Embed Size (px)
Citation preview
SUPPLEMENTARY APPENDIXChronic Myeloid Leukemia
BCR-ABL1 genomic DNA PCR response kinetics during first-lineimatinib treatment of chronic myeloid leukemiaIlaria S. Pagani,1,2 Phuong Dang,1 Ivar O. Kommers,3 Jarrad M. Goyne,1 Mario Nicola,4 Verity A. Saunders,1 Jodi Braley,4Deborah L. White,1,2,5,6,7 David T. Yeung,1,2,8,9 Susan Branford,2,4,6,10 Timothy P. Hughes,1,2,8,9,10 and David M. Ross1,2,8,9,10,11
1Cancer Theme, South Australian Health & Medical Research Institute, Adelaide, Australia; 2School of Medicine, Faculty of Health Sci-ences, University of Adelaide, Australia; 3VU University Medical Center, Amsterdam, the Netherlands; 4Genetic and Molecular Pathol-ogy, SA Pathology, Adelaide, Australia; 5School of Biological Sciences, Faculty of Sciences, University of Adelaide, Australia; 6School ofPaediatrics, Faculty of Health Sciences, University of Adelaide, Australia; 7Health Sciences UniSA, Adelaide, Australia; 8AustralasianLeukaemia and Lymphoma Group, Melbourne, Australia; 9Department of Haematology, Royal Adelaide Hospital and SA Pathology, Aus-tralia; 10Centre for Cancer Biology, School of Pharmacy and Medical Science, University of South Australia, Adelaide, Australia and11Flinders University and Medical Centre, Adelaide, Australia
©2018 Ferrata Storti Foundation. This is an open-access paper. doi:10.3324/haematol.2018.189787
Received: January 29, 2018.
Accepted: July 4, 2018.
Pre-published: July 5, 2018.
Correspondence: [email protected]
1
Supplements Methods
Patient characteristics and samples
All patients in TIDEL-II commenced first-line imatinib treatment at a dose of 600 mg daily,
with selective dose escalation (800 mg daily) or switching to nilotinib (400 mg twice daily)
for patients who failed to meet pre-defined time-dependent molecular response targets.
516 paired samples from total white cells were analysed by both DNA techniques (QPCR and
dPCR) and mRNA RQ-PCR. 330 paired samples were analysed by DNA Q-PCR and 186
paired samples by DNA dPCR. Details of the patients’ transcript types and methods of
analysis are summarized in Supplemental Table 1. The slightly higher proportion of patients
with e13a2 transcripts (54%) possibly reflects the more efficient amplification (in long range
PCR) of BCR breakpoints involving the shorter intron following exon 13, so that these
breakpoints were more easily identified. However, the overall clinical characteristics and
treatment responses of the selected cohort were not significantly different from those of the
entire TIDEL-II study population of 210 patients (Supplemental Table 2). Seven patients
withdrew from the study after a median of 9.5 months of therapy (range 3.7-24) because of
blast crisis (n=1), development of a kinase domain mutation with (n=2) or without
progression (n=1), TKI intolerance (n=1), non-compliance (n=1), or pregnancy (n=1).
RQ-PCR
The achievement of a major molecular response (MMR; ≤0.1%) or MR4.5 (≤0.0032%)
required confirmation at 2 consecutive measurements. We defined the sensitivity of BCR-
ABL1 detection for each individual sample based on the Europe Against Cancer formula.1 In
2
our laboratory a sample with UMRD requires a minimum of 400 000 BCR transcripts to
demonstrate that MR4.5 is achieved.2
Breakpoint detection and Feasibility and Reproducibility of patient-specific assays for
BCR-ABL1 DNA
In the current paper we used a multiplex long-range PCR screening approach for the
breakpoint detection with a success rate of 78%. Additional breakpoints can be detected by
simplex long-range PCR screening, or by using additional breakpoint detection methods, but
it was not necessary for us to do so in this study.
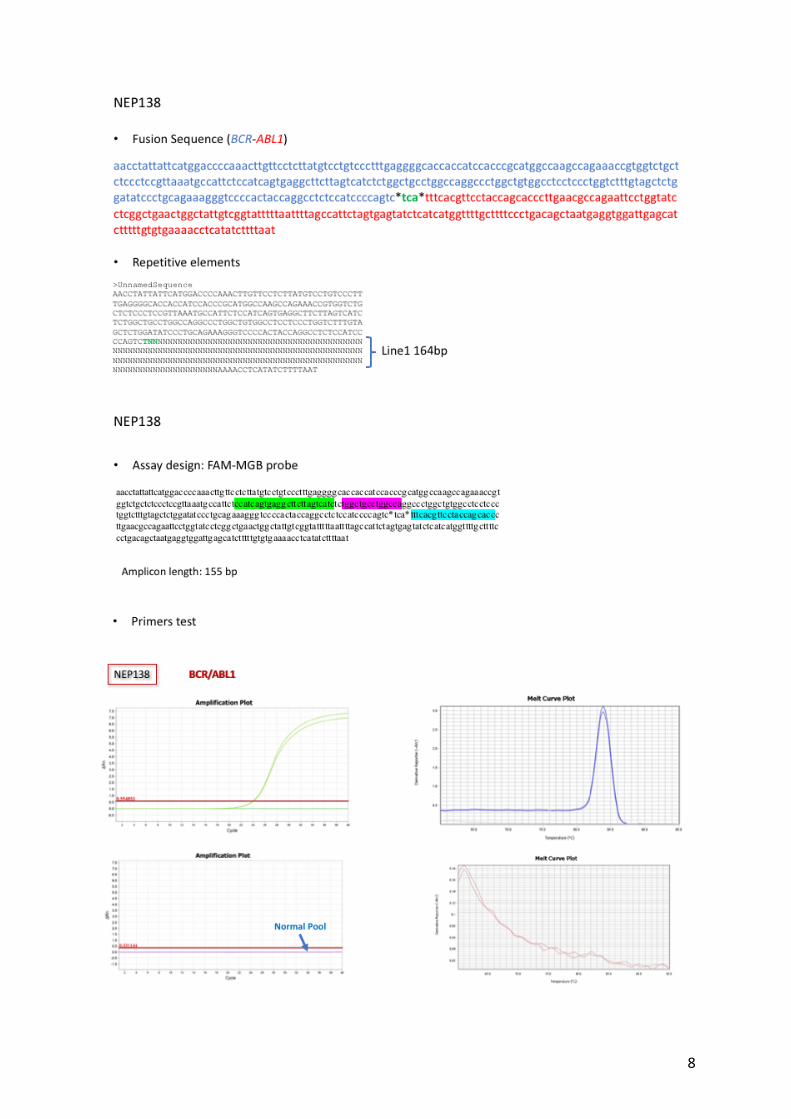
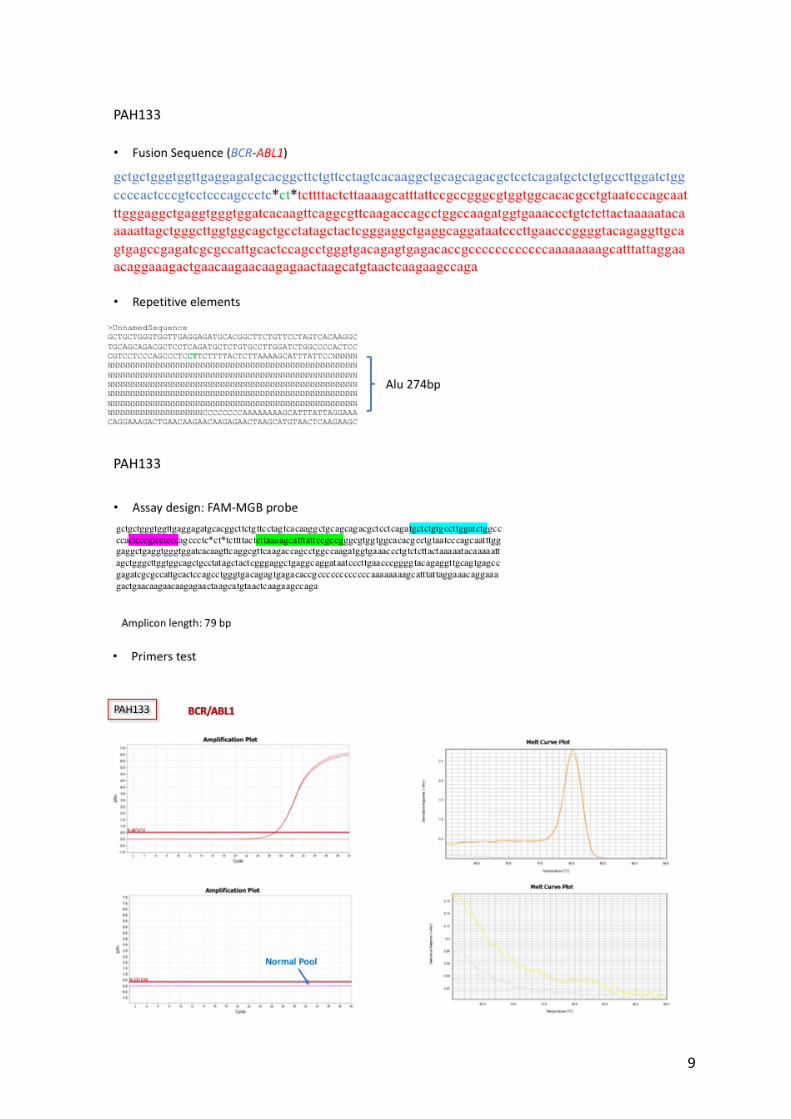
It was possible to design specific and efficient Q-PCR primers and probes for every patient in
who we were able to detect the breakpoint. This included patients in whom one or both
breakpoints were in a genomic repeat element. Repetitive elements are not a major problem
because 1) specificity can be achieved as long as one of the primers is not located in a repeat
element; and 2) repetitive elements are conserved, but not always identical, so that it usually
possible to find a stretch of unique sequence within the repeat. Two examples of assay design
involving repetitive elements are shown in Supplemental Figure 1.
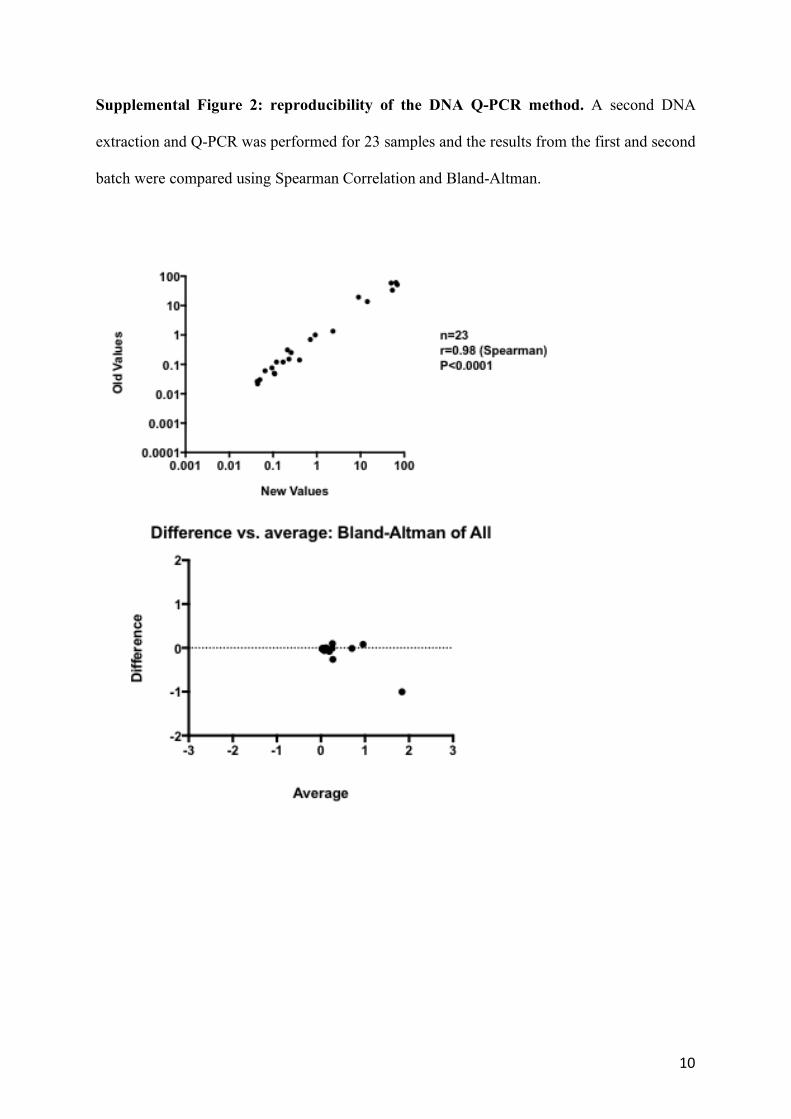
23 samples new batch extracted from 3 patients have been re-analysed by DNA Q-PCR and
the results have been compared with the original data showing agreement and confirming the
reproducibility of the data (Supplemental Figure 2).
Design and validation of patient-specific assays for BCR-ABL1 DNA
Patient-specific genomic DNA assays were designed using the Primer Express® Software
Version 3.0 with a TaqMan FAM-MGB or FAM-TAMRA probe (Life Technologies,
Carlsbad, CA, United States) and with a forward primer located in BCR as near as possible to
the BCR-ABL1 junction, and a reverse primer located in ABL1. Assay performance was
3
assessed following minimum information for publication of quantitative real-time PCR
experiments guidelines.3 To ensure accurate disease quantification, we also followed the
European Minimal Residual Disease Consortium recommendations for qPCR in Ph-negative
acute lymphoblastic leukemia, in which DNA extracted from each patient's diagnostic sample
was used for preparing standard curves (assuming the diagnostic sample is 100%
leukaemic),4 and we follow the recommendations of van der Velden and colleagues for the
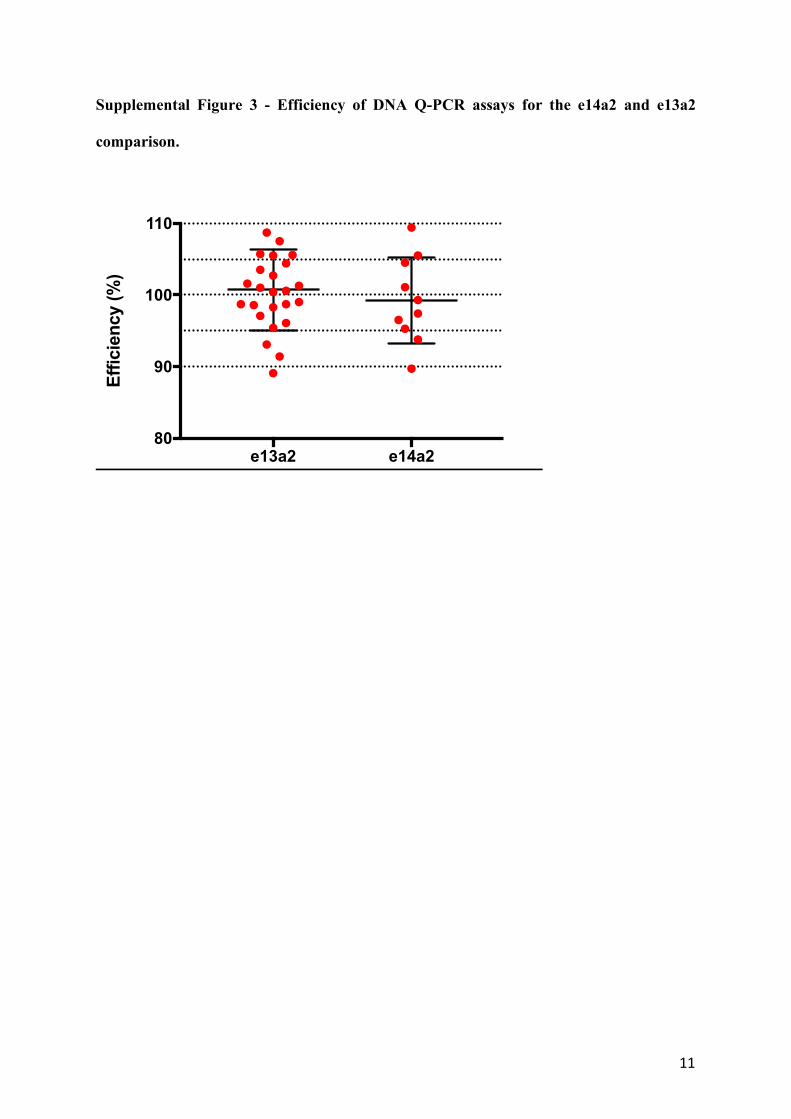
detection of MRD by real-time quantitative PCR.5 The efficiency of every assay was
calculated by interpolation of a standard curve obtained with patient-specific diagnostic DNA
10-fold serial diluted on non-human buffered DNA (Thermofisher, Waltham, Massachusetts,
United States) starting from 50 ng. The efficiency of the reaction was calculated as
η=(10−1/slope-1)*100. A regression curve with a slope of -3.32 and R2=1 give to an optimal
efficiency of 100%. Acceptable values are between 90-110% with a slope in a range between
-3.0 and -3.9 with R2>95%. Assays with an unacceptable efficiency were discarded and re-
designed (Supplemental Figure 3). Assays were additionally tested for non-specificity using
pooled normal human DNA. The GUSB gene was used as control. The GUSB gene has been
chosen since is rarely involved in the Ph translocation and is present in 2 copies per cell
(although any autosomal gene or intergenic sequence could be used for DNA quantification,
as, so long as its sequence is specific, and not repeated throughout the genome and highly
conserved).
Quantification of BCR-ABL1 DNA by quantitative real-time PCR
Genomic DNA was extracted by phenol/chloroform method from the same peripheral blood
leukocytes used for the molecular monitoring of the mRNA. The Qubit Fluorometer (Life
Technologies, Carlsbad, CA, United States) was used to determine the concentration and both
4
NanoDrop 8000 Spectrophotometer (Life Technologies, Carlsbad, CA, United States) and
agarose gel were used to check the gDNA quality and integrity. The amount of amplifiable
DNA in each sample was measured using quantitative real-time PCR (Q-PCR) as previously
described.6 Briefly, on the same plate were ran standard curves for both BCR-ABL1 and the
GUSB control gene. Standard curves for GUSB control gene were prepared using 10-fold
serial dilutions of GUSB plasmid, and standard curves for BCR-ABL1 used serial dilutions of
the patient's diagnostic DNA (assuming that the diagnostic sample was 100% leukaemic) in
non-human buffered DNA (Thermofisher, Waltham, Massachusetts, United States) starting
from 100 ng. Results were reported as BCR-ABL1/GUSB% by interpolation from a standard
curve. The log of each known concentration based on the dilution series of GUSB (x-axis)
was plotted against the Ct values of the BCR-ABL1 from their relative standard curve (y-
axis). The concentration of BCR-ABL1 in each target (BCR-ABL1target) was then derived by
the formula BCR-ABL1target=10^(intercept-CT meantarget)/slope. The number of leukemic cells
(%) was then calculated by dividing the concentration of GUSBtarget by the concentration of
BCR-ABL1target. The sensitivity was determined by the amount of DNA according to the
GUSB copy number.
Quantification of BCR-ABL1 DNA by digital PCR
The Q-PCR method was adapted to use in dPCR using the BioMark HD System with the
dPCR 37k integrated fluidic circuits (Fluidigm Corporation, South San Francisco, California,
United States). Each integrated fluidic circuit consists of 48 panels (sample inlets) each
containing 770 reaction chambers of 0.85 nL reaction volume. Reaction mixes were prepared
with 3 µL of 2x TaqMan® Gene Expression Master mix (Life Technologies), 0.6 µL of 20x
GE Sample Loading Reagent (Fluidigm), 0.24 µL of patient-specific primers and probe at a
final concentration of respectively 400 nM and 200 nM, 1.5 µL of gDNA and nuclease free
5
water in a final volume of 6 µL. Four microliters of the prepared reaction mixes were loaded
into the corresponding inlets of each array chip, and the BioMark IFC controller MX
(Fluidigm) was used to uniformly partition each reaction mix from the loading inlets through
channels into the reaction chambers. The dPCR was then performed using the BioMark HD
System, and the data were collected using the Data Collection software version 4 (Fluidigm).
The Digital PCR Analysis software version 4.0.1 (Fluidigm) was used to set the Cq threshold
(Ct) and range, and to count the number of positive chambers (H) out of the total number
chambers (C) per panel from which the Poisson distribution was used to estimate the average
number of template copies per chamber (λ), were: λ = −ln (1 − H/C).7,8 Thus target copies per
reaction volume were estimated as (Est target) = λ * C.8 Based on the manufacturer’s
instructions only about 16% of the initial volume per well ends up in the reaction chambers,
therefore the limit of detection was determined based on the amount (ng) of gDNA used for
the BCR-ABL1 quantification normalized on the number of copies of GUSB in dPCR. Since
GUSB is diploid, the average estimated target number calculated by the Fluidigm software
was divided by 2 then divided by the total amount of gDNA used for GUSB in dPCR to
calculate the GUSB number of cells per ng (GUSB cells/ng). The limit of detection (LOD)
was calculated by multiplying the total ng of gDNA used for BCR-ABL1 quantification by the
number of cells/ng. For samples at or near MR4.5 the number of panels was increased to
achieve a LOD of at least 5-logs (i.e. one in 100 000 cells). The sensitivity calculated for
undetectable results by qRT-PCR ranged from 4.6 to 6.5 logs. A median of 7 panels (range,
1-18 panels) was used per follow-up sample, with a median of 3.7 µg of total gDNA (range, 5
ng-12 µg). To avoid saturation of the panels 5 ng of DNA were used for samples at diagnosis
and for GUSB. The minimal residual disease was then determined by dividing the BCR-ABL1
Estimated targets per GUSB cells/ng values, and multiplying by 100 to obtain the BCR-
ABL1/GUSB ratio %.
6
Analysis of BCR-ABL1 DNA at diagnosis uses only the dPCR values. Analysis of BCR-ABL1
DNA during treatment uses only relative quantification. For Q-PCR this is based on the
standard curve. For dPCR this is based on a mathematical correction that expresses the
follow-up level relative to the patient’s individual baseline value.
Supplemental References
1. Gabert J, Beillard E, van der Velden VH, et al. Standardization and quality control
studies of 'real-time' quantitative reverse transcriptase polymerase chain reaction of fusion
gene transcripts for residual disease detection in leukemia - a Europe Against Cancer
program. Leukemia. 2003;17(12):2318-57.
2. Ross DM, Branford S, Seymour JF, S et al. Safety and efficacy of imatinib cessation
for CML patients with stable undetectable minimal residual disease: results from the
TWISTER study. Blood. 2013;122(4):515-22.
3. Johnson G, Nour AA, Nolan T, Huggett J, Bustin S. Minimum information necessary
for quantitative real-time PCR experiments. Methods Mol Biol. 2014;1160:5-17.
4. van der Velden VH, Cazzaniga G, Schrauder A, et al. Analysis of minimal residual
disease by Ig/TCR gene rearrangements: guidelines for interpretation of real-time
quantitative PCR data. Leukemia. 2007;21(4):604-11.
5. van der Velden VH, Hochhaus A, Cazzaniga G, Szczepanski T, Gabert J, van Dongen
JJ. Detection of minimal residual disease in hematologic malignancies by real-time
quantitative PCR: principles, approaches, and laboratory aspects. Leukemia.
2003;17(6):1013-34.
6. Ross DM, Branford S, Seymour JF, et al. Patients with chronic myeloid leukemia who
maintain a complete molecular response after stopping imatinib treatment have evidence of
persistent leukemia by DNA PCR. Leukemia. 2010;24(10):1719-24.
7
7. Dube S, Qin J, Ramakrishnan R. Mathematical analysis of copy number variation in a
DNA sample using digital PCR on a nanofluidic device. PloS one. 2008;3(8):e2876.
8. Huggett JF, Foy CA, Benes V, et al. The digital MIQE guidelines: Minimum
Information for Publication of Quantitative Digital PCR Experiments. Clinical Chemistry.
2013;59(6):892-902.
Supplemental Figures
Supplemental Figure 1: Feasibility of the DNA Q-PCR assay. Example of assay design
for 2 patients (NEP138 and PAH133) with repetitive elements at the breakpoint. The Q-PCR
with Sybr Green showed no non-specific amplification and a unique melting curve.
8
9
10
Supplemental Figure 2: reproducibility of the DNA Q-PCR method. A second DNA
extraction and Q-PCR was performed for 23 samples and the results from the first and second
batch were compared using Spearman Correlation and Bland-Altman.
11
Supplemental Figure 3 - Efficiency of DNA Q-PCR assays for the e14a2 and e13a2
comparison.
e13a2 e14a280
90
100
110
Effic
ienc
y (%
)
12
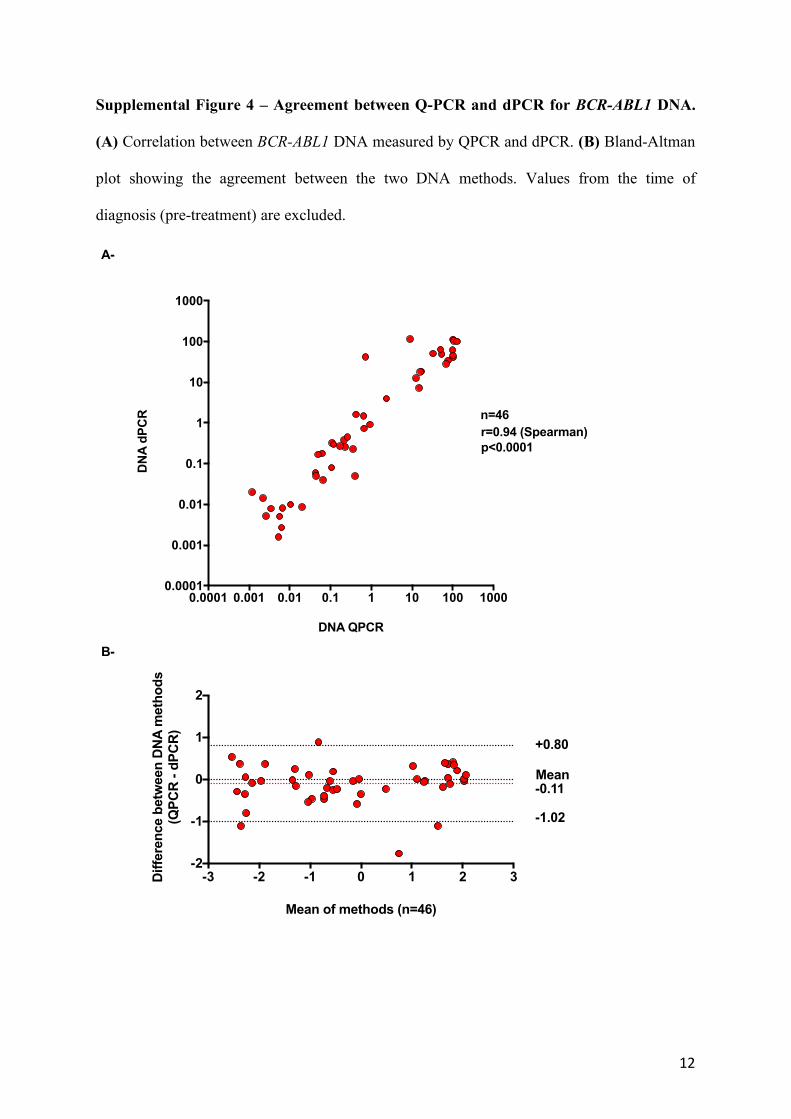
Supplemental Figure 4 – Agreement between Q-PCR and dPCR for BCR-ABL1 DNA.
(A) Correlation between BCR-ABL1 DNA measured by QPCR and dPCR. (B) Bland-Altman
plot showing the agreement between the two DNA methods. Values from the time of
diagnosis (pre-treatment) are excluded.
0.0001 0.001 0.01 0.1 1 10 100 10000.0001
0.001
0.01
0.1
1
10
100
1000
DNA QPCR
DN
A d
PC
R
r=0.94 (Spearman)p<0.0001
n=46
-3 -2 -1 0 1 2 3-2
-1
0
1
2
Mean of methods (n=46)
Diff
eren
ce b
etw
een
DN
A m
etho
ds(Q
PC
R -
dPC
R)
Mean-0.11
+0.80
-1.02
A-
B-
13
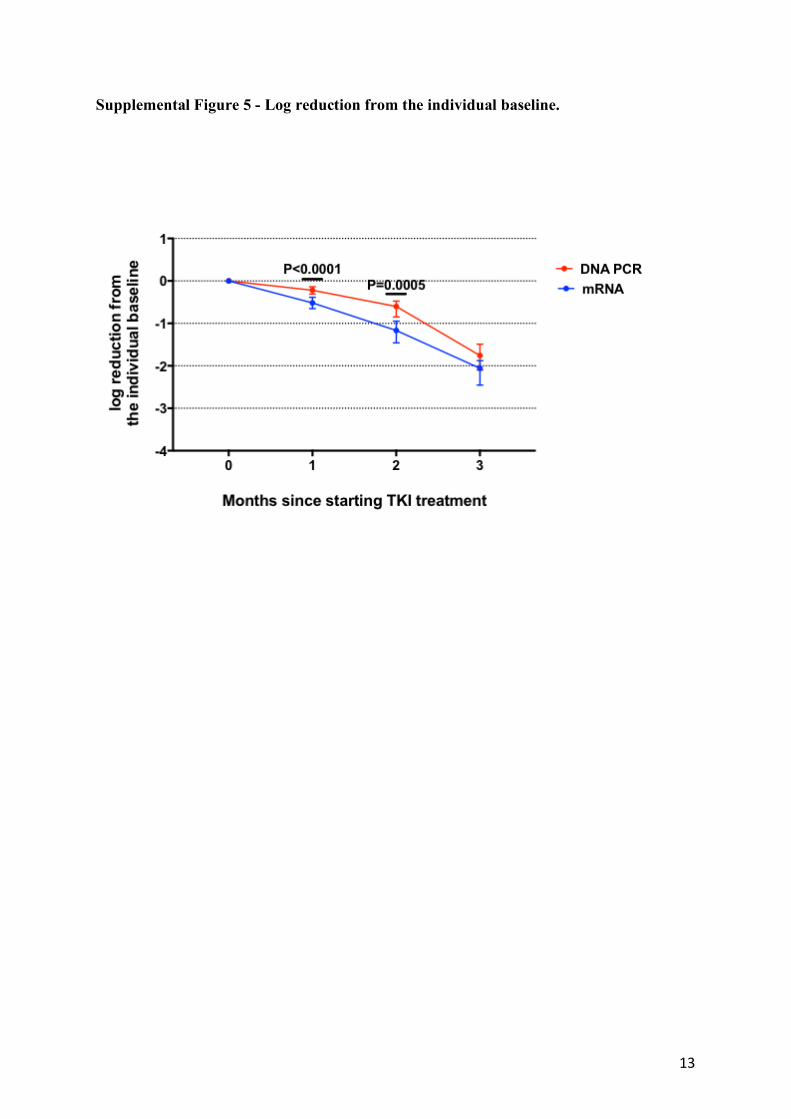
Supplemental Figure 5 - Log reduction from the individual baseline.
14
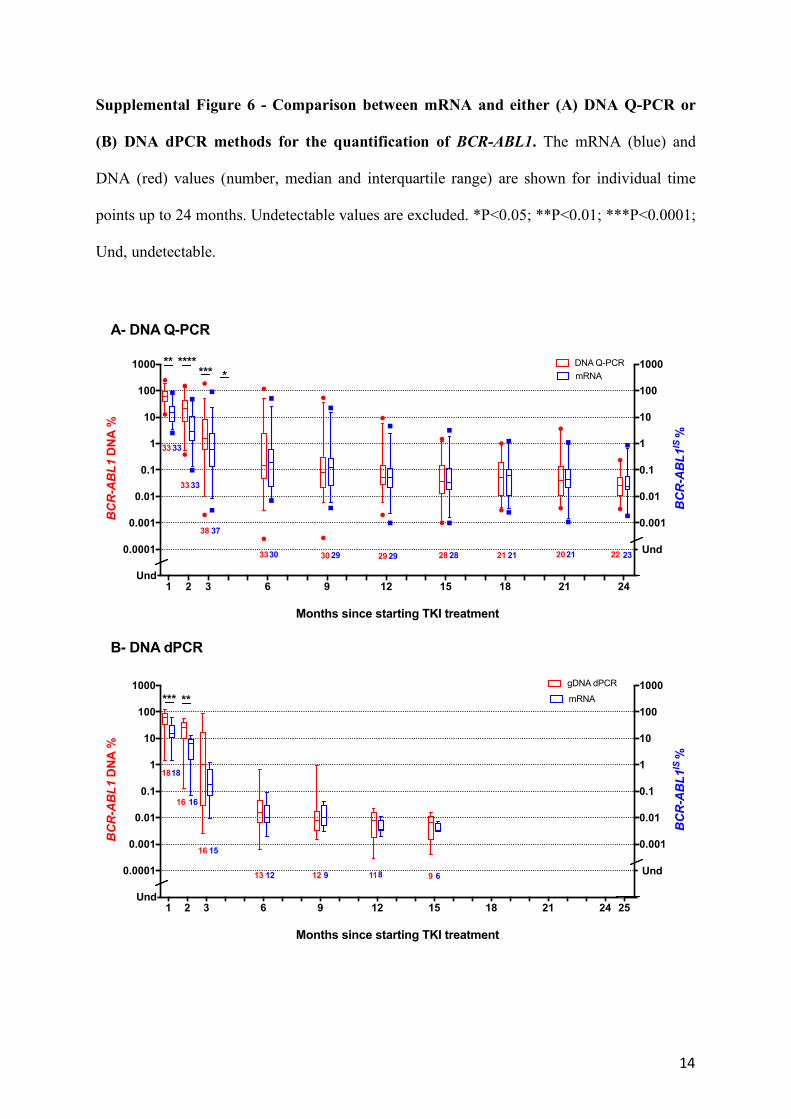
Supplemental Figure 6 - Comparison between mRNA and either (A) DNA Q-PCR or
(B) DNA dPCR methods for the quantification of BCR-ABL1. The mRNA (blue) and
DNA (red) values (number, median and interquartile range) are shown for individual time
points up to 24 months. Undetectable values are excluded. *P<0.05; **P<0.01; ***P<0.0001;
Und, undetectable.
A- DNA Q-PCR
B- DNA dPCR
1 2 3 6 9 12 15 18 21 24 250.00001
0.0001
0.001
0.01
0.1
1
10
100
1000
0.00001
0.0001
0.001
0.01
0.1
1
10
100
1000
Months since starting TKI treatment
BCR-ABL1
DN
A %
gDNA dPCRBCR-ABL1
IS %
*** **
Und
Und
mRNA
18
16
16
13 12 11 9
18
16
15
12 9 8 6
1 2 3 6 9 12 15 18 21 240.00001
0.0001
0.001
0.01
0.1
1
10
100
1000
0.00001
0.0001
0.001
0.01
0.1
1
10
100
1000
Months since starting TKI treatment
BCR-ABL1
DN
A %
BCR-ABL1
IS %
*******
Und
Und
DNA Q-PCRmRNA
***
33 33
3333
38 37
3330 30 29 2929 28 28 21 21 2021 22 23
15
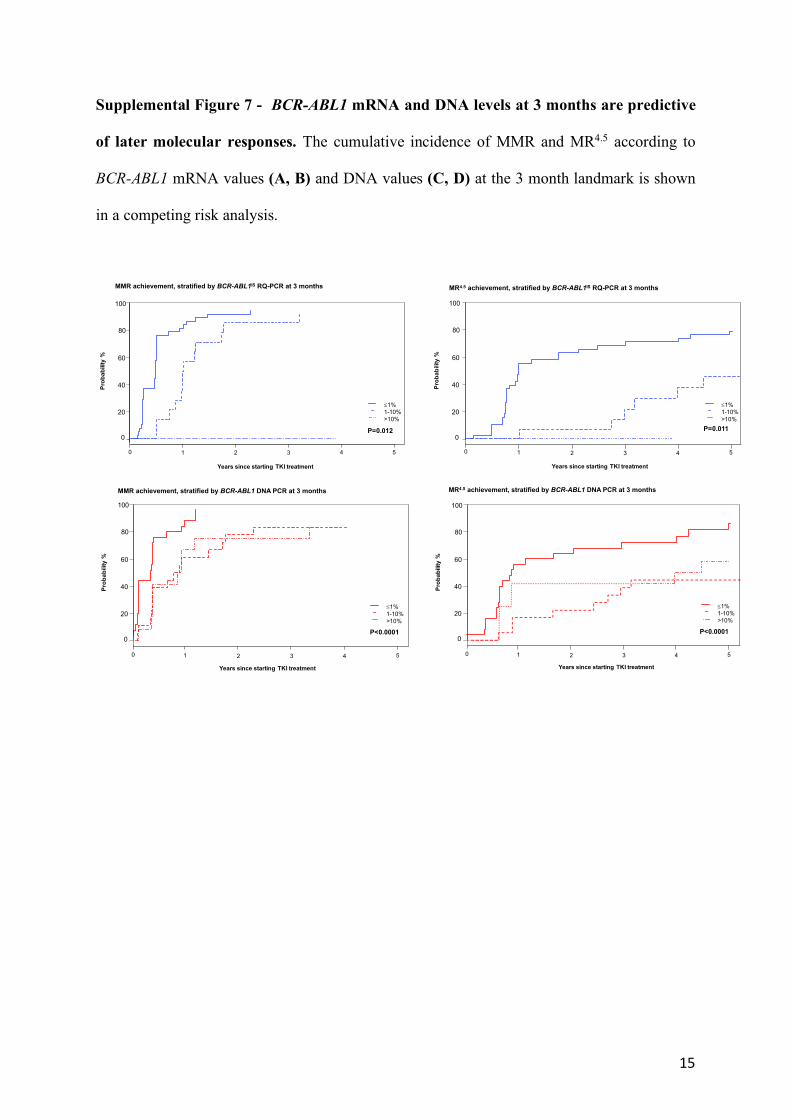
Supplemental Figure 7 - BCR-ABL1 mRNA and DNA levels at 3 months are predictive
of later molecular responses. The cumulative incidence of MMR and MR4.5 according to
BCR-ABL1 mRNA values (A, B) and DNA values (C, D) at the 3 month landmark is shown
in a competing risk analysis.
0 1 2 3 4 5
Years since starting TKI treatment
Prob
abili
ty %
£1%1-10%>10%
MMR achievement, stratified by BCR-ABL1IS RQ-PCR at 3 months
0
20
40
60
80
100
P=0.012
0 1 2 3 4 5
MR4.5 achievement, stratified by BCR-ABL1IS RQ-PCR at 3 months
Years since starting TKI treatment
£1%1-10%>10%
0
20
40
60
80
100
Prob
abili
ty %
P=0.011
MMR achievement, stratified by BCR-ABL1 DNA PCR at 3 months
0 1 2 3 4 5
0
20
40
60
80
100
Prob
abili
ty %
£1%1-10%>10%
P<0.0001
Years since starting TKI treatment
MR4.5 achievement, stratified by BCR-ABL1 DNA PCR at 3 months
0 1 2 3 4 5
Years since starting TKI treatment
Prob
abili
ty %
0
20
40
60
80
100
£1%1-10%>10%
P<0.0001
16
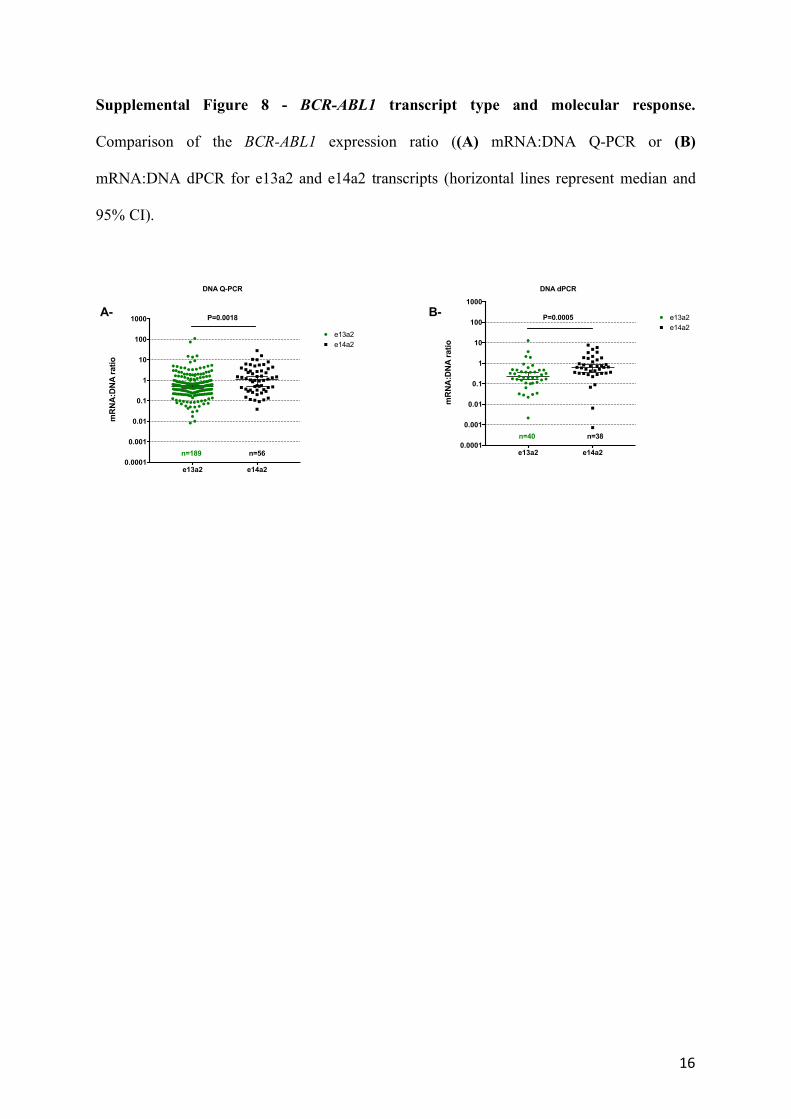
Supplemental Figure 8 - BCR-ABL1 transcript type and molecular response.
Comparison of the BCR-ABL1 expression ratio ((A) mRNA:DNA Q-PCR or (B)
mRNA:DNA dPCR for e13a2 and e14a2 transcripts (horizontal lines represent median and
95% CI).
e13a2 e14a20.0001
0.001
0.01
0.1
1
10
100
1000
mR
NA
:DN
A r
atio
e13a2P=0.0005
DNA dPCR
e14a2
n=40 n=38
e13a2 e14a20.0001
0.001
0.01
0.1
1
10
100
1000
mR
NA
:DN
A r
atio
e13a2
P=0.0018
e14a2
DNA Q-PCR
n=189 n=56
A- B-
17
Supplemental tables
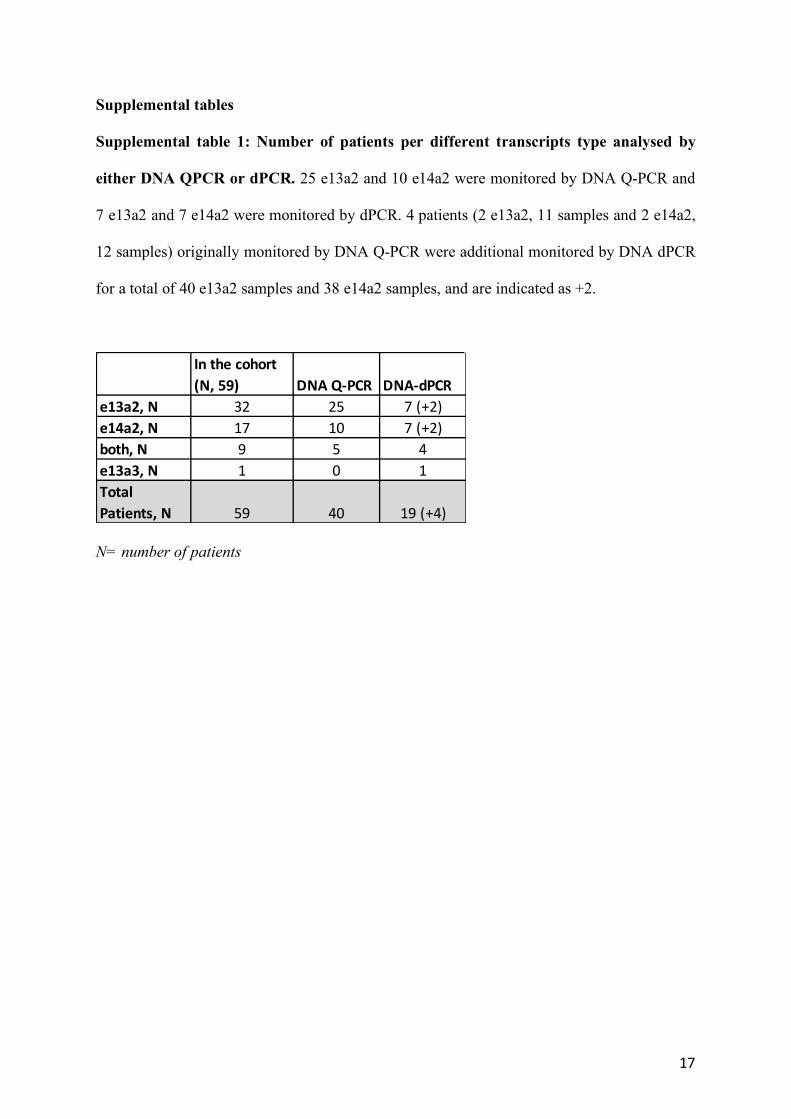
Supplemental table 1: Number of patients per different transcripts type analysed by
either DNA QPCR or dPCR. 25 e13a2 and 10 e14a2 were monitored by DNA Q-PCR and
7 e13a2 and 7 e14a2 were monitored by dPCR. 4 patients (2 e13a2, 11 samples and 2 e14a2,
12 samples) originally monitored by DNA Q-PCR were additional monitored by DNA dPCR
for a total of 40 e13a2 samples and 38 e14a2 samples, and are indicated as +2.
N= number of patients
In the cohort (N, 59) DNA Q-PCR DNA-dPCR
e13a2, N 32 25 7 (+2)e14a2, N 17 10 7 (+2)both, N 9 5 4e13a3, N 1 0 1Total Patients, N 59 40 19 (+4)

18
Supplemental Table 2: Patient Characteristics.
n= number of patients
Supplemental Table 3: Characteristics of three patients with unusually low BCR-ABL1
expression at diagnosis.
IM: imatinib; NIL: nilotinib; WCC: white cell count; CCA: conventional cytogenetic
analysis; Ph+: Philadelphia positive; iFISH: interphase fluorescence in situ hybridisation;
N/A: not available.
TIDEL-II population Study CohortNumber 210 59
Age years, median 50 (range, 17-81) 48 (range, 18-76)Female 44% (n=92) 49% (n=29)Sokal score, median 0.82 (range, 0.46-8.08) 0.78 (range, 0.56-8.08)High 18% (n=38) 24% (n=14)Intermediate 30% (n=62) 22% (n=13)Low 45% (n=95) 51% (n=30)Missing 7% (n=15) 3% (n=2)Transcript typee13a2 40% (n=85) 54% (n=32)e14a2 38% (n=80) 29% (n=17)both 20% (n=42) 15% (n=9)e13a3 1% (n=1) 2% (n=1)e1a2 1% (n=2) 0
Patient IDAge at
Diagnosis Sokal Score SexTranscript
TypeTherapy
SnapshotProgression/
Event WCC Spleen Size Platelets Blasts CCA/Ph+iFISH (BCR-ABL1%)
#1 31 intermediate Male b2a2
600mg IM > Early
Withdrawal
Blast Crisis - Mutation:
H396P 15.4 14.00 366.00 1.00 99.4
#2 40 low Female b2a2, b3a2
600mg IM > 800mg IM >
800mg NIL > Early
withdrawal
Mutations: G250E and
Y253H 9.4 1.00 730.00 0.00 N/A
#3 42 high Female b2a2
600mg IM > 800mg IM > 800mg NIL 1.7 25.00 617.00 11.00 t(9;22;16)[20] 87.8