Embed Size (px)
Citation preview

Bowling Green State University Bowling Green State University
ScholarWorks@BGSU ScholarWorks@BGSU
Honors Projects Honors College
Spring 4-20-2022
BCI Validation: YFiler Plus Kit Validation BCI Validation: YFiler Plus Kit Validation
Chloe Koon [email protected]
Follow this and additional works at: https://scholarworks.bgsu.edu/honorsprojects
Part of the Forensic Science and Technology Commons, and the Molecular Biology Commons
Repository Citation Repository Citation Koon, Chloe, "BCI Validation: YFiler Plus Kit Validation" (2022). Honors Projects. 800. https://scholarworks.bgsu.edu/honorsprojects/800
This work is brought to you for free and open access by the Honors College at ScholarWorks@BGSU. It has been accepted for inclusion in Honors Projects by an authorized administrator of ScholarWorks@BGSU.
BCI VALIDATION STUDY:
YFILER PLUS KIT VALIDATION
CHLOE KOON
HONORS PROJECT
Submitted to the Honors College
at Bowling Green State University in partial fulfillment of
the requirements for graduation with
UNIVERSITY HONORS
4/20/2022
Dr. Crystal Oechsle, Forensic Science (Forensic Biology)
Dr. Travis Worst, Forensic Science (Forensic Chemistry)

Koon 1
BCI Validation Study:
YFiler Plus Kit Validation
Introduction
Validation Purpose and Utility
Validation studies are common practice of the forensic scientific community allowing
scientists and laboratories to have scientifically sound work that provides factual information
about questioned evidence in a case. By doing so, laboratories are reassured that they are
providing quality products and clients, such as law enforcement officers and the general public,
are reassured that they are receiving quality work and accurate results. Protocols within
laboratories are also set and maintained by validation studies. Upon external accreditation, any
dubious protocols may be questioned, and the acceptable standards to be followed by all
personnel are set by the results of a validation as well. The wide variety of benefits of validating
anything before it is used in a laboratory has resulted in many laboratories upholding their lab
work with this scientific quality assurance.
Some forensic disciplines don’t necessarily have to run validation studies because they
are not required by any authoritative entity, just suggested, however forensic DNA analysis does
require validation studies. The Federal Bureau of Investigation (FBI) holds its own Quality
Assurance Standards (FBI-QAS) that require numerous standards and regulations of laboratories
and their personnel in order for scientists to have access to the Combined DNA Index System
(CODIS) database. These standards range from how the laboratory space is to be set up to the
educational classes that a forensic DNA analyst must have taken, but most importantly, this is
where validation studies for the equipment, procedures, and materials used in the laboratories are
stated as being required 1. It is important to have access to this database because it allows

Koon 2
forensic DNA analysts to compare their DNA results to this database of collected DNA profiles
for casework. Further, more guidance has been given about the nature of the required standards
and how to directly apply them by the Scientific Working Group on DNA Analysis Methods
(SWGDAM) so that laboratories are correctly completing these standards and will be able to use
the CODIS database 2. The group also has published documentation on the validation aspect of
the FBI-QAS so that a proper validation study is conducted that meets the FBI standards 3.
Validation Methods
There are multiple types of validations that exist including external and internal
validation studies in forensics. Internal studies are done by a laboratory before introducing a new
method, technology, or material into the space while external studies are done outside of a
laboratory itself, such as a developmental validation study done by a manufacturer before selling
and distributing a product 4. The Ohio Bureau of Criminal Investigation (Ohio BCI) is a
laboratory system that performs forensic DNA analysis, and therefore, must complete internal
validation studies of their own. The Ohio Attorney General’s Center (the Center) for the Future
of Forensic Science at Bowling Green State University often works with the Ohio BCI to further
research and help with projects if needed. The Center was asked to help complete further
validation studies into the YFiler Plus amplification kit currently being used in the Ohio BCI
laboratory system. Previous validation has been done, but upon external accreditation, it was
decided that areas of the original study needed to be developed in order to create a more solid
validation in argument of continued use of the kit.
An original developmental validation was performed by the YFiler Plus amplification kit
developers that illustrated that the kit could be successfully used and made suggestions as to
what limitations the kit might have 5. This does not however fulfill the FBI-QAS requirement for

Koon 3
internal validation which was the reason for the Ohio BCI performing their first validation study.
It was determined by the outside accreditors that the male-to-male mixture study and the male-
mixed-female study both were lacking in enough data for the laboratory system to accurately set
protocols that allowed use of the kit without more cautionary measures of its use. The
manufacturer, Applied Biosystems, also discussed their validation studies into the kit’s use along
with potential issues that might arise in the future within the user guide they distributed for the
kit 7. This includes possible artifacts that they noticed appeared often and what level DNA
concentrations might result in incomplete or inconclusive results.
DNA Typing
Autosomal DNA typing in forensic science has been used for several years and most of its uses
are widely accepted in the scientific community. This type of DNA analysis includes the
chromosomes in both females and males and can be used to help distinguish an individual, or
even multiple individuals in a mixture sample. Mixture samples can have their drawbacks,
however, when analyzing the data due to the ability to have multiple alleles, short repeated
sequences of DNA that can differ by person, at one locus, specified location in DNA. One person
could have up to two different alleles at one locus while two people could have up to four alleles
at one locus and so forth 4. This makes typical autosomal typing more difficult and some level of
uncertainty is added to the DNA results, so more caution is taken into how reliable the profiles
are. Y-chromosome short tandem repeat (Y-STR) typing can be used in male-female mixtures to
help obtain more confident male DNA profiles. Since the Y-chromosome is only found in
biological males, areas of the chromosome can be amplified and run through the capillary
electrophoresis so that the DNA profile(s) should only contain male DNA even if mixed in with
female DNA.

Koon 4
Y-Chromosome Typing
The Y-chromosome is very useful in forensics due to some of its unique qualities in a
variety of casework including sexual assault cases and lineage studies. There are several Y-STRs
that can be chosen which makes the chromosome easy to study and amplify along with the
inheritance factor of the Y-chromosome through the male line that contribute to some of its
usefulness 6. Between different lineages, males have been shown to be significantly unique in
their allele combinations between investigated loci and identification is much more reliable and
easier to distinguish between males. However, obtaining individual profiles from a mixture of
related males proves much more difficult due to the similarity of their profiles from inheriting
the Y-chromosome in the family lineage 8. There has been study into the level of contrast needed
to distinguish between a father and his son, but the most useful solution found has been to use
more loci to increase the chance that the two profiles are different enough to be significant 9.
The YFiler Plus kit in this validation study is an example of this solution. The YFiler Plus
kit has 10 more loci than the previous YFiler kit in hopes of increasing the distinguishability of
the resulting DNA profiles. Some of the new loci are high-mutating STRs which are thought to
be better used in identity testing because the chance of related males having different repeats at a
given locus increases while slow-mutating STRs are still preferred in lineage casework 10. Other
improvements were made to this new kit including lowering the PCR cycle run times, creating
greater inhibitor tolerance, and most importantly, the kit is advertised as having more sensitivity
to male DNA in the presence of high female DNA 5. This sensitivity aspect is important
especially in sexual assault cases to ensure that the female DNA doesn’t overwhelm the primers
included in the amplification kit and the male DNA still receives primer binding to allow the
amplification process to work.

Koon 5
Current Validation Development
This study was originally modeled after other developmental validation studies that were
reviewed along with a testing scheme and validation report previously done by the Center. The
testing scheme for the 3500 Genetic Analyzer and its accompanying analysis software served as
an example as to how to determine the layout of the remaining studies that should be done 11.
Following some of these ideas ensured that proper validation techniques were being performed
and enough testing would take place that would fulfill the lacking requirements. The validation
report from the Center also served the purpose of ensuring that the proper techniques and
procedures were taking place as well as the methods for setting thresholds and other protocols
for use in the laboratory 12. A development and validation study on a previous Y-STR kit
(AmpFISTR YFiler PCR Amplification Kit) showed how developers validated for the
AmpFISTR kit with 17 loci in comparison to the original having 11 loci 13. This is applicable to
the current validation study since the YFiler Plus kit is an increase in the number of loci from the
previous kit, so this validation’s methods can be used as a comparison of how to do the
validation in this study.
DNA Profile Editing, Interpretation, and Data Analysis
To determine the true extent that YFiler Plus should be used in the BCI’s laboratory
system, the DNA profiles must be analyzed and interpreted so that statistical testing can occur.
While software, such as GeneMapper ID-X, can provide preliminary calls based off pre-set
thresholds as to what peaks, indicating the amplified repeats at a locus, may be true DNA, it is
the role of the designated forensic DNA analyst to decide what peaks are truly DNA and a part of
the DNA profile(s). Other peaks are considered various types of artifacts, and an analyst must
eliminate artifacts such as spikes that occur during high fluorescence, pull-up which involves

Koon 6
excess fluorescence flowing into other dye channels, and other common artifacts according to the
protocols set by their laboratory 14. This becomes harder to do in autosomal DNA typing of
mixtures since each locus can include multiple alleles, and it can be difficult to determine if a
peak is true DNA or not. Y-STR typing helps this issue with typically having less alleles at each
locus, aside from a select few loci, so separating a mixture into multiple profiles is generally
easier. SWGDAM has published guidelines to help laboratories set their protocols for both
autosomal and Y-STR typing with those for Y-STRs having emphasis on appropriately
separating DNA profiles in a mixture 15.
After obtaining the Y-STR DNA profiles from the mixture, analysis of data can occur.
There are three main studies being focused on in this overarching validation study all of which
use various analyses to draw final conclusions. The first of which is the male sensitivity study
which uses several male samples in a concentration dilution series. This is meant to show when
alleles begin to drop out and can be used to determine where to set the analytical threshold, the
minimum height a peak must be to at least be considered DNA, for the laboratory protocols 13.
The next study involves constant male DNA in a concentration dilution series of female DNA.
Data from this will allow the BCI to know if there is a possibility of allele drop out in samples
with extremely high amounts of female DNA and what the male DNA profile may appear if the
female DNA overwhelms it. The final study involves male-to-male mixtures from 2-person to 4-
person mixtures. This study will illustrate when DNA profiles start to become difficult to
interpret as well as the likelihood of allele dropout and encountering incomplete profiles. These
mixtures also feature pairings of profiles that are known to be similar or dissimilar. Since close
allele combinations can be challenging to obtain individual profiles, it is important to
demonstrate what those mixture profiles could look like 16. The intended purpose of this

Koon 7
validation study is to set appropriate protocols and recommendations for the Ohio Bureau of
Criminal Investigation laboratory system’s use of the YFiler Plus amplification kit. This will be
done through three appropriate studies: a male sensitivity study, a male-female sensitivity study,
and a male-to-male mixtures study.
Materials and Methods
The first part of this validation study was done in Fall of 2021. This portion involved
obtaining the eight male DNA sample sources (DR, LOM, LS, MML, RHE, SAT, SW and TA)
from the BCI and mixing the different sources into the appropriate combinations and
concentrations for the various studies. Each individual sample extract was prepared with a total
volume of 40 μl, enough to amplify each sample in triplicate. Once samples were mixed, they
were returned to the BCI where staff scientists amplified all samples in triplicate using their
predefined protocols for the YFiler Plus PCR kit. Following amplification, all sample replicates
were electrophoresed on a 3500xL genetic analyzer with a 1.2 kV injection for 24-seconds
following the BCI’s predetermined protocols. Amplification and capillary electrophoresis were
performed along with negative and positive controls and allelic ladders. The electronic data were
received at the Ohio Attorney General’s Center (the Center) for the Future of Forensic Science at
Bowling Green State University after the beginning of 2022 and editing of the DNA using
GeneMapper ID-X (v1.6) software began shortly thereafter.
Analytical Thresholds
The first step to completing the validation study was to reevaluate the previously set
analytical threshold for using the YFiler Plus amplification kit. This was done by editing both the
negative controls and the male sensitivity at low RFUs (relative fluorescence units). Then
Koon 8
analysis was performed to determine an appropriate level of RFU that wouldn’t allow too much
baseline noise peaks but avoided not calling true DNA.
Male Sensitivity Study
Using the chosen analytical threshold (100 RFU), the male sensitivity samples were
reanalyzed and edited again. These were samples ranging in DNA concentration from 2ng to
0.00391 ng for each of the eight males. These could then be interpreted and analyzed for allele
dropout and a level of confidence can be determined for what concentration of DNA could still
obtain a reasonable DNA profile.
Male with Excess Female Study
The samples used for this study were a mixture of one sample consisting of an excessive
amount of female DNA and another sample of male RHE’s DNA concentration was held
constant at 1ng while the female DNA increased from 1ng to 999ng. Each sample was analyzed,
edited, and then interpreted to look for any allele dropout or cross-reactivity that occurred with
the increasing amounts of female DNA.
Male: Male Mixtures Study
Mixtures samples were created in combinations of 2, 3, or 4 males at varying amounts of
DNA (1ng, 0.25ng, 0.125ng, and 0.062ng). Each combination was also performed at different
ratios between individuals at every DNA concentration level. 2-person combinations (TA:LOM
and SW:ML) had ratios at 20:1, 10:1, 5:1, and 2:1. 3-person combinations (TA:LOM:LS and
SW:ML:DR) had ratios at 1:1:1, 2:1:1, 5:1:1, and 10:1:1. 4-person combinations
(TA:LOM:LS:RHE and SW:ML:DR:ST) had ratios of 1:1:1:1, 3:1:1:1, 3:2:1:0.5, 4:3:2:1, and
5:5:1:1. Each sample was analyzed, edited, and then interpreted to look for any allele dropout,

Koon 9
overlap, major-minor profile, or mixture ratio information that may help in interpreting male-
male mixture samples.
Results
Analytical Thresholds
Analysis of the negative controls yielded differing suggested minimum analytical
thresholds for each of the dye channels between 25 RFU and 50 RFU. The blue channel had a
minimum analytical threshold of 30 RFU, the green channel had 45 RFU, the yellow channel had
25 RFU, the red channel had 35 RFU, the purple channel had 45 RFU, and the orange channel
had 50 RFU. The average suggested a 45 RFU level for analytical threshold overall between all
six dye channels. The overall average RFU baseline peaks seen were 7.03 RFU with a standard
deviation of 3.54 RFU. The overall Limit of Detection (average RFU plus four standard
deviations) was determined as 21.21 RFU, and the Limit of Quantitation (average RFU plus ten
standards deviations) was 42.47 RFU.
Looking at the male sensitivity samples at low RFUs yielded different results for the
minimum analytical threshold. Each locus was analyzed for their average peak height and
standard deviation (in RFUs) for every input DNA level (assuming data was available at that
input level). Loci DYS385 and DYF387S1 were both omitted from this part of the study due to
their ability to have multiple peaks at one locus, unlike the rest of the studied loci. The average
peak height and standard deviation were then determined by input level for each of the five
standard dye channels and for the overall loci included between dye channels. The average peak
heights were seen to decrease as the level of DNA input decreased. A weighted regression
analysis was performed for each dye channel and for all loci together at both an alpha value of
0.05 and 0.01. The minimum analytical threshold for each dye channel, at an alpha value of 0.05

Koon 10
and 0.01 respectively, was 75 RFU and 140 RFU for blue, 85 RFU and 160 RFU for green, 40
RFU and 75 RFU for yellow, 75 RFU and 135 RFU, and 75 RFU and 165 RFU for purple. The
overall minimum analytical thresholds were suggested to be at 75 RFU at an alpha value of 0.05
and 140 RFU at 0.01.
Male Sensitivity Study
Editing of the male sensitivity samples occurred again at the decided upon analytical
threshold (100 RFU) before the samples’ peak heights were used for the actual sensitivity study
purposes. As with the analytical thresholds study, the loci DYS385 and DYF387S1 were both
omitted due to known duplication events that occur at those loci. The basic process of finding the
average peak heights and standard deviations for the loci at all input levels, then by dye channels
and by overall between all the loci at all the input levels, remained the same as what was
previously done for the analytical threshold study. However, there were many more peaks in the
study analyzed at low RFUs in comparison to that done at the 100 RFU analytical threshold. As
seen in Figure 1, there was a typically a decrease of roughly half between each DNA
concentration that was halved. One exception was the decrease from 2 ng of input DNA to 1 ng
of input DNA that had a decrease of roughly over half. Also, once the concentrations reach about
0.0625 ng, the decrease no longer resembled a decrease of a half, and they start to level out.

Koon 11
Figure 1. Graph depicting the average peak height (RFU) of all the loci data at a given
DNA input concentration (ng).
Each dye channel appeared to perform about the same as the others. As seen in Figure 2,
there was some slight differences at 2 ng of input DNA, but as the concentration decreases, the
dye channels become more tightly packed in average peak height. The biggest difference was
seen between the yellow dye channel and the green dye channel at 2 ng and 1 ng of input DNA.
0
500
1000
1500
2000
2500
3000
3500
4000
4500
5000
5500
6000
6500
7000A
vera
ge P
eak H
eig
ht
(RF
U)
DNA Concentration (ng)
0
1000
2000
3000
4000
5000
Av
era
ge P
eak H
eig
ht
(RF
U)
DNA Concentration (ng)

Koon 12
Figure 2. Graph depicting each dye channel’s average peak height (RFU) at each given
DNA concentration (ng).
Some loci, such as DYS389II and DYS449, showed more dropout than other loci at all
input levels as shown in Figure 3. It can be seen within the figure that there are a few loci that
have, on average, much lower peak heights throughout the various concentration levels.
Figure 3. Graph depicting each loci’s average peak height (RFU) at each given DNA
concentration (ng) for all concentrations in the sensitivity study.
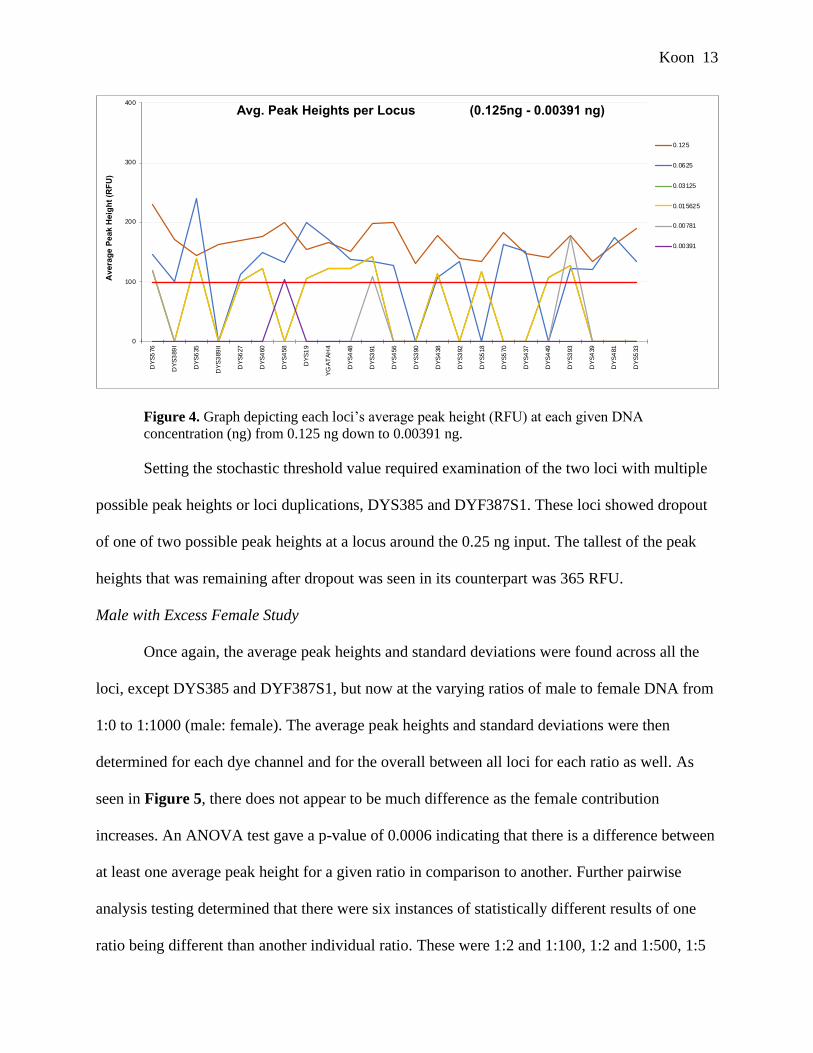
As the DNA input decreased to lower concentrations at 0.125 ng and below, there was
significantly more dropout of the intended alleles even in those that were shown to readily
appear in high DNA concentration levels. This can be seen in Figure 4 where is also indication
of dropout of certain loci at the lowest concentrations. There is much more variation seen of peak
heights across all the loci than at the concentrations 0.125 ng and above.
0
1000
2000
3000
4000
5000
6000
7000
8000
DY
S5
76
DY
S3
89
I
DY
S6
35
DY
S3
89
II
DY
S6
27
DY
S4
60
DY
S4
58
DY
S1
9
YG
AT
AH
4
DY
S4
48
DY
S3
91
DY
S4
56
DY
S3
90
DY
S4
38
DY
S3
92
DY
S5
18
DY
S5
70
DY
S4
37
DY
S4
49
DY
S3
93
DY
S4
39
DY
S4
81
DY
S5
33
Av
era
ge P
ea
k H
eig
ht
(RF
U)
Avg. Peak Heights per Locus (2ng - 0.00391 ng)
2
1
0.5
0.25
0.125
0.0625
0.03125
0.015625
0.00781
0.00391
Koon 13
Figure 4. Graph depicting each loci’s average peak height (RFU) at each given DNA
concentration (ng) from 0.125 ng down to 0.00391 ng.
Setting the stochastic threshold value required examination of the two loci with multiple
possible peak heights or loci duplications, DYS385 and DYF387S1. These loci showed dropout
of one of two possible peak heights at a locus around the 0.25 ng input. The tallest of the peak
heights that was remaining after dropout was seen in its counterpart was 365 RFU.
Male with Excess Female Study
Once again, the average peak heights and standard deviations were found across all the
loci, except DYS385 and DYF387S1, but now at the varying ratios of male to female DNA from
1:0 to 1:1000 (male: female). The average peak heights and standard deviations were then
determined for each dye channel and for the overall between all loci for each ratio as well. As
seen in Figure 5, there does not appear to be much difference as the female contribution
increases. An ANOVA test gave a p-value of 0.0006 indicating that there is a difference between
at least one average peak height for a given ratio in comparison to another. Further pairwise
analysis testing determined that there were six instances of statistically different results of one
ratio being different than another individual ratio. These were 1:2 and 1:100, 1:2 and 1:500, 1:5
0
100
200
300
400
DY
S5
76
DY
S3
89
I
DY
S6
35
DY
S3
89
II
DY
S6
27
DY
S4
60
DY
S4
58
DY
S1
9
YG
AT
AH
4
DY
S4
48
DY
S3
91
DY
S4
56
DY
S3
90
DY
S4
38
DY
S3
92
DY
S5
18
DY
S5
70
DY
S4
37
DY
S4
49
DY
S3
93
DY
S4
39
DY
S4
81
DY
S5
33
Av
era
ge P
ea
k H
eig
ht
(RF
U)
Avg. Peak Heights per Locus (0.125ng - 0.00391 ng)
0.125
0.0625
0.03125
0.015625
0.00781
0.00391

Koon 14
and 1:100, 1:20 and 1:100, 1:20 and 1:500, and 1:100 and 1:750. However, those differences
don’t appear to be truly meaningful or appreciable, according to Figure 5. Average peak height
each different dye channels and by locus did not yield any significant dropout or results.
Figure 5. Graph depicting the average peak height (RFU) for each given male to female ratio.
Male: Male Mixtures Study
Complete editing was performed on the raw data for all mixture samples. The analysis
process was not complete in time to write this paper, but it is in progress and will be completed
in a timely manner to relay any important findings to the Ohio Bureau of Criminal Investigation.
Discussion and Conclusions
While the negative control method suggested that the minimum analytical threshold
should be at least 45 RFUs based off the Limit of Detection and Limit of Quantitation, the
analysis of the male sensitivity samples at low RFUs suggested that the minimum be at least 75
RFUs if not 140 RFUs. There was also the notion that each dye channel may have a separate
analytical threshold value since there was great variance in the suggested values between each
channel in both the negative controls method and the male sensitivity method. Ultimately, it was
0
500
1000
1500
2000
2500
3000
3500
4000
4500
5000
5500
6000
6500
7000
Av
era
ge P
eak H
eig
ht
(RF
U)
M:F Ratio
Koon 15
decided in consultation with the Ohio Bureau of Criminal Investigation that the dye channels
would remain constant between their analytical thresholds. Additionally, the Ohio Bureau of
Criminal Investigation determined that they would proceed with an analytical threshold value of
100 RFU as a middle ground to the suggested levels, which would corresponding to an alpha of
less than 0.05 but greater than 0.01 confidence.
Examination of the single source male sensitivity samples at the new analytical
thresholds gave indications of important boundaries to set when looking at the peaks of most of
the studied loci. At low levels of input DNA, it is known that there may be detection of alleles
that are above the analytical threshold. However, based on the data having increased dropout
under 0.125 ng of input DNA, it is suggested that the dynamic range of when to expect
significant DNA profiles is between 2 ng and 0.125 ng of input DNA. This Limit of Linearity’s
upper limit is the peak heights of 2 ng samples due to having large error indicted on Figure 1
and the increasing number of artifacts present at this level. The lower limit is the analytical
threshold (100 RFUs) since no peak can be called as true DNA below it. Outside of the Limit of
Linearity indicates that the appropriate relationship between the peak heights and DNA
concentrations exists (halving the concentration causing halving of the peak heights). The ideal
target of DNA was determined to be between 0.5 ng and 1 ng, approximately 0.75 ng of input
DNA. At this level, there is the most confidence that there will be full profiles obtained, and
there will be consistent peak heights across all the loci within the same dye channel with perhaps
some variance in heights between the dye channels.
Determining the stochastic threshold can help set the guidelines as to when to carefully
use the peaks in a DNA profile at the loci with duplications of intended peak heights, DYS385
and DYF387S1. The stochastic threshold can be set to determine at what peak height can one be

Koon 16
most confident that the loci is truly only supposed to have one peak. Since the tallest remaining
peak when dropout occurred was 365 RFU, a suggested stochastic threshold is 400 RFU. This
means if a single peak is at one of the two loci, DYS385 or DYF387S1, it would need to be at
least 400 RFU before it could be considered as a homozygous locus and not to have possible
dropout of its counterpart duplication peak.
The study of the male DNA mixed with increasing amounts of female DNA was intended
to indicate at what concentration female DNA interfered with the male DNA profile obtained in
doing Y-STR typing. Due to limited amounts of male DNA, this was only completed at the 1 ng
level for the male contribution while the female DNA was mixed in at ratios up to 1:1000.
Although the ANOVA and pairwise test indicated that there was difference between some
individual ratios, it altogether does not have significance to this study. Normal amounts of male
DNA were used, and full DNA profiles were still being obtained at the various levels of female
DNA. The female DNA did not seem to have an adverse effect on the profiles being obtained.
This means that if enough male DNA is present in the mixture, then there is confidence that a
full male DNA profile can be obtained up to a 1:1000 ratio with female DNA present.
Despite the male-to-male mixtures analysis not being completed yet, several aspects of
the finished studies should prove useful to the Ohio Bureau of Criminal Investigation. There was
an analytical threshold of 100 RFU decided upon and a suggested stochastic threshold of 400
RFU that can be investigated as a possible new guideline in the laboratory system. It was also
important to show the boundaries within the male sensitivity study, so it can provide solid
foundation to setting the guidelines for the mixture study. Having the range of 2 ng down to
0.125 ng can help determine whether a sample should be sent for further DNA analysis and
profiling. It was also important to set an ideal target of about 0.75 ng of input DNA for yielding

Koon 17
the best DNA profile. While it was shown that the excess female DNA in a mixture didn’t have
any effect on the quality of a male DNA profile at normal analysis levels, future study could be
done with larger amounts of male DNA with the increasing female DNA and with low amounts
of male DNA to see if good quality DNA profiles are still obtained. Overall, these studies made
excellent progress in progressing the protocols for the Ohio Bureau of Criminal Investigation.

Koon 18
References
1. Federal Bureau of Investigation. (2020). Quality assurance standards for forensic DNA
testing laboratories. Federal Bureau of Investigation. Last date accessed
2/21/2022. Retrieved from https://www.fbi.gov/file-repository/quality-assurance-
standards-for-forensic-dna-testing-laboratories.pdf/view
2. Scientific Working Group on DNA Analysis Methods (SWGDAM). (2020). The
guidance document for the FBI quality assurance standards for forensic DNA
testing and DNA databasing laboratories. Scientific Working Group on DNA
Analysis Methods. Last date accessed 2/21/2022. Retrieved from
https://www.swgdam.org/publications
3. Scientific Working Group on DNA Analysis Methods (SWGDAM). (2017). SWGDAM
validation guidelines for DNA analysis methods. Scientific Working Group on
DNA Analysis Methods. Last date accessed 2/21/2022. Retrieved from
https://www.swgdam.org/publications
4. Butler, J. M. (2005). Forensic DNA typing: Biology, technology, and genetics of STR
markers. Elsevier, Acad. Press, 201-206, 398-401.
5. Gopinath, S., Zhong, C., Nguyen, V., Ge, J., Lagacé, R. E., Short, M. L., & Mulero, J. J. \
(2016). Developmental validation of the YFiler® Plus PCR amplification kit: An
enhanced Y-STR multiplex for casework and database applications. Forensic
Science International: Genetics, 24, 164–175. Last date accessed 2/21/2022.
Retrieved from https://doi.org/10.1016/j.fsigen.2016.07.006
6. Jobling, M. A., Pandya, A., & Tyler-Smith, C. (1997). The Y chromosome in forensic
analysis and paternity testing. International Journal of Legal Medicine, 110(3),
118–124. Last date accessed 2/21/2022. Retrieved from
https://doi.org/10.1007/s004140050050
7. Applied Biosystems. (2019). YFlier Plus PCR amplification kit: User guide. Applied
Biosystems.
8. Ballantyne, K. N., Ralf, A., Aboukhalid, R., Achakzai, N. M., Anjos, M. J., Ayub, Q.,
Balažic, J.,Ballantyne, J., Ballard, D. J., Berger, B., Bobillo, C., Bouabdellah, M.,
Burri, H., Capal, T., Caratti, S., Cárdenas, J., Cartault, F., Carvalho, E. F.,
Carvalho, M., … Kayser, M. (2014). Toward male individualization with rapidly

Koon 19
mutating Y-chromosomal short tandem repeats. Human Mutation, 35(8), 1021–
1032. Last date accessed 2/21/2022. Retrieved from
https://doi.org/10.1002/humu.22599
9. Diegoli, T. M. (2015). Forensic typing of short tandem repeat markers on the X and Y
chromosomes. Forensic Science International: Genetics, 18, 140–151. Last date
accessed 2/21/2022. Retrieved from https://doi.org/10.1016/j.fsig
10. Kayser, M. (2017). Forensic use of Y-chromosome DNA: A general overview. Human
Genetics, 136(5), 621–635. Last data accessed 2/21/2022. Retrieved from
https://doi.org/10.1007/s00439-017-1776-9
11. Ohio Attorney General’s Center for the Future of Forensic Science at Bowling Green
State University. (2020). Applied biosystems 3500 genetic analyzer, DC 4.0
GeneMapper ID-X software (v1.5/v1.6) validation testing scheme. Ohio Attorney
General’s Center for the Future of Forensic Science at Bowling Green State
University.
12. Ohio Attorney General’s Center for the Future of Forensic Science at Bowling Green
State University. (2020). Applied biosystems 3500 genetic analyzer, DC 4.0
GeneMapper ID-X software v1.5 (previously validated)/v1.6 validation report.
Ohio Attorney General’s Center for the Future of Forensic Science at Bowling
Green State University.
13. Mulero, J. J., Chang, C. W., Calandro, L. M., Green, R. L., Li, Y., Johnson, C. L., &
Hennessy, L. K. (2006). Development and validation of the AmpFlSTR Yfiler
PCR amplification kit: a male specific, single amplification 17 Y-STR multiplex
system. Journal of forensic sciences, 51(1), 64–75. Last date accessed 2/21/2022.
Retrieved from https://doi.org/10.1111/j.1556-4029.2005.00016.x
14. Scientific Working Group on DNA Analysis Methods (SWGDAM). (2017). SWGDAM
interpretation guidelines for autosomal STR typing by forensic DNA testing
laboratories. Scientific Working Group on DNA Analysis Methods (SWGDAM).
Last date accessed 2/21/2022. Retrieved from
https://www.swgdam.org/publications
15. Scientific Working Group on DNA Analysis Methods (SWGDAM). (2014). SWGDAM

Koon 20
interpretation guidelines for Y-chromosome STR typing by forensic DNA
laboratories. Scientific Working Group on DNA Analysis Methods (SWGDAM).
Last date accessed 2/21/2022. Retrieved from
https://www.swgdam.org/publications
16. Roewer, L., Andersen, M. M., Ballantyne, J., Butler, J. M., Caliebe, A., Corach, D.,
D’Amato, M. E., Gusmão, L., Hou, Y., de Knijff, P., Parson, W., Prinz, M.,
Schneider, P. M., Taylor, D., Vennemann, M., & Willuweit, S. (2020). DNA
commission of the International Society of Forensic Genetics (ISFG):
Recommendations on the interpretation of Y-STR results in forensic analysis.
Forensic Science International: Genetics, 48, 102308. Last data accessed
2/21/2022. Retrieved from https://doi.org/10.1016/j.fsigen.2020.102308


