Embed Size (px)
Citation preview

Bandwidth-Aware Allocation of Resilient Virtual Software Defined Networks
Rafael L. Gomesa,b,1,∗, Luiz F. Bittencourt, Edmundo R. M. Madeira.b, Eduardo Cerqueira.a,c, Mario Gerla.a
aUniversity of California (UCLA), Los Angeles, USAbUniversity of Campinas (UNICAMP), Sao Paulo, Brazil
cFederal University of Para (UFPA), Para, Brazil
Abstract
Currently, it is hard to imagine our lives without the Internet, where services are accessed and shared by billions ofusers every day. However, even after many years, the Internet cannot guarantee Quality of Service (QoS) for themain services to current and future clients. To deal with this problem, clients establish Service Level Agreements(SLAs) with their Internet Service Providers (ISPs), including resilience parameters. The Internet is recognized tobe resilient enough for many services, but it is still sensitive to failure events that affect the performance of theseservices. Software Defined Networks (SDNs) together with Virtual Network (VNs) approaches aim to enhance themanagement, planning and resource usage of networks. When both approaches are mixed together, we have VirtualSoftware Defined Network (VSDN). However, the allocation of VSDNs considering resilience issues is still an openissue. Within this context, this article presents an algorithm for VSDN allocation, called Bw-Risk-Ratio, that considersresilience factors, as well as it deploys the VSDN according to QoS parameters defined in the SLA. Experiments usinga real network topology show the effectiveness of the algorithm to deploy the VSDN resilient to failure events whencompared to existing solutions.
Keywords: Virtual Networks Allocation, Software Defined Network, Service Level Agreement, Resilience.
1. Introduction
Nowadays, Internet services over communication networks play a vital role in our modern private, corporate, andinstitutional lives. As a consequence, users become frustrated when the Internet access fails and/or when applicationquality level drops. Currently, users share lots of content, which accounts for an expressive part of Internet traffic. Ingeneral, Internet traffic is composed of a variety of applications, which need high bandwidth and are sensitive to delayand packet losses.
Usually, to pursue Quality of Service (QoS) between companies/clients and Internet Service Providers (ISPs), aService Level Agreement (SLA) is established to specify network parameters to be fulfilled by the ISPs [1], whereresilience is a key requirement to avoid service disruption of networked applications. Network resilience has beendefined as the capacity of the network to provide a minimum specified level of service in situations of faults instandard operation [2]. The concept of resilience involves not only incorporating reactive actions to manage post-event consequences, but also pre-event strategic planning. Moreover, reliability and traffic congestion concepts areimportant aspects of resilience to be considered during the service provisioning process [3].
Resilience and Bandwidth (Bw) are metrics closely related to the QoS, and they have direct impact in the user’simpression/satisfaction about the service provided by the ISP. However, the current Internet design does not supportboth QoS and resilience guarantees, being necessary to improve the management and planning of ISPs to allow abetter access to the Internet [3]. The implementation of these management and planning features involves ensuringSLA specifications, and thus impacts the user’s experience during possible failure events in the ISP.
∗+55 19 [email protected]
Preprint submitted to Elsevier January 21, 2016

Network Virtualization (NV) and Software Defined Networks (SDNs) approaches emerge as prominent tech-nologies to bring management and planning features for the Future Internet. NV is a technology that enables thedeployment of multiple network environments that share the same physical infrastructure [1], and SDN is a networkarchitecture that allows us set up flows and subnetworks through controls that are separate from the data plane [4].Both approaches can be mixed together through a Network Hypervisor (such as Flowvisor or OpenVirtex [5]), whichallows slicing of the network in layers. Each layer is a customized Virtual Network (VN) that deploys a particular setof resources and protocols. We call this a Virtual Software Defined Network (VSDN). Through the VSDN approach,the ISP can isolate VNs in the SDN and separately deploy the functionalities requested by each client, for examplepacket routing, resource reservation, among others.
The flexibility and management control provided by VSDNs, however, does not come for granted. To deployVSDNs, ISPs must develop allocation algorithms that decide which components (links and nodes) will take part onthe VSDN to comply with client requests. In this context, this article proposes the Bw-Risk-Ratio algorithm to deployVSDNs with the best ratio between network reliability and bandwidth allocated to the VSDN. Thus, besides adaptingthe VSDN allocation according to the reliability, our proposal also aims to minimize the total bandwidth committed tosolve the requests. To accomplish this, the proposed algorithm deploys a VSDN based on available Bw in the networkand on the estimated risk of failure of the components allocated to VSDN. We also propose a risk model to define thefailure risk of a component, which is used as input for our Bw-Risk-Ratio algorithm.
The objective of the proposed algorithm is to allocate a VSDN that is efficient (i.e., fulfills the SLA parametersusing as few as possible resources from the ISP) under normal operating conditions, but is also planned to be resilientunder failure events. The resilience is achieved with strategic planning for failure events, where the algorithm deploysalternative paths whose allocated Bw can be increased as necessary, called elastic Bw. This elastic Bw allocation ispossible due to the dual characteristics of the proposed VSDN that combines the SDN and NV approaches [6].
The contribution of this article is an allocation algorithm for VSDN, which focuses on searching relative disjointpaths to achieve resilience considering the events that can affect the network infrastructure, as well as the planningof resource allocation to ensure SLA. The contribution represents the utilization of distinct research topics that whenmixed together can improve the service provision of ISPs.
This article is organized as follows. Section 2 presents some basic concepts, including the description of thenetwork reliability method and the presentation of some related work. Section 3 introduces the proposed algorithm.Section 4 describes the experimental results, and Section 5 concludes the article and presents future work.
2. Background
This section provides key concepts for the understanding of this article. Section 2.1 presents the concept of virtualsoftware defined networks and an illustrative scenario, while Section 2.2 describes the network reliability calculation.Finally, Section 2.3 discusses the main related work of resilience strategies, encompassing disjoint path definition,failure recovery, survivability, and other.
2.1. Virtual software defined networksVirtualization is used to bring flexibility and isolation for computer networks. Traditionally, approaches to achieve
virtualization of the network (for example, Xen [7], SR-IOV [8],, VIOLIN [9], and other) propose modification of ex-isting network equipment and/or the usage of technologies that are not designed to perform the network virtualization,where the virtual components have autonomy and should be configured individually [4].
Another approach is the deployment of VNs over SDNs. The basic idea of SDN is to decouple control andforwarding planes to make the network more manageable. A Controller acts as the “brain”, i.e., it is the entityresponsible for network behavior, relaying information to the switches according to applications deployed on it. Anetwork hypervisor can be deployed over an SDN infrastructure to provide an abstraction layer for the networkcomponents. Thus, it allows the creation of virtual networks that are completely decoupled and independent. Thenetwork hypervisor enables a virtual network to be independently managed by a controller and to be dynamicallyprovisioned. These virtual networks created over the SDN infrastructures are called VSDNs, where the capability tocustomize both the network parameters and services provided by ISPs arises. Therefore, the solutions to deal with thevirtualization over SDN infrastructures should interact directly with the network hypervisor and the flow tables insidethe SDN switches.
2

Differently from the traditional approaches, in the VSDN context the virtualization is centralized in the networkhypervisor and the intelligence of the network is based on the controller configuration, where one controller is respon-sible for one virtual network, which has a particular view of the network infrastructure composed of a subset of flows[4].
Figure 1 illustrates each environment that exists in the context of VSDN in the ISPs and an ISP Manager representsthe management entity of the ISP. SDN Infrastructure portrays the set of network components that compose the ISP.Network Hypervisor holds the configuration of VSDNs. Control Layer depicts the set of SDN controllers to managethe VSDNs.
ISP
Man
ager
Net
wo
rkH
yper
viso
rC
on
tro
lL
ayer
SD
NIn
fras
tru
ctu
re
VSDN - 1Configuration
InfrastructureManagement
Virtual NetworkDeployment
Controller 1 Controller n
SDN Switch - 1
Openflow Protocol
... SDN Switch - n
VSDN - nConfiguration
TopologyDefinition
...
...
Figure 1: Virtual Software Defined Networks Organization.
We consider that the ISP Manager has three modules in the ISP to perform VSDN allocation: (i) Virtual NetworkDeployment is responsible for communicating with the network hypervisor to deploy the VSDN; (ii) InfrastructureManagement gets information regarding resources and network components that are available under the networkinfrastructure; and, (iii) Topology Definition decides which components (links and nodes) will take part in the VSDN.Therefore, the proposed allocation algorithm works inside the Topology Definition.
Additionally, the allocation of nodes and links is performed directly from the infrastructure, i.e., if a component isallocated in two VSDNs, it is directly accessed by the controllers through the network hypervisor, where the behaviorof the VSDN is defined through controller configuration (one controller for each VSDN). Therefore, the allocationalgorithm must define which components of existing network are linked to the VSDN deployed at the moment.
For the ISP client, the network quality can be expressed through many parameters, among which resilience andbandwidth are the focus of this work. In general, these two parameters are defined in SLAs. The resilience comprisesseveral factors, among which reliability and traffic tolerance are addressed in this article. Network reliability isthe probability that a network will successfully complete the task it is intended to perform under the conditionsencountered for the specified period of time defined between a source and a target [10]. The most popular approachto provide network reliability is the establishment of disjoint paths: when a link/node fails, the main path affected bythe failure switches the traffic over to its respective alternative path [11]. However, it is not advantageous for the ISPsto allocate a full redundancy network for a client that does not desire such reliability (and will not pay for it), since itrepresents a waste of resources.
On the other hand, traffic tolerance is the ability to handle unpredictable load without a significant drop in carriedload in cases of unexpected failure [2]. Usually, it is caused by a flash crowd or convergence of traffic due to networkfailure (for example, a disaster) [2]. Thus, the ISPs can improve service quality by employing mechanisms andstrategies to implement reliability and traffic tolerance.
Nowadays, the Internet traffic is sensitive to the available bandwidth since it is directly related to the packet losses.In this way, these two QoS parameters (resilience and bandwidth) are related to the QoE perceived by the users. Onthe other hand, the ISPs aim to maximize profit, deploying as much SLAs as possible according to their availableinfrastructure.
Figure 2(a) illustrates a scenario where this work can be used. Suppose that the client and the ISP negotiate an SLAand the VSDN must be deployed by the ISP accordingly. For example, if Client 1 negotiates a VSDN with the ISP, itcould allocate the green VSDN-1, which has an aggregated Bw of 20 Mbps and is managed by Controller 1. Similarly,the ISP could deploy for Client 2 the orange VSDN-2 with an aggregated Bw of 30Mbps between the gateways (gray
3

nodes in Figure 2(a)) and Controller 2. Therefore, to allocate the VSDN from the existing SDN infrastructure, the ISPneeds to define the topology, which must have its parameters specified by the client. In this work, the client specifiesthe gateways to be interconnected, desired Bw, and reliability.
Net
wo
rk
Hyp
ervi
sor
30
3030 30 30
30
30
SD
N
Infr
astr
uct
ure
1010 10
10
VSDN-2VSDN-1
15
15
15
Co
ntr
ol
Lay
er
ISP
Man
ager
Openflow Protocol
Controller 1 Controller 2
Client 1
Client 2
Internet
InfrastructureManagement
Virtual Network
Deployment
TopologyDefinition
(a) Normal operation.
Net
wo
rk
Hyp
ervi
sor
30
3030 30 30
30
30
SD
N
Infr
astr
uct
ure
15 15
VSDN-2VSDN-1
15
15
15
Co
ntr
ol
Lay
er
ISP
Man
ager
Openflow Protocol
Controller 1 Controller 2
Client 1
Client 2
Internet
InfrastructureManagement
Virtual Network
Deployment
TopologyDefinition
(b) Operation under failure event.
Figure 2: Scenario representing the context.
In a different scenario, Figure 2(b) shows an example when part of the network fails. Therefore, VSDN-1 suffersthe consequences of a failure, losing parts of its resources. A judicious VSDN design allows the VSDN to work at theminimum SLA quality level through an increase in allocated Bw on the path that is still operational. An example ofVSDN design for this situation was proposed in reference [6]. Therefore, the proposal of this article can be attachedas a preliminary step, to plan the VSDN allocation to support the VSDN resource adjustment when it is necessary,known as an elastic Bw approach.
Within this context, we propose that the VSDN allocation problem can be solved by: (1) generating robust VSDNtopology that satisfies reliability and redundancy restrictions; and (2) computing on such a topology a set of pathsthat meet SLA requirements. The Bw-Risk-Ratio algorithm presented in this article generates a VSDN topology thatsatisfies the SLA with the best ratio between Bw usage and reliability. The Bw-Risk-Ratio algorithm proposed in thisarticle generates a VSDN topology that satisfies SLA with best ratio between Bw usage and reliability of the VSDN.
2.2. Network reliability calculationThe first step in VSDN allocation is the determination of the VSDN topology. Subsequently, the reliability of
the network topology is calculated. There are several ways to compute the reliability of a network. Some papersuse machine learning techniques [12] that need a robust set of information related to the network infrastructure.Another scheme is to evaluate the probability of connection between specified pair of nodes inside the network. Thisconnectivity approach can be deployed using distinct assumptions, for example: the failure probability follows acounting process [13]; the network nodes are perfectly reliable and the links can be in one of three states (operational,degraded or failed) [14]; the failures in the network are correlated/dependent [15]; and others.
This article uses the reliability calculated as criterion to establish the effectiveness of the VSDN topology. Thus, itis independent of the reliability calculation method (i.e., this does not change the behavior of the proposed algorithm).Therefore, we decided to apply the method proposed by Li et al. [16], which has the following advantages: (i) itis proposed for generic networks (i.e., it does not use information about physical elements or a pre-defined databaseinformation about the network infrastructure); (ii) it gets a good approximation to the reliability, while minimizingthe computation time; (iii) it is flexible to vary the number of failures in the network; and (iv) it is easily adaptableto consider one source to many destination analysis. The description of the network reliability calculation process ispresented in Section 2.2.1, while Section 2.2.2 provides information about the method.
2.2.1. Description of network reliability computation methodThe network reliability method is applied considering that each VSDN component (nodes and links) has a reli-
ability value (i.e., a probability of the component to be operational). We call R as the probability of the network toconnect the client’s gateway (root node) and all destination nodes.
4
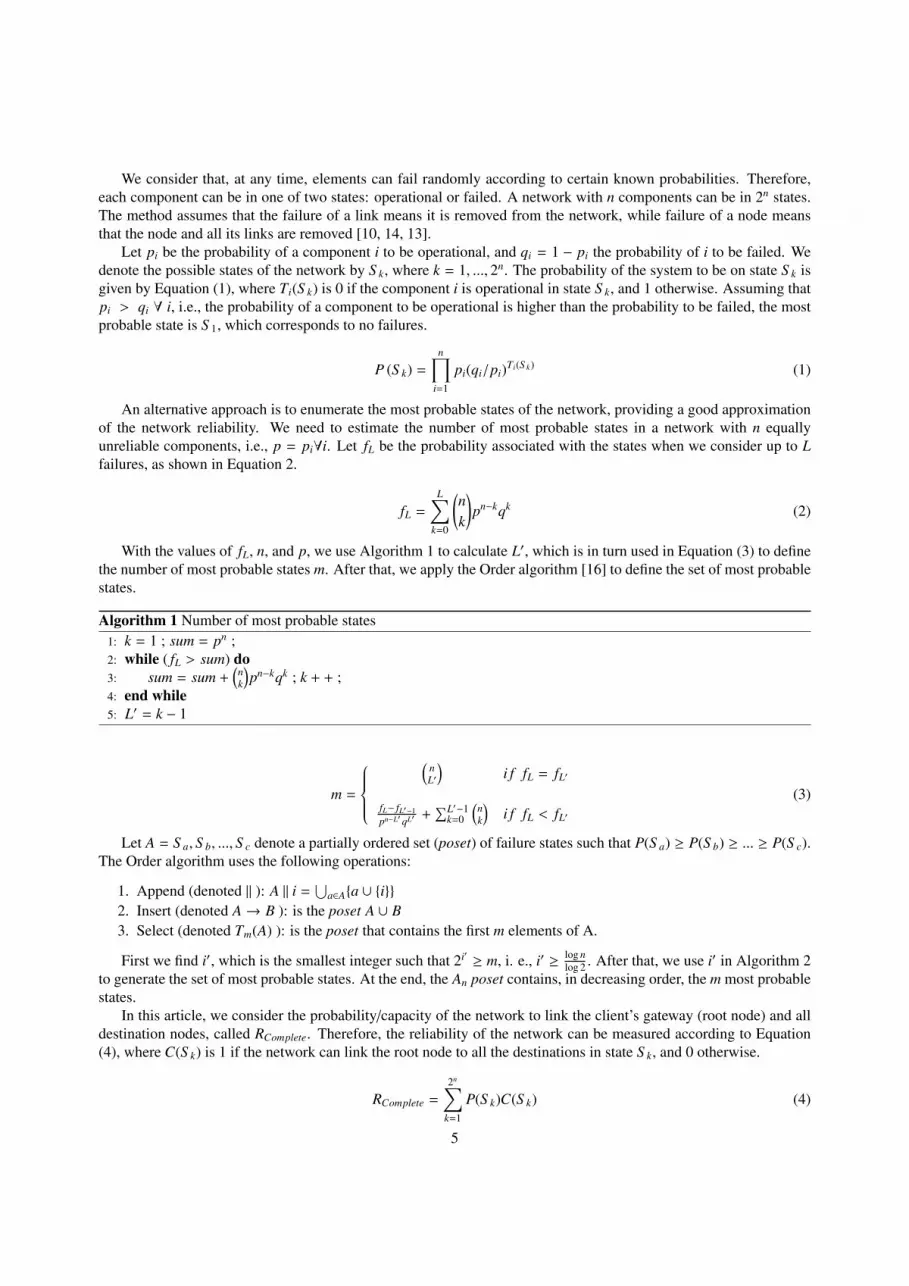
We consider that, at any time, elements can fail randomly according to certain known probabilities. Therefore,each component can be in one of two states: operational or failed. A network with n components can be in 2n states.The method assumes that the failure of a link means it is removed from the network, while failure of a node meansthat the node and all its links are removed [10, 14, 13].
Let pi be the probability of a component i to be operational, and qi = 1 − pi the probability of i to be failed. Wedenote the possible states of the network by S k, where k = 1, ..., 2n. The probability of the system to be on state S k isgiven by Equation (1), where Ti(S k) is 0 if the component i is operational in state S k, and 1 otherwise. Assuming thatpi > qi ∀ i, i.e., the probability of a component to be operational is higher than the probability to be failed, the mostprobable state is S 1, which corresponds to no failures.
P (S k) =
n∏i=1
pi(qi/pi)Ti(S k) (1)
An alternative approach is to enumerate the most probable states of the network, providing a good approximationof the network reliability. We need to estimate the number of most probable states in a network with n equallyunreliable components, i.e., p = pi∀i. Let fL be the probability associated with the states when we consider up to Lfailures, as shown in Equation 2.
fL =
L∑k=0
(nk
)pn−kqk (2)
With the values of fL, n, and p, we use Algorithm 1 to calculate L′, which is in turn used in Equation (3) to definethe number of most probable states m. After that, we apply the Order algorithm [16] to define the set of most probablestates.
Algorithm 1 Number of most probable states1: k = 1 ; sum = pn ;2: while ( fL > sum) do3: sum = sum +
(nk
)pn−kqk ; k + + ;
4: end while5: L′ = k − 1
m =
(
nL′
)i f fL = fL′
fL− fL′−1
pn−L′qL′ +∑L′−1
k=0
(nk
)i f fL < fL′
(3)
Let A = S a, S b, ..., S c denote a partially ordered set (poset) of failure states such that P(S a) ≥ P(S b) ≥ ... ≥ P(S c).The Order algorithm uses the following operations:
1. Append (denoted || ): A || i =⋃
a∈A{a ∪ {i}}2. Insert (denoted A→ B ): is the poset A ∪ B3. Select (denoted Tm(A) ): is the poset that contains the first m elements of A.
First we find i′, which is the smallest integer such that 2i′ ≥ m, i. e., i′ ≥ log nlog 2 . After that, we use i′ in Algorithm 2
to generate the set of most probable states. At the end, the An poset contains, in decreasing order, the m most probablestates.
In this article, we consider the probability/capacity of the network to link the client’s gateway (root node) and alldestination nodes, called RComplete. Therefore, the reliability of the network can be measured according to Equation(4), where C(S k) is 1 if the network can link the root node to all the destinations in state S k, and 0 otherwise.
RComplete =
2n∑k=1
P(S k)C(S k) (4)
5

Algorithm 2 Order algorithm1: S 1 = ∅ ; A0 = {S 1};2: for i = 1→ i′ do3: Bi−1 = Ai−1||i ; Ai = Bi−1 → Ai−1;4: end for5: Ai′+1 = Tm(Ai)6: for i = i′ + 1→ m do7: Bi−1 = Ai−1||i ; Ai = Bi−1 → Ai−1 ; Ai = Tm(Ai);8: end for
Applying the most probable states approach, we can find the Lower (RLow) and Upper (RU p) bounds of the networkreliability, using the Equations 5 and 6 respectively [16].
RLow =
m∑k=1
P(S k)C(S k) +
1 − m∑k=1
P(S k)
C(S 2n ) (5)
RU p =
m∑k=1
P(S k)C(S k) +
1 − m∑k=1
P(S k)
C(S 1) (6)
The Upper and Lower bounds assume that the performance for S m+1 to S 2n is the same as in S 1 (no failure state)and S 2n (failure of all components state), respectively. We define the probability R, as the mean value of RLow and RU p.Regarding the algorithm complexity, the network reliability method has O(n2m + nmlogm), since it first computes themost probable states and after bounds the reliability of them.
2.2.2. Remarks about the network reliability methodIn our previous work [17], we identified a tradeoff between the network reliability and the network size: the more
paths exist between the root node and destinations, the greater the network reliability due to alternative paths amongnodes. However, the reliability of a single path decreases with the increase in its length (number of hops), since themore components, the greater the cumulative probability of failure in any component of the path. For example, atopology with one path of three components presents higher reliability than a topology defined with one path of fivecomponents, given that all components present the same probability of failure.
In the context of VSDN allocation addressed in this work, the allocation algorithm initially determines the VSDNtopology, and after that, the reliability of the network can be calculated. Moreover, from the reliability point-of-view,it is identified if the VSDN is suitable for the desired parameters. Observe that, since the proposal of this articleis independent of the reliability method (it just requires as input the reliability of the virtual network topology), thereliability method applied could be easily adapted for specific situations.
2.3. Related work
This article proposes a partial disjoint path definition approach to bring resilience to VSDNs. Thus, we analyzesome papers related to resilience improvements on SDN and VN, as well as disjoint path definition approaches toachieve resilience in the network. Since both topics have distinct focus, we split the related work in different subsec-tions.
2.3.1. Resilience in VN and SDN environmentsIn this section we describe papers related to SDN and VN approaches in the resilience context. Table 1 summarizes
analyzed papers, emphasizing the difference between each of them and the proposal of this article. Each column ofTable 1 specifies the behavior of protocols: Context presents the network environment to which the protocol wasdesigned; SLA-Aware informs if the protocol considers an SLA specification to deploy the virtual network; and Focusis the main contribution of the paper.
Hock et al. [18] investigated the planning of controller location in SDN to achieve resilience or dynamic controllerprovisioning. The authors look at node-to-controller latencies and controller placement in order to fulfill resilience
6
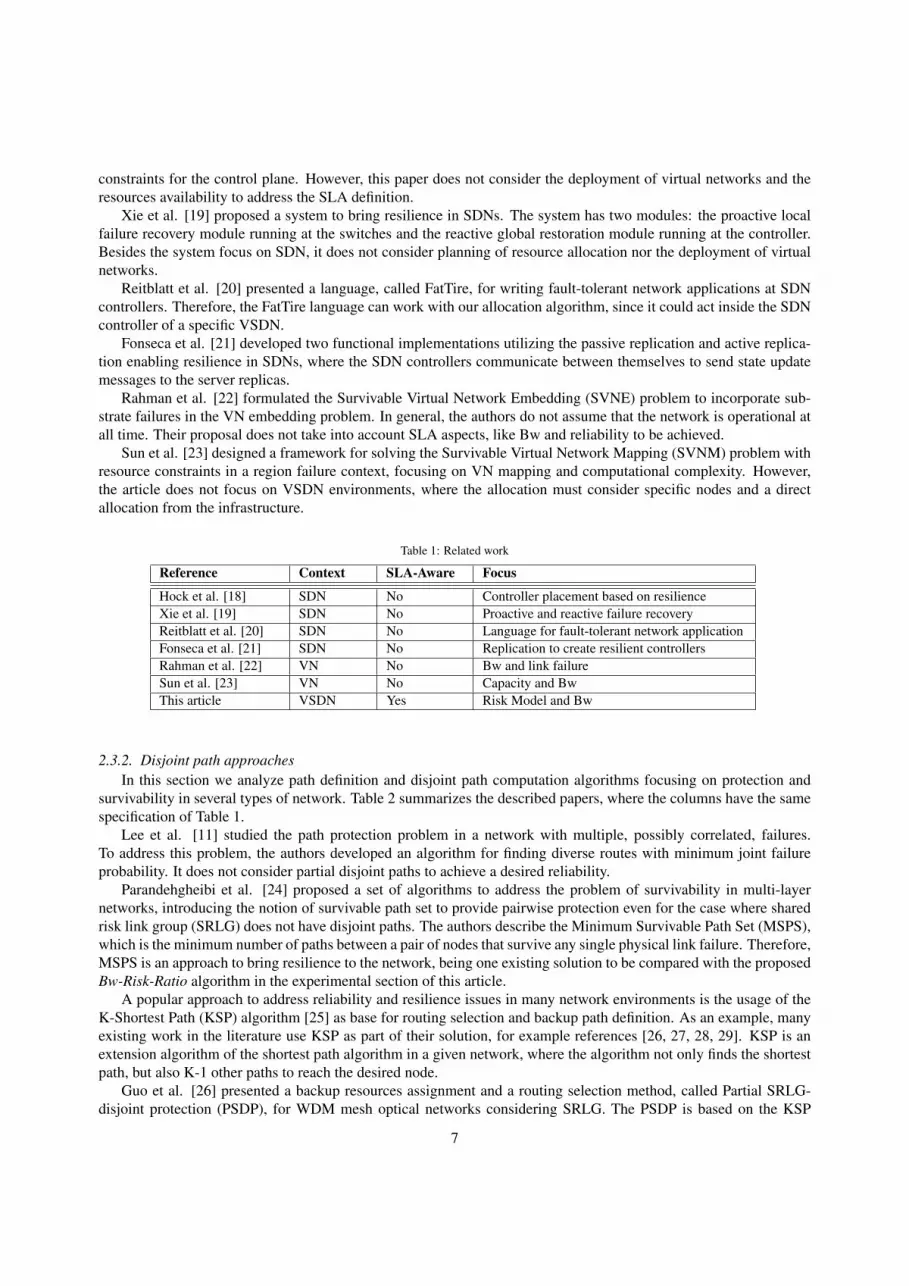
constraints for the control plane. However, this paper does not consider the deployment of virtual networks and theresources availability to address the SLA definition.
Xie et al. [19] proposed a system to bring resilience in SDNs. The system has two modules: the proactive localfailure recovery module running at the switches and the reactive global restoration module running at the controller.Besides the system focus on SDN, it does not consider planning of resource allocation nor the deployment of virtualnetworks.
Reitblatt et al. [20] presented a language, called FatTire, for writing fault-tolerant network applications at SDNcontrollers. Therefore, the FatTire language can work with our allocation algorithm, since it could act inside the SDNcontroller of a specific VSDN.
Fonseca et al. [21] developed two functional implementations utilizing the passive replication and active replica-tion enabling resilience in SDNs, where the SDN controllers communicate between themselves to send state updatemessages to the server replicas.
Rahman et al. [22] formulated the Survivable Virtual Network Embedding (SVNE) problem to incorporate sub-strate failures in the VN embedding problem. In general, the authors do not assume that the network is operational atall time. Their proposal does not take into account SLA aspects, like Bw and reliability to be achieved.
Sun et al. [23] designed a framework for solving the Survivable Virtual Network Mapping (SVNM) problem withresource constraints in a region failure context, focusing on VN mapping and computational complexity. However,the article does not focus on VSDN environments, where the allocation must consider specific nodes and a directallocation from the infrastructure.
Table 1: Related work
Reference Context SLA-Aware Focus
Hock et al. [18] SDN No Controller placement based on resilienceXie et al. [19] SDN No Proactive and reactive failure recoveryReitblatt et al. [20] SDN No Language for fault-tolerant network applicationFonseca et al. [21] SDN No Replication to create resilient controllersRahman et al. [22] VN No Bw and link failureSun et al. [23] VN No Capacity and BwThis article VSDN Yes Risk Model and Bw
2.3.2. Disjoint path approachesIn this section we analyze path definition and disjoint path computation algorithms focusing on protection and
survivability in several types of network. Table 2 summarizes the described papers, where the columns have the samespecification of Table 1.
Lee et al. [11] studied the path protection problem in a network with multiple, possibly correlated, failures.To address this problem, the authors developed an algorithm for finding diverse routes with minimum joint failureprobability. It does not consider partial disjoint paths to achieve a desired reliability.
Parandehgheibi et al. [24] proposed a set of algorithms to address the problem of survivability in multi-layernetworks, introducing the notion of survivable path set to provide pairwise protection even for the case where sharedrisk link group (SRLG) does not have disjoint paths. The authors describe the Minimum Survivable Path Set (MSPS),which is the minimum number of paths between a pair of nodes that survive any single physical link failure. Therefore,MSPS is an approach to bring resilience to the network, being one existing solution to be compared with the proposedBw-Risk-Ratio algorithm in the experimental section of this article.
A popular approach to address reliability and resilience issues in many network environments is the usage of theK-Shortest Path (KSP) algorithm [25] as base for routing selection and backup path definition. As an example, manyexisting work in the literature use KSP as part of their solution, for example references [26, 27, 28, 29]. KSP is anextension algorithm of the shortest path algorithm in a given network, where the algorithm not only finds the shortestpath, but also K-1 other paths to reach the desired node.
Guo et al. [26] presented a backup resources assignment and a routing selection method, called Partial SRLG-disjoint protection (PSDP), for WDM mesh optical networks considering SRLG. The PSDP is based on the KSP
7

algorithm, where it assigns for each working path a full SRLG-disjoint backup path based on a differentiated reliabilityconstraints.
Zotkiewicz et al. [27] proposed a polynomial time algorithm to compute the shortest pair of failure-disjoint paths.The authors assume two kinds of links: perfectly resilient (that does not fail) and unreliable. Based on it, the algorithmgenerates disjoint paths from KSP, where two paths can share only perfectly resilient links.
Lin et al. [28] proposed a disjoint path routing algorithm to reduce energy usage, identifying network links thatcan be powered-off. The algorithm finds a set of k paths that can be used to route all traffic demand and the flows arerouted through the paths that are feasible and minimize the energy consumption.
Oki et al. [29] presented a disjoint path selection scheme for GMPLS networks with SRLG constraints, calledweighted-SRLG (WSRLG) scheme. It treats the number of SRLG members related to a link as part of the link costwhen the KSP algorithm is executed. In WSRLG, a link that has many SRLG members is rarely selected as theshortest path.
Table 2: Related work
Reference Context Focus
Lee et al. [11] Generic Network Failure probabilityEppstein [25] Generic Network KSP algorithmParandehgheibi et al. [24] Generic Network Survivability in multi-layer networksLin et al. [28] Generic Network Energy-aware disjoint path definitionZotkiewicz et al. [27] Generic Network Definition of failure-disjoint pathsGuo et al. [26] WDM Backup routing for WDM meshOki et al. [29] GMPLS Disjoint path selection based on SRLGThis article VSDN Relative disjoint path based on reliability and Bw
To the best of our knowledge, none of the works found in the literature focuses on the development of an algorithmto solve the following issues together: (i) to allow the ISP to save resources maximizing the number of solved requests;(ii) to provide resilience through alternatives paths; and, (iii) to allocate VSDNs that are able to adjust the resourceswhen needed. All these issues are addressed in the allocation algorithm proposed in this article.
3. Bw-Risk-Ratio algorithm
This section presents the Bw-Risk-Ratio algorithm. It is composed of an algorithm to generate relative disjointpaths, which uses a path definition algorithm as basis to compute paths between the source node and a set of destina-tions. Basically, the Bw-Risk-Ratio algorithm focuses on varying the percentage of disjoint path established betweenthe source node and the set of destination nodes to find the best solution. The evaluation of best solution considers thereliability of the virtual topology, as well as the Bw used by it.
This article uses the following notation to model the VSDN allocation problem. Let G = (V, E) be a weighteddirected graph representing the ISP topology, where V is a set of n vertices (or nodes) and E is a set of eu,v edges(or links), where u and v are nodes in V . Moreover, each edge eu,v has an associated weight wu,v that allows the pathsearch to choose the best links according to algorithm’s policy. In this proposal, each edge wu,v receives as initialweight the bandwidth of link between node u and node v. The algorithm is based on generating disjoint paths thatmaximize reliability through evaluation of a set of redundancy levels 0 6 p 6 1. These disjoint paths start in a sourcenode s and must reach a set D, |D| = k, of designated destination nodes in the network graph G = (V, E). The notationused in this article is summarized in Table 3.
The disjoint path search is based on the following steps:
1. Build a tree T1 of paths from root s to every node in the network graph G. In our work, this tree is generated byfollowing design principles that find only paths with the requested bandwidth (detailed in Section 3.2).
2. Extract from T1 a subtree P1 that connects s to every destination node in D.3. Define the amount re of redundant edges needed for the subtree P1 to have a redundancy p. Note that the needed
number of edges re depends on the size (number of edges) of subtree P1.
8

Table 3: NotationSymbol Description
G Weighted directed graph representing the ISP topologyV Set of vertices (or nodes)n Number of vertices (or nodes)E Set of directed edges (or links)e Number of directed edges (or links)s Source nodeD Set of destination nodesk Number of destination nodes (|D| = k)
eu,v Edge between nodes u and vwu,v Weight/cost for the edge between node u and node vG′ Updated ISP topologyR Reliability of the current virtual topologyRr Reliability requested in SLAre Number of edges to updatep Redundancy level (0 6 p 6 1)
BwTotal total sum of Bw allocated in the topologyBwr Bw requested for the VSDNbest Current best ratio between Bw and reliabilityGbest Current best virtual topologyG f Final best virtual topology
4. Update weights wu,v from re edges of subtree P1 to avoid them when building the redundancy tree T2.5. Build a tree T2 using the same procedure of step 1. This new tree, due to the link update performed in previous
step, will have re disjoint links from the tree T1.
As we focus on maximizing reliability and enhancing the Bw usage, the steps above are repeated for redundanciesp varying from 0 to 1, and the disjoint path configuration that presents the best reliability is stored for deployment. InSection 3.1, it is presented an overview of the steps performed by the algorithm to generate relative disjoint paths inorder to provide the general reasoning of the proposal. In Section 3.2, we describe the path definition algorithm.
3.1. Algorithm to generate relative disjoint paths
To generate the alternative paths in VSDN topology, we developed Algorithm 3, which generates the redundancyinside the VSDN according to a redundancy factor p. As stated before, p is the variable responsible for establishinghow many links need to be updated, i.e., the percentage of links of the primary path to be used as a basis for thesecondary path.
As an example, p = 0 is the no redundancy case, which means that the topology will have a single path to eachdestination node. On the other hand, if p = 1, which is the full redundancy case, the topology will have two fullydisjoint paths to each destination node. Similarly, p = 0.5 is the case where half of links in primary path will be thebasis for the secondary path. The algorithm iterates from no redundancy (p = 0 – single path to each destination)to full redundancy (p = 1 – two fully disjoint paths to each destination) to find the redundancy level that yields thelargest reliability. For example, if the increment on redundancy p is 0.25, then first the algorithm evaluates the p = 0case, after it checks p = 0.25 case, and so on until p = 1.
Inside the main loop (lines 2–16), the algorithm iterates by the possible redundancy factor to find the best virtualtopology. Initially, we find a tree T1 with node s as root by running the Bw-Risk-ratio path definition (line 2). Thisalgorithm will be detailed in Algorithm 4 at Section 3.2. The resulting T1 tree contains a path from s for every node uin G.
Next, the function Edges(T1, D) (line 4) extracts from T1 only those paths which connect s to nodes in D, storingthem in P1. Then, the algorithm assigns to re the number of links to be updated to generate the redundancy in the
9

topology (line 5). re is calculated as a percentage from the number of links in P1 according to redundancy p beingevaluated. The next step sorts the links in P1 according to how many times the link appears in P1, storing this sortedlist in E1 (line 6).
Then, the algorithm creates a copy G′ of G. The sorted list E1 is traversed between lines 8 and 16 to update theweight of each link in G′. This update process aims to avoid, during the redundant path search, links that have beenalready used, thus allowing the discovery of alternative paths.
In the next step, the algorithm finds the tree T2 in the graph G′ (with the updated weights) by running the Bw-Risk-ratio path definition algorithm, and it assigns to P2 the set of paths from s to nodes in D extracted from T2 (lines17 and 18, respectively). Note that, due to the link update procedure, the path definition to compose T2 avoids the useof re links that are already used in T1.
The algorithm merges paths of P1 and P2 (line 19), i.e., the algorithm creates a graph by merging the link sets andnode sets. This process is performed by the Merge(S et o f Edges, S et o f Edges) function. The resulting graph isthe final topology G f that contains the relative disjoint paths between node s and the nodes of D obeying the currentredundancy factor p.
Algorithm 3 Relative disjoint paths for Bw-Risk-Ratio algorithm1: p = 0; . No Redundancy Case2: while p ≤ 1 do . Redundancy , Full3: Tree T1 = Bw-Risk-Ratio path definition; . Using G to search4: Subtree P1 = Edges(T1, D);5: int re = p ∗ |P1|;6: Edges E1 = S ortEdges(P1);7: G′ = copy(G);8: while E1 , Ø do9: eu,v = getFirstEdge(E1);
10: E1 = E1 − {eu,v};11: if (re > 0) then . Updates edge (u,v) from copy G′
12: w′u,v = ℘ ;13: else14: w′u,v = 0;15: end if16: end while17: Tree T2 = Bw-Risk-Ratio path definition; . Using G′ to search18: Subtree P2 = Edges(T2, D);19: Graph G f = MergeTrees(P1, P2)20: double R = Reliability(G f ) ;21: if (( BwTotal / Bwr) ∗ (1 − R) < best) and (Rr ≤ R) then22: best = (BwTotal / Bwr) ∗ (1 − R);23: Gbest = G f ;24: end if25: Increase(p);26: end while
After, the reliability of G f is calculated according to the method presented in Section 2.2. The best topology so faris stored (lines 21 to 24), where the algorithm checks if current G f is “better” than those previously found, as well as ifthe reliability of the current virtual topology meets the reliability requested by the client. The definition of “better” isrelated to the suitability of the topology in front of the desired parameter, and it is controlled by the condition definedin line 21 , where BwTotal is the total sum of Bw allocated in the topology, Bwr is the Bw requested by the client in theSLA, R is the reliability of topology (ranges between 0 and 1, as detailed in Section 2.2), Rr is the desired reliability,and best and Gbest are, respectively, the best solution and best topology found so far. This condition aims to definea linear relation between the criteria (reliability and bandwidth usage) applied, resulting in a evaluation where bothcriteria have a similar importance when the G f is analyzed.
10

At the end of outmost while loop, the algorithm increases the redundancy p to be used in the next iteration (line25). The amount of increment is configured by the network administrator to control the search granularity, for example0.1, 0.25, or 0.5 per iteration. In this article, a fixed increment of 0.25 is applied during experiments, which means theoutermost loop runs 5 times, testing redundancies of 0%, 25%, 50%, 75%, and 100%.
In a nutshell, Algorithm 3 constructs an initial tree in its first lines, and after that, with the update of link weight,it seeks alternative paths by adding new edges to the initial tree. This addition of links is limited by the redundancyfactor defined. The link update is used to avoid allocating edges already being used in currently allocated topology,but without discarding them as an option, thus forcing the algorithm to seek for alternative paths to reach the desirednodes in the second call of path definition algorithm. If no alternative path exists, the algorithm uses the path alreadyallocated due to non existence of a disjoint path. To illustrate the behavior of Algorithm 3, Figure 3 shows the linkschosen to be part of a network in cases of no redundancy and full redundancy when the algorithm is applied to theInternet2 Network topology2.
Figure 3: Example of links allocated.
In Figure 3 the black node represents the client/root node and nodes in blue illustrate the destination nodes.Moreover, blue lines represent the links allocated in scenario of no redundancy, while the blue dashed lines are theadditional links allocated in full redundancy situation. After running the algorithm, the ISP has the most suitabletopology from perspective of Bw usage and network reliability, which is defined according to the relation presentedin Algorithm 3.
The virtual topology generated is in accordance with the reliability desired by the client, taking advantage ofthe flexibility offered by network virtualization. This flexibility enables bandwidth usage reduction (since it can useonly part of the edges in the network) or/and the provision of reliability (since it enhances the routing possibilities)according to the client requirements.
3.2. Path definition algorithm
As presented in the previous section, the algorithm to generate relative disjoint paths uses a path definition al-gorithm. This path definition algorithm should allocate the shortest path with higher available bandwidth and lowerfailure risk. With that, it saves bandwidth and avoids the allocation of high risk components, directly influencingVSDN reliability, as detailed in Section 2.2.
In the Bw-Risk-Ratio algorithm, the weight of each link is defined according to Equation (7), which is composed oftwo parts: BwS core and RiskS core. The BwS core aims to evaluate the impact of the allocation of the bandwidth requestedby the client (Bwr) in relation to the available bandwidth in the link (Bw(u,v)). The RiskS core represents the potentialrisk events that can affect the network components, where RiskFactori is the risk factor defined for risk event i, and nis the number of risk factors, according to risk model described next. The formulation of RiskFactor follows the RiskModel proposed, which is detailed in Section 3.2.1.
2http://www.internet2.edu/
11
wu,v = BwS core + RiskS core , where
BwS core = log( Bw(u,v)
Bwr
), and
RiskS core =∑n
i=1 RiskFactori
n .
(7)
3.2.1. Risk modelThe network infrastructure is sensitive to several risks that can affect its performance and lead to service disruption.
A possible approach to identify these risks and their impact is the design of a risk model [30]. Several papers in theliterature [31, 32, 33] present theoretical and practical principles to analyze risk issues, as well as other papers use riskmodeling and mitigation as a base to: reveal suspicious behaviors of mobile applications [34]; make security profilesfor network components [35]; quantify monetary penalties for business policies [36]; realize fuzzy identification ofrouting attacks [37]; monitor emergence situations in hotspots independently[38]; perform reactive failure recovery[19]; among others.
Therefore, to determine the trustworthiness of a region where a network component is located, we propose the useof a risk model. The proposed risk model follows the principles of Fuzzy Logic, trying to bring it closer to the networkadministrator reasoning. The risk model has two input variables, Occurrence and Impact, and one Risk Factor outputvariable. Occurrence is the frequency that a given event occurs in the analyzed region. Impact is the damage causedto the network infrastructure by the corresponding event.
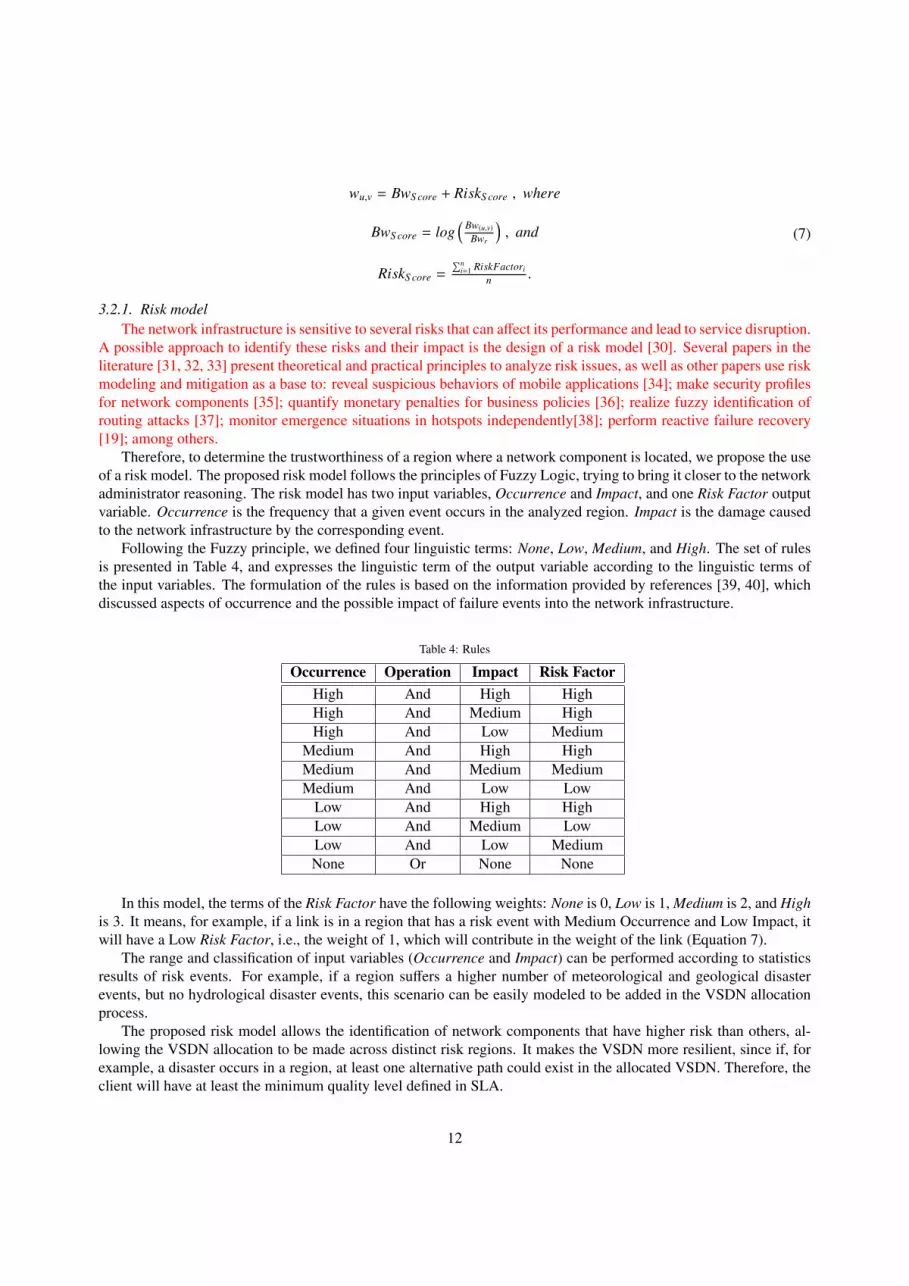
Following the Fuzzy principle, we defined four linguistic terms: None, Low, Medium, and High. The set of rulesis presented in Table 4, and expresses the linguistic term of the output variable according to the linguistic terms ofthe input variables. The formulation of the rules is based on the information provided by references [39, 40], whichdiscussed aspects of occurrence and the possible impact of failure events into the network infrastructure.
Table 4: Rules
Occurrence Operation Impact Risk FactorHigh And High HighHigh And Medium HighHigh And Low Medium
Medium And High HighMedium And Medium MediumMedium And Low Low
Low And High HighLow And Medium LowLow And Low MediumNone Or None None
In this model, the terms of the Risk Factor have the following weights: None is 0, Low is 1, Medium is 2, and Highis 3. It means, for example, if a link is in a region that has a risk event with Medium Occurrence and Low Impact, itwill have a Low Risk Factor, i.e., the weight of 1, which will contribute in the weight of the link (Equation 7).
The range and classification of input variables (Occurrence and Impact) can be performed according to statisticsresults of risk events. For example, if a region suffers a higher number of meteorological and geological disasterevents, but no hydrological disaster events, this scenario can be easily modeled to be added in the VSDN allocationprocess.
The proposed risk model allows the identification of network components that have higher risk than others, al-lowing the VSDN allocation to be made across distinct risk regions. It makes the VSDN more resilient, since if, forexample, a disaster occurs in a region, at least one alternative path could exist in the allocated VSDN. Therefore, theclient will have at least the minimum quality level defined in SLA.
12
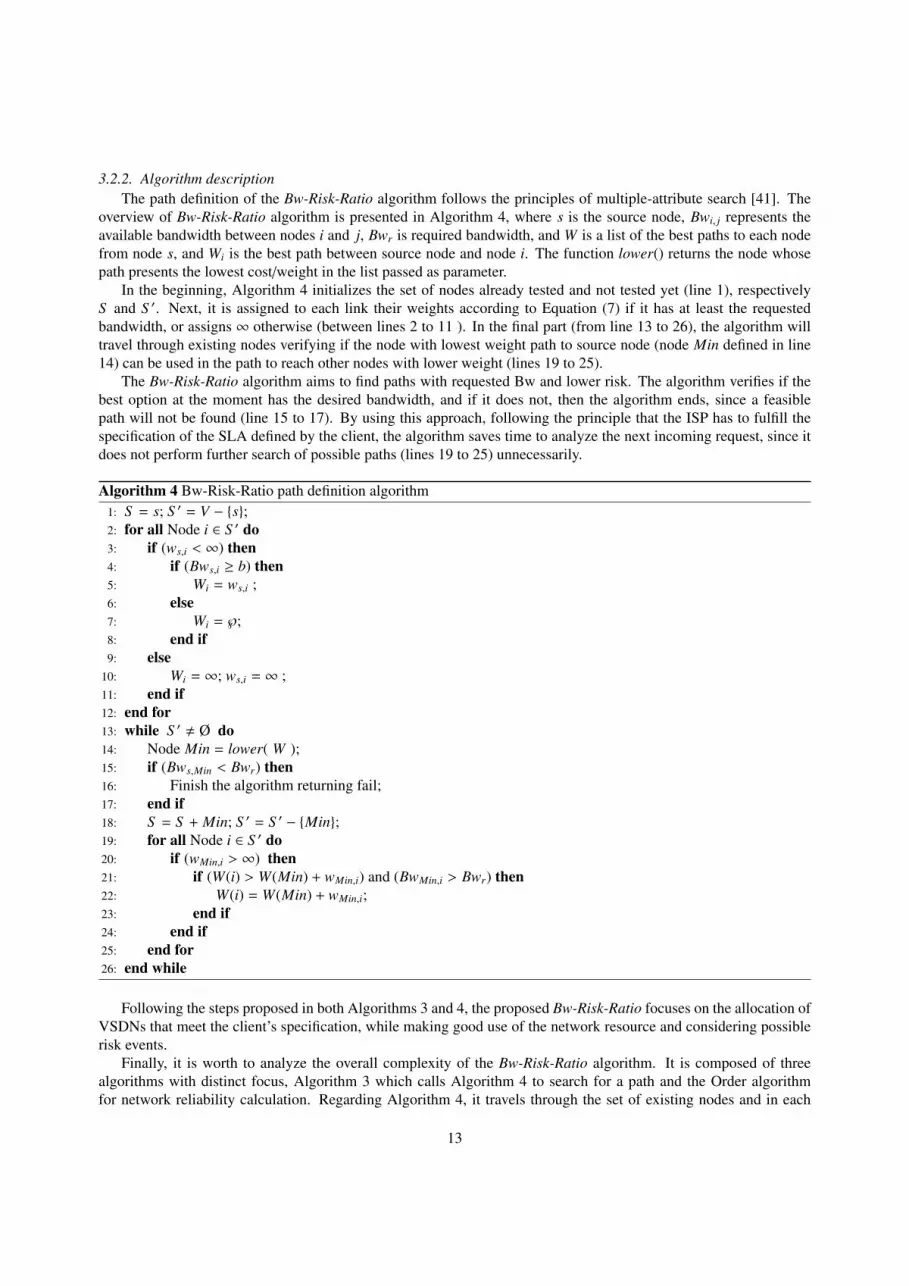
3.2.2. Algorithm descriptionThe path definition of the Bw-Risk-Ratio algorithm follows the principles of multiple-attribute search [41]. The
overview of Bw-Risk-Ratio algorithm is presented in Algorithm 4, where s is the source node, Bwi, j represents theavailable bandwidth between nodes i and j, Bwr is required bandwidth, and W is a list of the best paths to each nodefrom node s, and Wi is the best path between source node and node i. The function lower() returns the node whosepath presents the lowest cost/weight in the list passed as parameter.
In the beginning, Algorithm 4 initializes the set of nodes already tested and not tested yet (line 1), respectivelyS and S ′. Next, it is assigned to each link their weights according to Equation (7) if it has at least the requestedbandwidth, or assigns ∞ otherwise (between lines 2 to 11 ). In the final part (from line 13 to 26), the algorithm willtravel through existing nodes verifying if the node with lowest weight path to source node (node Min defined in line14) can be used in the path to reach other nodes with lower weight (lines 19 to 25).
The Bw-Risk-Ratio algorithm aims to find paths with requested Bw and lower risk. The algorithm verifies if thebest option at the moment has the desired bandwidth, and if it does not, then the algorithm ends, since a feasiblepath will not be found (line 15 to 17). By using this approach, following the principle that the ISP has to fulfill thespecification of the SLA defined by the client, the algorithm saves time to analyze the next incoming request, since itdoes not perform further search of possible paths (lines 19 to 25) unnecessarily.
Algorithm 4 Bw-Risk-Ratio path definition algorithm1: S = s; S ′ = V − {s};2: for all Node i ∈ S ′ do3: if (ws,i < ∞) then4: if (Bws,i ≥ b) then5: Wi = ws,i ;6: else7: Wi = ℘;8: end if9: else
10: Wi = ∞; ws,i = ∞ ;11: end if12: end for13: while S ′ , Ø do14: Node Min = lower( W );15: if (Bws,Min < Bwr) then16: Finish the algorithm returning fail;17: end if18: S = S + Min; S ′ = S ′ − {Min};19: for all Node i ∈ S ′ do20: if (wMin,i > ∞) then21: if (W(i) > W(Min) + wMin,i) and (BwMin,i > Bwr) then22: W(i) = W(Min) + wMin,i;23: end if24: end if25: end for26: end while
Following the steps proposed in both Algorithms 3 and 4, the proposed Bw-Risk-Ratio focuses on the allocation ofVSDNs that meet the client’s specification, while making good use of the network resource and considering possiblerisk events.
Finally, it is worth to analyze the overall complexity of the Bw-Risk-Ratio algorithm. It is composed of threealgorithms with distinct focus, Algorithm 3 which calls Algorithm 4 to search for a path and the Order algorithmfor network reliability calculation. Regarding Algorithm 4, it travels through the set of existing nodes and in each
13

iteration analyzes the remaining nodes in set S ′. In the same way, Algorithm 3 runs Algorithm 4 twice and updatesthe weight of the links used. Therefore, the complexity of Bw-Risk-Ratio is O( (nlogn) + e + (n2m + nmlogm) ),where m is the number of most probable states, e is the number of links and n is the number of nodes. The first part( O(nlogn) ) refers to the path computation process, the second part ( O(e) ) is related to the link update process, andthe last part represents the network reliability ( O(n2m + nmlogm) ) calculation.
4. Experiments
The Internet is recognized to be resilient enough, but it is still sensitive to failure events, that affect the servicedelivery of ISPs. Therefore, disasters can cause huge impacts on it [3]. Disaster represents a unique category ofchallenges because it results in failures over a region. Our experiments aim to evaluate the capacity of the proposedsolution to allocate a set of virtual topology requests and the capacity of the generated topologies in maintainingconnectivity during failure events over the same resilience strategy.
The evaluation of Bw-Risk-Ratio algorithm was split into two sets of experiments, since it has an algorithm forresilience and another one for path definition. Thus, the first evaluation compares the performance of our proposedresilience strategy against existing algorithms for resilience through disjoint paths. The second part evaluates the pathdefinition algorithm of Bw-Risk-Ratio against existing path definition algorithms.
4.1. EnvironmentTo evaluate the proposal, we developed a VSDN allocation simulator3, which is able to perform the following
tasks: (i) load an infrastructure topology; (ii) manage the infrastructure, as well as resource availability; (iii) define thenetwork for a set of requests according to the allocation algorithm and the reliability method chosen; and (iv) verifythe network connection status based on a sequence of failures of network components. Therefore, the developedsimulator can be used to evaluate the main aspects of allocation of resilient VSDN.
4.1.1. Experiment setupThe experiments aim to evaluate the capacity of the proposal to allocate a set of VSDN requests. The parameters
of a request are the following: (i) the source node; (ii) set of destination nodes; (iii) desired reliability in the SLA; (iv)duration of the requests (mean value of 50), where after the duration expires the resource allocated is released; and,(v) the requested bandwidth (mean value of 50 Mbps, where the minimum and maximum values are 10 and 100 Mbps,respectively). One hundred sets of requests were generated randomly and each one was composed of 100 requests.
Usually, network traffic models assume that the inter-arrival time and duration of flows, which results in trafficdemand, follow an exponential distribution [42]. Therefore, both the requested bandwidth and duration of requestsare generated by an exponential distribution, since both parameters can be considered related to the traffic demand.
Regarding the network infrastructure configuration, we used the Internet2 Network as topology (Figure 3), con-sidering a disaster event context. Additionally, the network links were configured with availability of 1 Gbps and thereliability of each network component (link or node) is 0.99 [10]. The results show a 95% confidence interval.
4.1.2. Bw-Risk-Ratio algorithm configurationThe configuration of the Risk Model of Bw-Risk-Ratio algorithm was based on the statistical information about
disasters occurrence and the impact of it in USA provided by the references [40, 39], including the categorization ofthe events. Therefore, we modeled four disaster events to the risk model presented in Section 3.2.1:
• Geophysical: Low Occurrence and High Impact – RiskFactorGeophysical is 3 (High Risk Factor);
• Meteorological: High Occurrence and High Impact – RiskFactorMeteorological is 3 (High Risk Factor);
• Hydrological: High Occurrence and Medium Impact – RiskFactorHydrological is 3 (High Risk Factor);
• Climatological: Low Occurrence and Low Impact – RiskFactorClimatological is 1 (Low Risk Factor).
3http://bitbucket.org/rafaellgom/vn-allocation/
14

Additionally, the Internet2 network was segmented in regions, each one sensitive to a particular risk event. Thesegmentation applied in the risk model is summarized in Table 5. It was based on the category of disaster eventsoccurrence according to the statistical information cited before. Figure 4 illustrates the region division applied in theexperiments.
Figure 4: Region division.
Table 5: Risk model information
Region Nodes Risk Events Risk Score
A Seattle, Portland, Sunnyvale, Los Angeles,and San Diego.
Meteorological and Geophysical. 1.5
B Boise and Salt Lake City. Meteorological and Climatological. 1C Albuquerque and El Paso. Meteorological. 0.75D Kansas and Denver. Meteorological and Climatological. 1E Houston, Baton Rouge, and Jacksonville. Meteorological and Hydrological. 1.5F Chicago, Indianapolis, and Louisville. Meteorological, Hydrological, and
Geophysical.2.25
G Nashville, Atlanta, Charlotte, and Raleigh. Meteorological and Hydrological. 1.5H Cleveland, Washington, Boston, New York,
and Philadelphia.Meteorological and Hydrological. 1.5
The Risk Score is defined according to Equation 7 in Section 3.2 with the risk model information presented above.For example, region D is susceptible to Meteorological and Climatological events, which have risk factors of 3 and 1,respectively. On the other hand, it is immune to Geophysical and Hydrological disasters, resulting in risk factor of 0for both of them. Therefore, each component in region D has RiskS core = 3+1+0+0
4 = 1.
4.2. Results
In this section we present the results of both sets of experiments performed, where Section 4.2.1 presents theevaluation of the resilience strategy and Section 4.2.2 exhibits the comparison of path definition algorithms. Duringthe experiments four aspects were evaluated:
• Successful allocations: the cumulative number of solved requests, i.e., how many VSDN requests the algorithmswere able to allocate with the desired reliability and bandwidth;
• Available bandwidth: the average bandwidth remaining in the network infrastructure after the allocation pro-cess;
• Saturated links: the number of links that have less than 10% of available bandwidth;
15

• Post-failure connectivity: the number of solved requests that keep full connectivity (reach all desired nodes)after some network component failures.
4.2.1. Resilience strategy evaluationIn this experiment, we compare the performance of existing algorithms for resilience through disjoint path cited
in Section 2.3, namely the KSP [25] algorithm and MSPS [24], against the proposed Bw-Risk-Ratio to evaluate itseffectiveness in relation to the solutions present in the literature. The KSP was adapted to consider the reliabilityof generated VSDNs, called Reliable KSP (RKSP), incrementing the number of paths until it reaches the desiredreliability. Since KSP uses a path definition algorithm, we analyze it together with two approaches for path definition:(i) shortest path with the Desired Bw (D-Bw); and (ii) the Maximum Available Bandwidth (MAB) algorithm [41].MAB is based on the widest path algorithm which finds the path with highest available bandwidth regardless of thenumber of used hops/links. Therefore, it is not a cumulative algorithm, it just chooses the path whose bottleneck (linkwith lowest bandwidth) has the highest available bandwidth.
The result regarding the status (success or failure) of requests is depicted in Figure 5. We observe that the behaviorof the algorithms is similar until the 35th request. At this point, the network resources are limited due to allocationof previous requests. It emphasizes the advantage of the proposed Bw-Risk-Ratio algorithm, where it can solve 10%more requests in cases of limited resources in the network, outperforming the other algorithms from the literature.
0
10
20
30
40
50
60
70
80
0 10 20 30 40 50 60 70 80 90 100
Su
cce
ssfu
l A
lloca
tio
ns
Number of Requests
Allocation Status
Bw-Risk-RatioRKSP+D-Bw
RKSP+MABMSPS
Figure 5: Successful allocations.
To highlight the difference between the algorithms, Figures 6(a) and 6(b) show bandwidth information accordingto the number of requests. It can be seen in Figure 6(a) that, among the algorithms, the RKSP+DBw is the one thatconsumed less bandwidth, where the Bw-Risk-Ratio algorithm reached a close value. This happens due to the natureof the DBw to search for paths with lower number of hops, disconsidering a possible impact of the allocations on theresource availability of the network as a whole.
Figure 6(b) illustrates the saturation behavior of algorithms. RKSP+MAB allocates the links until they are almostsaturated, preventing the defined VSDN to increase the allocated bandwidth if necessary. On the other hand, theBw-Risk-Ratio algorithm scatters the allocation of the links when it identifies a high utilization. This behavior allowsthe adaptation of bandwidth allocated for the VSDN in cases of increase on traffic demand of the VSDNs. Observethat, since each VSDN exists in a timeframe, the results regarding Bw present a change in the behavior, following therelease of resources after the timeframe.
To evaluate the algorithms from a post-disaster perspective, Figure 7 shows the number of operational requestsafter failure events. The evaluation considered four cases of disaster: failure of network components of all regions,or in regions E, F, and H. These specific regions were chosen because recent natural disaster events occurred in USA(Sandy and Katrina Hurricanes) affected these regions. Furthermore, we evaluate the scenarios according to failurepercentage. For example, “H-50%” means that 50% of the components in region H randomly failed, “H-100%”
16

300
400
500
600
700
800
900
1000
0 10 20 30 40 50 60 70 80 90 100
Ba
nd
wid
th (
Mb
ps)
Number of Requests
Available Bandwidth
Bw-Risk-RatioRKSP+D-Bw
RKSP+MABMSPS
(a) Available bandwidth after allocation.
0
2
4
6
8
10
12
14
0 10 20 30 40 50 60 70 80 90 100
Nu
mb
er
of
Sa
tura
ted
Lin
ks
Number of Requests
Saturated Links
Bw-Risk-RatioRKSP+D-Bw
RKSP+MABMSPS
(b) Number of saturated links.
Figure 6: Resource usage results.
implies that all components in that region have failed, and “All-10%” means that 10% of components in all regionsrandomly failed.
0
10
20
30
40
50
60
70
80
All-0% All-10% All-25% All-50% E-10% E-50% E-100% F-10% F-50% F-100% H-10% H-50% H-100%Nu
mb
er
of
Op
era
tio
na
l N
etw
ork
s
Failure Occurrence
Connectivity Status Under Failure Events
BW-Risk-Ratio RKSP+D-Bw RKSP+MAB MSPS
Figure 7: Post-disaster connectivity status.
In general, the connectivity decreases according to the increment of the number of components that fail. Animportant point to verify in this analysis is the capacity of the algorithms to define a set of VSDNs that could keep theconnectivity high even when the failure occurrence increases. Therefore, when an algorithm is analyzed individually,the higher is the number of failures the lower is the resulting connectivity. However, this decrement in the connectivityvaries according to each algorithm.
Based on Figure 7, it can be seen that the proposed Bw-Risk-Ratio has the highest connectivity independently ofthe region, because it avoids regions with higher Risk Score. With the limitation of resources according to VSDNsallocation, it is necessary to use these regions, but in a lower scale. In all cases, the connectivity status of the set ofVSDNs generated by Bw-Risk-Ratio algorithm is around 11% higher than existing algorithms.
Additionally, the algorithms based on RKSP get a higher decrement in its connectivity when the failure percentageincreases when compared to MSPS algorithm. This fact is illustrated in cases “All-25%”, “E-100%” and “H-100%”,where the algorithms based on RKSP, besides the higher connectivity in the previous cases, get a similar connectivityto MSPS algorithm.
17

4.2.2. Path definition evaluationAfter, the evaluation of the algorithms for resilience in the VSDN allocation process, we focused on evaluating
the path definition approach of the Bw-Risk-Ratio. Therefore, we performed another set of experiments applying theresilience strategy proposed in Algorithm 3 using as path definition approach one of the following algorithms: (i)Algorithm 4, representing the proposed Bw-Risk-Ratio; (ii) shortest path with the Desired Bw (D-Bw); and (iii) the(MAB) algorithm [41]. The goal of this experiment is the comparison of the performance achieved by the proposedpath definition for Bw-Risk-Ratio against the existing algorithms, since the resilience strategy could be used applyinga different path definition algorithm.
Figure 8 shows the cumulative number of solved requests. It can be seen that the behavior of algorithms is similaruntil the 20th request, due to remaining network resource deriving the previous requests solved. Thus, regarding suc-cessful allocations, the proposed Bw-Risk-Ratio got better results, outperforming the existing algorithms and solving14% more requests.
0
10
20
30
40
50
60
70
80
0 10 20 30 40 50 60 70 80 90 100
Su
cce
ssfu
l A
lloca
tio
ns
Number of Requests
Allocation Status
D-BwMAB
Bw-Risk-Ratio
Figure 8: Successful allocations.
Figures 9(a) and 9(b) show the data related to resource usage in the network infrastructure. According to Figure9(a), the D-Bw is the algorithm that consumed less bandwidth, where the Bw-Risk-Ratio algorithm reached closeresults. This happens due to the nature of the D-Bw to compute the shortest paths (lower number of hops) that havethe desired Bw.
300
400
500
600
700
800
900
1000
0 10 20 30 40 50 60 70 80 90 100
Ba
nd
wid
th (
Mb
ps)
Number of Requests
Available Bandwidth
D-BwMAB
Bw-Risk-Ratio
(a) Available bandwidth after allocation.
0
1
2
3
4
5
6
7
8
9
0 10 20 30 40 50 60 70 80 90 100
Nu
mb
er
of
Sa
tura
ted
Lin
ks
Number of Requests
Saturated Links
D-BwMAB
Bw-Risk-Ratio
(b) Number of saturated links.
Figure 9: Resource usage results.
18

To analyze another issue regarding resource usage of the ISP, Figure 9(b) presents the number of saturated links.Bw-Risk-Ratio and D-Bw algorithms have lower number of saturated links. On the other hand, MAB resulted inmore than twice the number of saturated links, suggesting that for VSDN allocation the criterion of highest availablebandwidth regardless of the number of used hops/links is not beneficial.
In general, the experiments suggest that the proposed algorithm can meet the topology definition according to thereliability specifications set by the client, when feasible. The Bw-Risk-Ratio algorithm solved more requests, getting aperformance at least 10% higher than the existing algorithms. In the same way, Bw-Risk-Ratio uses less Bw and linkswith higher available Bw to solve the requests, resulting in lower number of saturated links in the network. Moreover,the Bw-Risk-Ratio was able to maintain more networks operational in failure scenarios.
5. Conclusion
The deployment of VNs together with SDNs (called VSDNs) brings more flexibility and manageability to thenetwork infrastructure improving the resource usage and service delivery to clients. However, the task to allocatea VSDN is still an open issue. Therefore, this article presents an algorithm for allocation of VSDNs to provideresilience, while considering the Bw available in ISPs and reliability of VSDNs.
The Bw-Risk-Ratio algorithm enhances the resilience achieved by ISPs through deployment of the best virtualtopology for both client and ISP. In general, the proposed algorithm deploys a resilience strategy based on alternativepath allocation and the characteristics of the network infrastructure (available resources and risk model).
The proposed Bw-Risk-Ratio algorithm outperforms the existing algorithms, serving more customers (around10%), enabling the maximization of provider’s profit. In the same way, the proposed algorithm enables ISP to guar-antee the service level defined in the SLA when facing failure issues, maintaining higher connectivity (around 9%)when compared to existing algorithms. As future work, we intend to extend the algorithm to consider an energy-awareallocation.
Acknowledgment
The authors would like to thank Sao Paulo Research Foundation (FAPESP - grant 2012/04945-7), CAPES (grant12342/13-0), PROPESP/UFPA, RNP and CNPq for the financial support.
References
[1] H. Carvalho, N. Fernandes, O. Duarte, G. Pujolle, SLAPv: A service level agreement enforcer for virtual networks, in: International Confer-ence on Computing, Networking and Communications (ICNC), 2012, pp. 708–712.
[2] J. P. Sterbenz, D. Hutchison, E. K. Cetinkaya, A. Jabbar, J. P. Rohrer, M. Scholler, P. Smith, Resilience and survivability in communicationnetworks: Strategies, principles, and survey of disciplines, Computer Networks 54 (8) (2010) 1245–1265.
[3] K. Nguyen, Q. T. Minh, S. Yamada, A software-defined networking approach for disaster-resilient WANs, in: 22nd International Conferenceon Computer Communications and Networks (ICCCN), 2013, pp. 1–5.
[4] P. Skoldstrom, K. Yedavalli, Network virtualization and resource allocation in OpenFlow-based wide area networks, in: Proceedings of IEEEInternational Conference on Communications (ICC), 2012.
[5] A. Al-Shabibi, M. De Leenheer, M. Gerola, A. Koshibe, G. Parulkar, E. Salvadori, B. Snow, Openvirtex: Make your virtual sdns pro-grammable, in: Proceedings of the Third Workshop on Hot Topics in Software Defined Networking, HotSDN ’14, ACM, New York, NY,USA, 2014, pp. 25–30.
[6] R. L. Gomes, L. F. Bittencourt, E. R. Madeira, E. Cerqueira, M. Gerla, An architecture for dynamic resource adjustment in VSDNs based ontraffic demand, in: IEEE Global Communications Conference (GLOBECOM 2014), 2014, pp. 2005–2010.
[7] P. Pisa, N. Fernandes, H. Carvalho, M. Moreira, M. Campista, L. Costa, O. Duarte, Openflow and xen-based virtual network migration, in:A. Pont, G. Pujolle, S. Raghavan (Eds.), Communications: Wireless in Developing Countries and Networks of the Future, Vol. 327 of IFIPAdvances in Information and Communication Technology, Springer Berlin Heidelberg, 2010, pp. 170–181.
[8] Y. Dong, X. Yang, J. Li, G. Liao, K. Tian, H. Guan, High performance network virtualization with sr-iov, J. Parallel Distrib. Comput. 72 (11)(2012) 1471–1480.
[9] P. Ruth, X. Jiang, D. Xu, S. Goasguen, Virtual distributed environments in a shared infrastructure, Computer 38 (5) (2005) 63–69.[10] C. Huang, M. Li, A. Srinivasan, A scalable path protection mechanism for guaranteed network reliability under multiple failures, Reliability,
IEEE Transactions on 56 (2) (2007) 254–267.[11] H.-W. Lee, E. Modiano, K. Lee, Diverse routing in networks with probabilistic failures, Networking, IEEE/ACM Transactions on 18 (6)
(2010) 1895–1907.
19

[12] F. Altiparmak, B. Dengiz, A. Smith, Reliability estimation of computer communication networks: Ann models, in: Computers and Commu-nication, 2003. (ISCC 2003). Proceedings. Eighth IEEE International Symposium on, 2003, pp. 1353–1358 vol.2.
[13] S. Zarezadeh, M. Asadi, Network reliability modeling under stochastic process of component failures, IEEE Transactions on Reliability 62 (4)(2013) 917–929.
[14] D. Bulka, J. Bechta Dugan, Network s-t reliability bounds using a 2-dimensional reliability polynomial, IEEE Transactions on Reliability43 (1) (1994) 39–45.
[15] K. Le, V. Li, Modeling and analysis of systems with multimode components and dependent failures, Reliability, IEEE Transactions on 38 (1)(1989) 68–75.
[16] V. Li, J. Silvester, Performance Analysis of Networks with Unreliable Components, IEEE Transactions on Communications 32 (10) (1984)1105 – 1110.
[17] R. Gomes, L. Bittencourt, E. Madeira, A virtual network allocation algorithm for reliability negotiation, in: Computer Communications andNetworks (ICCCN), 2013 22nd International Conference on, 2013, pp. 1–7.
[18] D. Hock, S. Gebert, M. Hartmann, T. Zinner, P. Tran-Gia, Poco-framework for pareto-optimal resilient controller placement in sdn-based corenetworks, in: Network Operations and Management Symposium (NOMS), 2014 IEEE, 2014, pp. 1–2.
[19] A. Xie, X. Wang, W. Wang, S. Lu, Designing a disaster-resilient network with software defined networking, in: IEEE 22nd InternationalSymposium of Quality of Service (IWQoS), 2014, pp. 135–140.
[20] M. Reitblatt, M. Canini, A. Guha, N. Foster, Fattire: Declarative fault tolerance for software-defined networks, in: Proceedings of the SecondACM SIGCOMM Workshop on Hot Topics in Software Defined Networking, HotSDN ’13, ACM, New York, NY, USA, 2013, pp. 109–114.
[21] P. Fonseca, R. Bennesby, E. Mota, A. Passito, Resilience of sdns based on active and passive replication mechanisms, in: IEEE GlobalCommunications Conference (GLOBECOM), 2013, pp. 2188–2193.
[22] M. Rahman, R. Boutaba, Svne: Survivable virtual network embedding algorithms for network virtualization, Network and Service Manage-ment, IEEE Transactions on 10 (2) (2013) 105–118.
[23] G. Sun, H. Di, H. Yu, L. Li, V. Anand, The Framework and Algorithms for the Survivable Mapping of Virtual Network onto a SubstrateNetwork, IETE Technical Review 28 (5) (2011) 381–391.
[24] M. Parandehgheibi, H.-W. Lee, E. Modiano, Survivable path sets: A new approach to survivability in multilayer networks, Journal ofLightwave Technology 32 (24) (2014) 4741–4752.
[25] D. Eppstein, Finding the k shortest paths, in: 35th Annual Symposium on Foundations of Computer Science, IEEE, 1994, pp. 154–165.[26] L. Guo, L. Li, A novel survivable routing algorithm with partial shared-risk link groups (srlg)-disjoint protection based on differentiated
reliability constraints in wdm optical mesh networks, Journal of Lightwave Technology 25 (6) (2007) 1410–1415.[27] M. Zotkiewicz, W. Ben-Ameur, M. Pioro, Finding failure-disjoint paths for path diversity protection in communication networks, IEEE
Communications Letters 14 (8) (2010) 776–778.[28] G. Lin, S. Soh, K.-W. Chin, M. Lazarescu, Energy aware two disjoint paths routing, Journal of Network and Computer Applications 43 (2014)
27 – 41.[29] E. Oki, N. Matsuura, K. Shiomoto, N. Yamanaka, A disjoint path selection scheme with shared risk link groups in gmpls networks, IEEE
Communications Letters 6 (9) (2002) 406–408.[30] S. Giansante, Recent advances in modelling systemic risk using network analysis-ecb, The CDS Network (2010) p. 11.[31] K. Dahbur, B. Mohammad, A. B. Tarakji, A survey of risks, threats and vulnerabilities in cloud computing, in: Proceedings of the 2011
International Conference on Intelligent Semantic Web-Services and Applications, ISWSA ’11, ACM, New York, NY, USA, 2011, pp. 12:1–12:6.
[32] M. Hamdi, N. Boudriga, Computer and network security risk management: theory, challenges, and countermeasures, International Journal ofCommunication Systems 18 (8) (2005) 763–793.
[33] M. Cheminod, L. Durante, A. Valenzano, Review of security issues in industrial networks, Industrial Informatics, IEEE Transactions on 9 (1)(2013) 277–293.
[34] Y. Jing, G. Ahn, Z. Zhao, H. Hu, Towards automated risk assessment and mitigation of mobile applications, IEEE Transactions on Dependableand Secure Computing 12 (5) (2015) 571–584.
[35] R. Miura-Ko, N. Bambos, Dynamic risk mitigation in computing infrastructures, in: Third International Symposium on Information Assur-ance and Security (IAS), 2007, pp. 325–328.
[36] P. Cholda, P. Guzik, K. Rusek, Risk mitigation in resilient networks, in: 6th International Workshop on Reliable Networks Design andModeling (RNDM), 2014, pp. 23–30.
[37] Z. Zhao, H. Hu, G.-J. Ahn, R. Wu, Risk-aware mitigation for manet routing attacks, IEEE Transactions on Dependable and Secure Computing9 (2) (2012) 250–260.
[38] S. Sesay, Z. Yang, J. He, J. Xiang, X. Du, Ensuring efficiency and robustness in manet, in: 2nd International Conference on Mobile Technol-ogy, Applications and Systems, 2005, pp. 6 pp.–6.
[39] G. O’Reilly, D. Houck, E. Kim, T. Morawski, D. Picklesimer, H. Uzunalioglu, Infrastructure simulations of disaster scenarios, in: 11thInternational Telecommunications Network Strategy and Planning Symposium, 2004, pp. 205–210.
[40] R. Munich, Topics geo: natural catastrophes 2012: analyse, assessments, positions, Munchener Ruckversichereungs-Gesellschaft, 2013.[41] D. Medhi, K. Ramasamy, Network Routing: Algorithms, Protocols, and Architectures, Morgan Kaufmann Publishers Inc., 2007.[42] T. M. Chen, Network Traffic Modeling, John Wiley & Sons, Inc., 2007.
20