Embed Size (px)
Citation preview
A Recoil Resilient
Luminal Support Title
by
Arash Mehdizadeh
B. Sc. (Computer Systems Engineering, Honours)
Amirkabir University of Technology (Tehran Polytechnic), Iran, 2005
M. Sc. (Computer Architecture Engineering, First Class)
Amirkabir University of Technology (Tehran Polytechnic), Iran, 2008
Thesis submitted for the degree of
Doctor of Philosophy
in
School of Electrical & Electronic Engineering
Faculty of Engineering, Computer & Mathematical Sciences
The University of Adelaide, Australia
April 2014

Supervisors:
Dr Said Al-Sarawi, School of Electrical & Electronic Engineering
Prof. Derek Abbott, School of Electrical & Electronic Engineering
Centre for
Biomedical Engineering
(CBME)
© 2014
Arash Mehdizadeh
All Rights Reserved
Page i
Contents
Contents
Contents ................................................................................................................................................ i
Abstract ................................................................................................................................................ v
Statement of Originality .................................................................................................................. ix
Acknowledgments ............................................................................................................................ xi
Conventions....................................................................................................................................... xv
Publications & Awards .................................................................................................................. xvii
List of Symbols ................................................................................................................................ xix
Abbreviations .................................................................................................................................. xxv
List of Figures ................................................................................................................................ xxvii
List of Tables .................................................................................................................................. xxxi
Chapter 1. Introduction and Motivation ......................................................................................... 1
1.1 Abstract .................................................................................................................................... 2
1.2 Atherosclerosis and Luminal Occlusion ............................................................................. 3
1.3 Non-surgical Treatments ...................................................................................................... 5
1.4 Surgical Treatments ............................................................................................................... 6
1.4.1 Coronary Artery Bypass Grafting ............................................................................. 6
1.4.2 Endarterectomy ........................................................................................................... 7
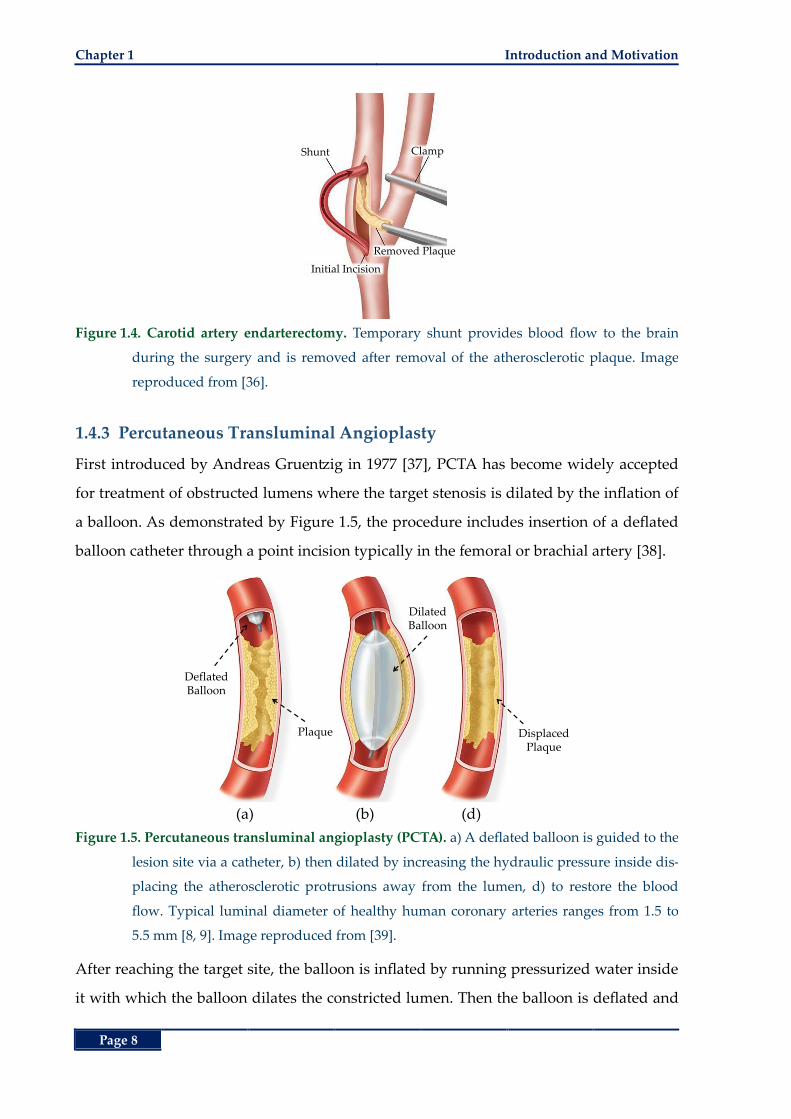
1.4.3 Percutaneous Transluminal Angioplasty ................................................................ 8
1.4.4 Stenting ......................................................................................................................... 9
1.4.5 Atherectomy ............................................................................................................... 11
1.5 Stents Current Status and the Future ................................................................................ 13
1.5.1 Materials and Expansion Mechanism .................................................................... 15
1.5.2 Material Form ............................................................................................................ 19
Contents
Page ii
1.5.3 Fabrication Method ................................................................................................... 20
1.5.4 Design and Geometrical Features ........................................................................... 23
I. Coil Stents ............................................................................................................... 23
II. Spiral Stents ........................................................................................................... 24
III. Woven Stents ....................................................................................................... 25
IV. Modular (sequential) Stents............................................................................... 25
1.5.5 Stent Coatings and Surface Treatments ................................................................. 29
1.5.6 Stenting Limitations and Mitigation Efforts .......................................................... 31
I. Stent Recoil ............................................................................................................. 31
I. Stent Thrombosis ................................................................................................... 32
II. Restenosis .............................................................................................................. 33
1.6 Chapter Summary ................................................................................................................ 35
1.7 Thesis Overview ................................................................................................................... 37
1.7.1 Thesis Structure and Original Contributions ........................................................ 37
Chapter 2. A Recoil Resilient Luminal Support ......................................................................... 41
2.1 Abstract .................................................................................................................................. 42
2.2 Introduction........................................................................................................................... 43
2.3 Design and Modelling ......................................................................................................... 47
2.3.1 Free Expansion Analysis .......................................................................................... 47
I. Materials and Methods ......................................................................................... 47
II. Results .................................................................................................................... 51
2.3.2 Radial Strength .......................................................................................................... 52
2.3.3 Axial Strength and Feasible Improvements .......................................................... 54
2.4 Fabrication ............................................................................................................................. 60
2.4.1 Machining ................................................................................................................... 60
2.4.2 Shaping ....................................................................................................................... 61
I. Surface Profile ........................................................................................................ 62
II. RRR Patency .......................................................................................................... 63
Contents
Page iii
2.4.3 Experimental Results ................................................................................................ 64
2.5 Chapter Summary ................................................................................................................ 69
Chapter 3. Hemodynamic Risk Assessment by Computational Fluid Dynamics ................ 71
3.1 Abstract .................................................................................................................................. 72
3.2 Introduction .......................................................................................................................... 73
3.3 Materials and Methods ........................................................................................................ 75
3.3.1 Models Development ............................................................................................... 78
3.3.2 Discretisation ............................................................................................................. 79
3.3.3 Dimensional Analysis ............................................................................................... 81
3.4 Results and Discussion ........................................................................................................ 83
3.4.1 Part 1 – Unbranched Fluid Domain ........................................................................ 83
I. LWSS in Unbranched Fluid Domains .................................................................. 83
II. Drag Force in the Unbranched Domains ........................................................... 92
3.4.2 Part 2 – Branched Fluid Domain ............................................................................. 94
I. LWSS in Branched Fluid Domains ....................................................................... 94
II. Drag Force and Output Flow Rate ..................................................................... 96
3.4.3 Part 3 – Dimensional Analysis .............................................................................. 103
I. Dimensional Assumptions and LWSS ............................................................... 104
II. Dimensional Assumptions, Drag Force and Flow Supply ............................ 106
III. Dimensional Assumptions, Final Notes ......................................................... 112
3.5 Chapter Summary .............................................................................................................. 113
Chapter 4. Thermal Actuation of the Recoil Resilient Ring .................................................... 117
4.1 Abstract ................................................................................................................................ 118
4.2 Introduction ........................................................................................................................ 118
4.3 Materials and Methods ...................................................................................................... 121
4.4 Theoretical Analysis ........................................................................................................... 124
4.4.1 Results ...................................................................................................................... 134
4.5 Numerical Analysis: Uniform Heat Transfer ................................................................. 136
Contents
Page iv
4.5.1 Materials and Methods ........................................................................................... 137
4.5.2 Results ....................................................................................................................... 139
4.6 Numerical Analysis: Conjugate Heat Transfer .............................................................. 143
4.6.1 Materials and Methods ........................................................................................... 143
4.6.2 Results ....................................................................................................................... 147
4.7 Experimental Results ......................................................................................................... 154
4.7.1 Heat-induced Actuation in vitro ............................................................................ 157
4.7.2 Heat-induced Actuation in Free Expansion ........................................................ 158
4.7.3 Heat-induced Actuation Force .............................................................................. 160
4.8 Electro-Thermal Actuation ................................................................................................ 164
4.8.1 Theoretical Framework .......................................................................................... 165
4.8.2 Numerical Analysis ................................................................................................. 169
I. Materials and Methods ....................................................................................... 169
II. Results .................................................................................................................. 172
4.9 Chapter Summary .............................................................................................................. 176
Chapter 5. Conclusion and Future Directions ........................................................................... 179
5.1 Introduction......................................................................................................................... 180
5.2 Contributions and Conclusions ........................................................................................ 181
5.3 Recommendations for Future Work ................................................................................ 187
5.4 Closing Comments ............................................................................................................. 188
Bibliography .................................................................................................................................... 189
Index .................................................................................................................................................. 209
Biography ......................................................................................................................................... 215
Scientific Genealogy ...................................................................................................................... 216
Page v
Abstract
Abstract
Cardiovascular disease (CVD) refers to a class of diseases affecting normal function of
cardiovascular system and its momentous role to carry oxygenated blood to the entire
body. Taking lives of more than 17 million people in 2008, CVD has yet remained as the
primary cause of deaths around the world. Statistics from World Health Organisation in
2002 associated CVD with 10% of the disability-adjusted life years lost in low/middle-
income countries and 18% in high-income countries.
Atherosclerosis, as one of the primary causes of CVD, refers to the thickening of vascular
walls due to deposition of fatty materials wherein it can lead to impeded or completely
occluded blood flow. Obstruction of coronary arteries, referred to as coronary heart dis-
ease (CHD), is estimated to become the single leading health problem by 2020. Occur-
rence and further development of CHD is associated with a number of biological and
environmental factors such as an individual’s genetic predisposition, lifestyle, climate
conditions, exercise habits and emotions to name a few.
Treatment and management of vascular constrictions consists of a combination of non-
surgical and surgical methods. The former includes approaches such as healthy lifestyle
changes and pharmacological interventions while the later includes bypass grafting, bal-
loon angioplasty with or without deployment of a stent and atherectomy. Stents are me-
chanical devices that provide a chronic support against internal walls of occluded vessels
to restore their normal luminal patency. In the past decade, stenting has prevailed as the
conventional treatment option in management of CVD, exceeding current number of by-
pass grafting procedures, owing this success to its proven efficacy in short and long-term
treatment of occluded vessels. Common stent structures are simply made of a metal
mesh, e.g. stainless steel, and deployed in a blood vessel such as an artery during a per-
cutaneous coronary intervention procedure, also known as angioplasty. Several attempts
to meet the often self-competing objectives of stents such as high radial strength, low
elastic recoil, axial flexibility, trackability in tortuous paths, biocompatibility and radio-
Abstract
Page vi
pacity gave birth to a multitude of different stent design and improvement iterations to
date. The acute luminal gain after stenting is often compromised by the two most com-
mon post intervention complications, namely in-stent thrombosis (formation of blood
clot) and restenosis (re-narrowing of the lesion). Induced trauma during stent deploy-
ment is proven to play a key role in the occurrence of these complications. Elastic recoil
of stents after deployment due to the intrinsic material properties and the compressive
forces from a vessel accounts for both acute and chronic luminal loss after stent deploy-
ment. Mitigation measures such as over-expansion in balloon-expandable (BE) stents and
use of self-expandable (SE) stents so far have proven to aggravate vascular trauma lead-
ing to thrombosis and restenosis. Pharmacological approaches such as systemic admin-
istration of blood-thinners or localized drug release in drug-eluting (DE) stents aim to
control these complications by inhibition of an accentuated inflammatory response from
the body. Despite the promising results in reduction of restenosis after use of DE stents,
increased rate of late thrombosis raised concerns about efficacy of these stents in compar-
ison with bare-metal (BM) stents. Moreover, it is important to note that in these ap-
proaches the mechanical aspect of the problem still stands. As a result, to meet the often-
competing aforementioned imperatives of stents, a new design paradigm is called for.
To address the issue of recoil and extend capability of current stents to controlled and
incremental expansion steps with alternative expansion mechanisms, in this thesis a
novel recoil resilient stent is proposed and developed. The proposed luminal support
called a recoil resilient ring (RRR) is an open ring with overlapping ends and asymmet-
rical sawtooth structures from the two ends that are intermeshed. Utilized as a
standalone support or integrated with other stent structures, upon expansion of the RRR,
the teeth from opposite ends can slide on top of each other, yet interlock step-by-step in
the opposite direction so to keep the final expanded state against compressive forces that
normally cause recoil.
Design, fabrication and compatibility of the proposed stent with current state-of-the-art
stent deployment procedures and its superior radial strength in comparison with com-
mercial stents are extensively studied in this thesis through finite element modelling
(FEM) and experimental studies. The RRR is fabricated from Nitinol sheets with trans-
formation temperatures well above typical body temperature ensuring martensite mode
Abstract
Page vii
of operation of the device after deployment. Fabrication is carried out by linear pattern-
ing of Nitinol sheets of 200-µm thickness utilizing µEDM technology. Superior radial
strength of the RRR in comparison with a commercial stent composed of the stiffer mate-
rial, stainless steel, is demonstrated via experimental and numerical studies.
Hemodynamic risk assessment of the proposed design as a standalone and integrated
support compared with a typical commercial stent is then carried out by transient com-
putational fluid dynamics (CFD). Subject to a realistic pulsatile blood flow, spatial and
temporal restenosis risk indicators of three luminal supports are extensively studied uti-
lizing CFD. These luminal supports include a standalone RRR, a nominal BE stent and
an RRR-integrated stent. Risk factors including extension of areas subject to low wall
shear stress as the primary risk factor of restenosis after deployment, tendency of sup-
ports to migrate in response to fluid drag forces as well as flow supply changes to side
branches are extensively investigated. Furthermore, sensitivity of the results to the di-
mensional assumptions of the deployment domain, branching vessels and patency of the
supports is studied. Our results indicate superior hemodynamic performance of the
standalone RRR compared with the others. In addition, close correspondence of the per-
formance indicators of RRR-integrated stent and the standalone stent demonstrates min-
imal hemodynamic footprint of the proposed RRR highlighting its merit as a viable
luminal support given its superior radial strength.
Attractive attributes such as shape memory effect of Nitinol, the thermally trained ex-
panded shape of the RRR, its unique incremental slide and lock expansion mechanism
and its higher transformation temperature compared to the body temperature, bring new
potential for alternative controlled and incremental actuation of the RRR. These alterna-
tive expansion methods, by application of direct or electrically-induced heat are further
explored through extensive analytical, multi-field numerical and experimental studies.
The knowledge and contributions made in the current work, in addition to the design,
development, experimental and multi-field numerical results provide a general engineer-
ing framework applicable to other biomedical luminal supports in the future.

Abstract
Page viii
This page is left blank intentionally
Page ix
Statement of Originality
Statement of Originality
This work contains no material that has been accepted for the award of any other degree
or diploma in any university or other tertiary institution and, to the best of my know-
ledge and belief, contains no material previously published written by another person,
except where due reference has been made in the text.
I give consent to this copy of my thesis, when deposited in the University Library, being
made available for loan and photocopying, subject to the provisions of the Copyright Act
1968.
I also give permission for the digital version of my thesis to be made available on the
web via the University’s digital research repository, the Library catalogue, the Australa-
sian Digital Thesis Program (ADTP) and also through web search engines, unless per-
mission has been granted by the University to restrict access for a period of time.
Signed Date

Statement of Originality
Page x
This page is left blank intentionally

Page xi
Acknowledgments
Acknowledgments
Now that the multidisciplinary journey of this research has come to a conclusion, I truly
understand the power of collaboration and its momentous role to realise the wildest of
dreams. I am thrilled to have this opportunity to express my gratitude and acknowl-
edgement to those around me, to only some of whom it is possible to give particular
mention here. All the people who shed light on different aspects of my personal and ac-
ademic life in this period undoubtedly deserve a big cheer.
First and foremost, I would like to express my sincerest gratitude to my principal super-
visor Dr Said Al-Sarawi from the school of Electrical and Electronic Engineering at the
University of Adelaide. His open mind and receptive attitude towards new ideas, taught
me how to let ideas fly beyond boundaries and consider nothing as being off-limits.
While continuously providing support to improve my critical thinking and make pro-
gress on the set milestones, every single meeting with Dr Al-Sarawi was an absolute joy.
His investigative and progressive approach towards other branches of science gave me
the drive to feed my curious mind and plunge into different disciplines such as biology,
optimization, micro-electronics, and mechanical engineering all of which equipped me
with the necessary skills to tackle the present work. He has been a genuine mentor to me
on this journey and I sincerely thank him for that.
My special gratitude is extended to my co-supervisor Prof. Derek Abbott from the
School of Electrical and Electronic Engineering at the University of Adelaide who laid
the foundation for the commencement of my research at this university. Prof. Abbott’s
unsurpassed friendly, supportive and informative attitude was very apparent even be-
fore I met him in person. His initiative to provide guidance in administrative and collab-
orative efforts provided me with invaluable experiences and lessons that I will carry for
the rest of my life. His meticulous and critical eye enriched the content of this thesis for
which I am grateful.

Acknowledgments
Page xii
Physical implementation of the proposed designs in this thesis could have not been real-
ized without the support and extensive help of Dr Kenichi Takahata from the depart-
ment of Electrical and Computer Engineering at the University of British Columbia
(UBC), Vancouver, Canada. His venerated expertise on stents and MEMS research and
his influential and supportive mentorship during my visit to Microsystems and Nano-
technology Group (MiNa) at UBC provided me with invaluable direction and technical
support to accomplish key components of this research. Also, I would like to
acknowledge the friendly and insightful advice that I have received from Prof. York
Hsiang from Vascular Surgery Department at the University of British Columbia, Van-
couver, Canada.
In this vein, I would like to extend my gratitude to my dear friends and colleagues in
UBC who assisted me during this period to feel at home and part of a great scientific
taskforce. I acknowledge help and support of (in a random order) Dr Mohamed Sultan
Mohamed Ali for his assistance on fabrication of microdevices and his critical and tech-
nical reviews and enlightening suggestions, Dr Reza Rashidi for his critical yet encourag-
ing support on development of stents, Mr Masoud Dahmardeh for being an incredible
friend during my visit to Canada and his indispensable help on micromachining and
physical evaluation of prototypes, and Mr Babak Assadsangabi for his insightful ideas on
structural analysis of the proposed structures in COMSOL.
I would also like to convey my gratitude to The University of Adelaide for the funding
and support provided for this research to make it a success. This project would have not
been accomplished without the financial assistance via the international postgraduate
scholarship (ASI) and travel grants including Research Abroad Scholarship, University
of Adelaide and BUPA Postgraduate Travel Grant and AUGU/RC Heddle Award that
facilitated my visit to UBC. I acknowledge the support and expertise of Mr Simon Doe
and Mr Dapankar Chugh at Ian Wark Research Institute at the University of South Aus-
tralia for providing access to optical profilometer. Numerical analysis has been an inte-
gral part of this thesis and I am pleased to thank the helpful support of Leap Australia,
Australia and CMC Microsystems, Canada support teams for their guidance on finite el-
ement modelling packages ANSYS and COMSOL.
Acknowledgments
Page xiii
Constant support and help of the academic and professional staff at the School of Electri-
cal and Electronic Engineering at the University of Adelaide, undeniably, deserves a spe-
cial thanks. Especially, I would like to mention Mrs. Ivana Rebellato, Mrs. Rose-Marie
Descalzi, Mr Stephen P. Guest and Mr Danny Di Giacomo form the administration team
in addition to Mr David Bowler, Mr Mark Innes, Mr Greg Pullman and Mr Ryan King
from IT and technical support for their unlimited support and patience with the multi-
tude of requests that I had in this period. I also wish to express my thanks to Mr Ian Lin-
ke for his insightful technical suggestions and assistance for macro-fabrication of the first
prototype. I also enjoyed being a proud member of our schools team in a number of ath-
letic events to experience their cooperative spirit yet in another level.
I am deeply grateful to all my colleagues and good friends as they enriched my life dur-
ing this journey by their motivational encouragement and helpful suggestions. Particu-
larly, I wish to thank my dearest friends, who in fact have become my family in
Australia, Mr Nikan Rostamzadeh Torghabeh and Dr Pawel Kuklik, for both their in-
sightful directions into different theoretical aspects of my thesis and most importantly
making life in Adelaide an unforgettable joy. I will always remember our countless hours
of discussions, often turning into arguments, on subjects such as electromagnetism, fluid
mechanics and even the cosmos that, albeit the following headaches and disagreements,
challenged us constantly. My gratitude is extended especially to Nikan for his invaluable
help and friendly dedication during our extensive discussions on fluid mechanics and
computational fluid dynamics (CFD) that were indispensable to the accomplishment of
this project.
Among my fellow postgraduate students, I would like to thank Dr Muammar Kabir for
his kind help, valuable friendship and encouraging conversations that we had together,
Dr Don W. Dissanayake for his expertise on biomedical implants and our fruitful discus-
sions on pilot studies and Mr Shaoming Zhu, Mr Henry Ho and Dr Gretel M. Png for
providing such a friendly and pleasant environment to work in.

Acknowledgments
Page xiv
Above all, I would like to convey my endless appreciation to my family for their uncon-
ditional love, perpetual support and patience throughout my life. A special expression of
gratitude goes to my dearest parents Shahnaz and Majid for the sacrifices they made in
their lives to empower me become who I am today.
In the end I dedicate this thesis to my grandfathers whose vision for excellence reverber-
ated through generations and beyond.
Arash Mehdizadeh

Page xv
Conventions
Conventions
Formatting: For typesetting and image production of this thesis, Microsoft (MS) Office
suite 2010 is used. Plots and images were generated using Matlab 10.0 (Mathworks Inc.)
and MS Excel 2010.
Spelling: Australian English spelling is adopted, as defined by the Macquarie English
Dictionary (Delbridge 2001).
Referencing: IEEE style is used for referencing and citations in this thesis managed by
Endnote X6 (Thomson Reuters).

Conventions
Page xvi
This page is left blank intentionally
Page xvii
Publications & Awards
Publications & Awards
Journal Articles
A. Mehdizadeh, M. S. M. Ali, K. Takahata, S. Al-Sarawi, and D. Abbott, "A recoil re-
silient lumen support, design, fabrication and mechanical evaluation," Journal of Mi-
cromechanics and Microengineering, vol. 23, art. no. 065001, 2013.
M. K. Kopaei, A. Mehdizadeh, D. C. Ranasinghe, and S. Al-Sarawi, "A novel hybrid
approach for wireless powering of biomedical implants," IEEE Sensors Journal, 2013
(Submitted, Under Review).
A. Mirsepahi, A. Mehdizadeh, L. Chen, and B. O'Neill, "A comparative approach be-
tween intelligent techniques and conventional methods for inverse heat transfer
modelling of an irradiative dryer," Journal of International Communications in Heat and
Mass Transfer, 2013 (Submitted).
Conferences
M. K. Kopaei, A. Mehdizadeh, D. C. Ranasinghe, and S. Al-Sarawi, "A novel hybrid
approach for wireless powering of biomedical implants," in 2013 IEEE Eighth Interna-
tional Conference on Intelligent Sensors, Sensor Networks and Information Processing, ,
2013, pp. 455-460.
A. Mehdizadeh, S. Al-Sarawi, K. Takahata, and D. Abbott, "A novel stent for recoil
resilience," presented at the Australian Biomedical Engineering Conference (ABEC), Bris-
bane, Queensland, 2012.
A. Mehdizadeh, A. K. Horestani, S. F. Al-Sarawi, and D. Abbott, "An efficient 60 GHz
resonator using Harmony Search," in 2011 IEEE Conference on Recent Advances in Intel-
ligent Computational Systems (RAICS), 2011, pp. 369-372.
A. K. Horestani, A. Mehdizadeh, S. Al-Sarawi, C. Fumeaux, and D. Abbott, "Quality
factor optimization process of a tapered slow-wave coplanar strips resonator in
CMOS technology," in Microwave Conference Proceedings (APMC), 2011 Asia-Pacific,
2011, pp. 45-48.

Publications & Awards
Page xviii
A. Mehdizadeh, A. Miremadi, S. Al-Sarawi, M. Arjomandi, S. Mehdizadeh, B. Dally,
and D. Abbott, "Optimal design of an offset strip fin heat sink using harmony search,"
in 38th Chemeca 2010: Engineering at the Edge, Hilton Adelaide, South Australia, 2010,
pp. 848-858.
A. Miremadi, A. Mehdizadeh, M. Arjomandi, S. Al-Sarawi, M. Kahrom, B. Dally, and
D. Abbott, "Taguchi based performance analysis or an offset strip fin heat sink," in
38th Chemeca 2010: Engineering at the Edge, Hilton Adelaide, South Australia, 2010, pp.
1-10.
Awards
Young Biomedical Engineer Prize awarded by Engineers Australia at the 12th Austral-
ian Biomedical Engineering Conference (ABEC), Brisbane, Australia, 2012.
Research Abroad Scholarship travel grant to visit Microsystems and Nanotechnology
(MiNa) research group at the University of British Columbia (UBC), Vancouver, Can-
ada, awarded by University of Adelaide, 2011.
BUPA Postgraduate Travel Grant and AUGU/RC Heddle Award travel scholarship to
visit Microsystems and Nanotechnology (MiNa) research group at the University of
British Columbia (UBC), Vancouver, Canada, 2011.
Selected runner for the 3-Minute thesis competition, Faculty of Engineering Comput-
er Science & Mathematical Sciences, School of Electrical & Electronic Engineering,
The University of Adelaide, 2010.
Postgraduate research Scholarship (ASI) towards doctoral studies, The University of
Adelaide, Nov 2008.
Page xix
List of Symbols
List of Symbols
Notation Description
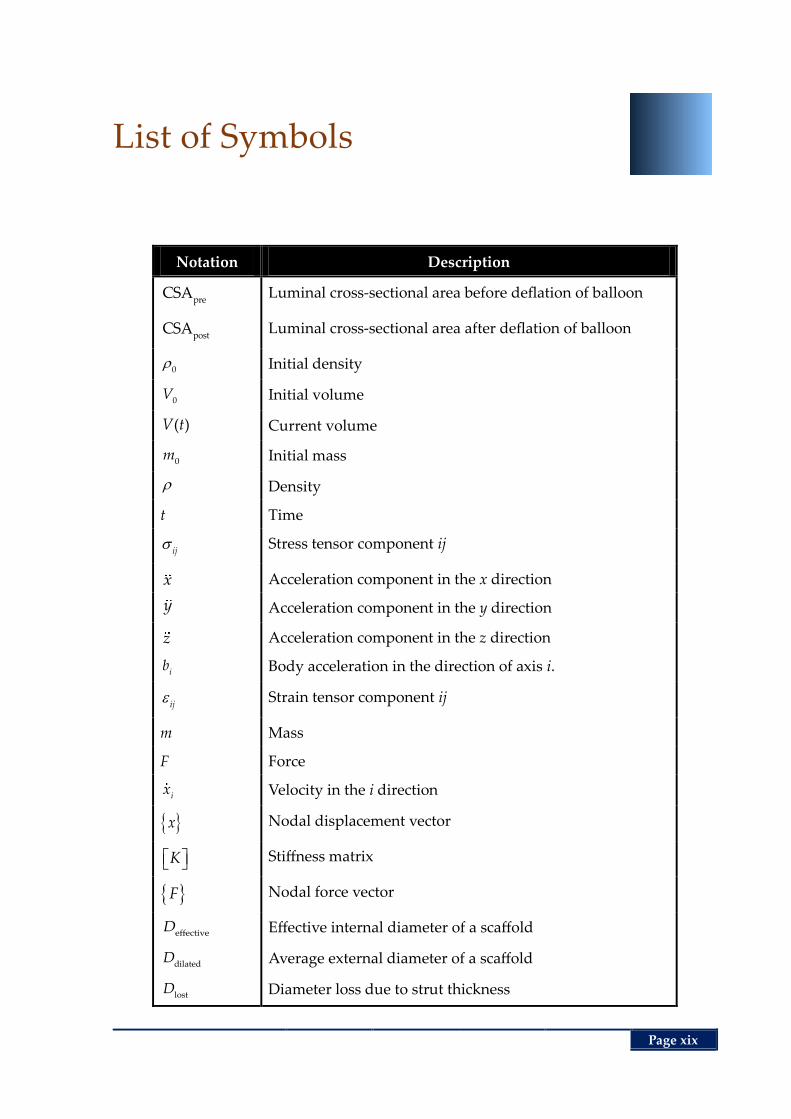
preCSA Luminal cross-sectional area before deflation of balloon
postCSA Luminal cross-sectional area after deflation of balloon
0 Initial density
0V Initial volume
( )V t Current volume
0m Initial mass
Density
t Time
ij Stress tensor component ij
x Acceleration component in the x direction
y Acceleration component in the y direction
z Acceleration component in the z direction
ib Body acceleration in the direction of axis i.
ij Strain tensor component ij
m Mass
F Force
ix Velocity in the i direction
x Nodal displacement vector
K Stiffness matrix
F Nodal force vector
effectiveD Effective internal diameter of a scaffold
dilatedD Average external diameter of a scaffold
lostD Diameter loss due to strut thickness
List of Symbols
Page xx
Notation Description
sT Strut thickness
PG Patency gain
CA Average cross-sectional area patent to fluid
TA Mean cross-sectional area of a deployed scaffold
s,avgT Average strut thickness
s,flatT Fabricated RRR thickness with no sawtooth
ht RRR sawtooth height
lt RRR sawtooth length
lO RRR overlap length
lR RRR total length
V Fluid velocity vector
p Fluid pressure
Dynamic viscosity
D Rate of deformation tensor
Viscosity at zero shear rate
0 Viscosity at infinite shear rate
Shear rate
u Velocity component in the direction of x axis
v Velocity component in the direction of y axis
w Velocity component in the direction of z axis
in,avgD Mean inner diameter of a scaffold
sW Strut width
sT Strut thickness
in_mD Main vessel diameter
in_mD Branching vessel diameter
Prox,StentL Boundary layer initial length, proximal end of stent
Dist,StentL Boundary later initial length, distal end of stent
Prox,RRR-StentL Boundary layer initial length, proximal end of RRR-stent
Dist,RRR-StentL Boundary later initial length, distal end of RRR-stent
List of Symbols
Page xxi
Notation Description
whF Scaffolding withholding force
dF Fluid drag force
i,supportf Branch i outlet flow rate, main branch scaffolded
inf Inlet flow rate
iFR Outlet/Inlet flow rate ratio
i,healthyf Branch i outlet flow rate, main branch unscaffolded
iFD Outlet/Inlet flow rate ratio deviation
RRR-StentA Area subject to low wall shear stress, RRR-stent
StentA Area subject to low wall shear stress, stent
sA SMA starting transformation temperature
fA SMA finishing transformation temperature
sty,rL Axial length of Styrofoam rings
sty,cL Axial length of Styrofoam cap
rodL Axial length of heat transfer rod
1r Radius of heat transfer rod
air,rL Axial length of air cylinder trapped, Styrofoam rings
air,dL Axial length of air cylinder at the deployment area
2r Mock vessel internal diameter
sty,rT Thickness of Styrofoam rings
mockL Axial length of mock vessel
RRRL Total length of RRR
RRRt RRR average thickness
RRRW RRR width
flowV Approach velocity
rodk Thermal conductivity of heat transfer rod
styk Thermal conductivity of Styrofoam
airk Thermal conductivity of air
Kinematic viscosity
List of Symbols
Page xxii
Notation Description
Re Reynolds number
Pr Prandtl number
Q Heat transfer rate
T Temperature
thermalR Thermal resistance
condR Conduction thermal resistance
convR Convective thermal resistance
h Convective heat transfer coefficient
radR Radiation thermal resistance
radh Radiation heat transfer coefficient
sT Surface temperature
surrT Surrounding temperature
con s1 d_in
R R Conductive thermal resistance of air and Styrofoam rings
2 cond_mock
R R Conductive thermal resistance of mock vessel
3 conv
R R Convective thermal resistance of crossflow
insk Thermal conductivity of insulation layer
Nu Nusselt Number
convq Convective heat flux rate
condq Conductive heat flux rate
flowh Effective heat transfer coefficient of crossflow
chrL Characteristic length
cylNu Nusselt number of cylinder in crossflow
1T Temperature at internal walls of mock vessel
1T Constant rod temperature
totalR Total thermal resistance
in( )Q x Heat transfer rate into the differential volume at distance x
out( )Q x Heat transfer rate out of the diff. volume at distance x
comb( )Q x Heat transfer rate out of the diff. volume in radial direction
combR Combined thermal resistance of insulation layer
List of Symbols
Page xxiii
Notation Description
cA Cross-sectional area of heat transfer rod
totalL Total length of the thermal model of heat transfer rod
addedL Added length to the thermal mode of heat transfer rod
out,tipQ Heat transfer rate from the tip of heat transfer rod
tipx Axial distance from base to tip of heat transfer rod
addedQ Heat transfer from added length of heat transfer rod
rod( )T x Temperature of rod at axial distance x from the base
total_tipR Total thermal resistance at the tip of the rod
insR Thermal resistance of the insulation at the top section of
mock-rod assembly
c,insA Cross-sectional area of Styrofoam cap
ins,topk Thermal conductivity of insulation at the top section of
mock-rod assembly
toph Heat transfer coefficient at the top of mock rod assembly
topR Thermal resistance at the top of mock-rod assembly
topL Axial length of the top section of the mock-rod assembly
mockP Periphery of the mock vessel
c,mockA Cross-sectional area of mock vessel
p Heat transfer rate per unit length
mockR Effective thermal resistance of mock vessel
[ ]K Matrix of thermal conductance
electricQ Electric power consumption
I Electric current
electric,plateR Electrical resistance of heating plate
thermalQ Thermal heat transfer rate
thermal, plateR Thermal resistance of heating plate
plateT Heating plate temperature
roomT Room temperature
List of Symbols
Page xxiv
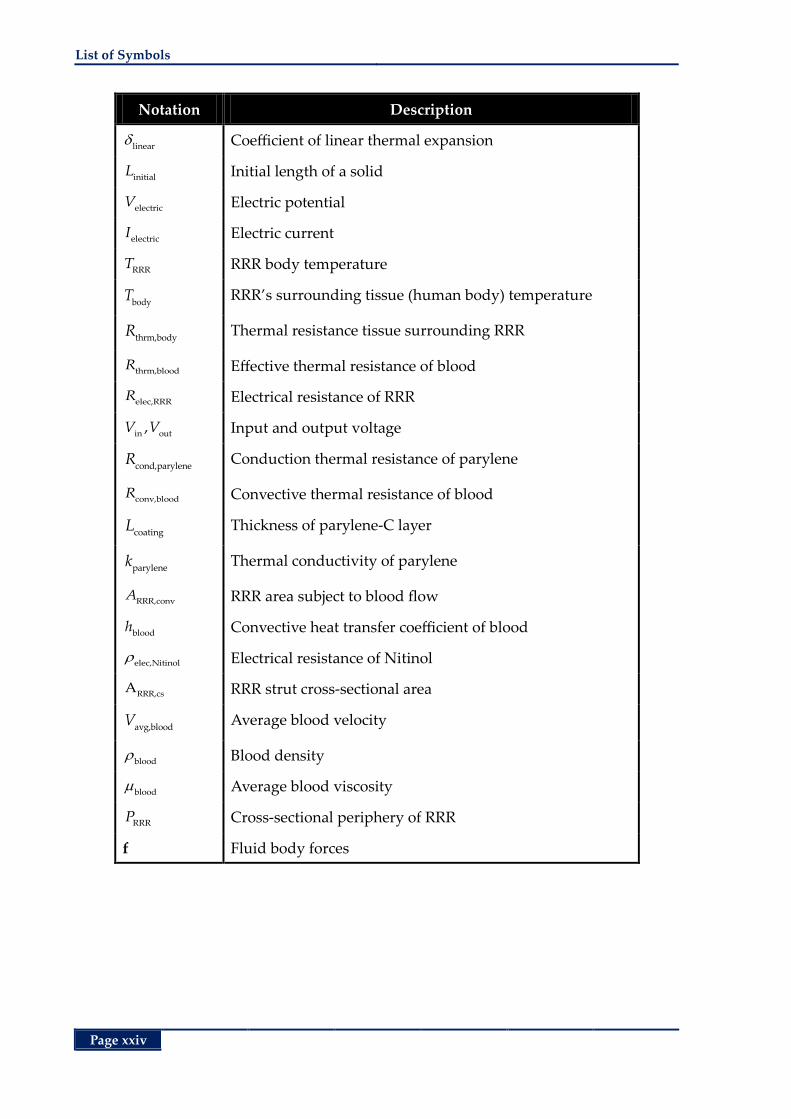
Notation Description
linear
Coefficient of linear thermal expansion
initialL Initial length of a solid
electricV Electric potential
electricI Electric current
RRRT RRR body temperature
bodyT RRR’s surrounding tissue (human body) temperature
thrm,bodyR Thermal resistance tissue surrounding RRR
thrm,bloodR Effective thermal resistance of blood
elec,RRRR Electrical resistance of RRR
in out,V V Input and output voltage
cond,paryleneR Conduction thermal resistance of parylene
conv,bloodR Convective thermal resistance of blood
coatingL Thickness of parylene-C layer
parylenek Thermal conductivity of parylene
RRR,convA RRR area subject to blood flow
bloodh Convective heat transfer coefficient of blood
elec,Nitinol
Electrical resistance of Nitinol
RRR,csA RRR strut cross-sectional area
avg,bloodV Average blood velocity
blood
Blood density
blood
Average blood viscosity
RRRP Cross-sectional periphery of RRR
f Fluid body forces
Page xxv
Abbreviations
Abbreviations
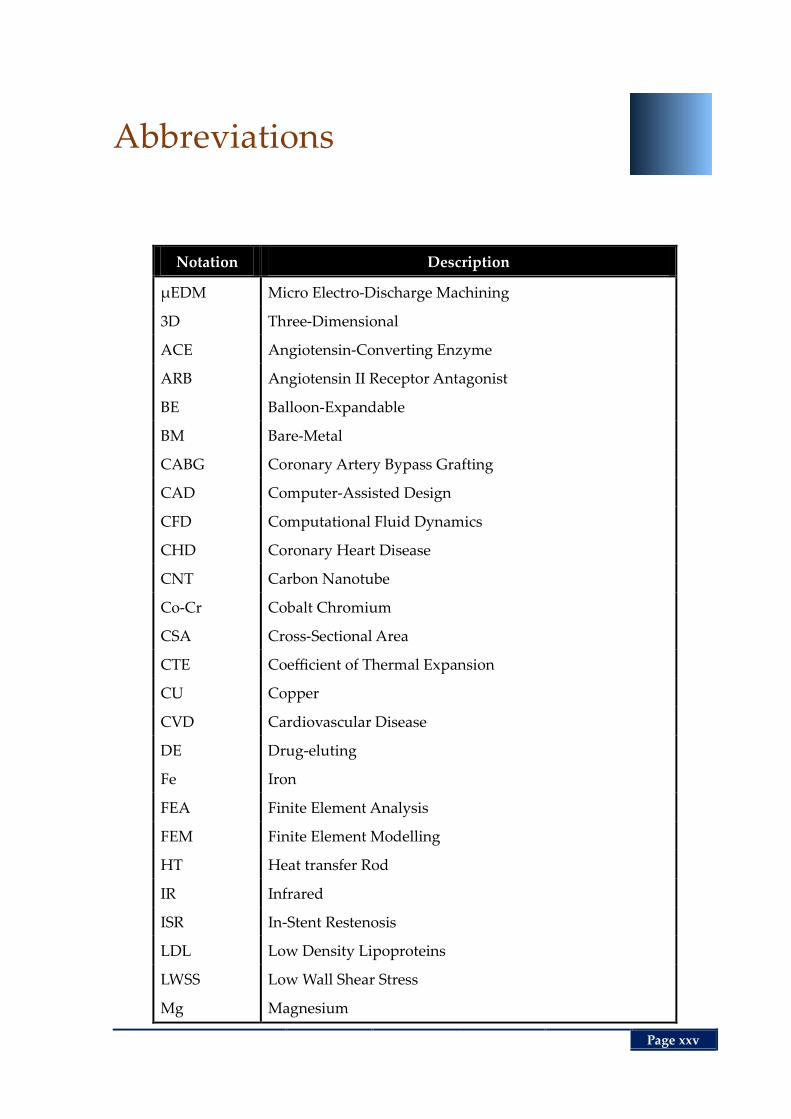
Notation Description
µEDM Micro Electro-Discharge Machining
3D Three-Dimensional
ACE Angiotensin-Converting Enzyme
ARB Angiotensin II Receptor Antagonist
BE Balloon-Expandable
BM Bare-Metal
CABG Coronary Artery Bypass Grafting
CAD Computer-Assisted Design
CFD Computational Fluid Dynamics
CHD Coronary Heart Disease
CNT Carbon Nanotube
Co-Cr Cobalt Chromium
CSA Cross-Sectional Area
CTE Coefficient of Thermal Expansion
CU Copper
CVD Cardiovascular Disease
DE Drug-eluting
Fe Iron
FEA Finite Element Analysis
FEM Finite Element Modelling
HT Heat transfer Rod
IR Infrared
ISR In-Stent Restenosis
LDL Low Density Lipoproteins
LWSS Low Wall Shear Stress
Mg Magnesium
Abbreviations
Page xxvi
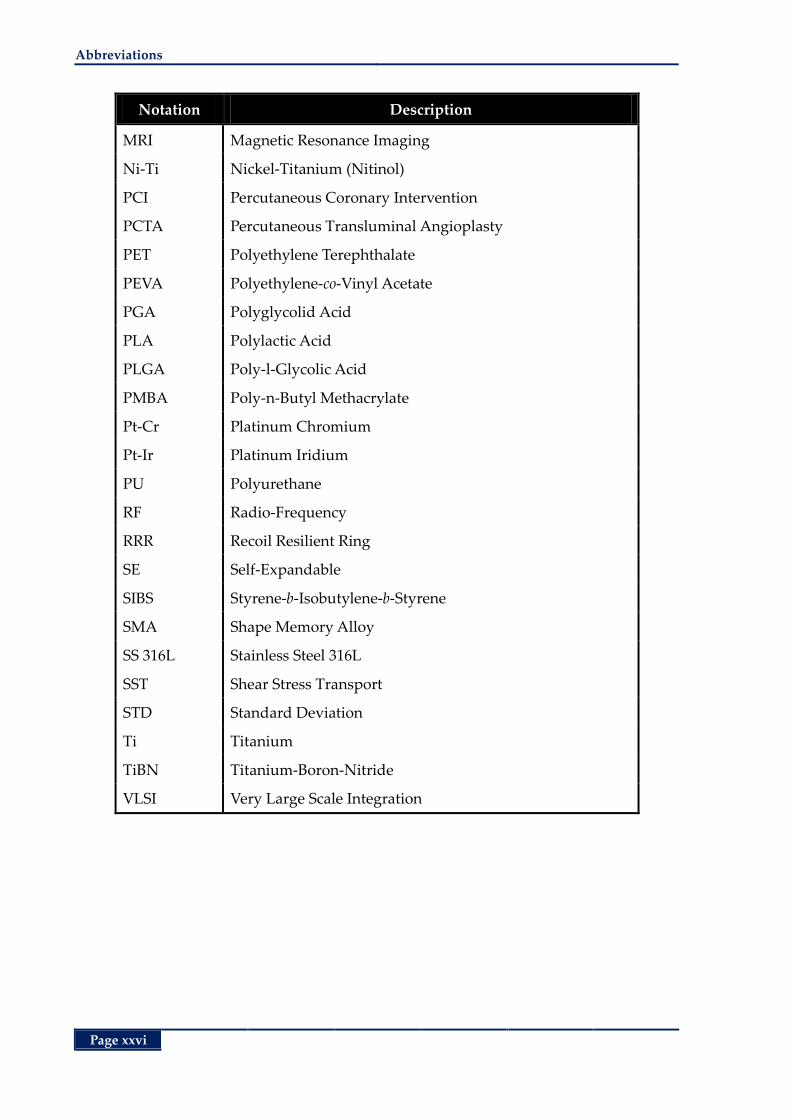
Notation Description
MRI Magnetic Resonance Imaging
Ni-Ti Nickel-Titanium (Nitinol)
PCI Percutaneous Coronary Intervention
PCTA Percutaneous Transluminal Angioplasty
PET Polyethylene Terephthalate
PEVA Polyethylene-co-Vinyl Acetate
PGA Polyglycolid Acid
PLA Polylactic Acid
PLGA Poly-l-Glycolic Acid
PMBA Poly-n-Butyl Methacrylate
Pt-Cr Platinum Chromium
Pt-Ir Platinum Iridium
PU Polyurethane
RF Radio-Frequency
RRR Recoil Resilient Ring
SE Self-Expandable
SIBS Styrene-b-Isobutylene-b-Styrene
SMA Shape Memory Alloy
SS 316L Stainless Steel 316L
SST Shear Stress Transport
STD Standard Deviation
Ti Titanium
TiBN Titanium-Boron-Nitride
VLSI Very Large Scale Integration
Page xxvii
List of Figures
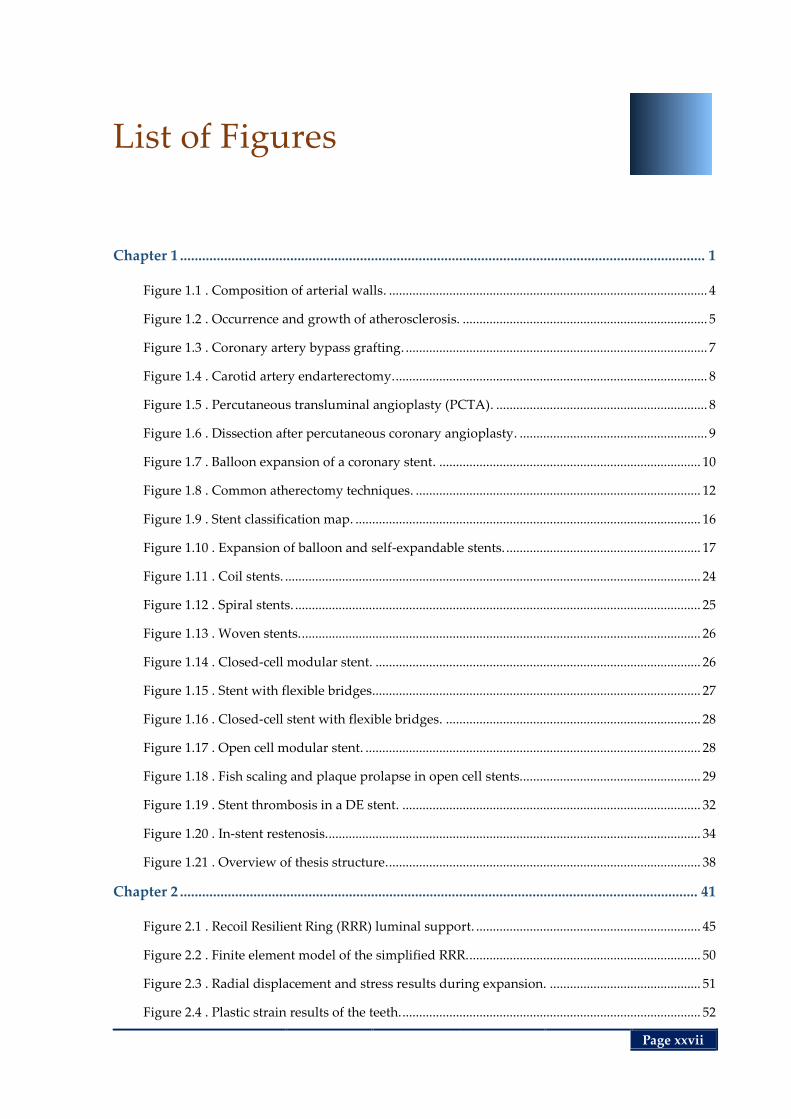
List of Figures
Chapter 1 ............................................................................................................................................... 1
Figure 1.1 . Composition of arterial walls. ............................................................................................... 4
Figure 1.2 . Occurrence and growth of atherosclerosis. ......................................................................... 5
Figure 1.3 . Coronary artery bypass grafting. .......................................................................................... 7
Figure 1.4 . Carotid artery endarterectomy. ............................................................................................. 8
Figure 1.5 . Percutaneous transluminal angioplasty (PCTA). ............................................................... 8
Figure 1.6 . Dissection after percutaneous coronary angioplasty. ........................................................ 9
Figure 1.7 . Balloon expansion of a coronary stent. .............................................................................. 10
Figure 1.8 . Common atherectomy techniques. ..................................................................................... 12
Figure 1.9 . Stent classification map. ....................................................................................................... 16
Figure 1.10 . Expansion of balloon and self-expandable stents. .......................................................... 17
Figure 1.11 . Coil stents. ............................................................................................................................ 24
Figure 1.12 . Spiral stents. ......................................................................................................................... 25
Figure 1.13 . Woven stents. ....................................................................................................................... 26
Figure 1.14 . Closed-cell modular stent. ................................................................................................. 26
Figure 1.15 . Stent with flexible bridges.................................................................................................. 27
Figure 1.16 . Closed-cell stent with flexible bridges. ............................................................................ 28
Figure 1.17 . Open cell modular stent. .................................................................................................... 28
Figure 1.18 . Fish scaling and plaque prolapse in open cell stents...................................................... 29
Figure 1.19 . Stent thrombosis in a DE stent. ......................................................................................... 32
Figure 1.20 . In-stent restenosis. ............................................................................................................... 34
Figure 1.21 . Overview of thesis structure. ............................................................................................. 38
Chapter 2 ............................................................................................................................................. 41
Figure 2.1 . Recoil Resilient Ring (RRR) luminal support. ................................................................... 45
Figure 2.2 . Finite element model of the simplified RRR...................................................................... 50
Figure 2.3 . Radial displacement and stress results during expansion. ............................................. 51
Figure 2.4 . Plastic strain results of the teeth. ......................................................................................... 52
List of Figures
Page xxviii
Figure 2.5 . BE stent resilience against compression. ............................................................................ 53
Figure 2.6 . RRR resilience against compression. .................................................................................. 54
Figure 2.7 . Computational model of RRR in axial loading analysis. ................................................. 55
Figure 2.8 . Axial loading results of the RRR without axial support. ................................................. 56
Figure 2.9 . Axial harnesses. ..................................................................................................................... 57
Figure 2.10 . Use of axial harnesses in the fully expanded state.......................................................... 58
Figure 2.11 . Discretised 3D model of RRR with axial harnesses. ....................................................... 58
Figure 2.12 . Axial loading results of the RRR with axial harnesses. .................................................. 59
Figure 2.13 . Plastic deformation of axial harnesses. ............................................................................. 59
Figure 2.14 . Straight RRR, µEDM patterned from a 200-µm-thick Nitinol sheet. ........................... 60
Figure 2.15 . RRR shaping and thermal treatment setup. ..................................................................... 61
Figure 2.16 . RRR after shaping and thermal treatment. ...................................................................... 62
Figure 2.17 . Surface profile of RRR ......................................................................................................... 63
Figure 2.18 . Balloon expansion of RRR in vitro ..................................................................................... 65
Figure 2.19 . Radial loading test setup. ................................................................................................... 66
Figure 2.20 . Radial loading test results, free-holding. ......................................................................... 68
Figure 2.21 . Radial loading test results, in vitro. ................................................................................... 69
Chapter 3 ............................................................................................................................................. 71
Figure 3.1 . Geometry of the three different supports. ......................................................................... 77
Figure 3.2 . Fluid domain configurations of the CFD analysis. ........................................................... 79
Figure 3.3 . Inlet flow profile. ................................................................................................................... 80
Figure 3.4 . Discretization of the fluid domain. ..................................................................................... 80
Figure 3.5 . Dimensional configurations of the dimensional analysis. ............................................... 82
Figure 3.6 . LWSS distribution in unbranched fluid domains. ............................................................ 84
Figure 3.7 . Temporal average of LWSS in unbranched fluid domains.............................................. 84
Figure 3.8 . Selected time instances of third cardiac cycle. ................................................................... 85
Figure 3.9 . Inverse relation of the dynamic viscosity and shear rate, standalone stent. ................. 86
Figure 3.10 . Inverse relation of the dynamic viscosity and shear rate, RRR-integrated stent. ....... 86
Figure 3.11 . LWSS contour plots, deployment area of unbranched domains, instances 1‒3. ........ 87
Figure 3.12 . LWSS contour plots, deployment area of unbranched domains, instances 4‒6. ........ 88
Figure 3.13 . LWSS contour plots, entire area of unbranched fluid domains, instances 1‒3. .......... 89
Figure 3.14 . LWSS contour plots, entire area of unbranched fluid domains, instances 4‒6. .......... 90
List of Figures
Page xxix
Figure 3.15 . Radial gradient of velocity and shear strain rate ............................................................ 91
Figure 3.16 . Velocity magnitudes along a radial path. ........................................................................ 92
Figure 3.17 . Drag force comparison in a unbranched fluid domain. ................................................. 93
Figure 3.18 . LWSS distribution in branched fluid domains................................................................ 95
Figure 3.19 . Drag force comparison of the scaffolds in branched domains. ..................................... 96
Figure 3.20 . LWSS contour plots, deployment area of branched domains, instances 1‒3. ............. 97
Figure 3.21 . LWSS contour plots, deployment area of branched domains, instances 4‒5. ............. 98
Figure 3.22 . LWSS contour plots, entire area of branched fluid domains, time instances 1‒3. ...... 99
Figure 3.23 . LWSS contour plots, entire area of branched fluid domains, time instances 4‒6. .... 100
Figure 3.24 . Flow rate comparison of proximal, distal and main branches. ................................... 101
Figure 3.25 . Mean absolute flow deviation from a healthy branched vessel. ................................ 102
Figure 3.26 . Temporal average values of hemodynamic indicators. ............................................... 103
Figure 3.27 . LWSS in the deployment area of cases 1‒8. ................................................................... 105
Figure 3.28 . LWSS in the entire fluid domains of case 1‒8. .............................................................. 106
Figure 3.29 . Drag Force Comparison, cases 1–8. ................................................................................ 107
Figure 3.30 . Proximal branch to inlet flow rate ratio, cases 1‒8. ...................................................... 108
Figure 3.31 . Distal branch to inlet flow rate ratio, cases 1‒8. ............................................................ 109
Figure 3.32 . Main branch to inlet flow rate ratio, cases 1‒8. ............................................................. 110
Figure 3.33 . Mean absolute flow deviation. ........................................................................................ 111
Figure 3.34 . Temporal average values of hemodynamic indicators, cases 1‒8. ............................. 111
Figure 3.35 . Temporal distribution of the mean LWSS ratios, cases 1‒8. ........................................ 112
Figure 3.36 . Temporal distribution of mean drag force, cases 1‒8................................................... 113
Figure 3.37 . Temporal mean flow ratios, cases 1‒8. ........................................................................... 114
Chapter 4 ........................................................................................................................................... 117
Figure 4.1 . Stress-strain curve of a shape memory alloy. .................................................................. 120
Figure 4.2 . Heat transfer setup model.................................................................................................. 122
Figure 4.3 . Cross-sectional overview of the mock-rod assembly. .................................................... 125
Figure 4.4 . Fin analysis of the heat transfer assembly. ...................................................................... 129
Figure 4.5 . Thermal resistance network at the top section of mock-rod assembly. ....................... 131
Figure 4.6 . Temperature distribution along walls of mock vessel. .................................................. 134
Figure 4.7 . Temperature distribution along heat transfer (HT) rod. ............................................... 135
Figure 4.8 . Temperature distribution along walls of mock vessel, high temperature input. ....... 136
List of Figures
Page xxx
Figure 4.9 . Geometry of the 3D thermal analysis model. .................................................................. 138
Figure 4.10 . Discretised mock-rod domain. ........................................................................................ 139
Figure 4.11 . Temperature distribution in the axial direction of the rod. ......................................... 140
Figure 4.12 . Heat flux in the mock-rod assembly. .............................................................................. 141
Figure 4.13 . Temperature distribution along internal walls of mock vessel. .................................. 142
Figure 4.14 . Temperature distribution in the simplified RRR. ......................................................... 143
Figure 4.15 . FEA model of the mock-rod assembly in a fluid chamber. ......................................... 144
Figure 4.16 . Discretization of the fluid solid domain for conjugate heat transfer. ......................... 147
Figure 4.17 . Convergence plots of the conjugate heat transfer analysis. ......................................... 148
Figure 4.18 . Temperature distribution along the rod, conjugate heat transfer. .............................. 149
Figure 4.19 . Velocity profile at the horizontal cross-section of the fluid chamber. ........................ 150
Figure 4.20 . Velocity profile at the vertical cross-section of the fluid chamber. ............................. 151
Figure 4.21 . Temperature on mock vessel internal walls, conjugate heat transfer. ....................... 152
Figure 4.22 . Temperature on mock vessel external walls, conjugate heat transfer. ....................... 153
Figure 4.23 . Temperature distribution in the RRR, conjugate heat transfer. .................................. 154
Figure 4.24 . Heat transfer setup. ........................................................................................................... 155
Figure 4.25 . Temperature of the external surface of mock vessel, base. .......................................... 156
Figure 4.26 . Temperature of the external surface of mock vessel, deployment area. .................... 157
Figure 4.27 . In vitro thermal expansion of the RRR. ........................................................................... 158
Figure 4.28 . Free expansion of the RRR under heat stimuli. ............................................................. 159
Figure 4.29 . Average external diameter of RRR vs. temperate. ........................................................ 159
Figure 4.30 . Actuation force measurement setup. .............................................................................. 160
Figure 4.31 . Temperature distribution on the heating plate and RRR. ............................................ 163
Figure 4.32 . Expansion forces of thermal actuation. .......................................................................... 164
Figure 4.33 . Electro-thermal actuation of the RRR. ............................................................................ 166
Figure 4.34 . Geometry of the electro-thermal analysis, deployment area. ...................................... 170
Figure 4.35 . Discretization of the fluid solid domain, electro-thermal analysis. ............................ 172
Figure 4.36 . Convergence plots of electro-thermal analysis. ............................................................. 173
Figure 4.37 . Temperature distribution in RRR, electro-thermal analysis. ....................................... 174
Figure 4.38 . Parametric study of electro-thermal analysis. ............................................................... 174
Figure 4.39 . Shear thinning effect of blood, electro-thermal analysis .............................................. 175
Page xxxi
List of Tables
List of Tables
Chapter 1 ............................................................................................................................................... 1
Table 1.1 . Mechanical properties of common stent materials............................................................. 18
Table 1.2 . Common materials used for fabrication of stents. ............................................................. 21
Table 1.3 . Common stent surface enhancement strategies.................................................................. 30
Chapter 2 ............................................................................................................................................. 41
Table 2.1 . Material and geometrical characteristics of a typical BE stent and RRR. ........................ 50
Table 2.2 . Surface roughness measurement parameters and values. ................................................ 63
Table 2.3 . Properties of RRR and commercial stent samples for compression test. ........................ 67
Chapter 3 ............................................................................................................................................. 71
Table 3.1 . Material and geometrical characteristics of the three luminal supports. ........................ 78
Table 3.2 . Dimensional configurations of the fluid domain for sensitivity study. .......................... 81
Table 3.3 . Drag and withholding forces comparison in an unbranched fluid domain. .................. 94
Chapter 4 ........................................................................................................................................... 117
Table 4.1 . Geometrical and material properties of the mock-rod assembly. .................................. 123
Table 4.2 . Vertical expansion of components in heat-induced actuation setup. ............................ 162
Table 4.3 . Material properties of blood and parylene-C.................................................................... 167

List of Tables
Page xxxii
This page is left blank intentionally

Page 1
Chapter 1
Chapter 1. Introduction and Motivation
Introduction and Motivation
ardiovascular disease is the primary cause of death in
the developed and developing countries, every year
taking lives of millions around the world. In this chap-
ter an overview of the risk factors leading to this disease are first
introduced, followed by the common non-surgical and surgical
treatment options. Among the occlusive vascular disease surgical
treatments, balloon angioplasty with adjunct stenting is the most
prevalent method.
Stents are mechanical tubular structures that are delivered to an
occluded site in a crimped state, wherein they expand and provide
a permanent support against luminal walls to re-establish normal
fluid flow. As the main focus of this chapter, a review of current
stent structures, designs and their often self-competing require-
ments are provided. Having recognized advantages and disad-
vantages of each class, current design gaps are recognized that are
considered for the development of a proposed novel transluminal
scaffolding device in subsequent chapters.
C
Chapter 1
Chapter 1 Introduction and Motivation
Page 2
1.1 Abstract
The human heart is a small fist-sized organ that beats about 70 times per minute at rest,
humbly reviving itself and all other parts of the body bestowing them oxygen and nutri-
ent-rich blood. As an integral part of the cardiovascular system, the vessels facilitate this
process by providing the pathways between the heart and its descendants. Though resil-
ient to the myriad of different conditions of its owner, this marvel of creation may yet fall
shy of its responsibilities by the slightest nuance of a blockage endangering our exist-
ence. Cardiovascular disease (CVD), taking lives of more than 17 million people in 2008,
has yet remained the greatest culprit for deaths around the globe as of today [1].
Statistics from the World Health Organisation and US Centre for Disease Control and
Prevention (2002) show that cardiovascular disease is responsible for 10% of the disabil-
ity-adjusted life years lost in low and middle-income countries, and 18% in high-income
countries. Accounting as one of the primary causes of CVD, atherosclerosis refers to the
thickening of internal layers of vessels due to accumulation of fatty materials. This chron-
ic inflammatory disease can lead to narrowing or total occlusion of any of the arteries
negatively affecting the downstream organs such as the heart (coronary artery disease),
the brain and peripheral organs.
Coronary heart disease is estimated to become the single leading health problem by 2020
[1]. In Australia, based on statistics in 2001, CVD accounted for 38% of all Australian
deaths; 26% of these were due to coronary heart diseases, while the rest (9%) were stroke
related. In addition, this disease is responsible for 7.5% of all hospital operations, costing
$7.8 billion of the total Australian health expenditure in 2002, and becoming the most
costly health condition. Some of the commonly recognized causes of this disease include
genetic predisposition, unhealthy lifestyle, cold weather, lack of exercise and strong emo-
tions [2]. Treatment and management of vascular constrictions consists of a combination
of non-surgical approaches such as healthy lifestyle changes, pharmacological approach-
es as well as the more invasive surgical methods among which bypass grafting, balloon
angioplasty, stenting and atherectomy are the most common.
A stent is a mechanical structure that provides a chronic support against internal walls of
an occluded vessel to restore its luminal cavity. Having proved its efficacy in short- and
long-term treatment of occluded vessels, stenting has become the mainstream approach
Atherosclerosis and Luminal Occlusion Chapter 1
Page 3
in management of CVD surpassing the number of bypass grafting procedures every
year. Common stent structures are simply made of a metal mesh, e.g. stainless steel, and
deployed in a blood vessel such as an artery during a percutaneous coronary interven-
tion procedure, also known as angioplasty. Despite promising acute luminal gain after
stenting, thrombosis (formation of blood clots) and restenosis (renarrowing of the lesion)
have yet remained as the most important post-intervention complications that limit the
effectiveness of this procedure.
In this chapter, after an introduction on atherosclerosis and its contributing factors,
common treatment options are discussed. Stenting as the main focus of this thesis is then
expanded providing a review of current structures and improvements since deployment
of the very first vascular stent. Iterating the advantages and shortcomings of each of the
designs and important attributes of stents, then the design gap is recognized. Finally, a
summary of the thesis and original contributions are outlined.
1.2 Atherosclerosis and Luminal Occlusion
Major blood vessels of the body are comprised of three distinct layers including, the tuni-
ca intima, the tunica media and the tunica adventitia. From the innermost layer to the
outermost, the tunica intima consists of the thin internal layer adjacent to the luminal cav-
ity. This layer acts as a barrier between the luminal fluid and the rest of the vessel engag-
ing in mediation of coagulation, platelet adhesion, immune function and controlling the
content and amount of intravascular and extravascular fluids [3]. In a healthy vessel, this
layer comprises a thin layer of endothelial cell and connective tissue. The mechanical ac-
tion of this layer is provided by the smooth muscles cells of the tunica media that are en-
closed by a network of collagen and elastic fibres. These two first layers are covered by a
protective layer of primarily elastin and collagen that consists of tunica adventitia. Figure
1.1 shows the cross-sectional view of an artery with a detailed view of the three layers.
The cavity at the centre of a vessel that is normally filled with flowing blood is referred
to as the lumen.
One of the most prevalent pathological indications of abnormal vessels is an inflammato-
ry phenomenon referred to as atherosclerosis. Development of atherosclerosis is majorly
associated with early appearance of fibrotic fatty depositions between the tunica media
Chapter 1 Introduction and Motivation
Page 4
and intima [4, 5]. Despite the widespread agreement on the relevance of atherosclerosis
and the inflammatory response of the endothelial layer to injuries [6, 7], this complex
phenomenon is yet to be understood completely.
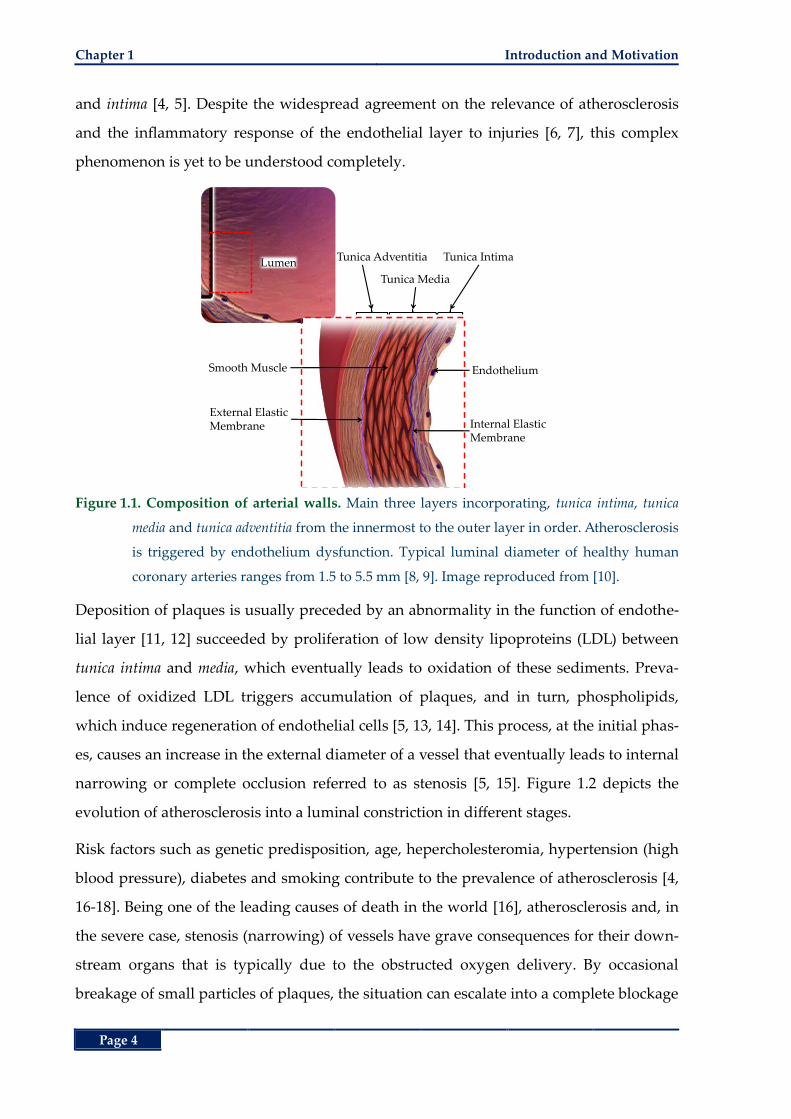
Figure 1.1. Composition of arterial walls. Main three layers incorporating, tunica intima, tunica
media and tunica adventitia from the innermost to the outer layer in order. Atherosclerosis
is triggered by endothelium dysfunction. Typical luminal diameter of healthy human
coronary arteries ranges from 1.5 to 5.5 mm [8, 9]. Image reproduced from [10].
Deposition of plaques is usually preceded by an abnormality in the function of endothe-
lial layer [11, 12] succeeded by proliferation of low density lipoproteins (LDL) between
tunica intima and media, which eventually leads to oxidation of these sediments. Preva-
lence of oxidized LDL triggers accumulation of plaques, and in turn, phospholipids,
which induce regeneration of endothelial cells [5, 13, 14]. This process, at the initial phas-
es, causes an increase in the external diameter of a vessel that eventually leads to internal
narrowing or complete occlusion referred to as stenosis [5, 15]. Figure 1.2 depicts the
evolution of atherosclerosis into a luminal constriction in different stages.
Risk factors such as genetic predisposition, age, hepercholesteromia, hypertension (high
blood pressure), diabetes and smoking contribute to the prevalence of atherosclerosis [4,
16-18]. Being one of the leading causes of death in the world [16], atherosclerosis and, in
the severe case, stenosis (narrowing) of vessels have grave consequences for their down-
stream organs that is typically due to the obstructed oxygen delivery. By occasional
breakage of small particles of plaques, the situation can escalate into a complete blockage
Smooth Muscle
External ElasticMembrane
Tunica Adventitia
Tunica Media
Tunica Intima
Endothelium
Internal ElasticMembrane
Lumen
Non-surgical Treatments Chapter 1
Page 5
leading to necrosis of vital organs such as the heart (heart attack) and/or brain (stroke). In
less life-threatening situations atherosclerotic plaques can cause peripheral artery disease
typically leading to pain in legs, poor wound healing and even amputations. Depending
on the severity of plaque deposition in terms of volume, content and its risk of rupture,
different treatment protocols are adopted by clinicians as detailed in the following sec-
tions.
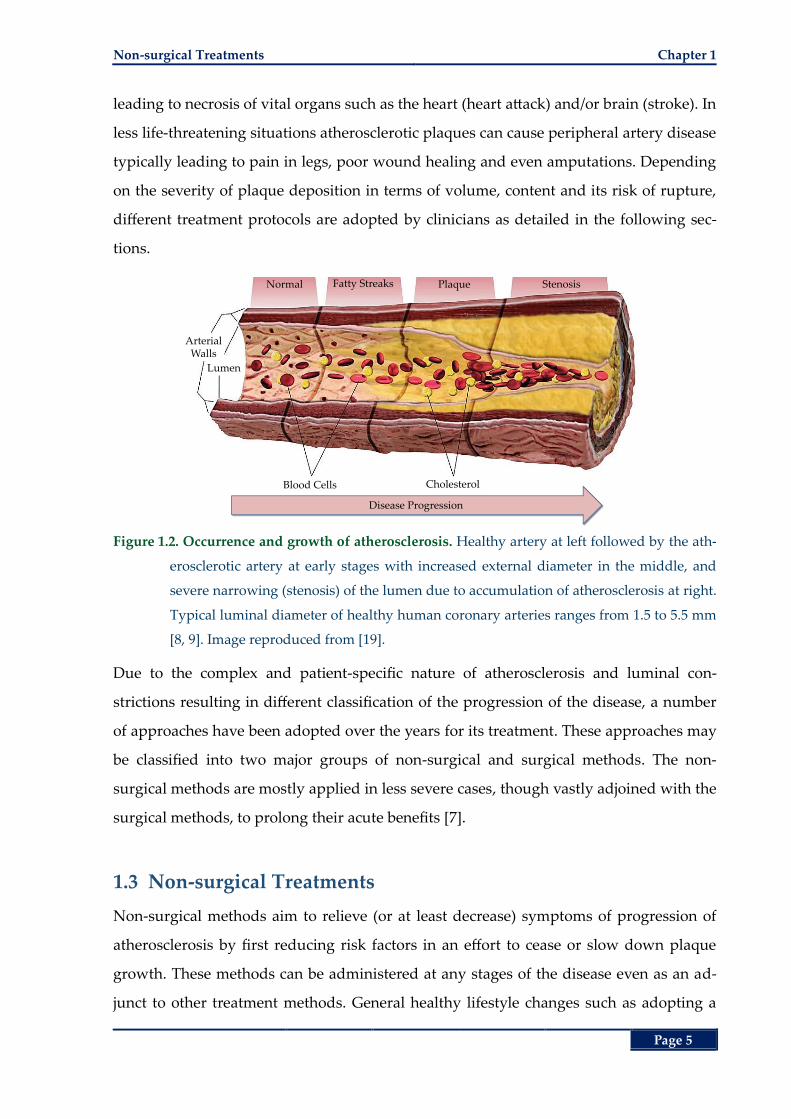
Figure 1.2. Occurrence and growth of atherosclerosis. Healthy artery at left followed by the ath-
erosclerotic artery at early stages with increased external diameter in the middle, and
severe narrowing (stenosis) of the lumen due to accumulation of atherosclerosis at right.
Typical luminal diameter of healthy human coronary arteries ranges from 1.5 to 5.5 mm
[8, 9]. Image reproduced from [19].
Due to the complex and patient-specific nature of atherosclerosis and luminal con-
strictions resulting in different classification of the progression of the disease, a number
of approaches have been adopted over the years for its treatment. These approaches may
be classified into two major groups of non-surgical and surgical methods. The non-
surgical methods are mostly applied in less severe cases, though vastly adjoined with the
surgical methods, to prolong their acute benefits [7].
1.3 Non-surgical Treatments
Non-surgical methods aim to relieve (or at least decrease) symptoms of progression of
atherosclerosis by first reducing risk factors in an effort to cease or slow down plaque
growth. These methods can be administered at any stages of the disease even as an ad-
junct to other treatment methods. General healthy lifestyle changes such as adopting a
Blood Cells Cholesterol
ArterialWalls
Lumen
Normal Fatty Streaks Plaque Stenosis
Disease Progression
Chapter 1 Introduction and Motivation
Page 6
healthy diet low in cholesterol, sugar and salt, more frequent physical activities, lower-
ing stress, quitting smoking and maintaining a healthy weight are of outmost importance
as the first line of defence for prevention or alleviation of atherosclerosis [2]. Pharmaco-
logical interventions may also be applicable at the early stages of the disease and as an
adjunct treatment. At this stage a single or combination therapy of medications mainly
addressed to lower blood pressure, lower cholesterol levels and blood thinners are ad-
ministered [20-23]. Typical antihypertensive medications including but not limited to be-
ta blockers, angiotensin-converting enzyme (ACE) inhibitors and the more recent
angiotensin II receptor antagonists (ARB) [24, 25] reduce the high stress levels and in-
flammation of arteries that lead to poor vascular performance [20, 21]. Cholesterol-
lowering medications (statins) attempt to control further sedimentation of fatty cells in
the atherosclerotic lesion. Blood thinners, including anticoagulants such as heparin or
warfarin and antiplatelet agents such as aspirin can assist the fight against atherosclero-
sis progression by reducing thrombus formations yet increase the risk of excessive bleed-
ing in individuals with low platelet levels [22, 26].
1.4 Surgical Treatments
In severe cases of stenosis, surgical methods are employed to physically push or remove
the atherosclerotic plaque away from the lumen and restore blood flow. These methods
can further be classified into two groups of invasive and minimally-invasive. The two
dominant invasive approaches include bypass grafting, and endarterectomy that are ex-
plained later in this section. In addition to the older invasive methods, the more recent
transluminal methods such as angioplasty with or without stent deployment and
atherectomy have become more dominant in the past decade. Long-term clinical results
of the transluminal methods are improved even beyond the more invasive methods by
the advent of site-specific drug administration using DE stents and DE balloons.
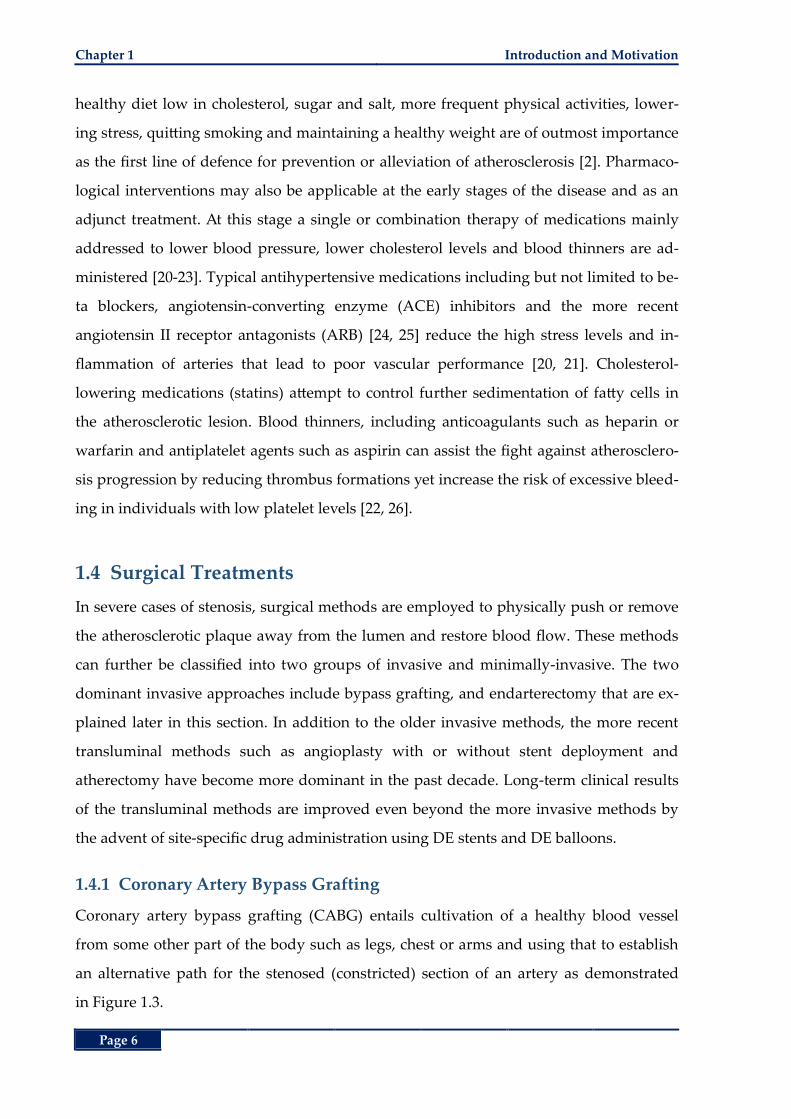
1.4.1 Coronary Artery Bypass Grafting
Coronary artery bypass grafting (CABG) entails cultivation of a healthy blood vessel
from some other part of the body such as legs, chest or arms and using that to establish
an alternative path for the stenosed (constricted) section of an artery as demonstrated
in Figure 1.3.
Surgical Treatments Chapter 1
Page 7
Figure 1.3. Coronary artery bypass grafting. Blood flow of stenosed coronary arteries is rerouted
via alternative vessels from the aorta. Image reproduced from [27].
Undergoing CABG requires general anaesthesia and the recovery time is the longest
amongst other treatment options [28, 29]. One streamlined method for CABG is referred
to as arrested heart surgery (conventional bypass surgery) wherein the heart is stopped
and a heart-lung machine replaces the circulatory system. The second method referred to
as off-pump or beating heart surgery discards the need for the heart-lung machine yet
entails certain equipment to facilitate operation on a beating heart [28, 30]. General com-
plications of this method include those of any open surgery such as infection, internal
bleeding in addition to circulatory-specific problems such as clot formation or acute clo-
sure of arteries leading to heart attack or stroke [29, 31].
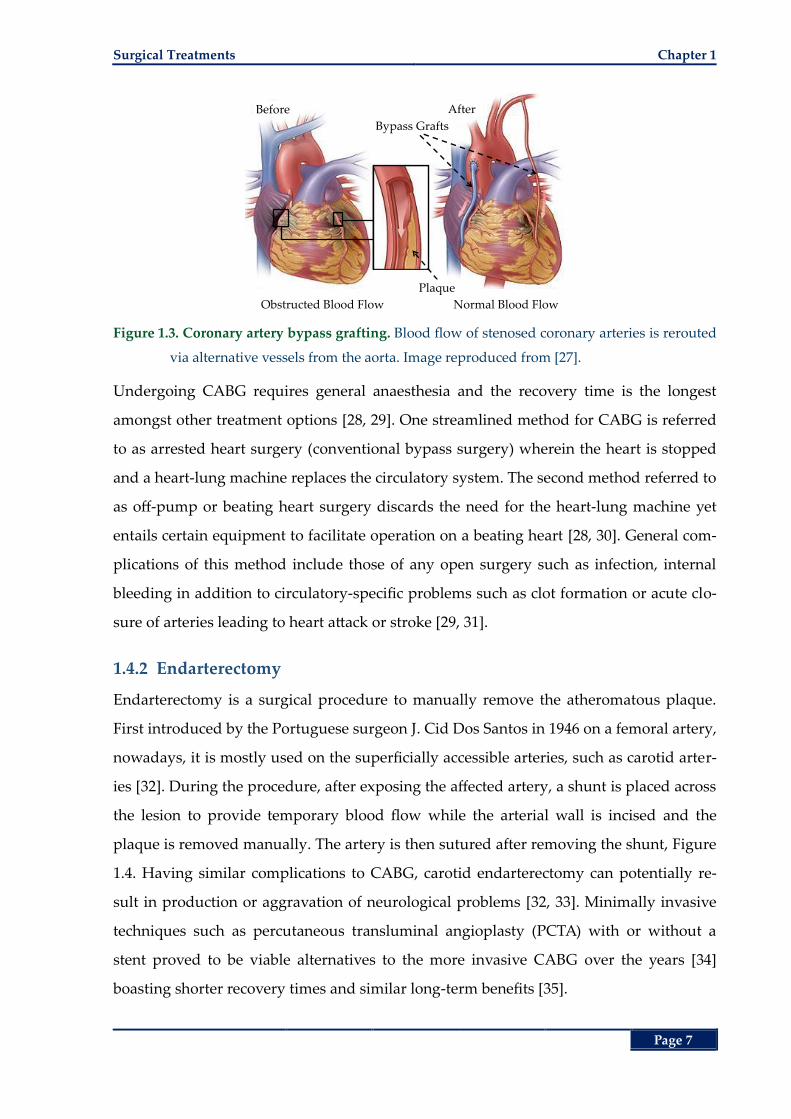
1.4.2 Endarterectomy
Endarterectomy is a surgical procedure to manually remove the atheromatous plaque.
First introduced by the Portuguese surgeon J. Cid Dos Santos in 1946 on a femoral artery,
nowadays, it is mostly used on the superficially accessible arteries, such as carotid arter-
ies [32]. During the procedure, after exposing the affected artery, a shunt is placed across
the lesion to provide temporary blood flow while the arterial wall is incised and the
plaque is removed manually. The artery is then sutured after removing the shunt, Figure
1.4. Having similar complications to CABG, carotid endarterectomy can potentially re-
sult in production or aggravation of neurological problems [32, 33]. Minimally invasive
techniques such as percutaneous transluminal angioplasty (PCTA) with or without a
stent proved to be viable alternatives to the more invasive CABG over the years [34]
boasting shorter recovery times and similar long-term benefits [35].
Before After
Bypass Grafts
Plaque
Obstructed Blood Flow Normal Blood Flow
Chapter 1 Introduction and Motivation
Page 8
Figure 1.4. Carotid artery endarterectomy. Temporary shunt provides blood flow to the brain
during the surgery and is removed after removal of the atherosclerotic plaque. Image
reproduced from [36].
1.4.3 Percutaneous Transluminal Angioplasty
First introduced by Andreas Gruentzig in 1977 [37], PCTA has become widely accepted
for treatment of obstructed lumens where the target stenosis is dilated by the inflation of
a balloon. As demonstrated by Figure 1.5, the procedure includes insertion of a deflated
balloon catheter through a point incision typically in the femoral or brachial artery [38].
(a) (b) (d)
Figure 1.5. Percutaneous transluminal angioplasty (PCTA). a) A deflated balloon is guided to the
lesion site via a catheter, b) then dilated by increasing the hydraulic pressure inside dis-
placing the atherosclerotic protrusions away from the lumen, d) to restore the blood
flow. Typical luminal diameter of healthy human coronary arteries ranges from 1.5 to
5.5 mm [8, 9]. Image reproduced from [39].
After reaching the target site, the balloon is inflated by running pressurized water inside
it with which the balloon dilates the constricted lumen. Then the balloon is deflated and
Initial Incision
Shunt Clamp
Removed Plaque
Plaque
DeflatedBalloon
DilatedBalloon
DisplacedPlaque
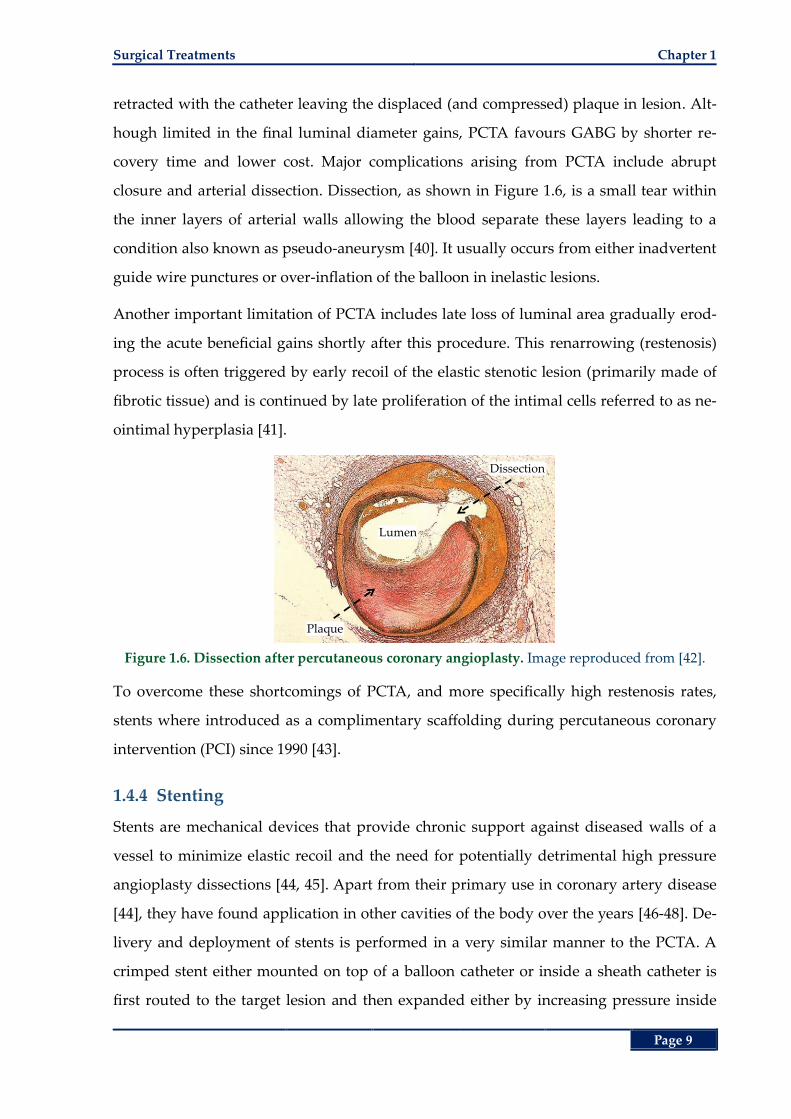
Surgical Treatments Chapter 1
Page 9
retracted with the catheter leaving the displaced (and compressed) plaque in lesion. Alt-
hough limited in the final luminal diameter gains, PCTA favours GABG by shorter re-
covery time and lower cost. Major complications arising from PCTA include abrupt
closure and arterial dissection. Dissection, as shown in Figure 1.6, is a small tear within
the inner layers of arterial walls allowing the blood separate these layers leading to a
condition also known as pseudo-aneurysm [40]. It usually occurs from either inadvertent
guide wire punctures or over-inflation of the balloon in inelastic lesions.
Another important limitation of PCTA includes late loss of luminal area gradually erod-
ing the acute beneficial gains shortly after this procedure. This renarrowing (restenosis)
process is often triggered by early recoil of the elastic stenotic lesion (primarily made of
fibrotic tissue) and is continued by late proliferation of the intimal cells referred to as ne-
ointimal hyperplasia [41].
Figure 1.6. Dissection after percutaneous coronary angioplasty. Image reproduced from [42].
To overcome these shortcomings of PCTA, and more specifically high restenosis rates,
stents where introduced as a complimentary scaffolding during percutaneous coronary
intervention (PCI) since 1990 [43].
1.4.4 Stenting
Stents are mechanical devices that provide chronic support against diseased walls of a
vessel to minimize elastic recoil and the need for potentially detrimental high pressure
angioplasty dissections [44, 45]. Apart from their primary use in coronary artery disease
[44], they have found application in other cavities of the body over the years [46-48]. De-
livery and deployment of stents is performed in a very similar manner to the PCTA. A
crimped stent either mounted on top of a balloon catheter or inside a sheath catheter is
first routed to the target lesion and then expanded either by increasing pressure inside
Dissection
Plaque
Lumen
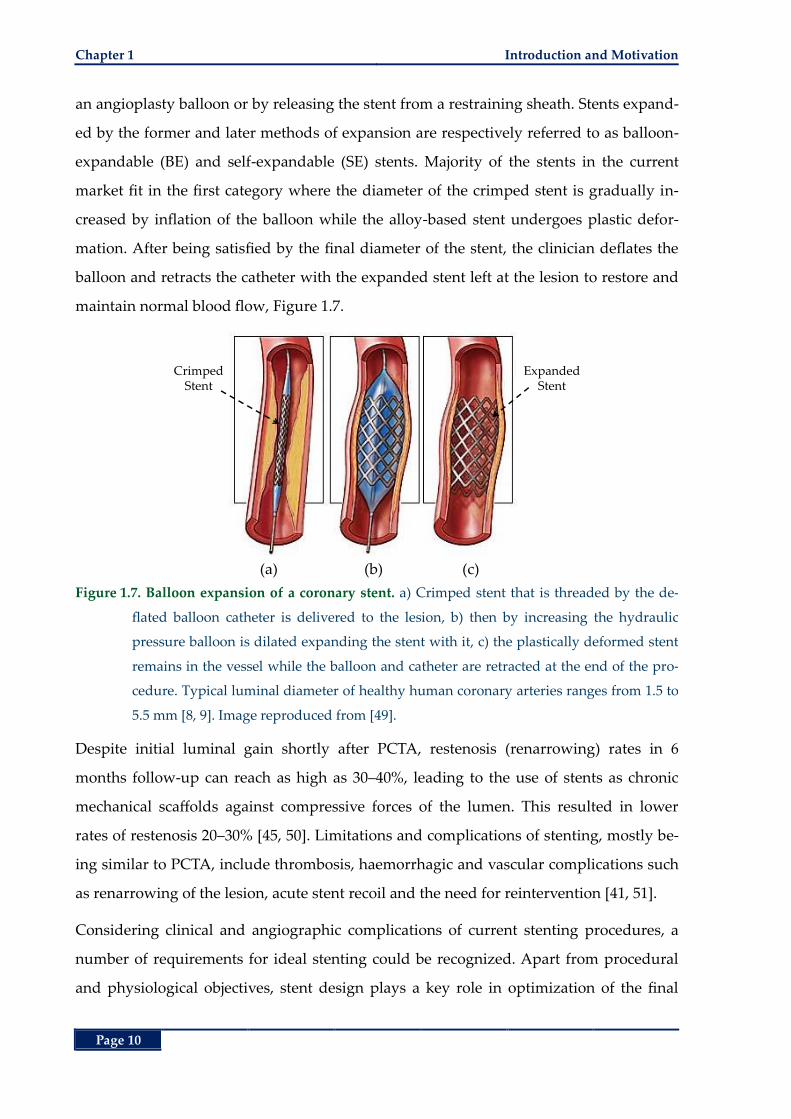
Chapter 1 Introduction and Motivation
Page 10
an angioplasty balloon or by releasing the stent from a restraining sheath. Stents expand-
ed by the former and later methods of expansion are respectively referred to as balloon-
expandable (BE) and self-expandable (SE) stents. Majority of the stents in the current
market fit in the first category where the diameter of the crimped stent is gradually in-
creased by inflation of the balloon while the alloy-based stent undergoes plastic defor-
mation. After being satisfied by the final diameter of the stent, the clinician deflates the
balloon and retracts the catheter with the expanded stent left at the lesion to restore and
maintain normal blood flow, Figure 1.7.
(a) (b) (c)
Figure 1.7. Balloon expansion of a coronary stent. a) Crimped stent that is threaded by the de-
flated balloon catheter is delivered to the lesion, b) then by increasing the hydraulic
pressure balloon is dilated expanding the stent with it, c) the plastically deformed stent
remains in the vessel while the balloon and catheter are retracted at the end of the pro-
cedure. Typical luminal diameter of healthy human coronary arteries ranges from 1.5 to
5.5 mm [8, 9]. Image reproduced from [49].
Despite initial luminal gain shortly after PCTA, restenosis (renarrowing) rates in 6
months follow-up can reach as high as 30‒40%, leading to the use of stents as chronic
mechanical scaffolds against compressive forces of the lumen. This resulted in lower
rates of restenosis 20‒30% [45, 50]. Limitations and complications of stenting, mostly be-
ing similar to PCTA, include thrombosis, haemorrhagic and vascular complications such
as renarrowing of the lesion, acute stent recoil and the need for reintervention [41, 51].
Considering clinical and angiographic complications of current stenting procedures, a
number of requirements for ideal stenting could be recognized. Apart from procedural
and physiological objectives, stent design plays a key role in optimization of the final
CrimpedStent
ExpandedStent
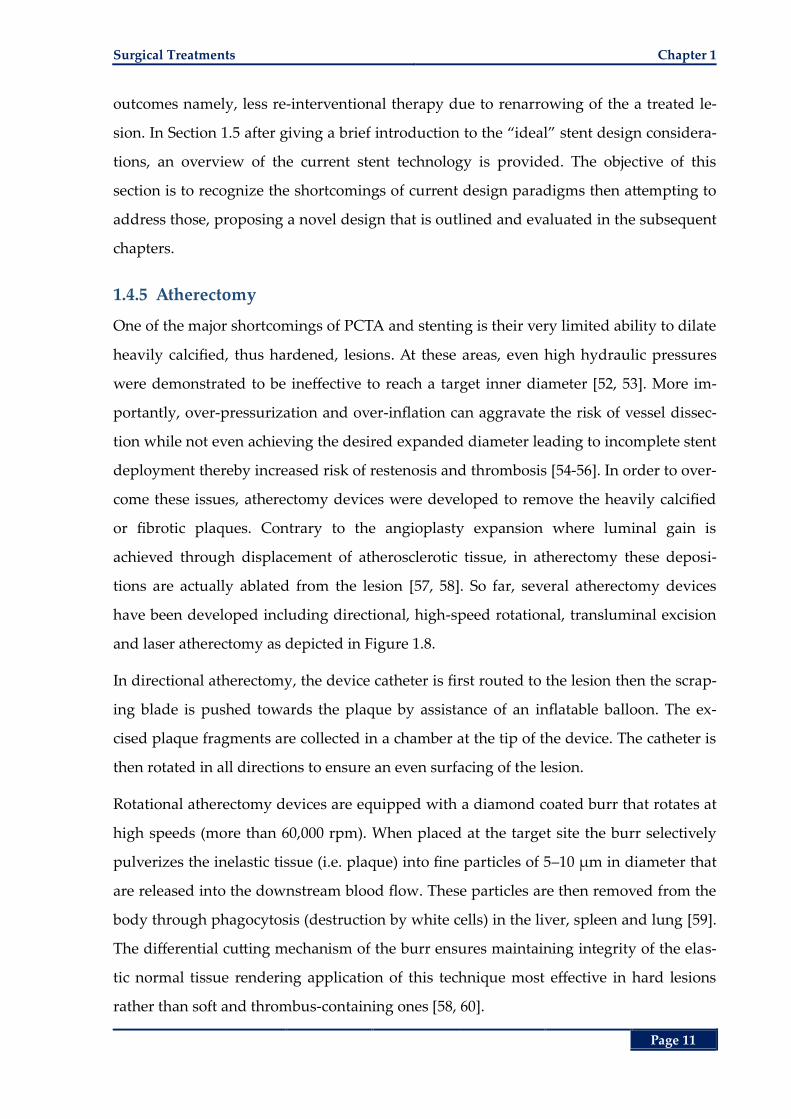
Surgical Treatments Chapter 1
Page 11
outcomes namely, less re-interventional therapy due to renarrowing of the a treated le-
sion. In Section 1.5 after giving a brief introduction to the “ideal” stent design considera-
tions, an overview of the current stent technology is provided. The objective of this
section is to recognize the shortcomings of current design paradigms then attempting to
address those, proposing a novel design that is outlined and evaluated in the subsequent
chapters.
1.4.5 Atherectomy
One of the major shortcomings of PCTA and stenting is their very limited ability to dilate
heavily calcified, thus hardened, lesions. At these areas, even high hydraulic pressures
were demonstrated to be ineffective to reach a target inner diameter [52, 53]. More im-
portantly, over-pressurization and over-inflation can aggravate the risk of vessel dissec-
tion while not even achieving the desired expanded diameter leading to incomplete stent
deployment thereby increased risk of restenosis and thrombosis [54-56]. In order to over-
come these issues, atherectomy devices were developed to remove the heavily calcified
or fibrotic plaques. Contrary to the angioplasty expansion where luminal gain is
achieved through displacement of atherosclerotic tissue, in atherectomy these deposi-
tions are actually ablated from the lesion [57, 58]. So far, several atherectomy devices
have been developed including directional, high-speed rotational, transluminal excision
and laser atherectomy as depicted in Figure 1.8.
In directional atherectomy, the device catheter is first routed to the lesion then the scrap-
ing blade is pushed towards the plaque by assistance of an inflatable balloon. The ex-
cised plaque fragments are collected in a chamber at the tip of the device. The catheter is
then rotated in all directions to ensure an even surfacing of the lesion.
Rotational atherectomy devices are equipped with a diamond coated burr that rotates at
high speeds (more than 60,000 rpm). When placed at the target site the burr selectively
pulverizes the inelastic tissue (i.e. plaque) into fine particles of 5‒10 µm in diameter that
are released into the downstream blood flow. These particles are then removed from the
body through phagocytosis (destruction by white cells) in the liver, spleen and lung [59].
The differential cutting mechanism of the burr ensures maintaining integrity of the elas-
tic normal tissue rendering application of this technique most effective in hard lesions
rather than soft and thrombus-containing ones [58, 60].
Chapter 1 Introduction and Motivation
Page 12
Transluminal excision (extraction), similar to the rotational atherectomy, replaces the di-
amond coated burr with a set of stainless steel blades. Moreover, the hollow tubular
catheter in transluminal excision atherectomy collects the ablated fragments through
vacuum suction instead of releasing them into the bloodstream.
Laser atherectomy, most often adjunct to balloon angioplasty and stenting, vaporises the
plaque by delivery of 308-nm wavelength energy (excimer laser) to target lesions allow-
ing selective ablation of thrombus and atherosclerotic plaque [61-63]. The primary objec-
tive of this method is to convert complex angiographic cases into more manageable ones
referred to as laser assisted revascularization [61].
(a) (b) (c) (d) (e)
Figure 1.8. Common atherectomy techniques. a) Stenosed artery, b) directional atherectomy, the
balloon expands to expose the cutting blade to the plaque, scraped plaque is collected at
the collection chamber, c) rotational atherectomy, the rotating diamond-coated tip disin-
tegrates the plaque into microscopic fragments that are released downstream, d) trans-
luminal excision, the rotating stainless steel blades grind the plaque that is collected by
vacuum suction, e) laser atherectomy, laser vaporizes the plaque, [64]. Typical luminal
diameter of healthy human coronary arteries ranges from 1.5 to 5.5 mm [8, 9].
Atherectomy and other debris removal techniques such as thrombectomy (removal of
clots) and embolic protection (capturing embolic debris) can all be used in conjunction
with balloon angioplasty and coronary stenting to augment their beneficial results [57].
Particularly, where concerns regarding proper expansion of a stent in a heavily calcified
lesion are escalated, combination of rotational ablation followed by stenting has proven
to be useful. This is due to the better compliance of the lesion following atherectomy,
which results in better stent expansion [65-68]. One of the most indicative application ar-
eas of atherectomy, more specifically rotational atherectomy, is management of chronic
PlaqueBalloon
Blade
CollectionChamber
DiamondBurr
PulverizedPlaque
SuctionChamber
Steel Blades
PulverizedPlaque
LaserBeam
Stents Current Status and the Future Chapter 1
Page 13
in-stent restenosis (ISR). Contrary to the elastic recoil mechanism of restenosis in PCTA,
ISR is mainly due to neointimal proliferation that is most likely in response to the pres-
ence of a foreign object, the stent and intravascular trauma during deployment. Resteno-
sis management, solely by re-application of angioplasty exhibited very high rates (up to
85%) of recurrent restenosis [69]. This is due to the inability of the balloon to efficiently
displace the high volume of stenotic tissue. For these reasons, pre-treatment with an ath-
eroablative technique before balloon dilation is proposed [70-75].
1.5 Stents Current Status and the Future
The word “stent” is derived from a dental prosthesis developed by the 19th century Eng-
lish dentist Charles Stent. Nowadays, it refers to any mechanical device that is to expand
and provide support inside a cavity in the body [41]. Mostly indicated in vascular occlu-
sions [41, 44], these devices have found their way in other ducts of the body [46-48]. To-
day’s market is replete with numerous stents amounting to a 3-billion-dollar industry.
General characteristics and requirements of stents are reiterated abundantly in the litera-
ture [76-80]. These often competing ideal stent specifications can be classified as follows:
High radial strength: to withstand the compressive forces imposed by the often
atherosclerotic vessel walls to retain the lumen.
Low elastic recoil: elastic recoil of stents that is due to the intrinsic material proper-
ties of the stent ought to be accounted for during deployment to achieve optimal
luminal diameter. The higher the recoil, the higher is the need for over-expansion
of the stent to compensate for luminal loss due to recoil, which in turn results in
induction of more vascular injury leading to subsequent proliferative response
from the body.
High axial flexibility: increases the vascularization success rate at tortuous and dis-
tal lesions. Low axial flexibility results in lesion straightening and non-
homogenous stress distribution on the vessel walls potentially leading to exces-
sive vascular injury at the proximal and distal ends of the stent.
High crimped to expanded ratio: increases trackability of the deployment catheter to
pass through narrow and tortuous paths when the stent is crimped while provid-
ing good scaffolding upon expansion of the stent.
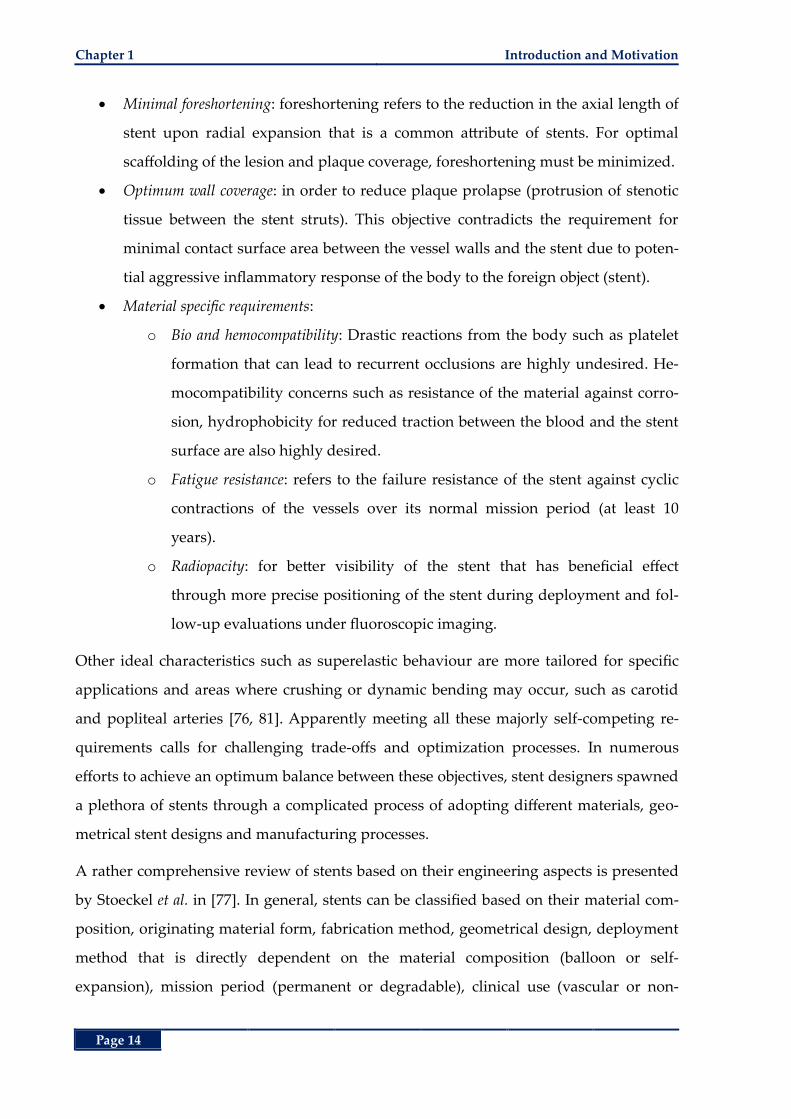
Chapter 1 Introduction and Motivation
Page 14
Minimal foreshortening: foreshortening refers to the reduction in the axial length of
stent upon radial expansion that is a common attribute of stents. For optimal
scaffolding of the lesion and plaque coverage, foreshortening must be minimized.
Optimum wall coverage: in order to reduce plaque prolapse (protrusion of stenotic
tissue between the stent struts). This objective contradicts the requirement for
minimal contact surface area between the vessel walls and the stent due to poten-
tial aggressive inflammatory response of the body to the foreign object (stent).
Material specific requirements:
o Bio and hemocompatibility: Drastic reactions from the body such as platelet
formation that can lead to recurrent occlusions are highly undesired. He-
mocompatibility concerns such as resistance of the material against corro-
sion, hydrophobicity for reduced traction between the blood and the stent
surface are also highly desired.
o Fatigue resistance: refers to the failure resistance of the stent against cyclic
contractions of the vessels over its normal mission period (at least 10
years).
o Radiopacity: for better visibility of the stent that has beneficial effect
through more precise positioning of the stent during deployment and fol-
low-up evaluations under fluoroscopic imaging.
Other ideal characteristics such as superelastic behaviour are more tailored for specific
applications and areas where crushing or dynamic bending may occur, such as carotid
and popliteal arteries [76, 81]. Apparently meeting all these majorly self-competing re-
quirements calls for challenging trade-offs and optimization processes. In numerous
efforts to achieve an optimum balance between these objectives, stent designers spawned
a plethora of stents through a complicated process of adopting different materials, geo-
metrical stent designs and manufacturing processes.
A rather comprehensive review of stents based on their engineering aspects is presented
by Stoeckel et al. in [77]. In general, stents can be classified based on their material com-
position, originating material form, fabrication method, geometrical design, deployment
method that is directly dependent on the material composition (balloon or self-
expansion), mission period (permanent or degradable), clinical use (vascular or non-
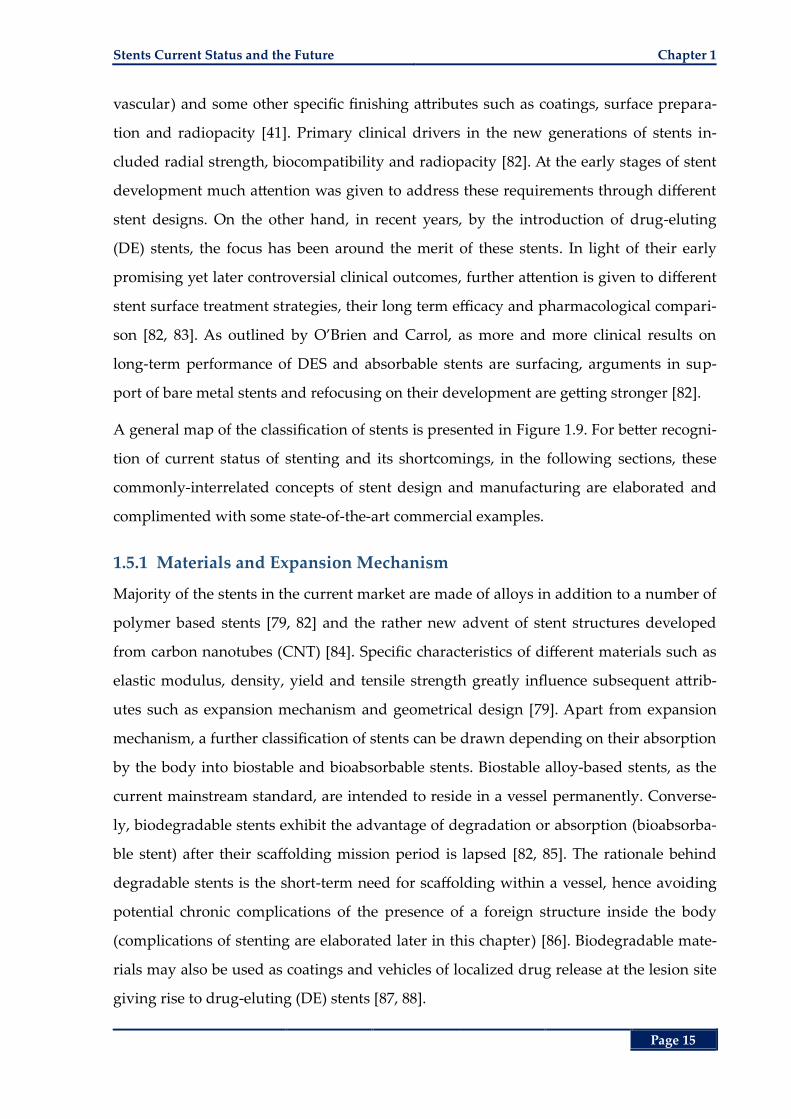
Stents Current Status and the Future Chapter 1
Page 15
vascular) and some other specific finishing attributes such as coatings, surface prepara-
tion and radiopacity [41]. Primary clinical drivers in the new generations of stents in-
cluded radial strength, biocompatibility and radiopacity [82]. At the early stages of stent
development much attention was given to address these requirements through different
stent designs. On the other hand, in recent years, by the introduction of drug-eluting
(DE) stents, the focus has been around the merit of these stents. In light of their early
promising yet later controversial clinical outcomes, further attention is given to different
stent surface treatment strategies, their long term efficacy and pharmacological compari-
son [82, 83]. As outlined by O’Brien and Carrol, as more and more clinical results on
long-term performance of DES and absorbable stents are surfacing, arguments in sup-
port of bare metal stents and refocusing on their development are getting stronger [82].
A general map of the classification of stents is presented in Figure 1.9. For better recogni-
tion of current status of stenting and its shortcomings, in the following sections, these
commonly-interrelated concepts of stent design and manufacturing are elaborated and
complimented with some state-of-the-art commercial examples.
1.5.1 Materials and Expansion Mechanism
Majority of the stents in the current market are made of alloys in addition to a number of
polymer based stents [79, 82] and the rather new advent of stent structures developed
from carbon nanotubes (CNT) [84]. Specific characteristics of different materials such as
elastic modulus, density, yield and tensile strength greatly influence subsequent attrib-
utes such as expansion mechanism and geometrical design [79]. Apart from expansion
mechanism, a further classification of stents can be drawn depending on their absorption
by the body into biostable and bioabsorbable stents. Biostable alloy-based stents, as the
current mainstream standard, are intended to reside in a vessel permanently. Converse-
ly, biodegradable stents exhibit the advantage of degradation or absorption (bioabsorba-
ble stent) after their scaffolding mission period is lapsed [82, 85]. The rationale behind
degradable stents is the short-term need for scaffolding within a vessel, hence avoiding
potential chronic complications of the presence of a foreign structure inside the body
(complications of stenting are elaborated later in this chapter) [86]. Biodegradable mate-
rials may also be used as coatings and vehicles of localized drug release at the lesion site
giving rise to drug-eluting (DE) stents [87, 88].
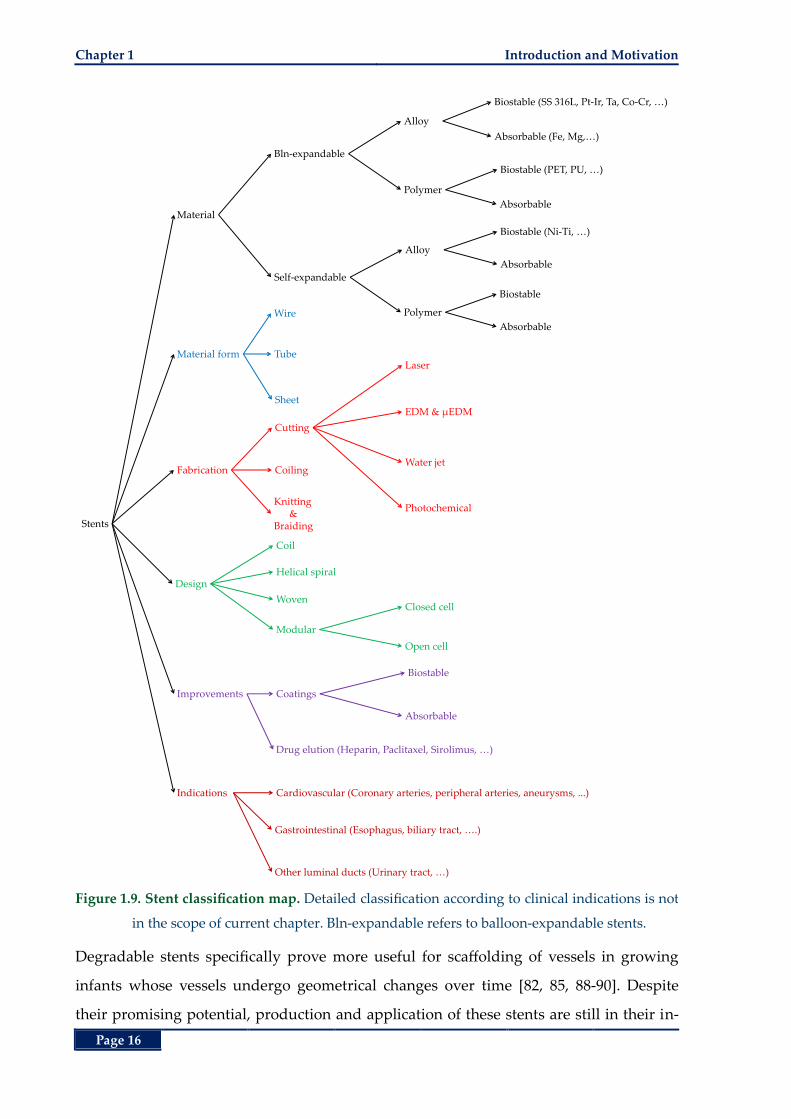
Chapter 1 Introduction and Motivation
Page 16
Figure 1.9. Stent classification map. Detailed classification according to clinical indications is not
in the scope of current chapter. Bln-expandable refers to balloon-expandable stents.
Degradable stents specifically prove more useful for scaffolding of vessels in growing
infants whose vessels undergo geometrical changes over time [82, 85, 88-90]. Despite
their promising potential, production and application of these stents are still in their in-
Stents
Material
Improvements
Material form
Design
Fabrication
Bln-expandable
Coatings
Wire
Coil
Cutting
Self-expandable
Alloy
Polymer
Tube
Sheet
Coiling
Knitting &
Braiding
Laser
EDM & µEDM
Water jet
Photochemical
Helical spiral
Woven
Modular
Closed cell
Open cell
Alloy
Polymer
Biostable (SS 316L, Pt-Ir, Ta, Co-Cr, …)
Absorbable (Fe, Mg,…)
Drug elution (Heparin, Paclitaxel, Sirolimus, …)
Biostable (PET, PU, …)
Absorbable
Biostable (Ni-Ti, …)
Absorbable
Biostable
Absorbable
Biostable
Absorbable
Indications Cardiovascular (Coronary arteries, peripheral arteries, aneurysms, ...)
Gastrointestinal (Esophagus, biliary tract, ….)
Other luminal ducts (Urinary tract, …)
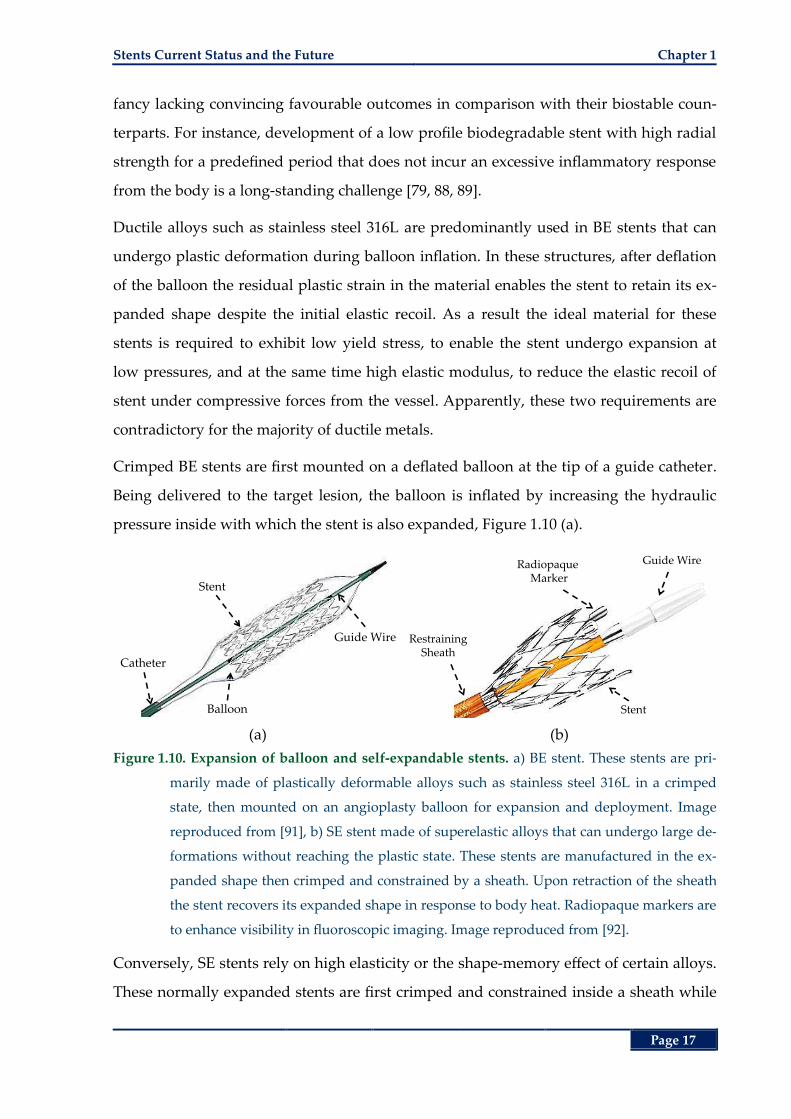
Stents Current Status and the Future Chapter 1
Page 17
fancy lacking convincing favourable outcomes in comparison with their biostable coun-
terparts. For instance, development of a low profile biodegradable stent with high radial
strength for a predefined period that does not incur an excessive inflammatory response
from the body is a long-standing challenge [79, 88, 89].
Ductile alloys such as stainless steel 316L are predominantly used in BE stents that can
undergo plastic deformation during balloon inflation. In these structures, after deflation
of the balloon the residual plastic strain in the material enables the stent to retain its ex-
panded shape despite the initial elastic recoil. As a result the ideal material for these
stents is required to exhibit low yield stress, to enable the stent undergo expansion at
low pressures, and at the same time high elastic modulus, to reduce the elastic recoil of
stent under compressive forces from the vessel. Apparently, these two requirements are
contradictory for the majority of ductile metals.
Crimped BE stents are first mounted on a deflated balloon at the tip of a guide catheter.
Being delivered to the target lesion, the balloon is inflated by increasing the hydraulic
pressure inside with which the stent is also expanded, Figure 1.10 (a).
(a) (b)
Figure 1.10. Expansion of balloon and self-expandable stents. a) BE stent. These stents are pri-
marily made of plastically deformable alloys such as stainless steel 316L in a crimped
state, then mounted on an angioplasty balloon for expansion and deployment. Image
reproduced from [91], b) SE stent made of superelastic alloys that can undergo large de-
formations without reaching the plastic state. These stents are manufactured in the ex-
panded shape then crimped and constrained by a sheath. Upon retraction of the sheath
the stent recovers its expanded shape in response to body heat. Radiopaque markers are
to enhance visibility in fluoroscopic imaging. Image reproduced from [92].
Conversely, SE stents rely on high elasticity or the shape-memory effect of certain alloys.
These normally expanded stents are first crimped and constrained inside a sheath while
Guide Wire
Balloon
Catheter
Stent
Guide WireRadiopaque Marker
RestrainingSheath
Stent
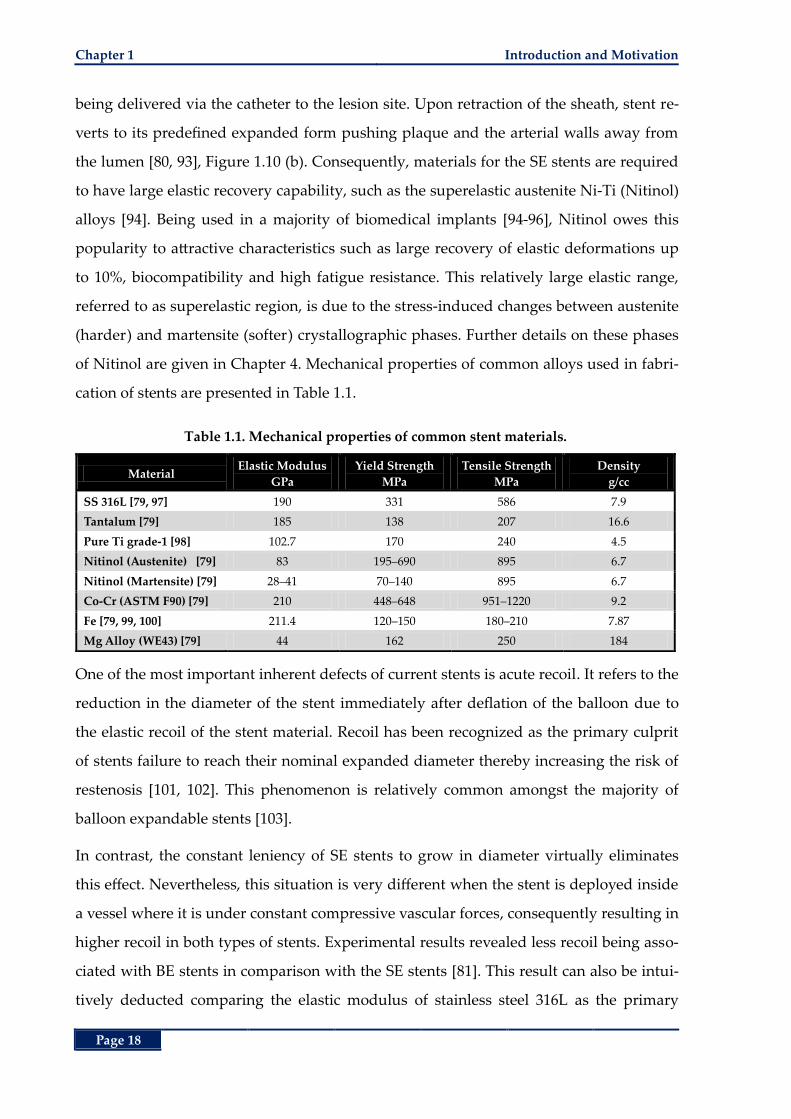
Chapter 1 Introduction and Motivation
Page 18
being delivered via the catheter to the lesion site. Upon retraction of the sheath, stent re-
verts to its predefined expanded form pushing plaque and the arterial walls away from
the lumen [80, 93], Figure 1.10 (b). Consequently, materials for the SE stents are required
to have large elastic recovery capability, such as the superelastic austenite Ni-Ti (Nitinol)
alloys [94]. Being used in a majority of biomedical implants [94-96], Nitinol owes this
popularity to attractive characteristics such as large recovery of elastic deformations up
to 10%, biocompatibility and high fatigue resistance. This relatively large elastic range,
referred to as superelastic region, is due to the stress-induced changes between austenite
(harder) and martensite (softer) crystallographic phases. Further details on these phases
of Nitinol are given in Chapter 4. Mechanical properties of common alloys used in fabri-
cation of stents are presented in Table 1.1.
Table 1.1. Mechanical properties of common stent materials.
Material Elastic Modulus
GPa
Yield Strength
MPa
Tensile Strength
MPa
Density
g/cc
SS 316L [79, 97] 190 331 586 7.9
Tantalum [79] 185 138 207 16.6
Pure Ti grade-1 [98] 102.7 170 240 4.5
Nitinol (Austenite) [79] 83 195‒690 895 6.7
Nitinol (Martensite) [79] 28‒41 70‒140 895 6.7
Co-Cr (ASTM F90) [79] 210 448‒648 951‒1220 9.2
Fe [79, 99, 100] 211.4 120‒150 180‒210 7.87
Mg Alloy (WE43) [79] 44 162 250 184
One of the most important inherent defects of current stents is acute recoil. It refers to the
reduction in the diameter of the stent immediately after deflation of the balloon due to
the elastic recoil of the stent material. Recoil has been recognized as the primary culprit
of stents failure to reach their nominal expanded diameter thereby increasing the risk of
restenosis [101, 102]. This phenomenon is relatively common amongst the majority of
balloon expandable stents [103].
In contrast, the constant leniency of SE stents to grow in diameter virtually eliminates
this effect. Nevertheless, this situation is very different when the stent is deployed inside
a vessel where it is under constant compressive vascular forces, consequently resulting in
higher recoil in both types of stents. Experimental results revealed less recoil being asso-
ciated with BE stents in comparison with the SE stents [81]. This result can also be intui-
tively deducted comparing the elastic modulus of stainless steel 316L as the primary
Stents Current Status and the Future Chapter 1
Page 19
material for BE stents and the austenite Nitinol that forms the majority of today’s SE
stents. This superiority in radial strength is one of the primary reasons that BE stents are
still the preferred modality for treatment of coronary and renal lesions [81]. Neverthe-
less, one of the strongest arguments in support of SE stents is their malleability rendering
them suitable for more tortuous paths. Moreover, their inherent self-expansion tendency
results in a low chronic outward force opposing the plaque and stenotic tissue in long-
term [77, 81, 94, 96, 104].
Considering the benefits and shortcomings of BE and SE stents, results from a large ran-
domized study including 1,096 patients with native coronary artery disease comparing
effectiveness of the aforementioned two types of stents revealed similar clinical and an-
giographic outcomes at 9 months. More particularly, in spite of the late luminal gain as a
result of the chronic outward force of the SE stents, this force also increased incidence of
neointimal hyperplasia likely due to the continued induced stress on the arterial walls
[104]. A further difficulty arises from accurate placement of SE stents as they tend to ad-
vance from the sheath during expansion, which makes them unsuitable for treating ostial
lesions or stenoses adjacent to side branches [80]. A number of rather comprehensive re-
views of stent materials and coatings are given in [79, 82, 105]. Table 1.2 presents an
overview of the common materials used in current biostable and biodegradable stent
fabrication technology outlining the advantages and disadvantages of each for better
comparison along with some examples [77, 79].
1.5.2 Material Form
The raw materials from which the stents are manufactured mainly come in tubes, wires
and flat sheets. Tubular BE stents are manufactured in a crimped or nearly crimped state
when cut, then expanded using the angioplasty balloon. On the other hand, the tubular
SE stents are manufactured in the expanded or slightly over-expanded state then
crimped and constrained by the catheter to be released in the lesion site [81]. Wire braid-
ed, or woven meshes that are mainly used for fabrication of SE stents, are commonly
used for non-vascular or peripheral artery disease applications including but not limited
to the cobalt alloy-based WallStent (Boston Scientific, Massachusetts, USA), and Nitinol
based CraggStent (MinTec, Bahamas) [96], Expander Stent (Medicorp, S. A., Villers les
Nancy, France) [106], Symphony and Ultraflex stents (Boston Scientific, Massachusetts,
Chapter 1 Introduction and Motivation
Page 20
USA) and ZA biliary stent (Cook Group Inc., Indiana, USA) [96]. Some examples of BE
wire stents are the stainless steel-based AVE: Bridge, S7, S660, S670 (Medtronic, Minne-
apolis, USA), the tantalum-based Strecker (Boston Scientific, Massachusetts, USA) and
platinum-iridium based AngioStent (Angio-Dynamics, NY, USA) [107]. Stents from pla-
nar sheet metals require an additional rolling step to form the planar shape into the
tubular stent structure. The two free ends of the sheet metal may be conjoined through
welding or mechanical locking, such as ZR1 (formerly Navius, San Diego, USA) and En-
doTex (Endotex Interventional Systems, CA, USA) stents [77, 108].
1.5.3 Fabrication Method
The raw material form greatly influences the fabrication method as well. Stents from
tubes are mainly manufacture by laser (Nd:YAG) cutting. Although this method offers
low profile kerf widths of less than 20 µm, it produces a heat-affected zone near the cut
regions. For better performance of the stent, these edges need to be removed via debur-
ring and passivation techniques. In order to reduce or eliminate the extension of heat-
affected zones other cutting methods such as waterjet and (micro electro-discharge ma-
chining) µEDM have also been adopted [77, 103, 109, 110]. The early slotted-tube Palmaz
stent is one of good examples of use of EDM in stent design.
On the other hand, wire-based stents can be formed through coiling, braiding or knitting.
One of the earliest, and most probably, simplest geometries of stents include coil stents.
The majority of currently marketed coil stents are made of SE Nitinol [77, 96] with very
few experimental BE models [111]. To increase radial and axial stiffness of wire stents,
multiple strands of wires may either be knitted or braided, which allows continuous
production of long stent tubes. Moreover, adjacent wires can be welded at different spots
to create closed-cell wire stents.
To increase batch processing of stents, photochemical etching techniques from very large
scale integrated (VLSI) circuit fabrication methodologies have also been utilized. Alt-
hough available for tubular structures, this method is deemed more beneficial in produc-
tion of planar sheet based stents. Planar sheet processing techniques such as
photochemical etching and 2D µEDM are most suited in mass production of micro struc-
tures despite the additional shaping (rolling) step involved [77, 109, 112].
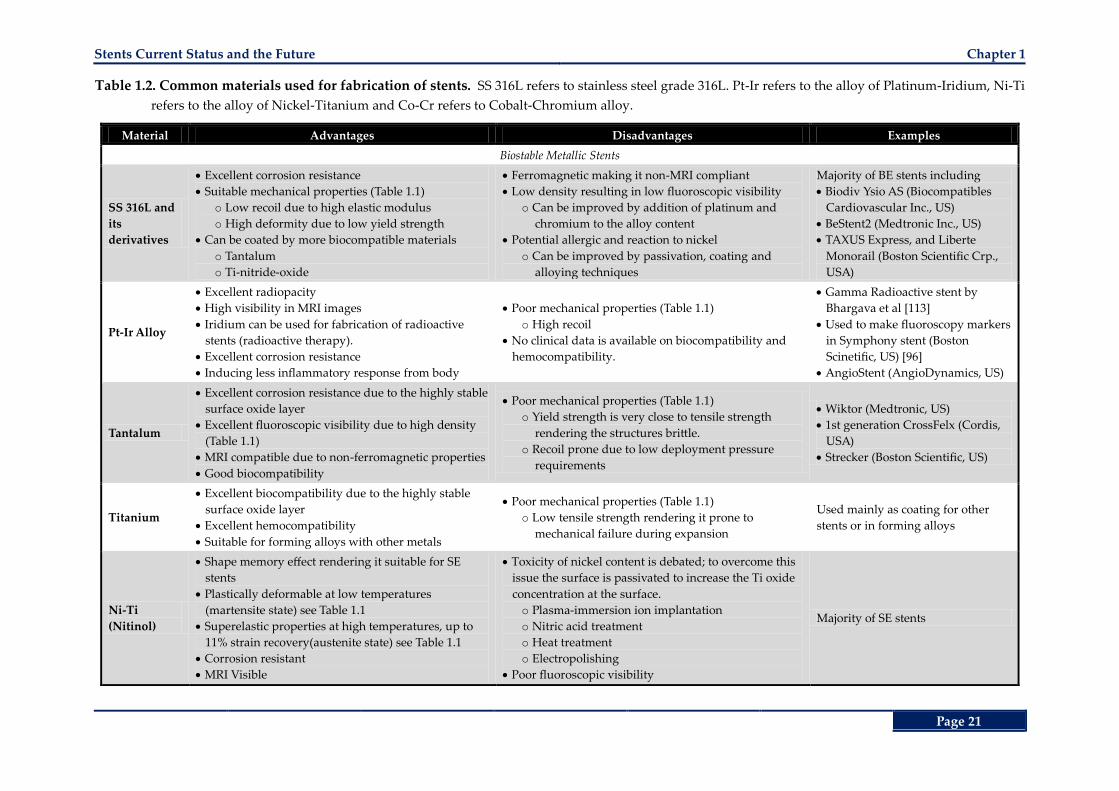
Stents Current Status and the Future Chapter 1
Page 21
Table 1.2. Common materials used for fabrication of stents. SS 316L refers to stainless steel grade 316L. Pt-Ir refers to the alloy of Platinum-Iridium, Ni-Ti
refers to the alloy of Nickel-Titanium and Co-Cr refers to Cobalt-Chromium alloy.
Material Advantages Disadvantages Examples
Biostable Metallic Stents
SS 316L and
its
derivatives
Excellent corrosion resistance
Suitable mechanical properties (Table 1.1)
o Low recoil due to high elastic modulus
o High deformity due to low yield strength
Can be coated by more biocompatible materials
o Tantalum
o Ti-nitride-oxide
Ferromagnetic making it non-MRI compliant
Low density resulting in low fluoroscopic visibility
o Can be improved by addition of platinum and
chromium to the alloy content
Potential allergic and reaction to nickel
o Can be improved by passivation, coating and
alloying techniques
Majority of BE stents including
Biodiv Ysio AS (Biocompatibles
Cardiovascular Inc., US)
BeStent2 (Medtronic Inc., US)
TAXUS Express, and Liberte
Monorail (Boston Scientific Crp.,
USA)
Pt-Ir Alloy
Excellent radiopacity
High visibility in MRI images
Iridium can be used for fabrication of radioactive
stents (radioactive therapy).
Excellent corrosion resistance
Inducing less inflammatory response from body
Poor mechanical properties (Table 1.1)
o High recoil
No clinical data is available on biocompatibility and
hemocompatibility.
Gamma Radioactive stent by
Bhargava et al [113]
Used to make fluoroscopy markers
in Symphony stent (Boston
Scinetific, US) [96]
AngioStent (AngioDynamics, US)
Tantalum
Excellent corrosion resistance due to the highly stable
surface oxide layer
Excellent fluoroscopic visibility due to high density
(Table 1.1)
MRI compatible due to non-ferromagnetic properties
Good biocompatibility
Poor mechanical properties (Table 1.1)
o Yield strength is very close to tensile strength
rendering the structures brittle.
o Recoil prone due to low deployment pressure
requirements
Wiktor (Medtronic, US)
1st generation CrossFelx (Cordis,
USA)
Strecker (Boston Scientific, US)
Titanium
Excellent biocompatibility due to the highly stable
surface oxide layer
Excellent hemocompatibility
Suitable for forming alloys with other metals
Poor mechanical properties (Table 1.1)
o Low tensile strength rendering it prone to
mechanical failure during expansion
Used mainly as coating for other
stents or in forming alloys
Ni-Ti
(Nitinol)
Shape memory effect rendering it suitable for SE
stents
Plastically deformable at low temperatures
(martensite state) see Table 1.1
Superelastic properties at high temperatures, up to
11% strain recovery(austenite state) see Table 1.1
Corrosion resistant
MRI Visible
Toxicity of nickel content is debated; to overcome this
issue the surface is passivated to increase the Ti oxide
concentration at the surface.
o Plasma-immersion ion implantation
o Nitric acid treatment
o Heat treatment
o Electropolishing
Poor fluoroscopic visibility
Majority of SE stents
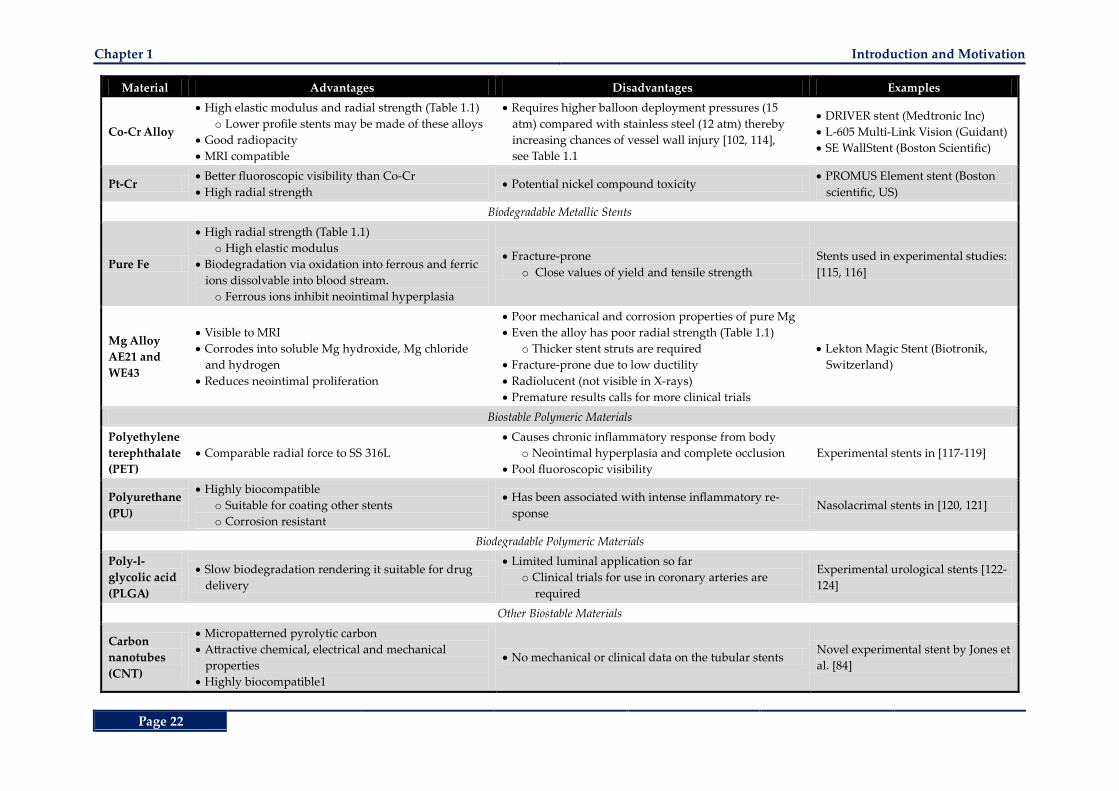
Chapter 1 Introduction and Motivation
Page 22
Material Advantages Disadvantages Examples
Co-Cr Alloy
High elastic modulus and radial strength (Table 1.1)
o Lower profile stents may be made of these alloys
Good radiopacity
MRI compatible
Requires higher balloon deployment pressures (15
atm) compared with stainless steel (12 atm) thereby
increasing chances of vessel wall injury [102, 114],
see Table 1.1
DRIVER stent (Medtronic Inc)
L-605 Multi-Link Vision (Guidant)
SE WallStent (Boston Scientific)
Pt-Cr Better fluoroscopic visibility than Co-Cr
High radial strength Potential nickel compound toxicity
PROMUS Element stent (Boston
scientific, US)
Biodegradable Metallic Stents
Pure Fe
High radial strength (Table 1.1)
o High elastic modulus
Biodegradation via oxidation into ferrous and ferric
ions dissolvable into blood stream.
o Ferrous ions inhibit neointimal hyperplasia
Fracture-prone
o Close values of yield and tensile strength
Stents used in experimental studies:
[115, 116]
Mg Alloy
AE21 and
WE43
Visible to MRI
Corrodes into soluble Mg hydroxide, Mg chloride
and hydrogen
Reduces neointimal proliferation
Poor mechanical and corrosion properties of pure Mg
Even the alloy has poor radial strength (Table 1.1)
o Thicker stent struts are required
Fracture-prone due to low ductility
Radiolucent (not visible in X-rays)
Premature results calls for more clinical trials
Lekton Magic Stent (Biotronik,
Switzerland)
Biostable Polymeric Materials
Polyethylene
terephthalate
(PET)
Comparable radial force to SS 316L
Causes chronic inflammatory response from body
o Neointimal hyperplasia and complete occlusion
Pool fluoroscopic visibility
Experimental stents in [117-119]
Polyurethane
(PU)
Highly biocompatible
o Suitable for coating other stents
o Corrosion resistant
Has been associated with intense inflammatory re-
sponse Nasolacrimal stents in [120, 121]
Biodegradable Polymeric Materials
Poly-l-
glycolic acid
(PLGA)
Slow biodegradation rendering it suitable for drug
delivery
Limited luminal application so far
o Clinical trials for use in coronary arteries are
required
Experimental urological stents [122-
124]
Other Biostable Materials
Carbon
nanotubes
(CNT)
Micropatterned pyrolytic carbon
Attractive chemical, electrical and mechanical
properties
Highly biocompatible1
No mechanical or clinical data on the tubular stents Novel experimental stent by Jones et
al. [84]
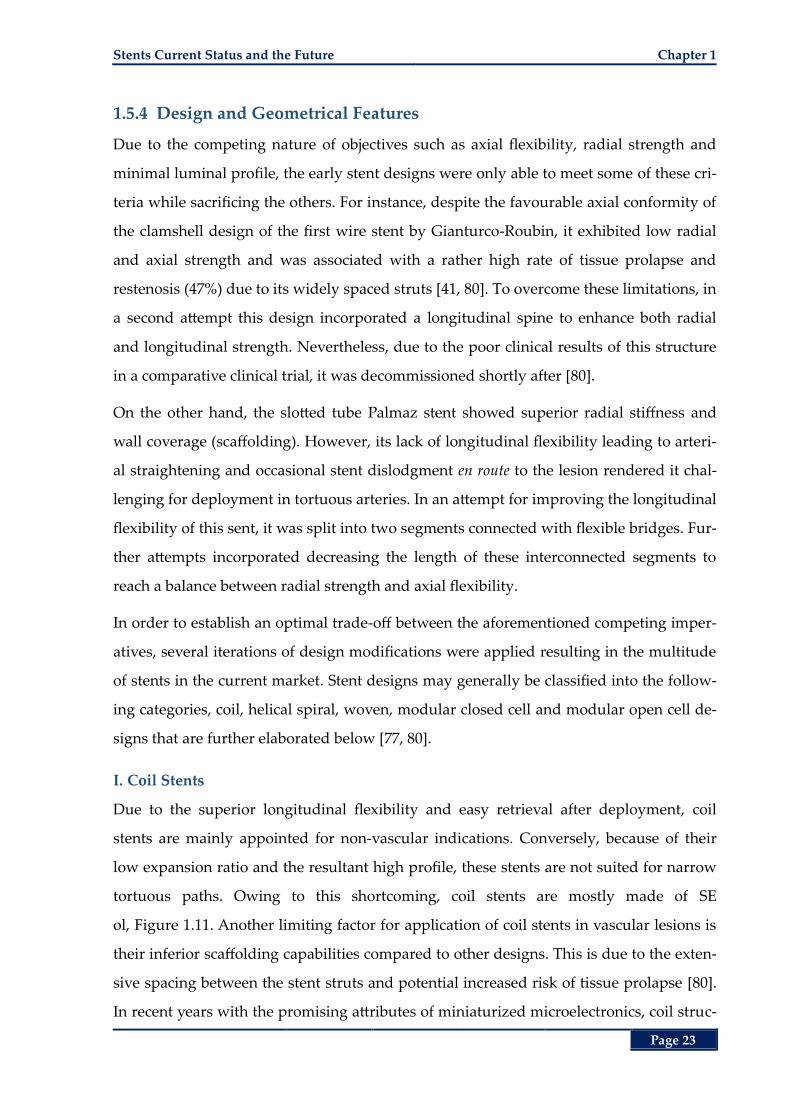
Stents Current Status and the Future Chapter 1
Page 23
1.5.4 Design and Geometrical Features
Due to the competing nature of objectives such as axial flexibility, radial strength and
minimal luminal profile, the early stent designs were only able to meet some of these cri-
teria while sacrificing the others. For instance, despite the favourable axial conformity of
the clamshell design of the first wire stent by Gianturco-Roubin, it exhibited low radial
and axial strength and was associated with a rather high rate of tissue prolapse and
restenosis (47%) due to its widely spaced struts [41, 80]. To overcome these limitations, in
a second attempt this design incorporated a longitudinal spine to enhance both radial
and longitudinal strength. Nevertheless, due to the poor clinical results of this structure
in a comparative clinical trial, it was decommissioned shortly after [80].
On the other hand, the slotted tube Palmaz stent showed superior radial stiffness and
wall coverage (scaffolding). However, its lack of longitudinal flexibility leading to arteri-
al straightening and occasional stent dislodgment en route to the lesion rendered it chal-
lenging for deployment in tortuous arteries. In an attempt for improving the longitudinal
flexibility of this sent, it was split into two segments connected with flexible bridges. Fur-
ther attempts incorporated decreasing the length of these interconnected segments to
reach a balance between radial strength and axial flexibility.
In order to establish an optimal trade-off between the aforementioned competing imper-
atives, several iterations of design modifications were applied resulting in the multitude
of stents in the current market. Stent designs may generally be classified into the follow-
ing categories, coil, helical spiral, woven, modular closed cell and modular open cell de-
signs that are further elaborated below [77, 80].
I. Coil Stents
Due to the superior longitudinal flexibility and easy retrieval after deployment, coil
stents are mainly appointed for non-vascular indications. Conversely, because of their
low expansion ratio and the resultant high profile, these stents are not suited for narrow
tortuous paths. Owing to this shortcoming, coil stents are mostly made of SE
ol, Figure 1.11. Another limiting factor for application of coil stents in vascular lesions is
their inferior scaffolding capabilities compared to other designs. This is due to the exten-
sive spacing between the stent struts and potential increased risk of tissue prolapse [80].
In recent years with the promising attributes of miniaturized microelectronics, coil struc-
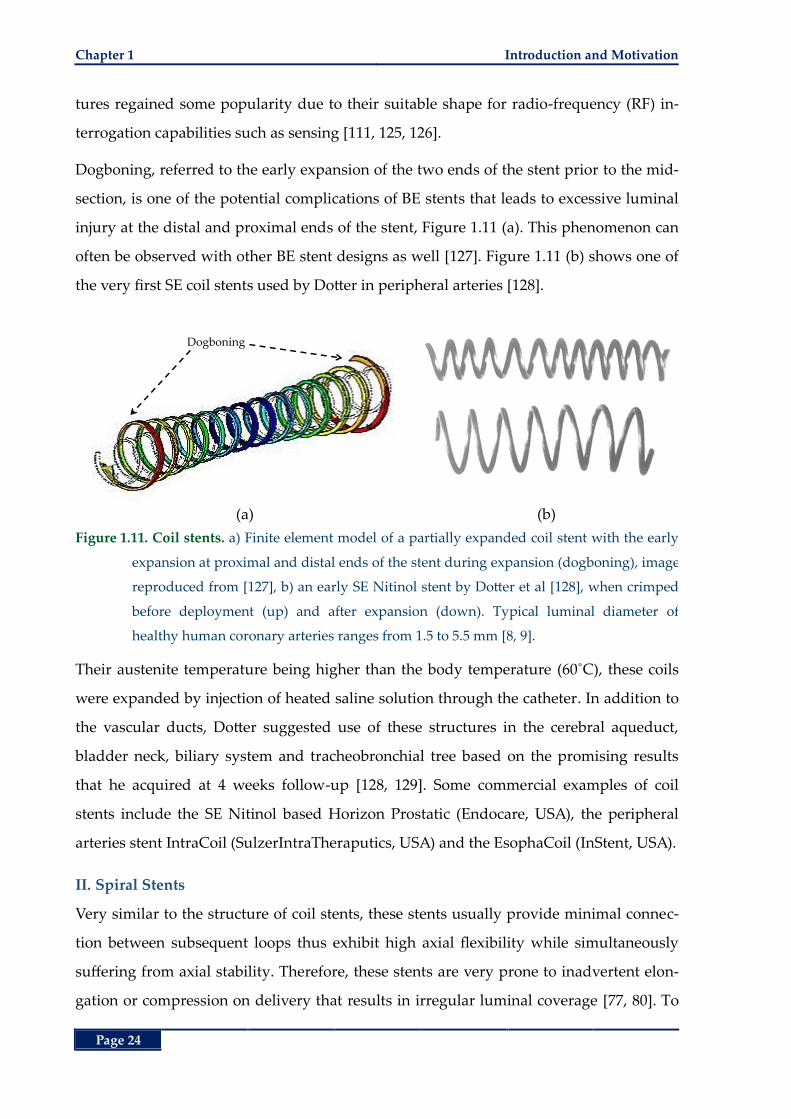
Chapter 1 Introduction and Motivation
Page 24
tures regained some popularity due to their suitable shape for radio-frequency (RF) in-
terrogation capabilities such as sensing [111, 125, 126].
Dogboning, referred to the early expansion of the two ends of the stent prior to the mid-
section, is one of the potential complications of BE stents that leads to excessive luminal
injury at the distal and proximal ends of the stent, Figure 1.11 (a). This phenomenon can
often be observed with other BE stent designs as well [127]. Figure 1.11 (b) shows one of
the very first SE coil stents used by Dotter in peripheral arteries [128].
(a) (b)
Figure 1.11. Coil stents. a) Finite element model of a partially expanded coil stent with the early
expansion at proximal and distal ends of the stent during expansion (dogboning), image
reproduced from [127], b) an early SE Nitinol stent by Dotter et al [128], when crimped
before deployment (up) and after expansion (down). Typical luminal diameter of
healthy human coronary arteries ranges from 1.5 to 5.5 mm [8, 9].
Their austenite temperature being higher than the body temperature (60˚C), these coils
were expanded by injection of heated saline solution through the catheter. In addition to
the vascular ducts, Dotter suggested use of these structures in the cerebral aqueduct,
bladder neck, biliary system and tracheobronchial tree based on the promising results
that he acquired at 4 weeks follow-up [128, 129]. Some commercial examples of coil
stents include the SE Nitinol based Horizon Prostatic (Endocare, USA), the peripheral
arteries stent IntraCoil (SulzerIntraTheraputics, USA) and the EsophaCoil (InStent, USA).
II. Spiral Stents
Very similar to the structure of coil stents, these stents usually provide minimal connec-
tion between subsequent loops thus exhibit high axial flexibility while simultaneously
suffering from axial stability. Therefore, these stents are very prone to inadvertent elon-
gation or compression on delivery that results in irregular luminal coverage [77, 80]. To
Dogboning
Stents Current Status and the Future Chapter 1
Page 25
enhance the longitudinal stiffness, a reasonable first attempt was to establish some con-
nection points between loops leading to loss of flexibility while gaining stability and con-
trol over cell size. Figure 1.12 (a) demonstrates a number of early SE spring spirals made
of steel that were used by Maass et al [130]. By application of torque to the ends of these
spirals, the number of coils increases as the diameters decrease and upon release they
spring back to the predefined expanded shape apposing against luminal walls. Due to
the limitation of crimping to the extent of yielding strength of these structures, thus the
resultant bulky crimped shape, these structures were implanted in larger vessels such as
aorta and vena cava [130]. Another BE stainless steel helical coil stent with no additional
inter-strut connections is demonstrated in Figure 1.12 (b).
(a) (b)
Figure 1.12. Spiral stents. a) Spiral spring stents used by Maass et. al in canine aortae and vena
cava [130], b) Crossflex, a helical spiral stent with minimal connections [77].
III. Woven Stents
Produced by inter-shaping of wires these stents may be manufactured using either braid-
ing or knitting. Foreshortening (reduction in longitudinal size) is most prominent in
these stents while providing excellent vessel coverage [12]. A removable SE braided stent
for treatment of bleeding oesophageal varices is shown Figure 1.13 (a). A knitted BE stent
made of tantalum wires is shown in Figure 1.13 (b).
IV. Modular (sequential) Stents
Accounting for the majority of today’s commercial stent designs, modular refers to any
of the designs that are composed of repeatable geometrical structures. These repeated
structures, referred to as Z-rings due to their shape, are most apparent in the slotted tube
stents such as the Palmaz stent where they are interconnected at their peak points as
demonstrated in Figure 1.14. Depending on the priority of radial strength vs. axial flexi-
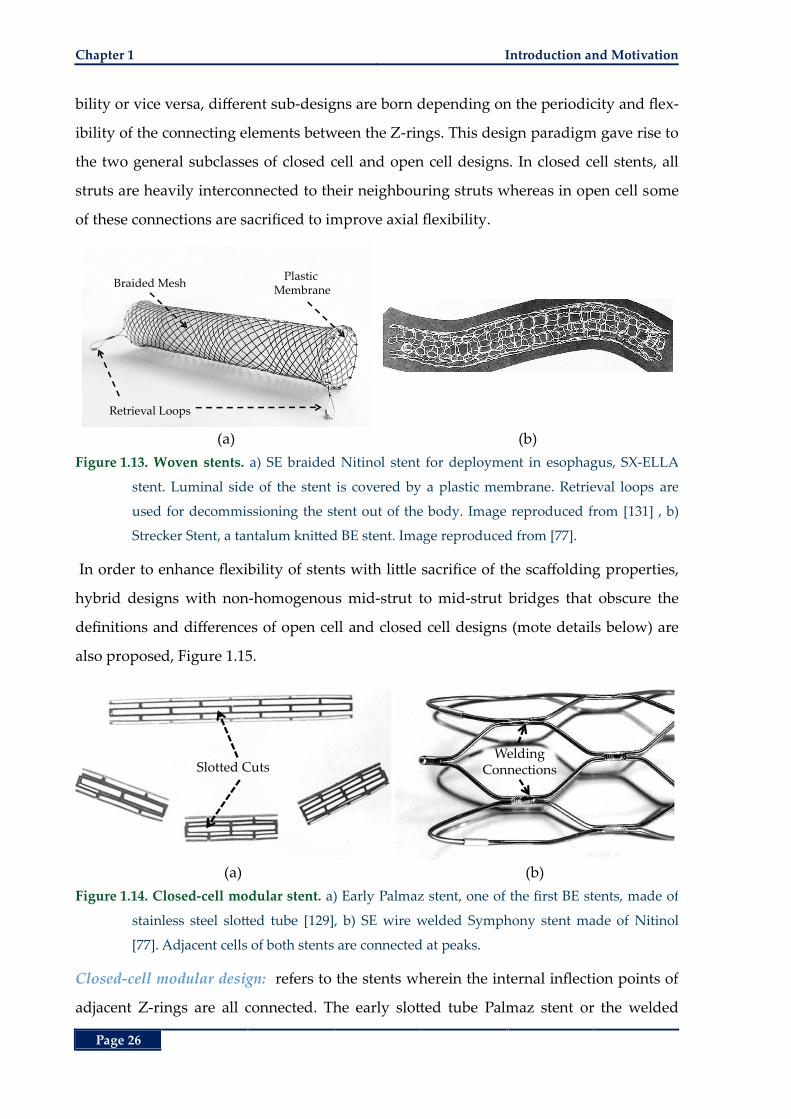
Chapter 1 Introduction and Motivation
Page 26
bility or vice versa, different sub-designs are born depending on the periodicity and flex-
ibility of the connecting elements between the Z-rings. This design paradigm gave rise to
the two general subclasses of closed cell and open cell designs. In closed cell stents, all
struts are heavily interconnected to their neighbouring struts whereas in open cell some
of these connections are sacrificed to improve axial flexibility.
(a) (b)
Figure 1.13. Woven stents. a) SE braided Nitinol stent for deployment in esophagus, SX-ELLA
stent. Luminal side of the stent is covered by a plastic membrane. Retrieval loops are
used for decommissioning the stent out of the body. Image reproduced from [131] , b)
Strecker Stent, a tantalum knitted BE stent. Image reproduced from [77].
In order to enhance flexibility of stents with little sacrifice of the scaffolding properties,
hybrid designs with non-homogenous mid-strut to mid-strut bridges that obscure the
definitions and differences of open cell and closed cell designs (mote details below) are
also proposed, Figure 1.15.
(a) (b)
Figure 1.14. Closed-cell modular stent. a) Early Palmaz stent, one of the first BE stents, made of
stainless steel slotted tube [129], b) SE wire welded Symphony stent made of Nitinol
[77]. Adjacent cells of both stents are connected at peaks.
Closed-cell modular design: refers to the stents wherein the internal inflection points of
adjacent Z-rings are all connected. The early slotted tube Palmaz stent or the welded
Retrieval Loops
Plastic Membrane
Braided Mesh
Slotted CutsWelding
Connections
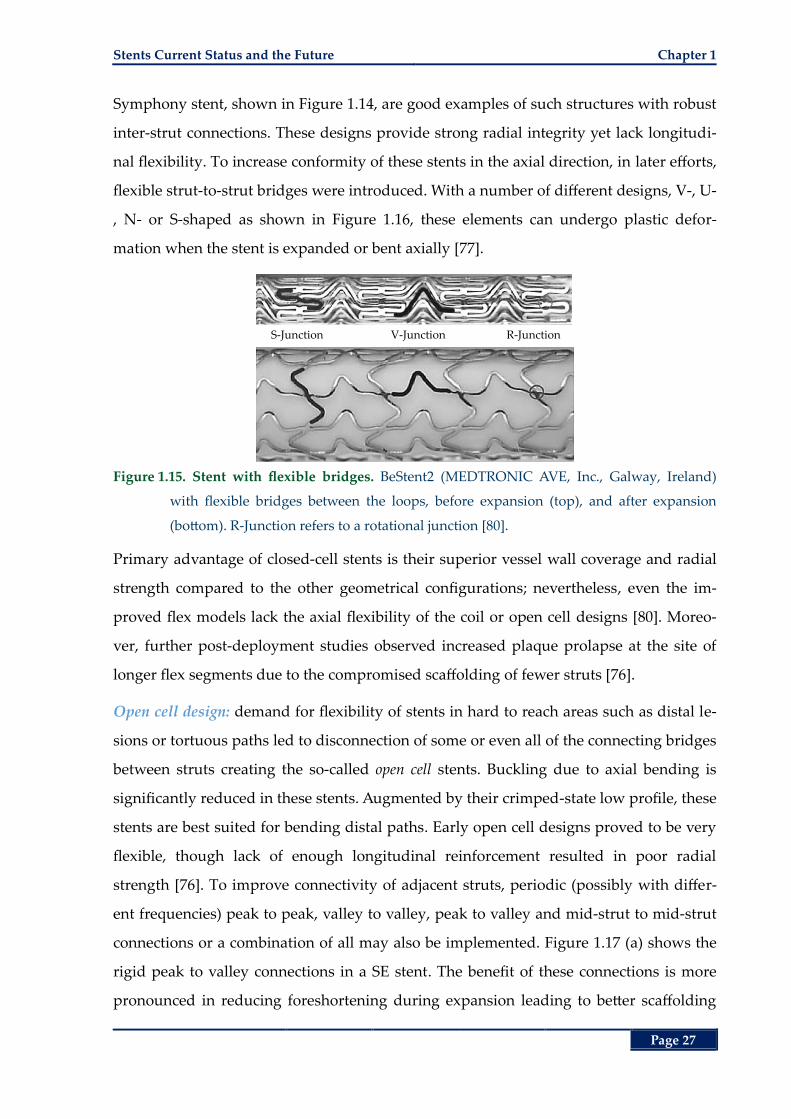
Stents Current Status and the Future Chapter 1
Page 27
Symphony stent, shown in Figure 1.14, are good examples of such structures with robust
inter-strut connections. These designs provide strong radial integrity yet lack longitudi-
nal flexibility. To increase conformity of these stents in the axial direction, in later efforts,
flexible strut-to-strut bridges were introduced. With a number of different designs, V-, U-
, N- or S-shaped as shown in Figure 1.16, these elements can undergo plastic defor-
mation when the stent is expanded or bent axially [77].
Figure 1.15. Stent with flexible bridges. BeStent2 (MEDTRONIC AVE, Inc., Galway, Ireland)
with flexible bridges between the loops, before expansion (top), and after expansion
(bottom). R-Junction refers to a rotational junction [80].
Primary advantage of closed-cell stents is their superior vessel wall coverage and radial
strength compared to the other geometrical configurations; nevertheless, even the im-
proved flex models lack the axial flexibility of the coil or open cell designs [80]. Moreo-
ver, further post-deployment studies observed increased plaque prolapse at the site of
longer flex segments due to the compromised scaffolding of fewer struts [76].
Open cell design: demand for flexibility of stents in hard to reach areas such as distal le-
sions or tortuous paths led to disconnection of some or even all of the connecting bridges
between struts creating the so-called open cell stents. Buckling due to axial bending is
significantly reduced in these stents. Augmented by their crimped-state low profile, these
stents are best suited for bending distal paths. Early open cell designs proved to be very
flexible, though lack of enough longitudinal reinforcement resulted in poor radial
strength [76]. To improve connectivity of adjacent struts, periodic (possibly with differ-
ent frequencies) peak to peak, valley to valley, peak to valley and mid-strut to mid-strut
connections or a combination of all may also be implemented. Figure 1.17 (a) shows the
rigid peak to valley connections in a SE stent. The benefit of these connections is more
pronounced in reducing foreshortening during expansion leading to better scaffolding
S-Junction V-Junction R-Junction
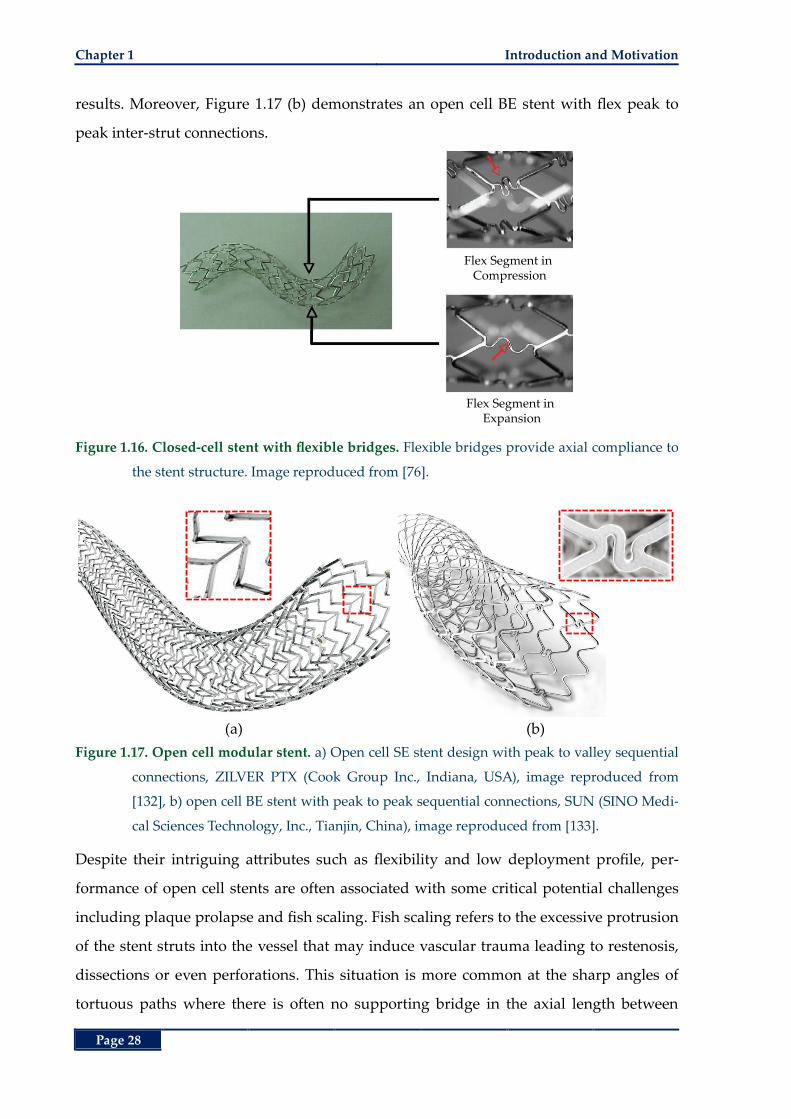
Chapter 1 Introduction and Motivation
Page 28
results. Moreover, Figure 1.17 (b) demonstrates an open cell BE stent with flex peak to
peak inter-strut connections.
Figure 1.16. Closed-cell stent with flexible bridges. Flexible bridges provide axial compliance to
the stent structure. Image reproduced from [76].
(a) (b)
Figure 1.17. Open cell modular stent. a) Open cell SE stent design with peak to valley sequential
connections, ZILVER PTX (Cook Group Inc., Indiana, USA), image reproduced from
[132], b) open cell BE stent with peak to peak sequential connections, SUN (SINO Medi-
cal Sciences Technology, Inc., Tianjin, China), image reproduced from [133].
Despite their intriguing attributes such as flexibility and low deployment profile, per-
formance of open cell stents are often associated with some critical potential challenges
including plaque prolapse and fish scaling. Fish scaling refers to the excessive protrusion
of the stent struts into the vessel that may induce vascular trauma leading to restenosis,
dissections or even perforations. This situation is more common at the sharp angles of
tortuous paths where there is often no supporting bridge in the axial length between
Flex Segment in Compression
Flex Segment in Expansion
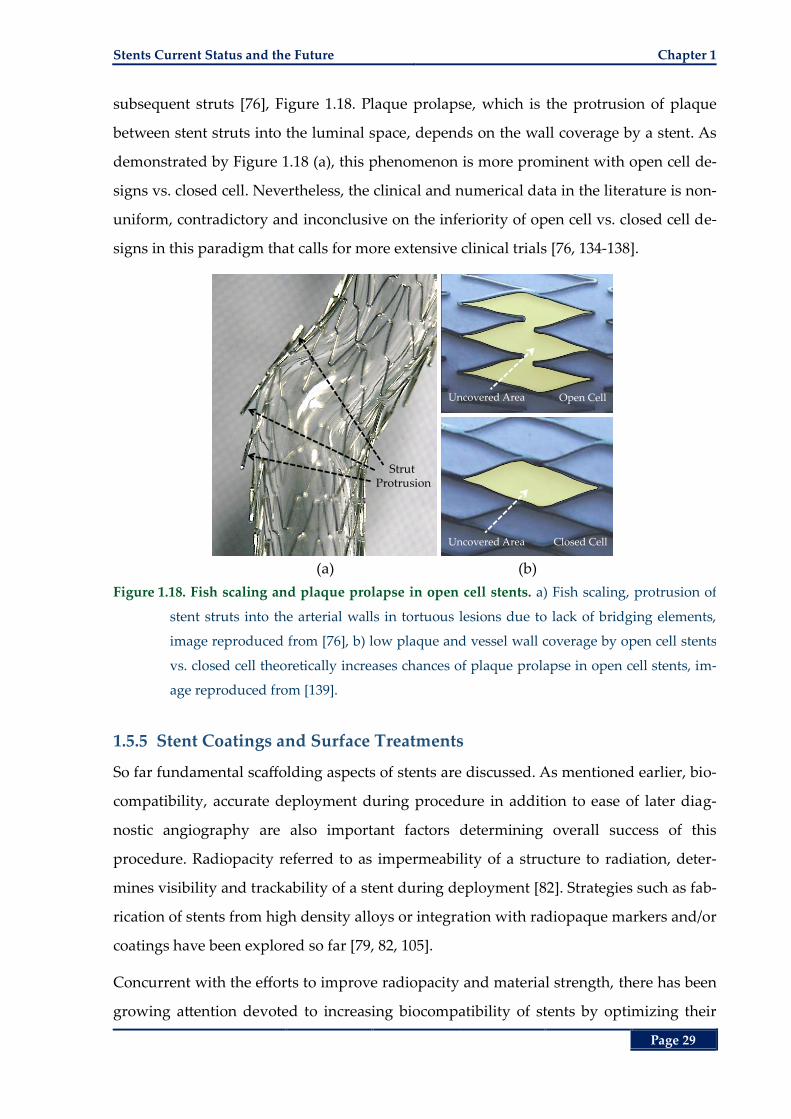
Stents Current Status and the Future Chapter 1
Page 29
subsequent struts [76], Figure 1.18. Plaque prolapse, which is the protrusion of plaque
between stent struts into the luminal space, depends on the wall coverage by a stent. As
demonstrated by Figure 1.18 (a), this phenomenon is more prominent with open cell de-
signs vs. closed cell. Nevertheless, the clinical and numerical data in the literature is non-
uniform, contradictory and inconclusive on the inferiority of open cell vs. closed cell de-
signs in this paradigm that calls for more extensive clinical trials [76, 134-138].
(a) (b)
Figure 1.18. Fish scaling and plaque prolapse in open cell stents. a) Fish scaling, protrusion of
stent struts into the arterial walls in tortuous lesions due to lack of bridging elements,
image reproduced from [76], b) low plaque and vessel wall coverage by open cell stents
vs. closed cell theoretically increases chances of plaque prolapse in open cell stents, im-
age reproduced from [139].
1.5.5 Stent Coatings and Surface Treatments
So far fundamental scaffolding aspects of stents are discussed. As mentioned earlier, bio-
compatibility, accurate deployment during procedure in addition to ease of later diag-
nostic angiography are also important factors determining overall success of this
procedure. Radiopacity referred to as impermeability of a structure to radiation, deter-
mines visibility and trackability of a stent during deployment [82]. Strategies such as fab-
rication of stents from high density alloys or integration with radiopaque markers and/or
coatings have been explored so far [79, 82, 105].
Concurrent with the efforts to improve radiopacity and material strength, there has been
growing attention devoted to increasing biocompatibility of stents by optimizing their
Strut Protrusion
Uncovered Area Open Cell
Uncovered Area Closed Cell
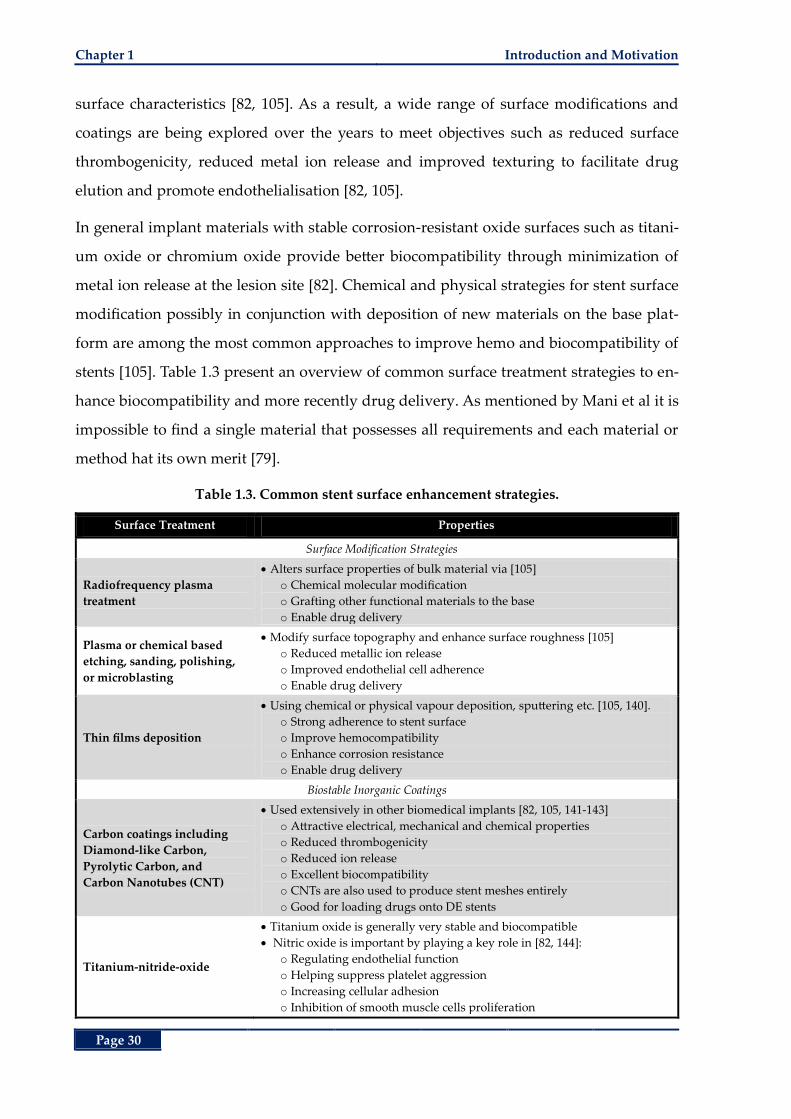
Chapter 1 Introduction and Motivation
Page 30
surface characteristics [82, 105]. As a result, a wide range of surface modifications and
coatings are being explored over the years to meet objectives such as reduced surface
thrombogenicity, reduced metal ion release and improved texturing to facilitate drug
elution and promote endothelialisation [82, 105].
In general implant materials with stable corrosion-resistant oxide surfaces such as titani-
um oxide or chromium oxide provide better biocompatibility through minimization of
metal ion release at the lesion site [82]. Chemical and physical strategies for stent surface
modification possibly in conjunction with deposition of new materials on the base plat-
form are among the most common approaches to improve hemo and biocompatibility of
stents [105]. Table 1.3 present an overview of common surface treatment strategies to en-
hance biocompatibility and more recently drug delivery. As mentioned by Mani et al it is
impossible to find a single material that possesses all requirements and each material or
method hat its own merit [79].
Table 1.3. Common stent surface enhancement strategies.
Surface Treatment Properties
Surface Modification Strategies
Radiofrequency plasma
treatment
Alters surface properties of bulk material via [105]
o Chemical molecular modification
o Grafting other functional materials to the base
o Enable drug delivery
Plasma or chemical based
etching, sanding, polishing,
or microblasting
Modify surface topography and enhance surface roughness [105]
o Reduced metallic ion release
o Improved endothelial cell adherence
o Enable drug delivery
Thin films deposition
Using chemical or physical vapour deposition, sputtering etc. [105, 140].
o Strong adherence to stent surface
o Improve hemocompatibility
o Enhance corrosion resistance
o Enable drug delivery
Biostable Inorganic Coatings
Carbon coatings including
Diamond-like Carbon,
Pyrolytic Carbon, and
Carbon Nanotubes (CNT)
Used extensively in other biomedical implants [82, 105, 141-143]
o Attractive electrical, mechanical and chemical properties
o Reduced thrombogenicity
o Reduced ion release
o Excellent biocompatibility
o CNTs are also used to produce stent meshes entirely
o Good for loading drugs onto DE stents
Titanium-nitride-oxide
Titanium oxide is generally very stable and biocompatible
Nitric oxide is important by playing a key role in [82, 144]:
o Regulating endothelial function
o Helping suppress platelet aggression
o Increasing cellular adhesion
o Inhibition of smooth muscle cells proliferation
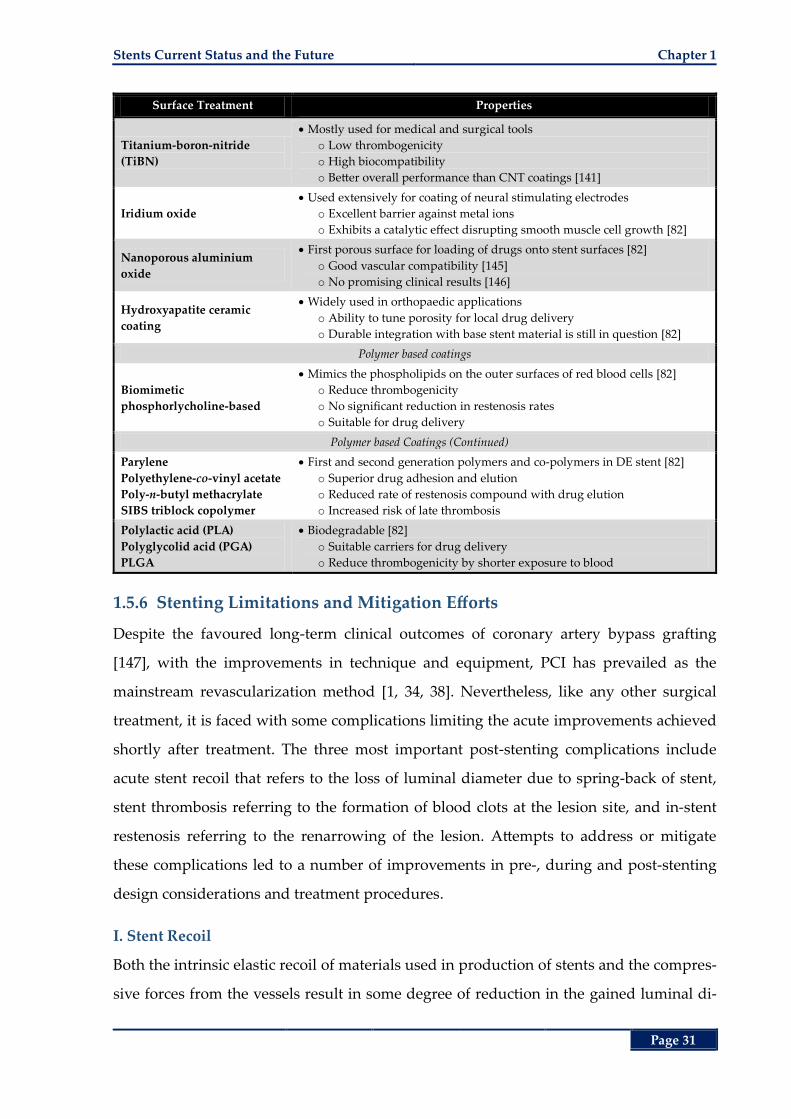
Stents Current Status and the Future Chapter 1
Page 31
Surface Treatment Properties
Titanium-boron-nitride
(TiBN)
Mostly used for medical and surgical tools
o Low thrombogenicity
o High biocompatibility
o Better overall performance than CNT coatings [141]
Iridium oxide
Used extensively for coating of neural stimulating electrodes
o Excellent barrier against metal ions
o Exhibits a catalytic effect disrupting smooth muscle cell growth [82]
Nanoporous aluminium
oxide
First porous surface for loading of drugs onto stent surfaces [82]
o Good vascular compatibility [145]
o No promising clinical results [146]
Hydroxyapatite ceramic
coating
Widely used in orthopaedic applications
o Ability to tune porosity for local drug delivery
o Durable integration with base stent material is still in question [82]
Polymer based coatings
Biomimetic
phosphorlycholine-based
Mimics the phospholipids on the outer surfaces of red blood cells [82]
o Reduce thrombogenicity
o No significant reduction in restenosis rates
o Suitable for drug delivery
Polymer based Coatings (Continued)
Parylene
Polyethylene-co-vinyl acetate
Poly-n-butyl methacrylate
SIBS triblock copolymer
First and second generation polymers and co-polymers in DE stent [82]
o Superior drug adhesion and elution
o Reduced rate of restenosis compound with drug elution
o Increased risk of late thrombosis
Polylactic acid (PLA)
Polyglycolid acid (PGA)
PLGA
Biodegradable [82]
o Suitable carriers for drug delivery
o Reduce thrombogenicity by shorter exposure to blood
1.5.6 Stenting Limitations and Mitigation Efforts
Despite the favoured long-term clinical outcomes of coronary artery bypass grafting
[147], with the improvements in technique and equipment, PCI has prevailed as the
mainstream revascularization method [1, 34, 38]. Nevertheless, like any other surgical
treatment, it is faced with some complications limiting the acute improvements achieved
shortly after treatment. The three most important post-stenting complications include
acute stent recoil that refers to the loss of luminal diameter due to spring-back of stent,
stent thrombosis referring to the formation of blood clots at the lesion site, and in-stent
restenosis referring to the renarrowing of the lesion. Attempts to address or mitigate
these complications led to a number of improvements in pre-, during and post-stenting
design considerations and treatment procedures.
I. Stent Recoil
Both the intrinsic elastic recoil of materials used in production of stents and the compres-
sive forces from the vessels result in some degree of reduction in the gained luminal di-
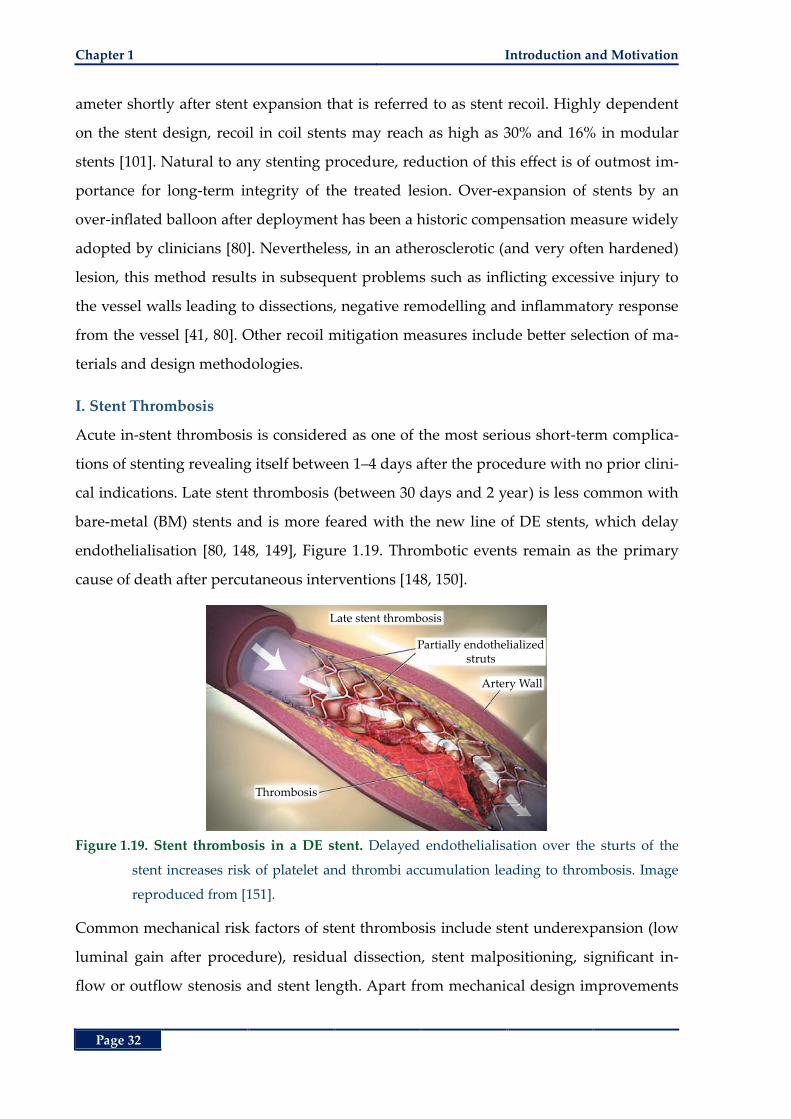
Chapter 1 Introduction and Motivation
Page 32
ameter shortly after stent expansion that is referred to as stent recoil. Highly dependent
on the stent design, recoil in coil stents may reach as high as 30% and 16% in modular
stents [101]. Natural to any stenting procedure, reduction of this effect is of outmost im-
portance for long-term integrity of the treated lesion. Over-expansion of stents by an
over-inflated balloon after deployment has been a historic compensation measure widely
adopted by clinicians [80]. Nevertheless, in an atherosclerotic (and very often hardened)
lesion, this method results in subsequent problems such as inflicting excessive injury to
the vessel walls leading to dissections, negative remodelling and inflammatory response
from the vessel [41, 80]. Other recoil mitigation measures include better selection of ma-
terials and design methodologies.
I. Stent Thrombosis
Acute in-stent thrombosis is considered as one of the most serious short-term complica-
tions of stenting revealing itself between 1‒4 days after the procedure with no prior clini-
cal indications. Late stent thrombosis (between 30 days and 2 year) is less common with
bare-metal (BM) stents and is more feared with the new line of DE stents, which delay
endothelialisation [80, 148, 149], Figure 1.19. Thrombotic events remain as the primary
cause of death after percutaneous interventions [148, 150].
Figure 1.19. Stent thrombosis in a DE stent. Delayed endothelialisation over the sturts of the
stent increases risk of platelet and thrombi accumulation leading to thrombosis. Image
reproduced from [151].
Common mechanical risk factors of stent thrombosis include stent underexpansion (low
luminal gain after procedure), residual dissection, stent malpositioning, significant in-
flow or outflow stenosis and stent length. Apart from mechanical design improvements
Late stent thrombosis
Partially endothelializedstruts
Thrombosis
Artery Wall
Stents Current Status and the Future Chapter 1
Page 33
to enhance luminal gain and scaffolding, adjunct chemical and pharma-cological ap-
proaches have also been adopted. One of the earliest, yet continuing, modalities is pre-
scription of antiplatelet and anticoagulant agents prior to and after deployment.
Another approach is coating of stents with inert materials to improve surface properties
resulting in less platelet adhesion and aggressive coagulation. The primary mission of
coatings was to increase biocompatibility and hemocompatibility of stents, yet later they
became a platform for local drug delivery to inhibit intimal proliferation [79]. Historical-
ly gold is accepted as a biocompatible alloy among clinicians and has been used for a
number of biomedical implants. Its use for increasing fluoroscopic visibility of stents has
also been endorsed for a long time. Nevertheless, large clinical trials show greater inci-
dence of neointimal hyperplasia in lesions treated with gold coated stents compared
with uncoated stents [80, 152, 153]. Some of the other clinically tested coatings to reduce
thrombogenicity and restenosis include carbon, silicon carbide and the antithrombotic
drug, heparin. Other metallic and polymeric compounds used for coatings are summa-
rized in Table 1.2. An intuitive approach towards mitigation of late thrombosis is utiliza-
tion of bioabsorbable/biodegradable stents. Such structures theoretically reduce risk of
thrombus formation after providing short-term scaffolding to the lesion site then disap-
pearing through corrosion or absorption. Nevertheless due to practical limitations such
as simultaneously providing enough scaffolding, having low profile and inducing low
inflammatory response from the body, development of these stents experienced a slug-
gish pace [86, 88, 89].
Early stent deployment results reported thrombosis incidents as high as 24% after 6
months. Nevertheless, improvements such as post-treatment antiplatelet regimens, better
stent design, better implantation techniques such as complimentary high-pressure ex-
pansions after initial deployment effort and better coatings reduced the rates to as low as
0.5‒2% [41, 154]. In case of occurrence and early detection, stent thrombosis can be treat-
ed with emergency balloon angioplasty or thrombectomy (removal of thrombi) joined
with pharmacological treatments.
II. Restenosis
Restenosis refers to the effect of a complex proliferative healing process of intimal layer
after deployment of stents that leads to the renarrowing of a treated lesion [102, 155] as
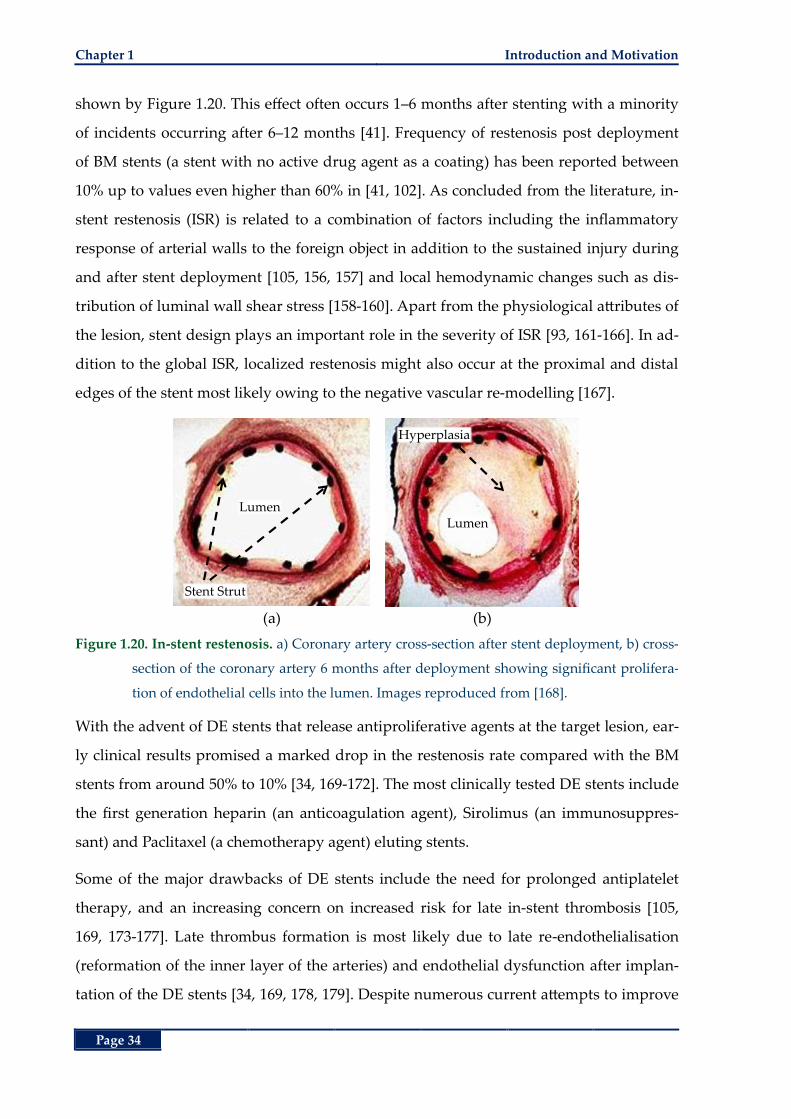
Chapter 1 Introduction and Motivation
Page 34
shown by Figure 1.20. This effect often occurs 1–6 months after stenting with a minority
of incidents occurring after 6–12 months [41]. Frequency of restenosis post deployment
of BM stents (a stent with no active drug agent as a coating) has been reported between
10% up to values even higher than 60% in [41, 102]. As concluded from the literature, in-
stent restenosis (ISR) is related to a combination of factors including the inflammatory
response of arterial walls to the foreign object in addition to the sustained injury during
and after stent deployment [105, 156, 157] and local hemodynamic changes such as dis-
tribution of luminal wall shear stress [158-160]. Apart from the physiological attributes of
the lesion, stent design plays an important role in the severity of ISR [93, 161-166]. In ad-
dition to the global ISR, localized restenosis might also occur at the proximal and distal
edges of the stent most likely owing to the negative vascular re-modelling [167].
(a) (b)
Figure 1.20. In-stent restenosis. a) Coronary artery cross-section after stent deployment, b) cross-
section of the coronary artery 6 months after deployment showing significant prolifera-
tion of endothelial cells into the lumen. Images reproduced from [168].
With the advent of DE stents that release antiproliferative agents at the target lesion, ear-
ly clinical results promised a marked drop in the restenosis rate compared with the BM
stents from around 50% to 10% [34, 169-172]. The most clinically tested DE stents include
the first generation heparin (an anticoagulation agent), Sirolimus (an immunosuppres-
sant) and Paclitaxel (a chemotherapy agent) eluting stents.
Some of the major drawbacks of DE stents include the need for prolonged antiplatelet
therapy, and an increasing concern on increased risk for late in-stent thrombosis [105,
169, 173-177]. Late thrombus formation is most likely due to late re-endothelialisation
(reformation of the inner layer of the arteries) and endothelial dysfunction after implan-
tation of the DE stents [34, 169, 178, 179]. Despite numerous current attempts to improve
Lumen
Stent Strut
Hyperplasia
Lumen
Chapter Summary Chapter 1
Page 35
drugs, stent coatings and treatments to lower acute and late thrombosis [105, 180], one
should note that utilization of DE stents does not eliminate the inflicted mechanical inju-
ry during percutaneous interventions.
In a randomized trial with 2313 patients requiring stenting in large coronary arteries (≥3
mm in diameter), Kaiser et al. [181] compared use of two DE stents, sirolimus-eluting
and everolimus-eluting, vs. bare-metal stents. Their results indicated no significant
difference between the DE and bare-metal stents with respect to the primary comparison
factors including the number of combined deaths from cardiac causes and non-fatal my-
ocardial infarctions in a 2-year follow-up. According to Indermuhle [34], there has not
been an optimal and widely accepted treatment for in-stent restenosis yet. This applies
for both the BM and DE stents [34]; making clinicians resort to methods such as revascu-
larization of the lesion by a combination of angioplasty and stenting. The most recent
approach incorporates application of DE balloons that are coated with antiproliferative
substances [34].
1.6 Chapter Summary
Having remained as a significant cause of mortality, CVD annually takes lives of millions
of the young and the old. Atherosclerosis as one of the most important precursors to
CVD is a complex process that presents itself with a deposition of plaque and fatty
streaks between the innermost and the middle layers of vessels gradually constricting or
even blocking blood flow. Reduced (or occluded) blood flow to downstream organs has
serious consequences mainly stemming from lack of oxygen supply. Apart from the
pharmacological interventions and healthy lifestyle mediations, clinicians have tried to
alleviate luminal occlusions using surgical methods such as bypass grafting, balloon an-
gioplasty, stenting and atherectomy. Balloon angioplasty tries to re-establish blood flow
by inflation of a balloon inside the lesion that consequently pushes the atherosclerotic
plaque away from the lumen thereby increasing its diameter on its way.
Despite the acute luminal gain shortly after inflation of the balloon, renarrowing of the
lumen is shown to be very prevalent. As a result, stents that are mechanical scaffolds that
provide a constant support against the internal walls of vessels came to the rescue. As of
today, the number of PCIs has surpassed any other interventional procedures for treat-
Chapter 1 Introduction and Motivation
Page 36
ment of occluded vessels including CABG. Proven clinical benefits such as shorter pro-
cedure time, faster recovery and long luminal patency after surgery added to the popu-
larity of this method over the more invasive methods such as CABG.
Since the introduction of first generation stents, they have undergone several improve-
ment iterations. Attempts to satisfy the often self-competing stenting objectives such as
high radial strength and low elastic recoil in addition to expandability, conformity, high
axial flexibility, trackability, biocompatibility and radiopacity all influenced stent design
and development giving rise to hundreds of stents on the current market. Apart from
their clinical use (deployment region), stents can generally be classified according to
their material, initial material form, fabrication method, geometrical design and some
final improvement steps such as coatings and capability for in-site drug release. Despite
the numerous attempts and the proven stent improvements over the years, stent recoil,
stent thrombosis (formation of blood clots) and restenosis remain the most important
post intervention complications that limit the outcomes of stenting procedure and its
primary objective to maintain a patent treated lesion in long-term.
One of the most important predictors of the aforementioned two complications is the
level of trauma induced to the vessel during deployment and the hemodynamic changes
to the blood flow after deployment. Elastic recoil of stents after deployment due to the
intrinsic properties of alloys often used in stent fabrication in addition to the compres-
sive forces from a vessel, accounts for both acute and chronic luminal loss after deploy-
ment. Mitigation measures such as over-expansion in BE stents and use of SE stents, so
far have proven to aggravate vascular trauma that leads to thrombosis and restenosis.
Pharmacological approaches such as systemic administration of blood-thinners or local-
ized drug release, such as DE stents, try to control these complications by inhibition of an
exaggerated inflammatory response from the body. Despite the promising results in re-
duction of restenosis after deployment of DE stents, increased rate of late thrombosis
raised concerns about long-term efficacy of these stents in comparison with BM ones.
Moreover, it is important to note that despite these approaches, the mechanical aspect of
the problem still stands that calls for a new design paradigm. This statement is further
supported by the significant amount of research in the literature emphasizing the role of
stent design in the overall performance of stents after deployment.
Thesis Overview Chapter 1
Page 37
1.7 Thesis Overview
To meet the often competing imperatives of stents mentioned above, a new design para-
digm is called for. To address this shortcoming from a design and engineering perspec-
tive, a new recoil resilient luminal support is proposed in this thesis with different
aspects of design, deployment procedure and hemodynamic implications as well as al-
ternative actuation methods elaborated in the subsequent chapters. A summary of the
thesis structure and contributions made are summarised in the next section.
1.7.1 Thesis Structure and Original Contributions
Key research components and contributions of this thesis are compiled into separate
chapters at each significant stage of the research. An overview of the thesis structure is
presented in Figure 1.21. Having recognized current stenting design gaps in control and
reduction of recoil in Chapter 1 and to address them, a novel luminal support is pro-
posed in Chapter 2. This device, referred to as a recoil resilient ring (RRR), is utilized
standalone or potentially integrated with existing stents to address the problem of recoil.
The proposed structure aims to minimize the need for high-pressure over-expansion that
can induce intra-luminal trauma and excess growth of vascular tissue causing later
restenosis. The RRR is an open ring with overlapping ends and asymmetrical sawtooth
structures from the two ends that are intermeshed. While radially expanded, these teeth
can slide on top of each other, but interlock step-by-step so to keep the final expanded
state against compressive forces that normally cause recoil. The RRRs thus deliver bal-
loon expandability and when integrated with a stent, they bring both radial rigidity and
longitudinal flexibility to the stent structure.
In Chapter 2, design and development of the RRR is first elaborated by extensive numer-
ical analysis, followed by fabrication and experimental studies. Compliance of the pro-
posed design with current balloon angioplasty expansion mechanics while maintaining
structural integrity is studied by finite element modelling (FEM) in an explicit dynamic
framework. Superior radial strength of the RRR in withstanding against compressive
forces and recovery of its initial shape after retraction of these forces in comparison to a
typical BE stent is demonstrated using FEM. The numerical analysis is then extended to
evaluate axial strength of RRR, following which improvement measures are proposed
and validated.
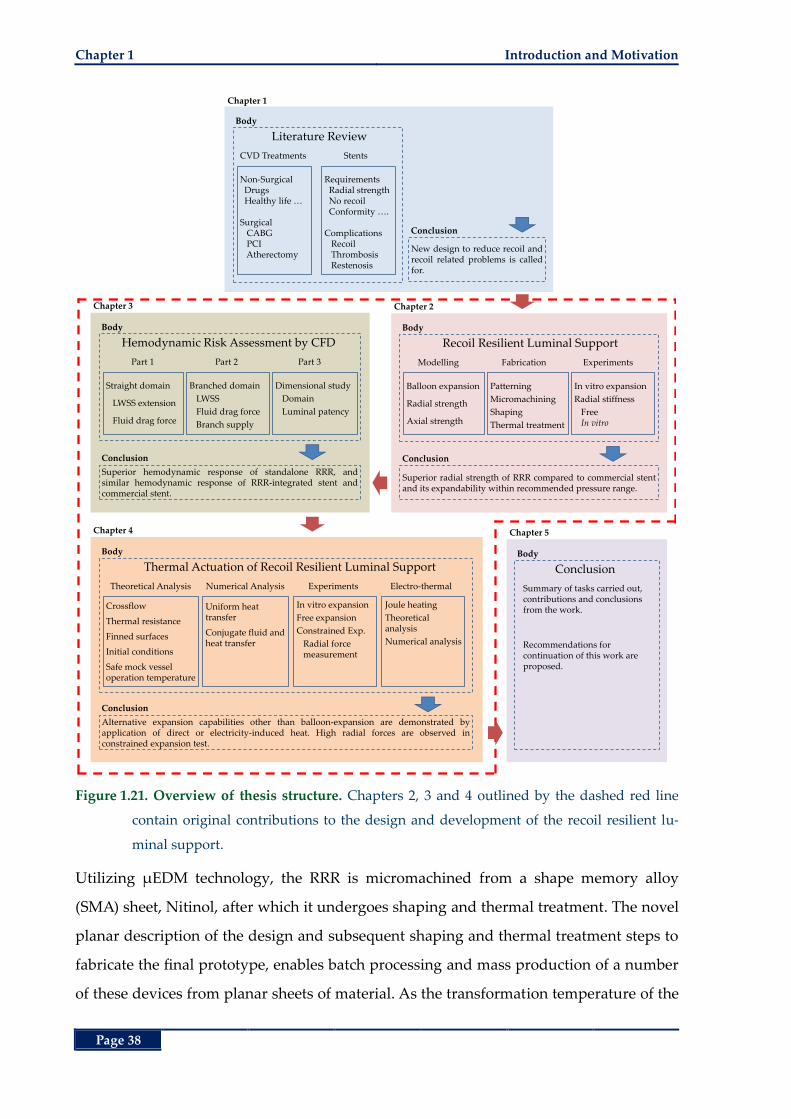
Chapter 1 Introduction and Motivation
Page 38
Figure 1.21. Overview of thesis structure. Chapters 2, 3 and 4 outlined by the dashed red line
contain original contributions to the design and development of the recoil resilient lu-
minal support.
Utilizing µEDM technology, the RRR is micromachined from a shape memory alloy
(SMA) sheet, Nitinol, after which it undergoes shaping and thermal treatment. The novel
planar description of the design and subsequent shaping and thermal treatment steps to
fabricate the final prototype, enables batch processing and mass production of a number
of these devices from planar sheets of material. As the transformation temperature of the
Literature Review
CVD Treatments
Non-SurgicalDrugsHealthy life …
SurgicalCABGPCIAtherectomy
Stents
RequirementsRadial strengthNo recoilConformity ….
ComplicationsRecoilThrombosisRestenosis
Body
New design to reduce recoil andrecoil related problems is calledfor.
Conclusion
Chapter 1
Recoil Resilient Luminal Support
Modelling
Balloon expansion
Radial strength
Axial strength
Fabrication
Patterning
Micromachining
Shaping
Thermal treatment
Body
Superior radial strength of RRR compared to commercial stentand its expandability within recommended pressure range.
Conclusion
Experiments
In vitro expansion
Radial stiffness
FreeIn vitro
Chapter 2
Hemodynamic Risk Assessment by CFD
Part 1
Straight domain
LWSS extension
Fluid drag force
Part 2
Branched domain
LWSS
Fluid drag force
Branch supply
Body
Superior hemodynamic response of standalone RRR, andsimilar hemodynamic response of RRR-integrated stent andcommercial stent.
Conclusion
Part 3
Dimensional study
Domain
Luminal patency
Chapter 3
Thermal Actuation of Recoil Resilient Luminal Support
Crossflow
Thermal resistance
Finned surfaces
Initial conditions
Safe mock vessel operation temperature
Theoretical Analysis Numerical Analysis
Uniform heat transfer
Conjugate fluid andheat transfer
Body
Alternative expansion capabilities other than balloon-expansion are demonstrated byapplication of direct or electricity-induced heat. High radial forces are observed inconstrained expansion test.
Conclusion
Experiments
In vitro expansion
Free expansion
Constrained Exp.
Radial forcemeasurement
Electro-thermal
Joule heating
Theoretical analysis
Numerical analysis
Chapter 4
Conclusion
Summary of tasks carried out, contributions and conclusions from the work.
Recommendations for continuation of this work are proposed.
Body
Chapter 5
Thesis Overview Chapter 1
Page 39
chosen Nitinol is considerably higher, around 80˚C, than the typical human body tem-
perature, the RRR normally operates in the martensite state of the material facilitating
conformity and easy expansion of the RRR by undergoing large plastic deformations.
Moreover, the superior radial strength of the RRR in comparison with a stainless steel
commercial stent, made of the considerably stiffer stainless steel 316L, lies in the pro-
posed interlock design numerically validated as outlined above.
These numerical results are complimented by in vitro expansion mechanics and radial
force measurements carried out in experimental studies, demonstrating expandability of
the RRR with balloon pressures well within the recommended in vivo range, and its sig-
nificantly higher radial strength compared to a commercial stainless steel stent.
Apart from the acute mechanical changes and effects such as luminal gain and vessel
wall injury, following their deployment, stents introduce changes to the fluid regime.
These effects can potentially result in abnormal biological effects such as restenosis. In
Chapter 3, rigorous computational fluid dynamic (CFD) models are utilized to study and
compare the effect of deployment of three different luminal supports that are subject to a
physiological pulsatile fluid flow. These supports include a nominal BE stent, a
standalone RRR and an RRR-integrated BE stent. Utilizing a transient analysis frame-
work, spatial and temporal distribution of wall shear stress as the primary indicator of
restenosis, fluid drag force and the outlet flow rate of the branching arteries were inves-
tigated. The results are compared with corresponding un-scaffolded healthy vessels with
uniform internal diameters. The fluidic response of a healthy vessel represents the refer-
ence behaviour of a vessel that may be used as a benchmark for hemodynamic compari-
son of luminal supports after deployment.
Superior hemodynamic performance of the standalone RRR in comparison with the oth-
er two is demonstrated by the transient and time-averaged results from these analyses.
Moreover, comparable, and in some cases even better, hemodynamic indicators of the
RRR-integrated stent compared to the standalone BE stent supports merit of the former
as an alternative to the later given the RRR’s superior radial strength. In the end, in a di-
mensional analysis study, sensitivity of the results to dimensional assumptions of the
fluid domains such as the main and side branch luminal diameters in addition to differ-
ent overlap lengths from the two ends of the RRR is studied. Results for this section can
Chapter 1 Introduction and Motivation
Page 40
provide other designers a predictive guideline for future hemodynamic analysis of
different supports and the effect of deployment domain assumptions on the final results.
The shape memory properties of Nitinol used for fabrication of the RRR, the RRR’s
thermally trained expanded shape, and its novel incremental interlock expansion mech-
anism may further be utilized to explore alternative methods of actuation. These meth-
ods may include application of direct or electrically-induced heat. Having a
transformation temperature, higher than the deployment region (body) temperature, it is
possible to transform the normally martensite RRR into austenite and exert high dilating
radial forces. In Chapter 4 these possibilities are explored through theoretical, numerical
and experimental studies. To study expansion of the RRR in response to heat stimuli in a
novel in vitro setup, and to ensure exposure of the mock vessel to a safe range of temper-
ature, first a novel theoretical framework based on the theory of thermal resistance and
crossflow over cylindrical structures is developed. Based on these models, necessary ini-
tial conditions (temperatures) required for thermal actuation of the RRR, and their ther-
modynamic implications are calculated. Validation of the results from the theoretical
analysis framework is carried out by a series of novel heat transfer and multi-field conju-
gate fluid and heat transfer numerical analyses. Good agreement of the theoretical and
numerical results demonstrates the validity of our approach for prediction of initial con-
ditions and their effect on the deployment domain.
Expansion of the RRR in response to heat stimuli is then experimentally studied, in a
novel in vitro setup complimented by observations from a free expansion study. Moreo-
ver, radial forces exerted by a constrained and partially crimped RRR while undergoing
martensite to austenite phase transformation in response to heat are experimentally
measured and presented. In the end, using the results from the first two parts, a novel
alternative actuation mechanism by application of electrical-currents is proposed and
examined through theoretical and numerical studies. In the final chapter, a summary of
the research carried out in this thesis is provided followed by further suggestions for
continuation of this work in the future.
The knowledge and contributions made in the current work, in addition to the design,
development, experimental and multi-field numerical results, provide a general engi-
neering framework applicable to future biomedical luminal supports.
Page 41
Chapter 2
Chapter 2. A Recoil Resilient Luminal Support
A Recoil Resilient Luminal Support
fter the introduction on stents given in Chapter 1, rec-
ognizing the pros and cons of each, current design
gaps from an engineering perspective are now identi-
fied. Elastic recoil and its subsequent complications account for a
majority of stent failures thus necessitating careful attention to
overcome this issue. Mechanical compensation measures such as
stent over-expansion and self-expandable (SE) stents in addition to
pharmacological approaches such as use of drug-eluting (DE)
stents have not been able to completely eradicate the source of this
problem so far.
Moreover, to meet the often competing stent objectives such as
high radial strength and flexibility a new design paradigm is
called for. As a result, in this chapter, a novel recoil resilient lu-
minal support is introduced. The development steps including de-
sign, fabrication, mechanical and numerical evaluations are
detailed in this chapter.
A
Chapter 2
Chapter 2 A Recoil Resilient Luminal Support
Page 42
2.1 Abstract
In Chapter 1, a comprehensive introduction is given on stents and their current variants
to this date. Stents are artificial implants that provide scaffolding to a cavity inside the
body. Improvements and drawbacks of each are also presented, in Chapter 1, to eluci-
date the requirements for current stenting procedure. In the present chapter, after a short
introduction, a new luminal device for reducing the mechanical failure of stents due to
recoil, which is one of the most important stenting complications, is introduced. This de-
vice, referred to as a recoil-resilient ring (RRR), is utilized standalone or potentially inte-
grated with existing stents to address the problem of recoil. The proposed structure aims
to minimize the need for high-pressure over-expansion that can potentially induce intra-
luminal trauma and excess growth of vascular tissue causing later restenosis. The RRR is
an open ring with overlapping ends and asymmetrical sawtooth structures from the two
ends that are intermeshed. While radially expanded, these teeth can slide on top of each
other, but interlock step-by-step so to keep the final expanded state against compres-
sional forces that normally cause recoil. The RRRs thus deliver balloon expandability and
high radial strength. Moreover, when integrated with a stent, they bring both radial ri-
gidity and longitudinal flexibility to the stent structure. The design of the RRR in this
chapter is first investigated through finite element analysis (FEA), next a prototype de-
vice is fabricated using micro electro-discharge machining of 200-µm Nitinol sheets. The
standalone RRR is balloon expandable in vitro by 5 to 7 atm in pressure, which is well
within the recommended in vivo pressure ranges for stenting procedures. FEA compres-
sion tests indicate a 13× reduction in the loss of luminal cross-sectional area (CSA) of the
RRR compared with a typical stainless steel stent under compressive forces. These re-
sults also show perfect elastic recovery of the RRR after removal the pressure compared
to the remaining plastic deformations of the stainless steel stent. On the other hand, ex-
perimental loading tests show that the fabricated RRR exhibits 2.8× greater radial stiff-
ness compared to a two-column section of a commercial stent while exhibiting
comparable elastic recovery. Furthermore, testing of in vitro expansion in a mock vessel
shows around 2.9% recoil, approximately 5‒11× smaller than the recoil reported for
commercial stents. These experimental results demonstrate the effectiveness of the de-
vice design for the targeted luminal support and stenting applications.
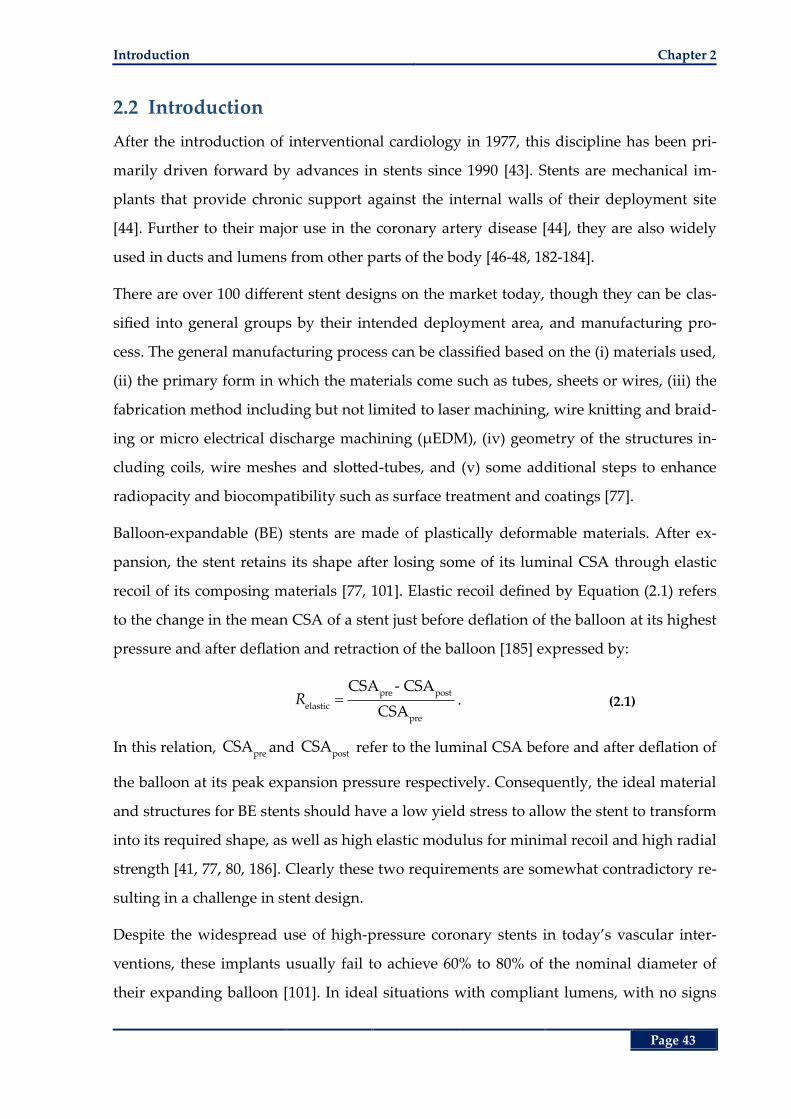
Introduction Chapter 2
Page 43
2.2 Introduction
After the introduction of interventional cardiology in 1977, this discipline has been pri-
marily driven forward by advances in stents since 1990 [43]. Stents are mechanical im-
plants that provide chronic support against the internal walls of their deployment site
[44]. Further to their major use in the coronary artery disease [44], they are also widely
used in ducts and lumens from other parts of the body [46-48, 182-184].
There are over 100 different stent designs on the market today, though they can be clas-
sified into general groups by their intended deployment area, and manufacturing pro-
cess. The general manufacturing process can be classified based on the (i) materials used,
(ii) the primary form in which the materials come such as tubes, sheets or wires, (iii) the
fabrication method including but not limited to laser machining, wire knitting and braid-
ing or micro electrical discharge machining (µEDM), (iv) geometry of the structures in-
cluding coils, wire meshes and slotted-tubes, and (v) some additional steps to enhance
radiopacity and biocompatibility such as surface treatment and coatings [77].
Balloon-expandable (BE) stents are made of plastically deformable materials. After ex-
pansion, the stent retains its shape after losing some of its luminal CSA through elastic
recoil of its composing materials [77, 101]. Elastic recoil defined by Equation (2.1) refers
to the change in the mean CSA of a stent just before deflation of the balloon at its highest
pressure and after deflation and retraction of the balloon [185] expressed by:
pre post
elastic
pre
CSA - CSA
CSAR . (2.1)
In this relation, preCSA and post
CSA refer to the luminal CSA before and after deflation of
the balloon at its peak expansion pressure respectively. Consequently, the ideal material
and structures for BE stents should have a low yield stress to allow the stent to transform
into its required shape, as well as high elastic modulus for minimal recoil and high radial
strength [41, 77, 80, 186]. Clearly these two requirements are somewhat contradictory re-
sulting in a challenge in stent design.
Despite the widespread use of high-pressure coronary stents in today’s vascular inter-
ventions, these implants usually fail to achieve 60% to 80% of the nominal diameter of
their expanding balloon [101]. In ideal situations with compliant lumens, with no signs
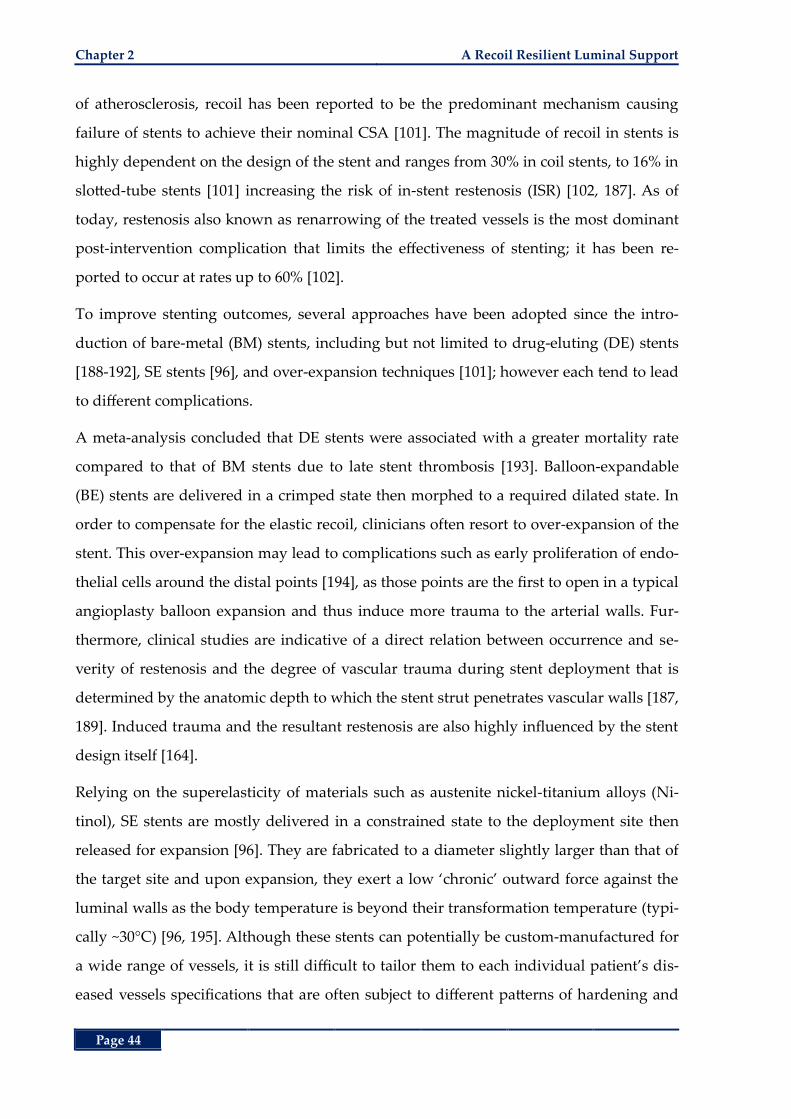
Chapter 2 A Recoil Resilient Luminal Support
Page 44
of atherosclerosis, recoil has been reported to be the predominant mechanism causing
failure of stents to achieve their nominal CSA [101]. The magnitude of recoil in stents is
highly dependent on the design of the stent and ranges from 30% in coil stents, to 16% in
slotted-tube stents [101] increasing the risk of in-stent restenosis (ISR) [102, 187]. As of
today, restenosis also known as renarrowing of the treated vessels is the most dominant
post-intervention complication that limits the effectiveness of stenting; it has been re-
ported to occur at rates up to 60% [102].
To improve stenting outcomes, several approaches have been adopted since the intro-
duction of bare-metal (BM) stents, including but not limited to drug-eluting (DE) stents
[188-192], SE stents [96], and over-expansion techniques [101]; however each tend to lead
to different complications.
A meta-analysis concluded that DE stents were associated with a greater mortality rate
compared to that of BM stents due to late stent thrombosis [193]. Balloon-expandable
(BE) stents are delivered in a crimped state then morphed to a required dilated state. In
order to compensate for the elastic recoil, clinicians often resort to over-expansion of the
stent. This over-expansion may lead to complications such as early proliferation of endo-
thelial cells around the distal points [194], as those points are the first to open in a typical
angioplasty balloon expansion and thus induce more trauma to the arterial walls. Fur-
thermore, clinical studies are indicative of a direct relation between occurrence and se-
verity of restenosis and the degree of vascular trauma during stent deployment that is
determined by the anatomic depth to which the stent strut penetrates vascular walls [187,
189]. Induced trauma and the resultant restenosis are also highly influenced by the stent
design itself [164].
Relying on the superelasticity of materials such as austenite nickel-titanium alloys (Ni-
tinol), SE stents are mostly delivered in a constrained state to the deployment site then
released for expansion [96]. They are fabricated to a diameter slightly larger than that of
the target site and upon expansion, they exert a low ‘chronic’ outward force against the
luminal walls as the body temperature is beyond their transformation temperature (typi-
cally ~30°C) [96, 195]. Although these stents can potentially be custom-manufactured for
a wide range of vessels, it is still difficult to tailor them to each individual patient’s dis-
eased vessels specifications that are often subject to different patterns of hardening and
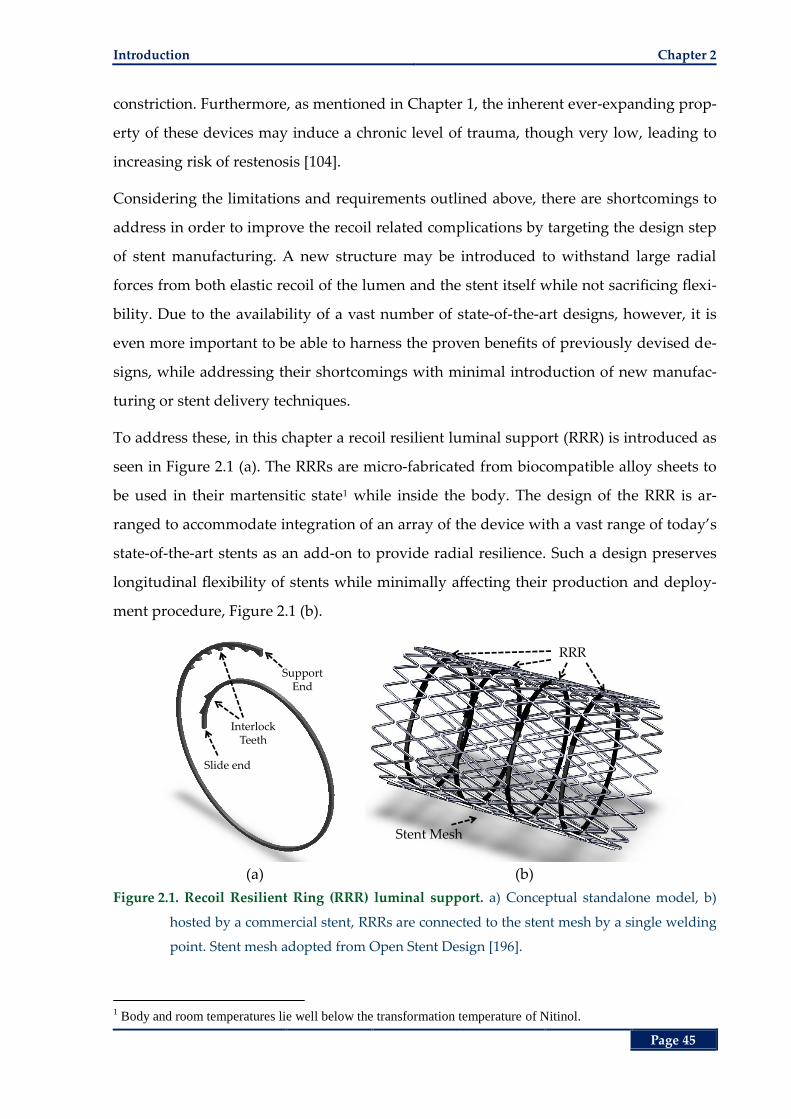
Introduction Chapter 2
Page 45
constriction. Furthermore, as mentioned in Chapter 1, the inherent ever-expanding prop-
erty of these devices may induce a chronic level of trauma, though very low, leading to
increasing risk of restenosis [104].
Considering the limitations and requirements outlined above, there are shortcomings to
address in order to improve the recoil related complications by targeting the design step
of stent manufacturing. A new structure may be introduced to withstand large radial
forces from both elastic recoil of the lumen and the stent itself while not sacrificing flexi-
bility. Due to the availability of a vast number of state-of-the-art designs, however, it is
even more important to be able to harness the proven benefits of previously devised de-
signs, while addressing their shortcomings with minimal introduction of new manufac-
turing or stent delivery techniques.
To address these, in this chapter a recoil resilient luminal support (RRR) is introduced as
seen in Figure 2.1 (a). The RRRs are micro-fabricated from biocompatible alloy sheets to
be used in their martensitic state1 while inside the body. The design of the RRR is ar-
ranged to accommodate integration of an array of the device with a vast range of today’s
state-of-the-art stents as an add-on to provide radial resilience. Such a design preserves
longitudinal flexibility of stents while minimally affecting their production and deploy-
ment procedure, Figure 2.1 (b).
(a) (b)
Figure 2.1. Recoil Resilient Ring (RRR) luminal support. a) Conceptual standalone model, b)
hosted by a commercial stent, RRRs are connected to the stent mesh by a single welding
point. Stent mesh adopted from Open Stent Design [196].
1 Body and room temperatures lie well below the transformation temperature of Nitinol.
Support End
Slide end
InterlockTeeth
Stent Mesh
RRR
Chapter 2 A Recoil Resilient Luminal Support
Page 46
In this study, the RRR devices are fabricated from Nitinol, a nickel-titanium shape-
memory alloy (SMA) that is widely adopted in today’s medical implants and devices [94,
95] including SE stents [96, 195]. In this work, Nitinol is used in its martensitic state to
accommodate low-stress plastic deformations thus expansion by a balloon. Though
widely used for SE stents, Nitinol alloy is also used in its martensitic form for construc-
tion of BE stents [77]. That is due to its high biocompatibility, corrosion resistance and
radiopacity [77, 79]. For a more comprehensive review of materials used in stent fabrica-
tion please refer to Chapter 1.
It is important to note that the choice of the material at this stage is not because of its
shape memory effect, but rather its in vivo benefits and flexibility in the martensitic state.
Moreover, this brings potential for other possible expansion methods such as application
of heat or electric current as well as remote actuation [197-199]. These possibilities are
discussed in more detail in Chapter 4.
Over the years, the demand towards production of non-traditional microstructures using
µEDM has increased [112, 200, 201]. This method is used to produce microparts with siz-
es ranging from a few micro meters to several 100’s µm. Being a thermal process, µEDM
is used to cut electrically conductive materials utilizing intense heat provided by high-
frequency pulses of miniaturized electrical discharge, enabling high precision and burr-
free micromachining in any metal or alloy [109, 112]. Moreover, the material biocompati-
bility of the machined pieces are not impaired by the µEDM thermal treatment [202].
Due to these benefits, µEDM has gained popularity in biocompatible micro-devices such
as stents [77, 110, 203]. In this work, we exploited these features of µEDM to fabricate the
proposed RRRs.
The rest of this chapter is organized as follows. The design and modelling of RRR is first
discussed where topics such as balloon expansion, radial and axial strength of the struc-
ture is evaluated. Following this section, the fabrication methodology, including shaping
and heat treatment stages are then elaborated. Next, the experimental results of the me-
chanical evaluation of the fabricated structure in comparison with a commercial stent are
given, followed by the chapter summary.
Design and Modelling Chapter 2
Page 47
2.3 Design and Modelling
The fabrication approach selected was µEDM of Nitinol sheets of 200 and 300-µm in
thickness, to produce a planar strip of the material that is to be shaped into the RRR. The
RRR is an open overlapped ring. The two overlapping ends have a number of asymmet-
rical sawtooth structures facilitating sliding on top of each other in one direction when
the RRR is opening. Upon compressive forces the teeth interlock so they keep the final
expanded state. The design challenges are to develop a layout describable in a planar
fashion to be patterned using Nitinol sheets and a standard µEDM process, and then
shape it according to the required description such that it resembles a ring for later
crimping and deployment in a vessel. It is also crucial to achieve various key mechanical
characteristics including high radial stiffness for recoil resilience and low-pressure ex-
pandability. These features eliminate the need for high-pressure balloon expansion or
over-expansions that are often employed to compensate for elastic recoil of BE stents.
Prior to any fabrication steps, structural FEA studies are conducted to investigate the
effect of balloon expansion on the structural integrity of the RRR. The effect of the pro-
posed structure on the hemodynamic risk indicators, such as distribution of low wall
shear stress as a predictors of later restenosis [204, 205], after deployment is extensively
studied in Chapter 3 utilizing rigorous computational fluid dynamics (CFD) analyses.
2.3.1 Free Expansion Analysis
As mentioned earlier, one of the first objectives of any luminal support is deliverability
and deployment capabilities. Deployment calls for expansion of a crimped stent into the
luminal site that is commonly performed by an external device such as an angioplasty
balloon. To study the mechanics and compliance of the proposed RRR with the current
angioplasty methodology, in this section a detailed numerical analysis is presented. In
this study a limited radial expansion of the RRR is investigated through structural analy-
sis simulations.
I. Materials and Methods
To simulate the expansion mechanics, the simplified design of the RRR with a short sec-
tion of an elastic tube representing the angioplasty balloon, as shown in Figure 2.2 is
studied in a free expansion model [206] disregarding the vessel wherein the RRR is ex-
panded as a stand-alone luminal support. The simulation is conducted by ANSYS finite
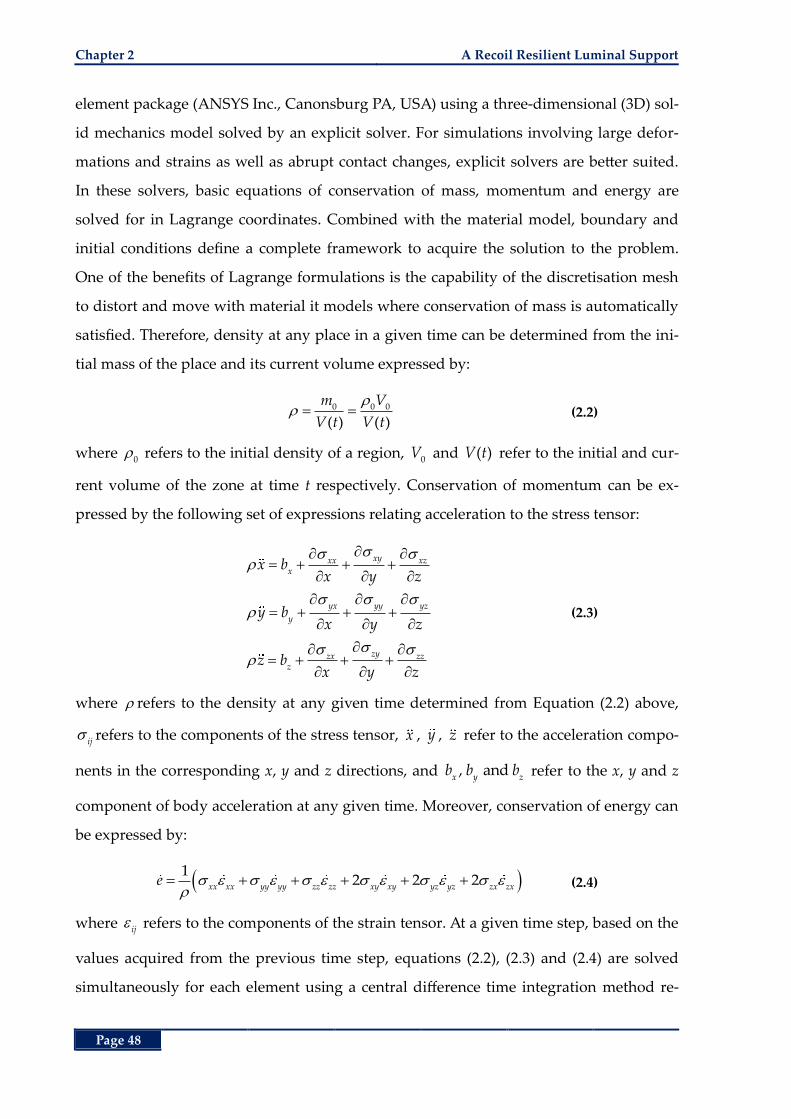
Chapter 2 A Recoil Resilient Luminal Support
Page 48
element package (ANSYS Inc., Canonsburg PA, USA) using a three-dimensional (3D) sol-
id mechanics model solved by an explicit solver. For simulations involving large defor-
mations and strains as well as abrupt contact changes, explicit solvers are better suited.
In these solvers, basic equations of conservation of mass, momentum and energy are
solved for in Lagrange coordinates. Combined with the material model, boundary and
initial conditions define a complete framework to acquire the solution to the problem.
One of the benefits of Lagrange formulations is the capability of the discretisation mesh
to distort and move with material it models where conservation of mass is automatically
satisfied. Therefore, density at any place in a given time can be determined from the ini-
tial mass of the place and its current volume expressed by:
0 0 0
( ) ( )
m V
V t V t (2.2)
where 0 refers to the initial density of a region, 0
V and ( )V t refer to the initial and cur-
rent volume of the zone at time t respectively. Conservation of momentum can be ex-
pressed by the following set of expressions relating acceleration to the stress tensor:
xyxx xzx
yx yy yz
y
zyzx zzz
x bx y z
y bx y z
z bx y z
(2.3)
where refers to the density at any given time determined from Equation (2.2) above,
ij refers to the components of the stress tensor, x , y , z refer to the acceleration compo-
nents in the corresponding x, y and z directions, and , and x y z
b b b refer to the x, y and z
component of body acceleration at any given time. Moreover, conservation of energy can
be expressed by:
1
2 2 2xx xx yy yy zz zz xy xy yz yz zx zx
e (2.4)
where ij refers to the components of the strain tensor. At a given time step, based on the
values acquired from the previous time step, equations (2.2), (2.3) and (2.4) are solved
simultaneously for each element using a central difference time integration method re-
Design and Modelling Chapter 2
Page 49
ferred to as the leapfrog method. Nodal forces that are determined from boundary con-
ditions, internal stress or contact are first computed. Next, acceleration for each node can
be derived from:
ii i
Fx b
m (2.5)
where the subscript i, refers to the three coordinate axes of x, y and z. In this relation m is
the mass of each node while F and b refer to the magnitude of force and body accelera-
tion. Having known the acceleration and velocity at earlier time steps, velocity and dis-
placements at later time intervals can be determined using the following estimation
expressions:
, 1/2 , 1/2 ,i n i n i n nx x x t (2.6)
, 1/2 , , 1/2 1/2i n i n i n n
x x x t . (2.7)
To develop the model, the ring and balloon assembly are first developed in SolidWorks
(SolidWorks Corp, Velizy, France) then imported into ANSYS. In order to decrease the
complexity of the model and for improved convergence using the explicit solver, only
two teeth of the ring are modelled in this study. The detailed geometrical characteristics
of the model assembly are presented in Figure 2.2. The width of the RRR in the Z direc-
tion is 200 µm (thickness of Nitinol sheet used for fabrication of RRR) whereas the bal-
loon width is 0.5 mm with a thickness of 50 µm. The balloon is deployed inside the RRR
so that it protrudes by 0.15 mm from the two lateral sides of the RRR that are parallel to
the X-Y plane.
For the simplified RRR, the material properties of Nitinol in the martensite state were
chosen from the Nitinol sheet manufacturer (Memry Corp., Germany) in a bilinear elas-
to-plastic material model summarized in Table 2.1 in comparison with stainless steel
316L that is commonly used for fabrication of BE stents [207, 208]. This table also pre-
sents the geometrical characteristics of the RRR model and a nominal BE stent [196]. The
von Mises yield criterion and bilinear isotropic hardening rules are adopted here.
Simulation of a realistic tri-folded angioplasty balloon calls for very high computational
power, while also causing convergence problems. This is due to the need for a very re-
fined mesh of the balloon and the introduction of self-contact in the balloon. To avoid
these complexities, without sacrificing the accuracy of the RRR deformation results, a
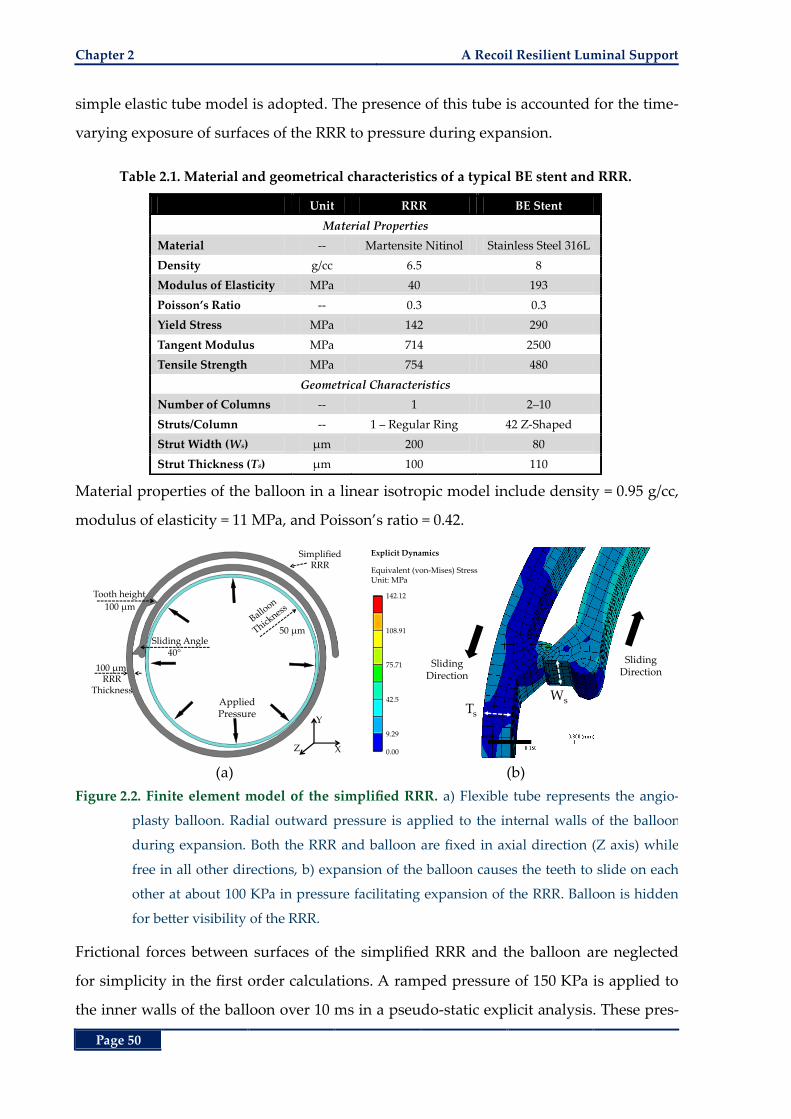
Chapter 2 A Recoil Resilient Luminal Support
Page 50
simple elastic tube model is adopted. The presence of this tube is accounted for the time-
varying exposure of surfaces of the RRR to pressure during expansion.
Table 2.1. Material and geometrical characteristics of a typical BE stent and RRR.
Unit RRR BE Stent
Material Properties
Material -- Martensite Nitinol Stainless Steel 316L
Density g/cc 6.5 8
Modulus of Elasticity MPa 40 193
Poisson’s Ratio -- 0.3 0.3
Yield Stress MPa 142 290
Tangent Modulus MPa 714 2500
Tensile Strength MPa 754 480
Geometrical Characteristics
Number of Columns -- 1 2‒10
Struts/Column -- 1 – Regular Ring 42 Z-Shaped
Strut Width (Ws) µm 200 80
Strut Thickness (Ts) µm 100 110
Material properties of the balloon in a linear isotropic model include density = 0.95 g/cc,
modulus of elasticity = 11 MPa, and Poisson’s ratio = 0.42.
(a) (b)
Figure 2.2. Finite element model of the simplified RRR. a) Flexible tube represents the angio-
plasty balloon. Radial outward pressure is applied to the internal walls of the balloon
during expansion. Both the RRR and balloon are fixed in axial direction (Z axis) while
free in all other directions, b) expansion of the balloon causes the teeth to slide on each
other at about 100 KPa in pressure facilitating expansion of the RRR. Balloon is hidden
for better visibility of the RRR.
Frictional forces between surfaces of the simplified RRR and the balloon are neglected
for simplicity in the first order calculations. A ramped pressure of 150 KPa is applied to
the inner walls of the balloon over 10 ms in a pseudo-static explicit analysis. These pres-
Applied Pressure
RRRThickness
100 µm
Tooth height
100 µm
50 µm
Simplified RRR
Sliding Angle40°
Y
XZ
WsTs
SlidingDirection
Explicit Dynamics
Equivalent (von-Mises) StressUnit: MPa
Sliding Direction
142.12
108.91
75.71
42.5
9.29
0.00
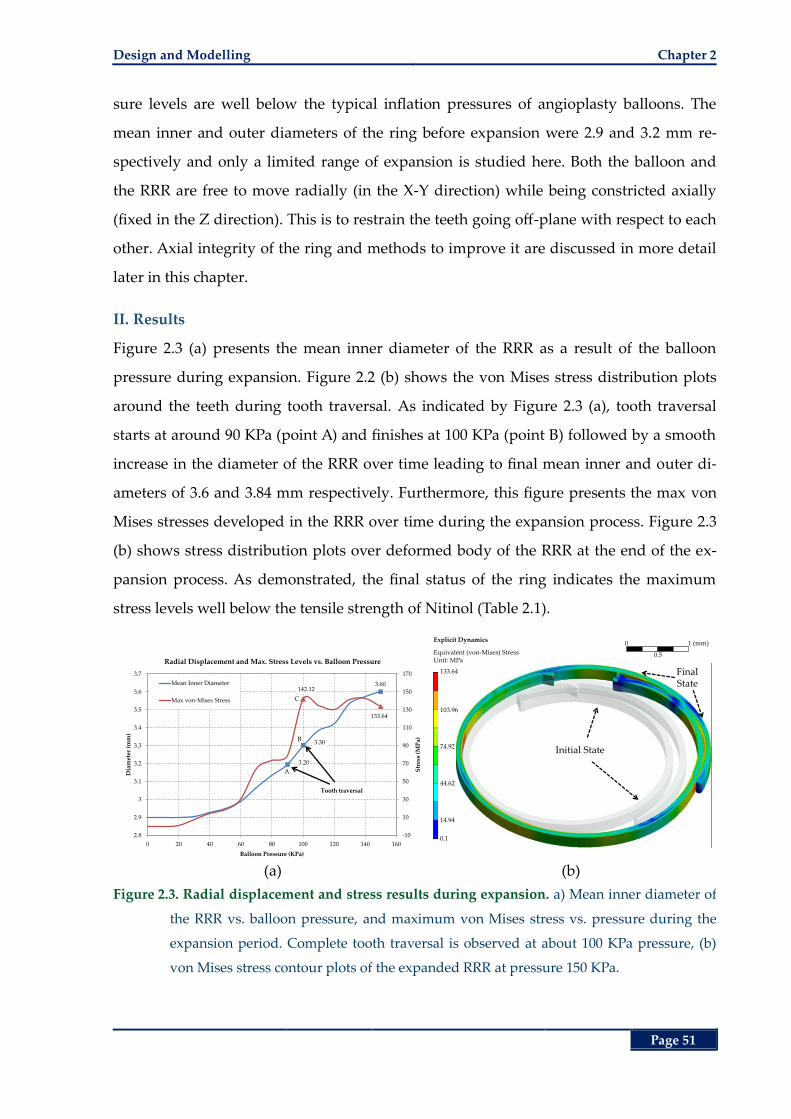
Design and Modelling Chapter 2
Page 51
sure levels are well below the typical inflation pressures of angioplasty balloons. The
mean inner and outer diameters of the ring before expansion were 2.9 and 3.2 mm re-
spectively and only a limited range of expansion is studied here. Both the balloon and
the RRR are free to move radially (in the X-Y direction) while being constricted axially
(fixed in the Z direction). This is to restrain the teeth going off-plane with respect to each
other. Axial integrity of the ring and methods to improve it are discussed in more detail
later in this chapter.
II. Results
Figure 2.3 (a) presents the mean inner diameter of the RRR as a result of the balloon
pressure during expansion. Figure 2.2 (b) shows the von Mises stress distribution plots
around the teeth during tooth traversal. As indicated by Figure 2.3 (a), tooth traversal
starts at around 90 KPa (point A) and finishes at 100 KPa (point B) followed by a smooth
increase in the diameter of the RRR over time leading to final mean inner and outer di-
ameters of 3.6 and 3.84 mm respectively. Furthermore, this figure presents the max von
Mises stresses developed in the RRR over time during the expansion process. Figure 2.3
(b) shows stress distribution plots over deformed body of the RRR at the end of the ex-
pansion process. As demonstrated, the final status of the ring indicates the maximum
stress levels well below the tensile strength of Nitinol (Table 2.1).
(a) (b)
Figure 2.3. Radial displacement and stress results during expansion. a) Mean inner diameter of
the RRR vs. balloon pressure, and maximum von Mises stress vs. pressure during the
expansion period. Complete tooth traversal is observed at about 100 KPa pressure, (b)
von Mises stress contour plots of the expanded RRR at pressure 150 KPa.
3.20
3.30
3.60142.12
133.64
-10
10
30
50
70
90
110
130
150
170
2.8
2.9
3
3.1
3.2
3.3
3.4
3.5
3.6
3.7
0 20 40 60 80 100 120 140 160
Str
ess
(MP
a)
Dia
met
er (
mm
)
Balloon Pressure (KPa)
Radial Displacement and Max. Stress Levels vs. Balloon Pressure
Mean Inner Diameter
Max von-Mises Stress
Tooth traversal
A
B
C
Explicit Dynamics
Equivalent (von-Mises) StressUnit: MPa
Initial State
Final State
0 1 (mm)
0.5
133.64
103.96
74.92
44.62
14.94
0.1
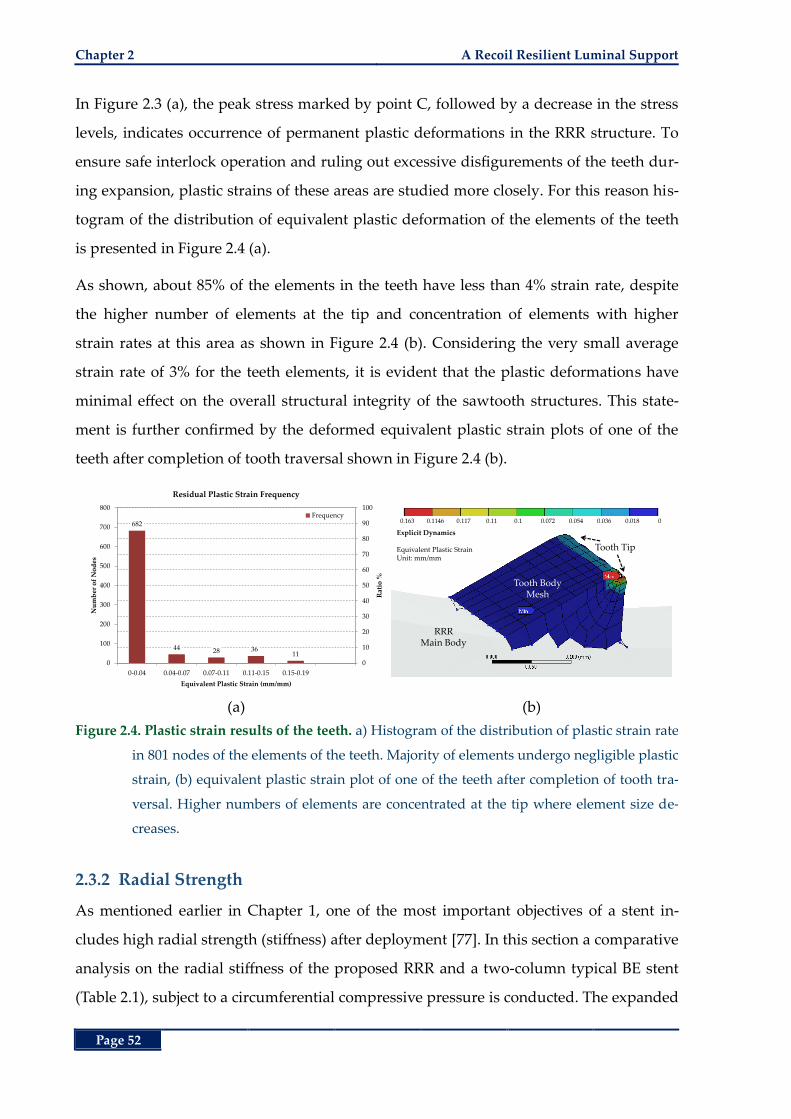
Chapter 2 A Recoil Resilient Luminal Support
Page 52
In Figure 2.3 (a), the peak stress marked by point C, followed by a decrease in the stress
levels, indicates occurrence of permanent plastic deformations in the RRR structure. To
ensure safe interlock operation and ruling out excessive disfigurements of the teeth dur-
ing expansion, plastic strains of these areas are studied more closely. For this reason his-
togram of the distribution of equivalent plastic deformation of the elements of the teeth
is presented in Figure 2.4 (a).
As shown, about 85% of the elements in the teeth have less than 4% strain rate, despite
the higher number of elements at the tip and concentration of elements with higher
strain rates at this area as shown in Figure 2.4 (b). Considering the very small average
strain rate of 3% for the teeth elements, it is evident that the plastic deformations have
minimal effect on the overall structural integrity of the sawtooth structures. This state-
ment is further confirmed by the deformed equivalent plastic strain plots of one of the
teeth after completion of tooth traversal shown in Figure 2.4 (b).
(a) (b)
Figure 2.4. Plastic strain results of the teeth. a) Histogram of the distribution of plastic strain rate
in 801 nodes of the elements of the teeth. Majority of elements undergo negligible plastic
strain, (b) equivalent plastic strain plot of one of the teeth after completion of tooth tra-
versal. Higher numbers of elements are concentrated at the tip where element size de-
creases.
2.3.2 Radial Strength
As mentioned earlier in Chapter 1, one of the most important objectives of a stent in-
cludes high radial strength (stiffness) after deployment [77]. In this section a comparative
analysis on the radial stiffness of the proposed RRR and a two-column typical BE stent
(Table 2.1), subject to a circumferential compressive pressure is conducted. The expanded
682
44 28 3611
0
10
20
30
40
50
60
70
80
90
100
0
100
200
300
400
500
600
700
800
0-0.04 0.04-0.07 0.07-0.11 0.11-0.15 0.15-0.19
Rat
io %
Nu
mb
er o
f N
od
es
Equivalent Plastic Strain (mm/mm)
Residual Plastic Strain Frequency
Frequency
RRR Main Body
Tooth Body Mesh
Tooth Tip
Explicit Dynamics
Equivalent Plastic StrainUnit: mm/mm
0.163 0.1146 0.117 0.11 0.1 0.072 0.054 0.036 0.018 0
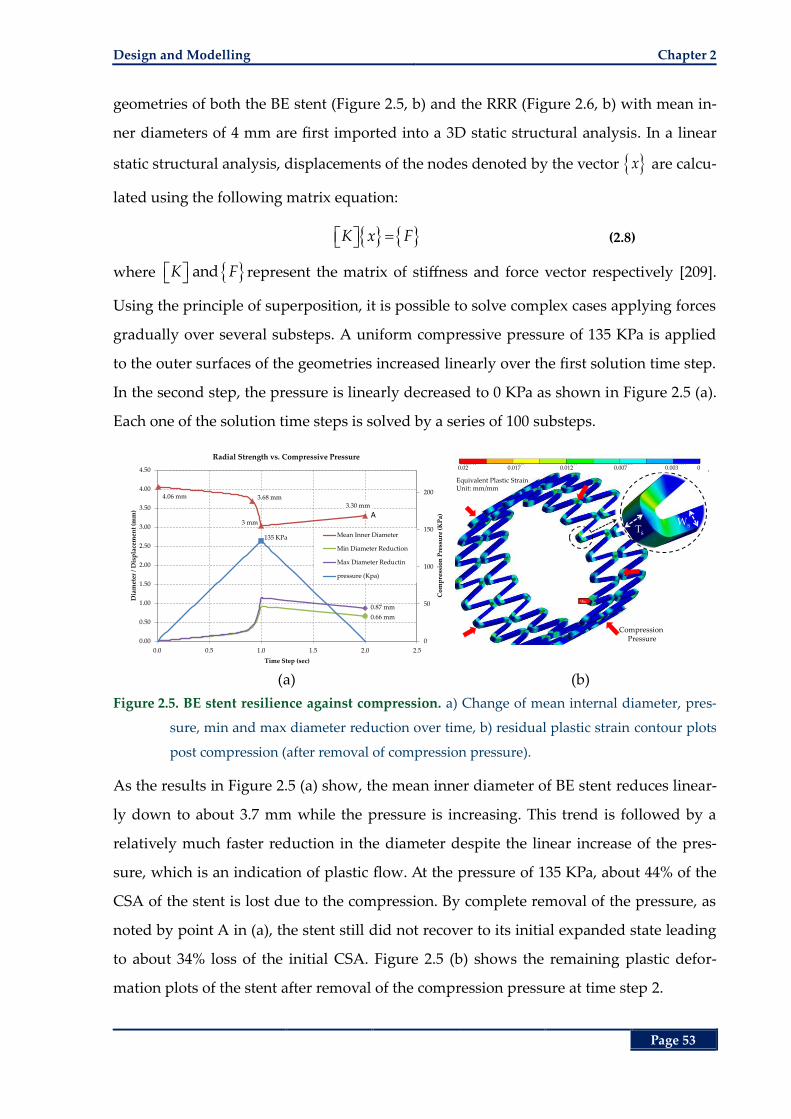
Design and Modelling Chapter 2
Page 53
geometries of both the BE stent (Figure 2.5, b) and the RRR (Figure 2.6, b) with mean in-
ner diameters of 4 mm are first imported into a 3D static structural analysis. In a linear
static structural analysis, displacements of the nodes denoted by the vector x are calcu-
lated using the following matrix equation:
K x F (2.8)
where andK F represent the matrix of stiffness and force vector respectively [209].
Using the principle of superposition, it is possible to solve complex cases applying forces
gradually over several substeps. A uniform compressive pressure of 135 KPa is applied
to the outer surfaces of the geometries increased linearly over the first solution time step.
In the second step, the pressure is linearly decreased to 0 KPa as shown in Figure 2.5 (a).
Each one of the solution time steps is solved by a series of 100 substeps.
(a) (b)
Figure 2.5. BE stent resilience against compression. a) Change of mean internal diameter, pres-
sure, min and max diameter reduction over time, b) residual plastic strain contour plots
post compression (after removal of compression pressure).
As the results in Figure 2.5 (a) show, the mean inner diameter of BE stent reduces linear-
ly down to about 3.7 mm while the pressure is increasing. This trend is followed by a
relatively much faster reduction in the diameter despite the linear increase of the pres-
sure, which is an indication of plastic flow. At the pressure of 135 KPa, about 44% of the
CSA of the stent is lost due to the compression. By complete removal of the pressure, as
noted by point A in (a), the stent still did not recover to its initial expanded state leading
to about 34% loss of the initial CSA. Figure 2.5 (b) shows the remaining plastic defor-
mation plots of the stent after removal of the compression pressure at time step 2.
4.06 mm 3.68 mm
3 mm
3.30 mm
0.66 mm
0.87 mm
135 KPa
0
50
100
150
200
0.00
0.50
1.00
1.50
2.00
2.50
3.00
3.50
4.00
4.50
0.0 0.5 1.0 1.5 2.0 2.5
Co
mp
ress
ion
Pre
ssu
re (
KP
a)
Dia
met
er /
Dis
pla
cem
ent
(mm
)
Time Step (sec)
Radial Strength vs. Compressive Pressure
Mean Inner Diameter
Min Diameter Reduction
Max Diameter Reductin
pressure (Kpa)
A
Ts
Ws
Compression Pressure
Equivalent Plastic StrainUnit: mm/mm
0.02 0.017 0.012 0.007 0.003 0
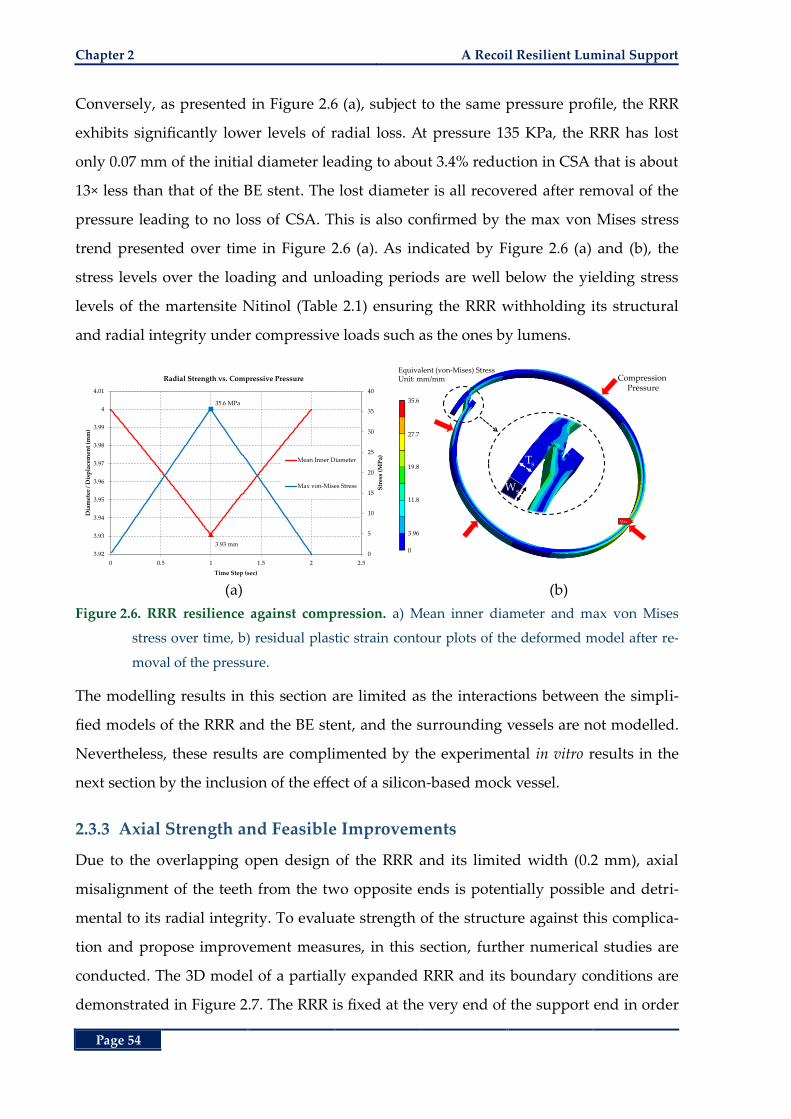
Chapter 2 A Recoil Resilient Luminal Support
Page 54
Conversely, as presented in Figure 2.6 (a), subject to the same pressure profile, the RRR
exhibits significantly lower levels of radial loss. At pressure 135 KPa, the RRR has lost
only 0.07 mm of the initial diameter leading to about 3.4% reduction in CSA that is about
13× less than that of the BE stent. The lost diameter is all recovered after removal of the
pressure leading to no loss of CSA. This is also confirmed by the max von Mises stress
trend presented over time in Figure 2.6 (a). As indicated by Figure 2.6 (a) and (b), the
stress levels over the loading and unloading periods are well below the yielding stress
levels of the martensite Nitinol (Table 2.1) ensuring the RRR withholding its structural
and radial integrity under compressive loads such as the ones by lumens.
(a) (b)
Figure 2.6. RRR resilience against compression. a) Mean inner diameter and max von Mises
stress over time, b) residual plastic strain contour plots of the deformed model after re-
moval of the pressure.
The modelling results in this section are limited as the interactions between the simpli-
fied models of the RRR and the BE stent, and the surrounding vessels are not modelled.
Nevertheless, these results are complimented by the experimental in vitro results in the
next section by the inclusion of the effect of a silicon-based mock vessel.
2.3.3 Axial Strength and Feasible Improvements
Due to the overlapping open design of the RRR and its limited width (0.2 mm), axial
misalignment of the teeth from the two opposite ends is potentially possible and detri-
mental to its radial integrity. To evaluate strength of the structure against this complica-
tion and propose improvement measures, in this section, further numerical studies are
conducted. The 3D model of a partially expanded RRR and its boundary conditions are
demonstrated in Figure 2.7. The RRR is fixed at the very end of the support end in order
3.93 mm
35.6 MPa
0
5
10
15
20
25
30
35
40
3.92
3.93
3.94
3.95
3.96
3.97
3.98
3.99
4
4.01
0 0.5 1 1.5 2 2.5
Str
ess
(MP
a)
Dia
met
er /
Dis
pla
cem
ent
(mm
)
Time Step (sec)
Radial Strength vs. Compressive Pressure
Mean Inner Diameter
Max von-Mises Stress Ws
Ts
Compression Pressure
Equivalent (von-Mises) StressUnit: mm/mm
35.6
27.7
19.8
11.8
3.96
0
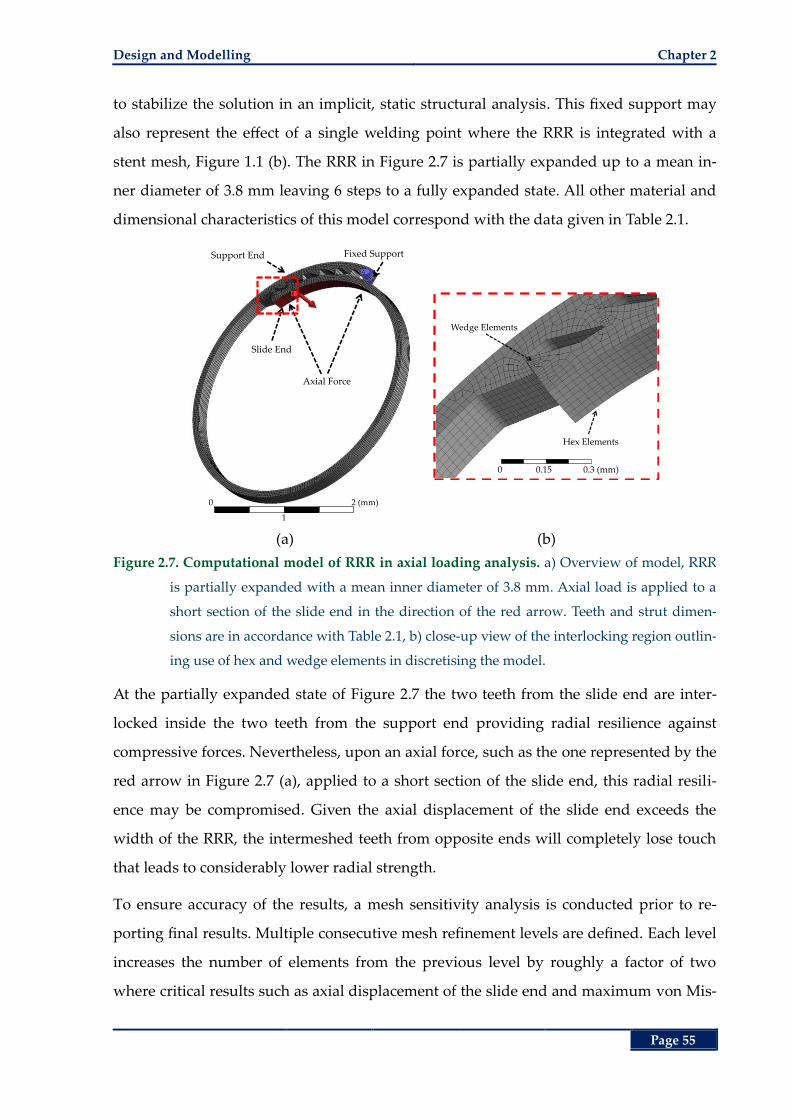
Design and Modelling Chapter 2
Page 55
to stabilize the solution in an implicit, static structural analysis. This fixed support may
also represent the effect of a single welding point where the RRR is integrated with a
stent mesh, Figure 1.1 (b). The RRR in Figure 2.7 is partially expanded up to a mean in-
ner diameter of 3.8 mm leaving 6 steps to a fully expanded state. All other material and
dimensional characteristics of this model correspond with the data given in Table 2.1.
(a) (b)
Figure 2.7. Computational model of RRR in axial loading analysis. a) Overview of model, RRR
is partially expanded with a mean inner diameter of 3.8 mm. Axial load is applied to a
short section of the slide end in the direction of the red arrow. Teeth and strut dimen-
sions are in accordance with Table 2.1, b) close-up view of the interlocking region outlin-
ing use of hex and wedge elements in discretising the model.
At the partially expanded state of Figure 2.7 the two teeth from the slide end are inter-
locked inside the two teeth from the support end providing radial resilience against
compressive forces. Nevertheless, upon an axial force, such as the one represented by the
red arrow in Figure 2.7 (a), applied to a short section of the slide end, this radial resili-
ence may be compromised. Given the axial displacement of the slide end exceeds the
width of the RRR, the intermeshed teeth from opposite ends will completely lose touch
that leads to considerably lower radial strength.
To ensure accuracy of the results, a mesh sensitivity analysis is conducted prior to re-
porting final results. Multiple consecutive mesh refinement levels are defined. Each level
increases the number of elements from the previous level by roughly a factor of two
where critical results such as axial displacement of the slide end and maximum von Mis-
Axial Force
Fixed SupportSupport End
Slide End
0 2 (mm)
1
Hex Elements
Wedge Elements
0 0.15 0.3 (mm)
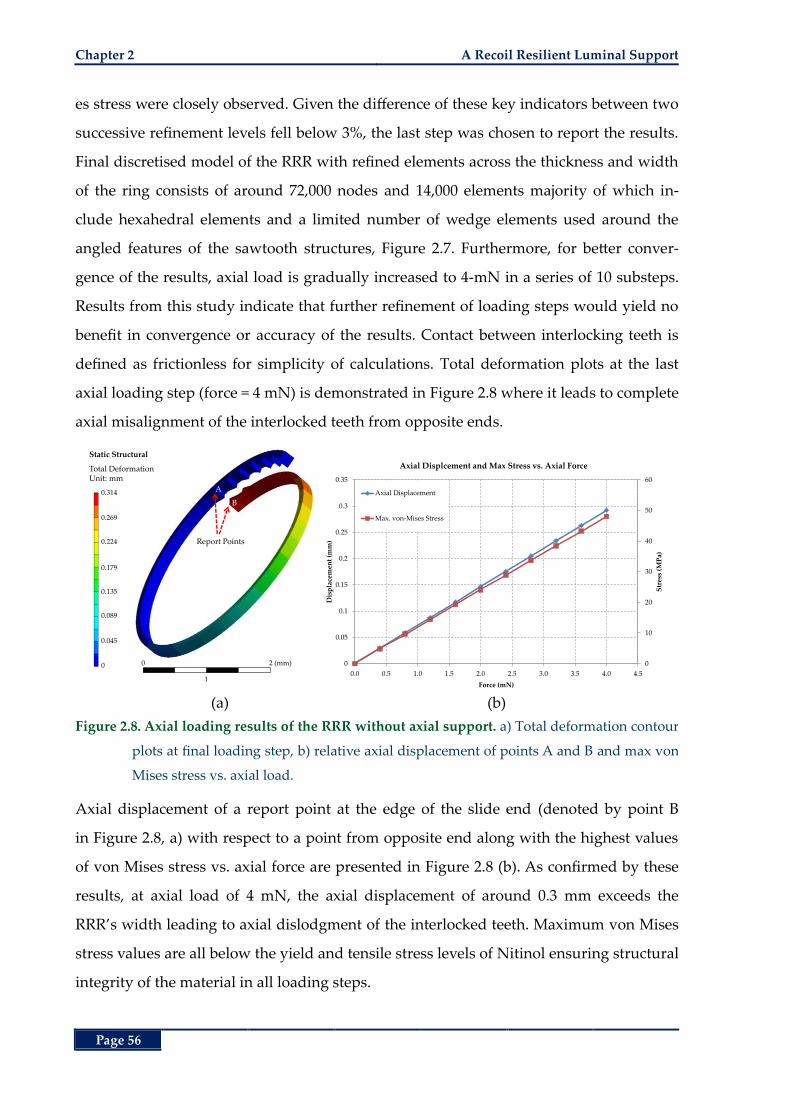
Chapter 2 A Recoil Resilient Luminal Support
Page 56
es stress were closely observed. Given the difference of these key indicators between two
successive refinement levels fell below 3%, the last step was chosen to report the results.
Final discretised model of the RRR with refined elements across the thickness and width
of the ring consists of around 72,000 nodes and 14,000 elements majority of which in-
clude hexahedral elements and a limited number of wedge elements used around the
angled features of the sawtooth structures, Figure 2.7. Furthermore, for better conver-
gence of the results, axial load is gradually increased to 4-mN in a series of 10 substeps.
Results from this study indicate that further refinement of loading steps would yield no
benefit in convergence or accuracy of the results. Contact between interlocking teeth is
defined as frictionless for simplicity of calculations. Total deformation plots at the last
axial loading step (force = 4 mN) is demonstrated in Figure 2.8 where it leads to complete
axial misalignment of the interlocked teeth from opposite ends.
(a) (b)
Figure 2.8. Axial loading results of the RRR without axial support. a) Total deformation contour
plots at final loading step, b) relative axial displacement of points A and B and max von
Mises stress vs. axial load.
Axial displacement of a report point at the edge of the slide end (denoted by point B
in Figure 2.8, a) with respect to a point from opposite end along with the highest values
of von Mises stress vs. axial force are presented in Figure 2.8 (b). As confirmed by these
results, at axial load of 4 mN, the axial displacement of around 0.3 mm exceeds the
RRR’s width leading to axial dislodgment of the interlocked teeth. Maximum von Mises
stress values are all below the yield and tensile stress levels of Nitinol ensuring structural
integrity of the material in all loading steps.
Static Structural
Total DeformationUnit: mm
Report Points
A
B
0.314
0.269
0.224
0.179
0.135
0.089
0.045
0 0 2 (mm)
1
0
10
20
30
40
50
60
0
0.05
0.1
0.15
0.2
0.25
0.3
0.35
0.0 0.5 1.0 1.5 2.0 2.5 3.0 3.5 4.0 4.5
Str
ess
(MP
a)
Dis
pla
cem
ent
(mm
)
Force (mN)
Axial Displcement and Max Stress vs. Axial Force
Axial Displacement
Max. von-Mises Stress
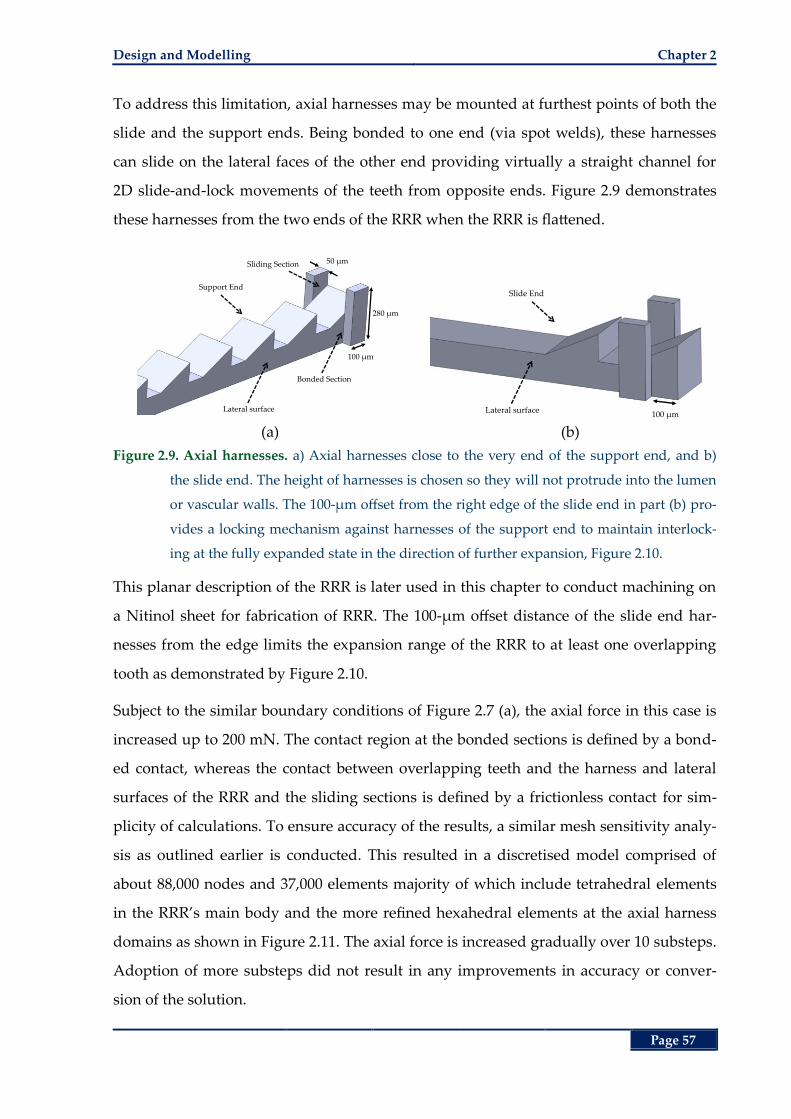
Design and Modelling Chapter 2
Page 57
To address this limitation, axial harnesses may be mounted at furthest points of both the
slide and the support ends. Being bonded to one end (via spot welds), these harnesses
can slide on the lateral faces of the other end providing virtually a straight channel for
2D slide-and-lock movements of the teeth from opposite ends. Figure 2.9 demonstrates
these harnesses from the two ends of the RRR when the RRR is flattened.
(a) (b)
Figure 2.9. Axial harnesses. a) Axial harnesses close to the very end of the support end, and b)
the slide end. The height of harnesses is chosen so they will not protrude into the lumen
or vascular walls. The 100-µm offset from the right edge of the slide end in part (b) pro-
vides a locking mechanism against harnesses of the support end to maintain interlock-
ing at the fully expanded state in the direction of further expansion, Figure 2.10.
This planar description of the RRR is later used in this chapter to conduct machining on
a Nitinol sheet for fabrication of RRR. The 100-µm offset distance of the slide end har-
nesses from the edge limits the expansion range of the RRR to at least one overlapping
tooth as demonstrated by Figure 2.10.
Subject to the similar boundary conditions of Figure 2.7 (a), the axial force in this case is
increased up to 200 mN. The contact region at the bonded sections is defined by a bond-
ed contact, whereas the contact between overlapping teeth and the harness and lateral
surfaces of the RRR and the sliding sections is defined by a frictionless contact for sim-
plicity of calculations. To ensure accuracy of the results, a similar mesh sensitivity analy-
sis as outlined earlier is conducted. This resulted in a discretised model comprised of
about 88,000 nodes and 37,000 elements majority of which include tetrahedral elements
in the RRR’s main body and the more refined hexahedral elements at the axial harness
domains as shown in Figure 2.11. The axial force is increased gradually over 10 substeps.
Adoption of more substeps did not result in any improvements in accuracy or conver-
sion of the solution.
50 µm
280 µm
100 µm
Support End
Bonded Section
Sliding Section
Lateral surface
Slide End
100 µmLateral surface
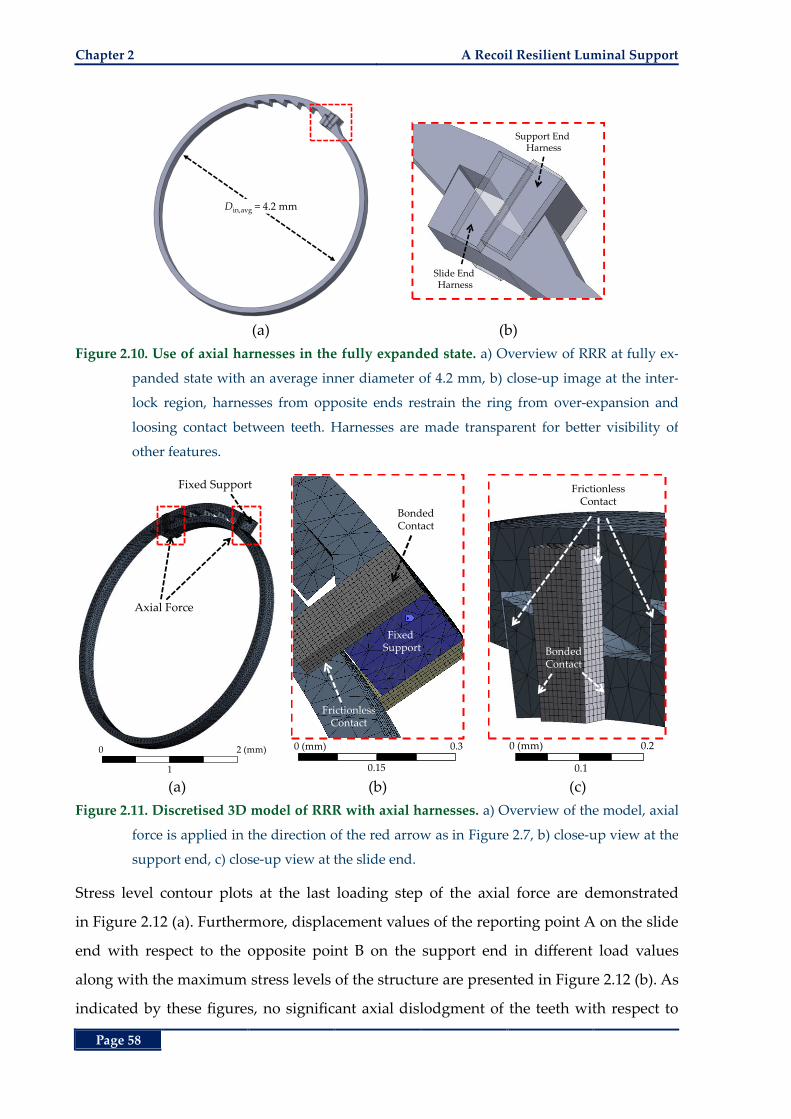
Chapter 2 A Recoil Resilient Luminal Support
Page 58
(a) (b)
Figure 2.10. Use of axial harnesses in the fully expanded state. a) Overview of RRR at fully ex-
panded state with an average inner diameter of 4.2 mm, b) close-up image at the inter-
lock region, harnesses from opposite ends restrain the ring from over-expansion and
loosing contact between teeth. Harnesses are made transparent for better visibility of
other features.
(a) (b) (c)
Figure 2.11. Discretised 3D model of RRR with axial harnesses. a) Overview of the model, axial
force is applied in the direction of the red arrow as in Figure 2.7, b) close-up view at the
support end, c) close-up view at the slide end.
Stress level contour plots at the last loading step of the axial force are demonstrated
in Figure 2.12 (a). Furthermore, displacement values of the reporting point A on the slide
end with respect to the opposite point B on the support end in different load values
along with the maximum stress levels of the structure are presented in Figure 2.12 (b). As
indicated by these figures, no significant axial dislodgment of the teeth with respect to
Din,avg = 4.2 mm
Slide End Harness
Support End Harness
Axial Force
Fixed Support
0 2 (mm)
1
Fixed Support
FrictionlessContact
BondedContact
0 (mm) 0.3
0.15
0 (mm) 0.2
0.1
FrictionlessContact
BondedContact
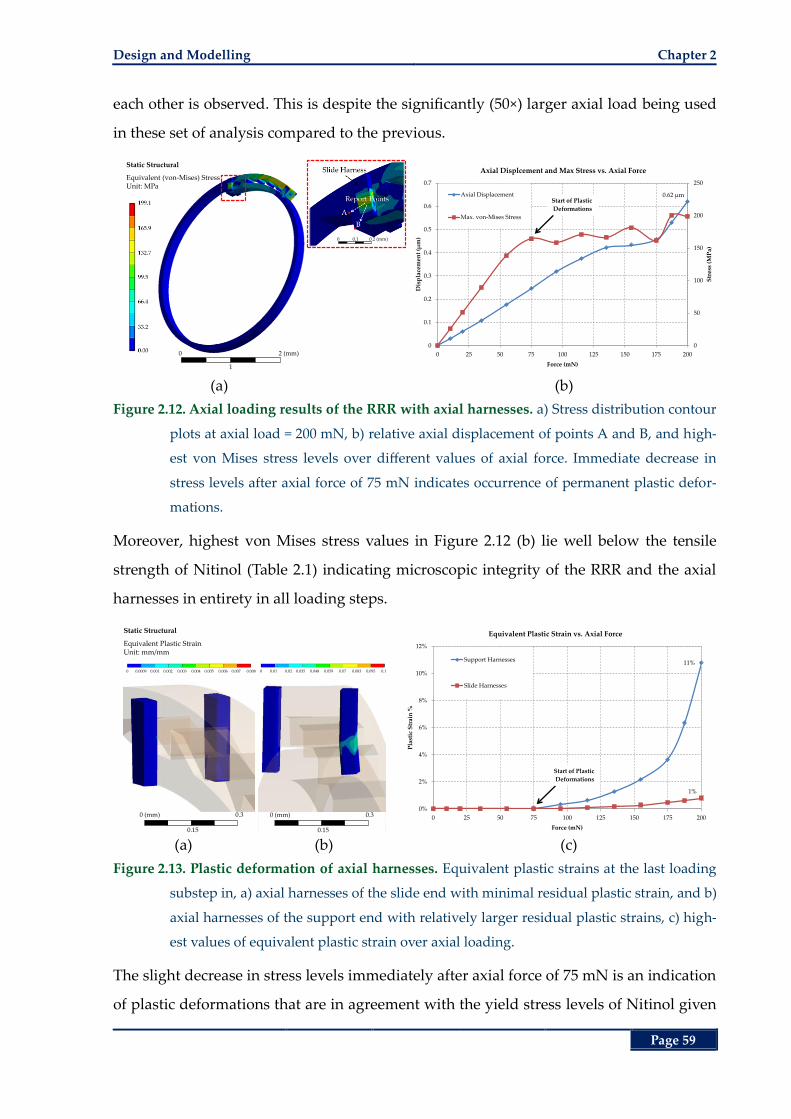
Design and Modelling Chapter 2
Page 59
each other is observed. This is despite the significantly (50×) larger axial load being used
in these set of analysis compared to the previous.
(a) (b)
Figure 2.12. Axial loading results of the RRR with axial harnesses. a) Stress distribution contour
plots at axial load = 200 mN, b) relative axial displacement of points A and B, and high-
est von Mises stress levels over different values of axial force. Immediate decrease in
stress levels after axial force of 75 mN indicates occurrence of permanent plastic defor-
mations.
Moreover, highest von Mises stress values in Figure 2.12 (b) lie well below the tensile
strength of Nitinol (Table 2.1) indicating microscopic integrity of the RRR and the axial
harnesses in entirety in all loading steps.
(a) (b) (c)
Figure 2.13. Plastic deformation of axial harnesses. Equivalent plastic strains at the last loading
substep in, a) axial harnesses of the slide end with minimal residual plastic strain, and b)
axial harnesses of the support end with relatively larger residual plastic strains, c) high-
est values of equivalent plastic strain over axial loading.
The slight decrease in stress levels immediately after axial force of 75 mN is an indication
of plastic deformations that are in agreement with the yield stress levels of Nitinol given
Static Structural
Equivalent (von-Mises) StressUnit: MPa
0 2 (mm)
1
0 0.1 0.2 (mm)
0.62 µm
0
50
100
150
200
250
0
0.1
0.2
0.3
0.4
0.5
0.6
0.7
0 25 50 75 100 125 150 175 200
Str
ess
(MP
a)
Dis
pla
cem
ent
(µm
)
Force (mN)
Axial Displcement and Max Stress vs. Axial Force
Axial Displacement
Max. von-Mises Stress
Start of Plastic
Deformations
0 0.01 0.02 0.035 0.048 0.059 0.07 0.083 0.095 0.1
Static Structural
Equivalent Plastic StrainUnit: mm/mm
0 0.0009 0.001 0.002 0.003 0.004 0.005 0.006 0.007 0.008
0 (mm) 0.3
0.15
0 (mm) 0.3
0.15
11%
1%
0%
2%
4%
6%
8%
10%
12%
0 25 50 75 100 125 150 175 200
Pla
stic
Str
ain
%
Force (mN)
Equivalent Plastic Strain vs. Axial Force
Support Harnesses
Slide Harnesses
Start of Plastic
Deformations
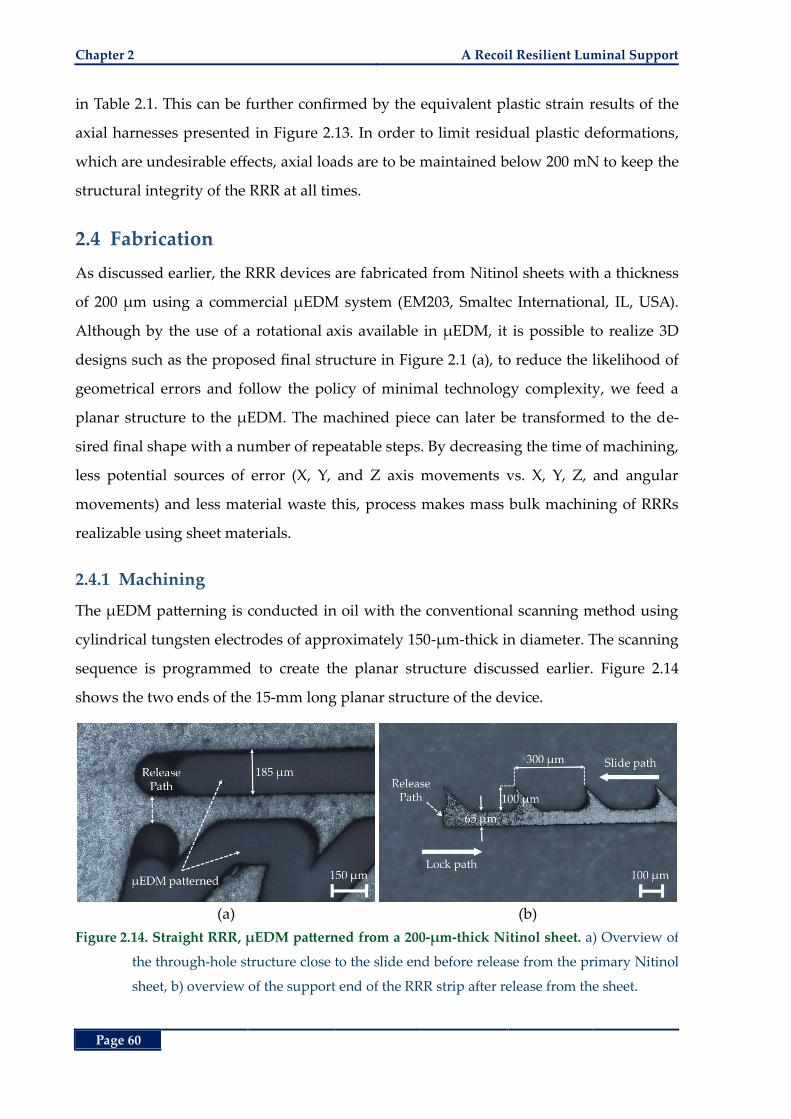
Chapter 2 A Recoil Resilient Luminal Support
Page 60
in Table 2.1. This can be further confirmed by the equivalent plastic strain results of the
axial harnesses presented in Figure 2.13. In order to limit residual plastic deformations,
which are undesirable effects, axial loads are to be maintained below 200 mN to keep the
structural integrity of the RRR at all times.
2.4 Fabrication
As discussed earlier, the RRR devices are fabricated from Nitinol sheets with a thickness
of 200 µm using a commercial µEDM system (EM203, Smaltec International, IL, USA).
Although by the use of a rotational axis available in µEDM, it is possible to realize 3D
designs such as the proposed final structure in Figure 2.1 (a), to reduce the likelihood of
geometrical errors and follow the policy of minimal technology complexity, we feed a
planar structure to the µEDM. The machined piece can later be transformed to the de-
sired final shape with a number of repeatable steps. By decreasing the time of machining,
less potential sources of error (X, Y, and Z axis movements vs. X, Y, Z, and angular
movements) and less material waste this, process makes mass bulk machining of RRRs
realizable using sheet materials.
2.4.1 Machining
The µEDM patterning is conducted in oil with the conventional scanning method using
cylindrical tungsten electrodes of approximately 150-µm-thick in diameter. The scanning
sequence is programmed to create the planar structure discussed earlier. Figure 2.14
shows the two ends of the 15-mm long planar structure of the device.
(a) (b)
Figure 2.14. Straight RRR, µEDM patterned from a 200-µm-thick Nitinol sheet. a) Overview of
the through-hole structure close to the slide end before release from the primary Nitinol
sheet, b) overview of the support end of the RRR strip after release from the sheet.
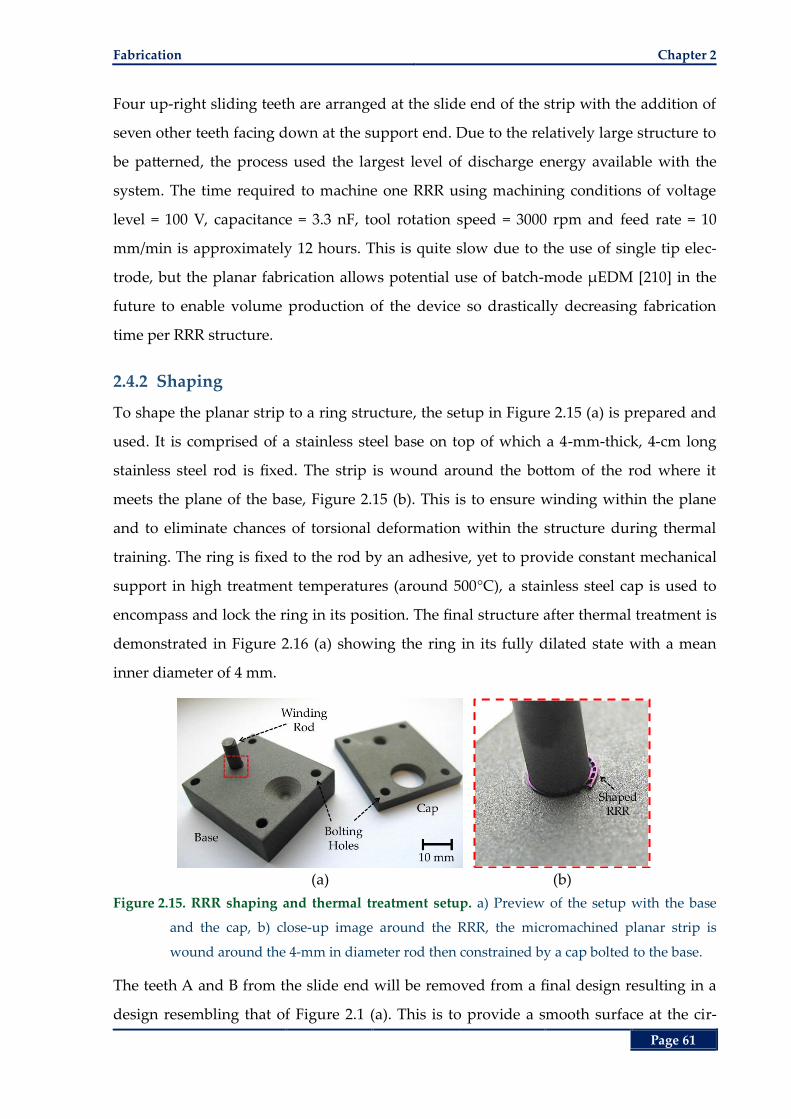
Fabrication Chapter 2
Page 61
Four up-right sliding teeth are arranged at the slide end of the strip with the addition of
seven other teeth facing down at the support end. Due to the relatively large structure to
be patterned, the process used the largest level of discharge energy available with the
system. The time required to machine one RRR using machining conditions of voltage
level = 100 V, capacitance = 3.3 nF, tool rotation speed = 3000 rpm and feed rate = 10
mm/min is approximately 12 hours. This is quite slow due to the use of single tip elec-
trode, but the planar fabrication allows potential use of batch-mode µEDM [210] in the
future to enable volume production of the device so drastically decreasing fabrication
time per RRR structure.
2.4.2 Shaping
To shape the planar strip to a ring structure, the setup in Figure 2.15 (a) is prepared and
used. It is comprised of a stainless steel base on top of which a 4-mm-thick, 4-cm long
stainless steel rod is fixed. The strip is wound around the bottom of the rod where it
meets the plane of the base, Figure 2.15 (b). This is to ensure winding within the plane
and to eliminate chances of torsional deformation within the structure during thermal
training. The ring is fixed to the rod by an adhesive, yet to provide constant mechanical
support in high treatment temperatures (around 500°C), a stainless steel cap is used to
encompass and lock the ring in its position. The final structure after thermal treatment is
demonstrated in Figure 2.16 (a) showing the ring in its fully dilated state with a mean
inner diameter of 4 mm.
(a) (b)
Figure 2.15. RRR shaping and thermal treatment setup. a) Preview of the setup with the base
and the cap, b) close-up image around the RRR, the micromachined planar strip is
wound around the 4-mm in diameter rod then constrained by a cap bolted to the base.
The teeth A and B from the slide end will be removed from a final design resulting in a
design resembling that of Figure 2.1 (a). This is to provide a smooth surface at the cir-
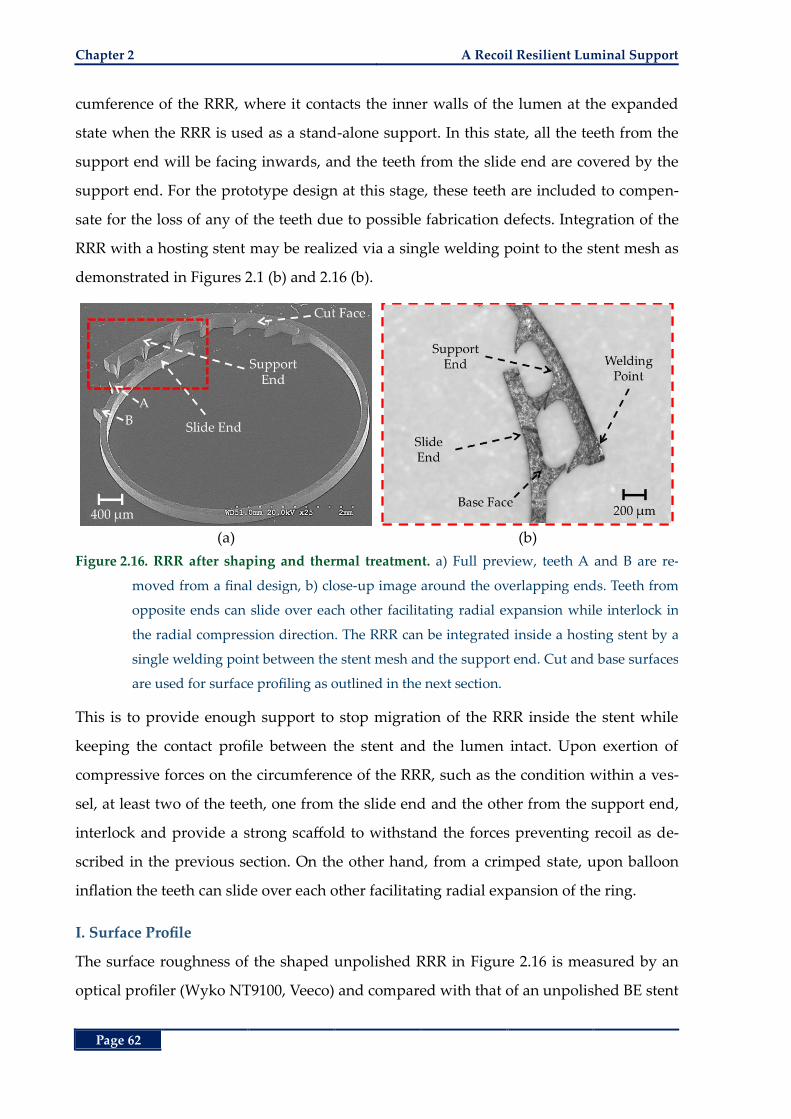
Chapter 2 A Recoil Resilient Luminal Support
Page 62
cumference of the RRR, where it contacts the inner walls of the lumen at the expanded
state when the RRR is used as a stand-alone support. In this state, all the teeth from the
support end will be facing inwards, and the teeth from the slide end are covered by the
support end. For the prototype design at this stage, these teeth are included to compen-
sate for the loss of any of the teeth due to possible fabrication defects. Integration of the
RRR with a hosting stent may be realized via a single welding point to the stent mesh as
demonstrated in Figures 2.1 (b) and 2.16 (b).
(a) (b)
Figure 2.16. RRR after shaping and thermal treatment. a) Full preview, teeth A and B are re-
moved from a final design, b) close-up image around the overlapping ends. Teeth from
opposite ends can slide over each other facilitating radial expansion while interlock in
the radial compression direction. The RRR can be integrated inside a hosting stent by a
single welding point between the stent mesh and the support end. Cut and base surfaces
are used for surface profiling as outlined in the next section.
This is to provide enough support to stop migration of the RRR inside the stent while
keeping the contact profile between the stent and the lumen intact. Upon exertion of
compressive forces on the circumference of the RRR, such as the condition within a ves-
sel, at least two of the teeth, one from the slide end and the other from the support end,
interlock and provide a strong scaffold to withstand the forces preventing recoil as de-
scribed in the previous section. On the other hand, from a crimped state, upon balloon
inflation the teeth can slide over each other facilitating radial expansion of the ring.
I. Surface Profile
The surface roughness of the shaped unpolished RRR in Figure 2.16 is measured by an
optical profiler (Wyko NT9100, Veeco) and compared with that of an unpolished BE stent
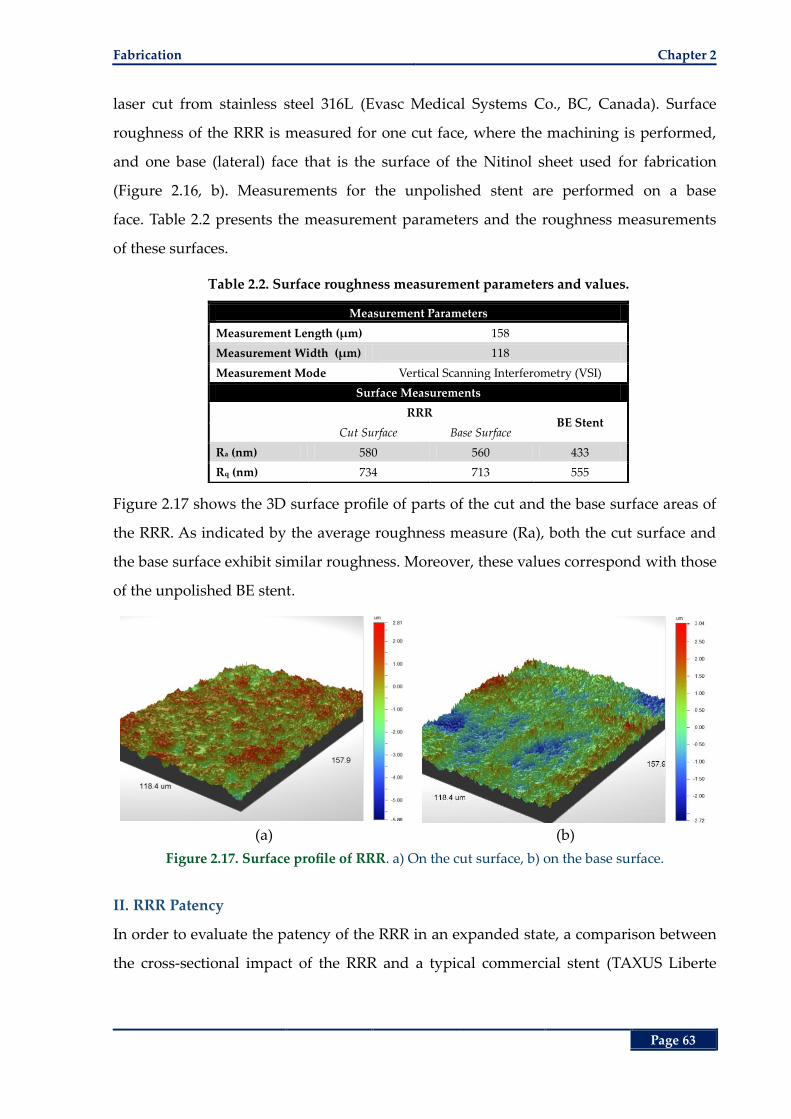
Fabrication Chapter 2
Page 63
laser cut from stainless steel 316L (Evasc Medical Systems Co., BC, Canada). Surface
roughness of the RRR is measured for one cut face, where the machining is performed,
and one base (lateral) face that is the surface of the Nitinol sheet used for fabrication
(Figure 2.16, b). Measurements for the unpolished stent are performed on a base
face. Table 2.2 presents the measurement parameters and the roughness measurements
of these surfaces.
Table 2.2. Surface roughness measurement parameters and values.
Measurement Parameters
Measurement Length (µm) 158
Measurement Width (µm) 118
Measurement Mode Vertical Scanning Interferometry (VSI)
Surface Measurements
RRR BE Stent
Cut Surface Base Surface
Ra (nm) 580 560 433
Rq (nm) 734 713 555
Figure 2.17 shows the 3D surface profile of parts of the cut and the base surface areas of
the RRR. As indicated by the average roughness measure (Ra), both the cut surface and
the base surface exhibit similar roughness. Moreover, these values correspond with those
of the unpolished BE stent.
(a) (b)
Figure 2.17. Surface profile of RRR. a) On the cut surface, b) on the base surface.
II. RRR Patency
In order to evaluate the patency of the RRR in an expanded state, a comparison between
the cross-sectional impact of the RRR and a typical commercial stent (TAXUS Liberte
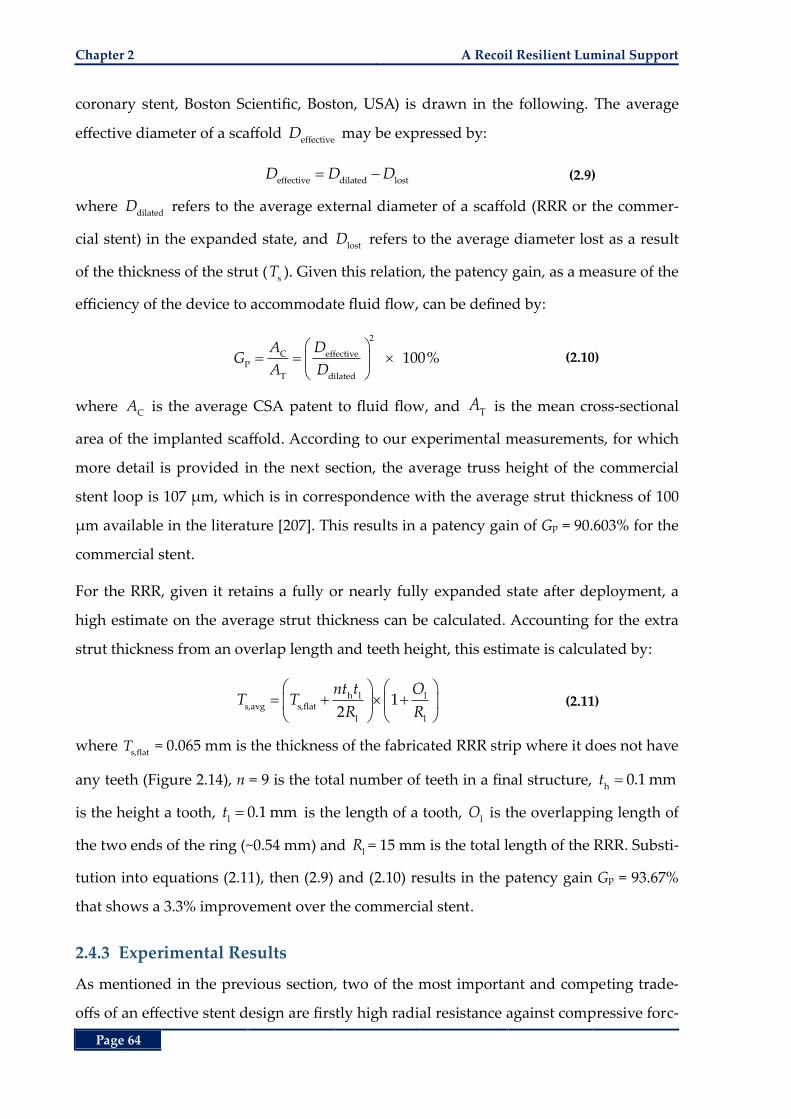
Chapter 2 A Recoil Resilient Luminal Support
Page 64
coronary stent, Boston Scientific, Boston, USA) is drawn in the following. The average
effective diameter of a scaffold effective
D may be expressed by:
effective dilated lost
D D D (2.9)
where dilated
D refers to the average external diameter of a scaffold (RRR or the commer-
cial stent) in the expanded state, and lost
D refers to the average diameter lost as a result
of the thickness of the strut (s
T ). Given this relation, the patency gain, as a measure of the
efficiency of the device to accommodate fluid flow, can be defined by:
2
C effectiveP
T dilated
100%A D
GA D
(2.10)
where C
A is the average CSA patent to fluid flow, and TA is the mean cross-sectional
area of the implanted scaffold. According to our experimental measurements, for which
more detail is provided in the next section, the average truss height of the commercial
stent loop is 107 µm, which is in correspondence with the average strut thickness of 100
µm available in the literature [207]. This results in a patency gain of Gp = 90.603% for the
commercial stent.
For the RRR, given it retains a fully or nearly fully expanded state after deployment, a
high estimate on the average strut thickness can be calculated. Accounting for the extra
strut thickness from an overlap length and teeth height, this estimate is calculated by:
h l ls,avg s,flat
l l
12
nt t OT T
R R (2.11)
where s,flat
T = 0.065 mm is the thickness of the fabricated RRR strip where it does not have
any teeth (Figure 2.14), n = 9 is the total number of teeth in a final structure, h
0.1 mmt
is the height a tooth, l
0.1 mmt is the length of a tooth, lO is the overlapping length of
the two ends of the ring (~0.54 mm) and lR = 15 mm is the total length of the RRR. Substi-
tution into equations (2.11), then (2.9) and (2.10) results in the patency gain Gp = 93.67%
that shows a 3.3% improvement over the commercial stent.
2.4.3 Experimental Results
As mentioned in the previous section, two of the most important and competing trade-
offs of an effective stent design are firstly high radial resistance against compressive forc-
Fabrication Chapter 2
Page 65
es, and secondly expandability within rated angioplasty pressures [76, 77]. In this sec-
tion, the expandability of the fabricated RRR by an angioplasty balloon and its resilience
against recoil are experimentally evaluated. For these tests, the RRR is first manually
down crimped to a mean outer diameter of 3 mm so that it can be easily inserted into a
commercially available silicone-based mock vessel (Dynatek Dalta Scientific Instruments,
MO, USA). A mock vessel with an inner diameter of 4 0.2 mm and radial compliance of
6‒8%, comparable to human arteries, is used for this experiment. Next, the ring is
threaded by a deflated balloon (TAXUS Liberte MONORAIL, Boston Scientific, Boston,
USA) with a nominal expanded diameter of 4.5 mm. Having this ensemble residing in-
side the mock vessel, the balloon is gradually inflated by increasing the hydrostatic pres-
sure inside while measuring the outer diameter of the mock vessel at the deployment site
of the RRR. These measurements are implemented with a calliper (ABSOLUTE Digimat-
ic, Mitutoyo, USA) taking the average of four measurements at each pressure stage up to
7 atm. Figure 2.18 shows the RRR, balloon, mock vessel assembly at different conditions
imaged during this test.
(b)
(a) (c) (d)
Figure 2.18. Balloon expansion of RRR in vitro a) Pre-inflation state, showing the RRR inside the
mock vessel threaded by the balloon, b) Balloon filled with deionized water, inflated by
raising the pressure to 3 atm resulting in 4.7-mm mean outer diameter, c) Pressure
raised to a maximum of 7 atm resulting in 5-mm mean outer diameter, d) Balloon de-
flated and retracted from the mock vessel resulting in 4.93-mm mean outer diameter.
Average values of the RRR and the mock vessel diameter obtained from measurements
just before (5 mm) and after the deflation (4.93 mm) of the balloon indicate less than 3%
recoil in the CSA, significantly lower than those of commercial stents reported in the lit-
erature reaching as high as 16–30% [101] or 13% [185].
As indicators of performance, radial stiffness and bending compliance of stents are of
paramount importance [76]. As per the RRRs, bending compliance is highly dependent
Guide wire
Mock Artery
RRR
Balloon
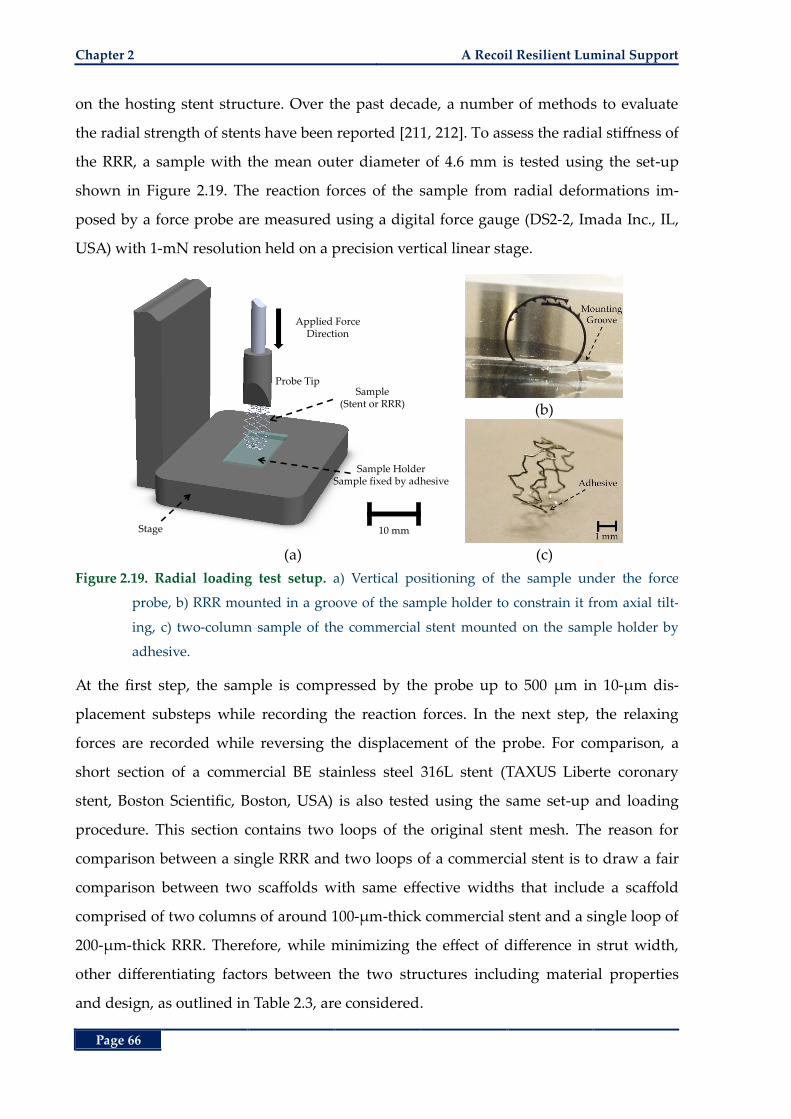
Chapter 2 A Recoil Resilient Luminal Support
Page 66
on the hosting stent structure. Over the past decade, a number of methods to evaluate
the radial strength of stents have been reported [211, 212]. To assess the radial stiffness of
the RRR, a sample with the mean outer diameter of 4.6 mm is tested using the set-up
shown in Figure 2.19. The reaction forces of the sample from radial deformations im-
posed by a force probe are measured using a digital force gauge (DS2-2, Imada Inc., IL,
USA) with 1-mN resolution held on a precision vertical linear stage.
(b)
(a) (c)
Figure 2.19. Radial loading test setup. a) Vertical positioning of the sample under the force
probe, b) RRR mounted in a groove of the sample holder to constrain it from axial tilt-
ing, c) two-column sample of the commercial stent mounted on the sample holder by
adhesive.
At the first step, the sample is compressed by the probe up to 500 µm in 10-µm dis-
placement substeps while recording the reaction forces. In the next step, the relaxing
forces are recorded while reversing the displacement of the probe. For comparison, a
short section of a commercial BE stainless steel 316L stent (TAXUS Liberte coronary
stent, Boston Scientific, Boston, USA) is also tested using the same set-up and loading
procedure. This section contains two loops of the original stent mesh. The reason for
comparison between a single RRR and two loops of a commercial stent is to draw a fair
comparison between two scaffolds with same effective widths that include a scaffold
comprised of two columns of around 100-µm-thick commercial stent and a single loop of
200-µm-thick RRR. Therefore, while minimizing the effect of difference in strut width,
other differentiating factors between the two structures including material properties
and design, as outlined in Table 2.3, are considered.
Applied Force Direction
Probe Tip
Sample HolderSample fixed by adhesive
Sample (Stent or RRR)
Stage 10 mm
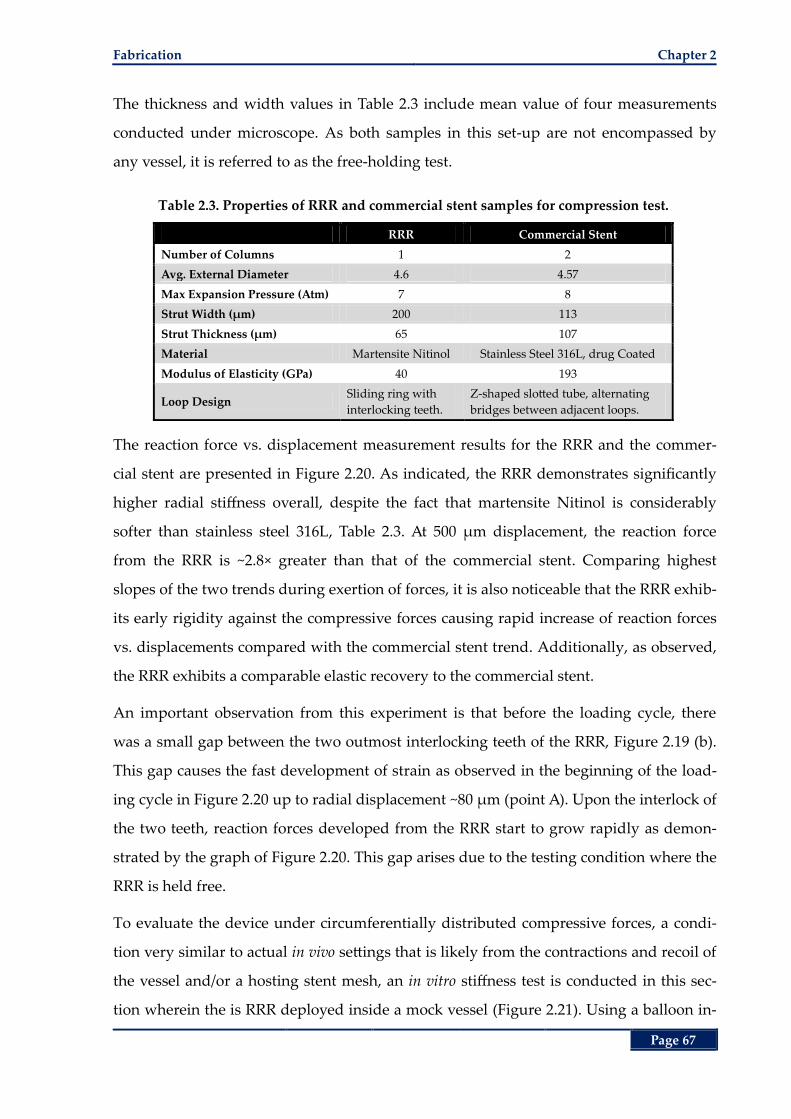
Fabrication Chapter 2
Page 67
The thickness and width values in Table 2.3 include mean value of four measurements
conducted under microscope. As both samples in this set-up are not encompassed by
any vessel, it is referred to as the free-holding test.
Table 2.3. Properties of RRR and commercial stent samples for compression test.
RRR Commercial Stent
Number of Columns 1 2
Avg. External Diameter 4.6 4.57
Max Expansion Pressure (Atm) 7 8
Strut Width (µm) 200 113
Strut Thickness (µm) 65 107
Material Martensite Nitinol Stainless Steel 316L, drug Coated
Modulus of Elasticity (GPa) 40 193
Loop Design Sliding ring with
interlocking teeth.
Z-shaped slotted tube, alternating
bridges between adjacent loops.
The reaction force vs. displacement measurement results for the RRR and the commer-
cial stent are presented in Figure 2.20. As indicated, the RRR demonstrates significantly
higher radial stiffness overall, despite the fact that martensite Nitinol is considerably
softer than stainless steel 316L, Table 2.3. At 500 µm displacement, the reaction force
from the RRR is ~2.8× greater than that of the commercial stent. Comparing highest
slopes of the two trends during exertion of forces, it is also noticeable that the RRR exhib-
its early rigidity against the compressive forces causing rapid increase of reaction forces
vs. displacements compared with the commercial stent trend. Additionally, as observed,
the RRR exhibits a comparable elastic recovery to the commercial stent.
An important observation from this experiment is that before the loading cycle, there
was a small gap between the two outmost interlocking teeth of the RRR, Figure 2.19 (b).
This gap causes the fast development of strain as observed in the beginning of the load-
ing cycle in Figure 2.20 up to radial displacement ~80 µm (point A). Upon the interlock of
the two teeth, reaction forces developed from the RRR start to grow rapidly as demon-
strated by the graph of Figure 2.20. This gap arises due to the testing condition where the
RRR is held free.
To evaluate the device under circumferentially distributed compressive forces, a condi-
tion very similar to actual in vivo settings that is likely from the contractions and recoil of
the vessel and/or a hosting stent mesh, an in vitro stiffness test is conducted in this sec-
tion wherein the is RRR deployed inside a mock vessel (Figure 2.21). Using a balloon in-
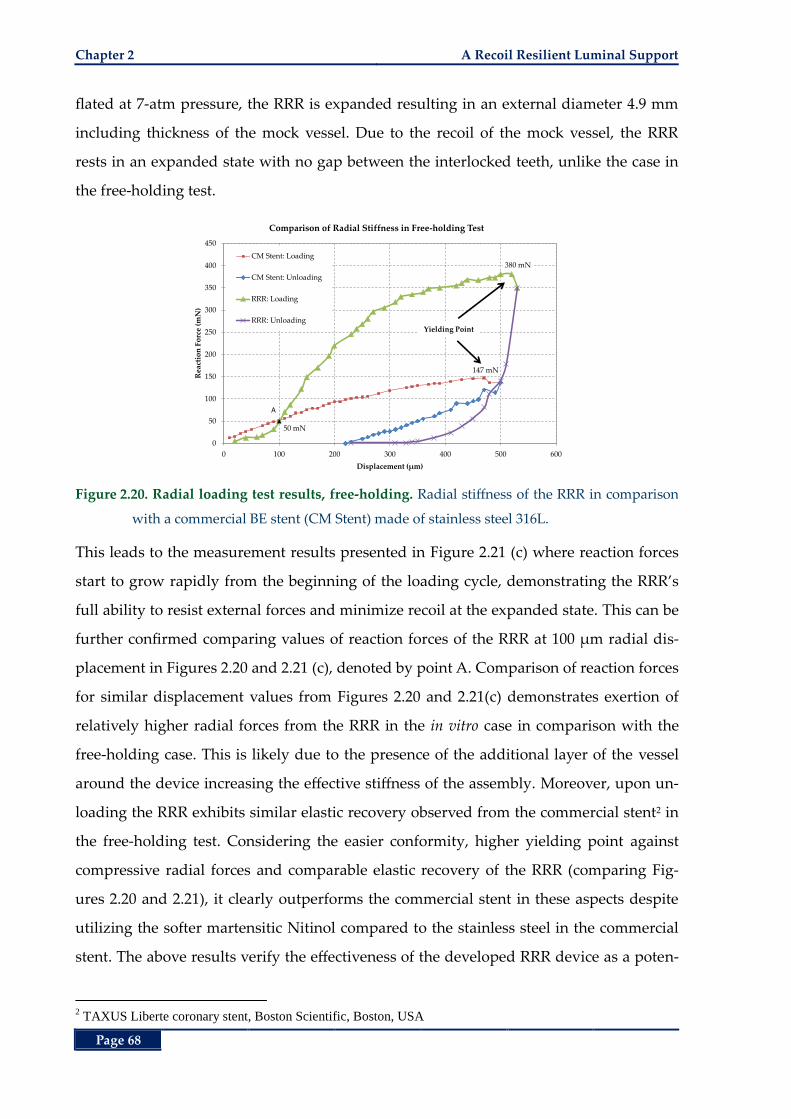
Chapter 2 A Recoil Resilient Luminal Support
Page 68
flated at 7-atm pressure, the RRR is expanded resulting in an external diameter 4.9 mm
including thickness of the mock vessel. Due to the recoil of the mock vessel, the RRR
rests in an expanded state with no gap between the interlocked teeth, unlike the case in
the free-holding test.
Figure 2.20. Radial loading test results, free-holding. Radial stiffness of the RRR in comparison
with a commercial BE stent (CM Stent) made of stainless steel 316L.
This leads to the measurement results presented in Figure 2.21 (c) where reaction forces
start to grow rapidly from the beginning of the loading cycle, demonstrating the RRR’s
full ability to resist external forces and minimize recoil at the expanded state. This can be
further confirmed comparing values of reaction forces of the RRR at 100 µm radial dis-
placement in Figures 2.20 and 2.21 (c), denoted by point A. Comparison of reaction forces
for similar displacement values from Figures 2.20 and 2.21(c) demonstrates exertion of
relatively higher radial forces from the RRR in the in vitro case in comparison with the
free-holding case. This is likely due to the presence of the additional layer of the vessel
around the device increasing the effective stiffness of the assembly. Moreover, upon un-
loading the RRR exhibits similar elastic recovery observed from the commercial stent2 in
the free-holding test. Considering the easier conformity, higher yielding point against
compressive radial forces and comparable elastic recovery of the RRR (comparing Fig-
ures 2.20 and 2.21), it clearly outperforms the commercial stent in these aspects despite
utilizing the softer martensitic Nitinol compared to the stainless steel in the commercial
stent. The above results verify the effectiveness of the developed RRR device as a poten-
2 TAXUS Liberte coronary stent, Boston Scientific, Boston, USA
147 mN
50 mN
380 mN
0
50
100
150
200
250
300
350
400
450
0 100 200 300 400 500 600
Rea
ctio
n F
orc
e (m
N)
Displacement (µm)
Comparison of Radial Stiffness in Free-holding Test
CM Stent: Loading
CM Stent: Unloading
RRR: Loading
RRR: Unloading
A
Yielding Point
Chapter Summary Chapter 2
Page 69
tial add-on to the existing stents to improve their recoil resilience while minimally affect-
ing longitudinal flexibility and deployment procedures.
(a)
(b) (c)
Figure 2.21. Radial loading test results, in vitro. Radial stiffness measurement of the RRR de-
ployed in an artificial (mock) vessel, a) overview of the sample under force probe before
loading, b) overview of the deformed sample after completion of the load-unload cycle,
c) reaction force values vs. probe displacement.
2.5 Chapter Summary
In this chapter, design modelling and fabrication of a viable recoil resilient luminal sup-
port for stenting applications was investigated. The proposed structure called recoil resil-
ient ring (RRR) is fabricated by µEDM technology cutting planar shapes from Nitinol
sheets of 200 µm in thickness. The simple planar design and subsequent shaping and
training methods used, facilitates batch processing and mass production of the struc-
tures. To be compatible with today’s standard stenting tools and procedures, first-order
simple geometries of the RRR were modelled to demonstrate expandability using an an-
gioplasty balloon while maintaining structural integrity. Under circumferential compres-
sive pressures, the FEA results indicated only 3.4% loss of CSA for the RRR that is 13×
less than that of a typical balloon expandable stent. After removal of the pressure the bal-
loon expandable stent lost 34% of its CSA due to plastic deformations while the RRR re-
covered completely.
83 mN
720 mN
0
100
200
300
400
500
600
700
800
0 100 200 300 400 500 600 700 800
Co
mp
ress
ive
Fo
rce
(mN
)
Displacement (µm)
RRR Radial Stiffness in vitro
RRR: Loading
RRR: Unloading
A
ΔL
Chapter 2 A Recoil Resilient Luminal Support
Page 70
The fabricated RRR was then subjected to experimental in vitro expansion and stiffness
tests. The free radial stiffness test measurements indicated 2.8× higher radial rigidity of
the RRR compared to that of a two-column stainless steel commercial stent. Considering
the lower modulus of elasticity of Nitinol in martensitic state compared to stainless steel,
and the comparable thickness and width of the RRR and commercial stent, the higher
radial strength of RRR is delivered by the proposed design and interlocking mechanism.
The in vitro radial stiffness tests also demonstrated comparable elastic recovery of the
RRR to the commercial stent. The proposed RRR is balloon expandable in vitro by 5‒7
atm pressure, well in the range of recommended in vivo pressures. The change in mean
CSA after balloon deflation, showed to be < 3% for the RRR compared to the reported
mean value of 13‒30% associated with commercial stents.
Given RRR’s attractive specifications such as low deployment footprint (low width and
thickness) and its high radial strength, a series of RRRs can potentially integrated inside
a stent mesh through single connection points, providing further scaffolding to specific
areas and to the stent as a whole, while not sacrificing expandability or longitudinal flex-
ibility. Considering these benefits compared to the added local thickness inside a stent
due to the RRR’s profile, the proposed structures bring a good trade-off between flexibil-
ity, deliverability, and resilience.
Investigation of the detailed study of the hemodynamic changes of the deployment area
after deployment of the proposed structure in comparison with a commercial stent and
their effect on increasing neointimal hyperplasia, are the next important subjects. These
subjects are discussed extensively in Chapter 3 utilizing computational fluid dynamics
(CFD). Furthermore, use of SMA in the martensitic temperature range opens a path to
other actuation and expansion methods such as application of heat or electric current as
an extension of this work that are discussed in Chapter 4 of the thesis.
Page 71
Chapter 3
Chapter 3. Hemodynamic Risk Assessment by Computational Fluid Dynamics
Hemodynamic Risk Assessment by
Computational Fluid Dynamics
cute luminal gain after percutaneous intervention
comes with the price of risk of later restenosis. Hemo-
dynamic changes due to the presence of a stent play a
key role in occurrence of restenosis. In particular low wall shear
stress levels at the treated lesion site have been associated with in-
creased risk of neointimal hyperplasia. In this chapter, the pro-
posed recoil resilient ring (RRR) of Chapter 2 is extensively
studied utilizing capabilities of computational fluid dynamics
(CFD). Comparisons are then made between the proposed struc-
ture and a commercial stent to provide further insight into the
hemodynamic performance indicators of the RRR. Moreover, di-
mensional analysis studies are conducted to demonstrate the effi-
cacy of an RRR-integrated stent to deliver a hemodynamic
response comparable to current stent technology. These results
provide an insight into the effect of dimensional changes of fluid
domains on the hemodynamic response of luminal scaffolds.
A
Chapter 3
Chapter 3 Hemodynamic Risk Assessment by CFD
Page 72
3.1 Abstract
Stents that are one of the most prevalent biomedical implants that provide permanent
scaffolding as a treatment to constricted lumens. Lumen refers to the cavity inside a ves-
sel that is normally filled with flowing blood. In Chapter 2, a novel recoil resilient ring
(RRR) to reduce stent recoil and its subsequent side effects is introduced. The RRR is an
overlapped open ring with asymmetrical interlocking sawtooth structures. Teeth from
opposite ends of the ring can slide against each other during expansion while interlock
step by step to keep the expanded structure upon compression. In Chapter 2, high radial
strength of the RRR is demonstrated via numerical and experimental studies outlining its
potential to reduce recoil. Particularly, RRR’s superior radial resilience is demonstrated
in comparison with a commercial stent.
Apart from the acute changes and effects such as luminal gain and vascular wall injury,
following their deployment, stents introduce changes to the fluid regime. These effects
can potentially result in abnormal biological effects leading to restenosis as outlined in
Chapter 1. In this chapter, 3D CFD models are utilized to study and compare the effect of
deployment of three different luminal supports that are subject to a physiological pulsa-
tile fluid flow. These supports include a nominal balloon-expandable (BE) stent, a
standalone RRR and an RRR-integrated BE stent. The supports are first studied in two
fluid domains including a straight domain with no side branches and a branched do-
main consisting of a proximal and a distal branch. The results are then compared with
corresponding fluid domains of unscaffolded healthy arteries with uniform inner diame-
ters through the deployment area. The fluidic response of the healthy vessel represents
the reference behaviour of a vessel that may be used as a general benchmark for assess-
ment of new luminal supports.
Utilizing a transient analysis framework, hemodynamic indicators including spatial and
temporal distribution of wall shear stress, fluid drag force and flow supply of the branch-
ing arteries are investigated. In all these indicators, oscillatory behaviours are observed.
Compared with the other two supports, the standalone RRR demonstrated a super he-
modynamic response with the least extension of region subject to low wall shear stress
(LWSS) (< 0.5 Pa) and the least deviation of the outlet flow rates from a healthy fluid do-
main. Although, marginal differences between the transient LWSS distribution results of
Introduction Chapter 3
Page 73
the RRR-integrated stent and the standalone stent are observed in a straight vessel, the
temporal average values show minimal difference in the deployment area (< 3%) and the
entire fluid domain (< 1%). In a branched fluid domain these transient differences be-
come minimal. Fluid drag force results show efficacy of the withholding forces by at least
14 times greater than drag forces to cease migration or displacement of any of the sup-
ports. Dimensional analysis results in the branched fluid domains demonstrated even
slight improvement of the LWSS in the deployment area of the RRR-integrated stent in
smaller-diameter lumens and with longer overlap lengths from the two end of the RRR
(higher strut thickens to luminal diameter ratios) compared to similar standalone stent
deployment cases by 1%. Branching and main outlet flow results of the RRR-integrated
and the standalone stents show close correspondence with a cumulative difference of 2%.
These results demonstrate the merit of the standalone RRR and RRR-integrated stent as
viable luminal implants with minimal potential fluidic penalties compared to the current
state-of-the-art stenting devices.
3.2 Introduction
Since the introduction of coronary stenting in 1990, it has received significant praise and
attention from both the medical and engineering communities [43]. Providing a chronic
support against luminal constrictions, stents, which mostly resemble tubular meshes,
have found their way in numerous ducts and lumens through the body [46-48] and more
specifically in coronary arteries [213]. Despite their widespread use, these implants often
fail to achieve 80‒60% of the cross sectional area (CSA) of their expanding balloon [101].
This phenomenon, referred to as stent recoil, is one of the leading risk factors of in-stent
restenosis [102, 187].
To address stent recoil, a recoil resilient luminal support is introduced in Chapter 2. The
new scaffold called the recoil resilient ring (RRR) [103] is an overlapping open ring with
asymmetric sawtooth structures that facilitate expansion in one direction and interlock
upon compression. This device may be utilized either as a standalone support or inte-
grated with the current state-of-the-art stents to provide further resilience against recoil
while not sacrificing the stent’s longitudinal flexibility. The merit of the proposed RRR
for decreasing recoil, henceforth recoil related complications, has been demonstrated in
Chapter 3 Hemodynamic Risk Assessment by CFD
Page 74
Chapter 2 and [103] through extensive numerical modeling and experimental evalua-
tions.
Optimum scaffolding and minimal stent profile, thus minimal alterations of hemody-
namics after deployment, are competing objectives that present a significant challenge in
stent design. Physiological recurrence and progression of atherosclerotic plaques in the
stented lesions is a complicated phenomenon yet to be understood properly [158, 214].
Despite these facts, a number of studies have demonstrated the effect of geometrical
properties of stents as a critical indicator in occurrence and development of restenosis
[162, 165, 215, 216].
Factors such as distribution of low wall shear stress (LWSS) after deployment of stents
appear to present viable initiation causes for the development of atherombose and ather-
osclerotic formations [158, 217, 218]. Stent struts that protrude against the flow of blood
into the lumen may introduce vortices and stagnation zones that directly influence the
spatial and temporal distribution of wall shear stress. As reported by the significant
amount of research in the literature [158, 161, 214, 219-222] these changes are highly de-
pendent on the geometrical properties of stents such as the length and most importantly
the struts dimensions and configuration, among others. Upon approach of fatty cells to
the vessel walls, the shear stress, which is dictated by the fluid regime, determines ad-
herence of these cells to the walls. As a result, regions with lower shear stress are more
prone to accumulation of fatty tissue [222-224]. Particularly, a correlation between LWSS
(< 0.5 Pa) and early intimal thickening leading to restenosis has been discovered [204,
205, 216]. On the other hand, high and moderate wall shear stress is considered to be
beneficial against proliferation of intimal cells [225-227]. The in vivo and in vitro studies
further confirmed the influence of stent structures on wall shear stress distribution,
which can result in restenosis and thrombus formation in the deployment area [159, 164,
216, 228]. Consequently, with any new stent structure, the study of its effect on the fluid
regime after deployment is of paramount importance.
Computational fluid dynamics (CFD) modeling has the advantage of flexibility and re-
peatability compared to the experimental methods. Moreover, it can provide detailed
insight into critical flow parameters at the deployment region close to the stent struts and
the arterial walls where it is very hard, if not impossible, to acquire such data experimen-
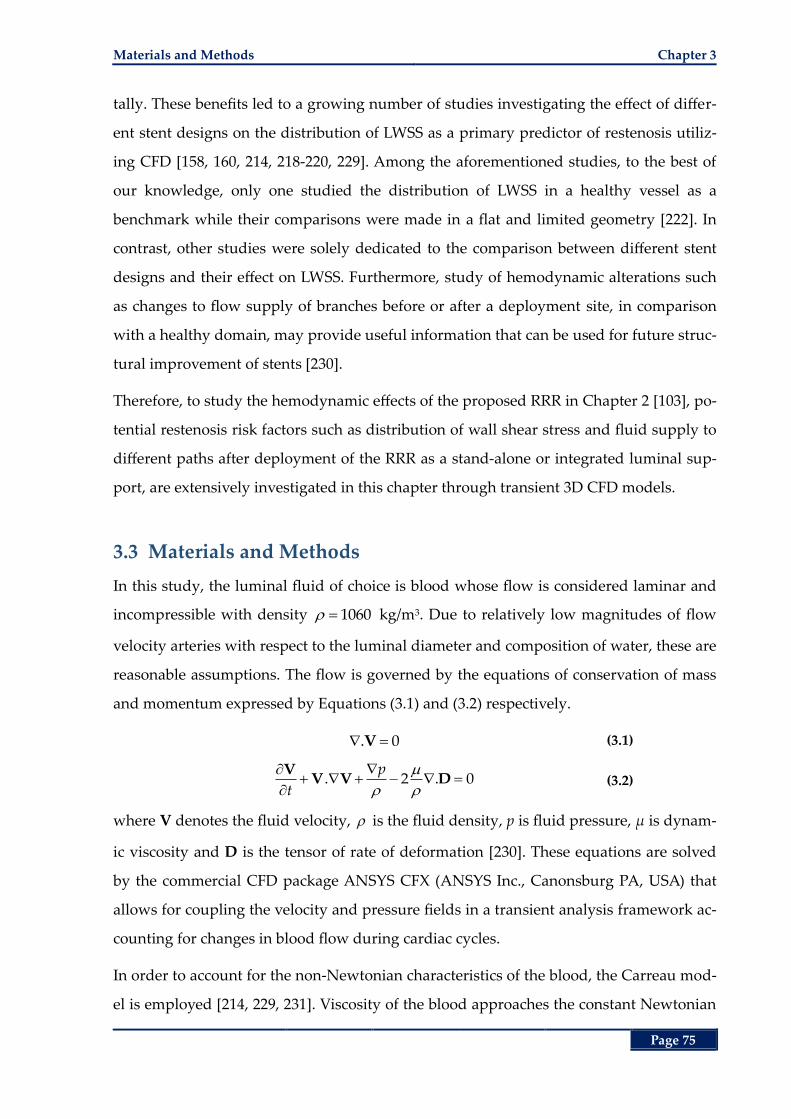
Materials and Methods Chapter 3
Page 75
tally. These benefits led to a growing number of studies investigating the effect of differ-
ent stent designs on the distribution of LWSS as a primary predictor of restenosis utiliz-
ing CFD [158, 160, 214, 218-220, 229]. Among the aforementioned studies, to the best of
our knowledge, only one studied the distribution of LWSS in a healthy vessel as a
benchmark while their comparisons were made in a flat and limited geometry [222]. In
contrast, other studies were solely dedicated to the comparison between different stent
designs and their effect on LWSS. Furthermore, study of hemodynamic alterations such
as changes to flow supply of branches before or after a deployment site, in comparison
with a healthy domain, may provide useful information that can be used for future struc-
tural improvement of stents [230].
Therefore, to study the hemodynamic effects of the proposed RRR in Chapter 2 [103], po-
tential restenosis risk factors such as distribution of wall shear stress and fluid supply to
different paths after deployment of the RRR as a stand-alone or integrated luminal sup-
port, are extensively investigated in this chapter through transient 3D CFD models.
3.3 Materials and Methods
In this study, the luminal fluid of choice is blood whose flow is considered laminar and
incompressible with density 1060 kg/m3. Due to relatively low magnitudes of flow
velocity arteries with respect to the luminal diameter and composition of water, these are
reasonable assumptions. The flow is governed by the equations of conservation of mass
and momentum expressed by Equations (3.1) and (3.2) respectively.
. 0V (3.1)
. 2 . 0
p
t
VV V D (3.2)
where V denotes the fluid velocity, is the fluid density, p is fluid pressure, µ is dynam-
ic viscosity and D is the tensor of rate of deformation [230]. These equations are solved
by the commercial CFD package ANSYS CFX (ANSYS Inc., Canonsburg PA, USA) that
allows for coupling the velocity and pressure fields in a transient analysis framework ac-
counting for changes in blood flow during cardiac cycles.
In order to account for the non-Newtonian characteristics of the blood, the Carreau mod-
el is employed [214, 229, 231]. Viscosity of the blood approaches the constant Newtonian
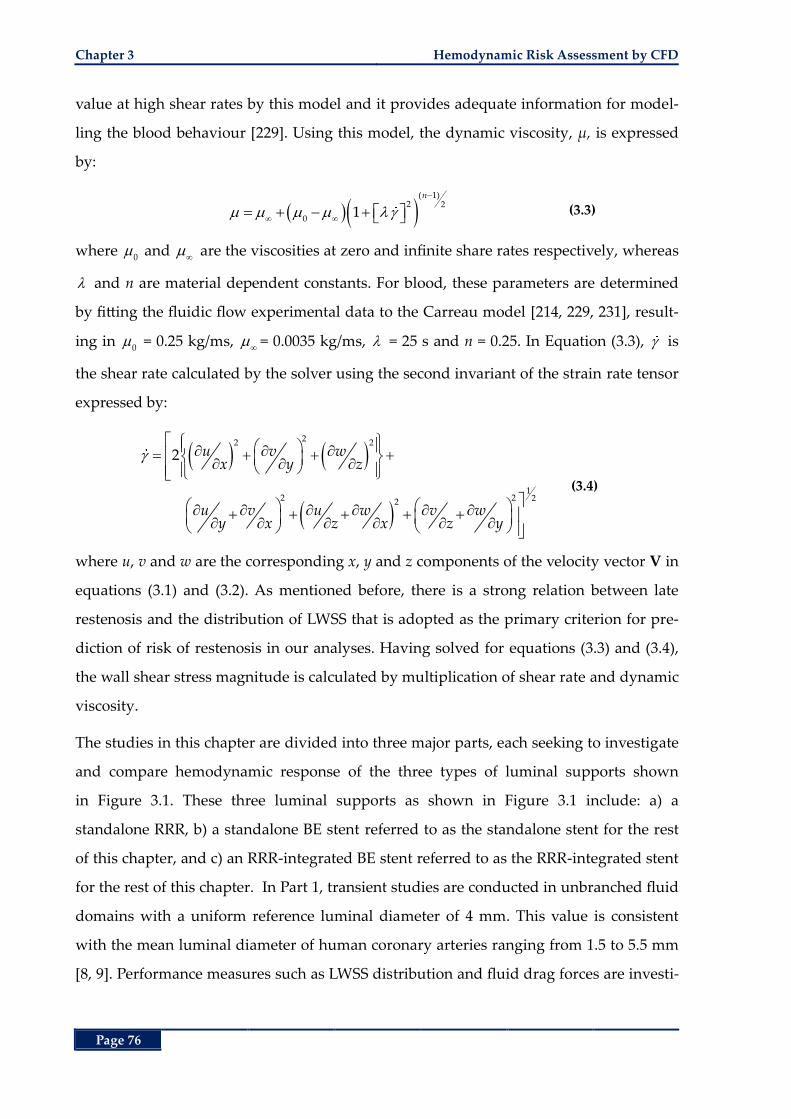
Chapter 3 Hemodynamic Risk Assessment by CFD
Page 76
value at high shear rates by this model and it provides adequate information for model-
ling the blood behaviour [229]. Using this model, the dynamic viscosity, µ, is expressed
by:
( 1)2 2
01
n
(3.3)
where 0 and
are the viscosities at zero and infinite share rates respectively, whereas
and n are material dependent constants. For blood, these parameters are determined
by fitting the fluidic flow experimental data to the Carreau model [214, 229, 231], result-
ing in 0 = 0.25 kg/ms,
= 0.0035 kg/ms, = 25 s and n = 0.25. In Equation (3.3), is
the shear rate calculated by the solver using the second invariant of the strain rate tensor
expressed by:
22 2
12 2 22
2 u v wx y z
u v u w v wy x z x z y
(3.4)
where u, v and w are the corresponding x, y and z components of the velocity vector V in
equations (3.1) and (3.2). As mentioned before, there is a strong relation between late
restenosis and the distribution of LWSS that is adopted as the primary criterion for pre-
diction of risk of restenosis in our analyses. Having solved for equations (3.3) and (3.4),
the wall shear stress magnitude is calculated by multiplication of shear rate and dynamic
viscosity.
The studies in this chapter are divided into three major parts, each seeking to investigate
and compare hemodynamic response of the three types of luminal supports shown
in Figure 3.1. These three luminal supports as shown in Figure 3.1 include: a) a
standalone RRR, b) a standalone BE stent referred to as the standalone stent for the rest
of this chapter, and c) an RRR-integrated BE stent referred to as the RRR-integrated stent
for the rest of this chapter. In Part 1, transient studies are conducted in unbranched fluid
domains with a uniform reference luminal diameter of 4 mm. This value is consistent
with the mean luminal diameter of human coronary arteries ranging from 1.5 to 5.5 mm
[8, 9]. Performance measures such as LWSS distribution and fluid drag forces are investi-
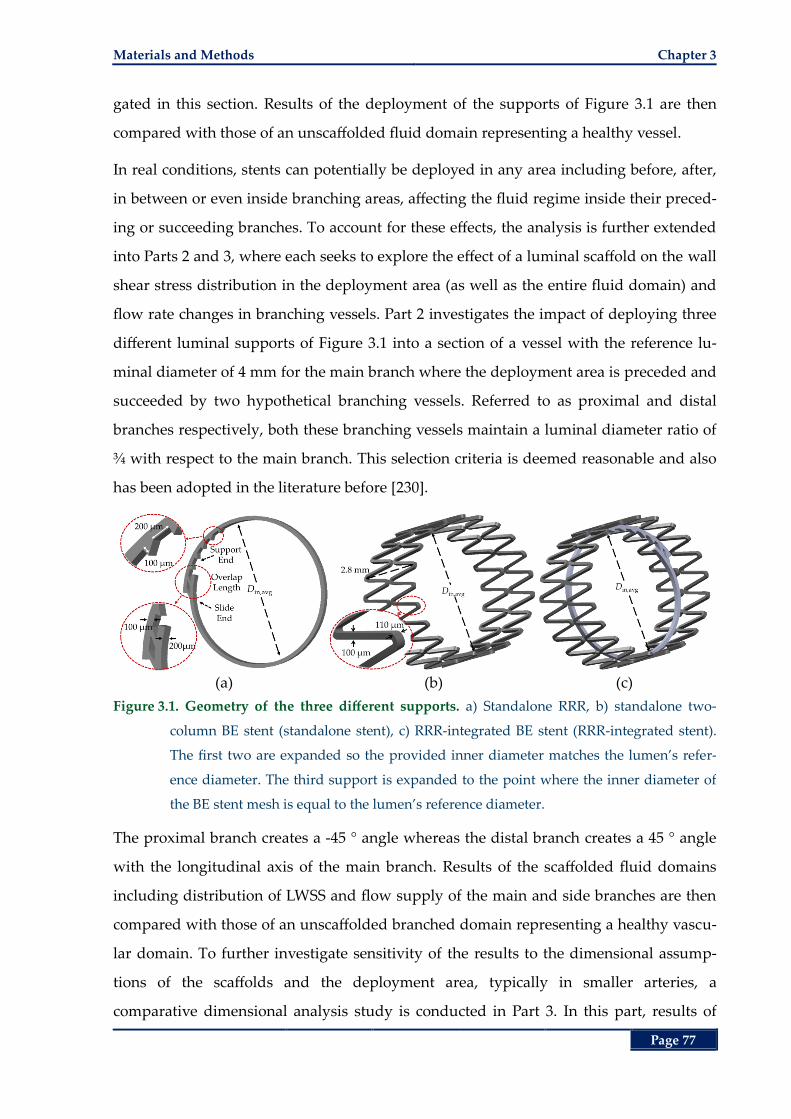
Materials and Methods Chapter 3
Page 77
gated in this section. Results of the deployment of the supports of Figure 3.1 are then
compared with those of an unscaffolded fluid domain representing a healthy vessel.
In real conditions, stents can potentially be deployed in any area including before, after,
in between or even inside branching areas, affecting the fluid regime inside their preced-
ing or succeeding branches. To account for these effects, the analysis is further extended
into Parts 2 and 3, where each seeks to explore the effect of a luminal scaffold on the wall
shear stress distribution in the deployment area (as well as the entire fluid domain) and
flow rate changes in branching vessels. Part 2 investigates the impact of deploying three
different luminal supports of Figure 3.1 into a section of a vessel with the reference lu-
minal diameter of 4 mm for the main branch where the deployment area is preceded and
succeeded by two hypothetical branching vessels. Referred to as proximal and distal
branches respectively, both these branching vessels maintain a luminal diameter ratio of
¾ with respect to the main branch. This selection criteria is deemed reasonable and also
has been adopted in the literature before [230].
(a) (b) (c)
Figure 3.1. Geometry of the three different supports. a) Standalone RRR, b) standalone two-
column BE stent (standalone stent), c) RRR-integrated BE stent (RRR-integrated stent).
The first two are expanded so the provided inner diameter matches the lumen’s refer-
ence diameter. The third support is expanded to the point where the inner diameter of
the BE stent mesh is equal to the lumen’s reference diameter.
The proximal branch creates a -45 ° angle whereas the distal branch creates a 45 ° angle
with the longitudinal axis of the main branch. Results of the scaffolded fluid domains
including distribution of LWSS and flow supply of the main and side branches are then
compared with those of an unscaffolded branched domain representing a healthy vascu-
lar domain. To further investigate sensitivity of the results to the dimensional assump-
tions of the scaffolds and the deployment area, typically in smaller arteries, a
comparative dimensional analysis study is conducted in Part 3. In this part, results of
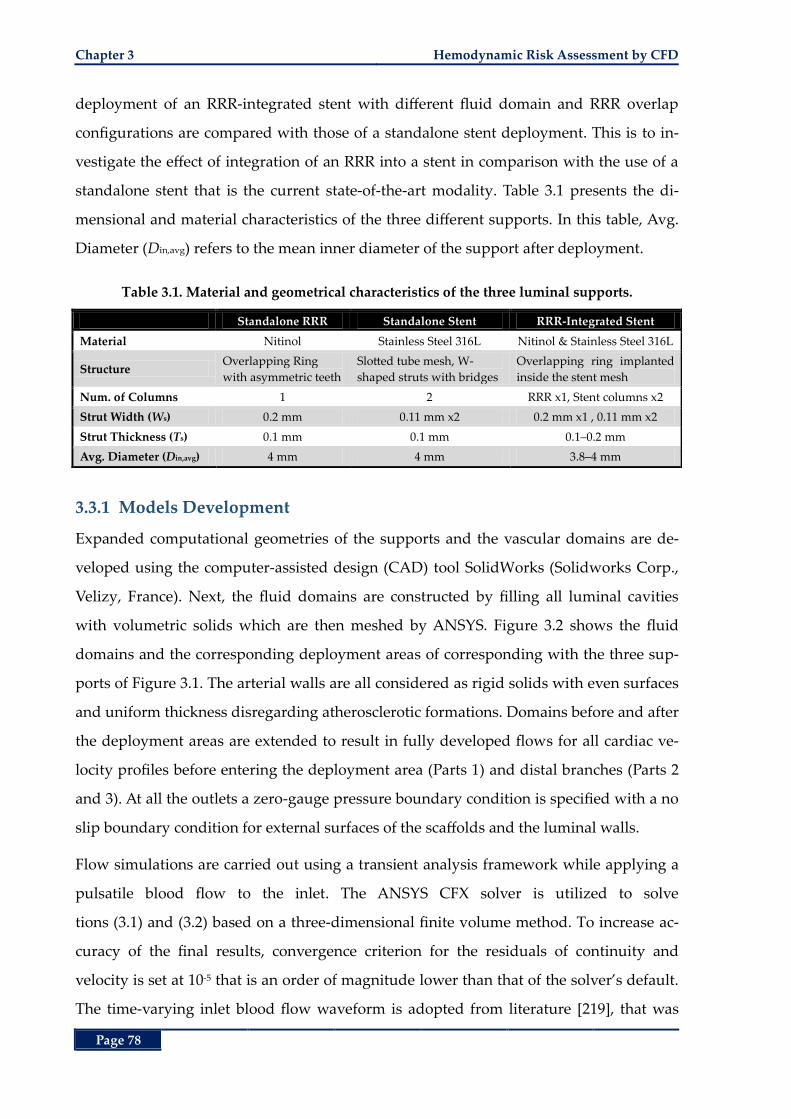
Chapter 3 Hemodynamic Risk Assessment by CFD
Page 78
deployment of an RRR-integrated stent with different fluid domain and RRR overlap
configurations are compared with those of a standalone stent deployment. This is to in-
vestigate the effect of integration of an RRR into a stent in comparison with the use of a
standalone stent that is the current state-of-the-art modality. Table 3.1 presents the di-
mensional and material characteristics of the three different supports. In this table, Avg.
Diameter (Din,avg) refers to the mean inner diameter of the support after deployment.
Table 3.1. Material and geometrical characteristics of the three luminal supports.
Standalone RRR Standalone Stent RRR-Integrated Stent
Material Nitinol Stainless Steel 316L Nitinol & Stainless Steel 316L
Structure Overlapping Ring
with asymmetric teeth
Slotted tube mesh, W-
shaped struts with bridges
Overlapping ring implanted
inside the stent mesh
Num. of Columns 1 2 RRR x1, Stent columns x2
Strut Width (Ws) 0.2 mm 0.11 mm x2 0.2 mm x1 , 0.11 mm x2
Strut Thickness (Ts) 0.1 mm 0.1 mm 0.1‒0.2 mm
Avg. Diameter (Din,avg) 4 mm 4 mm 3.8‒4 mm
3.3.1 Models Development
Expanded computational geometries of the supports and the vascular domains are de-
veloped using the computer-assisted design (CAD) tool SolidWorks (Solidworks Corp.,
Velizy, France). Next, the fluid domains are constructed by filling all luminal cavities
with volumetric solids which are then meshed by ANSYS. Figure 3.2 shows the fluid
domains and the corresponding deployment areas of corresponding with the three sup-
ports of Figure 3.1. The arterial walls are all considered as rigid solids with even surfaces
and uniform thickness disregarding atherosclerotic formations. Domains before and after
the deployment areas are extended to result in fully developed flows for all cardiac ve-
locity profiles before entering the deployment area (Parts 1) and distal branches (Parts 2
and 3). At all the outlets a zero-gauge pressure boundary condition is specified with a no
slip boundary condition for external surfaces of the scaffolds and the luminal walls.
Flow simulations are carried out using a transient analysis framework while applying a
pulsatile blood flow to the inlet. The ANSYS CFX solver is utilized to solve
tions (3.1) and (3.2) based on a three-dimensional finite volume method. To increase ac-
curacy of the final results, convergence criterion for the residuals of continuity and
velocity is set at 10-5 that is an order of magnitude lower than that of the solver’s default.
The time-varying inlet blood flow waveform is adopted from literature [219], that was
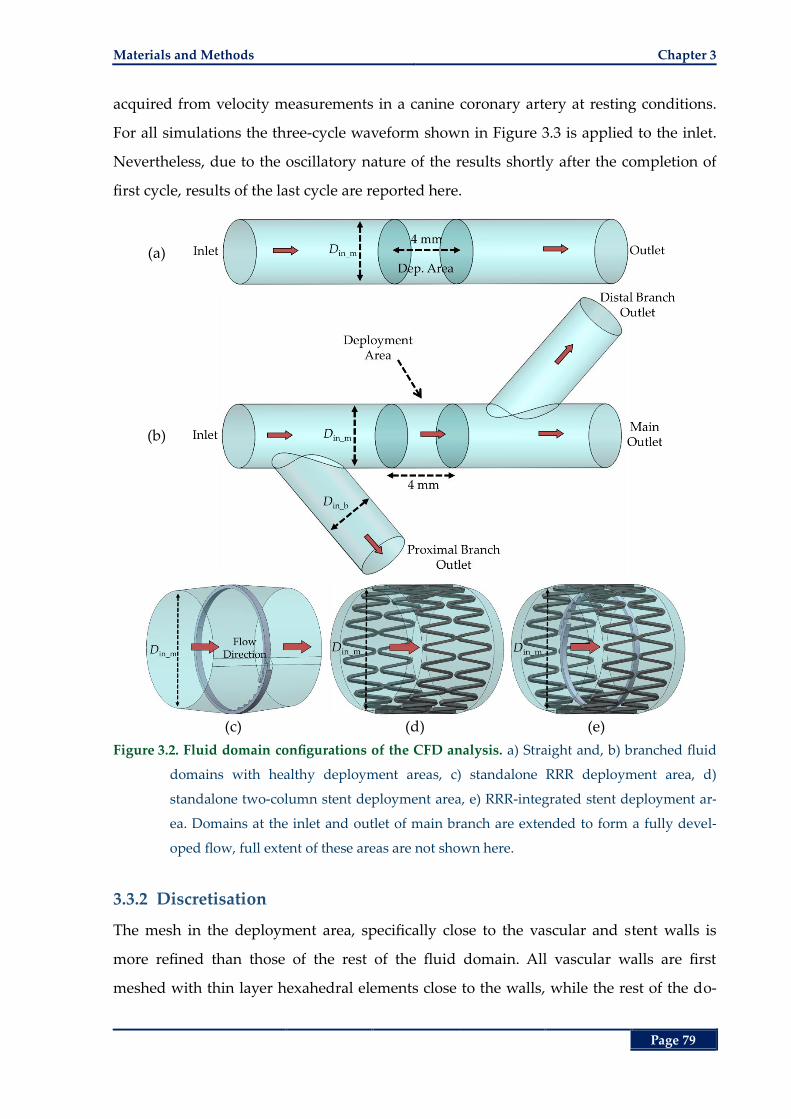
Materials and Methods Chapter 3
Page 79
acquired from velocity measurements in a canine coronary artery at resting conditions.
For all simulations the three-cycle waveform shown in Figure 3.3 is applied to the inlet.
Nevertheless, due to the oscillatory nature of the results shortly after the completion of
first cycle, results of the last cycle are reported here.
(a)
(b)
(c) (d) (e)
Figure 3.2. Fluid domain configurations of the CFD analysis. a) Straight and, b) branched fluid
domains with healthy deployment areas, c) standalone RRR deployment area, d)
standalone two-column stent deployment area, e) RRR-integrated stent deployment ar-
ea. Domains at the inlet and outlet of main branch are extended to form a fully devel-
oped flow, full extent of these areas are not shown here.
3.3.2 Discretisation
The mesh in the deployment area, specifically close to the vascular and stent walls is
more refined than those of the rest of the fluid domain. All vascular walls are first
meshed with thin layer hexahedral elements close to the walls, while the rest of the do-
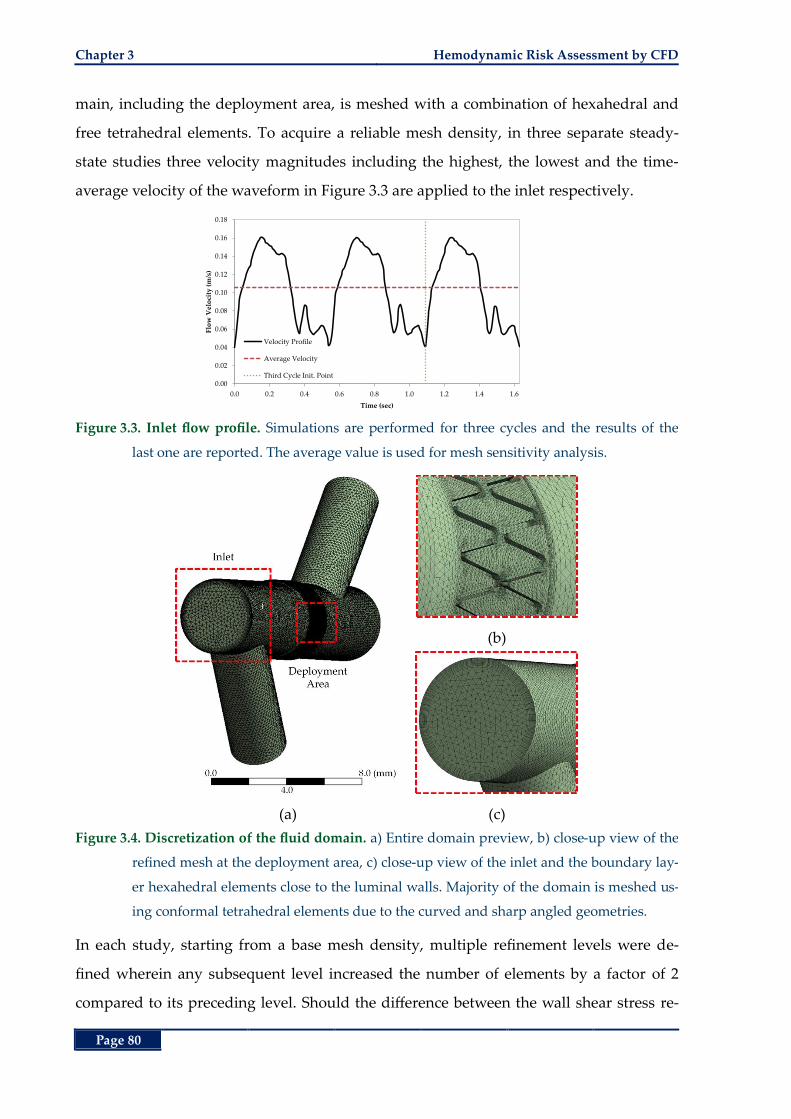
Chapter 3 Hemodynamic Risk Assessment by CFD
Page 80
main, including the deployment area, is meshed with a combination of hexahedral and
free tetrahedral elements. To acquire a reliable mesh density, in three separate steady-
state studies three velocity magnitudes including the highest, the lowest and the time-
average velocity of the waveform in Figure 3.3 are applied to the inlet respectively.
Figure 3.3. Inlet flow profile. Simulations are performed for three cycles and the results of the
last one are reported. The average value is used for mesh sensitivity analysis.
(b)
(a) (c)
Figure 3.4. Discretization of the fluid domain. a) Entire domain preview, b) close-up view of the
refined mesh at the deployment area, c) close-up view of the inlet and the boundary lay-
er hexahedral elements close to the luminal walls. Majority of the domain is meshed us-
ing conformal tetrahedral elements due to the curved and sharp angled geometries.
In each study, starting from a base mesh density, multiple refinement levels were de-
fined wherein any subsequent level increased the number of elements by a factor of 2
compared to its preceding level. Should the difference between the wall shear stress re-
0.00
0.02
0.04
0.06
0.08
0.10
0.12
0.14
0.16
0.18
0.0 0.2 0.4 0.6 0.8 1.0 1.2 1.4 1.6
Flo
w V
elo
city
(m
/s)
Time (sec)
Velocity Profile
Average Velocity
Third Cycle Init. Point
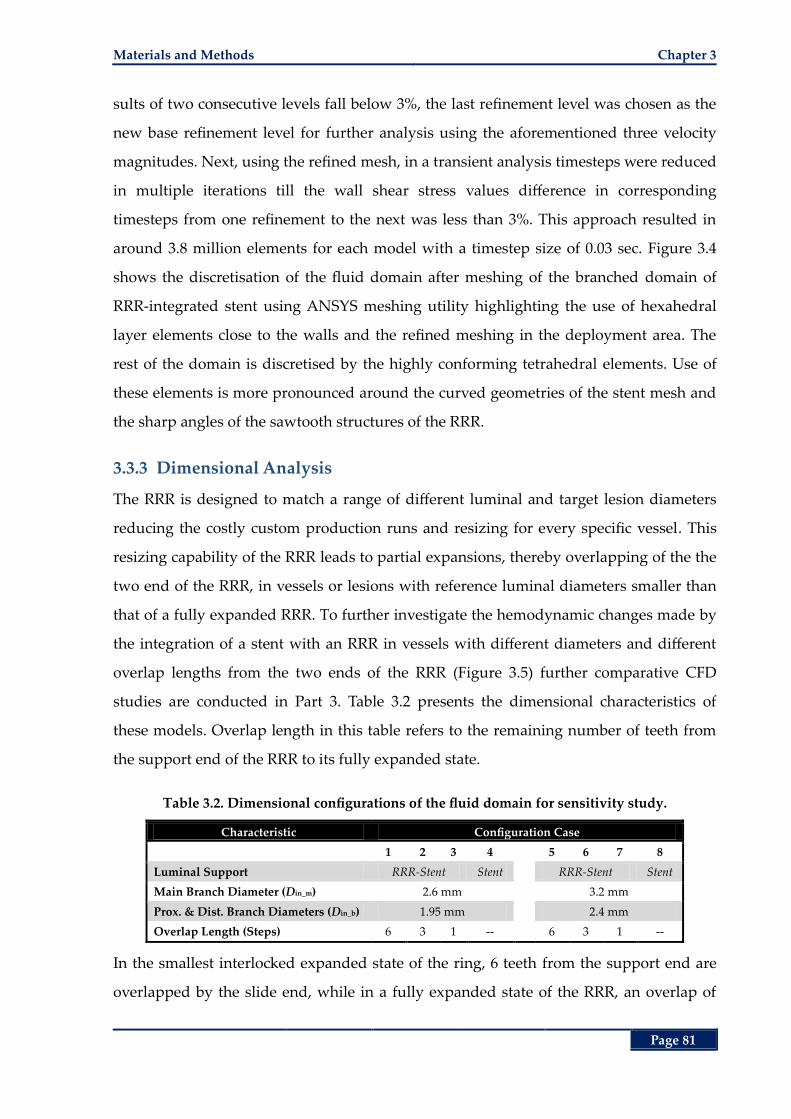
Materials and Methods Chapter 3
Page 81
sults of two consecutive levels fall below 3%, the last refinement level was chosen as the
new base refinement level for further analysis using the aforementioned three velocity
magnitudes. Next, using the refined mesh, in a transient analysis timesteps were reduced
in multiple iterations till the wall shear stress values difference in corresponding
timesteps from one refinement to the next was less than 3%. This approach resulted in
around 3.8 million elements for each model with a timestep size of 0.03 sec. Figure 3.4
shows the discretisation of the fluid domain after meshing of the branched domain of
RRR-integrated stent using ANSYS meshing utility highlighting the use of hexahedral
layer elements close to the walls and the refined meshing in the deployment area. The
rest of the domain is discretised by the highly conforming tetrahedral elements. Use of
these elements is more pronounced around the curved geometries of the stent mesh and
the sharp angles of the sawtooth structures of the RRR.
3.3.3 Dimensional Analysis
The RRR is designed to match a range of different luminal and target lesion diameters
reducing the costly custom production runs and resizing for every specific vessel. This
resizing capability of the RRR leads to partial expansions, thereby overlapping of the the
two end of the RRR, in vessels or lesions with reference luminal diameters smaller than
that of a fully expanded RRR. To further investigate the hemodynamic changes made by
the integration of a stent with an RRR in vessels with different diameters and different
overlap lengths from the two ends of the RRR (Figure 3.5) further comparative CFD
studies are conducted in Part 3. Table 3.2 presents the dimensional characteristics of
these models. Overlap length in this table refers to the remaining number of teeth from
the support end of the RRR to its fully expanded state.
Table 3.2. Dimensional configurations of the fluid domain for sensitivity study.
Characteristic Configuration Case
1 2 3 4
5 6 7 8
Luminal Support RRR-Stent Stent RRR-Stent Stent
Main Branch Diameter (Din_m) 2.6 mm 3.2 mm
Prox. & Dist. Branch Diameters (Din_b) 1.95 mm 2.4 mm
Overlap Length (Steps) 6 3 1 -- 6 3 1 --
In the smallest interlocked expanded state of the ring, 6 teeth from the support end are
overlapped by the slide end, while in a fully expanded state of the RRR, an overlap of
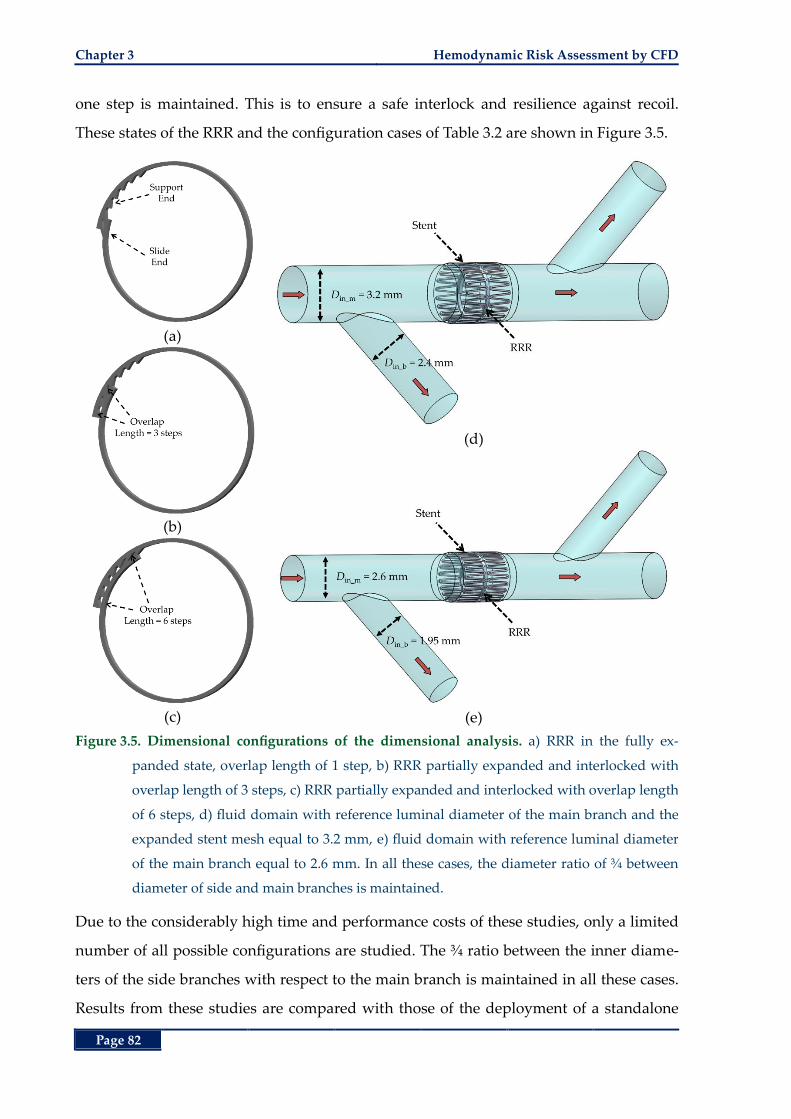
Chapter 3 Hemodynamic Risk Assessment by CFD
Page 82
one step is maintained. This is to ensure a safe interlock and resilience against recoil.
These states of the RRR and the configuration cases of Table 3.2 are shown in Figure 3.5.
(a)
(b)
(c)
(d)
(e)
Figure 3.5. Dimensional configurations of the dimensional analysis. a) RRR in the fully ex-
panded state, overlap length of 1 step, b) RRR partially expanded and interlocked with
overlap length of 3 steps, c) RRR partially expanded and interlocked with overlap length
of 6 steps, d) fluid domain with reference luminal diameter of the main branch and the
expanded stent mesh equal to 3.2 mm, e) fluid domain with reference luminal diameter
of the main branch equal to 2.6 mm. In all these cases, the diameter ratio of ¾ between
diameter of side and main branches is maintained.
Due to the considerably high time and performance costs of these studies, only a limited
number of all possible configurations are studied. The ¾ ratio between the inner diame-
ters of the side branches with respect to the main branch is maintained in all these cases.
Results from these studies are compared with those of the deployment of a standalone
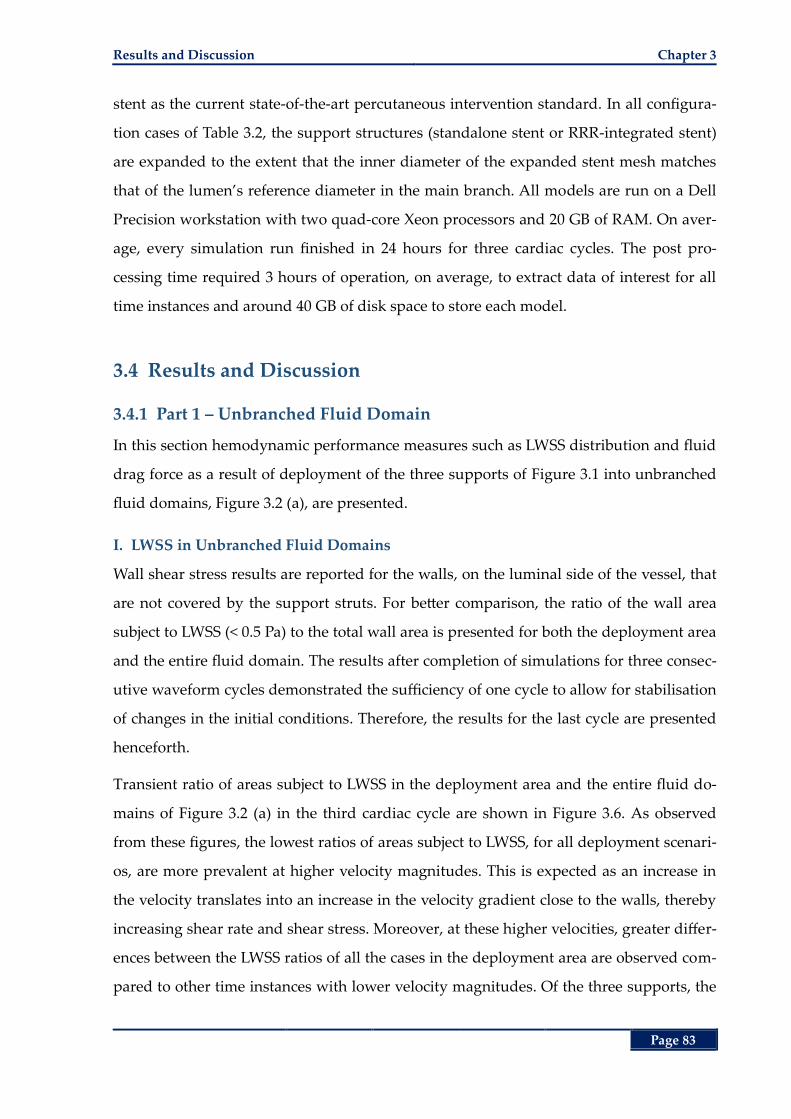
Results and Discussion Chapter 3
Page 83
stent as the current state-of-the-art percutaneous intervention standard. In all configura-
tion cases of Table 3.2, the support structures (standalone stent or RRR-integrated stent)
are expanded to the extent that the inner diameter of the expanded stent mesh matches
that of the lumen’s reference diameter in the main branch. All models are run on a Dell
Precision workstation with two quad-core Xeon processors and 20 GB of RAM. On aver-
age, every simulation run finished in 24 hours for three cardiac cycles. The post pro-
cessing time required 3 hours of operation, on average, to extract data of interest for all
time instances and around 40 GB of disk space to store each model.
3.4 Results and Discussion
3.4.1 Part 1 – Unbranched Fluid Domain
In this section hemodynamic performance measures such as LWSS distribution and fluid
drag force as a result of deployment of the three supports of Figure 3.1 into unbranched
fluid domains, Figure 3.2 (a), are presented.
I. LWSS in Unbranched Fluid Domains
Wall shear stress results are reported for the walls, on the luminal side of the vessel, that
are not covered by the support struts. For better comparison, the ratio of the wall area
subject to LWSS (< 0.5 Pa) to the total wall area is presented for both the deployment area
and the entire fluid domain. The results after completion of simulations for three consec-
utive waveform cycles demonstrated the sufficiency of one cycle to allow for stabilisation
of changes in the initial conditions. Therefore, the results for the last cycle are presented
henceforth.
Transient ratio of areas subject to LWSS in the deployment area and the entire fluid do-
mains of Figure 3.2 (a) in the third cardiac cycle are shown in Figure 3.6. As observed
from these figures, the lowest ratios of areas subject to LWSS, for all deployment scenari-
os, are more prevalent at higher velocity magnitudes. This is expected as an increase in
the velocity translates into an increase in the velocity gradient close to the walls, thereby
increasing shear rate and shear stress. Moreover, at these higher velocities, greater differ-
ences between the LWSS ratios of all the cases in the deployment area are observed com-
pared to other time instances with lower velocity magnitudes. Of the three supports, the
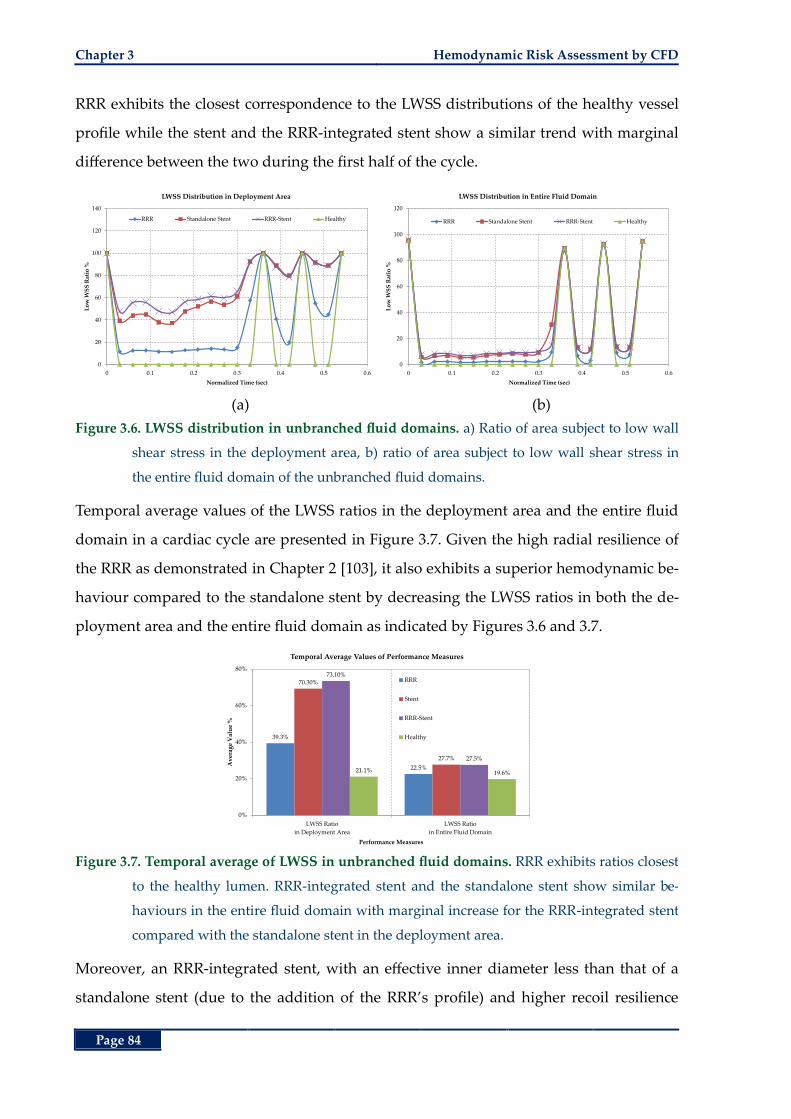
Chapter 3 Hemodynamic Risk Assessment by CFD
Page 84
RRR exhibits the closest correspondence to the LWSS distributions of the healthy vessel
profile while the stent and the RRR-integrated stent show a similar trend with marginal
difference between the two during the first half of the cycle.
(a) (b)
Figure 3.6. LWSS distribution in unbranched fluid domains. a) Ratio of area subject to low wall
shear stress in the deployment area, b) ratio of area subject to low wall shear stress in
the entire fluid domain of the unbranched fluid domains.
Temporal average values of the LWSS ratios in the deployment area and the entire fluid
domain in a cardiac cycle are presented in Figure 3.7. Given the high radial resilience of
the RRR as demonstrated in Chapter 2 [103], it also exhibits a superior hemodynamic be-
haviour compared to the standalone stent by decreasing the LWSS ratios in both the de-
ployment area and the entire fluid domain as indicated by Figures 3.6 and 3.7.
Figure 3.7. Temporal average of LWSS in unbranched fluid domains. RRR exhibits ratios closest
to the healthy lumen. RRR-integrated stent and the standalone stent show similar be-
haviours in the entire fluid domain with marginal increase for the RRR-integrated stent
compared with the standalone stent in the deployment area.
Moreover, an RRR-integrated stent, with an effective inner diameter less than that of a
standalone stent (due to the addition of the RRR’s profile) and higher recoil resilience
0
20
40
60
80
100
120
140
0 0.1 0.2 0.3 0.4 0.5 0.6
Lo
w W
SS
Rat
io %
Normalized Time (sec)
LWSS Distribution in Deployment Area
RRR Standalone Stent RRR-Stent Healthy
0
20
40
60
80
100
120
0 0.1 0.2 0.3 0.4 0.5 0.6
Lo
w W
SS
Rat
io %
Normalized Time (sec)
LWSS Distribution in Entire Fluid Domain
RRR Standalone Stent RRR-Stent Healthy
39.3%
22.5%
70.30%
27.7%
73.10%
27.5%
21.1% 19.6%
0%
20%
40%
60%
80%
LWSS Ratio
in Deployment Area
LWSS Ratio
in Entire Fluid Domain
Av
erag
e V
alu
e %
Performance Measures
Temporal Average Values of Performance Measures
RRR
Stent
RRR-Stent
Healthy
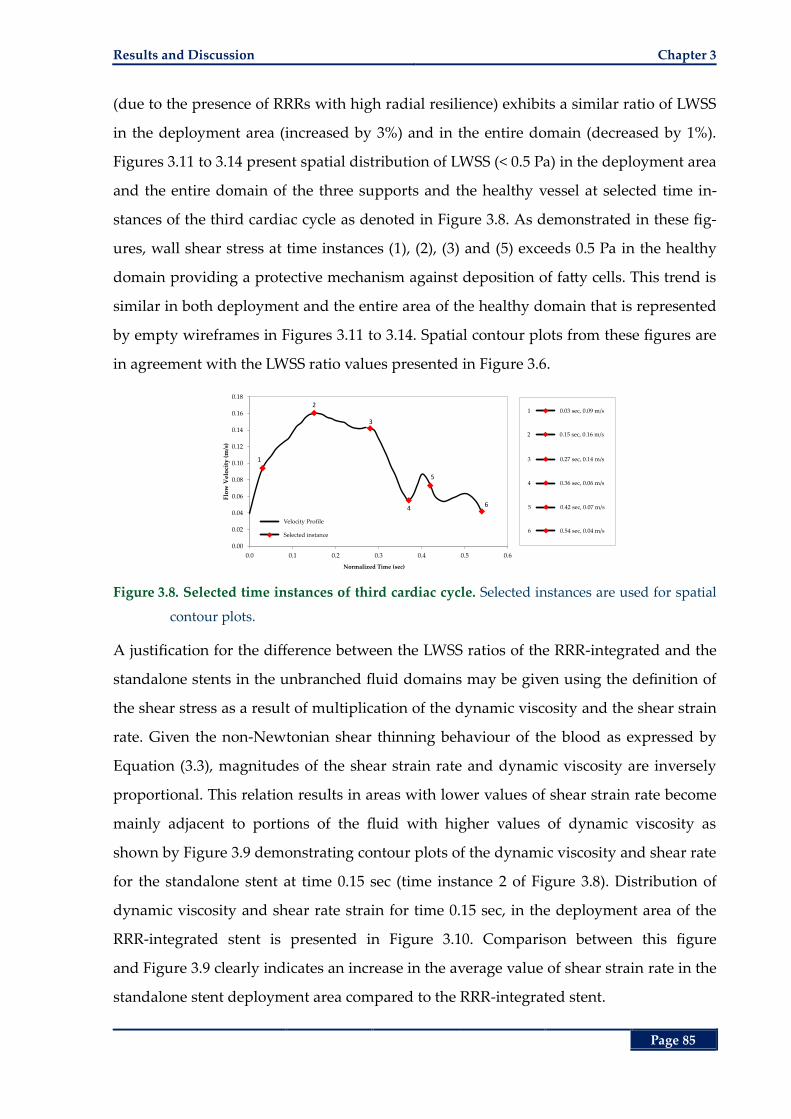
Results and Discussion Chapter 3
Page 85
(due to the presence of RRRs with high radial resilience) exhibits a similar ratio of LWSS
in the deployment area (increased by 3%) and in the entire domain (decreased by 1%).
Figures 3.11 to 3.14 present spatial distribution of LWSS (< 0.5 Pa) in the deployment area
and the entire domain of the three supports and the healthy vessel at selected time in-
stances of the third cardiac cycle as denoted in Figure 3.8. As demonstrated in these fig-
ures, wall shear stress at time instances (1), (2), (3) and (5) exceeds 0.5 Pa in the healthy
domain providing a protective mechanism against deposition of fatty cells. This trend is
similar in both deployment and the entire area of the healthy domain that is represented
by empty wireframes in Figures 3.11 to 3.14. Spatial contour plots from these figures are
in agreement with the LWSS ratio values presented in Figure 3.6.
Figure 3.8. Selected time instances of third cardiac cycle. Selected instances are used for spatial
contour plots.
A justification for the difference between the LWSS ratios of the RRR-integrated and the
standalone stents in the unbranched fluid domains may be given using the definition of
the shear stress as a result of multiplication of the dynamic viscosity and the shear strain
rate. Given the non-Newtonian shear thinning behaviour of the blood as expressed by
Equation (3.3), magnitudes of the shear strain rate and dynamic viscosity are inversely
proportional. This relation results in areas with lower values of shear strain rate become
mainly adjacent to portions of the fluid with higher values of dynamic viscosity as
shown by Figure 3.9 demonstrating contour plots of the dynamic viscosity and shear rate
for the standalone stent at time 0.15 sec (time instance 2 of Figure 3.8). Distribution of
dynamic viscosity and shear rate strain for time 0.15 sec, in the deployment area of the
RRR-integrated stent is presented in Figure 3.10. Comparison between this figure
and Figure 3.9 clearly indicates an increase in the average value of shear strain rate in the
standalone stent deployment area compared to the RRR-integrated stent.
0.03 sec, 0.09 m/s1
0.15 sec, 0.16 m/s2
0.27 sec, 0.14 m/s3
0.36 sec, 0.06 m/s4
0.42 sec, 0.07 m/s5
0.54 sec, 0.04 m/s6
0.00
0.02
0.04
0.06
0.08
0.10
0.12
0.14
0.16
0.18
0.0 0.1 0.2 0.3 0.4 0.5 0.6
Flo
w V
elo
city
(m
/s)
Time (sec)
1
2
3
4
5
6
Velocity Profile
Selected instance
Normalized Time (sec)
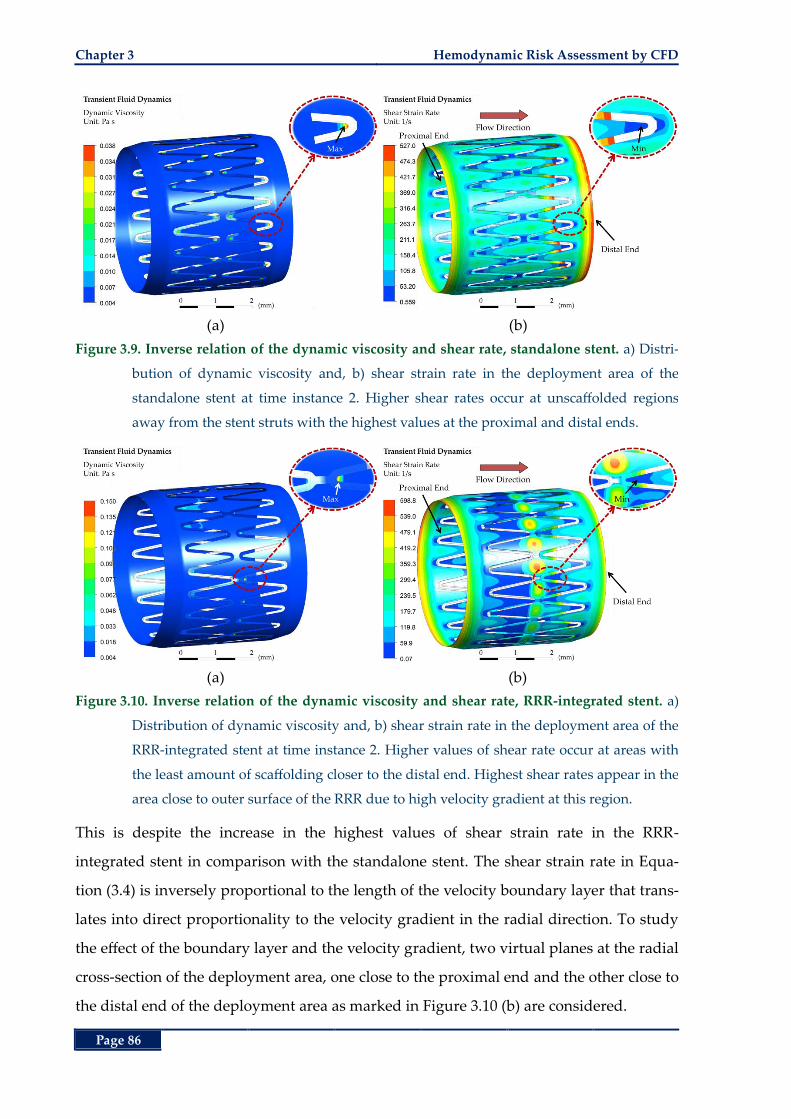
Chapter 3 Hemodynamic Risk Assessment by CFD
Page 86
(a) (b)
Figure 3.9. Inverse relation of the dynamic viscosity and shear rate, standalone stent. a) Distri-
bution of dynamic viscosity and, b) shear strain rate in the deployment area of the
standalone stent at time instance 2. Higher shear rates occur at unscaffolded regions
away from the stent struts with the highest values at the proximal and distal ends.
(a) (b)
Figure 3.10. Inverse relation of the dynamic viscosity and shear rate, RRR-integrated stent. a)
Distribution of dynamic viscosity and, b) shear strain rate in the deployment area of the
RRR-integrated stent at time instance 2. Higher values of shear rate occur at areas with
the least amount of scaffolding closer to the distal end. Highest shear rates appear in the
area close to outer surface of the RRR due to high velocity gradient at this region.
This is despite the increase in the highest values of shear strain rate in the RRR-
integrated stent in comparison with the standalone stent. The shear strain rate in Equa-
tion (3.4) is inversely proportional to the length of the velocity boundary layer that trans-
lates into direct proportionality to the velocity gradient in the radial direction. To study
the effect of the boundary layer and the velocity gradient, two virtual planes at the radial
cross-section of the deployment area, one close to the proximal end and the other close to
the distal end of the deployment area as marked in Figure 3.10 (b) are considered.
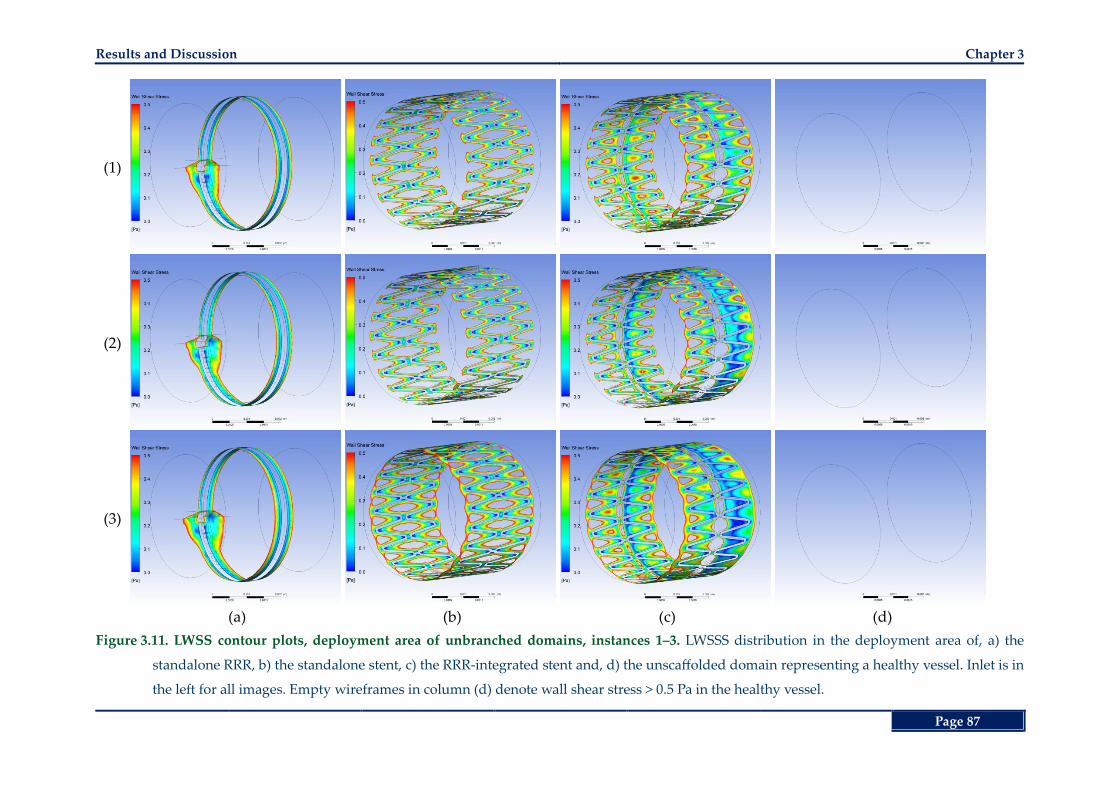
Results and Discussion Chapter 3
Page 87
(1)
(2)
(3)
(a) (b) (c) (d)
Figure 3.11. LWSS contour plots, deployment area of unbranched domains, instances 1‒3. LWSSS distribution in the deployment area of, a) the
standalone RRR, b) the standalone stent, c) the RRR-integrated stent and, d) the unscaffolded domain representing a healthy vessel. Inlet is in
the left for all images. Empty wireframes in column (d) denote wall shear stress > 0.5 Pa in the healthy vessel.
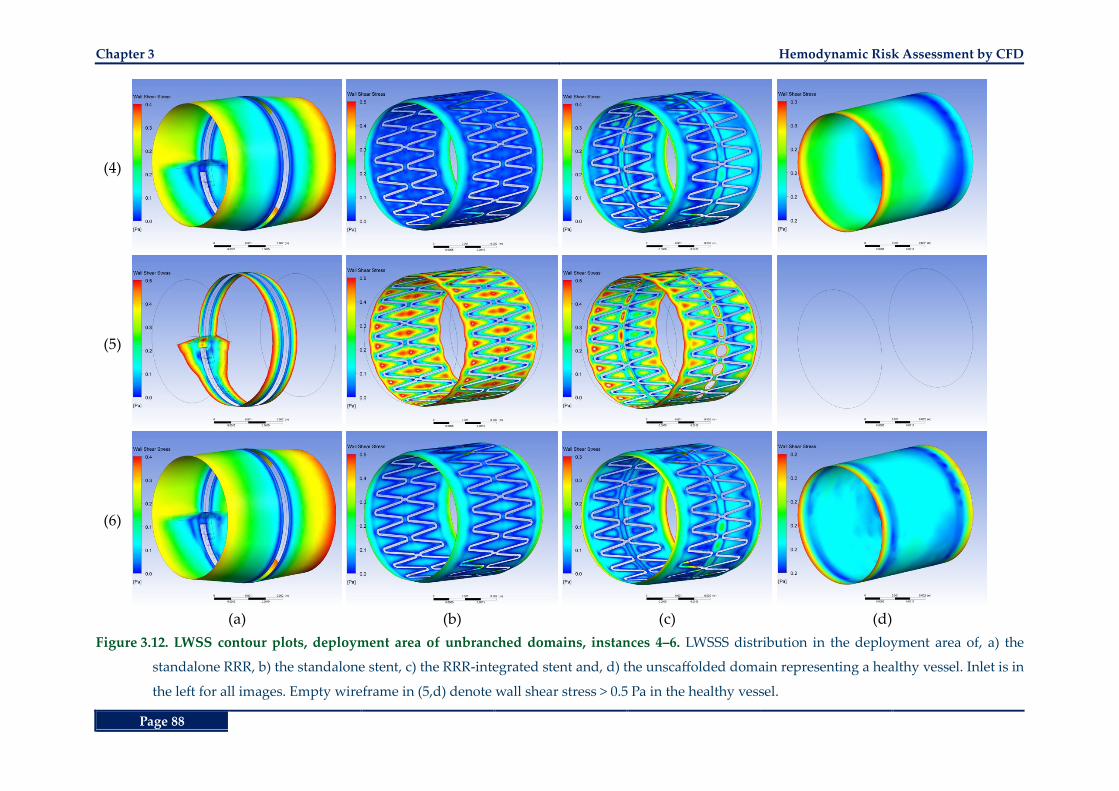
Chapter 3 Hemodynamic Risk Assessment by CFD
Page 88
(4)
(5)
(6)
(a) (b) (c) (d)
Figure 3.12. LWSS contour plots, deployment area of unbranched domains, instances 4‒6. LWSSS distribution in the deployment area of, a) the
standalone RRR, b) the standalone stent, c) the RRR-integrated stent and, d) the unscaffolded domain representing a healthy vessel. Inlet is in
the left for all images. Empty wireframe in (5,d) denote wall shear stress > 0.5 Pa in the healthy vessel.
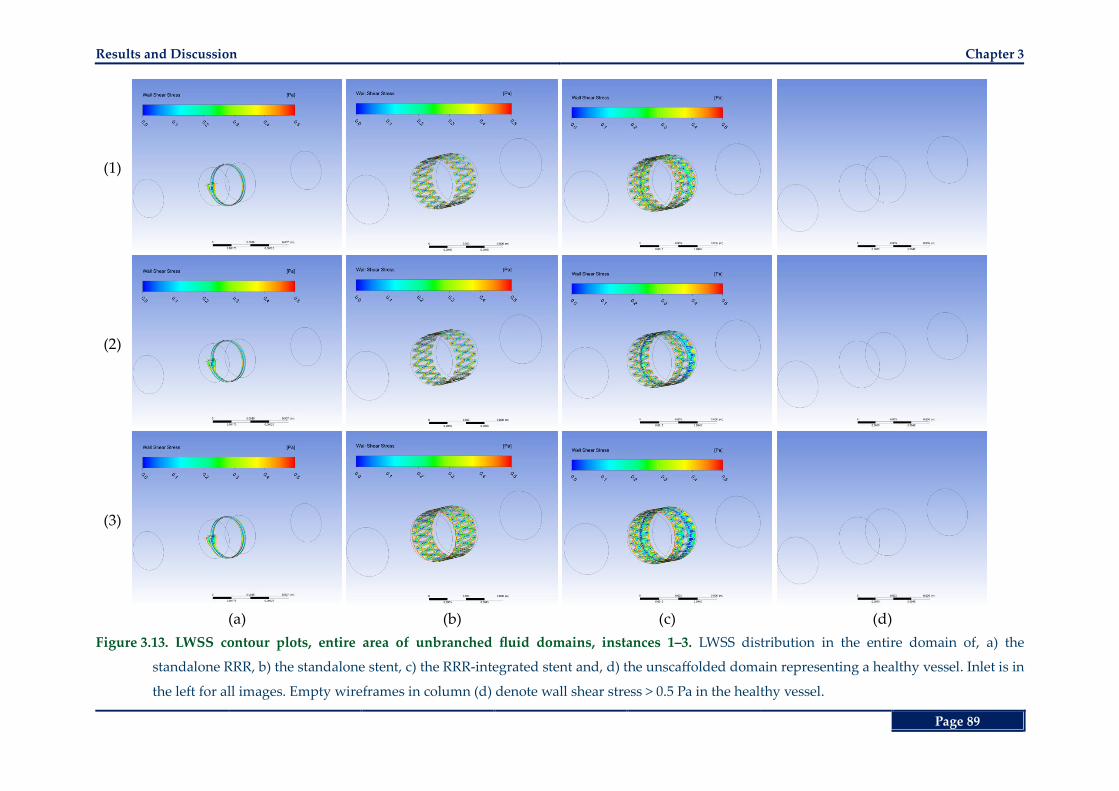
Results and Discussion Chapter 3
Page 89
(1)
(2)
(3)
(a) (b) (c) (d)
Figure 3.13. LWSS contour plots, entire area of unbranched fluid domains, instances 1‒3. LWSS distribution in the entire domain of, a) the
standalone RRR, b) the standalone stent, c) the RRR-integrated stent and, d) the unscaffolded domain representing a healthy vessel. Inlet is in
the left for all images. Empty wireframes in column (d) denote wall shear stress > 0.5 Pa in the healthy vessel.
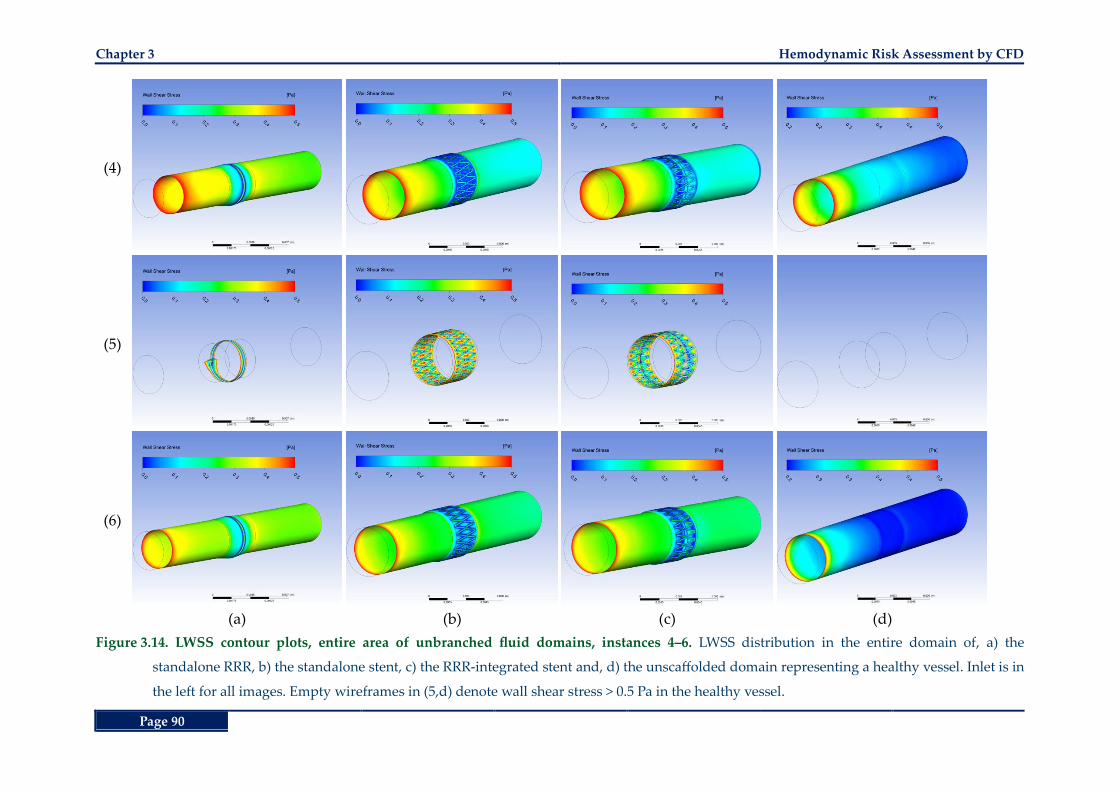
Chapter 3 Hemodynamic Risk Assessment by CFD
Page 90
(4)
(5)
(6)
(a) (b) (c) (d)
Figure 3.14. LWSS contour plots, entire area of unbranched fluid domains, instances 4‒6. LWSS distribution in the entire domain of, a) the
standalone RRR, b) the standalone stent, c) the RRR-integrated stent and, d) the unscaffolded domain representing a healthy vessel. Inlet is in
the left for all images. Empty wireframes in (5,d) denote wall shear stress > 0.5 Pa in the healthy vessel.
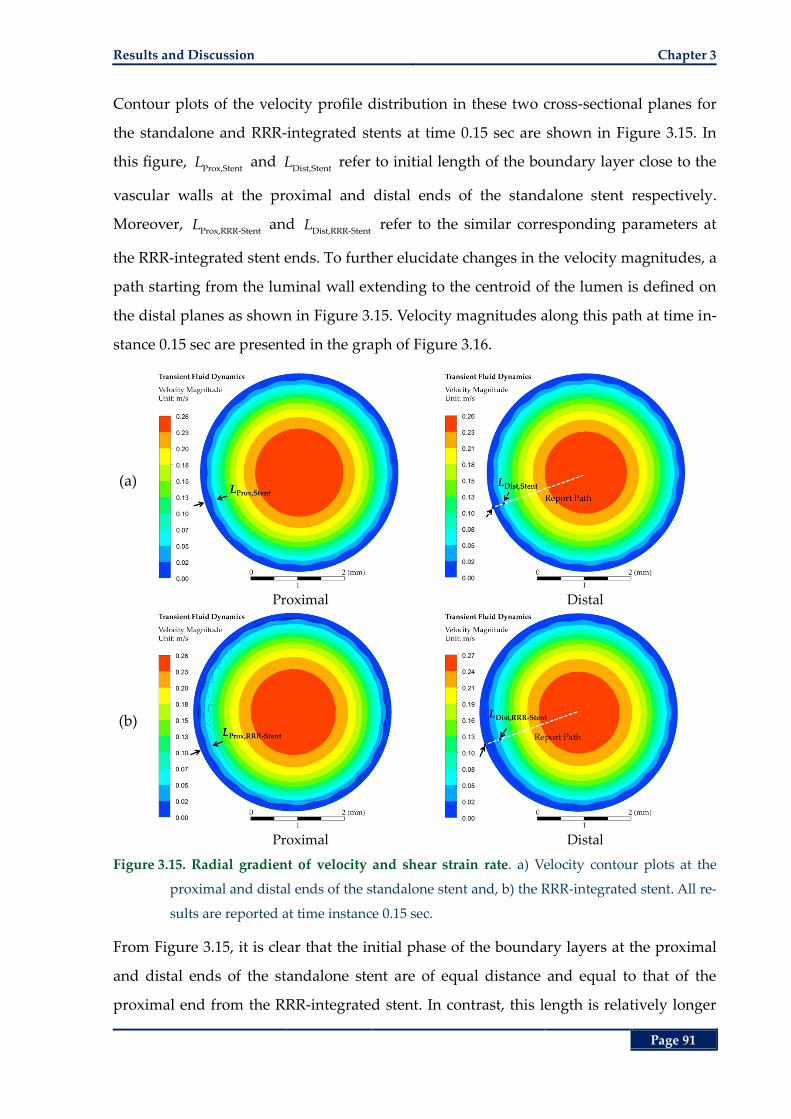
Results and Discussion Chapter 3
Page 91
Contour plots of the velocity profile distribution in these two cross-sectional planes for
the standalone and RRR-integrated stents at time 0.15 sec are shown in Figure 3.15. In
this figure, Prox,Stent
L and Dist,Stent
L refer to initial length of the boundary layer close to the
vascular walls at the proximal and distal ends of the standalone stent respectively.
Moreover, Prox,RRR-Stent
L and Dist,RRR-Stent
L refer to the similar corresponding parameters at
the RRR-integrated stent ends. To further elucidate changes in the velocity magnitudes, a
path starting from the luminal wall extending to the centroid of the lumen is defined on
the distal planes as shown in Figure 3.15. Velocity magnitudes along this path at time in-
stance 0.15 sec are presented in the graph of Figure 3.16.
(a)
Proximal Distal
(b)
Proximal Distal
Figure 3.15. Radial gradient of velocity and shear strain rate. a) Velocity contour plots at the
proximal and distal ends of the standalone stent and, b) the RRR-integrated stent. All re-
sults are reported at time instance 0.15 sec.
From Figure 3.15, it is clear that the initial phase of the boundary layers at the proximal
and distal ends of the standalone stent are of equal distance and equal to that of the
proximal end from the RRR-integrated stent. In contrast, this length is relatively longer
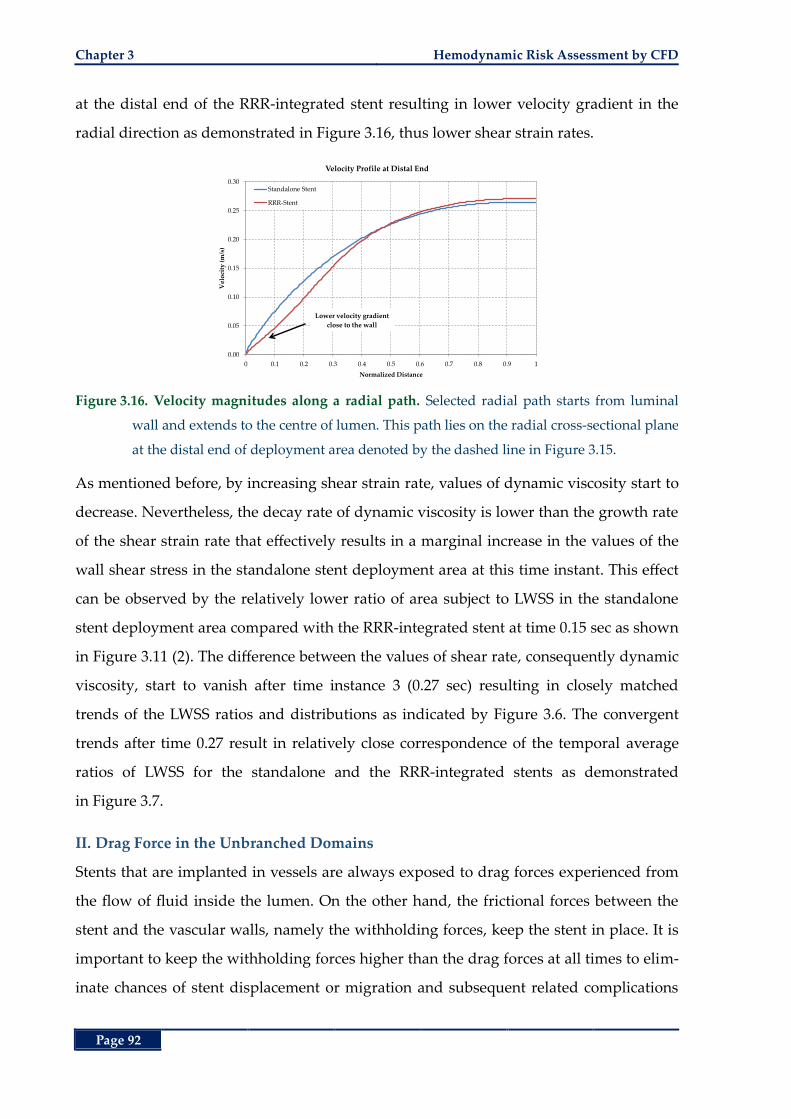
Chapter 3 Hemodynamic Risk Assessment by CFD
Page 92
at the distal end of the RRR-integrated stent resulting in lower velocity gradient in the
radial direction as demonstrated in Figure 3.16, thus lower shear strain rates.
Figure 3.16. Velocity magnitudes along a radial path. Selected radial path starts from luminal
wall and extends to the centre of lumen. This path lies on the radial cross-sectional plane
at the distal end of deployment area denoted by the dashed line in Figure 3.15.
As mentioned before, by increasing shear strain rate, values of dynamic viscosity start to
decrease. Nevertheless, the decay rate of dynamic viscosity is lower than the growth rate
of the shear strain rate that effectively results in a marginal increase in the values of the
wall shear stress in the standalone stent deployment area at this time instant. This effect
can be observed by the relatively lower ratio of area subject to LWSS in the standalone
stent deployment area compared with the RRR-integrated stent at time 0.15 sec as shown
in Figure 3.11 (2). The difference between the values of shear rate, consequently dynamic
viscosity, start to vanish after time instance 3 (0.27 sec) resulting in closely matched
trends of the LWSS ratios and distributions as indicated by Figure 3.6. The convergent
trends after time 0.27 result in relatively close correspondence of the temporal average
ratios of LWSS for the standalone and the RRR-integrated stents as demonstrated
in Figure 3.7.
II. Drag Force in the Unbranched Domains
Stents that are implanted in vessels are always exposed to drag forces experienced from
the flow of fluid inside the lumen. On the other hand, the frictional forces between the
stent and the vascular walls, namely the withholding forces, keep the stent in place. It is
important to keep the withholding forces higher than the drag forces at all times to elim-
inate chances of stent displacement or migration and subsequent related complications
0.00
0.05
0.10
0.15
0.20
0.25
0.30
0 0.1 0.2 0.3 0.4 0.5 0.6 0.7 0.8 0.9 1
Vel
oci
ty (
m/s
)
Normalized Distance
Velocity Profile at Distal End
Standalone Stent
RRR-Stent
Lower velocity gradient
close to the wall
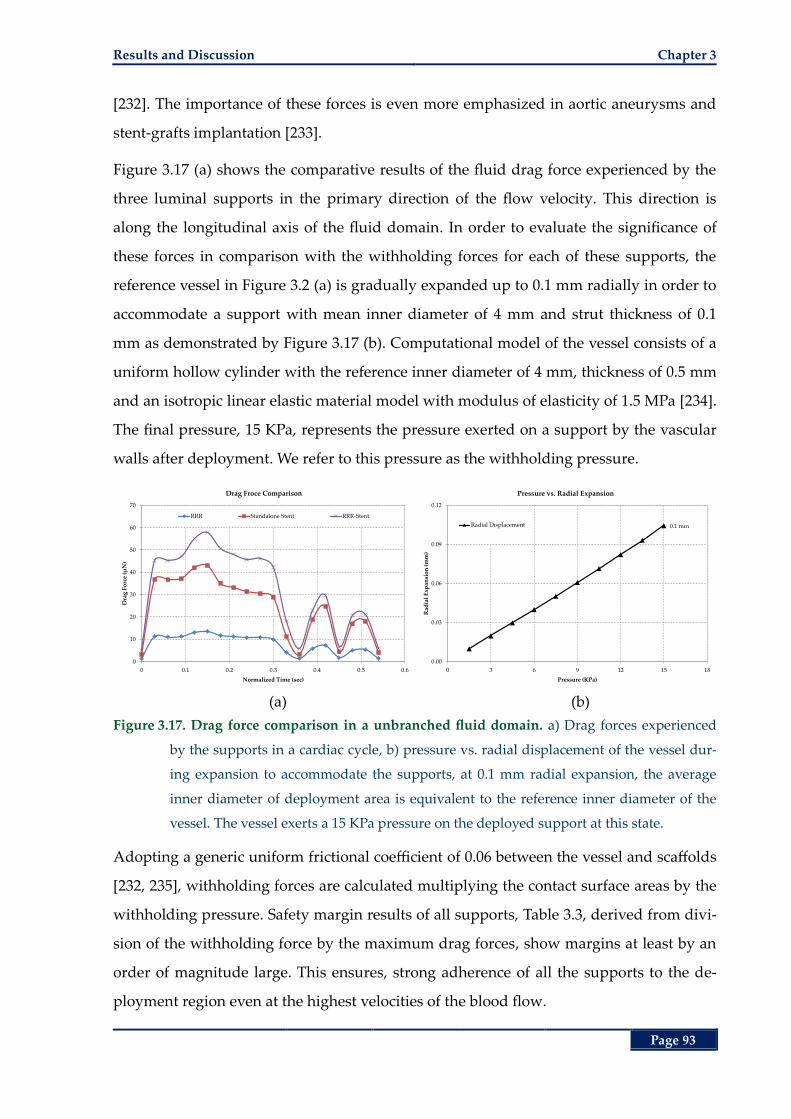
Results and Discussion Chapter 3
Page 93
[232]. The importance of these forces is even more emphasized in aortic aneurysms and
stent-grafts implantation [233].
Figure 3.17 (a) shows the comparative results of the fluid drag force experienced by the
three luminal supports in the primary direction of the flow velocity. This direction is
along the longitudinal axis of the fluid domain. In order to evaluate the significance of
these forces in comparison with the withholding forces for each of these supports, the
reference vessel in Figure 3.2 (a) is gradually expanded up to 0.1 mm radially in order to
accommodate a support with mean inner diameter of 4 mm and strut thickness of 0.1
mm as demonstrated by Figure 3.17 (b). Computational model of the vessel consists of a
uniform hollow cylinder with the reference inner diameter of 4 mm, thickness of 0.5 mm
and an isotropic linear elastic material model with modulus of elasticity of 1.5 MPa [234].
The final pressure, 15 KPa, represents the pressure exerted on a support by the vascular
walls after deployment. We refer to this pressure as the withholding pressure.
(a) (b)
Figure 3.17. Drag force comparison in a unbranched fluid domain. a) Drag forces experienced
by the supports in a cardiac cycle, b) pressure vs. radial displacement of the vessel dur-
ing expansion to accommodate the supports, at 0.1 mm radial expansion, the average
inner diameter of deployment area is equivalent to the reference inner diameter of the
vessel. The vessel exerts a 15 KPa pressure on the deployed support at this state.
Adopting a generic uniform frictional coefficient of 0.06 between the vessel and scaffolds
[232, 235], withholding forces are calculated multiplying the contact surface areas by the
withholding pressure. Safety margin results of all supports, Table 3.3, derived from divi-
sion of the withholding force by the maximum drag forces, show margins at least by an
order of magnitude large. This ensures, strong adherence of all the supports to the de-
ployment region even at the highest velocities of the blood flow.
0
10
20
30
40
50
60
70
0 0.1 0.2 0.3 0.4 0.5 0.6
Dra
g F
orc
e (µ
N)
Normalized Time (sec)
Drag Froce Comparison
RRR Standalone Stent RRR-Stent
0.1 mm
0.00
0.03
0.06
0.09
0.12
0 3 6 9 12 15 18
Rad
ial
Exp
ansi
on
(m
m)
Pressure (KPa)
Pressure vs. Radial Expansion
Radial Displacement
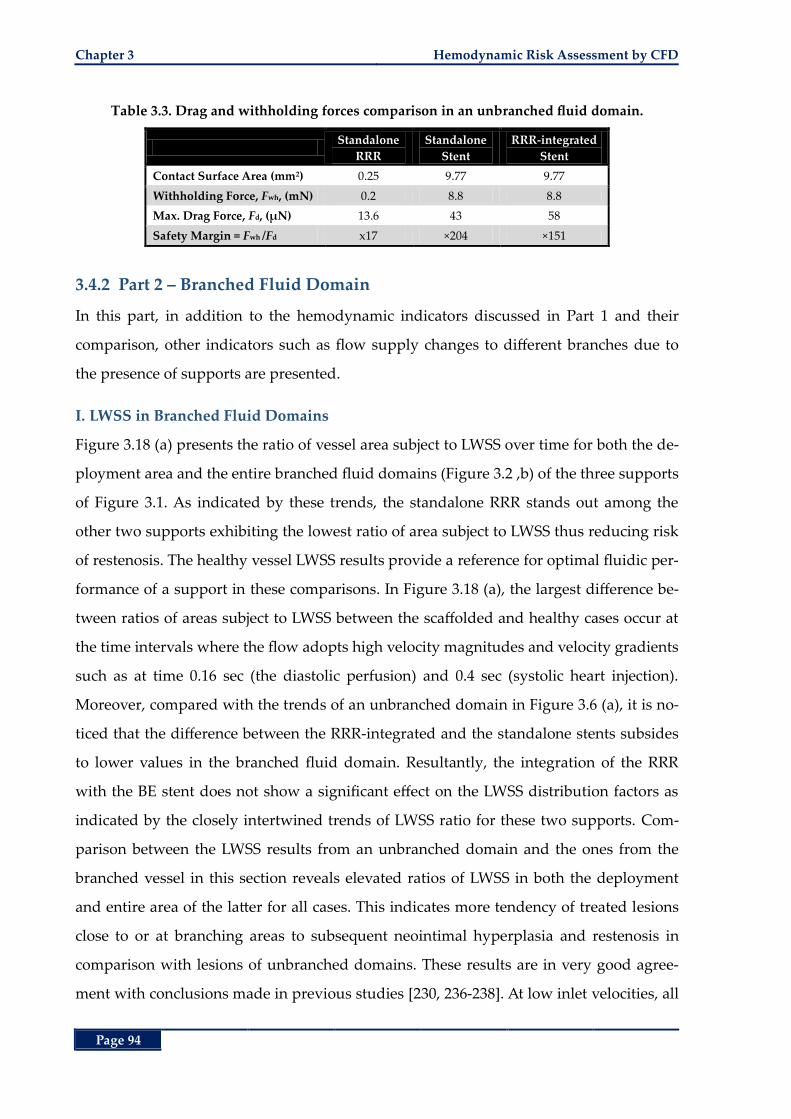
Chapter 3 Hemodynamic Risk Assessment by CFD
Page 94
Table 3.3. Drag and withholding forces comparison in an unbranched fluid domain.
Standalone
RRR
Standalone
Stent
RRR-integrated
Stent
Contact Surface Area (mm2) 0.25 9.77 9.77
Withholding Force, Fwh, (mN) 0.2 8.8 8.8
Max. Drag Force, Fd, (µN) 13.6 43 58
Safety Margin = Fwh /Fd x17 ×204 ×151
3.4.2 Part 2 – Branched Fluid Domain
In this part, in addition to the hemodynamic indicators discussed in Part 1 and their
comparison, other indicators such as flow supply changes to different branches due to
the presence of supports are presented.
I. LWSS in Branched Fluid Domains
Figure 3.18 (a) presents the ratio of vessel area subject to LWSS over time for both the de-
ployment area and the entire branched fluid domains (Figure 3.2 ,b) of the three supports
of Figure 3.1. As indicated by these trends, the standalone RRR stands out among the
other two supports exhibiting the lowest ratio of area subject to LWSS thus reducing risk
of restenosis. The healthy vessel LWSS results provide a reference for optimal fluidic per-
formance of a support in these comparisons. In Figure 3.18 (a), the largest difference be-
tween ratios of areas subject to LWSS between the scaffolded and healthy cases occur at
the time intervals where the flow adopts high velocity magnitudes and velocity gradients
such as at time 0.16 sec (the diastolic perfusion) and 0.4 sec (systolic heart injection).
Moreover, compared with the trends of an unbranched domain in Figure 3.6 (a), it is no-
ticed that the difference between the RRR-integrated and the standalone stents subsides
to lower values in the branched fluid domain. Resultantly, the integration of the RRR
with the BE stent does not show a significant effect on the LWSS distribution factors as
indicated by the closely intertwined trends of LWSS ratio for these two supports. Com-
parison between the LWSS results from an unbranched domain and the ones from the
branched vessel in this section reveals elevated ratios of LWSS in both the deployment
and entire area of the latter for all cases. This indicates more tendency of treated lesions
close to or at branching areas to subsequent neointimal hyperplasia and restenosis in
comparison with lesions of unbranched domains. These results are in very good agree-
ment with conclusions made in previous studies [230, 236-238]. At low inlet velocities, all
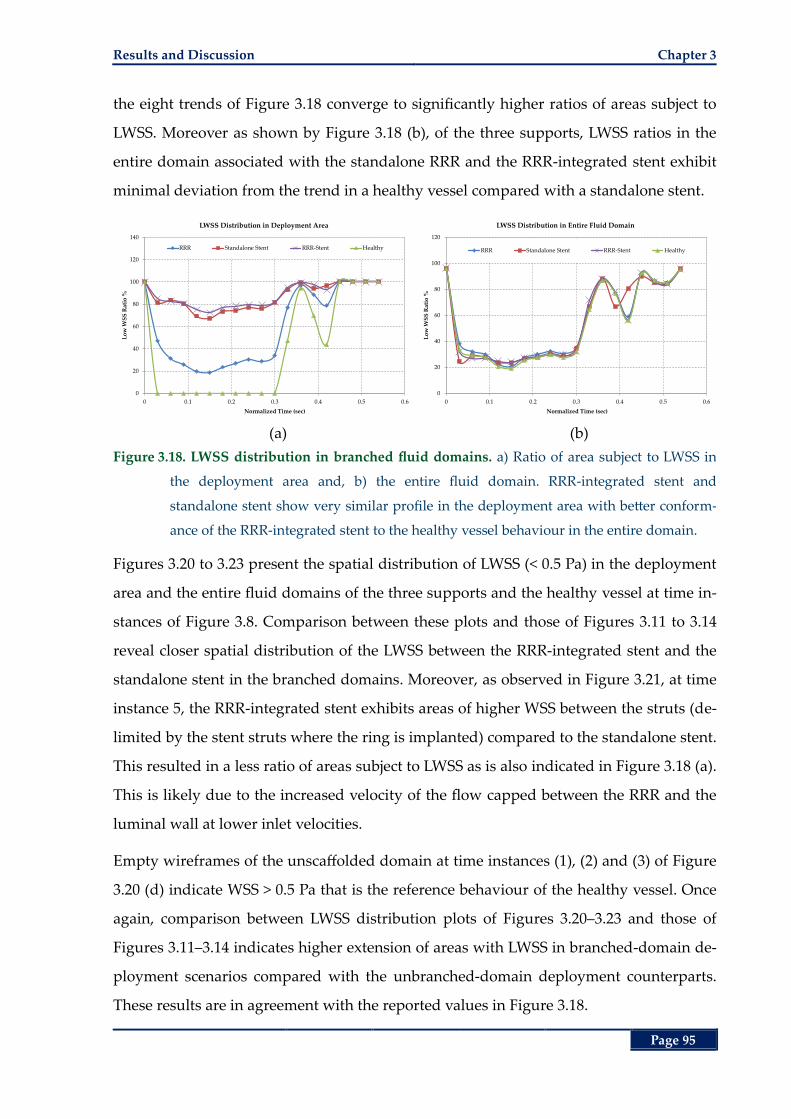
Results and Discussion Chapter 3
Page 95
the eight trends of Figure 3.18 converge to significantly higher ratios of areas subject to
LWSS. Moreover as shown by Figure 3.18 (b), of the three supports, LWSS ratios in the
entire domain associated with the standalone RRR and the RRR-integrated stent exhibit
minimal deviation from the trend in a healthy vessel compared with a standalone stent.
(a) (b)
Figure 3.18. LWSS distribution in branched fluid domains. a) Ratio of area subject to LWSS in
the deployment area and, b) the entire fluid domain. RRR-integrated stent and
standalone stent show very similar profile in the deployment area with better conform-
ance of the RRR-integrated stent to the healthy vessel behaviour in the entire domain.
Figures 3.20 to 3.23 present the spatial distribution of LWSS (< 0.5 Pa) in the deployment
area and the entire fluid domains of the three supports and the healthy vessel at time in-
stances of Figure 3.8. Comparison between these plots and those of Figures 3.11 to 3.14
reveal closer spatial distribution of the LWSS between the RRR-integrated stent and the
standalone stent in the branched domains. Moreover, as observed in Figure 3.21, at time
instance 5, the RRR-integrated stent exhibits areas of higher WSS between the struts (de-
limited by the stent struts where the ring is implanted) compared to the standalone stent.
This resulted in a less ratio of areas subject to LWSS as is also indicated in Figure 3.18 (a).
This is likely due to the increased velocity of the flow capped between the RRR and the
luminal wall at lower inlet velocities.
Empty wireframes of the unscaffolded domain at time instances (1), (2) and (3) of Figure
3.20 (d) indicate WSS > 0.5 Pa that is the reference behaviour of the healthy vessel. Once
again, comparison between LWSS distribution plots of Figures 3.20–3.23 and those of
Figures 3.11–3.14 indicates higher extension of areas with LWSS in branched-domain de-
ployment scenarios compared with the unbranched-domain deployment counterparts.
These results are in agreement with the reported values in Figure 3.18.
0
20
40
60
80
100
120
140
0 0.1 0.2 0.3 0.4 0.5 0.6
Lo
w W
SS
Rat
io %
Normalized Time (sec)
LWSS Distribution in Deployment Area
RRR Standalone Stent RRR-Stent Healthy
0
20
40
60
80
100
120
0 0.1 0.2 0.3 0.4 0.5 0.6
Lo
w W
SS
Rat
io %
Normalized Time (sec)
LWSS Distribution in Entire Fluid Domain
RRR Standalone Stent RRR-Stent Healthy
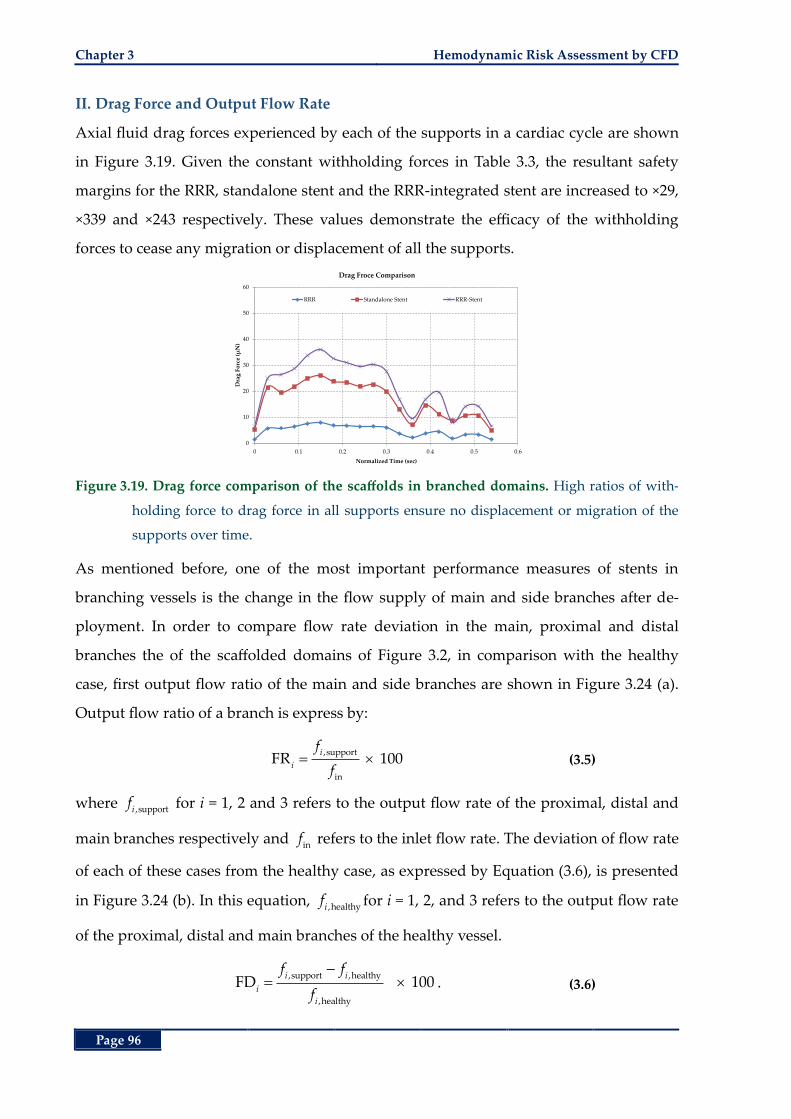
Chapter 3 Hemodynamic Risk Assessment by CFD
Page 96
II. Drag Force and Output Flow Rate
Axial fluid drag forces experienced by each of the supports in a cardiac cycle are shown
in Figure 3.19. Given the constant withholding forces in Table 3.3, the resultant safety
margins for the RRR, standalone stent and the RRR-integrated stent are increased to ×29,
×339 and ×243 respectively. These values demonstrate the efficacy of the withholding
forces to cease any migration or displacement of all the supports.
Figure 3.19. Drag force comparison of the scaffolds in branched domains. High ratios of with-
holding force to drag force in all supports ensure no displacement or migration of the
supports over time.
As mentioned before, one of the most important performance measures of stents in
branching vessels is the change in the flow supply of main and side branches after de-
ployment. In order to compare flow rate deviation in the main, proximal and distal
branches the of the scaffolded domains of Figure 3.2, in comparison with the healthy
case, first output flow ratio of the main and side branches are shown in Figure 3.24 (a).
Output flow ratio of a branch is express by:
,support
in
FR 100i
i
f
f (3.5)
where ,supportif for i = 1, 2 and 3 refers to the output flow rate of the proximal, distal and
main branches respectively and inf refers to the inlet flow rate. The deviation of flow rate
of each of these cases from the healthy case, as expressed by Equation (3.6), is presented
in Figure 3.24 (b). In this equation, ,healthyif for i = 1, 2, and 3 refers to the output flow rate
of the proximal, distal and main branches of the healthy vessel.
,support ,healthy
,healthy
FD 100i i
i
i
f f
f. (3.6)
0
10
20
30
40
50
60
0 0.1 0.2 0.3 0.4 0.5 0.6
Dra
g F
orc
e (µ
N)
Normalized Time (sec)
Drag Froce Comparison
RRR Standalone Stent RRR-Stent
Results and Discussion Chapter 3
Page 97
(1)
(2)
(3)
(a) (b) (c) (d)
Figure 3.20. LWSS contour plots, deployment area of branched domains, instances 1‒3. LWSS distribution in the deployment area of, a) the
standalone RRR, b) the standalone stent, c) the RRR-integrated stent and, d) the unscaffolded domain representing a healthy vessel. Inlet is
the left for all images. Empty wireframes in column (d) denote wall shear stress > 0.5 Pa in the healthy vessel.
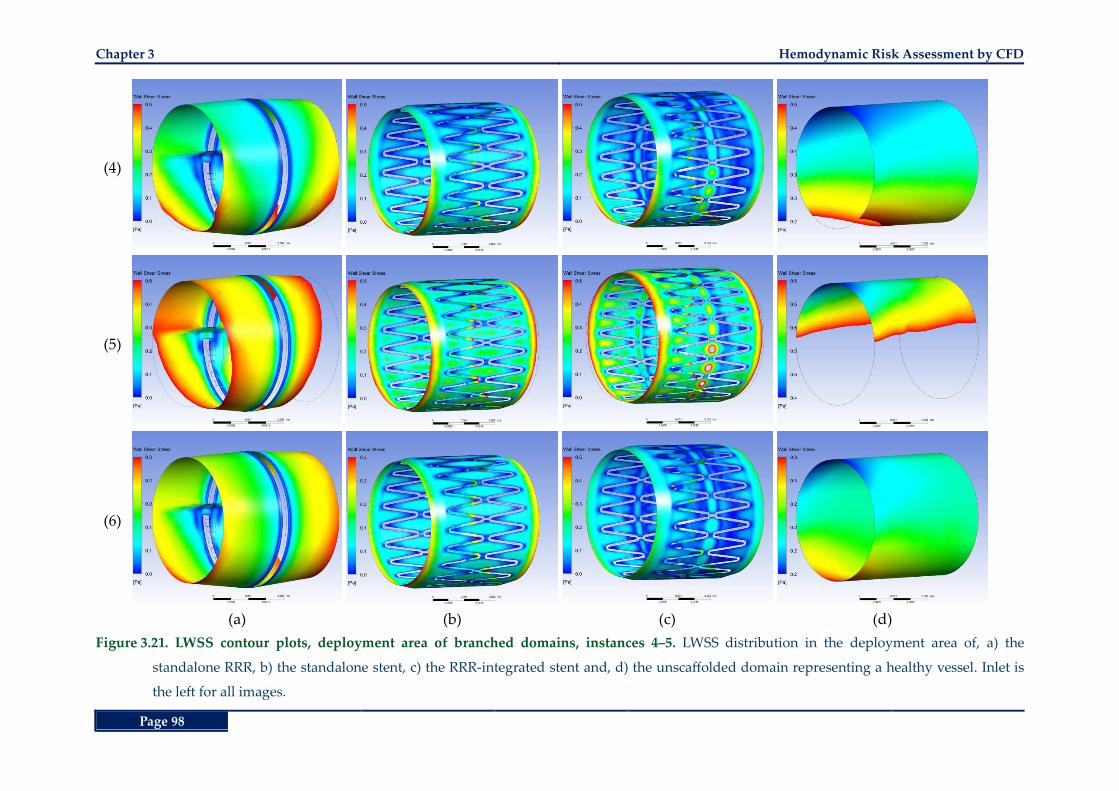
Chapter 3 Hemodynamic Risk Assessment by CFD
Page 98
(4)
(5)
(6)
(a) (b) (c) (d)
Figure 3.21. LWSS contour plots, deployment area of branched domains, instances 4‒5. LWSS distribution in the deployment area of, a) the
standalone RRR, b) the standalone stent, c) the RRR-integrated stent and, d) the unscaffolded domain representing a healthy vessel. Inlet is
the left for all images.
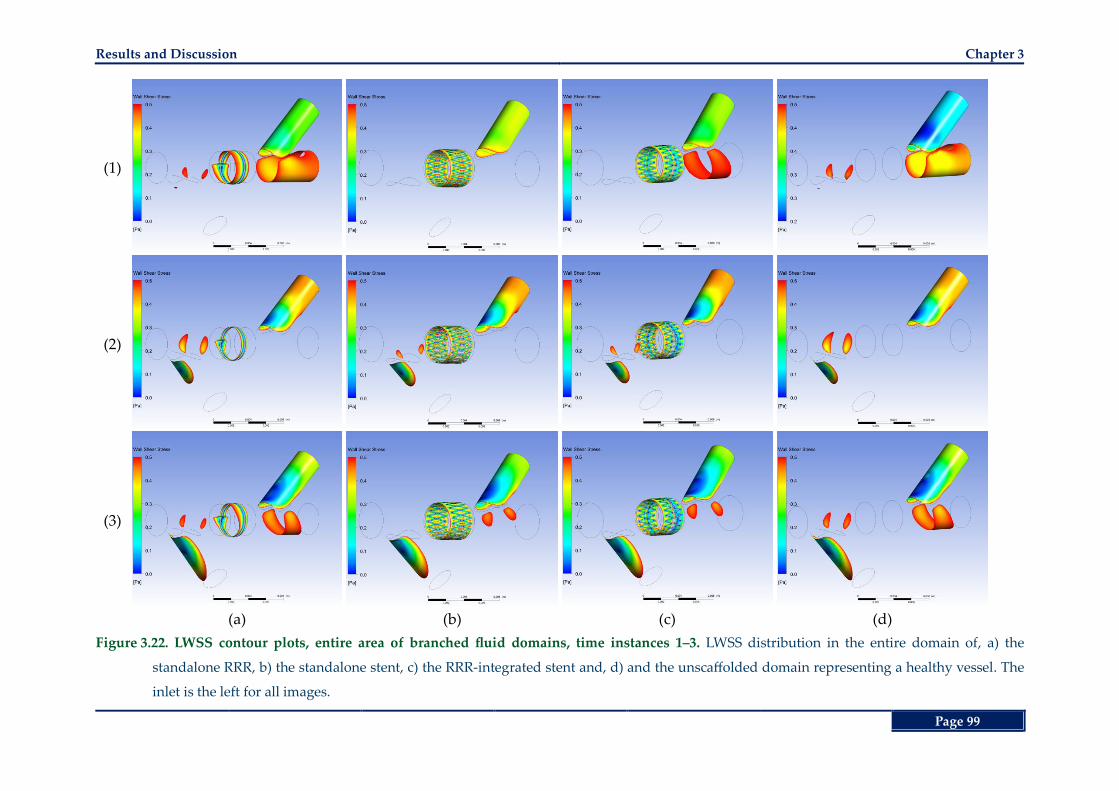
Results and Discussion Chapter 3
Page 99
(1)
(2)
(3)
(a) (b) (c) (d)
Figure 3.22. LWSS contour plots, entire area of branched fluid domains, time instances 1‒3. LWSS distribution in the entire domain of, a) the
standalone RRR, b) the standalone stent, c) the RRR-integrated stent and, d) and the unscaffolded domain representing a healthy vessel. The
inlet is the left for all images.
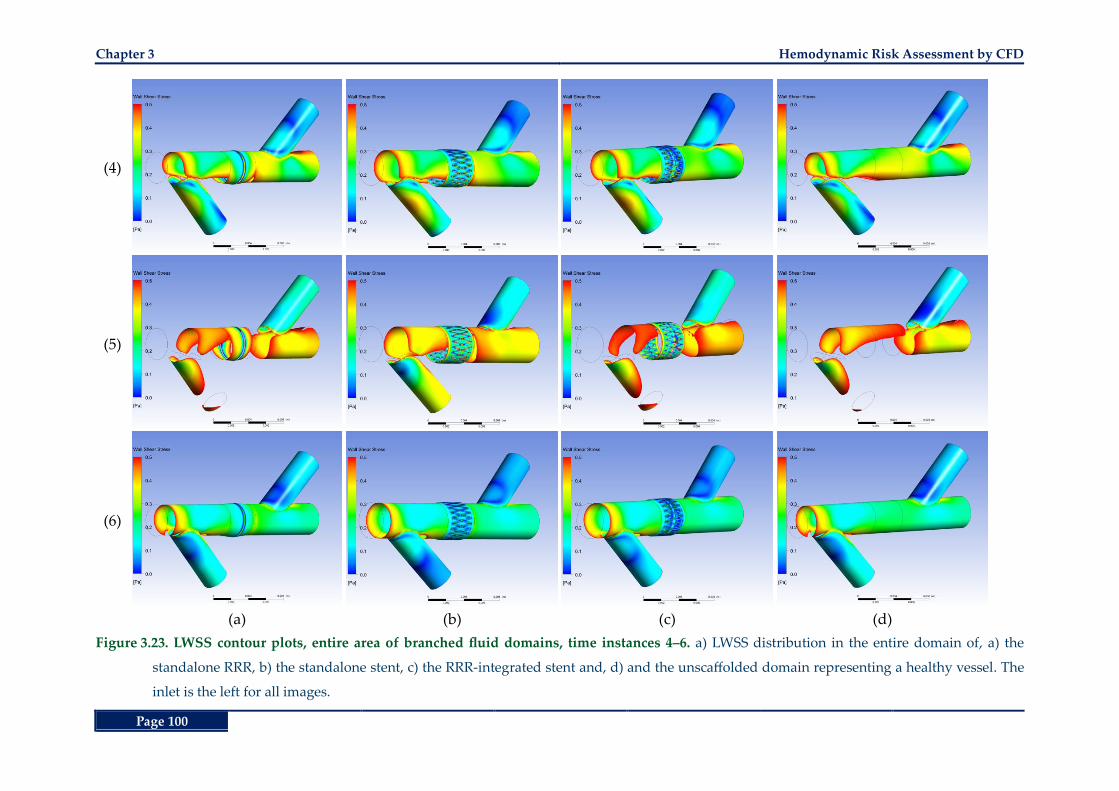
Chapter 3 Hemodynamic Risk Assessment by CFD
Page 100
(4)
(5)
(6)
(a) (b) (c) (d)
Figure 3.23. LWSS contour plots, entire area of branched fluid domains, time instances 4‒6. a) LWSS distribution in the entire domain of, a) the
standalone RRR, b) the standalone stent, c) the RRR-integrated stent and, d) and the unscaffolded domain representing a healthy vessel. The
inlet is the left for all images.
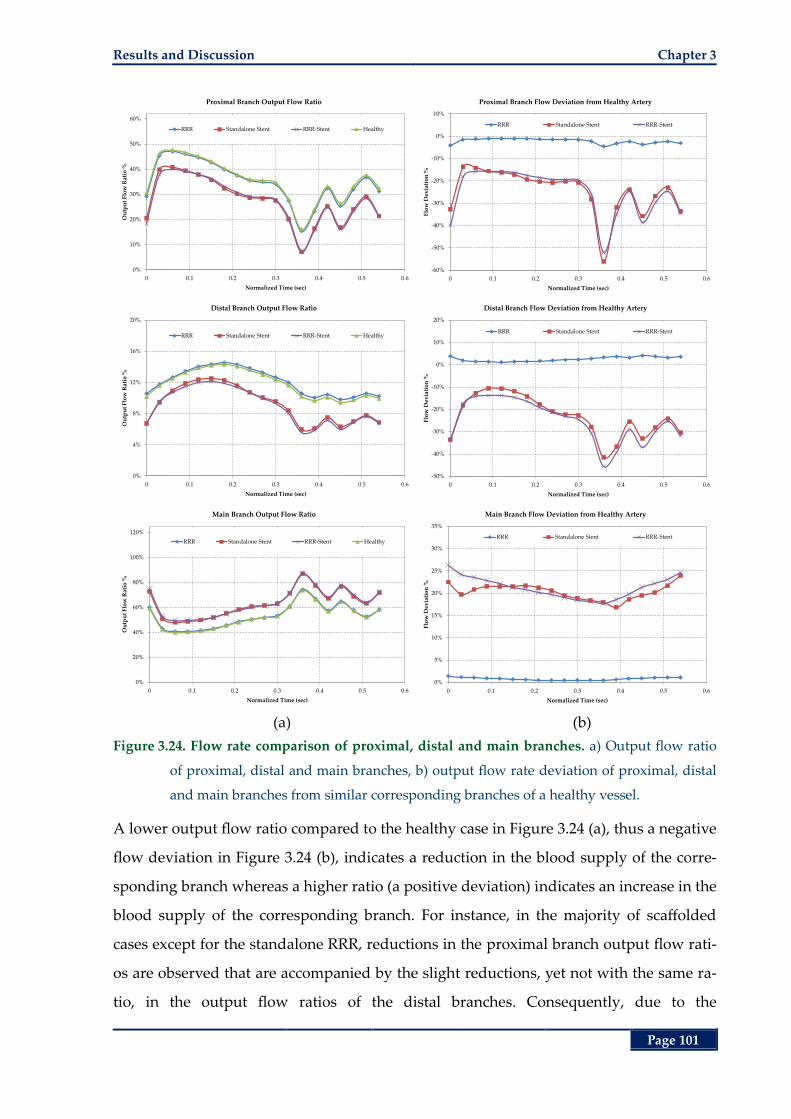
Results and Discussion Chapter 3
Page 101
(a) (b)
Figure 3.24. Flow rate comparison of proximal, distal and main branches. a) Output flow ratio
of proximal, distal and main branches, b) output flow rate deviation of proximal, distal
and main branches from similar corresponding branches of a healthy vessel.
A lower output flow ratio compared to the healthy case in Figure 3.24 (a), thus a negative
flow deviation in Figure 3.24 (b), indicates a reduction in the blood supply of the corre-
sponding branch whereas a higher ratio (a positive deviation) indicates an increase in the
blood supply of the corresponding branch. For instance, in the majority of scaffolded
cases except for the standalone RRR, reductions in the proximal branch output flow rati-
os are observed that are accompanied by the slight reductions, yet not with the same ra-
tio, in the output flow ratios of the distal branches. Consequently, due to the
0%
10%
20%
30%
40%
50%
60%
0 0.1 0.2 0.3 0.4 0.5 0.6
Ou
tpu
t F
low
Rat
io %
Normalized Time (sec)
Proximal Branch Output Flow Ratio
RRR Standalone Stent RRR-Stent Healthy
-60%
-50%
-40%
-30%
-20%
-10%
0%
10%
0 0.1 0.2 0.3 0.4 0.5 0.6
Flo
w D
evia
tio
n %
Normalized Time (sec)
Proximal Branch Flow Deviation from Healthy Artery
RRR Standalone Stent RRR-Stent
0%
4%
8%
12%
16%
20%
0 0.1 0.2 0.3 0.4 0.5 0.6
Ou
tpu
t F
low
Rat
io %
Normalized Time (sec)
Distal Branch Output Flow Ratio
RRR Standalone Stent RRR-Stent Healthy
-50%
-40%
-30%
-20%
-10%
0%
10%
20%
0 0.1 0.2 0.3 0.4 0.5 0.6
Flo
w D
evia
tio
n %
Normalized Time (sec)
Distal Branch Flow Deviation from Healthy Artery
RRR Standalone Stent RRR-Stent
0%
20%
40%
60%
80%
100%
120%
0 0.1 0.2 0.3 0.4 0.5 0.6
Ou
tpu
t F
low
Rat
io %
Normalized Time (sec)
Main Branch Output Flow Ratio
RRR Standalone Stent RRR-Stent Healthy
0%
5%
10%
15%
20%
25%
30%
35%
0 0.1 0.2 0.3 0.4 0.5 0.6
Flo
w D
evia
tio
n %
Normalized Time (sec)
Main Branch Flow Deviation from Healthy Artery
RRR Standalone Stent RRR-Stent
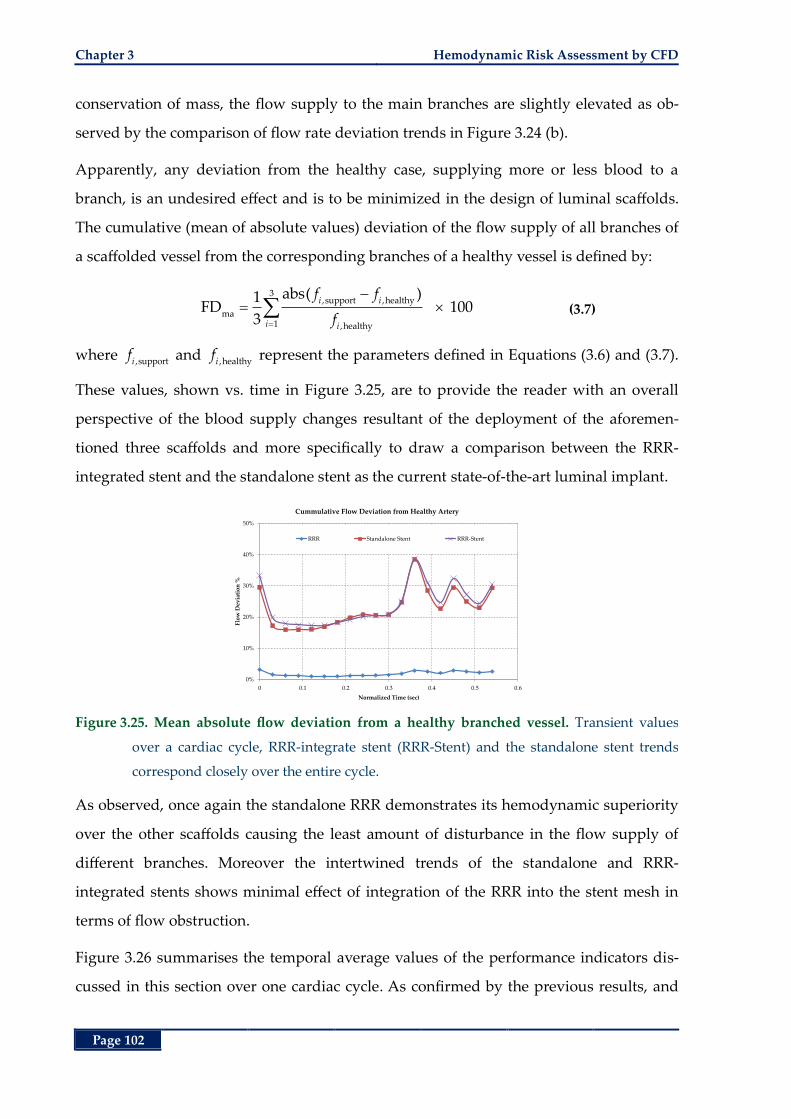
Chapter 3 Hemodynamic Risk Assessment by CFD
Page 102
conservation of mass, the flow supply to the main branches are slightly elevated as ob-
served by the comparison of flow rate deviation trends in Figure 3.24 (b).
Apparently, any deviation from the healthy case, supplying more or less blood to a
branch, is an undesired effect and is to be minimized in the design of luminal scaffolds.
The cumulative (mean of absolute values) deviation of the flow supply of all branches of
a scaffolded vessel from the corresponding branches of a healthy vessel is defined by:
3,support ,healthy
ma1 ,healthy
abs( )1FD 100
3
i i
i i
f f
f (3.7)
where ,supportif and ,healthyi
f represent the parameters defined in Equations (3.6) and (3.7).
These values, shown vs. time in Figure 3.25, are to provide the reader with an overall
perspective of the blood supply changes resultant of the deployment of the aforemen-
tioned three scaffolds and more specifically to draw a comparison between the RRR-
integrated stent and the standalone stent as the current state-of-the-art luminal implant.
Figure 3.25. Mean absolute flow deviation from a healthy branched vessel. Transient values
over a cardiac cycle, RRR-integrate stent (RRR-Stent) and the standalone stent trends
correspond closely over the entire cycle.
As observed, once again the standalone RRR demonstrates its hemodynamic superiority
over the other scaffolds causing the least amount of disturbance in the flow supply of
different branches. Moreover the intertwined trends of the standalone and RRR-
integrated stents shows minimal effect of integration of the RRR into the stent mesh in
terms of flow obstruction.
Figure 3.26 summarises the temporal average values of the performance indicators dis-
cussed in this section over one cardiac cycle. As confirmed by the previous results, and
0%
10%
20%
30%
40%
50%
0 0.1 0.2 0.3 0.4 0.5 0.6
Flo
w D
evia
tio
n %
Normalized Time (sec)
Cummulative Flow Deviation from Healthy Artery
RRR Standalone Stent RRR-Stent
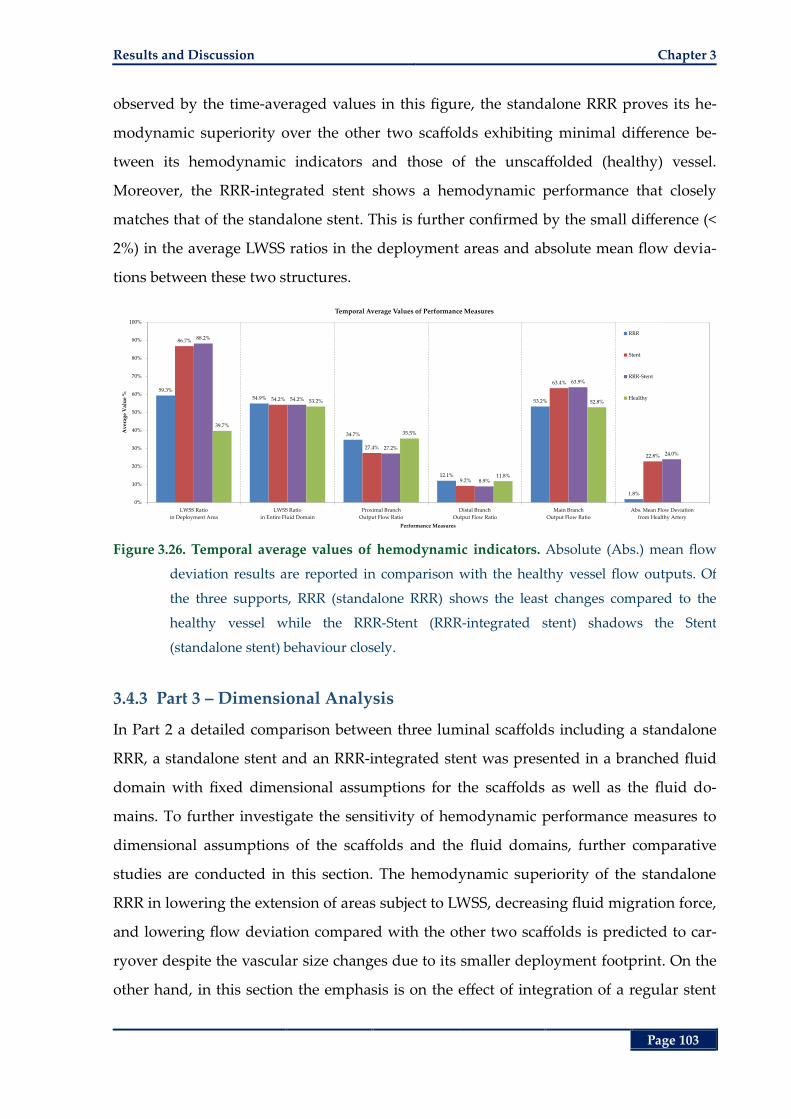
Results and Discussion Chapter 3
Page 103
observed by the time-averaged values in this figure, the standalone RRR proves its he-
modynamic superiority over the other two scaffolds exhibiting minimal difference be-
tween its hemodynamic indicators and those of the unscaffolded (healthy) vessel.
Moreover, the RRR-integrated stent shows a hemodynamic performance that closely
matches that of the standalone stent. This is further confirmed by the small difference (<
2%) in the average LWSS ratios in the deployment areas and absolute mean flow devia-
tions between these two structures.
Figure 3.26. Temporal average values of hemodynamic indicators. Absolute (Abs.) mean flow
deviation results are reported in comparison with the healthy vessel flow outputs. Of
the three supports, RRR (standalone RRR) shows the least changes compared to the
healthy vessel while the RRR-Stent (RRR-integrated stent) shadows the Stent
(standalone stent) behaviour closely.
3.4.3 Part 3 – Dimensional Analysis
In Part 2 a detailed comparison between three luminal scaffolds including a standalone
RRR, a standalone stent and an RRR-integrated stent was presented in a branched fluid
domain with fixed dimensional assumptions for the scaffolds as well as the fluid do-
mains. To further investigate the sensitivity of hemodynamic performance measures to
dimensional assumptions of the scaffolds and the fluid domains, further comparative
studies are conducted in this section. The hemodynamic superiority of the standalone
RRR in lowering the extension of areas subject to LWSS, decreasing fluid migration force,
and lowering flow deviation compared with the other two scaffolds is predicted to car-
ryover despite the vascular size changes due to its smaller deployment footprint. On the
other hand, in this section the emphasis is on the effect of integration of a regular stent
59.3%
54.9%
34.7%
12.1%
53.2%
1.8%
86.7%
54.2%
27.4%
9.2%
63.4%
22.8%
88.2%
54.2%
27.2%
8.9%
63.9%
24.0%
39.7%
53.2%
35.5%
11.8%
52.8%
0%
10%
20%
30%
40%
50%
60%
70%
80%
90%
100%
LWSS Ratio
in Deployment Area
LWSS Ratio
in Entire Fluid Domain
Proximal Branch
Output Flow Ratio
Distal Branch
Output Flow Ratio
Main Branch
Output Flow Ratio
Abs. Mean Flow Deviation
from Healthy Artery
Av
erag
e V
alu
e %
Performance Measures
Temporal Average Values of Performance Measures
RRR
Stent
RRR-Stent
Healthy
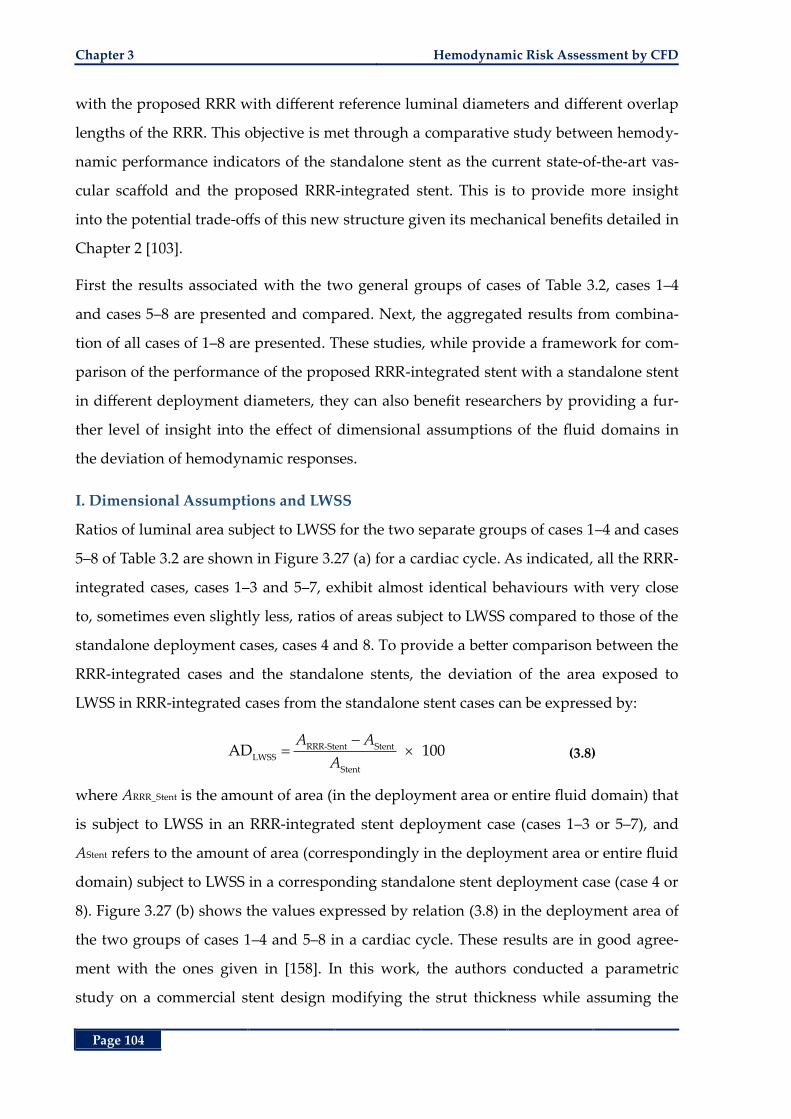
Chapter 3 Hemodynamic Risk Assessment by CFD
Page 104
with the proposed RRR with different reference luminal diameters and different overlap
lengths of the RRR. This objective is met through a comparative study between hemody-
namic performance indicators of the standalone stent as the current state-of-the-art vas-
cular scaffold and the proposed RRR-integrated stent. This is to provide more insight
into the potential trade-offs of this new structure given its mechanical benefits detailed in
Chapter 2 [103].
First the results associated with the two general groups of cases of Table 3.2, cases 1‒4
and cases 5‒8 are presented and compared. Next, the aggregated results from combina-
tion of all cases of 1‒8 are presented. These studies, while provide a framework for com-
parison of the performance of the proposed RRR-integrated stent with a standalone stent
in different deployment diameters, they can also benefit researchers by providing a fur-
ther level of insight into the effect of dimensional assumptions of the fluid domains in
the deviation of hemodynamic responses.
I. Dimensional Assumptions and LWSS
Ratios of luminal area subject to LWSS for the two separate groups of cases 1‒4 and cases
5‒8 of Table 3.2 are shown in Figure 3.27 (a) for a cardiac cycle. As indicated, all the RRR-
integrated cases, cases 1‒3 and 5‒7, exhibit almost identical behaviours with very close
to, sometimes even slightly less, ratios of areas subject to LWSS compared to those of the
standalone deployment cases, cases 4 and 8. To provide a better comparison between the
RRR-integrated cases and the standalone stents, the deviation of the area exposed to
LWSS in RRR-integrated cases from the standalone stent cases can be expressed by:
RRR-Stent Stent
LWSS
Stent
AD 100A A
A (3.8)
where ARRR_Stent is the amount of area (in the deployment area or entire fluid domain) that
is subject to LWSS in an RRR-integrated stent deployment case (cases 1‒3 or 5‒7), and
AStent refers to the amount of area (correspondingly in the deployment area or entire fluid
domain) subject to LWSS in a corresponding standalone stent deployment case (case 4 or
8). Figure 3.27 (b) shows the values expressed by relation (3.8) in the deployment area of
the two groups of cases 1‒4 and 5‒8 in a cardiac cycle. These results are in good agree-
ment with the ones given in [158]. In this work, the authors conducted a parametric
study on a commercial stent design modifying the strut thickness while assuming the
Results and Discussion Chapter 3
Page 105
pulsatile flow used in this chapter and reported a slight reduction in the ratio of the area
subject to LWSS by 3% on average as the stent strut thickness was increased from 0.05
mm to 0.15 mm. This conclusion is further confirmed by Figure 3.27 (b). As the ratio of
the strut thickness to the reference luminal diameter increases (due to the integration of
the RRR with the stent mesh, or increasing the overlap length, or reducing the reference
luminal diameter) the LWSS ratio deviation values adopt greater negative values i.e. less
luminal surface area is subjected to LWSS thereby reducing chances of restenosis.
(a) (b)
Figure 3.27. LWSS in the deployment area of cases 1‒8. a) Ratio of area subject to LWSS in the
deployment area of cases 1‒4 and cases 5‒8, b) deviation of the ratio of areas subject to
LWSS in the deployment area of cases 1‒3 and 5‒8 (RRR-integrated supports) from cases
4 and 8 (standalone stent) respectively.
As indicated by Figure 3.27 (b), the greatest negative deviation, thus the least LWSS ratio,
is observed for the lowest reference diameter (2.5 mm) with the longest overlap length
(case 1) at higher magnitudes and higher gradients of the velocity (diastolic perfusion
and systolic heart injection). Apparently the extent of these benefits is limited to the
point where further increase in the strut thickness starts to significantly alter flow supply
to the main and side branches. Results of the effect of dimensional changes to the flow
0
20
40
60
80
100
120
140
0 0.1 0.2 0.3 0.4 0.5 0.6
Lo
w W
SS
Rat
io %
Normalized Time (sec)
LWSS Ratio in Deployment Area (Case 1-4)
RRR-Stent 6-Steps (Case 1) RRR-Stent 3-Steps (Case 2)
RRR-Stent 1-Steps (Case 3) Standalone Stent (Case 4)
-8%
-6%
-4%
-2%
0%
2%
4%
0 0.1 0.2 0.3 0.4 0.5 0.6
LW
SS
Rat
io D
ivia
tio
n %
Normalized Time (sec)
LWSS Deviation from Standalone Stent in Deployment Area (Case 1-4)
RRR-Stent 6-Steps (Case 1) RRR-Stent 3-Steps (Case 2) RRR-Stent 1-Steps (Case 3)
0
20
40
60
80
100
120
140
0 0.1 0.2 0.3 0.4 0.5 0.6
Lo
w W
SS
Rat
io %
Normalized Time (sec)
LWSS Ratio in Deployment Area (Case 5-8)
RRR-Stent 6-Steps (Case 5) RRR-Stent 3-Steps (Case 6)
RRR-Stent 1-Steps (Case 7) Standalone Stent (Case 8)
-3%
-2%
-1%
0%
1%
2%
3%
0 0.1 0.2 0.3 0.4 0.5 0.6
LW
SS
Rat
io D
ivia
tio
n %
Normalized Time (sec)
LWSS Deviation from Standalone Stent in Deployment Area (Case 5-8)
RRR-Stent 6-Steps (Case 5) RRR-Stent 3-Steps (Case 6) RRR-Stent 1-Steps (Case 7)
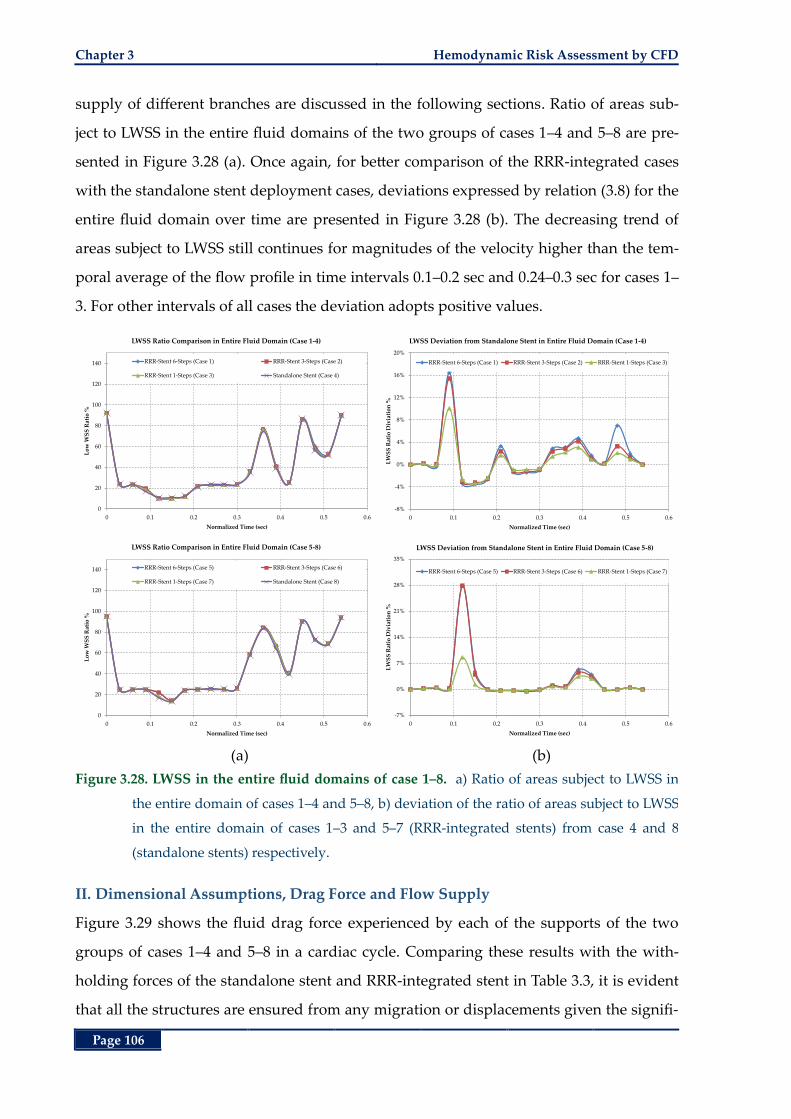
Chapter 3 Hemodynamic Risk Assessment by CFD
Page 106
supply of different branches are discussed in the following sections. Ratio of areas sub-
ject to LWSS in the entire fluid domains of the two groups of cases 1‒4 and 5‒8 are pre-
sented in Figure 3.28 (a). Once again, for better comparison of the RRR-integrated cases
with the standalone stent deployment cases, deviations expressed by relation (3.8) for the
entire fluid domain over time are presented in Figure 3.28 (b). The decreasing trend of
areas subject to LWSS still continues for magnitudes of the velocity higher than the tem-
poral average of the flow profile in time intervals 0.1‒0.2 sec and 0.24‒0.3 sec for cases 1‒
3. For other intervals of all cases the deviation adopts positive values.
(a) (b)
Figure 3.28. LWSS in the entire fluid domains of case 1‒8. a) Ratio of areas subject to LWSS in
the entire domain of cases 1‒4 and 5‒8, b) deviation of the ratio of areas subject to LWSS
in the entire domain of cases 1‒3 and 5‒7 (RRR-integrated stents) from case 4 and 8
(standalone stents) respectively.
II. Dimensional Assumptions, Drag Force and Flow Supply
Figure 3.29 shows the fluid drag force experienced by each of the supports of the two
groups of cases 1‒4 and 5‒8 in a cardiac cycle. Comparing these results with the with-
holding forces of the standalone stent and RRR-integrated stent in Table 3.3, it is evident
that all the structures are ensured from any migration or displacements given the signifi-
0
20
40
60
80
100
120
140
0 0.1 0.2 0.3 0.4 0.5 0.6
Lo
w W
SS
Rat
io %
Normalized Time (sec)
LWSS Ratio Comparison in Entire Fluid Domain (Case 1-4)
RRR-Stent 6-Steps (Case 1) RRR-Stent 3-Steps (Case 2)
RRR-Stent 1-Steps (Case 3) Standalone Stent (Case 4)
-8%
-4%
0%
4%
8%
12%
16%
20%
0 0.1 0.2 0.3 0.4 0.5 0.6
LW
SS
Rat
io D
ivia
tio
n %
Normalized Time (sec)
LWSS Deviation from Standalone Stent in Entire Fluid Domain (Case 1-4)
RRR-Stent 6-Steps (Case 1) RRR-Stent 3-Steps (Case 2) RRR-Stent 1-Steps (Case 3)
0
20
40
60
80
100
120
140
0 0.1 0.2 0.3 0.4 0.5 0.6
Lo
w W
SS
Rat
io %
Normalized Time (sec)
LWSS Ratio Comparison in Entire Fluid Domain (Case 5-8)
RRR-Stent 6-Steps (Case 5) RRR-Stent 3-Steps (Case 6)
RRR-Stent 1-Steps (Case 7) Standalone Stent (Case 8)
-7%
0%
7%
14%
21%
28%
35%
0 0.1 0.2 0.3 0.4 0.5 0.6
LW
SS
Rat
io D
ivia
tio
n %
Normalized Time (sec)
LWSS Deviation from Standalone Stent in Entire Fluid Domain (Case 5-8)
RRR-Stent 6-Steps (Case 5) RRR-Stent 3-Steps (Case 6) RRR-Stent 1-Steps (Case 7)
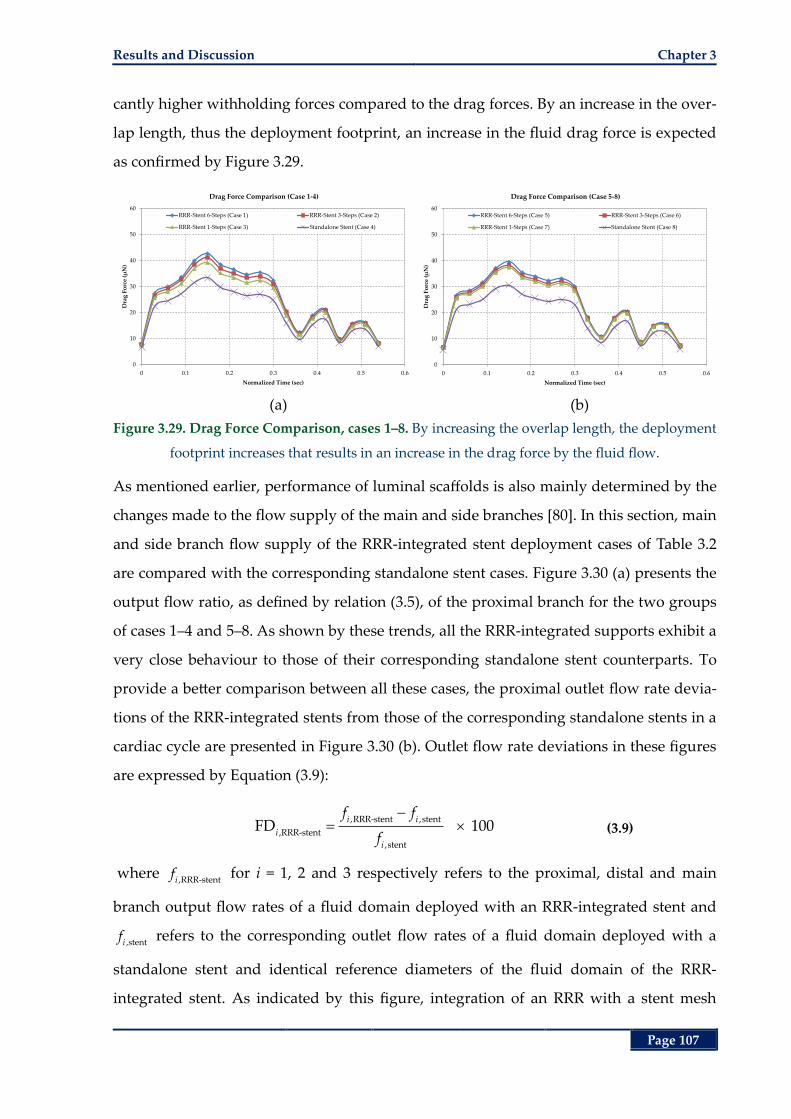
Results and Discussion Chapter 3
Page 107
cantly higher withholding forces compared to the drag forces. By an increase in the over-
lap length, thus the deployment footprint, an increase in the fluid drag force is expected
as confirmed by Figure 3.29.
(a) (b)
Figure 3.29. Drag Force Comparison, cases 1–8. By increasing the overlap length, the deployment
footprint increases that results in an increase in the drag force by the fluid flow.
As mentioned earlier, performance of luminal scaffolds is also mainly determined by the
changes made to the flow supply of the main and side branches [80]. In this section, main
and side branch flow supply of the RRR-integrated stent deployment cases of Table 3.2
are compared with the corresponding standalone stent cases. Figure 3.30 (a) presents the
output flow ratio, as defined by relation (3.5), of the proximal branch for the two groups
of cases 1‒4 and 5‒8. As shown by these trends, all the RRR-integrated supports exhibit a
very close behaviour to those of their corresponding standalone stent counterparts. To
provide a better comparison between all these cases, the proximal outlet flow rate devia-
tions of the RRR-integrated stents from those of the corresponding standalone stents in a
cardiac cycle are presented in Figure 3.30 (b). Outlet flow rate deviations in these figures
are expressed by Equation (3.9):
,RRR-stent ,stent
,RRR-stent
,stent
FD 100i i
i
i
f f
f (3.9)
where ,RRR-stenti
f for i = 1, 2 and 3 respectively refers to the proximal, distal and main
branch output flow rates of a fluid domain deployed with an RRR-integrated stent and
,stentif refers to the corresponding outlet flow rates of a fluid domain deployed with a
standalone stent and identical reference diameters of the fluid domain of the RRR-
integrated stent. As indicated by this figure, integration of an RRR with a stent mesh
0
10
20
30
40
50
60
0 0.1 0.2 0.3 0.4 0.5 0.6
Dra
g F
orc
e (µ
N)
Normalized Time (sec)
Drag Force Comparison (Case 1-4)
RRR-Stent 6-Steps (Case 1) RRR-Stent 3-Steps (Case 2)
RRR-Stent 1-Steps (Case 3) Standalone Stent (Case 4)
0
10
20
30
40
50
60
0 0.1 0.2 0.3 0.4 0.5 0.6
Dra
g F
orc
e (µ
N)
Normalized Time (sec)
Drag Force Comparison (Case 5-8)
RRR-Stent 6-Steps (Case 5) RRR-Stent 3-Steps (Case 6)
RRR-Stent 1-Steps (Case 7) Standalone Stent (Case 8)
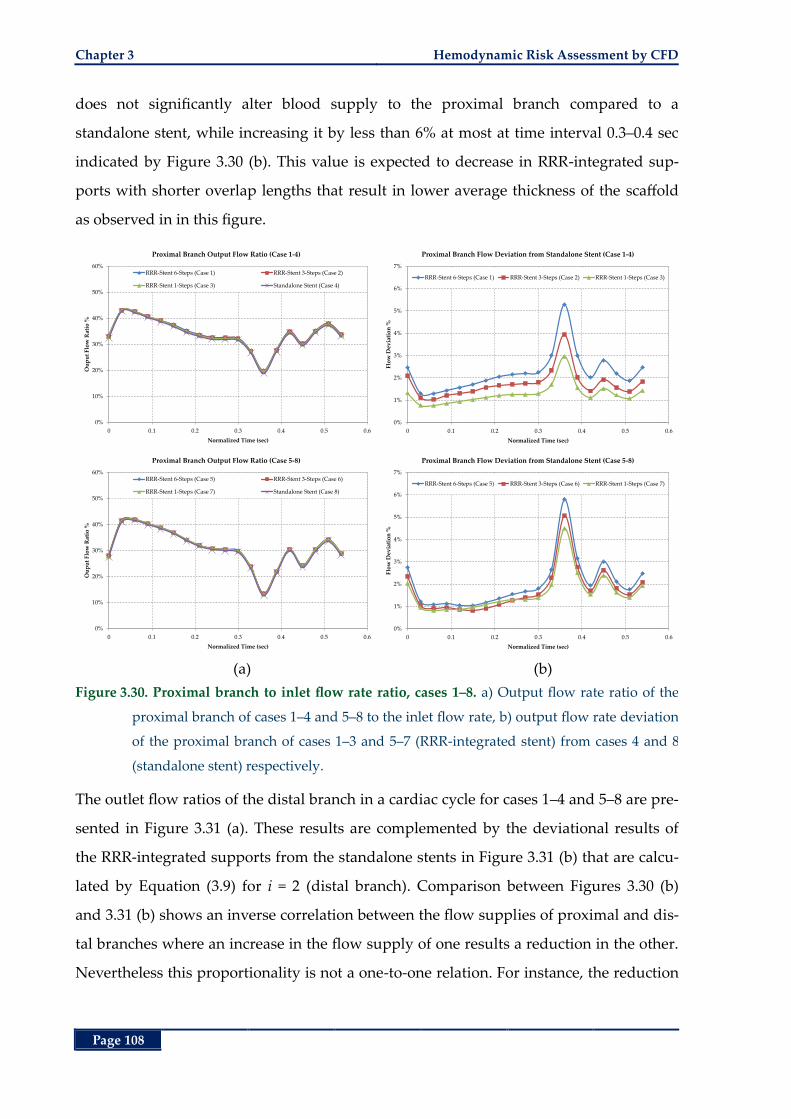
Chapter 3 Hemodynamic Risk Assessment by CFD
Page 108
does not significantly alter blood supply to the proximal branch compared to a
standalone stent, while increasing it by less than 6% at most at time interval 0.3‒0.4 sec
indicated by Figure 3.30 (b). This value is expected to decrease in RRR-integrated sup-
ports with shorter overlap lengths that result in lower average thickness of the scaffold
as observed in in this figure.
(a) (b)
Figure 3.30. Proximal branch to inlet flow rate ratio, cases 1‒8. a) Output flow rate ratio of the
proximal branch of cases 1‒4 and 5‒8 to the inlet flow rate, b) output flow rate deviation
of the proximal branch of cases 1‒3 and 5‒7 (RRR-integrated stent) from cases 4 and 8
(standalone stent) respectively.
The outlet flow ratios of the distal branch in a cardiac cycle for cases 1‒4 and 5‒8 are pre-
sented in Figure 3.31 (a). These results are complemented by the deviational results of
the RRR-integrated supports from the standalone stents in Figure 3.31 (b) that are calcu-
lated by Equation (3.9) for i = 2 (distal branch). Comparison between Figures 3.30 (b)
and 3.31 (b) shows an inverse correlation between the flow supplies of proximal and dis-
tal branches where an increase in the flow supply of one results a reduction in the other.
Nevertheless this proportionality is not a one-to-one relation. For instance, the reduction
0%
10%
20%
30%
40%
50%
60%
0 0.1 0.2 0.3 0.4 0.5 0.6
Ou
pu
t F
low
Rat
io %
Normalized Time (sec)
Proximal Branch Output Flow Ratio (Case 1-4)
RRR-Stent 6-Steps (Case 1) RRR-Stent 3-Steps (Case 2)
RRR-Stent 1-Steps (Case 3) Standalone Stent (Case 4)
0%
1%
2%
3%
4%
5%
6%
7%
0 0.1 0.2 0.3 0.4 0.5 0.6
Flo
w D
evia
tio
n %
Normalized Time (sec)
Proximal Branch Flow Deviation from Standalone Stent (Case 1-4)
RRR-Stent 6-Steps (Case 1) RRR-Stent 3-Steps (Case 2) RRR-Stent 1-Steps (Case 3)
0%
10%
20%
30%
40%
50%
60%
0 0.1 0.2 0.3 0.4 0.5 0.6
Ou
pu
t F
low
Rat
io %
Normalized Time (sec)
Proximal Branch Output Flow Ratio (Case 5-8)
RRR-Stent 6-Steps (Case 5) RRR-Stent 3-Steps (Case 6)
RRR-Stent 1-Steps (Case 7) Standalone Stent (Case 8)
0%
1%
2%
3%
4%
5%
6%
7%
0 0.1 0.2 0.3 0.4 0.5 0.6
Flo
w D
evia
tio
n %
Normalized Time (sec)
Proximal Branch Flow Deviation from Standalone Stent (Case 5-8)
RRR-Stent 6-Steps (Case 5) RRR-Stent 3-Steps (Case 6) RRR-Stent 1-Steps (Case 7)
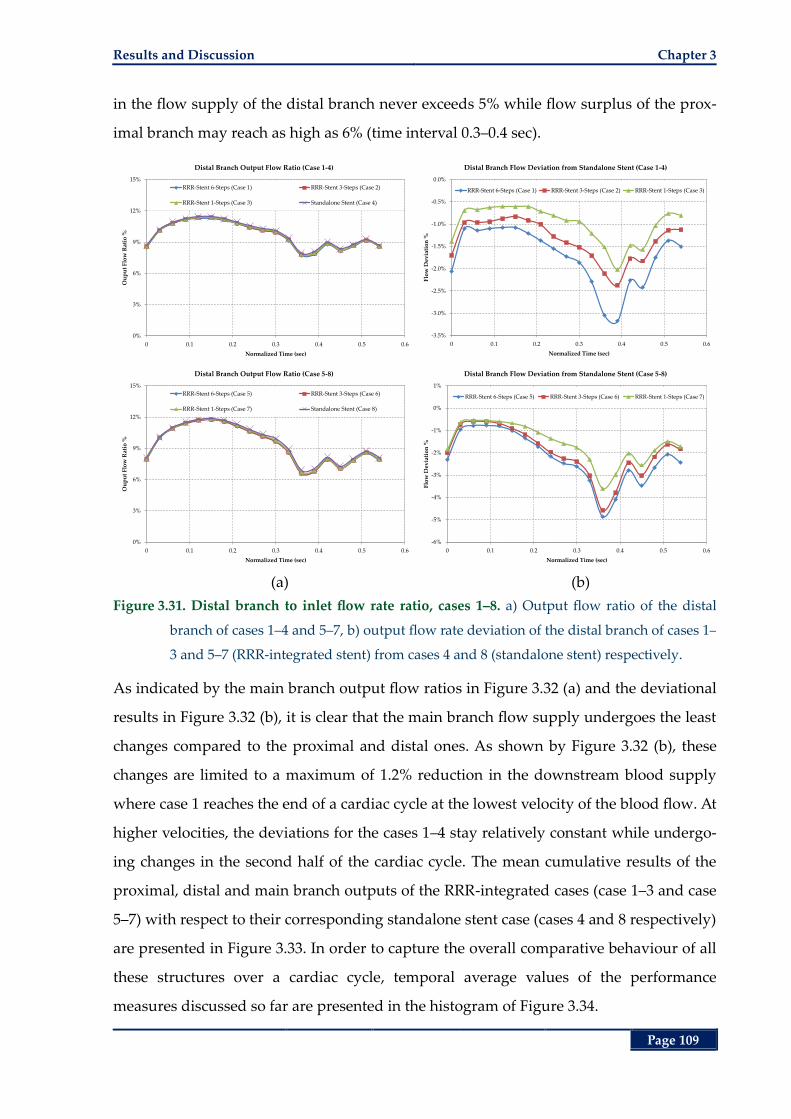
Results and Discussion Chapter 3
Page 109
in the flow supply of the distal branch never exceeds 5% while flow surplus of the prox-
imal branch may reach as high as 6% (time interval 0.3‒0.4 sec).
(a) (b)
Figure 3.31. Distal branch to inlet flow rate ratio, cases 1‒8. a) Output flow ratio of the distal
branch of cases 1‒4 and 5‒7, b) output flow rate deviation of the distal branch of cases 1‒
3 and 5‒7 (RRR-integrated stent) from cases 4 and 8 (standalone stent) respectively.
As indicated by the main branch output flow ratios in Figure 3.32 (a) and the deviational
results in Figure 3.32 (b), it is clear that the main branch flow supply undergoes the least
changes compared to the proximal and distal ones. As shown by Figure 3.32 (b), these
changes are limited to a maximum of 1.2% reduction in the downstream blood supply
where case 1 reaches the end of a cardiac cycle at the lowest velocity of the blood flow. At
higher velocities, the deviations for the cases 1‒4 stay relatively constant while undergo-
ing changes in the second half of the cardiac cycle. The mean cumulative results of the
proximal, distal and main branch outputs of the RRR-integrated cases (case 1‒3 and case
5‒7) with respect to their corresponding standalone stent case (cases 4 and 8 respectively)
are presented in Figure 3.33. In order to capture the overall comparative behaviour of all
these structures over a cardiac cycle, temporal average values of the performance
measures discussed so far are presented in the histogram of Figure 3.34.
0%
3%
6%
9%
12%
15%
0 0.1 0.2 0.3 0.4 0.5 0.6
Ou
pu
t F
low
Rat
io %
Normalized Time (sec)
Distal Branch Output Flow Ratio (Case 1-4)
RRR-Stent 6-Steps (Case 1) RRR-Stent 3-Steps (Case 2)
RRR-Stent 1-Steps (Case 3) Standalone Stent (Case 4)
-3.5%
-3.0%
-2.5%
-2.0%
-1.5%
-1.0%
-0.5%
0.0%
0 0.1 0.2 0.3 0.4 0.5 0.6
Flo
w D
evia
tio
n %
Normalized Time (sec)
Distal Branch Flow Deviation from Standalone Stent (Case 1-4)
RRR-Stent 6-Steps (Case 1) RRR-Stent 3-Steps (Case 2) RRR-Stent 1-Steps (Case 3)
0%
3%
6%
9%
12%
15%
0 0.1 0.2 0.3 0.4 0.5 0.6
Ou
pu
t F
low
Rat
io %
Normalized Time (sec)
Distal Branch Output Flow Ratio (Case 5-8)
RRR-Stent 6-Steps (Case 5) RRR-Stent 3-Steps (Case 6)
RRR-Stent 1-Steps (Case 7) Standalone Stent (Case 8)
-6%
-5%
-4%
-3%
-2%
-1%
0%
1%
0 0.1 0.2 0.3 0.4 0.5 0.6
Flo
w D
evia
tio
n %
Normalized Time (sec)
Distal Branch Flow Deviation from Standalone Stent (Case 5-8)
RRR-Stent 6-Steps (Case 5) RRR-Stent 3-Steps (Case 6) RRR-Stent 1-Steps (Case 7)
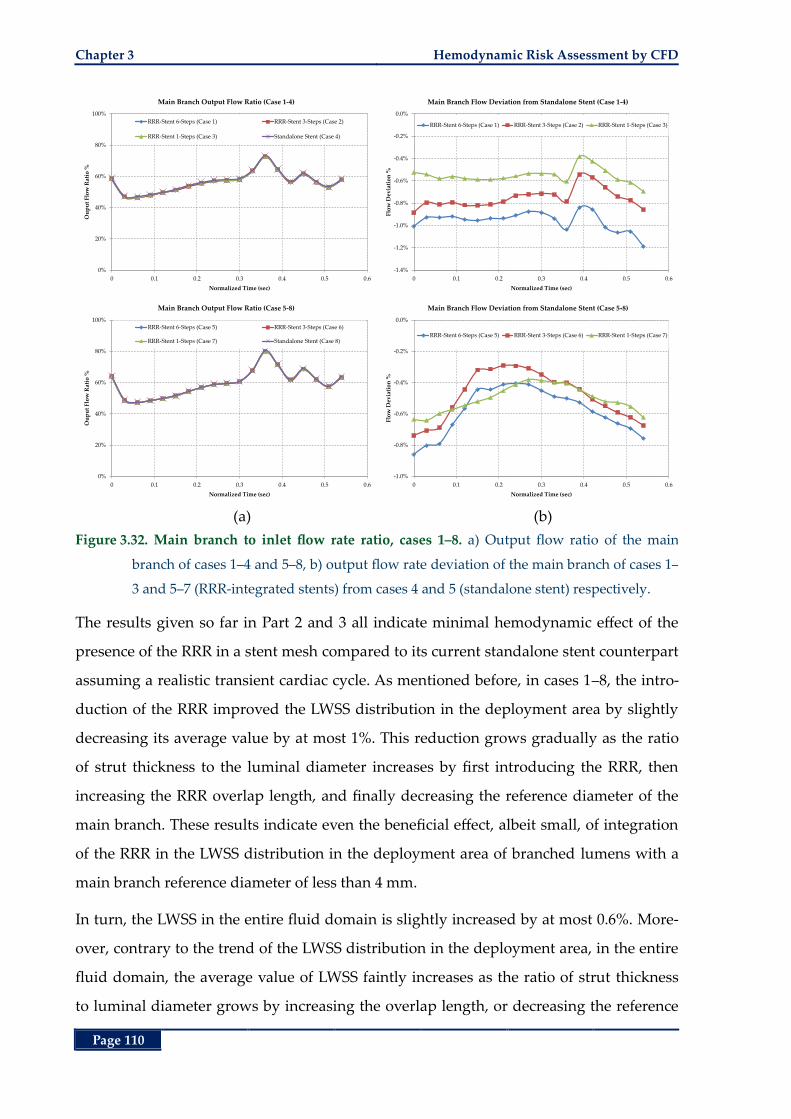
Chapter 3 Hemodynamic Risk Assessment by CFD
Page 110
(a) (b)
Figure 3.32. Main branch to inlet flow rate ratio, cases 1‒8. a) Output flow ratio of the main
branch of cases 1‒4 and 5‒8, b) output flow rate deviation of the main branch of cases 1‒
3 and 5‒7 (RRR-integrated stents) from cases 4 and 5 (standalone stent) respectively.
The results given so far in Part 2 and 3 all indicate minimal hemodynamic effect of the
presence of the RRR in a stent mesh compared to its current standalone stent counterpart
assuming a realistic transient cardiac cycle. As mentioned before, in cases 1‒8, the intro-
duction of the RRR improved the LWSS distribution in the deployment area by slightly
decreasing its average value by at most 1%. This reduction grows gradually as the ratio
of strut thickness to the luminal diameter increases by first introducing the RRR, then
increasing the RRR overlap length, and finally decreasing the reference diameter of the
main branch. These results indicate even the beneficial effect, albeit small, of integration
of the RRR in the LWSS distribution in the deployment area of branched lumens with a
main branch reference diameter of less than 4 mm.
In turn, the LWSS in the entire fluid domain is slightly increased by at most 0.6%. More-
over, contrary to the trend of the LWSS distribution in the deployment area, in the entire
fluid domain, the average value of LWSS faintly increases as the ratio of strut thickness
to luminal diameter grows by increasing the overlap length, or decreasing the reference
0%
20%
40%
60%
80%
100%
0 0.1 0.2 0.3 0.4 0.5 0.6
Ou
pu
t F
low
Rat
io %
Normalized Time (sec)
Main Branch Output Flow Ratio (Case 1-4)
RRR-Stent 6-Steps (Case 1) RRR-Stent 3-Steps (Case 2)
RRR-Stent 1-Steps (Case 3) Standalone Stent (Case 4)
-1.4%
-1.2%
-1.0%
-0.8%
-0.6%
-0.4%
-0.2%
0.0%
0 0.1 0.2 0.3 0.4 0.5 0.6
Flo
w D
evia
tio
n %
Normalized Time (sec)
Main Branch Flow Deviation from Standalone Stent (Case 1-4)
RRR-Stent 6-Steps (Case 1) RRR-Stent 3-Steps (Case 2) RRR-Stent 1-Steps (Case 3)
0%
20%
40%
60%
80%
100%
0 0.1 0.2 0.3 0.4 0.5 0.6
Ou
pu
t F
low
Rat
io %
Normalized Time (sec)
Main Branch Output Flow Ratio (Case 5-8)
RRR-Stent 6-Steps (Case 5) RRR-Stent 3-Steps (Case 6)
RRR-Stent 1-Steps (Case 7) Standalone Stent (Case 8)
-1.0%
-0.8%
-0.6%
-0.4%
-0.2%
0.0%
0 0.1 0.2 0.3 0.4 0.5 0.6
Flo
w D
evia
tio
n %
Normalized Time (sec)
Main Branch Flow Deviation from Standalone Stent (Case 5-8)
RRR-Stent 6-Steps (Case 5) RRR-Stent 3-Steps (Case 6) RRR-Stent 1-Steps (Case 7)
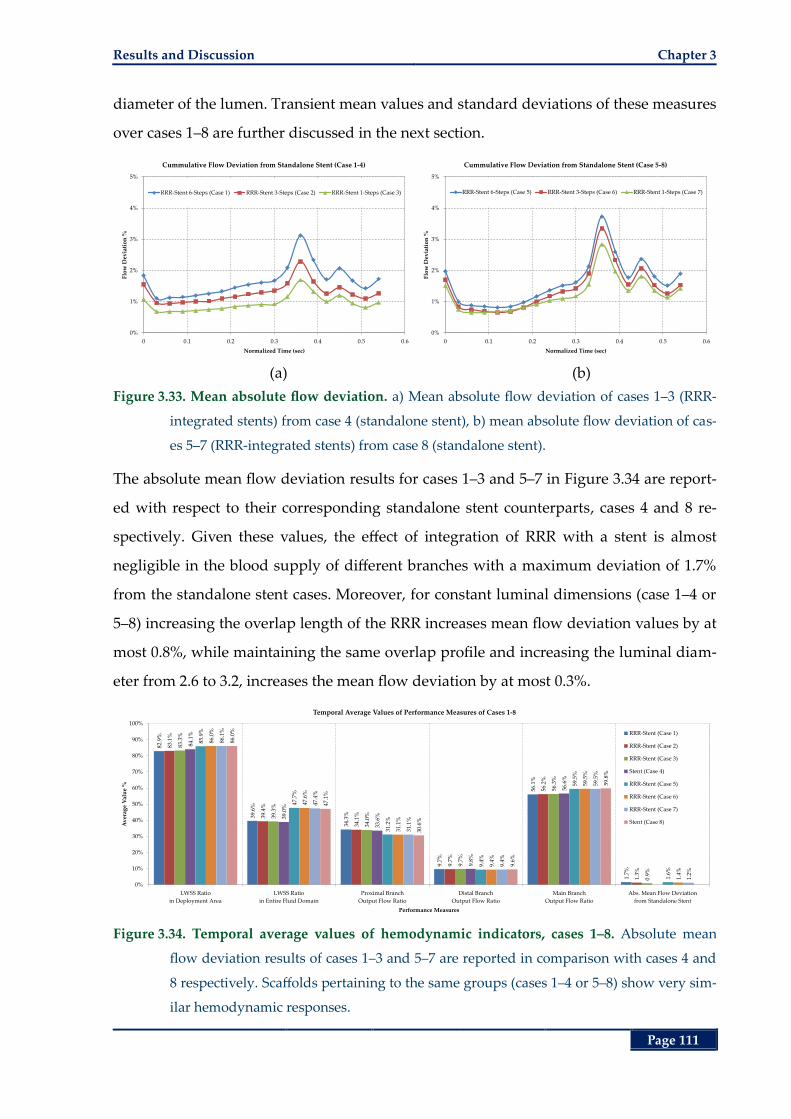
Results and Discussion Chapter 3
Page 111
diameter of the lumen. Transient mean values and standard deviations of these measures
over cases 1‒8 are further discussed in the next section.
(a) (b)
Figure 3.33. Mean absolute flow deviation. a) Mean absolute flow deviation of cases 1‒3 (RRR-
integrated stents) from case 4 (standalone stent), b) mean absolute flow deviation of cas-
es 5‒7 (RRR-integrated stents) from case 8 (standalone stent).
The absolute mean flow deviation results for cases 1‒3 and 5‒7 in Figure 3.34 are report-
ed with respect to their corresponding standalone stent counterparts, cases 4 and 8 re-
spectively. Given these values, the effect of integration of RRR with a stent is almost
negligible in the blood supply of different branches with a maximum deviation of 1.7%
from the standalone stent cases. Moreover, for constant luminal dimensions (case 1‒4 or
5‒8) increasing the overlap length of the RRR increases mean flow deviation values by at
most 0.8%, while maintaining the same overlap profile and increasing the luminal diam-
eter from 2.6 to 3.2, increases the mean flow deviation by at most 0.3%.
Figure 3.34. Temporal average values of hemodynamic indicators, cases 1‒8. Absolute mean
flow deviation results of cases 1‒3 and 5‒7 are reported in comparison with cases 4 and
8 respectively. Scaffolds pertaining to the same groups (cases 1‒4 or 5‒8) show very sim-
ilar hemodynamic responses.
0%
1%
2%
3%
4%
5%
0 0.1 0.2 0.3 0.4 0.5 0.6
Flo
w D
evia
tio
n %
Normalized Time (sec)
Cummulative Flow Deviation from Standalone Stent (Case 1-4)
RRR-Stent 6-Steps (Case 1) RRR-Stent 3-Steps (Case 2) RRR-Stent 1-Steps (Case 3)
0%
1%
2%
3%
4%
5%
0 0.1 0.2 0.3 0.4 0.5 0.6
Flo
w D
evia
tio
n %
Normalized Time (sec)
Cummulative Flow Deviation from Standalone Stent (Case 5-8)
RRR-Stent 6-Steps (Case 5) RRR-Stent 3-Steps (Case 6) RRR-Stent 1-Steps (Case 7)
82.9
%
39.6
%
34.3
%
9.7%
56.1
%
1.7%
83.1
%
39.4
%
34.1
%
9.7%
56.2
%
1.3%
83.3
%
39.3
%
34.0
%
9.7%
56.3
%
0.9%
84.1
%
39.0
%
33.6
%
9.8%
56.6
%
85.9
%
47.7
%
31.2
%
9.4%
59.5
%
1.6%
86.0
%
47.6
%
31.1
%
9.4%
59.5
%
1.4%
86.1
%
47.4
%
31.1
%
9.4%
59.5
%
1.2%
86.0
%
47.1
%
30.6
%
9.6%
59.8
%
0%
10%
20%
30%
40%
50%
60%
70%
80%
90%
100%
LWSS Ratio
in Deployment Area
LWSS Ratio
in Entire Fluid Domain
Proximal Branch
Output Flow Ratio
Distal Branch
Output Flow Ratio
Main Branch
Output Flow Ratio
Abs. Mean Flow Deviation
from Standalone Stent
Av
erag
e V
alu
e %
Performance Measures
Temporal Average Values of Performance Measures of Cases 1-8
RRR-Stent (Case 1)
RRR-Stent (Case 2)
RRR-Stent (Case 3)
Stent (Case 4)
RRR-Stent (Case 5)
RRR-Stent (Case 6)
RRR-Stent (Case 7)
Stent (Case 8)
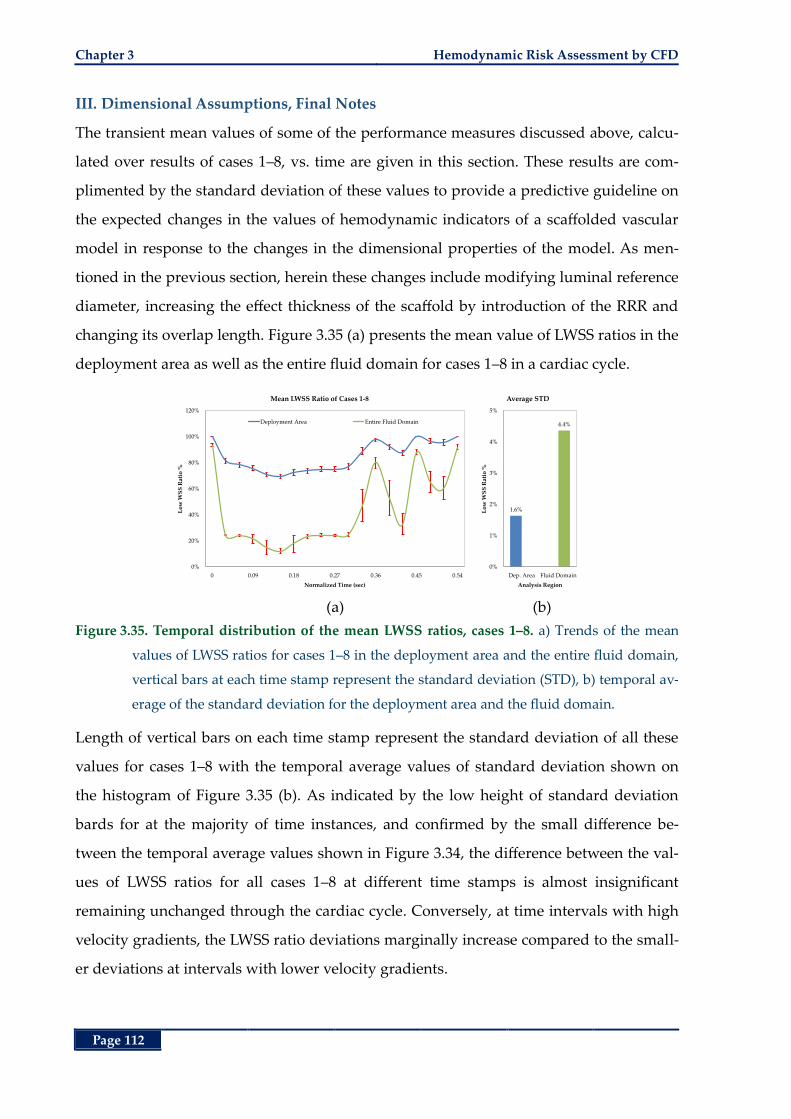
Chapter 3 Hemodynamic Risk Assessment by CFD
Page 112
III. Dimensional Assumptions, Final Notes
The transient mean values of some of the performance measures discussed above, calcu-
lated over results of cases 1‒8, vs. time are given in this section. These results are com-
plimented by the standard deviation of these values to provide a predictive guideline on
the expected changes in the values of hemodynamic indicators of a scaffolded vascular
model in response to the changes in the dimensional properties of the model. As men-
tioned in the previous section, herein these changes include modifying luminal reference
diameter, increasing the effect thickness of the scaffold by introduction of the RRR and
changing its overlap length. Figure 3.35 (a) presents the mean value of LWSS ratios in the
deployment area as well as the entire fluid domain for cases 1‒8 in a cardiac cycle.
(a) (b)
Figure 3.35. Temporal distribution of the mean LWSS ratios, cases 1‒8. a) Trends of the mean
values of LWSS ratios for cases 1‒8 in the deployment area and the entire fluid domain,
vertical bars at each time stamp represent the standard deviation (STD), b) temporal av-
erage of the standard deviation for the deployment area and the fluid domain.
Length of vertical bars on each time stamp represent the standard deviation of all these
values for cases 1‒8 with the temporal average values of standard deviation shown on
the histogram of Figure 3.35 (b). As indicated by the low height of standard deviation
bards for at the majority of time instances, and confirmed by the small difference be-
tween the temporal average values shown in Figure 3.34, the difference between the val-
ues of LWSS ratios for all cases 1‒8 at different time stamps is almost insignificant
remaining unchanged through the cardiac cycle. Conversely, at time intervals with high
velocity gradients, the LWSS ratio deviations marginally increase compared to the small-
er deviations at intervals with lower velocity gradients.
0%
20%
40%
60%
80%
100%
120%
0 0.09 0.18 0.27 0.36 0.45 0.54
Lo
w W
SS
Rat
io %
Normalized Time (sec)
Mean LWSS Ratio of Cases 1-8
Deployment Area Entire Fluid Domain
1.6%
4.4%
0%
1%
2%
3%
4%
5%
Dep. Area Fluid Domain
Lo
w W
SS
Rat
io %
Analysis Region
Average STD
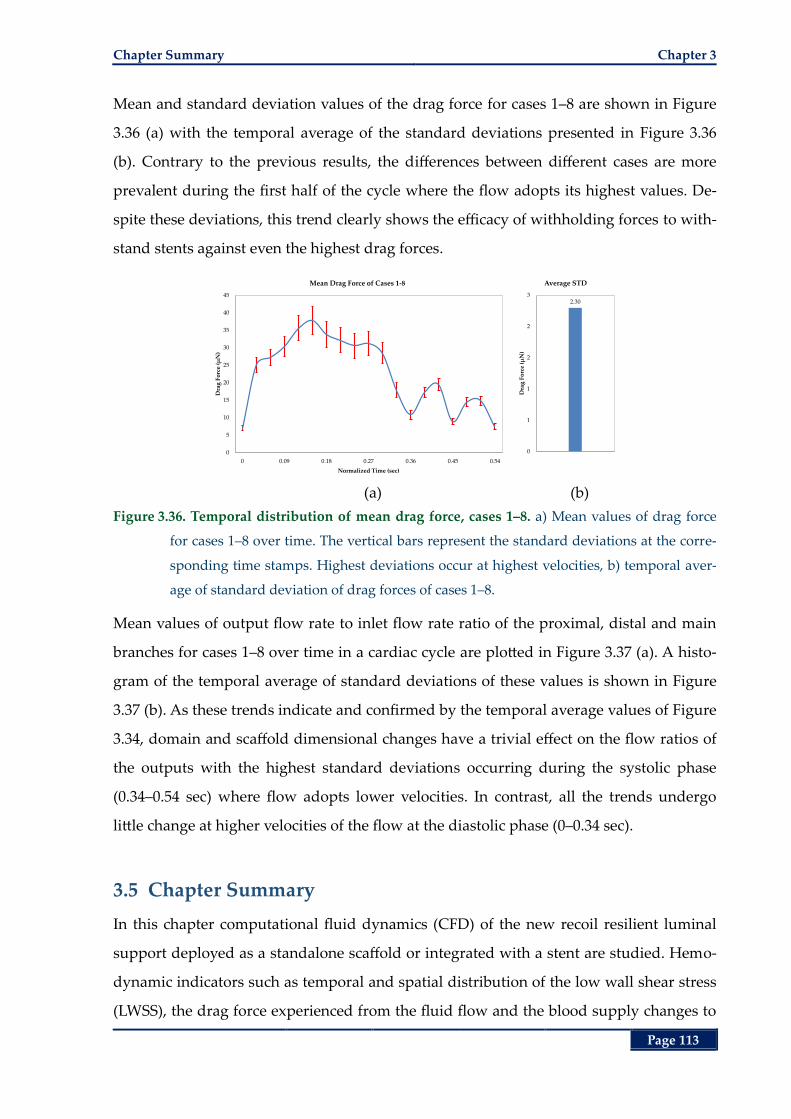
Chapter Summary Chapter 3
Page 113
Mean and standard deviation values of the drag force for cases 1‒8 are shown in Figure
3.36 (a) with the temporal average of the standard deviations presented in Figure 3.36
(b). Contrary to the previous results, the differences between different cases are more
prevalent during the first half of the cycle where the flow adopts its highest values. De-
spite these deviations, this trend clearly shows the efficacy of withholding forces to with-
stand stents against even the highest drag forces.
(a) (b)
Figure 3.36. Temporal distribution of mean drag force, cases 1‒8. a) Mean values of drag force
for cases 1‒8 over time. The vertical bars represent the standard deviations at the corre-
sponding time stamps. Highest deviations occur at highest velocities, b) temporal aver-
age of standard deviation of drag forces of cases 1‒8.
Mean values of output flow rate to inlet flow rate ratio of the proximal, distal and main
branches for cases 1‒8 over time in a cardiac cycle are plotted in Figure 3.37 (a). A histo-
gram of the temporal average of standard deviations of these values is shown in Figure
3.37 (b). As these trends indicate and confirmed by the temporal average values of Figure
3.34, domain and scaffold dimensional changes have a trivial effect on the flow ratios of
the outputs with the highest standard deviations occurring during the systolic phase
(0.34–0.54 sec) where flow adopts lower velocities. In contrast, all the trends undergo
little change at higher velocities of the flow at the diastolic phase (0–0.34 sec).
3.5 Chapter Summary
In this chapter computational fluid dynamics (CFD) of the new recoil resilient luminal
support deployed as a standalone scaffold or integrated with a stent are studied. Hemo-
dynamic indicators such as temporal and spatial distribution of the low wall shear stress
(LWSS), the drag force experienced from the fluid flow and the blood supply changes to
0
5
10
15
20
25
30
35
40
45
0 0.09 0.18 0.27 0.36 0.45 0.54
Dra
g F
orc
e (µ
N)
Normalized Time (sec)
Mean Drag Force of Cases 1-8
2.30
0
1
1
2
2
3
Dra
g F
orc
e (µ
N)
Average STD
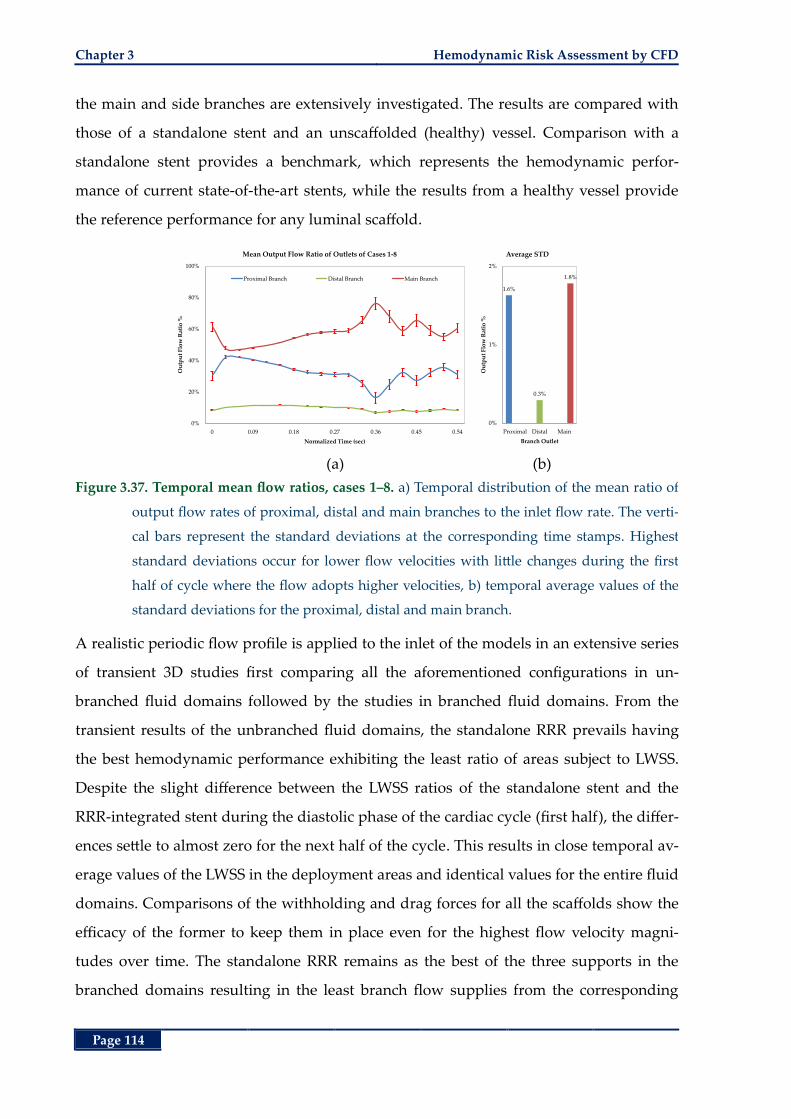
Chapter 3 Hemodynamic Risk Assessment by CFD
Page 114
the main and side branches are extensively investigated. The results are compared with
those of a standalone stent and an unscaffolded (healthy) vessel. Comparison with a
standalone stent provides a benchmark, which represents the hemodynamic perfor-
mance of current state-of-the-art stents, while the results from a healthy vessel provide
the reference performance for any luminal scaffold.
(a) (b)
Figure 3.37. Temporal mean flow ratios, cases 1‒8. a) Temporal distribution of the mean ratio of
output flow rates of proximal, distal and main branches to the inlet flow rate. The verti-
cal bars represent the standard deviations at the corresponding time stamps. Highest
standard deviations occur for lower flow velocities with little changes during the first
half of cycle where the flow adopts higher velocities, b) temporal average values of the
standard deviations for the proximal, distal and main branch.
A realistic periodic flow profile is applied to the inlet of the models in an extensive series
of transient 3D studies first comparing all the aforementioned configurations in un-
branched fluid domains followed by the studies in branched fluid domains. From the
transient results of the unbranched fluid domains, the standalone RRR prevails having
the best hemodynamic performance exhibiting the least ratio of areas subject to LWSS.
Despite the slight difference between the LWSS ratios of the standalone stent and the
RRR-integrated stent during the diastolic phase of the cardiac cycle (first half), the differ-
ences settle to almost zero for the next half of the cycle. This results in close temporal av-
erage values of the LWSS in the deployment areas and identical values for the entire fluid
domains. Comparisons of the withholding and drag forces for all the scaffolds show the
efficacy of the former to keep them in place even for the highest flow velocity magni-
tudes over time. The standalone RRR remains as the best of the three supports in the
branched domains resulting in the least branch flow supplies from the corresponding
0%
20%
40%
60%
80%
100%
0 0.09 0.18 0.27 0.36 0.45 0.54
Ou
tpu
t F
low
Rat
io %
Normalized Time (sec)
Mean Output Flow Ratio of Outlets of Cases 1-8
Proximal Branch Distal Branch Main Branch
1.6%
0.3%
1.8%
0%
1%
2%
Proximal Distal Main
Ou
tpu
t F
low
Rat
io %
Branch Outlet
Average STD
Chapter Summary Chapter 3
Page 115
branch flow supplies an unscaffolded (healthy) domain and the lowest ratios of areas
subject to LWSS compared to the other two scaffolds. The temporal trends of LWSS ratio
for the standalone stent and the RRR-integrated stent are closely intertwined through the
entire cardiac cycle decreasing the difference to as low as 1% on average in the deploy-
ment area and identical values for the entire fluid domain.
Deviation of output flow rates in the side and main branches of the standalone and RRR-
integrated stent domains from corresponding branches of a healthy vessel, follow similar
trends. These results demonstrate the efficacy of the RRR-integrated stent to deliver a
hemodynamic response at least as good as the current state-of-the-art stents considering
its superior resilience benefits over the later as demonstrated by the high radial strength
of the RRR in comparison to a commercial stent in Chapter 2.
Sensitivity of the results to the dimensional assumptions of the fluid domains and
scaffolds in the branched arteries is then studied. In these studies, hemodynamic per-
formance indicators of the RRR-integrated stents, with different overlap lengths from the
two ends of the RRR and different reference luminal diameters, are compared with cor-
responding standalone stents. The results are in good agreement with the ones pertain-
ing to the branched domain analysis conducted earlier once again demonstrating a close
resemblance between the hemodynamic behaviour of the standalone and the RRR-
integrated stents. Moreover, in the RRR-integrated stent deployment cases in smaller ar-
teries and with longer overlap lengths from the two ends of the RRR, less ratio of area
subject to LWSS is observed compared to similar deployment cases of standalone stents.
Comparison of all the study cases reveals small standard deviations for the LWSS ratios
at the deployment area while becoming relatively greater for the LWSS ratios in the en-
tire fluid domain. Differences of the outlet flow ratios are insignificant for the high flow
velocities while relatively increasing for lower velocity magnitudes. Temporal average
values of the performance indicators show very little dependence of our results on the
dimensional assumptions of the fluid domain and RRR’s overlap length showing the
merit of both the standalone RRR and the RRR-integrated stent as viable biomedical im-
plants for luminal constrictions.
So far Chapters 2 and 3 demonstrated mechanical benefits of the new RRR and its con-
formance with the current state-of-the-art stenting standards. High recoil resilience and
Chapter 3 Hemodynamic Risk Assessment by CFD
Page 116
radial strength of the RRR in comparison with commercial stents as well as its deploy-
ment capability by current angioplasty balloon expansion technique was demonstrated
in Chapter 2. Moreover, RRR’s hemodynamic implications after deployment and its con-
formance with current expected hemodynamic response of a luminal support were
demonstrated here in Chapter 3. The interlocked, thus incremental, expansion mecha-
nism of the RRR, its high transformation temperature in comparison to its deployment
environment (human body) temperature, it thermally trained expanded shape, and the
shape memory effect of Nitinol can potentially be utilized for alternative expansion
mechanisms. In chapter 4 these actuation mechanisms as alternatives or complimentary
to the current expansion by an angioplasty balloon are investigate.
Page 117
Chapter 4
Chapter 4. Thermal Actuation of the Recoil Resilient Ring
Thermal Actuation of the
Recoil Resilient Ring
part from balloon expansion mechanism discussed in
Chapter 2, the recoil resilient rings (RRR) have the po-
tential to be actuated by application of heat. This is
possible due to the shape memory effect of Nitinol utilized in fab-
rication of the RRRs. So far, these structures were considered in
the more flexible martensite state of their material where plastic
deformations are readily achieved. Nevertheless, as Nitinol un-
dergoes microscopic changes in response to thermal stimuli, it can
recover high strain rates up to 10% in the austenite state promising
alternative expansion mechanisms for the RRR.
Therefore, in this chapter expansion of the proposed RRR in Chap-
ter 2 by application of heat, and later electrical currents is ex-
plored. To demonstrate feasibility of such alternative actuation
mechanisms, extensive analytical and numerical studies are con-
ducted that are complimented by experimental studies.
A
Chapter 4
Chapter 4 Recoil Resilient Ring
Page 118
4.1 Abstract
In the previous chapters scaffolding and hemodynamic benefits of the new RRR design
were discussed through several experimental and numerical studies. The conformity and
easy expansion of the RRR using current state-of-the-art angioplasty balloons were
demonstrated in Chapter 2 where the superior radial resilience of the RRR was demon-
strated and compared to a commercial stent. In Chapter 3, the influence of the presence
of the RRR as a standalone or integrated support on the extension of areas with low wall
shear stress, as a harbinger of later restenosis, compared to current stent structures was
demonstrated. The shape memory properties of Nitinol used for fabrication of the RRR
and the specific thermally trained shape of the RRR at its expanded state may further be
utilized to explore other methods of actuation such as by heat. Having a transformation
temperature, higher than the deployment region’s temperature (body temperature), it is
possible to force the normally martensite RRR into the austenite phase that can potential-
ly exert high radial expansion forces. In this chapter these possibilities are explored
through several studies. First, a heat-induced expansion scenario in vitro is studied by
initially ensuring safe operation temperature values that are experienced by a mock ves-
sel through theoretical, numerical and experimental studies. Our results indicate that the
temperature of all parts of the mock vessel during application of heat to the RRR and be-
fore its expansion fall below the recommended operation range. Furthermore, free and in
vitro expansion of the RRR via application of heat are observed and measured in an ex-
perimental study. Secondly, the radial forces exerted by a constrained RRR that is under
stimuli of heat are measured experimentally. Finally, using the results from the first two
parts, an alternative actuation mechanism by application of an electric potential across
the RRR is proposed and examined through theoretical and numerical studies. At the
end, further suggestions are given as a continuation of this work.
4.2 Introduction
Shape Memory Alloys (SMA) such as Nitinol are new generations of materials that have
the ability to recover a pre-memorized shape when heated beyond a specific temperature
referred to as the transformation temperature. At this state of the material, called austen-
ite phase, the crystallographic structure of the material starts to align beyond the starting
Introduction Chapter 4
Page 119
transformation temperature (s
A ) and reaches its peak at a higher temperature referred
to as the finishing temperature (f
A ). This range of temperature is a characteristic of the
material that heavily relies on the slight changes in the ratio of nickel compound com-
pared to the titanium as well as the preparation conditions of the raw material and the
final device [94, 239]. Therefore, f
A may be engineered for specific applications ranging
from -200˚C to 110˚C. While cold, or below the transformation temperature, the SMA has
a low yield strength rendering it easily deformable into new shapes through a combina-
tion of superelastic and plastic strains. This state of the material is called the martensite
state. However, upon heating beyond the transformation temperature, the SMA under-
goes changes in its crystalline structure that promote the material recover its original
shape while reaching the austenite phase. In this process, if the material is constrained, it
exerts extremely large forces that may be utilized for actuation [95, 239].
The stress-strain curve of a typical martensite SMA such as Nitinol is shown in Figure 4.1
for both the martensite and austenite phases. Shape memory effect is illustrated
by Figure 4.1 (a), when the temperature is well below the transformation temperature. In
this state the material is easily deformable due to the low stiffness exhibited by an initial
linear elastic curve followed by the superelastic response from point A to B resulting in
large deformations for small values of stress. Upon unloading, part of the deformation is
recovered through elastic recovery though leaving residual deformations at point C.
Raising the temperature of the material above fA at this stage, induces a martensite to
austenite phase shift causing the structure recover the leftover strain from point C to the
initial shape. This effect is referred to as the one-way shape memory effect.
Figure 4.1 (b), demonstrates the stress strain response of the Nitinol in the austenite
phase while the temperature of the material is maintained above fA . The forward path
upon loading, demonstrates the high stiffness of the material at the early stages of stress-
ing, followed by the stress-induced forward phase transformation from austenite to mar-
tensite and the resultant superelastic response from point A to B. In this state, large
deformations are achieved with small increases in stress. During unloading, the sample
first exhibits an elastic recovery curve from point B to C, after which the stress- relieved
reverse martensite transformation (martensite to austenite) is observed from point C to
D. After finishing the loading and unloading cycle, Nitinol does not exhibit any residual
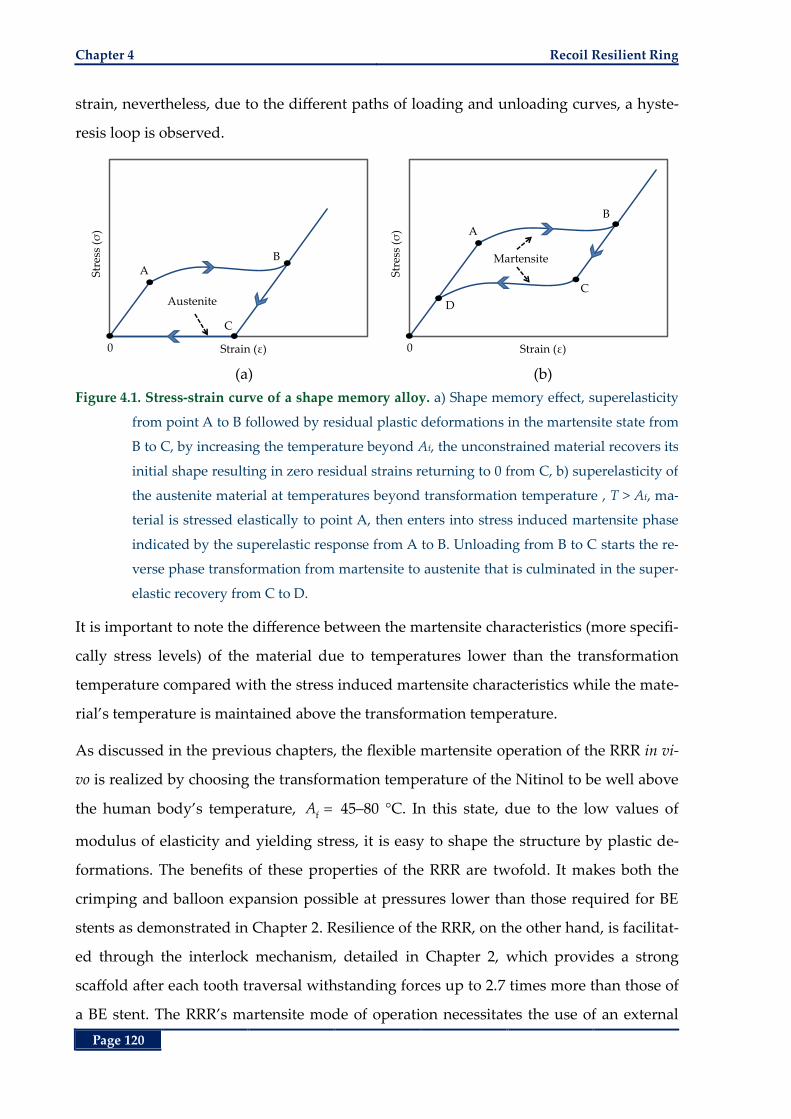
Chapter 4 Recoil Resilient Ring
Page 120
strain, nevertheless, due to the different paths of loading and unloading curves, a hyste-
resis loop is observed.
(a) (b)
Figure 4.1. Stress-strain curve of a shape memory alloy. a) Shape memory effect, superelasticity
from point A to B followed by residual plastic deformations in the martensite state from
B to C, by increasing the temperature beyond Af, the unconstrained material recovers its
initial shape resulting in zero residual strains returning to 0 from C, b) superelasticity of
the austenite material at temperatures beyond transformation temperature , T > Af, ma-
terial is stressed elastically to point A, then enters into stress induced martensite phase
indicated by the superelastic response from A to B. Unloading from B to C starts the re-
verse phase transformation from martensite to austenite that is culminated in the super-
elastic recovery from C to D.
It is important to note the difference between the martensite characteristics (more specifi-
cally stress levels) of the material due to temperatures lower than the transformation
temperature compared with the stress induced martensite characteristics while the mate-
rial’s temperature is maintained above the transformation temperature.
As discussed in the previous chapters, the flexible martensite operation of the RRR in vi-
vo is realized by choosing the transformation temperature of the Nitinol to be well above
the human body’s temperature, f
A 45‒80 °C. In this state, due to the low values of
modulus of elasticity and yielding stress, it is easy to shape the structure by plastic de-
formations. The benefits of these properties of the RRR are twofold. It makes both the
crimping and balloon expansion possible at pressures lower than those required for BE
stents as demonstrated in Chapter 2. Resilience of the RRR, on the other hand, is facilitat-
ed through the interlock mechanism, detailed in Chapter 2, which provides a strong
scaffold after each tooth traversal withstanding forces up to 2.7 times more than those of
a BE stent. The RRR’s martensite mode of operation necessitates the use of an external
AB
C
0
Str
ess
(σ)
Strain (ε)
Austenite
A
B
C
0
Str
ess
(σ)
Strain (ε)
D
Martensite
Materials and Methods Chapter 4
Page 121
expanding device such as an angioplasty balloon for deployment inside a duct. In con-
trast, given the high strain recovery of the austenite Nitinol by around 10% [95, 239], fur-
ther potential actuation and/or adjustment schemes would become beneficial either in
conjunction with or as a replacement to the use of angioplasty balloon expansion. This
mode of expansion may be used for subsequent radial adjustments after initial deploy-
ment, should restenosis or recoil occur in the future.
4.3 Materials and Methods
The RRR prototype introduced in Chapter 2 is micromachined from Nitinol sheets of 0.2-
mm thickness with the starting transformation temperature (As) ranging 50‒60˚C and a
final transformation temperature ( fA ) of 80˚C. Both these temperatures are well above
the typical human body temperatures of 37˚C. It is important to note that the thermal ac-
tuation methods described in this section are not unique for any specific SMA and may
be applied to Nitinol structures with lower f
A , e.g. 45‒50˚C, for safe operation in vivo. In
order to study the actuation of the crimped RRR through thermal excitation and evaluate
the capability of the outward forces to expand against vascular walls, two in vitro meth-
ods are proposed in this chapter.
In the first method, using a heat transfer (HT) rod, temperature of a deformed (crimped)
RRR in the martensite state is raised slightly above the transformation temperature fA
while suspended inside a mock vessel. Expansion of the RRR inside the mock vessel as a
result of phase change from martensite to austenite followed by teeth interlock and sub-
sequent cooling is confirmed visually and through measurement of the outer diameter of
the RRR in a free expansion scenario. Due to the high value of fA for the Nitinol sample
available, and in order to ensure safe operation of the mock vessel in this setup while
close to the HT rod, analytical, numerical and experimental studies were conducted to
evaluate the distribution of heat in the mock vessel. Moreover, to quantify the radial
forces exerted by a constrained crimped RRR, these forces are experimentally measured
at different temperatures while Nitinol undergoes phase transformation from martensite
to austenite. In the end, an alternative method is proposed for the generation of heat in
an RRR utilizing an electric current and Joule heating in electronic components for actua-
tion of the ring.
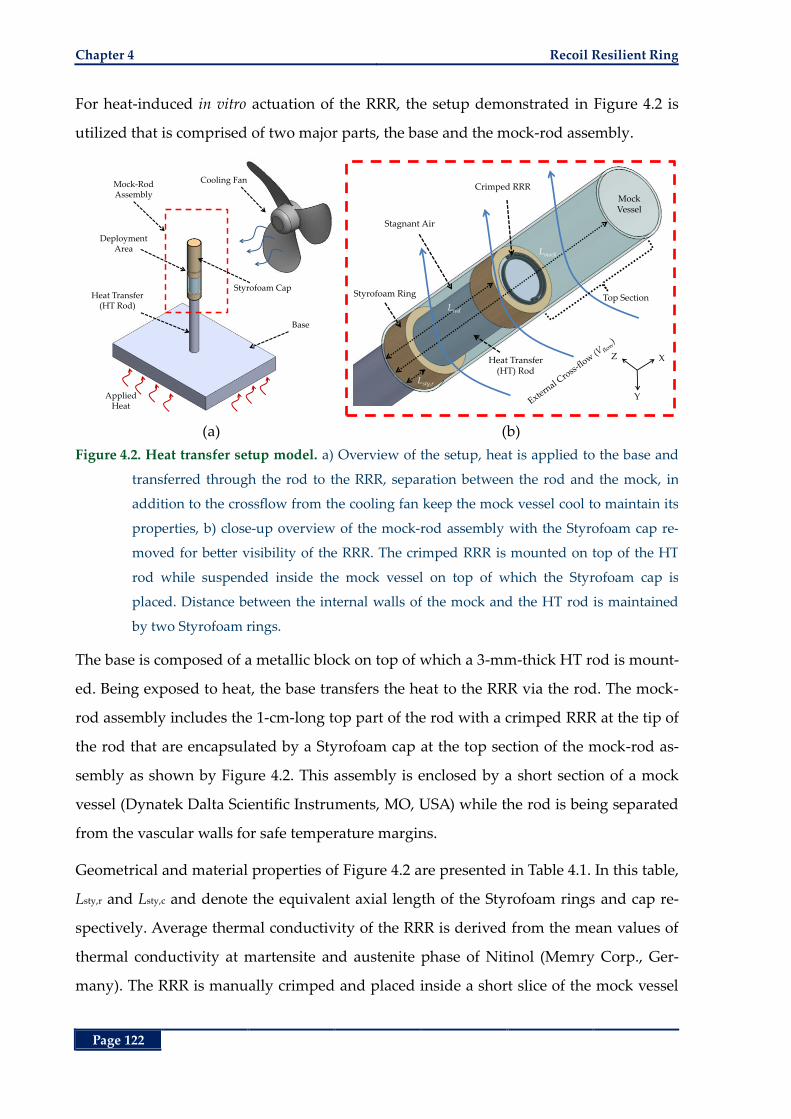
Chapter 4 Recoil Resilient Ring
Page 122
For heat-induced in vitro actuation of the RRR, the setup demonstrated in Figure 4.2 is
utilized that is comprised of two major parts, the base and the mock-rod assembly.
(a) (b)
Figure 4.2. Heat transfer setup model. a) Overview of the setup, heat is applied to the base and
transferred through the rod to the RRR, separation between the rod and the mock, in
addition to the crossflow from the cooling fan keep the mock vessel cool to maintain its
properties, b) close-up overview of the mock-rod assembly with the Styrofoam cap re-
moved for better visibility of the RRR. The crimped RRR is mounted on top of the HT
rod while suspended inside the mock vessel on top of which the Styrofoam cap is
placed. Distance between the internal walls of the mock and the HT rod is maintained
by two Styrofoam rings.
The base is composed of a metallic block on top of which a 3-mm-thick HT rod is mount-
ed. Being exposed to heat, the base transfers the heat to the RRR via the rod. The mock-
rod assembly includes the 1-cm-long top part of the rod with a crimped RRR at the tip of
the rod that are encapsulated by a Styrofoam cap at the top section of the mock-rod as-
sembly as shown by Figure 4.2. This assembly is enclosed by a short section of a mock
vessel (Dynatek Dalta Scientific Instruments, MO, USA) while the rod is being separated
from the vascular walls for safe temperature margins.
Geometrical and material properties of Figure 4.2 are presented in Table 4.1. In this table,
Lsty,r and Lsty,c and denote the equivalent axial length of the Styrofoam rings and cap re-
spectively. Average thermal conductivity of the RRR is derived from the mean values of
thermal conductivity at martensite and austenite phase of Nitinol (Memry Corp., Ger-
many). The RRR is manually crimped and placed inside a short slice of the mock vessel
Base
Cooling FanMock-RodAssembly
Heat Transfer(HT Rod)
AppliedHeat
Styrofoam Cap
DeploymentArea
Styrofoam Ring
Stagnant Air
Heat Transfer (HT) Rod
Mock Vessel
Lmock
Lrod
Lsty,r
X
Y
Z
Crimped RRR
Top Section
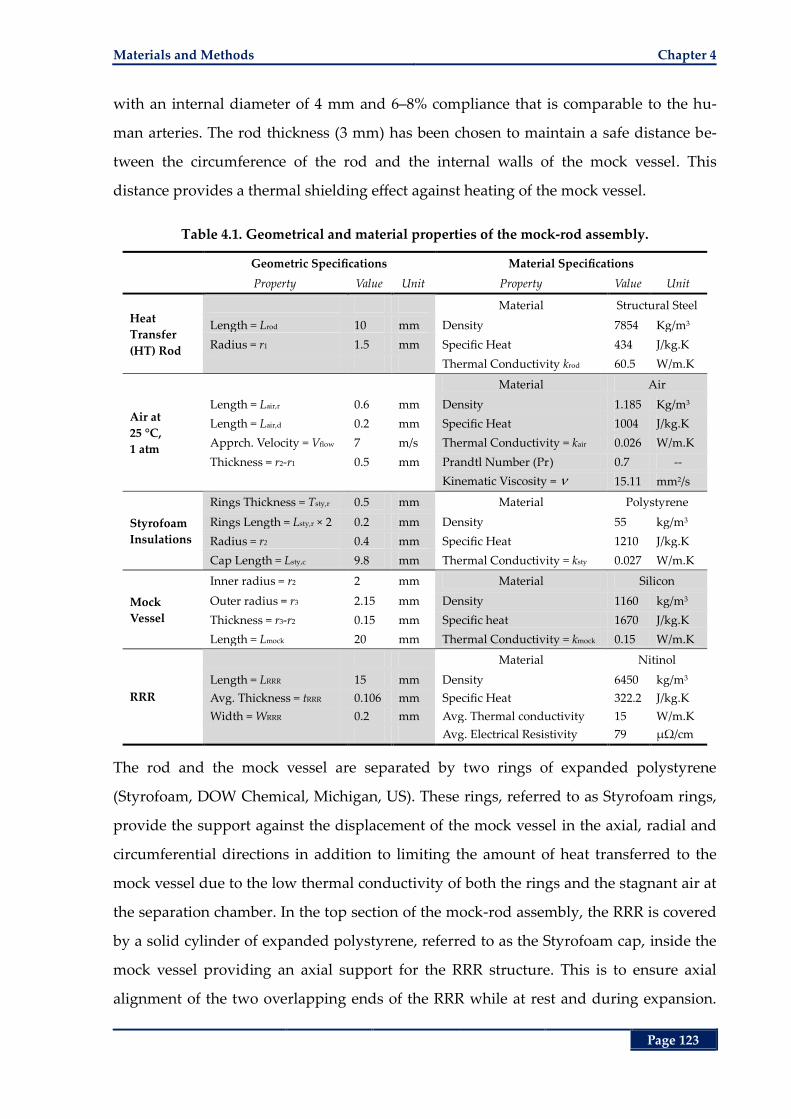
Materials and Methods Chapter 4
Page 123
with an internal diameter of 4 mm and 6‒8% compliance that is comparable to the hu-
man arteries. The rod thickness (3 mm) has been chosen to maintain a safe distance be-
tween the circumference of the rod and the internal walls of the mock vessel. This
distance provides a thermal shielding effect against heating of the mock vessel.
Table 4.1. Geometrical and material properties of the mock-rod assembly.
Geometric Specifications Material Specifications
Property Value Unit Property Value Unit
Heat
Transfer
(HT) Rod
Material Structural Steel
Length = Lrod 10 mm Density 7854 Kg/m3
Radius = r1 1.5 mm Specific Heat 434 J/kg.K
Thermal Conductivity krod 60.5 W/m.K
Air at
25 °C,
1 atm
Material Air
Length = Lair,r 0.6 mm Density 1.185 Kg/m3
Length = Lair,d 0.2 mm Specific Heat 1004 J/kg.K
Apprch. Velocity = Vflow 7 m/s Thermal Conductivity = kair 0.026 W/m.K
Thickness = r2-r1 0.5 mm Prandtl Number (Pr) 0.7 --
Kinematic Viscosity = 15.11 mm2/s
Styrofoam
Insulations
Rings Thickness = Tsty,r 0.5 mm Material Polystyrene
Rings Length = Lsty,r × 2 0.2 mm Density 55 kg/m3
Radius = r2 0.4 mm Specific Heat 1210 J/kg.K
Cap Length = Lsty,c 9.8 mm Thermal Conductivity = ksty 0.027 W/m.K
Mock
Vessel
Inner radius = r2 2 mm Material Silicon
Outer radius = r3 2.15 mm Density 1160 kg/m3
Thickness = r3-r2 0.15 mm Specific heat 1670 J/kg.K
Length = Lmock 20 mm Thermal Conductivity = kmock 0.15 W/m.K
RRR
Material Nitinol
Length = LRRR 15 mm Density 6450 kg/m3
Avg. Thickness = tRRR 0.106 mm Specific Heat 322.2 J/kg.K
Width = WRRR 0.2 mm Avg. Thermal conductivity 15 W/m.K
Avg. Electrical Resistivity 79 µΩ/cm
The rod and the mock vessel are separated by two rings of expanded polystyrene
(Styrofoam, DOW Chemical, Michigan, US). These rings, referred to as Styrofoam rings,
provide the support against the displacement of the mock vessel in the axial, radial and
circumferential directions in addition to limiting the amount of heat transferred to the
mock vessel due to the low thermal conductivity of both the rings and the stagnant air at
the separation chamber. In the top section of the mock-rod assembly, the RRR is covered
by a solid cylinder of expanded polystyrene, referred to as the Styrofoam cap, inside the
mock vessel providing an axial support for the RRR structure. This is to ensure axial
alignment of the two overlapping ends of the RRR while at rest and during expansion.
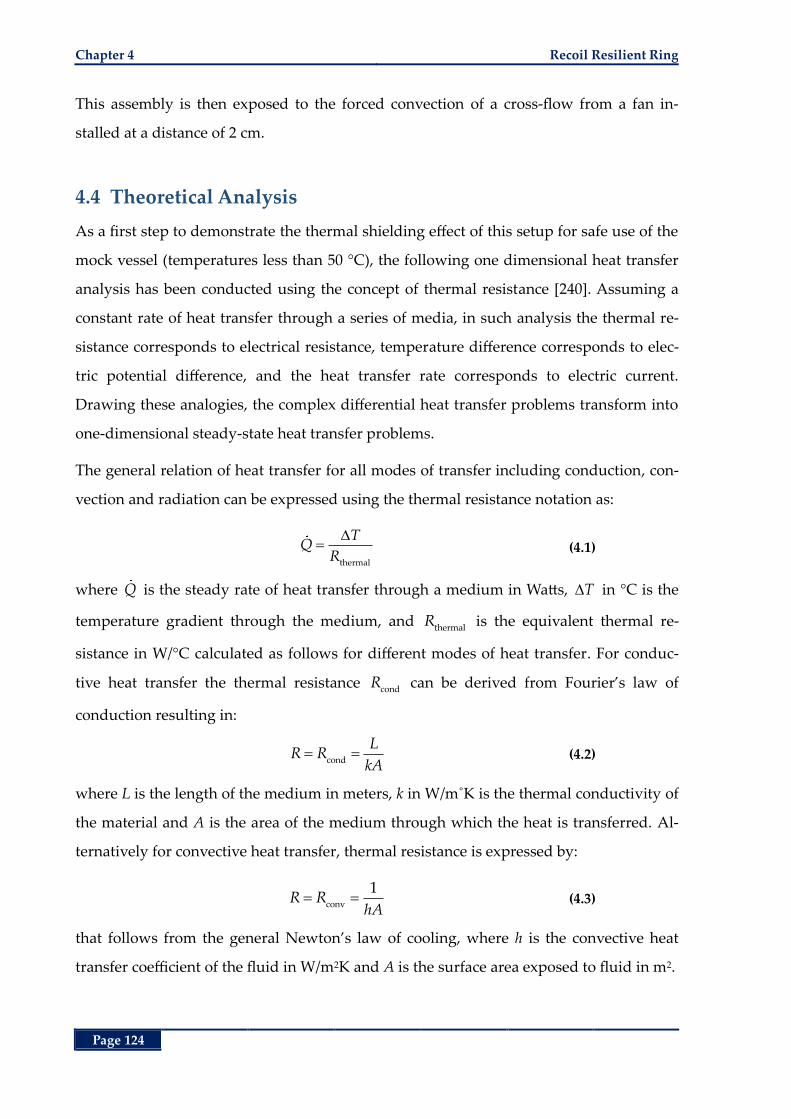
Chapter 4 Recoil Resilient Ring
Page 124
This assembly is then exposed to the forced convection of a cross-flow from a fan in-
stalled at a distance of 2 cm.
4.4 Theoretical Analysis
As a first step to demonstrate the thermal shielding effect of this setup for safe use of the
mock vessel (temperatures less than 50 °C), the following one dimensional heat transfer
analysis has been conducted using the concept of thermal resistance [240]. Assuming a
constant rate of heat transfer through a series of media, in such analysis the thermal re-
sistance corresponds to electrical resistance, temperature difference corresponds to elec-
tric potential difference, and the heat transfer rate corresponds to electric current.
Drawing these analogies, the complex differential heat transfer problems transform into
one-dimensional steady-state heat transfer problems.
The general relation of heat transfer for all modes of transfer including conduction, con-
vection and radiation can be expressed using the thermal resistance notation as:
thermal
TQ
R (4.1)
where Q is the steady rate of heat transfer through a medium in Watts, T in °C is the
temperature gradient through the medium, and thermal
R is the equivalent thermal re-
sistance in W/°C calculated as follows for different modes of heat transfer. For conduc-
tive heat transfer the thermal resistance condR can be derived from Fourier’s law of
conduction resulting in:
cond
LR R
kA (4.2)
where L is the length of the medium in meters, k in W/m˚K is the thermal conductivity of
the material and A is the area of the medium through which the heat is transferred. Al-
ternatively for convective heat transfer, thermal resistance is expressed by:
conv
1R R
hA (4.3)
that follows from the general Newton’s law of cooling, where h is the convective heat
transfer coefficient of the fluid in W/m2K and A is the surface area exposed to fluid in m2.
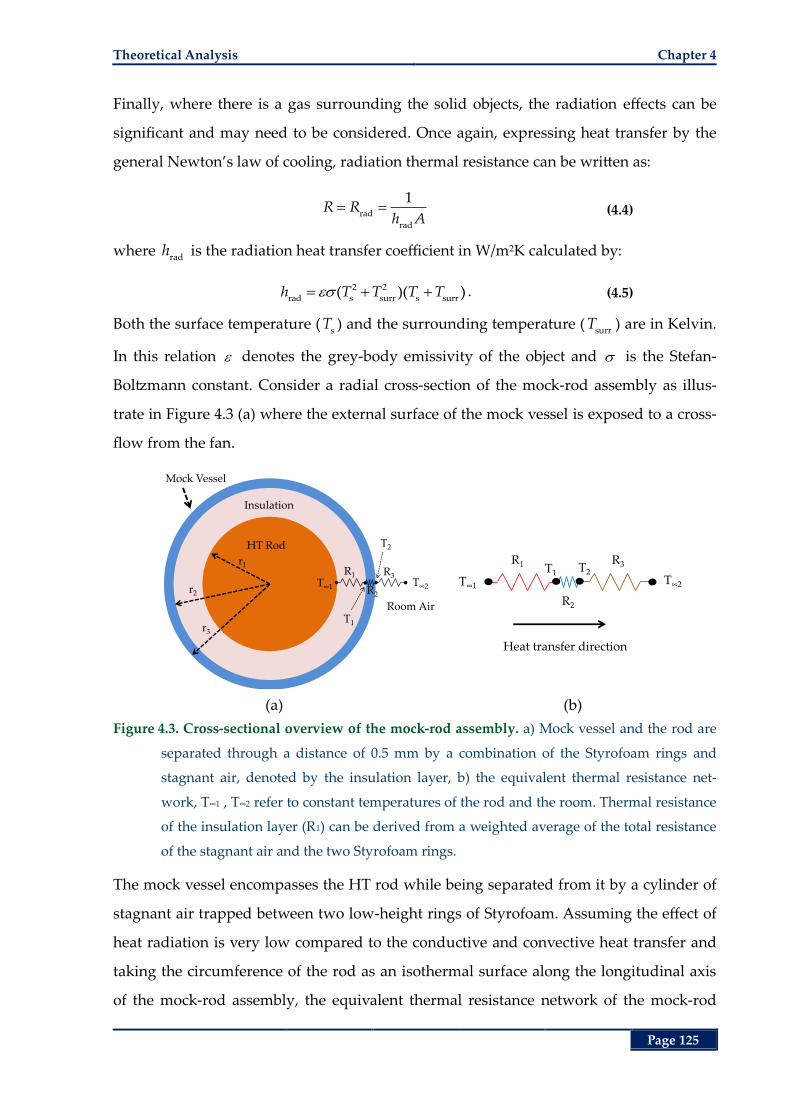
Theoretical Analysis Chapter 4
Page 125
Finally, where there is a gas surrounding the solid objects, the radiation effects can be
significant and may need to be considered. Once again, expressing heat transfer by the
general Newton’s law of cooling, radiation thermal resistance can be written as:
rad
rad
1R R
h A (4.4)
where rad
h is the radiation heat transfer coefficient in W/m2K calculated by:
2 2
rad s surr s surr( )( )h T T T T . (4.5)
Both the surface temperature (s
T ) and the surrounding temperature (surr
T ) are in Kelvin.
In this relation denotes the grey-body emissivity of the object and is the Stefan-
Boltzmann constant. Consider a radial cross-section of the mock-rod assembly as illus-
trate in Figure 4.3 (a) where the external surface of the mock vessel is exposed to a cross-
flow from the fan.
(a) (b)
Figure 4.3. Cross-sectional overview of the mock-rod assembly. a) Mock vessel and the rod are
separated through a distance of 0.5 mm by a combination of the Styrofoam rings and
stagnant air, denoted by the insulation layer, b) the equivalent thermal resistance net-
work, T∞1 , T∞2 refer to constant temperatures of the rod and the room. Thermal resistance
of the insulation layer (R1) can be derived from a weighted average of the total resistance
of the stagnant air and the two Styrofoam rings.
The mock vessel encompasses the HT rod while being separated from it by a cylinder of
stagnant air trapped between two low-height rings of Styrofoam. Assuming the effect of
heat radiation is very low compared to the conductive and convective heat transfer and
taking the circumference of the rod as an isothermal surface along the longitudinal axis
of the mock-rod assembly, the equivalent thermal resistance network of the mock-rod
r1
r2
r3
Mock Vessel
Insulation
HT Rod
R3
R2
R1T∞2T∞1
T1
T2
Room Air
R3
R2
R1
T∞2T∞1
T1 T2
Heat transfer direction
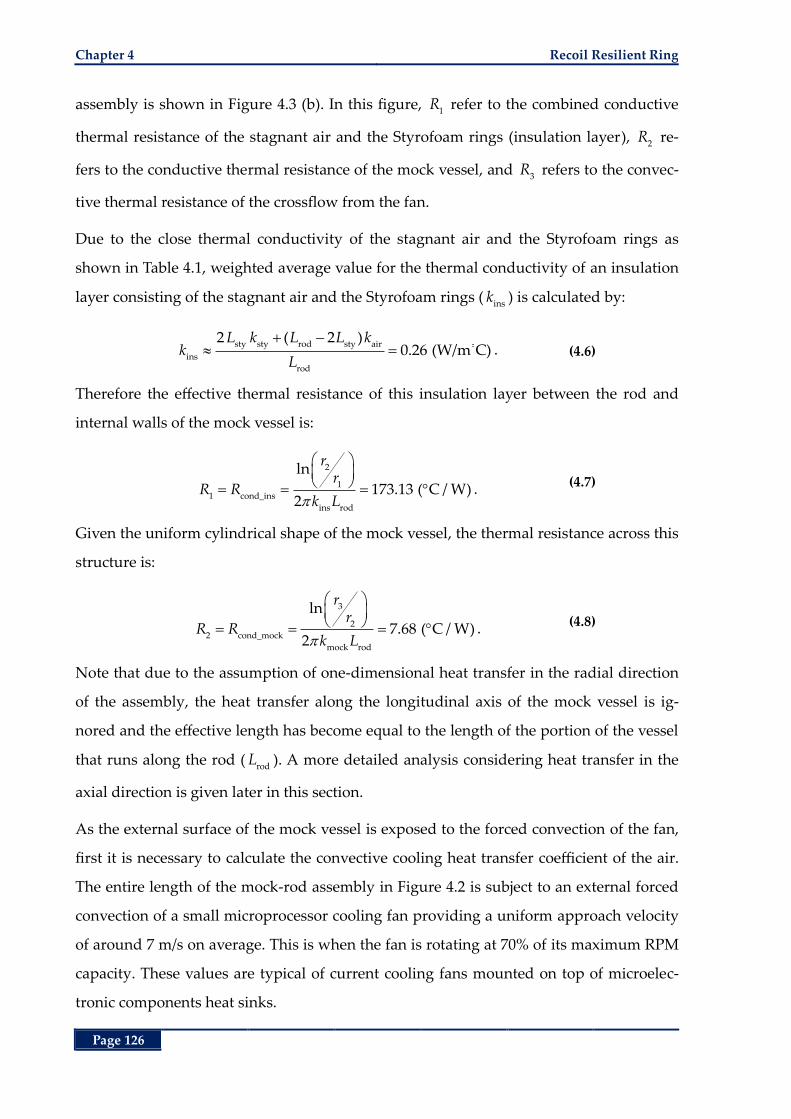
Chapter 4 Recoil Resilient Ring
Page 126
assembly is shown in Figure 4.3 (b). In this figure, 1
R refer to the combined conductive
thermal resistance of the stagnant air and the Styrofoam rings (insulation layer), 2
R re-
fers to the conductive thermal resistance of the mock vessel, and 3
R refers to the convec-
tive thermal resistance of the crossflow from the fan.
Due to the close thermal conductivity of the stagnant air and the Styrofoam rings as
shown in Table 4.1, weighted average value for the thermal conductivity of an insulation
layer consisting of the stagnant air and the Styrofoam rings (ins
k ) is calculated by:
sty sty rod sty air
ins
rod
2 ( 2 )0.26 (W/m C)
L k L L kk
L. (4.6)
Therefore the effective thermal resistance of this insulation layer between the rod and
internal walls of the mock vessel is:
2
1
1
ins r
co d_in
od
n s
ln
173.13 ( C / W)2
rr
R Rk L
. (4.7)
Given the uniform cylindrical shape of the mock vessel, the thermal resistance across this
structure is:
3
2
2 cond_mock
mock rod
ln
7.68 ( C / W)2
rr
R Rk L
. (4.8)
Note that due to the assumption of one-dimensional heat transfer in the radial direction
of the assembly, the heat transfer along the longitudinal axis of the mock vessel is ig-
nored and the effective length has become equal to the length of the portion of the vessel
that runs along the rod (rod
L ). A more detailed analysis considering heat transfer in the
axial direction is given later in this section.
As the external surface of the mock vessel is exposed to the forced convection of the fan,
first it is necessary to calculate the convective cooling heat transfer coefficient of the air.
The entire length of the mock-rod assembly in Figure 4.2 is subject to an external forced
convection of a small microprocessor cooling fan providing a uniform approach velocity
of around 7 m/s on average. This is when the fan is rotating at 70% of its maximum RPM
capacity. These values are typical of current cooling fans mounted on top of microelec-
tronic components heat sinks.
Theoretical Analysis Chapter 4
Page 127
Given the definition of the Nusselt (Nu) number [240], the convective heat transfer co-
efficient flow
h , can be calculated from:
conv flow flow chr
cond air chr air
Nu/
q h T h L
q k T L k (4.9)
where conv
q and cond
q are convective and conductive rate of heat flux (the rate of heat
transfer per unit time per unit surface area) respectively. The parameter chr
L is the char-
acteristic length of the geometry. In the case of a crossflow over a cylinder, the character-
istic length is equal to the external diameter of the radial cross-section of the assembly, in
this case the mock vessel. Value of Nusselt number depends on the regime of the fluid
that can be determined by the Reynolds (Re) number defined as follows:
flow chrInertial forces
ReViscous forces
V L (4.10)
where flow
V is the upstream (approach) velocity and is the kinematic viscosity of the
fluid. The value of Re, mainly describes the fluid flow regime [240]. Given relation (4.9),
the average Nusselt number for the laminar flow across the external surface of the mock
vessel can be expressed by the empirical relation of Churchill and Bernstein [240]:
4/55/81/2 1/3
cyl 1/42/3
0.62 Re Pr ReNu 0.3 1
2820001 0.4 / Pr
(4.11)
where Pr is the dimensionless Prandtl Number of the fluid, a characteristic of the materi-
al properties of the fluid that is close to 1 for most of the gases. Substituting values given
in Table 4.1 into equations (4.10), (4.11) then (4.9) results in the average effective convec-
tive heat transfer coefficient of flow
h 136 W/m2K that yields:
3 conv
3 rod flow
154.55 ( C / W)
2R R
r L h. (4.12)
Due to the presence of the thermal resistors in series, the total thermal resistance is simp-
ly the addition of all individual ones resulting in:
total 1 2 3
235.35 ( C / W)R R R R . (4.13)
Consequently, assuming the temperature of the rod and the room are kept constant at
80°C and 20°C respectively, the rate of heat transfer though the rod, insulation layer, and
mock vessel into the room evaluates to:
Chapter 4 Recoil Resilient Ring
Page 128
total
0.25 WT
QR
. (4.14)
Given the analogy between the electric current and the rate of heat transfer, and the con-
stant rate of heat transfer through all the layers of the media in Figure 4.3 (a), the uni-
form temperature at the internal walls of the mock vessel 1
T is calculated by:
1 1 1T T Q R (4.15)
where 1
T is the temperature of the HT rod assumed constant at 80 °C to ensure applica-
tion of temperatures above the transformation temperature of Nitinol to RRR and 1
R is
the conductive heat resistance of the insulation layer evaluated by relation (4.7). This
yields 1
36 °CT , which is well below the thermal operating range of the mock vessel, up
to 50 °C (Dynatek Dalta Scientific Instruments, MO, USA).
The theoretical framework described in this section provides a good first estimate of
temperature distribution in the radial direction of the cross-section of the mock-rod as-
sembly, yet it is limited in accuracy due to the following reasons. In an actual setup, the
heat flux is fetched through the bottom of the rod resulting in heat dissipation in the lon-
gitudinal direction of the assembly as well as the radial direction. This actual scenario
turns the heat transfer problem into a multi-dimensional problem governed by more
complex differential equations.
A better approximation of the heat transfer problem in this section may be derived from
the theory of heat transfer from finned surfaces [240]. Choosing a differential volume
along the assembly of Figure 4.2 (b) and adopting a uniform insulation layer with effec-
tive thermal conductivity equal to insk , the following energy balance equations can be
written for the bottom section of the rod-mock assembly along the longitudinal axis (x-
axis) of the differential volume shown in Figure 4.4,
in cond out cond comb( ) ( ) ( ) ( ) ( )Q x Q x Q x Q x x Q x . (4.16)
In this equation, in
( )Q x is the rate of heat transfer into the differential volume from the
cross-sectional surface of the rod at distance x, and out
( )Q x is the compound rate of heat
transfer out of the differential volume in both longitudinal, cond
( )Q x x , and radial,
comb( )Q x , directions.
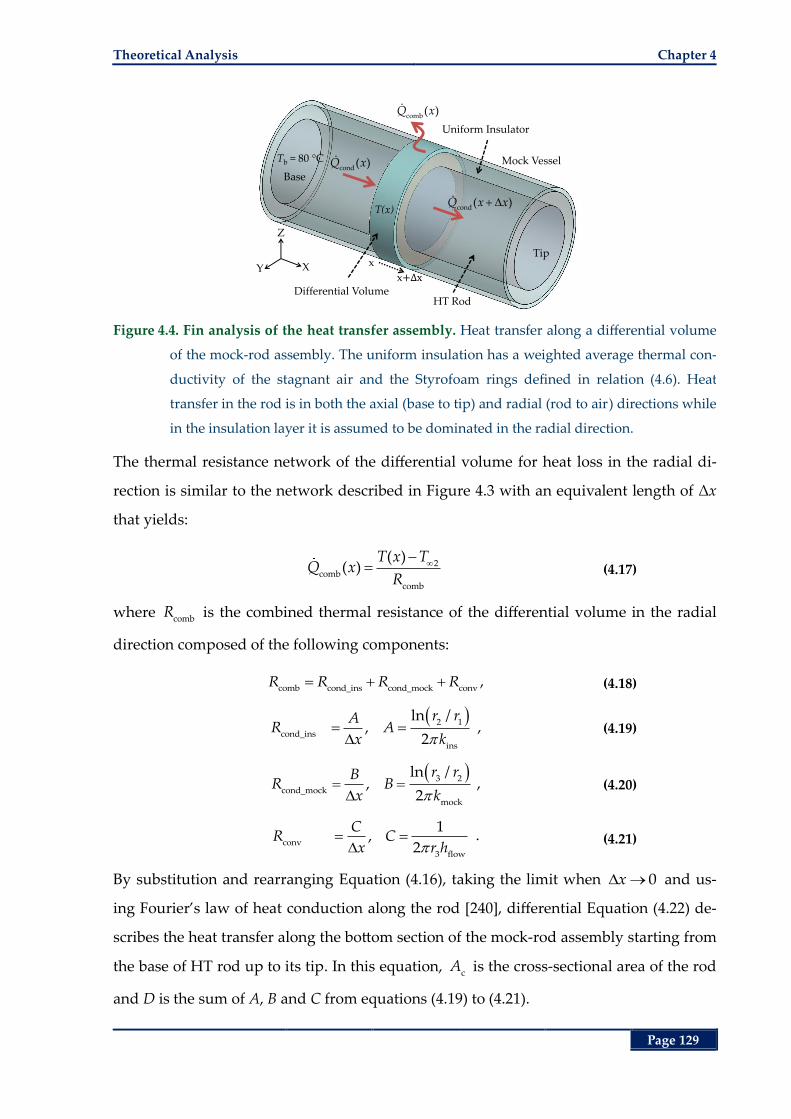
Theoretical Analysis Chapter 4
Page 129
Figure 4.4. Fin analysis of the heat transfer assembly. Heat transfer along a differential volume
of the mock-rod assembly. The uniform insulation has a weighted average thermal con-
ductivity of the stagnant air and the Styrofoam rings defined in relation (4.6). Heat
transfer in the rod is in both the axial (base to tip) and radial (rod to air) directions while
in the insulation layer it is assumed to be dominated in the radial direction.
The thermal resistance network of the differential volume for heat loss in the radial di-
rection is similar to the network described in Figure 4.3 with an equivalent length of Δx
that yields:
2comb
comb
( )( )
T x TQ x
R (4.17)
where comb
R is the combined thermal resistance of the differential volume in the radial
direction composed of the following components:
comb cond_ins cond_mock conv
R R R R , (4.18)
2 1
cond_ins
ins
ln /,
2
r rAR A
x k , (4.19)
3 2
cond_mock
mock
ln /,
2
r rBR B
x k , (4.20)
conv
3 flow
1,
2
CR C
x r h . (4.21)
By substitution and rearranging Equation (4.16), taking the limit when 0x and us-
ing Fourier’s law of heat conduction along the rod [240], differential Equation (4.22) de-
scribes the heat transfer along the bottom section of the mock-rod assembly starting from
the base of HT rod up to its tip. In this equation, cA is the cross-sectional area of the rod
and D is the sum of A, B and C from equations (4.19) to (4.21).
XY
Z
HT Rod
x
x
Uniform Insulator
Differential Volume
cond( )Q x
cond( )Q x x
comb( )Q x
Tb = 80 °C Mock Vessel
T(x)
Tip
Base
Chapter 4 Recoil Resilient Ring
Page 130
2
2rod c 2
( )( )0
T x Td T xk A
Ddx (4.22)
To account for the effect of heat loss from the top section of the assembly, extension from
the tip of the rod to the tip of the mock vessel, an appended length, added
L in
tion (4.23), can be added to the length of rod (rod
L ). This allows for the top of the assem-
bly to be considered as a perfectly insulated surface [240]. Therefore, the total length of
the assembly can be expressed by:
total rod added
L L L . (4.23)
The added length can be evaluated by equating the expected rate of heat transfer from
the tip of the rod to the rate of heat transfer through the added length of the assembly
and considering the tip of the resultant longer assembly as a perfectly insulated tip. This
can be expressed by:
total
rod
rod tip 2 rod 2out,tip added
total_tip
( ) ( )L
L
T x T T x TQ Q dx
R D (4.24)
where rod tip( )T x and
rod( )T x respectively refer to the temperature of the rod at the tip of
the rod and a coordinate between rod
L and total
.L An upper, yet close, approximation for
addedQ may be found by assuming a uniform temperature for the rod along the added
length, from rod
L to total
L , that is equal to rod tip( )T x . This results in:
rod tip 2 rod tip 2
out,tip added
total_tip added
( ) ( )
/
T x T T x TQ Q
R D L, (4.25)
added
total_tip
DL
R (4.26)
where total_tip
R is the effective thermal resistance of the assembly along the appended
length. Value of this resistance may be evaluated considering the following assumptions.
Due to the high thermal conductivity of the RRR and its small dimensions in comparison
with the rest of the assembly, its thermal resistance can be ignored for these evaluations.
From Figure 4.2 (b), it is apparent that the heat dissipation from the tip of the rod is
mainly by means of two general media one being the insulation layer above the rod that
is composed of the short column of stagnant air surrounding the RRR and the Styrofoam
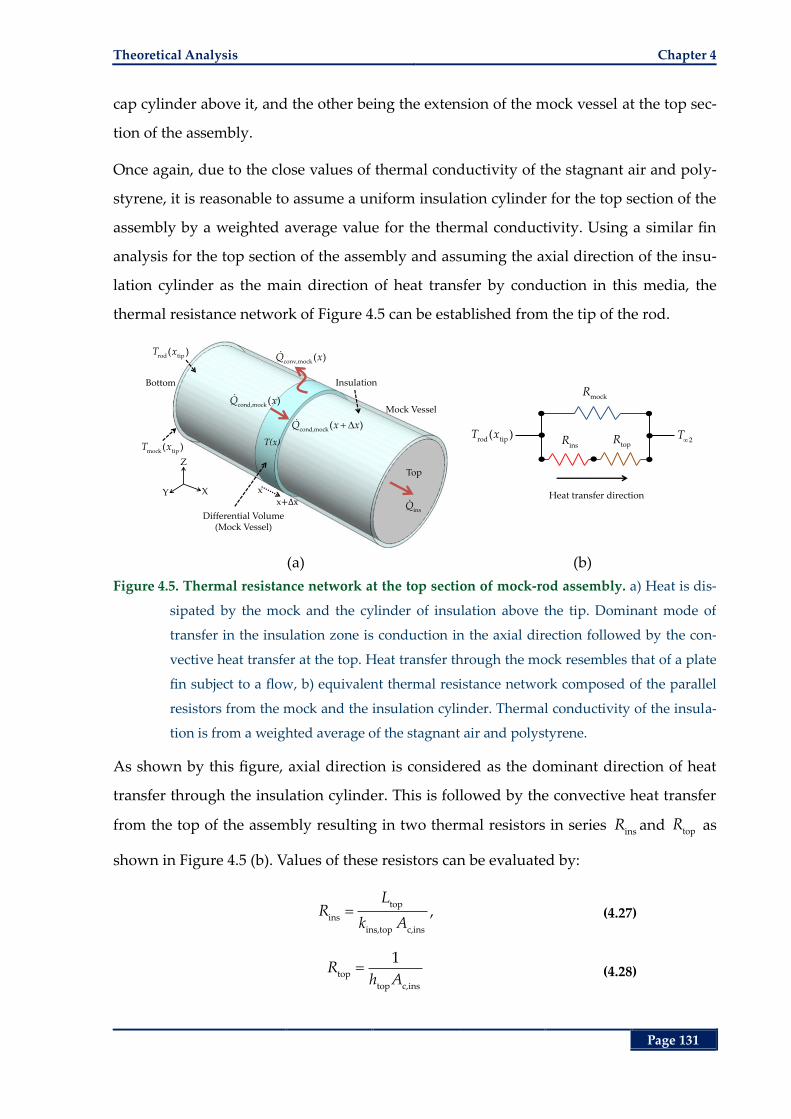
Theoretical Analysis Chapter 4
Page 131
cap cylinder above it, and the other being the extension of the mock vessel at the top sec-
tion of the assembly.
Once again, due to the close values of thermal conductivity of the stagnant air and poly-
styrene, it is reasonable to assume a uniform insulation cylinder for the top section of the
assembly by a weighted average value for the thermal conductivity. Using a similar fin
analysis for the top section of the assembly and assuming the axial direction of the insu-
lation cylinder as the main direction of heat transfer by conduction in this media, the
thermal resistance network of Figure 4.5 can be established from the tip of the rod.
(a) (b)
Figure 4.5. Thermal resistance network at the top section of mock-rod assembly. a) Heat is dis-
sipated by the mock and the cylinder of insulation above the tip. Dominant mode of
transfer in the insulation zone is conduction in the axial direction followed by the con-
vective heat transfer at the top. Heat transfer through the mock resembles that of a plate
fin subject to a flow, b) equivalent thermal resistance network composed of the parallel
resistors from the mock and the insulation cylinder. Thermal conductivity of the insula-
tion is from a weighted average of the stagnant air and polystyrene.
As shown by this figure, axial direction is considered as the dominant direction of heat
transfer through the insulation cylinder. This is followed by the convective heat transfer
from the top of the assembly resulting in two thermal resistors in series insR and top
R as
shown in Figure 4.5 (b). Values of these resistors can be evaluated by:
top
ins
ins,top c,ins
LR
k A, (4.27)
top
top c,ins
1R
h A (4.28)
XY
Z
x
x
Differential Volume (Mock Vessel)
cond,mock( )Q x
cond,mock( )Q x x
conv,mock( )Q x
Mock Vessel
T(x)
Top
insQ
Bottom
mock tip( )T x
rod tip( )T x
Insulation
Heat transfer direction
rod tip( )T x
2T
mockR
insR top
R
Chapter 4 Recoil Resilient Ring
Page 132
where topL = 10 mm refers to the length of the top section of the mock-rod assembly
in Figure 4.2 (b) and c,ins
A refers to the cross-sectional area of the insulation cylinder
shown in Figure 4.5 (a).
To find the convective heat transfer coefficient of air at the flat top of the assembly ( toph )
equations (4.9) and (4.10) can be used. In this case Nusselt number at the top of the as-
sembly, as the result of the laminar flow (Re < 5 × 10⁵) over the flat circular cap of the
Styrofoam cylinder in Figure 4.5 (a) can be expressed by:
0.5 1/3top top
top top air
air
Nu 0.664 Re Prh L
k, (4.29)
2flow
top
2Re
rV
(4.30)
where 2
/ 2r is the average characteristic length of the circular cap at the top of the as-
sembly that is subject to the forced convection of the fan.
To calculate the effective thermal resistance of the mock vessel (mock
R ) shown in Figure
4.5, the heat transfer analysis in fin structures defined by the differential equation of rela-
tion (4.22) can be utilized. In this case, as shown by the differential volume in Figure 4.5
(a), the heat flux that enters at axial distance x, cond,mock( )Q x , is equal to the sum of the flux
that exits through conduction, cond,mock
( )Q x x , and convection, conv,mock( )Q x . Solving for
the differential equation and assuming that the mock temperature at the very top reaches
the environment temperate (2
T ), rate of heat transfer through the mock vessel is ex-
pressed by:
1/2
mock flow mock mock c,mock mock tip 2( )Q h P k A T x T (4.31)
where mockP and
c,mockA refer to the periphery and the cross-sectional area of the mock
vessel respectively. Temperature difference between the bottom of the mock (at top sec-
tion of the mock-rod assembly, Figure 4.2, b) and the room temperature,
mock tip 2
( )T x T ,
can be expressed in terms of the temperature of the rod at this point and the thermal pa-
rameters A, B and C found using Equations (4.19) to (4.21) resulting in the equalities giv-
en in Equations (4.32) and (4.33).
Theoretical Analysis Chapter 4
Page 133
rod tip 2 mock tip 2
comb tip mock tip
( ) ( )( ) ( )
T x T T x Tp x p x
A B C B C (4.32)
mock xtip 2 rod tip 2( ) ( )
B CT x T T x T
A B C (4.33)
In Equations (4.32) the newly defined parameter p is the rate of heat transfer along a
medium per unit length of the medium in the axial direction. Substituting into rela-
tion (4.31), the effective thermal resistance of the mock (mock
R ) is:
1/2
mock
flow mock mock c,mock
1A B CR
B C h P k A. (4.34)
Given thermal resistance network of the tip shown in Figure 4.5 (b), total effective ther-
mal resistance from the tip is then expressed by:
mock air top
total_tip
mock air top
( )R R RR
R R R. (4.35)
By substitution into the relations given so far and solving for T(x) and applying the ini-
tial conditions the temperature at position x from the base of the rod at the rod surface
can be expressed by:
total
2 2
total
cosh ( )( ) ( )
cosh( )b
L xT x T T T
L (4.36)
where b
T is the temperature of the rod at the base of the mock-rod assembly as shown
in Figure 4.4 and α is expressed by:
1/2
rod c
1
k A D. (4.37)
In order to find the temperature at different axial distances from the base of the mock-
rod assembly along the radial direction, such as the internal surface of the mock vessel,
using relation (4.17), the rate of heat transfer per unit axial length of the assembly in the
radial direction can be defined by:
2comb
( )( )
T x Tp x
D (4.38)
where ( )T x is temperature of the surface of the rod at axial distance x from the base of
the mock-rod assembly as shown in Figure 4.4. Given the steady rate of heat transfer
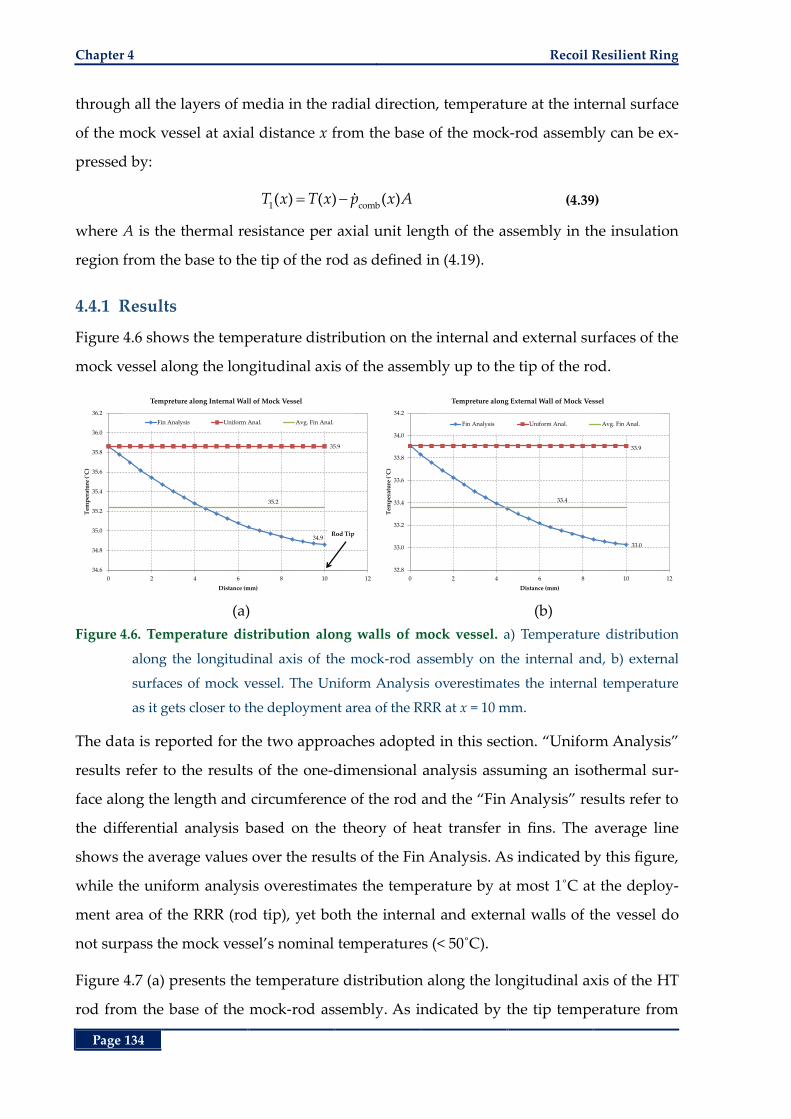
Chapter 4 Recoil Resilient Ring
Page 134
through all the layers of media in the radial direction, temperature at the internal surface
of the mock vessel at axial distance x from the base of the mock-rod assembly can be ex-
pressed by:
1 comb( ) ( ) ( )T x T x p x A (4.39)
where A is the thermal resistance per axial unit length of the assembly in the insulation
region from the base to the tip of the rod as defined in (4.19).
4.4.1 Results
Figure 4.6 shows the temperature distribution on the internal and external surfaces of the
mock vessel along the longitudinal axis of the assembly up to the tip of the rod.
(a) (b)
Figure 4.6. Temperature distribution along walls of mock vessel. a) Temperature distribution
along the longitudinal axis of the mock-rod assembly on the internal and, b) external
surfaces of mock vessel. The Uniform Analysis overestimates the internal temperature
as it gets closer to the deployment area of the RRR at x = 10 mm.
The data is reported for the two approaches adopted in this section. “Uniform Analysis”
results refer to the results of the one-dimensional analysis assuming an isothermal sur-
face along the length and circumference of the rod and the “Fin Analysis” results refer to
the differential analysis based on the theory of heat transfer in fins. The average line
shows the average values over the results of the Fin Analysis. As indicated by this figure,
while the uniform analysis overestimates the temperature by at most 1˚C at the deploy-
ment area of the RRR (rod tip), yet both the internal and external walls of the vessel do
not surpass the mock vessel’s nominal temperatures (< 50˚C).
Figure 4.7 (a) presents the temperature distribution along the longitudinal axis of the HT
rod from the base of the mock-rod assembly. As indicated by the tip temperature from
34.9
35.9
35.2
34.6
34.8
35.0
35.2
35.4
35.6
35.8
36.0
36.2
0 2 4 6 8 10 12
Tem
per
atu
re (
˚C)
Distance (mm)
Tempreture along Internal Wall of Mock Vessel
Fin Analysis Uniform Anal. Avg. Fin Anal.
Rod Tip
33.0
33.9
33.4
32.8
33.0
33.2
33.4
33.6
33.8
34.0
34.2
0 2 4 6 8 10 12
Tem
per
atu
re (
˚C)
Distance (mm)
Tempreture along External Wall of Mock Vessel
Fin Analysis Uniform Anal. Avg. Fin Anal.
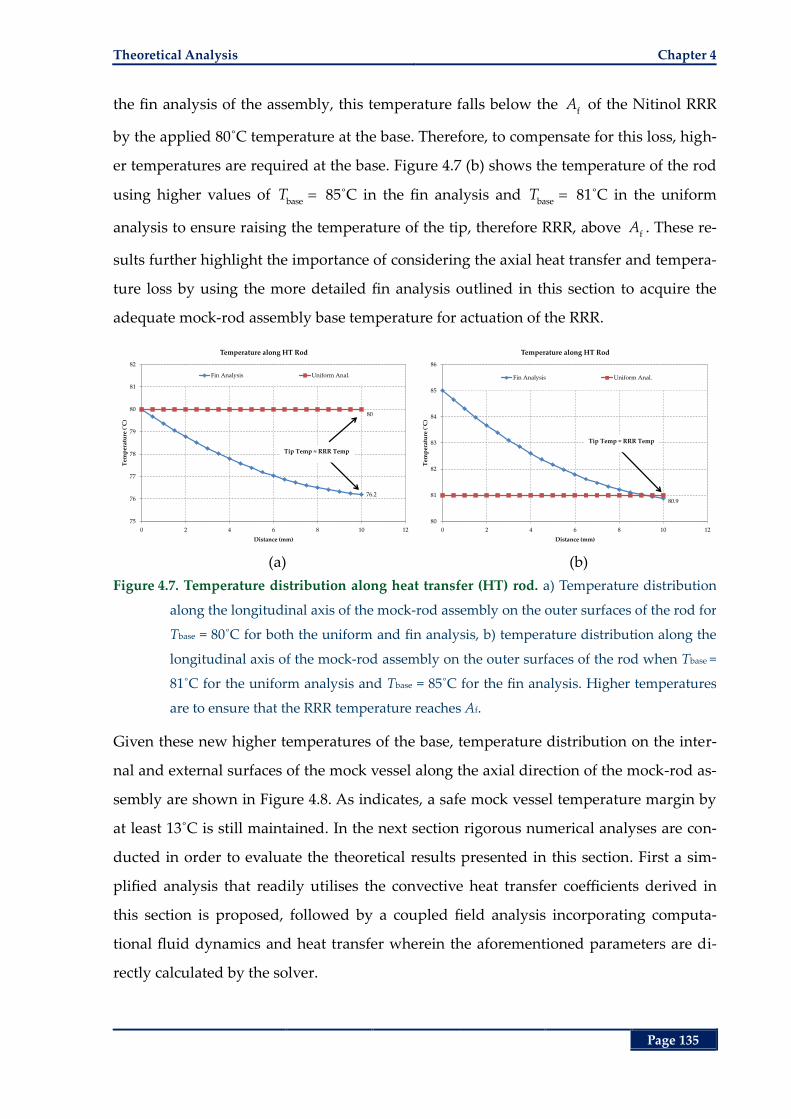
Theoretical Analysis Chapter 4
Page 135
the fin analysis of the assembly, this temperature falls below the f
A of the Nitinol RRR
by the applied 80˚C temperature at the base. Therefore, to compensate for this loss, high-
er temperatures are required at the base. Figure 4.7 (b) shows the temperature of the rod
using higher values of base
T 85˚C in the fin analysis and base
T 81˚C in the uniform
analysis to ensure raising the temperature of the tip, therefore RRR, above f
A . These re-
sults further highlight the importance of considering the axial heat transfer and tempera-
ture loss by using the more detailed fin analysis outlined in this section to acquire the
adequate mock-rod assembly base temperature for actuation of the RRR.
(a) (b)
Figure 4.7. Temperature distribution along heat transfer (HT) rod. a) Temperature distribution
along the longitudinal axis of the mock-rod assembly on the outer surfaces of the rod for
Tbase = 80˚C for both the uniform and fin analysis, b) temperature distribution along the
longitudinal axis of the mock-rod assembly on the outer surfaces of the rod when Tbase =
81˚C for the uniform analysis and Tbase = 85˚C for the fin analysis. Higher temperatures
are to ensure that the RRR temperature reaches Af.
Given these new higher temperatures of the base, temperature distribution on the inter-
nal and external surfaces of the mock vessel along the axial direction of the mock-rod as-
sembly are shown in Figure 4.8. As indicates, a safe mock vessel temperature margin by
at least 13˚C is still maintained. In the next section rigorous numerical analyses are con-
ducted in order to evaluate the theoretical results presented in this section. First a sim-
plified analysis that readily utilises the convective heat transfer coefficients derived in
this section is proposed, followed by a coupled field analysis incorporating computa-
tional fluid dynamics and heat transfer wherein the aforementioned parameters are di-
rectly calculated by the solver.
76.2
80
75
76
77
78
79
80
81
82
0 2 4 6 8 10 12
Tem
per
atu
re (
˚C)
Distance (mm)
Temperature along HT Rod
Fin Analysis Uniform Anal.
Tip Temp ≈ RRR Temp
80.9
80
81
82
83
84
85
86
0 2 4 6 8 10 12
Tem
per
atu
re (
˚C)
Distance (mm)
Temperature along HT Rod
Fin Analysis Uniform Anal.
Tip Temp ≈ RRR Temp
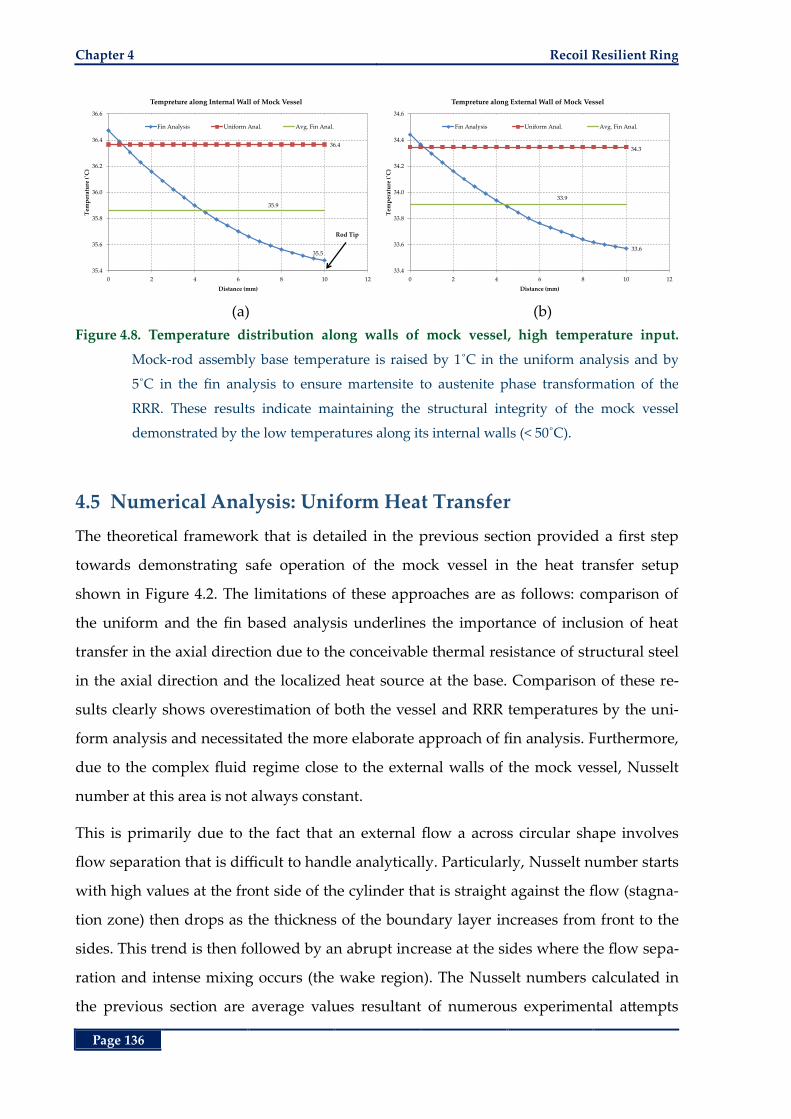
Chapter 4 Recoil Resilient Ring
Page 136
(a) (b)
Figure 4.8. Temperature distribution along walls of mock vessel, high temperature input.
Mock-rod assembly base temperature is raised by 1˚C in the uniform analysis and by
5˚C in the fin analysis to ensure martensite to austenite phase transformation of the
RRR. These results indicate maintaining the structural integrity of the mock vessel
demonstrated by the low temperatures along its internal walls (< 50˚C).
4.5 Numerical Analysis: Uniform Heat Transfer
The theoretical framework that is detailed in the previous section provided a first step
towards demonstrating safe operation of the mock vessel in the heat transfer setup
shown in Figure 4.2. The limitations of these approaches are as follows: comparison of
the uniform and the fin based analysis underlines the importance of inclusion of heat
transfer in the axial direction due to the conceivable thermal resistance of structural steel
in the axial direction and the localized heat source at the base. Comparison of these re-
sults clearly shows overestimation of both the vessel and RRR temperatures by the uni-
form analysis and necessitated the more elaborate approach of fin analysis. Furthermore,
due to the complex fluid regime close to the external walls of the mock vessel, Nusselt
number at this area is not always constant.
This is primarily due to the fact that an external flow a across circular shape involves
flow separation that is difficult to handle analytically. Particularly, Nusselt number starts
with high values at the front side of the cylinder that is straight against the flow (stagna-
tion zone) then drops as the thickness of the boundary layer increases from front to the
sides. This trend is then followed by an abrupt increase at the sides where the flow sepa-
ration and intense mixing occurs (the wake region). The Nusselt numbers calculated in
the previous section are average values resultant of numerous experimental attempts
35.5
36.4
35.9
35.4
35.6
35.8
36.0
36.2
36.4
36.6
0 2 4 6 8 10 12
Tem
per
atu
re (
˚C)
Distance (mm)
Tempreture along Internal Wall of Mock Vessel
Fin Analysis Uniform Anal. Avg. Fin Anal.
Rod Tip
33.6
34.3
33.9
33.4
33.6
33.8
34.0
34.2
34.4
34.6
0 2 4 6 8 10 12
Tem
per
atu
re (
˚C)
Distance (mm)
Tempreture along External Wall of Mock Vessel
Fin Analysis Uniform Anal. Avg. Fin Anal.
Numerical Analysis: Uniform Heat Transfer Chapter 4
Page 137
[240]. Moreover, in order to reduce the complexity of the differential equations in the fin
analysis a uniform insulation layer was assumed whose thermal conductivity was calcu-
lated from the weighted average values of the stagnant air and the Styrofoam rings. Due
to the lower thermal conductivity of the stagnant air compared with the polystyrene, it is
expected that the temperature of the mock vessel around the Styrofoam rings increases
slightly that calls for further analysis. Consequently, in order to account for these details
and their effect on the distribution of temperature on both the RRR and the walls of the
mock vessel further numerical studies are required.
In this section, a 3D steady-state heat transfer analysis is conducted by means of finite
element analysis (FEA). In these studies the energy balance equations of the constant
heat transfer are solved by the commercial FEA package ANSYS heat transfer (ANSYS
Inc., Canonsburg, PA, USA). For a steady-state thermal analysis in ANSYS, the degrees of
freedom are limited to temperatures T that are solved for by the matrix equation:
[ ( )]{ } { ( )}K T T Q T (4.40)
where the [ ]K refers to the matrix of the thermal conductance of materials (reciprocals of
thermal resistance). Fixed temperatures applied to a model represent the constraints and
boundary conditions on the system [241]. In this case, the general modes of heat transfer
are solved for by giving the corresponding parameters such as the convective heat trans-
fer coefficient and thermal conductivity as inputs of the problem. Therefore, the empha-
sis is more given on the distribution of temperatures and heat flux through different
layers of the media in the mock-rod assembly. Due to adoption of a uniform average
convective heat transfer coefficient, the study proposed in this section is referred to as the
“Uniform Analysis”. A more rigorous approach incorporating the computational fluid
dynamics (CFD) of the cross flow is presented in the next section referred to as the “Con-
jugate Analysis”.
4.5.1 Materials and Methods
The rod, stagnant air, Styrofoam rings and the mock vessel are modelled as concentric
cylinders with the dimensional parameters given in Table 4.1. Extension of the rod from
the base of the mock-rod assembly to the base of the heat transfer setup is discarded to
simplify the model. Figure 4.9 shows the components of the 3D model for this analysis
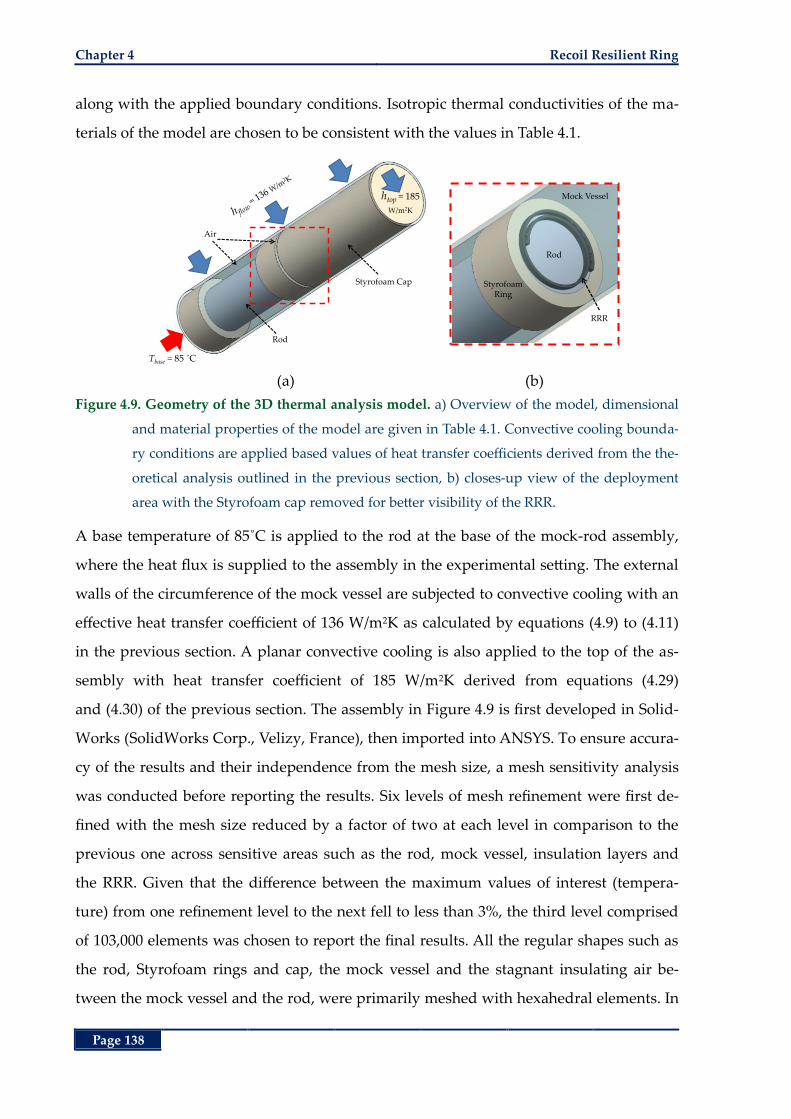
Chapter 4 Recoil Resilient Ring
Page 138
along with the applied boundary conditions. Isotropic thermal conductivities of the ma-
terials of the model are chosen to be consistent with the values in Table 4.1.
(a) (b)
Figure 4.9. Geometry of the 3D thermal analysis model. a) Overview of the model, dimensional
and material properties of the model are given in Table 4.1. Convective cooling bounda-
ry conditions are applied based values of heat transfer coefficients derived from the the-
oretical analysis outlined in the previous section, b) closes-up view of the deployment
area with the Styrofoam cap removed for better visibility of the RRR.
A base temperature of 85˚C is applied to the rod at the base of the mock-rod assembly,
where the heat flux is supplied to the assembly in the experimental setting. The external
walls of the circumference of the mock vessel are subjected to convective cooling with an
effective heat transfer coefficient of 136 W/m2K as calculated by equations (4.9) to (4.11)
in the previous section. A planar convective cooling is also applied to the top of the as-
sembly with heat transfer coefficient of 185 W/m2K derived from equations (4.29)
and (4.30) of the previous section. The assembly in Figure 4.9 is first developed in Solid-
Works (SolidWorks Corp., Velizy, France), then imported into ANSYS. To ensure accura-
cy of the results and their independence from the mesh size, a mesh sensitivity analysis
was conducted before reporting the results. Six levels of mesh refinement were first de-
fined with the mesh size reduced by a factor of two at each level in comparison to the
previous one across sensitive areas such as the rod, mock vessel, insulation layers and
the RRR. Given that the difference between the maximum values of interest (tempera-
ture) from one refinement level to the next fell to less than 3%, the third level comprised
of 103,000 elements was chosen to report the final results. All the regular shapes such as
the rod, Styrofoam rings and cap, the mock vessel and the stagnant insulating air be-
tween the mock vessel and the rod, were primarily meshed with hexahedral elements. In
Rod
Styrofoam Cap
Tbase = 85 ˚C
htop = 185
W/m2K
Air
RRR
Mock Vessel
Styrofoam Ring
Rod
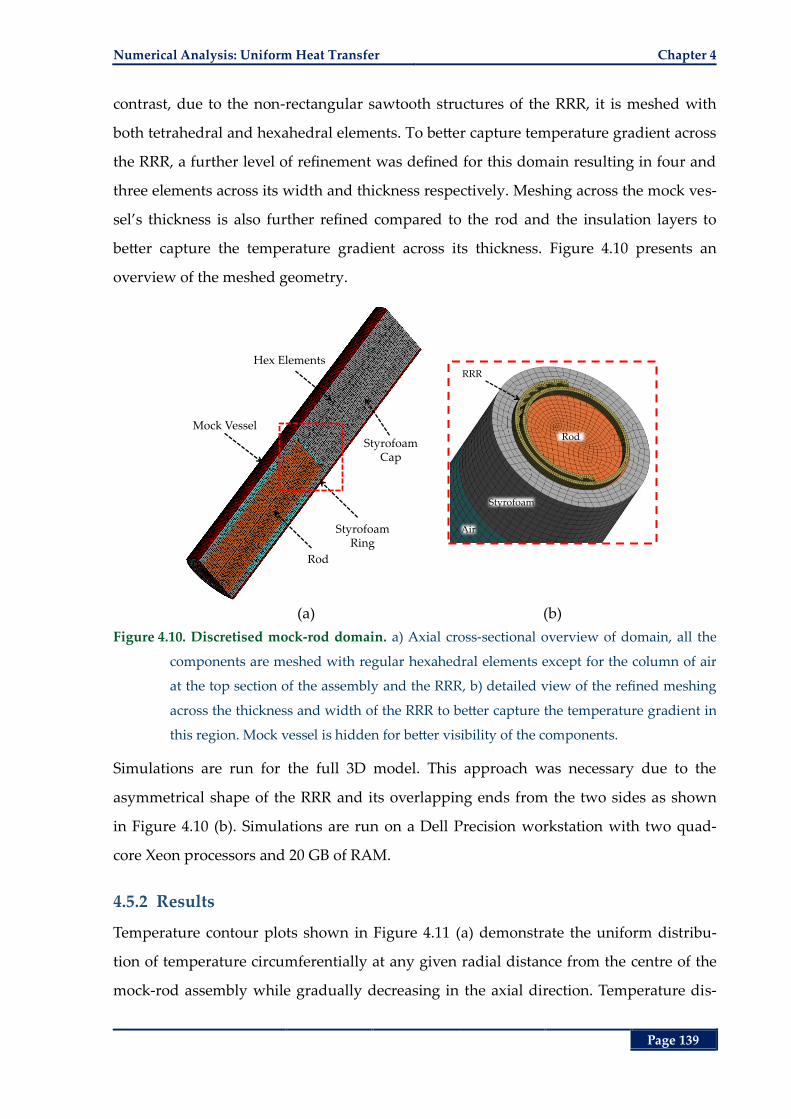
Numerical Analysis: Uniform Heat Transfer Chapter 4
Page 139
contrast, due to the non-rectangular sawtooth structures of the RRR, it is meshed with
both tetrahedral and hexahedral elements. To better capture temperature gradient across
the RRR, a further level of refinement was defined for this domain resulting in four and
three elements across its width and thickness respectively. Meshing across the mock ves-
sel’s thickness is also further refined compared to the rod and the insulation layers to
better capture the temperature gradient across its thickness. Figure 4.10 presents an
overview of the meshed geometry.
(a) (b)
Figure 4.10. Discretised mock-rod domain. a) Axial cross-sectional overview of domain, all the
components are meshed with regular hexahedral elements except for the column of air
at the top section of the assembly and the RRR, b) detailed view of the refined meshing
across the thickness and width of the RRR to better capture the temperature gradient in
this region. Mock vessel is hidden for better visibility of the components.
Simulations are run for the full 3D model. This approach was necessary due to the
asymmetrical shape of the RRR and its overlapping ends from the two sides as shown
in Figure 4.10 (b). Simulations are run on a Dell Precision workstation with two quad-
core Xeon processors and 20 GB of RAM.
4.5.2 Results
Temperature contour plots shown in Figure 4.11 (a) demonstrate the uniform distribu-
tion of temperature circumferentially at any given radial distance from the centre of the
mock-rod assembly while gradually decreasing in the axial direction. Temperature dis-
Styrofoam Ring
Rod
Hex Elements
Mock Vessel
Styrofoam Cap
Rod
Styrofoam
Air
RRR
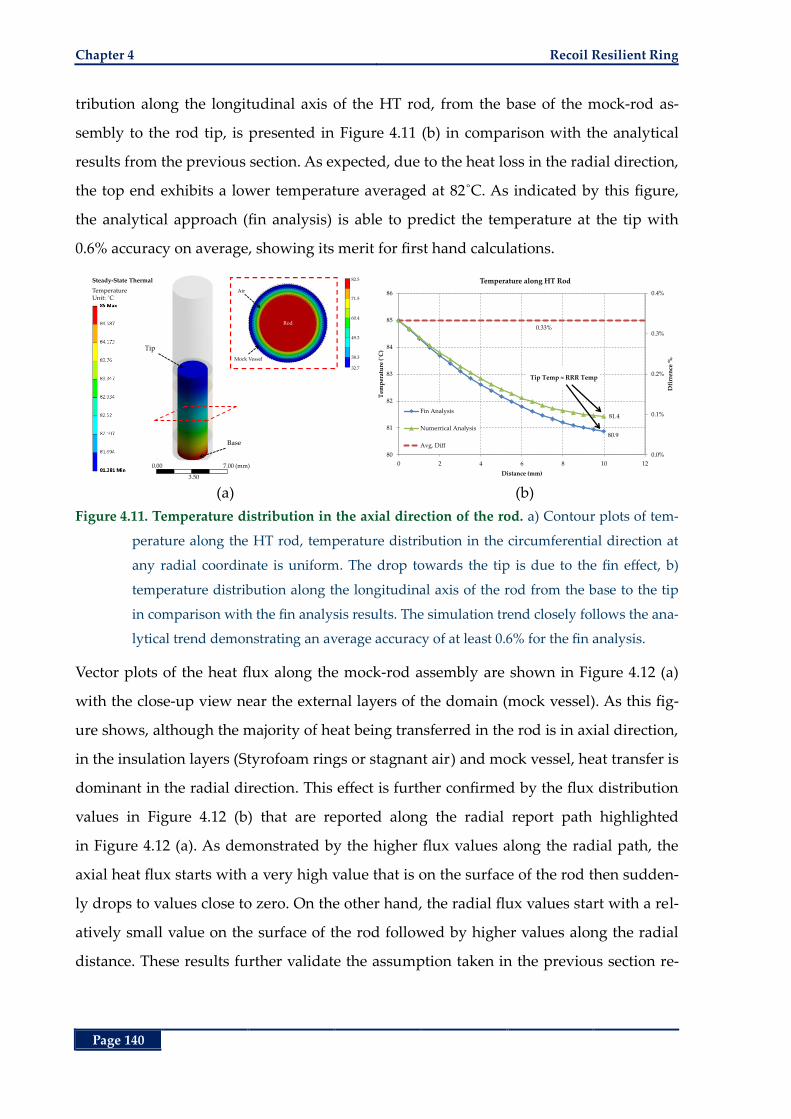
Chapter 4 Recoil Resilient Ring
Page 140
tribution along the longitudinal axis of the HT rod, from the base of the mock-rod as-
sembly to the rod tip, is presented in Figure 4.11 (b) in comparison with the analytical
results from the previous section. As expected, due to the heat loss in the radial direction,
the top end exhibits a lower temperature averaged at 82˚C. As indicated by this figure,
the analytical approach (fin analysis) is able to predict the temperature at the tip with
0.6% accuracy on average, showing its merit for first hand calculations.
(a) (b)
Figure 4.11. Temperature distribution in the axial direction of the rod. a) Contour plots of tem-
perature along the HT rod, temperature distribution in the circumferential direction at
any radial coordinate is uniform. The drop towards the tip is due to the fin effect, b)
temperature distribution along the longitudinal axis of the rod from the base to the tip
in comparison with the fin analysis results. The simulation trend closely follows the ana-
lytical trend demonstrating an average accuracy of at least 0.6% for the fin analysis.
Vector plots of the heat flux along the mock-rod assembly are shown in Figure 4.12 (a)
with the close-up view near the external layers of the domain (mock vessel). As this fig-
ure shows, although the majority of heat being transferred in the rod is in axial direction,
in the insulation layers (Styrofoam rings or stagnant air) and mock vessel, heat transfer is
dominant in the radial direction. This effect is further confirmed by the flux distribution
values in Figure 4.12 (b) that are reported along the radial report path highlighted
in Figure 4.12 (a). As demonstrated by the higher flux values along the radial path, the
axial heat flux starts with a very high value that is on the surface of the rod then sudden-
ly drops to values close to zero. On the other hand, the radial flux values start with a rel-
atively small value on the surface of the rod followed by higher values along the radial
distance. These results further validate the assumption taken in the previous section re-
Tip
Base
Steady-State Thermal
TemperatureUnit: ˚C
82.5
71.5
60.4
49.3
38.3
32.7
Rod
Air
Mock Vessel
0.00
3.50
7.00 (mm)
80.9
81.4
0.33%
0.0%
0.1%
0.2%
0.3%
0.4%
80
81
82
83
84
85
86
0 2 4 6 8 10 12
Dfi
rren
ce %
Tem
per
atu
re (
˚C)
Distance (mm)
Temperature along HT Rod
Fin Analysis
Numerrical Analysis
Avg. Diff
Tip Temp ≈ RRR Temp
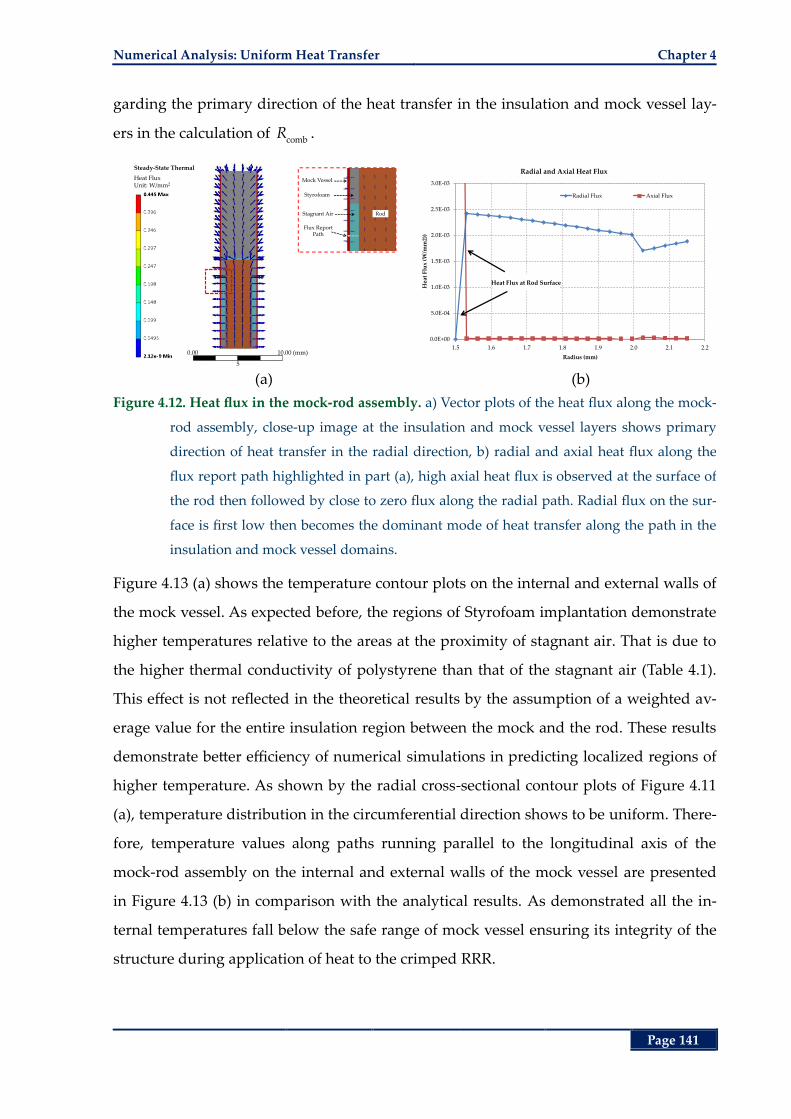
Numerical Analysis: Uniform Heat Transfer Chapter 4
Page 141
garding the primary direction of the heat transfer in the insulation and mock vessel lay-
ers in the calculation of comb
R .
(a) (b)
Figure 4.12. Heat flux in the mock-rod assembly. a) Vector plots of the heat flux along the mock-
rod assembly, close-up image at the insulation and mock vessel layers shows primary
direction of heat transfer in the radial direction, b) radial and axial heat flux along the
flux report path highlighted in part (a), high axial heat flux is observed at the surface of
the rod then followed by close to zero flux along the radial path. Radial flux on the sur-
face is first low then becomes the dominant mode of heat transfer along the path in the
insulation and mock vessel domains.
Figure 4.13 (a) shows the temperature contour plots on the internal and external walls of
the mock vessel. As expected before, the regions of Styrofoam implantation demonstrate
higher temperatures relative to the areas at the proximity of stagnant air. That is due to
the higher thermal conductivity of polystyrene than that of the stagnant air (Table 4.1).
This effect is not reflected in the theoretical results by the assumption of a weighted av-
erage value for the entire insulation region between the mock and the rod. These results
demonstrate better efficiency of numerical simulations in predicting localized regions of
higher temperature. As shown by the radial cross-sectional contour plots of Figure 4.11
(a), temperature distribution in the circumferential direction shows to be uniform. There-
fore, temperature values along paths running parallel to the longitudinal axis of the
mock-rod assembly on the internal and external walls of the mock vessel are presented
in Figure 4.13 (b) in comparison with the analytical results. As demonstrated all the in-
ternal temperatures fall below the safe range of mock vessel ensuring its integrity of the
structure during application of heat to the crimped RRR.
Steady-State Thermal
Heat FluxUnit: W/mm2
Mock Vessel
Styrofoam
Stagnant Air Rod
Flux ReportPath
0.00
5
10.00 (mm)
0.0E+00
5.0E-04
1.0E-03
1.5E-03
2.0E-03
2.5E-03
3.0E-03
1.5 1.6 1.7 1.8 1.9 2.0 2.1 2.2
Hea
t F
lux
(W/m
m2)
)
Radius (mm)
Radial and Axial Heat Flux
Radial Flux Axial Flux
Heat Flux at Rod Surface
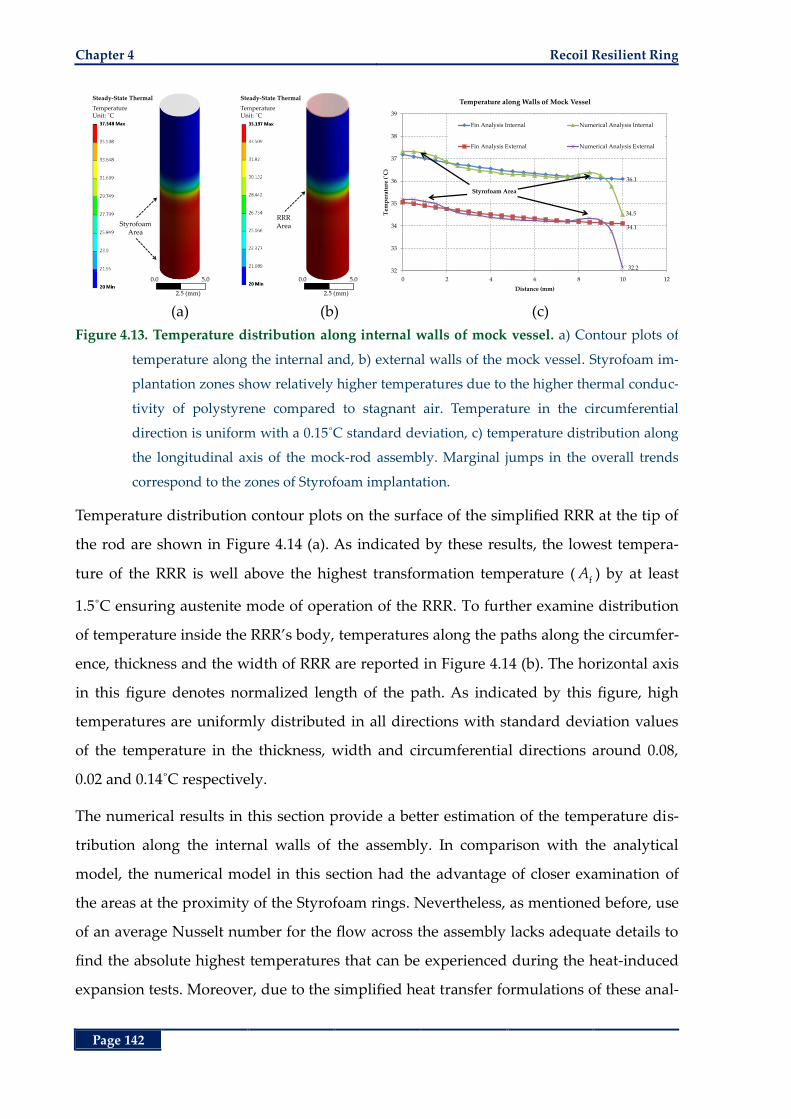
Chapter 4 Recoil Resilient Ring
Page 142
(a) (b) (c)
Figure 4.13. Temperature distribution along internal walls of mock vessel. a) Contour plots of
temperature along the internal and, b) external walls of the mock vessel. Styrofoam im-
plantation zones show relatively higher temperatures due to the higher thermal conduc-
tivity of polystyrene compared to stagnant air. Temperature in the circumferential
direction is uniform with a 0.15˚C standard deviation, c) temperature distribution along
the longitudinal axis of the mock-rod assembly. Marginal jumps in the overall trends
correspond to the zones of Styrofoam implantation.
Temperature distribution contour plots on the surface of the simplified RRR at the tip of
the rod are shown in Figure 4.14 (a). As indicated by these results, the lowest tempera-
ture of the RRR is well above the highest transformation temperature ( fA ) by at least
1.5˚C ensuring austenite mode of operation of the RRR. To further examine distribution
of temperature inside the RRR’s body, temperatures along the paths along the circumfer-
ence, thickness and the width of RRR are reported in Figure 4.14 (b). The horizontal axis
in this figure denotes normalized length of the path. As indicated by this figure, high
temperatures are uniformly distributed in all directions with standard deviation values
of the temperature in the thickness, width and circumferential directions around 0.08,
0.02 and 0.14˚C respectively.
The numerical results in this section provide a better estimation of the temperature dis-
tribution along the internal walls of the assembly. In comparison with the analytical
model, the numerical model in this section had the advantage of closer examination of
the areas at the proximity of the Styrofoam rings. Nevertheless, as mentioned before, use
of an average Nusselt number for the flow across the assembly lacks adequate details to
find the absolute highest temperatures that can be experienced during the heat-induced
expansion tests. Moreover, due to the simplified heat transfer formulations of these anal-
Steady-State Thermal
TemperatureUnit: ˚C
StyrofoamArea
0.0 5.0
2.5 (mm)
Steady-State Thermal
TemperatureUnit: ˚C
RRRArea
0.0 5.0
2.5 (mm)
36.1
34.5
34.1
32.232
33
34
35
36
37
38
39
0 2 4 6 8 10 12
Tem
per
atu
re (
˚C)
Distance (mm)
Temperature along Walls of Mock Vessel
Fin Analysis Internal Numerical Analysis Internal
Fin Analysis External Numerical Analysis External
Styrofoam Area
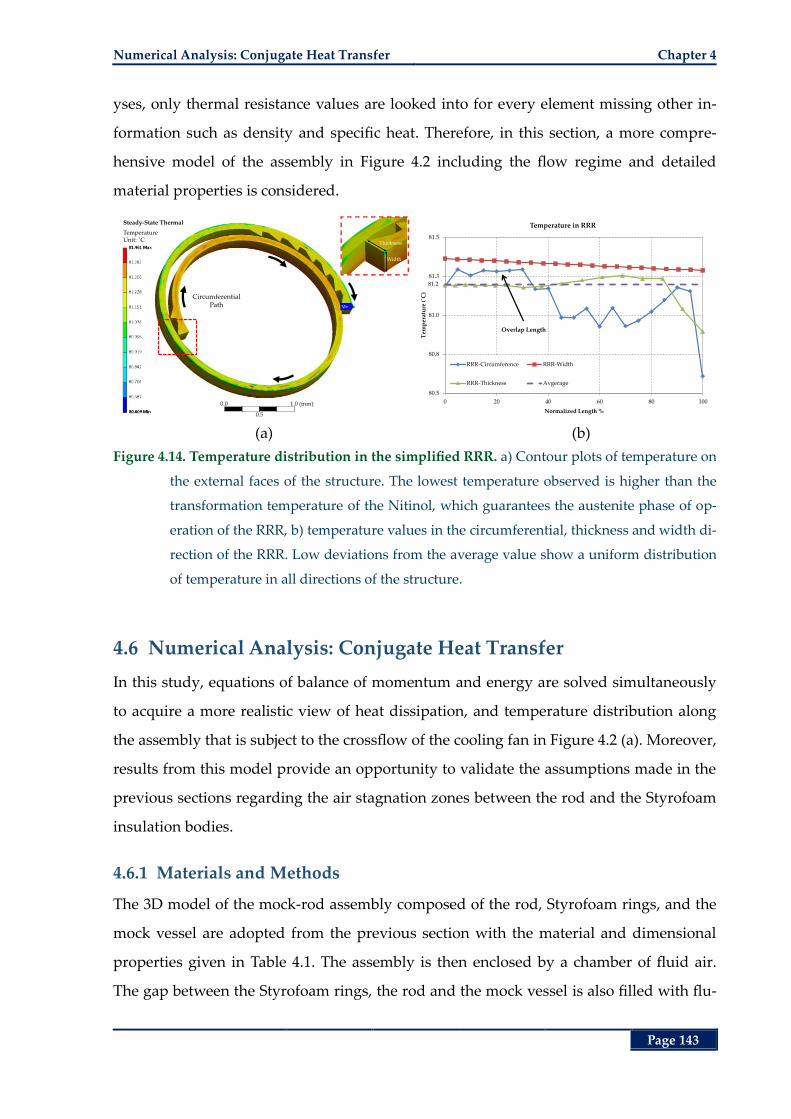
Numerical Analysis: Conjugate Heat Transfer Chapter 4
Page 143
yses, only thermal resistance values are looked into for every element missing other in-
formation such as density and specific heat. Therefore, in this section, a more compre-
hensive model of the assembly in Figure 4.2 including the flow regime and detailed
material properties is considered.
(a) (b)
Figure 4.14. Temperature distribution in the simplified RRR. a) Contour plots of temperature on
the external faces of the structure. The lowest temperature observed is higher than the
transformation temperature of the Nitinol, which guarantees the austenite phase of op-
eration of the RRR, b) temperature values in the circumferential, thickness and width di-
rection of the RRR. Low deviations from the average value show a uniform distribution
of temperature in all directions of the structure.
4.6 Numerical Analysis: Conjugate Heat Transfer
In this study, equations of balance of momentum and energy are solved simultaneously
to acquire a more realistic view of heat dissipation, and temperature distribution along
the assembly that is subject to the crossflow of the cooling fan in Figure 4.2 (a). Moreover,
results from this model provide an opportunity to validate the assumptions made in the
previous sections regarding the air stagnation zones between the rod and the Styrofoam
insulation bodies.
4.6.1 Materials and Methods
The 3D model of the mock-rod assembly composed of the rod, Styrofoam rings, and the
mock vessel are adopted from the previous section with the material and dimensional
properties given in Table 4.1. The assembly is then enclosed by a chamber of fluid air.
The gap between the Styrofoam rings, the rod and the mock vessel is also filled with flu-
Steady-State Thermal
TemperatureUnit: ˚C
Thickness
Width
Circumferential Path
0.0
0.5
1.0 (mm)
81.2
80.5
80.8
81.0
81.3
81.5
0 20 40 60 80 100
Tem
per
atu
re (
˚C)
Normalized Length %
Temperature in RRR
RRR-Circumference RRR-Width
RRR-Thickness Avgerage
Overlap Length
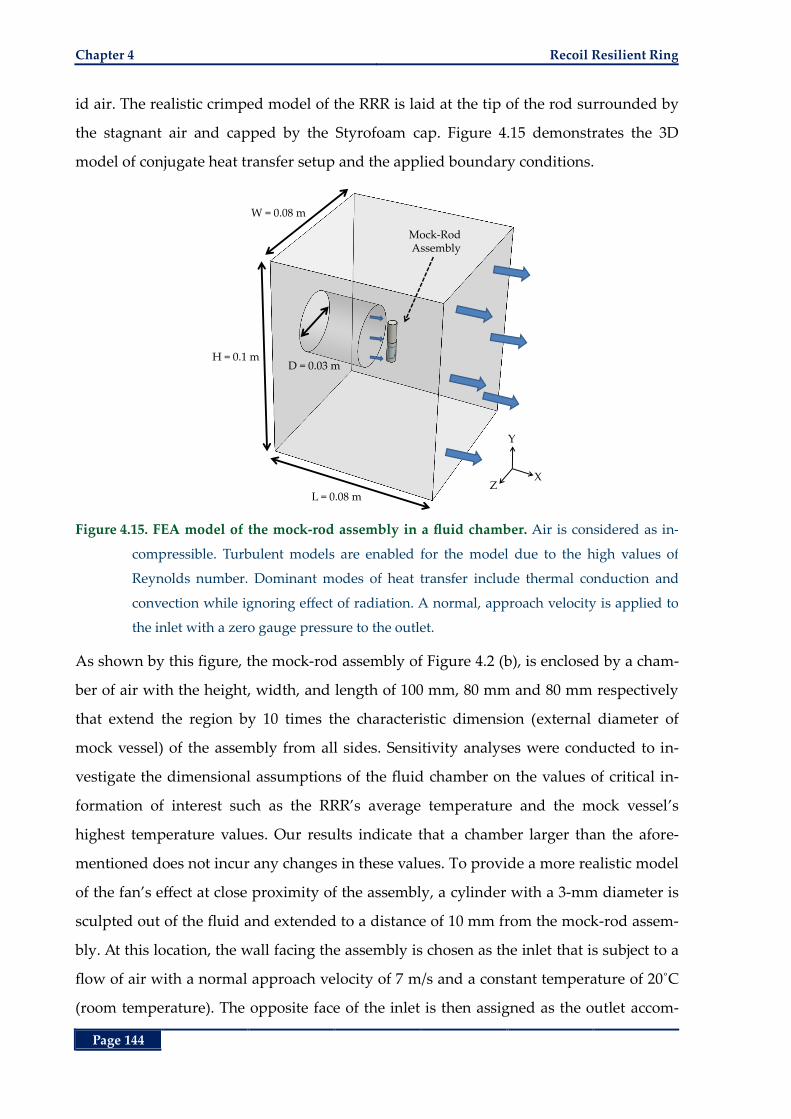
Chapter 4 Recoil Resilient Ring
Page 144
id air. The realistic crimped model of the RRR is laid at the tip of the rod surrounded by
the stagnant air and capped by the Styrofoam cap. Figure 4.15 demonstrates the 3D
model of conjugate heat transfer setup and the applied boundary conditions.
Figure 4.15. FEA model of the mock-rod assembly in a fluid chamber. Air is considered as in-
compressible. Turbulent models are enabled for the model due to the high values of
Reynolds number. Dominant modes of heat transfer include thermal conduction and
convection while ignoring effect of radiation. A normal, approach velocity is applied to
the inlet with a zero gauge pressure to the outlet.
As shown by this figure, the mock-rod assembly of Figure 4.2 (b), is enclosed by a cham-
ber of air with the height, width, and length of 100 mm, 80 mm and 80 mm respectively
that extend the region by 10 times the characteristic dimension (external diameter of
mock vessel) of the assembly from all sides. Sensitivity analyses were conducted to in-
vestigate the dimensional assumptions of the fluid chamber on the values of critical in-
formation of interest such as the RRR’s average temperature and the mock vessel’s
highest temperature values. Our results indicate that a chamber larger than the afore-
mentioned does not incur any changes in these values. To provide a more realistic model
of the fan’s effect at close proximity of the assembly, a cylinder with a 3-mm diameter is
sculpted out of the fluid and extended to a distance of 10 mm from the mock-rod assem-
bly. At this location, the wall facing the assembly is chosen as the inlet that is subject to a
flow of air with a normal approach velocity of 7 m/s and a constant temperature of 20˚C
(room temperature). The opposite face of the inlet is then assigned as the outlet accom-
Y
XZ
L = 0.08 m
H = 0.1 m
W = 0.08 m
Mock-Rod Assembly
D = 0.03 m
Numerical Analysis: Conjugate Heat Transfer Chapter 4
Page 145
modating outflow of temperature through convection while all the other surfaces are as-
signed as fluid walls. All the cavities between the solid bodies of mock vessel, rod,
Styrofoam rings, and the RRR are filled with fluid air considering their velocity and tem-
perature as degrees of freedom in calculations. At the contact surfaces (intersection re-
gions) of solid bodies to other solid bodies or fluid domains, interfaces are introduced to
account for the wall effect as well as heat transfer through them.
The isotropic material models of Table 4.1 are adopted for the solid materials that are
considered as rigid bodies. Rigid body assumption is considered reasonable for this
model due to the fact that no solid body deflections or movements were observed during
the experimental results.
The flow field is generated by solving for the equations of conservation of mass and
momentum in the x, y and z directions expressed by:
. 0V , (4.41)
2
air. p
t
VV V V f (4.42)
where the vector quantity V is the velocity of the fluid, is density, p is pressure, f rep-
resents body forces acting on the fluid, and air stands for the dynamic viscosity of air.
Simultaneously, the model solves for the thermal balance of the mock-rod assembly and
the air flowing in the chamber. Dominant modes of heat transfer are conduction (in the
assembly) and convection in the cooling air (via the external walls of the assembly) while
ignoring the effect of heat radiation. The temperature field across all the contact surfaces
is assumed to be continuous disregarding contact resistance. These equations are solved
using stabilized finite volume formulations for fluid flow by the commercial CFD pack-
age ANSYS CFX (ANSYS Inc., Canonsburg PA, USA) in a steady-state analysis. Physical
properties of air such as thermal conductivity, heat capacity and density are defined by
the uniform properties given in Table 4.1. Due to the subsonic velocities, air is modelled
as an incompressible fluid, yet because of the high Reynolds numbers (Re ≈ 2000) Shear
Stress Transport (SST) turbulence model is enabled for the fluid domain.
At the outlet a zero gauge pressure is applied while a no slip condition is introduced at
all solid surfaces (zero velocity at walls). Data of interest in this analysis is the tempera-
ture distribution across different parts of the assembly, more specifically on the internal
Chapter 4 Recoil Resilient Ring
Page 146
walls of the mock vessel and surface temperate of the RRR. Independence of the fluid
regime from the fluid chamber dimensions is later demonstrated in this section by the
low velocity gradients close to the walls of the chamber.
To ensure accuracy of the results, a mesh sensitivity analysis is conducted prior to the
final reports. In this study successive mesh refinement levels are defined, each reducing
the size of the fluid and solid elements by 50%, thereby increasing the number of ele-
ments by a factor of 2. Critical information such as highest temperature of the mock ves-
sel, lowest temperature of the ring, average distribution of temperature along the axial
direction of the rod and velocity profile around the circumference of the assembly, more
particularly appearance of the flow wake region, were compared from one level to the
other. As soon as the highest difference between these values fell below 3%, the corre-
sponding refinement level was chosen for reporting the results. The geometry is meshed
with both tetrahedral and hexahedral elements, shown in Figure 4.16, majority of which
belong to the former due to different part sizes and irregular shapes around the RRR
sawtooth structures. Mesh size was chosen to be smaller in and around the assembly in
the fluid region, shown in Figure 4.16 (b), with a slow inflation rate throughout the fluid
domain to accommodate smoother convergence of the results and better capture of the
fluid flow close to this region. Following this objective, close to the walls of the mock
vessel assembly a hexahedral boundary mesh with multiple layers is generated. The final
mesh consisting of around 2,000,000 elements is shown in Figure 4.16 with close-up view
near the assembly in parts (b) and (c).
Convergence criterion for the residuals of heat, mass, momentum and turbulence are all
set to 10-5 that is one order of magnitude lower than the solver’s default. The total num-
ber of iterations for completion is set to 800 and the solver is due to iterate to the last one
even if it reaches the target residual accuracy. This is to ensure stability of results over a
number of iterations. Models are simulated on a Dell Precision workstation with two
quad-core Xeon processors clocked at 2.6 GHz and 20 GB of RAM. Runtime for the final
model is about 16 hours to finish.
Numerical Analysis: Conjugate Heat Transfer Chapter 4
Page 147
(a) (b) (c)
Figure 4.16. Discretization of the fluid solid domain for conjugate heat transfer. a) Overview of
the model consisting of 2,000,000 elements, b) close-up of the mock-rod assembly with
refined fluid mesh close to the assembly and the refined mesh of the solids, c) close-up
of the assembly around the deployment area with the refined boundary mesh close to
the mock vessel walls. The mesh in the RRR domain is further refined to capture tem-
perature gradient across thickness.
4.6.2 Results
Convergence of the residuals of heat, mass, momentum and turbulence to the predeter-
mined target values over computational iterations is demonstrated in Figure 4.17 (a–c).
As indicated by these figures, all the residuals fall below the objective error (10-5) after
600 iterations, before completion of the last iteration, and continue to decrease over time.
Stability of the final results is further confirmed by the graph of the maximum tempera-
ture of the mock vessel presented in Figure 4.17 (d). As indicated by this trend, the mock
vessel’s highest body temperature levels out after the 300th iteration at 46.4˚C with mini-
mal fluctuations till completion of the last iteration. Due to the difference in the values of
the local Nusselt number and the resultant non-uniform distribution of temperature at
the circumferential direction of any of the radial cross-sections of the mock-rod assem-
bly, four different paths are chosen to report temperature results in the axial direction.
These paths that divide the circumference of the assembly into four quadrants include,
one facing the inlet (front path), one facing the outlet (rear path), one at 90˚ angle from
Y
XZ
0.0
20.0
40.0 (mm)
Styrofoam
Rod
Base
Air
Styrofoam
0.0
Boundary Mesh
RRR
Rod
Mock Vessel
Sty
rofo
am R
ing
Air
Styrofoam
Chapter 4 Recoil Resilient Ring
Page 148
the front path at the right side of the assembly (right path), and one at -90˚ angle from
the front path at the left side of the assembly (left path).
(a) (b)
(c) (d)
Figure 4.17. Convergence plots of the conjugate heat transfer analysis. a) Mass and momentum
convergence plots for the fluid chamber, b) heat transfer residuals for all domains, c)
shear stress transport (SST) turbulence residuals for the fluid chamber. All the residuals
fall below the objective error (10-5) after iteration 600, d) maximum temperature of the
mock over the course of solution converges to a steady value at 46.4˚C after the 300th it-
eration.
Temperature contour plots on the external walls of the HT rod are shown in Figure 4.18
(a) with the values of temperature along the four longitudinal paths presented in Figure
4.18 (b). As indicated by these trends and the radial cross-sectional contour plots at the
longitudinal distance of 5 mm from the base, the temperature distribution along the rod,
maintains a uniform circumferential distribution highlighted by Figure 4.18 (a). Moreo-
ver, compared with the results obtained from the previous sections, particularly Figure
4.11 (b), it is apparent that the analytical and the uniform numerical analysis results both
underestimate the tip temperature by at most 1˚C while all methods show temperatures
1.E-06
1.E-05
1.E-04
1.E-03
0 200 400 600 800
Res
idu
al
Iteration
Momentum and Mass Convergence
RMS P-Mass RMS U-Mom
RMS V-Mom RMS W-Mom
1.E-06
1.E-05
1.E-04
1.E-03
0 200 400 600 800
Res
idu
al
Iteration
Heat Transfer Convergence
RMS H-Energy (air1) RMS H-Energy (air2)
RMS H-Energy (fluid) RMS T-Energy
1.E-06
1.E-05
1.E-04
1.E-03
0 200 400 600 800
Res
idu
al
Iteration
Turbulence Convergence
RMS K-TurbKE (fluid)
RMS O-TurbFreq (fluid)
46.4
30
35
40
45
50
0 200 400 600 800
Tem
per
atu
re (
˚C)
Iteration
Temperature along Rod
Max Temp
Numerical Analysis: Conjugate Heat Transfer Chapter 4
Page 149
of the tip higher than the final transformation temperature of the RRR ensuring its trans-
formation into the austenite phase in an experimental setup.
(a) (b)
Figure 4.18. Temperature distribution along the rod, conjugate heat transfer. a) Contour plots of
temperature along the HT rod, temperature distribution in the circumferential and radi-
al direction of the rod is uniform, b) temperature values along the four axial paths of
front, rear, left and right. Lowest temperature at the tip stands higher than the RRR’s fi-
nal transformation temperature (Af).
In order to demonstrate the efficacy of the assumed dimensions for the fluid chamber as
well as the stagnation of air at the region enclosed between the HT rod, mock vessel and
Styrofoam rings and at the region between the HT rod’s tip, mock vessel and the
Styrofoam cap, velocity contour plots at selected horizontal and vertical cross-sectional
planes are presented in the following. Contour plots of the flow velocity in a horizontal
plane of the fluid chamber of Figure 4.15 at height Y = 10.1 mm from the base of the as-
sembly is shown in Figure 4.19. At this height, the cross-sectional plane passes through
the RRR’s deployment site providing insight into the fluid regime of the entrapped air
around the RRR. As demonstrated by this figure and confirmed by the velocity values
along path 1 in the graph of part (b), the fluid at the RRR deployment region is in com-
plete stagnation and conduction is the dominant mode of heat transfer through this me-
dium. This figure also clearly shows the advent of wake region at the rear end of the
assembly after the flow separation region at the sides. More details may be observed
from the magnitudes of velocity along the report paths of part (a) vs. the z coordinate as
demonstrated in Figure 4.19 (b) from the origin of the coordinate system that is assumed
at the centre of the base of the mock-rod assembly.
Conjugate Thermal
TemperatureUnit: ˚C Tip
0.0
0.3
6.0 (mm)
81.9
81.0
82.0
83.0
84.0
85.0
86.0
0 2 4 6 8 10 12
Tem
per
atu
re (
˚C)
Distance (mm)
Temperature along Rod
Front Path Rear Path Left Path Right Path
Adjacent to RRR
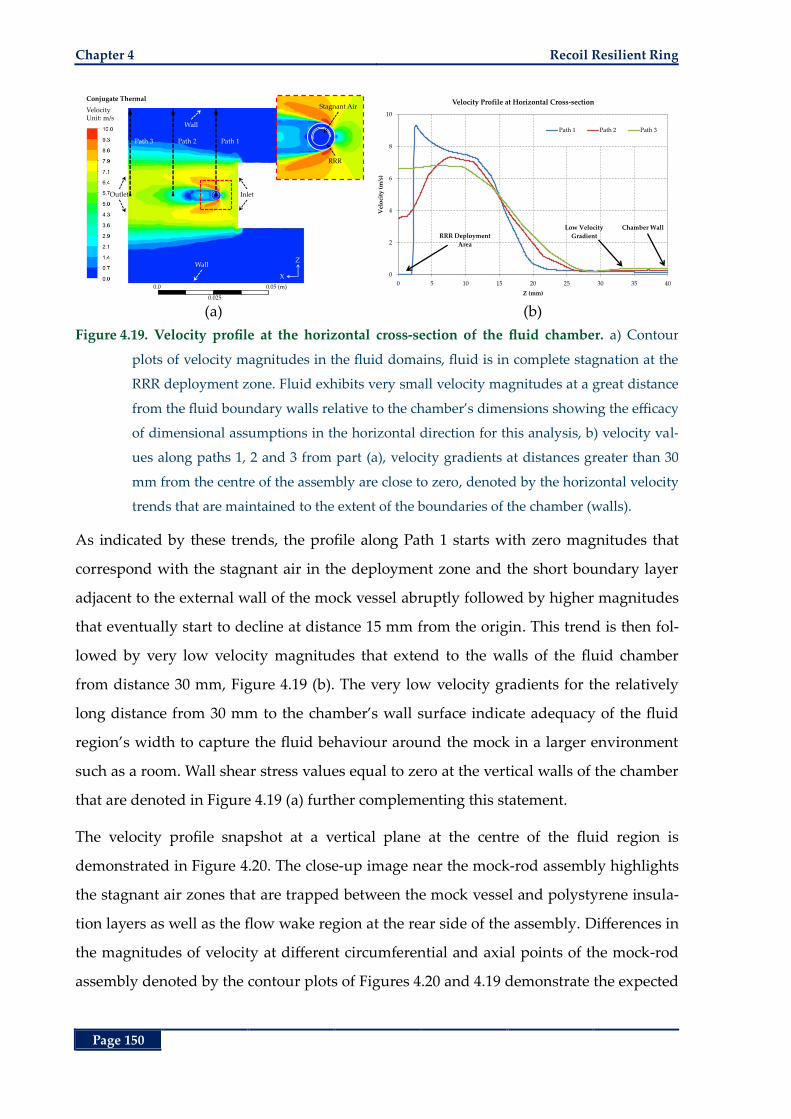
Chapter 4 Recoil Resilient Ring
Page 150
(a) (b)
Figure 4.19. Velocity profile at the horizontal cross-section of the fluid chamber. a) Contour
plots of velocity magnitudes in the fluid domains, fluid is in complete stagnation at the
RRR deployment zone. Fluid exhibits very small velocity magnitudes at a great distance
from the fluid boundary walls relative to the chamber’s dimensions showing the efficacy
of dimensional assumptions in the horizontal direction for this analysis, b) velocity val-
ues along paths 1, 2 and 3 from part (a), velocity gradients at distances greater than 30
mm from the centre of the assembly are close to zero, denoted by the horizontal velocity
trends that are maintained to the extent of the boundaries of the chamber (walls).
As indicated by these trends, the profile along Path 1 starts with zero magnitudes that
correspond with the stagnant air in the deployment zone and the short boundary layer
adjacent to the external wall of the mock vessel abruptly followed by higher magnitudes
that eventually start to decline at distance 15 mm from the origin. This trend is then fol-
lowed by very low velocity magnitudes that extend to the walls of the fluid chamber
from distance 30 mm, Figure 4.19 (b). The very low velocity gradients for the relatively
long distance from 30 mm to the chamber’s wall surface indicate adequacy of the fluid
region’s width to capture the fluid behaviour around the mock in a larger environment
such as a room. Wall shear stress values equal to zero at the vertical walls of the chamber
that are denoted in Figure 4.19 (a) further complementing this statement.
The velocity profile snapshot at a vertical plane at the centre of the fluid region is
demonstrated in Figure 4.20. The close-up image near the mock-rod assembly highlights
the stagnant air zones that are trapped between the mock vessel and polystyrene insula-
tion layers as well as the flow wake region at the rear side of the assembly. Differences in
the magnitudes of velocity at different circumferential and axial points of the mock-rod
assembly denoted by the contour plots of Figures 4.20 and 4.19 demonstrate the expected
Conjugate Thermal
VelocityUnit: m/s
InletOutlet
Path 1
X
Z
RRR
Stagnant Air
Wall
Wall
Path 2Path 3
0.0
0.025
0.05 (m)
0
2
4
6
8
10
0 5 10 15 20 25 30 35 40
Vel
oci
ty (
m/s
)
Z (mm)
Velocity Profile at Horizontal Cross-section
Path 1 Path 2 Path 3
RRR Deployment
Area
Chamber WallLow Velocity
Gradient
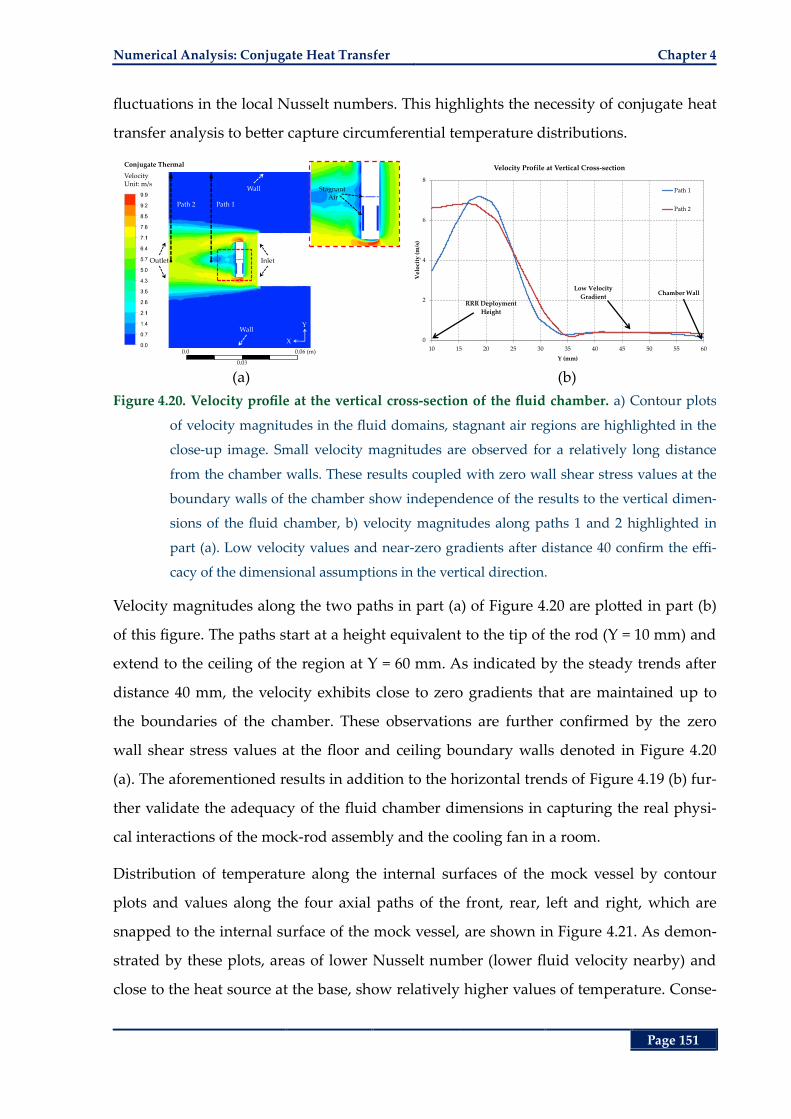
Numerical Analysis: Conjugate Heat Transfer Chapter 4
Page 151
fluctuations in the local Nusselt numbers. This highlights the necessity of conjugate heat
transfer analysis to better capture circumferential temperature distributions.
(a) (b)
Figure 4.20. Velocity profile at the vertical cross-section of the fluid chamber. a) Contour plots
of velocity magnitudes in the fluid domains, stagnant air regions are highlighted in the
close-up image. Small velocity magnitudes are observed for a relatively long distance
from the chamber walls. These results coupled with zero wall shear stress values at the
boundary walls of the chamber show independence of the results to the vertical dimen-
sions of the fluid chamber, b) velocity magnitudes along paths 1 and 2 highlighted in
part (a). Low velocity values and near-zero gradients after distance 40 confirm the effi-
cacy of the dimensional assumptions in the vertical direction.
Velocity magnitudes along the two paths in part (a) of Figure 4.20 are plotted in part (b)
of this figure. The paths start at a height equivalent to the tip of the rod (Y = 10 mm) and
extend to the ceiling of the region at Y = 60 mm. As indicated by the steady trends after
distance 40 mm, the velocity exhibits close to zero gradients that are maintained up to
the boundaries of the chamber. These observations are further confirmed by the zero
wall shear stress values at the floor and ceiling boundary walls denoted in Figure 4.20
(a). The aforementioned results in addition to the horizontal trends of Figure 4.19 (b) fur-
ther validate the adequacy of the fluid chamber dimensions in capturing the real physi-
cal interactions of the mock-rod assembly and the cooling fan in a room.
Distribution of temperature along the internal surfaces of the mock vessel by contour
plots and values along the four axial paths of the front, rear, left and right, which are
snapped to the internal surface of the mock vessel, are shown in Figure 4.21. As demon-
strated by these plots, areas of lower Nusselt number (lower fluid velocity nearby) and
close to the heat source at the base, show relatively higher values of temperature. Conse-
Conjugate Thermal
VelocityUnit: m/s
Inlet
Path 1
X
Y
Stagnant Air
Outlet
Wall
Wall
Path 2
0.0
0.0
0.0 (m)
0
2
4
6
8
10 15 20 25 30 35 40 45 50 55 60
Vel
oci
ty (
m/s
)
Y (mm)
Velocity Profile at Vertical Cross-section
Path 1
Path 2
RRR Deployment
Height
Chamber WallLow Velocity
Gradient
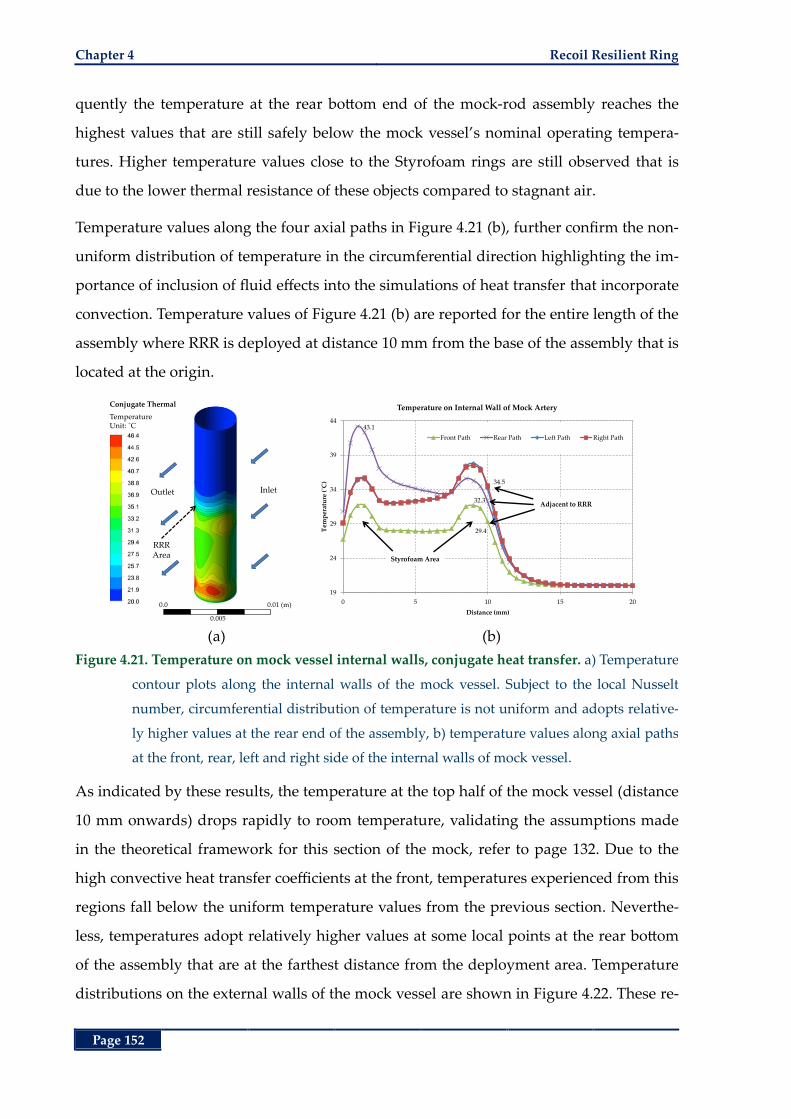
Chapter 4 Recoil Resilient Ring
Page 152
quently the temperature at the rear bottom end of the mock-rod assembly reaches the
highest values that are still safely below the mock vessel’s nominal operating tempera-
tures. Higher temperature values close to the Styrofoam rings are still observed that is
due to the lower thermal resistance of these objects compared to stagnant air.
Temperature values along the four axial paths in Figure 4.21 (b), further confirm the non-
uniform distribution of temperature in the circumferential direction highlighting the im-
portance of inclusion of fluid effects into the simulations of heat transfer that incorporate
convection. Temperature values of Figure 4.21 (b) are reported for the entire length of the
assembly where RRR is deployed at distance 10 mm from the base of the assembly that is
located at the origin.
(a) (b)
Figure 4.21. Temperature on mock vessel internal walls, conjugate heat transfer. a) Temperature
contour plots along the internal walls of the mock vessel. Subject to the local Nusselt
number, circumferential distribution of temperature is not uniform and adopts relative-
ly higher values at the rear end of the assembly, b) temperature values along axial paths
at the front, rear, left and right side of the internal walls of mock vessel.
As indicated by these results, the temperature at the top half of the mock vessel (distance
10 mm onwards) drops rapidly to room temperature, validating the assumptions made
in the theoretical framework for this section of the mock, refer to page 132. Due to the
high convective heat transfer coefficients at the front, temperatures experienced from this
regions fall below the uniform temperature values from the previous section. Neverthe-
less, temperatures adopt relatively higher values at some local points at the rear bottom
of the assembly that are at the farthest distance from the deployment area. Temperature
distributions on the external walls of the mock vessel are shown in Figure 4.22. These re-
Conjugate Thermal
TemperatureUnit: ˚C
InletOutlet
RRR Area
0.0
0.0 5
0.01 (m)
29.4
43.1
32.3
34.5
19
24
29
34
39
44
0 5 10 15 20
Tem
per
atu
re (
˚C)
Distance (mm)
Temperature on Internal Wall of Mock Artery
Front Path Rear Path Left Path Right Path
Adjacent to RRR
Styrofoam Area
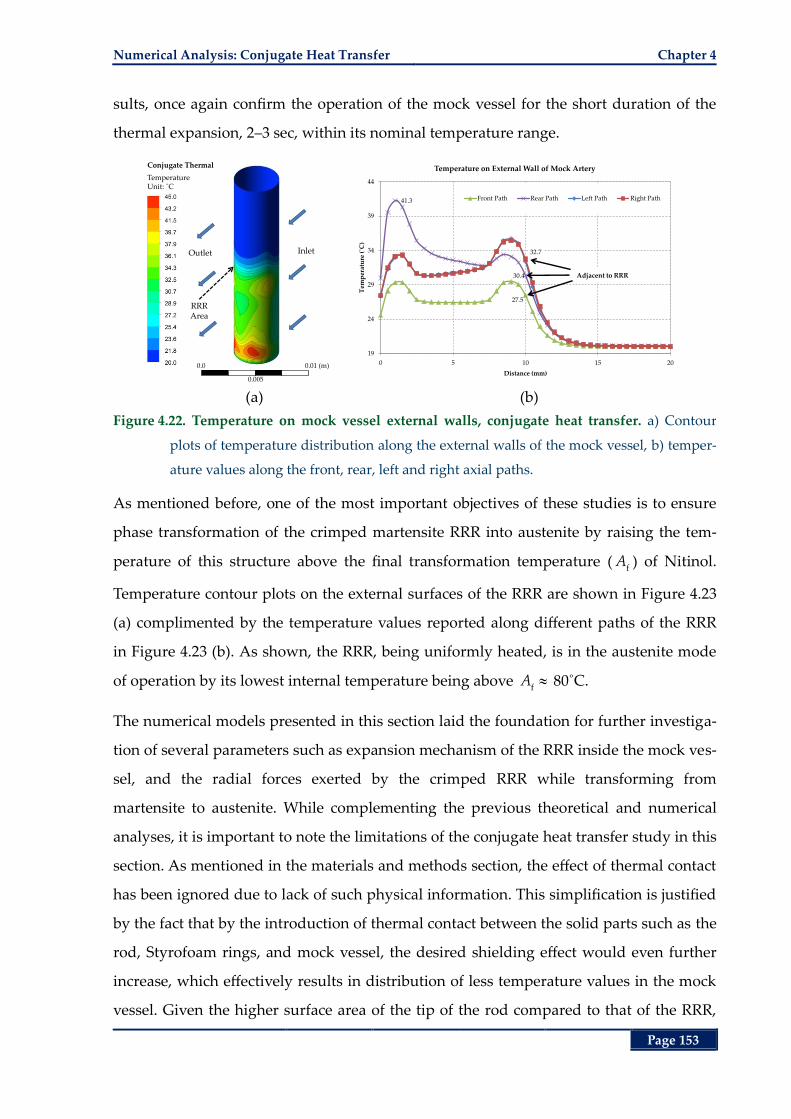
Numerical Analysis: Conjugate Heat Transfer Chapter 4
Page 153
sults, once again confirm the operation of the mock vessel for the short duration of the
thermal expansion, 2‒3 sec, within its nominal temperature range.
(a) (b)
Figure 4.22. Temperature on mock vessel external walls, conjugate heat transfer. a) Contour
plots of temperature distribution along the external walls of the mock vessel, b) temper-
ature values along the front, rear, left and right axial paths.
As mentioned before, one of the most important objectives of these studies is to ensure
phase transformation of the crimped martensite RRR into austenite by raising the tem-
perature of this structure above the final transformation temperature ( fA ) of Nitinol.
Temperature contour plots on the external surfaces of the RRR are shown in Figure 4.23
(a) complimented by the temperature values reported along different paths of the RRR
in Figure 4.23 (b). As shown, the RRR, being uniformly heated, is in the austenite mode
of operation by its lowest internal temperature being above f
A 80˚C.
The numerical models presented in this section laid the foundation for further investiga-
tion of several parameters such as expansion mechanism of the RRR inside the mock ves-
sel, and the radial forces exerted by the crimped RRR while transforming from
martensite to austenite. While complementing the previous theoretical and numerical
analyses, it is important to note the limitations of the conjugate heat transfer study in this
section. As mentioned in the materials and methods section, the effect of thermal contact
has been ignored due to lack of such physical information. This simplification is justified
by the fact that by the introduction of thermal contact between the solid parts such as the
rod, Styrofoam rings, and mock vessel, the desired shielding effect would even further
increase, which effectively results in distribution of less temperature values in the mock
vessel. Given the higher surface area of the tip of the rod compared to that of the RRR,
Conjugate Thermal
TemperatureUnit: ˚C
InletOutlet
RRR Area
0.0
0.0 5
0.01 (m)
27.5
41.3
30.4
32.7
19
24
29
34
39
44
0 5 10 15 20T
emp
erat
ure
(˚C
)
Distance (mm)
Temperature on External Wall of Mock Artery
Front Path Rear Path Left Path Right Path
Adjacent to RRR
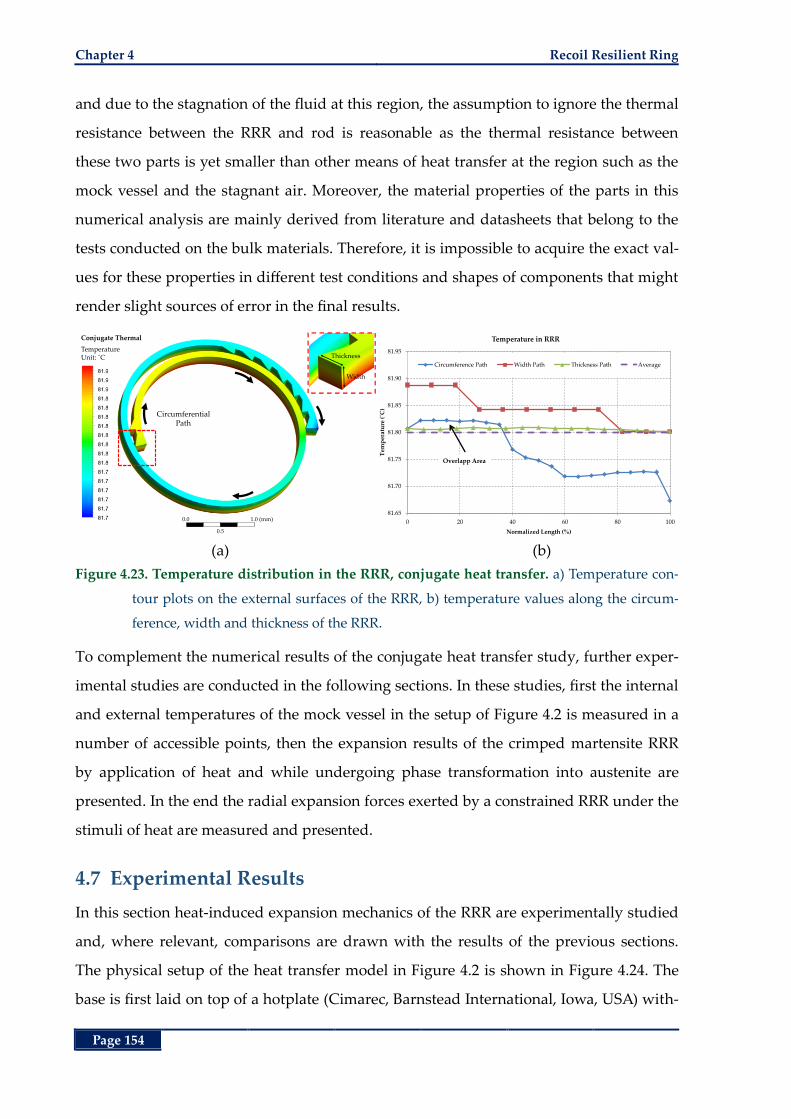
Chapter 4 Recoil Resilient Ring
Page 154
and due to the stagnation of the fluid at this region, the assumption to ignore the thermal
resistance between the RRR and rod is reasonable as the thermal resistance between
these two parts is yet smaller than other means of heat transfer at the region such as the
mock vessel and the stagnant air. Moreover, the material properties of the parts in this
numerical analysis are mainly derived from literature and datasheets that belong to the
tests conducted on the bulk materials. Therefore, it is impossible to acquire the exact val-
ues for these properties in different test conditions and shapes of components that might
render slight sources of error in the final results.
(a) (b)
Figure 4.23. Temperature distribution in the RRR, conjugate heat transfer. a) Temperature con-
tour plots on the external surfaces of the RRR, b) temperature values along the circum-
ference, width and thickness of the RRR.
To complement the numerical results of the conjugate heat transfer study, further exper-
imental studies are conducted in the following sections. In these studies, first the internal
and external temperatures of the mock vessel in the setup of Figure 4.2 is measured in a
number of accessible points, then the expansion results of the crimped martensite RRR
by application of heat and while undergoing phase transformation into austenite are
presented. In the end the radial expansion forces exerted by a constrained RRR under the
stimuli of heat are measured and presented.
4.7 Experimental Results
In this section heat-induced expansion mechanics of the RRR are experimentally studied
and, where relevant, comparisons are drawn with the results of the previous sections.
The physical setup of the heat transfer model in Figure 4.2 is shown in Figure 4.24. The
base is first laid on top of a hotplate (Cimarec, Barnstead International, Iowa, USA) with-
Conjugate Thermal
TemperatureUnit: ˚C
Circumferential Path
0.0
0.5
1.0 (mm)
Thickness
Width
81.65
81.70
81.75
81.80
81.85
81.90
81.95
0 20 40 60 80 100
Tem
per
atu
re (
˚C)
Normalized Length (%)
Temperature in RRR
Circumference Path Width Path Thickness Path Average
Overlapp Area
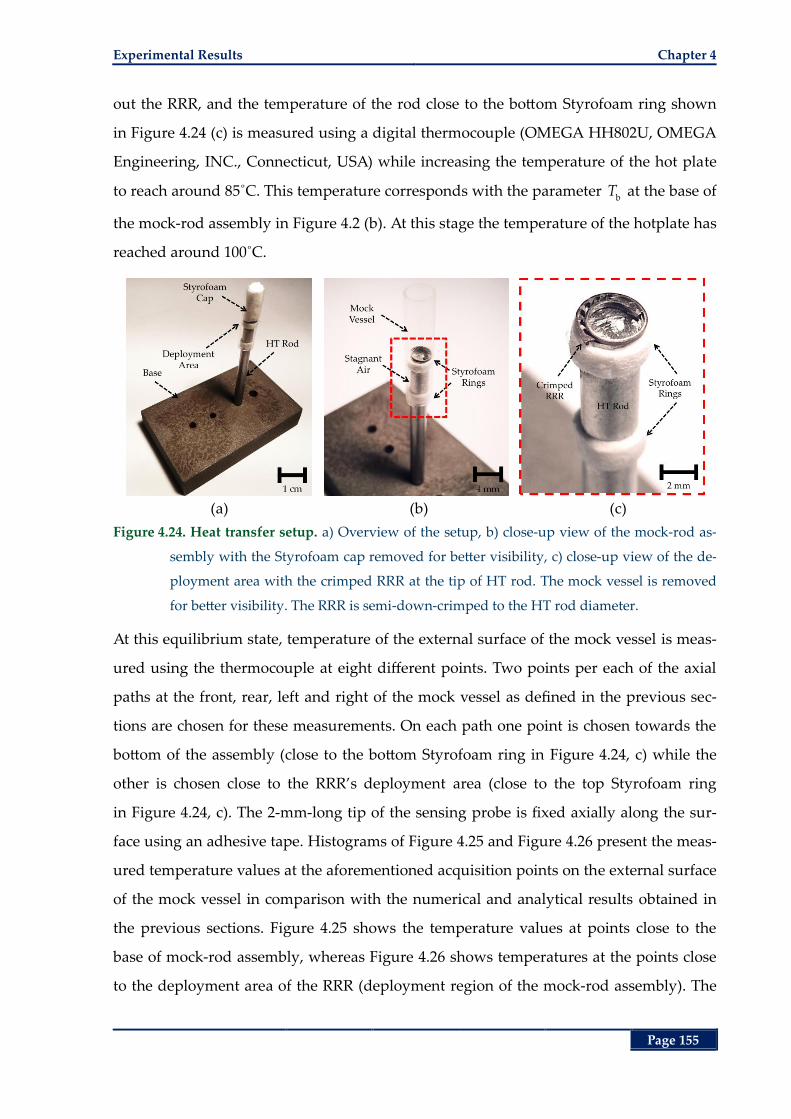
Experimental Results Chapter 4
Page 155
out the RRR, and the temperature of the rod close to the bottom Styrofoam ring shown
in Figure 4.24 (c) is measured using a digital thermocouple (OMEGA HH802U, OMEGA
Engineering, INC., Connecticut, USA) while increasing the temperature of the hot plate
to reach around 85˚C. This temperature corresponds with the parameter b
T at the base of
the mock-rod assembly in Figure 4.2 (b). At this stage the temperature of the hotplate has
reached around 100˚C.
(a) (b) (c)
Figure 4.24. Heat transfer setup. a) Overview of the setup, b) close-up view of the mock-rod as-
sembly with the Styrofoam cap removed for better visibility, c) close-up view of the de-
ployment area with the crimped RRR at the tip of HT rod. The mock vessel is removed
for better visibility. The RRR is semi-down-crimped to the HT rod diameter.
At this equilibrium state, temperature of the external surface of the mock vessel is meas-
ured using the thermocouple at eight different points. Two points per each of the axial
paths at the front, rear, left and right of the mock vessel as defined in the previous sec-
tions are chosen for these measurements. On each path one point is chosen towards the
bottom of the assembly (close to the bottom Styrofoam ring in Figure 4.24, c) while the
other is chosen close to the RRR’s deployment area (close to the top Styrofoam ring
in Figure 4.24, c). The 2-mm-long tip of the sensing probe is fixed axially along the sur-
face using an adhesive tape. Histograms of Figure 4.25 and Figure 4.26 present the meas-
ured temperature values at the aforementioned acquisition points on the external surface
of the mock vessel in comparison with the numerical and analytical results obtained in
the previous sections. Figure 4.25 shows the temperature values at points close to the
base of mock-rod assembly, whereas Figure 4.26 shows temperatures at the points close
to the deployment area of the RRR (deployment region of the mock-rod assembly). The
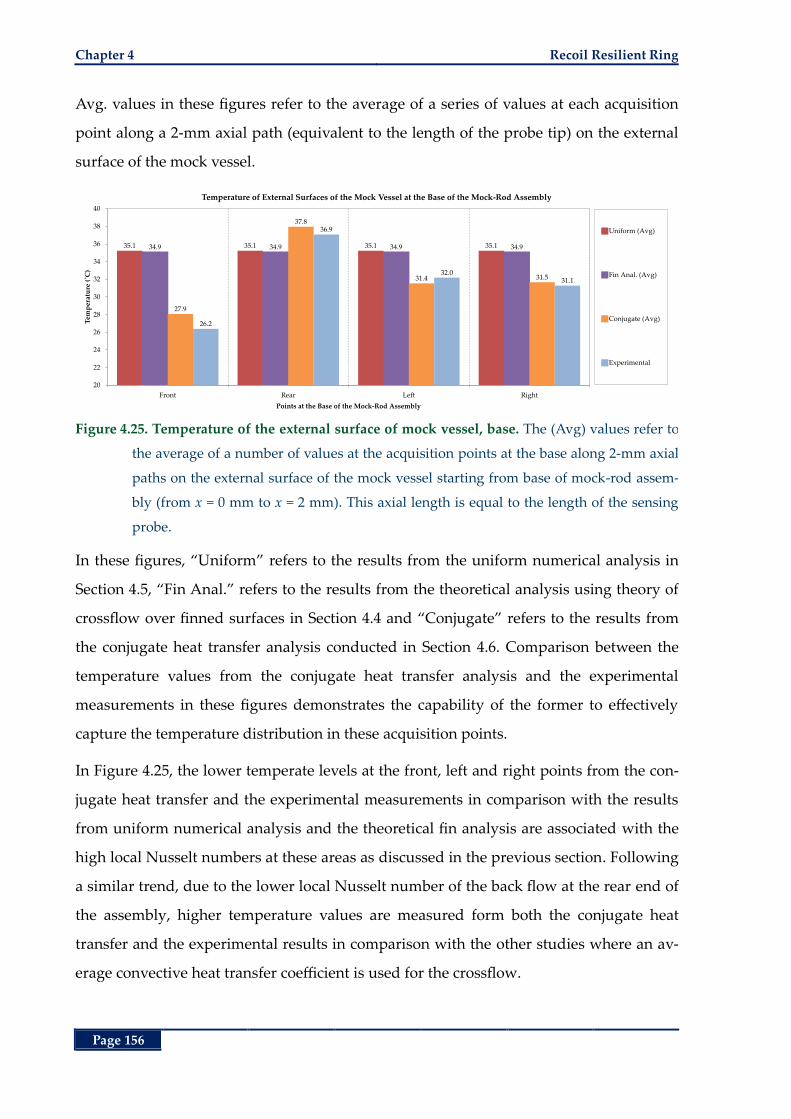
Chapter 4 Recoil Resilient Ring
Page 156
Avg. values in these figures refer to the average of a series of values at each acquisition
point along a 2-mm axial path (equivalent to the length of the probe tip) on the external
surface of the mock vessel.
Figure 4.25. Temperature of the external surface of mock vessel, base. The (Avg) values refer to
the average of a number of values at the acquisition points at the base along 2-mm axial
paths on the external surface of the mock vessel starting from base of mock-rod assem-
bly (from x = 0 mm to x = 2 mm). This axial length is equal to the length of the sensing
probe.
In these figures, “Uniform” refers to the results from the uniform numerical analysis in
Section 4.5, “Fin Anal.” refers to the results from the theoretical analysis using theory of
crossflow over finned surfaces in Section 4.4 and “Conjugate” refers to the results from
the conjugate heat transfer analysis conducted in Section 4.6. Comparison between the
temperature values from the conjugate heat transfer analysis and the experimental
measurements in these figures demonstrates the capability of the former to effectively
capture the temperature distribution in these acquisition points.
In Figure 4.25, the lower temperate levels at the front, left and right points from the con-
jugate heat transfer and the experimental measurements in comparison with the results
from uniform numerical analysis and the theoretical fin analysis are associated with the
high local Nusselt numbers at these areas as discussed in the previous section. Following
a similar trend, due to the lower local Nusselt number of the back flow at the rear end of
the assembly, higher temperature values are measured form both the conjugate heat
transfer and the experimental results in comparison with the other studies where an av-
erage convective heat transfer coefficient is used for the crossflow.
35.1 35.1 35.1 35.134.9 34.9 34.9 34.9
27.9
37.8
31.4 31.5
26.2
36.9
32.031.1
20
22
24
26
28
30
32
34
36
38
40
Front Rear Left Right
Tem
per
atu
re (
˚C)
Points at the Base of the Mock-Rod Assembly
Temperature of External Surfaces of the Mock Vessel at the Base of the Mock-Rod Assembly
Uniform (Avg)
Fin Anal. (Avg)
Conjugate (Avg)
Experimental
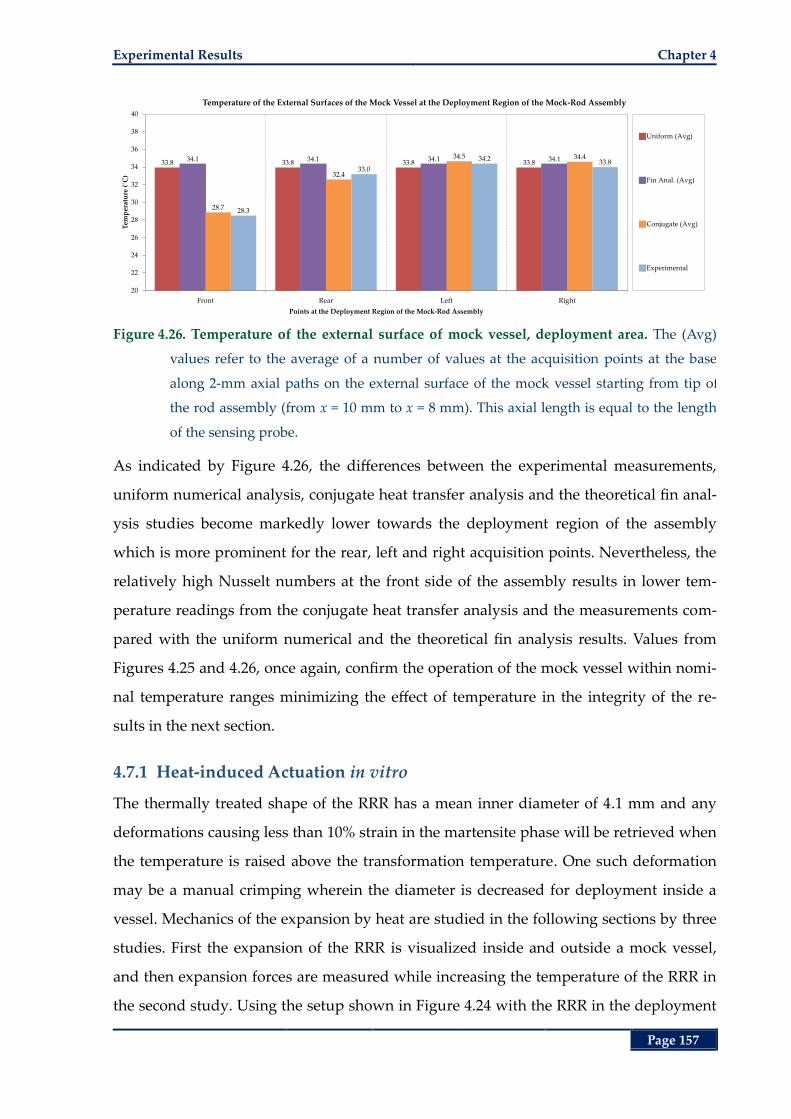
Experimental Results Chapter 4
Page 157
Figure 4.26. Temperature of the external surface of mock vessel, deployment area. The (Avg)
values refer to the average of a number of values at the acquisition points at the base
along 2-mm axial paths on the external surface of the mock vessel starting from tip of
the rod assembly (from x = 10 mm to x = 8 mm). This axial length is equal to the length
of the sensing probe.
As indicated by Figure 4.26, the differences between the experimental measurements,
uniform numerical analysis, conjugate heat transfer analysis and the theoretical fin anal-
ysis studies become markedly lower towards the deployment region of the assembly
which is more prominent for the rear, left and right acquisition points. Nevertheless, the
relatively high Nusselt numbers at the front side of the assembly results in lower tem-
perature readings from the conjugate heat transfer analysis and the measurements com-
pared with the uniform numerical and the theoretical fin analysis results. Values from
Figures 4.25 and 4.26, once again, confirm the operation of the mock vessel within nomi-
nal temperature ranges minimizing the effect of temperature in the integrity of the re-
sults in the next section.
4.7.1 Heat-induced Actuation in vitro
The thermally treated shape of the RRR has a mean inner diameter of 4.1 mm and any
deformations causing less than 10% strain in the martensite phase will be retrieved when
the temperature is raised above the transformation temperature. One such deformation
may be a manual crimping wherein the diameter is decreased for deployment inside a
vessel. Mechanics of the expansion by heat are studied in the following sections by three
studies. First the expansion of the RRR is visualized inside and outside a mock vessel,
and then expansion forces are measured while increasing the temperature of the RRR in
the second study. Using the setup shown in Figure 4.24 with the RRR in the deployment
33.8 33.8 33.8 33.834.1 34.1 34.1 34.1
28.7
32.4
34.5 34.4
28.3
33.0
34.233.8
20
22
24
26
28
30
32
34
36
38
40
Front Rear Left Right
Tem
per
atu
re (
˚C)
Points at the Deployment Region of the Mock-Rod Assembly
Temperature of the External Surfaces of the Mock Vessel at the Deployment Region of the Mock-Rod Assembly
Uniform (Avg)
Fin Anal. (Avg)
Conjugate (Avg)
Experimental
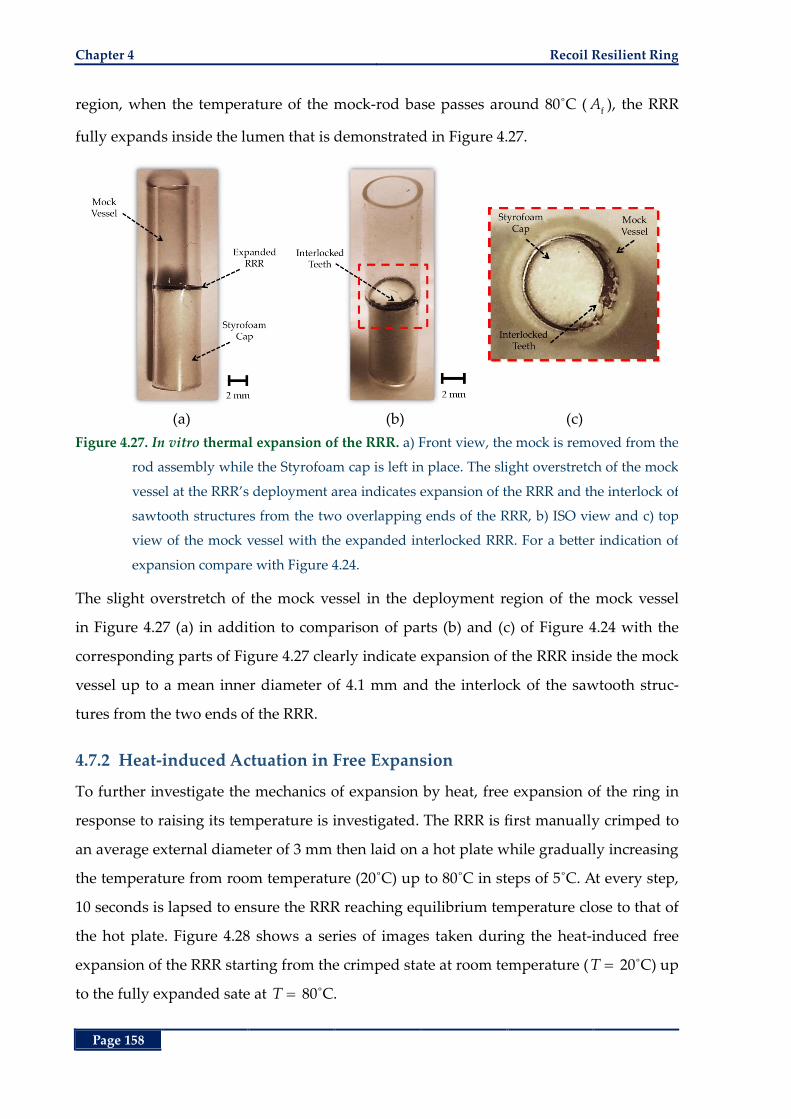
Chapter 4 Recoil Resilient Ring
Page 158
region, when the temperature of the mock-rod base passes around 80˚C (f
A ), the RRR
fully expands inside the lumen that is demonstrated in Figure 4.27.
(a) (b) (c)
Figure 4.27. In vitro thermal expansion of the RRR. a) Front view, the mock is removed from the
rod assembly while the Styrofoam cap is left in place. The slight overstretch of the mock
vessel at the RRR’s deployment area indicates expansion of the RRR and the interlock of
sawtooth structures from the two overlapping ends of the RRR, b) ISO view and c) top
view of the mock vessel with the expanded interlocked RRR. For a better indication of
expansion compare with Figure 4.24.
The slight overstretch of the mock vessel in the deployment region of the mock vessel
in Figure 4.27 (a) in addition to comparison of parts (b) and (c) of Figure 4.24 with the
corresponding parts of Figure 4.27 clearly indicate expansion of the RRR inside the mock
vessel up to a mean inner diameter of 4.1 mm and the interlock of the sawtooth struc-
tures from the two ends of the RRR.
4.7.2 Heat-induced Actuation in Free Expansion
To further investigate the mechanics of expansion by heat, free expansion of the ring in
response to raising its temperature is investigated. The RRR is first manually crimped to
an average external diameter of 3 mm then laid on a hot plate while gradually increasing
the temperature from room temperature (20˚C) up to 80˚C in steps of 5˚C. At every step,
10 seconds is lapsed to ensure the RRR reaching equilibrium temperature close to that of
the hot plate. Figure 4.28 shows a series of images taken during the heat-induced free
expansion of the RRR starting from the crimped state at room temperature ( T 20˚C) up
to the fully expanded sate at T 80˚C.
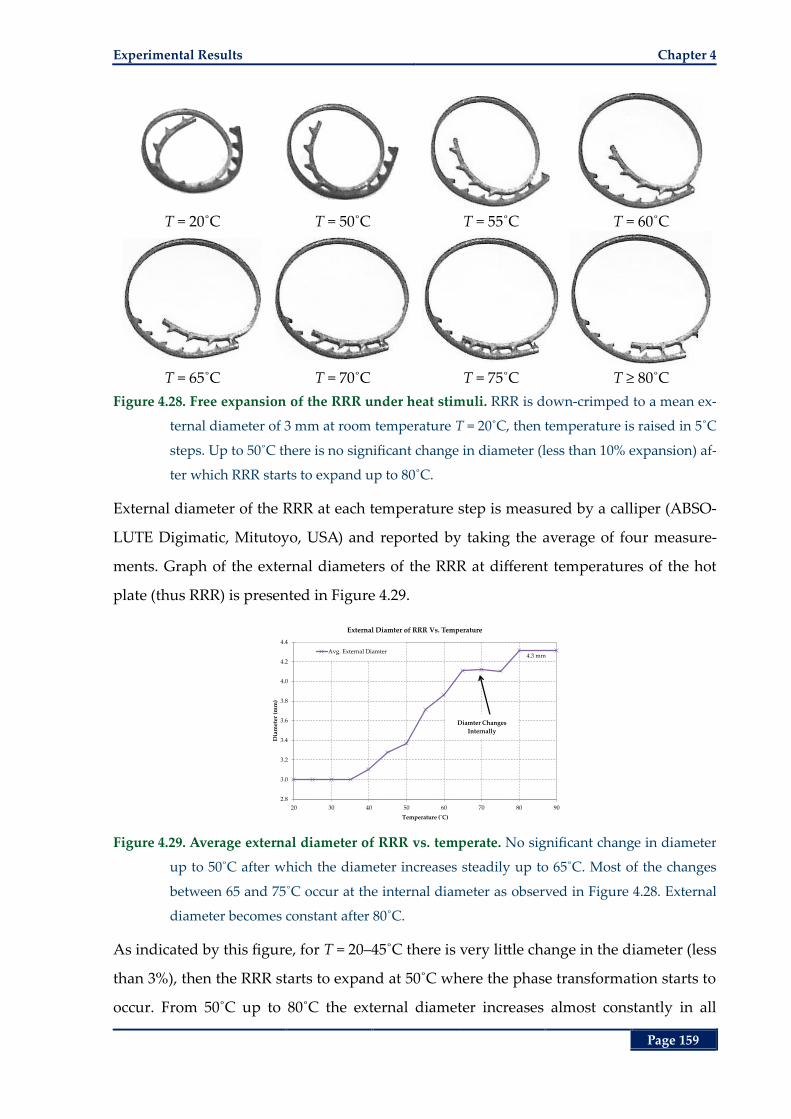
Experimental Results Chapter 4
Page 159
T = 20˚C T = 50˚C T = 55˚C T = 60˚C
T = 65˚C T = 70˚C T = 75˚C T ≥ 80˚C
Figure 4.28. Free expansion of the RRR under heat stimuli. RRR is down-crimped to a mean ex-
ternal diameter of 3 mm at room temperature T = 20˚C, then temperature is raised in 5˚C
steps. Up to 50˚C there is no significant change in diameter (less than 10% expansion) af-
ter which RRR starts to expand up to 80˚C.
External diameter of the RRR at each temperature step is measured by a calliper (ABSO-
LUTE Digimatic, Mitutoyo, USA) and reported by taking the average of four measure-
ments. Graph of the external diameters of the RRR at different temperatures of the hot
plate (thus RRR) is presented in Figure 4.29.
Figure 4.29. Average external diameter of RRR vs. temperate. No significant change in diameter
up to 50˚C after which the diameter increases steadily up to 65˚C. Most of the changes
between 65 and 75˚C occur at the internal diameter as observed in Figure 4.28. External
diameter becomes constant after 80˚C.
As indicated by this figure, for T = 20–45˚C there is very little change in the diameter (less
than 3%), then the RRR starts to expand at 50˚C where the phase transformation starts to
occur. From 50˚C up to 80˚C the external diameter increases almost constantly in all
4.3 mm
2.8
3.0
3.2
3.4
3.6
3.8
4.0
4.2
4.4
20 30 40 50 60 70 80 90
Dia
met
er (
mm
)
Temperature (˚C)
External Diamter of RRR Vs. Temperature
Avg. External Diamter
Diamter Changes
Internally
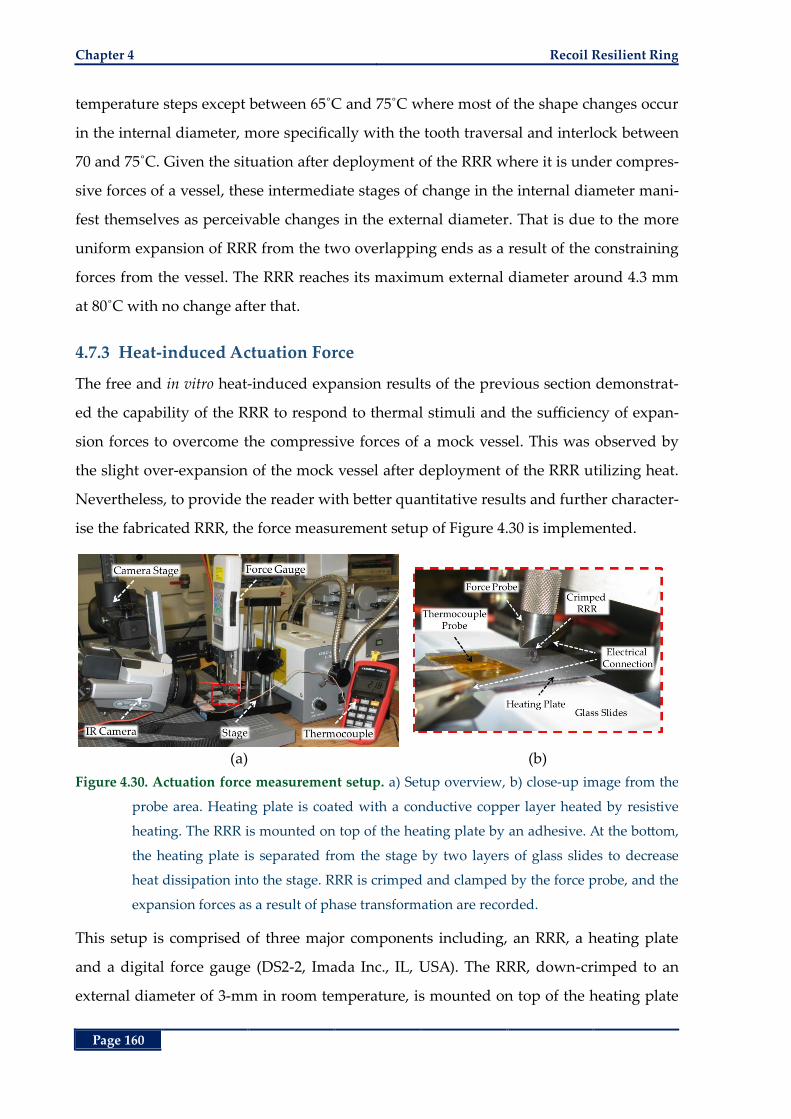
Chapter 4 Recoil Resilient Ring
Page 160
temperature steps except between 65˚C and 75˚C where most of the shape changes occur
in the internal diameter, more specifically with the tooth traversal and interlock between
70 and 75˚C. Given the situation after deployment of the RRR where it is under compres-
sive forces of a vessel, these intermediate stages of change in the internal diameter mani-
fest themselves as perceivable changes in the external diameter. That is due to the more
uniform expansion of RRR from the two overlapping ends as a result of the constraining
forces from the vessel. The RRR reaches its maximum external diameter around 4.3 mm
at 80˚C with no change after that.
4.7.3 Heat-induced Actuation Force
The free and in vitro heat-induced expansion results of the previous section demonstrat-
ed the capability of the RRR to respond to thermal stimuli and the sufficiency of expan-
sion forces to overcome the compressive forces of a mock vessel. This was observed by
the slight over-expansion of the mock vessel after deployment of the RRR utilizing heat.
Nevertheless, to provide the reader with better quantitative results and further character-
ise the fabricated RRR, the force measurement setup of Figure 4.30 is implemented.
(a) (b)
Figure 4.30. Actuation force measurement setup. a) Setup overview, b) close-up image from the
probe area. Heating plate is coated with a conductive copper layer heated by resistive
heating. The RRR is mounted on top of the heating plate by an adhesive. At the bottom,
the heating plate is separated from the stage by two layers of glass slides to decrease
heat dissipation into the stage. RRR is crimped and clamped by the force probe, and the
expansion forces as a result of phase transformation are recorded.
This setup is comprised of three major components including, an RRR, a heating plate
and a digital force gauge (DS2-2, Imada Inc., IL, USA). The RRR, down-crimped to an
external diameter of 3-mm in room temperature, is mounted on top of the heating plate
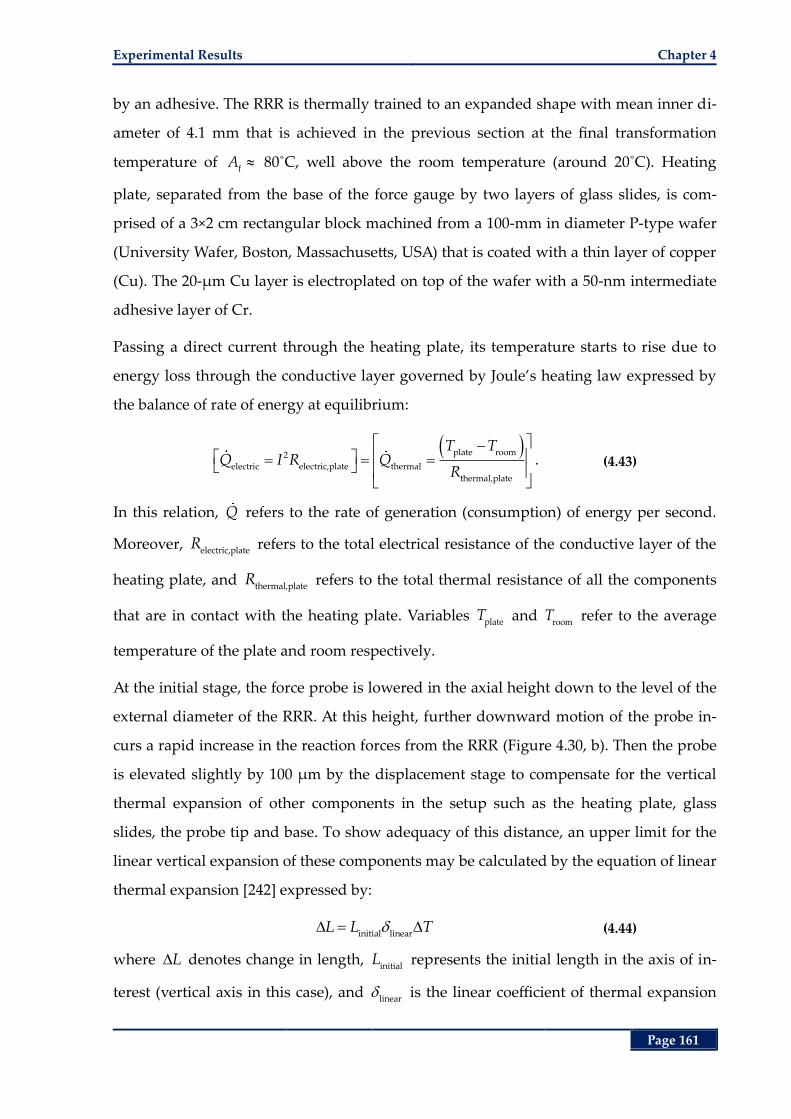
Experimental Results Chapter 4
Page 161
by an adhesive. The RRR is thermally trained to an expanded shape with mean inner di-
ameter of 4.1 mm that is achieved in the previous section at the final transformation
temperature of f
A 80˚C, well above the room temperature (around 20˚C). Heating
plate, separated from the base of the force gauge by two layers of glass slides, is com-
prised of a 3×2 cm rectangular block machined from a 100-mm in diameter P-type wafer
(University Wafer, Boston, Massachusetts, USA) that is coated with a thin layer of copper
(Cu). The 20-µm Cu layer is electroplated on top of the wafer with a 50-nm intermediate
adhesive layer of Cr.
Passing a direct current through the heating plate, its temperature starts to rise due to
energy loss through the conductive layer governed by Joule’s heating law expressed by
the balance of rate of energy at equilibrium:
plate room2
electric electric,plate thermal
thermal,plate
T TQ I R Q
R. (4.43)
In this relation, Q refers to the rate of generation (consumption) of energy per second.
Moreover, electric,plateR refers to the total electrical resistance of the conductive layer of the
heating plate, and thermal,plateR refers to the total thermal resistance of all the components
that are in contact with the heating plate. Variables plateT and
roomT refer to the average
temperature of the plate and room respectively.
At the initial stage, the force probe is lowered in the axial height down to the level of the
external diameter of the RRR. At this height, further downward motion of the probe in-
curs a rapid increase in the reaction forces from the RRR (Figure 4.30, b). Then the probe
is elevated slightly by 100 µm by the displacement stage to compensate for the vertical
thermal expansion of other components in the setup such as the heating plate, glass
slides, the probe tip and base. To show adequacy of this distance, an upper limit for the
linear vertical expansion of these components may be calculated by the equation of linear
thermal expansion [242] expressed by:
initial linear
L L T (4.44)
where L denotes change in length, initial
L represents the initial length in the axis of in-
terest (vertical axis in this case), and linear
is the linear coefficient of thermal expansion
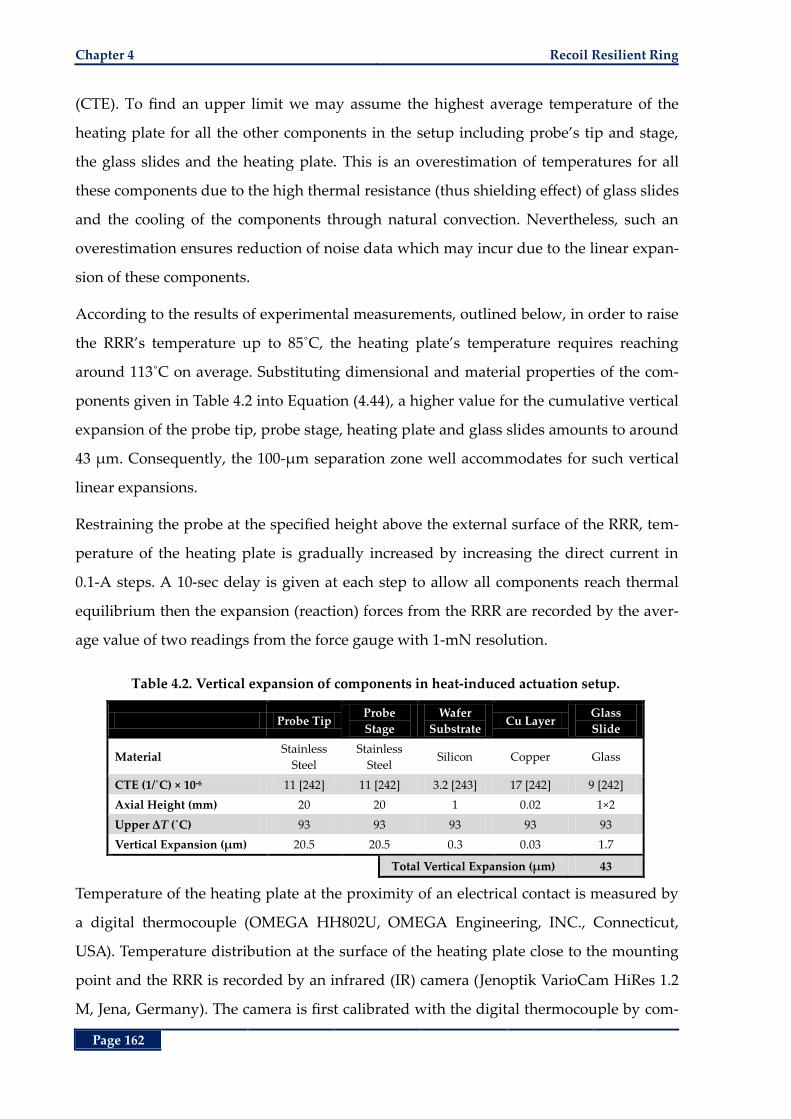
Chapter 4 Recoil Resilient Ring
Page 162
(CTE). To find an upper limit we may assume the highest average temperature of the
heating plate for all the other components in the setup including probe’s tip and stage,
the glass slides and the heating plate. This is an overestimation of temperatures for all
these components due to the high thermal resistance (thus shielding effect) of glass slides
and the cooling of the components through natural convection. Nevertheless, such an
overestimation ensures reduction of noise data which may incur due to the linear expan-
sion of these components.
According to the results of experimental measurements, outlined below, in order to raise
the RRR’s temperature up to 85˚C, the heating plate’s temperature requires reaching
around 113˚C on average. Substituting dimensional and material properties of the com-
ponents given in Table 4.2 into Equation (4.44), a higher value for the cumulative vertical
expansion of the probe tip, probe stage, heating plate and glass slides amounts to around
43 µm. Consequently, the 100-µm separation zone well accommodates for such vertical
linear expansions.
Restraining the probe at the specified height above the external surface of the RRR, tem-
perature of the heating plate is gradually increased by increasing the direct current in
0.1-A steps. A 10-sec delay is given at each step to allow all components reach thermal
equilibrium then the expansion (reaction) forces from the RRR are recorded by the aver-
age value of two readings from the force gauge with 1-mN resolution.
Table 4.2. Vertical expansion of components in heat-induced actuation setup.
Probe Tip Probe
Stage
Wafer
Substrate Cu Layer
Glass
Slide
Material Stainless
Steel
Stainless
Steel Silicon Copper Glass
CTE (1/˚C) × 10-6 11 [242] 11 [242] 3.2 [243] 17 [242] 9 [242]
Axial Height (mm) 20 20 1 0.02 1×2
Upper ΔT (˚C) 93 93 93 93 93
Vertical Expansion (µm) 20.5 20.5 0.3 0.03 1.7
Total Vertical Expansion (µm) 43
Temperature of the heating plate at the proximity of an electrical contact is measured by
a digital thermocouple (OMEGA HH802U, OMEGA Engineering, INC., Connecticut,
USA). Temperature distribution at the surface of the heating plate close to the mounting
point and the RRR is recorded by an infrared (IR) camera (Jenoptik VarioCam HiRes 1.2
M, Jena, Germany). The camera is first calibrated with the digital thermocouple by com-
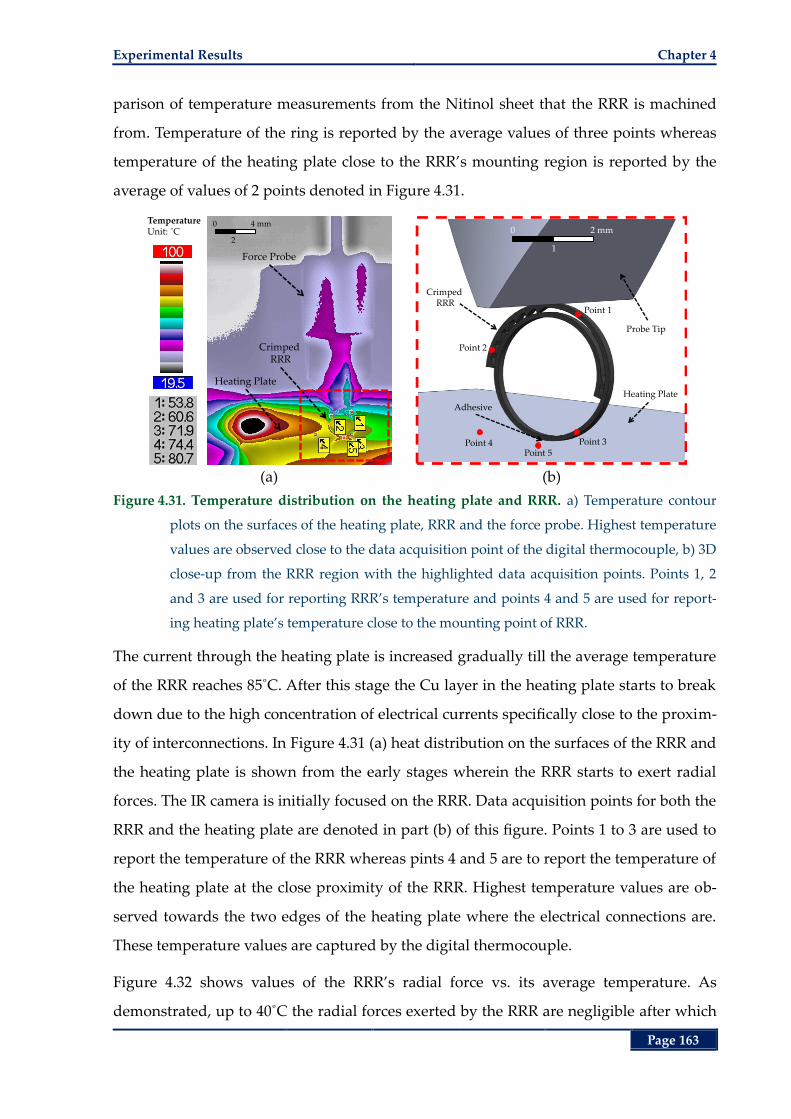
Experimental Results Chapter 4
Page 163
parison of temperature measurements from the Nitinol sheet that the RRR is machined
from. Temperature of the ring is reported by the average values of three points whereas
temperature of the heating plate close to the RRR’s mounting region is reported by the
average of values of 2 points denoted in Figure 4.31.
(a) (b)
Figure 4.31. Temperature distribution on the heating plate and RRR. a) Temperature contour
plots on the surfaces of the heating plate, RRR and the force probe. Highest temperature
values are observed close to the data acquisition point of the digital thermocouple, b) 3D
close-up from the RRR region with the highlighted data acquisition points. Points 1, 2
and 3 are used for reporting RRR’s temperature and points 4 and 5 are used for report-
ing heating plate’s temperature close to the mounting point of RRR.
The current through the heating plate is increased gradually till the average temperature
of the RRR reaches 85˚C. After this stage the Cu layer in the heating plate starts to break
down due to the high concentration of electrical currents specifically close to the proxim-
ity of interconnections. In Figure 4.31 (a) heat distribution on the surfaces of the RRR and
the heating plate is shown from the early stages wherein the RRR starts to exert radial
forces. The IR camera is initially focused on the RRR. Data acquisition points for both the
RRR and the heating plate are denoted in part (b) of this figure. Points 1 to 3 are used to
report the temperature of the RRR whereas pints 4 and 5 are to report the temperature of
the heating plate at the close proximity of the RRR. Highest temperature values are ob-
served towards the two edges of the heating plate where the electrical connections are.
These temperature values are captured by the digital thermocouple.
Figure 4.32 shows values of the RRR’s radial force vs. its average temperature. As
demonstrated, up to 40˚C the radial forces exerted by the RRR are negligible after which
TemperatureUnit: ˚C
Force Probe
Crimped RRR
Heating Plate
0
2
4 mm
Point 1
Point 2
Point 3Point 5
Point 4
Adhesive
Heating Plate
Probe Tip
0
1
2 mm
Crimped RRR
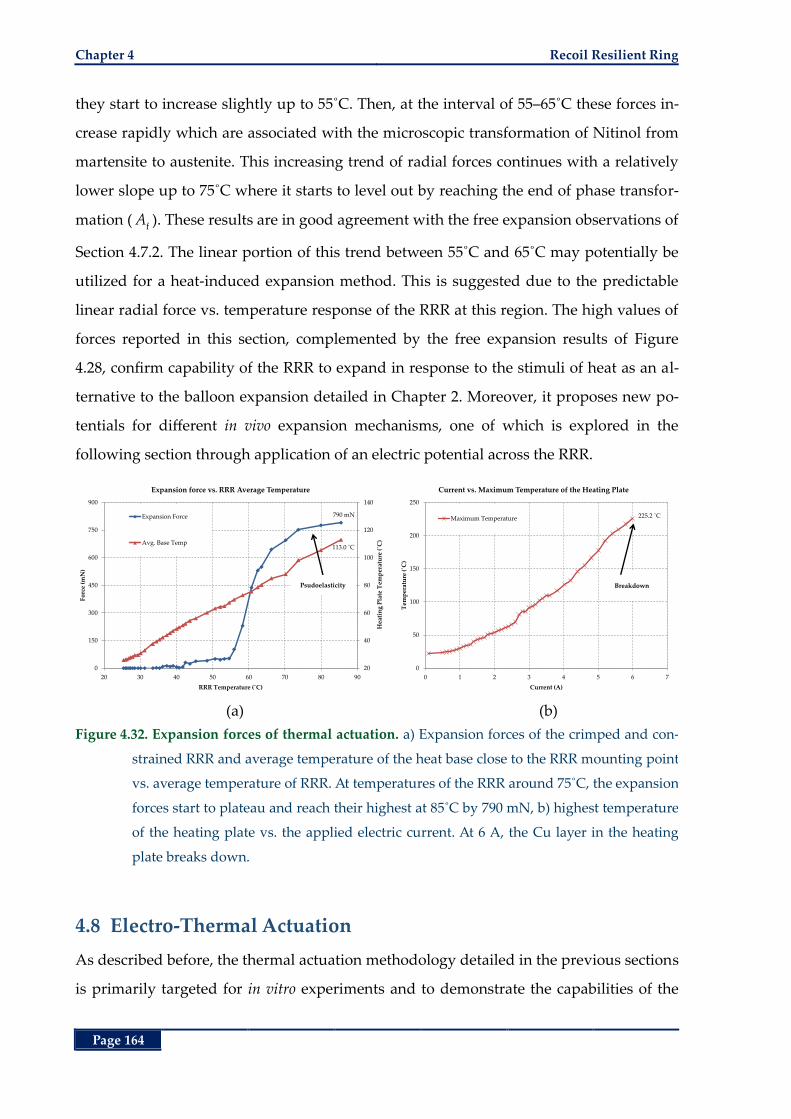
Chapter 4 Recoil Resilient Ring
Page 164
they start to increase slightly up to 55˚C. Then, at the interval of 55–65˚C these forces in-
crease rapidly which are associated with the microscopic transformation of Nitinol from
martensite to austenite. This increasing trend of radial forces continues with a relatively
lower slope up to 75˚C where it starts to level out by reaching the end of phase transfor-
mation (f
A ). These results are in good agreement with the free expansion observations of
Section 4.7.2. The linear portion of this trend between 55˚C and 65˚C may potentially be
utilized for a heat-induced expansion method. This is suggested due to the predictable
linear radial force vs. temperature response of the RRR at this region. The high values of
forces reported in this section, complemented by the free expansion results of Figure
4.28, confirm capability of the RRR to expand in response to the stimuli of heat as an al-
ternative to the balloon expansion detailed in Chapter 2. Moreover, it proposes new po-
tentials for different in vivo expansion mechanisms, one of which is explored in the
following section through application of an electric potential across the RRR.
(a) (b)
Figure 4.32. Expansion forces of thermal actuation. a) Expansion forces of the crimped and con-
strained RRR and average temperature of the heat base close to the RRR mounting point
vs. average temperature of RRR. At temperatures of the RRR around 75˚C, the expansion
forces start to plateau and reach their highest at 85˚C by 790 mN, b) highest temperature
of the heating plate vs. the applied electric current. At 6 A, the Cu layer in the heating
plate breaks down.
4.8 Electro-Thermal Actuation
As described before, the thermal actuation methodology detailed in the previous sections
is primarily targeted for in vitro experiments and to demonstrate the capabilities of the
790 mN
113.0 ˚C
20
40
60
80
100
120
140
0
150
300
450
600
750
900
20 30 40 50 60 70 80 90
Hea
tin
g P
late
Tem
per
atu
re (
˚C)
Fo
rce
(mN
)
RRR Temperature (˚C)
Expansion force vs. RRR Average Temperature
Expansion Force
Avg. Base Temp
Psudoelasticity
225.2 ˚C
0
50
100
150
200
250
0 1 2 3 4 5 6 7
Tem
per
atu
re (
˚C)
Current (A)
Current vs. Maximum Temperature of the Heating Plate
Maximum Temperature
Breakdown
Electro-Thermal Actuation Chapter 4
Page 165
RRR as an actuator. Gradual expansion of the RRR in vivo, on the other hand, first re-
quires a Nitinol compound with a lower, and safer, transformation temperature and sec-
ondly it calls for more attractive means of in vivo actuation with smaller footprints. The
current SMA based stents are primarily made of Nitinol with f
A temperatures that are
lower than the human body temperature [95]. Therefore, while outside the body, in room
temperature, these stents are in the martensite state wherein they are effortlessly
crimped into a constraining sheath. Upon delivery to the lesion site the sheet is retracted
and the warmed, thus microscopically transformed, stent retrieves its thermally trained
(expanded) shape. Remained in the austenite phase for the rest of its lifecycle, the ex-
panded stent then exerts a low chronic outward force against internal walls of the vessel
to maintain patency of the lumen.
The RRR proposed in this thesis, is to operate mainly in its martensite state after de-
ployment. Consequently, thermal actuation (expansion) is to occur at temperatures high-
er than that of the human body. To devise a safe actuation temperature, lower fA may be
engineered via either changes in the compositional ratio of nickel and titanium or a
thermal treatment process [95, 96, 239]. Expansion by a bulky apparatus such as an angi-
oplasty balloon or the heat transfer rod in the previous sections is not desirable in gen-
eral as outlined under stenting objectives in Chapter 1. However, the conductive
properties of Nitinol alloy and Joule heating may further be utilized in a heat-induced
actuation method. To explore this potential and to provide recommendations for future
work, in this section a theoretical and numerical framework is presented to further inves-
tigate the capabilities of the RRR.
4.8.1 Theoretical Framework
The energy dissipated by the electrical resistance of a conductor subject to an electric
filed may be expressed by Joule’s first law:
electric electric electric
Q V I (4.45)
where electric
Q is the rate of energy dissipated through resistive heating, electricV is the elec-
tric potential across the resistive conductor and electricI refers to the current passing
through it. Given the conductive properties of the Nitinol alloy (Table 4.1), this phenom-
enon may be utilized for thermal actuation of the RRR by application of an electric po-
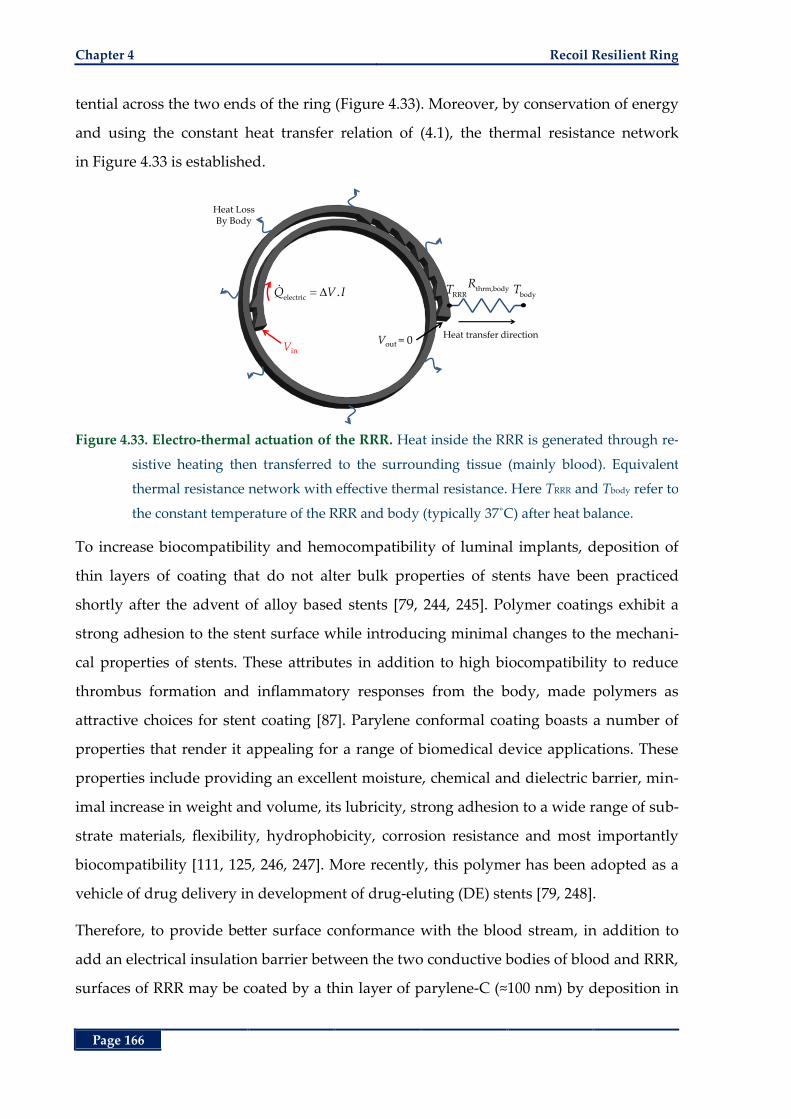
Chapter 4 Recoil Resilient Ring
Page 166
tential across the two ends of the ring (Figure 4.33). Moreover, by conservation of energy
and using the constant heat transfer relation of (4.1), the thermal resistance network
in Figure 4.33 is established.
Figure 4.33. Electro-thermal actuation of the RRR. Heat inside the RRR is generated through re-
sistive heating then transferred to the surrounding tissue (mainly blood). Equivalent
thermal resistance network with effective thermal resistance. Here TRRR and Tbody refer to
the constant temperature of the RRR and body (typically 37˚C) after heat balance.
To increase biocompatibility and hemocompatibility of luminal implants, deposition of
thin layers of coating that do not alter bulk properties of stents have been practiced
shortly after the advent of alloy based stents [79, 244, 245]. Polymer coatings exhibit a
strong adhesion to the stent surface while introducing minimal changes to the mechani-
cal properties of stents. These attributes in addition to high biocompatibility to reduce
thrombus formation and inflammatory responses from the body, made polymers as
attractive choices for stent coating [87]. Parylene conformal coating boasts a number of
properties that render it appealing for a range of biomedical device applications. These
properties include providing an excellent moisture, chemical and dielectric barrier, min-
imal increase in weight and volume, its lubricity, strong adhesion to a wide range of sub-
strate materials, flexibility, hydrophobicity, corrosion resistance and most importantly
biocompatibility [111, 125, 246, 247]. More recently, this polymer has been adopted as a
vehicle of drug delivery in development of drug-eluting (DE) stents [79, 248].
Therefore, to provide better surface conformance with the blood stream, in addition to
add an electrical insulation barrier between the two conductive bodies of blood and RRR,
surfaces of RRR may be coated by a thin layer of parylene-C (≈100 nm) by deposition in
VinVout = 0
Heat LossBy Body
thrm,bodyR
RRRT body
T
Heat transfer direction
electric.Q V I
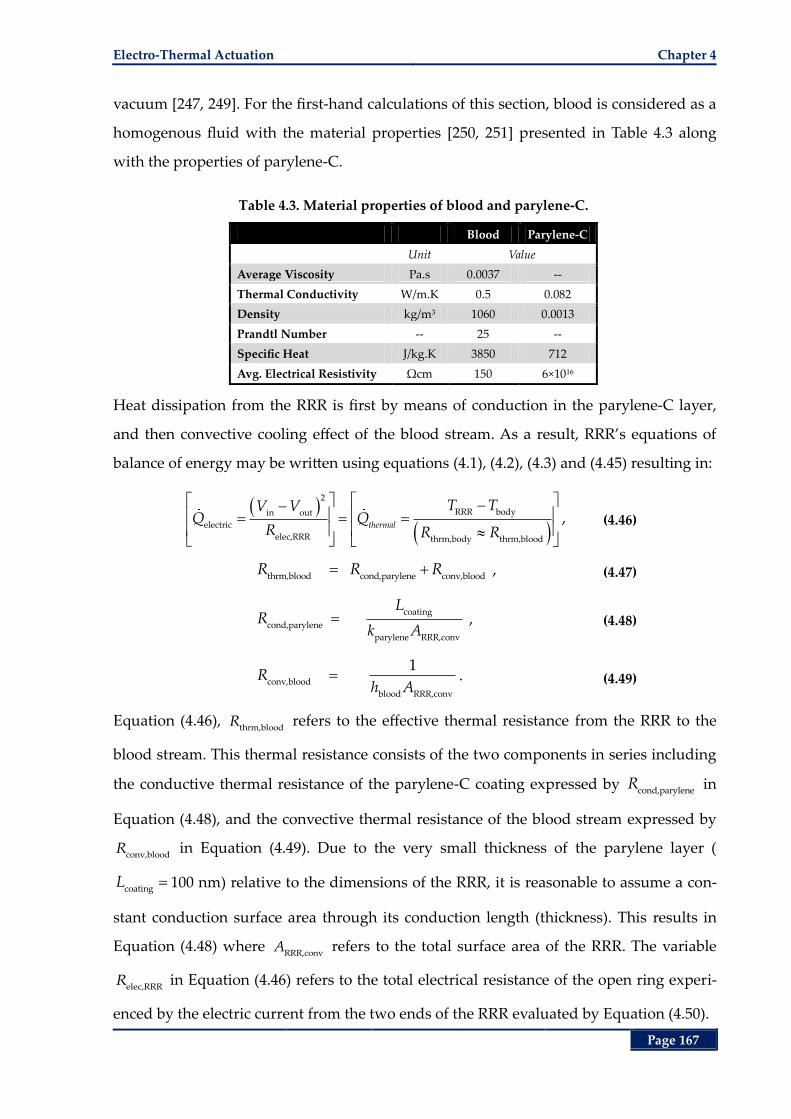
Electro-Thermal Actuation Chapter 4
Page 167
vacuum [247, 249]. For the first-hand calculations of this section, blood is considered as a
homogenous fluid with the material properties [250, 251] presented in Table 4.3 along
with the properties of parylene-C.
Table 4.3. Material properties of blood and parylene-C.
Blood Parylene-C
Unit Value
Average Viscosity Pa.s 0.0037 --
Thermal Conductivity W/m.K 0.5 0.082
Density kg/m3 1060 0.0013
Prandtl Number -- 25 --
Specific Heat J/kg.K 3850 712
Avg. Electrical Resistivity Ωcm 150 6×10¹⁶
Heat dissipation from the RRR is first by means of conduction in the parylene-C layer,
and then convective cooling effect of the blood stream. As a result, RRR’s equations of
balance of energy may be written using equations (4.1), (4.2), (4.3) and (4.45) resulting in:
2
RRR bodyin out
electric
elec,RRR thrm,body thrm,blood
thermal
T TV VQ Q
R R R, (4.46)
thrm,blood cond,parylene conv,blood
R R R , (4.47)
coating
cond,parylene
parylene RRR,conv
LR
k A , (4.48)
conv,blood
blood RRR,conv
1R
h A. (4.49)
Equation (4.46), thrm,blood
R refers to the effective thermal resistance from the RRR to the
blood stream. This thermal resistance consists of the two components in series including
the conductive thermal resistance of the parylene-C coating expressed by cond,paryleneR in
Equation (4.48), and the convective thermal resistance of the blood stream expressed by
conv,bloodR in Equation (4.49). Due to the very small thickness of the parylene layer (
coating
L 100 nm) relative to the dimensions of the RRR, it is reasonable to assume a con-
stant conduction surface area through its conduction length (thickness). This results in
Equation (4.48) where RRR,conv
A refers to the total surface area of the RRR. The variable
elec,RRRR in Equation (4.46) refers to the total electrical resistance of the open ring experi-
enced by the electric current from the two ends of the RRR evaluated by Equation (4.50).
Chapter 4 Recoil Resilient Ring
Page 168
elec,Nitinol RRR
elec,RRR
RRR,csA
LR (4.50)
In this equation RRR
L and RRR,cs
A refer to the total length and average cross-sectional area
of the RRR in Figure 4.33 respectively and elec,Nitinol
refers to the average electrical re-
sistance of Nitinol given in Table 4.1. In order to find the effective convective heat trans-
fer coefficient of the blood, blood
h , average velocity of blood is calculated from the time-
varying waveform from Chapter 3 [219] presented in Figure 3.3. The average heat trans-
fer coefficient of the blood stream may be estimated by Churchill and Bernstein relation
given in Equation (4.11) where the Reynolds number is evaluated by:
avg,blood chr blood
blood
Re 6.3V L
(4.51)
where blood
refers to the average viscosity of the blood given in Table 4.3, avg,bloodV is the
time-averaged flow velocity denoted in Figure 3.3. In this equation, chr
L refers to the
characteristic length of the RRR that may be estimated by a structure of a circular cross-
section. This length is estimated equating the periphery of the rectangular cross-section
of the RRR to a circular cylinder expressed by:
RRR RRR RRR cylinder chr2P W t P L (4.52)
where RRR
W and RRR
t respectively refer to the width and average thickness of RRR given
in Table 4.1. Evaluating the Nusselt number, the convective heat transfer coefficient of
blood can be expressed by:
bloodblood
chr
Nukh
L≈ 12000 W/m2K. (4.53)
For the theoretical and numerical studies of this section, a Nitinol material with a low
transformation temperature f
A 45˚C and a narrow offset between sA and f
A around
2˚C may be adopted as mentioned above. Consequently, substituting bloodh into Equa-
tion (4.46), the required electrical potential across the RRR to raise its temperature from
its initial state (body temperature≈37˚C) to fA is approximately 0.64 V. Given this low
value of actuation voltage, and current advances in remote radio frequency (RF) actua-
tion schemes, further studies to demonstrate actuation utilizing interrogation methods
may be conducted in the future.
Electro-Thermal Actuation Chapter 4
Page 169
The analytical method in this section provided a good first hand estimate on the required
amount of electromotive forces to induce thermal actuation in an RRR with a low f
A .
Nevertheless, these calculations are prone to inaccuracies due to the following reasons:
The empirical formulation of Nusselt number from Churchill and Bernstein is primarily
defined for cross-flows over cylindrical structures. Nevertheless, due to the lack of such
unique formulation for structures of rectangular cross-sections this model is employed
for our estimations in this section. Moreover, the cross-sectional area of the RRR struc-
ture is not uniform along its length with differences occurring at the sites of sawtooth
structures, whereas uniform assumptions are made here for both calculations of the elec-
trical resistance and Reynolds number. In physiological conditions, blood exhibits non-
Newtonian behaviour with a shear thinning effect at areas with high shear rates that is
not included in the calculations of this section. Most importantly, as mentioned in the
previous sections, local Nusselt number around an object that is subject to cross-flow is
variable and depends on the complicated flow patterns around it. These limitations call
for a more detailed analysis including these parameters into consideration. As a result, to
complement the results of this section, a detailed multiphysics numerical analysis cou-
pling electromagnetics, heat transfer and fluid transfer effects into account is presented
in the following section.
4.8.2 Numerical Analysis
Numerical analysis has the advantage of providing a robust approach to highlight in-
formation of interest in a problem while taking numerous what-if scenarios into account
before any costly fabrication and/or experimental results. The following section outlines
the methods and results of electrical heating of a crimped stand-alone RRR inside a ves-
sel that is subject to a blood flow profile.
I. Materials and Methods
The 3D model of a crimped RRR inside the deployment area of a mock vessel is demon-
strated in Figure 4.34. The RRR is crimped down to an average external diameter of 3-
mm that is subject to the luminal flow of a vessel with a reference internal diameter of 4
mm. As an initial condition, both the blood and the RRR are considered at constant tem-
perature of 37˚C.
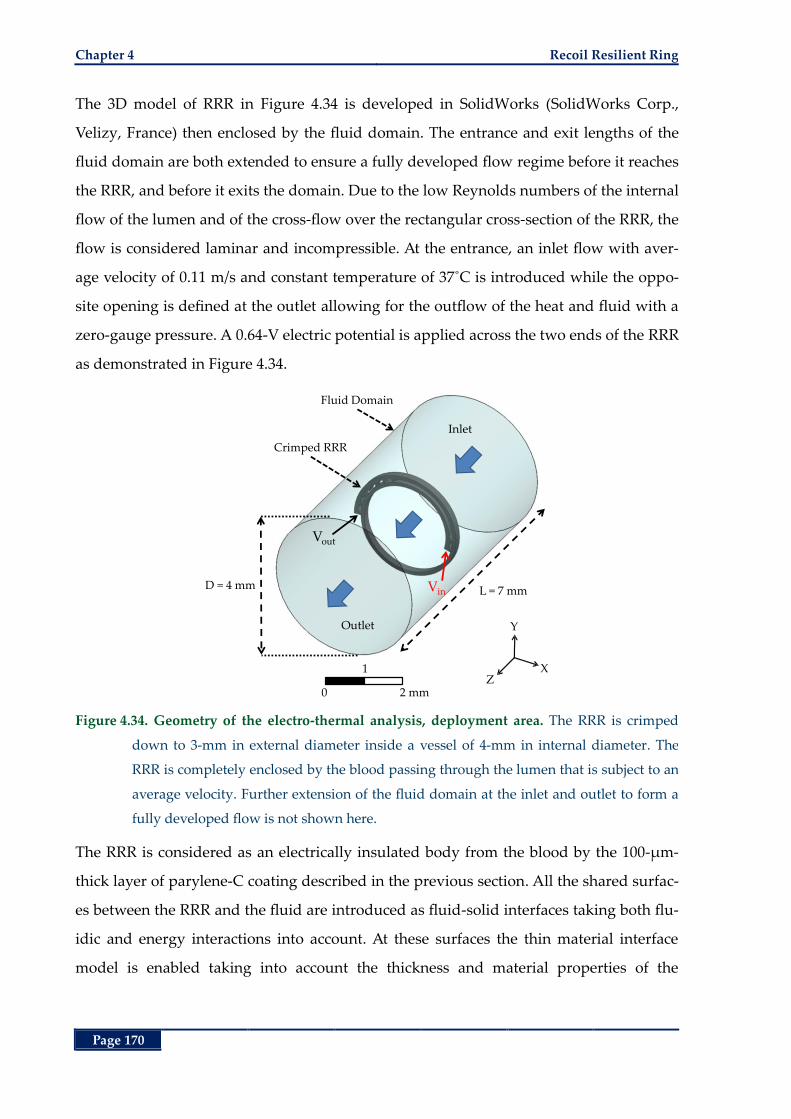
Chapter 4 Recoil Resilient Ring
Page 170
The 3D model of RRR in Figure 4.34 is developed in SolidWorks (SolidWorks Corp.,
Velizy, France) then enclosed by the fluid domain. The entrance and exit lengths of the
fluid domain are both extended to ensure a fully developed flow regime before it reaches
the RRR, and before it exits the domain. Due to the low Reynolds numbers of the internal
flow of the lumen and of the cross-flow over the rectangular cross-section of the RRR, the
flow is considered laminar and incompressible. At the entrance, an inlet flow with aver-
age velocity of 0.11 m/s and constant temperature of 37˚C is introduced while the oppo-
site opening is defined at the outlet allowing for the outflow of the heat and fluid with a
zero-gauge pressure. A 0.64-V electric potential is applied across the two ends of the RRR
as demonstrated in Figure 4.34.
Figure 4.34. Geometry of the electro-thermal analysis, deployment area. The RRR is crimped
down to 3-mm in external diameter inside a vessel of 4-mm in internal diameter. The
RRR is completely enclosed by the blood passing through the lumen that is subject to an
average velocity. Further extension of the fluid domain at the inlet and outlet to form a
fully developed flow is not shown here.
The RRR is considered as an electrically insulated body from the blood by the 100-µm-
thick layer of parylene-C coating described in the previous section. All the shared surfac-
es between the RRR and the fluid are introduced as fluid-solid interfaces taking both flu-
idic and energy interactions into account. At these surfaces the thin material interface
model is enabled taking into account the thickness and material properties of the
Crimped RRR
Outlet
L = 7 mm
Inlet
D = 4 mm Vin
Vout
Fluid Domain
0 2 mm
1
Y
XZ
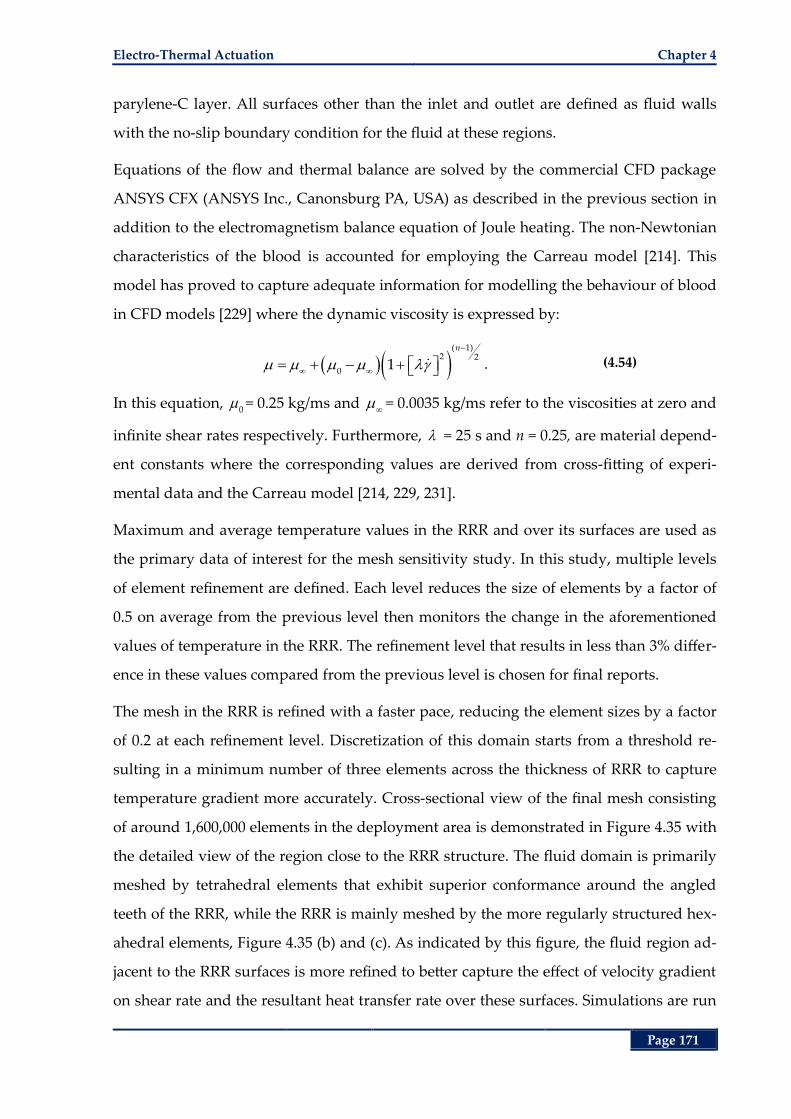
Electro-Thermal Actuation Chapter 4
Page 171
parylene-C layer. All surfaces other than the inlet and outlet are defined as fluid walls
with the no-slip boundary condition for the fluid at these regions.
Equations of the flow and thermal balance are solved by the commercial CFD package
ANSYS CFX (ANSYS Inc., Canonsburg PA, USA) as described in the previous section in
addition to the electromagnetism balance equation of Joule heating. The non-Newtonian
characteristics of the blood is accounted for employing the Carreau model [214]. This
model has proved to capture adequate information for modelling the behaviour of blood
in CFD models [229] where the dynamic viscosity is expressed by:
( 1)2 2
01
n
. (4.54)
In this equation, 0= 0.25 kg/ms and
= 0.0035 kg/ms refer to the viscosities at zero and
infinite shear rates respectively. Furthermore, = 25 s and n = 0.25, are material depend-
ent constants where the corresponding values are derived from cross-fitting of experi-
mental data and the Carreau model [214, 229, 231].
Maximum and average temperature values in the RRR and over its surfaces are used as
the primary data of interest for the mesh sensitivity study. In this study, multiple levels
of element refinement are defined. Each level reduces the size of elements by a factor of
0.5 on average from the previous level then monitors the change in the aforementioned
values of temperature in the RRR. The refinement level that results in less than 3% differ-
ence in these values compared from the previous level is chosen for final reports.
The mesh in the RRR is refined with a faster pace, reducing the element sizes by a factor
of 0.2 at each refinement level. Discretization of this domain starts from a threshold re-
sulting in a minimum number of three elements across the thickness of RRR to capture
temperature gradient more accurately. Cross-sectional view of the final mesh consisting
of around 1,600,000 elements in the deployment area is demonstrated in Figure 4.35 with
the detailed view of the region close to the RRR structure. The fluid domain is primarily
meshed by tetrahedral elements that exhibit superior conformance around the angled
teeth of the RRR, while the RRR is mainly meshed by the more regularly structured hex-
ahedral elements, Figure 4.35 (b) and (c). As indicated by this figure, the fluid region ad-
jacent to the RRR surfaces is more refined to better capture the effect of velocity gradient
on shear rate and the resultant heat transfer rate over these surfaces. Simulations are run
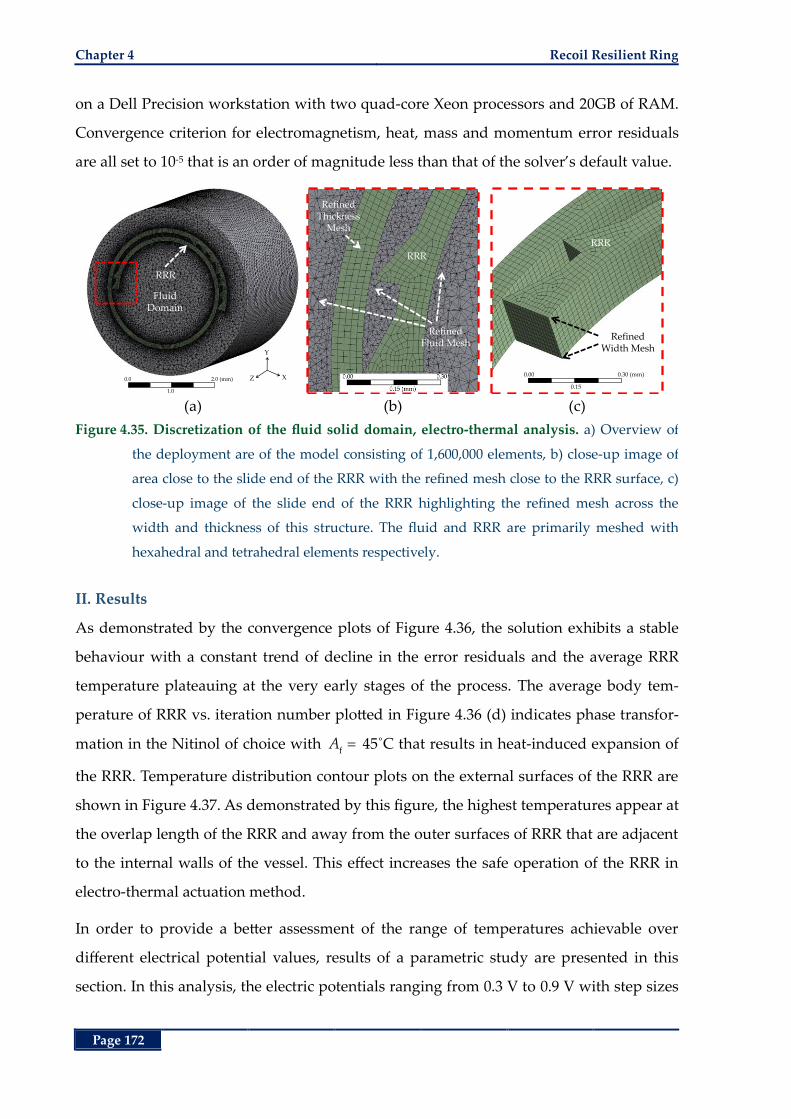
Chapter 4 Recoil Resilient Ring
Page 172
on a Dell Precision workstation with two quad-core Xeon processors and 20GB of RAM.
Convergence criterion for electromagnetism, heat, mass and momentum error residuals
are all set to 10-5 that is an order of magnitude less than that of the solver’s default value.
(a) (b) (c)
Figure 4.35. Discretization of the fluid solid domain, electro-thermal analysis. a) Overview of
the deployment are of the model consisting of 1,600,000 elements, b) close-up image of
area close to the slide end of the RRR with the refined mesh close to the RRR surface, c)
close-up image of the slide end of the RRR highlighting the refined mesh across the
width and thickness of this structure. The fluid and RRR are primarily meshed with
hexahedral and tetrahedral elements respectively.
II. Results
As demonstrated by the convergence plots of Figure 4.36, the solution exhibits a stable
behaviour with a constant trend of decline in the error residuals and the average RRR
temperature plateauing at the very early stages of the process. The average body tem-
perature of RRR vs. iteration number plotted in Figure 4.36 (d) indicates phase transfor-
mation in the Nitinol of choice with f
A 45˚C that results in heat-induced expansion of
the RRR. Temperature distribution contour plots on the external surfaces of the RRR are
shown in Figure 4.37. As demonstrated by this figure, the highest temperatures appear at
the overlap length of the RRR and away from the outer surfaces of RRR that are adjacent
to the internal walls of the vessel. This effect increases the safe operation of the RRR in
electro-thermal actuation method.
In order to provide a better assessment of the range of temperatures achievable over
different electrical potential values, results of a parametric study are presented in this
section. In this analysis, the electric potentials ranging from 0.3 V to 0.9 V with step sizes
Y
XZ
FluidDomain
RRR
0.0
1.0
2.0 (mm)
Refined Fluid Mesh
RRR
Refined Thickness
Mesh
Refined Width Mesh
RRR
0.00
0.15
0.30 (mm)
Electro-Thermal Actuation Chapter 4
Page 173
of 0.02 V are applied across the RRR while the highest, lowest and average body temper-
atures in the RRR are reported, Figure 4.38. The average temperature values are present-
ed in comparison with the results from the analytical study, Figure 4.38 (b).
(a) (b)
(c) (d)
Figure 4.36. Convergence plots of electro-thermal analysis. a) Mass and momentum, b) energy
and, c) electromagnetism residuals convergence to the target value of 10-5, d) RRR aver-
age body temperature through simulation iterations, it levels out at early stages of the
simulation demonstrating stability of the results.
Close correspondence of the average RRR body temperatures between the analytical and
numerical results clearly demonstrate the efficacy of the analytical approach to capture
the overall performance of the RRR. Despite the increasing trend of difference between
the localized highest and lowest temperatures at higher electrical potential values, the
average body temperature results indicate the spatially uniform distribution of heat in
the RRR structure that ensures reaching targeted final transformation temperatures. The
localized temperature differences may be associated with the different local values of
Nusselt number as a result of different flow patterns around the RRR’s body. The slightly
lower average temperatures of RRR from the numerical results in comparison with the
1.E-09
1.E-08
1.E-07
1.E-06
1.E-05
1.E-04
1.E-03
1.E-02
1.E-01
1.E+00
0 5 10 15 20 25 30 35 40
Res
idu
al
Iteration
Mass and Momentum Convergence
RMS P-Mass RMS U-Mom
RMS V-Mom RMS W-Mom
1.E-10
1.E-09
1.E-08
1.E-07
1.E-06
1.E-05
1.E-04
1.E-03
1.E-02
1.E-01
1.E+00
0 5 10 15 20 25 30 35 40
Res
idu
al
Iteration
Heat Transfer Convergence
RMS H-Energy
RMS T-Energy
1.E-08
1.E-07
1.E-06
1.E-05
1.E-04
1.E-03
1.E-02
1.E-01
1.E+00
0 5 10 15 20 25 30 35 40
Res
idu
al
Iteration
Electromagnetism Convergence
RMS E-Pot
45
0
20
40
60
80
100
120
140
160
0 5 10 15 20 25 30 35 40
Tem
per
atu
re (
˚C)
Iteration
Average RRR Temperature Convergence
RRR Avg. Body Temp
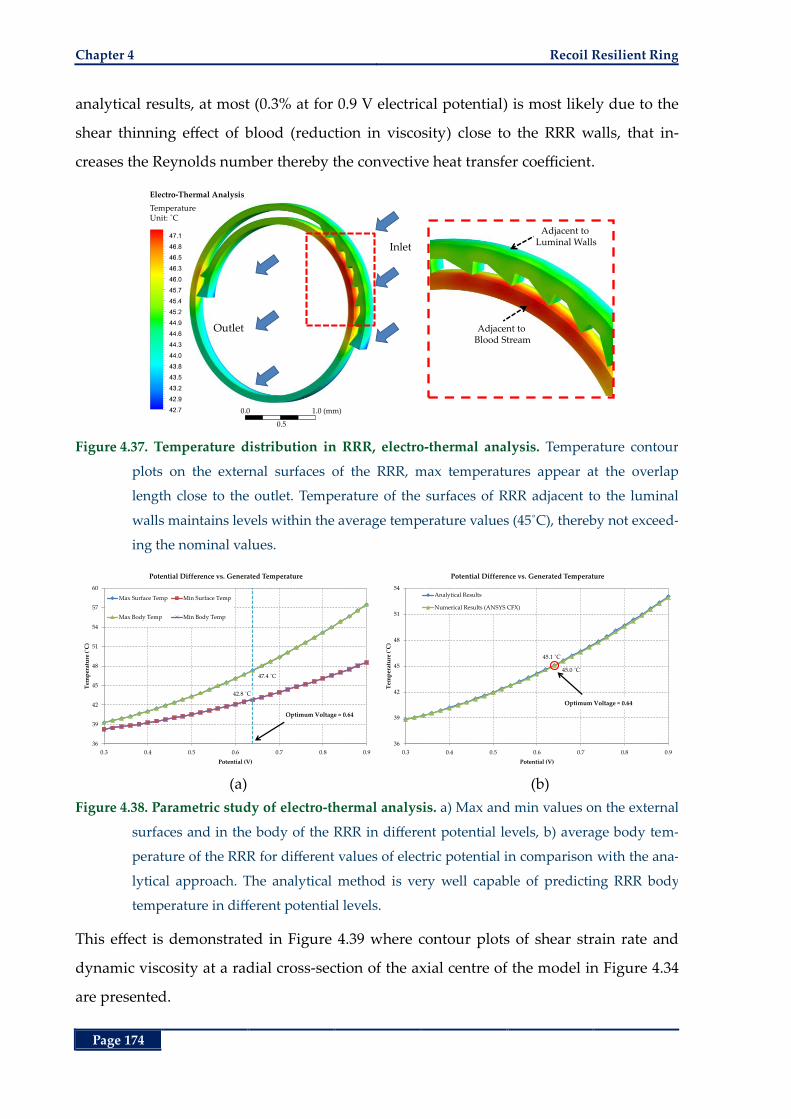
Chapter 4 Recoil Resilient Ring
Page 174
analytical results, at most (0.3% at for 0.9 V electrical potential) is most likely due to the
shear thinning effect of blood (reduction in viscosity) close to the RRR walls, that in-
creases the Reynolds number thereby the convective heat transfer coefficient.
Figure 4.37. Temperature distribution in RRR, electro-thermal analysis. Temperature contour
plots on the external surfaces of the RRR, max temperatures appear at the overlap
length close to the outlet. Temperature of the surfaces of RRR adjacent to the luminal
walls maintains levels within the average temperature values (45˚C), thereby not exceed-
ing the nominal values.
(a) (b)
Figure 4.38. Parametric study of electro-thermal analysis. a) Max and min values on the external
surfaces and in the body of the RRR in different potential levels, b) average body tem-
perature of the RRR for different values of electric potential in comparison with the ana-
lytical approach. The analytical method is very well capable of predicting RRR body
temperature in different potential levels.
This effect is demonstrated in Figure 4.39 where contour plots of shear strain rate and
dynamic viscosity at a radial cross-section of the axial centre of the model in Figure 4.34
are presented.
Inlet
Outlet
Electro-Thermal Analysis
TemperatureUnit: ˚C
0.0
0.5
1.0 (mm)
Adjacent to Luminal Walls
Adjacent to Blood Stream
47.4 ˚C
42.8 ˚C
36
39
42
45
48
51
54
57
60
0.3 0.4 0.5 0.6 0.7 0.8 0.9
Tem
per
atu
re (
˚C)
Potential (V)
Potential Difference vs. Generated Temperature
Max Surface Temp Min Surface Temp
Max Body Temp Min Body Temp
Optimum Voltage ≈ 0.64
45.1 ˚C
45.0 ˚C
36
39
42
45
48
51
54
0.3 0.4 0.5 0.6 0.7 0.8 0.9
Tem
per
atu
re (
˚C)
Potential (V)
Potential Difference vs. Generated Temperature
Analytical Results
Numerical Results (ANSYS CFX)
Optimum Voltage ≈ 0.64
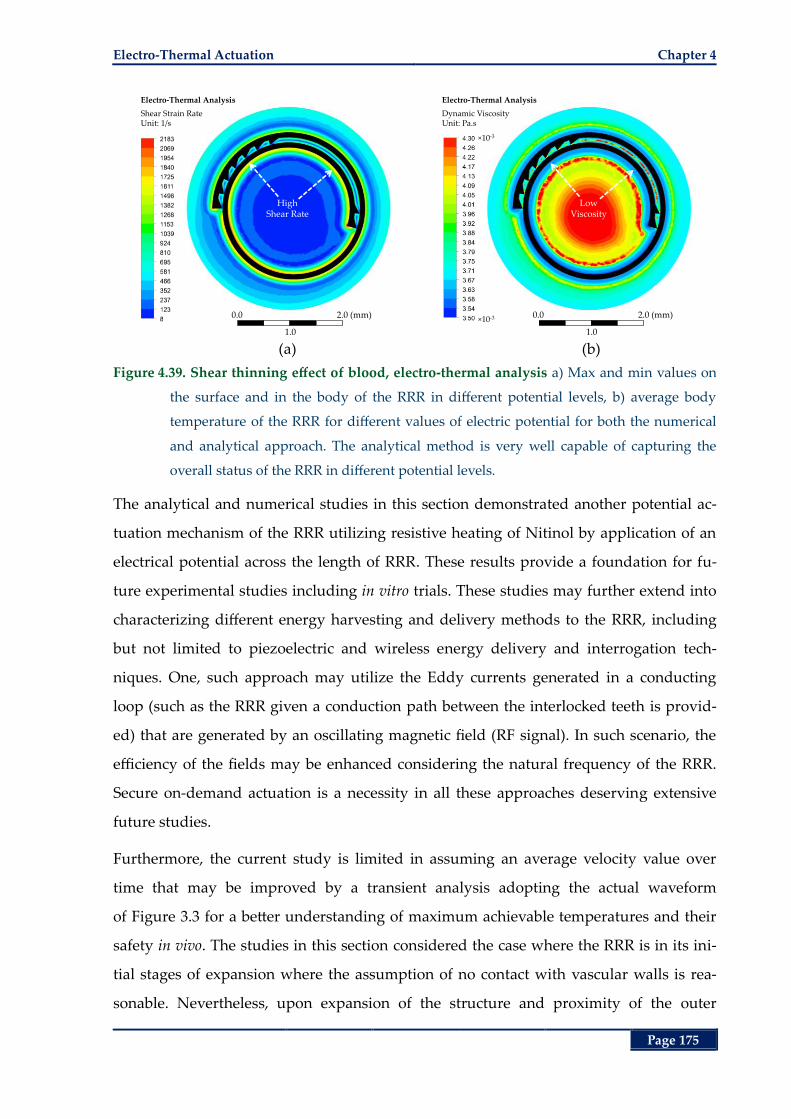
Electro-Thermal Actuation Chapter 4
Page 175
(a) (b)
Figure 4.39. Shear thinning effect of blood, electro-thermal analysis a) Max and min values on
the surface and in the body of the RRR in different potential levels, b) average body
temperature of the RRR for different values of electric potential for both the numerical
and analytical approach. The analytical method is very well capable of capturing the
overall status of the RRR in different potential levels.
The analytical and numerical studies in this section demonstrated another potential ac-
tuation mechanism of the RRR utilizing resistive heating of Nitinol by application of an
electrical potential across the length of RRR. These results provide a foundation for fu-
ture experimental studies including in vitro trials. These studies may further extend into
characterizing different energy harvesting and delivery methods to the RRR, including
but not limited to piezoelectric and wireless energy delivery and interrogation tech-
niques. One, such approach may utilize the Eddy currents generated in a conducting
loop (such as the RRR given a conduction path between the interlocked teeth is provid-
ed) that are generated by an oscillating magnetic field (RF signal). In such scenario, the
efficiency of the fields may be enhanced considering the natural frequency of the RRR.
Secure on-demand actuation is a necessity in all these approaches deserving extensive
future studies.
Furthermore, the current study is limited in assuming an average velocity value over
time that may be improved by a transient analysis adopting the actual waveform
of Figure 3.3 for a better understanding of maximum achievable temperatures and their
safety in vivo. The studies in this section considered the case where the RRR is in its ini-
tial stages of expansion where the assumption of no contact with vascular walls is rea-
sonable. Nevertheless, upon expansion of the structure and proximity of the outer
High Shear Rate
Electro-Thermal Analysis
Shear Strain RateUnit: 1/s
0.0
1.0
2.0 (mm)
×10-3
×10-3
Low Viscosity
Electro-Thermal Analysis
Dynamic ViscosityUnit: Pa.s
0.0
1.0
2.0 (mm)
Chapter 4 Recoil Resilient Ring
Page 176
surfaces of the RRR to the luminal walls, both the flow pattern as well as heat conduction
parameters may undergo dramatic changes. Where the RRR is in contact with the vascu-
lar walls, its outer surfaces will no longer be exposed to the blood stream and heat trans-
fer from these surfaces becomes primarily through conduction into the adjacent vascular
tissue. Inclusion of these effects in addition to consideration of different luminal and
RRR dimensional assumptions may be performed in several separate studies.
4.9 Chapter Summary
Following the numerical and experimental studies of Chapter 2 on mechanics of the ex-
pansion of RRR using an angioplasty balloon, alternative expansion mechanisms were
explored in this chapter. Utilizing the shape memory effect of Nitinol that is used in the
fabrication of RRR, the RRR’s thermally trained shape in the fully expanded state, its in-
cremental interlocked expansion mechanism and choosing the transformation tempera-
ture of Nitinol higher than the deployment region’s temperature (body temperature), it
is possible to accommodate controlled, incremental expansions through application of
heat. In this chapter, these possibilities were explored and demonstrated through rigor-
ous theoretical, numerical and experimental studies. To ensure exposure of the mock
vessels used in the in vitro studies to a controlled and safe range of temperature, first
analytical models using the theory of thermal resistance and crossflow over circular
patterns were developed. By extension of these models to the more complex analytical
models of finned surfaces, boundary conditions to supply adequate transformation, thus
actuation, temperature (> 80˚C) to the RRR were calculated, while maintaining tempera-
ture of the deployment mock vessel within the recommended range (< 50˚C). In order to
evaluate the analytical results, further numerical studies were conducted in multiple
steps where each succeeding step validated results of the predecessor while increasing
complexity of the models and decreasing the number of known assumptions. Starting
from a single field static thermal analysis, these studies were then extended to multi-field
analyses including conjugate fluid and heat transfer models.
Close correspondence of the numerical and analytical results, demonstrates the merit of
our theoretical analysis in predicting proper initial conditions and their resultant effects.
Nevertheless, localised changes to the fluid regime and the resultant temperature distri-
Chapter Summary Chapter 4
Page 177
bution, necessitated use of the detailed numerical analysis presented in this chapter to
provide more insight into the mechanics of distribution of temperature in the RRR and
its surrounding components.
Expansion of the RRR in response to the thermal stimuli is then evaluated by in vitro and
free expansion experimental results. The incremental expansion of the RRR by applica-
tion of heat was observed and measured in a free expansion study complimented by the
expansion observations from the in vitro study. Moreover, radial forces exerted by a con-
strained RRR under gradually increasing temperature stimuli are measured in an exper-
imental study demonstrating the capability of RRR to exert high radial forces while
actuating by heat. The resultant radial force vs. temperature trend demonstrated a region
of linear relation between these two parameters, promising a controlled alternative ex-
pansion mechanism. That is suggested due to the simplicity and predictability of the
force vs. temperature response curve in this linear region.
Finally, using the analytical and numerical foundation from the first sections, a second
alternative actuation mechanism utilizing electrical potential is proposed and examined
through theoretical and numerical studies. In very good agreement with the analytical
results, our numerical results indicated efficacy of a 0.64-V electrical potential, in order to
induce adequate temperature increase in the body of an RRR with a transformation tem-
perature f
45A ˚C to actuate the RRR while it is subject to in vivo thermo and hemody-
namic conditions.
In the next chapter, a summary of all tasks, contributions and conclusions is presented.
Moreover, recommendations for future continuation of this work are given.

Chapter 4 Recoil Resilient Ring
Page 178
This page is left blank intentionally
Page 179
Chapter 5. Conclusion and Future Directions
Conclusion and Future Directions
he multidisciplinary journey of the present research pro-
ject is summarised in this chapter. It draws a summary
of the conducted tasks, contributions and conclusions
from the work carried out in this research. Furthermore, recom-
mendations for future directions and extension of the proposed
luminal structure are given. In the end some concluding remarks
are outlined.
T
Chapter 5
Chapter 5 Conclusion and Future Directions
Page 180
5.1 Introduction
Management and treatment of cardiovascular disease (CVD), particularly atherosclerosis
as its primary cause, consists of a number of surgical and non-surgical approaches
among which balloon angioplasty and stenting are the most common. Short and long-
term beneficial results of stents to regain normal blood flow in occluded vessels rendered
them as the frontiers of intravascular devices these days. Meeting general biological re-
quirements such as biocompatibility and the more specific and often self-competing
stenting imperatives such as high radial strength, low elastic recoil, conformity, tracka-
bility and radiopacity led to the current overwhelming number of different stent designs
and materials in the market. Despite the promising acute luminal gain after deployment
of stents, complications such as in-stent thrombosis (formation of blood clot) and neoin-
timal hyperplasia leading to restenosis (renarrowing) of the treated lesions limit their
long-term benefits.
The two most prevalent stenting complications, including restenosis and thrombosis,
stem from a number of pre, during and post-interventional conditions. Among these, in-
travascular trauma during and after stent deployment in addition to the hemodynamic
changes after stent deployment play unequivocal roles in occurrence and further devel-
opment of restenosis and thrombosis. Stent over-expansion techniques compensating for
the inherent elastic recoil of stents during deployment or use of self-expanding (SE)
stents, that are in fact ever-expanding stents, are attributed with negative effects on in-
creasing intravascular trauma, more specifically in complex and hardened lesions. Cur-
rent pharmacological approaches to inhibit body’s proliferative response, thus
restenosis, through systemic or local administration of drugs still overlook the design
and mechanical shortcomings of the stenting procedure. Moreover, the often contradic-
tory imperatives of stenting such as easy conformity, easy expansion and on the other
hand, high radial strength and low elastic recoil call for a new stent design.
As a result, to address the issue of recoil and extend capability of current stents to con-
trolled and incremental expansion steps with alternative expansion mechanisms to the
state-of-the-art balloon expansion, in the current work a novel recoil resilient stent is
proposed and developed. Design, development and evaluation of the proposed structure
Contributions and Conclusions Chapter 5
Page 181
are extensively elaborated in a multidisciplinary project incorporating tasks, contribu-
tions and conclusions as outlined in the following section.
5.2 Contributions and Conclusions
In Chapter 1 after an introduction on atherosclerosis as the primary cause of CVD, its oc-
currence, development and risk factors were presented in Section 1.2. Then, current
treatment options to control and manage luminal occlusions including non-surgical and
surgical approaches were discussed and compared in more detail in Sections 1.3 and 1.4.
Among the surgical interventional methods and due to its current success, and signifi-
cance to the current work, a comprehensive review of current stenting technology in-
cluding its required characteristics and current stent design pros and cons was then
given in Section 1.5. In this section, the currently overcrowded market of stents was clas-
sified based on: a) materials and expansion mechanism, b) primary material form such as
wires, sheets or tubes, c) fabrication methods that are highly reliant on the primary mate-
rial form, such as weaving, braiding and cutting methods such as laser, water jet and
µEDM, d) design and geometrical features as one of the most important features affect-
ing overall performance of stents, and e) some other incremental attributes such as coat-
ings, surface preparation and radiopacity.
In this section, stent design objectives such as high radial strength and low elastic recoil
in addition to the opposing imperatives such as high axial flexibility, low pressure ex-
pandability and conformity in tortuous paths were iterated, after which the challenge in
optimal stent design was recognized. As concluded by this review, despite the numerous
attempts and proven stent improvements over the years, thrombosis and restenosis yet
remain the most important post interventional complications that are often preceded by
an intravascular trauma. Endangering the long-term luminal patency after stenting, ex-
aggerated healing response of the smooth muscle cells to this trauma leads to partial or
even total re-occlusion of a treated lesion (restenosis). Induced trauma as a result of high
balloon pressure and over-expansion of stents during or after deployment is in fact a
natural consequence of current stents limitation to satisfy their self-competing objectives.
A plastically deformable material that is also required to exhibit high elastic strength,
inevitably exhibits a linear portion of stress-strain response that is natural to the majority
Chapter 5 Conclusion and Future Directions
Page 182
of alloys used in current stents such as stainless steel. Consequently, to compensate for
the radial loss due to this linear elastic recoil of the material, high-pressure over-
expansion techniques are often adopted by clinicians, which lead to increased trauma of
the vessel during deployment. On the other hand, the chronic outward radial force (albe-
it low) exerted by the ever-expanding SE stents was shown to potentially aggravate vas-
cular trauma. It was then concluded that the current systemic, and localized drug
administration, despite their partial success in controlling an emphasised inflammatory
response from the body, still overlook the mechanical aspect of the recoil-trauma-
restenosis trifecta. As a result, a new stent design paradigm targeting the problem of re-
coil was necessitated at the end of Chapter 1.
In Chapter 2 after highlighting the two most important complications of stenting, reste-
nosis and recoil and identifying the current stent design gaps, design and development
of a novel recoil resilient luminal support for stenting applications was discussed. Devel-
opment of the proposed structure called recoil resilient ring (RRR) was carried out
through multistep numerical analysis, fabrication and mechanical evaluations. The pro-
posed structure aims to minimize the need for high-pressure over-expansion that can in-
duce intra-luminal trauma and excess growth of vascular tissue causing later restenosis.
The RRR is an open ring with overlapping ends and asymmetrical sawtooth structures
from the two ends that are intermeshed. While radially expanded, these teeth can slide
on top of each other, but interlock step-by-step so to keep the final expanded state
against compressional forces that normally cause recoil.
Compatibility of the proposed RRR with current balloon expansion mechanics was first
investigated via finite element modelling (FEM) of a 3D model in an explicit dynamic
simulation framework in Section 2.3. Use of such framework was warranted by the com-
plex geometry of 3D model in addition to the transient nature of the interlocking mecha-
nism that introduced large deformations and abrupt contact changes during expansion.
The limited free expansion results from this analysis showed efficacy of pressure levels
up to 100 KPa to induce, open ring expansion, tooth traversal and interlock without
compromising the structural integrity of the RRR. Such pressured levels, are significantly
lower than current in vivo pressure levels (up to 1 MPa). Radial strength of the RRR in
comparison with a typical balloon-expandable (BE) stent was then studies in a static
Contributions and Conclusions Chapter 5
Page 183
structural analysis utilizing FEM. Results from this study indicated superior radial
strength of the RRR both in withstanding deformations against compressive forces and
in recovery of its initial diameter after removal of these forces compared to the BE stent.
Axial strength of the RRR and proposals for improvements were elaborated using FEM
at the end of this section.
Following the successful initial numerical analysis results, fabrication of the RRR by line-
ar pattering of Nitinol sheets of 200-µm thickness utilizing µEDM technology was out-
lined in Section 2.4. The simple planar design and subsequent shaping and training
methods used, facilitates batch processing and mass production of the structures. The
fabricated RRR was then subjected to experimental in vitro expansion and stiffness tests.
The free radial stiffness test measurements indicate 2.7× higher radial rigidity of the RRR
compared to that of a two-column stainless steel commercial BE stent. Considering the
lower modulus of elasticity of Nitinol in its martensitic form compared to stainless steel,
and the comparable thickness and width of RRR and the commercial stent, the higher
radial strength of RRR is delivered by the proposed interlocking mechanism. The in vitro
radial stiffness tests also show comparable elastic recovery of the RRR and the commer-
cial stent. The proposed RRR is balloon expandable in vitro by 5‒7 atm pressure, well in
range of recommended in vivo pressures. The change in mean cross-sectional area after
balloon deflation were shown to be < 3% for the RRR compared to the reported mean
value of 13‒30% associated with commercial stents. Considering these specifications and
the merit of RRR, a series of this structure can potentially be welded by a single point in-
side a stent mesh, providing further scaffolding to specific areas and to the stent as a
whole while not sacrificing expandability or longitudinal flexibility of the stent mesh.
Considering these benefits compared to the added local thickness inside a stent due to
the RRR’s profile (this effect is investigated in Chapter 3), the proposed structures brings
an excellent trade-off between flexibility, deliverability, and resilience.
After deployment of stents, apart from their mechanical effect to their surrounding tis-
sue, they introduce changes to the fluid regime. As outlined in Section 1.5, these changes
can potentially result in detrimental biological effects such as re-accumulation of fatty
deposits leading to restenosis. In particular, numerous clinical and numerical results
show a strong relation between increased risk of restenosis and increased extension of
Chapter 5 Conclusion and Future Directions
Page 184
endothelial area that is subject to low wall shear stress (LWSS), less than 0.5 Pa, after de-
ployment of stents. In Chapter 3, investigation of such effects is carried out through ex-
tensive 3D computational fluid dynamic (CFD) studies. In these comparative studies
three different luminal supports including a nominal balloon-expandable (BE) stent, a
standalone RRR, and an RRR-integrated BE stent are subject to physiological pulsatile
flows in 3D CFD frameworks.
Hemodynamic indicators such as temporal and spatial distribution of LWSS in the de-
ployment area and the entire fluid domain, fluid drag force experienced by the scaffolds
and blood supply changes to the main and side branches, in branched fluid domains,
were extensively investigated. Results of the transient studies in unbranched domains in
Section 3.4 (Part 1) indicate hemodynamic superiority of the standalone RRR exhibiting
the least ratio of area subject to LWSS. Despite the slight differences between the LWSS
ratios of the standalone stent and the RRR-integrated stent during the first half of the
cardiac cycle, these differences settled to almost zero for the next half resulting in close
temporal average values of the LWSS in the deployment areas and identical values for
the entire fluid domains of these two scaffolds. High ratio of the withholding forces of all
the three scaffolds to the fluid drag forces demonstrated efficacy of the former to keep
the supports in place even for the highest values of the latter in a cardiac cycle.
In results of Part 2 of Section 3.4, the standalone RRR remained as the best of the three
scaffolds in a branched fluid domain resulting in the least deviation of outlet flow rates
from a healthy vessel. Moreover, the standalone RRR was associated with the lowest ra-
tio of luminal areas subject to LWSS compared to the other two supports. The temporal
trends of LWSS ratio for the standalone stent and the RRR-integrated stent were closely
intertwined through the entire cardiac cycle resulting in a difference as low as 1% on av-
erage in the deployment area and identical LWSS ratio values for the entire fluid do-
mains. Deviation of output flow rates in the side and main branches of the standalone
stent and RRR-integrated stent domains from corresponding branches of a healthy do-
main, followed similar trends. These results demonstrated the efficacy of the RRR-
integrated stent to deliver a hemodynamic response at least as good as the current state-
of-the-art stents considering the superior resilience benefits of the former over the later.
Contributions and Conclusions Chapter 5
Page 185
Sensitivity of the results to the dimensional assumptions of the RRR-integrated stent and
the branched fluid domains was then studied for different reference luminal diameters
and different overlap lengths from the two ends of the RRR. These results were in good
agreement with the results of the branched fluid domains demonstrating a close corre-
spondence between hemodynamic indicators of the RRR-integrated and the standalone
stents. Moreover, RRR-integrated stents deployed in smaller arteries and with longer
overlap lengths demonstrated less area subject to LWSS compared to similar cases of
standalone stent deployment. Differences in the side and main branch flow supplies
were insignificant for the high inlet flow velocities while relatively increasing for lower
inlet velocity magnitudes. Temporal average values of the aforementioned hemodynamic
performance indicators show very little dependence of our results on the dimensional
assumptions of the fluid domain showing the merit of both the standalone RRR and the
RRR-integrated stent as viable biomedical implants for luminal constrictions.
The proposed RRR in the current work is made of Nitinol with a transformation temper-
ature ( fA ) well higher (70‒80˚C) than human body temperature (37˚C). This ensures
martensite mode of operation of the RRR after and during deployment with an angio-
plasty balloon. In martensite phase, Nitinol exhibits considerably lower stiffness com-
pared to other materials used for stent fabrication including primarily stainless steel and
austenite Nitinol. This characteristic carries benefits such as flexibility, conformity and
capability to undergo large plastic deformations that are considered as desirable attrib-
utes during deployment as outlined in Chapter 1. High radial strength of the RRR, on the
other hand, is provided by its interlock mechanism rendering RRR capable of meeting
the opposing stenting objectives simultaneously as demonstrated in Chapter 2. Moreo-
ver, thermal treatment of the RRR in the fully expanded state, as discussed in Chapter 2,
its incremental interlock mechanism and the shape memory properties of Nitinol while
undergoing phase transformation from martensite to austenite, propose new potentials
for alternative controlled and incremental actuation and expansion mechanisms to the
usual balloon expansion.
In Chapter 4, these alternative expansion potentials, by application of direct or electrical-
ly-induced heat were explored and demonstrated through rigorous theoretical, numeri-
cal and experimental studies. As a precursor to the in vitro experimental results, and to
Chapter 5 Conclusion and Future Directions
Page 186
ensure exposure of the mock vessel, which is used for deployment of RRR in the in vitro
studies, to a controlled and safe range of temperature, first analytical models using the
theory of thermal resistance and crossflow over cylindrical patterns were developed. By
extension of these models to the more complex analytical models of finned surfaces,
boundary conditions to supply adequate transformation, thus actuation, temperature (>
80˚C) to the RRR were calculated, while maintaining temperature of the encompassing
mock vessel within the recommended range (< 50˚C). Validation of the analytical results
was conducted by extensive numerical analyses. Starting from a single field static ther-
mal analysis, these studies were then extended to multi-field analyses conjugating fluid
and heat transfer models. Close correspondence of the theoretical and numerical results
demonstrated the merit of our theoretical analysis to predict adequate initial conditions
for thermal actuation of the RRR and their resultant effects on the domain of the model,
most importantly the mock vessel.
In Section 4.7 actuation of the RRR under heat stimuli was experimentally evaluated by
in vitro expansion, free expansion and constrained actuation studies. First, ability of the
RRR to expand against compressive forces of a mock vessel was demonstrated in the in
vitro expansion study. Next, the incremental expansion of the RRR by direct application
of heat was observed and measured in the free expansion experimental study. In the
constrained actuation study, capability of a crimped RRR to exert high radial forces
while actuated by heat was demonstrated. The linear trend in the resultant radial force
vs. temperature response graph suggested an alternative expansion mechanism by ap-
plication of heat. That is suggested due to the simplicity and predictability of the tem-
perate vs. radial force response curve in this linear region.
In the end and to demonstrate the potentials for extension of current project, using the
results and analytical foundation from the previous section, a second alternative actua-
tion mechanism utilizing electrical currents is proposed and examined through multi-
field theoretical and numerical studies. In very good agreement with the analytical re-
sults, our numerical results indicated adequacy of a 0.64 V electrical potential, in order to
induce thermal actuation of an RRR with a transformation temperature f
45A ˚C that is
subject to physiological thermo and hemodynamic conditions.
Recommendations for Future Work Chapter 5
Page 187
Results and observations from the current work led to the identification of other im-
portant areas for further improvement of a recoil resilient stent with alternative actuation
capabilities.
5.3 Recommendations for Future Work
Attractive material properties of martensite Nitinol such as conformity and biocompati-
bility and its potential for use as an active material for actuation were the primary driv-
ers for use of this alloy in fabrication of the RRR as outlined in Chapter 2. Nevertheless,
other active materials such as piezoelectric polymers may also be considered for fabrica-
tion of the RRR. Selection and application of such new materials calls for several studies
that may be carried out within the proposed framework in this work.
In Chapter 3 a realistic physiological waveform was adopted for inlet velocities to effec-
tively capture hemodynamic changes over time. Nevertheless, due to the transient nature
of blood pressure and velocity depending on factors such as the location (vessel) of
measurements, conditions such as at resting or exercising, and pre-existing conditions
such as high or low blood pressure, other velocity profiles may be considered. Results
from such studies can provide further insight into the effect of these conditions in the
success rate of a luminal support after deployment in different groups of patients.
The analytical and numerical framework in Chapter 4 demonstrated actuation capabili-
ties of the proposed RRR in response to non-mechanical stimuli such as heat and electric-
ity. Results from these studies provide a foundation for further future experimental ex
vitro and in vitro studies. One such study may span into exploration and characterization
of efficient energy harvesting and delivery methods to the RRR. Examples of such meth-
ods include but not limited to piezoelectric and wireless energy delivery and interroga-
tion techniques. In a collaborative attempt with author of the present thesis, a magneto-
electric approach utilizing direct piezoelectric effect is currently under investigation
[252]. A potentially viable wireless approach may utilize Eddy currents generated in a
conducting loop, such as the RRR, in response to an oscillating magnetic field. Efficacy of
thermal excitation in response to a higher electromotive force may be studied consider-
ing the natural frequencies of the RRR.
Chapter 5 Conclusion and Future Directions
Page 188
Another possibility is utilization of surface acoustic wave (SAW) technology, to harvest
energy from mechanical oscillation of thin piezoelectric layers in response to a radio fre-
quency (RF) signal. This approach has been successfully implemented for actuation of
micropumps [253], and its further application to the current work may reap beneficial
results.
Irrespective of the actuation mechanism, secure and on-demand actuation is of outmost
importance calling for further extensive studies. In this respect, control and study of the
unwanted environment causes such as exposure to the strong magnetic field of a mag-
netic resonance imaging (MRI) scanner is warranted. In the end, like any other biomedi-
cal implant, the next major steps towards practical use of the proposed structure include
detailed and long-term animal, and subsequently, human clinical studies.
5.4 Closing Comments
In this thesis a new luminal support for stenting applications is proposed. The new de-
vice called the recoil resilient ring (RRR) is targeted to address the important issue of re-
coil and its detrimental consequences to the efficacy of luminal supports. In this thesis,
superior mechanical and hemodynamic performance of the fabricated RRR and its com-
patibility with the state-of-the-art stenting standards are demonstrated through extensive
numerical and experimental studies. Moreover, utilizing the shape memory effect of ac-
tive materials used in the RRR, alternative actuation methods to the current balloon ex-
pansion is explored and demonstrated. Carrying out this forefront innovative research,
the present thesis facilitated the addition of new contributions to a spectrum of fields in-
corporating design, analysis and development of biomedical devices.
Page 189
Bibliography
Bibliography
[1] A. S. Go, D. Mozaffarian, V. L. Roger, E. J. Benjamin, J. D. Berry, W. B. Borden, et al.,
"Heart disease and stroke statistics—2013 update: A report from the American Heart
Association," Circulation, vol. 127, pp. e6-e245, 2013.
[2] World Health Organization, Global Atlas on Cardiovascular Disease Prevention and Control.
Geneva 2011.
[3] R. E. Klabunde, "Cellular structure and function," in Cardiovascular Physiology Concepts:
Wolters Kluwer Health, 2011, pp. 49-55.
[4] J. A. Berliner, M. Navab, A. M. Fogelman, J. S. Frank, L. L. Demer, P. A. Edwards, et al.,
"Atherosclerosis: Basic mechanisms oxidation, inflammation, and genetics," Circulation,
vol. 91, pp. 2488-2496, 1995.
[5] J. Plutzky and P. Libby, "Pathophysiology of atherosclerotic heart disease," in
Atherosclerosis and Heart Disease, A. M. Tonkin, Ed. UK: Taylor & Francis, 2003, pp. 1-13.
[6] G. K. Hansson, "Inflammation, atherosclerosis, and coronary artery disease," New
England Journal of Medicine, vol. 352, pp. 1685-1695, 2005.
[7] V. Karagkiozaki, "Nanomedicine highlights in atherosclerosis," Journal of Nanoparticle
Research, vol. 15, pp. 1-17, 2013.
[8] S. E. Anderson, R. Lahm, and P. A. Laizzo, "The coronary vascular system and
associated medical devices," in Handbook of Cardiac Anatomy, Physiology, and Devices, P.
A. Iaizzo, Ed. New York, USA: Springer, 2010, pp. 109-121.
[9] M. Lüdinghausen, "The lengths and diameters of major coronary arteries," in The
Clinical Anatomy of Coronary Arteries, Berlin Heidelberg: Springer 2002, p. 32.
[10] Wikipedia. (Sep 2013, Nov 2013). The Structure of an Artery Wall. Available: http://en.w-
ikipedia.org/wiki/Tunica_intima
[11] R. J. Esper, R. A. Nordaby, J. O. Vilariño, A. Paragano, J. L. Cacharrón, and R. A.
Machado, "Endothelial dysfunction: A comprehensive appraisal," Cardiovasc Diabetol,
vol. 5, pp. 4-22, 2006.
[12] M. De Beule, "Design van stents met eindige elementen, Finite element stent design,"
Ph.D. dissertation, Ingenieurswetenschappen: Biomedische Ingenieurstechnieken,
Universitet Gent, 2008.
Bibliography
Page 190
[13] G. M. Chisolm and D. Steinberg, "The oxidative modification hypothesis of
atherogenesis: An overview," Free Radical Biology and Medicine, vol. 28, pp. 1815-1826,
2000.
[14] A. Tedgui and Z. Mallat, "Cytokines in atherosclerosis: Pathogenic and regulatory
pathways," Physiological Reviews, vol. 86, pp. 515-581, 2006.
[15] S. Glagov, E. Weisenberg, C. K. Zarins, R. Stankunavicius, and G. J. Kolettis,
"Compensatory enlargement of human atherosclerotic coronary arteries," New England
Journal of Medicine, vol. 316, pp. 1371-1375, 1987.
[16] K. S. Woo and D. Magliano, "Novel atherosclerosis risk factors and management," in
Atherosclerosis and Heart Disease, A. Tonkin, Ed. UK: Taylor & Francis, 2003, pp. 41-58.
[17] S. E. Humphries and L. Morgan, "Genetic risk factors for stroke and carotid
atherosclerosis: Insights into pathophysiology from candidate gene approaches," The
Lancet Neurology, vol. 3, pp. 227-235, 2004.
[18] J. Frohlich, M. Dobiasova, S. Lear, and K. W. J. Lee, "The role of risk factors in the
development of atherosclerosis," Critical Reviews in Clinical Laboratory Sciences, vol. 38,
pp. 401-440, 2001.
[19] R. Lewis and D. Huang. (2009, Nov 2013). US Against Athero-Fighting Atherosclerosis with
Knowledge. Available: http://multivu.prnewswire.com/mnr/uaa/37598/
[20] M. A. Pfeffer, "Angiotensin-axis inhibition," in Textbook of Interventional Cardiology, E. J.
Topol, Ed. USA: Saunders/Elsevier, 2008, pp. 203-221.
[21] V. Rajagopal, "Other adjunctive drugs for coronary intervention: B-blockers and
calcium channel blockers," in Textbook of Interventional Cardiology, E. J. Topol, Ed. USA:
Saunders/Elsevier, 2008, pp. 241-251.
[22] D. P. Chew, "Anticoagulation in percutaneous coronary intervention," in Textbook of
Interventional Cardiology, E. J. Topol, Ed. USA: Saunders/Elsevier, 2008, pp. 165-181.
[23] K. K. Ray and C. P. Cannon, "Lipid lowering in coronary artery disease," in Textbook of
Interventional Cardiology, E. J. Topol, Ed. USA: Saunders/Elsevier, 2008, pp. 183-201.
[24] A. Hirohata, K. Yamamoto, T. Miyoshi, K. Hatanaka, S. Hirohata, H. Yamawaki, et al.,
"Four-year clinical outcomes of the olivus-ex (impact of olmesartan on progression of
coronary atherosclerosis: Evaluation by intravascular ultrasound) extension trial,"
Atherosclerosis, vol. 220, pp. 134-138, 2012.
[25] S. Peters, "Inhibition of atherosclerosis by angiotensin II type 1 receptor antagonists,"
American Journal of Cardiovascular Drugs, pp. 1-4, 2013.
[26] American Heart Association, Answers by Heart, What Are Anticoagulants and
Antiplatelet Agents: Americal Heart Association, 2012.
Bibliography
Page 191
[27] WebMD. (2010, June 2013). Coronary Artery Bypass Surgery for Coronary Artery Disease.
Available: http://www.webmd.com/heart-disease/coronary-artery-bypass-surgery-for-
coronary-artery-disease
[28] C. J. Mullany, "Coronary artery bypass surgery," Circulation, vol. 107, pp. e21-e22, 2003.
[29] M. Pocar, A. Moneta, D. Passolunghi, A. Di Mauro, A. Bregasi, R. Mattioli, et al.,
"Coronary artery bypass grafting for chronic and acute heart failure," in Coronary Artery
Bypasses, R. T. Hammond and J. B. Alton, Eds. New York: Nova Science Publishers,
2009, pp. 111-122.
[30] M. Itshida, J. Kobayashi, O. Tagusari, K. Bando, K. Niwaya, H. Nakajima, et al.,
"Comparison of off-pump and on-pump coronary artery bypass grafting in midterm
results," The Japanese Journal of Thoracic and Cardiovascular Surgery, vol. 52, pp. 240-246,
2004.
[31] S. Bhimji. (2012, 2013). Heart bypass surgery. Medical Encyclopedia. Available: http://
www.nlm.nih.gov/medlineplus/ency/article/002946.htm
[32] J. E. Thompson, "The evolution of surgery for the treatment and prevention of stroke:
The Willis Lecture," Stroke, vol. 27, pp. 1427-1434, 1996.
[33] D. McCrory, L. Goldstein, G. Samsa, E. Oddone, P. Landsman, W. Moore, et al.,
"Predicting complications of carotid endarterectomy," Stroke, vol. 24, pp. 1285-1291,
1993.
[34] A. Indermuehle, R. Bahl, A. J. Lansky, G. M. Froehlich, G. Knapp, A. Timmis, et al.,
"Drug-eluting balloon angioplasty for in-stent restenosis: A systematic review and
meta-analysis of randomised controlled trials," Heart, vol. 99, pp. 327-333, 2013.
[35] S. G. Ellis, "Drug-eluting and bare metal stents," in Textbook of Interventional Cardiology,
E. J. Topol, Ed. USA: Saunders/Elsevier, 2008, pp. 255-271.
[36] University of Rochester Medical Center. (Nov 2013). Carotid Endarterectomy. Available:
http://www.urmc.rochester.edu/encyclopedia/content.aspx?contenttypeid=92&contenti
d=p08293
[37] A. R. Grüntzig, Å. Senning, and W. E. Siegenthaler, "Nonoperative dilatation of
coronary-artery stenosis: percutaneous transluminal coronary angioplasty," New
England Journal of Medicine, vol. 301, pp. 61-68, 1979.
[38] D. S. Bain, "Percutaneous balloon angioplasty and general coronary intervention," in
Grossman's Cardiac Catheterization, Angiography, and Intervention, D. S. Baim, Ed. USA:
Lippincott Williams & Wilkins, 2006, pp. 433-466.
[39] H. Token. (Nov 2013). Balloon Angioplasty. Available: http://healthtoken.com/balloon-
angioplasty
Bibliography
Page 192
[40] B. N. Potkin, G. Keren, G. S. Mintz, P. C. Douek, A. D. Pichard, L. F. Satler, et al.,
"Arterial responses to balloon coronary angioplasty: An intravascular ultrasound
study," Journal of the American College of Cardiology, vol. 20, pp. 942-951, 1992.
[41] G. W. Stone, "Coronary stenting," in Grossman's Cardiac Catheterization, Angiography and
Intervention, D. S. Baim, Ed. USA: Lippincott Williams & Wilkins, 2006, pp. 492-542.
[42] J. R. Algeria and J. David R. Holmes, "Balloon angioplasty: Is it still a viable
intervention?," in Textbook of Interventional Cardiology, E. J. Topol, Ed. USA:
Saunders/Elsevier, 2008, p. 275.
[43] D. G. Almond, "Coronary stenting I: Intracoronary stents - form, function and future,"
in Practical Interventional Cardiology, E. D. Grech and D. R. Ramsdale, Eds. London, UK:
Martin Dunitz, 2002, pp. 63-76.
[44] J. P. Curtis and J. F. Setaro, "Stenting in coronary angioplasty," in Classic Papers in
Coronary Angioplasty, C. Handler and M. Cleman, Eds. London, UK: Springer, 2006, pp.
115-116.
[45] D. L. Fischman, M. B. Leon, D. S. Baim, R. A. Schatz, M. P. Savage, I. Penn, et al., "A
randomized comparison of coronary-stent placement and balloon angioplasty in the
treatment of coronary artery disease," New England Journal of Medicine, vol. 331, pp. 496-
501, 1994.
[46] A.-M. Belli, "Angioplasty and stenting of the superficial femoral artery and popliteal
artery," in Handbook of Angioplasty and Stenting Procedures, R. A. Morgan and E. Walser,
Eds. London, UK: Springer, 2010, pp. 97-111.
[47] N. A. Hamilton and B. D. Matthews, "Minimal access management of pancreatic
cancer," in Minimally Invasive Cancer Management, F. L. Greene and B. T. Heniford, Eds.
New York: Springer, 2010, pp. 129-144.
[48] A. C. Mehta and A. Dasgupta, "Airway stents," Clinics in Chest Medicine, vol. 20, pp.
139-151, 1999.
[49] WebMD. (2011, Nov 2013). Coronary Stent. Available: http://www.webmd.com/heart-
disease/coronary-stent
[50] P. W. Serruys, P. de Jaegere, F. Kiemeneij, C. Macaya, W. Rutsch, G. Heyndrickx, et al.,
"A comparison of balloon-expandable-stent implantation with balloon angioplasty in
patients with coronary artery disease," New England Journal of Medicine, vol. 331, pp.
489-495, 1994.
[51] D. S. Baim and D. I. Simon, "Complications and the optimal use of adjunctive
pharmacology," in Grossman's Cardiac Catheterization, Angiography and Intervention, D. S.
Baim, Ed. USA: Lippincott Williams & Wilkins, 2006, pp. 36-75.
Bibliography
Page 193
[52] M. G. Gunning, I. L. Williams, D. E. Jewitt, A. M. Shah, R. J. Wainwright, and M. R.
Thomas, "Coronary artery perforation during percutaneous intervention: Incidence and
outcome," Heart, vol. 88, pp. 495-498, 2002.
[53] E. J. Topol, F. Leya, C. A. Pinkerton, P. L. Whitlow, B. Hofling, C. A. Simonton, et al., "A
comparison of directional atherectomy with coronary angioplasty in patients with
coronary artery disease," New England Journal of Medicine, vol. 329, pp. 221-227, 1993.
[54] E. Cheneau, L. Leborgne, G. S. Mintz, J. Kotani, A. D. Pichard, L. F. Satler, et al.,
"Predictors of subacute stent thrombosis: Results of a systematic intravascular
ultrasound study," Circulation, vol. 108, pp. 43-47, 2003.
[55] K. Fujii, S. G. Carlier, G. S. Mintz, Y.-m. Yang, I. Moussa, G. Weisz, et al., "Stent
underexpansion and residual reference segment stenosis are related to stent
thrombosis after sirolimus-eluting stent implantation: An intravascular ultrasound
study," Journal of the American College of Cardiology, vol. 45, pp. 995-998, 2005.
[56] S. Cook, P. Wenaweser, M. Togni, M. Billinger, C. Morger, C. Seiler, et al., "Incomplete
stent apposition and very late stent thrombosis after drug-eluting stent implantation,"
Circulation, vol. 115, pp. 2426-2434, 2007.
[57] C. Rogers and D. S. Bain, "Coronary atherectomy, thrombectomy and embolic
protection," in Grossman's Cardiac Catheterization, Angiography, and Intervention, D. S.
Baim, Ed. USA: Lippincott Williams & Wilkins, 2006, pp. 467-491.
[58] E. Cavusoglu, A. S. Kini, J. D. Marmur, and S. K. Sharma, "Current status of rotational
atherectomy," Catheterization and Cardiovascular Interventions, vol. 62, pp. 485-498, 2004.
[59] D. D. Hansen, D. C. Auth, M. Hall, and J. L. Ritchie, "Rotational endarterectomy in
normal canine coronary arteries: Preliminary report," Journal of the American College of
Cardiology, vol. 11, pp. 1073-1077, 1988.
[60] S. S. Ahn, D. Auth, D. R. Marcus, and W. S. Moore, "Removal of focal atheromatous
lesions by angioscopically guided high-speed rotary atherectomy: Preliminary
experimental observations," Journal of Vascular Surgery, vol. 7, pp. 292-300, 1988.
[61] M. C. Stoner, D. J. Defreitas, S. V. Phade, F. M. Parker, W. M. Bogey, and S. Powell,
"Mid-term results with laser atherectomy in the treatment of infrainguinal occlusive
disease," Journal of Vascular Surgery, vol. 46, pp. 289-295. e1, 2007.
[62] R. T. Strebel, U. Utzinger, M. Peltola, J. Schneider, P. Niederer, and O. Hess, "Excimer
laser spectroscopy: Influence of tissue ablation on vessel wall fluorescence," Journal of
Laser Applications, vol. 10, p. 34, 1998.
[63] J. B. Dahm, J. Ruppert, M. Doerr, N. Bordihn, and W. Maybauer, "Percutaneous laser-
facilitated thrombectomy: An innovative, easily applied, and effective therapeutic
option for recanalization of acute and subacute thrombotic hemodialysis shunt
occlusions," Journal of Endovascular Therapy, vol. 13, pp. 603-608, 2006.
Bibliography
Page 194
[64] G. Borade. (Feb 2013, Nov 2013). Blocked Arteries: Symptoms and Treatment. Available:
http://www.buzzle.com/articles/blocked-arteries-symptoms-and-treatment.html
[65] I. Moussa, C. Di Mario, J. Moses, B. Reimers, L. Di Francesco, G. Martini, et al.,
"Coronary stenting after rotational atherectomy in calcified and complex lesions
angiographic and clinical follow-up results," Circulation, vol. 96, pp. 128-136, 1997.
[66] M. Hoffmann, M. Mintz, S. Gary, M. Kent, M. Kenneth, M. Pichard, et al., "Comparative
early and nine-month results of rotational atherectomy, stents, and the combination of
both for calcified lesions in large coronary arteries," The American Journal of Cardiology,
vol. 81, pp. 552-557, 1998.
[67] Y. Kobayashi, J. De Gregorio, N. Kobayashi, T. Akiyama, B. Reimers, I. Moussa, et al.,
"Lower restenosis rate with stenting following aggressive versus less aggressive
rotational atherectomy," Catheterization and Cardiovascular Interventions, vol. 46, pp. 406-
414, 1999.
[68] M. Buchbinder, R. Fortuna, S. Sharma, T. Bass, R. Kipperman, J. Greenberg, et al.,
"Debulking prior to stenting improves acute outcomes: early results from the SPORT
trial," in Journal of the American College of Cardiology, 2000, p. 8A.
[69] R. Mehran, G. Dangas, A. S. Abizaid, G. S. Mintz, A. J. Lansky, L. F. Satler, et al.,
"Angiographic patterns of in-stent restenosis classification and implications for long-
term outcome," Circulation, vol. 100, pp. 1872-1878, 1999.
[70] S.-G. Lee, C. Lee, S.-S. Cheong, M.-K. Hong, J.-J. Kim, S.-W. Park, et al., "Immediate and
long-term outcomes of rotational atherectomy versus balloon angioplasty alone for
treatment of diffuse in-stent restenosis," The American Journal of Cardiology, vol. 82, pp.
140-143, 1998.
[71] S. K. Sharma, S. Duvvuri, G. Dangas, A. Kini, R. Vidhun, K. Venu, et al., "Rotational
atherectomy for in-stent restenosis: acute and long-term results of the first 100 cases,"
Journal of the American College of Cardiology, vol. 32, pp. 1358-1365, 1998.
[72] J. vom Dahl, P. W. Radke, P. K. Haager, K.-C. Koch, F. Kastrau, T. Reffelmann, et al.,
"Clinical and angiographic predictors of recurrent restenosis after percutaneous
transluminal rotational atherectomy for treatment of diffuse in-stent restenosis," The
American Journal of Cardiology, vol. 83, pp. 862-867, 1999.
[73] P. W. Radke, H. G. Klues, P. K. Haager, R. Hoffmann, F. Kastrau, T. Reffelmann, et al.,
"Mechanisms of acute lumen gain and recurrent restenosis after rotational atherectomy
of diffuse in-stent restenosis: A quantitative angiographic and intravascular ultrasound
study," Journal of the American College of Cardiology, vol. 34, pp. 33-39, 1999.
[74] R. Mehran, G. Dangas, G. S. Mintz, R. Waksman, A. Abizaid, L. F. Satler, et al.,
"Treatment of in-stent restenosis with excimer laser coronary angioplasty versus
rotational atherectomy: Comparative mechanisms and results," Circulation, vol. 101, pp.
2484-2489, 2000.
Bibliography
Page 195
[75] S. L. Goldberg, P. Berger, D. J. Cohen, F. Shawl, M. Buchbinder, R. Fortuna, et al.,
"Rotational atherectomy or balloon angioplasty in the treatment of intra-stent
restenosis: BARASTER Multicenter Registry," Catheterization and Cardiovascular
Interventions, vol. 51, pp. 407-413, 2000.
[76] M. Wholey and E. Finol, "Designing the ideal stent," Endovascular Today, vol. 6, pp. 25-
34, 2007.
[77] D. Stoeckel, C. Bonsignore, and S. Duda, "A survey of stent designs," Minimally Invasive
Therapy & Allied Technologies, vol. 11, pp. 137-147, 2002.
[78] R. A. Schatz, "A view of vascular stents," Circulation, vol. 79, pp. 445-457, 1989.
[79] G. Mani, M. D. Feldman, D. Patel, and C. M. Agrawal, "Coronary stents: A materials
perspective," Biomaterials, vol. 28, pp. 1689-1710, 2007.
[80] C. Lally and D. J. Kelly, "Stents," in Wiley Encyclopedia of Biomedical Engineering, M.
Akay, Ed. Hoboken, New Jersey: John Wiley & Sons, Inc., 2006, pp. 3345-3355.
[81] T. Duerig and M. Wholey, "A comparison of balloon and self-expanding stents,"
Minimally Invasive Therapy & Allied Technologies, vol. 11, pp. 173-178, 2002.
[82] B. O’Brien and W. Carroll, "The evolution of cardiovascular stent materials and
surfaces in response to clinical drivers: A review," Acta Biomaterialia, vol. 5, pp. 945-958,
2009.
[83] H.-M. Hsiao, Y.-H. Chiu, K.-H. Lee, and C.-H. Lin, "Computational modeling of effects
of intravascular stent design on key mechanical and hemodynamic behavior,"
Computer-Aided Design, vol. 44, pp. 757-765, 2012.
[84] K. Jones, B. D. Jensen, and A. Bowden, "Fabrication and testing of planar stent mesh
designs using carbon-infiltrated carbon nanotubes," Journal of Nanotechnology in
Engineering and Medicine, vol. 4, art. no. 020903, 2013.
[85] A. M. Sammel, D. Chen, and N. Jepson, "New generation coronary stent technology-Is
the future biodegradable?," Heart, Lung and Circulation, vol. 22, pp. 495-506, 2013.
[86] P. Erne, M. Schier, and T. J. Resink, "The road to bioabsorbable stents: Reaching clinical
reality?," Cardiovascular and Interventional Radiology, vol. 29, pp. 11-16, 2006.
[87] T. Peng, P. Gibula, K. Yao, and M. F. Goosen, "Role of polymers in improving the
results of stenting in coronary arteries," Biomaterials, vol. 17, pp. 685-694, 1996.
[88] J. A. Ormiston and P. W. Serruys, "Bioabsorbable coronary stents," Circulation:
Cardiovascular Interventions, vol. 2, pp. 255-260, 2009.
[89] N. Rajendra, B. Wrigley, and A. Gershlick, "Bioabsorbable stents: Nothing from
something," Clinical Investigation, vol. 2, pp. 1185-1189, 2012.
Bibliography
Page 196
[90] R. D. Alexy and D. S. Levi, "Materials and manufacturing technologies available for
production of a pediatric bioabsorbable stent," BioMed Research International, vol. 2013,
p. 11, 2013.
[91] Cook Medical. (Jan 2013, Nov 2013). Formula Renal Balloon-Expandable Stents. Available:
https://www.cookmedical.com/web/peripheral-intervention/article/-/blogs/pad-
therapies-program
[92] Meidcal Expo. (2013, Nov 2013). Endocor Self-expanding peripheral stent. Available:
http://www.medicalexpo.com/prod/endocor-gmbh/self-expanding-peripheral-stents-
applicators-nitinol-75348-532161.html
[93] P. H. Grewe, K. M. Müller, T. Deneke, E. Harrer, A. Germing, A. Mügge, et al., "Stents:
Material, surface texture and design, in theory and practice," Minimally Invasive Therapy
& Allied Technologies, vol. 11, pp. 157-163, 2002.
[94] N. B. Morgan, "Medical shape memory alloy applications—the market and its
products," Materials Science and Engineering: A, vol. 378, pp. 16-23, 2004.
[95] T. Duerig, A. Pelton, and D. Stöckel, "An overview of nitinol medical applications,"
Materials Science and Engineering: A, vol. 273-275, pp. 149-160, 1999.
[96] D. Stoeckel, A. Pelton, and T. Duerig, "Self-expanding nitinol stents: Material and
design considerations," European Radiology, vol. 14, pp. 292-301, 2004.
[97] B. Ratner, A. S. Hoffman, F. Schoen, and J. E. Lemons, Biomaterials Science: An
Introduction to Materials in Medicine. San Diego, California: Elsevier Inc., 2004.
[98] M. Niinomi, "Mechanical properties of biomedical titanium alloys," Materials Science
and Engineering: A, vol. 243, pp. 231-236, 1998.
[99] H. Hermawan, D. Dubé, and D. Mantovani, "Developments in metallic biodegradable
stents," Acta Biomaterialia, vol. 6, pp. 1693-1697, 2010.
[100] H. Hermawan, D. Dubé, and D. Mantovani, "Degradable metallic biomaterials: Design
and development of Fe–Mn alloys for stents," Journal of Biomedical Materials Research
Part A, vol. 93A, pp. 1-11, 2010.
[101] J. P. Carrozza, S. E. Hosley, D. J. C. MD, and D. S. Baim, "In vivo assessment of stent
expansion and recoil in normal porcine coronary arteries: Differential outcome by stent
design," Circulation, vol. 100, pp. 756-760, 1999.
[102] R. Hoffmann and G. S. Mintz, "Coronary in-stent restenosis—predictors, treatment and
prevention," European Heart Journal, vol. 21, pp. 1739-1749, 2000.
[103] A. Mehdizadeh, M. S. M. Ali, K. Takahata, S. Al-Sarawi, and D. Abbott, "A recoil
resilient lumen support, design, fabrication and mechanical evaluation," Journal of
Micromechanics and Microengineering, vol. 23, art. no. 065001, 2013.
Bibliography
Page 197
[104] R. O. Han, R. S. Schwartz, Y. Kobayashi, S. H. Wilson, J. T. Mann, M. H. Sketch, et al.,
"Comparison of self-expanding and balloon-expandable stents for the reduction of
restenosis," The American Journal of Cardiology, vol. 88, pp. 253-259, 2001.
[105] A. W. Martinez and E. L. Chaikof, "Microfabrication and nanotechnology in stent
design," Wiley Interdisciplinary Reviews: Nanomedicine and Nanobiotechnology, vol. 3, pp.
256-268, 2011.
[106] S. Zhao, X. Liu, and L. Gu, "The impact of wire stent fabrication technique on the
performance of stent placement," Journal of Medical Devices, vol. 6, art. no. 011007, 2012.
[107] Z. M. Hijazi, M. Homoud, M. J. Aronovitz, J. J. Smith, and G. T. Faller, "A new platinum
balloon-expandable stent (Angiostent) mounted on a high pressure balloon: Acute and
late results in an atherogenic swine model," Journal of Invasive Cardiology, vol. 7, pp. 127-
1234, Jun 1995.
[108] Y. Yamamoto, D. L. Brown, T. A. Ischinger, A. Arbab-Zadeh, and W. F. Penny, "Effect of
stent design on reduction of elastic recoil: A comparison via quantitative intravascular
ultrasound," Catheterization and Cardiovascular Interventions, vol. 47, pp. 251-257, 1999.
[109] K. Takahata, "Micro-electro-discharge machining technologies for MEMS," in Micro
Electronic and Mechanical Systems, K. Takahata, Ed. Vukovar, Croatia: InTech, 2009, pp.
143-164.
[110] K. Takahata and Y. B. Gianchandani, "A planar approach for manufacturing cardiac
stents: Design, fabrication, and mechanical evaluation," Journal of Microelectromechanical
Systems, vol. 13, pp. 933-939, 2004.
[111] K. Takahata, Y. B. Gianchandani, and K. D. Wise, "Micromachined antenna stents and
cuffs for monitoring intraluminal pressure and flow," Journal of Microelectromechanical
Systems, vol. 15, pp. 1289-1298, 2006.
[112] S. Mahendran, R. Devarajan, T. Nagarajan, and A. Madji, "A review of micro-EDM," in
International Multiconference of Engineers and Computer Scientists, Hong Kong, 2010, pp.
981-986.
[113] B. Bhargava, I. De Scheerder, Q. B. Ping, H. Yanming, R. Chan, H. Soo Kim, et al., "A
novel platinum-iridium, potentially gamma radioactive stent: Evaluation in a porcine
model," Catheter Cardiovasc Interv, vol. 51, pp. 364-368, 2000.
[114] J. Hagemeister, F. M. Baer, R. H. Schwinger, and H. W. Höpp, "Compliance of a cobalt
chromium coronary stent alloy - the COVIS trial," Current Controlled Trials in
Cardiovascular Medicine, vol. 6, p. 17, 2005.
[115] M. Peuster, P. Wohlsein, M. Brügmann, M. Ehlerding, K. Seidler, C. Fink, et al., "A
novel approach to temporary stenting: Degradable cardiovascular stents produced
from corrodible metal–results 6–18 months after implantation into New Zealand white
rabbits," Heart, vol. 86, pp. 563-569, 2001.
Bibliography
Page 198
[116] H. Hermawan, D. Dube, and D. Mantovani, "Developments in metallic biodegradable
stents," Acta Biomaterialia, vol. 6, pp. 1693-1697, 2010.
[117] W. J. Giessen, C. J. Slager, H. M. Beusekom, D. S. Ingen Schenau, R. A. Huijts, J. C.
Schuurbiers, et al., "Development of a polymer endovascular prosthesis and its
implantation in porcine arteries," Journal of Interventional Cardiology, vol. 5, pp. 175-186,
1992.
[118] J. Murphy, R. Schwartz, W. Edwards, A. Camrud, R. Vlietstra, and D. Holmes,
"Percutaneous polymeric stents in porcine coronary arteries. Initial experience with
polyethylene terephthalate stents," Circulation, vol. 86, pp. 1596-1604, 1992.
[119] K. Wilczek, M. Ivan De Scheerder, K. Wang, E. Verbeken, and J. Piessens, "Comparison
of self-expanding polyethylene terephthalate and metallic stents implanted in porcine
iliac arteries," Cardiovascular and Interventional Radiology, vol. 19, pp. 176-180, 1996.
[120] H.-Y. Song, Y.-H. Jin, J.-H. Kim, S.-W. Suh, H. K. Yoon, S.-G. Kang, et al., "Nonsurgical
placement of a nasolacrimal polyurethane stent: long-term effectiveness," Radiology,
vol. 200, pp. 759-763, 1996.
[121] J. S. Lee, G. Jung, B. S. Oum, S. H. Lee, and H. J. Roh, "Clinical efficacy of the
polyurethane stent without fluoroscopic guidance in the treatment of nasolacrimal duct
obstruction," Ophthalmology, vol. 107, pp. 1666-1670, 2000.
[122] X. Wang, S. S. Venkatraman, F. Y. Boey, J. S. Loo, and L. P. Tan, "Controlled release of
sirolimus from a multilayered PLGA stent matrix," Biomaterials, vol. 27, pp. 5588-5595,
2006.
[123] A. Kotsar, T. Isotalo, J. Mikkonen, H. Juuti, P. M. Martikainen, M. Talja, et al., "A new
biodegradable braided self-expandable PLGA prostatic stent: An experimental study in
the rabbit," Journal of Endourology, vol. 22, pp. 1065-1070, 2008.
[124] W.-J. Fu, Z.-X. Wang, G. Li, F.-Z. Cui, Y. Zhang, and X. Zhang, "Comparison of a
biodegradable ureteral stent versus the traditional double-J stent for the treatment of
ureteral injury: An experimental study," Biomedical Materials, vol. 7, art. no. 065002,
2012.
[125] K. Takahata, A. DeHennis, K. D. Wise, and Y. B. Gianchandani, "Stentenna: A
micromachined antenna stent for wireless monitoring of implantable microsensors," in
Proceedings of the 25th Annual International Conference of the IEEE on Engineering in
Medicine and Biology Society, 2003, pp. 3360-3363.
[126] K. Takahata, A. DeHennis, K. D. Wise, and Y. B. Gianchandani, "A wireless microsensor
for monitoring flow and pressure in a blood vessel utilizing a dual-inductor antenna
stent and two pressure sensors," in Proceedings of the 17th IEEE International Conference
on MEMS, 2004, pp. 216-219.
Bibliography
Page 199
[127] S. Chen, C. Tsai, J. Liu, H. Kan, C. Yao, L. Lee, et al., "The biomechanical analysis of the
coil stent and mesh stent expansion in the angioplasty," in 13th International Conference
on Biomedical Engineering, 2009, pp. 1592-1594.
[128] C. T. Dotter, R. Buschmann, M. K. McKinney, and J. Rösch, "Transluminal expandable
nitinol coil stent grafting: Preliminary report," Radiology, vol. 147, pp. 259-260, 1983.
[129] P. N. Ruygrok and P. W. Serruys, "Intracoronary stenting: From concept to custom,"
Circulation, vol. 94, pp. 882-890, 1996.
[130] D. Maass, C. L. Zollikofer, F. Largiadèr, and A. Senning, "Radiological follow-up of
transluminally inserted vascular endoprostheses: An experimental study using
expanding spirals," Radiology, vol. 152, pp. 659-663, 1984.
[131] ELLA-CS. (May 2010, Nov 2013). SX-ELLA Stent Danis. Available: http://www.ellacs.eu/
danis-procedure-pack.html
[132] A. Antony. (2011, Oct 2013). Top Ten: Upcoming Products to Benefit the Heart. Available:
http://www.medicaldevice-network.com/features/featuretop-ten-upcoming-projects-to-
benefit-the-heart
[133] SNOMED. (Nov 2013). SUN Bare Metal Stent. Available: http://en.sinomedical.net/
products_detail/&productId=513101b6-8103-4ced-b85a-6fa74ee29249&comp_stats=
comp-FrontProducts_list01-1310794394723.html
[134] C. Capelli, F. Gervaso, L. Petrini, G. Dubini, and F. Migliavacca, "Assessment of tissue
prolapse after balloon-expandable stenting: influence of stent cell geometry," Medical
Engineering & Physics, vol. 31, pp. 441-447, 2009.
[135] A. Kastrati, J. Dirschinger, P. Boekstegers, S. Elezi, H. Schühlen, J. Pache, et al.,
"Influence of stent design on 1-year outcome after coronary stent placement: A
randomized comparison of five stent types in 1,147 unselected patients," Catheterization
and Cardiovascular Interventions, vol. 50, pp. 290-297, 2000.
[136] S. Müller-Hülsbeck, P. J. Schäfer, N. Charalambous, S. R. Schaffner, M. Heller, and T.
Jahnke, "Comparison of carotid stents: An in-vitro experiment focusing on stent
design," Journal of Endovascular Therapy, vol. 16, pp. 168-177, 2009.
[137] Z. J. Shen, S. Brugaletta, H. M. Garcia-Garcia, J. Ligthart, J. Gomez-Lara, R. Diletti, et al.,
"Comparison of plaque prolapse in consecutive patients treated with Xience V and
Taxus Liberte stents," The International Journal of Cardiovascular Imaging, vol. 28, pp. 23-
31, 2012.
[138] M. Schillinger, M. Gschwendtner, B. Reimers, J. Trenkler, L. Stockx, J. Mair, et al., "Does
carotid stent cell design matter?," Stroke, vol. 39, pp. 905-909, 2008.
[139] A. Cremonesi and F. Gastriota. (2013, Nov 2013). Do Patients Benefit from Closed Cell
Design? Available: www.leipzig-interventional-course.com
Bibliography
Page 200
[140] S. W. Jordan and E. L. Chaikof, "Novel thromboresistant materials," Journal of Vascular
Surgery, vol. 45, pp. A104-A115, 2007.
[141] V. Karagkiozaki, P. G. Karagiannidis, N. Kalfagiannis, P. Kavatzikidou, P. Patsalas, D.
Georgiou, et al., "Novel nanostructured biomaterials: Implications for coronary stent
thrombosis," International Journal of Nanomedicine, vol. 7, pp. 6063-76, 2012.
[142] M. Schulz, V. Shanov, and Z. Yin, Nanotube Superfiber Materials: Changing Engineering
Design: Elsevier Science, 2013.
[143] B. Godin, Y. Hu, S. La Francesca, and M. Ferrari, "Cardiovascular nanomedicine:
Challenges and opportunities," in Molecular and Translational Vascular Medicine:
Springer, 2012, pp. 249-281.
[144] P. Vallance and N. Chan, "Endothelial function and nitric oxide: Clinical relevance,"
Heart, vol. 85, pp. 342-350, 2001.
[145] H. Wieneke, O. Dirsch, T. Sawitowski, Y. L. Gu, H. Brauer, U. Dahmen, et al.,
"Synergistic effects of a novel nanoporous stent coating and tacrolimus on intima
proliferation in rabbits," Catheterization and Cardiovascular Interventions, vol. 60, pp. 399-
407, 2003.
[146] I. Tsujino, J. Ako, Y. Honda, and P. J. Fitzgerald, "Drug delivery via nano-, micro and
macroporous coronary stent surfaces," Expert Opinion on Drug Delivery, vol. 4, pp. 287-
295, 2007.
[147] W. S. Weintraub, M. V. Grau-Sepulveda, J. M. Weiss, S. M. O'Brien, E. D. Peterson, P.
Kolm, et al., "Comparative effectiveness of revascularization strategies," New England
Journal of Medicine, vol. 366, pp. 1467-1476, 2012.
[148] I. Iakovou, T. Schmidt, E. Bonizzoni, L. Ge, G. M. Sangiorgi, G. Stankovic, et al.,
"Incidence, predictors, and outcome of thrombosis after successful implantation of
drug-eluting stents," The Journal of the American Medical Association, vol. 293, pp. 2126-
2130, 2005.
[149] J. Daemen, P. Wenaweser, K. Tsuchida, L. Abrecht, S. Vaina, C. Morger, et al., "Early
and late coronary stent thrombosis of sirolimus-eluting and paclitaxel-eluting stents in
routine clinical practice: Data from a large two-institutional cohort study," The Lancet,
vol. 369, pp. 667-678, 2007.
[150] I. Moussa, M. Carlo Di Mario, B. Reimers, T. Akiyama, J. Tobis, and A. Colombo,
"Subacute stent thrombosis in the era of intravascular ultrasound-guided coronary
stenting without anticoagulation: Frequency, predictors and clinical outcome," Journal
of the American College of Cardiology, vol. 29, pp. 6-12, 1997.
[151] G. D. Curfman, S. Morrissey, J. A. Jarcho, and J. M. Drazen, "Drug-eluting coronary
stents — Promise and uncertainty," New England Journal of Medicine, vol. 356, pp. 1059-
1060, 2007.
Bibliography
Page 201
[152] A. Kastrati, A. Schömig, J. Dirschinger, J. Mehilli, N. von Welser, J. Pache, et al.,
"Increased risk of restenosis after placement of gold-coated stents results of a
randomized trial comparing gold-coated with uncoated steel stents in patients with
coronary artery disease," Circulation, vol. 101, pp. 2478-2483, 2000.
[153] B. W. Nolan, M. L. Schermerhorn, R. J. Powell, E. Rowell, M. F. Fillinger, E. M.
Rzucidlo, et al., "Restenosis in gold-coated renal artery stents," Journal of Vascular
Surgery, vol. 42, pp. 40-46, 2005.
[154] P. Urban and E. De Benedetti, "Thrombosis: The last frontier of coronary stenting?," The
Lancet, vol. 369, pp. 619-621, 2007.
[155] F. Alfonso, "Treatment of in-stent restenosis – past, present and future " European
Cardiology, vol. 5, pp. 74-8, 2010.
[156] R. Kornowski, M. K. Hong, F. O. Tio, O. Bramwell, H. Wu, and M. B. Leon, "In-stent
restenosis: Contributions of inflammatory responses and arterial injury to neointimal
hyperplasia," Journal of the American College of Cardiology, vol. 31, pp. 224-230, 1998.
[157] R. S. Schwartz, K. C. Huber, J. G. Murphy, W. D. Edwards, A. R. Camrud, R. E.
Vlietstra, et al., "Restenosis and the proportional neointimal response to coronary artery
injury: Results in a porcine model," Journal of the American College of Cardiology, vol. 19,
pp. 267-274, 1992.
[158] R. Balossino, F. Gervaso, F. Migliavacca, and G. Dubini, "Effects of different stent
designs on local hemodynamics in stented arteries," Journal of Biomechanics, vol. 41, pp.
1053-1061, 2008.
[159] C. Kleinstreuer, S. Hyun, J. Buchanan Jr, P. Longest, J. Archie Jr, and G. Truskey,
"Hemodynamic parameters and early intimal thickening in branching blood vessels,"
Critical Reviews in Biomedical Engineering, vol. 29, pp. 1-64, 2001.
[160] M. M. Zarandi, R. Mongrain, and O. F. Bertrand, "Non-Newtonian hemodynamics and
shear stress distribution in three dimensional model of healthy and stented coronary
artery bifurcation," presented at the COMSOL Conference, Boston, 2010.
[161] R. Hoffmann, C. Jansen, A. König, P. K. Haager, G. Kerckhoff, J. Vom Dahl, et al., "Stent
design related neointimal tissue proliferation in human coronary arteries; an
intravascular ultrasound study," European Heart Journal, vol. 22, pp. 2007-2014,
November 1, 2001 2001.
[162] A. Kastrati, J. Mehilli, J. Dirschinger, J. Pache, K. Ulm, H. Schühlen, et al., "Restenosis
after coronary placement of various stent types," The American Journal of Cardiology, vol.
87, pp. 34-39, 2001.
[163] J. A. Ormiston, M. W. I. Webster, and P. N. Ruygrok, "Stent strut thickness and
restenosis," Circulation, vol. 105, p. e12, 2002.
Bibliography
Page 202
[164] C. Rogers and E. R. Edelman, "Endovascular stent design dictates experimental
restenosis and thrombosis," Circulation, vol. 91, pp. 2995-3001, 1995.
[165] Y. Yoshitomi, S. Kojima, M. Yano, T. Sugi, Y. Matsumoto, M. Saotome, et al., "Does stent
design affect probability of restenosis? A randomized trial comparing Multilink stents
with GFX stents," American Heart Journal, vol. 142, pp. 445-451, 2001.
[166] D. McLean and N. Eiger, "Stent design: Implications for restenosis," Reviews in
Cardiovascular Medicine, vol. 3, pp. S16-22, 2001.
[167] R. Hoffmann, G. S. Mintz, G. R. Dussaillant, J. J. Popma, A. D. Pichard, L. F. Satler, et al.,
"Patterns and mechanisms of in-stent restenosis: A serial intravascular ultrasound
study," Circulation, vol. 94, pp. 1247-1254, 1996.
[168] S. L. S. Lung and A. W. S. Pang. (2007, Nov 2013). Online Clinical Case Study, Clinical
Cardiology Series. Available: http://www.hkma.org/english/cme/clinicalcase/200703a_set
[169] Y. Minami, H. Kaneda, M. Inoue, M. Ikutomi, T. Morita, and T. Nakajima, "Endothelial
dysfunction following drug-eluting stent implantation: A systematic review of the
literature," International Journal of Cardiology, vol. 165, pp. 222-228, 2013.
[170] M.-C. Morice, P. W. Serruys, J. E. Sousa, J. Fajadet, E. Ban Hayashi, M. Perin, et al., "A
randomized comparison of a sirolimus-eluting stent with a standard stent for coronary
revascularization," New England Journal of Medicine, vol. 346, pp. 1773-1780, 2002.
[171] J. W. Moses, M. B. Leon, J. J. Popma, P. J. Fitzgerald, D. R. Holmes, C. O'Shaughnessy,
et al., "Sirolimus-eluting stents versus standard stents in patients with stenosis in a
native coronary artery," New England Journal of Medicine, vol. 349, pp. 1315-1323, 2003.
[172] S. Windecker, A. Remondino, F. R. Eberli, P. Jüni, L. Räber, P. Wenaweser, et al.,
"Sirolimus-eluting and paclitaxel-eluting stents for coronary revascularization," New
England Journal of Medicine, vol. 353, pp. 653-662, 2005.
[173] R. Virmani, G. Guagliumi, A. Farb, G. Musumeci, N. Grieco, T. Motta, et al., "Localized
hypersensitivity and late coronary thrombosis secondary to a sirolimus-eluting stent
should we be cautious?," Circulation, vol. 109, pp. 701-705, 2004.
[174] E. Camenzind, P. G. Steg, and W. Wijns, "A cause for concern," Circulation, vol. 115, pp.
1440-1455, 2007.
[175] M. Joner, A. V. Finn, A. Farb, E. K. Mont, F. D. Kolodgie, E. Ladich, et al., "Pathology of
drug-eluting stents in humansDelayed healing and late thrombotic risk," Journal of the
American College of Cardiology, vol. 48, pp. 193-202, 2006.
[176] B. Kalesan, T. Pilgrim, K. Heinimann, L. Räber, G. G. Stefanini, M. Valgimigli, et al.,
"Comparison of drug-eluting stents with bare metal stents in patients with ST-segment
elevation myocardial infarction," European Heart Journal, vol. 33, pp. 977-987, 2012.
Bibliography
Page 203
[177] S. Garg and P. W. Serruys, "Drug-eluting stents: A reappraisal," Heart, vol. 96, pp. 489-
493, 2010.
[178] M. Togni, S. Windecker, R. Cocchia, P. Wenaweser, S. Cook, M. Billinger, et al.,
"Sirolimus-eluting stents associated with paradoxic coronary vasoconstriction," Journal
of the American College of Cardiology, vol. 46, pp. 231-236, 2005.
[179] T. F. Lüscher, J. Steffel, F. R. Eberli, M. Joner, G. Nakazawa, F. C. Tanner, et al., "Drug-
eluting stent and coronary thrombosis biological mechanisms and clinical
implications," Circulation, vol. 115, pp. 1051-1058, 2007.
[180] W. Khan, S. Farah, and A. J. Domb, "Drug eluting stents: Developments and current
status," Journal of Controlled Release, vol. 161, pp. 703-712, 2012.
[181] C. Kaiser, S. Galatius, P. Erne, F. Eberli, H. Alber, H. Rickli, et al., "Drug-eluting versus
bare-metal stents in large coronary arteries," New England Journal of Medicine, vol. 363,
pp. 2310-2319, 2010.
[182] S. P. D Souza and D. M. Seriki, "Aortoiliac angioplasty and stenting," in Handbook of
Angioplasty and Stenting Procedures, R. A. Morgan and E. Walser, Eds. London, UK:
Springer, 2010, pp. 85-95.
[183] S. Mirsa, "Renal artery angioplasty and stenting," in Handbook of Angioplasty and
Stenting Procedures, R. A. Morgan and E. Walser, Eds. London, UK: Springer, 2010, pp.
153-165.
[184] T. J. Cleveland, "Angioplasty Stenting of the Subclavian and Axillary Arteries," in
Handbook of Angioplasty and Stenting Procedures, R. A. Morgan and E. Walser, Eds.
London, UK: Springer, 2010, pp. 195-205.
[185] G. B. Danzi, L. Fiocca, C. Capuano, S. Predolini, and E. Quaini, "Acute stent recoil: In
vivo evaluation of different stent designs," Catheterization and Cardiovascular
Interventions, vol. 52, pp. 147-153, 2001.
[186] T. Duerig and S. Duda, "Stents: The future," Minimally Invasive Therapy & Allied
Technologies, vol. 11, pp. 135-136, 2002.
[187] W. J. Cantor, E. D. Peterson, J. J. Popma, J. P. Zidar, M. H. Sketch Jr, J. E. Tcheng, et al.,
"Provisional stenting strategies: Systematic overview and implications for clinical
decision-making," Journal of the American College of Cardiology, vol. 36, pp. 1142-1151,
2000.
[188] W. Alvarez and N. K. Kapur, "Drug eluting stent technology," Journal of Pharmacy
Practice, vol. 18, pp. 461-478, 2005.
[189] H. C. Lowe, S. N. Oesterle, and L. M. Khachigian, "Coronary in-stent restenosis:
Current status and future strategies," Journal of the American College of Cardiology, vol.
39, pp. 183-193, 2002.
Bibliography
Page 204
[190] C. M. Nickson, P. J. Doherty, and R. L. Williams, "Novel polymeric coatings with the
potential to control in-stent restenosis — an in vitro study," Journal of Biomaterials
Applications, vol. 24, pp. 437-452, 2010.
[191] V. Spanos, G. Stankovic, J. Tobis, and A. Colombo, "The challenge of in-stent restenosis:
Insights from intravascular ultrasound," European Heart Journal, vol. 24, pp. 138-150,
2003.
[192] F. G. P. Welt and C. Rogers, "Inflammation and restenosis in the stent era,"
Arteriosclerosis, Thrombosis, and Vascular Biology, vol. 22, pp. 1769-1776, 2002.
[193] B. Lagerqvist, S. K. James, U. Stenestrand, J. Lindbäck, T. Nilsson, and L. Wallentin,
"Long-term outcomes with drug-eluting stents versus bare-metal stents in Sweden,"
New England Journal of Medicine, vol. 356, pp. 1009-1019, 2007.
[194] D. Lim, S.-K. Cho, W.-P. Park, A. Kristensson, J.-Y. Ko, S. Al-Hassani, et al., "Suggestion
of potential stent design parameters to reduce restenosis risk driven by foreshortening
or dogboning due to non-uniform balloon-stent expansion," Annals of Biomedical
Engineering, vol. 36, pp. 1118-1129, 2008.
[195] L. G. Machado and M. A. Savi, "Medical applications of shape memory alloys,"
Brazilian Journal of Medical and Biological Research, vol. 36, pp. 683-691, 2003.
[196] C. Bonsignore, Open Stent Design. Fermont, CA: Nitinol Devices and Components, Inc.,
2011.
[197] M. S. M. Ali and K. Takahata, "Wireless microfluidic control with integrated shape-
memory-alloy actuators operated by field frequency modulation," Journal of
Micromechanics and Microengineering, vol. 21, art. no. 075005, 2011.
[198] M. Ali and K. Takahata, "Frequency-controlled wireless shape-memory-alloy
microactuators integrated using an electroplating bonding process," Sensors and
Actuators A: Physical, vol. 163, pp. 363-372, 2010.
[199] B. Kim, M. G. Lee, Y. P. Lee, Y. Kim, and G. Lee, "An earthworm-like micro robot using
shape memory alloy actuator," Sensors and Actuators A: Physical, vol. 125, pp. 429-437,
2006.
[200] K. H. Ho and S. T. Newman, "State of the art electrical discharge machining (EDM),"
International Journal of Machine Tools and Manufacture, vol. 43, pp. 1287-1300, 2003.
[201] N. Mohd Abbas, D. G. Solomon, and M. Fuad Bahari, "A review on current research
trends in electrical discharge machining (EDM)," International Journal of Machine Tools
and Manufacture, vol. 47, pp. 1214-1228, 2007.
[202] M. Murali and S. Yeo, "Rapid biocompatible micro device fabrication by micro electro-
discharge machining," Biomedical Microdevices, vol. 6, pp. 41-45, 2004.
Bibliography
Page 205
[203] Y. P. Kathuria, "The potential of biocompatible metallic stents and preventing
restenosis," Materials Science and Engineering: A, vol. 417, pp. 40-48, 2006.
[204] D. N. Ku, "Blood flow in arteries," Annual Review of Fluid Mechanics, vol. 29, pp. 399-434,
1997.
[205] D. N. Ku, D. P. Giddens, C. K. Zarins, and S. Glagov, "Pulsatile flow and
atherosclerosis in the human carotid bifurcation. Positive correlation between plaque
location and low oscillating shear stress," Arteriosclerosis, Thrombosis, and Vascular
Biology, vol. 5, pp. 293-302, 1985.
[206] M. De Beule, P. Mortier, S. G. Carlier, B. Verhegghe, R. Van Impe, and P. Verdonck,
"Realistic finite element-based stent design: The impact of balloon folding," Journal of
Biomechanics, vol. 41, pp. 383-389, 2008.
[207] N. Li, H. Zhang, and H. Ouyang, "Shape optimization of coronary artery stent based on
a parametric model," Finite Elements in Analysis and Design, vol. 45, pp. 468-475, 2009.
[208] W. A. James F. Shackelford and W. Alexander, CRC Materials Science and Engineering
Handbook, Third Edition: CRC PressINC, 2001.
[209] S. Moaveni, "Introduction," in Finite Element Analysis: Theory and Application with
ANSYS, New Jersey, USA: Pearson Education, Inc., 2008.
[210] K. Takahata and Y. B. Gianchandani, "Batch mode micro-electro-discharge machining,"
Journal of Microelectromechanical Systems, vol. 11, pp. 102-110, 2002.
[211] R. Rieu, P. Barragan, C. Masson, J. Fuseri, V. Garitey, M. Silvestri, et al., "Radial force of
coronary stents: A comparative analysis," Catheterization and Cardiovascular
Interventions, vol. 46, pp. 380-391, 1999.
[212] F. Flueckiger, H. Sternthal, G. E. Klein, M. Aschauer, D. Szolar, and G. Kleinhappl,
"Strength, elasticity, and plasticity of expandable metal stents: In vitro studies with
three types of stress," Journal of vascular and interventional radiology, vol. 5, pp. 745-50,
1994.
[213] S. Garg and P. W. Serruys, "Coronary stents: Current status," Journal of Amercian College
of Cardiology, vol. 56, pp. S1-42, 2010.
[214] H. M. Hsiao, K. H. Lee, Y. C. Liao, and Y. C. Cheng, "Cardiovascular stent design and
wall shear stress distribution in coronary stented arteries," Micro & Nano Letters, IET,
vol. 7, pp. 430-433, 2012.
[215] H.-M. Hsiao, "Why similar stent designs cause new clinical issues," Journal of the
American College of Cardiology: Cardiovascular Interventions, vol. 5, pp. 362-362, 2012.
[216] K. Van der Heiden, F. J. Gijsen, A. Narracott, S. Hsiao, I. Halliday, J. Gunn, et al., "The
effects of stenting on shear stress: Relevance to endothelial injury and repair,"
Cardiovascular Research, 2013.
Bibliography
Page 206
[217] P. C. Evans and B. R. Kwak, "Biomechanical factors in cardiovascular disease,"
Cardiovascular Research, 2013.
[218] S. Morlacchi and F. Migliavacca, "Modeling stented coronary arteries: Where we are,
where to go," Annals of Biomedical Engineering, pp. 1-17, 2012.
[219] J. F. LaDisa, L. E. Olson, I. Guler, D. A. Hettrick, J. R. Kersten, D. C. Warltier, et al.,
"Circumferential vascular deformation after stent implantation alters wall shear stress
evaluated with time-dependent 3D computational fluid dynamics models," Journal of
Applied Physiology, vol. 98, pp. 947-957, 2005.
[220] A. O. Frank, P. W. Walsh, and J. E. Moore, "Computational fluid dynamics and stent
design," Artificial Organs, vol. 26, pp. 614-621, 2002.
[221] J. F. LaDisa, L. E. Olson, D. A. Hettrick, D. C. Warltier, J. R. Kersten, and P. S. Pagel,
"Axial stent strut angle influences wall shear stress after stent implantation: Analysis
using 3D computational fluid dynamics models of stent foreshortening," Biomedical
Engineering Online, vol. 4, p. 59, 2005.
[222] A. Rouhi, U. Piomelli, and P. Vlachos, "Numerical investigation of pulsatile flow in
endovascular stents," Physics of Fluids, vol. 25, art. no. 091905, 2013.
[223] C. Caro, J. Fitz-Gerald, and R. Schroter, "Atheroma and arterial wall shear observation,
correlation and proposal of a shear dependent mass transfer mechanism for
atherogenesis," Proceedings of the Royal Society of London. Series B. Biological Sciences, vol.
177, pp. 109-133, 1971.
[224] C. K. Zarins, D. P. Giddens, B. Bharadvaj, V. S. Sottiurai, R. F. Mabon, and S. Glagov,
"Carotid bifurcation atherosclerosis. Quantitative correlation of plaque localization
with flow velocity profiles and wall shear stress," Circulation Research, vol. 53, pp. 502-
514, 1983.
[225] A. M. Malek, S. L. Alper, and S. Izumo, "Hemodynamic shear stress and its role in
atherosclerosis," The Journal of the American Medical Association, vol. 282, pp. 2035-2042,
1999.
[226] O. Traub and B. C. Berk, "Laminar shear stress mechanisms by which endothelial cells
transduce an atheroprotective force," Arteriosclerosis, Thrombosis, and Vascular Biology,
vol. 18, pp. 677-685, 1998.
[227] N. DePaola, M. Gimbrone, P. F. Davies, and C. Dewey, "Vascular endothelium
responds to fluid shear stress gradients," Arteriosclerosis, Thrombosis, and Vascular
Biology, vol. 12, pp. 1254-1257, 1992.
[228] R. Tominaga, H. E. Kambic, H. Emoto, H. Harasaki, C. Sutton, and J. Hollman, "Effects
of design geometry of intravascular endoprostheses on stenosis rate in normal rabbits,"
American Heart Journal, vol. 123, pp. 21-28, 1992.
Bibliography
Page 207
[229] B. M. Johnston, P. R. Johnston, S. Corney, and D. Kilpatrick, "Non-Newtonian blood
flow in human right coronary arteries: Transient simulations," Journal of Biomechanics,
vol. 39, pp. 1116-1128, 2006.
[230] H. Y. Chen, I. D. Moussa, C. Davidson, and G. S. Kassab, "Impact of main branch
stenting on endothelial shear stress: Role of side branch diameter, angle and lesion,"
Journal of The Royal Society Interface, vol. 9, pp. 1187-1193, 2012.
[231] E. O. Ofili, A. J. Labovitz, and M. J. Kern, "Coronary flow velocity dynamics in normal
and diseased arteries," The American Journal of Cardiology, vol. 71, pp. D3-D9, 1993.
[232] A. C. Dunn, T. D. Zaveri, B. G. Keselowsky, and W. G. Sawyer, "Macroscopic friction
coefficient measurements on living endothelial cells," Tribology Letters, vol. 27, pp. 233-
238, 2007.
[233] C. K. Zarins, D. A. Bloch, T. Crabtree, A. H. Matsumoto, R. A. White, and T. J. Fogarty,
"Stent graft migration after endovascular aneurysm repair: Importance of proximal
fixation," Journal of Vascular Surgery, vol. 38, pp. 1264-1272, 2003.
[234] W.-Q. Wang, D.-K. Liang, D.-Z. Yang, and M. Qi, "Analysis of the transient expansion
behavior and design optimization of coronary stents by finite element method," Journal
of Biomechanics, vol. 39, pp. 21-32, 2006.
[235] S. Zhao, L. Gu, and S. R. Froemming, "On the importance of modeling stent procedure
for predicting arterial mechanics," Journal of Biomechanical Engineering, vol. 134, art. no.
121005, 2012.
[236] S. Chien, "Mechanotransduction and endothelial cell homeostasis: The wisdom of the
cell," American Journal of Physiology-Heart and Circulatory Physiology, vol. 292, pp. H1209-
H1224, 2007.
[237] N. Wang, H. Miao, Y.-S. Li, P. Zhang, J. H. Haga, Y. Hu, et al., "Shear stress regulation
of Krüppel-like factor 2 expression is flow pattern-specific," Biochemical and Biophysical
Research Communications, vol. 341, pp. 1244-1251, 2006.
[238] A. Colombo, J. W. Moses, M. C. Morice, J. Ludwig, D. R. Holmes, V. Spanos, et al.,
"Randomized study to evaluate sirolimus-eluting stents implanted at coronary
bifurcation lesions," Circulation, vol. 109, pp. 1244-1249, 2004.
[239] B. O'Brien and M. Bruzzi, "Shape memory alloys for use in medicine," in Comprehensive
Biomaterials, D. Editor-in-Chief: Paul, Ed. Oxford: Elsevier, 2011, pp. 49-72.
[240] Y. A. Çengel, Introduction to Thermodynamics and Heat Transfer, Second ed. New York,
USA: McGraw-Hill Higher Education, 2008.
[241] Ansys INC. (2013, Nov 2013). Ansys Help Guide-V14.5.
Bibliography
Page 208
[242] D. Halliday, R. Resnick, and J. Walker, "Temperature, heat, and the first law of
thermodynamics," in Fundamentals of Physics USA: John Wiley & Sons, Inc., 2011, pp.
481-483.
[243] G. R. Trott and A. Shorey, "Glass wafer mechanical properties: A comparison to
silicon," in Microsystems, Packaging, Assembly and Circuits Technology Conference
(IMPACT), 2011 6th International, 2011, pp. 359-362.
[244] S. H. Hofma, H. van Beusekom, P. W. Serruys, and W. J. van Der Giessen, "Recent
developments in coated stents," Current Interventional Cardiology Reports, vol. 3, p. 28,
2001.
[245] D. F. Williams, "On the mechanisms of biocompatibility," Biomaterials, vol. 29, pp. 2941-
2953, 2008.
[246] A. B. Fontaine, K. Koelling, S. Dos Passos, J. Cearlock, R. Hoffman, and D. G. Spigos,
"Polymeric surface modifications of tantalum stents," Journal of Endovascular Surgery,
vol. 3, pp. 276-283, 1996.
[247] T. Stieglitz, S. Kammer, K. Koch, S. Wien, and A. Robitzki, "Encapsulation of flexible
biomedical microimplants with parylene C," in Proceedings of the International Functional
Electrical Stimulation Society (IFESS) Conference, 2002.
[248] K. V. Wolf, Z. Zong, J. Meng, A. Orana, N. Rahbar, K. M. Balss, et al., "An investigation
of adhesion in drug-eluting stent layers," Journal of Biomedical Materials Research Part A,
vol. 87, pp. 272-281, 2008.
[249] G. E. Loeb, M. Bak, M. Salcman, and E. Schmidt, "Parylene as a chronically stable,
reproducible microelectrode insulator," Biomedical Engineering, IEEE Transactions on, pp.
121-128, 1977.
[250] K. L. Costeloe and D. Hill, "Blood resistivity and its implications for the calculation of
cardiac output by the thoracic electrical impedance technique," Intensive Care Medicine,
vol. 3, pp. 63-67, 1977.
[251] S. A. Victor and V. L. Shah, "Steady state heat transfer to blood flowing in the entrance
region of a tube," International Journal of Heat and Mass Transfer, vol. 19, pp. 777-783,
1976.
[252] M. K. Kopaei, A. Mehdizadeh, D. C. Ranasinghe, and S. Al-Sarawi, "A novel hybrid
approach for wireless powering of biomedical implants," in Eighth IEEE International
Conference on Intelligent Sensors, Sensor Networks and Information Processing 2013, pp. 455-
460.
[253] D. W. E. Dissanayake, "Modelling and analysis of wirelessly interrogated saw based
micropumps for drug delivery applications," Ph.D. dissertation, School of Electrical
and Electronic Engineering, The University of Adelaide, 2009.
Page 209
Index
Index
acceleration, 48, 49
angiographic, 10, 12, 19
angioplasty balloon, 1, 2, 8, 9, 10, 11, 12, 14, 17,
18, 19, 22, 33, 35, 37, 39, 42, 43, 44, 46, 47, 49,
50, 51, 62, 65, 67, 69, 70, 72, 73, 117, 120, 164,
176, 180, 181, 182, 183, 184, 185, 188
deflated, 8, 10, 17, 65
expanded, 32, 65
expansion, 44, 46, 47, 117, 120, 164, 182, 185,
188
ANSYS, 47, 49, 75, 78, 81, 137, 138, 145, 171
CFX, 75, 78, 145, 171
asymmetrical, 37, 42, 47, 72, 182
atherombose, 74
atherosclerosis, 2, 3, 4, 5, 35, 44, 180, 181
fatty deposits, 3
hepercholesteromia, 4
hypertension, 4
inflammatory response, 4, 17, 21, 22, 32, 33,
34, 36, 182
low density lipoproteins (LDL), 4
phospholipids, 4
stenosis, 4, 5, 6, 8, 32
treatment, 5
non-surgical, 5
pharmacological intervention, 6
ARB, 6
beta blockers, 6
blood thinners, 6
statins, 6
surgircal, 2, 5, 6, 35
invasive, 6
bypass grafting (CABG), 6, 7, 36
arrested heart surgery, 7
beating heart surgery, 7
endarterectomy, 6, 7
minimally-invasive, 6
abrupt closure, 9
arterial dissection, 9
atherectomy, 11
directional atherectomy, 11
laser atherectomy, 12
excimer laser, 12
laser assisted revascularization,
12
phagocytosis, 11
rotational atherectomy, 11
embolic protection, 12
percutaneous transluminal
angioplasty (PCTA), 8
pseudo-aneurysm, 9
stenting, 9
deployment, 9
thrombectomy, 12, 33
axial integrity, 51
axial strength, 54
batch processing, 20, 38, 69, 183
behaviour, 76
benchmark, 39, 72, 75, 114
bending compliance, 65
blood vessel, 3
aorta, 7, 25
coagulation, 3, 33
coronary artery, 2, 7, 9, 19, 22, 31, 34, 35, 43,
73, 79
endothelial cell, 3, 4, 34, 44, 181
peripheral artery, 24
tunica adventitia, 3, 4
tunica intima, 3, 4
tunica media, 3, 4
vena cava, 25
body temperature, 24, 39, 44, 118, 121, 165, 172,
173, 174, 175, 176
boundary conditions, 48
boundary layer, 80, 86, 91, 136, 150
branched, 72, 73, 81, 94, 95, 96, 97, 98, 99, 100,
102, 103, 110, 114, 115, 184
calliper, 65
canine, 25, 79
cardiac cycle, 75, 83, 84, 85, 93, 96, 102, 104,
106, 107, 109, 112, 113, 114, 115, 184
cardiovascular disease (CVD), 2
Carreau model, 75, 76, 171
compressive pressure, 52, 69
computational fluid dynamics (CFD), 71, 113,
135, 137
Index
Page 210
conjugate, 40, 144, 147, 148, 149, 151, 152, 153,
154, 176, 186
constrained, 17, 19, 40, 44, 61, 118, 119, 121,
137, 164, 177
controur, 51, 53, 54, 56, 58, 59, 85, 87, 88, 89, 90,
97, 98, 99, 100, 139, 140, 141, 142, 143, 148,
149, 150, 151, 152, 153, 154, 163, 174
convergence, 49, 56, 78, 146, 148, 172, 173
deformations, 17, 18, 48, 60, 66, 119, 157, 182,
183
deionized water, 65
Dell Precision, 83, 139, 146, 172
density, 15, 21, 48, 50, 75, 80, 143, 145
developed flow, 78, 170
difference time integration, 48
differential volume, 128, 129, 132
dimensional analysis study, 39, 71, 134
discretisation, 79
distal branch, 72, 77, 78, 101, 108, 109
distal end, 13, 24, 86, 91
distal path, 27
drag force, 39, 72, 83, 92, 93, 96, 106, 107, 113,
184
elastic modulus, 15, 17, 18, 21, 22, 43
elastic recovery, 18, 42, 68, 70, 119, 183
electrical potential, 118, 168, 172, 173, 174, 177,
186
electrical resistivity, 123, 167
electro-thermal actuation, 164
endothelialisation, 32, 34
expanded polystyrene, 123
experimental studies, 22, 39, 117, 118, 121, 154,
175, 176, 185, 188
finishing temperature, 119
finned surfaces, 128, 176, 186
flow deviation, 101, 102, 103, 111
flow rate, 72, 77, 96, 101, 108, 109, 110, 113, 114,
115, 184
flow ratio, 96, 101, 107, 108, 109, 110, 113, 114,
115
fluid regime, 39, 72, 74, 77, 136, 146, 176, 183
force gauge, 66, 160, 161
free expansion, 47
free-holding, 67, 68
frictional coefficient, 93
heat flux, 127, 128, 132, 137, 138, 140, 141
heat stimuli, 40, 186
heat transfer, 40, 121, 123, 124, 125, 126, 127,
128, 129, 130, 131, 132, 134, 135, 136, 137,
138, 141, 142, 144, 147, 148, 149, 151, 152,
153, 154, 166, 168, 171, 174, 176, 186
conduction, 124, 129, 131, 132, 144, 145, 149,
175
convection, 124, 126, 132, 144, 145, 152
convective heat transfer coefficient, 124, 125,
126, 127, 132, 135, 137, 138, 152, 168, 174
radiation, 124, 125, 144, 145
rate, 124, 127, 128, 130, 132, 133
thermal conductivity, 122, 123, 124, 126, 128,
129, 130, 137, 141, 142, 145
heat transfer (HT) rod, 121, 122, 125, 140, 148,
155
heat-induced, 118, 122, 142, 154, 158, 160, 172
heating plate, 160, 161, 162
hemodynamic change, 71
hemodynamic response, 71, 76, 111, 115, 184
high wall shear stress, 74
hotplate, 154, 155
hydraulic pressure, 8, 10, 11, 17
hysteresis, 120
implicity analysis, 55
in vitro, 39, 40, 42, 54, 65, 67, 68, 69, 70, 74, 118,
121, 122, 157, 160, 164, 175, 176, 177, 183,
185, 187
in vivo, 39, 42, 46, 70, 74, 120, 121, 164, 165, 175,
177, 182, 183
incompressible, 144, 145, 170
infrared (IR), 162
inlet, 78, 80, 94, 95, 96, 108, 109, 110, 113, 114,
144, 147, 170, 187
interrogation, 24, 175, 187
interventional cardiology, 43
intimal cells, 9, 74
isotropic, 49, 50, 93, 145
Jenoptik VarioCam, 162
Joule heating, 121, 171
kinematic viscosity, 123
Lagrange coordinates, 48
laminal, 127, 132, 170
leapfrog method, 49
lesion, 3, 6, 7, 8, 9, 10, 11, 12, 13, 14, 15, 17, 19,
21, 23, 31, 32, 33, 34, 35, 71, 81, 181
low wall shear stress (LWSS), 71, 72, 84, 113,
118, 184
luminal coverage, 24
luminal cross-sectional area (CSA), 43
magnitude, 44, 49, 76, 78, 93, 146, 172
mean absolute, 111
mechanical evaluation, 41, 46, 182
Memry, 49, 122
meta-analysis, 44
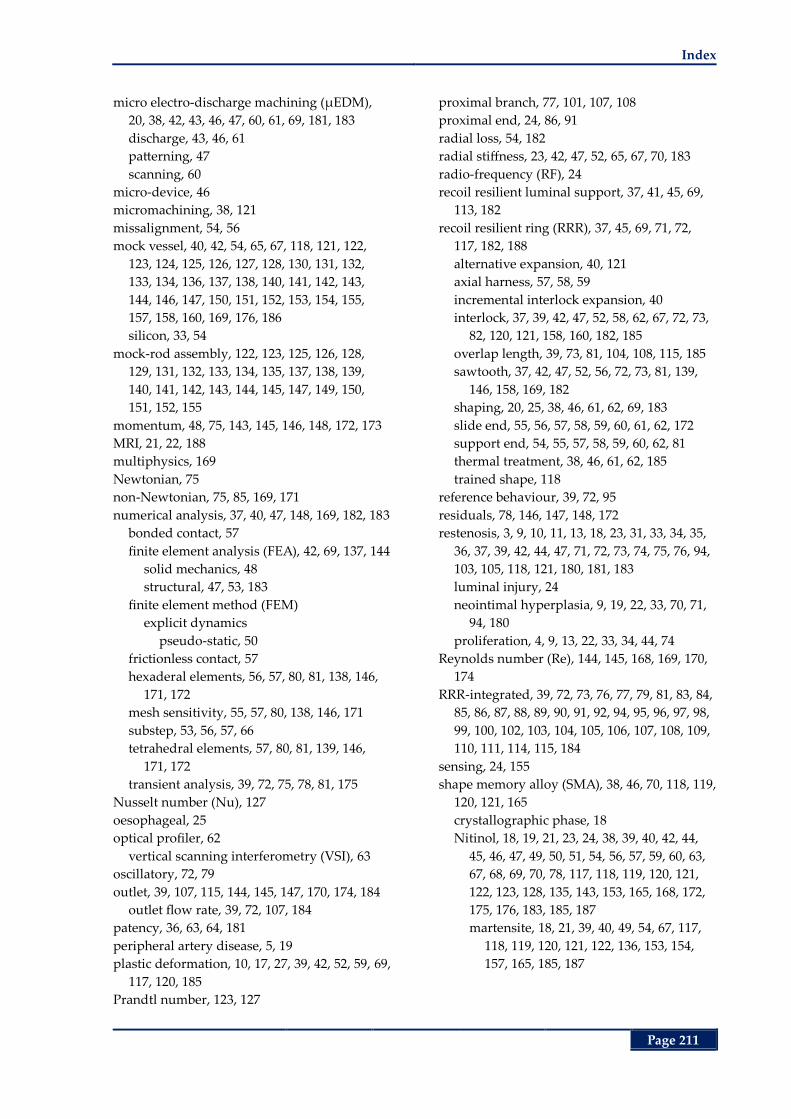
Index
Page 211
micro electro-discharge machining (µEDM),
20, 38, 42, 43, 46, 47, 60, 61, 69, 181, 183
discharge, 43, 46, 61
patterning, 47
scanning, 60
micro-device, 46
micromachining, 38, 121
missalignment, 54, 56
mock vessel, 40, 42, 54, 65, 67, 118, 121, 122,
123, 124, 125, 126, 127, 128, 130, 131, 132,
133, 134, 136, 137, 138, 140, 141, 142, 143,
144, 146, 147, 150, 151, 152, 153, 154, 155,
157, 158, 160, 169, 176, 186
silicon, 33, 54
mock-rod assembly, 122, 123, 125, 126, 128,
129, 131, 132, 133, 134, 135, 137, 138, 139,
140, 141, 142, 143, 144, 145, 147, 149, 150,
151, 152, 155
momentum, 48, 75, 143, 145, 146, 148, 172, 173
MRI, 21, 22, 188
multiphysics, 169
Newtonian, 75
non-Newtonian, 75, 85, 169, 171
numerical analysis, 37, 40, 47, 148, 169, 182, 183
bonded contact, 57
finite element analysis (FEA), 42, 69, 137, 144
solid mechanics, 48
structural, 47, 53, 183
finite element method (FEM)
explicit dynamics
pseudo-static, 50
frictionless contact, 57
hexaderal elements, 56, 57, 80, 81, 138, 146,
171, 172
mesh sensitivity, 55, 57, 80, 138, 146, 171
substep, 53, 56, 57, 66
tetrahedral elements, 57, 80, 81, 139, 146,
171, 172
transient analysis, 39, 72, 75, 78, 81, 175
Nusselt number (Nu), 127
oesophageal, 25
optical profiler, 62
vertical scanning interferometry (VSI), 63
oscillatory, 72, 79
outlet, 39, 107, 115, 144, 145, 147, 170, 174, 184
outlet flow rate, 39, 72, 107, 184
patency, 36, 63, 64, 181
peripheral artery disease, 5, 19
plastic deformation, 10, 17, 27, 39, 42, 52, 59, 69,
117, 120, 185
Prandtl number, 123, 127
proximal branch, 77, 101, 107, 108
proximal end, 24, 86, 91
radial loss, 54, 182
radial stiffness, 23, 42, 47, 52, 65, 67, 70, 183
radio-frequency (RF), 24
recoil resilient luminal support, 37, 41, 45, 69,
113, 182
recoil resilient ring (RRR), 37, 45, 69, 71, 72,
117, 182, 188
alternative expansion, 40, 121
axial harness, 57, 58, 59
incremental interlock expansion, 40
interlock, 37, 39, 42, 47, 52, 58, 62, 67, 72, 73,
82, 120, 121, 158, 160, 182, 185
overlap length, 39, 73, 81, 104, 108, 115, 185
sawtooth, 37, 42, 47, 52, 56, 72, 73, 81, 139,
146, 158, 169, 182
shaping, 20, 25, 38, 46, 61, 62, 69, 183
slide end, 55, 56, 57, 58, 59, 60, 61, 62, 172
support end, 54, 55, 57, 58, 59, 60, 62, 81
thermal treatment, 38, 46, 61, 62, 185
trained shape, 118
reference behaviour, 39, 72, 95
residuals, 78, 146, 147, 148, 172
restenosis, 3, 9, 10, 11, 13, 18, 23, 31, 33, 34, 35,
36, 37, 39, 42, 44, 47, 71, 72, 73, 74, 75, 76, 94,
103, 105, 118, 121, 180, 181, 183
luminal injury, 24
neointimal hyperplasia, 9, 19, 22, 33, 70, 71,
94, 180
proliferation, 4, 9, 13, 22, 33, 34, 44, 74
Reynolds number (Re), 144, 145, 168, 169, 170,
174
RRR-integrated, 39, 72, 73, 76, 77, 79, 81, 83, 84,
85, 86, 87, 88, 89, 90, 91, 92, 94, 95, 96, 97, 98,
99, 100, 102, 103, 104, 105, 106, 107, 108, 109,
110, 111, 114, 115, 184
sensing, 24, 155
shape memory alloy (SMA), 38, 46, 70, 118, 119,
120, 121, 165
crystallographic phase, 18
Nitinol, 18, 19, 21, 23, 24, 38, 39, 40, 42, 44,
45, 46, 47, 49, 50, 51, 54, 56, 57, 59, 60, 63,
67, 68, 69, 70, 78, 117, 118, 119, 120, 121,
122, 123, 128, 135, 143, 153, 165, 168, 172,
175, 176, 183, 185, 187
martensite, 18, 21, 39, 40, 49, 54, 67, 117,
118, 119, 120, 121, 122, 136, 153, 154,
157, 165, 185, 187
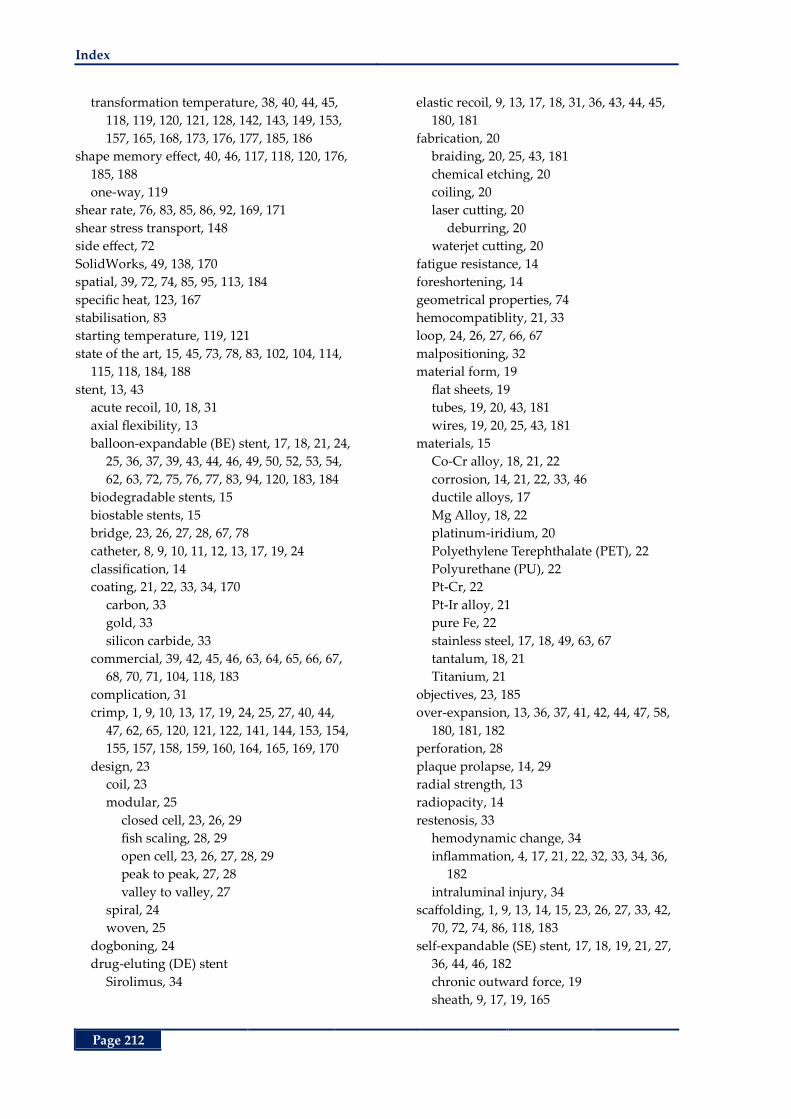
Index
Page 212
transformation temperature, 38, 40, 44, 45,
118, 119, 120, 121, 128, 142, 143, 149, 153,
157, 165, 168, 173, 176, 177, 185, 186
shape memory effect, 40, 46, 117, 118, 120, 176,
185, 188
one-way, 119
shear rate, 76, 83, 85, 86, 92, 169, 171
shear stress transport, 148
side effect, 72
SolidWorks, 49, 138, 170
spatial, 39, 72, 74, 85, 95, 113, 184
specific heat, 123, 167
stabilisation, 83
starting temperature, 119, 121
state of the art, 15, 45, 73, 78, 83, 102, 104, 114,
115, 118, 184, 188
stent, 13, 43
acute recoil, 10, 18, 31
axial flexibility, 13
balloon-expandable (BE) stent, 17, 18, 21, 24,
25, 36, 37, 39, 43, 44, 46, 49, 50, 52, 53, 54,
62, 63, 72, 75, 76, 77, 83, 94, 120, 183, 184
biodegradable stents, 15
biostable stents, 15
bridge, 23, 26, 27, 28, 67, 78
catheter, 8, 9, 10, 11, 12, 13, 17, 19, 24
classification, 14
coating, 21, 22, 33, 34, 170
carbon, 33
gold, 33
silicon carbide, 33
commercial, 39, 42, 45, 46, 63, 64, 65, 66, 67,
68, 70, 71, 104, 118, 183
complication, 31
crimp, 1, 9, 10, 13, 17, 19, 24, 25, 27, 40, 44,
47, 62, 65, 120, 121, 122, 141, 144, 153, 154,
155, 157, 158, 159, 160, 164, 165, 169, 170
design, 23
coil, 23
modular, 25
closed cell, 23, 26, 29
fish scaling, 28, 29
open cell, 23, 26, 27, 28, 29
peak to peak, 27, 28
valley to valley, 27
spiral, 24
woven, 25
dogboning, 24
drug-eluting (DE) stent
Sirolimus, 34
elastic recoil, 9, 13, 17, 18, 31, 36, 43, 44, 45,
180, 181
fabrication, 20
braiding, 20, 25, 43, 181
chemical etching, 20
coiling, 20
laser cutting, 20
deburring, 20
waterjet cutting, 20
fatigue resistance, 14
foreshortening, 14
geometrical properties, 74
hemocompatiblity, 21, 33
loop, 24, 26, 27, 66, 67
malpositioning, 32
material form, 19
flat sheets, 19
tubes, 19, 20, 43, 181
wires, 19, 20, 25, 43, 181
materials, 15
Co-Cr alloy, 18, 21, 22
corrosion, 14, 21, 22, 33, 46
ductile alloys, 17
Mg Alloy, 18, 22
platinum-iridium, 20
Polyethylene Terephthalate (PET), 22
Polyurethane (PU), 22
Pt-Cr, 22
Pt-Ir alloy, 21
pure Fe, 22
stainless steel, 17, 18, 49, 63, 67
tantalum, 18, 21
Titanium, 21
objectives, 23, 185
over-expansion, 13, 36, 37, 41, 42, 44, 47, 58,
180, 181, 182
perforation, 28
plaque prolapse, 14, 29
radial strength, 13
radiopacity, 14
restenosis, 33
hemodynamic change, 34
inflammation, 4, 17, 21, 22, 32, 33, 34, 36,
182
intraluminal injury, 34
scaffolding, 1, 9, 13, 14, 15, 23, 26, 27, 33, 42,
70, 72, 74, 86, 118, 183
self-expandable (SE) stent, 17, 18, 19, 21, 27,
36, 44, 46, 182
chronic outward force, 19
sheath, 9, 17, 19, 165
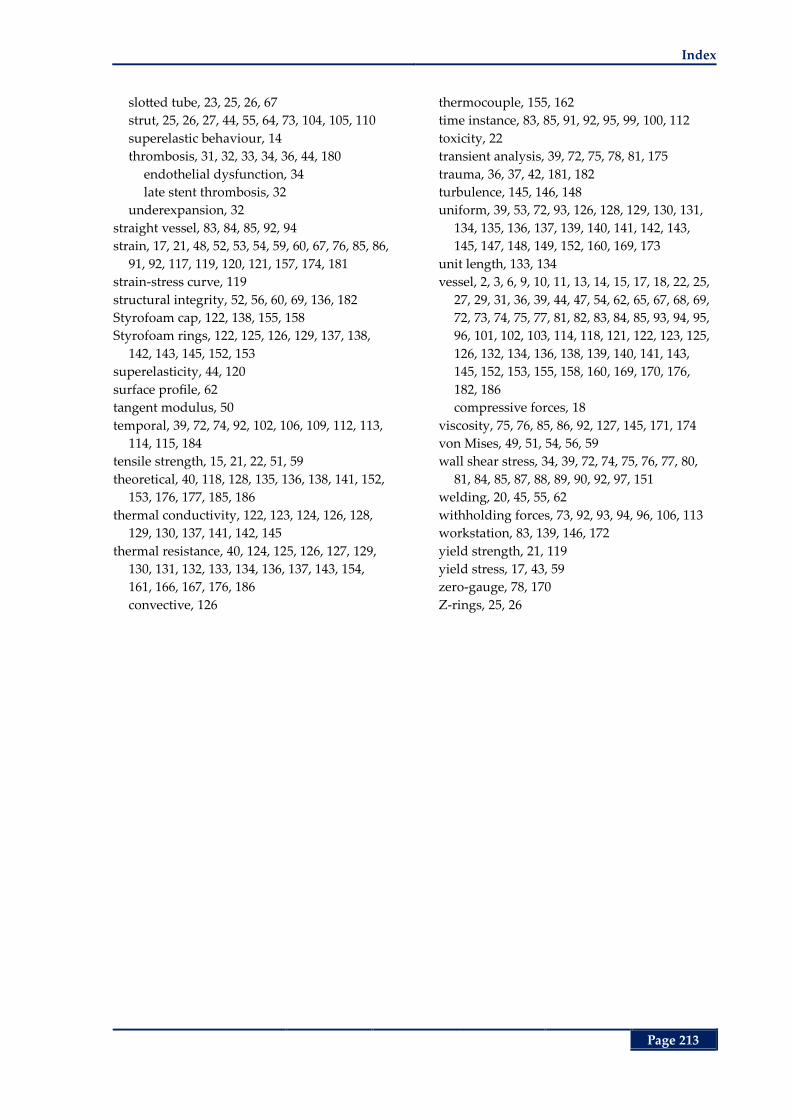
Index
Page 213
slotted tube, 23, 25, 26, 67
strut, 25, 26, 27, 44, 55, 64, 73, 104, 105, 110
superelastic behaviour, 14
thrombosis, 31, 32, 33, 34, 36, 44, 180
endothelial dysfunction, 34
late stent thrombosis, 32
underexpansion, 32
straight vessel, 83, 84, 85, 92, 94
strain, 17, 21, 48, 52, 53, 54, 59, 60, 67, 76, 85, 86,
91, 92, 117, 119, 120, 121, 157, 174, 181
strain-stress curve, 119
structural integrity, 52, 56, 60, 69, 136, 182
Styrofoam cap, 122, 138, 155, 158
Styrofoam rings, 122, 125, 126, 129, 137, 138,
142, 143, 145, 152, 153
superelasticity, 44, 120
surface profile, 62
tangent modulus, 50
temporal, 39, 72, 74, 92, 102, 106, 109, 112, 113,
114, 115, 184
tensile strength, 15, 21, 22, 51, 59
theoretical, 40, 118, 128, 135, 136, 138, 141, 152,
153, 176, 177, 185, 186
thermal conductivity, 122, 123, 124, 126, 128,
129, 130, 137, 141, 142, 145
thermal resistance, 40, 124, 125, 126, 127, 129,
130, 131, 132, 133, 134, 136, 137, 143, 154,
161, 166, 167, 176, 186
convective, 126
thermocouple, 155, 162
time instance, 83, 85, 91, 92, 95, 99, 100, 112
toxicity, 22
transient analysis, 39, 72, 75, 78, 81, 175
trauma, 36, 37, 42, 181, 182
turbulence, 145, 146, 148
uniform, 39, 53, 72, 93, 126, 128, 129, 130, 131,
134, 135, 136, 137, 139, 140, 141, 142, 143,
145, 147, 148, 149, 152, 160, 169, 173
unit length, 133, 134
vessel, 2, 3, 6, 9, 10, 11, 13, 14, 15, 17, 18, 22, 25,
27, 29, 31, 36, 39, 44, 47, 54, 62, 65, 67, 68, 69,
72, 73, 74, 75, 77, 81, 82, 83, 84, 85, 93, 94, 95,
96, 101, 102, 103, 114, 118, 121, 122, 123, 125,
126, 132, 134, 136, 138, 139, 140, 141, 143,
145, 152, 153, 155, 158, 160, 169, 170, 176,
182, 186
compressive forces, 18
viscosity, 75, 76, 85, 86, 92, 127, 145, 171, 174
von Mises, 49, 51, 54, 56, 59
wall shear stress, 34, 39, 72, 74, 75, 76, 77, 80,
81, 84, 85, 87, 88, 89, 90, 92, 97, 151
welding, 20, 45, 55, 62
withholding forces, 73, 92, 93, 94, 96, 106, 113
workstation, 83, 139, 146, 172
yield strength, 21, 119
yield stress, 17, 43, 59
zero-gauge, 78, 170
Z-rings, 25, 26

Index
Page 214
This page is left blank intentionally

Page 215
Biography
Biography
Arash Mehdizadeh was born in 1982, Kerman, Iran. In 2005, he
graduated from Amirkabir University of Technology (Tehran
Polytechnic), Tehran, Iran with a first class BSc honours among
the top 2% of students at the department of Computer
Engineering and IT. Consequently, he was admitted to pursue
his studies towards an MSc in his alma mater without
participating in the nationwide entrance exam. In early 2008 he
graduated from the department of Computer Engineering and IT
with the highest rank in Computer Systems Architecture. During
his BSc and MSc studies, he collaborated in several computer systems design projects
including the national Automatic Layout Synthesis Tool (ATLAS) taskforce where he
developed multi-layer cross-talk aware detail routing algorithms.
In late 2008 he was awarded an international postgraduate scholarship (ASI) from the
University of Adelaide to conduct his doctoral studies where he joined the Centre for
Biomedical Engineering (CBME) under supervision of Dr Said Al-Sarawi and Prof. Derek
Abbott at the School of Electrical and Electronic Engineering. In 2011 and 2012, he was a
visiting scholar at the Microsystems and Nanotechnology (MiNa) research group, University
of British Columbia, Vancouver, Canada, hosted by Prof. Kenichi Takahata. For this visit, he
was awarded a Research Abroad scholarship, The University of Adelaide, a BUPA
Postgraduate Travel grant, and a AUGU/RC Heddle Award travel scholarship. During his
studies, he was involved in a wide range of projects spanning from mechanical, chemical,
electrical and biomedical engineering. He received a Young Biomedical Engineer award by
Engineers Australia for best presentation at the Australian Biomedical Engineering
Conference (ABEC) in 2012. Throughout his MSc and PhD studies he also served as a
teaching assistant and part time lecturer for a number of courses including VLSI and Data
Path Systems, Automated Electronic Design, Digital Microelectronics and Mathematics.
His current research interests span several areas of biomedical engineering with a focus on
application of NEMS/MEMS technologies in biomedical devices, targeted drug delivery and
active smart implants. Moreover, he has been actively conducting research in development
and application of optimization methods as well as VLSI circuits and systems design.
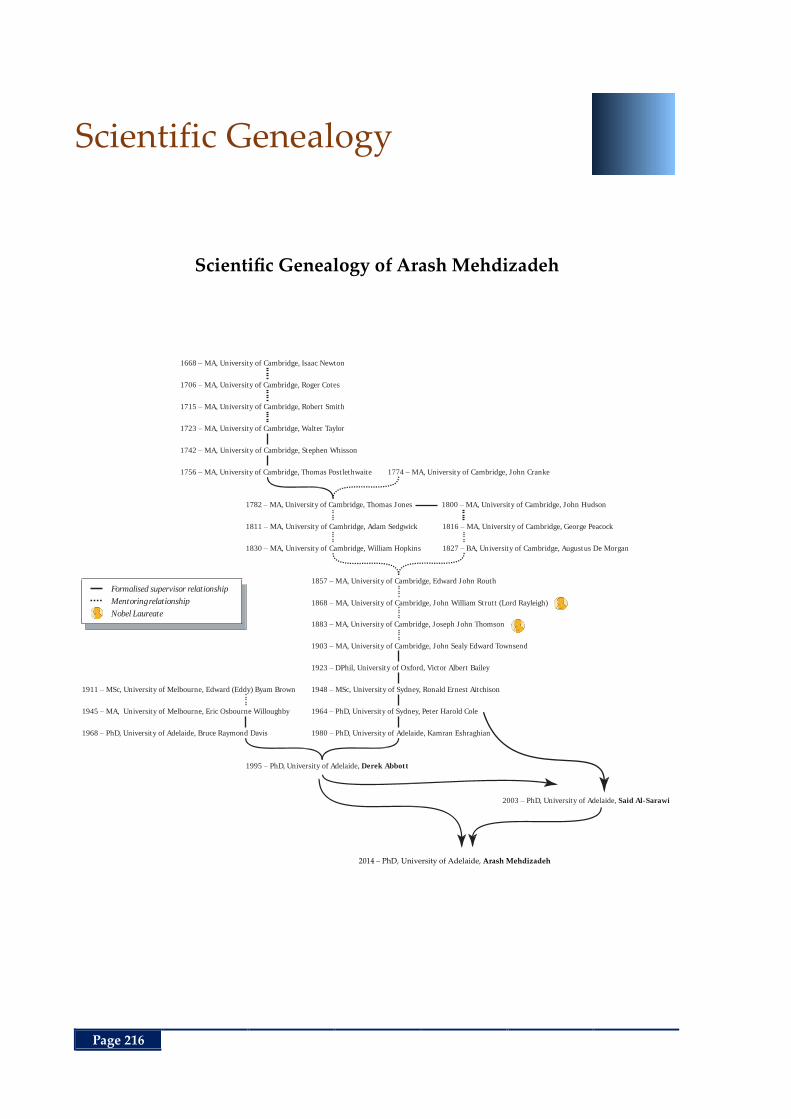
Page 216
Scientific Genealogy
Scientific Genealogy
Scientific Genealogy of Arash Mehdizadeh
1668 – MA, University of Cambridge, Isaac Newton
1706 – MA, University of Cambridge, Roger Cotes
1715 – MA, University of Cambridge, Robert Smith
1723 – MA, University of Cambridge, Walter Taylor
1742 – MA, University of Cambridge, Stephen Whisson
1756 – MA, University of Cambridge, Thomas Postlethwaite 1774 – MA, University of Cambridge, John Cranke
1782 – MA, University of Cambridge, Thomas Jones
1811 – MA, University of Cambridge, Adam Sedgwick
1830 – MA, University of Cambridge, William Hopkins
1800 – MA, University of Cambridge, John Hudson
1816 – MA, University of Cambridge, George Peacock
1827 – BA, University of Cambridge, Augustus De Morgan
1857 – MA, University of Cambridge, Edward John Routh
1868 – MA, University of Cambridge, John William Strutt (Lord Rayleigh)
1883 – MA, University of Cambridge, Joseph John Thomson
NOBEL
NOBEL
1903 – MA, University of Cambridge, John Sealy Edward Townsend
1923 – DPhil, University of Oxford, Victor Albert Bailey
1911 – MSc, University of Melbourne, Edward (Eddy) Byam Brown
1945 – MA, University of Melbourne, Eric Osbourne Willoughby
1968 – PhD, University of Adelaide, Bruce Raymond Davis
1948 – MSc, University of Sydney, Ronald Ernest Aitchison
1964 – PhD, University of Sydney, Peter Harold Cole
1980 – PhD, University of Adelaide, Kamran Eshraghian
1995 – PhD, University of Adelaide, Derek Abbott
2003 – PhD, University of Adelaide, Said Al-Sarawi
2013 - PhD submitted, University of Adelaide, Arash Mehdizadeh
Formalised supervisor relationship
Mentoring relationship
Nobel Laureate
2014 – PhD, University of Adelaide, Arash Mehdizadeh