Embed Size (px)
Citation preview
�����������������
Citation: Castaldo, R.; Garbino, N.;
Cavaliere, C.; Incoronato, M.; Basso,
L.; Cuocolo, R.; Pace, L.; Salvatore,
M.; Franzese, M.; Nicolai, E. A
Complex Radiomic Signature in
Luminal Breast Cancer from a
Weighted Statistical Framework: A
Pilot Study. Diagnostics 2022, 12, 499.
https://doi.org/10.3390/
diagnostics12020499
Academic Editor: Damiano Caruso
Received: 23 December 2021
Accepted: 12 February 2022
Published: 15 February 2022
Publisher’s Note: MDPI stays neutral
with regard to jurisdictional claims in
published maps and institutional affil-
iations.
Copyright: © 2022 by the authors.
Licensee MDPI, Basel, Switzerland.
This article is an open access article
distributed under the terms and
conditions of the Creative Commons
Attribution (CC BY) license (https://
creativecommons.org/licenses/by/
4.0/).
diagnostics
Article
A Complex Radiomic Signature in Luminal Breast Cancer froma Weighted Statistical Framework: A Pilot StudyRossana Castaldo 1, Nunzia Garbino 1 , Carlo Cavaliere 1 , Mariarosaria Incoronato 1 , Luca Basso 1,Renato Cuocolo 2,3,4 , Leonardo Pace 5 , Marco Salvatore 1 , Monica Franzese 1,*,† and Emanuele Nicolai 1,†
1 IRCCS Synlab SDN, Via E. Gianturco, 113, 80143 Naples, Italy; [email protected] (R.C.);[email protected] (N.G.); [email protected] (C.C.); [email protected] (M.I.);[email protected] (L.B.); [email protected] (M.S.); [email protected] (E.N.)
2 Department of Clinical Medicine and Surgery, University of Naples Federico II, 80138 Naples, Italy;[email protected]
3 Interdepartmental Research Center on Management and Innovation in Healthcare—CIRMIS,University of Naples Federico II, 80138 Naples, Italy
4 Laboratory of Augmented Reality for Health Monitoring (ARHeMLab), Department of Electrical Engineeringand Information Technology, University of Naples Federico II, 80138 Naples, Italy
5 Department of Medicine, Surgery and Dentistry “Scuola Medica Salernitana”, University of Salerno,84084 Fisciano, Italy; [email protected]
* Correspondence: [email protected]† These authors contributed equally to this work.
Abstract: Radiomics is rapidly advancing in precision diagnostics and cancer treatment. However,there are several challenges that need to be addressed before translation to clinical use. This studypresents an ad-hoc weighted statistical framework to explore radiomic biomarkers for a bettercharacterization of the radiogenomic phenotypes in breast cancer. Thirty-six female patients withbreast cancer were enrolled in this study. Radiomic features were extracted from MRI and PETimaging techniques for malignant and healthy lesions in each patient. To reduce within-subject bias,the ratio of radiomic features extracted from both lesions was calculated for each patient. Radiomicfeatures were further normalized, comparing the z-score, quantile, and whitening normalizationmethods to reduce between-subjects bias. After feature reduction by Spearman’s correlation, amethodological approach based on a principal component analysis (PCA) was applied. The resultswere compared and validated on twenty-seven patients to investigate the tumor grade, Ki-67 index,and molecular cancer subtypes using classification methods (LogitBoost, random forest, and lineardiscriminant analysis). The classification techniques achieved high area-under-the-curve values withone PC that was calculated by normalizing the radiomic features via the quantile method. Thispilot study helped us to establish a robust framework of analysis to generate a combined radiomicsignature, which may lead to more precise breast cancer prognosis.
Keywords: breast cancer; radiomic features; molecular biomarkers; normalization; PCA; machine learning
1. Introduction
Recently, radiomics has been widely used in tumor research. The enormous advan-tage of radiomics is the automatic extraction of high-dimensional features from digitallyencrypted medical images that hold information related to tumor pathophysiology, whichcan later be mined and analyzed for decision support [1–4].
Radiomics can support the characterization of tumor heterogeneity from macroscopicimages and may also provide insights in precision medicine related to tumor detection andsubtype classification along with molecular analyses [4–7].
Breast cancer is the most common malignant tumor in females [8]. Breast cancer can beclassified into molecular subtypes: (1) luminal-like, (2) Erb-B2+ (human epidermal growth
Diagnostics 2022, 12, 499. https://doi.org/10.3390/diagnostics12020499 https://www.mdpi.com/journal/diagnostics
Diagnostics 2022, 12, 499 2 of 21
factor receptor 2 [HER2]-enriched), and (3) basal-like, according to Perou et al. [9]. Luminal-like tumors are the most common type of breast cancer, and they can be subclassified intotwo subgroups, Luminal A and B, based also on the level of Ki-67 expression. Ki-67 hasbeen identified as a molecular marker for the effective assessment of the cell proliferationindex [10]. In the same way, the histologic grade (grades 1, 2, and 3) is used to determine theaggressiveness of a tumor. It provides prognostic information in many tumors, includingbreast cancer [11].
In this study, we focused our attention on the luminal A and luminal B subtypesof breast cancer. Several studies have also explored the use of radiomics to investigateLuminal A and B breast cancer patients [12–14].
In fact, radiomics is a non-invasive method that could provide characterization oftumors. On the other hand, the radiomic analysis workflow still needs to be improved inorder to overcome several problems for the construction of robust and reliable radiomicsignatures and models to be transferred into clinical practice for the purposes of prognosis,disease tracking, and the evaluation of disease response to treatment [15]. For instance, theradiomic signature is sensitive to variation in the medical images used in radiomic analysisin regard to image quantification and post-extraction feature normalization.
An important and often undervalued aspect in the radiomic framework of analysisis, in fact, post-extraction feature normalization. Normalization standards are neededfor quantitative radiomic features to reduce the within-subject bias effect that affects thecomparison of different radiomic features in a single patient (differences because of theconditions of interest) and the between-bias effect that alters the comparison of the radiomicfeatures among patients (namely technical effects, due to their basic differences of scale,range, and statistical distributions). Untransformed features may have high levels ofskewness, which can result in artificially low p-values in statistical analyses and eventuallyintroduce bias into developed models [16]. Errors in normalization can have a significantimpact on downstream analysis, such as inflated false positives.
In the existing literature, guidelines and precise criteria designed to be used consis-tently to normalize quantitative radiomic features seem to be missing [17]. On the otherside, several efforts have been shown to improve the normalization procedures for imagequality as a crucial pre-processing step to correct the imaging-related batch effects before ex-tracting quantitative radiomic features [15,18–21]. The most common image pre-processingfor the texture analysis approaches are the limitation of dynamics to µ ± 3σ (where µ isthe mean gray-level value and σ is the standard deviation) and gray level compressionbased on the range between δ and 2δ (where δ is the number of bits per pixel), amongothers [22,23]. Although image pre-processing normalization is decisive to reduce thetechnical variability across images, additional feature normalization steps are still neededduring post-processing to reduce the within-subject bias and between-subjects bias effectsand, in the case of quantitative features coming from a multicenter study, to identify abatch-specific transformation to express all the data in a common space. Therefore, it iscrucial to understand how normalization methods can impact on downstream analysis,such as feature reduction, statistical analysis, and classification problems.
In radiomics, there are different methods of dimensionality reduction and featureselection [24]. Principal component analysis (PCA) is a well-known approach and one of themost-used methods for feature reduction [25,26], although other methods for supervisedfeature selection, such as LASSO, have been widely used in radiomic studies. PCA aimsto create a smaller set of maximally uncorrelated variables from a large set of correlatedvariables and to explain as much of the total variation in the data set as possible withthe fewest possible principal components (PCs) [27,28].The PCs are linear combinationsof features that are ordered by the amount of total variance they explain. The first PCsrepresent the predominant pattern in the data [28,29]. Normalization methods can helpfeatures arrive in a more digestible form for these algorithms by making every feature inproportion with each other, otherwise they will tend to perform poorly [30]. In this study,PCA was firstly chosen as an explorative tool to visualize how the data normalization
Diagnostics 2022, 12, 499 3 of 21
methods are able to disclose different aspects of the data in the scores and the accompanyingloadings. Furthermore, it allows the identification of the most important radiomic featuresfor the characterization of breast cancer by analyzing the loadings in order to generate acombined radiomic signature [31].
The main aim of this study was to investigate the effect of within-subject and between-subjects normalization methods on the PCA and downstream analysis. In order to addressthis aim, we designed an ad hoc weighted statistical framework to investigate how differentnormalization techniques could impact on the PCA and data analysis to explore radiomicsignature in breast cancer.
Thus, the main goal of this study is to provide a multivariate statistical frameworkvia PCA to generate a complex quantitative radiomic signature, which may lead tomore precise breast cancer prognosis and help clinicians in decision-making towardspersonalized medicine.
2. Materials and Methods2.1. Patient Selection
The study was approved by the institutional ethics committee in accordance with theethical guidelines of the 1975 Declaration of Helsinki and approved by the ethical committeeof the institution “IRCCS Synlab SDN” (Protocol no.2-11). All subjects included in the studyprovided informed consent. The recruitment of the patients took place at IRCCS SynlabSDN. During the period of 2011 to 2014, consecutive patients were enrolled in the study.The inclusion criteria were (a) a diagnosis of breast cancer confirmed by an immunohisto-chemistry (IHC) report, (b) the absence of any prior surgical or pharmacological treatmentfor breast cancer (naïve), (c) a negative previous personal oncological history, (d) >18 yearsof age, and (e) lesions of at least 0.2 cm for a comprehensive imaging characterization.
Exclusion criteria were patients with (a) pregnancy; (b) blood glucose levels greaterthan 140 mg/dL (7.77 mmol/L); (c) inadequate PET images, MR images, or both, dueto artifacts, system malfunction, or poor patient cooperation; (d) contraindication to MRimaging; and (e) inability to tolerate being in the PET or MR imaging apparatus. After allthese exclusion criteria, 36 patients were included in the study.
2.2. Clinical Parameters
Among the 36 enrolled patients, clinical parameters were available for 27 femalepatients. All clinical characteristics, such as age, tumor size, tumor locations, numberof lesions, and tumor subtype, were recorded for each patient. The tumor size in eachenrolled patient was calculated on maximum intensity projection (MIP) of subtractionpost-contrast images [32]. One senior radiologist that was experienced in breast imaging(more than 15 years of experience) and one nuclear medicine specialist (more than 20 yearsof experience) reviewed the local tumor size, tumor locations, number of lesions, and tumorstaging in consensus.
Estrogen, progesterone, and HER2 receptor status were reported, along with thetumor molecular subtype classification, cellular differentiation status, and proliferationindex (Ki-67) of the tumor lesions using the immunohistochemical (IHC) information ofthe enrolled BC patients, if present.
2.3. Circulating miRNA Signatures
Quantification of miRNAs expression values using the miScript miRNA PCR Arrayand validation by real-time PCR (qRT-PCR) were performed according to the protocolproposed by M. Incoronato, et al. [33]. The relative expression for each miRNA was calcu-lated as 2−∆CT and from a differential expression analysis to discriminate the breast cancercondition with respect to healthy status [33]. In total, 5 (miR-125b-5p, miR-143-3p, miR-145-5p, miR-100-5p, and miR-23a-3p) out of the 84 miRNAs processed were differentiallyexpressed and upregulated in the plasma samples of the breast cancer patients with a foldchange ≥1.5 and a p-value < 0.05. Therefore, only those five miRNAs were considered in
Diagnostics 2022, 12, 499 4 of 21
the following analysis to evaluate, if present, possible associations with radiomic signaturescombined with clinical parameters.
2.4. Image Acquisition and Pre-Processing
PET/MR was performed on a 3T Biograph mMR (Siemens Healthcare, Erlangen, Ger-many). Bed position was established in order to obtain a full coverage of the breast regionusing a dedicated breast coil. Each patient was positioned prone and feet first, paying atten-tion to correctly position the breast inside the dedicated coil cavities. Through a venous ac-cess, the patient was connected to an automatic injector useful for the administration of thecontrast gadolinium diethylene triamine pentaacetate agent (Gd-DTPA; Magnevist, BayerInc., Mississauga, ON, Canada) at 0.1 mmol/kg body weight and a flow rate of 3.5 mL/s.For PET, all patients fasted for at least 6 h before the procedure. They then received400 ± 32 MBq (mean ± standard deviation) of 2-Deoxy-2-[18F] fluoroglucose(18F-FDG)intravenously. After a biodistribution period of 60 min and before breast PET/MR, allthe patients underwent total body PET/CT. Subsequently, a simultaneous PET/MR scanwas acquired. The PET/MRI sequences taken into account for this study were: a PETacquisition of 8 min; an axial T2-weighted half Fourier single-shot turbo spin echo (HASTE)(TR 1400 ms, TE 89 ms, slice thickness 6 mm, FOV 399 × 399 mm, acquisition matrix 384);an axial diffusion-weighted imaging (DWI) with b values of 50, 400 and 800 s/mm2 (TR7000 ms, TE 83 ms, slice thickness 4 mm, FOV 223 × 400 mm, acquisition matrix 190),with automatic apparent diffusion coefficient (ADC) map reconstruction; an axial high-resolution T1-weighted VIBE sequence with fat suppression was acquired after contrastagent injection (TR 8.69 ms, TE 4.33 ms, slice thickness 0.9, FOV 337 × 360 mm, acquisitionmatrix 192). The PET data were reconstructed with an AW OSEM 3D iterative reconstruc-tion algorithm applied with 3 iterations and 21 subsets and Gaussian smoothing of 4 mm infull width at half maximum. MR attenuation correction was performed via a segmentationapproach based on 2-point Dixon MRI sequences.
2.5. Radiomic Features
Radiomic features were extracted from 36 patients with PMOD, an automated quan-titative software of images in biomedical research (version 3.8, PMOD Technologies Ltd.,Zürich, Switzerland). Quantitative imaging was performed by the PMOD tool PBAS,performing a semi-automatic segmentation of breast lesions using a VOI isocontour. Thesemi-automatic segmentation of breast lesions was carefully supervised by an expertradiologist with more than 10 years of experience.
For this study, PET images and the MR sequences T2w HASTE, ADC, and T1w wereanalyzed post-contrast-injection after a 3D rigid registration with a normalized mutualinformation on PMOD. Firstly, the isocontour VOI was placed on the tumor lesion onPET acquisition by an experienced nuclear medicine physician, considering a metabolictumor volume (MTV) with a threshold of 40% of the maximum signal intensity (MTV40)for a volumetric characterization of lesion burden [34]. Then, the VOI was entirely copiedon the morphological T2w, ADC, and T1w sequences, verifying its coverage on the axial,sagittal, and coronal planes. Furthermore, for each patient and sequence, contralateralhealthy gland tissue information was obtained by translating the same VOI isocontourproduced previously in the same contralateral breast quadrant. For each VOI, the texture-analysis parameters were extrapolated using an integrated PMOD software. An exampleof an 18F-FDG-PET/MRI scan image is presented in Figure S1. Imaging normalizationand resampling were applied during pre-processing using the default parameters of thePMOD software.
A total of 74 radiomic features were extracted from the PET/MR imaging with the 3Dextraction. In total, 24 radiomic features were extracted from PET, including 5 first-orderfeatures from the intensity histogram computed on 256 bins (with a bin size of 32), namely,mean, variance, skewness, kurtosis, and energy, and 16 features from the SUV analysis.
Diagnostics 2022, 12, 499 5 of 21
From the MRI images, 5 first-order features were extracted from the intensity his-togram computed on 256 bins for each of the ADC, T2w, and T1w post-contrast sequences(mean, variance, skewness, kurtosis, and energy). In addition, 19 second-order featureswere also computed for the both the T2w and T1w post-contrast images [26,27], includingenergy, contrast, entropy, homogeneity, correlation, sum average, variance, dissimilarity,and autocorrelation.
A summary of the extracted radiomics features is presented in Table S1.
2.6. Statistical Analysis
A statistical analysis was performed using R software (version 3.6.1, Vienna, Austria) [31].Continuous variables were expressed as means, standard deviations (SD), medians andranges. The data were tested for normality through the Shapiro–Wilk test. Radiomicsdata were tested for normality before and after applying the normalization methods. TheWilcoxon rank-sum test or t-test were used, as required, for comparisons between groups.Categorical variables were expressed as percentages and were compared using the chi-square test or Fisher’s exact test. A p-value less than 0.05 was considered significant.Holm’s correction was used for multiple hypothesis correction, if necessary. Spearman’srank correlation was carried out for continuous variables. A Spearman’s ρ value greaterthan 0.8 and a significant p-value (p-value < 0.05) were set as the threshold to identify astrong agreement between variables. As a rule of thumb, a Spearman’s correlation ρ valuethat lies between 0.80 and 1.00 is considered to identify a strong correlation among thevariables, as also reported in [35].
2.6.1. Radiomic Statistical Analysis
Within-subject normalization was achieved as the ratio between the radiomic featuresextracted from the malignant and healthy breasts for each of the 36 patients enrolled inthis study. Successively, three different normalization techniques were, used to normalizethe radiomic features to also reduce between-subjects bias. The features were normalizedusing z-score normalization, where each feature was normalized as z = (x − x)/s, where x,x, and s are the feature, the mean, and the standard deviation, respectively [36]. Quantilenormalization, which transforms the original data to remove unwanted technical variationby forcing the observed distributions to be the same, and the average distribution, obtainedby taking the average of each quantile across samples, is used as the reference [37,38].Lastly, whitening normalization was used. This methos is based on a linear transformationthat converts a vector of random variables with a known covariance matrix into a set of newvariables whose covariance is the identity matrix, meaning that they are uncorrelated andeach have a variance equal to one [39]. The radiomic features were normalized separatelyfor each MRI sequence and PET [40].
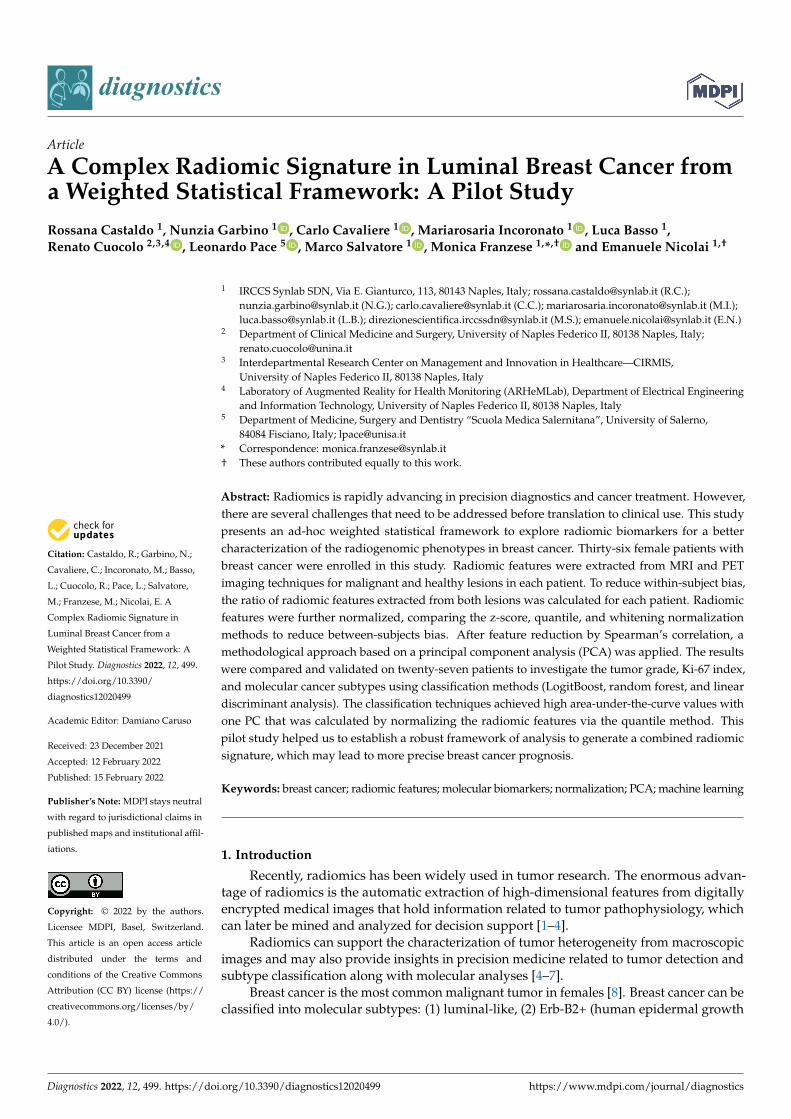
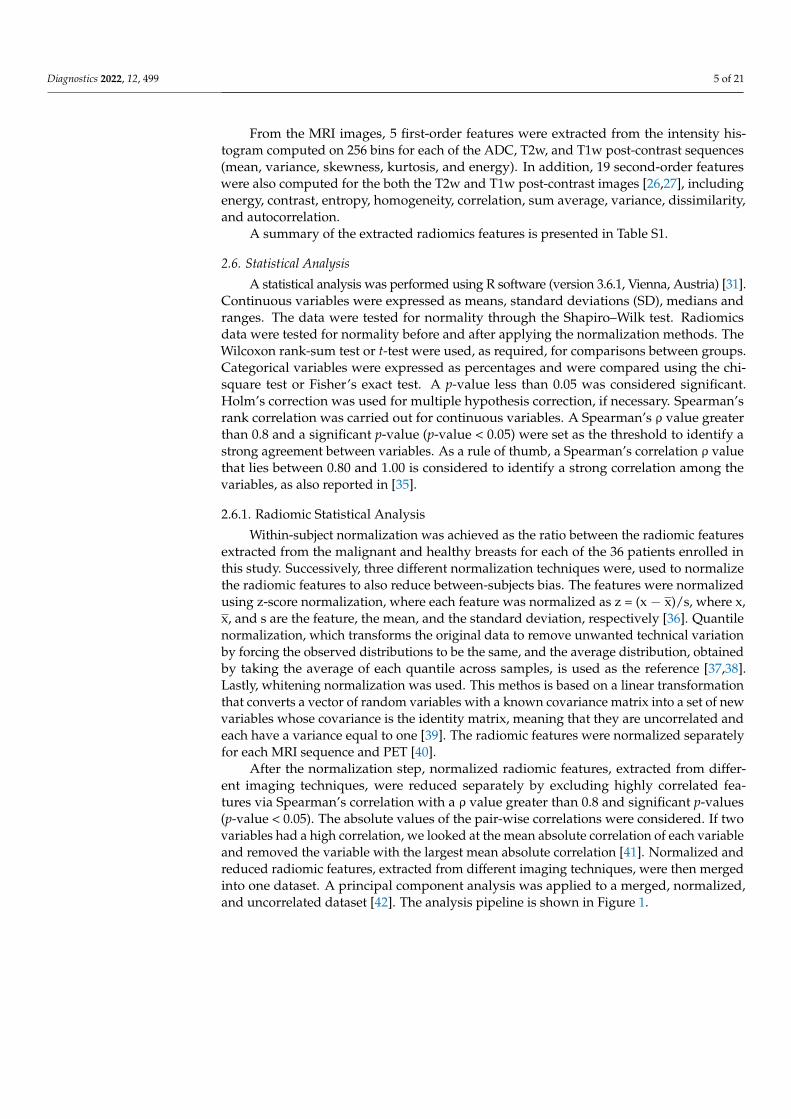
After the normalization step, normalized radiomic features, extracted from differ-ent imaging techniques, were reduced separately by excluding highly correlated fea-tures via Spearman’s correlation with a ρ value greater than 0.8 and significant p-values(p-value < 0.05). The absolute values of the pair-wise correlations were considered. If twovariables had a high correlation, we looked at the mean absolute correlation of each variableand removed the variable with the largest mean absolute correlation [41]. Normalized andreduced radiomic features, extracted from different imaging techniques, were then mergedinto one dataset. A principal component analysis was applied to a merged, normalized,and uncorrelated dataset [42]. The analysis pipeline is shown in Figure 1.
Diagnostics 2022, 12, 499 6 of 21Diagnostics 2022, 12, x FOR PEER REVIEW 6 of 21
Figure 1. Analysis Workflow.
2.6.2. PCA on Radiomic Features A PCA was applied to radiomic features in four datasets:
1. Radiomic features normalized as the ratio of malignant and healthy radiomic fea-tures.
2. Radiomic features normalized as the ratio of malignant and healthy radiomic fea-tures and z-scores.
3. Radiomic features normalized as the ratio of malignant and healthy radiomic fea-tures and quantiles.
4. Radiomic features normalized as the ratio of malignant and healthy radiomic fea-tures and whitening. Cumulative variance was set to 60% to select the minimum number of PCs. In order
to only select the normalization methods that were able to better explain the variance in the data via PCA, the median value was computed among the number of PCs that ex-plained 60% of the variance across datasets (1 to 4). The normalization methods that had more PCs compared to the median value were excluded from further analysis (Figure 2). The number of PCs across all datasets was set equal to the median value.
Figure 1. Analysis Workflow.
2.6.2. PCA on Radiomic Features
A PCA was applied to radiomic features in four datasets:
1. Radiomic features normalized as the ratio of malignant and healthy radiomic features.2. Radiomic features normalized as the ratio of malignant and healthy radiomic features
and z-scores.3. Radiomic features normalized as the ratio of malignant and healthy radiomic features
and quantiles.4. Radiomic features normalized as the ratio of malignant and healthy radiomic features
and whitening.
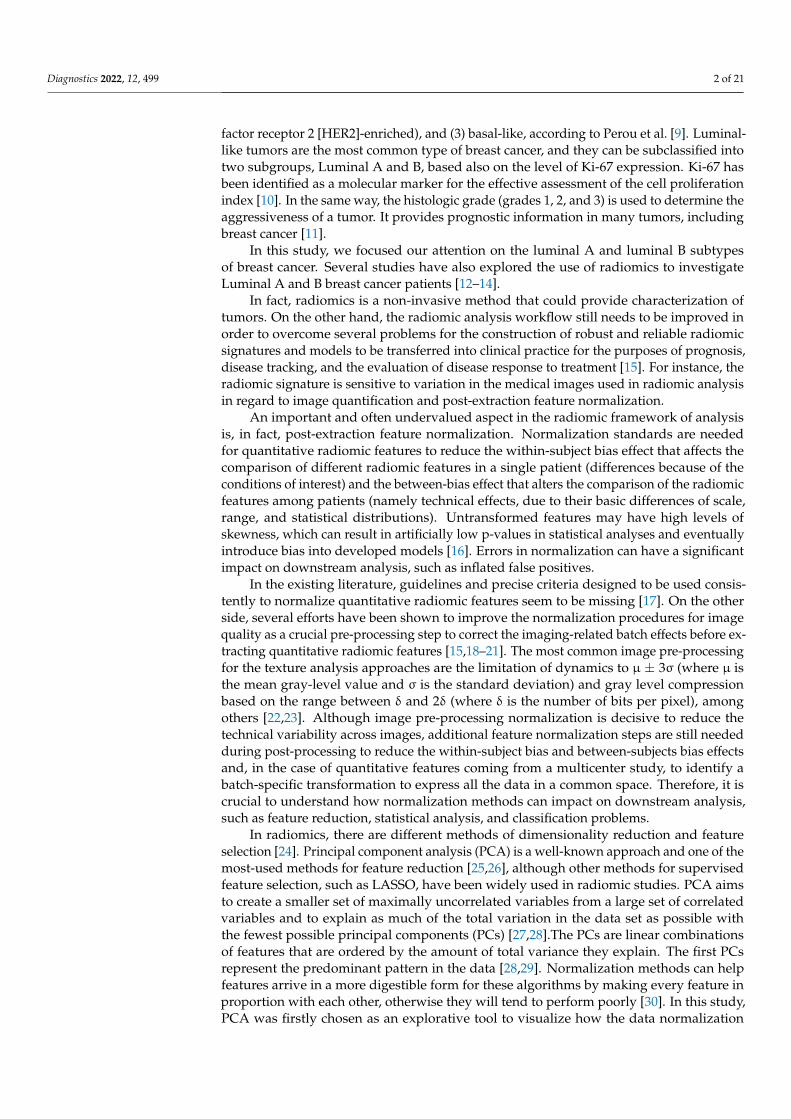
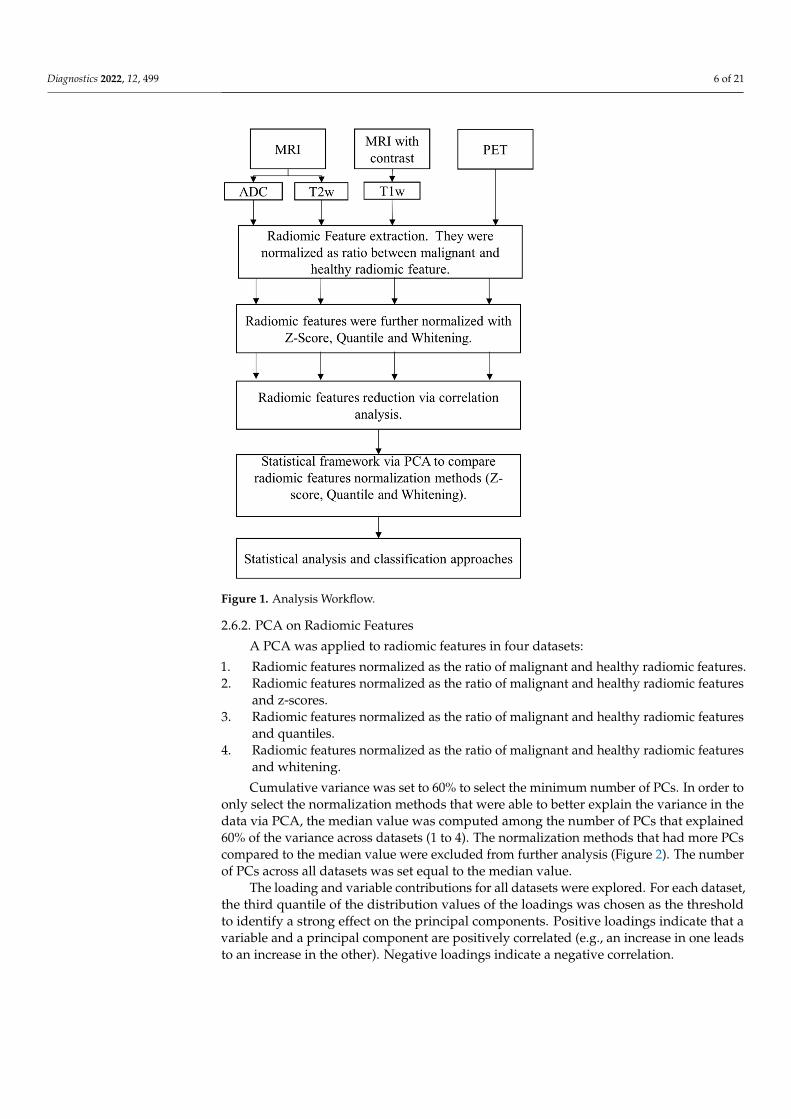
Cumulative variance was set to 60% to select the minimum number of PCs. In order toonly select the normalization methods that were able to better explain the variance in thedata via PCA, the median value was computed among the number of PCs that explained60% of the variance across datasets (1 to 4). The normalization methods that had more PCscompared to the median value were excluded from further analysis (Figure 2). The numberof PCs across all datasets was set equal to the median value.
The loading and variable contributions for all datasets were explored. For each dataset,the third quantile of the distribution values of the loadings was chosen as the thresholdto identify a strong effect on the principal components. Positive loadings indicate that avariable and a principal component are positively correlated (e.g., an increase in one leadsto an increase in the other). Negative loadings indicate a negative correlation.
Diagnostics 2022, 12, 499 7 of 21Diagnostics 2022, 12, x FOR PEER REVIEW 7 of 21
Figure 2. Workflow for PC reduction. PCA: principal component analysis; QNT: quantile normali-zation method; WHT: whitening normalization method; PCs: principal components; Th: threshold; MD: median.
The loading and variable contributions for all datasets were explored. For each da-taset, the third quantile of the distribution values of the loadings was chosen as the thresh-old to identify a strong effect on the principal components. Positive loadings indicate that a variable and a principal component are positively correlated (e.g., an increase in one leads to an increase in the other). Negative loadings indicate a negative correlation.
2.6.3. Clinical Investigation and Patient Stratification Statistical analyses were performed to explore the normalization impacts on the PCs
and radiomic features to investigate the grade, the Ki-67 index characterizing the aggres-siveness of the tumor, and the tumor subtype. Due to missing data, clinical investigations were carried out in 27 female patients.
Firstly, patients that presented with grade 2 tumors were divided from the patients that presented with grade 3 tumors. Therefore, patients were stratified by tumor grade in two classes: G2 and G3. None of the included patients presented with G1 tumors.
Secondly, the population was stratified into two classes to compare tumor conditions based on the nuclear protein Ki-67, which is considered a good indicator of cellular pro-liferation. The threshold value was fixed to 30% [43,44]. Therefore, patients presenting values of Ki-67 greater than 30% were included in Class 1 (i.e., high values of Ki-67), whereas patients presenting values of Ki-67 less than 30% were included in Class 2 (i.e., low values of Ki-67).
Thirdly, patients that presented with the luminal A tumor type were divided from the patients that presented with the luminal B tumor type. Therefore, patients were strat-ified by tumor subtype into two classes: Luminal A, Luminal B. HER2 (+) tumor cases were excluded at this stage due to the very low number of patients.
Figure 2. Workflow for PC reduction. PCA: principal component analysis; QNT: quantile normal-ization method; WHT: whitening normalization method; PCs: principal components; Th: threshold;MD: median.
2.6.3. Clinical Investigation and Patient Stratification
Statistical analyses were performed to explore the normalization impacts on the PCsand radiomic features to investigate the grade, the Ki-67 index characterizing the aggres-siveness of the tumor, and the tumor subtype. Due to missing data, clinical investigationswere carried out in 27 female patients.
Firstly, patients that presented with grade 2 tumors were divided from the patientsthat presented with grade 3 tumors. Therefore, patients were stratified by tumor grade intwo classes: G2 and G3. None of the included patients presented with G1 tumors.
Secondly, the population was stratified into two classes to compare tumor conditionsbased on the nuclear protein Ki-67, which is considered a good indicator of cellular prolifer-ation. The threshold value was fixed to 30% [43,44]. Therefore, patients presenting valuesof Ki-67 greater than 30% were included in Class 1 (i.e., high values of Ki-67), whereaspatients presenting values of Ki-67 less than 30% were included in Class 2 (i.e., low valuesof Ki-67).
Thirdly, patients that presented with the luminal A tumor type were divided from thepatients that presented with the luminal B tumor type. Therefore, patients were stratifiedby tumor subtype into two classes: Luminal A, Luminal B. HER2 (+) tumor cases wereexcluded at this stage due to the very low number of patients.
2.6.4. Classification Methods
The classification approaches were considered to automatically classify the tumorgrade, the tumor condition stratified via Ki-67, and the tumor subtype, based on statisti-cally significant PCs and the radiomic features that contributed the most to the staticallysignificant PCs and clinical characteristics. The classification approaches were investigatedto empirically understand the impact of the data normalizations and PCA. R software(version 3.6.1, Vienna, Austria) [31] was used to develop the classifiers.
Three traditional classification methods were investigated: additive logistic regression(LogitBoost), which is a boosting algorithm as an approximation to additive modellingon the logistic scale using the maximum Bernoulli likelihood as a criterion [45]; randomforest decision trees (RF), an ensemble learning method for classification that operates
Diagnostics 2022, 12, 499 8 of 21
by constructing a multitude of decision trees during training and outputting the classthat is the mode of the classes (classification) [46,47]; and linear discriminant analysis(LDA), which consists of finding the projection hyperplane that minimizes the interclassvariance and maximizes the distance between the projected means of the classes [48]. Theseclassification methods were chosen because of the nature of the datasets (i.e., small dataset)and according to the existing literature. In fact, LogitBoost, decision trees, and LDA havebeen widely used in breast cancer detection [24,49].
For LogistBoost and RF, we employed the default configuration provided in RStu-dio [41]. For LogistBoost, the number of boosting iterations was set to 100. In the randomforest analysis, the number of available variables for splitting at each tree node was calcu-lated as the square root of the number of predictor variables (rounded down). The repeated3-fold stratified cross-validation approach was used to validate the models [50,51]. Dueto the unbalanced nature of the dataset, the SMOTE technique was used to attenuate thebias towards the classification in the majority class in each training fold [52]. Repeatedcross-validation was performed to guarantee the robustness of the results and to reduceoverfitting [53]. Cross-validation was repeated 100 times. Binary classification performancemeasures were adopted according to standard formulae [54].
Due to the low number of patients included in the study, no more than 1 featurefor every 10 “observation/subject” presenting the outcome of interest was employed todevelop the models, as described in [55]. The models were trained and validated by usingrelevant statistical features (p-value less than 0.05) for the outcome of interest [17]. Thatmeans that predictors were evaluated independently before the data were applied to theclassification methods, as described in [24]. In fact, Zerouaoui et al. reported that themajority (47%) of the studies in the field of radiomic in breast cancer have used a priorifeature selection via filter methods.
Among the three different methods (LogitBoost, RF, and LDA) used to train andvalidate the classifiers, the best performing method was chosen as the one achieving thehighest value of sensitivity + specificity [56]. In fact, as a rule of thumb, this criterioncan help interpret the evidence on test performance. For a diagnostic or clinical test to beuseful, sensitivity + specificity should be around 1.5 (halfway between 1, which is useless,and 2, which is perfect) [56]. In the case of an equal value of sensitivity + specificity, themodel with the highest area under the curve (AUC), which is a reliable estimator of bothsensitivity and specificity rates, was considered.
Comparison analyses among the classification methods were also carried out via aWilcoxon sum-rank test over 100 repetitions. The values of sensitivity + specificity, Cohen’sKappa, and AUC were also graphically investigated via boxplots.
3. Results3.1. Study Population
For this study, we enrolled a total of 36 female patients who underwent MRI and PET.For 27 of them we reported the available clinical and molecular characteristics in Table 1.The breast cancer tumor molecular subtypes were classified according to the 2013 St. Gallenguidelines [57].
3.2. Radiomic Statistical Framework: Normalization and PCA
The majority of the radiomic features (≥86%) before and after normalization (z-scoreand quantile methods), extracted from 36 female patients, were non-normally distributedvia the Shapiro–Wilk test. For the radiomic features normalized via whitening methods,60% were non-normally distributed.
The radiomic features were first normalized as the ratio between the malignant featuresand healthy features. Successively, the radiomic features for each MRI sequence and PETwere normalized separately using the z-score, quantile, and whitening normalizationmethods. The goal of normalizing the feature separately for each dataset is to remove thefeature variability between the datasets [40].
Diagnostics 2022, 12, 499 9 of 21
Table 1. Patient characteristics.
Variables [N] Number ofMissing Patients Median Range
[max–min] Mean SD
Age (years) [N = 27] 0 57 82–35 55.259 13.75
circulating miR-125b-5p [N = 22] 5 0.017 0.102–0.006 0.026 0.024
circulating miR-143-3p [N = 22] 5 0.009 0.061–0.002 0.018 0.018
circulating miR-145-5p [N = 22] 5 0.006 0.045–0.002 0.012 0.012
circulating miR_100_5p [N = 19] 8 0.010 0.051–0.004 0.017 0.014
circulating miR_23a_3p [N = 19] 8 0.155 0.438–0.039 0.19 0.13
ESTROGEN RECEPTOR STATUS (%) [N = 23] 4 90 99–0.5 75.87 32.289
PROGESTERONE RECEPTOR STATUS (%) [N = 24] 3 55 99–0.5 52.979 38.606
HER2 STATUS (%) [N = 10] 17 90 99–60 84.2 15.747
Ki-67 (%) [N = 24] 3 40 80–5 41.25 26.996
Number of Patients Percentage (%)
Molecular subtype classification ER/PR/HER [N = 24]
3+/−/+ 1 4.17
+/+/− 13 54.17
+/+/+ 10 41.67
Grading [N = 19]
8G2 11 57.89
G3 8 42.11
Spearman’s rank correlation was used to exclude highly correlated features with athreshold of 0.8 separately for each of the MRI and PET sequences. A smaller subset offeatures was identified and PCA was applied to four datasets:
1. Radiomic features only normalized as the ratio of malignant and healthy radiomic features.2. Radiomic features normalized as the ratio of malignant and healthy radiomic features
and z-scores.3. Radiomic features normalized as the ratio of malignant and healthy radiomic features
and quantiles.4. Radiomic features normalized as the ratio of malignant and healthy radiomic features
and whitening.
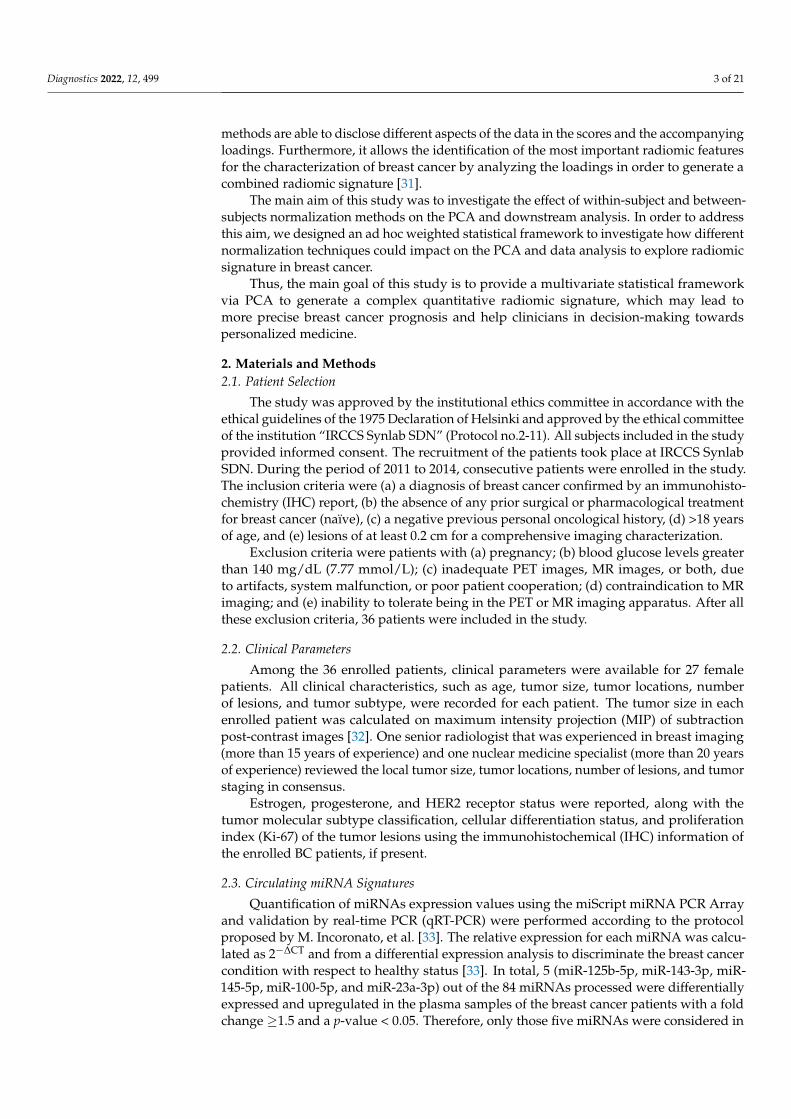
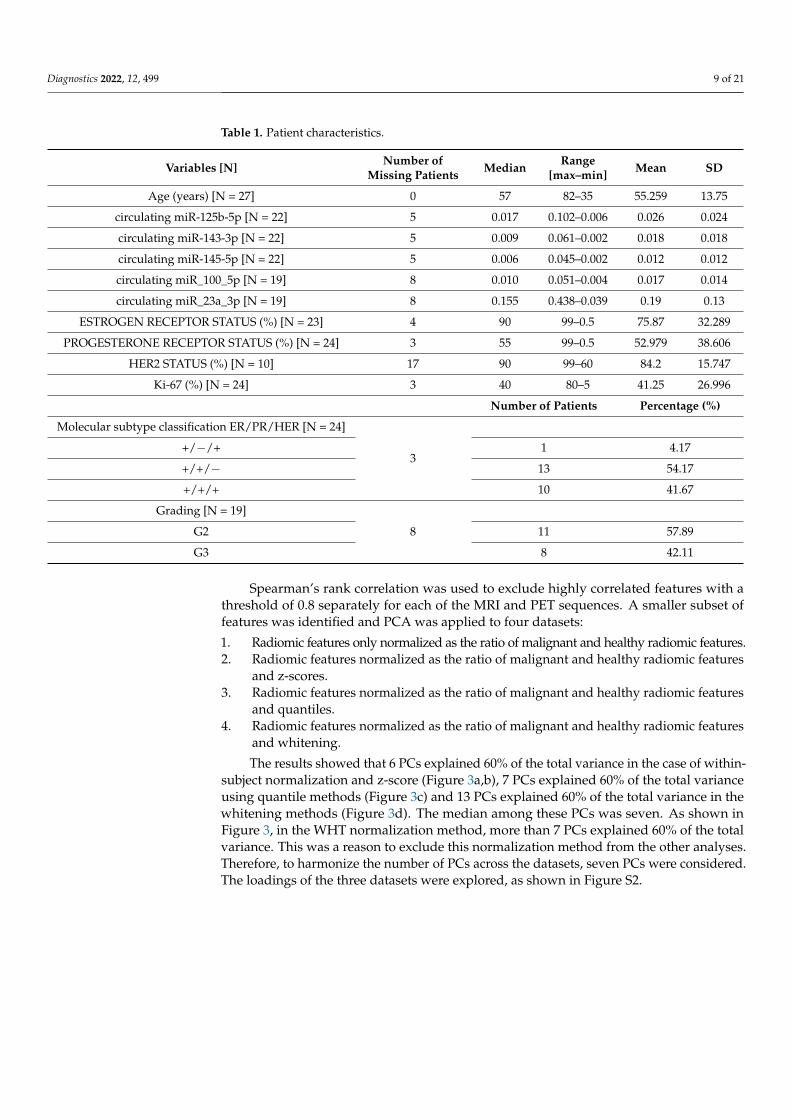
The results showed that 6 PCs explained 60% of the total variance in the case of within-subject normalization and z-score (Figure 3a,b), 7 PCs explained 60% of the total varianceusing quantile methods (Figure 3c) and 13 PCs explained 60% of the total variance in thewhitening methods (Figure 3d). The median among these PCs was seven. As shown inFigure 3, in the WHT normalization method, more than 7 PCs explained 60% of the totalvariance. This was a reason to exclude this normalization method from the other analyses.Therefore, to harmonize the number of PCs across the datasets, seven PCs were considered.The loadings of the three datasets were explored, as shown in Figure S2.
Diagnostics 2022, 12, 499 10 of 21
Diagnostics 2022, 12, x FOR PEER REVIEW 10 of 21
the total variance. This was a reason to exclude this normalization method from the other analyses. Therefore, to harmonize the number of PCs across the datasets, seven PCs were considered. The loadings of the three datasets were explored, as shown in Figure S2.
Figure 3. Cumulative variance plots for the 4 datasets, based on a threshold of 0.6. (a) Normalized only as the ratio of malignant and healthy radiomic features; (b) Z-Score; (c) quantile; and (d) whit-ening.
3.3. Clinical Investigation and Classification Approaches 3.3.1. Grade
Among the 19 patients that reported tumor grading, 11 were grade 2 and 8 patients were classified as grade 3. None of the patients included in the study presented with grade 1 tumors. From the statistical analysis, the circulating miRNA 125b_5p and PC3 from the quantile normalization dataset showed to be significantly different between the patients with grade 2 and grade 3 tumors (Figure 4).
Figure 3. Cumulative variance plots for the 4 datasets, based on a threshold of 0.6. (a) Normalized onlyas the ratio of malignant and healthy radiomic features; (b) Z-Score; (c) quantile; and (d) whitening.
3.3. Clinical Investigation and Classification Approaches3.3.1. Grade
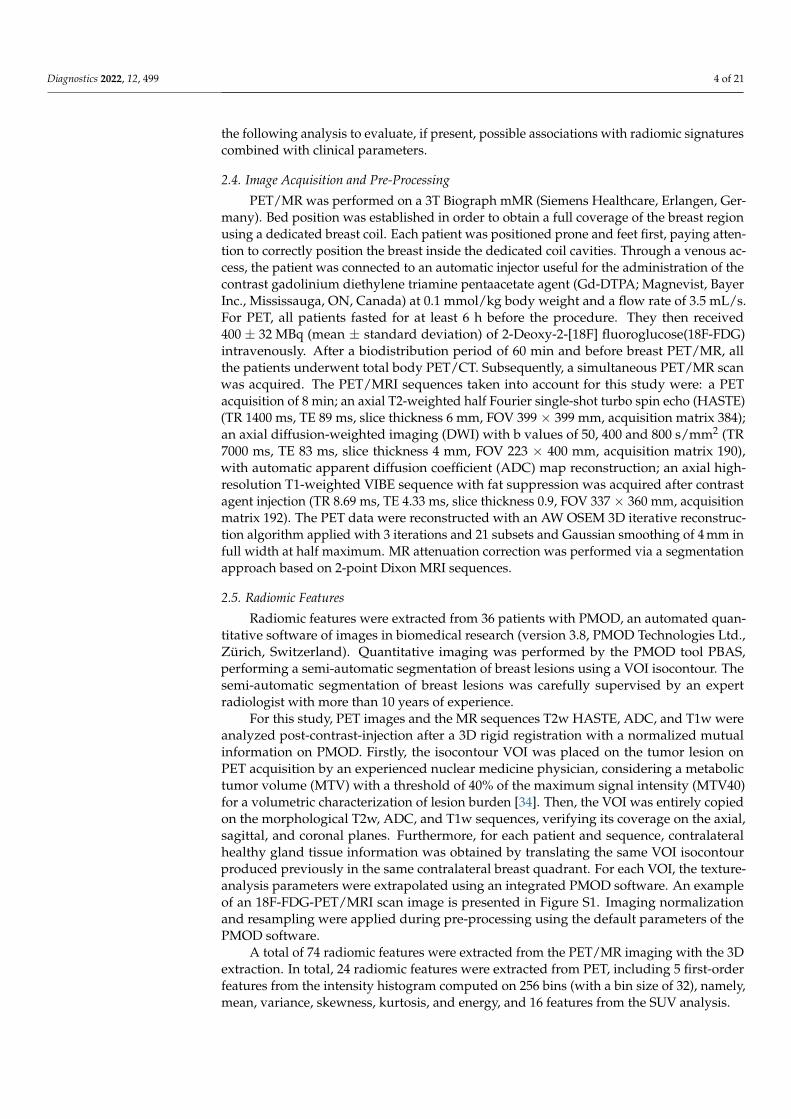
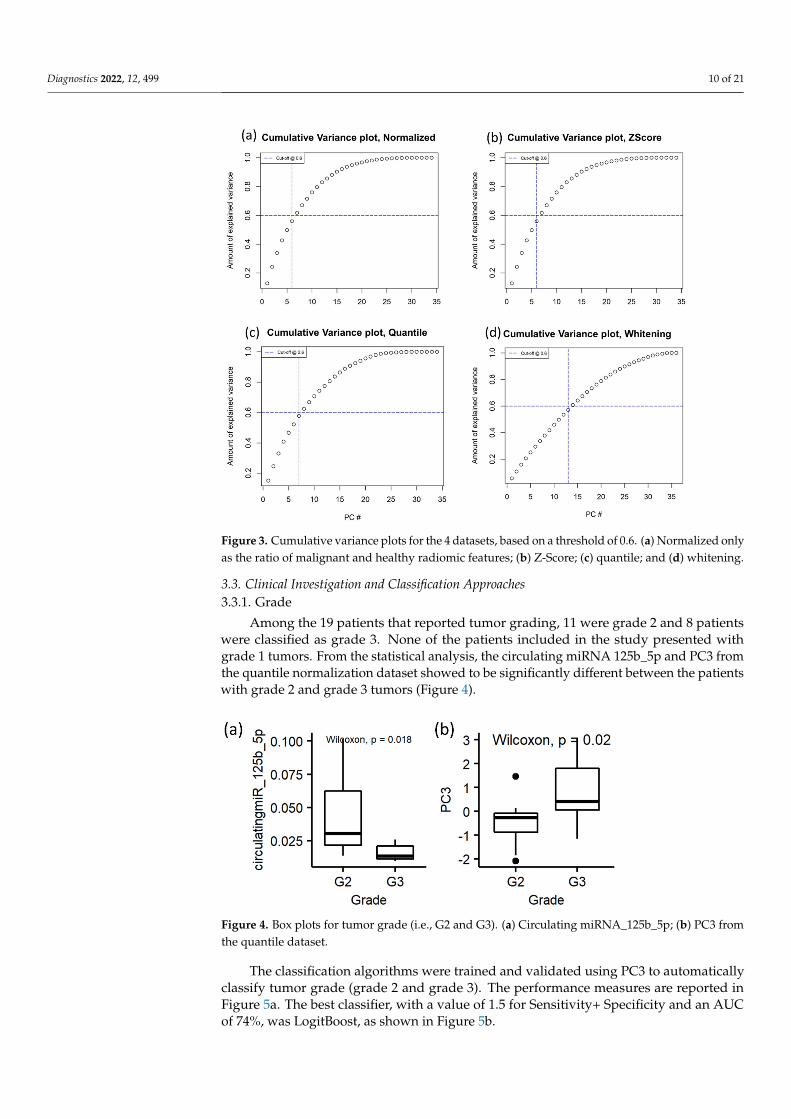
Among the 19 patients that reported tumor grading, 11 were grade 2 and 8 patientswere classified as grade 3. None of the patients included in the study presented withgrade 1 tumors. From the statistical analysis, the circulating miRNA 125b_5p and PC3 fromthe quantile normalization dataset showed to be significantly different between the patientswith grade 2 and grade 3 tumors (Figure 4).
Diagnostics 2022, 12, x FOR PEER REVIEW 10 of 21
the total variance. This was a reason to exclude this normalization method from the other analyses. Therefore, to harmonize the number of PCs across the datasets, seven PCs were considered. The loadings of the three datasets were explored, as shown in Figure S2.
Figure 3. Cumulative variance plots for the 4 datasets, based on a threshold of 0.6. (a) Normalized only as the ratio of malignant and healthy radiomic features; (b) Z-Score; (c) quantile; and (d) whit-ening.
3.3. Clinical Investigation and Classification Approaches 3.3.1. Grade
Among the 19 patients that reported tumor grading, 11 were grade 2 and 8 patients were classified as grade 3. None of the patients included in the study presented with grade 1 tumors. From the statistical analysis, the circulating miRNA 125b_5p and PC3 from the quantile normalization dataset showed to be significantly different between the patients with grade 2 and grade 3 tumors (Figure 4).
Figure 4. Box plots for tumor grade (i.e., G2 and G3). (a) Circulating miRNA_125b_5p; (b) PC3 fromthe quantile dataset.
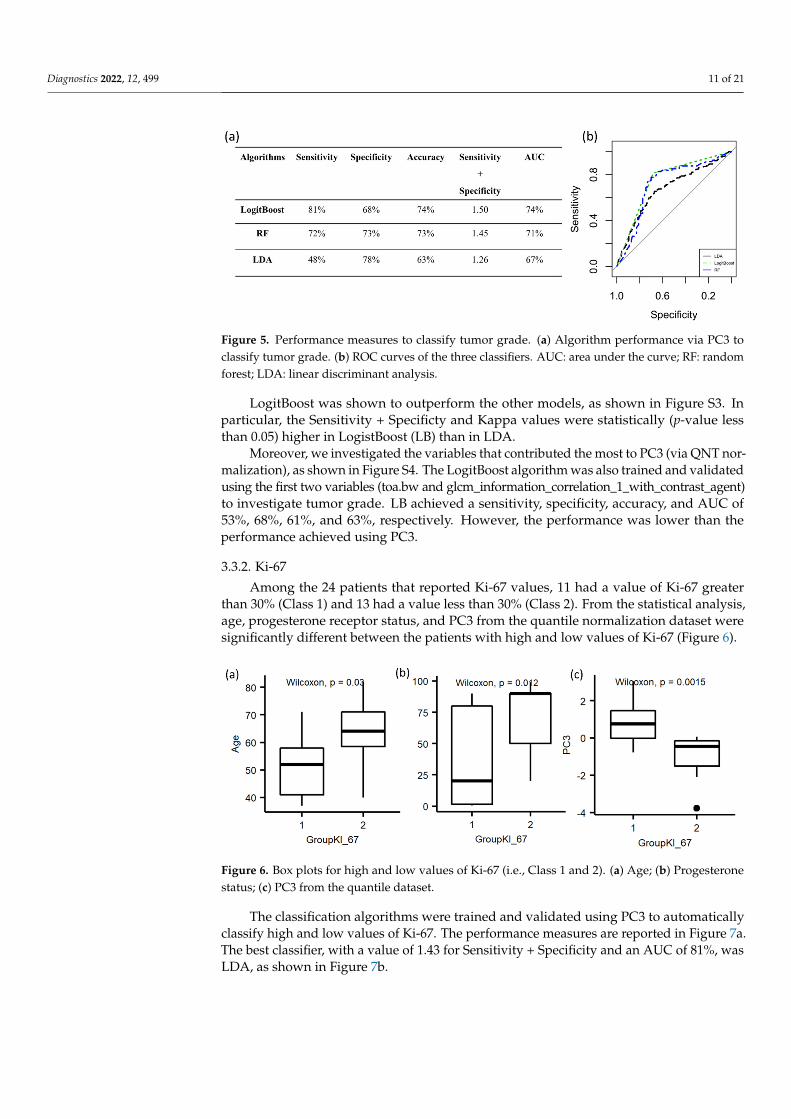
The classification algorithms were trained and validated using PC3 to automaticallyclassify tumor grade (grade 2 and grade 3). The performance measures are reported inFigure 5a. The best classifier, with a value of 1.5 for Sensitivity+ Specificity and an AUCof 74%, was LogitBoost, as shown in Figure 5b.
Diagnostics 2022, 12, 499 11 of 21
Diagnostics 2022, 12, x FOR PEER REVIEW 11 of 21
Figure 4. Box plots for tumor grade (i.e., G2 and G3). (a) Circulating miRNA_125b_5p; (b) PC3 from the quantile dataset.
The classification algorithms were trained and validated using PC3 to automatically classify tumor grade (grade 2 and grade 3). The performance measures are reported in Figure 5a. The best classifier, with a value of 1.5 for Sensitivity+ Specificity and an AUC of 74%, was LogitBoost, as shown in Figure 5b.
Figure 5. Performance measures to classify tumor grade. (a) Algorithm performance via PC3 to clas-sify tumor grade. (b) ROC curves of the three classifiers. AUC: area under the curve; RF: random forest; LDA: linear discriminant analysis.
LogitBoost was shown to outperform the other models, as shown in Figure S3. In particular, the Sensitivity + Specificty and Kappa values were statistically (p-value less than 0.05) higher in LogistBoost (LB) than in LDA.
Moreover, we investigated the variables that contributed the most to PC3 (via QNT normalization), as shown in Figure S4. The LogitBoost algorithm was also trained and validated using the first two variables (toa.bw and glcm_information_correla-tion_1_with_contrast_agent) to investigate tumor grade. LB achieved a sensitivity, speci-ficity, accuracy, and AUC of 53%, 68%, 61%, and 63%, respectively. However, the perfor-mance was lower than the performance achieved using PC3.
3.3.2. Ki-67 Among the 24 patients that reported Ki-67 values, 11 had a value of Ki-67 greater
than 30% (Class 1) and 13 had a value less than 30% (Class 2). From the statistical analysis, age, progesterone receptor status, and PC3 from the quantile normalization dataset were significantly different between the patients with high and low values of Ki-67 (Figure 6).
Figure 6. Box plots for high and low values of Ki-67 (i.e., Class 1 and 2). (a) Age; (b) Progesterone status; (c) PC3 from the quantile dataset.
Figure 5. Performance measures to classify tumor grade. (a) Algorithm performance via PC3 toclassify tumor grade. (b) ROC curves of the three classifiers. AUC: area under the curve; RF: randomforest; LDA: linear discriminant analysis.
LogitBoost was shown to outperform the other models, as shown in Figure S3. Inparticular, the Sensitivity + Specificty and Kappa values were statistically (p-value lessthan 0.05) higher in LogistBoost (LB) than in LDA.
Moreover, we investigated the variables that contributed the most to PC3 (via QNT nor-malization), as shown in Figure S4. The LogitBoost algorithm was also trained and validatedusing the first two variables (toa.bw and glcm_information_correlation_1_with_contrast_agent)to investigate tumor grade. LB achieved a sensitivity, specificity, accuracy, and AUC of53%, 68%, 61%, and 63%, respectively. However, the performance was lower than theperformance achieved using PC3.
3.3.2. Ki-67
Among the 24 patients that reported Ki-67 values, 11 had a value of Ki-67 greaterthan 30% (Class 1) and 13 had a value less than 30% (Class 2). From the statistical analysis,age, progesterone receptor status, and PC3 from the quantile normalization dataset weresignificantly different between the patients with high and low values of Ki-67 (Figure 6).
Diagnostics 2022, 12, x FOR PEER REVIEW 11 of 21
Figure 4. Box plots for tumor grade (i.e., G2 and G3). (a) Circulating miRNA_125b_5p; (b) PC3 from the quantile dataset.
The classification algorithms were trained and validated using PC3 to automatically classify tumor grade (grade 2 and grade 3). The performance measures are reported in Figure 5a. The best classifier, with a value of 1.5 for Sensitivity+ Specificity and an AUC of 74%, was LogitBoost, as shown in Figure 5b.
Figure 5. Performance measures to classify tumor grade. (a) Algorithm performance via PC3 to clas-sify tumor grade. (b) ROC curves of the three classifiers. AUC: area under the curve; RF: random forest; LDA: linear discriminant analysis.
LogitBoost was shown to outperform the other models, as shown in Figure S3. In particular, the Sensitivity + Specificty and Kappa values were statistically (p-value less than 0.05) higher in LogistBoost (LB) than in LDA.
Moreover, we investigated the variables that contributed the most to PC3 (via QNT normalization), as shown in Figure S4. The LogitBoost algorithm was also trained and validated using the first two variables (toa.bw and glcm_information_correla-tion_1_with_contrast_agent) to investigate tumor grade. LB achieved a sensitivity, speci-ficity, accuracy, and AUC of 53%, 68%, 61%, and 63%, respectively. However, the perfor-mance was lower than the performance achieved using PC3.
3.3.2. Ki-67 Among the 24 patients that reported Ki-67 values, 11 had a value of Ki-67 greater
than 30% (Class 1) and 13 had a value less than 30% (Class 2). From the statistical analysis, age, progesterone receptor status, and PC3 from the quantile normalization dataset were significantly different between the patients with high and low values of Ki-67 (Figure 6).
Figure 6. Box plots for high and low values of Ki-67 (i.e., Class 1 and 2). (a) Age; (b) Progesterone status; (c) PC3 from the quantile dataset. Figure 6. Box plots for high and low values of Ki-67 (i.e., Class 1 and 2). (a) Age; (b) Progesteronestatus; (c) PC3 from the quantile dataset.
The classification algorithms were trained and validated using PC3 to automaticallyclassify high and low values of Ki-67. The performance measures are reported in Figure 7a.The best classifier, with a value of 1.43 for Sensitivity + Specificity and an AUC of 81%, wasLDA, as shown in Figure 7b.
Diagnostics 2022, 12, 499 12 of 21
Diagnostics 2022, 12, x FOR PEER REVIEW 12 of 21
The classification algorithms were trained and validated using PC3 to automatically classify high and low values of Ki-67. The performance measures are reported in Figure 7a. The best classifier, with a value of 1.43 for Sensitivity + Specificity and an AUC of 81%, was LDA, as shown in Figure 7b.
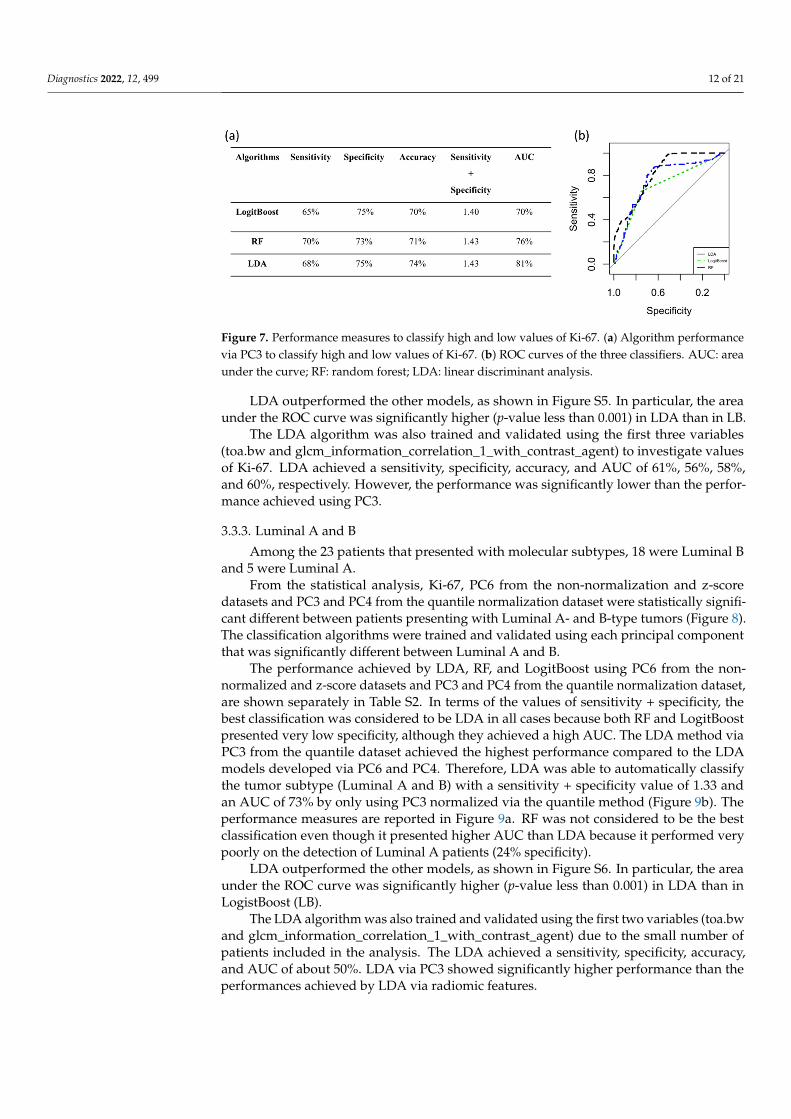
Figure 7. Performance measures to classify high and low values of Ki-67. (a) Algorithm performance via PC3 to classify high and low values of Ki-67. (b) ROC curves of the three classifiers. AUC: area under the curve; RF: random forest; LDA: linear discriminant analysis.
LDA outperformed the other models, as shown in Figure S5. In particular, the area under the ROC curve was significantly higher (p-value less than 0.001) in LDA than in LB.
The LDA algorithm was also trained and validated using the first three variables (toa.bw and glcm_information_correlation_1_with_contrast_agent) to investigate values of Ki-67. LDA achieved a sensitivity, specificity, accuracy, and AUC of 61%, 56%, 58%, and 60%, respectively. However, the performance was significantly lower than the per-formance achieved using PC3.
3.3.3. Luminal A and B Among the 23 patients that presented with molecular subtypes, 18 were Luminal B
and 5 were Luminal A. From the statistical analysis, Ki-67, PC6 from the non-normalization and z-score da-
tasets and PC3 and PC4 from the quantile normalization dataset were statistically signifi-cant different between patients presenting with Luminal A- and B-type tumors (Figure 8). The classification algorithms were trained and validated using each principal component that was significantly different between Luminal A and B.
Figure 7. Performance measures to classify high and low values of Ki-67. (a) Algorithm performancevia PC3 to classify high and low values of Ki-67. (b) ROC curves of the three classifiers. AUC: areaunder the curve; RF: random forest; LDA: linear discriminant analysis.
LDA outperformed the other models, as shown in Figure S5. In particular, the areaunder the ROC curve was significantly higher (p-value less than 0.001) in LDA than in LB.
The LDA algorithm was also trained and validated using the first three variables(toa.bw and glcm_information_correlation_1_with_contrast_agent) to investigate valuesof Ki-67. LDA achieved a sensitivity, specificity, accuracy, and AUC of 61%, 56%, 58%,and 60%, respectively. However, the performance was significantly lower than the perfor-mance achieved using PC3.
3.3.3. Luminal A and B
Among the 23 patients that presented with molecular subtypes, 18 were Luminal Band 5 were Luminal A.
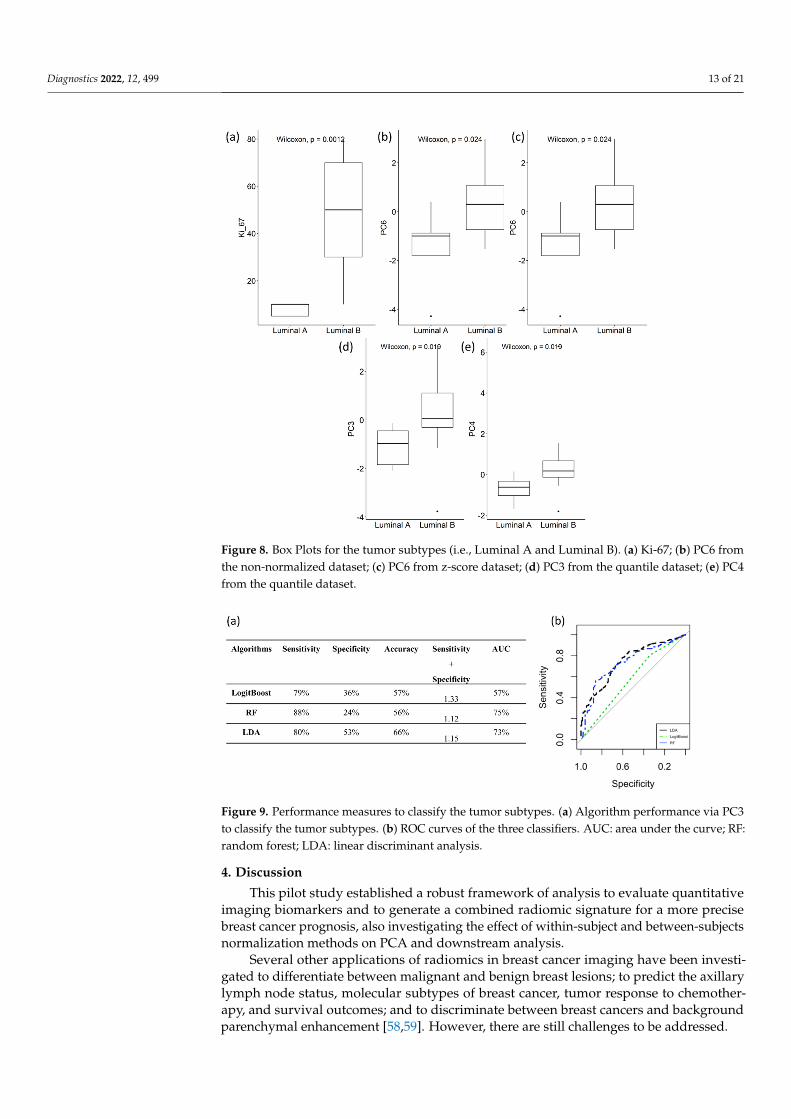
From the statistical analysis, Ki-67, PC6 from the non-normalization and z-scoredatasets and PC3 and PC4 from the quantile normalization dataset were statistically signifi-cant different between patients presenting with Luminal A- and B-type tumors (Figure 8).The classification algorithms were trained and validated using each principal componentthat was significantly different between Luminal A and B.
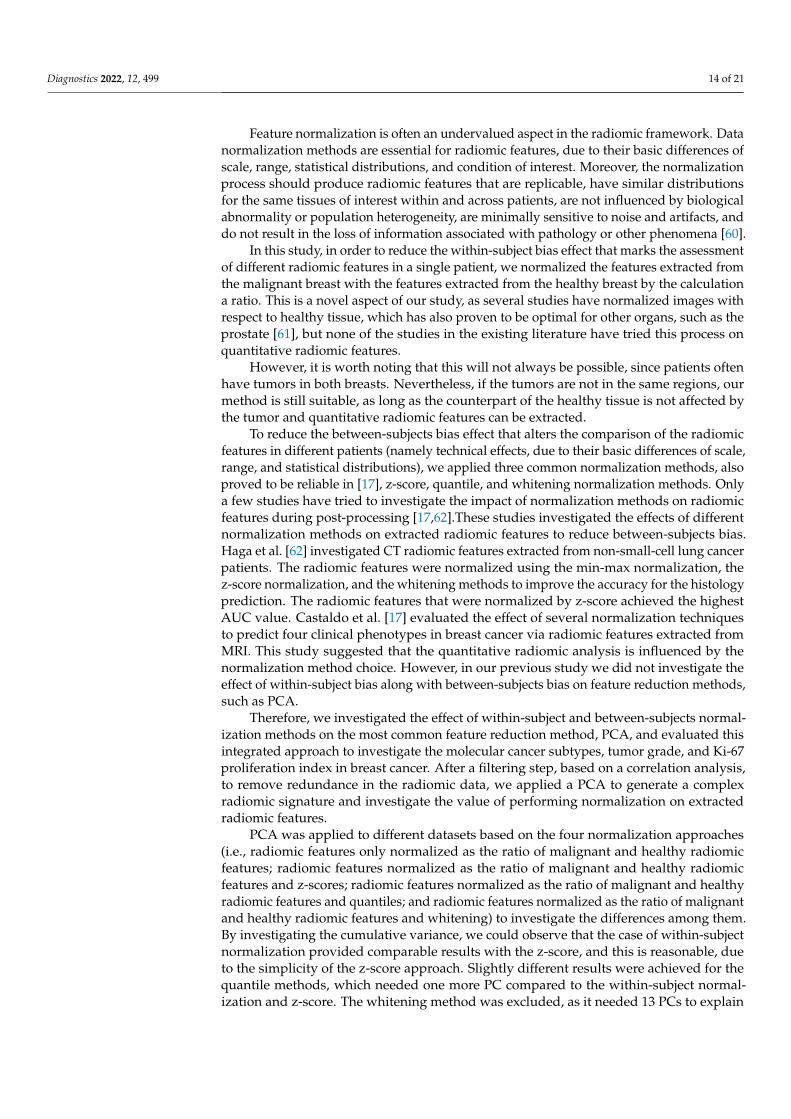
The performance achieved by LDA, RF, and LogitBoost using PC6 from the non-normalized and z-score datasets and PC3 and PC4 from the quantile normalization dataset,are shown separately in Table S2. In terms of the values of sensitivity + specificity, thebest classification was considered to be LDA in all cases because both RF and LogitBoostpresented very low specificity, although they achieved a high AUC. The LDA method viaPC3 from the quantile dataset achieved the highest performance compared to the LDAmodels developed via PC6 and PC4. Therefore, LDA was able to automatically classifythe tumor subtype (Luminal A and B) with a sensitivity + specificity value of 1.33 andan AUC of 73% by only using PC3 normalized via the quantile method (Figure 9b). Theperformance measures are reported in Figure 9a. RF was not considered to be the bestclassification even though it presented higher AUC than LDA because it performed verypoorly on the detection of Luminal A patients (24% specificity).
LDA outperformed the other models, as shown in Figure S6. In particular, the areaunder the ROC curve was significantly higher (p-value less than 0.001) in LDA than inLogistBoost (LB).
The LDA algorithm was also trained and validated using the first two variables (toa.bwand glcm_information_correlation_1_with_contrast_agent) due to the small number ofpatients included in the analysis. The LDA achieved a sensitivity, specificity, accuracy,and AUC of about 50%. LDA via PC3 showed significantly higher performance than theperformances achieved by LDA via radiomic features.
Diagnostics 2022, 12, 499 13 of 21Diagnostics 2022, 12, x FOR PEER REVIEW 13 of 21
Figure 8. Box Plots for the tumor subtypes (i.e., Luminal A and Luminal B). (a) Ki-67; (b) PC6 from the non-normalized dataset; (c) PC6 from z-score dataset; (d) PC3 from the quantile dataset; (e) PC4 from the quantile dataset.
The performance achieved by LDA, RF, and LogitBoost using PC6 from the non-nor-malized and z-score datasets and PC3 and PC4 from the quantile normalization dataset, are shown separately in Table S2. In terms of the values of sensitivity + specificity, the best classification was considered to be LDA in all cases because both RF and LogitBoost pre-sented very low specificity, although they achieved a high AUC. The LDA method via PC3 from the quantile dataset achieved the highest performance compared to the LDA models developed via PC6 and PC4. Therefore, LDA was able to automatically classify the tumor subtype (Luminal A and B) with a sensitivity + specificity value of 1.33 and an AUC of 73% by only using PC3 normalized via the quantile method (Figure 9b). The per-formance measures are reported in Figure 9a. RF was not considered to be the best classi-fication even though it presented higher AUC than LDA because it performed very poorly on the detection of Luminal A patients (24% specificity).
Figure 8. Box Plots for the tumor subtypes (i.e., Luminal A and Luminal B). (a) Ki-67; (b) PC6 fromthe non-normalized dataset; (c) PC6 from z-score dataset; (d) PC3 from the quantile dataset; (e) PC4from the quantile dataset.
Diagnostics 2022, 12, x FOR PEER REVIEW 13 of 21
Figure 8. Box Plots for the tumor subtypes (i.e., Luminal A and Luminal B). (a) Ki-67; (b) PC6 from the non-normalized dataset; (c) PC6 from z-score dataset; (d) PC3 from the quantile dataset; (e) PC4 from the quantile dataset.
The performance achieved by LDA, RF, and LogitBoost using PC6 from the non-nor-malized and z-score datasets and PC3 and PC4 from the quantile normalization dataset, are shown separately in Table S2. In terms of the values of sensitivity + specificity, the best classification was considered to be LDA in all cases because both RF and LogitBoost pre-sented very low specificity, although they achieved a high AUC. The LDA method via PC3 from the quantile dataset achieved the highest performance compared to the LDA models developed via PC6 and PC4. Therefore, LDA was able to automatically classify the tumor subtype (Luminal A and B) with a sensitivity + specificity value of 1.33 and an AUC of 73% by only using PC3 normalized via the quantile method (Figure 9b). The per-formance measures are reported in Figure 9a. RF was not considered to be the best classi-fication even though it presented higher AUC than LDA because it performed very poorly on the detection of Luminal A patients (24% specificity).
Figure 9. Performance measures to classify the tumor subtypes. (a) Algorithm performance via PC3to classify the tumor subtypes. (b) ROC curves of the three classifiers. AUC: area under the curve; RF:random forest; LDA: linear discriminant analysis.
4. Discussion
This pilot study established a robust framework of analysis to evaluate quantitativeimaging biomarkers and to generate a combined radiomic signature for a more precisebreast cancer prognosis, also investigating the effect of within-subject and between-subjectsnormalization methods on PCA and downstream analysis.
Several other applications of radiomics in breast cancer imaging have been investi-gated to differentiate between malignant and benign breast lesions; to predict the axillarylymph node status, molecular subtypes of breast cancer, tumor response to chemother-apy, and survival outcomes; and to discriminate between breast cancers and backgroundparenchymal enhancement [58,59]. However, there are still challenges to be addressed.
Diagnostics 2022, 12, 499 14 of 21
Feature normalization is often an undervalued aspect in the radiomic framework. Datanormalization methods are essential for radiomic features, due to their basic differences ofscale, range, statistical distributions, and condition of interest. Moreover, the normalizationprocess should produce radiomic features that are replicable, have similar distributionsfor the same tissues of interest within and across patients, are not influenced by biologicalabnormality or population heterogeneity, are minimally sensitive to noise and artifacts, anddo not result in the loss of information associated with pathology or other phenomena [60].
In this study, in order to reduce the within-subject bias effect that marks the assessmentof different radiomic features in a single patient, we normalized the features extracted fromthe malignant breast with the features extracted from the healthy breast by the calculationa ratio. This is a novel aspect of our study, as several studies have normalized images withrespect to healthy tissue, which has also proven to be optimal for other organs, such as theprostate [61], but none of the studies in the existing literature have tried this process onquantitative radiomic features.
However, it is worth noting that this will not always be possible, since patients oftenhave tumors in both breasts. Nevertheless, if the tumors are not in the same regions, ourmethod is still suitable, as long as the counterpart of the healthy tissue is not affected bythe tumor and quantitative radiomic features can be extracted.
To reduce the between-subjects bias effect that alters the comparison of the radiomicfeatures in different patients (namely technical effects, due to their basic differences of scale,range, and statistical distributions), we applied three common normalization methods, alsoproved to be reliable in [17], z-score, quantile, and whitening normalization methods. Onlya few studies have tried to investigate the impact of normalization methods on radiomicfeatures during post-processing [17,62].These studies investigated the effects of differentnormalization methods on extracted radiomic features to reduce between-subjects bias.Haga et al. [62] investigated CT radiomic features extracted from non-small-cell lung cancerpatients. The radiomic features were normalized using the min-max normalization, thez-score normalization, and the whitening methods to improve the accuracy for the histologyprediction. The radiomic features that were normalized by z-score achieved the highestAUC value. Castaldo et al. [17] evaluated the effect of several normalization techniquesto predict four clinical phenotypes in breast cancer via radiomic features extracted fromMRI. This study suggested that the quantitative radiomic analysis is influenced by thenormalization method choice. However, in our previous study we did not investigate theeffect of within-subject bias along with between-subjects bias on feature reduction methods,such as PCA.
Therefore, we investigated the effect of within-subject and between-subjects normal-ization methods on the most common feature reduction method, PCA, and evaluated thisintegrated approach to investigate the molecular cancer subtypes, tumor grade, and Ki-67proliferation index in breast cancer. After a filtering step, based on a correlation analysis,to remove redundance in the radiomic data, we applied a PCA to generate a complexradiomic signature and investigate the value of performing normalization on extractedradiomic features.
PCA was applied to different datasets based on the four normalization approaches(i.e., radiomic features only normalized as the ratio of malignant and healthy radiomicfeatures; radiomic features normalized as the ratio of malignant and healthy radiomicfeatures and z-scores; radiomic features normalized as the ratio of malignant and healthyradiomic features and quantiles; and radiomic features normalized as the ratio of malignantand healthy radiomic features and whitening) to investigate the differences among them.By investigating the cumulative variance, we could observe that the case of within-subjectnormalization provided comparable results with the z-score, and this is reasonable, dueto the simplicity of the z-score approach. Slightly different results were achieved for thequantile methods, which needed one more PC compared to the within-subject normal-ization and z-score. The whitening method was excluded, as it needed 13 PCs to explain
Diagnostics 2022, 12, 499 15 of 21
60% of total variance. This was expected, as the whitening method is highly sensitive tooutliers [63].
The same radiomic features contributed to the seven PCs for the within-subject nor-malization and z-score methods, whereas different radiomic features contributed to thePCs for the quantile method. This emphasizes that by applying different normalizationmethods we could achieve different results, and, therefore, great attention needs to be paidwhen working with quantitative radiomic features.
To further investigate the role that normalization methods have on the PCA-basedframework, we investigated whether quantitative radiomic features were able to differenti-ate among the tumor grades, aggressiveness of tumor, and luminal types in females withbreast cancer via statistical analysis and classification approaches.
Tumor grading, together with tumor size and lymph node stage, is often used tostratify individual patients for appropriate therapy. In particular, patients with grade2 and 3 tumors are referred to as high-risk patients [64]. In this study, we investigatedpatients presenting with grade 2 and 3 tumors. Regarding the statistical analysis, circulat-ingmiRNA_125b_5p and the third component (PC3) of the quantile normalization weresignificantly different among the patients presenting with grade 2 and 3 tumors. LogitBoostachieved an AUC of 74% to automatically identify high-risk patients (tumor grade 3) byusing only one PC.
We also investigated the Ki-67 index, which has recently attracted significant interestfrom clinical oncologists. In fact, the mitotic index (MI) and the Ki-67 index value are thetwo most commonly used indices to measure proliferation [65]. Moreover, certain studiesreported that the Ki-67 index value is a significant prognostic factor in terms of disease-freeand overall survival after initial treatment [66]. In general, high levels of Ki-67 expressionin breast cancer correlate strongly with a more tenacious proliferation and a poor prognosis.In this study the cut-off point for Ki-67 was set at 30% as recommended in [43,44]. Therefore,the data were split into low and high values of Ki-67 to assess the aggressiveness of thetumors. Age and progesterone receptor status were significantly higher in patients withhigh values of Ki-67, wheatears PC3 from the quantile dataset was significantly lower inpatients with high values of Ki-67. The best classifier was LDA, which achieved an AUC of81% to automatically detect patients with a high value of Ki-67 via only PC3.
Lastly, Luminal A and B were evaluated, as they are the most common tumor sub-types among the worldwide population. Luminal A tumors are more endocrine sensitive,indolent, and have a better prognosis; whereas luminal B are less endocrine sensitive, moreaggressive, and have worse prognosis. In fact, it has been demonstrated that luminal Bcancers are more progressive, as tumors usually exhibited more nodal metastasis thanin luminal A subtype [67,68]. Moreover, the main reason for attempting to distinguishbetween luminal A and luminal B tumors is because they respond differently to treat-ment [69]. Regarding the statistical analysis, Ki-67 and the third component (PC3) of thequantile normalization were statically different among subtypes A and B. Ki-67 level wasexpected to be statistically different, as it is recognized to be a surrogate of “Luminal A-like”disease [68]. The linear discriminant analysis method was also able to differentiate LuminalB with 75% AUC by using only one principial component via the quantile method. This wasin line with the recent literature, which states that radiomic assessment of breast imagingcan provide an option in determining breast cancer molecular subtypes [14].
The main aim of using the classification methods was to investigate the impactsof normalization methods and the use of PCA on classification performances. A recentstudy [70] also investigated the impact of 14 data normalization methods as pre-processingsteps on classification performance. They observed from the results that no single methodoutperformed the others on 21 publicly available real and synthetic datasets. According toSingh et al. [70], z-score performed better than non-normalized methods. However, theydid not investigate the quantile or whitening methods.
Diagnostics 2022, 12, 499 16 of 21
Overall, the classification methods achieved good results in detecting tumor subtypes,grade, and aggressiveness by using only the third principial component of the radiomicfeatures normalized by the quantile methods.
The first 10 radiomic features that contributed to PC3 came from the first-order grey-level statistics features (such as energy and skewness) and SUV parameters (the sum ofall VOI pixel values) from the PET technique, two features (skewness and variance) camefrom ADC-MRI, and the majority came from the grey-level co-occurrence matrix-basedfeatures from the T1w-MRI. Lastly, only one feature quantifying the complexity of thetumor texture was from the T2-wMRI. This demonstrated that a linear combination ofMRI-based and PET-based radiomic features are able to characterize molecular prognosticindicators in females affected by breast cancer. These results are also supported by therecent literature data that indicate that features obtained from PET and MRI correlate withtumor histological characteristics and molecular subtypes [71–75]. Moreover, by using onlythe first two radiomic features that contributed to PC3, no improvements in the resultswere shown. In particular, both the accuracy and AUC were significantly (p-value < 0.05)higher in the models developed by using only one principal component. This result isworth noting, as, by applying PCA, a combination of features allows a better classificationof tumor subtype, grade, and aggressiveness. One of the drawbacks of PCA is that PCs arenot as readable and interpretable as the original radiomic features. Conversely, the mainadvantages of using PCA is to maintain accuracy and make datasets easier to understand.Moreover, using PCA in small dataset can help to generate a quantitative radiomic signaturein a composite indicator, where principal components are the linear combination of yourradiomic features.
This is particularly relevant when a small dataset is available, as, by rule of thumb, onepredictor for every 10 events should be used in classification tasks [17,55]. This result is inline also with Mert et al. [76], who demonstrated that the use of feature reduction methods,such as a pre-processing step to classification analysis, can be a high-performance solution.
Five circulating miRNAs were selected in this study (miR-125b-5p, miR-143-3p, miR-145-5p, miR-100-5p, and miR-23a-3p) because they showed to be significantly upregulated(p < 0.05) in breast cancer patients vs. healthy donors, as reported in [33]. Although theyare not all well-accepted biomarkers for breast cancer yet, Incoronato et al. found that theexpression levels of miR-125b-5p were variable and depended on the severity of the disease.Additionally, the expression levels of miR-143-3p reached expression values close to thoseof healthy donors in cancer stage IV. This result suggested that at stage IV, this molecule isnot required for the maintenance of the pathology. Regarding miR-145-5p, Tang et al. [77]reported that miR-145-5p played a suppressive role in the proliferation of breast cancer cellsand that it is a putative biomarker for risk assessment in patients with breast cancer. Lastly,in vitro functional experiments demonstrated that overexpression of miR-100 inhibited theproliferation, migration, and invasion of breast cancer cells, which suggests that miR-100may be used as a potential molecular marker and target for the diagnosis and treatment ofmetastatic breast cancer, as suggested by [78].
The association between circulating miRNA and PCs was investigated via a correlationanalysis. None of the principal components for all three normalization methods (within-normalization, z-score, and quantile) showed significant associations with the circulatingmiRNA. This may be due to the low number of patients (40% of the included patients) thatreported the values for the circulating miRNA. However, circulating miRNA125b_5p wassignificantly different between the patients with grade 2 and 3 tumors. In particular, it wassignificantly lower in grade 3 breast cancer patients.
In conclusion, we provided a statistical framework that combines several approachesto generate a quantitatively robust and replicable radiomic signature, which may leadto more precise breast cancer prognosis and help clinicians in decision-making towardspersonalized medicine.
However, this study presents some limitations. Intra-reader agreement was notassessed for the segmentation of the lesions. This was mainly due to the fact that in
Diagnostics 2022, 12, 499 17 of 21
this study we performed semi-automatic segmentation of breast lesions, which reducesegmentation time and inter- and intra-reader variability [79]. In fact, variation due tomanual segmentation could be reduced or eliminated by semi-automated or completelyautomated segmentation algorithms. Moreover, the semi-automatic segmentation of breastlesions was carefully supervised by an expert radiologist with more than 10 years ofexperience. Moreover, in this study we only investigated first order and second order MRIradiomic features. In future studies, high-order radiomic features will be also considered inthe framework of analysis.
The main limitation of our study was that the patient sample that reported additionalclinal information was relatively small and unbalanced. We developed the frameworkof analysis on 36 patients using their MRI and PET radiomic features. Then, we used asmaller sample of 27 patients to validate our approach. In addition, our study lacks furthervalidation on a bigger cohort. As we are aware that the results generated on a small samplesize cannot lead to a generalized conclusion, future studies will validate the results fromthis pilot study on a larger dataset. However, we applied several methodological steps toovercome this issue: (1) We used traditional machine learning which has less computationalcomplexity than the more advanced ML algorithms and, therefore, less parameters to trainreducing overfitting [80]. (2) Due to the low number of patients included in the study,no more than 1 feature for every 10 patients was employed to develop the models, asdescribed in [55]. (3) We balanced the dataset with synthetic samples (SMOTE) [81].(4) Repeated cross-validation (N = 100) was performed to guarantee the robustness of theresults and to reduce overfitting [82]. Moreover, due to the limit of small sample, thisradiomic framework may not stand for all subtypes of breast cancer, as we have onlyinvestigated specific subtypes (Luminal A and B).
After this pilot study, which helped us to establish a robust workflow of analysis,upcoming work will include studies on a larger and more recent clinically annotated dataset to verify and validate the results from this study. We will further assess the role ofthe MRI and PET phenotypes in combination with genomic and clinical information toimprove the prediction power of the machine-learning-based models. At the same time,with this study we are notifying other researchers to implement a multivariate statisticalframework of radiomic analysis for post-acquisition extraction and data processing, inorder to ensure more robust findings.
5. Conclusions
This pilot study aimed to design a weighted statistical framework investigating thestability of the radiomic features of robustness and repeatability applied to MRI and PETanalysis in general and evaluated the impact of normalization methods to generate acomplex radiomic signature in breast cancer imaging, specifically. To conclude, the resultsfrom this study demonstrate that a combination of quantitative radiomic analysis via PCAshows potential as a means for high-throughput image-based phenotyping to automaticallydetect the grade, aggressiveness of the tumor, and breast cancer subtype.
Supplementary Materials: The following supporting information can be downloaded at: https://www.mdpi.com/article/10.3390/diagnostics12020499/s1, Table S1: Description of Radiomic Fea-tures, Table S2: Modelling Performance to Detect Tumor Subtypes (Luminal A and B), Figure S1:18F-FDG-PET/MRI scan image, Figure S2: Loading plots for three datasets, Figure S3: Comparisonamong models (LB: LogistBoost, LDA: Linear decision Analysis, and RF: Random Forest) used toclassify tumor grade, Figure S4: PC3 quantile. Top 10 variable contribution, Figure S5: Comparisonamong models (LB: LogistBoost, LDA: Linear decision Analysis, and RF: Random Forest) used toclassify high- and low-values of KI_67, Figure S6: Comparison among models (LB: LogistBoost, LDA:Linear decision Analysis, and RF: Random Forest) used to classify tumor subtype.
Author Contributions: Conceptualization, M.F., L.P., E.N. and M.S.; methodology, R.C. (RossanaCastaldo), M.F., M.I., N.G., L.B. and C.C.; software, R.C. (Rossana Castaldo); validation, R.C. (RossanaCastaldo), M.F., R.C. (Renato Cuocolo) and M.I.; formal analysis, R.C. (Rossana Castaldo), M.F.,M.I., N.G. and L.B.; investigation, R.C. (Rossana Castaldo) and M.F.; resources, M.S. and E.N.; data
Diagnostics 2022, 12, 499 18 of 21
curation, N.G., L.B., C.C., M.I. and E.N.; writing—original draft preparation, R.C. (Rossana Castaldo)and M.F.; writing—review and editing, R.C. (Rossana Castaldo), M.F., R.C. (Renato Cuocolo), M.I.,C.C., E.N., L.P. and M.S.; supervision, M.F., E.N., L.P. and M.S. All authors have read and agreed tothe published version of the manuscript.
Funding: This work was supported by the Ministry of Health under contract “Ricerca CorrenteRRC-2022-23680785”.
Institutional Review Board Statement: The study was conducted according to the guidelines of theDeclaration of Helsinki and approved by the Institutional Review Board of IRCCS SDN (Protocolno.2-11, approved 7 June 2011 by Ethical Committee IRCCS Fondazione SDN).
Informed Consent Statement: Informed consent was obtained from all subjects involved in thestudy. Written informed consent has been obtained from the patients to publish this paper.
Data Availability Statement: The raw data supporting the conclusions of this article will be madeavailable by the authors, without undue reservation.
Conflicts of Interest: The authors declare no conflict of interest.
References1. Lambin, P.; Leijenaar, R.T.H.; Deist, T.M.; Peerlings, J.; de Jong, E.E.C.; van Timmeren, J.; Sanduleanu, S.; Larue, R.T.H.M.;
Even, A.J.G.; Jochems, A.; et al. Radiomics: The bridge between medical imaging and personalized medicine. Nat. Rev. Clin.Oncol. 2017, 14, 749–762. [CrossRef] [PubMed]
2. Gillies, R.J.; Kinahan, P.E.; Hricak, H. Radiomics: Images Are More than Pictures, They Are Data. Radiology 2016, 278, 563–577.[CrossRef] [PubMed]
3. Aerts, H.J.; Velazquez, E.R.; Leijenaar, R.T.H.; Parmar, C.; Grossmann, P.; Carvalho, S.; Bussink, J.; Monshouwer, R.;Haibe-Kains, B.; Rietveld, D.; et al. Decoding tumour phenotype by noninvasive imaging using a quantitative radiomicsapproach. Nat. Commun. 2014, 5, 4006. [CrossRef] [PubMed]
4. Park, H.; Lim, Y.; Ko, E.S.; Cho, H.-H.; Lee, J.E.; Han, B.-K.; Ko, E.Y.; Choi, J.S.; Park, K.W. Radiomics Signature on MagneticResonance Imaging: Association with Disease-Free Survival in Patients with Invasive Breast Cancer. Clin. Cancer Res. 2018, 24,4705–4714. [CrossRef] [PubMed]
5. Parikh, J.; Selmi, M.; Charles-Edwards, G.; Glendenning, J.; Ganeshan, B.; Verma, H.; Mansi, J.; Harries, M.; Tutt, A.; Goh, V.Changes in Primary Breast Cancer Heterogeneity May Augment Midtreatment MR Imaging Assessment of Response to Neoadju-vant Chemotherapy. Radiology 2014, 272, 100–112. [CrossRef]
6. Pickles, M.D.; Lowry, M.; Gibbs, P. Pretreatment Prognostic Value of Dynamic Contrast-Enhanced Magnetic Resonance ImagingVascular, Texture, Shape, and Size Parameters Compared with Traditional Survival Indicators Obtained from Locally AdvancedBreast Cancer Patients. Investig. Radiol. 2016, 51, 177–185. [CrossRef]
7. Kim, J.-H.; Ko, E.Y.; Lim, Y.; Lee, K.S.; Han, B.-K.; Hahn, S.Y.; Nam, S.J. Breast Cancer Heterogeneity: MR Imaging TextureAnalysis and Survival Outcomes. Radiology 2017, 282, 665–675. [CrossRef]
8. Jemal, A.; Bray, F.; Center, M.M.; Ferlay, J.; Ward, E.; Forman, D. Global cancer statistics. CA Cancer J. Clin. 2011, 61, 69–90. [CrossRef]9. Perou, C.M.; Sørlie, T.; Eisen, M.B.; Van De Rijn, M.; Jeffrey, S.S.; Rees, C.A.; Pollack, J.R.; Ross, D.T.; Johnsen, H.; Akslen, L.A.; et al.
Molecular portraits of human breast tumours. Nature 2000, 406, 747–752. [CrossRef]10. Kim, D.-K.; Kim, D.W.; Kim, S.W.; Kim, D.Y.; Lee, C.H.; Rhee, C.S. Ki67 antigen as a predictive factor for prognosis of sinonasal
mucosal melanoma. Clin. Exp. Otorhinolaryngol. 2008, 1, 206. [CrossRef]11. Rakha, E.A.; Reis-Filho, J.S.; Baehner, F.; Dabbs, D.J.; Decker, T.; Eusebi, V.; Fox, S.B.; Ichihara, S.; Jacquemier, J.; Lakhani, S.R.; et al.
Breast cancer prognostic classification in the molecular era: The role of histological grade. Breast Cancer Res. 2010, 12, 207.[CrossRef] [PubMed]
12. Grimm, L.J.; Zhang, J.; Mazurowski, M.A. Computational approach to radiogenomics of breast cancer: Luminal A and luminalB molecular subtypes are associated with imaging features on routine breast MRI extracted using computer vision algorithms.J. Magn. Reson. Imaging 2015, 42, 902–907. [CrossRef] [PubMed]
13. Mazurowski, M.A.; Zhang, J.; Grimm, L.; Yoon, S.C.; Silber, J.I. Radiogenomic Analysis of Breast Cancer: Luminal B MolecularSubtype Is Associated with Enhancement Dynamics at MR Imaging. Radiology 2014, 273, 365–372. [CrossRef]
14. Davey, M.G.; Davey, M.S.; Boland, M.R.; Ryan, É.J.; Lowery, A.J.; Kerin, M.J. Radiomic differentiation of breast cancer molecular subtypesusing pre-operative breast imaging—A systematic review and meta-analysis. Eur. J. Radiol. 2021, 144, 109996. [CrossRef] [PubMed]
15. Rizzo, S.; Botta, F.; Raimondi, S.; Origgi, D.; Fanciullo, C.; Morganti, A.G.; Bellomi, M. Radiomics: The facts and the challenges ofimage analysis. Eur. Radiol. Exp. 2018, 2, 36. [CrossRef]
16. Parmar, C.; Barry, J.D.; Hosny, A.; Quackenbush, J.; Aerts, H.J. Data Analysis Strategies in Medical Imaging. Clin. Cancer Res.2018, 24, 3492–3499. [CrossRef]
17. Castaldo, R.; Pane, K.; Nicolai, E.; Salvatore, M.; Franzese, M. The Impact of Normalization Approaches to Automatically DetectRadiogenomic Phenotypes Characterizing Breast Cancer Receptors Status. Cancers 2020, 12, 518. [CrossRef]
Diagnostics 2022, 12, 499 19 of 21
18. Madabhushi, A.; Udupa, J.K. New methods of MR image intensity standardization via generalized scale. Med. Phys. 2006, 33,3426–3434. [CrossRef]
19. Nyúl, L.G.; Udupa, J.K. On standardizing the MR image intensity scale. Magn. Reson. Med. 1999, 42, 1072–1081. [CrossRef]20. Nyul, L.; Udupa, J.; Zhang, X. New variants of a method of MRI scale standardization. IEEE Trans. Med. Imaging 2000, 19,
143–150. [CrossRef]21. Ge, Y.; Udupa, J.K.; Wei, L.; Grossman, R.I. Numerical tissue characterization in MS via standardization of the MR image intensity
scale. J. Magn. Reson. Imaging 2000, 12, 715–721. [CrossRef]22. Csutak, C.; S, tefan, P.-A.; Lupean, R.-A.; Lenghel, L.M.; Mihu, C.M.; Lebovici, A. Computed tomography in the diagnosis of
intraperitoneal effusions: The role of texture analysis. Bosn. J. Basic Med. Sci. 2021, 21, 488–494. [CrossRef] [PubMed]23. S, tefan, P.A.; Lupean, R.A.; Mihu, C.M.; Lebovici, A.; Oancea, M.D.; Hît,u, L.; Duma, D.; Csutak, C. Ultrasonography in the
Diagnosis of Adnexal Lesions: The Role of Texture Analysis. Diagnostics 2021, 11, 812. [CrossRef] [PubMed]24. Zerouaoui, H.; Idri, A. Reviewing Machine Learning and Image Processing Based Decision-Making Systems for Breast Cancer
Imaging. J. Med. Syst. 2021, 45, 8. [CrossRef]25. Huynh, E.; Coroller, T.P.; Narayan, V.; Agrawal, V.; Romano, J.; Franco, I.; Parmar, C.; Hou, Y.; Mak, R.H.; Aerts, H.J.W.L.
Associations of Radiomic Data Extracted from Static and Respiratory-Gated CT Scans with Disease Recurrence in Lung CancerPatients Treated with SBRT. PLoS ONE 2017, 12, e0169172. [CrossRef]
26. Zhang, Y.; Oikonomou, A.; Wong, A.; Haider, M.A.; Khalvati, F. Radiomics-based Prognosis Analysis for Non-Small Cell LungCancer. Sci. Rep. 2017, 7, 46349. [CrossRef]
27. Jolliffe, I.T. Principal Component Analysis; Springer Series in Statistics; Springer: Berlin/Heidelberg, Germany, 2002; Volume 29.28. Wold, S.; Esbensen, K.; Geladi, P. Principal component analysis. Chemom. Intell. Lab. Syst. 1987, 2, 37–52. [CrossRef]29. Traverso, A.; Kazmierski, M.; Zhovannik, I.; Welch, M.; Wee, L.; Jaffray, D.; Dekker, A.; Hope, A. Machine learning helps
identifying volume-confounding effects in radiomics. Phys. Med. 2020, 71, 24–30. [CrossRef]30. Jolliffe, I.T. Rotation of principal components: Choice of normalization constraints. J. Appl. Stat. 1995, 22, 29–35. [CrossRef]31. R Team. R: A Language and Environment for Statistical Computing; R Foundation for Statistical Computing: Vienna, Austria, 2019.32. Yu, H.J.; Chen, J.-H.; Mehta, R.S.; Nalcioglu, O.; Su, M.-Y. MRI measurements of tumor size and pharmacokinetic parameters
as early predictors of response in breast cancer patients undergoing neoadjuvant anthracycline chemotherapy. J. Magn. Reson.Imaging 2007, 26, 615–623. [CrossRef]
33. Incoronato, M.; Grimaldi, A.M.; Mirabelli, P.; Cavaliere, C.; Parente, C.A.; Franzese, M.; Staibano, S.; Ilardi, G.; Russo, D.;Soricelli, A.; et al. Circulating miRNAs in Untreated Breast Cancer: An Exploratory Multimodality Morpho-Functional Study.Cancers 2019, 11, 876. [CrossRef] [PubMed]
34. Erdi, Y.E.; Mawlawi, O.; Larson, S.M.; Imbriaco, M.; Yeung, H.; Finn, R.; Humm, J.L. Segmentation of lung lesion volume byadaptive positron emission tomography image thresholding. Cancer 1997, 80 (Suppl. 12), 2505–2509. [CrossRef]
35. Chan, Y.H. Biostatistics 104: Correlational analysis. Singap. Med. J. 2003, 44, 614–619.36. Abdi, H. Z-scores. Encycl. Meas. Stat. 2007, 3, 1055–1058.37. Bolstad, B.; Irizarry, R.; Astrand, M.; Speed, T. A comparison of normalization methods for high density oligonucleotide array
data based on variance and bias. Bioinformatics 2003, 19, 185–193. [CrossRef]38. Hicks, S.C.; Irizarry, R.A. When to use quantile normalization? BioRxiv 2014, 012203. [CrossRef]39. Kessy, A.; Lewin, A.; Strimmer, K. Optimal Whitening and Decorrelation. Am. Stat. 2018, 72, 309–314. [CrossRef]40. Chatterjee, A.; Vallieres, M.; Dohan, A.; Levesque, I.R.; Ueno, Y.; Saif, S.; Reinhold, C.; Seuntjens, J. Creating Robust Predictive
Radiomic Models for Data from Independent Institutions Using Normalization. IEEE Trans. Radiat. Plasma Med. Sci. 2019, 3,210–215. [CrossRef]
41. Kuhn, M. Building predictive models in R using the caret package. J. Stat. Softw. 2008, 28, 1–26. [CrossRef]42. Flury, B. Common Principal Components & Related Multivariate Models; John Wiley & Sons, Inc.: Hoboken, NJ, USA, 1988.43. Zhu, X.; Chen, L.; Huang, B.; Wang, Y.; Ji, L.; Wu, J.; Di, G.; Liu, G.; Yu, K.; Shao, Z.; et al. The prognostic and predictive potential
of Ki-67 in triple-negative breast cancer. Sci. Rep. 2020, 10, 225. [CrossRef]44. Aman, N.A.; Doukoure, B.; Koffi, K.D.; Koui, B.S.; Traore, Z.C.; Kouyate, M.; Toure, I.; Effi, A.B. Immunohistochemical Evaluation
of Ki-67 and Comparison with Clinicopathologic Factors in Breast Carcinomas. Asian Pac. J. Cancer Prev. 2019, 20, 73–79.[CrossRef] [PubMed]
45. Friedman, J.; Hastie, T.; Tibshirani, R. Additive logistic regression: A statistical view of boosting (with discussion and a rejoinderby the authors). Ann. Stat. 2000, 28, 337–407. [CrossRef]
46. Quinlan, J.R. C4.5: Programs for Machine Learning; The Morgan Kaufmann Series in Machine Learning; Morgan KaufmannPublishers: San Mateo, CA, USA, 1993.
47. Nguyen, C.; Wang, Y.; Nguyen, H.N. Random forest classifier combined with feature selection for breast cancer diagnosis andprognostic. J. Biomed. Sci. Eng. 2013, 6, 551–560. [CrossRef]
48. Xanthopoulos, P.; Pardalos, P.M.; Trafalis, T.B. Linear Discriminant Analysis, in Robust Data Mining; Springer: Berlin/Heidelberg,Germany, 2013; pp. 27–33.
49. Yassin, N.I.; Omran, S.; Houby, E.M.; Allam, H. Machine learning techniques for breast cancer computer aided diagnosis usingdifferent image modalities: A systematic review. Comput. Methods Programs Biomed. 2018, 156, 25–45. [CrossRef] [PubMed]
50. Refaeilzadeh, P.; Tang, L.; Liu, H. Cross-validation. Encycl. Database Syst. 2009, 5, 532–538.
Diagnostics 2022, 12, 499 20 of 21
51. Sondakh, D.E. Comparative Study of Classification Algorithms: Holdouts as Accuracy Estimation. CogITo Smart J. 2016, 1,13–23. [CrossRef]
52. Chawla, N.V.; Bowyer, K.W.; Hall, L.O.; Kegelmeyer, W.P. SMOTE: Synthetic Minority Over-sampling Technique. J. Artif. Intell.Res. 2002, 16, 321–357. [CrossRef]
53. Steyerberg, E.W.; Harrell, F.E.; Borsboom, G.J.; Eijkemans, M.; Vergouwe, Y.; Habbema, J.F. Internal validation of predictivemodels: Efficiency of some procedures for logistic regression analysis. J. Clin. Epidemiol. 2001, 54, 774–781. [CrossRef]
54. Kohl, M. Performance measures in binary classification. Int. J. Stat. Med. Res. 2012, 1, 79–81. [CrossRef]55. Foster, K.R.; Koprowski, R.; Skufca, J.D. Machine learning, medical diagnosis, and biomedical engineering research-commentary.
Biomed. Eng. Online 2014, 13, 94. [CrossRef]56. Power, M.; Fell, G.; Wright, M. Principles for high-quality, high-value testing. Evid.-Base. Med. 2013, 18, 5–10. [CrossRef] [PubMed]57. Goldhirsch, A.; Winer, E.P.; Coates, A.S.; Gelber, R.D.; Piccart-Gebhart, M.; Thürlimann, B.; Senn, H.-J. Personalizing the treatment
of women with early breast cancer: Highlights of the St Gallen International Expert Consensus on the Primary Therapy of EarlyBreast Cancer 2013. Ann. Oncol. 2013, 24, 2206–2223. [CrossRef] [PubMed]
58. Bene, I.B.; Ciurea, A.; Ciortea, C.; S, tefan, P.; Lisencu, L.; Dudea, S. Differentiating Breast Tumors from Background ParenchymalEnhancement at Contrast-Enhanced Mammography: The Role of Radiomics—A Pilot Reader Study. Diagnostics 2021, 11, 1248.
59. Ye, D.-M.; Wang, H.-T.; Yu, T. The Application of Radiomics in Breast MRI: A Review. Technol. Cancer Res. Treat. 2020, 19,1533033820916191. [CrossRef]
60. Shinohara, R.T.; Sweeney, E.M.; Goldsmith, J.; Shiee, N.; Mateen, F.J.; Calabresi, P.; Jarso, S.; Pham, D.L.; Reich, D.S.; Crainiceanu, C.M.Statistical normalization techniques for magnetic resonance imaging. NeuroImage: Clin. 2014, 6, 9–19. [CrossRef]
61. Isaksson, L.J.; Raimondi, S.; Botta, F.; Pepa, M.; Gugliandolo, S.G.; De Angelis, S.P.; Marvaso, G.; Petralia, G.; DE Cobelli, O.;Gandini, S.; et al. Effects of MRI image normalization techniques in prostate cancer radiomics. Phys. Med. 2020, 71, 7–13. [CrossRef]
62. Haga, A.; Takahashi, W.; Aoki, S.; Nawa, K.; Yamashita, H.; Abe, O.; Nakagawa, K. Standardization of imaging features forradiomics analysis. J. Med. Investig. 2019, 66, 35–37. [CrossRef]
63. Böhm, C.; Faloutsos, C.; Plant, C. Outlier-Robust Clustering Using Independent Components. In Proceedings of the 2008 ACMSIGMOD International Conference on Management of Data, Vancouver, BC, Canada, 9–12 June 2008.
64. Elston, C.; Ellis, I. pathological prognostic factors in breast cancer. I. The value of histological grade in breast cancer: Experiencefrom a large study with long-term follow-up. Histopathology 1991, 19, 403–410. [CrossRef]
65. Weidner, N.; Ii, D.H.M.; Vartanian, R. Correlation of Ki-67 antigen expression with mitotic figure index and tumor grade in breastcarcinomas using the novel “paraffin”-reactive MIB1 antibody. Hum. Pathol. 1994, 25, 337–342. [CrossRef]
66. Nishimura, R.; Osako, T.; Nishiyama, Y.; Tashima, R.; Nakano, M.; Fujisue, M.; Toyozumi, Y.; Arima, N. Prognostic significance ofKi-67 index value at the primary breast tumor in recurrent breast cancer. Mol. Clin. Oncol. 2014, 2, 1062–1068. [CrossRef]
67. Inic, Z.; Zegarac, M.; Inic, M.; Markovic, I.; Kozomara, Z.; Djurisic, I.; Inic, I.; Pupic, G.; Jancic, S. Difference between Luminal Aand Luminal B Subtypes According to Ki-67, Tumor Size, and Progesterone Receptor Negativity Providing Prognostic Information.Clin. Med. Insights Oncol. 2014, 8, 107–111. [CrossRef] [PubMed]
68. Hashmi, A.A.; Aijaz, S.; Khan, S.M.; Mahboob, R.; Irfan, M.; Zafar, N.I.; Nisar, M.; Siddiqui, M.; Edhi, M.M.; Faridi, N.; et al.Prognostic parameters of luminal A and luminal B intrinsic breast cancer subtypes of Pakistani patients. World J. Surg. Oncol.2018, 16, 1. [CrossRef] [PubMed]
69. Incoronato, M.; Grimaldi, A.M.; Cavaliere, C.; Inglese, M.; Mirabelli, P.; Monti, S.; Ferbo, U.; Nicolai, E.; Soricelli, A.;Catalano, O.A.; et al. Relationship between functional imaging and immunohistochemical markers and prediction of breastcancer subtype: A PET/MRI study. Eur. J. Pediatr. 2018, 45, 1680–1693. [CrossRef] [PubMed]
70. Singh, D.; Singh, B. Investigating the impact of data normalization on classification performance. Appl. Soft Comput. 2020,97, 105524. [CrossRef]
71. Son, S.H.; Kim, D.-H.; Hong, C.M.; Kim, C.-Y.; Jeong, S.Y.; Lee, S.-W.; Lee, J.; Ahn, B.-C. Prognostic implication of intratumoralmetabolic heterogeneity in invasive ductal carcinoma of the breast. BMC Cancer 2014, 14, 585. [CrossRef]
72. Yoon, H.-J.; Kim, Y.; Kim, B.S. Intratumoral metabolic heterogeneity predicts invasive components in breast ductal carcinoma insitu. Eur. Radiol. 2015, 25, 3648–3658. [CrossRef]
73. Le-Petross, H.T.; Cristofanilli, M.; Carkaci, S.; Krishnamurthy, S.; Jackson, E.F.; Harrell, R.K.; Reed, B.J.; Yang, W.T. MRI Featuresof Inflammatory Breast Cancer. Am. J. Roentgenol. 2011, 197, W769–W776. [CrossRef]
74. Alili, C.; Pages, E.; Doyon, F.C.; Perrochia, H.; Millet, I.; Taourel, P. Correlation between MR imaging—Prognosis factors andmolecular classification of breast cancers. Diagn. Interv. Imaging 2014, 95, 235–242. [CrossRef]
75. Holli-Helenius, K.; Salminen, A.; Rinta-Kiikka, I.; Koskivuo, I.; Brück, N.; Boström, P.; Parkkola, R. MRI texture analysisin differentiating luminal A and luminal B breast cancer molecular subtypes—A feasibility study. BMC Med. Imaging2017, 17, 69. [CrossRef]
76. Mert, A.; Kılıç, N.; Bilgili, E.; Akan, A. Breast cancer detection with reduced feature set. Comput. Math. Methods Med. 2015, 2015,265138. [CrossRef]
77. Tang, W.; Zhang, X.; Tan, W.; Gao, J.; Pan, L.; Ye, X.; Chen, L.; Zheng, W. miR-145-5p Suppresses Breast Cancer Progression byInhibiting SOX2. J. Surg. Res. 2019, 236, 278–287. [CrossRef] [PubMed]
78. Xie, H.; Xiao, R.; He, Y.; He, L.; Xie, C.; Chen, J.; Hong, Y. MicroRNA-100 inhibits breast cancer cell proliferation, invasion andmigration by targeting FOXA1. Oncol. Lett. 2021, 22, 816. [CrossRef] [PubMed]

Diagnostics 2022, 12, 499 21 of 21
79. Wu, K.; Ung, Y.C. Reply: Autocontouring versus Manual Contouring. J. Nucl. Med. 2011, 52, 658–659. [CrossRef]80. Jabbar, H.K.; Khan, R.Z. Methods to Avoid Over-Fitting and Under-Fitting in Supervised Machine Learning (Comparative Study).
Comput. Sci. Commun. Instrum. Devices 2015, 70, 163–172.81. Bellinger, C.; Drummond, C.; Japkowicz, N. Beyond the boundaries of SMOTE. In Joint European Conference on Machine Learning
and Knowledge Discovery in Databases; Springer: Berlin/Heidelberg, Germany, 2016.82. Vanwinckelen, G.; Blockeel, H. On estimating model accuracy with repeated cross-validation. In Proceedings of the BeneLearn
2012 21st Belgian-Dutch Conference on Machine Learning, Ghent, Belgium, 24–25 May 2012.


