Embed Size (px)
Citation preview

Building a Resilient
Scituate Climate Vulnerability Assessment
and Action Plan March 2018

ACKNOWLEDGEMENTS
The project was conducted by the Metropolitan Area Planning Council (MAPC) with funding from
MAPC’s Planning for MetroFuture District Local Technical Assistance program.
METROPOLITAN AREA PLANNING COUNCIL
Officers President Keith Bergman Vice President Erin Wortman Secretary Sandra Hackman Treasurer Taber Keally
Executive Director Marc D. Draisen Senior Environmental Planner Darci Schofield GIS/Data Analysis Darci Schofield and Eliza Wallace Town of Scituate Town Administrator James Boudreau Chair, Board of Selectmen Maura C. Curran STEERING COMMITTEE MEMBERS Department of Public Works Kevin Cafferty Engineering Sean McCarthy Director of Planning and Economic Development Brad Washburn Chief of Scituate Fire/Emergency Manager John Murphy Chief of Scituate Police Michael Stewart Board of Health Director Jennifer Keefe Coastal Resource Officer Nancy Durfee Natural Resource and Conservation Officer Amy Walkey Building Commissioner Robert Vogel Council on Aging Director Linda Hayes Director of Facilities Kevin Kelly Recreation Director Maura Clancy

Building a Resilient Scituate
EXECUTIVE SUMMARY
Climate change is the most compelling environmental,
economic, and social issue of our time. Scituate, known
for its numerous barrier beaches, prominent bedrock
headlands, and rich cultural history, is one of the most
vulnerable regions in Massachusetts. It is routinely hit
hard with coastal storms causing massive storm surge
and inundation with even just a lunar high tide.
Projected sea level rise and changes in intensity of
storm and precipitation events compel the need to
assess the vulnerability of Scituate’s people and places
as well as plan for protecting its future. This report
summarizes the latest climate risks, evaluates the vulnerability of Scituate’s critical infrastructure
and resources, and creates an action for incremental steps toward greater resilience and
community vibrancy in an uncertain future.
Climate Change: Our Uncertain Future
2017 was the second warmest year on record and the period from 2006-2015 was the warmest
decade since temperature has been measured. This has translated into an increase in the growing
season by 10 days since 1980 1and model temperature projections anticipate more frequent
heat waves.2
Depending on various greenhouse gas emission scenarios, warming temperatures will cause ocean
expansion and melting glaciers resulting in sea level rise. Sea level has risen by 11 inches over
the last century and scientists anticipate this rate to accelerate.
In the last 50 years, precipitation in the Northeast US increased 71% in the amount of rain that
falls in the top 1% of storm events. Projections suggest an increase in total precipitation, changes
in precipitation patterns, and increased frequency of extreme storms such as hurricanes and
nor’easters.3
1 U.S. Environmental Protection Agency. 2016. Climate Change Indicators in the United States, 2016. Fourth meditation. EPA 430-R-16-004. www.epa/gov/climate-indicators Northeast Climate Science Center. 2 Northeast Climate Science Center. UMass Amherst. Massachusetts Climate Change Projections. December 2017 3 Sea Level Rise Study. The Towns of Marshfield, Duxbury, Scituate, MA”. 2013. Kleinfelder.
Scituate, Winter Storm Riley, March 2018. Source:
Simon Brewer
Scituate could experience five to 23 days over 90˚ by 2050 and nine to 58 days
over 90˚by 2100.2
Scituate could experience an additional eight inches sea level rise by 2030 and six
and a half feet by the end of the century.1,3
Scituate could experience an increase of five inches of precipitation annually by
2050 and six inches by 2100 with the greatest increase during the winter.1

Scituate’s Strength and Vulnerability
Projected climate impacts are an intensification, increased frequency, or geographic expansion of
existing challenges. Scituate already has significant planning, experience and strengths to bring
to these challenges.
Scituate’s seniors comprise 17% of the population and are the residents at greatest
risk to climate change. Many seniors live in Humarock vulnerable to extreme heat
and coastal flooding. But the Town is well prepared with programs that connect
seniors to programs, cooling centers, and resources for their well-being and safety.
Scituate is at risk to increased occurrences of vector-borne diseases with warmer
winters, standing flood waters, and extended growing seasons. But it has
significant strengths in preventing heat-related illness with 48.8% tree canopy
cooling the town, mitigating air pollutants, capturing stormwater, and sequestering
carbon. There is a nominal risk to toxic exposure from flooding of hazardous
materials storage sites.
Scituate has over 1,600 acres of salt marsh and over 100 acres of eelgrass
meadows providing critical shoreline protection. The salt marshes are showing signs
of degradation and saltmarsh grass decline and migration, but the eelgrass
meadows have remained relatively stable since 1995. There are four designated
impaired waters in its rivers, bays, and ponds requiring TDML, but Scituate also
contains 10,033 acres of State-designated BioMap2 Aquatic Core habitat
demonstrating viable wetland systems able to withstand the impacts of climate
change.
Scituate’s drinking water has two sources, but it is vulnerable to scarcity during
periods of drought and potential intrusion from coastal flooding and inundation of
its well infrastructure. Its waste water treatment plant is located within a 1%
Annual Chance Flood Zone and the flood risk increases greatly with sea level rise
in 2038 and 2088.
Scituate has suffered 3,681flood insurance claims totaling over $63 million.4
Critical Infrastructure located in current or future flood zones includes two well
heads, pump stations, wastewater treatment plant, two bridges and a few
businesses, where Front St. is the most vulnerable. Sixteen roads are prone to
flooding in a 1% Annual Chance Storm. Businesses located in a 2088 flood zone
are valued today at over $57 million.
There 127 historic structures at risk to flooding in a 1% Annual Flood Chance Flood
and approximately 60 historic structures vulnerable to sea level rise in 2088.
4 VHB. Natural Hazard Mitigation Plan Scituate, Massachusetts. August 2, 2016

Scituate’s Climate Action Plan
This climate action plan builds upon previous completed plans for
hazard mitigation and coastal flooding, erosion, and resilience. It
takes an adaptive management approach that combines emergency
preparedness, mitigation, and adaptation. The Town’s Climate
Vulnerability Steering Committee created the prioritization of
suggested climate actions agreed upon four guiding principles toward
Building a More Resilient Scituate:
1. Balance growth, preservation, and resiliency to enhance our
vibrant community and ensure its livability into the next century
and beyond
2. Invest in infrastructure that promotes multiple benefits that address climate risks as well as
beautification, economic growth, public programming, and public health.
3. Leverage the resources of multiple disciplines and sectors within municipal departments and
across sectors to generate layers of resilience.
4. Approach Building a More Resilient Scituate as an ongoing effort to ensure Scituate’s
ongoing success leveraging capital improvement cycles and outside funding cycles.
Scituate is Proactive… Scituate is committed to Resilience
The top climate action priorities were those receiving the most significant concern and sense of
urgency for Scituate’s future livability and were recommended to be implemented as soon as
possible. The top climate action priorities are as follows:
1. Address the vulnerability of coastal business districts. Lead a climate vulnerability and
resilience workshop with stakeholders, property owners, residents, businesses, and
municipal staff and officials for participatory visioning the future with sea level rise and
coastal flooding. The goal of the workshop is to educate stakeholders to the current and
future risks and ensure stakeholders are active participants in the waterfront’s current and
future resilience. Front Street is a priority for this action.
2. Address the vulnerability of Scituate’s municipal infrastructure. A priority could be the
Waste Water Treatment Plant, currently in a 1% Annual Chance Flood. Protection
measures discussed include earthen berms and other natural shoreline protection as an
incremental resilience measure while investigating more significant structural investments
that addresses future risk.
3. Initiate a public outreach and marketing campaign with a sense of urgency on climate
change and resilience in Scituate. The Town has demonstrated results in such an effort,
when, during the 2016 drought where resident’s behavior shifted sufficiently to mitigate
drinking water scarcity during that time.
Adaptation
Mitigation
Emergency Preparedness

1
Contents List of Figures ............................................................................................................................ 2
List of Tables ............................................................................................................................. 3
Introduction ............................................................................................................................... 4
I. Climate Change. Our uncertain Future ................................................................................... 5
Temperature .....................................................................................................................................................7
Sea Level Rise ...................................................................................................................................................9
Precipitation ................................................................................................................................................... 11
II. Vulnerability Assessment .................................................................................................... 13
Social Vulnerability ........................................................................................................................................ 13
Public Health Vulnerability............................................................................................................................. 16
Natural Resources Vulnerability ..................................................................................................................... 24
Critical Infrastructure Vulnerability ................................................................................................................ 39
Economic Vulnerability ................................................................................................................................... 55
Utility Vulnerability ........................................................................................................................................ 57
Transportation Vulnerability .......................................................................................................................... 62
Historic Assets Vulnerability ........................................................................................................................... 65
III. Climate Action Plan ............................................................................................................ 68
Mitigation, Adaptation, and Emergency Preparedness are Inter-connected. ................................................ 68
Adaptive Management Framework ............................................................................................................... 69
Strengths and Guiding Principles ................................................................................................................... 70
Climate Actions .............................................................................................................................................. 71
IV. Appendix ........................................................................................................................ A
Appendix A ......................................................................................................................................................1
Appendix B .......................................................................................................................................................1
Appendix C ......................................................................................................................................................1

2
LIST OF FIGURES
Figure 1The Greenhouse Effect and global temperature trends. ..........................................................................5
Figure 2 Local Observed Temperature Change. ..................................................................................................6
Figure 3 Increased length of days in growing season across the U.S....................................................................8
Figure 4 Observed Sea Level Rise. .........................................................................................................................9
Figure 5 Precipitation Projections. ...................................................................................................................... 12
Figure 6 Scituate’s current population and projections. ..................................................................................... 14
Figure 7 Scituate's residents’ income. ................................................................................................................. 14
Figure 8 Climate impacts and health outcomes roadmap. ................................................................................. 16
Figure 9 Scituate heat islands. ........................................................................................................................... 17
Figure 10 Air Quality Assessment in Scituate 2011-2015. ................................................................................ 18
Figure 11 Heart attack and asthma hospitalization for Scituate 2012. ............................................................ 19
Figure 12 Lyme disease incidence in Plymouth County. ..................................................................................... 21
Figure 13 Scituate FEMA flood zones and potential environmental hazards. .................................................... 23
Figure 14 Coastal wetland migration areas for climate resilience. ................................................................... 26
Figure 15 Scituate eelgrass and shellfish suitability areas. ............................................................................... 29
Figure 16 Sea Level Rise 2038 and 2063 (Kleinfelder 2013). ......................................................................... 31
Figure 17 Scituate Tree Canopy. ......................................................................................................................... 36
Figure 18 Salt water intrusion to fresh groundwater with SLR. .......................................................................... 40
Figure 19 Scituate's coastal aquifers and soil hydrologic group. ...................................................................... 41
Figure 20. Potential for salt water intrusion in wellhead protection areas with sea level rise. .......................... 43
Figure 21 Municipal wastewater infrastructure, coastal flooding and sea level rise (SLR) in 2088. .................. 45
Figure 22 Exposed septic system after coastal storm, CT. ................................................................................. 48
Figure 23 Coastal flooding in Scituate, 2014. ................................................................................................... 51
Figure 24 Critical Infrastructure and flooding. .................................................................................................... 53
Figure 25 Potential economic loss with 2088 sea level rise in Scituate. ............................................................. 56
Figure 26 Energy and emissions analysis, Scituate............................................................................................. 57
Figure 27 Natural gas leaks and repaired leaks in Scituate as of December 2016. ........................................ 59
Figure 28 Heat kink on MBTA track. ................................................................................................................. 62
Figure 29 Scituate coastal flooding on roadways. ............................................................................................... 63
Figure 30 Historic structures within a 1% Annual Chance Flood and SLR. .......................................................... 66
Figure 31 Interconnections of mitigation, adaptation, and emergency preparedness. ...................................... 68
Figure 32 Adaptive Management Framework. .................................................................................................. 69

3
LIST OF TABLES
Table 1: Boston area projected increases in average temperature.
Table 2: Total Relative Sea Level Rise projections in Boston and South Shore for the “Highest” emission scenarios.
Table 3. Water Quality Impairments.
Table 4. Biomap2 Core Habitat for aquatic and Wetland Core in Scituate.
Table 5. Tree species projections on adaptive capacity to climate change.
Table 6. Risk to drinking water, water resources, and State/Federal Water Resources programs with
Climate Change.
Table 7. Vulnerability of Scituate’s dams by hazard status, current flood risk, and future flood risk.

4
Introduction
Climate change is the most compelling environmental, economic, and social issue of our time and the
northeastern United States is one of the most vulnerable regions, particularly with projected sea level
rise. Scituate, 35 miles from Boston, is a commuter town known for its numerous barrier beaches,
prominent bedrock headlands, and rich cultural history. With its diverse coastal features, Scituate has
extensive scenic, recreational, and economic amenities already at risk to storms and changing
weather patterns. With projected sea level rise and changes in intensity of storm and precipitation
events, the need to assess the vulnerability of Scituate’s infrastructure, economy, and community as
well as plan for protecting its future is critical.
The goal of this plan is to identify Scituate’s most significant risks from sea level rise, inland flooding,
extreme precipitation events, and extreme temperature on social, natural, economic, and physical
infrastructure. The vulnerability analysis and Scituate’s existing strengths will inform near and long-
term strategies to ensure Scituate remains a resilient and vibrant town.
This Climate Vulnerability Assessment and Action Plan builds upon multiple studies around coastal
vulnerability to climate change including:
South Shore Coastal Hazards Adaptation Study. MAPC, 2011
Sea Level Rise Study for the Towns of Marshfield, Duxbury, Scituate, MA. Kleinfelder, 2013.
Coastal Erosion, Sediment Transport, and Prioritization Management Strategy Assessment
for Shoreline Protection. Applied Coastal, 2016.
Flood Resilience for Riverine and Coastal Communities. Building Blocks for Sustainable
Communities. Scituate, MA. Next Steps Memorandum. 2016. EPA
Natural Hazard Mitigation Plan. VHB, 2016

5
I. CLIMATE CHANGE. OUR UNCERTAIN FUTURE
Our climate has always been regulated by gases, including carbon dioxide, methane, and nitrous
oxide, that blanket the earth. These gases trap heat that would otherwise be reflected out to space;
without them our planet would be too cold to support life. We refer to these gases as “greenhouse
gases” (GHGs) for their heat trapping capacity. Changes in GHG concentrations occur naturally, due
to such events as volcanic eruptions and variations in solar energy entering the atmosphere.
Figure 1The Greenhouse Effect and global temperature trends.
In the past century, human activity associated with industrialization has contributed to a growing
concentration of GHGs in our atmosphere. The combustion of fossil fuels, our primary energy

6
source, releases GHGs into the atmosphere. As shown in Figure1, there is a correlation between
increases in carbon dioxide concentrations and global warming and widespread consensus exists
among scientists regarding the correlation. 1,2,3
The following sections will review climate changes that have been observed to date and projections
of future changes based upon the best available data. The focus of this report is on impacts relevant
to Scituate. We utilize data for the northeast United States, Massachusetts and the Boston region
including (i) the UMass Amherst Northeast Climate Science Center’s evaluation of the Commonwealth’s
temperature, precipitation, and sea level rise changes; (ii) Climate Ready Boston “The Boston
Research Advisory Group: Climate Change and Sea Level Rise Projections for Boston; (iii) the City of
Cambridge, Climate Change Vulnerability Assessment of 2015; and (iv) the US Environmental
Protection Agency Climate Change Indicators in the United States, Fourth Edition.
Figure 2 Local Observed Temperature Change.
Climate change observations come from a variety of data sources recorded in recent decades and
centuries. Climate change projections, however, model future climate impacts based on data that is
not yet observed. As a result, climate projections are generally expressed as a range of possible
1 Third United States Climate Report (2014) (Chapter 2, page 12) 2 Statement on Climate Change from 18 Scientific Organizations. (https://www.aaas.org/sites/default/files/migrate/uploads/1021climate_letter1.pdf) 3 Intergovernmental Panel on Climate Change. Climate Change 2014 Synthesis Report Summary for Policymakers.

7
impacts influenced by the uncertainty of future global GHG emissions and/or land use, natural
localized variability in climate, and inherent variations in climate projection models.4
Temperature
According to the National Ocean and Atmospheric Administration and NASA, 2017 was the second
warmest year on record5 and according to the EPA’s US Climate Change Indicators report, the period
from 2006-2015 was the warmest decade since temperature has been measured.6 Data from the
Blue Hill Observatory in Milton (Figure 2) located 28 miles from Scituate, reflects this trend. Future
temperature projections for the Northeast indicate an increasing likelihood of heat waves, measured
by the likely number of days over 90 and 100. The South Coastal Basin, where Scituate lies, may be
cooler than other inland or dense urban areas in the Commonwealth due to the presence of offshore
winds and this is demonstrated by differences in temperature projections. The South Coastal Basin
could experience 8-13 days over 90˚ by 2030 and 9-57 days over 90˚by the end of the century.
Metro Boston may experience 20-40 days over 90˚ by 2030 and 90 days over 90˚ by the end of
the century.7,8,9
Table 1. South Coastal Basin area (SC) projected increases in average temperature in degrees
Fahrenheit.
Baseline 1961–2010
2030
2050-2070
2090-2100
SC Annual Average
50˚ 52˚-58˚ 52˚-58˚ 53˚-60˚
SC Winter Average
31˚ 33˚-35˚ 33˚-39˚ 34˚-40˚
SC Summer Average
69˚ 71˚-73˚ 71˚-78˚ 72˚-81˚
Source: Northeast Climate Science Center. UMass Amherst. Massachusetts Climate Change Projections. December 2017
In addition to warming summer temperatures, winters are already warming and scientists project that
to continue by an increase of 2˚-6˚ in 2030 and an increase of 4˚-12˚by the end of the century.6,7,8
4 Daser, C., Philips, A., Bourette, V. et al. Climate Dynamics (2012) 38:527 https://doi.org/10.1007/s00382-010-0977-x 5 https://www.washingtonpost.com/news/energy-environment/wp/2018/01/18/2017-was-among-the-planets-hottest-years-on-record-government-scientists-report/?utm_term=.77bff825293d 6 U.S. Environmental Protection Agency. 2016. Climate Change Indicators in the United States, 2016. Fourth meditation. EPA 430-R-16-004. www.epa/gov/climate-indicators. 7 Climate Ready Boston, “The Boston Research Advisory Group Report: Climate Change and Sea Level Rise Projections for Boston,” June 2016 8 Under RCP 4.5 conditions. City of Cambridge, Climate Change Vulnerability Assessment, (City of Cambridge, 2015), http://www.cambridgema.gov/CDD/Projects/Climate/climatechangeresilianceandadaptation.aspx cited in BRAG. 9Northeast Climate Science Center. UMass Amherst. Massachusetts Climate Change Projections. December 2017

8
Figure 3 Increased length of days in growing season across the U.S.
Even small changes in temperatures can have a dramatic effect, such as changing precipitation
patterns and extending the growing season.10 The implications of warmer winters and summers are a
shift in the growing season and freeze/thaw cycle for the northeast. The Northeast has already seen
a significant deviation from the long-term average growing season beginning in the late 1980s with
nearly 10 days longer growing season (Figure 3). Future projected warming translates into a climate
similar to North Carolina and Virginia in the11 or to Alabama in the 2070s.12 These shifts in
temperature will have an important effect on food production, natural systems, species and vector
borne disease migration, and public health. In addition, they will affect energy use for heating and
cooling.
10 Northeast Climate Science Center. UMass Amherst. Massachusetts Climate Change Projections. December 2017 11 Northeast Climate Science Center. UMass Amherst. Massachusetts Climate Change Projections. December 2017 12 Climate Ready Boston, “The Boston Research Advisory Group Report: Climate Change and Sea Level Rise Projections for Boston,” June 2016

9
Sea Level Rise
Over the last century, sea level rise has increased by 11 inches (Figure 4) and the Boston Research
Advisory Group (BRAG) anticipates that the rate of increase will accelerate, anticipating an
additional eight inches by 2030.13,14 Warming temperatures contribute to sea level rise in two ways.
First, warm water expands to take up more space. Second, rising temperatures are melting land-
based ice which enters the oceans as meltwater. Another minor contributor to sea level rise in New
England is a small amount of land subsidence (drop in elevation) in response to the last glacial
period. During the last glacial period, pressure from the heavy ice compressed the land causing areas
around the glacier to curl upward. With glacial retreat, the land is rebounding to create isostatic
balance causing some portions of the east coast to rebound and some areas to subside.15
Figure 4 Observed Sea Level Rise.
Boston Tide Station from 1921-2016 which indicates over 11 inches of sea level rise in the last century.
There are several models and projections for sea level rise available. The majority derive results that
are relatively similar based upon some key assumptions, such as emission scenarios.
In 2013, Kleinfelder performed sea level rise and storm surge modeling for the towns of Scituate,
Marshfield, and Duxbury, projecting scenarios in 25, 50, and 75 years. Sea level rise was estimated
using NOAA Technical Report Global Sea Level Rise Scenarios for the United States National Climate
Assessment (December 2012) and storm surge was modeled using the hydronamic Sea, Lake, and
Overland Surge from Hurricanes Model (SLOSH) developed by the National Weather Service. In
2018, we anticipate completion of a more comprehensive SLR and storm surge analysis for Scituate
through the Massachusetts Department of Transportation Coastal Transportation Vulnerability
Assessment. Comprised of the widely-accepted Advanced Circulation (ADCIRC) probabilistic model,
13 U.S. Environmental Protection Agency. 2016. Climate Change Indicators in the United States, 2016. Fourth meditation. EPA 430-R-16-004. www.epa/gov/climate-indicators. 14 Climate Ready Boston, “The Boston Research Advisory Group Report: Climate Change and Sea Level Rise Projections for Boston,” June 2016 15 Upton, J. Sinking Atlantic Coastline Meets Rapidly Rising Seas. Scientific American. April 2016.

10
this analysis is a high-resolution, hydrodynamic, probabilistic model that calculates probable future
water flows as a result of tides, elevations, waves, winds, rivers, and various storms. It was used in
Boston Harbor, called the Boston Harbor Flood Risk Model -(BH-FRM) and is one of the most detailed
projections for coastal flooding available.16 Finally, the Northeast Climate Science Center at UMass
Amherst completed a SLR analysis for the Commonwealth in December 2017. This analysis is based
upon the one used for Boston Harbor in Climate Ready Boston and a method recently used in Southern
California.17 This is a probabilistic model that projects changes in sea level based upon existing tide
gauges. For Scituate, the closest analysis is the Boston tide gauge.
Table 2. Total Relative Sea Level Rise projections in Boston and South Shore for the “Highest” emission scenarios.
2030 2050 2070 2100
Boston BH_FRM 18 8.00 in 1.50 ft. 3.10 ft. 7.40 ft.
South Shore 19 8.04 in 1.85 ft. 3.39 ft. 6.52 ft.
Boston Tide Gauge20 0.4-0.9 ft 0.8-1.5 ft 1.3-2.4 2.0-4.0
The Kleinfelder model was calculated using the “highest” emission scenario as directed through
consensus with the municipalities and other local and statewide experts. The other models report both
medium and high emission scenarios, but the highest emission scenarios are reported for total relative
sea level rise in Table 2. The projections completed by the Northeast Climate Science Center vary
from the BH_FRM and the Kleinfelder models and further research is likely required to ascertain the
differences. For this report, we utilize the Kleinfelder model to analyze vulnerability in response to
sea level rise and storm surge.
16 Bosma, K., Douglas, E., Kirshen, P., McArthur, K., and Miller, S. MassDOT-FHWA Pilot Project Report. Climate Change and Extreme Weather Vulnerability Assessments and Adaptation Options for the Central Artery. June 2015. 17 Northeast Climate Science Center. UMass Amherst. Massachusetts Climate Change Projections. December2017. 18 Douglas, E.M., Kirshen, P.H., Bosma, K., et al. 2017. Simulating the Impacts and Assessing the Vulnerability of the Central Artery/Tunnel System to Sea level Rise and Increased Coastal Flooding. J Extreme Events 3 (4): 1650013 (28 pages). 19 “Sea Level Rise Study. The Towns of Marshfield, Duxbury, Scituate, MA”. 2013. Kleinfelder. 20 Northeast Climate Science Center. UMass Amherst. “Massachusetts Climate Change Projections”. December 2017
Source: NOAA

11
Precipitation
In the last 50 years, precipitation in the
Northeast US increased 71% in the amount
of rain that falls in the top 1% of storm
events.21 Projections for future precipitation
suggest an increase in total precipitation,
changes in precipitation patterns, and
increased frequency of extreme storms such
as hurricanes and nor’easters. Local
precipitation projection models indicate that
the frequency of these events and the
amount of precipitation occurring during
these events is likely to increase. For
example, a 100-year storm is defined as a
storm that would have a 1% chance of
occurring in any given year. Historically this
could create 8.9 inches of rain, but models
project that amount could increase to10 inches of rain by 2044 and 11.7 inches of rain by 2084
(Figure 5).22
The actual amount of increased precipitation or number of extreme weather events per year is
difficult to project into the future.23,24 However, the Northeast Climate Science Center does report an
anticipated increase in rainfall for Massachusetts in the spring and winter months and their climate
projection models suggest that the frequency of high-intensity rainfall events will also increase.25
Consequently, warming temperatures can cause greater evaporation in the summer and fall as well
as earlier snowmelt,23 leading to periods of drought or extreme snowfall. The Northeast Climate
Science Center projects a small decrease in average summer precipitation into the century; this
combined with projected higher temperatures could increase the frequency of episodic droughts.23
Finally, scientists anticipate the Boston region will continue to experience significant snow events
through 2100,20 though at this time, winter precipitation will be more rain than snow due projected
warmer winters.23
21 Horton, R., G. Yohe, W. Easterling, R. Kates, M. Ruth, E. Sussman, A. Whelchel, D. Wolfe, and F. Lipschultz, 2014: Ch.
16: Northeast. Climate Change Impacts in the United States: The Third National Climate Assessment, J. M. Melillo, Terese
(T.C.) Richmond, and G. W. Yohe, Eds., U.S. Global Change Research Program, 16-1-nn. 22 City of Cambridge, Climate Change Vulnerability Assessment, (City of Cambridge, 2015), Temperature and Precipitation
Projections (http://www.cambridgema.gov/CDD/Projects/Climate/~/media/A9D382B8C49F4944BF64776F88B68D7A.ashx) 23 Climate Ready Boston, “The Boston Research Advisory Group Report: Climate Change and Sea Level Rise Projections
for Boston,” June 2016 24 Horton, R., G. Yohe, W. Easterling, R. Kates, M. Ruth, E. Sussman, A. Whelchel, D. Wolfe, and F. Lipschultz, 2014: Ch.
16: Northeast. Climate Change Impacts in the United States: The Third National Climate Assessment, J. M. Melillo, Terese (T.C.) Richmond, and G. W. Yohe, Eds., U.S. Global Change Research Program, 16-1-nn 25 Northeast Climate Center UMass Amherst. Massachusetts Climate Change Projections. December 2017.
What is a “100-year” flood? The term “100-year flood” is shorthand for a flood that has a 1% chance of happening in a given year. In reality, a 100-year flood could occur two years in a row, or not at all for 100 years. But each year, there is a 1% chance it will occur. The 0.2% chance flood = 500-year flood The 1% chance flood = 100-year flood The 2% chance flood = 50-year flood The 10% chance flood = 10-year flood The 100-year flood zone is the location where there is a 1% chance of flooding each year. In the 500-year flood zone there is a 0.2% chance of flooding each year.

12
Figure 5 Precipitation Projections.
Precipitation projections. Modeling from Kleinfelder and ATMOS indicates more rain in any given storm event above the baseline into the end of the century. Source: Cambridge Climate Vulnerability Assessment 2015. Kleinfelder based on ATMOS projections November 2015

13
II. VULNERABILITY ASSESSMENT
This climate vulnerability assessment is an effort to determine which Scituate community assets –
people, places, infrastructure, and economy – may be susceptible to harm from climate change.
Climate vulnerability assessments generally consider:
Exposure – whether climate changes will have a negative effect on various assets in the
community.
Sensitivity – if affected by climate change, how much damage, or loss of function will occur.
Adaptive Capacity – sensitivity will be lessened, or heightened, by the degree to which there
may be ways for the community to cope, compensate, or be modified, to adjust to climate
changes.
Once vulnerabilities are identified, Scituate can prioritize climate actions (Part III) and capital
investments according to the perceived risk they present. Generally, this involves considering the
probability of damage to an asset and the consequences of damage. As an example, flooding to a
sewer pump station and a public park might be equally likely, but the pump station would
presumably have higher priority as the consequence of failure is more severe.
Overall, projected climate impacts do not create new concerns, rather they are an intensification,
increased frequency, or geographic expansion of existing challenges. Scituate already has significant
planning, experience and expertise to bring to these challenges. Further, many initiatives to address
climate impacts provide benefits to the Town (tree planting, open space preservation), can help
address obligations (MS4 permit compliance), or combat already identified problems (coastal
flooding).
Although disruptive storms may occur at any time, most of the predicted climate changes are
happening relatively slowly over time. Identifying future vulnerabilities now gives Scituate has time to
plan and enact programs, policies, and projects that ensure a more resilient community in the future.
Social Vulnerability
Just as some geographic areas in Scituate will be more vulnerable to climate impacts than others,
climate change will not affect all residents of Scituate equally. In the context of climate change,
vulnerable populations include those who may be more susceptible to climate impacts, and those who
will have more difficulty adapting to, preparing for, and recovering from extreme weather events.
“Social vulnerability” refers to characteristics such as income, age, health, race/ethnicity and
proximity to environmental hazards, which influence vulnerability to climate change. Demographic
information helps identify those residents that may be most vulnerable to climate change. It can also
provide opportunities to build stronger community cohesion to enhance resilience.
Scituate’s population is 18,133 which has grown slightly since 2000 and is expected to continue to
grow (Figure 6). According to the 2010 Census, 17.2% of the population is over the age of 64 and
5.3% is under the age of five, two age groups typically identified as being higher risk to extreme
weather events. Further, 24% are single-household residences and 41.1% are single female

14
Figure 6 Scituate’s current population and projections.
Figure 7 Scituate's residents’ income.
25%
12%
31%
32%
Scituate Income
< $49,000 $49,000-75,000 $75,000-$150,000 >$150,000

15
households with their own children
under 17. Scituate has a nominal
population of people of color with
96% of residents identifying
themselves as white. Other
ethnicities include 1% Black, 1%
Asian, and 2% other races.
Consequently, we found no data
suggesting Scituate has “limited
English speaking” or “Linguistically
isolated” households. Ninety-six
percent of residents speak English
only, but other spoken languages
include Spanish, Indo-European,
Asian and Pacific Islander. Twenty-
five percent of residents are
considered low income in Scituate
with less than $49,000 annual
income (Figure 7).
Based upon these demographics,
we suggest low income residents,
citizens over age 64, single
households with children, and
people of color may be at greater
risk to the impacts of climate
change.
Humarock contains a higher
population of seniors, who are at
risk not only to coastal flooding but
also extreme heat. Seniors over the age of 65 are the most likely at risk because of potentially
declining health or chronic health conditions, fixed-income, and changes in social factors such as
isolation. With fixed income, seniors (also low-income individuals) may have more limited access to
healthcare services or be under-insured. After extreme weather events, they may be more susceptible
to financial shocks having long-lasting impacts on financial security, securing safe shelter and meeting
medical needs. Furthermore, they may have access to transportation, impairing their ability to
relocate to emergency shelters or away from areas susceptible to climate impacts. Seniors may also
have physical mobility constraints and may require special assistance with emergency response.
However, Scituate is already providing extensive services through its Council on Aging and our
community-based disaster relief organization called SANDS. The Council on Aging connects with
seniors during extreme weather events and provides rides to shelters if requested.
Addressing the needs of seniors and all its residents in extreme weather is one Scituate’s greatest strengths. Scituate has one of the first recognized Community Organized to Aid in Disasters under the Commonwealth of Massachusetts Volunteer Organizations Active in Disaster, called SANDS. Recognized by FEMA for their emergency response efforts during Juno in 2015, SANDS assist in providing pre and post disaster recover for its residents. For example, they connect teens to seniors for shoveling. Also connect seniors to shelter during extreme heat
events.

16
Public Health Vulnerability
Climate change creates risks to public health, and those health risks are likely to increase in the future.
The Center for Disease Control and Prevention illustrates in Figure 8 the intersection of climate
change, impacts to human health and health outcomes as a result of exposure. In this section, we
identify some of Scituate’s important public health vulnerabilities and strengths in relationship to a
changing climate.
Figure 8 Climate impacts and health outcomes roadmap.
Source: Centers for Disease Control and Prevention
(https://www.cdc.gov/climateandhealth/effects/default.htm)
Extreme Heat
The projected increase in extreme heat and heat waves is the source of one of the key health
concerns related to climate change. According to the Environmental Protection Agency (EPA) and the
National Oceanic and Atmospheric Association (NOAA), heat was the leading cause of weather
fatalities in the United States from 1987-2016.26 As noted earlier, scientists project up to 90 days
over 90°F, and up to 28 days over 100°F annually, by the end of this century.
MAPC uses LANDSAT satellite data, a 30m downscaled average of land surface temperature every
16 days, during late June/July to locate heat islands. Heat islands are areas whose surface
temperature are elevated in comparison to its surroundings because of land use or infrastructure such
as impervious surface of lack of tree cover. Figure 9 illustrates the heat islands in Scituate.
26 National Oceanic and Atmospheric Association, National Weather Service. Office of Climate, Water and Weather Services. 2-15.

17
Figure 9 Scituate heat islands.
MAPC identifies heat islands using LANDSAT satellite data with elevated daytime land surface temperature (LST) during
late June/early July. This data provides a 30m downscaled average of land surface temperature every 16 days.

18
Areas most vulnerable to extreme heat include Humarock, the Town Center including Town Hall and
Scituate High School, the retail/commercial area on Front Street, and the Greenbush Commuter Rail
station. Humarock and the Scituate High School areas are of greatest concern.
Humarock has a greater population of seniors. According to the Centers for Disease Control and
Prevention, seniors are at particularly high risk to heat for several reasons. They may not adjust to
sudden changes in temperature as quickly as younger people, they are more likely to have a chronic
medical condition whose symptoms may be exacerbated by heat, and they are more likely to be
taking prescription medications that affect their ability to control body temperature.27,28,29
Vulnerability is increased if there is no access to air conditioning or cooling centers.
Figure 10 Air Quality Assessment in Scituate 2011-2015.
Source: MA Department of Public Health-Bureau of Environmental Health
https://matracking.ehs.state.ma.us/
Extreme heat can affect the general population even outside of heat islands. Individuals who work
outdoors are at increased risk for heat-related illnesses. Extreme heat has the potential to contribute
to greater levels of ground level air pollution and allergens. Heat helps form by chemical reactions
between NOx and volatile organic compounds (VOCs) in the presence of sunlight. Breathing ozone
27 Center for Disease Control and Prevention. http://www.nws.noaa.gov/om/hazstats.shtml(https://www.cdc.gov/disasters/extremeheat/older-adults-heat.html) 28 Gamble, J. L., Hurley, B. J., Schultz, P. A., Jaglom, W. S., Krishnan, N., & Harris, M. (2013). Climate Change and Older Americans: State of the Science. Environmental Health Perspectives, 121(1), 15–22. http://doi.org/10.1289/ehp.1205223 29 Center for Disease Control and Prevention. Natural Disasters and Severe Weather. https://www.cdc.gov/disasters/extremeheat/older-adults-heat.html

19
can irritate the respiratory system, reduce lung function and heighten sensitivity to allergens.30
Interestingly, in 2015, Plymouth County experienced one day where the 8-hour ozone level exceeded
the National Ambient Air Quality Standards (NAAQS), but from 2011-2015 there were zero days
during which fine particle daily concentrations exceeded the NAAQS (Figure 10). One indicator of
risk to heat is hospitalizations related to chronic cardiovascular and respiratory conditions. Scituate in
most cases where data is available has about half less than the State average for asthma and
cardiovascular hospitalizations (Figure 11).
Figure 11 Heart attack and asthma hospitalization for Scituate 2012.
Source: MA Department of Public Health-Bureau of Environmental Health
https://matracking.ehs.state.ma.us/
30 MassDEP, “Ground-Level Ozone,” accessed on August 19, 2016,
http://www.mass.gov/eea/agencies/massdep/air/quality/aq-ground-level-ozone.html

20
The youth at the high school may also be at risk with longer exposure to heat during sports and
recreation periods. Prolonged exposure to high temperatures can cause heat-related illnesses, such as
heat cramps, heat exhaustion, heat stroke, and death. Heat exhaustion is the most common heat-
related illness and if untreated, it may progress to heat stroke. Prolonged heat exposure can also
exacerbate pre-existing conditions, including respiratory illnesses, cardiovascular disease, and mental
illnesses.
Finally, power failures can occur during heat waves, where intense heat spikes electricity demand and
stresses aging infrastructure. This occurred in June 2017 in the Town of Belmont, MA where intense
heat caused a spike in electricity demand. With aging infrastructure, the combination of these factors
led to equipment failure.31 Loss of electricity not only impairs a resident’s ability to cool but can cause
significant medical emergencies for those who require electronic medical life support equipment or
from consuming food-borne illnesses from contaminated food, ingested after loss of refrigeration.
Vector Borne Illness
Vector-borne illnesses are those that stem from contact with vectors such as mosquitos and ticks. The
spread of vector-borne illnesses is influenced by vector type, weather conditions, built environment
conditions, and human behavioral factors. The two most common mosquito-borne illnesses in
Massachusetts are eastern equine encephalitis (EEE) and West Nile virus (WNV). There is no reported
mosquito species in Scituate to have been found to carry WNV. As climate change is expected to
bring heavy precipitation events (which increase areas of standing water) and warmer temperatures,
mosquito populations may expand, and the transmission season may extend beyond its traditional
late spring through early fall. Warmer temperatures also accelerate a mosquito’s lifecycle and
increase biting rates.
Tick-borne illnesses, particularly Lyme disease, babesiosis, and anaplasmosis have been on the rise in
Massachusetts. From 2005-2016, there has been an 83.5% change in cases of Lyme disease in
Plymouth County (Figure 12). Winter frost plays an important role in limiting tick
populations; warmer winter may lead to more nymphs surviving into the spring months. As with
mosquitos, warmer temperatures can lead to longer transmission seasons as ticks begin to seek hosts
earlier in the season. Tick populations thrive with increased precipitation and humidity and may be
more susceptible to annual fluctuations in precipitation than mosquitos.
Forecasting the spread of vector-borne illnesses and estimating risk due to climate change is very
challenging, due to multiple factors at play. For example, research suggests that heavy precipitation
in urbanized areas could reduce mosquito populations by flushing underground breeding habitat.
Further, vector populations’ size and range are dependent on the size and range of their host species
(i.e., migratory birds, mice, and deer), which may shift as the climate changes. As the climate gets
warmer, tropical vector species may expand their ranges north, which could bring with them vector-
borne illnesses not typically found in the Northeast (i.e., dengue fever or chikungunya). As vector-
31 Wicked Local Belmont “Power Outage in Belmont Affects 2,000 Customers” June 14, 2017. http://belmont.wickedlocal.com/news/20170612/power-outage-in-belmont-affects-2000-customers

21
borne disease outbreaks occur globally, residents may import vector-borne illnesses acquired during
trips to other countries.
Figure 12 Lyme disease incidence in Plymouth County.
Vector Borne-Illnesses Source: Massachusetts Department of Public Health and WBUR “Map: Where
Lyme Disease is Worsening in MA.” http://www.wbur.org/commonhealth/2017/07/18/massachusetts-
map-lyme-disease
People who spend a lot of time outdoors, or live close to vector habitats, are at greatest risk of
exposure to vector-borne illnesses. The ability to protect oneself from mosquito-borne illnesses has
been associated with socioeconomic status via housing conditions. Households that can afford air-
conditioning and maintenance of windows/screens are less likely to encounter mosquitos in their home.
Those most likely to experience severe vector-borne illnesses are children, people over the age of 50,
and people with compromised immune systems.
Environmental Hazards Exposure
A significant public health risk in the face of extreme precipitation or storm events with subsequent
flooding is exposure to environmental hazards and toxins, for both the immediate and long-term. EPA
Tier 2 are sites where the release of oil or other hazardous material has occurred and are monitored
by the MA Dept. of Environmental Protection (DEP). MA DEP BWP sites are facilities regulated by the
MA DEP Bureau of Air and Waste (BWP) because of the presence of large quantities of hazardous
waste, hazardous waste treatment, storage and/or disposal facilities, groundwater and/or surface
water discharge permits, etc. In an extreme flooding event, potential exposure to these health-

22
threatening substances can cause water contamination, including bacteria, viruses, and chemicals that
cause gastrointestinal diseases, dermatological conditions, toxicity/poisoning, and other illnesses.
Often people encounter contaminated water when it floods onto their property but contact with
contaminated water through recreation can be dangerous, too. Climate change is expected to
increase the risk of residents encountering contaminated water in their parks, homes, schools, and
places of work. The Commonwealth of MA in collaboration with MA regional planning agencies is
providing training to businesses monitored or regulated for hazardous materials for climate resilience
for emergency preparedness and resilient containment.
Figure 13 illustrates Scituate’s risks related to potential toxic exposure from flooding. For immediate
flooding concerns, there is one site currently in a FEMA 1% Annual Chance Flood Zone that could
cause potential release of toxic or hazardous substances if structures and containments were
damaged as a result of storm surge or coastal flooding. Other sites adjacent to the 1% include two
21E sites at 69 Kenneth Road and 20 Country Way and the closed and active landfills. There are no
toxic sites within projected limits of SLR 2038 or 2088 or within either both those years with a
Category 1 Hurricane, except DEP regulated CVS on Front Street.
An additional health concern is posed by mold. Long term risk with more frequent precipitation
and/or localized flooding results in water damage to buildings – and the formation of mold. Chronic
mold can be an ongoing challenge particularly in public housing, senior housing, and in buildings built
before the 1980s. Mold triggers allergies and respiratory illnesses, such as asthma. Some strains of
mold release airborne toxins, called mycotoxins, which can cause mold toxicity. Mold toxicity can
influence the function of internal organs, the nervous system, and the immune system.

23
Figure 13 Scituate FEMA flood zones and potential environmental hazards.

24
Natural Resources Vulnerability
Scituate is shaped by its
seven miles of coastline
with steep distinct
bedrock headlands and
several barrier and
pebbly beaches,
including Humarock. The
Town also has
important natural
systems and resources
providing significant
ecological services,
recreational amenities,
economic drivers, and
climate resilience. Of its
12,160 square miles, approximately 3,577 or 30% of the Town is protected open space and 1,340
or 11% is water, such as rivers, lakes, ponds, and streams. Healthy, intact ecosystems provide greater
resiliency to the community from flooding, stormwater, and extreme heat while also providing clean
air and clean water. However, these natural resources are also vulnerable to erratic and extreme
precipitation patterns, sea level rise, ocean warming and acidification, and impacts related to
warmer climate such as changes in the freeze/thaw cycle.
Coastal Environment
Extensive vulnerability analysis and recommendations for
coastal adaptation to sea level rise and storm surge have
been completed for Scituate. This section identifies ecological
vulnerably in the coastal environment important to climate
resiliency that are not addressed in Scituate’s previous
climate-related planning efforts.
Salt Marshes
Scituate has approximately 1,600 acres of salt marshes, the
most extensive occurring within the sheltered bay (Cohasset
Harbor) landward of Strawberry Point. Other marshes include
the salt marsh at the North/South River and Kent Street
Marshes. Salt marshes and estuaries are complex and highly
productive ecosystems generally resilient to wide variations in
temperature, salinity, and inundation.32 Ecological benefits of
salt marshes include floodwater storage, storm surge
protection, carbon sequestration, nutrient removal and water
32 Executive Office of Energy and Environmental Affairs and Adaptation Advisory Committee. 2011. Massachusetts Climate Adaptation Report.
Photo by Darci Schofield

25
quality improvements. Healthy marshes also support important commercial fish and shellfish habitat.33
The sustainability of the system is a delicate balance of complex coastal processes. Salt marshes are
typically found in low energy coastal areas; they require consistent tidal inundation but cannot survive
if submerged. Salt marshes today are already threatened by several factors: nutrient loading/non-
point pollution from stormwater runoff, extreme precipitation events, loss of tidal flow due to
insufficient culverts, invasive species and persistent salt water inundation. Salt marshes are protected
by the Wetlands Protection Act with a 100-foot buffer and no disturbance regulation. However,
historic development has created hardened shorelines that affect the horizontal migration and vertical
migration of the salt marsh. With climate change, the deteriorated conditions of many of
Massachusetts’ salt marshes will be exacerbated with sea level rise, lack of migration area from
hardened shores, and extreme precipitation events flushing the salt marsh and creating an
environment conducive to invasive species.
In Scituate, there is already
evidence of marsh
deterioration from sea level
rise. Mass Bays is an EPA
National Estuary Program
that facilitates research and
partnerships to create more
resilient and sustainable
estuarine ecosystems. They
performed an evaluation of
salt marsh grasses/vegetation
in the South Shore including
North River salt mars5hes,
tested at Driftway Park and
Scituate Conservation Area in
Scituate. At Driftway Park in
2014, there has been an
81% increase in biomass of
Spartina alterniflora (short saltmarsh cordgrass) in comparison to 2000. At Scituate Conservation,
there was a decrease in three different types of high marsh species Spartina patens (-3%), Distichlis
spicata (-11%), and Iva frutescens (-3%). The study suggests that salt water intrusion from frequent
inundation may be causing the shift in species composition 34where high marsh salt grasses are less
tolerant of high levels of salinity. In this circumstance, the loss of marsh elevation prohibits optimal
plant growth, and the salt marsh converts to a tidal mudflat or subtidal open water.
33 Linda A. Deegan, David Samuel Johnson, R. Scott Warren, Bruce J. Peterson, John W. Fleeger, Sergio Fagherazzi & Wilfred M. Wollheim. Coastal eutrophication as a result of salt marsh loss. 2012. Nature 490: 388-392 34 Grady, Sara and Mansfield, Alex. Hones, North, and South Rivers Salt Marsh Assessment. Mass Bays Program. January 29, 2015. http://www.mass.gov/eea/docs/mbp/publications/technical-report-jrwa-2014.pdf
Salt Marsh at North/South River confluence. Photo by Darci Schofield

26
Figure 14 Coastal wetland migration areas for climate resilience.
This map illustrates BioMap2 Coastal Adaptation Areas for marsh migration/climate adaptation. The Massachusetts Department of Fish & Game’s Natural Heritage & Endangered Species Program (NHESP)

27
and The Nature Conservancy’s Massachusetts Program developed BioMap2 to protect the state’s
biodiversity in the context of projected effects of climate change.35
Some studies indicate that allowing for salt marsh migration, horizontal and vertical, can help build
resilience when thin layer deposition occurs at a rate consistent with sea level rise to enable
sustainable ecosystem function. Coastal natural buffers for horizontal migration sustain the ecosystem
balance of tall (Spartina alterniflora) and short (Spartina patens) marsh grass habitats. Figure 14
illustrates the Coastal Adaptation Analysis and the geographic extent needed coastal wetland
migration. Furthermore, the MA DEP has listed Cohasset Harbor and North River as impaired waters
which can further detrimentally impair salt marsh health. Shellfish growing areas are limited in
Scituate Harbor and only conditionally approved at the Kent Street Marshes and around Cohasset
Harbor.36 Healthy salt marshes support healthy shellfish growing areas, and the combined interaction
of these systems ensures greater resilience and shoreline protection for Scituate in the face of rising
seas and warmer temperatures.
Bays
Cohasset Cove and Scituate Harbor are robust amenities to the Town of Scituate, seasonally active
with boating, sailing, fishing, educational programs and tourism. In 2008, there were 1,200
recreational boaters during the summer and over 200 boat slips in the harbor.37 The integrity of the
bay ecosystem is critical not only as an economic and recreational asset but also in providing coastal
resilience as it supports living shorelines already protecting Scituate’s coast. However, there are
several climate change risks that will have important effects on future resilience.
Table 3. Water Quality Impairments
Waterbody Category Impairment
Musquashcut Pond
5 Excess Algal Growth, Flow Regime Alterations, Dissolved O2 saturation, Chlorophyll-a, Phosphorus, Fecal coliform.
Cohasset Harbor
5 Fecal coliform (no shellfish harvesting)
Aaron River Reservoir
4a Mercury in fish tissue (atmospheric), fish passage barrier
North River 5 Fecal Coliform (not supporting shellfish harvesting)
South River 5 Fecal Coliform -Discharges from MS4 (no shellfish)
Herring River 5 Fecal Coliform-Municipal Point Source Discharges
Source: ENSR International, Massachusetts DEP, and US EPA New England Region 1. Final Pathogen TMDL for the South Coastal Watershed. Aguste 2014. CN 0255.0
35 https://www.mass.gov/files/documents/2016/08/wi/biomap2-summary-report.pdf 36 Bureau of Geographic Information (MassGIS), Commonwealth of Massachusetts, Executive Office of Technology and Security Services 37 Horsley Witten Group. Town of Scituate Open Space and Recreation Plan. February 2009.

28
The bays host important tidal flats that sustain a productive shellfish growing areas, seagrass,
anadromous fish, and resident and migratory birds, some of which are threatened or of special
concern. BioMap2 is a program created by the MA Department of Fish and Game Natural Heritage
and Endangered Species Program (NHESP) and The Nature Conservancy to map important natural
resource areas that will protect biodiversity and the nature of Massachusetts in the face of climate
change.38 Aquatic Cores are intact river corridors whose ecological processes are critical to
supporting fish species and other aquatic Species of Conservation Concern as well are providing a
myriad of important wetland ecosystem functions. The Spit and portions of the North and South River
are NHESP designated Aquatic Core Habitat, an approximately 9,998-acre expanse which extends
into Norwell and Marshfield along the North and South Rivers. This Aquatic Core supports 17 rare
and uncommon species, including the globally rare Piping Plover, Common and Least Terns. This Core
Habitat also contains the uncommon, structurally-diverse Freshwater Tidal Marsh and uncommon
Fresh/Brackish Tidal Swamp. Further, there is designated Tern foraging habitat from Humarock, The
Spit, to Scituate Bay and Cohasset Bay.38
Despite their significance, these waterbodies are also at risk to ecosystem loss and impairment from a
variety of factors. Table 3 lists impaired waters from the 2014 “Final Listing of the Condition of
Massachusetts’ Waters Pursuant to Sections 305(b), 314 and 303(d) of the Clean Water Act.”
Scituate Harbor, Cohasset Bay and Musquashcot Pond are all designated as Category Five requiring
Total Daily Maximum Loads (TDML), an EPA designation that establishes the maximum pollutant
amount in a water body and serves as a planning tool for restoring water quality.39 These water
bodies also have use-restrictions such as limitations on shellfish harvesting from the presence of fecal
coliform.
Since 1995, the MA Department of Environmental Protection has evaluated submerged aquatic
vegetation at regular intervals, the majority of which is eelgrass (Zostera marina). Though Scituate’s
bays have some impairment, they are supporting important eelgrass meadows. In 1995, Cohasset
Bay contained approximately 125 acres and Situate Bay contained approximately 12 acres of
eelgrass.40 There has been a decline from 2010 in the meadow extent in some areas in Cohasset Bay
and while other meadows have expanded when evaluated in 2012 (Figure 15). Seagrass/eelgrass
meadows provide important ecological and climate resilience benefits. They capture sediment and
take up nutrients ultimately providing better water clarity and provide important habitat for fish.41
Importantly, eelgrass meadows will dissipate wave energy and wave height thereby reducing
shoreline erosion.42
38 Natural Heritage and Endangered Species Program. Conserving the Biodiversity of Massachusetts in a Changing World-Scituate. 2012. http://maps.massgis.state.ma.us/dfg/biomap/pdf/town_core/Scituate.pdf 39 https://www.epa.gov/tmdl 40 Bureau of Geographic Information (MassGIS), Commonwealth of Massachusetts, Executive Office of Technology and Security Services. http://www.mass.gov/anf/research-and-tech/it-serv-and-support/application-serv/office-of-geographic-information-massgis/datalayers/eelgrass2013.html 41 Bjork, Mats; Short, Fred, Mcleod, Elizabeth, and Beer, Sven. 2008. Managing Seagrasses for Resilience to Climate Change. IUCN, Gland, Switzerland. 56pp 42 Bradley, Kevin and Houser, Chris. 2009. Relative velocity of seagrass blades: Implications for wave attenuation in low-energy environments. Journal of Geophysical Research, Vol 114 F01004

29
Figure 15 Scituate eelgrass and shellfish suitability areas.

30
Eelgrass decline can be attributed to many
factors such as pathogens, boating, and
nutrient loading from stormwater, sewer
systems, and fertilizers.43 Sea level rise,
warming ocean temperatures and increased
runoff from extreme precipitation could also
put these important ecosystems at risk.
Other future impacts of climate change to
Scituate’s Bays are ocean acidification and
warmer temperatures. Oceans capture excess
carbon released into the atmosphere through
the burning of fossil fuels. The carbon when
dissolved forms carbonic acid, ultimately
affecting the typically basic pH levels in the
ocean and causing acidification. Future ocean
acidification may cause shellfish larvae to
create smaller shells or not develop them at
all44 or reduce shellfish reproduction and growth rates. There is enough concern that Massachusetts
Bays is seeking to install an ocean acidification monitor at the Mattakeeset Public Boat Launch in
Duxbury.45
Increasing ocean temperatures locally can detrimentally affect ecosystem function, causing species
migration, potential introduction of new pathogens, and harmful algal blooms.46 In the last three
decades, sea surface temperatures have been higher on average than over the last century, or ever
since being recorded.47 The MA Department of Public Health in partnership with the Department of
Fish and Game and Division of Marine Fisheries, is monitoring pathogenic marine micro-organisms
related to foodborne illness. There is a reported increase in Vibrio parahaemolyticus (Vp) whose
geographic distribution has shifted to Massachusetts because of warming ocean temperatures. Vp is a
naturally-occurring bacterium found in warm, brackish waters and its presence has caused strict
regulation on oyster harvests as it causes illness when consumed in raw oysters.48
43 Short, Fred; Klein, Anita; Burdick, David; and Moore, Gregg. 2012. The Eelgrass Resource of Southern New England New York: Science in Support of Management and Restoration Success. NOAA Restoration Center Community-based Restoration Program. OMB Approval 0648-0472. 44 Waldbusser, George G. et al. 2015. Saturation-state sensitivity of marine bivalve larvae to ocean acidification. Nature Climate Change 5, 273-280 45 Personal Communication. Sara Grady, South Shore Regional Coordinator, MassBays 46 Executive Office of Energy and Environmental Affairs and Adaptation Advisory Committee. 2011. Massachusetts Climate Adaptation Report. 47 National Oceanic and Atmospheric Administration. 2016 Indicators. http://www.globalchange.gov/browse/indicators/indicator-sea-surface-temperatures 48 Department of Fish and Game. Massachusetts Division of Marine Fisheries Annual Report 2016.
Humarock Beach. Photo by Darci Schofield

31
Figure 16 Sea Level Rise 2038 and 2063 (Kleinfelder 2013).

32

33
Barrier Beaches
Scituate contains several important barrier beaches, important not only for their recreational
amenities but also for building and maintaining coastal resilience. Beaches in Scituate include Minot
Beach, North Scituate Beach to Egypt Beach, the barrier beach between First and Second Cliff,
Peggotty Beach, The Spit, Fourth Cliff, and Humarock, one of the largest barrier beaches in
Massachusetts. Applied Coastal Research and Engineering, Inc. in 2016 provided an important
assessment of horizontal and vertical migration and loss to many of these beaches as well as
recommendations for stabilization and management strategies for shoreline protection. Barrier
beaches are a critical first line of defense for storm surge providing wave attenuation and energy
dissipation, thereby protecting coastal infrastructure. However, many of the natural features of
Scituate’s beaches and barriers effectuating critical stabilization of the shore have been minimized or
lost to development. Scituate’s hardened shoreline from sea walls and revetments alters coastal
geomorphology and is influencing the migration of sediments, lowering beaches substantially over the
last sixty years.49
Scituate is already experiencing significant impacts from coastal storms. Figure 16 illustrates
Scituate’s coastal vulnerability to sea level rise and storm surge, where by 2088, many of these
beaches will be completely submerged. Scituate’s Hazard Mitigation Plan, “Coastal Erosion, Sediment
Transport, and Prioritization Management Strategy Assessment for Shoreline Protection” by Applied
Coastal and Kleinfelder’s “Sea Level Rise Study in the Towns of Marshfield, Scituate, and Duxbury”
have provided very important short-term mitigation strategies and long-term adaptation strategies
for shoreline protection. Implementing these recommendations are critically important to prevent
future loss of both infrastructure is natural systems.
Table 4: BioMap2 Core Habitat for Aquatic and Wetland Core in Scituate.
Fresh Water Resources
Rivers and Inland Wetlands
The Town of Scituate contains over 21 square miles of freshwater resources including rivers, streams,
inland wetlands, and salt marshes. These systems are important for supporting clean drinking water,
49 Applied Coastal Research and Engineering, Inc. Coastal Erosion, Sediment Transport, and Prioritization Management Strategy assessment for Shoreline Protection. August 2016.
BioMap2 Aquatic Core
Habitat
Location Acres Description
1033 North River <1 ac Species of Conservation- Seabeach Needlegrass
1326 North River 9,988 Wetland Core, Priority Natural Community, Species of Conservation
1472 Pond -Country Way
49 Aquatic Core, Species of Conservation
1412 South Swamp 294 Wetland Core, least disturbed wetland, support critical function into the future.

34
flood control, and overall ecosystem health for climate resilience. Rivers include the North River,
Herring River, Satuit Brook, Musquashcut Brook, First Herring Brook, and Bound Brook. Many of these
rivers experience flooding at regular intervals in a 0.5%, 1%, and 2% storm, and existing water
quality impairments (Table 1) could diminish the health of these natural systems, important for overall
ecosystem function and services.
Connecting these rivers are extensive wetlands and ponds. Scituate contains over 10,300 acres of
important BioMap2 Aquatic and Core Wetland areas and contains a Wetland Core that is among
the largest 20% of Wetland Cores statewide. Bio Map 2 Wetland Core is an area that represents
healthy, intact wetland systems sustaining critical ecosystem functions and biodiversity which are likely
to maintain their function through our changing climate. Aquatic Cores are intact river systems and
corridors supporting important ecosystem function and services for wildlife and water management.50
The health of these wetlands is critical to mitigate flooding, filter contaminants from stormwater, and
protect water quality. Several of these areas and rivers, including Bound Brook, Satuit Brook, the
confluence of the Herring and North Rivers and at Old Oaken Bucket/Tack Factory ponds, contain
anadromous fish habitats and/or runs.51 Anadromous fish are ecologically important to an overall
river system because they provide nutrient transfer from marine to fresh waters and a food source for
predatory fish and birds, an indicator of ecosystem health.
Climate Risks to Freshwater Resources
Overall, the integrity of Scituate’s wetland resources is at risk from climate change due to several
factors: sea level rise and storm surge, drought, increasing temperatures and extreme precipitation
events. A 2-4 foot of sea level rise and storm surge will significantly increase the extent of flooding
of the North and South Rivers, Musquashcot Brook, the Gulf, Herring River, and Kent Street Marshes
(Figure 16) spreading into many residential areas and some commercial areas, potentially
overflowing culverts and causing significant road and bridge damage. Heavy precipitation
accompanied by flooding can scour stream and river vegetation eroding banks and degrading
ecosystem function. There is also has a negative effect on water quality, because it flushes ground
pollutants – everything from dog waste, to oils on the road, to sand – into rivers, streams, and ponds.
Existing and capped landfills could be vulnerable, impairing historic and existing wetlands,
groundwater resources, or adjacent water bodies. Extreme rain events could result in structural
damage to the cap and increase infiltration with toxic leachate into adjacent wetlands and/or
waterbodies.52
Heat waves, hotter summers, and drought, combined with earlier spring run-off due to warmer
temperatures and a shift from snow to rain, can lead to warmer waters and seasonal low-flow or no-
flow events and potentially low levels of dissolved oxygen, impairing fish species habitat and vitality.
50 Bureau of Geographic Information (MassGIS), Commonwealth of Massachusetts, Executive Office of Technology and Security Services 51 Natural Heritage and Endangered Species Program. Conserving the Biodiversity of Massachusetts in a Changing World- Scituate. 2012. http://maps.massgis.state.ma.us/dfg/biomap/pdf/town_core/Scituate.pdf 52 Executive Office of Energy and Environmental Affairs and Adaptation Advisory Committee. 2011. Massachusetts Climate Adaptation Report.

35
If dry conditions persist, wetlands could shrink in area or lose some of their absorptive capacity and
be more prone to runoff and erosion.
The combined effects of washing nutrients into lakes and ponds and warmer summer temperatures
may lead to an increase in the growth of aquatic vegetation. For example, warmer winter
temperatures and lack of ice cover extend the growing season enabling greater aquatic growth in
ponds. Excessive aquatic vegetation can deplete dissolved oxygen and lead to die-offs of aquatic
animals. Additionally, algae blooms can also lead to growth in toxic bacteria that makes water
bodies unsafe for use by humans and pets.
Forests and Trees
Scituate has a long history
of acquiring and
protecting land and
contains 1,186 acres of
protected land held by
the Town, private land
trust, and State.53 Since
the adoption of the
Community Preservation
Act in 2002, the Town has
acquired 384 acres of
additional open space. Of
Scituate’s 17.6 square
miles, 48.8% is covered
by forest canopy as of
2011, totaling 5,583 acres
(Figure 17), and Scituate’s
canopy cover has grown by 10% in the last six years.54 Approximately 1,588 acres or 14% of the
Town is covered by impervious cover such as asphalt from roads and parking lots. The most notable
contiguous tracts of open space in and around Scituate include Wompatuck State Park, Rivermoore
Habitat Park and its abutting protected areas, Widow’s Walk, the Ellis Estate, and West End
Conservation Land.48
Scituate’s natural lands, though susceptible to a changing climate, create a weave of resilience
against climate risks and hazards. These areas mitigate flooding, alleviate stress on stormwater
systems, serve to recharge and clean the Towns aquifer, mitigate air pollutants, and cool the town
with evapotranspiration and shade. According to the EPA, suburban areas with mature trees are four
to six degrees cooler than new suburbs without trees. Shaded surfaces can be 25-40
53 Horsley Witten Group. Open Space and Recreation Plan. 2009 54 MA Department of Public Health-Bureau of Environmental Health. Report created on Oct. 16, 2017. http://www.mass.gov/dph/matracking
Scituate’s West End. Photo credit Town of Scituate

36
degrees cooler than the peak temperatures of unshaded surfaces. Trees also absorb remarkable
quantities of precipitation;55 In addition to water uptake by roots, tree leaves intercept rainfall which
is stored or evaporated back into the atmosphere, reducing the amount of stormwater runoff and
flooding. They also serve to reduce energy use and demand through shading buildings, reducing the
need for air condition, and reduce asphalt maintenance by preventing sun deterioration. Finally, trees
sequester carbon dioxide, a greenhouse gas; this is a critical mechanism to mitigate climate change.
Figure 17 Scituate Tree Canopy.
Tree canopy cover in Scituate from National Land Cover Database of 2011. Scituate’s land use contains over 48.8% forest and 20.7% open space and recreation land.
The peer-reviewed USDA Forest Service i-Tree software creates models of ecological services from
forests and tree canopy. Based on this model, Scituate’s 48.8% forest cover intercepts 525 million
gallons of rain fall per year and avoids 71.3 million gallons of runoff worth $637,317 per year.
Estimates of pollution reduction from Scituate’s tree canopy in pounds per year include 537,856 of
55 U.S. Environmental Protection Agency. 2008. Reducing urban heat islands: Compendium of strategies. Draft. https://www.epa.gov/heat-islands/heat-island-compendium

37
carbon monoxide, 39,256 of nitrogen dioxide, and 282,247 of ozone. The estimated value of
Scituate’s tree canopy for carbon storage is over $31 million while the value of annual carbon
sequestration (tree growth minus loss due to decomposition and mortality) is over $594,343 per year,
equivalent to 15,229 tons of carbon dioxide sequestration per year.56 As a comparison, the City of
Chelsea, a dense, urban environment, has a tree canopy that sequesters only 77.9 tons of CO2.
Scituate’s tree canopy provides a significant quantifiable benefit, however there is a clear dearth of
tree canopy along Scituate’s coast. Though some of these areas (Figure 17) are salt marsh and not
supporting tree growth, the remaining illustrates the dense development and significant vulnerability
along the coastline.
Intact forest ecosystems are critical for maintaining long-term climate resilience, but forests will
undergo stressors related to our changing climate, specifically longer growing seasons, periods of
intense precipitation and/or drought, and warmer winters. Longer growing seasons and increased
carbon in the atmosphere overall will benefit forest productivity. Historically, the growing season in
the last 60 years has increased a week to 10 days.57 Warmer winters may increase the incidence of
ice storms, and extreme precipitation regimes could lead to severe rainfall in a single event causing
flooding. These factors work in conjunction to cause several vulnerabilities to the forest: (i) favoring
establishment of invasive and exotics establishments with gaps in the canopy due to wind and ice
storms, (ii) migration of species to more northern climates and immigration of new species and/or
pests; and (iii) weakened trees, with drought causing greater susceptibility to insects and diseases.58
The overall impact is an anticipated shift in forest type in Southern New England from a
Maple/Birch/Beech forest to forests characteristic of southern New York, New Jersey and
Pennsylvania, an Oak/Hickory forests.59 Table 5 lists species that will be more or less competitive
with a changing climate. Managing forests and trees for climate adaptation will be an important
strategy to retaining Scituate’s forest health, air and water quality, and overall climate resilience.
56 United States Forest Service. Itree. https://www.itreetools.org/resources/content/Landscape_factsheet.pdf 57 Executive Office of Energy and Environmental Affairs and Adaptation Advisory Committee. 2011. Massachusetts Climate Adaptation Report. 58 Catanzaro, P., A. D’Amato, E. Silver Huff 2016. Increasing Forest Resiliency for an Uncertain Future. UMass Extension Landowner Outreach Pamphlet. 28 pages 59 U.S. Forest Service, Changing Climate, Changing Forests. The Impacts of Climate Change on the Northeast United States and Eastern Canada. 2011

38
Table 5: Tree Species predictions on adaptive capacity to climate change.
Southern New England Forest
Tree Species Low Emissions Scenario
High Emissions Scenario
Balsam Fir -- -- Black Spruce -- -- Eastern White Pine -- -- Northern White Cedar -- -- Paper Birch -- -- Quaking Aspen -- -- Red Spruce -- -- White Spruce -- -- Tamarack -- • American Beech • -- Red Maple • -- Northern Red Oak • -- Bear/Scrub Oak • • Black Cherry • • Sugar Maple • • Bigtooth Aspen + • Pitch Pine + • American Basswood • +
Bitternut Hickory + +
Black Oak + +
Chestnut Oak + +
Shagbark Hickory + +
White Oak + +
Threatened by Current Forest Health Issues
Black Ash -- -- Eastern Hemlock • • White Ash • •
The values indicate whether a species will decrease in habitat (–), stay the same (•), or increase in
habitat (+). Source: Catanzaro, P., A. D’Amato, E. Silver Huff 2016. Increasing Forest Resiliency for
an Uncertain Future. UMass Extension Landowner Outreach Pamphlet. 28 pages.

39
Critical Infrastructure Vulnerability
In August 2016, the Town of Scituate completed a Natural Hazard Mitigation Plan. The purpose of a
Hazard Mitigation Plan is to evaluate the Town’s vulnerability and mitigate presently existing natural
hazards such as coastal and inland flooding, extreme heat, severe storms like hurricanes and
Nor’easters, etc. The vulnerability of the Town’s critical infrastructure to existing natural hazards is
evaluated in this plan. This Critical Infrastructure Vulnerability section will evaluate future risks of
Scituate’s infrastructure as it relates to climate change projections for sea level rise, inland flooding,
and extreme heat.
Drinking Water
With anticipated sea level rise, increased frequency and intensity of precipitation events and/or
drought, extreme heat and shifting freeze/thaw cycles, climate change is expected to strain drinking
water resources, both in quality and quantity. It is important to understand the extent of water supply
and demand today, plan for the water demand for new residential, commercial, industrial, and
agricultural growth into the future, and evaluate the system’s vulnerabilities to meeting the Town’s
demands today and into future. Overall, vulnerabilities for Scituate’s drinking water include the
potential for a stressed water supply, contamination from flooding, and potential for salt water
intrusion into groundwater aquifers along the coast.
Scituate’s has two sources of drinking water, wells and surface water. The town maintains a water
treatment plant, two booster stations, two water storage tanks, four corrosion control stations, and
124 miles of drinking water distribution pipes.60 Scituate’s six wells pump from three main aquifers
and are located off Cornet Stetson Rd (#10 & 11); off Tack Factory Pond Rd (#17A); off the
Driftway (#18B); off Chief Justice Cushing Highway (#19) near the Town Hall; and off Old Forge Rd
(#22).61 The land around these
wells is regulated as Zone II
groundwater recharge areas
bounded by the extent of pump
extraction for 180 days without
precipitation recharge and
physical/geomorphological
features such as bedrock or till.
Scituate has three Zone II areas,
including 859 acres at First
Herring Brook (expands into
Norwell), 123 acres at Coleman
Hills in the Scituate Conservation
Park, and 418 acres at Webster
Meadows, bounded by Herring
60 VHB. Natural Hazard Mitigation Plan. Scituate, Massachusetts. August 2, 2016. 61 Scituate Water Department. Annual Water Quality Report. 2015. fttp://www.gemgrp.com/eReports/CNMA010684-1Y16.pdf
Patriot Ledger story on Scituate’s Water Supply with the 2016 drought.
March 2017. Photo credit Greg Derr.

40
Brook and containing some protected conservation land.62
Scituate also has Surface Water Protection Areas. These include a 679-acre Zone A including First
Herring Brook and Tributaries, Tack Factory Pond Reservoir, and a 372-acre Old Oaken Bucket
Reservoir. Zone A is the surface water source and its upper boundaries and the Zone B land is the
area within ½ mile of the upper boundary of the Zone A source.63 Further, Scituate contains two
major areas classified as “Outstanding Resource Waters” (ORW) protection under the Massachusetts
Surface Water Quality Standards, including certain wetlands and their tributaries, because of their
high quality water supply and contribution to the municipality and region. These include the 3,294-
acre Old Oaken Bucket Pond ORW Public Water Supply Contributor and a portion of the 3,542-
acre Aaron River Reservoir ORW.64
Figure 18 Salt water intrusion to fresh groundwater with SLR.
Source: https://www.epa.gov/sites/production/files/2015-07/documents/soil-
based_onsite_wastewater_treatment_and_the_challenges_of_climate_change.pdf
A portion of one of Scituate’s aquifers lies along the coastline. Scientists anticipate that sea level rise
will reduce the barrier between the fresh groundwater and the ocean salt water as salt water
migrates underground (Figure 18). Aquifers near the coastline are susceptible to salt water intrusion
when the soil barrier between the salt water table and the aquifer is permeable or contains well-
drained soils such as sand, gravel, and till. The area in Scituate potentially most vulnerable to salt
water intrusion is the aquifer that touches the coast at Peggotty Beach. The coastal upland soils
contain Broadbrook Very Fine Sandy Loam which is a well-drained soil. The same aquifer approaches
“the Spit”, however these soils are poorly drained, suggesting that it would be more difficult for salt
water intrusion to occur (Figure 19).
62 Horsley Witten Group. Town of Scituate Open Space and Recreation Plan. 2009 63 Bureau of Geographic Information (MassGIS), Commonwealth of Massachusetts, Executive Office of Technology and Security Services 64 Bureau of Geographic Information (MassGIS), Commonwealth of Massachusetts, Executive Office of Technology and Security Services

41
Figure 19 Scituate's coastal aquifers and soil hydrologic group.

42
One drinking water well, Well #10, is vulnerable to sea level rise 2038 with a Category 1
Hurricane. Well #11 is adjacent to sea level rise 2038 Category 1 and Well #18b is adjacent to
the extent of sea level rise in 2088 but neither are within inundation zones for 2038 or 2088. Wells
that are currently within a FEMA 1% Annual Chance Flood zone include Well 18B, Well #22, Well
#11, and Well #10 (Figure 20 and Appendix A). However, further hydrologic study is required to
ascertain the potential and/or extent of salt water intrusion at aquifer and wells.
Effects on water supply with climate change will greatly depend on precipitation, both quantity and
timing, and capturing rain and stormwater into the ground before it reaches streams, rivers, and the
ocean-effectively keeping Scituate’s water within its own aquifer and watershed system. MAPC
performed a study in 2001 to ascertain drinking water supply challenges for municipalities in the
region and Scituate was identified as a town facing water supply issues. These issues will arise from
increased demand with new development and increased discharge of water outside of the watershed
recharge area.65 As of 2009, the Town was seeking opportunities to increase its water supply by
expanding the reservoir and/or by acquiring new land to expand its wells.66 In 2016, Massachusetts
experienced severe drought conditions, the most severe since 1965, which caused a strain on many
municipal drinking water supplies. During the drought, Scituate’s Public Works Director reported that
its Reservoir was precariously low.67 As of October 18, 2017, the Water Department imposed a full
water ban on all non-essential outdoor watering use because the reservoir had fallen to a level of 36
feet. When it is at that level, the MA DEP requires a water ban.68
65 Metropolitan Area Planning Council. South Coastal Basin Watershed Pilot Project, Final Report. 2001 66 Horsley Witten Group. Town of Scituate Open Space and Recreation Plan. 2009 67 WBUR.Amid Drought, Scituate Reservoir Is Getting Precariously Low. August 12, 2016. http://www.wbur.org/morningedition/2016/08/12/scituate-reservoir-drought 68 https://www.scituatema.gov/sites/scituatema/files/news/water_ban_10.18.17.pdf

43
Figure 20. Potential for salt water intrusion in wellhead protection areas with sea level rise.

44
Wastewater Infrastructure
Scituate’s municipal sewer system is managed by the Sewer Division of the Department of Public
Works. The Town has a treatment plant supported by six pump stations and 32 miles of sewer lines.
The sewer system became operational in 1967, which was intended to treat approximately 1.3
million gallons per day (mgd) of waste water, though its current capacity has been upgraded to 1.6
mgd. The system has had two upgrades since its inception, in 1984 and 2000. Sewer Division
disinfects its wastewater with ultraviolet light rather than chlorine. The Town has had several
expansions to its collection system including Greenbush/Reservoir in 2005, Third Cliff in 2006, and
First and Second Cliffs in 2007.69 Phase 4, 5, and 6 of the sewer expansion are targeted for Front
Street, North Scituate, and Minot. However, new development around existing sewer lines can tap
into the existing systems causing concern with Town leaders and staff on existing sewer capacity
relative to future growth.70
Presently, nearly 72% of Scituate residences have private septic systems even though 85% of the
soils in Scituate are considered not conducive to septic systems by the USDA Soil Conservation
Services (now the USDA Natural Resources Conservation Services). Soil suitability is measured by
percolation rate, depth to bedrock, depth to water table, compact/impermeable soils, steep slopes
and flooding.71
Municipal Sewer System
Sea level rise, extreme precipitation, and flooding are the most important factors in understanding
Scituate’s sewer system vulnerability. Today, approximately half of the facilities at the North River
Waster Water Pollution Control Plan at the Driftway are currently within a 1% Annual Chance Flood.
And the Collier Road and Peggotty Beach Pump Stations are currently in a FEMA High Velocity Zone
(VE)- coastal areas subject to 1% Annual Chance Flood with additional hazards from storm surge
69 https://www.scituatema.gov/sewer-division 70 Scituate DPW Director, Board of Selectmen meeting. November 21, 2017. 71 Horsley Witten Group. Town of Scituate Open Space and Recreation Plan. 2009

45
(Table 6). Today, Scituate’s sewer system is already experiencing coastal flooding along Ocean
Drive, taking in sea water and far exceeding its capacity (up to 5-6 million gallons a day) when
waves overtop the seawalls in that location. This has occurred with just a very high tide only, though
now the sea wall has been replaced and improved. The vulnerability of the municipal sewer lines is
significant for the 1% Annual Chance Flood for inundation with storm surge, where Cedar Point and
most of Oceanside Drive sewer lines are submerged. The municipal sewer lines in critical areas
become inundated by sea level rise in 2088, but not by 2038 (Figure 21).72
Table 6: Sewer Pump Stations and their vulnerability to coastal flooding.
Critical Infrastructure
ID
Name
Address
Type
FEMA VE
FEMA 1%
SLR 2038
SLR 2088
104 Chain Pond Pump
Station
310 Hatherly Rd. Sewer Pump
Station
x (x)
105 Sand Hills Pump Station
0 Scituate Ave. Sewer Pump Station
x (x) x
106 First Parish Pump Station
106 First Parish Rd. Sewer Pump Station
107 Country Way Pump Station
220 Country Way Sewer Pump Station
108 Herring Brook Pump Station
15 New Driftway Sewer Pump Station
x x
109 Collier Road Pump Station
31 Collier Rd. Sewer Pump Station
x
110 Peggotty Beach Pump Station
22 Peggotty Beach Rd.
Sewer Pump Station
x x x
111 First Cliff Pump Station
137 Edward Foster Rd.
Sewer Pump Station
x x x
Pump stations exposed to current future coastal flooding. See Figure 23 for locations on the map.
Future extent of sea level rise extends just to the waste water treatment plant (WWTP) boundary in
2038 with a Category 1 storm surge. However, it isn’t until 2088 that the WWTP becomes nearly
submerged by two to four feet of water from sea level rise and/or storm surge (Figure 23). In
addition, the treatment plant has the potential for flooding with a Category 2 Hurricane.73 First Cliff,
Peggotty Beach, and Herring Brook Pump Stations are all within flood zones for sea level rise 2038
and Category 1 Hurricane and sea level rise in 2088 (Figure 21 and Appendix A).
The impact of inundation by sea level rise and/or storm surge is significant, potentially causing an
overload to the system and/or electricity failures resulting in the release of raw sewage and hazards
to drinking water systems. For example, during Hurricane Sandy, many water utilities lost
Figure 21 Municipal wastewater infrastructure, coastal flooding and sea level rise (SLR) in 2088.
72 Scituate DPW Director, Board of Selectmen meeting. November 21, 2017. 73 Bureau of Geographic Information (MassGIS), Commonwealth of Massachusetts, Executive Office of Technology and Security Services

46

47
electricity and did not have back-up generators. Counties in New York and New Jersey had drinking

48
water advisories and boil water notices. The Passaic Valley treatment plant was forced to release
billions of gallons of raw and partially treated sewage into New York Bay.74
Onsite Waste Water Treatment
Scituate’s private septic systems are vulnerable to sea level rise, extreme precipitation events and
warming temperatures. Septic systems or On-Site Wastewater Treatment (OSWT) proximate to
rivers, wetlands, and the coast, where the groundwater table would be most affected by sea level
rise or flooding from extreme precipitation events, are geographically the ones at risk. At the coast,
sea level rise will displace and potentially intrude into near-shore fresh groundwater tables, bringing
the fresh groundwater (which is less dense) closer to the surface. This mechanism could cause several
complications. First, sea level rise and storm surge could ultimately expose and/or destroy the OSWT
completely (Figure 22). Residents in Humarock, Peggotty Beach, and Minot, most of whom have
OWST, are most vulnerable. Second, there will more shallow depth to ground water limiting septic
leachate area. With less area, there is reduced microbial activity needed to properly filter
wastewater potentially releasing fecal coliform and phosphorus.75
Figure 22 Exposed septic system after coastal storm, CT.
Source: https://www.epa.gov/sites/production/files/2015-07/documents/soil-
based_onsite_wastewater_treatment_and_the_challenges_of_climate_change.pdf
Third, OSWT will be susceptible to groundwater infiltration of leach fields, particularly during severe
precipitation events and during times of inland and/or coastal flooding. Finally, groundwater and/or
74 http://www.mwra.com/monthly/wac/presentations/2014/030714-climatechange.pdf 75 Amador, J. Loomis, G., Cooper, J. and Kalen. D. Soil-Based Onsite Wastewater Treatment and the Challenges of Climate Change. Laboratory of Soil Ecology and Microbiology New England Onsite Wastewater Training Center University of Rhode Island Kingston, RI https://www.epa.gov/sites/production/files/2015-07/documents/soil-based_onsite_wastewater_treatment_and_the_challenges_of_climate_change.pdf

49
salt water intrusion of pipes with sea level rise, storm surge and inland flooding can cause
deterioration of the system itself.
Dams
The Department of Conservation and
Recreation (DCR) Office of Dam Safety
monitors the condition of the state’s dams.
DCR requires that dams with low hazard
ratings be evaluated every decade while the
dams which are rated significant and high
hazard are inspected every five years.76
DCR potential hazard ratings are high,
significant, and low; conditions are rated
good, satisfactory, fair, poor, or unsafe. The
State Hazard Mitigation Plan uses the term
“High Hazard Potential” for dams located
where failure will likely cause loss of life and
serious damage to homes, industrial or
commercial facilities, important public utilities,
main highways, or railroads. A “Significant
Hazard Potential” dam is one located where
failure may cause loss of life and damage
homes, industrial or commercial facilities,
secondary highways, or railroads; or cause
interruption of use or service of relatively
important facilities. “Low Hazard Potential” dams are located where failure may cause minimal
property damage to others, and loss of life is not expected.
In 2015, Scituate worked with the MA Division of Ecological Restoration, NOAA, MA Coastal Zone
Management and others to restore the aquatic habitat of Bound Brook with the removal of the
Hunter’s Pond Dam.77 Hunter’s Pond Dam was the only dam located in a future sea level rise zone in
2088. Scituate’s removal of this dam is a perfect example of taking action today which will have
great impact in protecting the municipality in the future.
Scituate’s Hazard Mitigation Plan identifies three dams that are currently at significant risk as a result
of FEMA flood zones, and these are of immediate concern. Since FEMA floods zones are determined
by historic flooding events among other factors, the impact of sea level rise with storm surge on the
existing dam structures are an even greater risk into the future. The dams at risk are summarized in
Table 7. The Massachusetts Climate Adaptation Report notes that increased intensity of precipitation
76 https://www.scituatema.gov/sites/scituatema/files/file/file/hunters_public_meeting_invite_january_2015.pdf 77 VHB. Natural Hazard Mitigation Plan Scituate, Massachusetts. August 2, 2016.

50
is the primary concern regarding dams as they typically have been likely designed based on historic
weather patterns. A potential effect of increased significant rain events is the failure and/or
overtopping of existing dams.
Table 7: Scituate’s dams and vulnerability.
Dam Owner Hazard
Severity with Failure
Current FEMA Flood Hurricane
Surge Storm Current
2038 SLR
Old Oaken Bucket Pond Dam
Town of Scituate
Significant 1% Annual Flood Risk with BFE
Category 4 Yes
First Herring Brook Reservoir Dam
Town of Scituate
High 1% Annual Flood Risk with BFE
N/A No
Tack Factory Pond Dam
Town of Scituate
N/A 1% Annual Flood Risk with BFE
N/A No
Mordecai Lincoln Rd. Pond Dam
Private Association
Significant 1% Annual Flood Risk with no BFE
Category 1-2 Yes
Bound Brook Control Dam
Town of Cohasset
Significant 1% with no BFE N/A No
Satsuit Meadow Dam Town of Scituate
N/A 0.2% Annual Flood Risk
N/A No
Picture Pond Dam State DCR N/A 1% Annual Flood Risk with BFE
N/A No
Scituate’s dams by hazard status, current flood risk and future flood risk. There are no dams located in a zone of sea
level rise in 2088.

51
Built Environment
Loss of electricity and lack of back-up energy source is a vulnerability due to extreme heat and high
energy demand. The most significant threat to municipal and critical infrastructure (such as medical
services) is flooding from coastal storms and extreme precipitation events. Other vulnerabilities to the
built environment are extreme heat impacting electricity demand and supply as well as deterioration
to infrastructure. In this section, we review future risks to the built environment where sea level rise
may alter flood locations and depths. Because there are no inland flooding projection models, only
FEMA flood maps which are based upon historical data, there are challenges to projecting future
inland flooding and damages, including varying impacts when rain falls on dry, frozen, or saturated
land; and varying impacts between long and short-duration rain events. Flooding associated with
storm drainage infrastructure is also particularly difficult to project.
Figure 23 Coastal flooding in Scituate, 2014.
News report on Scituate’s coastal flooding of residences and streets along 6th and 7th avenue after a blizzard in 2014.
Yet there are ways to assess and consider future vulnerabilities that might result from increases in
precipitation. Reviewing extreme events that may become more frequent is valuable for identifying
where damage occurred and where it might have extended had rainfall amounts been greater
(Figure 5). Since we anticipate that future precipitation regimes are expected to increase in

52
frequency and intensity, we evaluate FEMA mapped 0.2% and 1% Annual Chance flood (500-year
storm) to assess inland flooding vulnerability. As noted above, understanding the condition and
location of culverts and storm drains is important, because of their potential for blockages and
flooding.
Scituate’s 2016 Hazard Mitigation Plan illustrates that through November 2015, the Town of Scituate
had 1,472 flood insurance policies with coverage of over $382 million, and 3,681 submitted losses.
The total payment on those losses was $63 million.78 Applied Coastal Research and Engineering in
2016 reports, according to the Federal Emergency Management Agency/National Flood Insurance
Program, 1,732 repetitive loss claims in Scituate since 1978, with the greatest number of these in
1991 “Perfect Storm” with 446 FEMA repetitive loss claims totaling $34,505,788.79 Scituate
participates in the Community Rating System (CRS) which provides reduced insurance costs for
property owner’s flood insurance if the Town accomplishes certain mitigation actions to reduce its
vulnerability to flooding. In 2015, the Town’s Class 7 rating afforded 15% decrease in flood
insurance payments. Further, Scituate has embarked upon a robust public education program on
flooding including fact sheets, handbooks, and public workshops.80
Appendix A lists all critical facilities and their location within a FEMA high velocity zone (VE), FEMA
1% Annual Chance Flood, sea level rise in 2038 with a Category 1 hurricane, and sea level rise in
2088. It is significant to note that none of Scituate’s critical infrastructure lies within a FEMA 0.2%
Annual Chance Flood. Some notable critical infrastructure subject to sea level rise in 2038 and 2088
includes the Coast Guard Station, Harbormaster Office and piers. Notable infrastructure subject to
sea level rise in 2038 only includes the CVS block on Front Street, North River and Sea Street
bridges, Scituate Harbor Marina, and Satuite Waterfront Club. Figure 24 illustrates Scituate’s critical
infrastructure in a FEMA flood zone and in SLR 2038 and 2088.
78 VHB. Natural Hazard Mitigation Plan Scituate, Massachusetts. August 2, 2016 79 Applied Coastal Research and Engineering, Inc. Coastal Erosion, Sediment Transport, and Prioritization Management Strategy assessment for Shoreline Protection. August 2016. 80 VHB. Natural Hazard Mitigation Plan Scituate, Massachusetts. August 2, 2016

53
Figure 24 Critical Infrastructure and flooding.

54
Scituate’s Critical Infrastructure and Flooding from the FEMA flood zones and sea level Rise in 2038 and in 2088. Appendix
A contains the corresponding list of critical infrastructure.

55
Economic Vulnerability
Extreme weather events are important factors in determining economic vulnerability for Scituate in
climate change. These include extreme temperatures, extreme precipitation and flooding from coastal
storms. Economic vulnerability arises from the loss of transportation to work, the inability to operate
business due to lack of staff, loss of utilities, lack of accessibility and/or damage to business
infrastructure itself, or loss of productivity from unexpected childcare with school closures. Extreme
weather events have already caused significant loss of productivity and economic loss in the Boston
region in recent years. For example, in 2014, the Polar Vortex caused extreme cold temperatures
that resulted in $5 billion in economic losses globally, a 2.1% drop in the GDP. These were largely
due to loss of productivity from school and business closures from damaged infrastructure-frozen
pipes and heating systems and delayed or cancelled transportation, like airlines.81,82
In 2015, for 33 consecutive days from late January to late February, Massachusetts experienced
significant snow and several blizzards resulting in over 103 inches of snow accumulations in Plymouth
County. For this period, Plymouth County endured expenses totaling over $20 million for debris
removal, emergency services, public infrastructure repairs, and additional snow removal. The January
26-28, 2015 blizzard alone cost $5.9 million, most of which was for snow removal, tree limb removal,
and the heavy equipment and overtime required. These costs exclude any loss of productivity due to
business closures, displacement, and loss of revenue from decreased spending on non-essential retail
and commercial products and services.83
For future potential economic losses, we evaluate economic infrastructure impacted by sea level rise in
2088 with a category 1 storm surge, using land use data and Infogroup 2011. Figure 25 illustrates
the results of potential economic losses from coastal flooding and inundation, the majority of which is
clustered in the Front Street downtown area. There are 156 businesses employing 932 people at risk.
The assessed value of parcels in the 2088 SLR flood zone include: $57,821,600 in commercial
parcels, $46,421,600 in municipal parcels, and $1,666,552 in residential parcels.
81 http://money.cnn.com/2014/10/30/news/economy/us-gdp-3-and-half-percent-beats-expectations/?iid=EL 82 https://www.cbsnews.com/news/economic-impact-of-polar-vortex-could-reach-5b/ 83 http://www.mass.gov/governor/docs/news/attachment-a-severe-winter-weather-pattern-impacts-supplemental-info.pdf

56
Figure 25 Potential economic loss with 2088 sea level rise in Scituate.

57
Utility Vulnerability
Figure 26 illustrates the breakdown of energy use by sector in Scituate and its implications on carbon
emissions, from the MAPC’s Local Energy Action Dashboard (lead.mapc.org). This platform serves to
explore and compare energy use, emissions, and cost estimates. It provides a high-level
understanding the extent of potential loss during a storm but also as a baseline to assist communities
in developing clean energy programs, important for reducing our carbon emissions and reducing sea
level rise extent in the future.
Figure 26 Energy and emissions analysis, Scituate.
An analysis of Scituate’s energy consumption, emissions, and cost from the Metropolitan Area Planning Council’s Local Energy Action Dashboard (https://lead.mapc.org/cities/duxbury).
Scituate owns a wind turbine and solar farm at the Driftway, advancing clean energy and climate
mitigation strategies as well as saving money on electricity for municipal buildings. Other utilities
include Columbia Gas Company for natural gas, and Eversource and National Grid for electricity.84
Because energy infrastructure is not publicly available, we have limited data on the geographic
84 https://www.scituatema.gov/quick-links/pages/utilities

58
locations of substations. Nonetheless, we have evaluated the overall vulnerability of utilities and here
report on how Scituate’s companies are addressing climate resilience.
Electricity
Electrical infrastructure is vulnerable to extreme weather, particularly winter storms, heat waves, and
floods. Ice storms, freeze/thaw cycles, and flooding can cause severe damage. Winter storms and
hurricanes can increase loads on utility infrastructure, such as power lines and utility poles, from
precipitation and wind strain. Additionally, over 90% of power outages are caused by fallen trees
and limbs during storms. Heat waves are also damaging to infrastructure, because of disruptions to
cooling equipment within transformers, which are already overburdened during times of increased
demand on the electric grid. Flooding can corrode critical infrastructure and prevent electronic
components from functioning.
Eversource is currently implementing initiatives to bolster the resiliency of their critical assets. These
initiatives include emergency preparedness trainings for staff, flood-proofing vulnerable substations,
and updating design standards for increased precipitation and flooding. Eversource has also
partnered with the University of Connecticut for a variety of research and model programs to
enhance emergency repair response, forest management, climate adaptation and mitigation activities
in preparation for sea level rise and flooding. They are also advancing projects with a resilience cost
benefit analyses and utilizing technology to create a three-dimensional model of local and utility
infrastructure. Eversource is also utilizing and providing clean energy such as solar and wind to its
customers. 85
National Grid is part of the U.S. Department of Energy’s Partnership for Energy Sector Climate
Resilience, a program for utilities to enhance resilience of its infrastructure from extreme weather
events and climate change. Through this partnership, National Grid has committed to evaluate climate
vulnerability, create an action plan for resiliency, evaluate the cost and benefits of resilient strategies
to prioritize response, and share best practices with the partnership. The Department of Energy
provides technical assistance such as tools for assessing vulnerabilities and climate data, facilitates
collaboration within the partnership and provides recognition for leaders in climate resilience.73 In
addition, National Grid has initiated a Yearly Improvement Program targeted at enhancing resiliency
in areas that have suffered repeat flood outages. In these high-risk areas, they will be upgrading low
pressure distribution systems to high pressure distribution systems and flood-proofing aboveground
infrastructure that may be affected by flooding. Finally, National Grid has made a commitment
toward climate mitigation by providing low-carbon energy solutions and to pledge reduce their
greenhouse gas emissions by 45% by 2020 and 80% by 2050.86
85 http://www.eversource.uconn.edu/wp-content/uploads/2016/11/brochure-eec-october-2016.pdf 86 https://www.nationalgrid.com/group/responsibility-and-sustainability/environmental-sustainability/our-climate-commitment

59
Natural Gas
Scituate’s natural gas infrastructure is provided by Columbia Gas. Critical gas infrastructure includes
pipelines, compressor stations, storage facilities, and control stations. This infrastructure is necessary to
transport, store, and distribute natural gas.
Flooding from heavy precipitation poses a threat to underground gas infrastructure. Gas pipes rely
on internal pressure to keep natural gas flowing. Water intrusion can disturb this internal pressure
and result in service disruption. Gas pipes within low pressure distribution systems are the most
vulnerable to flooding, because they do not have the hydrostatic pressure necessary to keep water
out. Aboveground infrastructure, such as compressor stations, metering stations, and control stations
are also vulnerable to flooding. Freeze/thaw events can cause gas mains to break. Older cast iron
pipes are the most vulnerable to freeze/thaw events. Extreme heat does not pose significant threats
to gas infrastructure. For example, during winter storm Riley in March 2018, a downed utility wire
ignited a gas line in the Town of Wenham causing a 30-foot fireball to rise into the sky and an
ongoing plume of fire on the street until the issue was resolved.87
Figure 27 Natural gas leaks and repaired leaks in Scituate as of December 2016.
Source: https://www.heetma.org/squeaky-leak/natural-gas-leaks-maps/
Massachusetts has a gas leakage problem that adds complexity to addressing future climate impact.
The natural gas system is one of the oldest in the country; cast iron pipes are susceptible to breaks
from frost heaves, ground movement, and construction. Unprotected steel pipes are subject to
87 https://whdh.com/news/30-foot-fireball-rises-over-wenham-when-downed-wire-ignites-gas-line/

60
corrosion. As of December 2016, Scituate had 45 unrepaired gas leaks and 43 leaks repaired in
2016(Figure 27).88 Many of these are located within a FEMA 1% Annual Chance Flood or within SLR
for 2038 and 2088. Gas leaks release methane, the most powerful greenhouse gas, into the soil and
the air and can cause serious environmental and health risks, including suffocating the root systems of
trees and forming ground-level ozone (an asthma trigger). In 2014, the Massachusetts legislature
passed a law that requires gas companies to accelerate the replacement of leak prone pipes. Gas
companies are required to submit annual Gas Safety Enhancement Plans. In 2015, Columbia Gas had
over 800 miles of leak-prone pipes. To meet compliance, Columbia gas began working with
municipalities to improve the process of construction for repairs including consensus on project start
dates, identification of municipal special requests, and sequencing of gas main replacement with
paving and/or water and sewer improvement projects. This collaborative approach enables cost-
savings mechanism for municipalities and Columbia Gas in sharing expenses related to utility and
road (paving) improvements.89 In addition, Columbia Gas, National Grid, and Eversource are working
with the Home Energy Efficient Team (HEET) to address natural gas leaks through a “Shared Action
Plan.” Specifically, they are targeting the Grade 3 large volume leaks that are the greatest risks to
health and the environment.90
Telecommunications
Telecommunications infrastructure is the technology that transmits information electronically, including
phone and computer networks, and the internet. This infrastructure plays a critical role in emergency
response and recovery. Telecommunications infrastructure is vulnerable to extreme heat, precipitation,
and storms. Most heat-related service disruptions are caused by power outages resulting from
increased demand on the electric grid. Extreme heat can also cause critical infrastructure to overheat
or malfunction, leading to equipment failure and reduced lifespan. Flooding from heavy precipitation,
sea level rise, and storm surges are primary concerns for underground infrastructure and critical
facilities with potential for corrosion and erosion. Heavy ice formation and snow accumulation can
increase the load on telecommunication lines and infrastructure, resulting in damage. Heavy
precipitation and increased humidity can interfere with the signal transmission on which wireless
systems rely on.
Aboveground infrastructure is vulnerable to strong winds and lightning. Wired infrastructure and
utility poles are particularly vulnerable to damage from falling trees and limbs. Many providers
utilize shared fiber networks that reduce redundancy and therefore increase vulnerability to systems
disruption during extreme weather.
Some service providers, such as Verizon, are taking steps to protect their infrastructure from the
impact of climate change. They are creating backup power capability on critical sites, implementing
emergency fuel plans for generators, hardening buildings and structures to withstand flooding and
precipitation, deploying mobile communications units to heavily affected communities, and training
88 https://www.heetma.org/squeaky-leak/natural-gas-leaks-maps/ 89 75 http://fixourpipes.org/case-studies/ 90 https://www.columbiagasma.com/en/about-us/newsroom/news/2017/11/07/columbia-gas-of-massachusetts-plans-reliability-projects

61
staff to respond to emergencies. Specific data on the location of telecommunications infrastructure
and networks is not publicly available.

62
Transportation Vulnerability
MBTA
The MBTA provides services to Scituate residents and businesses via the Greenbush Commuter Line
and two commuter stops, North Scituate and Greenbush. Data from the MBTA Ridership and Services
Statistics 2014 Report reveals that the Greenbush line services approximately 5,400 riders daily,
including approximately 500-1000 from the North Scituate Commuter Station. Though the Greenbush
Commuter line is not the most heavily used, its ridership has increased by over 3,000 since 2010.91
While Greenbush line ridership increases significantly starting at the Quincy Center station, the
notable growth in ridership both locally, statewide, and nationally on public transportation presents
this line as a clear asset to the Town.92
Figure 28 Heat kink on MBTA track.
Heat kinks in the Orange Line tracks cause cancellations and delays.
MBTA infrastructure in Scituate is at risk from climate change. The Greenbush Station is in a 1% Annual Chance Flood and the North Scituate station is adjacent to a regulatory floodway and a 1% Annual Chance Flood Zone. Both are low lying and generally prone to flooding today. 93 Portions of the commuter line rail itself is susceptible to 0.2% flooding between the North Scituate and Cohasset Stations. Some portions of the rail line exist within a current 1% Annual chance of flooding.
Furthermore, the Greenbush station is located within an existing urban heat island.
MBTA climate concerns extend to extreme heat and warmer winters. Also, temperatures in excess of
85°F can cause buckled rails (Figure 28), overheated equipment, regional power failures, wear and
tear on paved surfaces, and health and safety issue for workers and passengers. Warming
temperatures could lead to more damage from ice storms if temperatures hover around freezing.
91 MBTA State of the Service Commuter Rail. 2015. http://old.mbta.com/uploadedfiles/About_the_T/Board_Meetings/StateofCommuterRailSystem.pdf 92 American Public Transportation Association. Public Transportation Ridership Report. 2014. http://www.apta.com/resources/statistics/Documents/Ridership/2014-q4-ridership-APTA.pdf 93 Personal Communication, Nancy Durfee, December 2017.

63
Extreme weather events were the greatest cause of delays in service in 2015 with 4,743 incidents.
The MBTA is committed to creating a resilient transportation system and employing incremental steps
to address climate resilience. New architectural and engineering plans must now address historic and
future vulnerabilities by the 30% design stage. New improvement projects must indicate how they will
improve climate resilience and are prioritized by climate resilience function. The MBTA has completed
the Blue Line Vulnerability Assessment, and Kenmore Square and Charlestown studies are underway
to ascertain flood risk in stations effected by future sea level rise and storm surge projections.
Additionally, they are pursuing a system-wide analysis of climate vulnerability.
Figure 29 Scituate coastal flooding on roadways.
Emergency response was required to walk to site of emergency because of road flooding during a storm. Photo Credit SANDS.
Roadways
Transportation infrastructure would likely experience an acceleration in deterioration of its
components, like asphalt, from the combination of extreme temperatures, increased precipitation and
flooding. Extreme temperatures for long periods would cause thermal expansion of metal structures
and stress bridge infrastructure. This would also affect roadway materials through softening and
expanding, which can lead to rutting and potholes.94 While a warmer climate may lead to a
decreased need to provide snow and ice removal, more rapid freezing and thawing cycles could
cause more acute damage sustained during the warmer months.
Roadways in Scituate subject to heat damage from heat island effects include (i) roads adjacent to
the North Scituate Commuter Rail Stop including Gannet Road and Country Way, (ii) roads adjacent
94 National Research Council. The Potential Impacts of Climate Change on U.S. Transportation, Transportation Research Board Special report 290. 2008.

64
to the Greenbush Commuter Rail Station including the Driftway, Stockbridge Road and Country Way,
(iii) the municipal buildings complex off Route 3A including the Scituate High School, Gates Middle
School, and Scituate Town Hall, (iv) Front Street at retail center, and (v) roads in and around
Humarock.
Flooding has the potential to block roadways for both regular and emergency transportation access.
There are approximate 16 major roads and streets prone to major flooding from a1% Annual
Chance Flood Zone. These are listed in the Table 8.
Table 8: Major roads prone to flooding in 1% Annual Chance Flood.
Road 1% Annual
Chance Flood Zone
Gannet X
Surfside X
Hatherly X
Glades X
Hollet X
Oceanside X
Rebecca X
Lighthouse X
Jericho X
Front X
Edward Foster
X
Kent X
The Driftway X
Central Ave X
Gilson X
River St. X

65
Historic Assets Vulnerability
Scituate is rich with cultural assets contributing significant interest and beauty to the Town. Indeed, one
resident noted that its historic assets “are the very essence of our Town.” 95 Some notable historic sites
include the Scituate Lighthouse, the Stockbridge Grist Mill, Lawson Tower, and Old Oaken Bucket
House. Scituate has a historical commission, a historical society, a demolition delay bylaw, and
compliments the Community Preservation Act. The MA Historic Commission has inventoried 972 historic
structures and buildings in Scituate, and the Scituate Historical Society has completed 18 historic
preservation Community Preservation Projects. Because of their richness, historic and cultural assets
are important to consider for future planning, growth, and climate change resilience. With projected
changes in temperatures, storm severity, and precipitation regimes, new preservation methodologies
may need to be explored.
Historic assets in Scituate are vulnerable to climate change. First, locations in flood zones, coastal
areas, and heat islands may impact the integrity of historic structures, but in addition, studies have
indicated that our changing climate could accelerate the deterioration of stone and brick buildings.
Masonry building deterioration is caused by water infiltrating the stone, evaporation and/or freezing
and thawing.96 This process can typically occur over centuries but is likely to accelerate with increased
temperatures and increased frequency of freeze/thaw cycles. Increased temperatures could also
encourage fungal and plant growth and insect infestation which could further deteriorate building
materials.97
Of Scituate’s 972 historic structures, 127 are at risk to flooding in a 1% Annual Flood Chance
according to FEMA flood risk maps. These include the South Shore Railroad Bridge, the
Scituate/Cohasset Border Marker, the Scituate Lifeboat Station, and Scituate Lighthouse. In addition,
there are approximately 60 historic structures vulnerable to sea level rise in 2088, with
approximately 1-2 feet of flood depth (Figure 30).
95 http://scituate.wickedlocal.com/x1551268428/Scituate-Historical-Commission-History-is-in-the-home
96 https://www.sciencedaily.com/releases/2010/08/100823113422.htm 97 https://historicengland.org.uk/research/current/threats/heritage-climate-change-environment/what-effects/

66
Figure 30 Historic structures within a 1% Annual Chance Flood and SLR.

67

68
III. CLIMATE ACTION PLAN
Scituate already experiences intense coastal flooding and storm surge and will face new risks in the
coming decades with changing oceans,
waterfronts, rivers, and weather events whose
related impacts may occur more frequently and
more intensely than they have in the past. Climate
change resilience will require an increase in
response to these new conditions. As climate
change extends beyond municipal boundaries,
municipal leaders, residents, adjoining towns and
the South Shore engagement and collaboration in
visioning and participating in climate action
response will be critical for effective climate
mitigation and adaptation.
Mitigation, Adaptation, and Emergency
Preparedness are Inter-connected.
Responses to climate change include emergency preparedness, mitigation and adaptation strategies
(Figure 31).98 Of the three, emergency preparedness planning is generally in place already.
However, emergency preparedness is a process that requires continuous updating and the strategies
used are likely to change in response to climate change.
Figure 31 Interconnections of mitigation, adaptation, and emergency preparedness.
These three elements are interconnected, as action in one dimension can help address the causes or
outcomes that another is also trying to tackle. For example, mitigation activities address the causes of
climate change (e.g., GHG emissions), and in reducing the magnitude of impacts, efforts may, in turn,
affect what adaptation actions are needed to address and/or the extent that emergency
preparedness and planning activities are necessary. An instance of this would be clean energy
98 Emergency preparedness typically encompasses four sets of actions: preparation, response, recovery, and mitigation.
Adaptation
Mitigation
Emergency Preparedness

69
investments that reduce GHG emissions through solar or wind operations. If done under certain
circumstances, the solar array could be connected to a microgrid99 that would enable a set of homes
or neighborhoods to maintain electricity during outages and reduce the demand on emergency
responders and utility companies. Each dimension – adaptation, mitigation, and emergency
preparedness - provide valuable perspectives and tools that are needed to holistically address the
causes and potential impacts.
The most desirable response strategies embrace an approach that considers climate resilience a
mechanism that creates more livable and vibrant communities regardless of shifting paradigms or
patterns of climate change, a “no regrets” approach. They include action items that should be
considered regardless as they intend to generate economic, environmental, and social benefits. They
include evidence-based and best practices for environmental protection, public health and safety,
sustainable economic growth, and a reduction in disparities. An example is the use of green
infrastructure and low impact development (LID) techniques that reduce stormwater runoff, provide
additional green space, reduce cooling cost due to less impervious ground cover, and recharge water
in the local ecosystem. This change would provide benefits even if climate change were not occurring
as it would expose more residents to green space, reduce demands on municipal stormwater
drainage systems, and support the needs of local ecosystems.
Figure 32 Adaptive Management Framework.
Source: Parks and Wildlife Service, Tasmania
Adaptive Management Framework
The strategies in Figure 32 embrace the concept of Adaptive Management. This concept is used to
address issues that involve uncertainty. It relies on iterative processes that use continuous monitoring
and assessment to understand what actions are working, which are not, and how these actions could
potentially come into conflict with one another. It operates best when new information (e.g.,
99 Department of Energy, “How Microgrids Work”, https://energy.gov/articles/how-microgrids-work, accessed
April 5, 2017.

70
projections, estimates, etc.) can be integrated quickly so that new approaches can be better
evaluated and modified to maximize impact under changing conditions.
An adaptive management operating approach is likely to face many challenges in a municipal
framework. The concept requires decision-making to be agile and capable of working quickly in the
face of evolving information, potentially a challenge for town governments and residents. Therefore,
a general proposal is needed to identify how adaptive management concepts can be tested and
used to make enhancements in municipal decision-making to best address climate response action.
Strengths and Guiding Principles
Scituate’s Natural Hazard Mitigation Plan of August 2016 presents a summary of Scituate’s planning
efforts concerning coastal remedies and issues from several recent planning efforts. The climate action
items presented in this report are intended to supplement, prioritize, and expand upon action items
delineated in previous planning documents
The Town’s Climate Vulnerability Steering Committee created the prioritization of suggested climate
actions in a workshop on December 20, 2017. This prioritization intends to achieve “early-win”
resilient efforts that will have a profound impact on stakeholder engagement, public awareness, and
protection of critical facilities and areas. Responses and prioritization from the meeting are illustrated
in Appendix B. In addition, the Steering Committee agreed upon four guiding principles toward
Building a More Resilient Scituate in its climate action approach. These are to:
1. Balance growth, preservation, and resiliency to enhance our vibrant community and ensure its
livability into the next century and beyond
2. Invest in infrastructure that promotes multiple benefits that address climate risks as well as
beautification, economic growth, public programming, and public health.
3. Leverage the resources of multiple disciplines and sectors within municipal departments and
across sectors to generate layers of resilience.
4. Approach Building a More Resilient Scituate as an ongoing effort to ensure Scituate’s ongoing
success leveraging capital improvement cycles and outside funding cycles.
Scituate has significant strengths today that will minimize the impact of climate change and inform a
shared agenda for climate action by the Town and the South Shore Region. Maintaining these
strengths as guideposts for action will be essential in an uncertain future. They will serve as reminders
of existing adaptive capacities and provide direction regarding new capabilities that are needed to
respond to a changing climate. Scituate’s strengths are:
Scituate is proactive. The Town’s propensity to act is demonstrated by its participation in multiple
planning efforts concerning sea level rise and climate change, hazard mitigation planning, and master
planning, and emergency management. Scituate’s foresight will create a foundation for incremental
resilience improvement programs and projects to ensure it remains a vibrant community into the next
century and beyond.

71
o Plans and procures grants procurement for shoreline protection;
o Launched the Commonwealth’s first Volunteer Organization Active in Disaster, SANDS,
providing -emergency preparedness and community cohesion before, during, and
after natural disasters.
o Coordinates with CZM and Mass Bays on healthy marine environment;
o Leads a robust outreach and education program on flooding and emergency
preparedness;
o Demonstrates strong leadership and community support for climate resilience;
o Provides an ongoing educational campaign on preventing Lyme Disease
o Engages in programs and services committed to its seniors’ health and safety with a
dedicated Licensed Social Worker and Council on Aging programs on emergency
preparedness and community cohesion.
Scituate is committed to resilience. This is evident in town’s extensive planning and investment in
protecting its shorelines and natural resources from coastal flooding, inundation, and coastal erosion.
The Towns initiatives in this area include:
o Ongoing evaluation of its seawalls, dikes, jetties and natural barriers to prioritize
maintenance and repairs;
o Completion of the North Scituate Beach Nourishment Project;
o Reconstruction of the Oceanside Drive Seawall;
o Completion of the Edward Foster Road Seawall Reconstruction;
o Completion of the South River Dredge and Dune Nourishment Project;
o Collaboration with the Towns of Hull and Cohasset on the feasibility of a regional
sewer system;
o Since 1997, provisions of funding assistance to residents to elevate their homes or
utilities for nearly 70 homes and utilities;
o Acquisition vacant flood-prone lands;
o Participation in the Community Rating System and Public Information Program.
o Completion of a coastal resiliency assessment to prioritize natural and hard shoreline
protection infrastructure;
o Implemented a stormwater bylaw;
o Sewer System upgrades on Cedar Point to address coastal flooding and mitigate
potential contamination;
o Retention of a Coastal Resource Officer, Department of Public Works, Emergency
Management and Coastal Advisory Commission to address the significant needs and
resources of Scituate’s prominent coast.
Climate Actions
The Scituate Climate Vulnerability Steering Committee determined the top priorities for Building a
Resilient Scituate as well as rating other important climate action items for future efforts. The top
priorities were those receiving the most significant concern and sense of urgency for Scituate’s future
livability and were recommended to be implemented as soon as possible. The Town’s top priorities
are as follows:

72
1. Address the vulnerability of coastal business districts. Lead a climate vulnerability and
resilience workshop with stakeholders, property owners, residents, businesses, and municipal
staff and officials for participatory visioning the future of Front Street with sea level rise and
coastal flooding. The goal of the workshop is to educate stakeholders to the current and
future risks and ensure stakeholders are active participants in the waterfront’s current and
future resilience. Front Street is a priority for this action.
2. Address the vulnerability of Scituate’s municipal infrastructure. A priority could be the
Waste Water Treatment Plant, currently in a 1% Annual Chance Flood. Protection measures
discussed include earthen berms and other natural shoreline protection as an incremental
resilience measure while investigating more significant structural investments that addresses
future risk.
3. Initiate a public outreach and marketing campaign with a sense of urgency on climate
change and resilience in Scituate. The Town has demonstrated results in such an effort, when,
during the 2016 drought where resident’s behavior shifted sufficiently to mitigate drinking
water scarcity during that time.
The following tables of climate change mitigation actions indicate the top items that the Steering
Committee would like to pursue in some capacity within the next seven years. With the intent to
maximize multiple benefits in any climate action investment, corresponding mitigation and adaptation
benefits are checked by each action item. Scituate’s Climate Resilience Task Force (Overall Best
Practices Action Item) should designate a lead entity to initiate these actions. The Steering Committee
does want to recognize that working across sectors is critically important for success and that staff
capacity can present challenges, but the importance of this task must override the obstacles. Finally,
potential public funding and technical assistance programs related to implementing these action items
are categorized and listed in Appendix C.
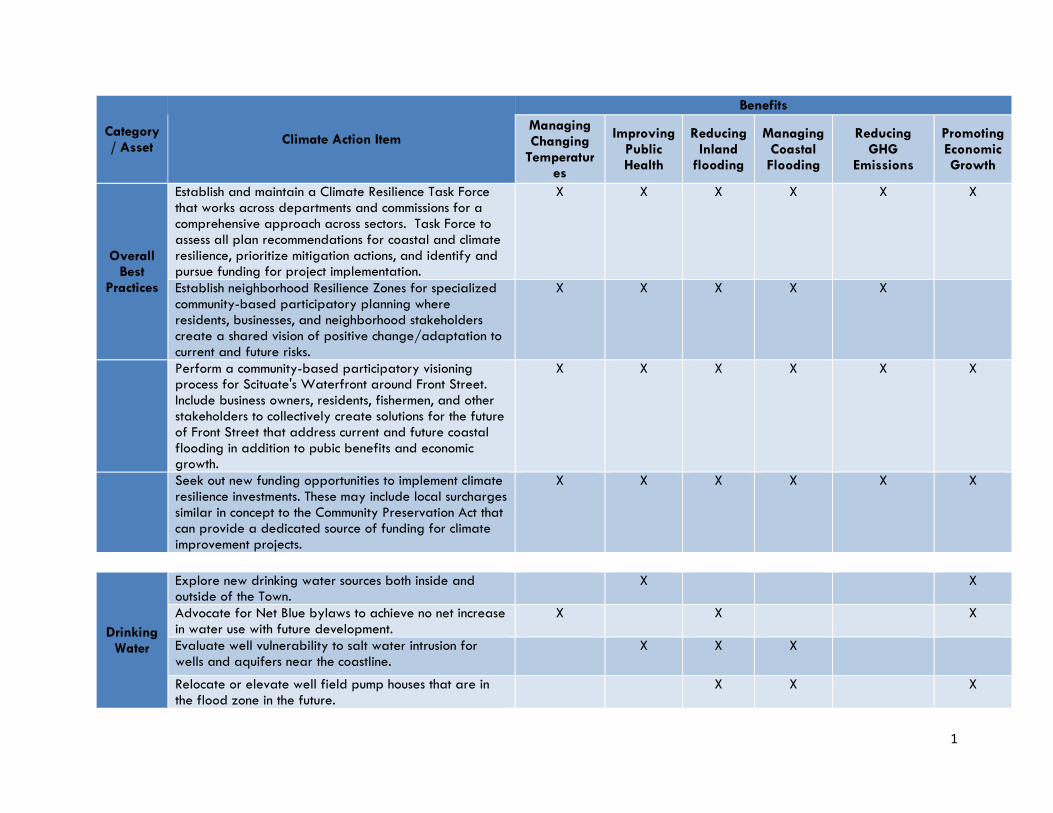
1
Category/ Asset
Climate Action Item
Benefits
Managing Changing
Temperatures
Improving Public Health
Reducing Inland
flooding
Managing Coastal Flooding
Reducing GHG
Emissions
Promoting Economic Growth
Overall Best
Practices
Establish and maintain a Climate Resilience Task Force that works across departments and commissions for a comprehensive approach across sectors. Task Force to assess all plan recommendations for coastal and climate resilience, prioritize mitigation actions, and identify and pursue funding for project implementation.
X X X X X X
Establish neighborhood Resilience Zones for specialized community-based participatory planning where residents, businesses, and neighborhood stakeholders create a shared vision of positive change/adaptation to current and future risks.
X X X X X
Perform a community-based participatory visioning process for Scituate's Waterfront around Front Street. Include business owners, residents, fishermen, and other stakeholders to collectively create solutions for the future of Front Street that address current and future coastal flooding in addition to pubic benefits and economic growth.
X X X X X X
Seek out new funding opportunities to implement climate resilience investments. These may include local surcharges similar in concept to the Community Preservation Act that can provide a dedicated source of funding for climate improvement projects.
X X X X X X
Drinking Water
Explore new drinking water sources both inside and outside of the Town.
X X
Advocate for Net Blue bylaws to achieve no net increase in water use with future development.
X X X
Evaluate well vulnerability to salt water intrusion for wells and aquifers near the coastline.
X X X
Relocate or elevate well field pump houses that are in the flood zone in the future.
X X X

2
Category/ Asset
Climate Action Item Managing Changing
Temperatures
Improving Public Health
Reducing Inland
flooding
Managing Coastal Flooding
Reducing GHG
Emissions
Promoting Economic Growth
Built Environment
Evaluate all zoning, bylaws, and codes for barriers to improvements for climate resilience measures in the built, natural, and landscaped environment (i.e., minimize impervious surface using pervious pavers, minimize parking requirements, and shared driveways, use Low Impact Development, Green Infrastructure, etc.)
X X X X X X
Consider establishing a Coastal Business Improvement District. This could as a consistent source of revenue that could fund climate resilience improvement projects in addition to creating public programming and encouraging business patronage along the waterfront.
X X X X X
Evaluate culverts, bridges, river and stream crossings for effectiveness in water flow during floods. Use MA Stream Crossing Standards.
X X
For additional interim protection prior to raising critical infrastructure and residences, consider building soft shoreline protection features such as earthen berms with living shorelines to protect buildings located in low energy flood zones.
Transport-ation
Create a municipal working group to inform design standards on raising roads in response to current and future coastal flooding. Consider also the implications for commercial, industrial, and residential building egress. See Recommendations, Dutch, and Climate Ready Boston
X X X X X
Institute a Complete Streets Ordinance. Apply Complete Streets where appropriate and space allows such as on primary and secondary roads. Work with the State to advocate for Complete Streets on route 3A (commuters to Train Station from Marshfield) to promote walking and biking to encourage less vehicle miles travelled.
X X X X X

3
Benefits
Category/ Asset
Climate Action Item Managing Changing
Temperatures
Improving Public Health
Reducing Inland
flooding
Managing Coastal Flooding
Reducing GHG
Emissions
Promoting Economic Growth
Natural Resources
Strengthen local wetlands bylaw restrictions in buffer zones to restore original 100ft. no-build buffer of resource areas under the Wetland Protection Act. Consider stormwater management as part of wetlands protection to percolate water into the ground and out of rivers/oceans.
X X X
Revise Stormwater bylaw so all new and redevelopment captures at least first 1" of rain onsite, using Low Impact Development and other strategies, or evaluate the design standards that consider sea level rise and/or the 1% Annual Chance Flood.
X X X
Salt Marsh Restoration (i) Contract a formal evaluation on salt marsh health and long-term monitoring and maintenance such as citizen science groups; (ii) Initiate short-term marsh restoration techniques such as invasive removals; (iii) Evaluate wetlands protection act and land acquisition opportunities to plan for, protect, and/or acquire land for horizontal marsh migration. (iv) Perform recommendations for salt marsh restoration based upon formal evaluation; and (iv) collaborate with the Town of Marshfield on salt marsh evaluation and restoration.
X X X X
Continue beach and dune nourishment. X X
Install sacrificial dunes, sand fences, seawalls and other coastal infrastructure investments.

4
Category/ Asset
Climate Action Item Managing Changing
Temperatures
Improving Public Health
Reducing Inland
flooding
Managing Coastal Flooding
Reducing GHG
Emissions
Promoting Economic Growth
Waste Water/ Sewer
Resilience
Evaluate vulnerability of critical systems in water and sewer pump stations to a 1% and a 0.2% Annual Chance Flood and prioritize infrastructure improvements that enhance resilience.
X X X
As an interim step to elevating critical infrastructure, install structures to protect critical systems from floods such as self-rising flood walls around pump stations or berms with living shorelines in low-energy coastal areas.
X X
Prepare a list of key utility facilities that require critical power restoration and inform the power company of locations of the facilities to expedite electricity restoration during an outage.
X X
People
Advocate for new and redeveloped affordable housing and/or public housing includes building resilience to ensure residents can "shelter in place" during an emergency and have healthy, safe places to live through a changing climate.
X X X X
Create a Heat Emergency Action Plan. Prioritize creating cooling centers for those most vulnerable to heat, systematic communications strategies, and back-up energy plans. Stress the importance of tree canopy for cooling buildings.
X
Energy
Maintain Green Communities designation. X X X X
Support green building standards and energy use reduction for retrofits and new development. Incentivize when possible.
X X X
Explore implementing Community Shared Solar (CSS) to institute Town-wide renewable energy efforts. CSS can provide solar energy benefits to resident, non-profits, and business that are unable to install solar on their properties while reducing Town-wide carbon emissions.
X X X X X
Implement renewable back-up energy strategies for municipal buildings and critical infrastructure such as wells and waste water pump stations.
X X X

A
IV. APPENDIX

1
Appendix A
Critical Infrastructure susceptible to coastal flooding and sea level rise (SLR).
Critical Infrastructure
ID Name Address Type
FEMA VE
FEMA 1%
SLR 2038 Cat 1
SLR 2088
66 Scituate Animal Shelter
780 Chief Justice Cushing Highway
Animal Shelter
67 Driftway Animal Hospital 53 Driftway
Animal Shelter
57 Satuate Boat Club 66 Jericho Rd Boat Club x (x)
61 Cole Park Way Launching Ramp Cole Parkway Rd Boat Launch
x x x
62 Driftway Park Launching Ramp Driftway Boat Launch
x x
93 Boat Launch Humarock Boat Launch x x
58 State Launch Ramp Jericho Road Boat Ramp x x
44 North River Bridge Rt 3A Bridge x x
68 Francis R. Powers Bridge Humarock/Marshfield Bridge
x
69 Sea St. Bridge Humarock/Marshfield Bridge x x
43 Cell Towers Cell Tower
70 Cell Towers
604 Chief Justice Cushing Hwy. Cell Tower
71 Cell Towers 280 Driftway Cell Tower
72 Cell Towers
1006 Chief Justice Cushing Highway Cell Tower
50 Cudward Cemetery Cudworth Rd Cemetery
51 Fairview Cemetery Fairview Ave Cemetery
52 Union Cemetery Stockbridge Road Cemetery

2
Critical Infrastructure
ID Name Address Type
FEMA VE
FEMA 1%
SLR 2038 Cat 1
SLR 2088
53 Old St Mary's Cemetery Meetinghouse Lane Cemetery
73 Mount Hope Cemetery Clapp Rd. Cemetery
74 Groveland Cemetery Mann Lot Rd. Cemetery
64 St Mary's Hall Edward Foster Road Church x (x)
65 St Mary's Church Kent Road Church x
75 Harbor United Methodist Church 55 First Parish Rd. Church
76 First Parish Unitarian Church 330 First Parish Rd. Church
77 First Baptist Church 660 Country Way Church
78 First Trinitarian Congregational Church 381 Country Way Church
79 Christ Lutheran Church
460 Chief Justice Cushing Highway Church
80 Saint Francis Cabrini Church 78 Mann Hill Rd. Church
81 Union Chapel
315 Old Oaken Bucket Rd. Church
38 Coast Guard 102 Cole Park Way Coast Guard x x x
123 MBTA Commuter rail tracks Through entire town
Commuter Rail Tracks
54 Herring Brook Reservoir Dam Dam
x
55 Hunters Pond Dam Dam x x x
35 DPW Garage Captain Pierce Road DPW
82
Scituate Reservoir 400 Chief Justice Cushing Highway
Drinking Water Reservoir

3
Critical Infrastructure
ID Name Address Type
FEMA VE
FEMA 1%
SLR 2038 Cat 1
SLR 2088
3
Lincoln Park Elder Housing 791 Country Way Elder Housing
4 Community Residence 644 Country Way Elder Housing
10 Central Park Housing Central Park Dr. Elder Housing x
12 Wheelar Park 2 Wheeler Park Dr. Elder Housing
15 Wheeler Park I Wheelar Park Dr. Elder Housing
20 Community Residence 412 First Parish Rd. Elder Housing
23 Cardigan Nursing Home 59 Country Way Elder Housing
32 Life Care Center 309 Driftway Elder Housing
17 Environmental Police
175 Edward Foster Rd.
Environmental Police
7 Fire Dept. 143 First Parish Rd.
Fire Department
8 Fire Dept. 4 River St. Humarock
Fire Department
x
21 Fire Dept.
596 Chief Justice Crushing Hgwy.
Fire Department
39 Anderson Fuel 331 Gannet Road Fuel Depot
41 Fitts Mill Bearce Lane Fuel Depot
46 Village Market 71 Front Street Grocery Store x
37 Harbor Master Cole Park Way
Harbor Master
x x x
47 Joseph's Hardware Store Front Street
Hardware Store
x x
28 Heliport Heliport
83 Lawson Tower 330 First Parish Rd. Historic Site
84 Scituate Lighthouse 100 Lighthouse Rd. Historic Site x (x)

4
Critical Infrastructure
ID Name Address Type
FEMA VE
FEMA 1%
SLR 2038 Cat 1
SLR 2088
85 Minot Lighthouse
Minot's Ledge, Massachusetts Bay Historic Site
86 GAR Hall 353 Country Way Historic Site
87 Maritime Mossing Museum 301 Driftway Historic Site
88 Little Red School House 43 Cudworth Rd. Historic Site
89 Stockbridge Mill 6 Country Way Historic Site x
90 Mann Farmhouse 107 Greenfield Lane Historic Site
91 Old Oaken Bucket Homestead
47 Old Oaken Bucket Rd. Historic Site
92 Cudworth House & Barn 317 First Parish Rd. Historic Site
36 Scituate Public Library 85 Branch Street Library
59 Scituate Harbor Marina Jericho Rd Marina
x x
60 Satuit Water Front Club 20 Jericho Road Marina
x x
63 North River Marina
12 Chief Justice Cushing Hwy Marina
x
122 Village at South River Marina
33 Central Ave., Humarock Marina
x
24 Driftway Medical Facility Center 7 New Driftway
Medical Facility
x
95 Driftway Medical Facility Center 56 Driftway
Medical Facility
96 Jacob Hatch Building 2 Country Way
Medical Facility
13 Scituate Town Hall
600 Chief Justice Cushing Hwy. Municipal
97 Pier 44 (Town-owned) 44 Jericho Rd. Municipal x x

5
Critical Infrastructure
ID Name Address Type
FEMA VE
FEMA 1%
SLR 2038 Cat 1
SLR 2088
98 Ellis House Country Way Municipal
119 Water Dept. Business Office
4 Old Oaken Bucket Rd. Municipal
94 Scituate Marine Park
119 Edward Foster Rd.
Municipal & Marina
x
34 C M Senior Center 25 Brook Street Nursing Home
48 CVS 92 Front Street Pharmacy x x x
49 Scituate Pharmacy 372 Gannet Street Pharmacy
45 Town Pier Front Street Pier x (x)
19 Police Dept.
604 Chief Justice Crushing Hgwy.
Police Department
1 Us Post Office 76 Glades Rd. Post Office x (x) (x)
9 Us Post Office 365 Gannett Rd. Post Office
22 Us Post Office 108 First Parish Rd. Post Office
25 Us Post Office 23 Ford Place Post Office
121 Humarock Post Office
10 Central Ave., Humarock Post Office
x
29 North Scituate Sub Station H.t. Bailey Rd.
Power Substation
30 Scituate Sub Station First Parish Rd.
Power Substation
99
Well #10 87A Cornet Stetson Rd.
Public Drinking Water Well
x x
100
Well #11 87 Cornet Stetson Rd.
Public Drinking Water Well
x (x)
101
Well #19 381 Chief Justice Cushing Highway
Public Drinking Water Well

6
Critical Infrastructure
ID Name Address Type
FEMA VE
FEMA 1%
SLR 2038 Cat 1
SLR 2088
102
Well #17A 98 Tack Factory Pond Dr.
Public Drinking Water Well
103
Well #22 6 Old Forge Rd.
Public Drinking Water Well
x
118
Well 18B 250 Driftway
Public Drinking Water Well
x (x)
2 Hatherly School 72 Ann Vinal Rd. School
5 Wampatuck Elementary School 266 Tilden Rd. School
6 Cushing Elementary School 1 Aberdeen Dr. School
16 Gates Jr. High School 327 First Parish Rd. School
18 Scituate High School
606 Chief Justice Cushing Hwy. School
27 Montessori Community 46 Watch Hill Drive School
33 Jenkins Elementary School 61 First Parrish School
x
124 Seawalls
Minot to Third Cliff, Humarock Seawall
x x x
104 Chain Pond Pump Station 310 Hatherly Rd.
Sewer Pump Station
x (x)
105 Sand Hills Pump
Station 0 Scituate Ave.
Sewer Pump
Station x (x) x
106 First Parish Pump Station 106 First Parish Rd.
Sewer Pump Station
107 Country Way Pump Station 220 Country Way
Sewer Pump Station

7
Critical Infrastructure
ID Name Address Type
FEMA VE
FEMA 1%
SLR 2038 Cat 1
SLR 2088
108 Herring Brook Pump Station 15 New Driftway
Sewer Pump Station
x x
109 Collier Road Pump Station 31 Collier Rd.
Sewer Pump Station
x
110 Peggotty Beach Pump Station
22 Peggotty Beach Rd.
Sewer Pump Station
x x x
111 First Cliff Pump Station
137 Edward Foster Rd.
Sewer Pump Station
x x x
112
Transfer Station 280 Driftway
Solid Waste Transfer Station
14 Meeting House Estates
12 Meeting House Lane
Special Needs
113 Community Residence 129 Vernon Rd.
Special Needs
40 Stand Pipe Creelman Drive Stand Pipe
114 Pincin Hill Standpipe 164 Grove St. Stand Pipe
11 Bell Atlantic First Parish Rd.
Telephone Exchange
(x)
42 MBTA Greenbush Layover Station Off Driftway
Transportation Facility
117 MBTA North Scituate Station Off Country Way
Transportation Facility
26 North River Waste Water Pollution Control Plant 161 Driftway
Waste Water Treatment
x
31 Scituate Water Treatment Plant
Chief Justice Cushing Hwy.
Waste Water Treatment
115 Walnut Hill Booster Pump Station 27 Woodworth Lane
Water Booster Pump Station

8
Critical Infrastructure
ID Name Address Type
FEMA VE
FEMA 1%
SLR 2038 Cat 1
SLR 2088
120 Mann Lot Booster Station 136 Mann Lot Rd.
Water Booster Pump Station
56 Scituate Harbor Yacht Club 84 Jericho Road
Water Facility
x
116 Wind Turbine 167 Driftway Wind Turbine x x

1
Appendix B
Climate Steering Committee Meeting #2 Climate Action Plan prioritization notes.

2

3

4

5

6

1
Appendix C
Potential Funding Sources to Implement Climate Action Plan
Overall Best Practices Climate Action.
EEA Planning Grant. The Executive Office of Energy and Environmental Affairs provides funding
to municipalities and Regional Planning Agencies to pursue Massachusetts Sustainable
Development Principles that preserve natural resources, ensure sufficient and diverse housing, and
prepare for climate change. Eligible requests include zoning for sustainable housing production,
actions implementing the results of a climate vulnerability assessment or MVP program, or
mitigation of climate change through zoning or other regulations that reduce energy use and
greenhouse gas emissions. In 2017, EEA awarded $1,296,219 to 37 applicants.
https://www.mass.gov/service-details/planning-assistance-grants
Municipal Vulnerability Preparedness Program. The Executive Office of Energy and Environmental
Affairs provides financial assistance to municipalities to pay for technical assistance to complete
assessments and planning using the Community Resilience Building workshop guide (CRB).
Municipalities who complete this process and develop a final report will be designated as an
MVP Community, which may lead to increased standing in future funding opportunities and signify
the commitment of this municipality to building resiliency and preparing for climate change.
https://www.mass.gov/municipal-vulnerability-preparedness-program

2
Drinking Water Climate Action
The Clean Water State Revolving Fund program is a federal-state partnership that provides
communities a permanent, independent source of low-cost financing for a variety of water quality
infrastructure projects: wastewater treatment, stormwater management, nonpoint source pollution
control, and watershed and estuary management, including retrofit projects and certain types of
“green” projects. Most loans are for a 20-year period and some are zero interest. Loans in
Massachusetts are implemented by MassDEP.
http://www.mass.gov/eea/agencies/massdep/water/grants/clean-water-state-revolving-
fund.html
Massachusetts DEP Drinking Water Supply Protection Grant (DWSP). The DWSP grant program provides financial assistance to public water systems and municipal water departments for the purchase of land or interests in land for the following purposes: 1) protection of existing DEP-approved public drinking water supplies; 2) protection of planned future public drinking water supplies; or 3) groundwater recharge. The program is a reimbursement grant with a maximum award of $300,000 and 50% project cost reimbursement rate.
The National Drought Resilience Partnership (NDRP, or the Partnership) is a partnership made up
of Federal departments and agencies that have roles or responsibilities in planning for and/or
responding to drought. The purpose of the Partnership is to harness and coordinate distinct efforts
by individual agencies already underway to assist in building resilience to drought on the ground.
Two distinct roles are envisioned: one, as a policy coordinating body, and two, as an entity to
align Federal agencies around their individual roles in drought planning and risk mitigation. This
will help the Federal government to deliver expertise and resources to facilitate community
preparedness and strengthen the Nation’s resilience to drought.
https://www.drought.gov/drought/resources/national-drought-resilience-partnership
Mass DEP Water Utility Resilience Program. This new program provides technical assistance,
partnership opportunities, adaptation planning, asset management, vulnerability assessments and
training to enhance the resilience of water and waste water utilities from hazards weather events
related to climate change. https://www.mass.gov/files/documents/2016/08/mo/circuit-rider-
for-resiliency.pdf

3
Built Environment Climate Action
EEA Planning Grant. The Executive Office of Energy and Environmental Affairs provides funding
to municipalities and Regional Planning Agencies to pursue Massachusetts Sustainable
Development Principles that preserve natural resources, ensure sufficient and diverse housing, and
prepare for climate change. Eligible requests include zoning for sustainable housing production,
actions implementing the results of a climate vulnerability assessment or MVP program, or
mitigation of climate change through zoning or other regulations that reduce energy use and
greenhouse gas emissions. In 2017, EEA awarded $1,296,219 to 37 applicants.
https://www.mass.gov/service-details/planning-assistance-grants
FEMA Hazard Mitigation Assistance. FEMA provides three different grant programs for mitigation
planning and projects that are designed to minimize loss and protect life and infrastructure from
natural hazards such as flooding and extreme heat. Grant programs include Hazard Mitigation
Grant Program (long-term planning and projects after federal declared emergency), Pre-Disaster
Mitigation Program (hazard mitigation planning grant) and Flood Mitigation Assistance (planning
and projects to reduce or eliminate risk of flood damage insured by NFIP).
HUD Loan Guarantee Program. The US Department of Housing and Urban Development’s Section
108 Loan Guarantee Program allows future Community Development Block Grant allocations to
be used to guarantee loans for neighborhood revitalization projects, including construction and
installation of public facilities and infrastructure. Section 108-guaranteed projects can incorporate
green infrastructure into their design and
construction.https://portal.hud.gov/hudportal/HUD?src=/states/massachusetts
HUD Sustainable Communities Regional Planning Grants.This HUD program supports metropolitan
and multijurisdictional planning efforts to integrate housing, land use, economic and workforce
development, transportation and infrastructure investments to empower communities and help
them meet challenges of economic competitiveness and revitalization, social equity, inclusion and
access to opportunity, energy use and climate change, and public health and environmental
impact. https://portal.hud.gov/hudportal/documents/huddoc?id=greeninfrastructsci.pdf
Massachusetts Community Preservation Act. The Community Preservation Act (CPA) has been
adopted by 172 cities and towns in Massachusetts representing 60 percent of the state’s
residents. CPA funds bring an annual match from the state CPA Trust Fund, and leverages
investments from state, federal and private sources. Each year, CPA provides funding for
affordable housing; historic resources, and outdoor recreation/open space, and is flexible to help
fund all types of creative improvements. Funds for open space and recreation, for example, can
be used to acquire and restore land and water resources and to acquire and improve parks,
playgrounds, ball fields, parks, greenways, farms and gardens that use nature-based solutions to
help cities and towns become more resilient to climate change impacts.
http://communitypreservation.org/projectsdatabaseaccess

4
Massachusetts Office of Coastal Zone Management (CZM). CZM administers the Coastal
Resilience Grant Program to provide financial and technical support to municipalities to reduce
risks associated with coastal storms, flooding, erosion, and sea level rise. The grant is managed
through CZM’s StormSmart Coasts program. Eligible projects include Vulnerability and Risk
Assessment; Public Education and Communication; Local Bylaws, Adaptation Plans, and other
Management Measures; Redesigns and Retrofits; Natural Storm-Damage Protection Techniques.
Recipients receive up to $500k and are required to provide at least 25% of the total project
cost. The program is open to the 78 municipalities located within the MA coastal zone. Certified
501(c)(3) nonprofit organizations with vulnerable coastal property that is open and accessible to
the public are also eligible for funding. http://www.mass.gov/eea/agencies/czm/program-
areas/stormsmart-coasts/grants/
Municipal Vulnerability Preparedness Program. The Executive Office of Energy and Environmental
Affairs provides financial assistance to municipalities to pay for technical assistance to complete
assessments and planning using the Community Resilience Building workshop guide (CRB).
Municipalities who complete this process and develop a final report will be designated as an
MVP Community, which may lead to increased standing in future funding opportunities and signify
the commitment of this municipality to building resiliency and preparing for climate change.

5
Transportation Climate Action
Congestion Mitigation and Air Quality Program. The Congestion Mitigation and Air Quality
program allocates federal funding for infrastructure projects that reduce congestion and improve
air quality. Bicycle transportation and pedestrian walkways are eligible, and can be designed to
include green infrastructure features, such as permeable surfaces for trails, and bioswales and
bioretention for areas adjacent to trail surfaces.
http://www.massdot.state.ma.us/planning/Main/PlanningProcess/FundingConsiderations.aspx
Transportation Investment Generating Economic Recovery. Transportation Investment Generating
Economic Recovery (TIGER) Discretionary Grant program provides funding for investments in road,
rail, transit and port projects, and can include green stormwater management components. TIGER
grants funding can be distributed to any public entity, including local governments.
https://www.transportation.gov/tiger
Transportation Alternatives Program. The Transportation Alternatives Program provides funding
for transportation “alternatives” that improve transportation networks by efficiently and cost-
effectively mitigating street and alley flooding. Projects can include green infrastructure
components of trails and sidewalks for non-motorized transportation, such as permeable
pavements.
http://www.massdot.state.ma.us/planning/Main/PlanningProcess/FundingConsiderations.aspx

6
Waste Water/Sewer Climate Action
Mass DEP Water Utility Resilience Program. This new program provides technical assistance,
partnership opportunities, adaptation planning, asset management, vulnerability assessments and
training to enhance the resilience of water and waste water utilities from hazards weather events
related to climate change. https://www.mass.gov/files/documents/2016/08/mo/circuit-rider-
for-resiliency.pdf
Municipal Vulnerability Preparedness Program. The Executive Office of Energy and Environmental
Affairs provides financial assistance to municipalities to pay for technical assistance to complete
assessments and planning using the Community Resilience Building workshop guide (CRB).
Municipalities who complete this process and develop a final report will be designated as an
MVP Community, which may lead to increased standing in future funding opportunities and signify
the commitment of this municipality to building resiliency and preparing for climate change.
The Clean Water State Revolving Fund program is a federal-state partnership that provides
communities a permanent, independent source of low-cost financing for a variety of water quality
infrastructure projects: wastewater treatment, stormwater management, nonpoint source pollution
control, and watershed and estuary management, including retrofit projects and certain types of
“green” projects. Most loans are for a 20-year period and some are zero interest. Loans in
Massachusetts are implemented by MassDEP.
http://www.mass.gov/eea/agencies/massdep/water/grants/clean-water-state-revolving-
fund.html
EPA Water Infrastructure and Resiliency Finance Center. This program administered by the EPA
provides technical assistance, toolkits, and resources to help decision makers building wastewater
infrastructure projects that protect human and environmental health.
https://ofmpub.epa.gov/apex/wfc/f?p=165:1::::::

7
People Climate Action
EPA Smart Growth and Technical Assistance Program. The EPA administers a variety of technical
assistance and planning grant programs to help communities improve the quality of the built
environment, protect public health, and protect the environment.
https://www.epa.gov/smartgrowth/smart-growth-technical-assistance-programs
Municipal Vulnerability Preparedness (MVP) Program. The Executive Office of Energy and
Environmental Affairs provides financial assistance to municipalities to pay for technical assistance
to complete assessments and planning using the Community Resilience Building workshop guide
(CRB). Municipalities who complete this process and develop a final report will be designated as
an MVP Community, which may lead to increased standing in future funding opportunities and
signify the commitment of this municipality to building resiliency and preparing for climate change.
EEA Planning Grant. The Executive Office of Energy and Environmental Affairs provides funding
to municipalities and Regional Planning Agencies to pursue Massachusetts Sustainable
Development Principles that preserve natural resources, ensure sufficient and diverse housing, and
prepare for climate change. Eligible requests include zoning for sustainable housing production,
actions implementing the results of a climate vulnerability assessment or MVP program, or
mitigation of climate change through zoning or other regulations that reduce energy use and
greenhouse gas emissions. In 2017, EEA awarded $1,296,219 to 37 applicants.
George Climate Center Federal Funding Compendium for Urban Heat Adaptation. This
compendium provides a comprehensive analysis on diverse federal programs that can be applied
to mitigate extreme heat.
http://www.georgetownclimate.org/files/report/Federal%20Funding%20Compendium%20for%20Urban
%20Heat%20Adaptation.pdf

8
Energy Climate Action
Weatherization and Intergovernmental Program-The US Department of Energy’s Weatherization
and Intergovernmental Program provides grants, technical assistance, and information tools to
states, local governments and community action agencies for their energy programs. The funding
can be used to encourage installation of green infrastructure, such as green roofs, as part of the
weatherization process. https://energy.gov/eere/wipo/weatherization-and-intergovernmental-
programs-office
Massachusetts Clean Energy Center’s (MassCEC) Community Microgrids Program. This program helps municipalities harness the innovative microgrid technology that lowers customer energy costs, reduces greenhouse gas (GHG) emissions, and provides increased energy resilience. In February, In February 2018, MassCEC awarded over $1 million to 14 different projects across Massachusetts. http://www.masscec.com/community-microgrids-program
MA Clean Energy Center (CEC) Government and Non-Profit Clean Energy Programs. MassCEC manages the Massachusetts Renewable Energy Trust Fund for the state and has diverse programs that promote clean energy, energy efficiency, and wastewater treatment plant innovation. Grant programs include solar energy, clean heating and cooling, hydro projects, organics to energy projects and many more. http://www.masscec.com/get-clean-energy/government-and-non-profit

9
Natural Resources Climate Action
Coastal
The National Coastal Wetlands Conservation Grant Program. This program annually provides
grants of up to $1 million to coastal and Great Lakes states, as well as U.S. territories to protect,
restore and enhance coastal wetland ecosystems and associated uplands. The grants are funded
through the Sport Fish Restoration and Boating Trust Fund, which is supported by excise taxes on
fishing equipment and motorboat fuel. Typically states, local governments, private landowners,
and conservation groups will provide additional funds for projects. All states with a coastline are
eligible. https://www.fws.gov/coastal/CoastalGrants/
National Oceanic and Atmospheric Administration (NOAA). The NOAA Coastal Resilience
Program is a federal funding offers two categories of funding activities: 1) Strengthening Coastal
Communities and 2) Habitat Restoration. The Strengthening Coastal Communities provides funding
for activities that improve capacity of multiple coastal jurisdictions (states, counties, municipalities,
territories and tribes) to prepare and plan for, absorb impacts of, recover from, and/or adapt to
extreme weather events and climate-related hazards. The Habitat Restoration grant provides
funding for activities that restore habitat to strengthen the resilience of coastal ecosystems and
decrease the vulnerability of coastal communities to extreme weather events and climate-related
hazards. Typical awards range from $250,000 to $1million for projects lasting up to 35 months.
The minimum request is $100,000 and the maximum request is $2million. Non-profits, private,
institutions of higher education, regional organizations, and municipalities are eligible.
https://coast.noaa.gov/funding/_pdf/NOAA-NOS-NRPO-2017-2005159-FFO.pdf
Massachusetts Office of Coastal Zone Management (CZM). CZM administers the Coastal
Resilience Grant Program to provide financial and technical support for local efforts to increase
awareness and understanding of climate impacts, identify vulnerabilities, conduct adaptation
planning, redesign vulnerable public facilities and infrastructure, and implement non-structural
approaches that enhance natural resources and provide storm damage protection. The grant is
managed through CZM’s StormSmart Coasts program. Eligible projects Vulnerability and Risk
Assessment; Public Education and Communication; Local Bylaws, Adaptation Plans, and Other
Management Measures; Redesigns and Retrofits; Natural Storm-Damage Protection Techniques.
Recipients receive up to $500k and are required to provide at least 25% of the total project
cost. The 25% local match could be cash or in-kind contributions or a combination of the two. The
Coastal Resilience Grant Program is open to the 78 municipalities located within the MA coastal
zone. Certified 501(c)(3) nonprofit organizations with vulnerable coastal property that is open
and accessible to the public are also eligible for funding for natural storm-damage protection (or
green infrastructure) projects. http://www.mass.gov/eea/agencies/czm/program-
areas/stormsmart-coasts/grants/
Stormwater/Water Quality Funding
Stormwater Utility/Enterprise Fund. Several cities and towns in Massachusetts and hundreds of
communities across the country have adopted a stormwater utility to help fund the costs of
stormwater programs, including the costs of capital improvements and repair or replacement of
green infrastructure. Such fees create a dedicated and stable funding source to address

10
stormwater impacts. To help understand if a stormwater utility is practical to implement, MAPC
and its partners developed a Stormwater Utility/Funding starter kit to help municipalities
evaluate and pursue a stormwater utility for local water quality.
https://www.mapc.org/resource-library/stormwater-bylaws-toolkit/
Clean Water Act Nonpoint Source Grants. Under Section 319 of the federal Clean Water Act,
the US EPA provides states with funds to support a variety of activities to reduce nonpoint source
pollution, including technical and financial assistance, education and training, technology transfer,
demonstration projects and monitoring to assess the success of projects. EPA has stated specifically
that such grants can be used to reduce pollution from stormwater runoff and other sources,
recognizing the importance of green infrastructure in managing stormwater. Grant awards very
widely in among and scope; a 40 percent non-federal funding match is required. Note 319
grants may not be used for stormwater activities that directly implement municipal separate storm
sewer system (MS4) National Pollutant Discharge Elimination System (NPDES)
permits.http://www.mass.gov/eea/agencies/massdep/water/grants/watersheds-water-
quality.html#2
Massachusetts Environmental Trust (MET) Grant. The MET grant provides funding to support
programs, research, and other activities that promote the responsible stewardship of the
Commonwealth's water resources. MET's goal is to encourage development of new approaches
and ideas and to spur innovation among grantees or partnering organizations. To achieve these
outcomes, the Trust supports projects that: improve water quality or quantity, conserve aquatic
habitat and species, reduce runoff pollution, mitigate the effects of climate change on water
resources, promote human health as it relates to water resources, and/or other efforts consistent
with the Trust's mission. There are three types of grants, one with a specific focus on the Mystic
River. Awards range from $5,000 to $100,000. http://www.mass.gov/eea/grants-and-tech-
assistance/grants-and-loans/mass-enviro-trust/met-grants.html
Division of Ecological Restoration (DER). DER initiates projects that restore our rivers, streams,
wetlands, and watersheds. DER partners with nonprofits, towns, individuals, and groups to
implement projects. These projects improve habitat for wildlife and provide many benefits such as
reduced flooding, improved water quality, and public safety. Programs include culvert and dam
removal as well as coastal wetland, inland wetland, and river restoration. DER provides technical
assistance, helps secure funding, and coordinates project management until completion.
https://www.mass.gov/orgs/division-of-ecological-restoration
Rivers, Trails, and Conservation Assistance Program. The National Park Service Rivers, Trails and
Conservation Assistance Program (RTCA) assists community-led natural resource conservation and
outdoor recreation initiatives. RTCA staff provides guidance to communities on: conserving
waterways, preserving open space, and developing trails and greenways.
https://www.nps.gov/orgs/rtca/apply.htm

11
Natural Resources-Land and Forest
National Urban and Community Forestry Program. Under the US Forest Service, this program’s
objectives are to establish sustainable community forests that improve the public’s health, well-
being, and economic vitality, and create resilient ecosystems for present and future generations.
When funds are available, cost-share grants support urban projects that have national and
multistate application and impact. https://www.fs.fed.us/managing-land/urban-forests/ucf
Massachusetts Urban and Community Forestry. The Massachusetts Urban and Community Forestry
Program assists communities and nonprofit groups in protecting, growing, and managing
community trees and forest ecosystems, to improve the environment and enhance livability. The
program includes grants, technical assistance, training and recognition awards, and provides
guidance on urban forestry policy issues.
http://www.mass.gov/eea/agencies/dcr/conservation/forestry-and-fire-control/urban-and-
community-forestry.html
Parkland Acquisitions and Renovations for Communities (PARC). PARC assists cities and towns in
acquiring and developing land for park and outdoor recreation purposes. Any city that has an
authorized park or recreation commission is eligible to participate and use grant funds to acquire
land, develop new parks or renovate existing outdoor public recreation facilities (which may
include green infrastructure). Access by the general public is required. Municipalities must have a
current open space and recreation plan to apply, and the land must be open to the general
public. Awards range from $50,000 to $500,000. http://www.mass.gov/eea/grants-and-tech-
assistance/grants-and-loans/dcs/grant-programs/massachusetts-parkland-acquisitions-and.html
Conservation Partnership. The Conservation Partnership Program within the Executive Office of
Energy and Environmental Affairs (EEA) provides funding to nonprofit organizations to acquire
land and interests in land (i.e., easements known as Conservation Restrictions) for conservation or
recreation purposes, as part of a nature-based solution. The average grant size is $52,000. The
maximum grant is $85,000. A 1:1 match is required. http://www.mass.gov/eea/grants-and-tech-
assistance/grants-and-loans/dcs/grant-programs/conservation-partnership-grant.html
Local Acquisitions for Natural Diversity (LAND). LAND is a state grant program implemented by
EEA provides grants for the acquisition of land for passive parks or conservation areas in cities
and towns – which can include green infrastructure. Grants are up to $400,000 with
reimbursement rates ranging from 52%-70% of the total project cost. Municipalities must have a
current open space and recreation plan to apply, and the land must be open to the public.
https://www.mass.gov/files/2017-06/LAND%20fy-18%20grant%20summary_1.pdf
Massachusetts Community Preservation Act. The Community Preservation Act (CPA) has been
adopted by 172 cities and towns in Massachusetts representing 60 percent of the state’s
residents. CPA funds bring an annual match from the state CPA Trust Fund, and leverages
investments from state, federal and private sources. Each year, CPA provides funding for
affordable housing; historic resources, and outdoor recreation/open space, and is flexible to help
fund all types of creative improvements. Funds for open space and recreation, for example, can

12
be used to acquire and restore land and water resources, and to acquire and improve parks,
playgrounds, ball fields, parks, greenways, farms and gardens that use nature-based solutions to
help cities and towns become more resilient to climate change impacts.
http://www.communitypreservation.org/