Embed Size (px)
Citation preview
Article
Secreted NF-kB suppressi
ve microbial metabolitesmodulate gut inflammationGraphical abstract
Highlights
d Select strains of Clostridium from human stool samples can
suppress NF-kB activation
d The immunomodulatory effect of bacteria can be strain- and
media-specific
d Inter-patient variation suggests possible development of
personalized medicine
d In vitro immunosuppression assays using organoids predict
in vivo activity
Giri et al., 2022, Cell Reports 39, 110646April 12, 2022 ª 2022 The Author(s).https://doi.org/10.1016/j.celrep.2022.110646
Authors
Rabina Giri, Emily C. Hoedt,
Shamsunnahar Khushi, ...,
Robert J. Capon, Paraic O Cuıv,
Jakob Begun
[email protected] (P.O.C.),[email protected] (J.B.)
In brief
The ability of gut bacteria to modulate
inflammation remains cryptic. Using
anaerobic cultures, Giri et al. identify
multiple Firmicutes-affiliated bacteria
capable of reducing NF-kB-mediated
inflammatory signaling in a strain-
dependent manner. Cell-free culture
supernatants reduce inflammation in
patient-derived organoids and in a pre-
clinical model of colitis.
ll

OPEN ACCESS
llArticle
Secreted NF-kB suppressive microbialmetabolites modulate gut inflammationRabina Giri,1,2,7 Emily C. Hoedt,2,3,9 Shamsunnahar Khushi,4 Angela A. Salim,4 Anne-Sophie Bergot,3 Veronika Schreiber,1
Ranjeny Thomas,3 Michael A. McGuckin,1,2 Timothy H. Florin,1 Mark Morrison,2,3 Robert J. Capon,4 Paraic O Cuıv,2,3,5,8,*and Jakob Begun1,2,5,6,10,*1Mater Research Institute – The University of Queensland, Translational Research Institute, Brisbane, QLD 4102, Australia2Faculty of Medicine, The University of Queensland, St. Lucia, QLD 4072, Australia3The University of Queensland Diamantina Institute, The University of Queensland, Translational Research Institute, Brisbane, QLD 4102,
Australia4The Institute for Molecular Bioscience, The University of Queensland, Brisbane, QLD 4072, Australia5These authors contributed equally6Twitter: @JakobBegunMD7Twitter: @girirabina8Twitter: @mygutmicrobiome9Twitter: @EmilyHoedt10Lead contact
*Correspondence: [email protected] (P.O.C.), [email protected] (J.B.)
https://doi.org/10.1016/j.celrep.2022.110646
SUMMARY
Emerging evidence suggests thatmicrobiome-host crosstalk regulates intestinal immune activity and predis-position to inflammatory bowel disease (IBD). NF-kB is amaster regulator of immune function and a validatedtarget for the treatment of IBD. Here, we identify fiveClostridium strains that suppress immune-mediated NF-kB activation in epithelial cell lines, PBMCs, and gut epithelial organoids from healthy human subjects andpatients with IBD. Cell-free culture supernatant from Clostridium bolteae AHG0001 strain, but not the refer-ence C. bolteae BAA-613 strain, suppresses inflammatory responses and endoplasmic reticulum stress ingut epithelial organoids derived from Winnie mice. The in vivo responses to Clostridium bolteae AHG0001and BAA-613 mirror the in vitro activity. Thus, using our in vitro screening of bacteria capable of suppressingNF-kB in the context of IBD and using an ex vivo organoid-based approach, we identify a strain capable ofalleviating colitis in a relevant pre-clinical animal model of IBD.
INTRODUCTION
The human gut is the largest immune organ of the body, and gut
epithelial cells play a key role in the establishment and mainte-
nance of gut homeostasis, aswell as rapid responses to infection
(Peterson and Artis, 2014). The gut is colonized by a diverse mi-
crobiota that has co-evolved with its host and forms a symbiotic
relationship through its modulation of innate and adaptive im-
mune responses (Geva-Zatorsky et al., 2017; Kabat et al.,
2014). However, with a few notable exceptions (Mazmanian
et al., 2008; Wlodarska et al., 2017), the microbes and microbial
determinants of immune homeostasis remain cryptic.
Inflammatory bowel diseases (IBDs) are composed of two pre-
dominant subtypes, Crohn disease (CD) and ulcerative colitis
(UC), that are characterized by relapsing and remitting gut
inflammation. The nuclear factor-kB (NF-kB) family of transcrip-
tion factors are master regulators of gut epithelial integrity and
inflammation and activation of antigen-presenting cells and
effector leukocytes. Upon activation, NF-kB dimers translocate
to the nucleus, where they regulate transcription of a wide range
of genes, including those involved in immune and inflammatory
This is an open access article under the CC BY-N
responses (Wullaert et al., 2011). In the healthy gut, NF-kB acti-
vation is tightly regulated (Renner and Schmitz, 2009), but
several IBD genetic risk alleles, including NOD2, TOLLIP, and
A20, exert their pathogenic effects at least in part through dysre-
gulated NF-kB signaling (Zaidi and Wine, 2018). Additionally,
macrophages and epithelial cells isolated from the inflamed in-
testine of patients with IBD show increased activation, and nu-
clear localization of NF-kB-p65 (Rogler et al., 1998). NF-kB
signaling contributes significantly to multiple host responses un-
derlying the pathogenesis of IBD.
The gut microbiota is increasingly recognized as an important
contributory risk factor for IBD development and activity, as
healthy and IBD gut microbiota differ and are characterized by
structure and function alterations (Costello et al., 2017; Wilson
et al., 2019). Several bacterial taxa are abundant in the healthy
gut that can suppress inflammatory responses and alleviate
inflammation in animal models of disease (Sokol et al., 2008;
Eeckhaut et al., 2012; Takeshita et al., 2016). These ‘‘anti-inflam-
matory’’ properties are best characterized for the gut bacterium
Faecalibacterium prausnitzii A2-165, which produces secreted
peptides derived from the Mam protein that suppress NF-kB
Cell Reports 39, 110646, April 12, 2022 ª 2022 The Author(s). 1C-ND license (http://creativecommons.org/licenses/by-nc-nd/4.0/).
(legend on next page)
2 Cell Reports 39, 110646, April 12, 2022
Articlell
OPEN ACCESS

Articlell
OPEN ACCESS
in vitro and in vivo via stabilization of the IKK complex (Quevrain
et al., 2016). However, although Firmicutes-affiliated Clostridia
are among the most abundant and functionally diverse gut bac-
teria, Mam expression is largely restricted to members of Faeca-
libacterium spp., and much remains to be discovered about the
immunomodulatory capacities inherent to other Firmicutes.
Here, we identified five new Firmicutes isolates that are com-
parable or superior to F. prausnitzii A2-165 in their NF-kB sup-
pressive activity and whose activities are characterized by
strain-specific differences. Notably, these bacteria suppressed
cytokine-mediated IL-8 secretion in CD and UC gut-derived or-
ganoid cultures and peripheral blood mononuclear cells
(PBMCs). On the basis of these observations, we demonstrated
using two Clostridium bolteae strains and ex vivo assays that
ex vivo activity in organoids predicts immunomodulatory bioac-
tivity in vivo using theWinniemurine model of spontaneous coli-
tis. Furthermore, using an activity-guided high-performance
liquid chromatography (HPLC) purification method, we have
shown that non-polar and hydrophobic bacterial supernatant
derived fractions from Clostridium bolteae can suppress both
cytokine and lipopolysaccharide (LPS)-driven chemokine/cyto-
kine expression on human organoids and PBMCs, as well as
non-canonical NF-kB in vitro and in vivo. These data demon-
strate the potential of bioprospecting the human microbiome
for novel therapeutic leads targeting immunologically relevant
pathways for treating gut inflammation.
RESULTS
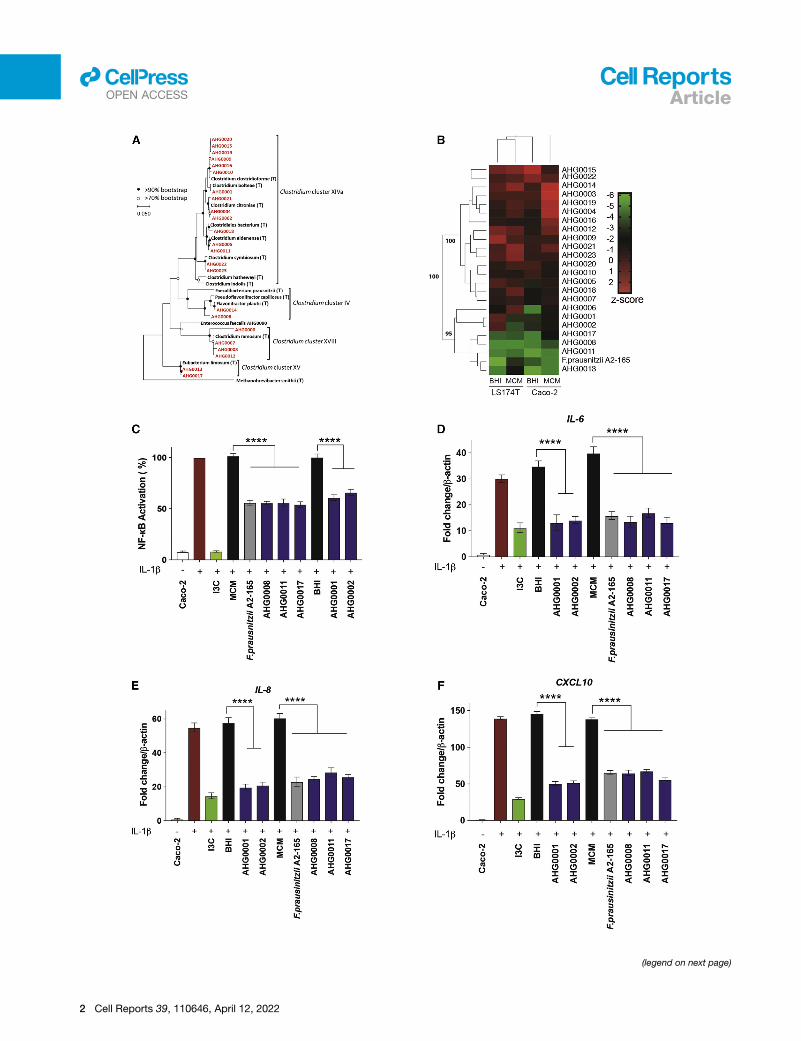
Gut clostridia can suppress NF-kBWe assessed the NF-kB suppressive capacity of cell-free super-
natants (CS) derived from 23 Firmicutes-affiliated gut bacteria
previously isolated by metaparental mating (O Cuıv et al.,
2015). The isolates were principally affiliated with Clostridium
cluster XIVa, with several isolates also affiliated with clusters
IV, XV, and XVIII (Figure 1A).
We assessed the ability of individual isolates to suppress NF-
kB activation using LS174T goblet cell-like and Caco-2 entero-
cyte-like reporter cell lines stimulated with IL-1b and TNF-a,
respectively, which have previously been shown to stimulate
NF-kB activity in these cell-lines (O Cuıv et al., 2017). A Z factor
of 0.805 ± 0.06 (modified clostridial medium [MCM]) and 0.87 ±
0.01 (brain heart infusion [BHI]) was achieved for the LS174T
cells, while a Z factor of 0.78 ± 0.057 (MCM) and 0.765 ± 0.02
(BHI) was achieved for the Caco-2 cells. CS prepared from iso-
lates grown to stationary phase in modified clostridial medium
Figure 1. Gut clostridia can suppress NF-kB
(A) 16S rRNA-based phylogeny of the MPM isolates characterized in this study
(bold black typeface).
(B) Heatmap analysis of the NF-kB suppressive capacity of the bacterial isolates
medium (MCM) or brain heart infusion (BHI) to suppress NF-kB in LS174T or Ca
formed an NF-kB suppressive cluster with F. prausnitzii A2-165.
(C) Caco-2-based confirmatory assay of the hits identified from the first-pass scre
suppression was assessed against sterile medium (mean [SD]). Indole-3-carbino
(D–F) Caco-2-based qRT-PCR confirmatory assay of the hits identified from th
suppress IL-1b-induced IL-6, IL-8, and CXCL10 expression in Caco-2 cells.
n = 2 independent experiment with n = 3 technical replicates each. **p < 0.01 and
comparison test.
or brain heart infusion medium were assessed for their ability
to suppress cytokine-induced NF-kB activation. The dilutions
of CS were chosen on the basis of the dose-response experi-
ment performed on each cell line and the maximal non-suppres-
sive baseline dilution selected (Figures S1A–S1D). In addition to
F. prausnitzii A2-165, the isolates C. bolteae AHG0001, Clos-
tridium citroniae AHG0002 Pseudoflavonifractor sp. AHG0008,
Clostridium aldenense AHG0011, Eubacterium limosum
AHG0013, and E. limosum AHG0017 suppressed NF-kB in
both cell lines when grown in MCM and/or BHI (Figure 1B; Z
score % �3). The first-pass screen was confirmed for selected
isolates following growth in MCM or BHI, with NF-kB suppres-
sion observed in both cell lines (Figures 1C and S2A). Consistent
with the reporter assay results, all the isolates suppressed induc-
tion of the NF-kB-regulated genes IL-6, IL-8, and CXCL10 in
Caco-2 (Figures 1D–1F) and LS174T (Figure S2B) cells following
cytokine stimulation. Critically, none of the CS exhibited cyto-
toxic effects at the dilutions used (Figures S2C and S2D) and
did not affect cell proliferation (Figure S2E). Although short-chain
fatty acids are posited to suppress gut inflammation, similar to
previous reports(Lakhdari et al., 2011), the addition of up to
16 mM of the short-chain fatty acids acetate, butyrate, and pro-
pionate actually enhanced cytokine-driven NF-kB activation
(Figures S2F–S2K).
NF-kB suppression is strain-specificHaving confirmed their suppressive activity, we next examined
the intraspecies variations in NF-kB suppressive capacity. Iso-
latesC. bolteae AHG0001 and American Type Culture Collection
(ATCC) BAA-613 (OTU1), C. citroniae AHG0002 and AHG0004
(OTU2), and C. aldenense AHG0011 and AHG0005 (OTU3) are
assigned to the same operational taxonomic units (Figure 1A;
R97% 16S rRNA sequence identity). However, these OTUs
were characterized by marked intraspecies differences in their
NF-kB suppressive capacities under standard growth conditions
(Figures 2A–2C).We therefore examined the effect of growthme-
dium on the suppressive effects of C. bolteae AHG0001 and
C. citroniae AHG0002. CS prepared from C. bolteae AHG0001
and C. citroniae AHG0002 following growth in MCM but not
BHI suppressed TNF-a-driven mediated NF-kB activation in
LS174T cells (Figure 2D). Conversely, CS prepared from these
strains following growth in BHI but not MCM suppressed IL-
1b-driven NF-kB activation in Caco-2 cells (Figure 2E). Thus,
NF-kB suppressive functionality is strain-specific, and nutritional
growth conditions influence bioactive production in vitro and by
extension may affect the production of anti-inflammatory activity
(red typeface) and representative microbial isolates and reference sequences
. The ability of CS prepared from bacterial isolates grown in modified clostridia
co-2 reporter cell lines was assessed twice independently. A subset of strains
en. NF-kB activation was assessed 4 h after IL-1b stimulation, and the extent of
l (I3C), a pharmacological inhibitor of NF-kB, was used as positive control.
e first-pass screen (mean [SD]). F. prausnitzii A2-165 and the validated hits
****p < 0.0001, as determined using one-way ANOVA with Dunnett’s multiple-
Cell Reports 39, 110646, April 12, 2022 3

A B C
D
F
E
G
(legend on next page)
4 Cell Reports 39, 110646, April 12, 2022
Articlell
OPEN ACCESS

Table 1. Biosynthetic gene clusters from strains producing <3 kDa bioactive
Genome
designation
CheckM marker
lineage (order
[GTDB branch])
Number of
contigs
Genome
size (bp) GC (%)
CheckM
completeness (%)
CheckM
contamination (%)
Number of
BGCs
NCBI accession
number
C. bolteae AHG0001 Clostridiales
(UID1342)
96 5,985,600 49.4 98.76 0.56 19 QYRW00000000
C. citroniae AHG0002 Clostridiales
(UID1226)
149 6,630,634 48.8 99.37 0 25 QYRX00000000
C. aldenense AHG0011 Clostridiales
(UID1226)
263 6,734,822 49.5 99.37 0 24 QYRY00000000
E. limosum AHG0017 Clostridiales
(UID1120)
86 4,704,612 47.2 99.3 0.7 31 QYRZ00000000
Articlell
OPEN ACCESS
in situ in the gut. In addition, the context of NF-kB activation via
IL-1b or TNF-a may determine the suppressive effect of
bioactives.
We examined our collection of suppressive CS using a combi-
nation of size fractionation, Proteinase K, and heat treatments to
determine their biochemical characteristics. Using this
approach, we determined that the NF-kB suppressive activity
for all strains except Pseudoflavonifractor sp. AHG0008was pre-
dominantly associated with the <3 kDa fraction (Figures 2F, 2S,
and 3A–3F). Gut bacteria produce a structurally diverse array of
low-molecular weight NF-kB suppressive bioactives (Quevrain
et al., 2016; O Cuıv et al., 2018; Kaci et al., 2011), andwe focused
on the <3 kDa fraction. These bioactives could be broadly sepa-
rated into two classes on the basis of heat and protease sensi-
tivity (e.g., F. prausnitzii A2-165 and C. aldenense AHG0011) or
resilience (e.g., C. bolteae AHG0001, C. citroniae AHG0002,
and E. limosum AHG0017), possibly inclusive of peptides and/
or thermal and hydrolytically stable small molecules, respec-
tively (Figures 2G and S3A–S3F). Interestingly, the suppressive
activity ofC. bolteae AHG0001 culture supernatant increased af-
ter heat and Proteinase K treatment, although this was not signif-
icant, which could be a result of degradation of any activating
proteins or peptides produced by this strain. We performed
genome sequencing of the strains producing <3 kDa bioactives
to near completeness to identify candidate bioactive encoding
biosynthetic gene clusters (BGCs) (Table 1). Phylogenetic anal-
ysis using the Genome Taxonomy Database (GTDB) confirmed
the 16S rRNA-based assignments (Figure S4A). We also deter-
mined that the strains exhibited a high degree of genome
synteny with their near relatives (Figures S4B–S4E) and carried
multiple BGCs (Table 1). None of the isolates encoded
F. prausnitziiMam-like orthologs, which is consistent with its nar-
Figure 2. NF-kB suppression is strain-specific
(A–C) Characterization of intraspecies variation in NF-kB suppressive capacity. Th
and AHG0004 (B), and C. aldenense AHG0011 and AHG0005 (C) to suppress N
sessed 4 h after TNF-a stimulation, and the extent of suppression was assessed
(D and E) Characterization of the effect of growthmedium on the NF-kB suppressiv
Caco-2 (E) reporter cell lines. NF-kB activation was assessed 4 h after cytokine st
(F and G) Characterization of the bioactive factors produced by F. prausnitzii A
E. limosum AHG0017, and Pseudoflavonifractor sp. AHG0008. The cell-free CS w
treatments as appropriate (G). NF-kB activation was assessed 4 h after TNF-a st
(mean [SD]).
n = 2 independent experiment with n = 3 technical replicates each. *p < 0.05, **p
with Dunnett’s multiple-comparison test.
row phylogenetic distribution (Quevrain et al., 2016; Martın et al.,
2017). No annotated BGCs were identified to explain the
observed bioactivity.
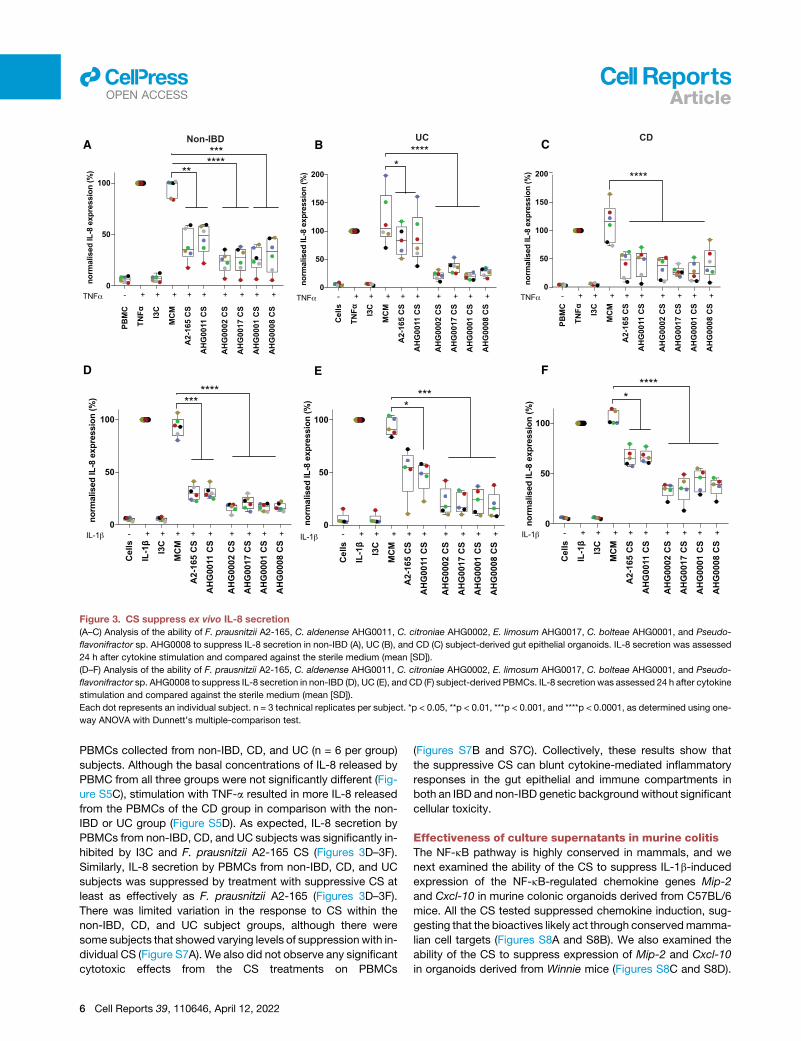
CS suppress ex vivo IL-8 secretionTo assess whether the suppressive CS could affect epithelial
inflammatory responses in primary cells in the context of IBD-
associated genetic risk factors, we assessed their ability to pre-
vent IL-1b-driven IL-8 production in healthy (n = 6), CD (n = 5),
and UC (n = 5) derived primary intestinal epithelial organoid cul-
tures. Interestingly, despite removal from the inflammatory envi-
ronment, there was significantly higher basal IL-8 production by
organoids derived from patients with CD compared with those
from non-IBD controls and patients with UC (Figure S5A).
Following stimulation with IL-1b, significantly more IL-8 was pro-
duced by organoids derived from UC but not CD patients
compared with non-IBD subjects (Figure S5B). Treatment with
F. prausnitzii A2-165 CS significantly suppressed IL-8 secretion
compared with the MCM control in non-IBD and CD but not UC
subjects (Figures 3A–3C). Treatment with suppressive CS from
our identified Firmicutes strains significantly suppressed IL-8
secretion in non-IBD, CD, and UC subjects (Figures 3A–3C).
There was a high degree of concordance in the degree of sup-
pression between subjects treated with bacterial CS, although
some subject-specific differences were noted (Figure S6A). We
did not observe any significant cytotoxic effects from the CS
treatments in these primary organoid cultures (Figures S6B–
S6D).
In addition to effects on the epithelium, bioactives produced
by gut bacteria may also be absorbed and have local or systemic
effects on the immune compartment. Therefore, the suppressive
effects of the CS on primary immune cells were examined using
e ability of C. bolteae AHG0001 and ATCC BAA-613 (A), C. citroniae AHG0002
F-kB was analyzed using the LS174T reporter cells. NF-kB activation was as-
against sterile medium (mean [SD]).
e capacity ofC. bolteae AHG0001 andC. citroniae AHG0002 in LS174T (D) and
imulation, and the extent of suppression was assessed against sterile medium.
2-165, C. aldenense AHG0011, C. bolteae AHG0001, C. citroniae AHG0002,
ere untreated or subjected to size fractionation (F), heat, and/or Proteinase K
imulation, and the extent of suppression was assessed against sterile medium
< 0.01, ***p < 0.001, and ****p < 0.0001, as determined using one-way ANOVA
Cell Reports 39, 110646, April 12, 2022 5
A B C
D FE
Figure 3. CS suppress ex vivo IL-8 secretion
(A–C) Analysis of the ability of F. prausnitzii A2-165, C. aldenense AHG0011, C. citroniae AHG0002, E. limosum AHG0017, C. bolteae AHG0001, and Pseudo-
flavonifractor sp. AHG0008 to suppress IL-8 secretion in non-IBD (A), UC (B), and CD (C) subject-derived gut epithelial organoids. IL-8 secretion was assessed
24 h after cytokine stimulation and compared against the sterile medium (mean [SD]).
(D–F) Analysis of the ability of F. prausnitzii A2-165, C. aldenense AHG0011, C. citroniae AHG0002, E. limosum AHG0017, C. bolteae AHG0001, and Pseudo-
flavonifractor sp. AHG0008 to suppress IL-8 secretion in non-IBD (D), UC (E), and CD (F) subject-derived PBMCs. IL-8 secretion was assessed 24 h after cytokine
stimulation and compared against the sterile medium (mean [SD]).
Each dot represents an individual subject. n = 3 technical replicates per subject. *p < 0.05, **p < 0.01, ***p < 0.001, and ****p < 0.0001, as determined using one-
way ANOVA with Dunnett’s multiple-comparison test.
Articlell
OPEN ACCESS
PBMCs collected from non-IBD, CD, and UC (n = 6 per group)
subjects. Although the basal concentrations of IL-8 released by
PBMC from all three groups were not significantly different (Fig-
ure S5C), stimulation with TNF-a resulted in more IL-8 released
from the PBMCs of the CD group in comparison with the non-
IBD or UC group (Figure S5D). As expected, IL-8 secretion by
PBMCs from non-IBD, CD, and UC subjects was significantly in-
hibited by I3C and F. prausnitzii A2-165 CS (Figures 3D–3F).
Similarly, IL-8 secretion by PBMCs from non-IBD, CD, and UC
subjects was suppressed by treatment with suppressive CS at
least as effectively as F. prausnitzii A2-165 (Figures 3D–3F).
There was limited variation in the response to CS within the
non-IBD, CD, and UC subject groups, although there were
some subjects that showed varying levels of suppression with in-
dividual CS (Figure S7A). We also did not observe any significant
cytotoxic effects from the CS treatments on PBMCs
6 Cell Reports 39, 110646, April 12, 2022
(Figures S7B and S7C). Collectively, these results show that
the suppressive CS can blunt cytokine-mediated inflammatory
responses in the gut epithelial and immune compartments in
both an IBD and non-IBD genetic background without significant
cellular toxicity.
Effectiveness of culture supernatants in murine colitisThe NF-kB pathway is highly conserved in mammals, and we
next examined the ability of the CS to suppress IL-1b-induced
expression of the NF-kB-regulated chemokine genes Mip-2
and Cxcl-10 in murine colonic organoids derived from C57BL/6
mice. All the CS tested suppressed chemokine induction, sug-
gesting that the bioactives likely act through conservedmamma-
lian cell targets (Figures S8A and S8B). We also examined the
ability of the CS to suppress expression of Mip-2 and Cxcl-10
in organoids derived from Winnie mice (Figures S8C and S8D).

(legend on next page)
Cell Reports 39, 110646, April 12, 2022 7
Articlell
OPEN ACCESS
Articlell
OPEN ACCESS
Winnie mice carry a missense mutation in Muc2 that results in
protein misfolding, increased endoplasmic reticulum (ER) stress,
and defects in gut barrier function. These mice develop a spon-
taneous colitis characteristic of UC and are an excellent pre-clin-
ical model for human treatments (Oancea et al., 2017; Das et al.,
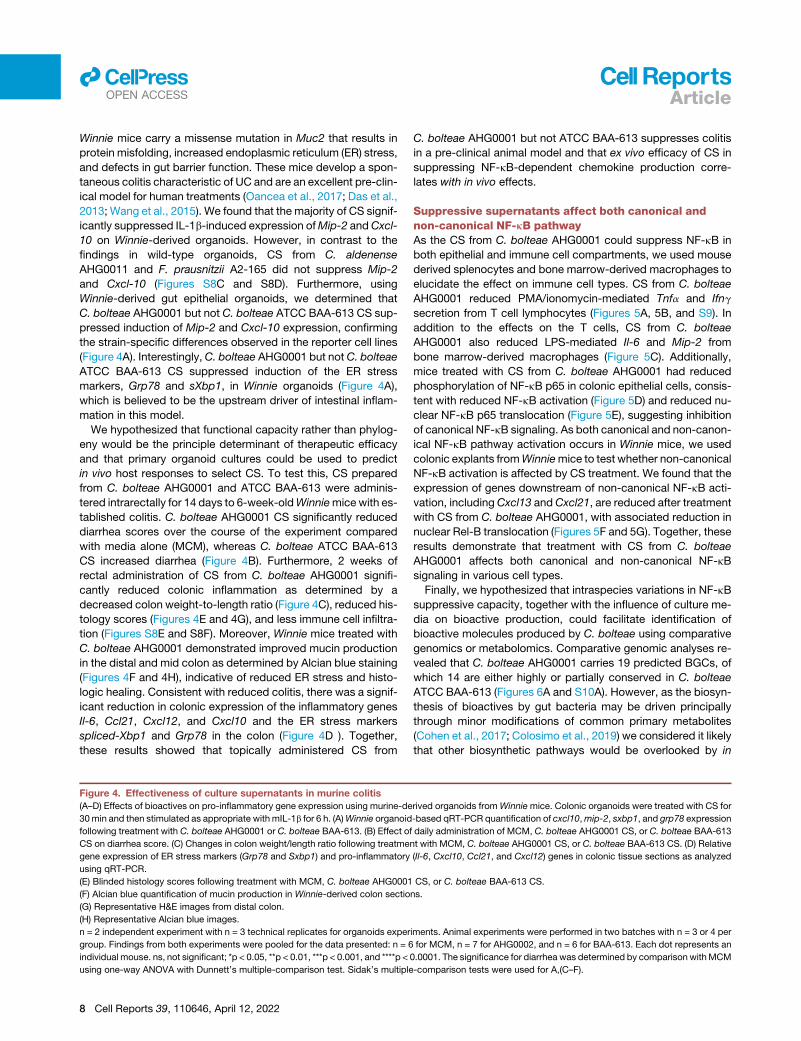
2013; Wang et al., 2015). We found that the majority of CS signif-
icantly suppressed IL-1b-induced expression ofMip-2 andCxcl-
10 on Winnie-derived organoids. However, in contrast to the
findings in wild-type organoids, CS from C. aldenense
AHG0011 and F. prausnitzii A2-165 did not suppress Mip-2
and Cxcl-10 (Figures S8C and S8D). Furthermore, using
Winnie-derived gut epithelial organoids, we determined that
C. bolteae AHG0001 but not C. bolteae ATCC BAA-613 CS sup-
pressed induction of Mip-2 and Cxcl-10 expression, confirming
the strain-specific differences observed in the reporter cell lines
(Figure 4A). Interestingly,C. bolteae AHG0001 but not C. bolteae
ATCC BAA-613 CS suppressed induction of the ER stress
markers, Grp78 and sXbp1, in Winnie organoids (Figure 4A),
which is believed to be the upstream driver of intestinal inflam-
mation in this model.
We hypothesized that functional capacity rather than phylog-
eny would be the principle determinant of therapeutic efficacy
and that primary organoid cultures could be used to predict
in vivo host responses to select CS. To test this, CS prepared
from C. bolteae AHG0001 and ATCC BAA-613 were adminis-
tered intrarectally for 14 days to 6-week-oldWinniemice with es-
tablished colitis. C. bolteae AHG0001 CS significantly reduced
diarrhea scores over the course of the experiment compared
with media alone (MCM), whereas C. bolteae ATCC BAA-613
CS increased diarrhea (Figure 4B). Furthermore, 2 weeks of
rectal administration of CS from C. bolteae AHG0001 signifi-
cantly reduced colonic inflammation as determined by a
decreased colon weight-to-length ratio (Figure 4C), reduced his-
tology scores (Figures 4E and 4G), and less immune cell infiltra-
tion (Figures S8E and S8F). Moreover, Winnie mice treated with
C. bolteae AHG0001 demonstrated improved mucin production
in the distal and mid colon as determined by Alcian blue staining
(Figures 4F and 4H), indicative of reduced ER stress and histo-
logic healing. Consistent with reduced colitis, there was a signif-
icant reduction in colonic expression of the inflammatory genes
Il-6, Ccl21, Cxcl12, and Cxcl10 and the ER stress markers
spliced-Xbp1 and Grp78 in the colon (Figure 4D ). Together,
these results showed that topically administered CS from
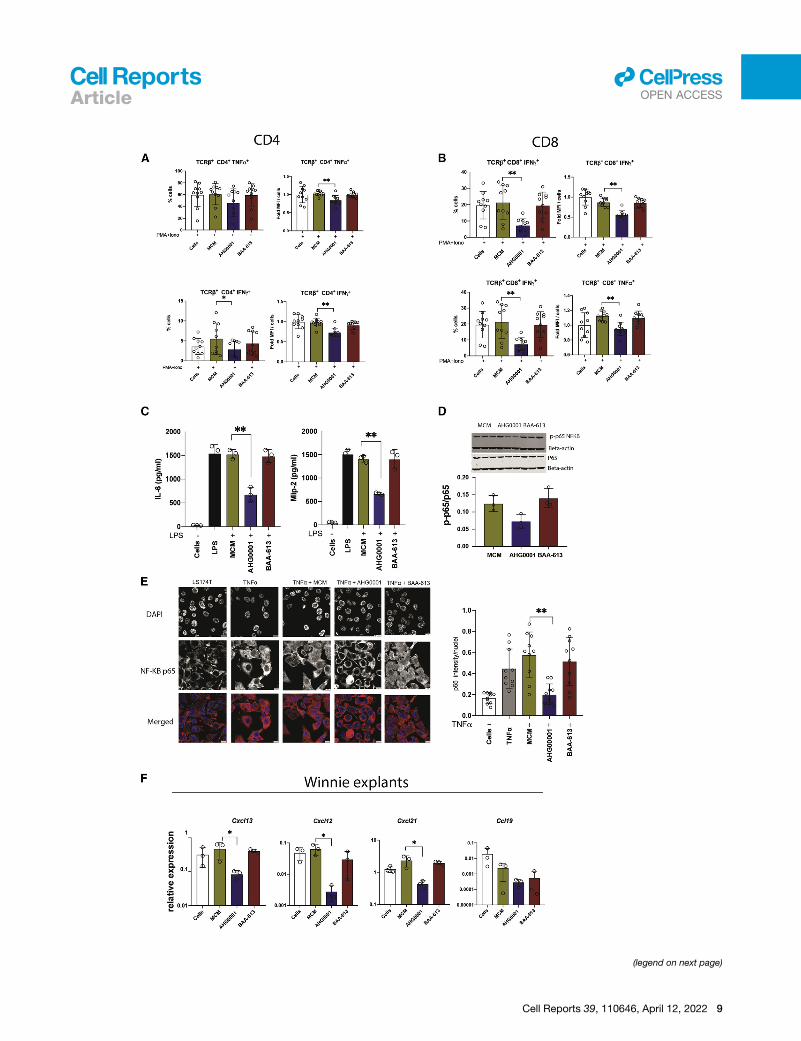
Figure 4. Effectiveness of culture supernatants in murine colitis(A–D) Effects of bioactives on pro-inflammatory gene expression using murine-de
30min and then stimulated as appropriate with mIL-1b for 6 h. (A)Winnie organoid
following treatment with C. bolteae AHG0001 or C. bolteae BAA-613. (B) Effect of
CS on diarrhea score. (C) Changes in colon weight/length ratio following treatme
gene expression of ER stress markers (Grp78 and Sxbp1) and pro-inflammatory
using qRT-PCR.
(E) Blinded histology scores following treatment with MCM, C. bolteae AHG0001
(F) Alcian blue quantification of mucin production in Winnie-derived colon sectio
(G) Representative H&E images from distal colon.
(H) Representative Alcian blue images.
n = 2 independent experiment with n = 3 technical replicates for organoids exper
group. Findings from both experiments were pooled for the data presented: n = 6
individual mouse. ns, not significant; *p < 0.05, **p < 0.01, ***p < 0.001, and ****p <
using one-way ANOVA with Dunnett’s multiple-comparison test. Sidak’s multiple
8 Cell Reports 39, 110646, April 12, 2022
C. bolteae AHG0001 but not ATCC BAA-613 suppresses colitis
in a pre-clinical animal model and that ex vivo efficacy of CS in
suppressing NF-kB-dependent chemokine production corre-
lates with in vivo effects.
Suppressive supernatants affect both canonical andnon-canonical NF-kB pathwayAs the CS from C. bolteae AHG0001 could suppress NF-kB in
both epithelial and immune cell compartments, we used mouse
derived splenocytes and bone marrow-derived macrophages to
elucidate the effect on immune cell types. CS from C. bolteae
AHG0001 reduced PMA/ionomycin-mediated Tnfa and Ifng
secretion from T cell lymphocytes (Figures 5A, 5B, and S9). In
addition to the effects on the T cells, CS from C. bolteae
AHG0001 also reduced LPS-mediated Il-6 and Mip-2 from
bone marrow-derived macrophages (Figure 5C). Additionally,
mice treated with CS from C. bolteae AHG0001 had reduced
phosphorylation of NF-kB p65 in colonic epithelial cells, consis-
tent with reduced NF-kB activation (Figure 5D) and reduced nu-
clear NF-kB p65 translocation (Figure 5E), suggesting inhibition
of canonical NF-kB signaling. As both canonical and non-canon-
ical NF-kB pathway activation occurs in Winnie mice, we used
colonic explants fromWinniemice to test whether non-canonical
NF-kB activation is affected by CS treatment. We found that the
expression of genes downstream of non-canonical NF-kB acti-
vation, includingCxcl13 andCxcl21, are reduced after treatment
with CS from C. bolteae AHG0001, with associated reduction in
nuclear Rel-B translocation (Figures 5F and 5G). Together, these
results demonstrate that treatment with CS from C. bolteae
AHG0001 affects both canonical and non-canonical NF-kB
signaling in various cell types.
Finally, we hypothesized that intraspecies variations in NF-kB
suppressive capacity, together with the influence of culture me-
dia on bioactive production, could facilitate identification of
bioactive molecules produced by C. bolteae using comparative
genomics or metabolomics. Comparative genomic analyses re-
vealed that C. bolteae AHG0001 carries 19 predicted BGCs, of
which 14 are either highly or partially conserved in C. bolteae
ATCC BAA-613 (Figures 6A and S10A). However, as the biosyn-
thesis of bioactives by gut bacteria may be driven principally
through minor modifications of common primary metabolites
(Cohen et al., 2017; Colosimo et al., 2019) we considered it likely
that other biosynthetic pathways would be overlooked by in
rived organoids fromWinniemice. Colonic organoids were treated with CS for
-based qRT-PCR quantification of cxcl10,mip-2, sxbp1, and grp78 expression
daily administration of MCM, C. bolteae AHG0001 CS, or C. bolteae BAA-613
nt with MCM, C. bolteae AHG0001 CS, or C. bolteae BAA-613 CS. (D) Relative
(Il-6, Cxcl10, Ccl21, and Cxcl12) genes in colonic tissue sections as analyzed
CS, or C. bolteae BAA-613 CS.
ns.
iments. Animal experiments were performed in two batches with n = 3 or 4 per
for MCM, n = 7 for AHG0002, and n = 6 for BAA-613. Each dot represents an
0.0001. The significance for diarrhea was determined by comparison withMCM
-comparison tests were used for A,(C–F).
(legend on next page)
Cell Reports 39, 110646, April 12, 2022 9
Articlell
OPEN ACCESS

Articlell
OPEN ACCESS
silico analyses. We consequently applied a process of bioassay-
guided solvent extractions and filtrations, followed by high-per-
formance liquid chromatography to fractionate the bioactivity
further. After ethanol acetate (EtOAc) extraction of C. bolteae
AHG0001 culture supernatants, followed by drying and reconsti-
tution in cell culture media, full suppressive activity was
observed (Figures 6B–6D). Fractionation of the EtOAc extract
using a reversed-phase analytical HPLC column revealed that
the NF-kB suppressive activity was found in the late eluting
non-polar fractions, highlighting the non-polarity and hydropho-
bicity of the putative bioactive(s) (Figures 6B–6D, S11).
In the future, an integrated approach of combining bacterial
isolation, functional screens, and comparative metabolomics
might be beneficial in identification of novel bacterial secreted
molecules and to expedite bioactive discovery.
DISCUSSION
Firmicutes-affiliated bacteria are among the most abundant gut
microbes, and these taxa are widely recognized to possess
immunomodulatory capacities (Atarashi et al., 2011, 2013;
Sokol et al., 2008). However, they are poorly represented
in culture collections, and their ability to modulate immune re-
sponses remains largely undefined. In this study, we identified
five gut bacterial strains affiliated with Clostridium clusters IV,
XIVa, and XV that have NF-kB suppressive activity comparable
or superior to the well-characterized F. prausnitzii A2-165
strain. The NF-kB suppressive bioactivities were characterized
by significant biochemical and intraspecies variations suggest-
ing that NF-kB suppressive capacity may be more prevalent
than previously appreciated and not adequately captured in ex-
isting genetic-based studies of the gut microbiome. This is
consistent with Geva-Zatorsky et al. (Geva-Zatorsky et al.,
2017), who determined that as few as 53 isolates were associ-
ated with more than 24,000 immune phenotypes that include
functionalities relevant to IBD such as Treg induction. Modu-
lating host immune responses may support the ability of gut
bacteria to colonize and persist in the gut environment. Further-
more, the ability of the microbiota to act as an extrinsic regu-
lator of host immunity may underpin immune homeostasis,
and therefore alterations in the gut microbial composition
may contribute to disease risk in genetically susceptible
individuals.
IBD is characterized by a dysregulated immune response with
select genetic susceptibilities affecting therapeutic responsive-
ness (Niess et al., 2012; Barber et al., 2016). Given this variability
Figure 5. CS affects both canonical and non-canonical NF-kB signalinEffect of CS in various cell types.
(A and B) PMA/ionomycin-mediated Tnfa and Ifng secretion in CD4+ and CD8+ T
(C) LPS-mediated IL-6 and Mip-2 secretion in BMDMs.
(D) Changes in phosphorylated NF-kB p65 expression levels following 1 h treatm
epithelial cells from Winnie mice as determined using western blot against total a
(E) Representative immunofluorescence (IF) images of P-65 nuclear translocation
location was quantified using ImageJ.
(F) Colonic tissues from Winnie mice were treated with CS for 6 h and tissues an
n = 10 mice were used for flow cytometry analysis; each circle represents an indiv
were used for ex vivo assays. n = 2 biological replicates with technical triplicate
intensity measurement.
10 Cell Reports 39, 110646, April 12, 2022
in IBD, we used patient-derived gut epithelial organoids and im-
mune cells to confirm bacterial capability to suppress cytokine-
mediated inflammatory responses. The heat- and Proteinase
K-resilient bioactives showed strong suppression of IL-8 secre-
tion in organoids and immune cells from non-IBD, CD, and UC
subjects. Interestingly, the proteinase sensitive bioactives pro-
duced by F. prausnitzii A2-165 and C. aldenense AHG0011 ap-
peared less suppressive in UC-derived organoids and PBMCs,
and in CD organoids, compared with organoids derived from
non-IBD controls, which may be reflective of the increased
endogenous protease activity observed in IBD (Vergnolle,
2016). Our in vitro and ex vivo data also suggested that functional
capacity rather than phylogeny may be the key determinant of
biologic effects. To explore this hypothesis, we capitalized on
the C. bolteae intraspecies differences in activity and demon-
strated that ex vivo effects observed inWinnie organoids, where
CS from C. bolteae AHG0001 but not ATCC BAA-613 sup-
pressed immune responses, predicted in vivo efficacy in amelio-
rating established colitis inWinniemice. Notably, treatment with
C. bolteae AHG0001 CSwas associated with a rapid onset of ac-
tion with improvement in diarrhea, alleviation of inflammation
and ER stress, as well as restoration of mucin production.
Mucosal and histologic healing are among the best predictors
of long-term outcomes in IBD (Turner et al., 2021) and taken
together, our data suggest a precision medicine approach using
ex vivo patient-derived organoids could be applied to select
effective microbiome derived IBD treatments.
The NF-kB suppressive strains we have identified carry multi-
ple BGCs, many of whose products remain cryptic, underlining
the inherent challenges in applying genomic-based approaches
to map genotype with phenotype. In addition, the biosynthesis
of bioactives by gut bacteria may be driven principally through
modest modifications of common primary metabolites that are
underpinned by small BGCs (Cohen et al., 2015, 2017). As the
medium dependent effects on NF-kB suppression may affect
the therapeutic efficacy of live biotherapeutics for IBD, we
used a bioassay-guided ethyl acetate extraction coupled with
reversed-phase analytical high-performance liquid chromatog-
raphy fractionation to further characterize low-molecular weight
non-polar bioactive associated with the NF-kB suppressive ac-
tivity of C. bolteae AHG0001. Consistent with other microbial
bioactives, the C. bolteae AHG0001 bioactive acts indepen-
dently of the bacterial cell and suppresses the inflammatory
response in animals.
In summary, our functional approach provides new opportu-
nities to rationally bioprospect the gut microbiota for precision
g
cells.
ent with MCM, C. bolteae AHG0001 CS, or C. bolteae BAA-613 CS on colonic
nd phospho-P65 using colonic tissue lysates.
on LS174T cells following 30 min treatment with CS and TNF-a. Nuclear trans-
alyzed using qRT-PCR.
idual mouse. Data were pooled from two independent experiment. n = 3 mice
s were used for IF analysis. Ten different representative fields were used for

A B
C
D E F
Figure 6. Comparative genome and chemical analysis of C. bolteae AHG0001 and C. bolteae ATCC BAA-613
(A) Determination of the extent of C. bolteae AHG0001 BGC conservation in C. bolteae ATCC BAA-613. The extent of protein (genes conserved) and syntenic
gene pair (syntenous pairs) conservation were assessed. C. bolteae AHG0001 BGCs were classed as being conserved (green), partially conserved (orange), or
not conserved (red).
(B) An overview of the experimental approach used to characterize the bioactives associated with the NF kB suppressive activity of C. bolteae AHG0001.
(legend continued on next page)
Cell Reports 39, 110646, April 12, 2022 11
Articlell
OPEN ACCESS
Articlell
OPEN ACCESS
live biotherapeutic strains and/or bioactives that could be used to
expedite thedevelopment of safer andmoreefficacious therapeu-
tics in IBD.
Limitations of the studyIn this study, we showed thatClostridium species isolated from a
single individual have NF-kB suppressive ability, but the
immunomodulatory properties are likely not limited to Clos-
tridium. Although we identified multiple strains with secreted
immunomodulatory activity, it remains undetermined if the
immunomodulatory properties ofClostridium can be generalized
to other species of bacteria. Similarly, we used onemousemodel
of colitis to validate the in vitro activity of culture supernatants,
although the activity was validated in multiple cell lines as well
as patient-derived organoids. Future studies should use other
models of murine colitis.
STAR+METHODS
Detailed methods are provided in the online version of this paper
and include the following:
d KEY RESOURCES TABLE
d RESOURCE AVAILABILITY
(C)
with
(D)
(E)
n =
12
B Lead contact
B Materials availability
B Data and code availability
d EXPERIMENTAL MODEL AND SUBJECT DETAILS
B Patient samples
B Human organoid culturing and immunomodulatory as-
says
B Peripheral blood mononuclear cell (PBMC) isolation
and immunomodulatory assays
B Animal experiments
B Murine organoid culturing and immunomodulatory as-
says
d METHOD DETAILS
B Measurement of immunomodulatory activities
B Bacterial strains, culture conditions and analyses
B Analytical fractionation of NF-kB suppressive extract
B Production of bone-marrow derived macrophages and
immunomodulatory assays
B Nuclear translocation immunofluorescence assays
d QUANTIFICATION AND STATISTICAL ANALYSIS
B Bacterial genetics comparative analyses
SUPPLEMENTAL INFORMATION
Supplemental information can be found online at https://doi.org/10.1016/j.
celrep.2022.110646.
Elution profiles after semi-preparative HPLC fractionation of the EtOAc extract
black dashed boxes, and the red dashed box represents the NF-kB suppre
The presence of the suppressive activity after EtOAc extraction in the various
Effects of active fractions 13 and 14 on pro-inflammatory chemokines/cytokin
2 biological independent experiments with technical triplicates for cell based
Cell Reports 39, 110646, April 12, 2022
ACKNOWLEDGMENTS
Weare grateful to all members of Inflammatory Bowel Disease group,Morrison
lab, and Hasnain lab for their valuable comments and advice. We used sam-
ples from the Mater IBD Biobank. We also acknowledge the technical service
provided by TRI BRF, histology, and microscopy core facilities. This research
was supported via funds provided by the University of Queensland (UQ) Fac-
ulty of Medicine (M.M., J.B., and P.O.C.), Diamantina Institute (M.M.) and
Mater Foundation (J.B.), UQ Research Training Program andMater Frank Clair
Scholarship (R.G.), UQ Institute for Molecular Bioscience (S.K. andR.K.C.), UQ
Reginald Ferguson Fellowship in Gastroenterology (P.O.C., J.B.), and The
Department of Defence. The Translational Research Institute is supported by
a grant from the Australian Government.
AUTHOR CONTRIBUTIONS
Conceptualization, R.G., R.J.C., M.M., T.H.F., M.A.M., P.O.C., and J.B.; Meth-
odology, R.G., S.K., A.A.S., A.-S.B., R.T., V.S., M.M., R.J.C., P.O.C., and J.B.;
Investigation, R.G., P.O.C., S.K., A.A.S., A.-S.B., V.S., E.C.H., M.M., R.J.C.,
and J.B.; Resources, R.T., T.H.F., P.O.C., M.M., R.J.C., M.A.M., and J.B.;
Visualization, R.G., P.O.C., S.K., E.C.H., and J.B.; Data Curation, R.G.,
E.C.H., S.K., A.A.S., A.-S.B., M.M., R.J.C., P.O.C., and J.B.; Funding Acquisi-
tion, R.G., J.B., P.O.C., M.M., and R.J.C.; Project Administration, V.S., J.B.,
and P.O.C.; Supervision, J.B., P.O.C., M.M., and R.J.C.; Writing – Original
Draft, R.G., P.O.C., and J.B.; Writing – Review & Editing, R.G., P.O.C., S.K.,
A.A.S., A.-S.B., V.S., E.C.H., T.H.F., R.T., M.M., R.J.C., M.A.M., and J.B.
DECLARATION OF INTERESTS
The authors declare no competing interests.
Received: May 9, 2021
Revised: January 24, 2022
Accepted: March 16, 2022
Published: April 12, 2022
SUPPORTING CITATIONS
The following references appear in the Supplemental information: Gulhane
et al. (2016); Hasnain et al. (2014); Heazlewood et al. (2008); Maudet et al.
(2014).
REFERENCES
Atarashi, K., Tanoue, T., Oshima, K., Suda, W., Nagano, Y., Nishikawa, H., Fu-
kuda, S., Saito, T., Narushima, S., Hase, K., et al. (2013). Treg induction by a
rationally selectedmixture of Clostridia strains from the humanmicrobiota. Na-
ture 500, 232–236.
Atarashi, K., Tanoue, T., Shima, T., Imaoka, A., Kuwahara, T., Momose, Y.,
Cheng, G., Yamasaki, S., Saito, T., Ohba, Y., et al. (2011). Induction of colonic
regulatory T cells by indigenous Clostridium species. Science 331, 337–341.
Bankevich, A., Nurk, S., Antipov, D., Gurevich, A.A., Dvorkin, M., Kulikov, A.S.,
Lesin, V.M., Nikolenko, S.I., Pham, S., Prjibelski, A.D., et al. (2012). SPAdes: a
new genome assembly algorithm and its applications to single-cell
sequencing. J. Comput. Biol. 19, 455–477.
Barber, G.E., Yajnik, V., Khalili, H., Giallourakis, C., Garber, J., Xavier, R., and
Ananthakrishnan, A.N. (2016). Genetic markers predict primary non-response
of C. bolteae AHG0001 cultured in MCM. The collected fractions are indicated
ssive fractions.
fractions was determined using the LS174T reporter cell assay.
es. Cells were stimulated for 6 h and analyzed using qRT-PCR.
assays.
Articlell
OPEN ACCESS
and durable response to anti-TNF biologic therapies in Crohn’s disease. Am. J.
Gastroenterol. 111, 1816–1822.
Cohen, L.J., Esterhazy, D., Kim, S.H., Lemetre, C., Aguilar, R.R., Gordon, E.A.,
Pickard, A.J., Cross, J.R., Emiliano, A.B., Han, S.M., et al. (2017). Commensal
bacteria make GPCR ligands that mimic human signalling molecules. Nature
549, 48–53.
Cohen, L.J., Kang, H.S., Chu, J., Huang, Y.H., Gordon, E.A., Reddy, B.V.,
Ternei, M.A., Craig, J.W., and Brady, S.F. (2015). Functional metagenomic dis-
covery of bacterial effectors in the human microbiome and isolation of com-
mendamide, a GPCR G2A/132 agonist. Proc. Natl. Acad. Sci. U S A. 112,
E4825–E4834.
Colosimo, D.A., Kohn, J.A., Luo, P.M., Piscotta, F.J., Han, S.M., Pickard, A.J.,
Rao, A., Cross, J.R., Cohen, L.J., and Brady, S.F. (2019). Mapping interactions
of microbial metabolites with human G-protein-coupled receptors. Cell Host
Microbe 26, 273–282.e7.
Costello, S.P., Soo, W., Bryant, R.V., Jairath, V., Hart, A.L., and Andrews, J.M.
(2017). Systematic review with meta-analysis: faecal microbiota transplanta-
tion for the induction of remission for active ulcerative colitis. Aliment. Pharma-
col. Ther. 46, 213–224.
Darling, A.E., Mau, B., and Perna, N.T. (2010). progressiveMauve: multiple
genome alignment with gene gain, loss and rearrangement. PLoS One 5,
e11147.
Das, I., Png, C.W., Oancea, I., Hasnain, S.Z., Lourie, R., Proctor, M., Eri, R.D.,
Sheng, Y., Crane, D.I., Florin, T.H., and McGuckin, M.A. (2013). Glucocorti-
coids alleviate intestinal ER stress by enhancing protein folding and degrada-
tion of misfolded proteins. J. Exp. Med. 210, 1201–1216.
Eeckhaut, V., Machiels, K., Perrier, C., Romero, C., Maes, S., Flahou, B.,
Steppe, M., Haesebrouck, F., Sas, B., Ducatelle, R., et al. (2012). Butyricicoc-
cus pullicaecorum in inflammatory bowel disease. Gut 62, 1745–1752.
Geva-Zatorsky, N., Sefik, E., Kua, L., Pasman, L., Tan, T.G., Ortiz-Lopez, A.,
Yanortsang, T.B., Yang, L., Jupp, R., Mathis, D., et al. (2017). Mining the hu-
man gut microbiota for immunomodulatory organisms. Cell 168, 928–943.e11.
Gulhane, M., Murray, L., Lourie, R., Tong, H., Sheng, Y.H., Wang, R., Kang, A.,
Schreiber, V., Wong, K.Y., Magor, G., et al. (2016). High fat diets induce colonic
epithelial cell stress and inflammation that is reversed by IL-22. Sci. Rep. 6,
28990.
Hasnain, S.Z., Borg, D.J., Harcourt, B.E., Tong, H., Sheng, Y.H., Ng, C.P., Das,
I., Wang, R., Chen, A.C., Loudovaris, T., et al. (2014). Glycemic control in dia-
betes is restored by therapeutic manipulation of cytokines that regulate beta
cell stress. Nat. Med. 20, 1417–1426.
Heazlewood, C.K., Cook, M.C., Eri, R., Price, G.R., Tauro, S.B., Taupin, D.,
Thornton, D.J., Png, C.W., Crockford, T.L., Cornall, R.J., et al. (2008). Aberrant
mucin assembly in mice causes endoplasmic reticulum stress and sponta-
neous inflammation resembling ulcerative colitis. PLoS Med. 5, e54.
Ismail, Y., Mahendran, V., Octavia, S., Day, A.S., Riordan, S.M., Grimm, M.C.,
Lan, R., Lemberg, D., Tran, T.A., and Zhang, L. (2012). Investigation of the
enteric pathogenic potential of oral Campylobacter concisus strains isolated
from patients with inflammatory bowel disease. PLoS One 7, e38217.
Junker, L.M., and Clardy, J. (2007). High-throughput screens for small-mole-
cule inhibitors of Pseudomonas aeruginosa biofilm development. Antimicrob.
Agents Chemother. 51, 3582–3590.
Kabat, A.M., Srinivasan, N., and Maloy, K.J. (2014). Modulation of immune
development and function by intestinal microbiota. Trends Immunol. 35,
507–517.
Kaci, G., Lakhdari, O., Dore, J., Ehrlich, S.D., Renault, P., Blottiere, H.M., and
Delorme, C. (2011). Inhibition of the NF-kappaB pathway in human intestinal
epithelial cells by commensal Streptococcus salivarius. Appl. Environ. Micro-
biol. 77, 4681–4684.
Kumar, S., Stecher, G., Li, M., Knyaz, C., and Tamura, K. (2018). MEGA X: mo-
lecular evolutionary genetics analysis across computing platforms. Mol. Biol.
Evol. 35, 1547–1549.
Lakhdari, O., Tap, J., Beguet-Crespel, F., Le Roux, K., de Wouters, T., Cul-
trone, A., Nepelska, M., Lefevre, F., Dore, J., and Blottiere, H.M. (2011). Iden-
tification of NF-kB modulation capabilities within human intestinal commensal
bacteria. J. Biomed. Biotechnol. 2011, 282356.
Mahendran, V., Tan, Y.S., Riordan, S.M., Grimm, M.C., Day, A.S., Lemberg,
D.A., Octavia, S., Lan, R., and Zhang, L. (2013). The prevalence and polymor-
phisms of zonula occluden toxin gene in multiple Campylobacter concisus
strains isolated from saliva of patients with inflammatory bowel disease and
controls. PLoS One 8, e75525.
Malo, N., Hanley, J.A., Cerquozzi, S., Pelletier, J., and Nadon, R. (2006). Sta-
tistical practice in high-throughput screening data analysis. Nat. Biotechnol.
24, 167–175.
Martın, R., Miquel, S., Benevides, L., Bridonneau, C., Robert, V., Hudault, S.,
Chain, F., Berteau, O., Azevedo, V., Chatel, J.M., et al. (2017). Functional char-
acterization of novel Faecalibacterium prausnitzii strains isolated from healthy
volunteers: a step forward in the use of F. prausnitzii as a next-generation pro-
biotic. Front. Microbiol. 8, 1226.
Maudet, C., Mano, M., Sunkavalli, U., Sharan, M., Giacca, M., Forstner, K.U.,
and Eulalio, A. (2014). Functional high-throughput screening identifies themiR-
15 microRNA family as cellular restriction factors for Salmonella infection. Nat.
Commun. 5, 4718.
Mazmanian, S.K., Round, J.L., and Kasper, D.L. (2008). A microbial symbiosis
factor prevents intestinal inflammatory disease. Nature 453, 620–625.
McSweeney, C.S., Denman, S.E., and Mackie, R.I. (2005). Rumen bacteria. In
Methods in Gut Microbial Ecology for Ruminants, H.P.S. Makkar and C.S.
McSweeney, eds. (Springer), pp. 23–37.
Medema, M.H., Takano, E., and Breitling, R. (2013). Detecting sequence ho-
mology at the gene cluster level with MultiGeneBlast. Mol. Biol. Evol. 30,
1218–1223.
Niess, J.H., Klaus, J., Stephani, J., Pfl€uger, C., Degenkolb, N., Spaniol, U.,
Mayer, B., Lahr, G., and von Boyen, G.B. (2012). NOD2 polymorphism predicts
response to treatment in Crohn’s disease–first steps to a personalized therapy.
Dig. Dis. Sci. 57, 879–886.
O Cuıv, P., Aguirre de Carcer, D., Jones, M., Klaassens, E., Worthley, D.L.,
Whitehall, V.L.J., Kang, S., McSweeney, C.S., Leggett, B.A., and Morrison,
M. (2011). The effects from DNA extraction methods on the evaluation of mi-
crobial diversity associated with human colonic tissue. Microb. Ecol. 61,
353–362.
O Cuıv, P., de Wouters, T., Giri, R., Mondot, S., Smith, W.J., Blottiere, H.M.,
Begun, J., and Morrison, M. (2017). The gut bacterium and pathobiont Bacter-
oides vulgatus activates NF-kB in a human gut epithelial cell line in a strain and
growth phase dependent manner. Anaerobe 47, 209–217.
O Cuıv, P., Giri, R., Hoedt, E.C., McGuckin, M.A., Begun, J., and Morrison, M.
(2018). Enterococcus faecalis AHG0090 is a genetically tractable bacterium
and produces a secreted peptidic bioactive that suppresses nuclear factor
Kappa B activation in human gut epithelial cells. Front. Immunol. 9, 790.
O Cuıv, P., Smith, W.J., Pottenger, S., Burman, S., Shanahan, E.R., and Mor-
rison, M. (2015). Isolation of genetically tractable most-wanted bacteria by
metaparental mating. Sci. Rep. 5, 13282.
Oancea, I., Movva, R., Das, I., Aguirre de Carcer, D., Schreiber, V., Yang, Y.,
Purdon, A., Harrington, B., Proctor, M., Wang, R., et al. (2017). Colonic micro-
biota can promote rapid local improvement of murine colitis by thioguanine
independently of T lymphocytes and host metabolism. Gut 66, 59–69.
Parks, D.H., Chuvochina, M., Waite, D.W., Rinke, C., Skarshewski, A., Chau-
meil, P.A., and Hugenholtz, P. (2018). A standardized bacterial taxonomy
based on genome phylogeny substantially revises the tree of life. Nat. Bio-
technol. 36, 996–1004.
Parks, D.H., Imelfort, M., Skennerton, C.T., Hugenholtz, P., Tyson, G.W., et al.
(2015). CheckM: assessing the quality of microbial genomes recovered from
isolates, single cells, and metagenomes. Genome Res 25, 1043–1055.
Peterson, L.W., and Artis, D. (2014). Intestinal epithelial cells: regulators of bar-
rier function and immune homeostasis. Nat. Rev. Immunol. 14, 141–153.
Quast, C., Pruesse, E., Yilmaz, P., Gerken, J., Schweer, T., Yarza, P., Peplies,
J., and Glockner, F.O. (2013). The SILVA ribosomal RNA gene database
Cell Reports 39, 110646, April 12, 2022 13

Articlell
OPEN ACCESS
project: improved data processing and web-based tools. Nucleic Acids Res.
41, D590–D596.
Quevrain, E., Maubert, M.A., Michon, C., Chain, F., Marquant, R., Tailhades, J.,
Miquel, S., Carlier, L., Bermudez-Humaran, L.G., Pigneur, B., et al. (2016).
Identification of an anti-inflammatory protein from Faecalibacterium prausnit-
zii, a commensal bacterium deficient in Crohn’s disease. Gut 65, 415–425.
Renner, F., and Schmitz, M.L. (2009). Autoregulatory feedback loops terminat-
ing the NF-kappaB response. Trends Biochem. Sci. 34, 128–135.
Rogler, G., Brand, K., Vogl, D., Page, S., Hofmeister, R., Andus, T., Knuechel,
R., Baeuerle, P.A., Scholmerich, J., and Gross, V. (1998). Nuclear factor kap-
paB is activated in macrophages and epithelial cells of inflamed intestinal mu-
cosa. Gastroenterology 115, 357–369.
Sokol, H., Pigneur, B., Watterlot, L., Lakhdari, O., Bermudez-Humaran, L.G.,
Gratadoux, J.J., Blugeon, S., Bridonneau, C., Furet, J.P., Corthier, G., et al.
(2008). Faecalibacterium prausnitzii is an anti-inflammatory commensal bacte-
rium identified by gutmicrobiota analysis of Crohn disease patients. Proc. Natl.
Acad. Sci. U S A. 105, 16731–16736.
Takeshita, K., Mizuno, S., Mikami, Y., Sujino, T., Saigusa, K., Matsuoka, K.,
Naganuma, M., Sato, T., Takada, T., Tsuji, H., et al. (2016). A single species
of Clostridium subcluster XIVa decreased in ulcerative colitis patients. In-
flamm. Bowel Dis. 22, 2802–2810.
Turner, D., Ricciuto, A., Lewis, A., D’Amico, F., Dhaliwal, J., Griffiths, A.M., Bet-
tenworth, D., Sandborn, W.J., Sands, B.E., Reinisch, W., et al. (2021). STRIDE-
II: an update on the selecting therapeutic targets in inflammatory bowel
disease (STRIDE) initiative of the international organization for the study of
IBD (IOIBD): determining therapeutic goals for treat-to-target strategies in
IBD. Gastroenterology 160, 1570–1583.
14 Cell Reports 39, 110646, April 12, 2022
Vergnolle, N. (2016). Protease inhibition as new therapeutic strategy for GI dis-
eases. Gut 65, 1215–1224.
Wang, R., Hasnain, S.Z., Tong, H., Das, I., Che-Hao Chen, A., Oancea, I., Proc-
tor, M., Florin, T.H., Eri, R.D., and McGuckin, M.A. (2015). Neutralizing IL-23 is
superior to blocking IL-17 in suppressing intestinal inflammation in a sponta-
neous murine colitis model. Inflamm. Bowel Dis. 21, 973–984.
Weber, T., Blin, K., Duddela, S., Krug, D., Kim, H.U., Bruccoleri, R., Lee, S.Y.,
Fischbach, M.A., M€uller, R., Wohlleben, W., et al. (2015). antiSMASH 3.0-a
comprehensive resource for the genome mining of biosynthetic gene clusters.
Nucleic Acids Res. 43, W237–W243.
Wilson, B.C., Vatanen, T., Cutfield, W.S., and O’Sullivan, J.M. (2019). The su-
per-donor phenomenon in fecal microbiota transplantation. Front. Cell Infect.
Microbiol. 9, 2.
Wlodarska, M., Luo, C., Kolde, R., d’Hennezel, E., Annand, J.W., Heim, C.E.,
Krastel, P., Schmitt, E.K., Omar, A.S., Creasey, E.A., et al. (2017). Indoleacrylic
acid produced by commensal peptostreptococcus species suppresses
inflammation. Cell Host Microbe 22, 25–37.e6.
Wullaert, A., Bonnet, M.C., and Pasparakis, M. (2011). NF-kB in the regulation
of epithelial homeostasis and inflammation. Cell Res. 21, 146–158.
Zaidi, D., and Wine, E. (2018). Regulation of nuclear factor Kappa-light-chain-
enhancer of activated B cells (NF-kb) in inflammatory bowel diseases. Front.
Pediatr. 6, 317.
Zhang, J.H., Chung, T.D., and Oldenburg, K.R. (1999). A simple statistical
parameter for use in evaluation and validation of high throughput screening as-
says. J. Biomol. Screen 4, 67–73.
Articlell
OPEN ACCESS
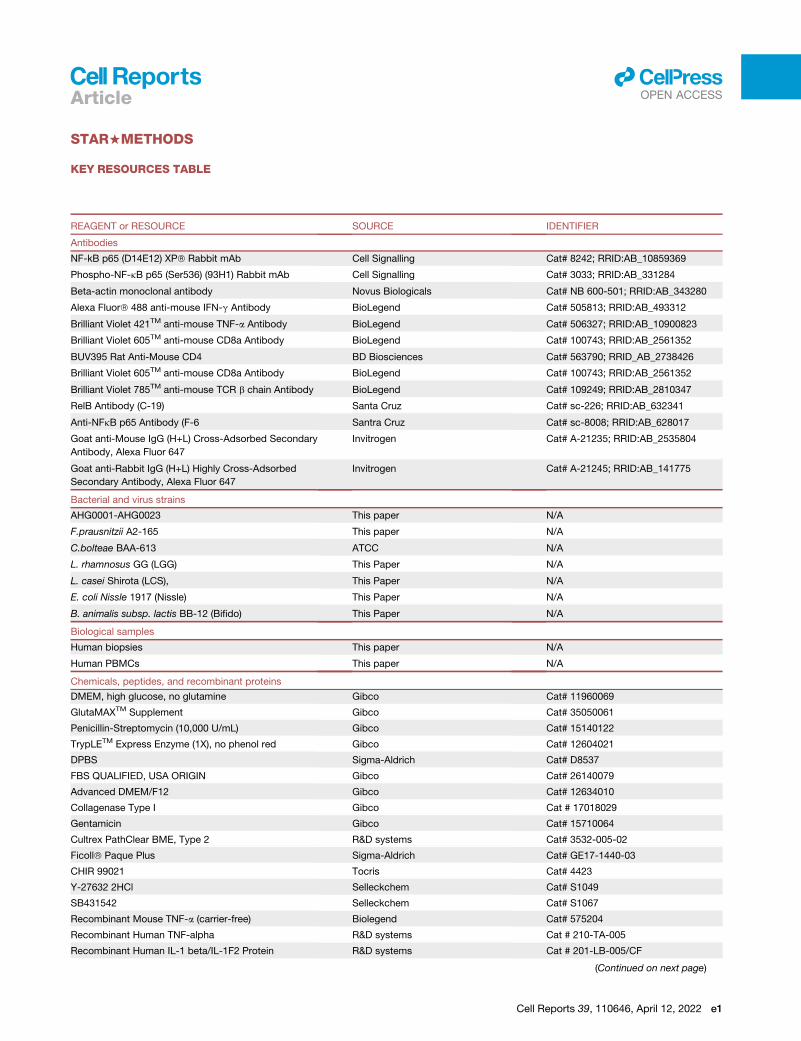
STAR+METHODS
KEY RESOURCES TABLE
REAGENT or RESOURCE SOURCE IDENTIFIER
Antibodies
NF-kB p65 (D14E12) XP� Rabbit mAb Cell Signalling Cat# 8242; RRID:AB_10859369
Phospho-NF-kB p65 (Ser536) (93H1) Rabbit mAb Cell Signalling Cat# 3033; RRID:AB_331284
Beta-actin monoclonal antibody Novus Biologicals Cat# NB 600-501; RRID:AB_343280
Alexa Fluor� 488 anti-mouse IFN-g Antibody BioLegend Cat# 505813; RRID:AB_493312
Brilliant Violet 421TM anti-mouse TNF-a Antibody BioLegend Cat# 506327; RRID:AB_10900823
Brilliant Violet 605TM anti-mouse CD8a Antibody BioLegend Cat# 100743; RRID:AB_2561352
BUV395 Rat Anti-Mouse CD4 BD Biosciences Cat# 563790; RRID_AB_2738426
Brilliant Violet 605TM anti-mouse CD8a Antibody BioLegend Cat# 100743; RRID:AB_2561352
Brilliant Violet 785TM anti-mouse TCR b chain Antibody BioLegend Cat# 109249; RRID:AB_2810347
RelB Antibody (C-19) Santa Cruz Cat# sc-226; RRID:AB_632341
Anti-NFkB p65 Antibody (F-6 Santra Cruz Cat# sc-8008; RRID:AB_628017
Goat anti-Mouse IgG (H+L) Cross-Adsorbed Secondary
Antibody, Alexa Fluor 647
Invitrogen Cat# A-21235; RRID:AB_2535804
Goat anti-Rabbit IgG (H+L) Highly Cross-Adsorbed
Secondary Antibody, Alexa Fluor 647
Invitrogen Cat# A-21245; RRID:AB_141775
Bacterial and virus strains
AHG0001-AHG0023 This paper N/A
F.prausnitzii A2-165 This paper N/A
C.bolteae BAA-613 ATCC N/A
L. rhamnosus GG (LGG) This Paper N/A
L. casei Shirota (LCS), This Paper N/A
E. coli Nissle 1917 (Nissle) This Paper N/A
B. animalis subsp. lactis BB-12 (Bifido) This Paper N/A
Biological samples
Human biopsies This paper N/A
Human PBMCs This paper N/A
Chemicals, peptides, and recombinant proteins
DMEM, high glucose, no glutamine Gibco Cat# 11960069
GlutaMAXTM Supplement Gibco Cat# 35050061
Penicillin-Streptomycin (10,000 U/mL) Gibco Cat# 15140122
TrypLETM Express Enzyme (1X), no phenol red Gibco Cat# 12604021
DPBS Sigma-Aldrich Cat# D8537
FBS QUALIFIED, USA ORIGIN Gibco Cat# 26140079
Advanced DMEM/F12 Gibco Cat# 12634010
Collagenase Type I Gibco Cat # 17018029
Gentamicin Gibco Cat# 15710064
Cultrex PathClear BME, Type 2 R&D systems Cat# 3532-005-02
Ficoll� Paque Plus Sigma-Aldrich Cat# GE17-1440-03
CHIR 99021 Tocris Cat# 4423
Y-27632 2HCl Selleckchem Cat# S1049
SB431542 Selleckchem Cat# S1067
Recombinant Mouse TNF-a (carrier-free) Biolegend Cat# 575204
Recombinant Human TNF-alpha R&D systems Cat # 210-TA-005
Recombinant Human IL-1 beta/IL-1F2 Protein R&D systems Cat # 201-LB-005/CF
(Continued on next page)
Cell Reports 39, 110646, April 12, 2022 e1
Continued
REAGENT or RESOURCE SOURCE IDENTIFIER
Indole-3-carbinol Sigma-Aldrich Cat # I7256
Confix NBF Conc.x5 Purple (Formalin) Australian Biostain Cat# ACFP.5L
TRIzolTM Reagent Invitrogen Cat# 15596018
SensiFAST SYBR Lo-Rox Kit Bioline Cat# BIO-94050
EDTA disodium salt dihydrate Sigma-Aldrich Cat# E5134
LPS-SM Ultrapure Invivogen Cat# tlrl-smlps
Lab-Lemco Oxoid Cat# LP0029; CAS: 91079-38-8
Peptone Oxoid Cat# LP0049; CAS: 93394-33-9
Yeast extract Sigma-Aldrich Cat# LP0021B; CAS: 801 3-01-2
Cysteine-HCL Sigma-Aldrich Cat# C7477; CAS: 52-89-1
Resazurin sodium salt Sigma-Aldrich Cat# 195481; CAS: 62758-13-8
Sodium Bicarbonate Sigma-Aldrich Cat# S6014; CAS: 144-55-8
Starch Sigma-Aldrich Cat# S9765; CAS: 9005-84-9
Glucose CSA Scientific Cat# GA018; CAS: 50-99-7
BHI Oxoid Cat# CM1135
Proteinase K solution Invitrogen Cat# 25530049
Critical commercial assays
ELISA MAXTM Standard Set Human IL-8 Biolegend Cat# 431501
PierceTM Firefly Luc One-Step Glow Assay Kit Thermo Scientific Cat# 16197
CytoTox 96� Non-Radioactive Cytotoxicity Assay Promega Cat# G1780
ISOLATE II RNA Mini Kit Bioline Cat# 52073
SensiFAST cDNA Synthesis Kit Bioline Cat# 65054
R&D Systems Mouse IL-6 Duo Set ELISA, 5 Plate,
Per Set
R&D systems Cat# DY40605
R&D Systems Mouse CXCL2/MIP-2 DuoSet ELISA,
5 Plate, Per Set
R&D systems Cat# DY45205
Deposited data
Whole genome of isolates DDBJ/EMBL/GenBank QYRW00000000
Whole genome of isolates DDBJ/EMBL/GenBank QYRX00000000
Whole genome of isolates DDBJ/EMBL/GenBank QYRY00000000
Whole genome of isolates DDBJ/EMBL/GenBank QYRZ00000000
Experimental models: Cell lines
L-WRN cells Kind gift from Prof Thaddeus
Stappenbeck
LS174T ATCC Cat# CL-188
Caco-2 ATCC Cat# HTB-37
L929 Kind gift from Prof Antje Blumenthal
LCLs Kind gift from Prof Maher Gandhi
Experimental models: Organisms/strains
Mouse: C57BL/6 ARC
Winnie In house
Oligonucleotides
Primers for mouse and human genes, see Table S2 This Paper N/A
Software and algorithms
SILVA
MEGAX
Cytoscape v. 3.8.2 https://cytoscape.org/
Graphpad Prism v 8.0.1 GraphPad www.graphpad.com
Other
Graphical Abstract Created with BioRender.com https://biorender.com/
e2 Cell Reports 39, 110646, April 12, 2022
Articlell
OPEN ACCESS

Articlell
OPEN ACCESS
RESOURCE AVAILABILITY
Lead contactFurther information and requests for resources and reagents should be directed to and will be fulfilled by the lead contact, A/Prof
Jakob Begun ([email protected]).
Materials availabilityThis study didn’t generate new unique reagents.
Data and code availabilityd Genome of the isolates have been deposited atDDBJ/EMBL/GenBank and accession numbers are listed in the key resources
table.
d This paper does not report original code.
d Any additional information required to reanalyse the data reported in this paper is available from the lead contact upon request
EXPERIMENTAL MODEL AND SUBJECT DETAILS
Patient samplesAll patient samples were collected in accordance with the recommendations of the Mater Health Services Human Research Ethics
Committee (HREC 2016001782 & HREC/14/MHS/125) for the Mater Inflammatory Bowel Disease Biobank.
Human organoid culturing and immunomodulatory assaysColonic biopsies (6 3 3 mm pinch biopsies) were collected from n (n = 6), CD (n = 5) and UC (n = 5) patients (Table S1). The colonic
biopsies were processed and cultured as previously described. Briefly, the biopsies were washed with PBS and digested with colla-
genase type I (2 mg.ml�1) supplemented with gentamicin (50 mg.ml�1) for 15-20 minutes at 37�C. The isolated crypts were washed
with DMEM/F12 medium and centrifuged at 50 x g for 5 mins at 4�C. The pellets were then suspended in Basement Membrane
Extract (BME, Invitrogen) in a 1:1 ratio. Then, 20 ml of the mixture was plated in a 24 well tissue culture plate and cultured in 50%
L-WRN conditioned medium. The crypts were expanded by serial culture until sufficient numbers were obtained for experimentation.
To assess the ability of the CS to suppress IL-8 secretion the organoids were seeded in a 48 well plate and grown for 48 hours. Then,
organoids were treated with 10% v/v of select CS in 50% L-WRN conditioned medium for 30 min and subsequently stimulated with
rhIL-1b (50 ng.ml�1) for 24 hours before quantifying IL-8 in the supernatant. Cytotoxicity was assessed using the CytoTox 96� Non-
Radioactive Cytotoxicity Assay.
Peripheral blood mononuclear cell (PBMC) isolation and immunomodulatory assaysHuman peripheral blood was obtained from healthy controls and patients with CD and UC (n = 6 each) from the Mater Inflammatory
Bowel Disease biobank. PBMCs were isolated by Ficoll gradient density centrifugation. Briefly, 20 ml of freshly drawn blood was
diluted in phosphate buffered saline (1:2) and well mixed. The diluted blood was then carefully layered over Ficoll paque. The tubes
were centrifuged without brakes at 400 g for 20minutes at 20�C. The interphase containingmononuclear cells were transferred into a
new tube and washed twice in PBS. Prepared cells were stored in liquid nitrogen until required. For the treatments, 500,000 cells per
well were plated on a 96-well plate and treated with 10% v/v of CS in RPMI medium for 30 minutes, followed by stimulation with
rhTNFa (50 ng/ml). IL-8 secretion and cytotoxicity was assessed as previously described.
Animal experimentsAll animal experiments were approved by the University of Queensland Animal Ethics Committee.Winniemice were bred in-house in
a pathogen-free animal facility. 6 weeks old male and female mice were intrarectally gavaged with 50 ml of CS from C. bolteae
AHG0001 and ATCC BAA-613 for 14 days. MCMmedium processed in the same manner as the CS was used as the vehicle control.
Disease activity was assessed using established protocols. Briefly, the body weights of the mice as well as diarrhoea and rectal
bleeding were monitored and recorded daily. Diarrhoea scoring was interpreted as follows: 0 = no diarrhoea, solid stool; 0.5 =
very mild diarrhoea, moist but formed stool; 1 = mild diarrhoea, formed but easily bisected by pressure applied with pipette tips;
1.5 = diarrhoea, no fully formed stools, and; 2 = severe, watery diarrhoea with minimal solid present. For histology scoring, the whole
colon was rolled, fixed in 10% neutral buffered formalin, and paraffin embedded and sectioned and stained with Haematoxylin and
Eosin (H&E) and Alcian blue. Blind assessment of histologic inflammation (increased leukocyte infiltration, neutrophil counts, deple-
tion of goblet cells, crypt abscesses, aberrant crypt architecture, increased crypt length, and epithelial cell damage and ulceration) for
proximal, mid, and distal colonwas performed as previously described. To quantify in vivo gene expression, the distal colonwas snap
frozen and homogenised in TRIzol. RNA was extracted using the Bioline RNA extraction kit according to manufacturer’s instructions.
RNA concentration was measured using a Nanodrop 1000 spectrophotometer, followed by cDNA synthesis using 1 mg of RNA and
the iScript cDNA synthesis kit (BioRad). The expression of genes of interest (Table S2) were analysed using quantitative real time PCR
Cell Reports 39, 110646, April 12, 2022 e3

Articlell
OPEN ACCESS
(qrt-PCR) according to the manufacturer’s instructions. Ct values were generated, and relative quantitation was determined by the
DCt method.
Murine organoid culturing and immunomodulatory assaysColonic tissues fromC57BL/6 andWinnie mice (n = 2) were segmented and the crypts were isolated and cultured. Briefly, the tissues
were segmented and washed with PBS, followed by EDTA (8 mM) digestion for 1 hour at 4�C and further digested with collagenase
type I (2 mg.ml�1) (Thermo Fisher Scientific) supplemented with gentamicin (50 mg.ml�1) for 15-20 minutes at 37�C. The isolated
crypts were washed with complete F12 medium (Identical to complete media except DMEM/F12 was used instead of DMEM)
and centrifuged at 50 x g for 5 mins at 4�C. The pellets were then suspended in BME in a 1:1 ratio. Then, 20 ml of the mixture was
plated in a 24 well tissue culture plate and cultured in 50% L-WRN conditioned medium. The crypts were expanded by serial culture
until sufficient numbers were obtained for experimentation. For the treatments, the organoids were first seeded in a 24 well plate and
grown for 48 hours. The organoids were then pre-treated with 10% v/v of select CS for 30 mins and then stimulated with 50 ng/ml
mIL-1b for 6 hours. The cells were lysed and used for mRNA expression.
For explants, colonic tissue from 8 -weeks old Winnie mice were cultured in DMEM complete media with 10% v/v CS and medium
control for 6 hours. Tissues were then lysed and used for mRNA expression.
METHOD DETAILS
Measurement of immunomodulatory activitiesThe LS174T-NF-kBluc or Caco-2-NF-kBluc reporter cell lines were adapted for high-throughput screening using the criterion
defined by Zhang et al. (Zhang et al., 1999), where a Z factor R0.5 represents an excellent assay, thereby providing a sensitive
and specific approach to assess the NF-kB suppressive capacity of the isolates. The Z factor for each assay was determined
and only assays achieving a Z factor R0.5 were processed for further analysis. The high-throughput assays were performed in
96-well microtiter plates as previously described(O Cuıv et al., 2018) except that the LS174T reporter cells were stimulated with
50 ng.ml�1 TNFa and the Caco-2 cell lines were treated with 7.5% v/v CS in complete DMEM medium. NF-kB driven luciferase
expression was assessed using the PierceTM Firefly Luc One-Step Glow Assay Kit (ThermoFisher Scientific) according to the
manufacturer’s instructions. The NF-kB suppressive isolates were scored and ranked on their Z-score(Junker and Clardy,
2007; Malo et al., 2006).
Bacterial strains, culture conditions and analysesAnaerobic Firmicutes affiliated bacteria were cultured in anoxic MCM (Lab-Lemco 10 g.L�1, Peptone P 10 g.L�1, Yeast extract 3
g.L�1, Glucose 5 g.L�1, Starch 2 g.L�1, Sodium chloride 5 g.L�1, Sodium bicarbonate 15 g.L�1, Resazurin 1 mg.L�1, Cysteine-
HCl 1 g.L�1) or BHI supplemented with salt solutions 2 and 3(McSweeney et al., 2005). F. prausnitzii A2-165 was grown as previously
described(O Cuıv et al., 2018). A Coy vinyl anaerobic chamber with an anoxic atmosphere (85% N2:10% CO2:5% H2) was used to
process the anaerobic Firmicutes cultures. Bacterial cultures were incubated at 37�C for up to 48 hours. Bacterial growth was
measured by spectrophotometry (OD600nm) using a SPECTRONIC 20D + Spectrophotometer (ThermoFisher, Sydney).
Analytical fractionation of NF-kB suppressive extractAn EtOAc extract (3 mg) of C. bolteae AHG0001 cultivated on MCM medium was subjected to analytical HPLC (Agilent Zorbax SB-
C8, 5 mm, 4.6 mm 3 150 mm column, gradient elution at 1 mL/min from 10% MeCN/ H2O to 100% MeCN over 15 min followed by
2 min wash with 100% MeCN, without TFA modifier) to yield 17 fractions. Only fractions 14-17 demonstrated an ability to suppress
NF-kB activity.
Production of bone-marrow derived macrophages and immunomodulatory assaysBone marrow was isolated from the femurs and tibias of C57BL/6 mice (6 weeks old). Briefly, bone marrow was grown for 7 days at
37�C in macrophage differentiation medium (10% FBS, 1% L-Glutamine, 1% sodium pyruvate, 1% HEPES in DMEM) containing
20% L929-conditioned medium. On day 7, the cells lifted with ice-cold EDTA (1 mM) in PBS, replated, and stimulated with 10ug/
ml LPS in the presence of select CS (10% v/v) for 24 hours. IL-6 and MIP-2 level was quantified using ELISA (R&D).
Nuclear translocation immunofluorescence assaysA 12-well plate was seeded with 20,000 LS174T cells per well on glass coverslips and cultured overnight at 37�C. Cell-free super-
natants harvested from isolates were added (10% v/v) to the cells for 30 minutes and then stimulated with 25 ng/ml rhTNF-a for 1
hour. Cells were fixed with 4% paraformaldehyde for 15 min at 4�C followed by permeabilisation using 0.1% Triton X-100 for
15mins. Cells were then stained withmouse anti-NF-kB p65 antibody (santa-cruz) for 1 hour, followed by Alexa Fluor 594 anti-mouse
secondary antibody. The cells were mounted onto glass slides using Fluoroshield with DAPI (Sigma-Aldrich) and visualised using an
Olympus Confocal Microscope at 60x magnification.
e4 Cell Reports 39, 110646, April 12, 2022
Articlell
OPEN ACCESS
For LCLs, 100,000 cells were seeded and stimulated with CS for 30mins. Cells were fixed and permealised as above and stained
with mouse anti-RelB antibody (santa-cruz) for 1 hour, followed by appropriate secondary antibody. Cells were stained mounted on
slides using cytospin and stained with DAPI and visualised at 60 x magnification.
PMA/ionomycin stimulation of spleenocytes
Spleens were mechanically passed through 70 mmcell strainer and resuspended in FACS buffer ((2% FBS,0.5 mMEDTA in PBS) and
centrifuged at 1400 rpm for 6 mins. Cell pellets were then lysed with ACK lysis buffer for 1 min at room temperature. Cells were
counted and 1x 10⁵ cells resuspended in complete media (RPMI supplemented with 10% FBS, 1% PS and 1% sodium pyruvate)
and plated in 96-well plate. Cells were stimulated with 10 ng/ml PMA and 250 ng/ml ionomycin in the presence of Brefeldin A for
4 hours at 37�C.Flow cytometry
Single cell suspensions were incubated with live/dead Fixable aqua for 10mins at room temperature. Cells were then incubated with
50 ml of a cocktail of antibodies reactive against surfacemolecules for 30min. For intra-cellular staining, cells were washed, fixed, and
permealised with eBioscience FoxP3/Transcription Factor staining buffer kit and stained with 50 ml of a cocktail of antibodies reactive
against intracellular molecules for 30mins at room temperature. Samples were acquitted on a BD LSRFortesa and analysed on
FlowJO Version 10.
QUANTIFICATION AND STATISTICAL ANALYSIS
Statistical analysis for each figures was preformed using Graphpad Prism V8.01. Details of the statistical tests and methodology for
quantification are provided in the figure legends.
Bacterial genetics comparative analysesPhylogenetic trees were constructed by aligning the 16S rRNA gene sequences using the SILVA database(Quast et al., 2013) and the
alignment was then imported into MEGAX(Kumar et al., 2018). The alignment was refined, and a maximum-likelihood phylogenetic
tree constructed displaying the isolate and select reference sequences. The stability of the maximum-likelihood tree was evaluated
by 1000 bootstrap replications and Kimura 2-parameter modelling. Where necessary, select isolates were subject to whole cell
protein profiling to determine intraspecies variations(Ismail et al., 2012; Mahendran et al., 2013). High molecular weight DNA was
prepared as previously described(O Cuıv et al., 2011). The SPAdes assembler v 3.11.0 was used to quality check, filter, and then
de novo assemble the sequence data(Bankevich et al., 2012). CheckM(Parks et al., 2015) was used to evaluate the genome
sequencing quality by estimating the completeness and contamination based on the phylogenetic assignment of a broad set of
marker genes. The C. bolteae AHG0001, C. citroniae AHG0002, C. aldenense AHG0011 and E. limosum AHG0017 contigs were
ordered using Mauve(Darling et al., 2010) with the C. bolteae ATCC BAA-613, C. citroniae WAL-17108, Clostridiales bacterium
1_7_47FAA and E. limosum ATCC 8486 genome sequences respectively as references. Genome based phylogeny was determined
using GTDB(Parks et al., 2018) as previously described(O Cuıv et al., 2018). Candidate BGC were identified using the antiSMASH
webserver(Weber et al., 2015) with the ClusterFinder Detection Strictness settings set to ‘‘loose’’ and the Extra Features turned
on. Similar candidate BGC were identified in select genomes or the Genbank Database using MultiGeneBlast(Medema et al.,
2013) in homology search mode. BGCs were considered highly conserved if (i) R80% of the genes in an C. bolteae AHG0001
BGC were conserved in C. bolteae ATCC BAA-613, with genes defined as being conserved if the query exhibited R80% sequence
identity overR80%of the query length, and; (ii)R 70%of the potential syntenic genes in aC. bolteaeAHG0001 BGCwere conserved
in a C. bolteae ATCC BAA-613 BGC (calculated as ((MultiGeneBlast Total score – No. of Blast hits)/0.5)/(No. of syntenic genes in
C. bolteae AHG0001 BGC)). BGC were considered partially conserved if R 40% of both the genes and potential syntenic genes
were conserved.
Normalization of IL-8 expression for PBMCs and organoids
The absorbance readings recorded for IL-8 ELISA expression for each condition were subtracted from the cells only control. The
absorbance values were normalized using the IL- 1b control and converted to percentage.
Cell Reports 39, 110646, April 12, 2022 e5

Cell Reports, Volume 39
Supplemental information
Secreted NF-kB suppressive microbial
metabolites modulate gut inflammation
Rabina Giri, Emily C. Hoedt, Shamsunnahar Khushi, Angela A. Salim, Anne-SophieBergot, Veronika Schreiber, Ranjeny Thomas, Michael A. McGuckin, Timothy H.Florin, Mark Morrison, Robert J. Capon, Páraic Ó Cuív, and Jakob Begun

IL-1 TNF0
50000
100000
150000
RLU
ns
****
LS174T
IL-1 TNF0
200000
400000
600000
800000
RLU
0ng/ml
25ng/ml
50ng/ml
****
ns
Caco-2
Cells TNF 5% 10% 20%0
50000
100000
150000
200000
RLU
MCM
LS174T
Cells IL-1 5% 7.5% 10% 20%0
20000
40000
60000
80000
100000R
LU
MCM
Caco-2
C D
A B

Figure S1: Optimisation of luciferase assays, related to Figure 1.
(A-B) Effects of various concentrations of TNF- α and IL-1β on LS174T and Caco-2 NF-κB reporter cells.
(C-D) Effects of various concentrations of MCM media on LS174T and Caco-2 NF-κB reporter cells. Results
are shown as mean (SD) **** p<0.0001 as determined by one-way ANOVA with Dunnett’s multiple
comparison test.
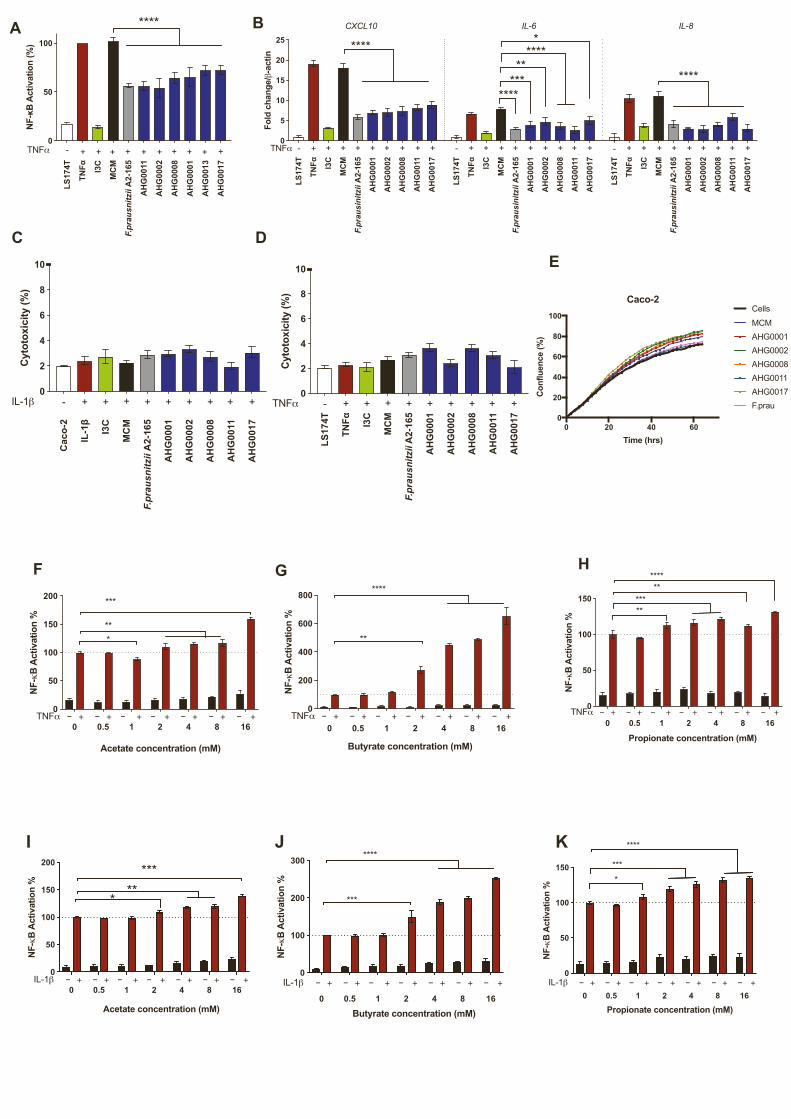
LS17
4T
TNF I3C
MC
M
F.pr
ausi
nitz
ii A
2-16
5
AH
G00
01
AH
G00
02
AH
G00
08
AH
G00
11
AH
G00
17
LS17
4T
TNF I3C
MC
M
F.pr
ausi
nitz
ii A
2-16
5
AH
G00
01
AH
G00
02
AH
G00
08
AH
G00
11
AH
G00
17
LS17
4T
TNF I3C
MC
M
F.pr
ausi
nitz
ii A
2-16
5
AH
G00
01
AH
G00
02
AH
G00
08
AH
G00
11
AH
G00
17
0
5
10
15
20
25
Fold
cha
nge/
-act
in
****
***********
******
*CXCL10 IL-6 IL-8
- + + + + + + + + + + + + + + + + + + + + + + + + + +TNF -+ -
LS17
4T
TNF I3C
MC
M
F.pr
ausn
itzii
A2-
165
AH
G00
11
AH
G00
02
AH
G00
08
AH
G00
01
AH
G00
13
AH
G00
17
0
50
100
NF-
B A
ctiv
atio
n (%
)
+ + + + + + + + + +-TNF
****A B
Cac
o-2
IL-1 I3
C
MC
M
F.pr
ausn
itzii
A2-
165
AH
G00
01
AH
G00
02
AH
G00
08
AH
G00
11
AH
G00
17
0
2
4
6
8
10
Cyt
otox
icity
(%)
IL-1 - + + + + + + + + +
C
LS17
4T
TNF I3C
MC
M
F.pr
ausn
itzii
A2-
165
AH
G00
01
AH
G00
02
AH
G00
08
AH
G00
11
AH
G00
17
0
2
4
6
8
10
Cyt
otox
icity
(%)
TNF - + + + + + + + + +
D
0 0.5 1 2 4 8 16
0
50
100
150
200
NF-
B A
ctiv
atio
n %
***
***
TNF - + - + - + - + - + - + - +
Acetate concentration (mM)
0 0.5 1 2 4 8 16
0
200
400
600
800
NF-
B A
ctiv
atio
n %
**
****
Butyrate concentration (mM)
TNF - + - + - + - + - + - + - +0 0.5 1 2 4 8 16
0
50
100
150
NF-
B A
ctiv
atio
n %
**
****
*****
**
TNF - + - + - + - + - + - + - +
Propionate concentration (mM)
0 0.5 1 2 4 8 16
0
50
100
150
200
NF-
B A
ctiv
atio
n %
*****
*
Acetate concentration (mM)
IL-1 - + - + - + - + - + - + - +
0 0.5 1 2 4 8 16
0
50
100
150
NF-
B A
ctiv
atio
n %
**
****
*
***
Propionate concentration (mM)
IL-1 - + - + - + - + - + - + - +
G H
I J
E
F
0 0.5 1 2 4 8 16
0
100
200
300
NF-
B A
ctiv
atio
n %
***
****
Butyrate concentration (mM)
IL-1 - + - + - + - + - + - + - +
K
0 20 40 600
20
40
60
80
100
Time (hrs)
Con
fluen
ce (%
)
Caco-2Cells
MCMAHG0001AHG0002AHG0008AHG0011AHG0017F.prau

Figure S2: In vitro and ex vivo immunomodulatory effects of selected CS, related to Figure 1.
(A) LS174T based confirmatory assay of the hits identified from the first pass screen. NF-κB activation was
assessed 4 h after TNFα stimulation and the extent of suppression was assessed against sterile medium (mean
(standard deviation (SD))).
(B) LS174T based qrt-PCR confirmatory assay of the hits identified from the first pass screen (mean (SD)). F.
prausnitizii A2-165 and the validated hits suppress IL-1b induced CXCL10, IL-6 and IL-8 expression in LS174T
cells.
(C-D) Analysis of the cytotoxicity of the CS prepared from the NF-kB suppressive strains in Caco-2 (Panel C)
and LS174T (Panel D) reporter cells. CS prepared from these strains did not exhibit cytotoxic effects (mean
(SD)).
(E) Analysis of CS prepared on the cell proliferation over 72 hours using Incucyte Live cell imaging analysis.
No effects on proliferation detected on Caco-2 cells.
(F-K) Assessment of the ability of acetate, butyrate, or propionate to suppress NF-kB activation in unstimulated
or cytokine stimulated LS174T (panel F-H) and Caco-2 (I-K) reporter cells. NF-κB activation was assessed 6h
after TNFα stimulation and the extent of suppression was assessed against sterile medium (mean (SD)). **
p<0.01, **** p<0.0001 as determined by one-way ANOVA with Dunnett’s multiple comparison test.

LS17
4T
TNF I3C
MC
M
AH
G00
02 C
S
<3kD
a
>3kD
a
37°C
57°C
97°C PK
0
50
100
150N
F-B
Act
ivat
ion
(%) ****
****
+ + + + + + + + +-TNF +
<3kDa
LS17
4TTN
F I3C
MC
MA
HG
0001
CS
<3kD
a>3
kDa
37°C
57°C
97°C PK
37°C
57°C
97°C PK
0
50
100
150
NF-
B A
ctiv
atio
n (%
)
+ + +- + + + + + + + + + +
*********
*
+
>3kDa<3kDa
TNF
LS17
4TTN
F I3C
MC
MA
2-16
5 C
S<3
kDa
>3kD
a
37°C
57°C
97°C PK
37°C
57°C
97°C PK
0
50
100
150
NF-
B A
ctiv
atio
n (%
)
+ + +- + + + + + + + + + +
>3kDa
**********
**
+
<3kDa
TNF
LS17
4TTN
F I3C
MC
MA
HG
0008
CS
<3kD
a>3
kDa
37°C
57°C
97°C PK
37°C
57°C
97°C PK
0
50
100
150
NF-
B A
ctiv
atio
n (%
)
+ + +- + + + + + + + + + +
*********
*****
**
+
>3kDa<3kDa
TNF
LS17
4T
TNF I3C
MC
M
AH
G00
011
CS
<3kD
a
>3kD
a
37°C
57°C
97°C PK
0
50
100
150
NF-
B A
ctiv
atio
n (%
)
+ +- + + + + + + + +
********
<3kDa
TNF
LS17
4T
TNF I3C
MC
M
AH
G00
17 C
S
<3kD
a
>3kD
a
37°C
57°C
97°C PK
0
50
100
150
NF-
B A
ctiv
atio
n (%
)
+ +- + + + + + + + +
********
<3kDa
TNF
A B
DC
FE
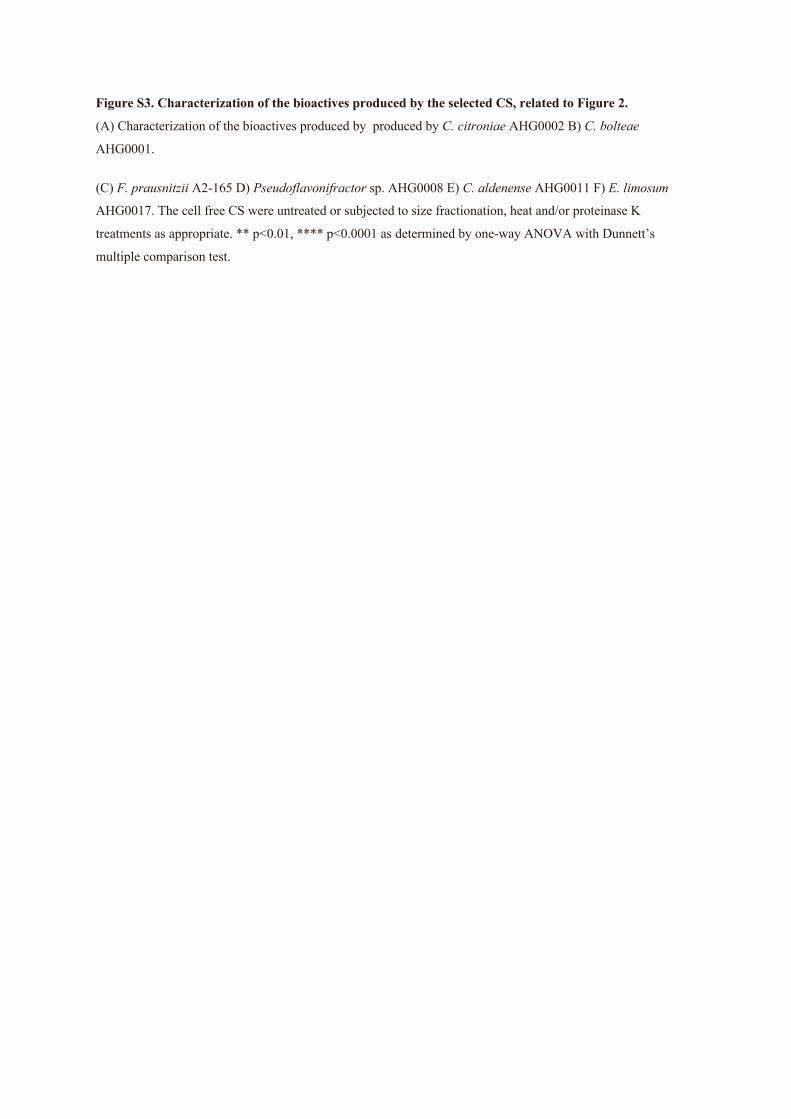
Figure S3. Characterization of the bioactives produced by the selected CS, related to Figure 2.
(A) Characterization of the bioactives produced by produced by C. citroniae AHG0002 B) C. bolteae
AHG0001.
(C) F. prausnitzii A2-165 D) Pseudoflavonifractor sp. AHG0008 E) C. aldenense AHG0011 F) E. limosum
AHG0017. The cell free CS were untreated or subjected to size fractionation, heat and/or proteinase K
treatments as appropriate. ** p<0.01, **** p<0.0001 as determined by one-way ANOVA with Dunnett’s
multiple comparison test.

A B
C
D
BAA-613
AHG0001
WAL-17108
AHG0002
1_7_47FAA
AHG00011
ATCC 8486
AHG00017
E
Figure S4. GTDB-based Phylogeny of selected isolates, related to Figure 2.
(A) GTDB-based phylogeny of C. bolteae AHG0001, C. citroniae AHG0002, C. aldenense AHG0011 and E.
limosum AHG0017 (red typeface) as determined from the concatenation of 120 universal bacterial-specific
marker genes. Representative strains are included for comparative purposes (black typeface). The bootstrap
values are indicated using a cut-off of >70 or >90%.
(B) The extent of genome synteny between C. bolteae ATCC BAA-613 and C. bolteae AHG0001.
(C) The extent of genome synteny between C. citroniae WAL-17108 and C. citroniae AHG0002.
(D) The extent of genome synteny between C. aldenense 1_7_47FAA and C. aldenense AHG0011.
(E) The extent of genome synteny between E. limosum ATCC8486 and E. limosum AHG0017. The red lines
indicate the boundaries of chromosomes, plasmids or contigs.

Healthy CD UC 30
35
40
45
50
IL-8
(pg/
ml)
*
Healthy CD UC
0
500
1000
1500
IL-8
(pg/
ml)
*
IL-1 + + +
Healthy CD UC0
20
40
60
80
IL-8
(pg/
ml)
Healthy CD UC
0
500
1000
1500
IL-8
(pg/
ml)
*
TNF + + +
Control
IL-1
(50n
g/ml)
TNF(5
0ng/m
L)1
10
100
1000
10000
100000
IL-8
(pg/
ml)
Non-IBD organoids
A B
C D
E

Figure S5: IL-8 levels in patient derived organoids and PBMCs, related to Figure 3.
(A) Analysis of basal IL-8 secretion by healthy, CD and UC derived gut epithelial organoids.
(B) Analysis of IL-8 secretion by healthy, CD and UC derived gut epithelial organoids following IL-1b
stimulation. IL-8 secretion was assessed 24 h after cytokine stimulation (mean (SD)).
(C) Analysis of basal IL-8 secretion by healthy, CD and UC derived PBMCs.
(D) Analysis of basal IL-8 secretion by healthy, CD and UC derived PBMCs following TNF- α stimulation.
(E) Responses of human derived organoids to TNF- α and IL-1β.

Cel
ls
IL-1 I3
C
MC
M
F.pr
ausn
itzii
A2-
165
AH
G00
11
AH
G00
01
AH
G00
02
AH
G00
08
AH
G00
17
0
200
400
600
800
IL-8
(pg/
ml)
Healthy # 1
****
IL-1 - + + + + + + + + +
Cel
ls
IL-1 I3
C
MC
M
F.pr
ausn
itzii
A2-
165
AH
G00
11
AH
G00
01
AH
G00
02
AH
G00
08
AH
G00
17
0
500
1000
1500
IL-8
(pg/
ml)
UC # 1****
IL-1 - + + + + + + + + +
Cel
ls
IL-1 I3
C
MC
M
F.pr
ausn
itzii
A2-
165
AH
G00
11
AH
G00
01
AH
G00
02
AH
G00
08
AH
G00
17
0
200
400
600
800
IL-8
(pg/
ml)
CD #3
****
Cel
ls
IL-1 I3
C
MC
M
F.pr
ausn
itzii
A2-
165
AH
G00
11
AH
G00
01
AH
G00
02
AH
G00
08
AH
G00
17
0
200
400
600
IL-8
(pg/
ml)
Healthy # 2
****
IL-1 - + + + + + + + + +
Cel
ls
IL-1 I3
C
MC
M
F.pr
ausn
itzii
A2-
165
AH
G00
11
AH
G00
01
AH
G00
02
AH
G00
08
AH
G00
17
0
500
1000
1500IL
-8 (p
g/m
l)
UC # 2
****
IL-1 - + + + + + + + + +
Cel
ls
IL-1 I3
C
MC
M
F.pr
ausn
itzii
A2-
165
AH
G00
11
AH
G00
01
AH
G00
02
AH
G00
08
AH
G00
17
0
200
400
600
800
IL-8
(pg/
ml)
CD #5******
IL-1 - + + + + + + + + +
Cel
ls
IL-1 I3
C
MC
M
F.pr
ausn
itzii
A2-
165
AH
G00
11
AH
G00
01
AH
G00
02
AH
G00
08
AH
G00
17
0
200
400
600
800
IL-8
(pg/
ml)
Healthy # 3
****
IL-1 - + + + + + + + + +
Cel
ls
IL-1 I3
C
MC
M
F.pr
ausn
itzii
A2-
165
AH
G00
11
AH
G00
01
AH
G00
02
AH
G00
08
AH
G00
17
0
500
1000
1500
IL-8
(pg/
ml)
UC # 3
****
IL-1 - + + + + + + + + +
Cel
ls
IL-1 I3
C
MC
M
F.pr
ausn
itzii
A2-
165
AH
G00
11
AH
G00
01
AH
G00
02
AH
G00
08
AH
G00
17
0
200
400
600
800
IL-8
(pg/
ml)
Healthy # 4
****
IL-1 - + + + + + + + + +
Cel
ls
IL-1 I3
C
MC
M
F.pr
ausn
itzii
A2-
165
AH
G00
11
AH
G00
01
AH
G00
02
AH
G00
08
AH
G00
17
0
100
200
300
400
IL-8
(pg/
ml)
Uc # 4
******
IL-1 - + + + + + + + + +
Cel
ls
IL-1 I3
C
MC
M
F.pr
ausn
itzii
A2-
165
AH
G00
11
AH
G00
01
AH
G00
02
AH
G00
08
AH
G00
17
0
200
400
600
800
1000
IL-8
(pg/
ml)
CD # 1****
**
IL-1 - + + + + + + + + +
Cel
ls
IL-1 I3
C
MC
M
F.pr
ausn
itzii
A2-
165
AH
G00
11
AH
G00
01
AH
G00
02
AH
G00
08
AH
G00
17
0
500
1000
1500
IL-8
(pg/
ml)
Healthy # 5
****
IL-1 - + + + + + + + + +
Cel
ls
IL-1 I3
C
MC
M
F.pr
ausn
itzii
A2-
165
AH
G00
11
AH
G00
01
AH
G00
02
AH
G00
08
AH
G00
17
0
500
1000
1500
IL-8
(pg/
ml)
Uc # 5
****
IL-1 - + + + + + + + + +
Cel
ls
IL-1 I3
C
MC
M
F.pr
ausn
itzii
A2-
165
AH
G00
11
AH
G00
01
AH
G00
02
AH
G00
08
AH
G00
17
0
200
400
600
800
1000
IL-8
(pg/
ml)
CD #4
******
IL-1 - + + + + + + + + +
Cel
ls
IL-1 I3
C
MC
M
F.pr
ausn
itzii
A2-
165
AH
G00
11
AH
G00
01
AH
G00
02
AH
G00
08
AH
G00
17
0
500
1000
1500
IL-8
(pg/
ml)
Healthy #6
********
IL-1 - + + + + + + + + +
Cel
ls
IL-1 I3
C
MC
M
F.pr
ausn
itzii
A2-
165
AH
G00
11
AH
G00
01
AH
G00
02
AH
G00
08
AH
G00
17
0
500
1000
1500
IL-8
(pg/
ml)
CD #6
****
IL-1 - + + + + + + + + +
Cel
ls
I3C
MC
M
F.pr
ausn
itzii
A2-
165
AH
G00
11
AH
G00
01
AH
G00
02
AH
G00
08
AH
G00
17
0
1
2
3
4
5
Cyt
otox
icity
(%)
IL-1 - + + + + + + + +
Healthy
Cel
ls
I3C
MC
M
F.pr
ausn
itzii
A2-
165
AH
G00
11
AH
G00
01
AH
G00
02
AH
G00
08
AH
G00
17
0
1
2
3
4
Cyt
otox
icity
(%)
CD
IL-1 - + + + + + + + +
Cel
ls
I3C
MC
M
F.pr
ausn
itzii
A2-
165
AH
G00
11
AH
G00
01
AH
G00
02
AH
G00
08
AH
G00
17
0
1
2
3
4
Cyt
otox
icity
(%)
UC
IL-1 - + + + + + + + +
A
B

Figure S6: Inter-subject variation in IL-8 secretion from human derived organoids, related to Figure 3.
(A) Analysis of the ability of CS prepared from the NF-κB suppressive strains to suppress IL-8 secretion in
organoids produced from healthy (Healthy, n=6), Crohn’s disease (CD, n=5) or ulcerative colitis (UC, n=5)
subjects.
(B) Analysis of the cytotoxicity of the CS prepared from the NF-κB suppressive strains in organoids produced
from healthy (Healthy, n=6), Crohn’s disease (CD, n=5) or ulcerative colitis (UC, n=5) subjects. ** p<0.01,
**** p<0.0001 as determined by one-way ANOVA with Dunnett’s multiple comparison test.
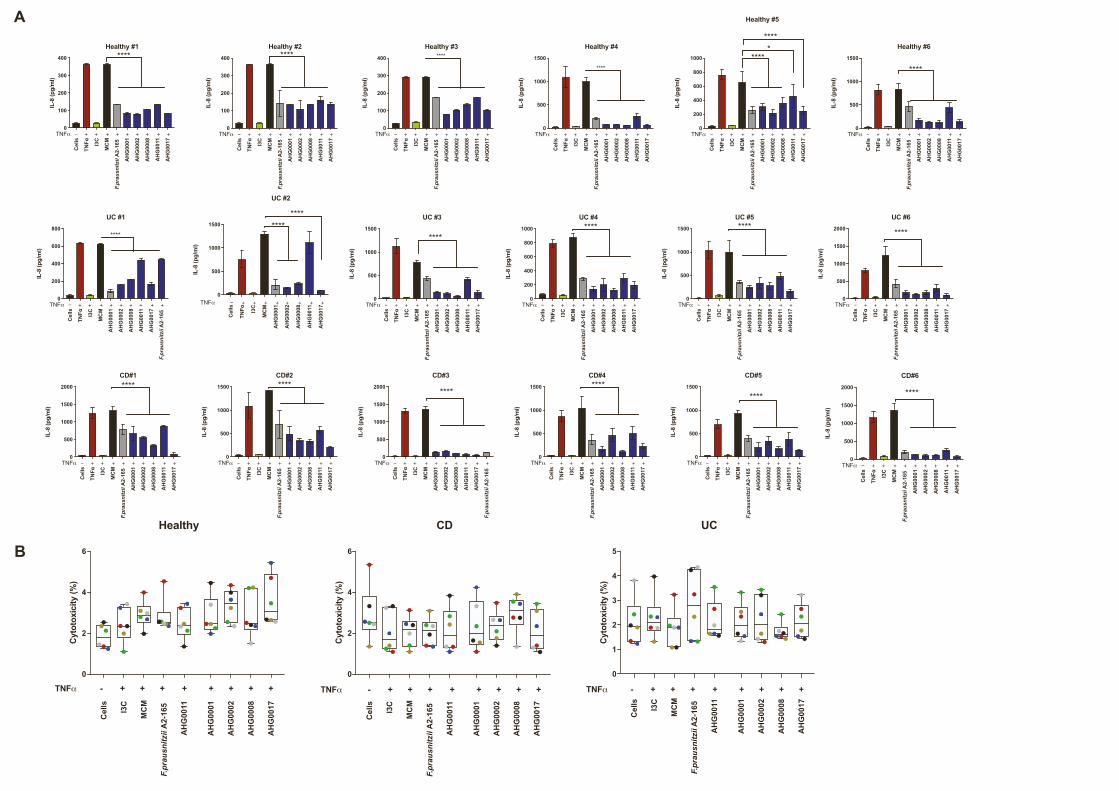
Cel
ls
TNF I3C
MC
M
F.pr
ausn
itzii
A2-
165
AH
G00
01
AH
G00
02
AH
G00
08
AH
G00
11
AH
G00
17
0
100
200
300
400IL
-8 (p
g/m
l)Healthy #1****
TNF - + + + + + + + + +
Cel
ls
TNF I3C
MC
M
AH
G00
01
AH
G00
02
AH
G00
08
AH
G00
11
AH
G00
17
F.pr
ausn
itzii
A2-
165
0
200
400
600
800
IL-8
(pg/
ml)
UC #1
****
TNF - + + + + + + + + +
Cel
ls
TNF I3C
MC
M
F.pr
ausn
itzii
A2-
165
AH
G00
01
AH
G00
02
AH
G00
08
AH
G00
11
AH
G00
17
0
500
1000
1500
2000
IL-8
(pg/
ml)
CD#1****
TNF - + + + + + + + + +
Cel
ls
TNF I3C
MC
M
F.pr
ausn
itzii
A2-
165
AH
G00
01
AH
G00
02
AH
G00
08
AH
G00
11
AH
G00
17
0
100
200
300
400
IL-8
(pg/
ml)
Healthy #2****
TNF - + + + + + + + + +
Cel
ls
TNF I3C
MC
M
AH
G00
01
AH
G00
02
AH
G00
08
AH
G00
11
AH
G00
17
0
500
1000
1500
IL-8
(pg/
ml)
UC #2
********
TNF - + + + + + + + +
Cel
ls
TNF I3C
MC
M
F.pr
ausn
itzii
A2-
165
AH
G00
01
AH
G00
02
AH
G00
08
AH
G00
11
AH
G00
17
0
500
1000
1500
IL-8
(pg/
ml)
CD#2****
TNF - + + + + + + + + +
Cel
ls
TNF I3C
MC
M
F.pr
ausn
itzii
A2-
165
AH
G00
01
AH
G00
02
AH
G00
08
AH
G00
11
AH
G00
17
0
100
200
300
400
IL-8
(pg/
ml)
Healthy #3****
TNF - + + + + + + + + +
Cel
ls
TNF I3C
MC
M
F.pr
ausn
itzii
A2-
165
AH
G00
01
AH
G00
02
AH
G00
08
AH
G00
11
AH
G00
17
0
500
1000
1500
IL-8
(pg/
ml)
UC #3
****
TNF - + + + + + + + + +
Cel
ls
TNF I3C
MC
M
AH
G00
01
AH
G00
02
AH
G00
08
AH
G00
11
AH
G00
17
F.pr
ausn
itzii
A2-
165
0
500
1000
1500
2000
IL-8
(pg/
ml)
CD#3
****
TNF - + + + + + + + + +
Cel
ls
TNF I3C
MC
M
F.pr
ausn
itzii
A2-
165
AH
G00
01
AH
G00
02
AH
G00
08
AH
G00
11
AH
G00
17
0
500
1000
1500
IL-8
(pg/
ml)
Healthy #4
****
TNF - + + + + + + + + +
Cel
ls
TNF I3C
MC
M
F.pr
ausn
itzii
A2-
165
AH
G00
01
AH
G00
02
AH
G00
08
AH
G00
11
AH
G00
17
0
200
400
600
800
1000
IL-8
(pg/
ml)
UC #4****
TNF - + + + + + + + + +
Cel
ls
TNF I3C
MC
M
F.pr
ausn
itzii
A2-
165
AH
G00
01
AH
G00
02
AH
G00
08
AH
G00
11
AH
G00
17
0
500
1000
1500
IL-8
(pg/
ml)
CD#4****
TNF - + + + + + + + + +
Cel
ls
TNF I3C
MC
M
F.pr
ausn
itzii
A2-
165
AH
G00
01
AH
G00
02
AH
G00
08
AH
G00
11
AH
G00
17
0
200
400
600
800
1000
IL-8
(pg/
ml)
*****
Healthy #5
****
TNF - + + + + + + + + +
Cel
ls
TNF I3C
MC
M
F.pr
ausn
itzii
A2-
165
AH
G00
01
AH
G00
02
AH
G00
08
AH
G00
11
AH
G00
17
0
500
1000
1500
IL-8
(pg/
ml)
UC #5****
TNF - + + + + + + + + +
Cel
ls
TNF I3C
MC
M
F.pr
ausn
itzii
A2-
165
AH
G00
01
AH
G00
02
AH
G00
08
AH
G00
11
AH
G00
17
0
500
1000
1500
IL-8
(pg/
ml)
CD#5
****
TNF - + + + + + + + + +
Cel
ls
TNF I3C
MC
M
F.pr
ausn
itzii
A2-
165
AH
G00
01
AH
G00
02
AH
G00
08
AH
G00
11
AH
G00
17
0
500
1000
1500
IL-8
(pg/
ml)
Healthy #6
****
TNF - + + + + + + + + +
Cel
ls
TNF I3C
MC
M
F.pr
ausn
itzii
A2-
165
AH
G00
01
AH
G00
02
AH
G00
08
AH
G00
11
AH
G00
17
0
500
1000
1500
2000
IL-8
(pg/
ml)
UC #6
****
TNF - + + + + + + + + +
Cel
ls
TNF I3C
MC
M
F.pr
ausn
itzii
A2-
165
AH
G00
01
AH
G00
02
AH
G00
08
AH
G00
11
AH
G00
17
0
500
1000
1500
2000
IL-8
(pg/
ml)
CD#6
****
TNF - + + + + + + + + +
Cel
ls
I3C
MC
M
F.pr
ausn
itzii
A2-
165
AH
G00
11
AH
G00
01
AH
G00
02
AH
G00
08
AH
G00
17
0
2
4
6
Cyt
otox
icity
(%)
TNF - + + + + + + + +
Healthy
Cel
ls
I3C
MC
M
F.pr
ausn
itzii
A2-
165
AH
G00
11
AH
G00
01
AH
G00
02
AH
G00
08
AH
G00
17
0
2
4
6
Cyt
otox
icity
(%)
TNF - + + + + + + + +
CD
Cel
ls
I3C
MC
M
F.pr
ausn
itzii
A2-
165
AH
G00
11
AH
G00
01
AH
G00
02
AH
G00
08
AH
G00
17
0
1
2
3
4
5
Cyt
otox
icity
(%)
TNF - + + + + + + + +
UC
A
B

Figure S7: Inter-subject variation in IL-8 secretion from human derived PBMCs, related to Figure 3.
(A) Analysis of the ability of CS prepared from the NF-kB suppressive strains to suppress IL-8 secretion in
PBMCs prepared from healthy (Healthy, n=6), Crohn’s disease (CD, n=6) or ulcerative colitis (UC, n=6)
subjects.
(B) Analysis of the cytotoxicity of the CS prepared from the NF-kB suppressive strains in PBMCs produced
from healthy (Healthy, n=6), Crohn’s disease (CD, n=5) or ulcerative colitis (UC, n=5) subjects. * p<0.05,
**** p<0.0001 as determined by one-way ANOVA with Dunnett’s multiple comparison test.
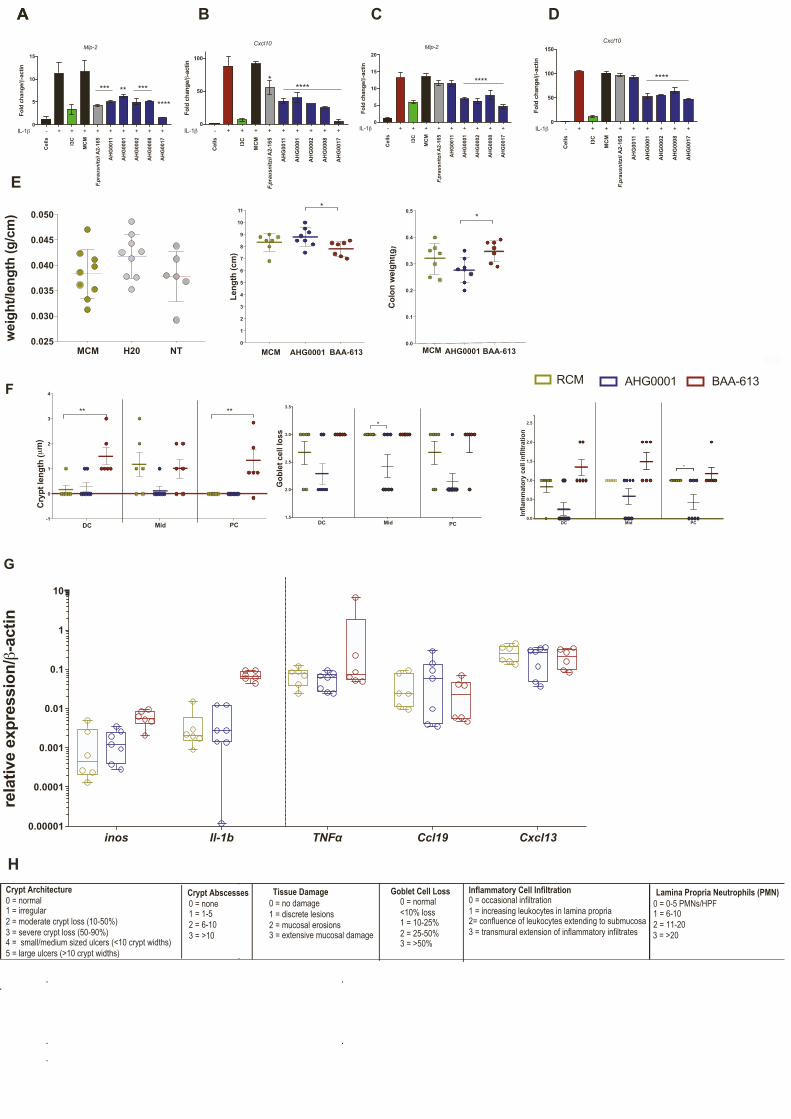
Cel
ls
I3C
MC
M
F.pr
ausn
itzii
A2-
165
AH
G00
11
AH
G00
01
AH
G00
02
AH
G00
08
AH
G00
17
0
5
10
15
Fold
cha
nge/
-act
in
IL-1
**
Mip-2
- + + + + + + + + +
*** ***
****
Cel
ls
I3C
MC
M
F.pr
ausn
itzii
A2-
165
AH
G00
11
AH
G00
01
AH
G00
02
AH
G00
08
AH
G00
17
0
50
100
Fold
cha
nge/
-act
in
IL-1
****
Cxcl10
- + + + + + + + + +
*
Cel
ls
I3C
MC
M
F.pr
ausn
itzii
A2-
165
AH
G00
11
AH
G00
01
AH
G00
02
AH
G00
08
AH
G00
17
0
50
100
150
Fold
cha
nge/
-act
in
IL-1
****
Cxcl10
- + + + + + + + + +
Cel
ls
I3C
MC
M
F.pr
ausn
itzii
A2-
165
AH
G00
11
AH
G00
01
AH
G00
02
AH
G00
08
AH
G00
17
0
5
10
15
20
Fold
cha
nge/
-act
in
IL-1
****
Mip-2
- + + + + + + + + +
AA DB C
MCM H20 NT0.025
0.030
0.035
0.040
0.045
0.050
wei
ght/l
engt
h (g
/cm
)
inos Il-1b TNF Ccl19 Cxcl130.00001
0.0001
0.001
0.01
0.1
1
10
rela
tive
expr
essi
on/
-act
in
RCM AHG0001 BAA-613
MCM AHG0001 BAA-613 0
1
2
3
4
5
6
7
8
9
10
11
Leng
th (c
m)
*
MCM AHG0001 BAA-613 0.0
0.1
0.2
0.3
0.4
0.5
Col
on w
eigh
t(g)
*
DC Mid PC-1
0
1
2
3
4
Cry
pt le
ngth
(μm
)
** **
Crypt Architecture 0 = normal 1 = irregular 2 = moderate crypt loss (10-50%) 3 = severe crypt loss (50-90%) 4 = small/medium sized ulcers (<10 crypt widths) 5 = large ulcers (>10 crypt widths)
Crypt Abscesses 0 = none 1 = 1-5 2 = 6-10 3 = >10
Tissue Damage 0 = no damage 1 = discrete lesions 2 = mucosal erosions 3 = extensive mucosal damage
Goblet Cell Loss 0 = normal <10% loss 1 = 10-25% 2 = 25-50% 3 = >50%
Inflammatory Cell Infiltration 0 = occasional infiltration 1 = increasing leukocytes in lamina propria 2= confluence of leukocytes extending to submucosa 3 = transmural extension of inflammatory infiltrates
Lamina Propria Neutrophils (PMN)
0 = 0-5 PMNs/HPF 1 = 6-10 2 = 11-20 3 = >20
E
H
DC Mid PC1.5
2.0
2.5
3.0
3.5
Gob
let c
ell l
oss
*
DC Mid PC0.0
0.5
1.0
1.5
2.0
2.5
Infla
mm
ator
y ce
ll in
filtr
atio
n
*
F
G
Figure S8: Histological colonic inflammation sub-scores following the treatment with MCM, C. bolteae
AHG0001 and C. bolteae BAA-613, related to Figure 4.
(A-B) Effects of bioactives on pro-inflammatory gene expression using murine derived organoids from
C57BL/6.
(C-D) Winnie mice. Murine derived organoids were treated with CS for 30mins and then stimulated as
appropriate with mIL-1β for 6 hours.
(E) Colon weight/length comparison of MCM treated group with H2O and no treatment group and C. bolteae
AHG0001 and C. bolteae BAA-613.
(F) Histological colonic inflammation sub-scores following the treatment with MCM, C. bolteae AHG0001 and
C. bolteae BAA-613 including Crypt length, Goblet cell loss, Inflammatory cell infiltration.
(G) Changes in gene expression in colonic tissues from mice treated with MCM, C. bolteae AHG0001 and C.
bolteae BAA-613.
(H) Criteria for histology sub score *p<0.05, ** p<0.01 as determined by one-way ANOVA with Dunnett’s
multiple comparison test.

Lymphocytes67.6
0 50K 100K 150K 200K 250K
FSC-A
0
50K
100K
150K
200K
250K
SSC-
A
Single Cells99.5
0 50K 100K 150K 200K 250K
SSC-A
0
50K
100K
150K
200K
250K
SSC-
W
T cells27.5
0-103
103
104
105
Comp-BV785-A :: TCRb
0
-103
103
104
105
Com
p-BV
510-
A :: L
_D
CD444.5
CD836.5
0-103
103
104
105
Comp-BV605-A :: CD8
0
-103
103
104
105
Com
p-BU
V395
-A ::
CD4
IFNg, TCRb subset3.57
0-103
103
104
105
Comp-FITC-A :: IFNg
0
-103
103
104
105
Com
p-BV
785-
A :: T
CRb
TNFa, TCRb subset82.0
0-103
103
104
105
Comp-BV421-A :: TNFa
0
-103
103
104
105
Com
p-BV
785-
A :: T
CRb
IFNg, TCRb subset27.1
0-103
103
104
105
Comp-FITC-A :: IFNg
0
-103
103
104
105
Com
p-BV
785-
A :: T
CRb
TNFa, TCRb subset65.0
0-103
103
104
105
Comp-BV421-A :: TNFa
0
-103
103
104
105
Com
p-BV
785-
A :: T
CRb
IFNg, TCRb subset3.42
3 3 4 5
0
-103
103
104
105
TNFa, TCRb subset68.5
0-103
103
104
105
0
-103
103
104
105
Com
p-BV
785-
A :: T
CRb
TNFa, TCRb subset28.3
0-103
103
104
105
Comp-BV421-A :: TNFa
0
-103
103
104
105
IFNg, TCRb subset1.17
0-103
103
104
105
0
-103
103
104
105
IFNg, TCRb subset2.50
0-103
103
104
105
0
-103
103
104
105
TNFa, TCRb subset61.7
0-103
103
104
105
0
-103
103
104
105
Com
p-BV
785-
A :: T
CRb
Comp-FITC-A :: IFNg
MCM AHG0001 BAA-613
TNFa, TCRb subset53.6
0-103
103
104
105
0
-103
103
104
105
TNFa, TCRb subset22.3
0-103
103
104
105
0
-103
103
104
105
TNFa, TCRb subset52.9
0-103
103
104
105
0
-103
103
104
105
IFNg, TCRb subset16.1
0-103
103
104
105
0
-103
103
104
105
IFNg, TCRb subset3.51
0-103
103
104
105
0
-103
103
104
105
IFNg, TCRb subset15.5
0-103
103
104
105
0
-103
103
104
105
Comp-BV421-A :: TNFa
Com
p-BV
785-
A :: T
CRb
Com
p-BV
785-
A :: T
CRb
Comp-FITC-A :: IFNg
LCL MCM AHG0001 BAA-613C
A B CD4
CD8
DAPI
RelB
Merged

Figure S9: Representative gating strategy for flow cytometry analysis and immunofluorescent imaging of
LCLs, related to Figure 5. (A) Gating strategy utilized for analysis of IFN- γ and TNFα.
(B) Representative flow plot showing cytokine expression by spleenocytes treated with CS from MCM, C.
bolteae AHG0001 and C. bolteae BAA-613.
(C) Representative microscopy images of LCLs treated with CS from MCM, C. bolteae AHG0001 and C.
bolteae BAA-613 stained with DAPI and RelB.

A
BGC 17
BGC 4
BGC 1
BGC 2
BGC 5
BGC 6
BGC 8
BGC 10
BGC9
BGC 11
BGC 13
BGC 14
BGC15
BGC 16

Figure S10: Genomic and analytical comparison of C. bolteae AHG0001and C. bolteae ATCC BAA-613,
related to Figure 6.
Gene organization of the highly and partially conserved BGCs between C. bolteae AHG0001 (top) and C.
bolteae ATCC BAA-613 (bottom). BGC 12 and BGC 13 are contiguous in C. bolteae AHG0001 and this BGC
disrupted by a transposon insertion in C. bolteae ATCC BAA-613.

LS17
4T
TNF I3C
AH
G-1
3
AH
G-1
3
AH
G-1
4
AH
G-1
4
0
50
100
NF-
B A
ctiv
atio
n (%
)
TNF - + + + + + +
20% v/v
10% v/v
A

Figure S11: Effect of purified fractions on LS174T NF-kB reporter cells, related to Figure 6.
Purified fractions 13 and 14 were tested at two different concentrations (10% and 20% v/v) on LS174T NF-kB
reporter cells.
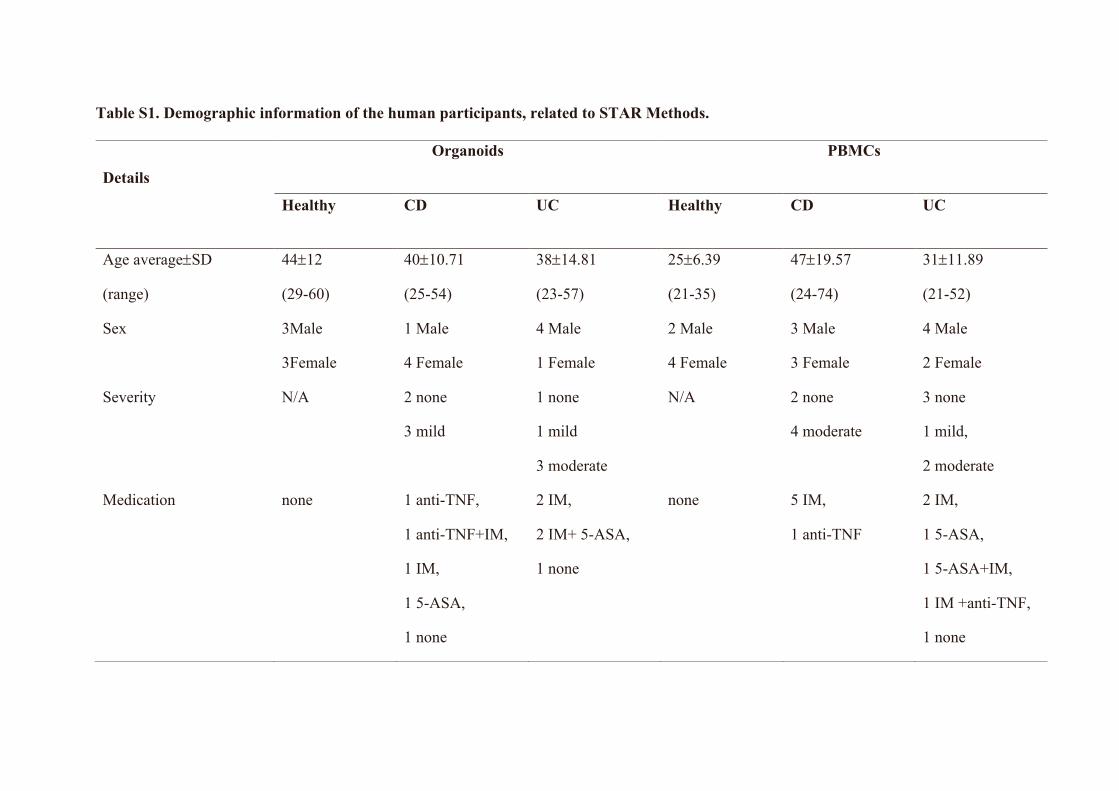
Table S1. Demographic information of the human participants, related to STAR Methods.
Details Organoids PBMCs
Healthy CD UC Healthy CD UC
Age average±SD
(range)
44±12
(29-60)
40±10.71
(25-54)
38±14.81
(23-57)
25±6.39
(21-35)
47±19.57
(24-74)
31±11.89
(21-52)
Sex 3Male
3Female
1 Male
4 Female
4 Male
1 Female
2 Male
4 Female
3 Male
3 Female
4 Male
2 Female
Severity N/A 2 none
3 mild
1 none
1 mild
3 moderate
N/A 2 none
4 moderate
3 none
1 mild,
2 moderate
Medication none 1 anti-TNF,
1 anti-TNF+IM,
1 IM,
1 5-ASA,
1 none
2 IM,
2 IM+ 5-ASA,
1 none
none 5 IM,
1 anti-TNF
2 IM,
1 5-ASA,
1 5-ASA+IM,
1 IM +anti-TNF,
1 none
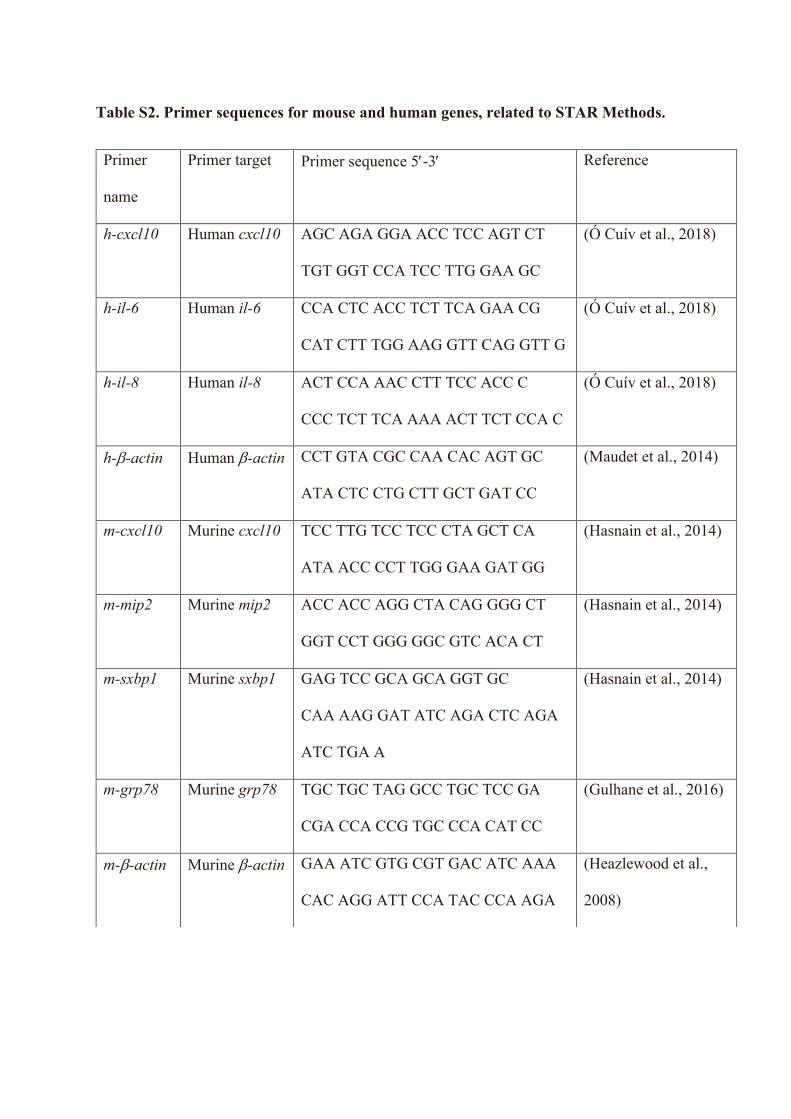
Table S2. Primer sequences for mouse and human genes, related to STAR Methods.
Primer
name
Primer target Primer sequence 5¢-3¢ Reference
h-cxcl10 Human cxcl10 AGC AGA GGA ACC TCC AGT CT
TGT GGT CCA TCC TTG GAA GC
(Ó Cuív et al., 2018)
h-il-6 Human il-6 CCA CTC ACC TCT TCA GAA CG
CAT CTT TGG AAG GTT CAG GTT G
(Ó Cuív et al., 2018)
h-il-8 Human il-8 ACT CCA AAC CTT TCC ACC C
CCC TCT TCA AAA ACT TCT CCA C
(Ó Cuív et al., 2018)
h-b-actin Human b-actin CCT GTA CGC CAA CAC AGT GC
ATA CTC CTG CTT GCT GAT CC
(Maudet et al., 2014)
m-cxcl10 Murine cxcl10 TCC TTG TCC TCC CTA GCT CA
ATA ACC CCT TGG GAA GAT GG
(Hasnain et al., 2014)
m-mip2 Murine mip2 ACC ACC AGG CTA CAG GGG CT
GGT CCT GGG GGC GTC ACA CT
(Hasnain et al., 2014)
m-sxbp1 Murine sxbp1 GAG TCC GCA GCA GGT GC
CAA AAG GAT ATC AGA CTC AGA
ATC TGA A
(Hasnain et al., 2014)
m-grp78 Murine grp78 TGC TGC TAG GCC TGC TCC GA
CGA CCA CCG TGC CCA CAT CC
(Gulhane et al., 2016)
m-b-actin Murine b-actin GAA ATC GTG CGT GAC ATC AAA
CAC AGG ATT CCA TAC CCA AGA
(Heazlewood et al.,
2008)


