Embed Size (px)
Citation preview
Autofluorescence and diffuse reflectance spectroscopy of oralepithelial tissue using a depth-sensitive fiber-optic probe
Richard A. Schwarz1,*, Wen Gao1, Dania Daye1, Michelle D. Williams2, Rebecca Richards-Kortum1, and Ann M. Gillenwater31Department of Bioengineering MS 142, Rice University, 6100 Main Street, Keck Hall Suite 116,Houston, Texas 77005, USA2Department of Pathology, The University of Texas M.D. Anderson Cancer Center, 1515 HolcombeBoulevard, Houston, Texas 77030, USA3Department of Head and Neck Surgery, The University of Texas M.D. Anderson Cancer Center,1515 Holcombe Boulevard, Houston, Texas 77030, USA
AbstractOptical spectroscopy can provide useful diagnostic information about the morphological andbiochemical changes related to the progression of precancer in epithelial tissue. As precancerouslesions develop, the optical properties of both the superficial epithelium and underlying stroma arealtered; measuring spectral data as a function of depth has the potential to improve diagnosticperformance. We describe a clinical spectroscopy system with a depth-sensitive, ball lens coupledfiber-optic probe for noninvasive in vivo measurement of oral autofluorescence and diffusereflectance spectra. We report results of spectroscopic measurements from oral sites in normalvolunteers and in patients with neoplastic lesions of the oral mucosa; results indicate that the additionof depth selectivity can enhance the detection of optical changes associated with precancer.
1. IntroductionCancers of the oral cavity and oropharynx are annually responsible for more than 7500 deathsin the United States and an estimated 127,000 deaths worldwide [1,2]. In the United States,patients diagnosed with oral or oropharyngeal cancer have a five-year survival rate of 59%relative to people of the same age group, gender, and ethnicity who do not have cancer [1].This survival rate has changed little over the past 30 years, in part because most patients presentwith disease that is already at an advanced stage [3]. Better methods for early detection anddiagnosis of oral cancer are needed to improve patient outcomes.
Standard clinical practice for diagnosis of oral cancer consists of visual inspection followedby invasive biopsy and histologic examination of any sites that appear abnormal. However,visual identification of the more subtle changes associated with early lesions can be difficulteven for experienced clinicians. Most clinically apparent oral lesions, such as candidiasis andaphthous ulcers, are benign; other lesions, such as leukoplakia, are associated with a risk ofmalignant progression that is difficult to judge by appearance alone. Furthermore, especiallyin patients with chronic exposure to carcinogens, histologic and genetic damage may exist evenin areas in which the mucosa appears normal [4].
© 2008 Optical Society of America*Corresponding author: [email protected] codes: 170.6510, 170.3890, 060.2310.
NIH Public AccessAuthor ManuscriptAppl Opt. Author manuscript; available in PMC 2009 November 4.
Published in final edited form as:Appl Opt. 2008 February 20; 47(6): 825–834.
NIH
-PA Author Manuscript
NIH
-PA Author Manuscript
NIH
-PA Author Manuscript

A variety of technologies designed to aid the clinician in detecting and diagnosing oralneoplasia are under development [5]. Optical spectroscopy is a noninvasive technique whosepotential to facilitate diagnosis of oral lesions has been demonstrated by a number of groups[6-12]. Loss of autofluorescence in the blue–green region of the spectrum is thought to bediagnostically significant, and according to recent reports may be associated with subclinicalgenetic alterations in the cancer risk field [4]; but the nature of this association has not beenexplained.
The development and progression of oral neoplasia has been reported to be associated with avariety of changes in tissue optical properties, including changes in the concentration offluorophores such as reduced nicotinamide adenine dinucleotide (NADH), flavin adeninedinucleotide (FAD), and keratin; changes in fluorescent collagen crosslinks in the underlyingstroma; changes in tissue scattering due to alterations in cell morphology; changes inhemoglobin absorption due to increased microvascularization; and changes in the thickness ofthe epithelial layer [13-16]. While fluorescence microscopy studies of excised fresh tissueprovide insight into the spatial dependence of optical property changes that accompanyneoplasia [17,18], it is more difficult to interpret spectroscopic measurements made from intacttissue. The precise mechanisms underlying the observed changes in tissue autofluorescenceare not well understood [19]. As neoplastic lesions develop, the morphological and biochemicalproperties of both the epithelium and stroma change, often in very different ways. If tissuespectra are acquired in vivo using an optical system that simply integrates optical signals arisingfrom different depths, then optical changes arising in the epithelium and stroma may producedissimilar or even opposing contributions to spectra measured from intact tissue. While avariety of mathematical models have been developed to analyze measured tissue spectra anddeconvolve optical changes that occur in the epithelium and stroma, most of these modelsinclude many variables that describe multiple competing effects, and typically require priorknowledge or assumptions regarding some input parameters such as the depth-dependentdistribution of specific chromophores in the tissue [20-23]. Results generated by these models,such as concentrations of fluorophores in tissue in vivo, are difficult to validate.
These issues must be addressed as optical spectroscopy and spectroscopic imaging moveincreasingly into clinical use for detection and diagnosis of oral lesions. The use of a depth-sensitive spectroscopy device that is capable of selectively targeting the epithelium or stromamay provide a means of overcoming some of these limitations. The ability to disentangle thechanges in optical properties that arise in the epithelium and stroma may prove useful inimproving the diagnostic ability of optical spectroscopy, particularly for the detection of earlyneoplastic lesions that originate in the epithelium.
A number of probe designs and techniques intended to target specific sampling regions in tissuehave been reported [24]. Oblique-incidence illumination and/or collection geometries usingangled fibers have been used to target superficial tissue regions [25-27]. Variations in fibersize, illumination-collection fiber separation, and probe-sample spacing have been shown toinfluence sensitivity to different fluorophore layers in turbid media [28]. Differential path-length spectroscopy has been demonstrated as a technique for preferential detection of photonsscattered from shallow depths [29].
We have previously described the design of a ball lens coupled fiber-optic probe for depth-resolved spectroscopy and validated its performance in tissue phantoms [30]. In this paper wepresent a clinical spectroscopy system based on this depth-sensitive probe, designed fornoninvasive in vivo measurement of autofluorescence and diffuse reflectance spectra of oralmucosa. We present representative spectral measurements of oral sites in healthy normalvolunteers and in patients with neoplastic lesions of the oral mucosa. Results indicate that the
Schwarz et al. Page 2
Appl Opt. Author manuscript; available in PMC 2009 November 4.
NIH
-PA Author Manuscript
NIH
-PA Author Manuscript
NIH
-PA Author Manuscript

addition of depth selectivity can enhance the detection of optical changes associated withprecancer.
2. Materials and MethodsA. Instrumentation
A schematic and photograph of the clinical spectroscopy system are shown in Fig. 1. The deviceis housed in a mobile cart 0.6 m × 0.8 m × 1.3 m in size. The light source is a 75 W xenon arclamp (Photon Technology International, Birmingham, N.J.). Two filter wheels (SutterInstrument Company, Novato, Calif.) containing bandpass filters (Chroma TechnologyCorporation, Rockingham, Vt.) allow selection of twelve different excitation wavelengthsbetween 300 and 470 nm for fluorescence measurements, or broadband light at variousillumination levels for reflectance measurements. The full-width at half-maximumtransmission bandwidth for the fluorescence excitation filters is 7 nm. Exposure time iscontrolled by a shutter (Vincent Associates, Rochester, N.Y.) located in the illuminationpathway. Excitation light is coupled into one of four illumination channels in the fiber-opticprobe, selected by means of a motorized translation stage (Parker Hannifin Corporation,Cleveland, Ohio). Illumination power is measured using two power meters (NewportCorporation, Irvine, Calif.). One power meter is used for direct measurements of probe outputduring system calibration; the other is permanently coupled to sampling fibers in the probe tomonitor the illumination power and exposure time during the tissue measurement.
Figure 2 shows a photograph of the fiber optic probe and a diagram of the arrangement ofillumination and detection fibers at its distal end. The design concept of the ball lens coupledprobe has been previously described [30]. The clinical probe described here contains fourchannels that are identified in terms of their depth response characteristics: a “shallow” channel,a “medium” depth channel, and two “deep” channels. In the shallow and medium channels,light is delivered to the tissue and collected through a 2 mm diameter sapphire ball lens. Theball lens is mounted in a stainless steel outer disk at the distal tip of the probe. The fibers forthe shallow and medium channels terminate in a stainless steel inner disk, which is located justinside the probe tip and is separated from the ball lens by a 0.50 mm air gap. The shallowchannel contains 14 illumination fibers arranged in a circle of radius 0.72 mm. The mediumchannel contains six illumination fibers arranged in a concentric circle of radius 0.36 mm. Asingle collection fiber, serving both the shallow and medium channels, is located at the centerof both circles. The shallow and medium channels collect signal preferentially from differentdepths beneath the same location on the tissue surface. The fibers for the two deep channelsterminate in the outer disk adjacent to the ball lens, with one channel on each side of the balllens. The two deep channels are identical to each other in design. Each contains twoillumination fibers and one adjacent collection fiber, all in direct contact with the tissue. Thedeep channels interrogate tissue sites located approximately 1.4 mm on either side of the siteinterrogated by the shallow and medium channels. All optical fibers (Polymicro Technologies,Phoenix, Ariz.) have a 200 μm core diameter and a numerical aperture of 0.22.
Upon illumination of the tissue, detected light (autofluorescence or diffuse reflectance) returnsthrough the collection channels of the probe and emerges from fibers arranged in a verticalstack. The collected light passes through a filter wheel containing longpass filters and isdirected onto the entrance slit of an imaging spectrograph (Horiba Jobin Yvon, Longjumeau,France). A TE-cooled CCD camera (Andor Technology, Belfast, Northern Ireland) located atthe exit port of the spectrograph collects an image that contains the spectrum of collected lightfrom each fiber in the stack.
All system instrumentation is controlled by Lab-view software (National InstrumentsCorporation, Austin, Tex.). The measurement sequence is fully automated and a single
Schwarz et al. Page 3
Appl Opt. Author manuscript; available in PMC 2009 November 4.
NIH
-PA Author Manuscript
NIH
-PA Author Manuscript
NIH
-PA Author Manuscript
measurement takes approximately 90 s. During a measurement the instrument collects 52individual spectra: fluorescence spectra at 12 different excitation wavelengths in the range300–470 nm and one broadband diffuse reflectance spectrum, through each of the four depth-selective probe channels. Background spectra, with the illumination source blocked, are alsocollected during the measurement.
B. Measurement and Modeling of Probe Depth ResponseTo measure the depth response of the clinical probe, a single side of a microscope slide wascoated with a thin (< 15 μm) uniform layer of green fluorescent paint for use as a test target.The response of each probe channel to the fluorescent target was measured as a function ofdistance from the probe tip to the target. This experiment was first performed in air and wasthen repeated with the probe and target fully immersed in water, to better simulate the refractiveindex change that would be encountered when the probe is in contact with tissue.
The measurements described above provide only an approximation of the actual depth responseof the probe in tissue, since tissue is a highly scattering medium compared to air or water.Monte Carlo simulations were performed to evaluate the effect of scattering on depth response.A previously reported Monte Carlo model [31] was modified to simulate the clinical ball lensprobe geometry and the experimental conditions corresponding to the depth responsemeasurement using a fluorescent target immersed in water. Simulations were performed witha range of scattering coefficients assigned to the medium: nonscattering (μs = 0 cm−1), moderatescattering (μs = 47 cm−1), and high scattering (μs = 224 cm−1). Results of the simulations werecompared to measured data.
C. In Vivo Spectral MeasurementsProtocols were approved by the Institutional Review Boards at the University of Texas M.D.Anderson Cancer Center (MDACC) and Rice University. Sites within the oral cavity of patientswith oral lesions and normal volunteers were measured using the device. For each patient,spectroscopic measurements were acquired from several sites, including clinically suspiciouslesions selected by the clinician and at least one contralateral, clinically normal appearing site.At each measurement site, the probe was placed in gentle contact with the mucosal surface ofthe tissue for the duration of the spectroscopic measurement. The procedure was performed ina darkened room to minimize variability and artifact from exposure to ambient light.Wavelength calibration, power calibration, and standards measurements were performedimmediately before or after the patient measurements. After the spectroscopic measurementswere completed, biopsies were collected from the corresponding tissue sites for histologicexamination, subject to prior patient consent and the discretion of the clinician. Histologicresults were reviewed by a study pathologist. For normal volunteers, the same procedure wasfollowed for spectroscopic measurements; clinical appearance of measured sites was noted butno biopsies were performed.
D. Calibration and Data ProcessingWavelength calibration was performed using a mercury–argon calibration lamp (Ocean Optics,Dunedin, Fla.). Standards measured daily included two positive fluorescence standards(Rhodamine B in ethylene glycol, 2 mg/L and 8 g/L); two negative fluorescence standards(frosted surface of a quartz cuvette and deionized ultrafiltered water); and a positive reflectancestandard (Teflon). The spectrum of a calibrated tungsten halogen light source (Ocean Optics)was obtained and used to correct measured spectra for nonuniform spectral variations in thethroughput of the detection system.
Measured spectra were processed using Matlab (The MathWorks, Natick, Mass.). A medianfilter was first applied to remove single-pixel outliers and a Savitzky–Golay filter was used to
Schwarz et al. Page 4
Appl Opt. Author manuscript; available in PMC 2009 November 4.
NIH
-PA Author Manuscript
NIH
-PA Author Manuscript
NIH
-PA Author Manuscript

remove high-frequency noise. Each tissue fluorescence measurement was normalized by theillumination energy delivered to the tissue and corrected for variations in the spectraltransmission characteristics of the detection system. Diffuse reflectance spectra of tissue weredivided by the corresponding diffuse reflectance spectra of the Teflon reflectance standard toobtain the ratio of tissue reflectance to this standard.
3. ResultsA. Probe Depth Response Data
The measured depth response of the shallow channel, medium channel, and a representativedeep channel of the clinical ball lens coupled probe are shown in Figs. 3(a) and 3(b). Thenormalized fluorescence intensity is plotted as a function of distance from the probe tip to thefluorescent target. The probe tip is formed by the distal surface of the ball lens, which extends0.43 mm beyond the surface of the outer disk where the deep channel fibers terminate.Therefore when the probe tip is in contact with a noncompliant surface such as the microscopeslide used in this measurement, the shallow and medium channels are in direct contact withthe target but the deep channels are recessed by 0.43 mm. The data shown were measured usingan excitation wavelength of 400 nm; measurements obtained at other excitation wavelengthswere similar. Figure 3(a) shows results obtained with the probe and target in air. In the shallowchannel, the fluorescence intensity drops to 10% of its peak value within 320 μm of the probetip. Figure 3(b) shows the same measurement performed with both the probe and targetimmersed in water. In this case the depth response curve broadens and shifts slightly deeperdue to the reduced refraction of illumination rays at the probe–water interface. This is a betterindication of the depth response that would be expected with the probe in contact with tissue.In water, the fluorescence intensity in the shallow channel drops to 10% of its peak value within550 μm of the probe tip.
Figure 3(c) shows the measured depth response for the shallow channel in water compared tothe Monte Carlo simulated depth response for the shallow channel. Monte Carlo results areshown for three different cases: a nonscattering medium (μs = 0 cm−1), a moderately scatteringmedium (μs = 47 cm−1), and a highly scattering medium (μs = 224 cm−1). The Monte Carloresult in the nonscattering case is roughly comparable to the measured depth response in water.The simulations indicate that as scattering increases the depth response is confined to shallowerdepths. This is consistent with results reported by Pfefer et al. from a Monte Carlo simulationof a similar oblique-incidence illumination geometry, in which increasing attenuation wasfound to decrease the probing depth [27]. We conclude from these modeling results that themeasured depth response in water provides a rough approximation of the depth response intissue but tends to overestimate the actual probing depth.
B. In Vivo Spectral DataUsing this system, we obtained spectroscopic measurements from 188 sites in 39 patients withlesions of the oral mucosa and from 140 sites in 32 normal volunteers. Figure 4 shows arepresentative example of spectra collected from a single site on the lateral tongue in a normalvolunteer. The data shown are fluorescence emission spectra collected at three excitationwavelengths (330, 350, and 400 nm) and reflectance spectra collected using white lightillumination. Data from the shallow channel and a deep channel of the probe are shown forcomparison. The spectra shown represent eight of the 52 spectra that are collected in a givenspectroscopic measurement. The reflectance spectra and several of the fluorescence spectrashown exhibit a valley at 420 nm, which is attributed to the presence of the absorber hemoglobinthat has a peak absorption at this location. Fluorescence and reflectance spectra acquiredthrough the deep channel of the probe show a substantially increased contribution ofhemoglobin absorption than do measurements made through the shallow channel. Since blood
Schwarz et al. Page 5
Appl Opt. Author manuscript; available in PMC 2009 November 4.
NIH
-PA Author Manuscript
NIH
-PA Author Manuscript
NIH
-PA Author Manuscript

vessels are expected to be present in the stroma but not in the epithelium, this is a goodindication that the fraction of signal collected from the epithelium is greater for the shallowchannel than for the deep channels.
Figure 5 shows representative fluorescence emission spectra collected from normal, dysplastic,and cancerous sites of the buccal mucosa in a single oral cancer patient at 350 nm excitation,using (a) the shallow channel and (b) a deep channel of the probe. Figures 5(c) and 5(d) showthe same spectra normalized to their peak intensity values for comparison. Spectra measuredusing both the shallow and deep channels indicate progressively lower fluorescence intensityfrom the dysplastic and cancerous tissue sites compared to the normal site. The spectrum ofthe normal site collected through the deep channel shows a strong absorption at 420 nm thatis absent in the corresponding shallow channel spectrum; again, this is consistent with thepresence of hemoglobin in the stroma but not in the epithelium. In the shallow channel, it isinteresting to note that there is a shift to longer peak wavelengths in the fluorescence spectraof the abnormal sites with respect to the normal site. Since the shallow channel enhances signalcollection from the epithelium, this wavelength shift is consistent with increased relativecontributions of NADH and FAD to the fluorescence spectra in the epithelial layer of theabnormal tissue sites [17,18].
Figure 6 shows representative fluorescence emission spectra collected from normal, dysplastic,and cancerous sites in the lateral tongue in a single oral cancer patient at 350 nm excitation,using (a) the shallow channel and (b) a deep channel of the probe. Figures 6(c) and 6(d) showthe same spectra normalized to their peak intensity values for comparison. The spectra showtrends similar to those observed in Fig. 5. Lower fluorescence intensity is observed from thedysplastic and cancerous sites compared to the normal site in both the shallow channel anddeep channel spectra. Hemoglobin absorption is more evident in the spectra measured throughthe deep channel. In the shallow channel there is a pronounced wavelength shift in the spectraof the abnormal sites compared to the spectrum of the normal site. In this case a wavelengthshift is also apparent in the deep channel spectra.
4. DiscussionPrevious reports have documented the potential of fluorescence and reflectance spectroscopyfor noninvasive diagnosis of early oral cancer and precancer. However, to be effectiveclinically, diagnostic technologies need to have high specificity, as well as sensitivity, in orderto avoid unnecessary patient interventions. Recent advances in the understanding of thealterations in tissue optical properties during carcinoma development have identified distinctdifferences between the epithelium and the underlying stroma [17]. This suggests that separateinterrogation of epithelial and stromal layers may improve the ability to distinguish dysplasiaand carcinoma from normal mucosa and benign conditions.
The spectroscopy system described in this report allows in vivo measurements of oralfluorescence and diffuse reflectance spectra at different depths within the tissue. The depthresponse measurements shown in Fig. 3 indicate how well the depth-sensitive clinical probeperforms. The measurements taken with the probe immersed in water, Fig. 3(b), provide anestimate of the depth sensitivity of the probe for tissue measurements, though the actual probingdepth may be slightly shallower due to scattering in tissue. In the oral cavity the thickness ofthe epithelial layer is typically of the order of 300–500 μm, varying with the specific tissuetype. Figure 3(b) indicates that the shallow channel is strongly weighted towards the epitheliallayer (the first 300–500 μm), but does not completely exclude signal from the stroma. Thedegree to which the interrogated region is confined to the epithelium depends on the epithelialthickness and therefore on tissue type within the oral cavity. The medium channel collectssignal from a broad region that includes both epithelium and stroma, extending from the tissue
Schwarz et al. Page 6
Appl Opt. Author manuscript; available in PMC 2009 November 4.
NIH
-PA Author Manuscript
NIH
-PA Author Manuscript
NIH
-PA Author Manuscript
surface to depths greater than 1 mm. The deep channels primarily interrogate the stroma butdo include a small component of signal from the epithelium.
The most prominent general feature observed in our in vivo data collected to date is aprogressive overall reduction in blue–green fluorescence intensity in dysplastic and canceroustissue compared to normal tissue, as illustrated in Figs. 5(a), 5(b), 6(a), and 6(b). This trend isevident across a wide range of excitation wavelengths from 330 to 470 nm, though not at 300or 310 nm excitation. The reduction in fluorescence intensity in dysplasia and carcinoma isobserved in all oral tissue types measured and in all depth channels of the probe (shallow,medium, and deep), indicating that alterations in both epithelium and stroma are involved. Webelieve the most likely contributing factors to this reduction in fluorescence intensity are thebreakdown of collagen crosslinks in the stroma, thickening of the epithelium, increasedepithelial scattering, loss of keratin in the epithelium, and increased hemoglobin absorptionassociated with increased microvascular density throughout the epithelial–stromal region[16,32,33].
A second general feature observed in the data is a progressive shift of the blue–greenfluorescence peak to longer wavelengths in dysplastic and cancerous tissue compared to normaltissue, as shown in Figs. 5(c) and 6(c). This trend also appears across a range of excitationwavelengths, most notably in the 330–390 nm range and somewhat less consistently in the400–470 nm range. It is mostly seen in the shallow and medium channels, and less clearlyobserved in the deep channels; this may be because hemoglobin absorption distorts the shapeof the normal spectra measured using the deep channels, as seen in Fig. 5(d), making thewavelength shift less readily apparent. The origin of the wavelength shift is not known but itmay be associated with loss of fluorophores that emit at shorter wavelengths, such as keratinand collagen, and increased relative contributions to the fluorescence signal from NADH andFAD.
The reduction in blue–green fluorescence intensity and the associated wavelength shift that weobserve in our data are consistent with results reported in the literature for in vivo oralmeasurements. In a previous study (without a ball lens coupled probe), our group found areduction in blue–green fluorescence intensity and a wavelength shift in cancerous tissuecompared to normal tissue, with excitation wavelengths of 365, 337, and 410 nm [14].Badizadegan et al. reported a similar progressive reduction in fluorescence intensity andwavelength shift in dysplastic and cancerous oral tissue compared to normal tissue, with anexcitation wavelength of 337 nm [9]. De Veld et al. found a progressive decrease in blue–greenfluorescence intensity in dysplastic and tumor tissue compared to healthy tissue at 405 nmexcitation, but also found a decrease in the fluorescence intensity of benign lesion sitescompared to healthy tissue [10]. This raises the concern that this parameter may not providesufficient specificity to distinguish dysplastic and cancerous lesions from benign lesions. Sinceinflammatory lesions predominantly affect the stroma, whereas dysplasia also producesalterations in the epithelium, spectral data separately derived from these layers may providenovel parameters to distinguish these clinical entities.
Our initial results indicate that the clinical ball lens coupled probe functions as designed andprovides depth-sensitive in vivo spectral data. The shallow channel of the probe appears tominimize the effect of hemoglobin absorption on the fluorescence spectrum. It remains to beseen whether the removal of the hemoglobin absorption leads to significantly improveddiagnostic performance; whether the probe can be used to identify different trends influorescence associated with fluorophores located in the epithelium and stroma; how diagnosticperformance is affected by interpatient and intrapatient variability; and whether benign andmalignant lesions can be distinguished.
Schwarz et al. Page 7
Appl Opt. Author manuscript; available in PMC 2009 November 4.
NIH
-PA Author Manuscript
NIH
-PA Author Manuscript
NIH
-PA Author Manuscript
In summary, we have described a clinical spectroscopy system with a depth-sensitive fiber-optic probe for noninvasive in vivo measurement of oral sites in healthy subjects and in patientswith lesions of the oral mucosa. Differences have been observed in intensity, peak emissionwavelength, and shape of the fluorescence spectra of normal and abnormal tissue sites. Depth-sensitive spectral measurements have been successfully demonstrated in vivo. The ability toobtain spectra from different depths at a single measurement site, and to distinguish betweenepithelial and stromal spectral signatures, may improve the diagnostic capability of point probeoptical spectroscopy systems.
AcknowledgmentsThe authors thank Adel K. El-Naggar for reviewing histopathology results, and Bimal Patel, Erica M. Smith, andCristina Kurachi for performing in vivo measurements. The authors gratefully acknowledge support from NationalCancer Institute grant R01CA095604.
References1. Ries, LAG.; Melbert, D.; Krapcho, M.; Mariotto, A.; Miller, BA.; Feuer, EJ.; Clegg, L.; Horner, MJ.;
Howlader, N.; Eisner, MP.; Reichman, M.; Edwards, BK., editors. SEER cancer statistics review,1975–2004. National Cancer Institute; Bethesda, Md: based on November 2006 SEER datasubmission, posted to the SEER web site, 2007, http://seer.cancer.gov/csr/1975_2004/
2. Parkin DM, Bray F, Ferlay J, Pisani P. Global cancer statistics, 2002. Ca-Cancer J Clin 2005;55:74–108. [PubMed: 15761078]
3. Neville BW, Day TA. Oral cancer and precancerous lesions. Ca-Cancer J Clin 2002;52:195–215.[PubMed: 12139232]
4. Poh CF, Zhang L, Anderson DW, Durham JS, Williams PM, Priddy RW, Berean KW, Ng S, TsengOL, MacAulay C, Rosin MP. Fluorescence visualization detection of field alterations in tumor marginsof oral cancer patients. Clin Cancer Res 2006;12:6716–6722. [PubMed: 17121891]
5. Gillenwater A, Papadimitrakopoulou V, Richards-Kortum R. Oral premalignancy: new methods ofdetection and treatment. Curr Oncol Rep 2006;8:146–154. [PubMed: 16507225]
6. Kolli VR, Savage HE, Yao TJ, Schantz SP. Native cellular fluorescence of neoplastic upperaerodigestive mucosa. Arch Otolaryngol Head Neck Surg 1995;121:1287–1292. [PubMed: 7576476]
7. Dhingra JK, Perrault DF Jr, McMillan K, Rebeiz EE, Kabani S, Manoharan R, Itzkan I, Feld MS,Shapshay SM. Early diagnosis of upper aerodigestive tract cancer by autofluorescence. ArchOtolaryngol Head Neck Surg 1996;122:1181–1186. [PubMed: 8906052]
8. Betz CS, Mehlmann M, Rick K, Stepp H, Grevers G, Baumgartner R, Leunig A. Autofluorescenceimaging and spectroscopy of normal and malignant mucosa in patients with head and neck cancer.Lasers Surg Med 1999;25:323–334. [PubMed: 10534749]
9. Badizadegan K, Backman V, Boone CW, Crum CP, Dasari RR, Georgakoudi I, Keefe K, Munger K,Shapshay SM, Sheets EE, Feld MS. Spectroscopic diagnosis and imaging of invisible pre-cancer.Faraday Discuss 2004;126:265–279. [PubMed: 14992412]
10. de Veld DCG, Skurichina M, Witjes MJH, Duin RPW, Sterenborg HJCM, Roodenburg JLN. Clinicalstudy for classification of benign, dysplastic, and malignant oral lesions using autofluorescencespectroscopy. J Biomed Opt 2004;9:940–950. [PubMed: 15447015]
11. de Veld DCG, Skurichina M, Witjes MJH, Duin RPW, Sterenborg HJCM, Roodenburg JLN.Autofluorescence and diffuse reflectance spectroscopy for oral oncology. Lasers Surg Med2005;36:356–364. [PubMed: 15856507]
12. Majumder SK, Gupta A, Gupta S, Ghosh N, Gupta PK. Multi-class classification algorithm for opticaldiagnosis of oral cancer. J Photochem Photobiol B 2006;85:109–117. [PubMed: 16839771]
13. Fryen A, Glanz H, Lohmann W, Dreyer T, Bohle RM. Significance of autofluorescence for the opticaldemarcation of field cancerisation in the upper aerodigestive tract. Acta Otolaryngol (Stockh)1997;117:316–319. [PubMed: 9105474]
14. Gillenwater A, Jacob R, Ganeshappa R, Kemp B, El-Naggar AK, Palmer JL, Clayman G, MitchellMF, Richards-Kortum RR. Noninvasive diagnosis of oral neoplasia based on fluorescence
Schwarz et al. Page 8
Appl Opt. Author manuscript; available in PMC 2009 November 4.
NIH
-PA Author Manuscript
NIH
-PA Author Manuscript
NIH
-PA Author Manuscript
spectroscopy and native tissue autofluorescence. Arch Otolaryngol Head Neck Surg 1998;124:1251–1258. [PubMed: 9821929]
15. Müller MG, Valdez TA, Georgakoudi I, Backman V, Fuentes C, Kabani S, Laver N, Wang Z, BooneCW, Dasari RR, Shapshay SM, Feld MS. Spectroscopic detection and evaluation of morphologicand biochemical changes in early human oral carcinoma. Cancer 2003;97:1681–1692. [PubMed:12655525]
16. Lane PM, Whitehead TGP, Zeng H, Poh CF, Ng S, Williams PM, Zhang L, Rosin MP, MacAulayCE. Simple device for the direct visualization of oral-cavity tissue fluorescence. J Biomed Opt2006;11:024006. [PubMed: 16674196]
17. Pavlova I, Sokolov K, Drezek R, Malpica A, Follen M, Richards-Kortum R. Microanatomical andbiochemical origins of normal and precancerous cervical autofluorescence using laser-scanningfluorescence confocal microscopy. Photochem Photobiol 2003;77:550–555. [PubMed: 12812299]
18. Drezek R, Brookner C, Pavlova I, Boiko I, Malpica A, Lotan R, Follen M, Richards-Kortum R.Autofluorescence microscopy of fresh cervical-tissue sections reveals alterations in tissuebiochemistry with dysplasia. Photochem Photobiol 2001;73:636–641. [PubMed: 11421069]
19. Westra WH, Sidransky D. Fluorescence visualization in oral neoplasia: shedding light on an oldproblem. Clin Cancer Res 2006;12:6594–6597. [PubMed: 17121876]
20. Georgakoudi I, Sheets EE, Müller MG, Backman V, Crum CP, Badizadegan K, Dasari RR, Feld MS.Trimodal spectroscopy for the detection and characterization of cervical precancers in vivo. Am JObstet Gynecol 2002;186:374–382. [PubMed: 11904594]
21. Chang SK, Arifler D, Drezek R, Follen M, Richards-Kortum R. Analytical model to describefluorescence spectra of normal and preneoplastic epithelial tissue: comparison with Monte Carlosimulations and clinical measurements. J Biomed Opt 2004;9:511–522. [PubMed: 15189089]
22. Chang SK, Mirabal YN, Atkinson EN, Cox D, Malpica A, Follen M, Richards-Kortum R. Combinedreflectance and fluorescence spectroscopy for in vivo detection of cervical pre-cancer. J Biomed Opt2005;10:024031. [PubMed: 15910104]
23. Chang SK, Marin N, Follen M, Richards-Kortum R. Model-based analysis of clinical fluorescencespectroscopy for in vivo detection of cervical intraepithelial dysplasia. J Biomed Opt2006;11:024008. [PubMed: 16674198]
24. Utzinger U, Richards-Kortum RR. Fiber optic probes for biomedical optical spectroscopy. J BiomedOpt 2003;8:121–147. [PubMed: 12542388]
25. Skala MC, Palmer GM, Zhu C, Liu Q, Vrotsos KM, Marshek-Stone CL, Gendron-Fitzpatrick A,Ramanujam N. Investigation of fiber-optic probe designs for optical spectroscopic diagnosis ofepithelial pre-cancers. Lasers Surg Med 2004;34:25–38. [PubMed: 14755422]
26. Liu Q, Ramanujam N. Experimental proof of the feasibility of using an angled fiber-optic probe fordepth-sensitive fluorescence spectroscopy of turbid media. Opt Lett 2004;29:2034–2036. [PubMed:15455771]
27. Pfefer TJ, Agrawal A, Drezek RA. Oblique-incidence illumination and collection for depth-selectivefluorescence spectroscopy. J Biomed Opt 2005;10:044016.
28. Pfefer TJ, Matchette LS, Ross AM, Ediger MN. Selective detection of fluorophore layers in turbidmedia: the role of fiber-optic probe design. Opt Lett 2003;28:120–122. [PubMed: 12656504]
29. Amelink A, Sterenborg HJCM. Measurement of the local optical properties of turbid media bydifferential path-length spectroscopy. Appl Opt 2004;43:3048–3054. [PubMed: 15176191]
30. Schwarz RA, Arifler D, Chang SK, Pavlova I, Hussain IA, Mack V, Knight B, Richards-Kortum R,Gillenwater AM. Ball lens coupled fiber optic probe for depth-resolved spectroscopy of epithelialtissue. Opt Lett 2005;30:1159–1161. [PubMed: 15945140]
31. Arifler D, Schwarz RA, Chang SK, Richards-Kortum R. Reflectance spectroscopy for diagnosis ofepithelial precancer: model-based analysis of fiber-optic probe designs to resolve spectralinformation from epithelium and stroma. Appl Opt 2005;44:4291–4305. [PubMed: 16045217]
32. Clark AL, Gillenwater A, Alizadeh-Naderi R, El-Naggar AK, Richards-Kortum R. Detection anddiagnosis of oral neoplasia with an optical coherence microscope. J Biomed Opt 2004;9:1271–1280.[PubMed: 15568948]
Schwarz et al. Page 9
Appl Opt. Author manuscript; available in PMC 2009 November 4.
NIH
-PA Author Manuscript
NIH
-PA Author Manuscript
NIH
-PA Author Manuscript

33. Tae K, El-Naggar AK, Yoo E, Feng L, Lee JJ, Hong WK, Hittelman WN, Shin DM. Expression ofvascular endothelial growth factor and microvessel density in head and neck tumorigenesis. ClinCancer Res 2000;6:2821–2828. [PubMed: 10914730]
Schwarz et al. Page 10
Appl Opt. Author manuscript; available in PMC 2009 November 4.
NIH
-PA Author Manuscript
NIH
-PA Author Manuscript
NIH
-PA Author Manuscript

Fig. 1.Diagram and photograph of the clinical spectroscopy system.
Schwarz et al. Page 11
Appl Opt. Author manuscript; available in PMC 2009 November 4.
NIH
-PA Author Manuscript
NIH
-PA Author Manuscript
NIH
-PA Author Manuscript

Fig. 2.Diagram and photograph of the clinical ball lens coupled fiber-optic probe.
Schwarz et al. Page 12
Appl Opt. Author manuscript; available in PMC 2009 November 4.
NIH
-PA Author Manuscript
NIH
-PA Author Manuscript
NIH
-PA Author Manuscript

Fig. 3.Measured depth response of the probe and comparison with simulations: (a) measured depthresponse in air; (b) measured depth response in water; (c) measured depth response in waterversus Monte Carlo simulated depth response for nonscattering, moderately scattering, andhighly scattering media (shallow channel only).
Schwarz et al. Page 13
Appl Opt. Author manuscript; available in PMC 2009 November 4.
NIH
-PA Author Manuscript
NIH
-PA Author Manuscript
NIH
-PA Author Manuscript

Fig. 4.Spectra measured from a single lateral tongue site in a normal volunteer using the shallow anddeep channels of the probe: (a) fluorescence spectrum at 330 nm excitation; (b) fluorescencespectrum at 350 nm excitation; (c) fluorescence spectrum at 400 nm excitation; (d) diffusereflectance spectrum under white light illumination. All spectra are shown on the samewavelength scale for comparison; the fluorescence spectrum at 400 nm excitation was collectedwith a 435 nm emission filter. The absorptions at 420, 540, and 580 nm in the deep channelreflectance spectrum are attributed to hemoglobin. The 420 nm hemoglobin absorption isevident in the reflectance spectra and also in several of the fluorescence spectra, particularlythose collected using the deep channel.
Schwarz et al. Page 14
Appl Opt. Author manuscript; available in PMC 2009 November 4.
NIH
-PA Author Manuscript
NIH
-PA Author Manuscript
NIH
-PA Author Manuscript

Fig. 5.Fluorescence spectra measured from three buccal sites in a single oral cancer patient at 350nm excitation: (a) shallow channel, (b) deep channel, (c) shallow channel normalized to peakintensity value, and (d) deep channel normalized to peak intensity value. Histologic diagnosesof the three sites are, respectively, normal, moderate dysplasia, and well-differentiated invasivecancer.
Schwarz et al. Page 15
Appl Opt. Author manuscript; available in PMC 2009 November 4.
NIH
-PA Author Manuscript
NIH
-PA Author Manuscript
NIH
-PA Author Manuscript
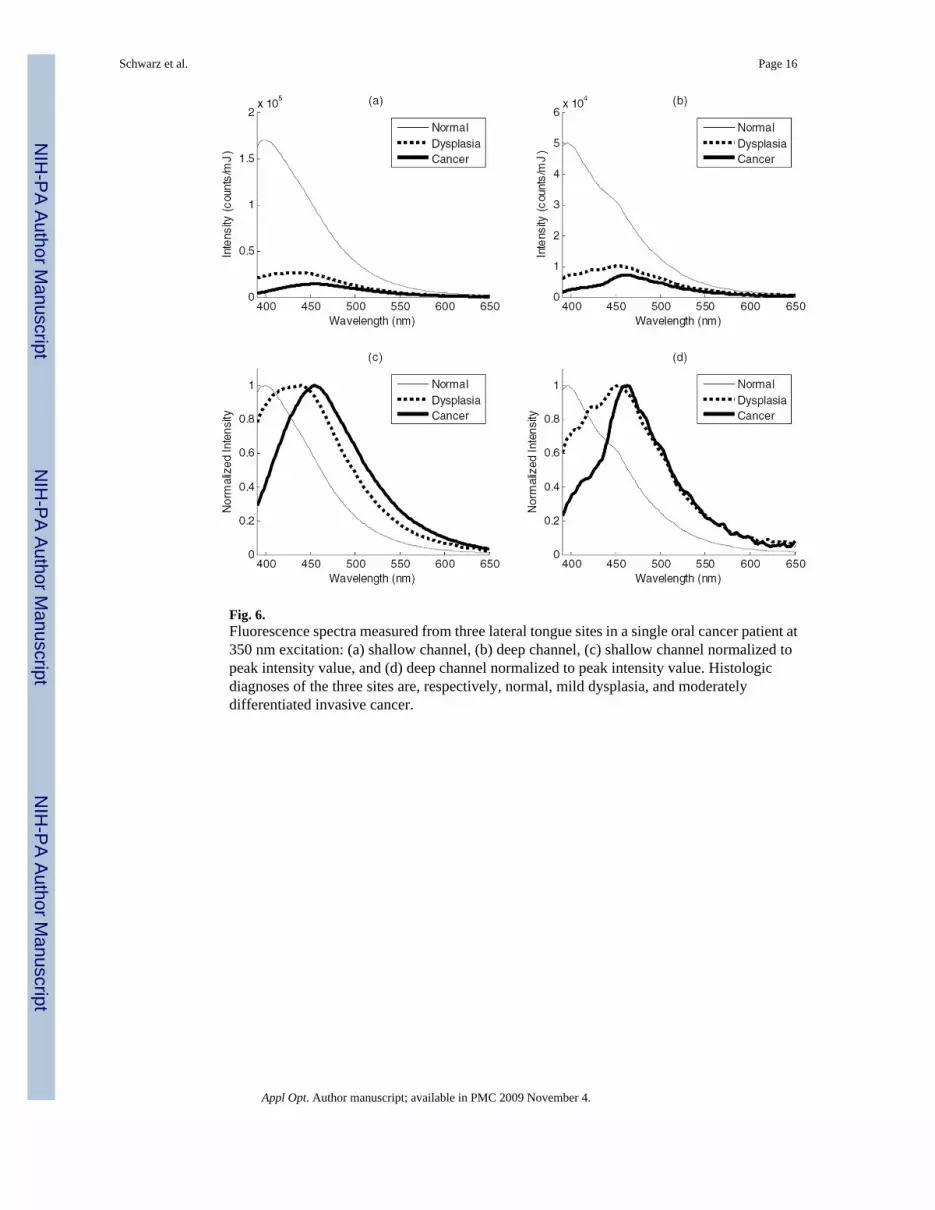
Fig. 6.Fluorescence spectra measured from three lateral tongue sites in a single oral cancer patient at350 nm excitation: (a) shallow channel, (b) deep channel, (c) shallow channel normalized topeak intensity value, and (d) deep channel normalized to peak intensity value. Histologicdiagnoses of the three sites are, respectively, normal, mild dysplasia, and moderatelydifferentiated invasive cancer.
Schwarz et al. Page 16
Appl Opt. Author manuscript; available in PMC 2009 November 4.
NIH
-PA Author Manuscript
NIH
-PA Author Manuscript
NIH
-PA Author Manuscript


