Embed Size (px)
Citation preview
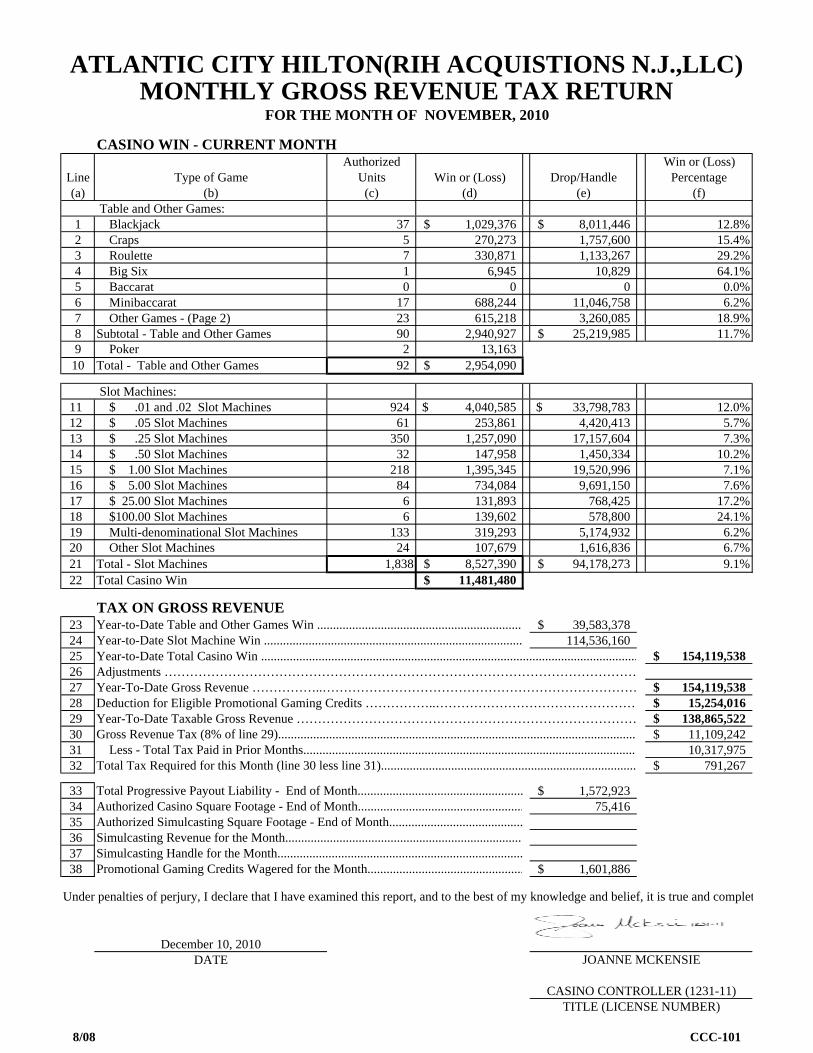
R1310111100
CASINO WIN - CURRENT MONTHAuthorized Win or (Loss)
Line Type of Game Units Win or (Loss) Drop/Handle Percentage(a) (b) (c) (d) (e) (f)
Table and Other Games:1 Blackjack 37 1,029,376$ 8,011,446$ 12.8%2 Craps 5 270,273 1,757,600 15.4%3 Roulette 7 330,871 1,133,267 29.2%4 Big Six 1 6,945 10,829 64.1%5 Baccarat 0 0 0 0.0%6 Minibaccarat 17 688,244 11,046,758 6.2%7 Other Games - (Page 2) 23 615,218 3,260,085 18.9%8 Subtotal - Table and Other Games 90 2,940,927 25,219,985$ 11.7%9 Poker 2 13,163
10 Total - Table and Other Games 92 2,954,090$
Slot Machines: 11 $ .01 and .02 Slot Machines 924 4,040,585$ 33,798,783$ 12.0%12 $ .05 Slot Machines 61 253,861 4,420,413 5.7%13 $ .25 Slot Machines 350 1,257,090 17,157,604 7.3%14 $ .50 Slot Machines 32 147,958 1,450,334 10.2%15 $ 1.00 Slot Machines 218 1,395,345 19,520,996 7.1%16 $ 5.00 Slot Machines 84 734,084 9,691,150 7.6%17 $ 25.00 Slot Machines 6 131,893 768,425 17.2%18 $100.00 Slot Machines 6 139,602 578,800 24.1%19 Multi-denominational Slot Machines 133 319,293 5,174,932 6.2%20 Other Slot Machines 24 107,679 1,616,836 6.7%21 Total - Slot Machines 1,838 8,527,390$ 94,178,273$ 9.1%22 Total Casino Win 11,481,480$
TAX ON GROSS REVENUE23 39,583,378$ 24 114,536,160 25 Year-to-Date Total Casino Win ...................................................................................................................... 154,119,538$ 26 Adjustments ………………………………………………………………………………………………… 27 Year-To-Date Gross Revenue ……………..………………………………………………………………… 154,119,538$ 28 Deduction for Eligible Promotional Gaming Credits ……………..………………………………………… 15,254,016$ 29 Year-To-Date Taxable Gross Revenue ……………………………………………………………………… 138,865,522$ 30 11,109,242$ 31 10,317,97532 791,267$
33 1,572,923$ 34 75,41635 36 37 38 1,601,886$
Under penalties of perjury, I declare that I have examined this report, and to the best of my knowledge and belief, it is true and complet
December 10, 2010DATE
Simulcasting Revenue for the Month...........................................................................Simulcasting Handle for the Month.............................................................................
Total Tax Required for this Month (line 30 less line 31)................................................................................
Total Progressive Payout Liability - End of Month....................................................Authorized Casino Square Footage - End of Month....................................................
Year-to-Date Table and Other Games Win .................................................................
Less - Total Tax Paid in Prior Months.........................................................................................................
ATLANTIC CITY HILTON(RIH ACQUISTIONS N.J.,LLC)MONTHLY GROSS REVENUE TAX RETURN
FOR THE MONTH OF NOVEMBER, 2010
Authorized Simulcasting Square Footage - End of Month..........................................
Promotional Gaming Credits Wagered for the Month.................................................
Year-to-Date Slot Machine Win .................................................................................
TITLE (LICENSE NUMBER)
JOANNE MCKENSIE
CASINO CONTROLLER (1231-11)
Gross Revenue Tax (8% of line 29).................................................................................................................
8/08 CCC-101
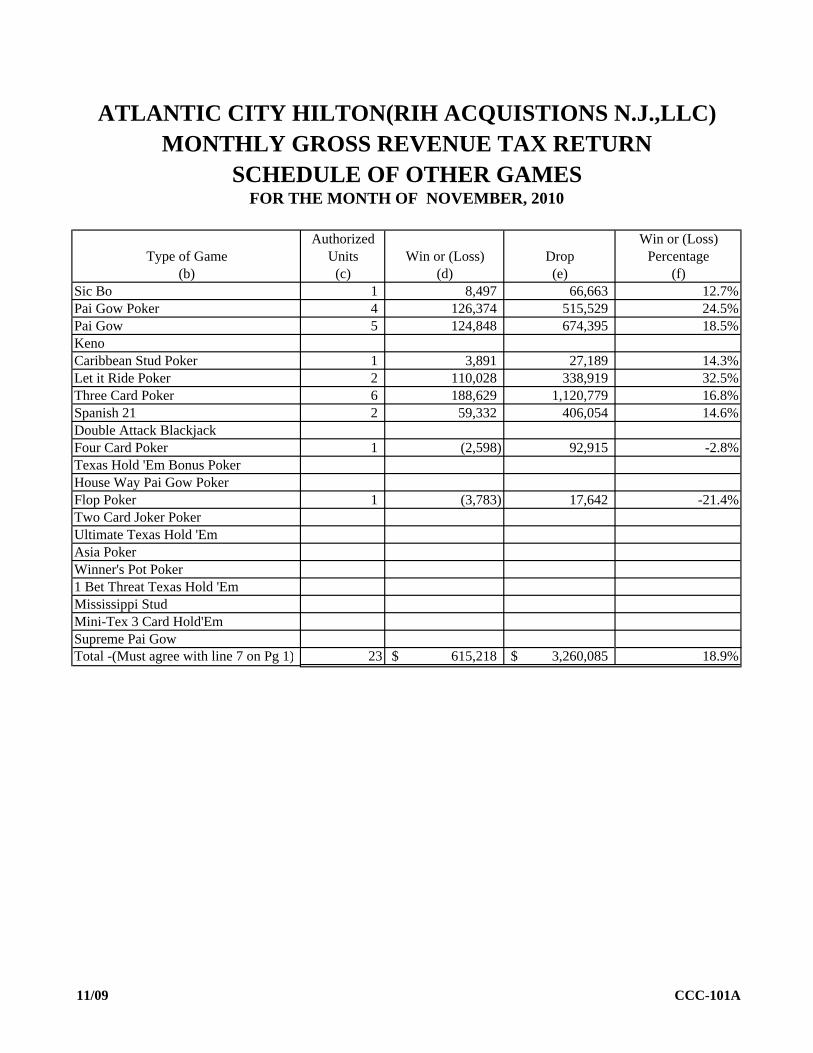
Authorized Win or (Loss)Type of Game Units Win or (Loss) Drop Percentage
(b) (c) (d) (e) (f)Sic Bo 1 8,497 66,663 12.7%Pai Gow Poker 4 126,374 515,529 24.5%Pai Gow 5 124,848 674,395 18.5%KenoCaribbean Stud Poker 1 3,891 27,189 14.3%Let it Ride Poker 2 110,028 338,919 32.5%Three Card Poker 6 188,629 1,120,779 16.8%Spanish 21 2 59,332 406,054 14.6%Double Attack BlackjackFour Card Poker 1 (2,598) 92,915 -2.8%Texas Hold 'Em Bonus PokerHouse Way Pai Gow PokerFlop Poker 1 (3,783) 17,642 -21.4%Two Card Joker PokerUltimate Texas Hold 'EmAsia PokerWinner's Pot Poker1 Bet Threat Texas Hold 'EmMississippi StudMini-Tex 3 Card Hold'EmSupreme Pai GowTotal -(Must agree with line 7 on Pg 1) 23 615,218$ 3,260,085$ 18.9%
MONTHLY GROSS REVENUE TAX RETURN
FOR THE MONTH OF NOVEMBER, 2010SCHEDULE OF OTHER GAMES
ATLANTIC CITY HILTON(RIH ACQUISTIONS N.J.,LLC)
11/09 CCC-101A
R0210111100
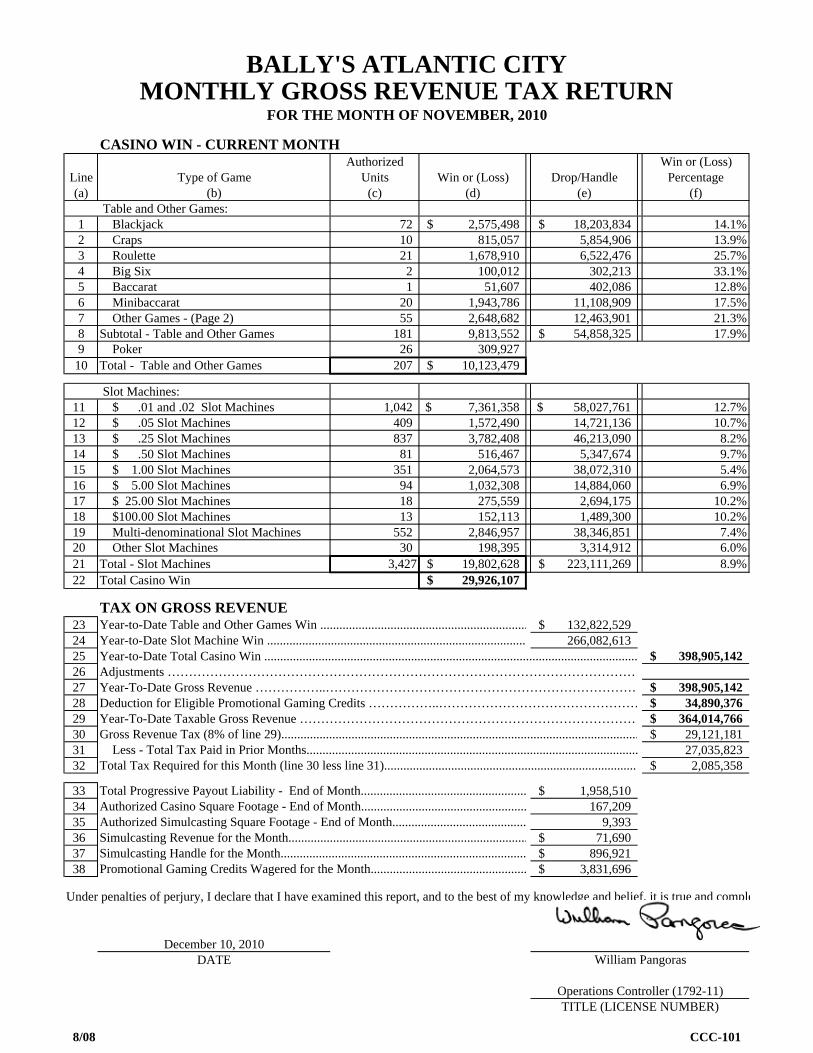
CASINO WIN - CURRENT MONTHAuthorized Win or (Loss)
Line Type of Game Units Win or (Loss) Drop/Handle Percentage(a) (b) (c) (d) (e) (f)
Table and Other Games:1 Blackjack 72 2,575,498$ 18,203,834$ 14.1%2 Craps 10 815,057 5,854,906 13.9%3 Roulette 21 1,678,910 6,522,476 25.7%4 Big Six 2 100,012 302,213 33.1%5 Baccarat 1 51,607 402,086 12.8%6 Minibaccarat 20 1,943,786 11,108,909 17.5%7 Other Games - (Page 2) 55 2,648,682 12,463,901 21.3%8 Subtotal - Table and Other Games 181 9,813,552 54,858,325$ 17.9%9 Poker 26 309,927
10 Total - Table and Other Games 207 10,123,479$
Slot Machines: 11 $ .01 and .02 Slot Machines 1,042 7,361,358$ 58,027,761$ 12.7%12 $ .05 Slot Machines 409 1,572,490 14,721,136 10.7%13 $ .25 Slot Machines 837 3,782,408 46,213,090 8.2%14 $ .50 Slot Machines 81 516,467 5,347,674 9.7%15 $ 1.00 Slot Machines 351 2,064,573 38,072,310 5.4%16 $ 5.00 Slot Machines 94 1,032,308 14,884,060 6.9%17 $ 25.00 Slot Machines 18 275,559 2,694,175 10.2%18 $100.00 Slot Machines 13 152,113 1,489,300 10.2%19 Multi-denominational Slot Machines 552 2,846,957 38,346,851 7.4%20 Other Slot Machines 30 198,395 3,314,912 6.0%21 Total - Slot Machines 3,427 19,802,628$ 223,111,269$ 8.9%22 Total Casino Win 29,926,107$
TAX ON GROSS REVENUE23 132,822,529$ 24 266,082,613 25 Year-to-Date Total Casino Win ..................................................................................................................... 398,905,142$ 26 Adjustments ………………………………………………………………………………………………… 27 Year-To-Date Gross Revenue ……………..………………………………………………………………… 398,905,142$ 28 Deduction for Eligible Promotional Gaming Credits ……………..………………………………………… 34,890,376$ 29 Year-To-Date Taxable Gross Revenue ……………………………………………………………………… 364,014,766$ 30 29,121,181$ 31 27,035,82332 2,085,358$
33 1,958,510$ 34 167,20935 9,39336 71,690$ 37 896,921$ 38 3,831,696$
Under penalties of perjury, I declare that I have examined this report, and to the best of my knowledge and belief, it is true and comple
December 10, 2010DATE
Less - Total Tax Paid in Prior Months........................................................................................................
Promotional Gaming Credits Wagered for the Month.................................................
Simulcasting Revenue for the Month...........................................................................Simulcasting Handle for the Month.............................................................................
Total Tax Required for this Month (line 30 less line 31)................................................................................
Total Progressive Payout Liability - End of Month....................................................Authorized Casino Square Footage - End of Month....................................................Authorized Simulcasting Square Footage - End of Month..........................................
Gross Revenue Tax (8% of line 29)................................................................................................................
Year-to-Date Slot Machine Win .................................................................................
BALLY'S ATLANTIC CITYMONTHLY GROSS REVENUE TAX RETURN
FOR THE MONTH OF NOVEMBER, 2010
Year-to-Date Table and Other Games Win .................................................................
TITLE (LICENSE NUMBER)
William Pangoras
Operations Controller (1792-11)
8/08 CCC-101
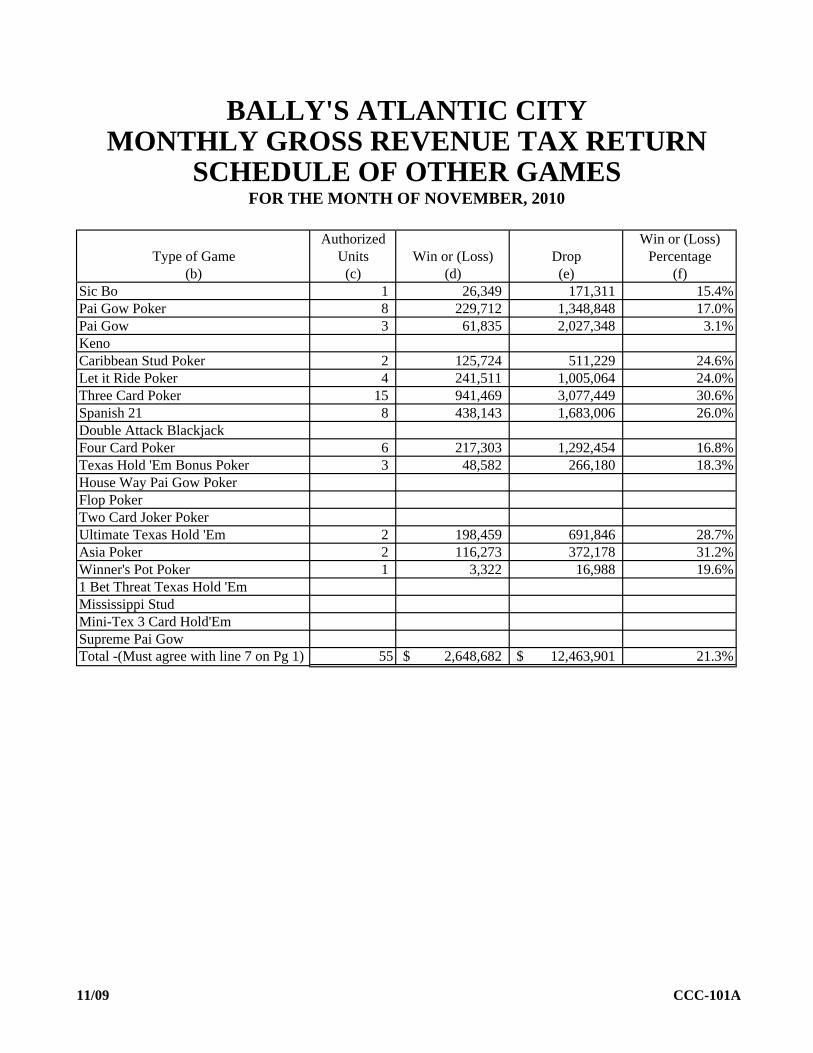
Authorized Win or (Loss)Type of Game Units Win or (Loss) Drop Percentage
(b) (c) (d) (e) (f)Sic Bo 1 26,349 171,311 15.4%Pai Gow Poker 8 229,712 1,348,848 17.0%Pai Gow 3 61,835 2,027,348 3.1%KenoCaribbean Stud Poker 2 125,724 511,229 24.6%Let it Ride Poker 4 241,511 1,005,064 24.0%Three Card Poker 15 941,469 3,077,449 30.6%Spanish 21 8 438,143 1,683,006 26.0%Double Attack BlackjackFour Card Poker 6 217,303 1,292,454 16.8%Texas Hold 'Em Bonus Poker 3 48,582 266,180 18.3%House Way Pai Gow PokerFlop PokerTwo Card Joker PokerUltimate Texas Hold 'Em 2 198,459 691,846 28.7%Asia Poker 2 116,273 372,178 31.2%Winner's Pot Poker 1 3,322 16,988 19.6%1 Bet Threat Texas Hold 'EmMississippi StudMini-Tex 3 Card Hold'EmSupreme Pai GowTotal -(Must agree with line 7 on Pg 1) 55 2,648,682$ 12,463,901$ 21.3%
MONTHLY GROSS REVENUE TAX RETURN
FOR THE MONTH OF NOVEMBER, 2010SCHEDULE OF OTHER GAMES
BALLY'S ATLANTIC CITY
11/09 CCC-101A
R5610111100
CASINO WIN - CURRENT MONTHAuthorized Win or (Loss)
Line Type of Game Units Win or (Loss) Drop/Handle Percentage(a) (b) (c) (d) (e) (f)
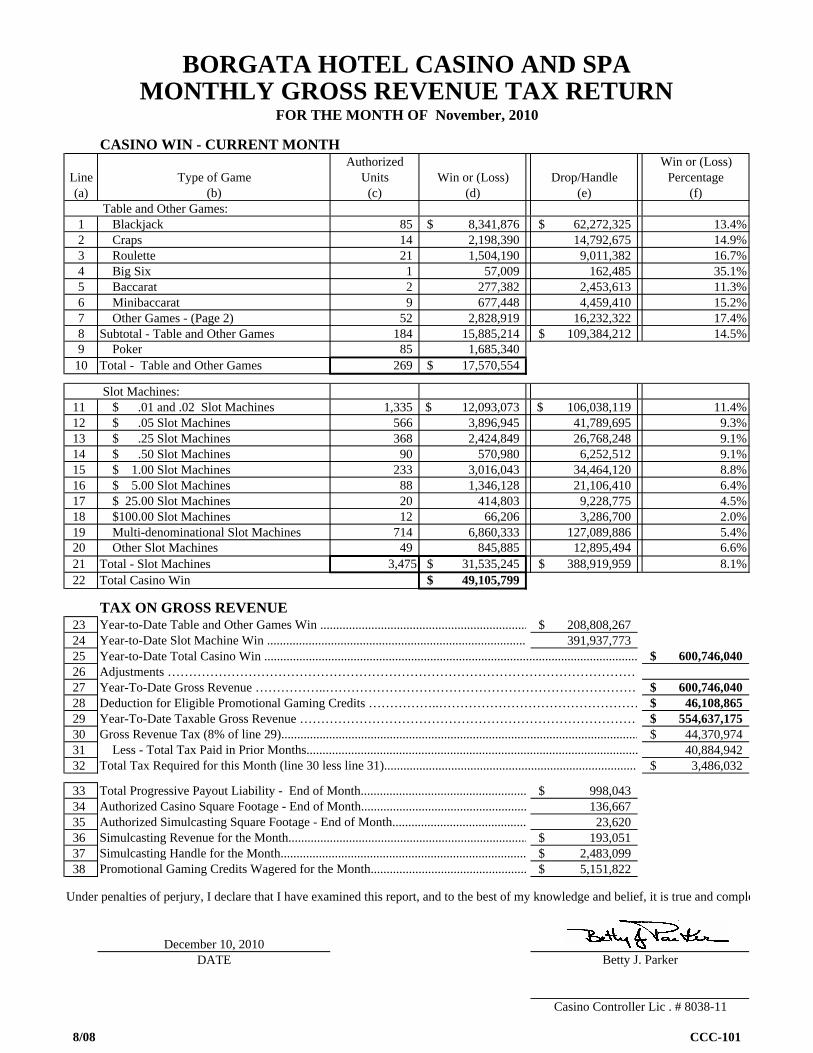
Table and Other Games:1 Blackjack 85 8,341,876$ 62,272,325$ 13.4%2 Craps 14 2,198,390 14,792,675 14.9%3 Roulette 21 1,504,190 9,011,382 16.7%4 Big Six 1 57,009 162,485 35.1%5 Baccarat 2 277,382 2,453,613 11.3%6 Minibaccarat 9 677,448 4,459,410 15.2%7 Other Games - (Page 2) 52 2,828,919 16,232,322 17.4%8 Subtotal - Table and Other Games 184 15,885,214 109,384,212$ 14.5%9 Poker 85 1,685,340
10 Total - Table and Other Games 269 17,570,554$
Slot Machines: 11 $ .01 and .02 Slot Machines 1,335 12,093,073$ 106,038,119$ 11.4%12 $ .05 Slot Machines 566 3,896,945 41,789,695 9.3%13 $ .25 Slot Machines 368 2,424,849 26,768,248 9.1%14 $ .50 Slot Machines 90 570,980 6,252,512 9.1%15 $ 1.00 Slot Machines 233 3,016,043 34,464,120 8.8%16 $ 5.00 Slot Machines 88 1,346,128 21,106,410 6.4%17 $ 25.00 Slot Machines 20 414,803 9,228,775 4.5%18 $100.00 Slot Machines 12 66,206 3,286,700 2.0%19 Multi-denominational Slot Machines 714 6,860,333 127,089,886 5.4%20 Other Slot Machines 49 845,885 12,895,494 6.6%21 Total - Slot Machines 3,475 31,535,245$ 388,919,959$ 8.1%22 Total Casino Win 49,105,799$
TAX ON GROSS REVENUE23 208,808,267$ 24 391,937,773 25 Year-to-Date Total Casino Win ..................................................................................................................... 600,746,040$ 26 Adjustments ………………………………………………………………………………………………… 27 Year-To-Date Gross Revenue ……………..………………………………………………………………… 600,746,040$ 28 Deduction for Eligible Promotional Gaming Credits ……………..………………………………………… 46,108,865$ 29 Year-To-Date Taxable Gross Revenue ……………………………………………………………………… 554,637,175$ 30 44,370,974$ 31 40,884,94232 3,486,032$
33 998,043$ 34 136,66735 23,62036 193,051$ 37 2,483,099$ 38 5,151,822$
Under penalties of perjury, I declare that I have examined this report, and to the best of my knowledge and belief, it is true and comple
December 10, 2010DATE
Promotional Gaming Credits Wagered for the Month.................................................
Total Tax Required for this Month (line 30 less line 31)................................................................................ Less - Total Tax Paid in Prior Months........................................................................................................
Casino Controller Lic . # 8038-11
Betty J. Parker
Simulcasting Handle for the Month.............................................................................Simulcasting Revenue for the Month...........................................................................
Total Progressive Payout Liability - End of Month....................................................
BORGATA HOTEL CASINO AND SPA
Gross Revenue Tax (8% of line 29)................................................................................................................
Authorized Casino Square Footage - End of Month....................................................
Year-to-Date Slot Machine Win .................................................................................Year-to-Date Table and Other Games Win .................................................................
MONTHLY GROSS REVENUE TAX RETURNFOR THE MONTH OF November, 2010
Authorized Simulcasting Square Footage - End of Month..........................................
8/08 CCC-101
Authorized Win or (Loss)Type of Game Units Win or (Loss) Drop Percentage
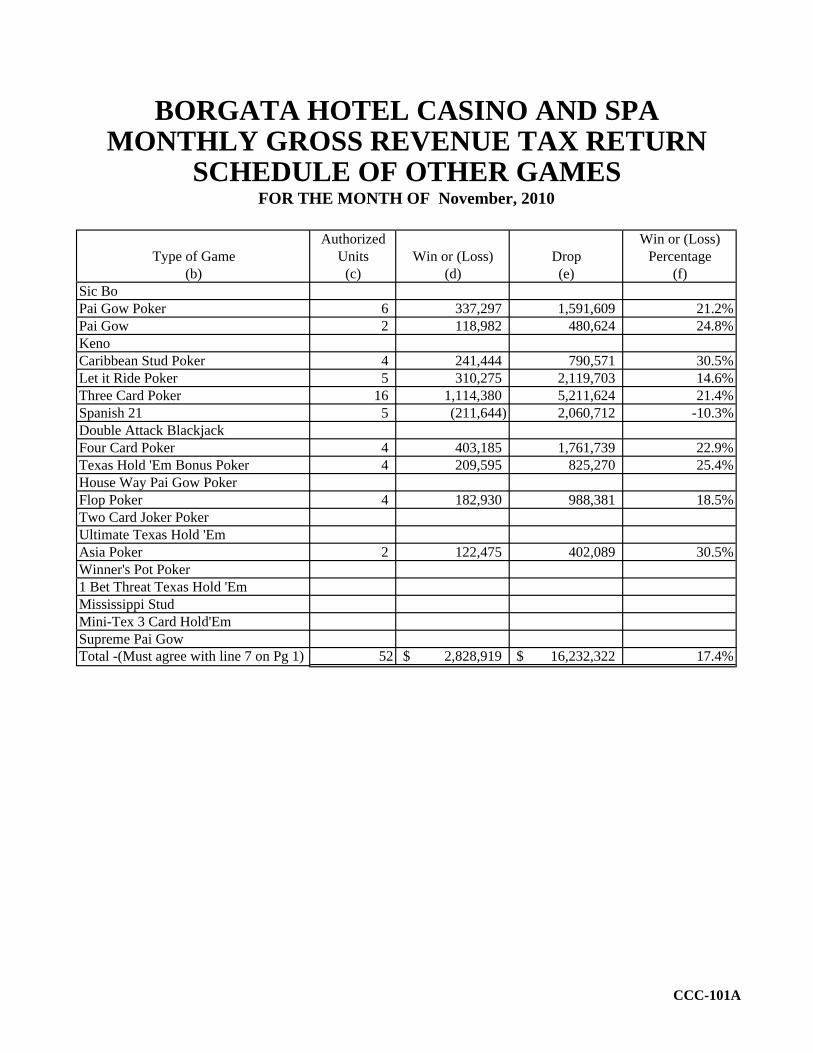
(b) (c) (d) (e) (f)Sic BoPai Gow Poker 6 337,297 1,591,609 21.2%Pai Gow 2 118,982 480,624 24.8%KenoCaribbean Stud Poker 4 241,444 790,571 30.5%Let it Ride Poker 5 310,275 2,119,703 14.6%Three Card Poker 16 1,114,380 5,211,624 21.4%Spanish 21 5 (211,644) 2,060,712 -10.3%Double Attack BlackjackFour Card Poker 4 403,185 1,761,739 22.9%Texas Hold 'Em Bonus Poker 4 209,595 825,270 25.4%House Way Pai Gow PokerFlop Poker 4 182,930 988,381 18.5%Two Card Joker PokerUltimate Texas Hold 'EmAsia Poker 2 122,475 402,089 30.5%Winner's Pot Poker1 Bet Threat Texas Hold 'EmMississippi StudMini-Tex 3 Card Hold'EmSupreme Pai GowTotal -(Must agree with line 7 on Pg 1) 52 2,828,919$ 16,232,322$ 17.4%
MONTHLY GROSS REVENUE TAX RETURN
FOR THE MONTH OF November, 2010SCHEDULE OF OTHER GAMES
BORGATA HOTEL CASINO AND SPA
CCC-101A
R0310111100
CASINO WIN - CURRENT MONTHAuthorized Win or (Loss)
Line Type of Game Units Win or (Loss) Drop/Handle Percentage(a) (b) (c) (d) (e) (f)
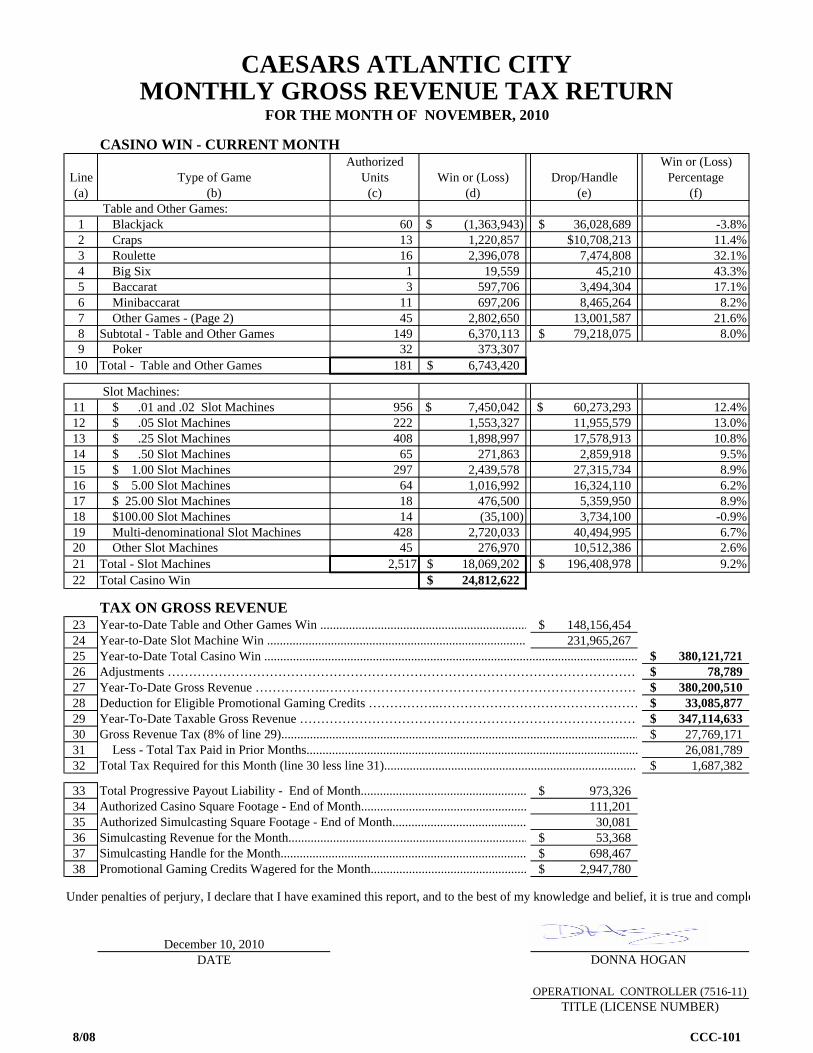
Table and Other Games:1 Blackjack 60 (1,363,943)$ 36,028,689$ -3.8%2 Craps 13 1,220,857 $10,708,213 11.4%3 Roulette 16 2,396,078 7,474,808 32.1%4 Big Six 1 19,559 45,210 43.3%5 Baccarat 3 597,706 3,494,304 17.1%6 Minibaccarat 11 697,206 8,465,264 8.2%7 Other Games - (Page 2) 45 2,802,650 13,001,587 21.6%8 Subtotal - Table and Other Games 149 6,370,113 79,218,075$ 8.0%9 Poker 32 373,307
10 Total - Table and Other Games 181 6,743,420$
Slot Machines: 11 $ .01 and .02 Slot Machines 956 7,450,042$ 60,273,293$ 12.4%12 $ .05 Slot Machines 222 1,553,327 11,955,579 13.0%13 $ .25 Slot Machines 408 1,898,997 17,578,913 10.8%14 $ .50 Slot Machines 65 271,863 2,859,918 9.5%15 $ 1.00 Slot Machines 297 2,439,578 27,315,734 8.9%16 $ 5.00 Slot Machines 64 1,016,992 16,324,110 6.2%17 $ 25.00 Slot Machines 18 476,500 5,359,950 8.9%18 $100.00 Slot Machines 14 (35,100) 3,734,100 -0.9%19 Multi-denominational Slot Machines 428 2,720,033 40,494,995 6.7%20 Other Slot Machines 45 276,970 10,512,386 2.6%21 Total - Slot Machines 2,517 18,069,202$ 196,408,978$ 9.2%22 Total Casino Win 24,812,622$
TAX ON GROSS REVENUE23 148,156,454$ 24 231,965,267 25 Year-to-Date Total Casino Win ..................................................................................................................... 380,121,721$ 26 Adjustments ………………………………………………………………………………………………… 78,789$ 27 Year-To-Date Gross Revenue ……………..………………………………………………………………… 380,200,510$ 28 Deduction for Eligible Promotional Gaming Credits ……………..………………………………………… 33,085,877$ 29 Year-To-Date Taxable Gross Revenue ……………………………………………………………………… 347,114,633$ 30 27,769,171$ 31 26,081,78932 1,687,382$
33 973,326$ 34 111,20135 30,08136 53,368$ 37 698,467$ 38 2,947,780$
Under penalties of perjury, I declare that I have examined this report, and to the best of my knowledge and belief, it is true and comple
December 10, 2010DATE
TITLE (LICENSE NUMBER)
DONNA HOGAN
OPERATIONAL CONTROLLER (7516-11)
Gross Revenue Tax (8% of line 29)................................................................................................................
Year-to-Date Slot Machine Win .................................................................................
CAESARS ATLANTIC CITYMONTHLY GROSS REVENUE TAX RETURN
FOR THE MONTH OF NOVEMBER, 2010
Year-to-Date Table and Other Games Win .................................................................
Less - Total Tax Paid in Prior Months........................................................................................................
Promotional Gaming Credits Wagered for the Month.................................................
Simulcasting Revenue for the Month...........................................................................Simulcasting Handle for the Month.............................................................................
Total Tax Required for this Month (line 30 less line 31)................................................................................
Total Progressive Payout Liability - End of Month....................................................Authorized Casino Square Footage - End of Month....................................................Authorized Simulcasting Square Footage - End of Month..........................................
8/08 CCC-101
Authorized Win or (Loss)Type of Game Units Win or (Loss) Drop Percentage
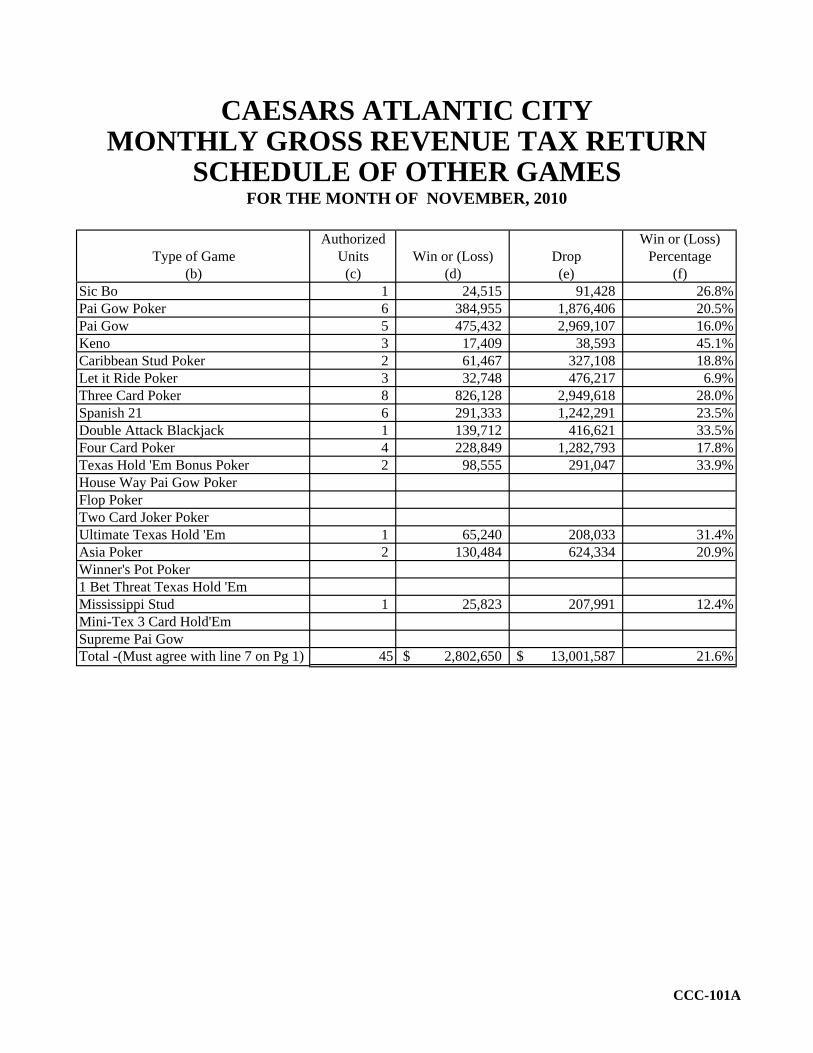
(b) (c) (d) (e) (f)Sic Bo 1 24,515 91,428 26.8%Pai Gow Poker 6 384,955 1,876,406 20.5%Pai Gow 5 475,432 2,969,107 16.0%Keno 3 17,409 38,593 45.1%Caribbean Stud Poker 2 61,467 327,108 18.8%Let it Ride Poker 3 32,748 476,217 6.9%Three Card Poker 8 826,128 2,949,618 28.0%Spanish 21 6 291,333 1,242,291 23.5%Double Attack Blackjack 1 139,712 416,621 33.5%Four Card Poker 4 228,849 1,282,793 17.8%Texas Hold 'Em Bonus Poker 2 98,555 291,047 33.9%House Way Pai Gow PokerFlop PokerTwo Card Joker PokerUltimate Texas Hold 'Em 1 65,240 208,033 31.4%Asia Poker 2 130,484 624,334 20.9%Winner's Pot Poker1 Bet Threat Texas Hold 'EmMississippi Stud 1 25,823 207,991 12.4%Mini-Tex 3 Card Hold'EmSupreme Pai GowTotal -(Must agree with line 7 on Pg 1) 45 2,802,650$ 13,001,587$ 21.6%
MONTHLY GROSS REVENUE TAX RETURN
FOR THE MONTH OF NOVEMBER, 2010SCHEDULE OF OTHER GAMES
CAESARS ATLANTIC CITY
CCC-101A
R1210111100
CASINO WIN - CURRENT MONTHAuthorized Win or (Loss)
Line Type of Game Units Win or (Loss) Drop/Handle Percentage(a) (b) (c) (d) (e) (f)
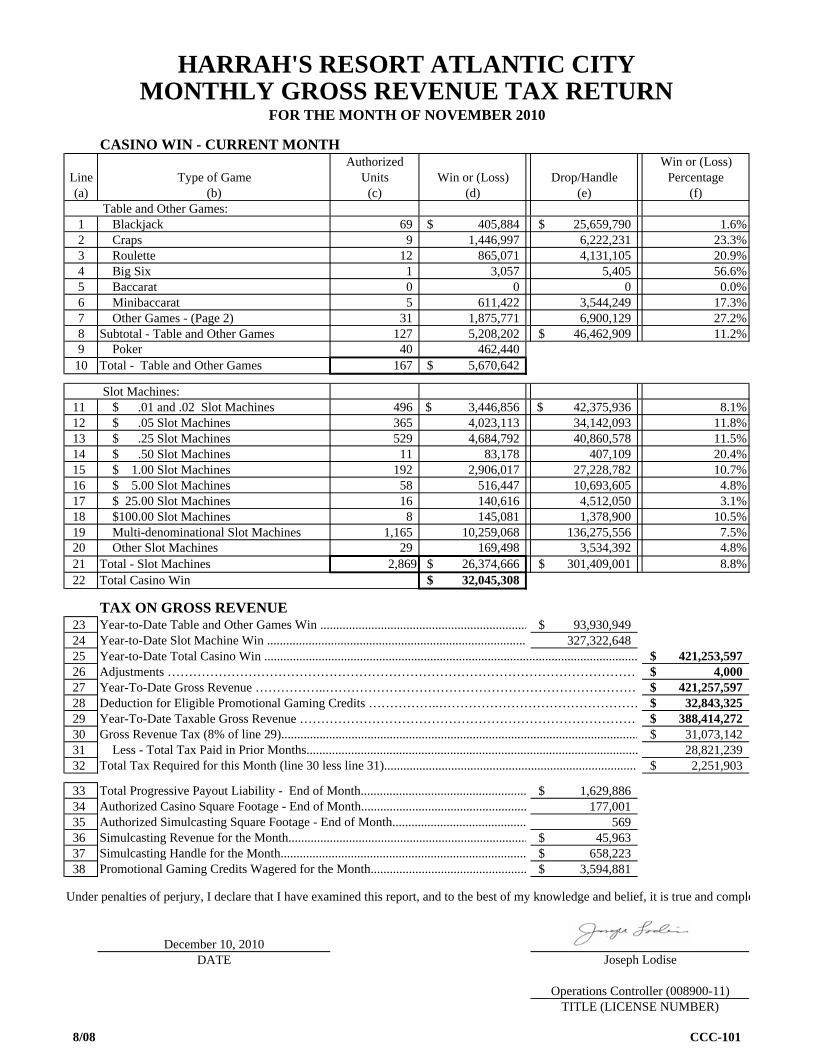
Table and Other Games:1 Blackjack 69 405,884$ 25,659,790$ 1.6%2 Craps 9 1,446,997 6,222,231 23.3%3 Roulette 12 865,071 4,131,105 20.9%4 Big Six 1 3,057 5,405 56.6%5 Baccarat 0 0 0 0.0%6 Minibaccarat 5 611,422 3,544,249 17.3%7 Other Games - (Page 2) 31 1,875,771 6,900,129 27.2%8 Subtotal - Table and Other Games 127 5,208,202 46,462,909$ 11.2%9 Poker 40 462,440
10 Total - Table and Other Games 167 5,670,642$
Slot Machines: 11 $ .01 and .02 Slot Machines 496 3,446,856$ 42,375,936$ 8.1%12 $ .05 Slot Machines 365 4,023,113 34,142,093 11.8%13 $ .25 Slot Machines 529 4,684,792 40,860,578 11.5%14 $ .50 Slot Machines 11 83,178 407,109 20.4%15 $ 1.00 Slot Machines 192 2,906,017 27,228,782 10.7%16 $ 5.00 Slot Machines 58 516,447 10,693,605 4.8%17 $ 25.00 Slot Machines 16 140,616 4,512,050 3.1%18 $100.00 Slot Machines 8 145,081 1,378,900 10.5%19 Multi-denominational Slot Machines 1,165 10,259,068 136,275,556 7.5%20 Other Slot Machines 29 169,498 3,534,392 4.8%21 Total - Slot Machines 2,869 26,374,666$ 301,409,001$ 8.8%22 Total Casino Win 32,045,308$
TAX ON GROSS REVENUE23 93,930,949$ 24 327,322,648 25 Year-to-Date Total Casino Win ..................................................................................................................... 421,253,597$ 26 Adjustments ………………………………………………………………………………………………… 4,000$ 27 Year-To-Date Gross Revenue ……………..………………………………………………………………… 421,257,597$ 28 Deduction for Eligible Promotional Gaming Credits ……………..………………………………………… 32,843,325$ 29 Year-To-Date Taxable Gross Revenue ……………………………………………………………………… 388,414,272$ 30 31,073,142$ 31 28,821,23932 2,251,903$
33 1,629,886$ 34 177,00135 56936 45,963$ 37 658,223$ 38 3,594,881$
Under penalties of perjury, I declare that I have examined this report, and to the best of my knowledge and belief, it is true and comple
December 10, 2010DATE
TITLE (LICENSE NUMBER)
Joseph Lodise
Operations Controller (008900-11)
Gross Revenue Tax (8% of line 29)................................................................................................................
Year-to-Date Slot Machine Win .................................................................................
HARRAH'S RESORT ATLANTIC CITYMONTHLY GROSS REVENUE TAX RETURN
FOR THE MONTH OF NOVEMBER 2010
Year-to-Date Table and Other Games Win .................................................................
Less - Total Tax Paid in Prior Months........................................................................................................
Promotional Gaming Credits Wagered for the Month.................................................
Simulcasting Revenue for the Month...........................................................................Simulcasting Handle for the Month.............................................................................
Total Tax Required for this Month (line 30 less line 31)................................................................................
Total Progressive Payout Liability - End of Month....................................................Authorized Casino Square Footage - End of Month....................................................Authorized Simulcasting Square Footage - End of Month..........................................
8/08 CCC-101
Authorized Win or (Loss)Type of Game Units Win or (Loss) Drop Percentage
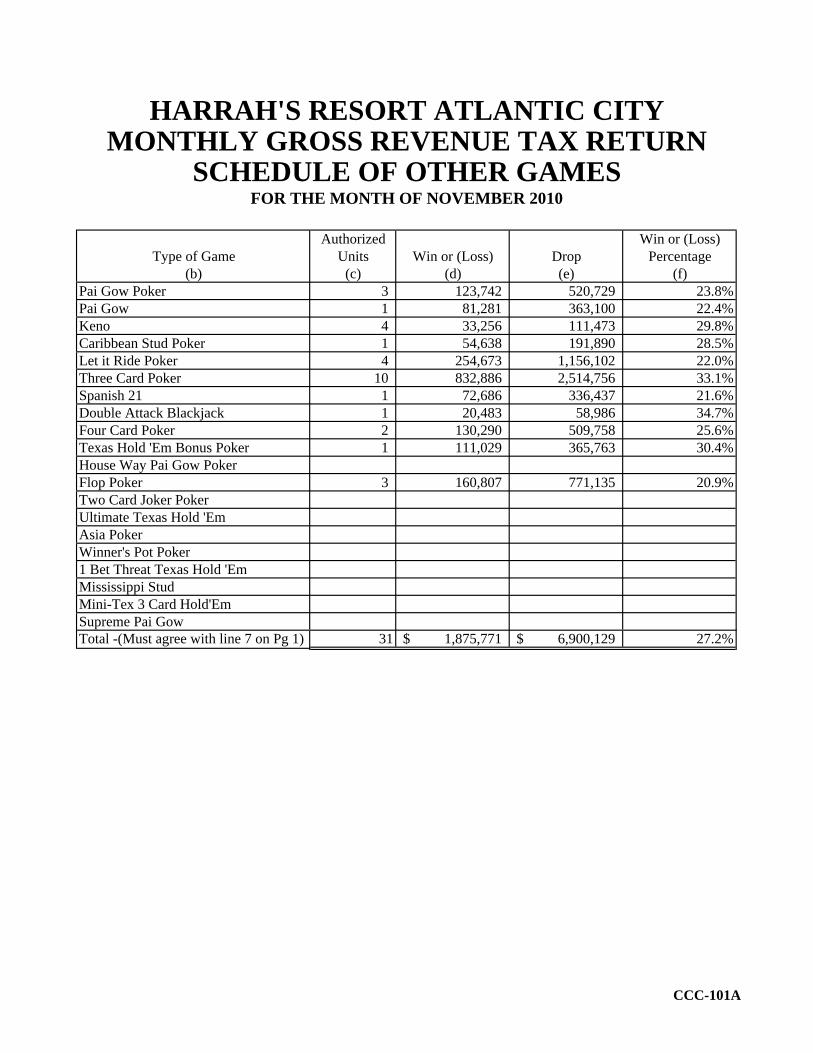
(b) (c) (d) (e) (f)Pai Gow Poker 3 123,742 520,729 23.8%Pai Gow 1 81,281 363,100 22.4%Keno 4 33,256 111,473 29.8%Caribbean Stud Poker 1 54,638 191,890 28.5%Let it Ride Poker 4 254,673 1,156,102 22.0%Three Card Poker 10 832,886 2,514,756 33.1%Spanish 21 1 72,686 336,437 21.6%Double Attack Blackjack 1 20,483 58,986 34.7%Four Card Poker 2 130,290 509,758 25.6%Texas Hold 'Em Bonus Poker 1 111,029 365,763 30.4%House Way Pai Gow PokerFlop Poker 3 160,807 771,135 20.9%Two Card Joker PokerUltimate Texas Hold 'EmAsia PokerWinner's Pot Poker1 Bet Threat Texas Hold 'EmMississippi StudMini-Tex 3 Card Hold'EmSupreme Pai GowTotal -(Must agree with line 7 on Pg 1) 31 1,875,771$ 6,900,129$ 27.2%
MONTHLY GROSS REVENUE TAX RETURN
FOR THE MONTH OF NOVEMBER 2010SCHEDULE OF OTHER GAMES
HARRAH'S RESORT ATLANTIC CITY
CCC-101A
R0110111100
CASINO WIN - CURRENT MONTHAuthorized Win or (Loss)
Line Type of Game Units Win or (Loss) Drop/Handle Percentage(a) (b) (c) (d) (e) (f)
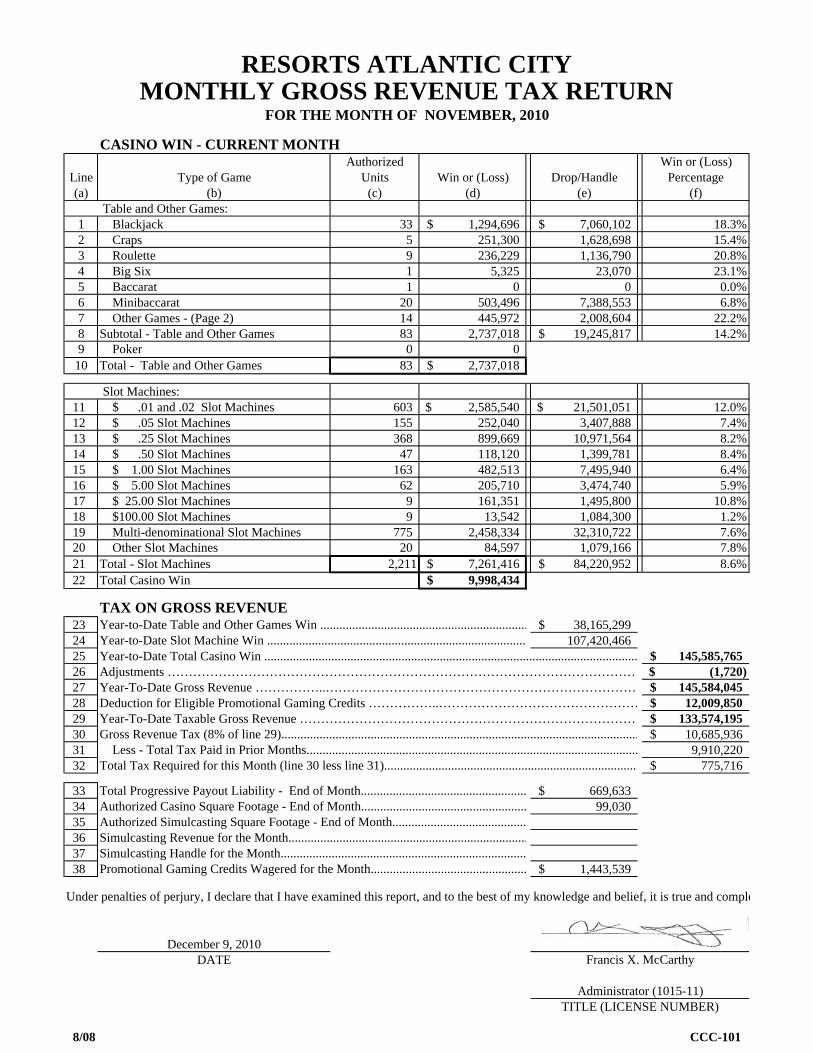
Table and Other Games:1 Blackjack 33 1,294,696$ 7,060,102$ 18.3%2 Craps 5 251,300 1,628,698 15.4%3 Roulette 9 236,229 1,136,790 20.8%4 Big Six 1 5,325 23,070 23.1%5 Baccarat 1 0 0 0.0%6 Minibaccarat 20 503,496 7,388,553 6.8%7 Other Games - (Page 2) 14 445,972 2,008,604 22.2%8 Subtotal - Table and Other Games 83 2,737,018 19,245,817$ 14.2%9 Poker 0 0
10 Total - Table and Other Games 83 2,737,018$
Slot Machines: 11 $ .01 and .02 Slot Machines 603 2,585,540$ 21,501,051$ 12.0%12 $ .05 Slot Machines 155 252,040 3,407,888 7.4%13 $ .25 Slot Machines 368 899,669 10,971,564 8.2%14 $ .50 Slot Machines 47 118,120 1,399,781 8.4%15 $ 1.00 Slot Machines 163 482,513 7,495,940 6.4%16 $ 5.00 Slot Machines 62 205,710 3,474,740 5.9%17 $ 25.00 Slot Machines 9 161,351 1,495,800 10.8%18 $100.00 Slot Machines 9 13,542 1,084,300 1.2%19 Multi-denominational Slot Machines 775 2,458,334 32,310,722 7.6%20 Other Slot Machines 20 84,597 1,079,166 7.8%21 Total - Slot Machines 2,211 7,261,416$ 84,220,952$ 8.6%22 Total Casino Win 9,998,434$
TAX ON GROSS REVENUE23 38,165,299$ 24 107,420,466 25 Year-to-Date Total Casino Win ..................................................................................................................... 145,585,765$ 26 Adjustments ………………………………………………………………………………………………… (1,720)$ 27 Year-To-Date Gross Revenue ……………..………………………………………………………………… 145,584,045$ 28 Deduction for Eligible Promotional Gaming Credits ……………..………………………………………… 12,009,850$ 29 Year-To-Date Taxable Gross Revenue ……………………………………………………………………… 133,574,195$ 30 10,685,936$ 31 9,910,22032 775,716$
33 669,633$ 34 99,03035 36 37 38 1,443,539$
Under penalties of perjury, I declare that I have examined this report, and to the best of my knowledge and belief, it is true and comple
December 9, 2010DATE
Gross Revenue Tax (8% of line 29)................................................................................................................ Less - Total Tax Paid in Prior Months........................................................................................................
Promotional Gaming Credits Wagered for the Month.................................................
TITLE (LICENSE NUMBER)
Francis X. McCarthy
Administrator (1015-11)
MONTHLY GROSS REVENUE TAX RETURNFOR THE MONTH OF NOVEMBER, 2010
Year-to-Date Table and Other Games Win .................................................................
Simulcasting Revenue for the Month...........................................................................Simulcasting Handle for the Month.............................................................................
Total Tax Required for this Month (line 30 less line 31)................................................................................
Total Progressive Payout Liability - End of Month....................................................Authorized Casino Square Footage - End of Month....................................................Authorized Simulcasting Square Footage - End of Month..........................................
Year-to-Date Slot Machine Win .................................................................................
RESORTS ATLANTIC CITY
8/08 CCC-101
Authorized Win or (Loss)Type of Game Units Win or (Loss) Drop Percentage
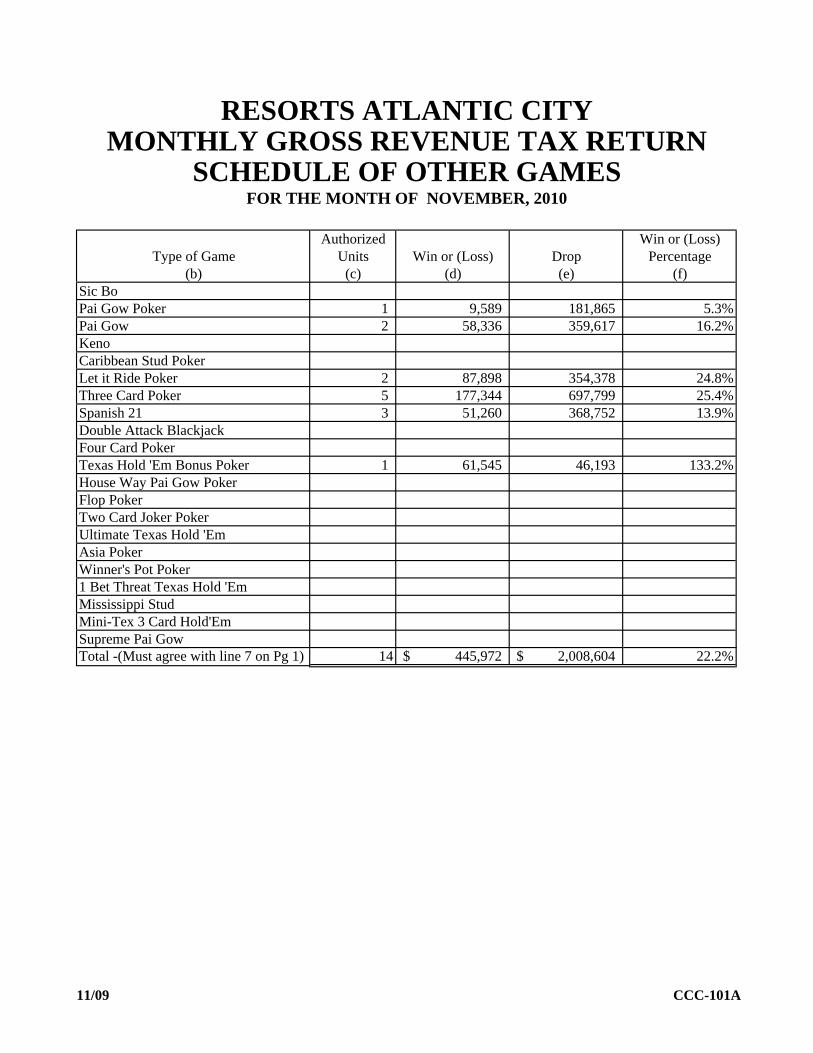
(b) (c) (d) (e) (f)Sic BoPai Gow Poker 1 9,589 181,865 5.3%Pai Gow 2 58,336 359,617 16.2%KenoCaribbean Stud PokerLet it Ride Poker 2 87,898 354,378 24.8%Three Card Poker 5 177,344 697,799 25.4%Spanish 21 3 51,260 368,752 13.9%Double Attack BlackjackFour Card PokerTexas Hold 'Em Bonus Poker 1 61,545 46,193 133.2%House Way Pai Gow PokerFlop PokerTwo Card Joker PokerUltimate Texas Hold 'EmAsia PokerWinner's Pot Poker1 Bet Threat Texas Hold 'EmMississippi StudMini-Tex 3 Card Hold'EmSupreme Pai GowTotal -(Must agree with line 7 on Pg 1) 14 445,972$ 2,008,604$ 22.2%
MONTHLY GROSS REVENUE TAX RETURN
FOR THE MONTH OF NOVEMBER, 2010SCHEDULE OF OTHER GAMES
RESORTS ATLANTIC CITY
11/09 CCC-101A
R3310111100
CASINO WIN - CURRENT MONTHAuthorized Win or (Loss)
Line Type of Game Units Win or (Loss) Drop/Handle Percentage(a) (b) (c) (d) (e) (f)
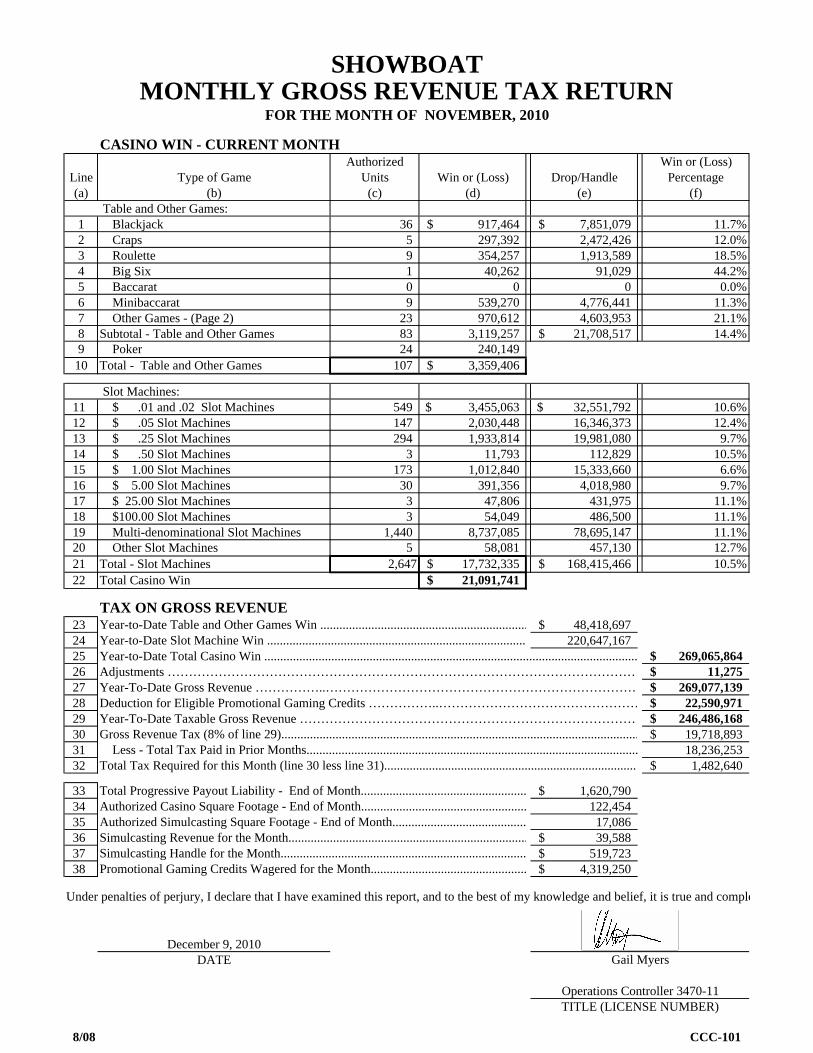
Table and Other Games:1 Blackjack 36 917,464$ 7,851,079$ 11.7%2 Craps 5 297,392 2,472,426 12.0%3 Roulette 9 354,257 1,913,589 18.5%4 Big Six 1 40,262 91,029 44.2%5 Baccarat 0 0 0 0.0%6 Minibaccarat 9 539,270 4,776,441 11.3%7 Other Games - (Page 2) 23 970,612 4,603,953 21.1%8 Subtotal - Table and Other Games 83 3,119,257 21,708,517$ 14.4%9 Poker 24 240,149
10 Total - Table and Other Games 107 3,359,406$
Slot Machines: 11 $ .01 and .02 Slot Machines 549 3,455,063$ 32,551,792$ 10.6%12 $ .05 Slot Machines 147 2,030,448 16,346,373 12.4%13 $ .25 Slot Machines 294 1,933,814 19,981,080 9.7%14 $ .50 Slot Machines 3 11,793 112,829 10.5%15 $ 1.00 Slot Machines 173 1,012,840 15,333,660 6.6%16 $ 5.00 Slot Machines 30 391,356 4,018,980 9.7%17 $ 25.00 Slot Machines 3 47,806 431,975 11.1%18 $100.00 Slot Machines 3 54,049 486,500 11.1%19 Multi-denominational Slot Machines 1,440 8,737,085 78,695,147 11.1%20 Other Slot Machines 5 58,081 457,130 12.7%21 Total - Slot Machines 2,647 17,732,335$ 168,415,466$ 10.5%22 Total Casino Win 21,091,741$
TAX ON GROSS REVENUE23 48,418,697$ 24 220,647,167 25 Year-to-Date Total Casino Win ..................................................................................................................... 269,065,864$ 26 Adjustments ………………………………………………………………………………………………… 11,275$ 27 Year-To-Date Gross Revenue ……………..………………………………………………………………… 269,077,139$ 28 Deduction for Eligible Promotional Gaming Credits ……………..………………………………………… 22,590,971$ 29 Year-To-Date Taxable Gross Revenue ……………………………………………………………………… 246,486,168$ 30 19,718,893$ 31 18,236,25332 1,482,640$
33 1,620,790$ 34 122,45435 17,08636 39,588$ 37 519,723$ 38 4,319,250$
Under penalties of perjury, I declare that I have examined this report, and to the best of my knowledge and belief, it is true and comple
December 9, 2010DATE
Less - Total Tax Paid in Prior Months........................................................................................................
Promotional Gaming Credits Wagered for the Month.................................................
Simulcasting Revenue for the Month...........................................................................Simulcasting Handle for the Month.............................................................................
Total Tax Required for this Month (line 30 less line 31)................................................................................
Total Progressive Payout Liability - End of Month....................................................Authorized Casino Square Footage - End of Month....................................................Authorized Simulcasting Square Footage - End of Month..........................................
Gross Revenue Tax (8% of line 29)................................................................................................................
Year-to-Date Slot Machine Win .................................................................................
SHOWBOATMONTHLY GROSS REVENUE TAX RETURN
FOR THE MONTH OF NOVEMBER, 2010
Year-to-Date Table and Other Games Win .................................................................
TITLE (LICENSE NUMBER)
Gail Myers
Operations Controller 3470-11
8/08 CCC-101
Authorized Win or (Loss)Type of Game Units Win or (Loss) Drop Percentage
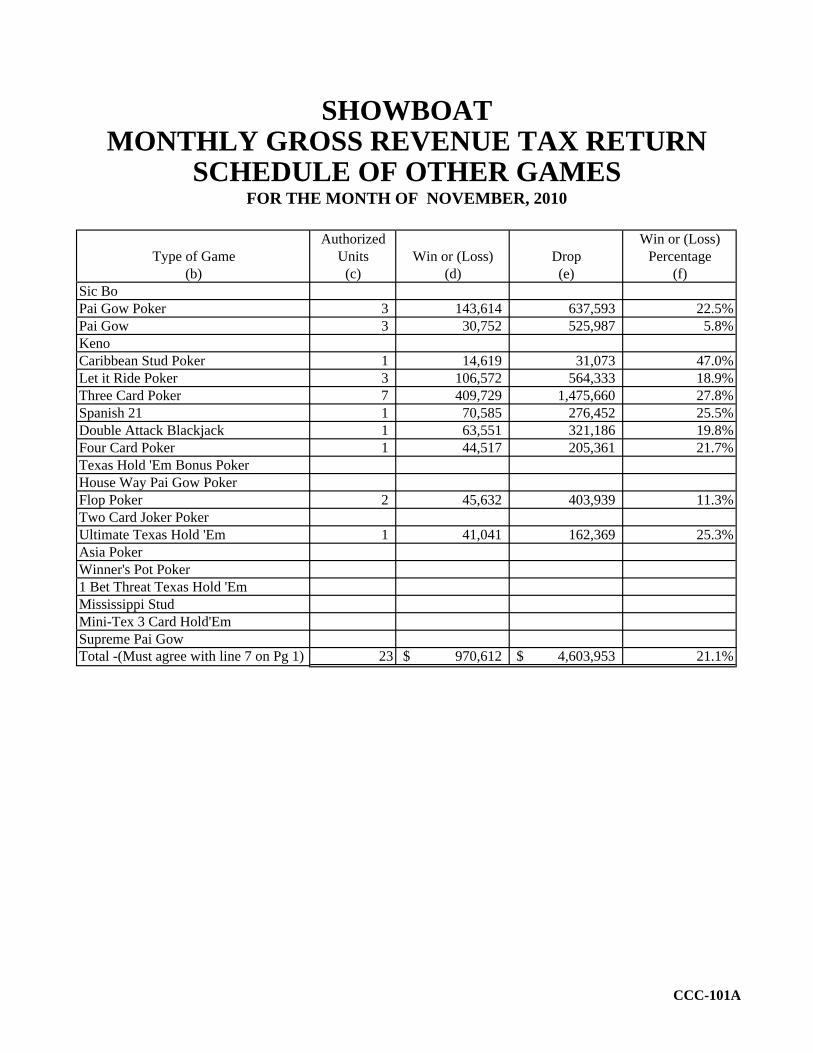
(b) (c) (d) (e) (f)Sic BoPai Gow Poker 3 143,614 637,593 22.5%Pai Gow 3 30,752 525,987 5.8%KenoCaribbean Stud Poker 1 14,619 31,073 47.0%Let it Ride Poker 3 106,572 564,333 18.9%Three Card Poker 7 409,729 1,475,660 27.8%Spanish 21 1 70,585 276,452 25.5%Double Attack Blackjack 1 63,551 321,186 19.8%Four Card Poker 1 44,517 205,361 21.7%Texas Hold 'Em Bonus PokerHouse Way Pai Gow PokerFlop Poker 2 45,632 403,939 11.3%Two Card Joker PokerUltimate Texas Hold 'Em 1 41,041 162,369 25.3%Asia PokerWinner's Pot Poker1 Bet Threat Texas Hold 'EmMississippi StudMini-Tex 3 Card Hold'EmSupreme Pai GowTotal -(Must agree with line 7 on Pg 1) 23 970,612$ 4,603,953$ 21.1%
MONTHLY GROSS REVENUE TAX RETURN
FOR THE MONTH OF NOVEMBER, 2010SCHEDULE OF OTHER GAMES
SHOWBOAT
CCC-101A
R0810111100
CASINO WIN - CURRENT MONTHAuthorized Win or (Loss)
Line Type of Game Units Win or (Loss) Drop/Handle Percentage(a) (b) (c) (d) (e) (f)
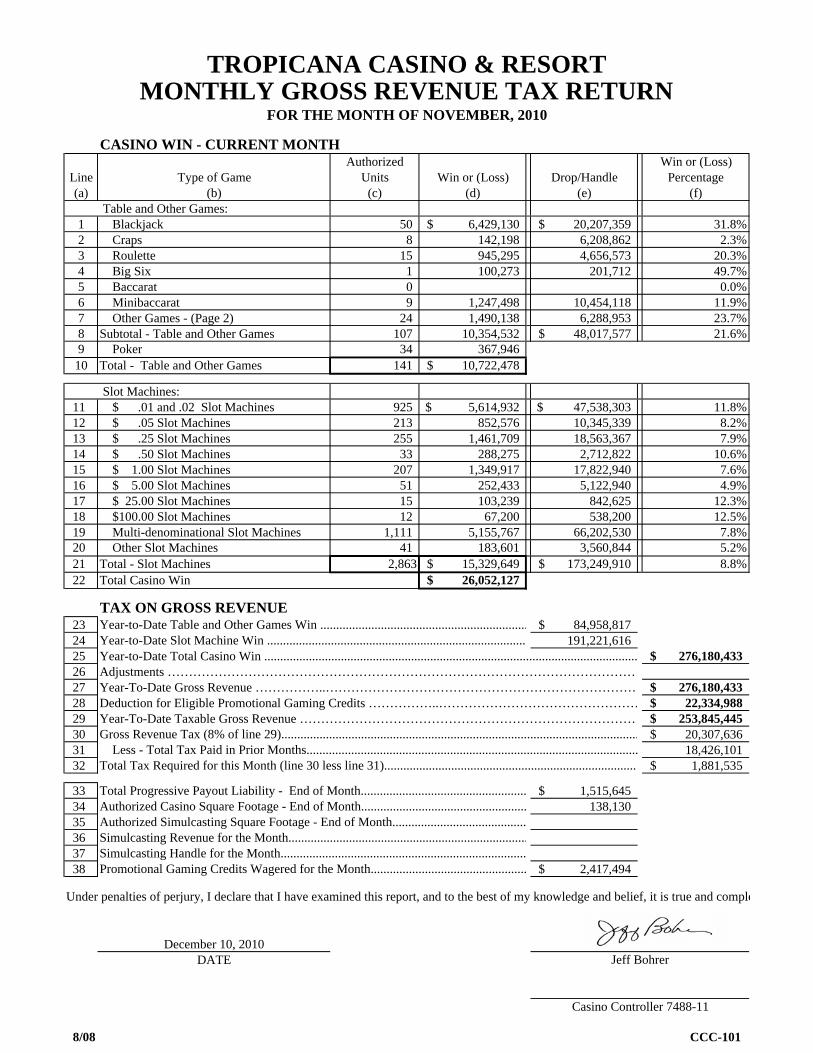
Table and Other Games:1 Blackjack 50 6,429,130$ 20,207,359$ 31.8%2 Craps 8 142,198 6,208,862 2.3%3 Roulette 15 945,295 4,656,573 20.3%4 Big Six 1 100,273 201,712 49.7%5 Baccarat 0 0.0%6 Minibaccarat 9 1,247,498 10,454,118 11.9%7 Other Games - (Page 2) 24 1,490,138 6,288,953 23.7%8 Subtotal - Table and Other Games 107 10,354,532 48,017,577$ 21.6%9 Poker 34 367,946
10 Total - Table and Other Games 141 10,722,478$
Slot Machines: 11 $ .01 and .02 Slot Machines 925 5,614,932$ 47,538,303$ 11.8%12 $ .05 Slot Machines 213 852,576 10,345,339 8.2%13 $ .25 Slot Machines 255 1,461,709 18,563,367 7.9%14 $ .50 Slot Machines 33 288,275 2,712,822 10.6%15 $ 1.00 Slot Machines 207 1,349,917 17,822,940 7.6%16 $ 5.00 Slot Machines 51 252,433 5,122,940 4.9%17 $ 25.00 Slot Machines 15 103,239 842,625 12.3%18 $100.00 Slot Machines 12 67,200 538,200 12.5%19 Multi-denominational Slot Machines 1,111 5,155,767 66,202,530 7.8%20 Other Slot Machines 41 183,601 3,560,844 5.2%21 Total - Slot Machines 2,863 15,329,649$ 173,249,910$ 8.8%22 Total Casino Win 26,052,127$
TAX ON GROSS REVENUE23 84,958,817$ 24 191,221,616 25 Year-to-Date Total Casino Win ..................................................................................................................... 276,180,433$ 26 Adjustments ………………………………………………………………………………………………… 27 Year-To-Date Gross Revenue ……………..………………………………………………………………… 276,180,433$ 28 Deduction for Eligible Promotional Gaming Credits ……………..………………………………………… 22,334,988$ 29 Year-To-Date Taxable Gross Revenue ……………………………………………………………………… 253,845,445$ 30 20,307,636$ 31 18,426,10132 1,881,535$
33 1,515,645$ 34 138,13035 36 37 38 2,417,494$
Under penalties of perjury, I declare that I have examined this report, and to the best of my knowledge and belief, it is true and comple
December 10, 2010DATE
MONTHLY GROSS REVENUE TAX RETURN
Less - Total Tax Paid in Prior Months........................................................................................................
FOR THE MONTH OF NOVEMBER, 2010
Year-to-Date Slot Machine Win .................................................................................Year-to-Date Table and Other Games Win .................................................................
Simulcasting Revenue for the Month...........................................................................Simulcasting Handle for the Month.............................................................................
Total Tax Required for this Month (line 30 less line 31)................................................................................
Total Progressive Payout Liability - End of Month....................................................
Gross Revenue Tax (8% of line 29)................................................................................................................
Authorized Casino Square Footage - End of Month....................................................
TROPICANA CASINO & RESORT
Authorized Simulcasting Square Footage - End of Month..........................................
Promotional Gaming Credits Wagered for the Month.................................................
Casino Controller 7488-11
Jeff Bohrer
8/08 CCC-101
Authorized Win or (Loss)Type of Game Units Win or (Loss) Drop Percentage
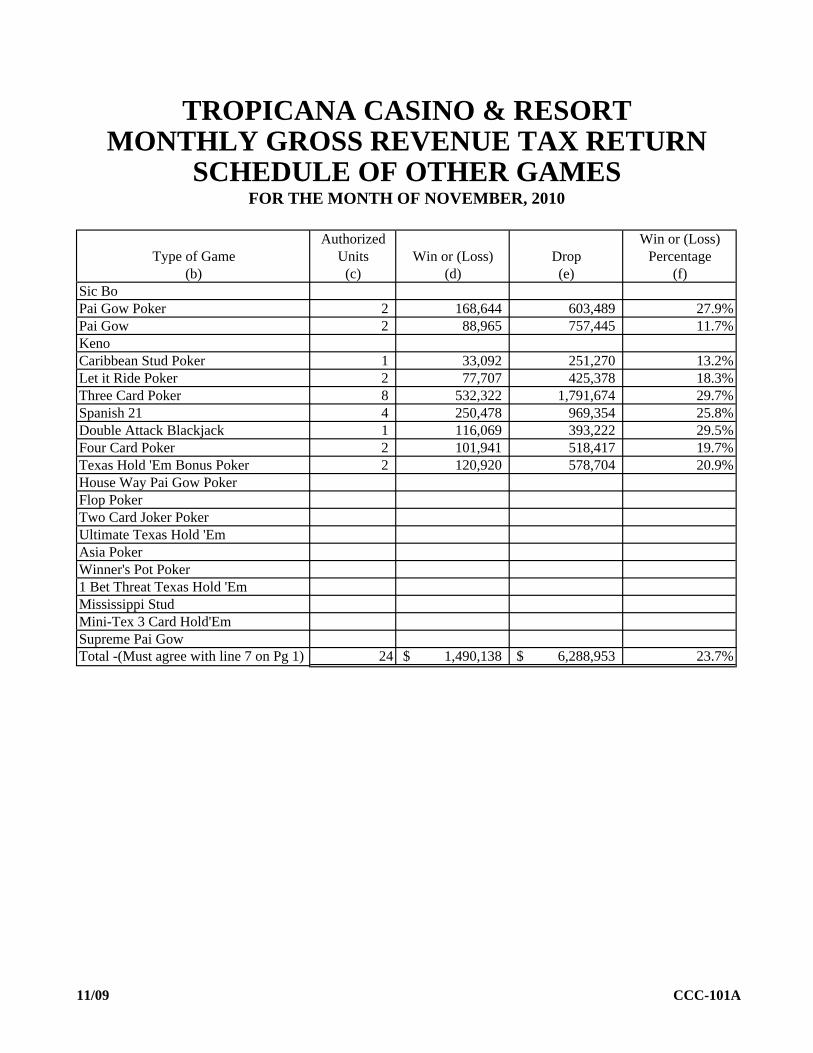
(b) (c) (d) (e) (f)Sic BoPai Gow Poker 2 168,644 603,489 27.9%Pai Gow 2 88,965 757,445 11.7%KenoCaribbean Stud Poker 1 33,092 251,270 13.2%Let it Ride Poker 2 77,707 425,378 18.3%Three Card Poker 8 532,322 1,791,674 29.7%Spanish 21 4 250,478 969,354 25.8%Double Attack Blackjack 1 116,069 393,222 29.5%Four Card Poker 2 101,941 518,417 19.7%Texas Hold 'Em Bonus Poker 2 120,920 578,704 20.9%House Way Pai Gow PokerFlop PokerTwo Card Joker PokerUltimate Texas Hold 'EmAsia PokerWinner's Pot Poker1 Bet Threat Texas Hold 'EmMississippi StudMini-Tex 3 Card Hold'EmSupreme Pai GowTotal -(Must agree with line 7 on Pg 1) 24 1,490,138$ 6,288,953$ 23.7%
MONTHLY GROSS REVENUE TAX RETURN
FOR THE MONTH OF NOVEMBER, 2010SCHEDULE OF OTHER GAMES
TROPICANA CASINO & RESORT
11/09 CCC-101A
R3510111100
CASINO WIN - CURRENT MONTHAuthorized Win or (Loss)
Line Type of Game Units Win or (Loss) Drop/Handle Percentage(a) (b) (c) (d) (e) (f)
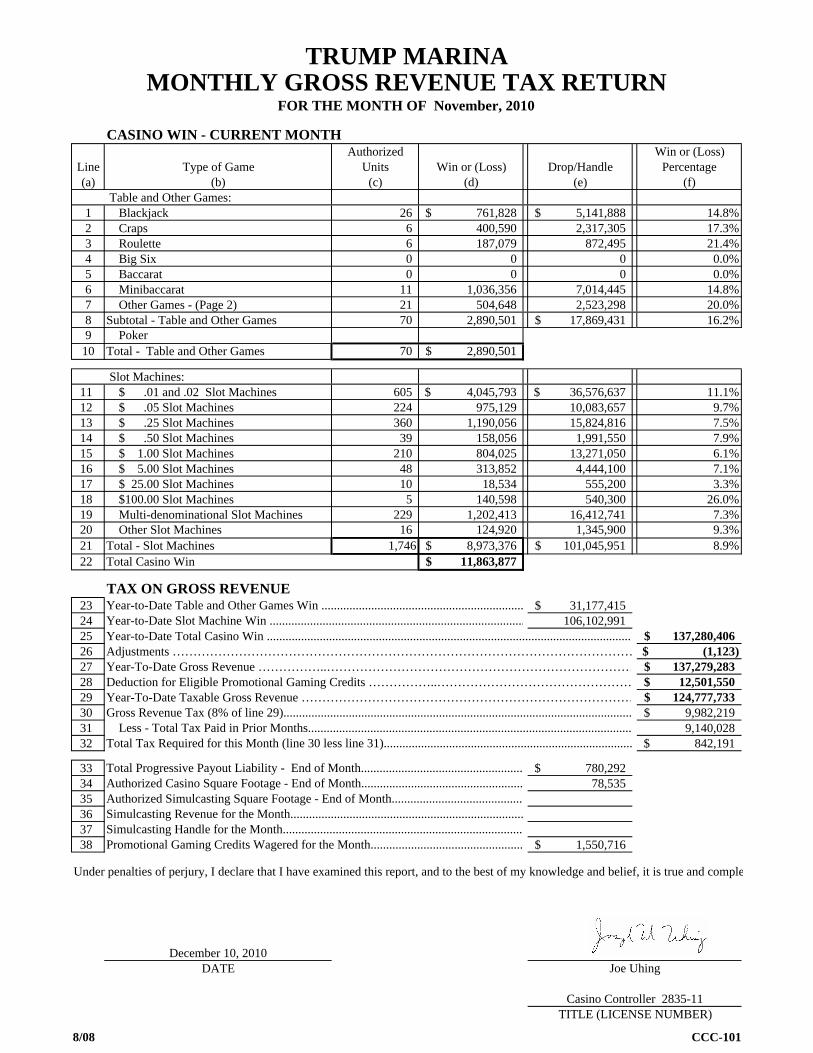
Table and Other Games:1 Blackjack 26 761,828$ 5,141,888$ 14.8%2 Craps 6 400,590 2,317,305 17.3%3 Roulette 6 187,079 872,495 21.4%4 Big Six 0 0 0 0.0%5 Baccarat 0 0 0 0.0%6 Minibaccarat 11 1,036,356 7,014,445 14.8%7 Other Games - (Page 2) 21 504,648 2,523,298 20.0%8 Subtotal - Table and Other Games 70 2,890,501 17,869,431$ 16.2%9 Poker
10 Total - Table and Other Games 70 2,890,501$
Slot Machines: 11 $ .01 and .02 Slot Machines 605 4,045,793$ 36,576,637$ 11.1%12 $ .05 Slot Machines 224 975,129 10,083,657 9.7%13 $ .25 Slot Machines 360 1,190,056 15,824,816 7.5%14 $ .50 Slot Machines 39 158,056 1,991,550 7.9%15 $ 1.00 Slot Machines 210 804,025 13,271,050 6.1%16 $ 5.00 Slot Machines 48 313,852 4,444,100 7.1%17 $ 25.00 Slot Machines 10 18,534 555,200 3.3%18 $100.00 Slot Machines 5 140,598 540,300 26.0%19 Multi-denominational Slot Machines 229 1,202,413 16,412,741 7.3%20 Other Slot Machines 16 124,920 1,345,900 9.3%21 Total - Slot Machines 1,746 8,973,376$ 101,045,951$ 8.9%22 Total Casino Win 11,863,877$
TAX ON GROSS REVENUE23 31,177,415$ 24 106,102,991 25 Year-to-Date Total Casino Win ...................................................................................................................... 137,280,406$ 26 Adjustments ………………………………………………………………………………………………… (1,123)$ 27 Year-To-Date Gross Revenue ……………..………………………………………………………………… 137,279,283$ 28 Deduction for Eligible Promotional Gaming Credits ……………..………………………………………… 12,501,550$ 29 Year-To-Date Taxable Gross Revenue ……………………………………………………………………… 124,777,733$ 30 9,982,219$ 31 9,140,02832 842,191$
33 780,292$ 34 78,53535 36 37 38 1,550,716$
Under penalties of perjury, I declare that I have examined this report, and to the best of my knowledge and belief, it is true and comple
December 10, 2010DATE
Promotional Gaming Credits Wagered for the Month.................................................
Year-to-Date Slot Machine Win ..................................................................................
Total Tax Required for this Month (line 30 less line 31)................................................................................
Year-to-Date Table and Other Games Win .................................................................
Gross Revenue Tax (8% of line 29)................................................................................................................
Authorized Casino Square Footage - End of Month....................................................Authorized Simulcasting Square Footage - End of Month..........................................
TITLE (LICENSE NUMBER)
Joe Uhing
Casino Controller 2835-11
Simulcasting Handle for the Month.............................................................................Simulcasting Revenue for the Month...........................................................................
Total Progressive Payout Liability - End of Month....................................................
TRUMP MARINAMONTHLY GROSS REVENUE TAX RETURN
Less - Total Tax Paid in Prior Months........................................................................................................
FOR THE MONTH OF November, 2010
8/08 CCC-101
Authorized Win or (Loss)Type of Game Units Win or (Loss) Drop Percentage
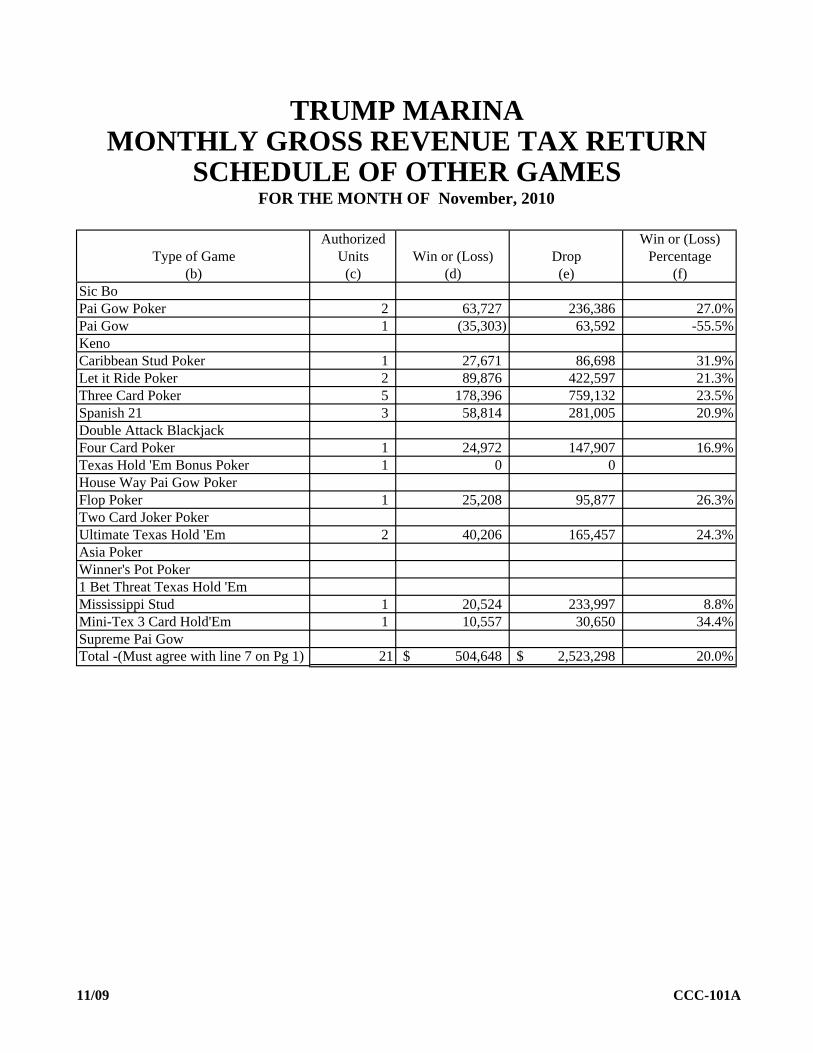
(b) (c) (d) (e) (f)Sic BoPai Gow Poker 2 63,727 236,386 27.0%Pai Gow 1 (35,303) 63,592 -55.5%KenoCaribbean Stud Poker 1 27,671 86,698 31.9%Let it Ride Poker 2 89,876 422,597 21.3%Three Card Poker 5 178,396 759,132 23.5%Spanish 21 3 58,814 281,005 20.9%Double Attack BlackjackFour Card Poker 1 24,972 147,907 16.9%Texas Hold 'Em Bonus Poker 1 0 0House Way Pai Gow PokerFlop Poker 1 25,208 95,877 26.3%Two Card Joker PokerUltimate Texas Hold 'Em 2 40,206 165,457 24.3%Asia PokerWinner's Pot Poker1 Bet Threat Texas Hold 'EmMississippi Stud 1 20,524 233,997 8.8%Mini-Tex 3 Card Hold'Em 1 10,557 30,650 34.4%Supreme Pai GowTotal -(Must agree with line 7 on Pg 1) 21 504,648$ 2,523,298$ 20.0%
MONTHLY GROSS REVENUE TAX RETURN
FOR THE MONTH OF November, 2010SCHEDULE OF OTHER GAMES
TRUMP MARINA
11/09 CCC-101A
R2810111100
CASINO WIN - CURRENT MONTHAuthorized Win or (Loss)
Line Type of Game Units Win or (Loss) Drop/Handle Percentage(a) (b) (c) (d) (e) (f)
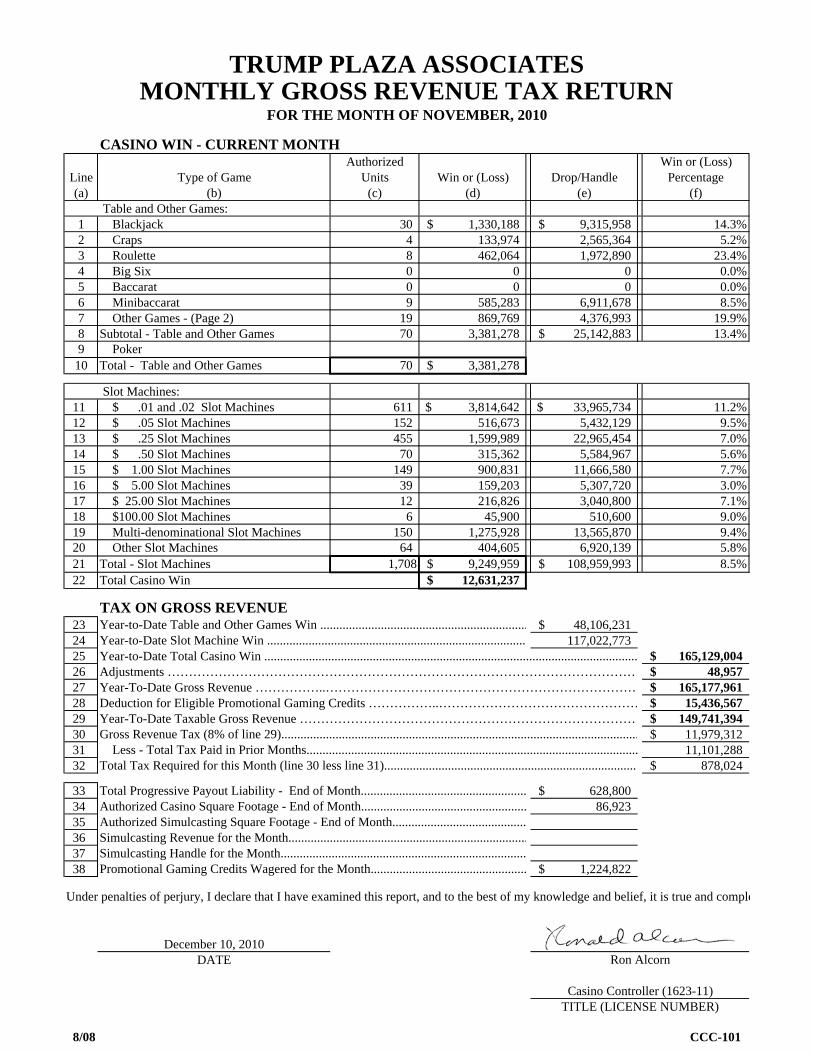
Table and Other Games:1 Blackjack 30 1,330,188$ 9,315,958$ 14.3%2 Craps 4 133,974 2,565,364 5.2%3 Roulette 8 462,064 1,972,890 23.4%4 Big Six 0 0 0 0.0%5 Baccarat 0 0 0 0.0%6 Minibaccarat 9 585,283 6,911,678 8.5%7 Other Games - (Page 2) 19 869,769 4,376,993 19.9%8 Subtotal - Table and Other Games 70 3,381,278 25,142,883$ 13.4%9 Poker
10 Total - Table and Other Games 70 3,381,278$
Slot Machines: 11 $ .01 and .02 Slot Machines 611 3,814,642$ 33,965,734$ 11.2%12 $ .05 Slot Machines 152 516,673 5,432,129 9.5%13 $ .25 Slot Machines 455 1,599,989 22,965,454 7.0%14 $ .50 Slot Machines 70 315,362 5,584,967 5.6%15 $ 1.00 Slot Machines 149 900,831 11,666,580 7.7%16 $ 5.00 Slot Machines 39 159,203 5,307,720 3.0%17 $ 25.00 Slot Machines 12 216,826 3,040,800 7.1%18 $100.00 Slot Machines 6 45,900 510,600 9.0%19 Multi-denominational Slot Machines 150 1,275,928 13,565,870 9.4%20 Other Slot Machines 64 404,605 6,920,139 5.8%21 Total - Slot Machines 1,708 9,249,959$ 108,959,993$ 8.5%22 Total Casino Win 12,631,237$
TAX ON GROSS REVENUE23 48,106,231$ 24 117,022,773 25 Year-to-Date Total Casino Win ..................................................................................................................... 165,129,004$ 26 Adjustments ………………………………………………………………………………………………… 48,957$ 27 Year-To-Date Gross Revenue ……………..………………………………………………………………… 165,177,961$ 28 Deduction for Eligible Promotional Gaming Credits ……………..………………………………………… 15,436,567$ 29 Year-To-Date Taxable Gross Revenue ……………………………………………………………………… 149,741,394$ 30 11,979,312$ 31 11,101,28832 878,024$
33 628,800$ 34 86,92335 36 37 38 1,224,822$
Under penalties of perjury, I declare that I have examined this report, and to the best of my knowledge and belief, it is true and comple
December 10, 2010DATE
Simulcasting Revenue for the Month...........................................................................Simulcasting Handle for the Month.............................................................................
Total Tax Required for this Month (line 30 less line 31)................................................................................
Total Progressive Payout Liability - End of Month....................................................Authorized Casino Square Footage - End of Month....................................................
MONTHLY GROSS REVENUE TAX RETURNFOR THE MONTH OF NOVEMBER, 2010
Year-to-Date Table and Other Games Win .................................................................
TRUMP PLAZA ASSOCIATES
Less - Total Tax Paid in Prior Months........................................................................................................
Promotional Gaming Credits Wagered for the Month.................................................
Gross Revenue Tax (8% of line 29)................................................................................................................
Authorized Simulcasting Square Footage - End of Month..........................................
Year-to-Date Slot Machine Win .................................................................................
TITLE (LICENSE NUMBER)
Ron Alcorn
Casino Controller (1623-11)
8/08 CCC-101
Authorized Win or (Loss)Type of Game Units Win or (Loss) Drop Percentage
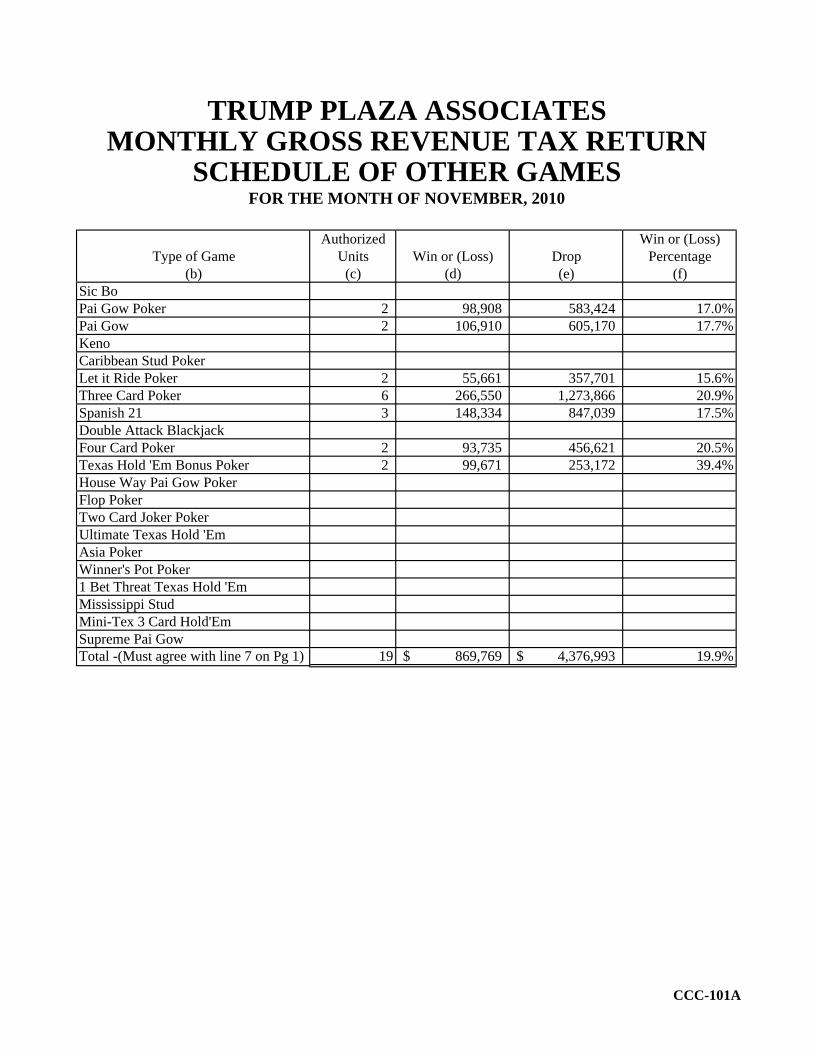
(b) (c) (d) (e) (f)Sic BoPai Gow Poker 2 98,908 583,424 17.0%Pai Gow 2 106,910 605,170 17.7%KenoCaribbean Stud PokerLet it Ride Poker 2 55,661 357,701 15.6%Three Card Poker 6 266,550 1,273,866 20.9%Spanish 21 3 148,334 847,039 17.5%Double Attack BlackjackFour Card Poker 2 93,735 456,621 20.5%Texas Hold 'Em Bonus Poker 2 99,671 253,172 39.4%House Way Pai Gow PokerFlop PokerTwo Card Joker PokerUltimate Texas Hold 'EmAsia PokerWinner's Pot Poker1 Bet Threat Texas Hold 'EmMississippi StudMini-Tex 3 Card Hold'EmSupreme Pai GowTotal -(Must agree with line 7 on Pg 1) 19 869,769$ 4,376,993$ 19.9%
MONTHLY GROSS REVENUE TAX RETURN
FOR THE MONTH OF NOVEMBER, 2010SCHEDULE OF OTHER GAMES
TRUMP PLAZA ASSOCIATES
CCC-101A

R3810111100
CASINO WIN - CURRENT MONTHAuthorized Win or (Loss)
Line Type of Game Units Win or (Loss) Drop/Handle Percentage(a) (b) (c) (d) (e) (f)
Table and Other Games:1 Blackjack 61 3,967,105$ 25,216,128$ 15.7%2 Craps 12 2,824,148 10,220,888 27.6%3 Roulette 14 843,983 6,377,704 13.2%4 Big Six 1 32,776 60,671 54.0%5 Baccarat 0 0 0 0.0%6 Minibaccarat 14 2,532,136 19,297,554 13.1%7 Other Games - (Page 2) 33 2,154,921 10,192,326 21.1%8 Subtotal - Table and Other Games 135 12,355,069 71,365,271$ 17.3%9 Poker 68 1,009,409
10 Total - Table and Other Games 203 13,364,478$
Slot Machines: 11 $ .01 and .02 Slot Machines 1,102 8,089,005$ 66,857,777$ 12.1%12 $ .05 Slot Machines 196 1,443,048 14,883,468 9.7%13 $ .25 Slot Machines 526 2,491,757 30,161,442 8.3%14 $ .50 Slot Machines 24 59,604 703,630 8.5%15 $ 1.00 Slot Machines 340 2,731,620 43,844,008 6.2%16 $ 5.00 Slot Machines 74 724,662 14,106,295 5.1%17 $ 25.00 Slot Machines 12 240,482 2,035,575 11.8%18 $100.00 Slot Machines 23 456,259 8,381,400 5.4%19 Multi-denominational Slot Machines 477 3,031,727 52,725,956 5.7%20 Other Slot Machines 31 67,999 3,201,192 2.1%21 Total - Slot Machines 2,805 19,336,163$ 236,900,743$ 8.2%22 Total Casino Win 32,700,641$
TAX ON GROSS REVENUE23 137,859,752$ 24 241,613,705 25 Year-to-Date Total Casino Win ..................................................................................................................... 379,473,457$ 26 Adjustments ………………………………………………………………………………………………… 18,651$ 27 Year-To-Date Gross Revenue ……………..………………………………………………………………… 379,492,108$ 28 Deduction for Eligible Promotional Gaming Credits ……………..………………………………………… 30,188,600$ 29 Year-To-Date Taxable Gross Revenue ……………………………………………………………………… 349,303,508$ 30 27,944,281$ 31 25,613,19832 2,331,083$
33 1,340,858$ 34 149,23935 12,48336 51,389$ 37 635,336$ 38 2,470,320$
Under penalties of perjury, I declare that I have examined this report, and to the best of my knowledge and belief, it is true and comple
December 10, 2010DATE
Simulcasting Handle for the Month.............................................................................Simulcasting Revenue for the Month...........................................................................
Total Progressive Payout Liability - End of Month....................................................
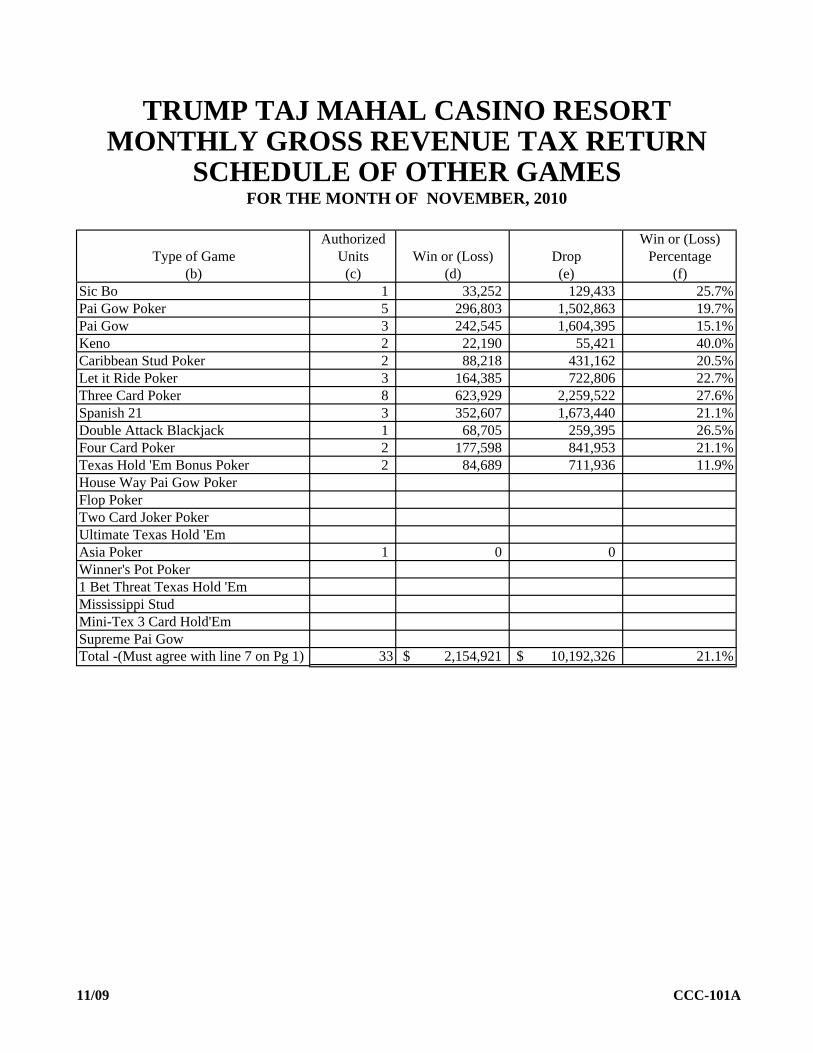
TRUMP TAJ MAHAL CASINO RESORTMONTHLY GROSS REVENUE TAX RETURN
Less - Total Tax Paid in Prior Months........................................................................................................
FOR THE MONTH OF NOVEMBER, 2010
TITLE (LICENSE NUMBER)
Ford Palmer
Casino Controller 4086-11
Promotional Gaming Credits Wagered for the Month.................................................
Year-to-Date Slot Machine Win .................................................................................
Total Tax Required for this Month (line 30 less line 31)................................................................................
Year-to-Date Table and Other Games Win .................................................................
Gross Revenue Tax (8% of line 29)................................................................................................................
Authorized Casino Square Footage - End of Month....................................................Authorized Simulcasting Square Footage - End of Month..........................................
8/08 CCC-101
Authorized Win or (Loss)Type of Game Units Win or (Loss) Drop Percentage
(b) (c) (d) (e) (f)Sic Bo 1 33,252 129,433 25.7%Pai Gow Poker 5 296,803 1,502,863 19.7%Pai Gow 3 242,545 1,604,395 15.1%Keno 2 22,190 55,421 40.0%Caribbean Stud Poker 2 88,218 431,162 20.5%Let it Ride Poker 3 164,385 722,806 22.7%Three Card Poker 8 623,929 2,259,522 27.6%Spanish 21 3 352,607 1,673,440 21.1%Double Attack Blackjack 1 68,705 259,395 26.5%Four Card Poker 2 177,598 841,953 21.1%Texas Hold 'Em Bonus Poker 2 84,689 711,936 11.9%House Way Pai Gow PokerFlop PokerTwo Card Joker PokerUltimate Texas Hold 'EmAsia Poker 1 0 0Winner's Pot Poker1 Bet Threat Texas Hold 'EmMississippi StudMini-Tex 3 Card Hold'EmSupreme Pai GowTotal -(Must agree with line 7 on Pg 1) 33 2,154,921$ 10,192,326$ 21.1%
MONTHLY GROSS REVENUE TAX RETURN
FOR THE MONTH OF NOVEMBER, 2010SCHEDULE OF OTHER GAMES
TRUMP TAJ MAHAL CASINO RESORT
11/09 CCC-101A


