Embed Size (px)
Citation preview
ABSTRACT :
This study has been attempted to shed light on the issues on growth rates of GDP of India. Data
on GDP have been collected over a period of 60 years from various publications of Reserve
Bank of India. Further, absolute values of forecasted GDP indicate an increasing trend and its
respective growth rates reveal an opposite trend in future. Findings will assist the policy makers
and managers to formulate economic and business strategies in turn more precisely.
INTRODUCTION:
GDP
The gross domestic product (GDP) is the primary indicators used to measure the health of a
country's economy. It represents the total dollar value of all goods and services produced over
a specific time period. we can say it as the size of the economy. We usually calculate GDP with
the comparison of the previous quarter or year. For example, if the year-to-year GDP is up 5%,
this is thought to mean that the economy has grown by 5% over the last year.
India GDP History
It reflects the entire differential factor that contributed to the economic growth of India.
India GDP History covers the consolidated reports of Indian Gross Domestic Product at 'cost
factor' and at 'actual price'. The growth in the India GDP History especially, after the
1990s was the result of liberalization of Indian economy. This renaissance occurred
in the wake of balance-of-payments crisis. The central government of India opened
up Indian markets to private investments. This shift of stance from a highly
insulated market to an open market facilitated inflow of foreign direct investment
(FII) and foreign institutional investor (FII). A number of public sector undertaking
were divested to private business house. The post 1990 era marked the gradual
increase in the average GDP of the Indian economy and it used to be around 4.5% to 5%.With
the astronomical rise in the Indian Information Technology and the Indian BPO
sectors, the GDP of India shoot-up to around 6% in the period from 1988 to 2003. From2004
onwards the average GDP of India 'at cost factor' reflected a steady growth trend.
This period witnessed rise of Indian GDP fueled by service and manufacturing
sector. The Indian GDP rose to 8.5% during this period and this figure is heading to 9.5% in
the present projections. The post 1990s, growth story of the India GDP History was led by the
following sectors of Indian industry –
• Information Technology
• Information Technology Enabled Services
• Telecommunications
• Electronics and hardware
• Pharmaceuticals and biotechnology
• Consumer durables
• Retail
• Textiles
• Infrastructure
• Construction
• Airlines
• Hospitality
• Power
The stupendous growth of the India GDP History further resulted the growth of the following economical
factors -
• FDI amounted to US$12.5 billion and outpaced portfolio investment of
US$6.8 billion
• Central Public Sector Enterprises to invest Rs.1,65,053 crore in 2007-08
• New 162 production sharing contracts awarded to Petroleum and Natural
Gas sector
• SMEs has witnessed increase in outstanding credit
• Foreign trade and merchandise exports expected to cross US$125 billion by
the end of the current fiscal
• Provision for tourist infrastructure increased to Rs.423 crore
• Bank's differential rate of interest scheme providing finance at the rate of
4% to weaker sections
• Regional rural banks to open at least one branch in 80 uncovered districts in 2007-08
• PAN made sole identification number for all participants of capital market
• Seven ultra mega power projects are under process
• Defense expenditure allocation to increased to Rs.96, 000 crore
• IT allocation for e-governance to increased from Rs.395 crore to Rs.719 crore
• Exclusive health insurance scheme for senior citizens
• Provision for national highway development programme to be increased to Rs.9,945
crore
• Farm credit target of Rs.225, 000 crore for 2007-08 has been set with an addition of 50
lakh new farmers to the banking system
• 35 projects have been completed in 2006-07 and additional irrigation potential
of 900,000 hectares to be created and training of farmers arranged
• A pilot programme for delivering subsidy directly to farmers have been arranged
• Loan facilitation through Agricultural Insurance and NABARD has also been
facilitated
• Corpus of Rural Infrastructure Development Fund to be raised.
DETAIL ABOUT THE TOPIC:
India GDP
The India GDP is the culmination of all the differential factors that contributes to the
economy of India. India GDP reflects a consolidated report of the performance of
the Indian economy. The Indian Gross Domestic Product is determined either by 'cost factor'
or 'actual price' method. The growth of India GDP especially, after the 1990s was
the effect of opening-up of Indian economy. This paradigm shift of Indian economy occurred in
the wake of balance-of-payments crisis in the 1980s. The Government of India opened up
Indian markets to facilitate entry of private investments into the Indian markets. This change
in Indian economic policy, from a highly insulated market to an open market
facilitated inflow of foreign direct investment (FII) and foreign institutional
investor (FII) . The period after the 1990s witnessed sudden incremental growth of the annual
average gross domestic product of the Indian economy and till then it used to be around 4.5%
to5%. With the meteoritic rise of Indian Information Technology,
Indian service industry and the Indian BPO sector, the average Indian GDP skyrocketed to
around 6%, during the p e r i o d f r o m 1 9 8 8 t o 2 0 0 3 . F r o m t h e f i n a n c i a l y e a r 2 0 0 4
o n w a r d s t h e a v e r ag e g r o s s domestic product of India 'at cost factor' reflected a stable
growth. This period marks the meteoritic rise of gross domestic product of India and
this rise was affected by service and manufacturing industry. The Indian GDP
registered an impressive growth rate of 8 . 5 % d u r i n g t h i s p e r i o d a n d t h e
p r e s e n t g r o w t h t a r g e t i s s e c u r e d a t 9 . 5 % t o 1 0 % .
The latest snapshots of the India GDP are as below -
• The foreign direct investment in the India market amounted to US$12.5
billion and surpassed portfolio investment of US$ 6.8 billion
• Foreign trade and merchandise exports expected to cross US$125 billion by
the end of the current fiscal
• Provision for national highway development programme to be increased to Rs.9,945
crore
• Farm credit target of Rs.225, 000 crore for 2007-08 has been set with an addition of 50
lakh new farmers to the banking system
• 35 projects have been completed in 2006-07 and additional irrigation potential
of 900,000 hectares to be created and training of farmers arranged
• A pilot programme for delivering subsidy directly to farmers have been arranged
• Loan facilitation through Agricultural Insurance and NABARD has also been
facilitated
• Central Public Sector Enterprises to invest Rs.165, 053 crore in 2007-08
• 1 6 2 n e w p r o d u c t i on s h a r i n g c o n t r a c t s a w a r d e d t o P e t r o l e u m a n d
N a t u r a l G a s sector
• SMEs has witnessed increase in outstanding credit
• Bank's differential rate of interest scheme providing finance at the rate of
4% to weaker sections
• Regional rural banks to open at least one branch in 80 uncovered districts in 2007-08
• PAN made sole identification number for all participants of capital market
• Seven ultra mega power projects are under process
• Defense expenditure allocation to increased to Rs.96, 000 crore
• IT allocation for e-governance to increased from Rs.395 crore to Rs.719 crore
• Exclusive health insurance scheme for senior citizens
• Corpus of Rural Infrastructure Development Fund raised substantially
• Provision for tourist infrastructure increased to Rs.423 crore
GDP India Statistics
The India GDP statistics reflects the summary of all the differential factors that forms the basis
of Indian economy. Further, the India GDP statistics reflects a cumulative report of the
performance of all the major parameters of the Indian economy. The statistics of the Indian
GDP indicates that the rise of the India GDP after the 1990s was the effect of o p e n i n g - u p of
I n d i a n e c o n o m y . T h e p a r a d i g m s h i f t o f I n d i a n e c o n o m y f r o m c l o s e d - market
to open market took place during the balance-of-payments crisis in the late 1980s.The
Government of India opened up Indian markets to facilitate easy entry of private
i n v e s t m e n t s i n t o th e I n d i a n m a r k e t s . T h i s c h a n g e i n I n d i a n e c o n o m i c
p o l i c y , f r o m a highly insulated market to an open market facilitated inflow of foreign direct
investment(FII) and foreign institutional investor (FII).A good number of Government of India
undertakings were divested to private business h o u s e , i n t h e pr o p o r t i o n of 2 5 % ,
4 9 % a n d 7 5 % . T h e p o s t 1 9 9 0 s e r a r e c o r d e d s u d d e n incremental growth of the
annual average gross domestic product of the Indian economy. The period used to register an
average annual GDP growth rate of 4.5% to 5%. With the stupendous growth of Indian
Information Technology sector, Indian service industry and the Indian BPO sector, the Indian
GDP sky rocketed to 6% during the period from 1988 to2003. The period after 2004 marks the
astronomical growth of gross domestic product of India and this rise was initiated by the Indian
service and manufacturing industry. The Indian GDP registered an impressive growth rate of
8.5% during the period there after.
The latest snapshots of the India GDP statistics are as below -
• The growth rate of Indian GDP rose from 9.2% in 2006-07 to 9.5 % till the end of 2nd
quarter of the current fiscal.
• The foreign direct investment in the India market amounted to US$12.5
billion and surpassed portfolio investment of US$ 6.8 billion.
• Foreign trade and merchandise exports expected to cross US$125 billion by
the end of the current fiscal.
• Provision for national highway development programme to be increased to Rs.9,945
crore.
• Farm credit target of Rs.225, 000 crore for 2007-08 has been set with an addition of 50
lakh new farmers to the banking system.
• 3 5 p r o j e c t s h a v e be e n c o m p l e t e d i n t h e l a s t f i n a n c i a l y ea r o f 2 0 0 6 -
0 7 a n d a n additional irrigation potential of 900,000 hectares to be created
and training of farmers arranged.
• A pilot programme for delivering subsidy directly to farmers have been facilitated.
• Loan facilitation through Agricultural Insurance and NABARD has also been
extended.
• Central Public Sector Enterprises to invest Rs.165, 053 crore in 2007-08.
• 1 6 2 n e w p r o d u c t i on s h a r i n g c o n t r a c t s a w a r d e d t o P e t r o l e u m a n d
N a t u r a l G a s industry.
• Bank's differential rate of interest scheme providing finance at the rate of
4% to weaker sections.
• Regional rural banks to open at least one branch in 80 uncovered districts in 2007-08.
• P e r m a n e n t A c c o u n t N u m b e r ( P A N ) m a d e s o l e i d e n t i f i c a t i o n n u m b e r
f o r a l l participants of capital market.
• Seven ultra mega power projects are under process.
• Defense expenditure allocation to increased to Rs.96, 000 crore.
• IT allocation for e-governance to increased from Rs.395 crore to Rs.719 crore.
• Exclusive health insurance scheme have been introduced for senior citizens.
• The budget for the Rural Infrastructure Development Fund raised substantially.
• Provision for tourist infrastructure increased to Rs.423 crore.
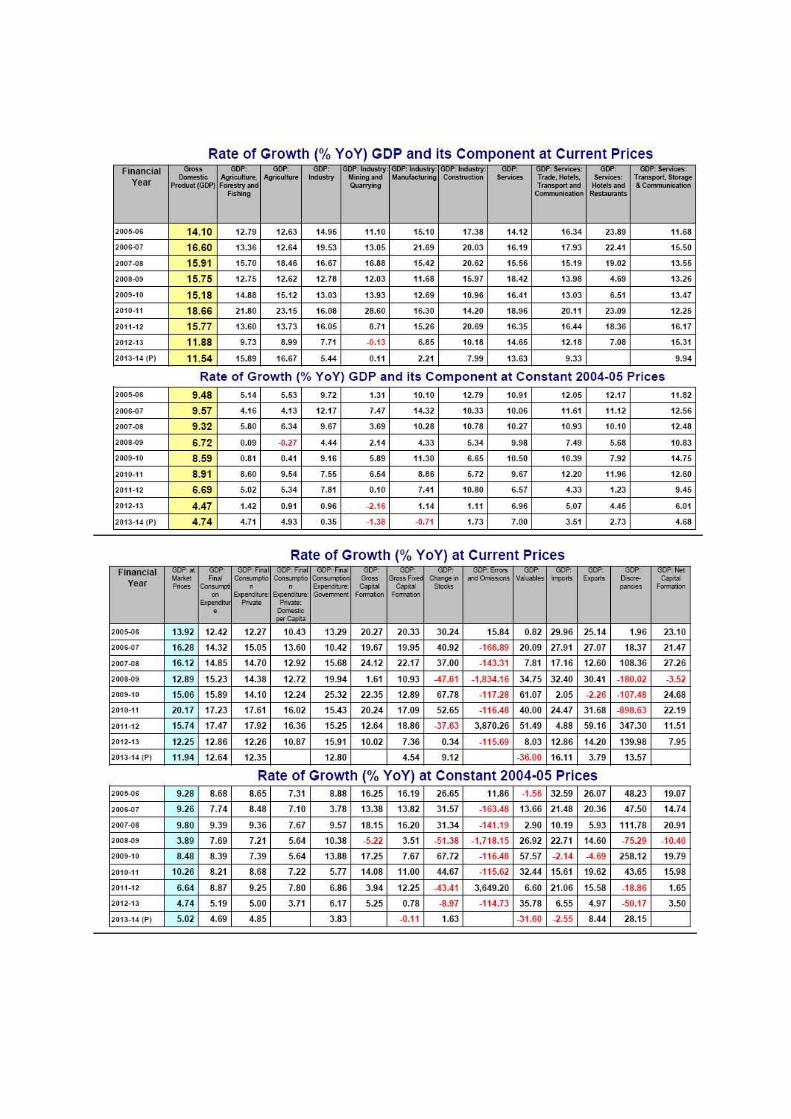
• The growth rate of Indian GDP fell from 7.35% in 2008-09 to 5.36% till the end of 3rd
quarter of the 2009-10.
• The cumulative FDI Equity inflows (from August 1991 – August 2009) stood at ` 5,20,589
crore.
• Budgetary support for National Highway Development Programme (NHDP) has gone by
23% on y-o-y basis for 2009-10.
• Expenses for the Commonwealth Games 2010, went up from Rs.2,112 crore in Interim
Budget to Rs.3,472 crore for 2009-10 fiscal.
• Allocation to railways have gone up from Rs.10,800 crore in interim budget toRs.15,800
crore for FY 2009-10.
• Allocation under National Rural Health Mission (NRHM) has gone up by Rs.2,057 crore
over Interim Budget estimate in 2009-10 of Rs.12,070 crore.
• Rs.2,113 crore has been allocated for IITs and NITs, comprising of a provision of Rs.450
crore for new upcoming IITs and NITs.
• Minimum Alternate Tax (MAT) to go up to 15% from 10.
Small and Medium Enterprises (SMEs) witnessed increase in outstanding credit. The Indian
Gross Domestic Product is calculated either by 'cost factor' or 'actual price' method and
thus the statistics of the Indian GDP reflects both the results. The present status of Indian
gross domestic product factor is encouraging and is much more higher than the world's
annual average GDP growth of 5.5%. It is estimated that at this rate of GDP growth, the
Indian economy will become the second largest economy after China in the next 40 to 45
years.
RESEARCH METHODOLOGY:
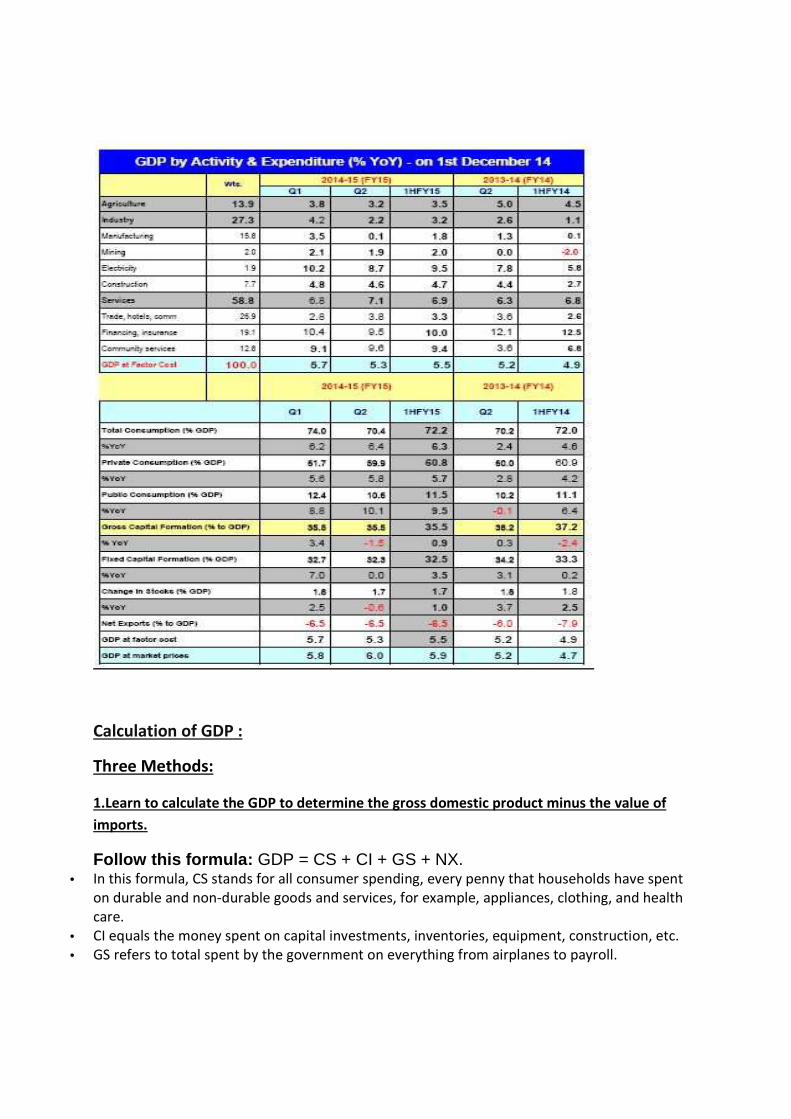
Calculation of GDP :
Three Methods:
1.Learn to calculate the GDP to determine the gross domestic product minus the value of
imports.
Follow this formula: GDP = CS + CI + GS + NX. • In this formula, CS stands for all consumer spending, every penny that households have spent
on durable and non-durable goods and services, for example, appliances, clothing, and health
care.
• CI equals the money spent on capital investments, inventories, equipment, construction, etc.
• GS refers to total spent by the government on everything from airplanes to payroll.
• Finally, NX stands for net exports, that is, the currency difference between money spent on the
economy's goods by foreign economies and the money spent by the domestic economy on a
foreign economy's goods.
2.Learn how to calculate the annualized rate of growth in the GDP to see the comparative growth or decline in the GDP compounded over a period of time.
Follow this formula: % rate of growth in GDP = 100 * X,
where X is the solution of VB * (1 + X) ^ N = VE. • Here, VB equals the good or service at the beginning of the valued period.
• N is the number of periods between the VB and the VE, usually quarters or years.
• VE refers to the value of goods and services at the end of the valued period.
3.Learn how to calculate the annualized rate of growth in the GDP to see the
comparative straight-line growth or decline in the GDP over a period of 1- year.
Follow this formula: GR = (1/N) X (VE - B) / B. • Here, GR equals the rate of annualized growth in the GDP without compounding.
• N is the number of years or quarters between the beginning and the end of the growth (or
decline).
• VE refers to the value at the end of the period.
• VB is the value at the beginning.
• This is the least valued formula in that, while it has descriptive value, it ignores the fact of
compounding.
CRITICAL ANALYSIS:
Indian GDP growth in 2015: A change in the way gross domestic product is calculated puts Indian growth ahead of China.
On 30th January 2015 the Indian government revised its method of measuring GDP, replacing
factor costs with internationally recognized market prices. the country’s economic output is
expected to grow 7.4 percent in this budget year compared to 6.9 percent in the previous year.
Growth for the previous three months has been revised up sharply to 8.2 percent from an
earlier figure of 5.3 percent. As a result, India has officially overtaken China as the world's
fastest-growing economy with its 7.5 percent growth in the December quarter. China grew by
7.3 percent in the most recent quarter.
The new method of calculating of GDP is called as rebasing under which the real GDP is
measured in accordance with the prices and structure of the economy in a base year. The GDP
figures for a one-year period become less relevant over time so that is why the base year is
changed periodically.
For India the base year changed on January 20 from 2004-2005 to 2011-2012. So as the result
of this, the country’s GDP growth for 2013
percent.
The country’s new way of calculating GDP was met with criticism as the new estimate is sharply
higher than the Reserve Bank of India's growth prediction of around 5.5 percent for the year
under the old method. Some economists point to other indicators such as industrial
production, trade and tax collection figures, which suggest the economy, is still suffering.
The International Monetary fund last month predicted India would overtake China next year as
the fastest-growing major economy with 6.5 percent annual growth compared with 6.3
for China.
Falling oil prices helped to cool inflation in the country and made it easier for new Prime
Minister Narendra Modi's reform
last May, the India’s economy had been struggling through its worst slowdown since the 1980s.
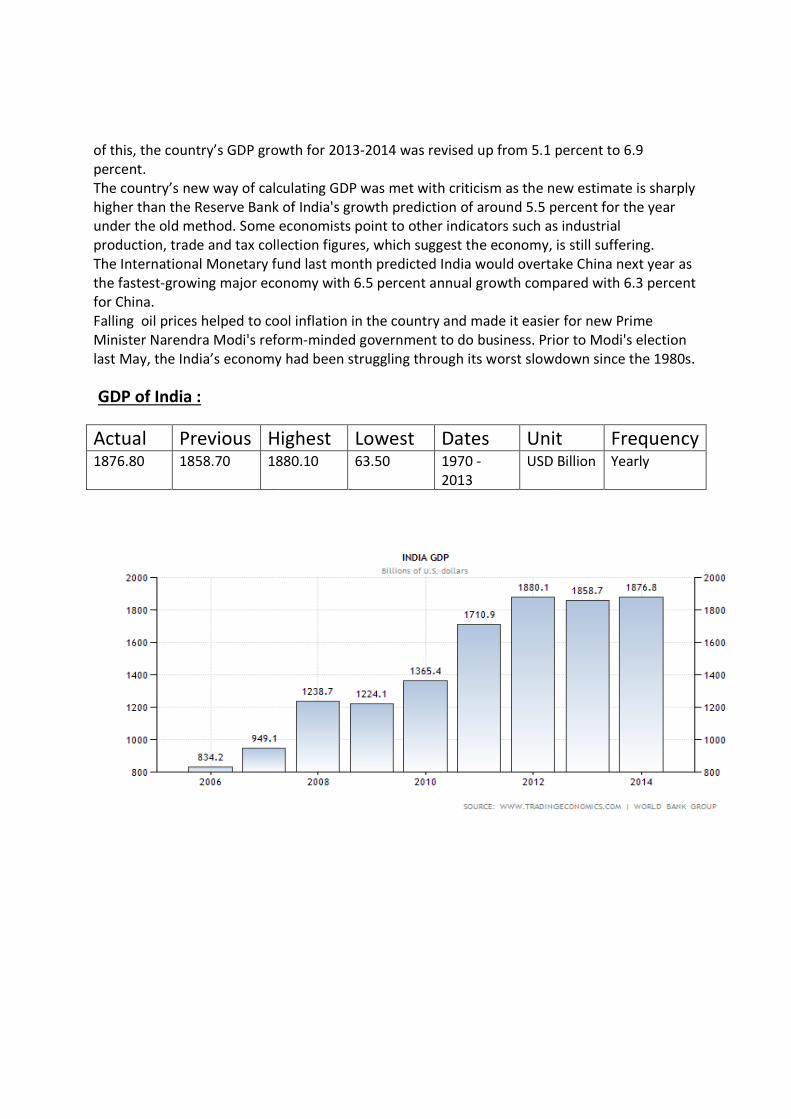
GDP of India :
Actual Previous Highest1876.80 1858.70 1880.10
of this, the country’s GDP growth for 2013-2014 was revised up from 5.1 percent to 6.9
culating GDP was met with criticism as the new estimate is sharply
higher than the Reserve Bank of India's growth prediction of around 5.5 percent for the year
under the old method. Some economists point to other indicators such as industrial
rade and tax collection figures, which suggest the economy, is still suffering.
fund last month predicted India would overtake China next year as
growing major economy with 6.5 percent annual growth compared with 6.3
oil prices helped to cool inflation in the country and made it easier for new Prime
Minister Narendra Modi's reform-minded government to do business. Prior to Modi's election
last May, the India’s economy had been struggling through its worst slowdown since the 1980s.
Highest Lowest Dates Unit1880.10 63.50 1970 -
2013 USD Billion
2014 was revised up from 5.1 percent to 6.9
culating GDP was met with criticism as the new estimate is sharply
higher than the Reserve Bank of India's growth prediction of around 5.5 percent for the year
under the old method. Some economists point to other indicators such as industrial
rade and tax collection figures, which suggest the economy, is still suffering.
fund last month predicted India would overtake China next year as
growing major economy with 6.5 percent annual growth compared with 6.3 percent
oil prices helped to cool inflation in the country and made it easier for new Prime
government to do business. Prior to Modi's election
last May, the India’s economy had been struggling through its worst slowdown since the 1980s.
Unit Frequency USD Billion Yearly
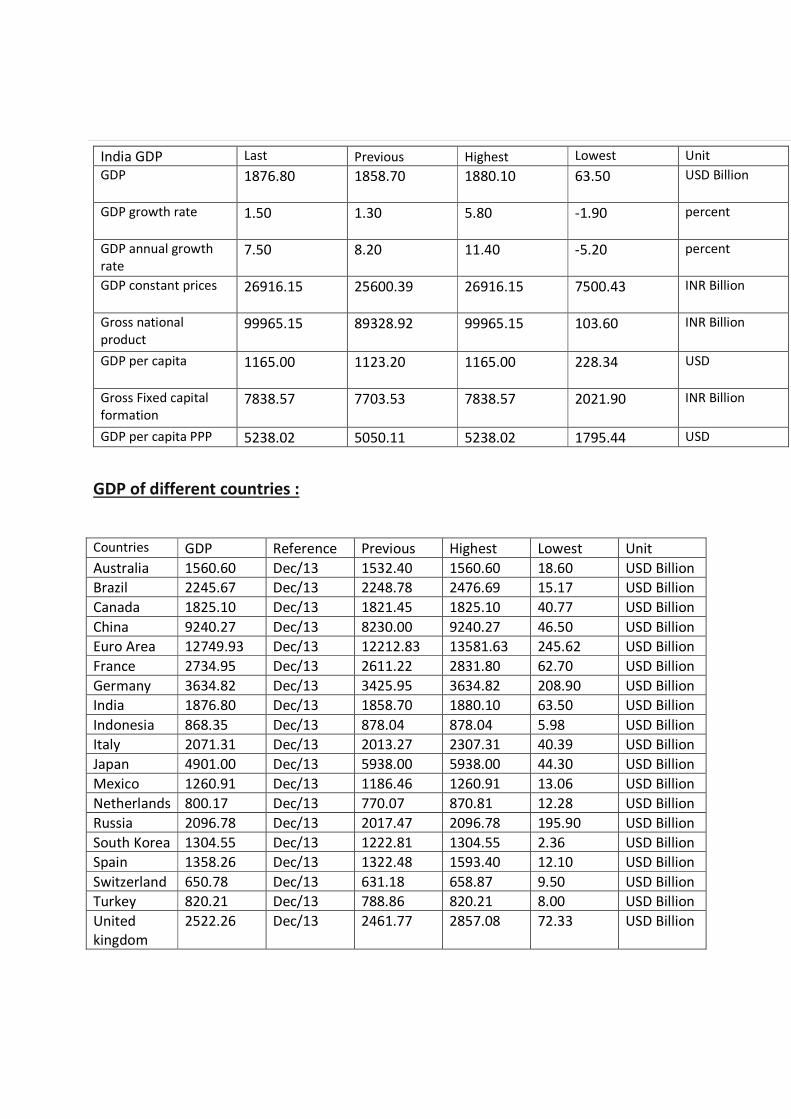
India GDP Last Previous Highest Lowest Unit
GDP 1876.80 1858.70 1880.10 63.50 USD Billion
GDP growth rate 1.50 1.30 5.80 -1.90 percent
GDP annual growth
rate 7.50 8.20 11.40 -5.20 percent
GDP constant prices 26916.15 25600.39 26916.15 7500.43 INR Billion
Gross national
product 99965.15 89328.92 99965.15 103.60 INR Billion
GDP per capita 1165.00 1123.20 1165.00 228.34 USD
Gross Fixed capital
formation 7838.57 7703.53 7838.57 2021.90 INR Billion
GDP per capita PPP 5238.02 5050.11 5238.02 1795.44 USD
GDP of different countries :
Countries GDP Reference Previous Highest Lowest Unit
Australia 1560.60 Dec/13 1532.40 1560.60 18.60 USD Billion
Brazil 2245.67 Dec/13 2248.78 2476.69 15.17 USD Billion
Canada 1825.10 Dec/13 1821.45 1825.10 40.77 USD Billion
China 9240.27 Dec/13 8230.00 9240.27 46.50 USD Billion
Euro Area 12749.93 Dec/13 12212.83 13581.63 245.62 USD Billion
France 2734.95 Dec/13 2611.22 2831.80 62.70 USD Billion
Germany 3634.82 Dec/13 3425.95 3634.82 208.90 USD Billion
India 1876.80 Dec/13 1858.70 1880.10 63.50 USD Billion
Indonesia 868.35 Dec/13 878.04 878.04 5.98 USD Billion
Italy 2071.31 Dec/13 2013.27 2307.31 40.39 USD Billion
Japan 4901.00 Dec/13 5938.00 5938.00 44.30 USD Billion
Mexico 1260.91 Dec/13 1186.46 1260.91 13.06 USD Billion
Netherlands 800.17 Dec/13 770.07 870.81 12.28 USD Billion
Russia 2096.78 Dec/13 2017.47 2096.78 195.90 USD Billion
South Korea 1304.55 Dec/13 1222.81 1304.55 2.36 USD Billion
Spain 1358.26 Dec/13 1322.48 1593.40 12.10 USD Billion
Switzerland 650.78 Dec/13 631.18 658.87 9.50 USD Billion
Turkey 820.21 Dec/13 788.86 820.21 8.00 USD Billion
United
kingdom
2522.26 Dec/13 2461.77 2857.08 72.33 USD Billion
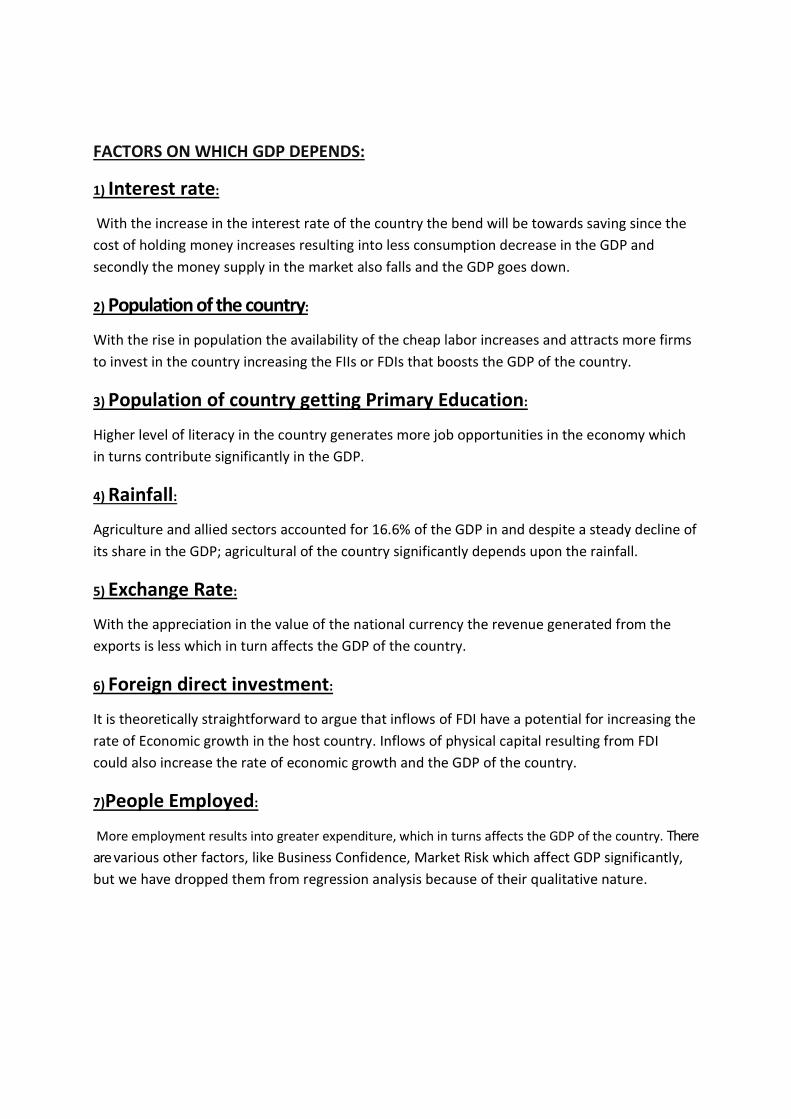
FACTORS ON WHICH GDP DEPENDS:
1) Interest rate:
With the increase in the interest rate of the country the bend will be towards saving since the
cost of holding money increases resulting into less consumption decrease in the GDP and
secondly the money supply in the market also falls and the GDP goes down.
2) Population of the country:
With the rise in population the availability of the cheap labor increases and attracts more firms
to invest in the country increasing the FIIs or FDIs that boosts the GDP of the country.
3) Population of country getting Primary Education:
Higher level of literacy in the country generates more job opportunities in the economy which
in turns contribute significantly in the GDP.
4) Rainfall:
Agriculture and allied sectors accounted for 16.6% of the GDP in and despite a steady decline of
its share in the GDP; agricultural of the country significantly depends upon the rainfall. 5) Exchange Rate:
With the appreciation in the value of the national currency the revenue generated from the
exports is less which in turn affects the GDP of the country.
6) Foreign direct investment:
It is theoretically straightforward to argue that inflows of FDI have a potential for increasing the
rate of Economic growth in the host country. Inflows of physical capital resulting from FDI
could also increase the rate of economic growth and the GDP of the country.
7)People Employed:
More employment results into greater expenditure, which in turns affects the GDP of the country. There
are various other factors, like Business Confidence, Market Risk which affect GDP significantly,
but we have dropped them from regression analysis because of their qualitative nature.
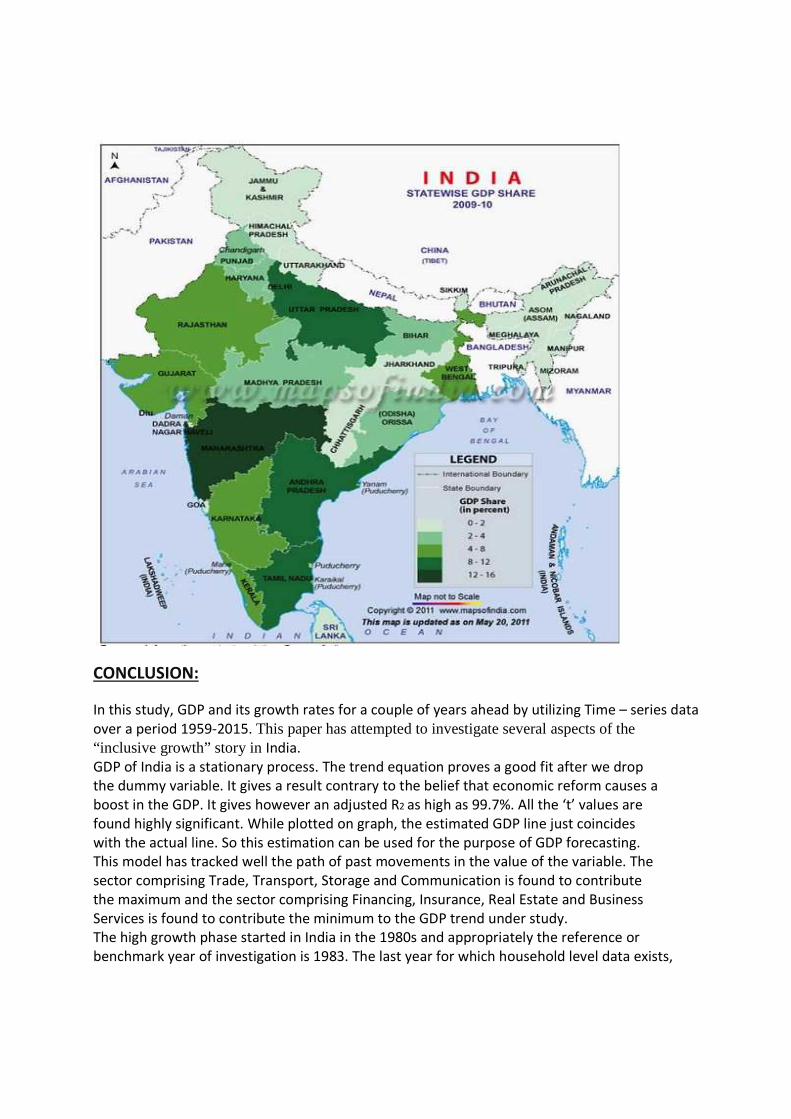
CONCLUSION:
In this study, GDP and its growth rates for a couple of years ahead by utilizing Time – series data
over a period 1959-2015. This paper has attempted to investigate several aspects of the “inclusive growth” story in India.
GDP of India is a stationary process. The trend equation proves a good fit after we drop
the dummy variable. It gives a result contrary to the belief that economic reform causes a
boost in the GDP. It gives however an adjusted R2 as high as 99.7%. All the ‘t’ values are
found highly significant. While plotted on graph, the estimated GDP line just coincides
with the actual line. So this estimation can be used for the purpose of GDP forecasting.
This model has tracked well the path of past movements in the value of the variable. The
sector comprising Trade, Transport, Storage and Communication is found to contribute
the maximum and the sector comprising Financing, Insurance, Real Estate and Business
Services is found to contribute the minimum to the GDP trend under study.
The high growth phase started in India in the 1980s and appropriately the reference or benchmark year of investigation is 1983. The last year for which household level data exists,
and is examined, is the 64th round of the NSS, the survey period being from July of 2007 to
June of 2008. The macro-economic data examined has been updated to 2010/11, with
estimates for the full year. The major result emerging from the analysis is twofold. First, the
Indian experience for this long 30 year period is one of genuine inclusive growth, and inclusive
growth in most dimensions considered. The findings in this paper answer some questions, and
raise several others. The surprising inclusive nature of growth in India calls for a deeper
examination. Further, both an examination of past effectiveness of government policies, and
the need for a changed role and focus of such efforts need to be explored. Given that even
according to the recently increased Tendulkar poverty line (close to the recently increased
World Bank poverty line of $1.25 per capita per day) poverty elimination with perfect targeting
will cost less than 0.6 percent of GDP.
BIBILOGRAPHY:
1. International Journal of Economics and Management Sciences
2. http://country.eiu.com/india
3. https://www.gfmag.com/global-data/country-data/india-gdp-country-report
4. Ahluwalia, Montek S., N. Carter, and H. Chenery. 1979. “Growth and Poverty in Developing Countries”. Journal of Development Economics 6, 399-341.
5. Ahluwalia, S. Montek, (2002), “Economic reforms in India since 1991: Has gradualism Worked?” Journal of Economic Perspectives 16(3), 67-88.
6. Anderson, W.H. Locke. 1964. “Trickling down: The relationship between economic growth and the extent of poverty among American families”, Page 511-524, Vol. LXXVIII, No. 4,
7. The Quarterly Journal of Economics, November. Bardhan, Pranab, Awakening Giants, Feet of Clay: Assessing the Economic Rise of China and India, Princeton University Press, 2010
8. Planning Commission, 2009, Report of the Expert Group to Review the methodology for
9. estimation of poverty, (Tendulkar report), New Delhi. 10. www.worldbank.org/en/country/india 11. Economic Survey 2002-03, Government of India, Delhi


