Embed Size (px)
Citation preview
Jersey Walk Residential Development
907-931 East Jersey Street
City of Elizabeth Union County, NJ
Stormwater Management Report
May 15, 2017
Revised October 18, 2017 Revised July 9, 2020
Prepared for: CMT Developers, LLC 1950 Rutgers University Boulevard, Suite 102 Lakewood, NJ 08701 Prepared by:
60 Grand Avenue Englewood, NJ 07631
William R. Vogt Jr., PE NJ PE Lic. No. 24GE04690600 L2A Auth No. 24GA28130900
1
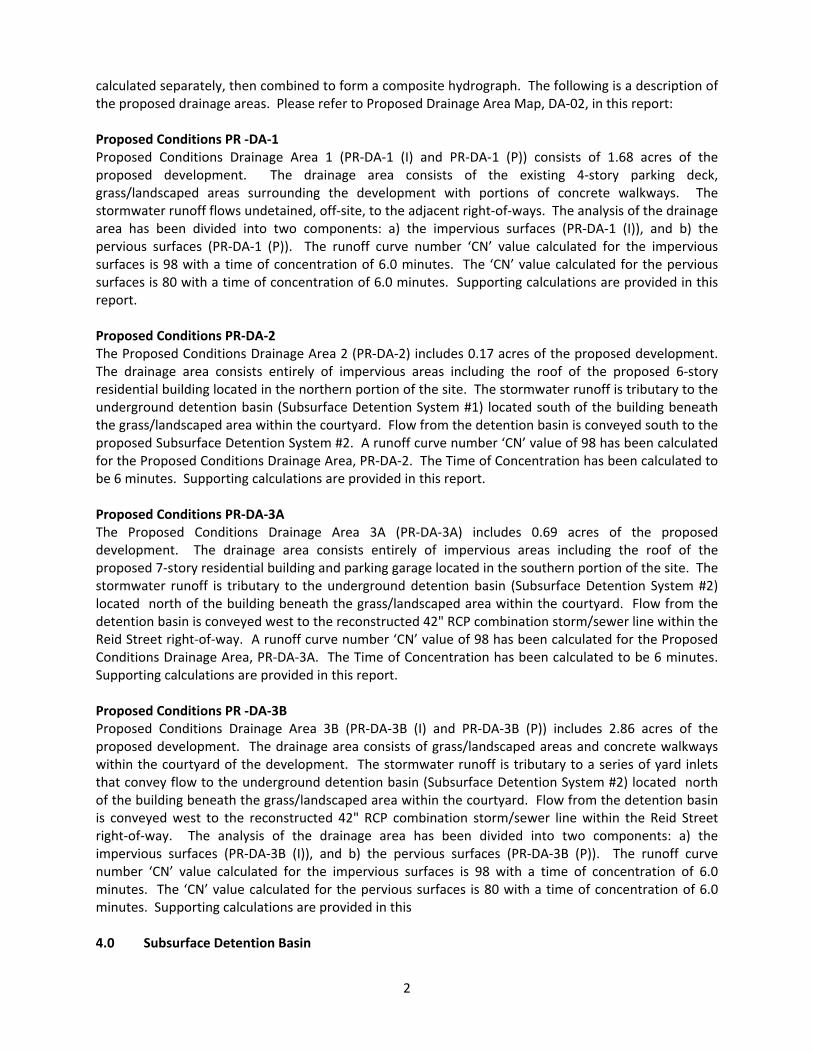
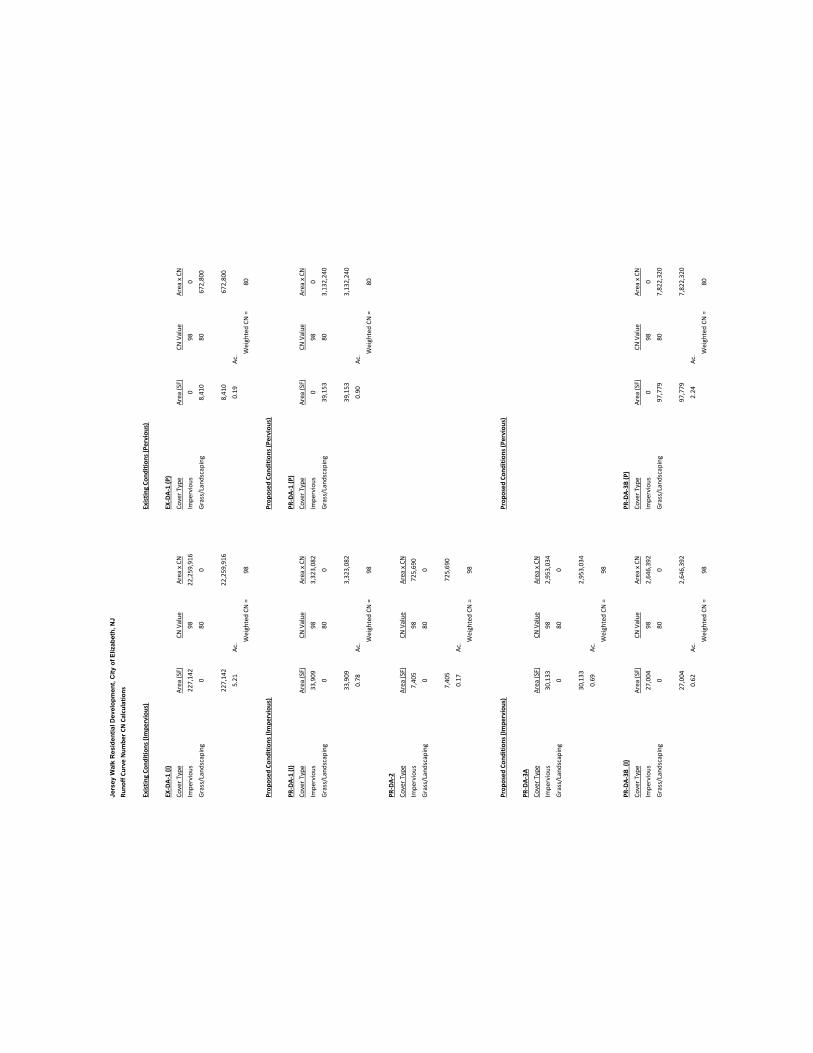
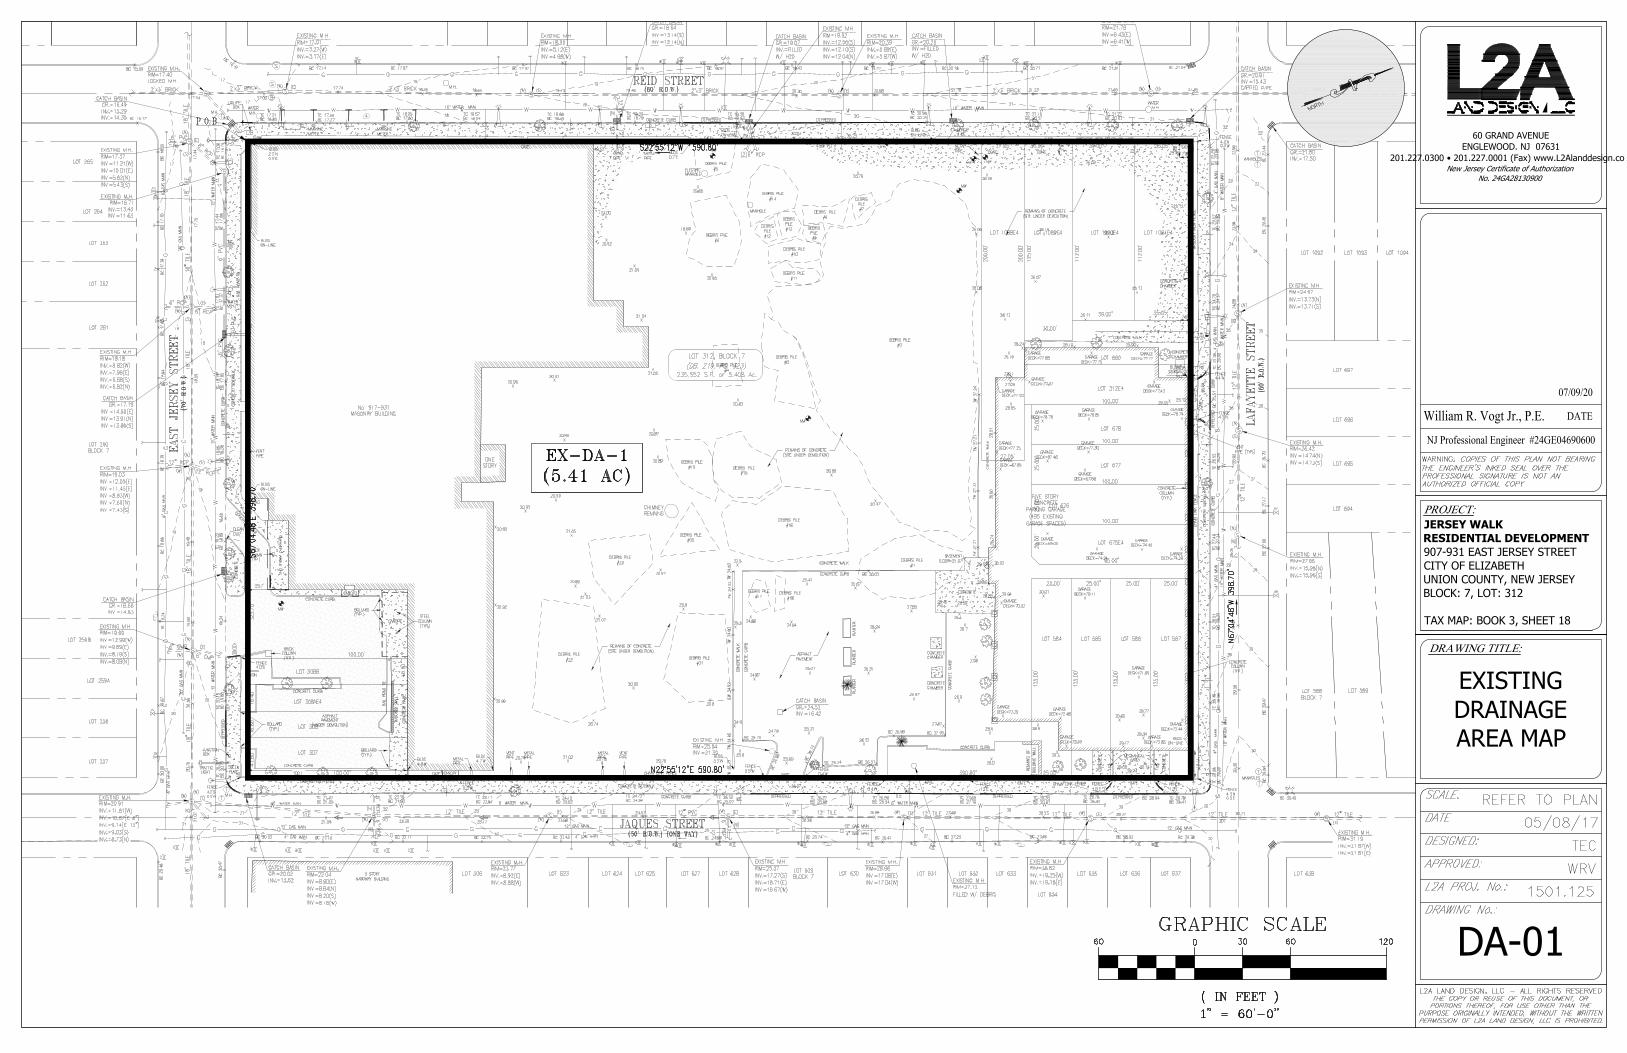
1.0 Introduction This Stormwater Management Report shall be part of the application for Preliminary and Final Site Plan for Block 7, Lot 312 in the City of Elizabeth, Union County, New Jersey, being made to the City of Elizabeth Zoning Board of Adjustment. This report describes the hydrologic and hydraulic analyses that were performed as part of the design of the proposed Residential Development located at 907‐931 East Jersey Street. The applicant is proposing to construct one (1) mid‐rise building and one (1) high‐rise building with a courtyard, pedestrian walkways and recreational areas. The analyses and stormwater management design have been performed in accordance with the City of Elizabeth ordinances and the NJ Stormwater Management Rule. 2.0 Existing Conditions The existing conditions study area (EX‐DA‐1) consists of the entire 5.41 acre tract area. Under existing conditions, the site is currently vacant and consists of a 7‐story hospital, a 4‐story parking deck, and dilapidated concrete surfaces with minimal areas of grass and landscaping. Stormwater runoff from the site is undetained and tributary to the existing combination storm/sewer conveyance systems located within the surrounding right‐of‐ways. In accordance with the NJ Stormwater Best Practices Manual, and to properly calculate the times of concentration for the existing conditions, hydrographs for impervious (I) and pervious (P) areas were calculated separately, then combined to form a composite hydrograph. The runoff curve number 'CN' value calculated for the impervious surfaces is 98 with a time of concentration of 6.0 minutes. The runoff curve number 'CN' value calculated for the pervious surfaces is 80 with a time of concentration of 6.0 minutes. Supporting calculations are provided in this report. The Existing Conditions peak runoff rates have been tabulated below:
Table 2.1 Existing Conditions Peak Rate of Runoff (cfs)
Storm Frequency Existing Conditions
2 16.94
10 26.22
100 44.24
3.0 Proposed Conditions The proposed site improvements include the construction of two (2) residential buildings, a courtyard, pedestrian walkways and recreational areas. The first residential building, Unit‐1, is a 6‐story high‐rise located in the northern portion of the site. The second residential building, Unit‐2, is 7‐story high rise located on the southern portion of the site. The residential buildings propose 274 units and 497 parking spaces. Under post‐development conditions, the site was divided into four (4) separate drainage areas. In accordance with the NJ Stormwater Best Practices Manual, and to properly calculate the times of concentration for the various drainage areas, hydrographs for impervious (I) and pervious (P) areas were
2
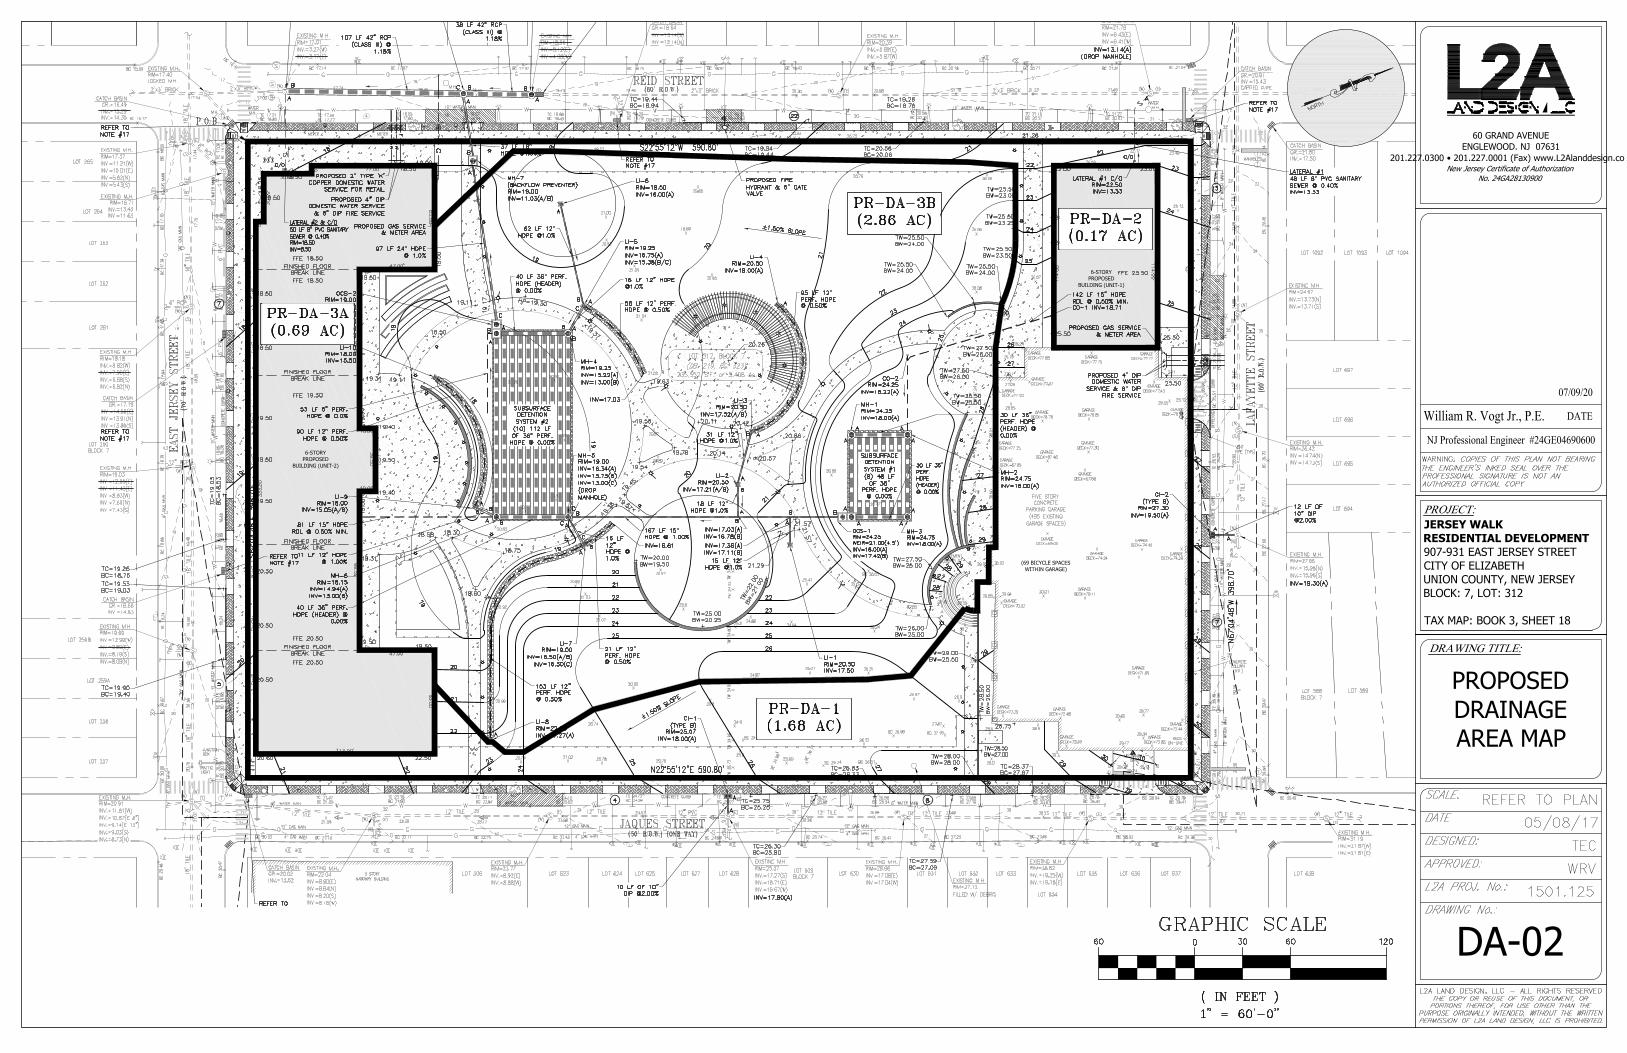
calculated separately, then combined to form a composite hydrograph. The following is a description of the proposed drainage areas. Please refer to Proposed Drainage Area Map, DA‐02, in this report: Proposed Conditions PR ‐DA‐1 Proposed Conditions Drainage Area 1 (PR‐DA‐1 (I) and PR‐DA‐1 (P)) consists of 1.68 acres of the proposed development. The drainage area consists of the existing 4‐story parking deck, grass/landscaped areas surrounding the development with portions of concrete walkways. The stormwater runoff flows undetained, off‐site, to the adjacent right‐of‐ways. The analysis of the drainage area has been divided into two components: a) the impervious surfaces (PR‐DA‐1 (I)), and b) the pervious surfaces (PR‐DA‐1 (P)). The runoff curve number ‘CN’ value calculated for the impervious surfaces is 98 with a time of concentration of 6.0 minutes. The ‘CN’ value calculated for the pervious surfaces is 80 with a time of concentration of 6.0 minutes. Supporting calculations are provided in this report. Proposed Conditions PR‐DA‐2 The Proposed Conditions Drainage Area 2 (PR‐DA‐2) includes 0.17 acres of the proposed development. The drainage area consists entirely of impervious areas including the roof of the proposed 6‐story residential building located in the northern portion of the site. The stormwater runoff is tributary to the underground detention basin (Subsurface Detention System #1) located south of the building beneath the grass/landscaped area within the courtyard. Flow from the detention basin is conveyed south to the proposed Subsurface Detention System #2. A runoff curve number ‘CN’ value of 98 has been calculated for the Proposed Conditions Drainage Area, PR‐DA‐2. The Time of Concentration has been calculated to be 6 minutes. Supporting calculations are provided in this report. Proposed Conditions PR‐DA‐3A The Proposed Conditions Drainage Area 3A (PR‐DA‐3A) includes 0.69 acres of the proposed development. The drainage area consists entirely of impervious areas including the roof of the proposed 7‐story residential building and parking garage located in the southern portion of the site. The stormwater runoff is tributary to the underground detention basin (Subsurface Detention System #2) located north of the building beneath the grass/landscaped area within the courtyard. Flow from the detention basin is conveyed west to the reconstructed 42" RCP combination storm/sewer line within the Reid Street right‐of‐way. A runoff curve number ‘CN’ value of 98 has been calculated for the Proposed Conditions Drainage Area, PR‐DA‐3A. The Time of Concentration has been calculated to be 6 minutes. Supporting calculations are provided in this report. Proposed Conditions PR ‐DA‐3B Proposed Conditions Drainage Area 3B (PR‐DA‐3B (I) and PR‐DA‐3B (P)) includes 2.86 acres of the proposed development. The drainage area consists of grass/landscaped areas and concrete walkways within the courtyard of the development. The stormwater runoff is tributary to a series of yard inlets that convey flow to the underground detention basin (Subsurface Detention System #2) located north of the building beneath the grass/landscaped area within the courtyard. Flow from the detention basin is conveyed west to the reconstructed 42" RCP combination storm/sewer line within the Reid Street right‐of‐way. The analysis of the drainage area has been divided into two components: a) the impervious surfaces (PR‐DA‐3B (I)), and b) the pervious surfaces (PR‐DA‐3B (P)). The runoff curve number ‘CN’ value calculated for the impervious surfaces is 98 with a time of concentration of 6.0 minutes. The ‘CN’ value calculated for the pervious surfaces is 80 with a time of concentration of 6.0 minutes. Supporting calculations are provided in this 4.0 Subsurface Detention Basin
3
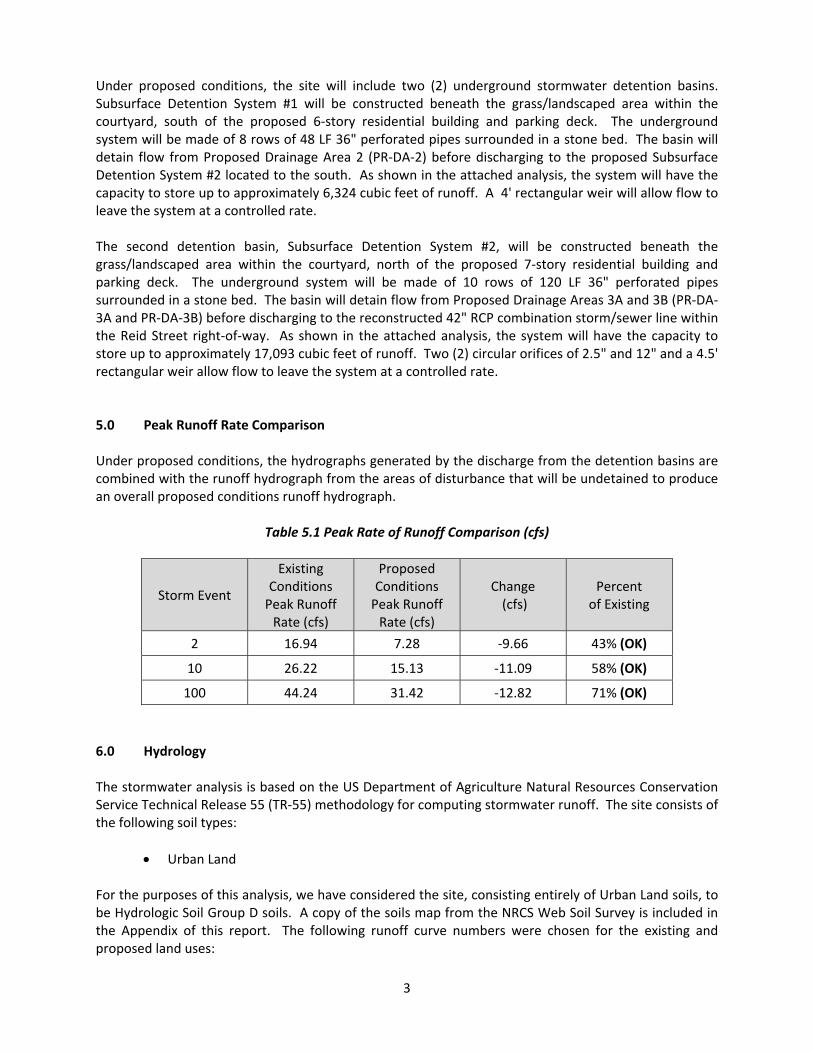
Under proposed conditions, the site will include two (2) underground stormwater detention basins. Subsurface Detention System #1 will be constructed beneath the grass/landscaped area within the courtyard, south of the proposed 6‐story residential building and parking deck. The underground system will be made of 8 rows of 48 LF 36" perforated pipes surrounded in a stone bed. The basin will detain flow from Proposed Drainage Area 2 (PR‐DA‐2) before discharging to the proposed Subsurface Detention System #2 located to the south. As shown in the attached analysis, the system will have the capacity to store up to approximately 6,324 cubic feet of runoff. A 4' rectangular weir will allow flow to leave the system at a controlled rate. The second detention basin, Subsurface Detention System #2, will be constructed beneath the grass/landscaped area within the courtyard, north of the proposed 7‐story residential building and parking deck. The underground system will be made of 10 rows of 120 LF 36" perforated pipes surrounded in a stone bed. The basin will detain flow from Proposed Drainage Areas 3A and 3B (PR‐DA‐3A and PR‐DA‐3B) before discharging to the reconstructed 42" RCP combination storm/sewer line within the Reid Street right‐of‐way. As shown in the attached analysis, the system will have the capacity to store up to approximately 17,093 cubic feet of runoff. Two (2) circular orifices of 2.5" and 12" and a 4.5' rectangular weir allow flow to leave the system at a controlled rate. 5.0 Peak Runoff Rate Comparison Under proposed conditions, the hydrographs generated by the discharge from the detention basins are combined with the runoff hydrograph from the areas of disturbance that will be undetained to produce an overall proposed conditions runoff hydrograph.
Table 5.1 Peak Rate of Runoff Comparison (cfs)
Storm Event
Existing Conditions Peak Runoff Rate (cfs)
Proposed Conditions Peak Runoff Rate (cfs)
Change (cfs)
Percent of Existing
2 16.94 7.28 ‐9.66 43% (OK)
10 26.22 15.13 ‐11.09 58% (OK)
100 44.24 31.42 ‐12.82 71% (OK)
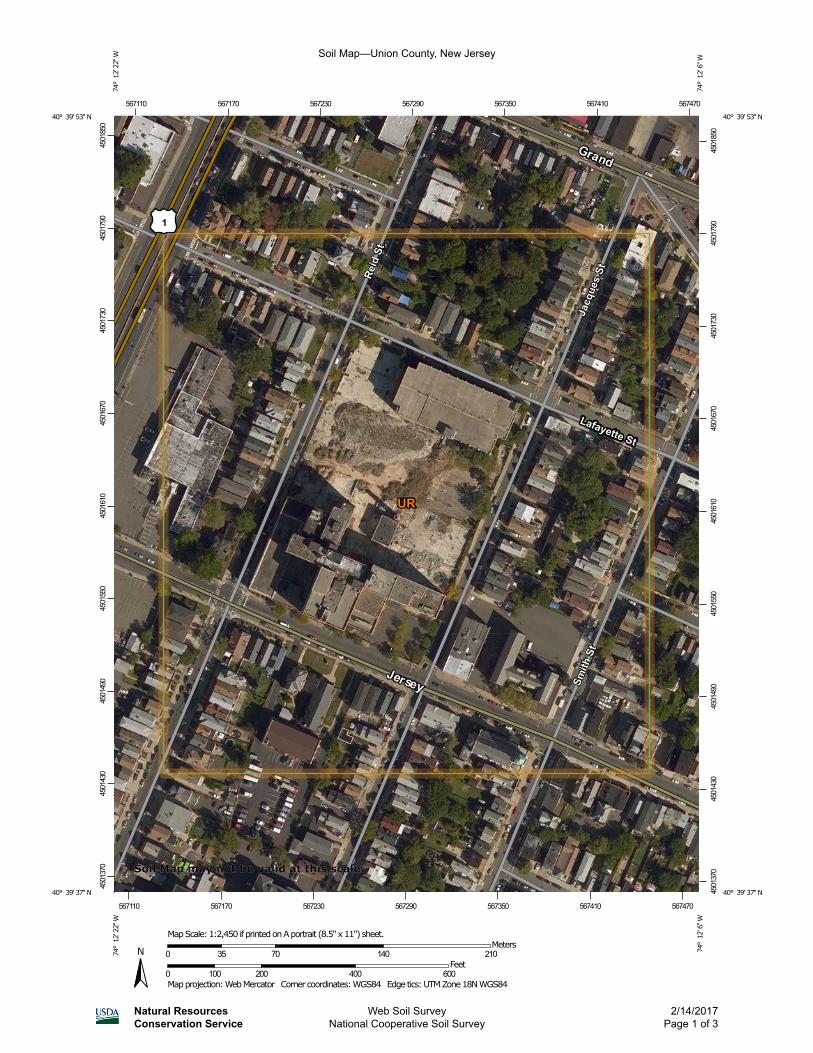
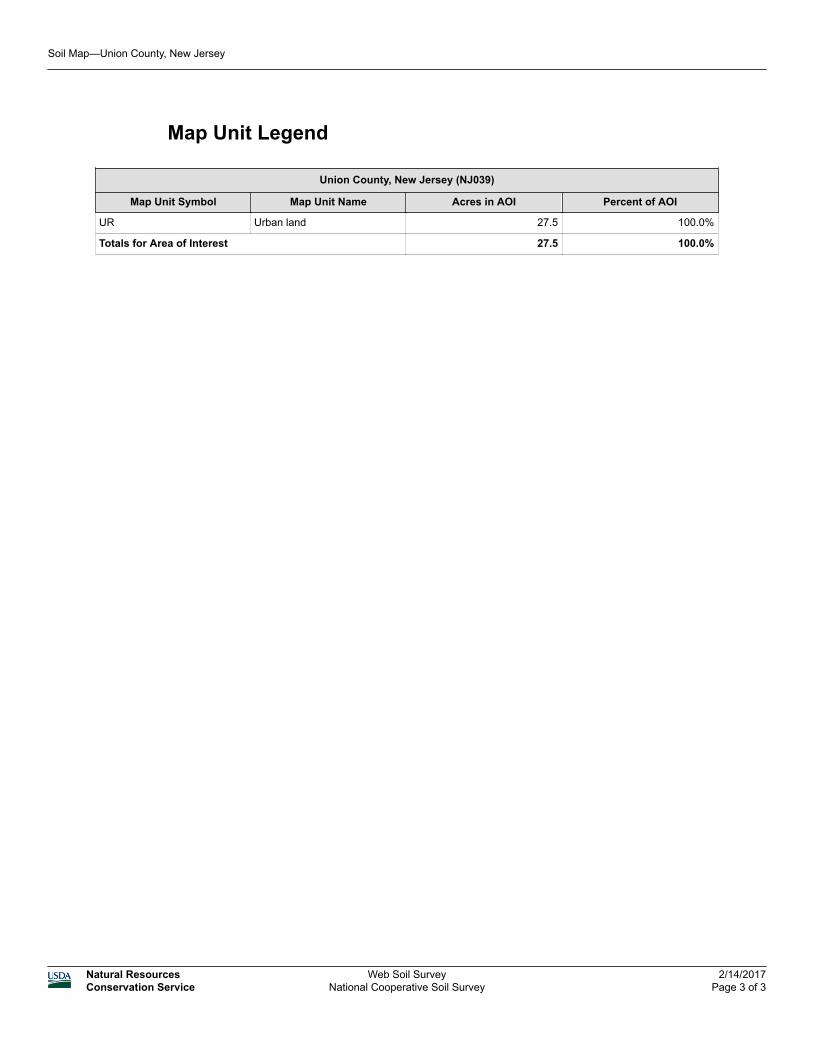
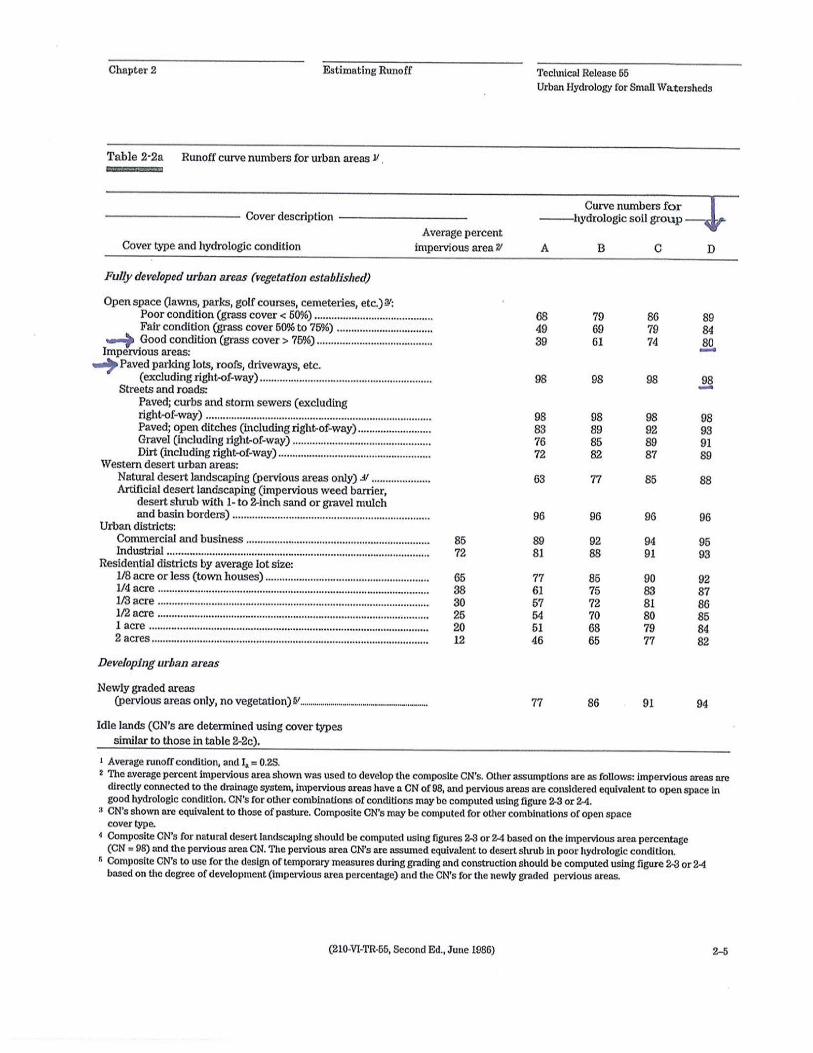
6.0 Hydrology The stormwater analysis is based on the US Department of Agriculture Natural Resources Conservation Service Technical Release 55 (TR‐55) methodology for computing stormwater runoff. The site consists of the following soil types:
Urban Land For the purposes of this analysis, we have considered the site, consisting entirely of Urban Land soils, to be Hydrologic Soil Group D soils. A copy of the soils map from the NRCS Web Soil Survey is included in the Appendix of this report. The following runoff curve numbers were chosen for the existing and proposed land uses:
4
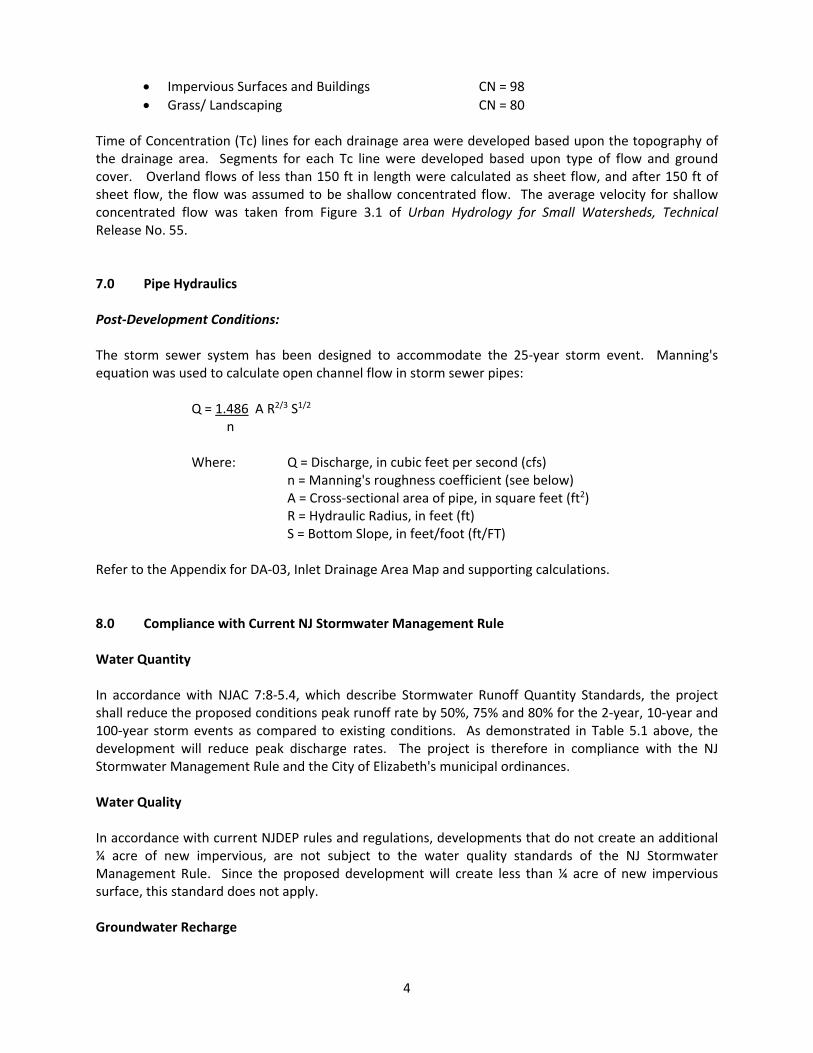
Impervious Surfaces and Buildings CN = 98
Grass/ Landscaping CN = 80 Time of Concentration (Tc) lines for each drainage area were developed based upon the topography of the drainage area. Segments for each Tc line were developed based upon type of flow and ground cover. Overland flows of less than 150 ft in length were calculated as sheet flow, and after 150 ft of sheet flow, the flow was assumed to be shallow concentrated flow. The average velocity for shallow concentrated flow was taken from Figure 3.1 of Urban Hydrology for Small Watersheds, Technical Release No. 55. 7.0 Pipe Hydraulics Post‐Development Conditions: The storm sewer system has been designed to accommodate the 25‐year storm event. Manning's equation was used to calculate open channel flow in storm sewer pipes:
Q = 1.486 A R2/3 S1/2
n Where: Q = Discharge, in cubic feet per second (cfs) n = Manning's roughness coefficient (see below) A = Cross‐sectional area of pipe, in square feet (ft2) R = Hydraulic Radius, in feet (ft) S = Bottom Slope, in feet/foot (ft/FT) Refer to the Appendix for DA‐03, Inlet Drainage Area Map and supporting calculations.
8.0 Compliance with Current NJ Stormwater Management Rule Water Quantity In accordance with NJAC 7:8‐5.4, which describe Stormwater Runoff Quantity Standards, the project shall reduce the proposed conditions peak runoff rate by 50%, 75% and 80% for the 2‐year, 10‐year and 100‐year storm events as compared to existing conditions. As demonstrated in Table 5.1 above, the development will reduce peak discharge rates. The project is therefore in compliance with the NJ Stormwater Management Rule and the City of Elizabeth's municipal ordinances. Water Quality In accordance with current NJDEP rules and regulations, developments that do not create an additional ¼ acre of new impervious, are not subject to the water quality standards of the NJ Stormwater Management Rule. Since the proposed development will create less than ¼ acre of new impervious surface, this standard does not apply. Groundwater Recharge

5
In accordance with NJAC 7:8‐5.4, which describes Stormwater Recharge Standards: “This groundwater recharge requirement does not apply to projects within the urban redevelopment area." The definition of Urban Redevelopment Area includes areas of the State within the Metropolitan Planning Area 1 as delineated on the State Plan Policy Map. This project area falls within a Metropolitan Planning Area 1, therefore this requirement does not apply.
Soil Map—Union County, New Jersey
Natural ResourcesConservation Service
Web Soil SurveyNational Cooperative Soil Survey
2/14/2017Page 1 of 3
4501
370
4501
430
4501
490
4501
550
4501
610
4501
670
4501
730
4501
790
4501
850
4501
370
4501
430
4501
490
4501
550
4501
610
4501
670
4501
730
4501
790
4501
850
567110 567170 567230 567290 567350 567410 567470
567110 567170 567230 567290 567350 567410 567470
40° 39' 53'' N74
° 1
2' 2
2'' W
40° 39' 53'' N
74° 1
2' 6
'' W
40° 39' 37'' N
74° 1
2' 2
2'' W
40° 39' 37'' N
74° 1
2' 6
'' W
N
Map projection: Web Mercator Corner coordinates: WGS84 Edge tics: UTM Zone 18N WGS840 100 200 400 600
Feet0 35 70 140 210
MetersMap Scale: 1:2,450 if printed on A portrait (8.5" x 11") sheet.
Soil Map may not be valid at this scale.
MAP LEGEND MAP INFORMATION
Area of Interest (AOI)Area of Interest (AOI)
SoilsSoil Map Unit Polygons
Soil Map Unit Lines
Soil Map Unit Points
Special Point FeaturesBlowout
Borrow Pit
Clay Spot
Closed Depression
Gravel Pit
Gravelly Spot
Landfill
Lava Flow
Marsh or swamp
Mine or Quarry
Miscellaneous Water
Perennial Water
Rock Outcrop
Saline Spot
Sandy Spot
Severely Eroded Spot
Sinkhole
Slide or Slip
Sodic Spot
Spoil Area
Stony Spot
Very Stony Spot
Wet Spot
Other
Special Line Features
Water FeaturesStreams and Canals
TransportationRails
Interstate Highways
US Routes
Major Roads
Local Roads
BackgroundAerial Photography
The soil surveys that comprise your AOI were mapped at1:24,000.
Warning: Soil Map may not be valid at this scale.
Enlargement of maps beyond the scale of mapping can causemisunderstanding of the detail of mapping and accuracy of soilline placement. The maps do not show the small areas ofcontrasting soils that could have been shown at a more detailedscale.
Please rely on the bar scale on each map sheet for mapmeasurements.
Source of Map: Natural Resources Conservation ServiceWeb Soil Survey URL:Coordinate System: Web Mercator (EPSG:3857)
Maps from the Web Soil Survey are based on the Web Mercatorprojection, which preserves direction and shape but distortsdistance and area. A projection that preserves area, such as theAlbers equal-area conic projection, should be used if moreaccurate calculations of distance or area are required.
This product is generated from the USDA-NRCS certified data asof the version date(s) listed below.
Soil Survey Area: Union County, New JerseySurvey Area Data: Version 10, Sep 28, 2016
Soil map units are labeled (as space allows) for map scales1:50,000 or larger.
Date(s) aerial images were photographed: Aug 25, 2014—Sep27, 2014
The orthophoto or other base map on which the soil lines werecompiled and digitized probably differs from the backgroundimagery displayed on these maps. As a result, some minorshifting of map unit boundaries may be evident.
Soil Map—Union County, New Jersey
Natural ResourcesConservation Service
Web Soil SurveyNational Cooperative Soil Survey
2/14/2017Page 2 of 3
Map Unit Legend
Union County, New Jersey (NJ039)
Map Unit Symbol Map Unit Name Acres in AOI Percent of AOI
UR Urban land 27.5 100.0%
Totals for Area of Interest 27.5 100.0%
Soil Map—Union County, New Jersey
Natural ResourcesConservation Service
Web Soil SurveyNational Cooperative Soil Survey
2/14/2017Page 3 of 3
Jers
ey W
alk
Res
iden
tial
Dev
elo
pm
ent,
Cit
y o
f E
lizab
eth
, NJ
Runoff Curve Number CN Calculations
Existing Conditions (Impervious)
Existing Conditions (Pervious)
EX‐DA‐1 (I)
EX‐DA‐1 (P)
Cover Type
Area (SF)
CN Value
Area x CN
Cover Type
Area (SF)
CN Value
Area x CN
Impervious
227,142
98
22,259,916
Impervious
098
0
Grass/Landscaping
080
0Grass/Landscaping
8,410
80
672,800
227,142
22,259,916
8,410
672,800
5.21
Ac.
0.19
Ac.
Weighted CN =
98
Weighted CN =
80
Proposed Conditions (Impervious)
Proposed Conditions (Pervious)
PR‐DA‐1 (I)
PR‐DA‐1 (P)
Cover Type
Area (SF)
CN Value
Area x CN
Cover Type
Area (SF)
CN Value
Area x CN
Impervious
33,909
98
3,323,082
Impervious
098
0
Grass/Landscaping
080
0Grass/Landscaping
39,153
80
3,132,240
33,909
3,323,082
39,153
3,132,240
0.78
Ac.
0.90
Ac.
Weighted CN =
98
Weighted CN =
80
PR‐DA‐2
Cover Type
Area (SF)
CN Value
Area x CN
Impervious
7,405
98
725,690
Grass/Landscaping
080
0
7,405
725,690
0.17
Ac.
Weighted CN =
98
Proposed Conditions (Impervious)
Proposed Conditions (Pervious)
PR‐DA‐3A
Cover Type
Area (SF)
CN Value
Area x CN
Impervious
30,133
98
2,953,034
Grass/Landscaping
080
0
30,133
2,953,034
0.69
Ac.
Weighted CN =
98
PR‐DA‐3B (I)
PR‐DA‐3B (P)
Cover Type
Area (SF)
CN Value
Area x CN
Cover Type
Area (SF)
CN Value
Area x CN
Impervious
27,004
98
2,646,392
Impervious
098
0
Grass/Landscaping
080
0Grass/Landscaping
97,779
80
7,822,320
27,004
2,646,392
97,779
7,822,320
0.62
Ac.
2.24
Ac.
Weighted CN =
98
Weighted CN =
80
Existing & Proposed Conditions Hydrologic Model
PROJECT:
DRAWING TITLE:
60 GRAND AVENUE
ENGLEWOOD. NJ 07631
201.227.0300 • 201.227.0001 (Fax) www.L2Alanddesign.com
New Jersey Certificate of Authorization
No. 24GA28130900
NJ Professional Engineer #24GE04690600
William R. Vogt Jr., P.E. DATE
JERSEY WALK
RESIDENTIAL DEVELOPMENT
907-931 EAST JERSEY STREET
CITY OF ELIZABETH
UNION COUNTY, NEW JERSEY
BLOCK: 7, LOT: 312
TAX MAP: BOOK 3, SHEET 18
07/09/20
EXISTING
DRAINAGE
AREA MAP
DA-01
6-STORY
PROPOSED
BUILDING (UNIT-2)
6-STORY
PROPOSED
BUILDING (UNIT-1)
(69 BICYCLE SPACES
WITHIN GARAGE)
PROJECT:
DRAWING TITLE:
60 GRAND AVENUE
ENGLEWOOD. NJ 07631
201.227.0300 • 201.227.0001 (Fax) www.L2Alanddesign.com
New Jersey Certificate of Authorization
No. 24GA28130900
NJ Professional Engineer #24GE04690600
William R. Vogt Jr., P.E. DATE
JERSEY WALK
RESIDENTIAL DEVELOPMENT
907-931 EAST JERSEY STREET
CITY OF ELIZABETH
UNION COUNTY, NEW JERSEY
BLOCK: 7, LOT: 312
TAX MAP: BOOK 3, SHEET 18
07/09/20
PROPOSED
DRAINAGE
AREA MAP
DA-02
1 2
3
4 5
6
7
8
9 10
11
12
13
14
15
16
1
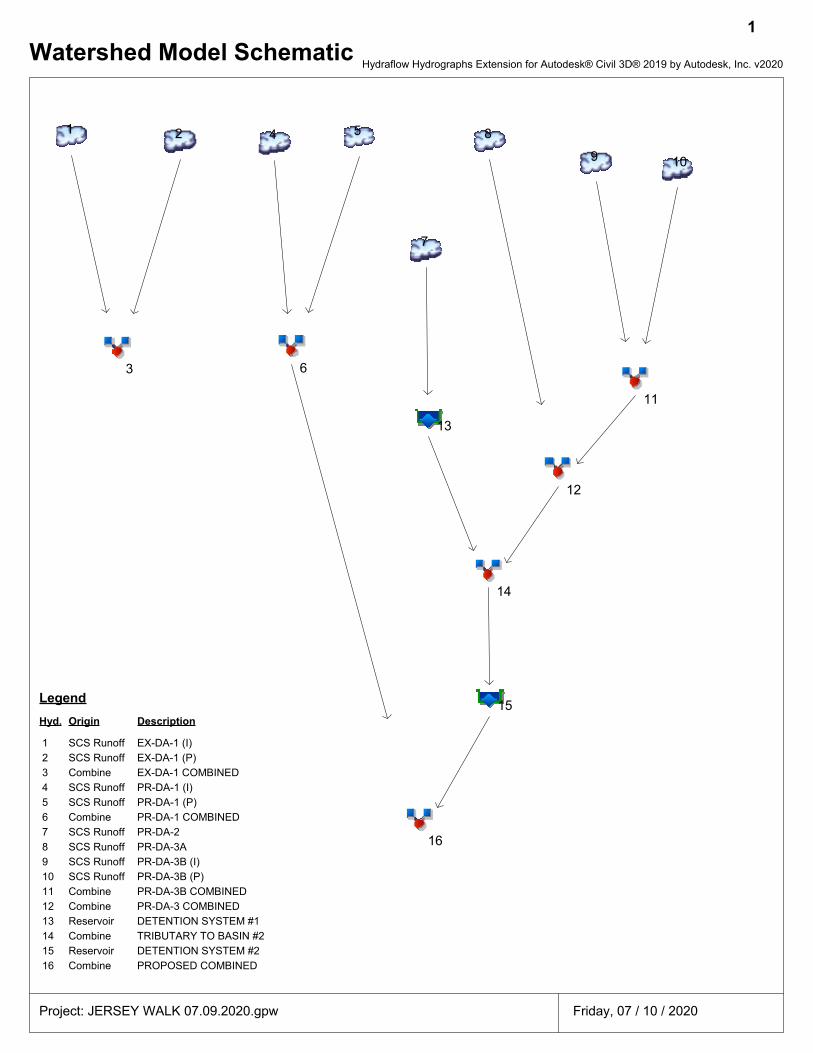
Watershed Model SchematicHydraflow Hydrographs Extension for Autodesk® Civil 3D® 2019 by Autodesk, Inc. v2020
Project: JERSEY WALK 07.09.2020.gpw Friday, 07 / 10 / 2020
Hyd. Origin Description
Legend
1 SCS Runoff EX-DA-1 (I)
2 SCS Runoff EX-DA-1 (P)
3 Combine EX-DA-1 COMBINED
4 SCS Runoff PR-DA-1 (I)
5 SCS Runoff PR-DA-1 (P)
6 Combine PR-DA-1 COMBINED
7 SCS Runoff PR-DA-2
8 SCS Runoff PR-DA-3A
9 SCS Runoff PR-DA-3B (I)
10 SCS Runoff PR-DA-3B (P)
11 Combine PR-DA-3B COMBINED
12 Combine PR-DA-3 COMBINED
13 Reservoir DETENTION SYSTEM #1
14 Combine TRIBUTARY TO BASIN #2
15 Reservoir DETENTION SYSTEM #2
16 Combine PROPOSED COMBINED

Hydrograph ReportHydraflow Hydrographs Extension for Autodesk® Civil 3D® 2019 by Autodesk, Inc. v2020 Friday, 07 / 10 / 2020
Hyd. No. 1
EX-DA-1 (I)
Hydrograph type = SCS Runoff Peak discharge = 16.60 cfsStorm frequency = 2 yrs Time to peak = 12.07 hrsTime interval = 2 min Hyd. volume = 56,148 cuftDrainage area = 5.210 ac Curve number = 98Basin Slope = 0.0 % Hydraulic length = 0 ftTc method = User Time of conc. (Tc) = 6.00 minTotal precip. = 3.40 in Distribution = Type IIIStorm duration = 24 hrs Shape factor = 484
2
0 2 4 6 8 10 12 14 16 18 20 22 24
Q (cfs)
0.00 0.00
3.00 3.00
6.00 6.00
9.00 9.00
12.00 12.00
15.00 15.00
18.00 18.00
Q (cfs)
Time (hrs)
EX-DA-1 (I)Hyd. No. 1 -- 2 Year
Hyd No. 1
Hydrograph ReportHydraflow Hydrographs Extension for Autodesk® Civil 3D® 2019 by Autodesk, Inc. v2020 Friday, 07 / 10 / 2020
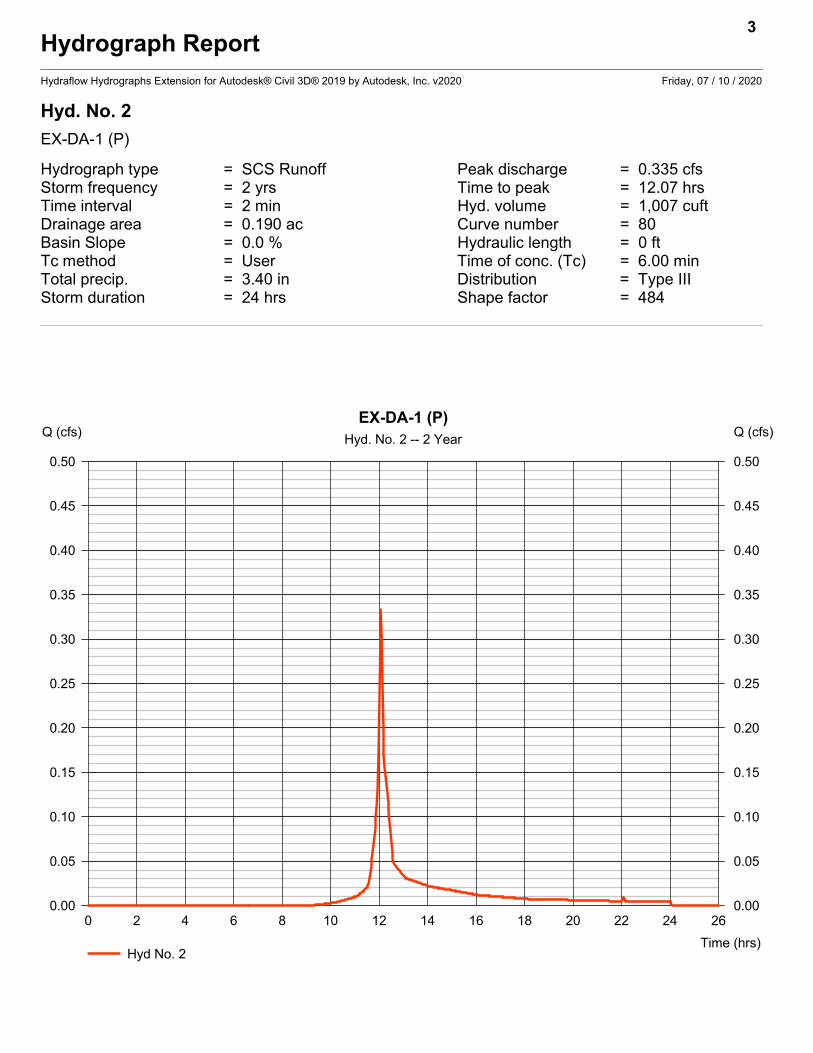
Hyd. No. 2
EX-DA-1 (P)
Hydrograph type = SCS Runoff Peak discharge = 0.335 cfsStorm frequency = 2 yrs Time to peak = 12.07 hrsTime interval = 2 min Hyd. volume = 1,007 cuftDrainage area = 0.190 ac Curve number = 80Basin Slope = 0.0 % Hydraulic length = 0 ftTc method = User Time of conc. (Tc) = 6.00 minTotal precip. = 3.40 in Distribution = Type IIIStorm duration = 24 hrs Shape factor = 484
3
0 2 4 6 8 10 12 14 16 18 20 22 24 26
Q (cfs)
0.00 0.00
0.05 0.05
0.10 0.10
0.15 0.15
0.20 0.20
0.25 0.25
0.30 0.30
0.35 0.35
0.40 0.40
0.45 0.45
0.50 0.50
Q (cfs)
Time (hrs)
EX-DA-1 (P)Hyd. No. 2 -- 2 Year
Hyd No. 2
Hydrograph ReportHydraflow Hydrographs Extension for Autodesk® Civil 3D® 2019 by Autodesk, Inc. v2020 Friday, 07 / 10 / 2020
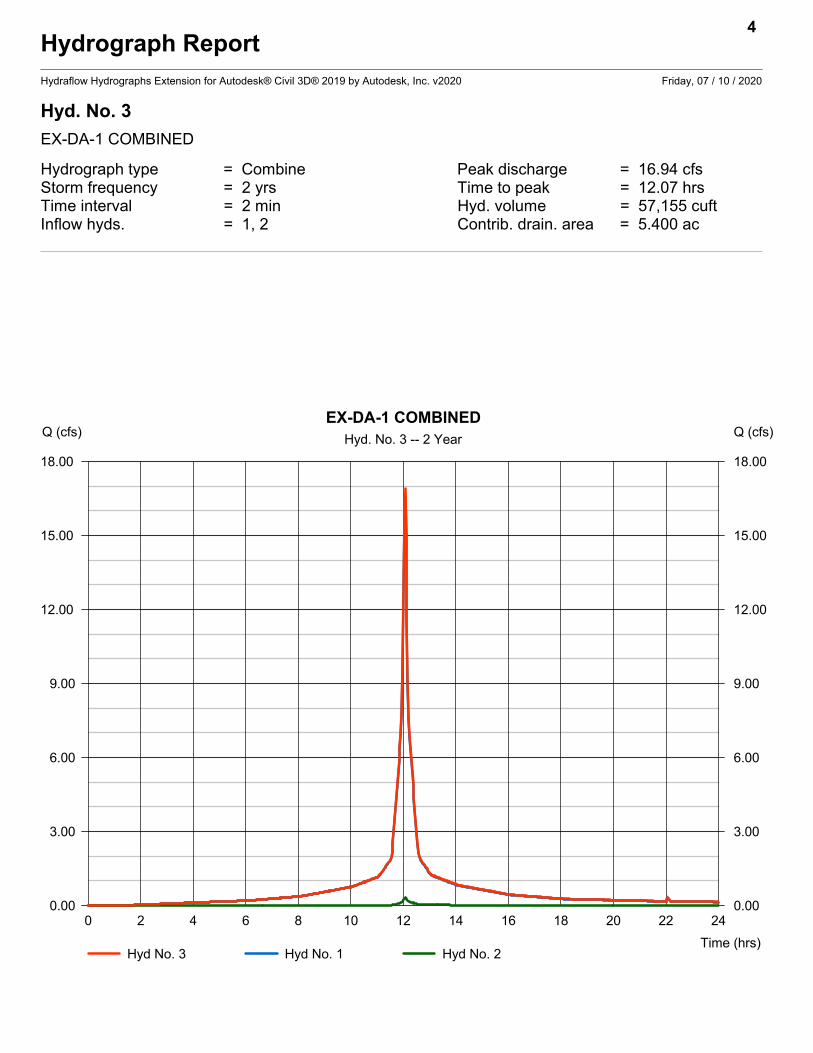
Hyd. No. 3
EX-DA-1 COMBINED
Hydrograph type = Combine Peak discharge = 16.94 cfsStorm frequency = 2 yrs Time to peak = 12.07 hrsTime interval = 2 min Hyd. volume = 57,155 cuftInflow hyds. = 1, 2 Contrib. drain. area = 5.400 ac
4
0 2 4 6 8 10 12 14 16 18 20 22 24
Q (cfs)
0.00 0.00
3.00 3.00
6.00 6.00
9.00 9.00
12.00 12.00
15.00 15.00
18.00 18.00
Q (cfs)
Time (hrs)
EX-DA-1 COMBINEDHyd. No. 3 -- 2 Year
Hyd No. 3 Hyd No. 1 Hyd No. 2
Hydrograph ReportHydraflow Hydrographs Extension for Autodesk® Civil 3D® 2019 by Autodesk, Inc. v2020 Friday, 07 / 10 / 2020
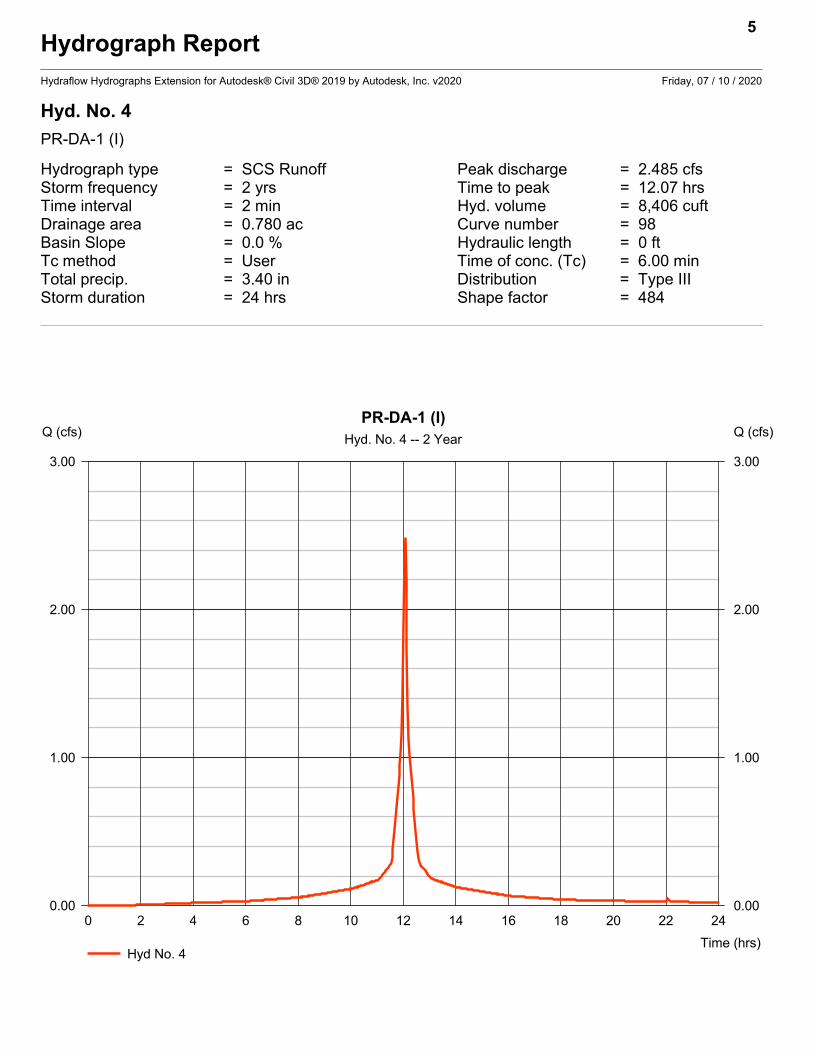
Hyd. No. 4
PR-DA-1 (I)
Hydrograph type = SCS Runoff Peak discharge = 2.485 cfsStorm frequency = 2 yrs Time to peak = 12.07 hrsTime interval = 2 min Hyd. volume = 8,406 cuftDrainage area = 0.780 ac Curve number = 98Basin Slope = 0.0 % Hydraulic length = 0 ftTc method = User Time of conc. (Tc) = 6.00 minTotal precip. = 3.40 in Distribution = Type IIIStorm duration = 24 hrs Shape factor = 484
5
0 2 4 6 8 10 12 14 16 18 20 22 24
Q (cfs)
0.00 0.00
1.00 1.00
2.00 2.00
3.00 3.00
Q (cfs)
Time (hrs)
PR-DA-1 (I)Hyd. No. 4 -- 2 Year
Hyd No. 4

Hydrograph ReportHydraflow Hydrographs Extension for Autodesk® Civil 3D® 2019 by Autodesk, Inc. v2020 Friday, 07 / 10 / 2020
Hyd. No. 5
PR-DA-1 (P)
Hydrograph type = SCS Runoff Peak discharge = 1.587 cfsStorm frequency = 2 yrs Time to peak = 12.07 hrsTime interval = 2 min Hyd. volume = 4,770 cuftDrainage area = 0.900 ac Curve number = 80Basin Slope = 0.0 % Hydraulic length = 0 ftTc method = User Time of conc. (Tc) = 6.00 minTotal precip. = 3.40 in Distribution = Type IIIStorm duration = 24 hrs Shape factor = 484
6
0 2 4 6 8 10 12 14 16 18 20 22 24 26
Q (cfs)
0.00 0.00
1.00 1.00
2.00 2.00
Q (cfs)
Time (hrs)
PR-DA-1 (P)Hyd. No. 5 -- 2 Year
Hyd No. 5
Hydrograph ReportHydraflow Hydrographs Extension for Autodesk® Civil 3D® 2019 by Autodesk, Inc. v2020 Friday, 07 / 10 / 2020
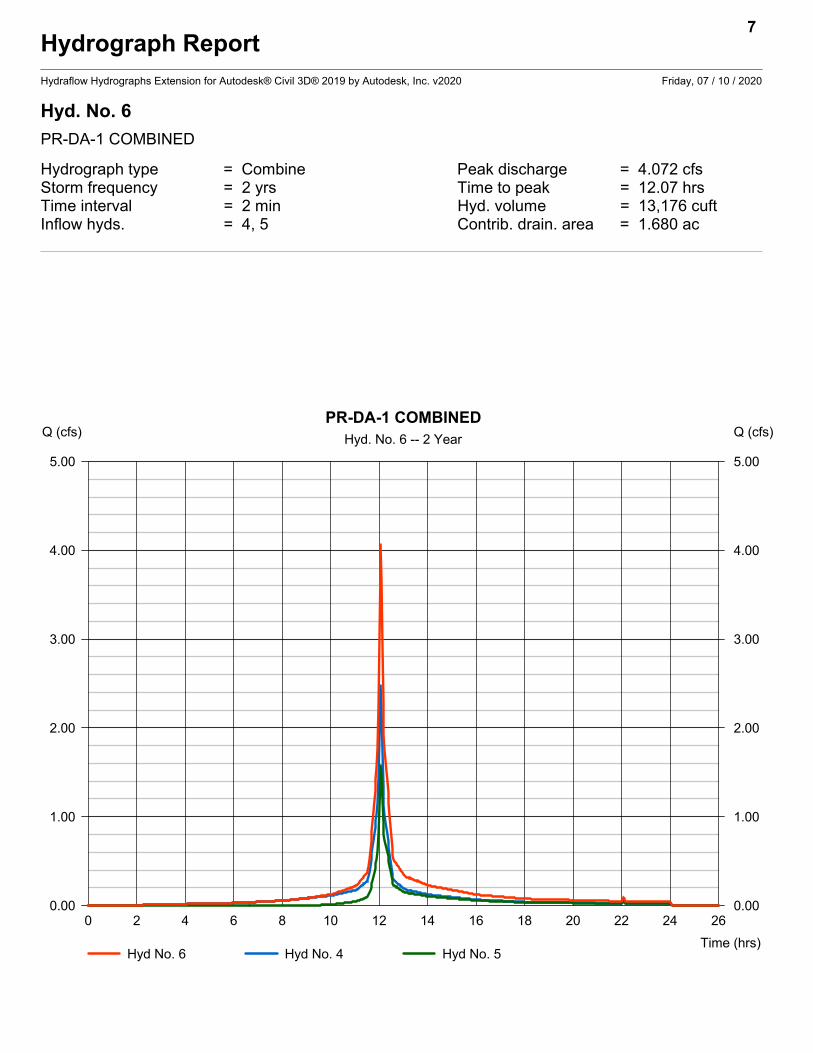
Hyd. No. 6
PR-DA-1 COMBINED
Hydrograph type = Combine Peak discharge = 4.072 cfsStorm frequency = 2 yrs Time to peak = 12.07 hrsTime interval = 2 min Hyd. volume = 13,176 cuftInflow hyds. = 4, 5 Contrib. drain. area = 1.680 ac
7
0 2 4 6 8 10 12 14 16 18 20 22 24 26
Q (cfs)
0.00 0.00
1.00 1.00
2.00 2.00
3.00 3.00
4.00 4.00
5.00 5.00
Q (cfs)
Time (hrs)
PR-DA-1 COMBINEDHyd. No. 6 -- 2 Year
Hyd No. 6 Hyd No. 4 Hyd No. 5
Hydrograph ReportHydraflow Hydrographs Extension for Autodesk® Civil 3D® 2019 by Autodesk, Inc. v2020 Friday, 07 / 10 / 2020
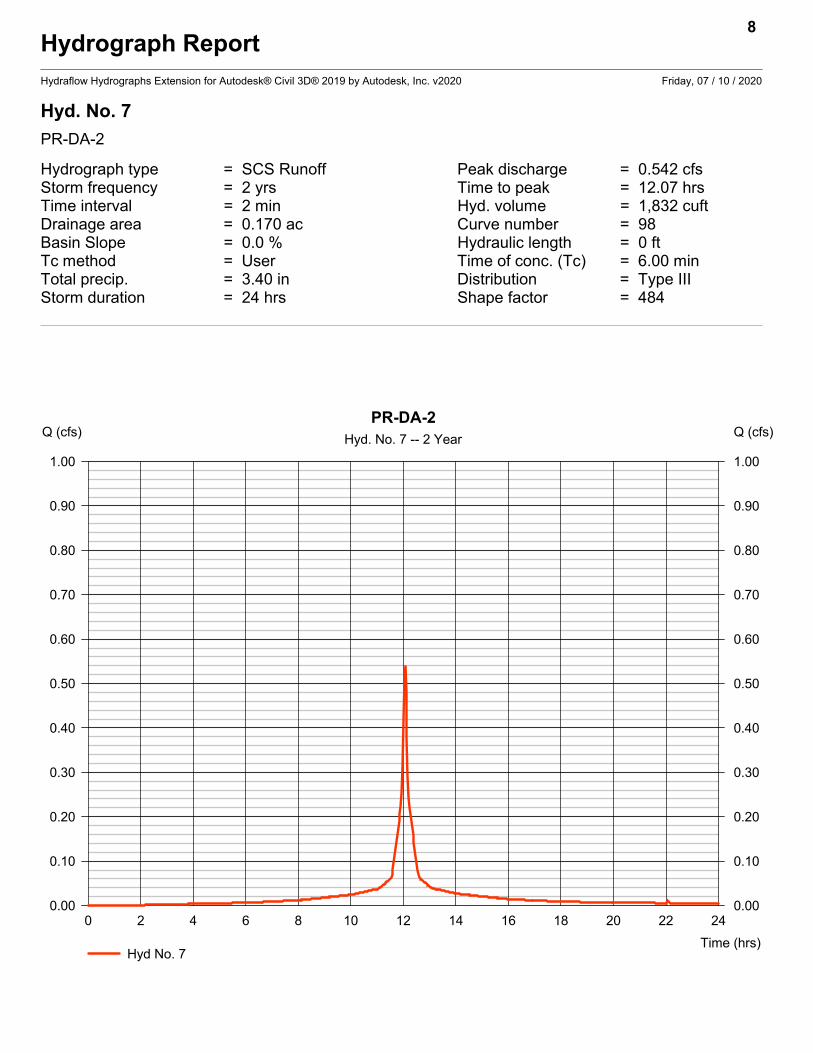
Hyd. No. 7
PR-DA-2
Hydrograph type = SCS Runoff Peak discharge = 0.542 cfsStorm frequency = 2 yrs Time to peak = 12.07 hrsTime interval = 2 min Hyd. volume = 1,832 cuftDrainage area = 0.170 ac Curve number = 98Basin Slope = 0.0 % Hydraulic length = 0 ftTc method = User Time of conc. (Tc) = 6.00 minTotal precip. = 3.40 in Distribution = Type IIIStorm duration = 24 hrs Shape factor = 484
8
0 2 4 6 8 10 12 14 16 18 20 22 24
Q (cfs)
0.00 0.00
0.10 0.10
0.20 0.20
0.30 0.30
0.40 0.40
0.50 0.50
0.60 0.60
0.70 0.70
0.80 0.80
0.90 0.90
1.00 1.00
Q (cfs)
Time (hrs)
PR-DA-2Hyd. No. 7 -- 2 Year
Hyd No. 7
Hydrograph ReportHydraflow Hydrographs Extension for Autodesk® Civil 3D® 2019 by Autodesk, Inc. v2020 Friday, 07 / 10 / 2020
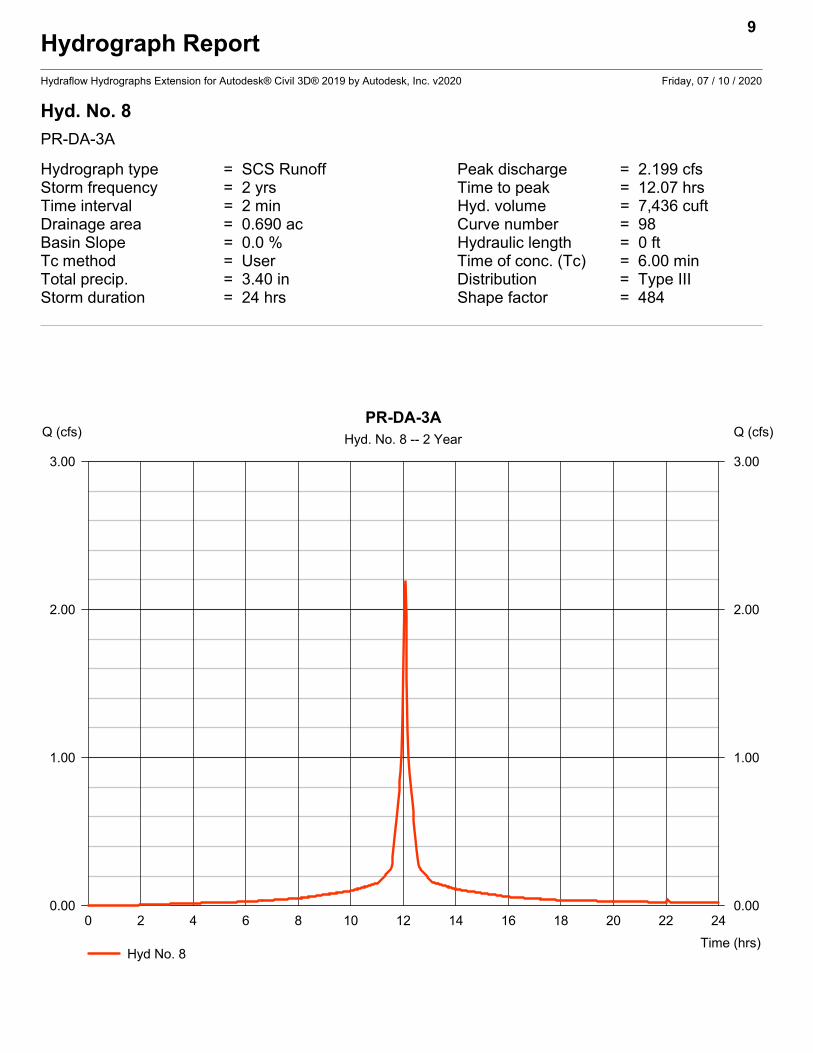
Hyd. No. 8
PR-DA-3A
Hydrograph type = SCS Runoff Peak discharge = 2.199 cfsStorm frequency = 2 yrs Time to peak = 12.07 hrsTime interval = 2 min Hyd. volume = 7,436 cuftDrainage area = 0.690 ac Curve number = 98Basin Slope = 0.0 % Hydraulic length = 0 ftTc method = User Time of conc. (Tc) = 6.00 minTotal precip. = 3.40 in Distribution = Type IIIStorm duration = 24 hrs Shape factor = 484
9
0 2 4 6 8 10 12 14 16 18 20 22 24
Q (cfs)
0.00 0.00
1.00 1.00
2.00 2.00
3.00 3.00
Q (cfs)
Time (hrs)
PR-DA-3AHyd. No. 8 -- 2 Year
Hyd No. 8

Hydrograph ReportHydraflow Hydrographs Extension for Autodesk® Civil 3D® 2019 by Autodesk, Inc. v2020 Friday, 07 / 10 / 2020
Hyd. No. 9
PR-DA-3B (I)
Hydrograph type = SCS Runoff Peak discharge = 1.975 cfsStorm frequency = 2 yrs Time to peak = 12.07 hrsTime interval = 2 min Hyd. volume = 6,682 cuftDrainage area = 0.620 ac Curve number = 98Basin Slope = 0.0 % Hydraulic length = 0 ftTc method = User Time of conc. (Tc) = 6.00 minTotal precip. = 3.40 in Distribution = Type IIIStorm duration = 24 hrs Shape factor = 484
10
0 2 4 6 8 10 12 14 16 18 20 22 24
Q (cfs)
0.00 0.00
1.00 1.00
2.00 2.00
Q (cfs)
Time (hrs)
PR-DA-3B (I)Hyd. No. 9 -- 2 Year
Hyd No. 9
Hydrograph ReportHydraflow Hydrographs Extension for Autodesk® Civil 3D® 2019 by Autodesk, Inc. v2020 Friday, 07 / 10 / 2020
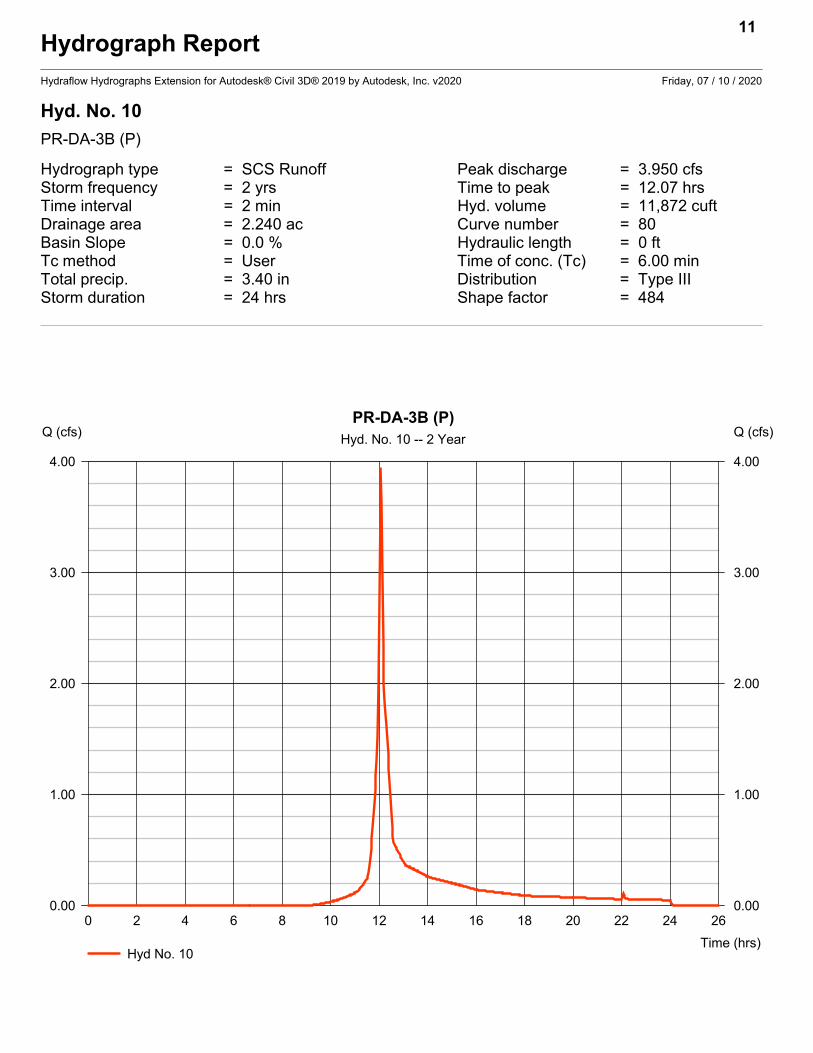
Hyd. No. 10
PR-DA-3B (P)
Hydrograph type = SCS Runoff Peak discharge = 3.950 cfsStorm frequency = 2 yrs Time to peak = 12.07 hrsTime interval = 2 min Hyd. volume = 11,872 cuftDrainage area = 2.240 ac Curve number = 80Basin Slope = 0.0 % Hydraulic length = 0 ftTc method = User Time of conc. (Tc) = 6.00 minTotal precip. = 3.40 in Distribution = Type IIIStorm duration = 24 hrs Shape factor = 484
11
0 2 4 6 8 10 12 14 16 18 20 22 24 26
Q (cfs)
0.00 0.00
1.00 1.00
2.00 2.00
3.00 3.00
4.00 4.00
Q (cfs)
Time (hrs)
PR-DA-3B (P)Hyd. No. 10 -- 2 Year
Hyd No. 10
Hydrograph ReportHydraflow Hydrographs Extension for Autodesk® Civil 3D® 2019 by Autodesk, Inc. v2020 Friday, 07 / 10 / 2020
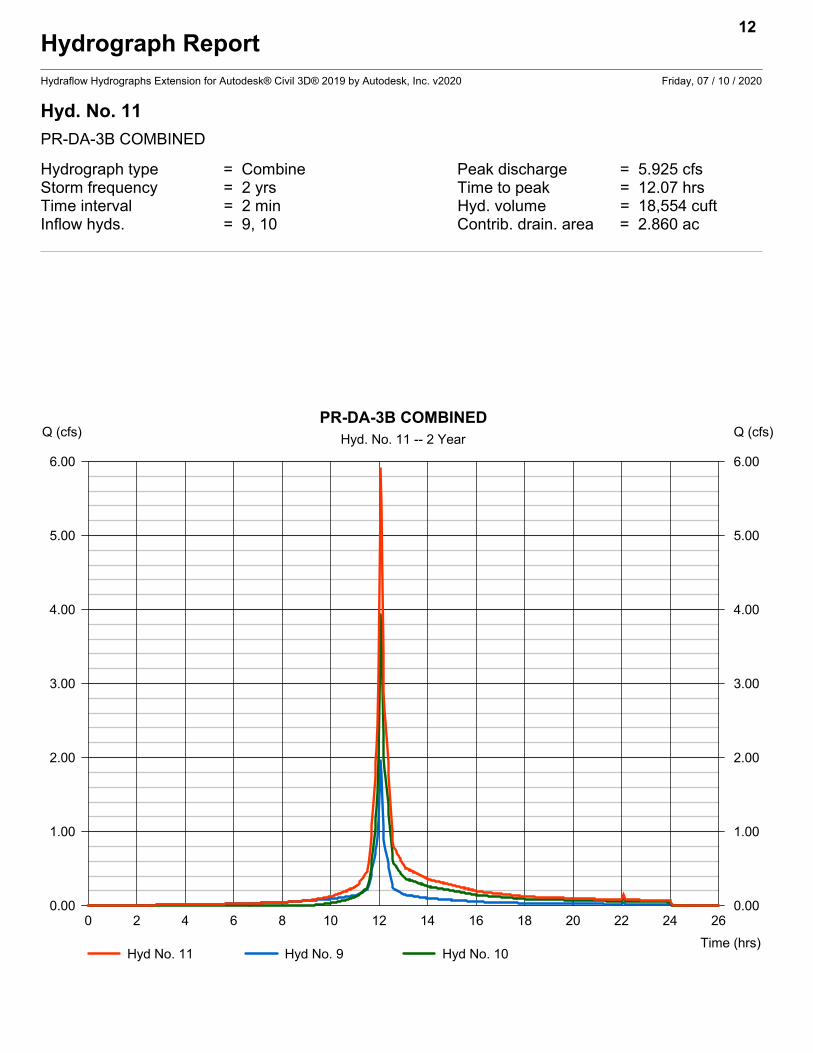
Hyd. No. 11
PR-DA-3B COMBINED
Hydrograph type = Combine Peak discharge = 5.925 cfsStorm frequency = 2 yrs Time to peak = 12.07 hrsTime interval = 2 min Hyd. volume = 18,554 cuftInflow hyds. = 9, 10 Contrib. drain. area = 2.860 ac
12
0 2 4 6 8 10 12 14 16 18 20 22 24 26
Q (cfs)
0.00 0.00
1.00 1.00
2.00 2.00
3.00 3.00
4.00 4.00
5.00 5.00
6.00 6.00
Q (cfs)
Time (hrs)
PR-DA-3B COMBINEDHyd. No. 11 -- 2 Year
Hyd No. 11 Hyd No. 9 Hyd No. 10
Hydrograph ReportHydraflow Hydrographs Extension for Autodesk® Civil 3D® 2019 by Autodesk, Inc. v2020 Friday, 07 / 10 / 2020
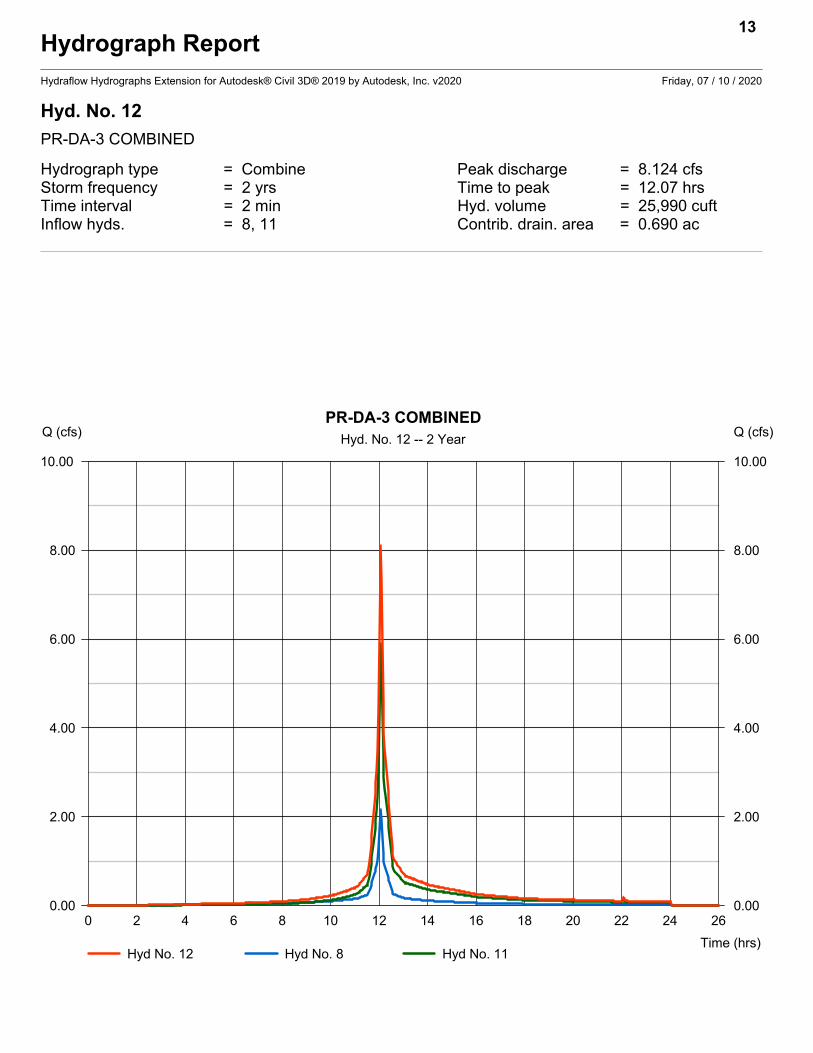
Hyd. No. 12
PR-DA-3 COMBINED
Hydrograph type = Combine Peak discharge = 8.124 cfsStorm frequency = 2 yrs Time to peak = 12.07 hrsTime interval = 2 min Hyd. volume = 25,990 cuftInflow hyds. = 8, 11 Contrib. drain. area = 0.690 ac
13
0 2 4 6 8 10 12 14 16 18 20 22 24 26
Q (cfs)
0.00 0.00
2.00 2.00
4.00 4.00
6.00 6.00
8.00 8.00
10.00 10.00
Q (cfs)
Time (hrs)
PR-DA-3 COMBINEDHyd. No. 12 -- 2 Year
Hyd No. 12 Hyd No. 8 Hyd No. 11
Hydrograph ReportHydraflow Hydrographs Extension for Autodesk® Civil 3D® 2019 by Autodesk, Inc. v2020 Friday, 07 / 10 / 2020
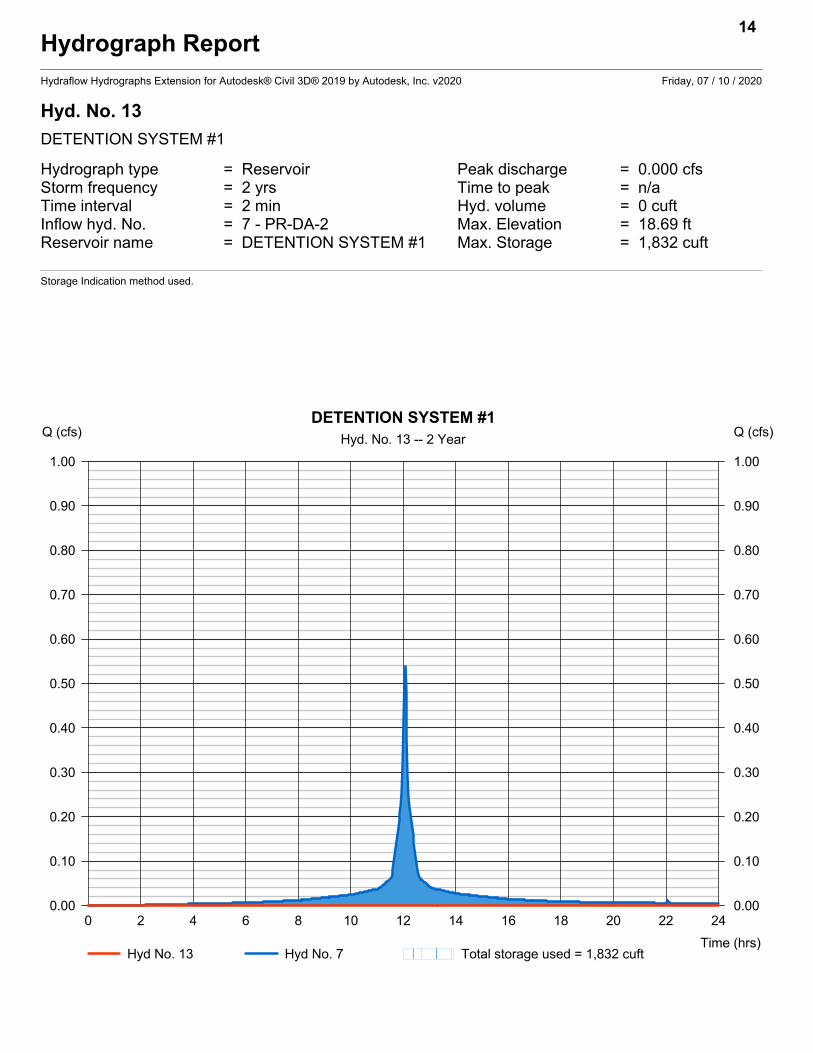
Hyd. No. 13
DETENTION SYSTEM #1
Hydrograph type = Reservoir Peak discharge = 0.000 cfsStorm frequency = 2 yrs Time to peak = n/aTime interval = 2 min Hyd. volume = 0 cuftInflow hyd. No. = 7 - PR-DA-2 Max. Elevation = 18.69 ftReservoir name = DETENTION SYSTEM #1 Max. Storage = 1,832 cuft
Storage Indication method used.
14
0 2 4 6 8 10 12 14 16 18 20 22 24
Q (cfs)
0.00 0.00
0.10 0.10
0.20 0.20
0.30 0.30
0.40 0.40
0.50 0.50
0.60 0.60
0.70 0.70
0.80 0.80
0.90 0.90
1.00 1.00
Q (cfs)
Time (hrs)
DETENTION SYSTEM #1Hyd. No. 13 -- 2 Year
Hyd No. 13 Hyd No. 7 Total storage used = 1,832 cuft
Hydrograph ReportHydraflow Hydrographs Extension for Autodesk® Civil 3D® 2019 by Autodesk, Inc. v2020 Friday, 07 / 10 / 2020
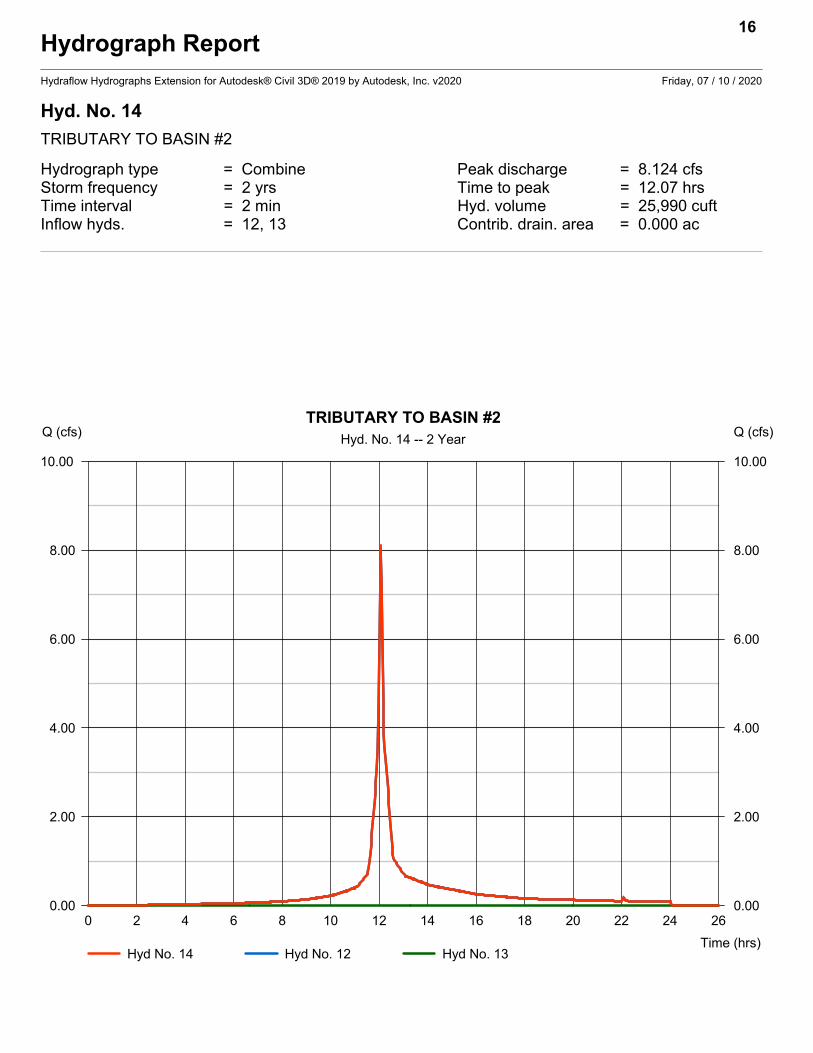
Hyd. No. 14
TRIBUTARY TO BASIN #2
Hydrograph type = Combine Peak discharge = 8.124 cfsStorm frequency = 2 yrs Time to peak = 12.07 hrsTime interval = 2 min Hyd. volume = 25,990 cuftInflow hyds. = 12, 13 Contrib. drain. area = 0.000 ac
16
0 2 4 6 8 10 12 14 16 18 20 22 24 26
Q (cfs)
0.00 0.00
2.00 2.00
4.00 4.00
6.00 6.00
8.00 8.00
10.00 10.00
Q (cfs)
Time (hrs)
TRIBUTARY TO BASIN #2Hyd. No. 14 -- 2 Year
Hyd No. 14 Hyd No. 12 Hyd No. 13
Hydrograph ReportHydraflow Hydrographs Extension for Autodesk® Civil 3D® 2019 by Autodesk, Inc. v2020 Friday, 07 / 10 / 2020
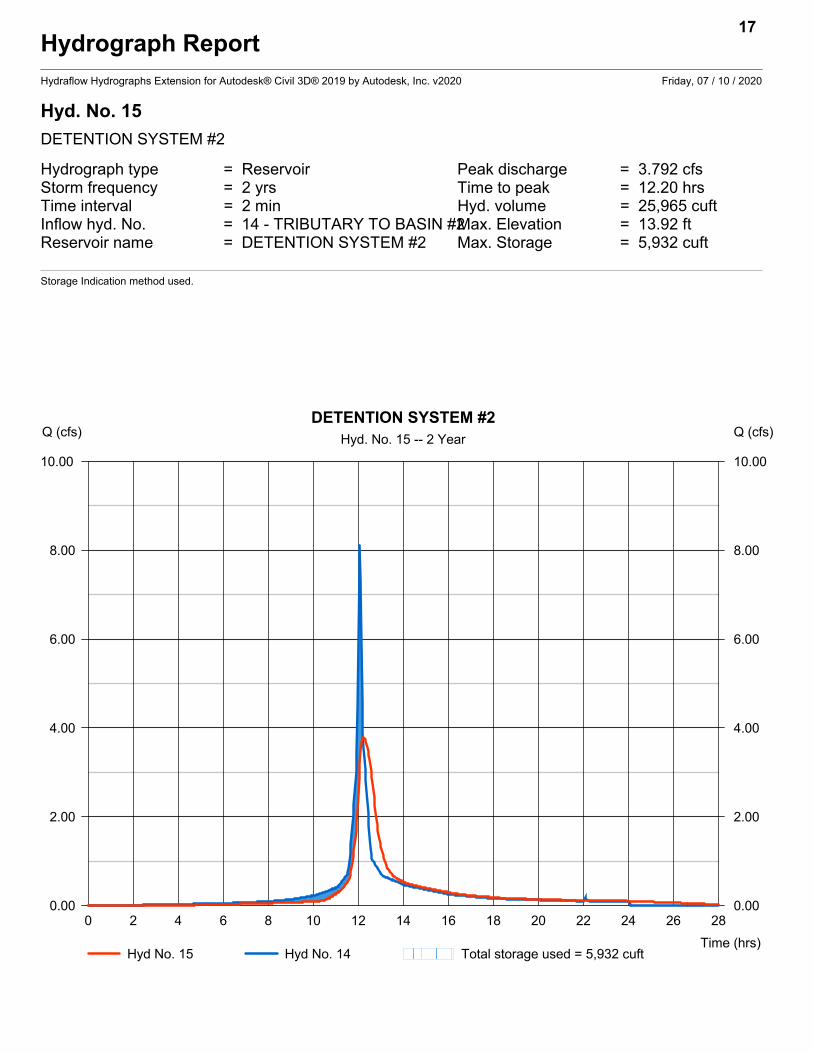
Hyd. No. 15
DETENTION SYSTEM #2
Hydrograph type = Reservoir Peak discharge = 3.792 cfsStorm frequency = 2 yrs Time to peak = 12.20 hrsTime interval = 2 min Hyd. volume = 25,965 cuftInflow hyd. No. = 14 - TRIBUTARY TO BASIN #2Max. Elevation = 13.92 ftReservoir name = DETENTION SYSTEM #2 Max. Storage = 5,932 cuft
Storage Indication method used.
17
0 2 4 6 8 10 12 14 16 18 20 22 24 26 28
Q (cfs)
0.00 0.00
2.00 2.00
4.00 4.00
6.00 6.00
8.00 8.00
10.00 10.00
Q (cfs)
Time (hrs)
DETENTION SYSTEM #2Hyd. No. 15 -- 2 Year
Hyd No. 15 Hyd No. 14 Total storage used = 5,932 cuft
Hydrograph ReportHydraflow Hydrographs Extension for Autodesk® Civil 3D® 2019 by Autodesk, Inc. v2020 Friday, 07 / 10 / 2020
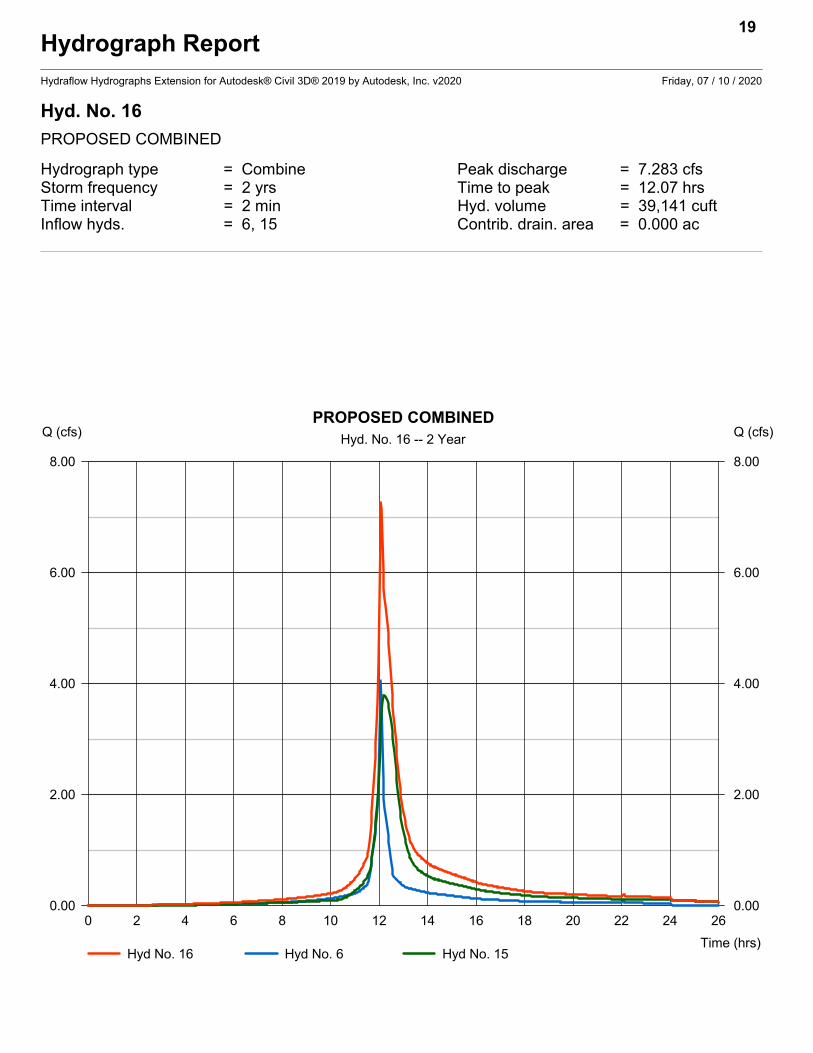
Hyd. No. 16
PROPOSED COMBINED
Hydrograph type = Combine Peak discharge = 7.283 cfsStorm frequency = 2 yrs Time to peak = 12.07 hrsTime interval = 2 min Hyd. volume = 39,141 cuftInflow hyds. = 6, 15 Contrib. drain. area = 0.000 ac
19
0 2 4 6 8 10 12 14 16 18 20 22 24 26
Q (cfs)
0.00 0.00
2.00 2.00
4.00 4.00
6.00 6.00
8.00 8.00
Q (cfs)
Time (hrs)
PROPOSED COMBINEDHyd. No. 16 -- 2 Year
Hyd No. 16 Hyd No. 6 Hyd No. 15
Hydrograph ReportHydraflow Hydrographs Extension for Autodesk® Civil 3D® 2019 by Autodesk, Inc. v2020 Friday, 07 / 10 / 2020
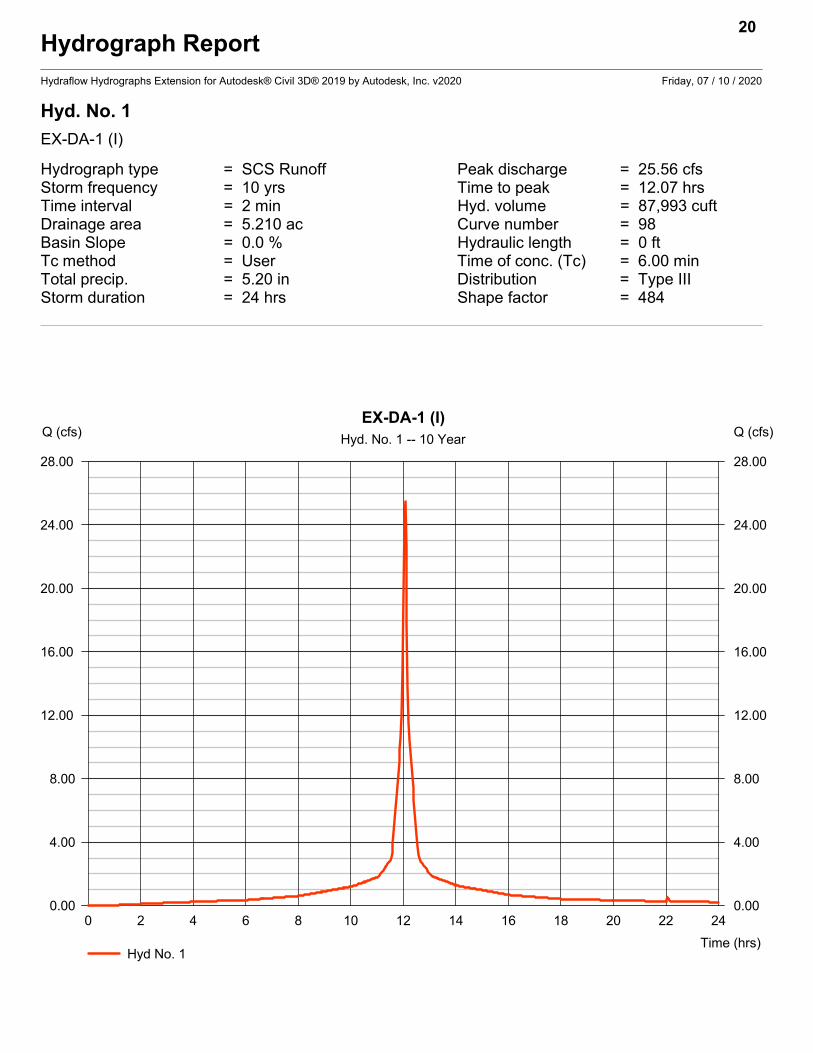
Hyd. No. 1
EX-DA-1 (I)
Hydrograph type = SCS Runoff Peak discharge = 25.56 cfsStorm frequency = 10 yrs Time to peak = 12.07 hrsTime interval = 2 min Hyd. volume = 87,993 cuftDrainage area = 5.210 ac Curve number = 98Basin Slope = 0.0 % Hydraulic length = 0 ftTc method = User Time of conc. (Tc) = 6.00 minTotal precip. = 5.20 in Distribution = Type IIIStorm duration = 24 hrs Shape factor = 484
20
0 2 4 6 8 10 12 14 16 18 20 22 24
Q (cfs)
0.00 0.00
4.00 4.00
8.00 8.00
12.00 12.00
16.00 16.00
20.00 20.00
24.00 24.00
28.00 28.00
Q (cfs)
Time (hrs)
EX-DA-1 (I)Hyd. No. 1 -- 10 Year
Hyd No. 1

Hydrograph ReportHydraflow Hydrographs Extension for Autodesk® Civil 3D® 2019 by Autodesk, Inc. v2020 Friday, 07 / 10 / 2020
Hyd. No. 2
EX-DA-1 (P)
Hydrograph type = SCS Runoff Peak discharge = 0.663 cfsStorm frequency = 10 yrs Time to peak = 12.07 hrsTime interval = 2 min Hyd. volume = 1,984 cuftDrainage area = 0.190 ac Curve number = 80Basin Slope = 0.0 % Hydraulic length = 0 ftTc method = User Time of conc. (Tc) = 6.00 minTotal precip. = 5.20 in Distribution = Type IIIStorm duration = 24 hrs Shape factor = 484
21
0 2 4 6 8 10 12 14 16 18 20 22 24 26
Q (cfs)
0.00 0.00
0.10 0.10
0.20 0.20
0.30 0.30
0.40 0.40
0.50 0.50
0.60 0.60
0.70 0.70
0.80 0.80
0.90 0.90
1.00 1.00
Q (cfs)
Time (hrs)
EX-DA-1 (P)Hyd. No. 2 -- 10 Year
Hyd No. 2

Hydrograph ReportHydraflow Hydrographs Extension for Autodesk® Civil 3D® 2019 by Autodesk, Inc. v2020 Friday, 07 / 10 / 2020
Hyd. No. 3
EX-DA-1 COMBINED
Hydrograph type = Combine Peak discharge = 26.22 cfsStorm frequency = 10 yrs Time to peak = 12.07 hrsTime interval = 2 min Hyd. volume = 89,977 cuftInflow hyds. = 1, 2 Contrib. drain. area = 5.400 ac
22
0 2 4 6 8 10 12 14 16 18 20 22 24
Q (cfs)
0.00 0.00
4.00 4.00
8.00 8.00
12.00 12.00
16.00 16.00
20.00 20.00
24.00 24.00
28.00 28.00
Q (cfs)
Time (hrs)
EX-DA-1 COMBINEDHyd. No. 3 -- 10 Year
Hyd No. 3 Hyd No. 1 Hyd No. 2
Hydrograph ReportHydraflow Hydrographs Extension for Autodesk® Civil 3D® 2019 by Autodesk, Inc. v2020 Friday, 07 / 10 / 2020
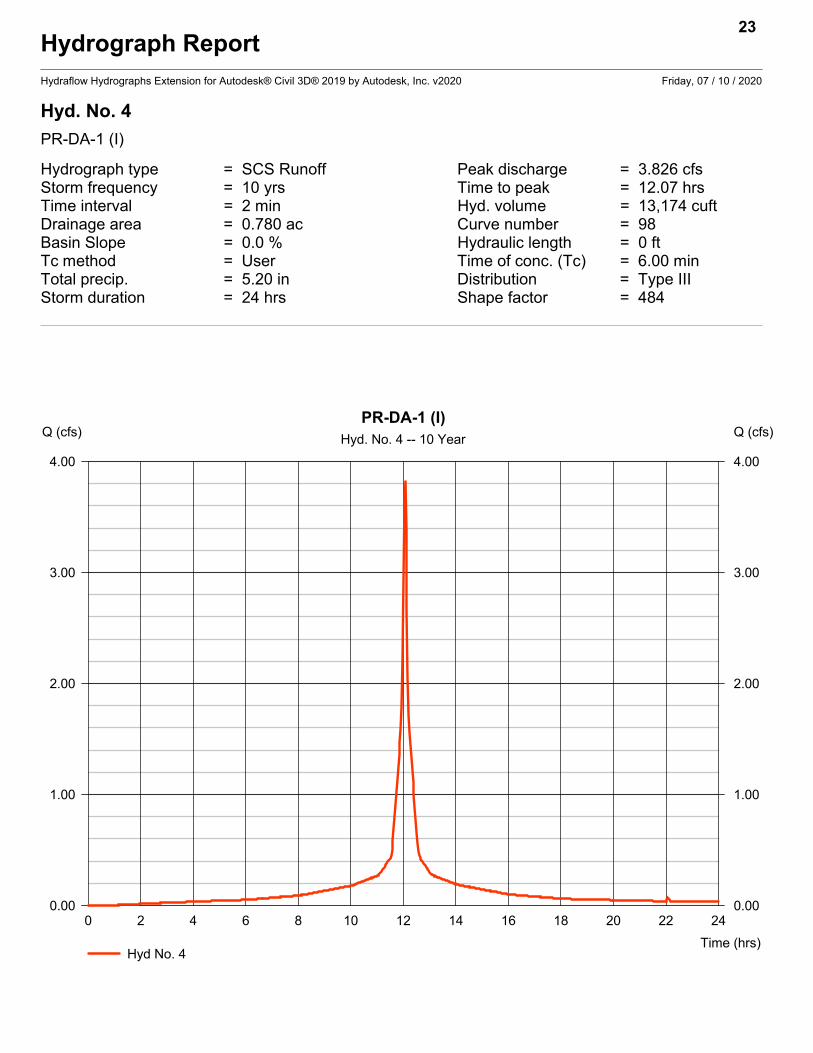
Hyd. No. 4
PR-DA-1 (I)
Hydrograph type = SCS Runoff Peak discharge = 3.826 cfsStorm frequency = 10 yrs Time to peak = 12.07 hrsTime interval = 2 min Hyd. volume = 13,174 cuftDrainage area = 0.780 ac Curve number = 98Basin Slope = 0.0 % Hydraulic length = 0 ftTc method = User Time of conc. (Tc) = 6.00 minTotal precip. = 5.20 in Distribution = Type IIIStorm duration = 24 hrs Shape factor = 484
23
0 2 4 6 8 10 12 14 16 18 20 22 24
Q (cfs)
0.00 0.00
1.00 1.00
2.00 2.00
3.00 3.00
4.00 4.00
Q (cfs)
Time (hrs)
PR-DA-1 (I)Hyd. No. 4 -- 10 Year
Hyd No. 4

Hydrograph ReportHydraflow Hydrographs Extension for Autodesk® Civil 3D® 2019 by Autodesk, Inc. v2020 Friday, 07 / 10 / 2020
Hyd. No. 5
PR-DA-1 (P)
Hydrograph type = SCS Runoff Peak discharge = 3.138 cfsStorm frequency = 10 yrs Time to peak = 12.07 hrsTime interval = 2 min Hyd. volume = 9,397 cuftDrainage area = 0.900 ac Curve number = 80Basin Slope = 0.0 % Hydraulic length = 0 ftTc method = User Time of conc. (Tc) = 6.00 minTotal precip. = 5.20 in Distribution = Type IIIStorm duration = 24 hrs Shape factor = 484
24
0 2 4 6 8 10 12 14 16 18 20 22 24 26
Q (cfs)
0.00 0.00
1.00 1.00
2.00 2.00
3.00 3.00
4.00 4.00
Q (cfs)
Time (hrs)
PR-DA-1 (P)Hyd. No. 5 -- 10 Year
Hyd No. 5
Hydrograph ReportHydraflow Hydrographs Extension for Autodesk® Civil 3D® 2019 by Autodesk, Inc. v2020 Friday, 07 / 10 / 2020
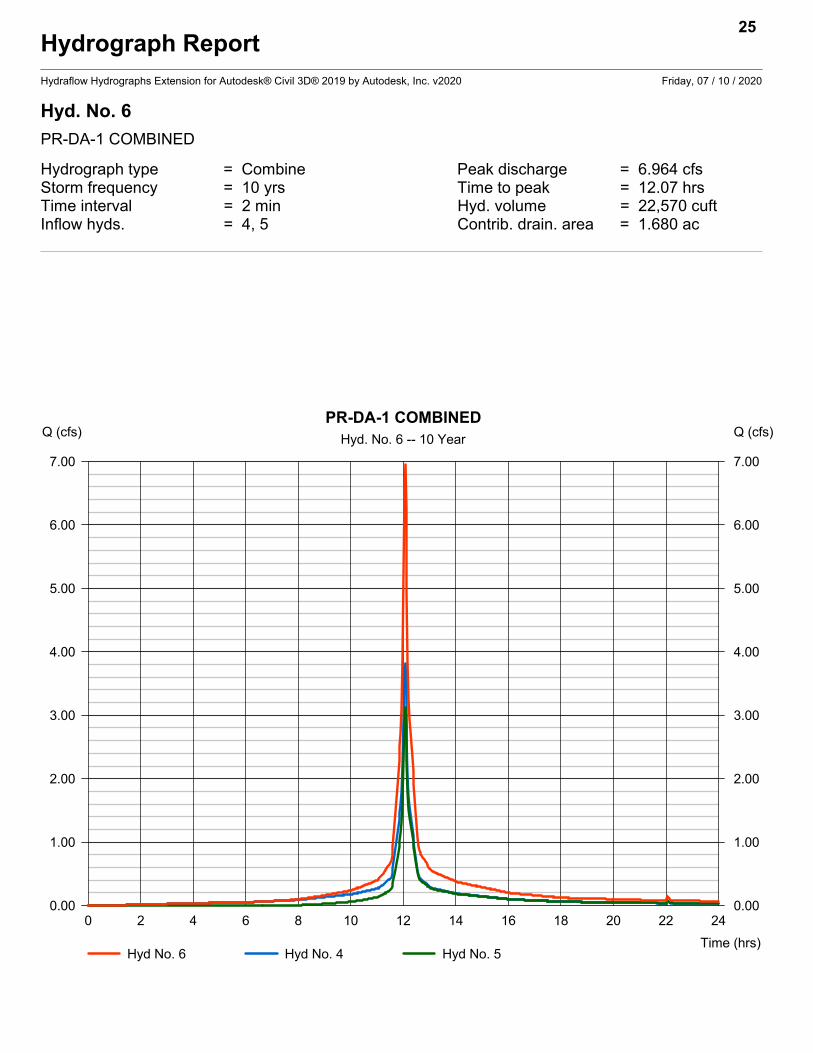
Hyd. No. 6
PR-DA-1 COMBINED
Hydrograph type = Combine Peak discharge = 6.964 cfsStorm frequency = 10 yrs Time to peak = 12.07 hrsTime interval = 2 min Hyd. volume = 22,570 cuftInflow hyds. = 4, 5 Contrib. drain. area = 1.680 ac
25
0 2 4 6 8 10 12 14 16 18 20 22 24
Q (cfs)
0.00 0.00
1.00 1.00
2.00 2.00
3.00 3.00
4.00 4.00
5.00 5.00
6.00 6.00
7.00 7.00
Q (cfs)
Time (hrs)
PR-DA-1 COMBINEDHyd. No. 6 -- 10 Year
Hyd No. 6 Hyd No. 4 Hyd No. 5

Hydrograph ReportHydraflow Hydrographs Extension for Autodesk® Civil 3D® 2019 by Autodesk, Inc. v2020 Friday, 07 / 10 / 2020
Hyd. No. 7
PR-DA-2
Hydrograph type = SCS Runoff Peak discharge = 0.834 cfsStorm frequency = 10 yrs Time to peak = 12.07 hrsTime interval = 2 min Hyd. volume = 2,871 cuftDrainage area = 0.170 ac Curve number = 98Basin Slope = 0.0 % Hydraulic length = 0 ftTc method = User Time of conc. (Tc) = 6.00 minTotal precip. = 5.20 in Distribution = Type IIIStorm duration = 24 hrs Shape factor = 484
26
0 2 4 6 8 10 12 14 16 18 20 22 24
Q (cfs)
0.00 0.00
0.10 0.10
0.20 0.20
0.30 0.30
0.40 0.40
0.50 0.50
0.60 0.60
0.70 0.70
0.80 0.80
0.90 0.90
1.00 1.00
Q (cfs)
Time (hrs)
PR-DA-2Hyd. No. 7 -- 10 Year
Hyd No. 7
Hydrograph ReportHydraflow Hydrographs Extension for Autodesk® Civil 3D® 2019 by Autodesk, Inc. v2020 Friday, 07 / 10 / 2020
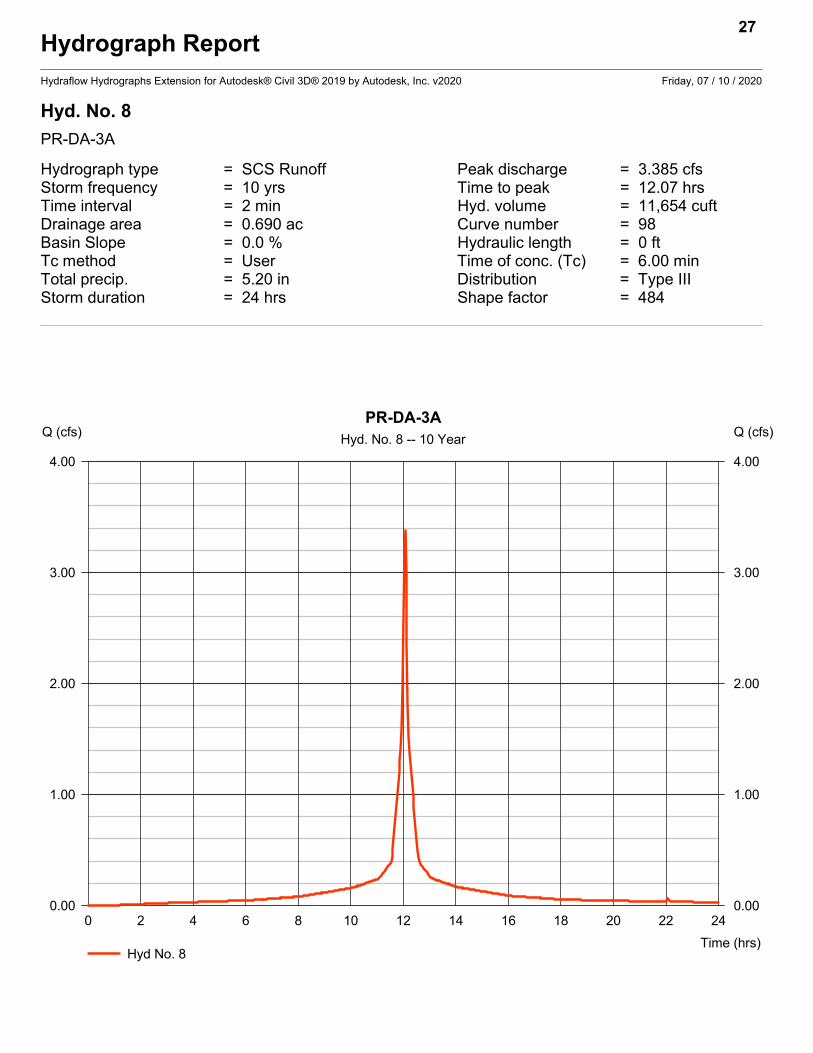
Hyd. No. 8
PR-DA-3A
Hydrograph type = SCS Runoff Peak discharge = 3.385 cfsStorm frequency = 10 yrs Time to peak = 12.07 hrsTime interval = 2 min Hyd. volume = 11,654 cuftDrainage area = 0.690 ac Curve number = 98Basin Slope = 0.0 % Hydraulic length = 0 ftTc method = User Time of conc. (Tc) = 6.00 minTotal precip. = 5.20 in Distribution = Type IIIStorm duration = 24 hrs Shape factor = 484
27
0 2 4 6 8 10 12 14 16 18 20 22 24
Q (cfs)
0.00 0.00
1.00 1.00
2.00 2.00
3.00 3.00
4.00 4.00
Q (cfs)
Time (hrs)
PR-DA-3AHyd. No. 8 -- 10 Year
Hyd No. 8
Hydrograph ReportHydraflow Hydrographs Extension for Autodesk® Civil 3D® 2019 by Autodesk, Inc. v2020 Friday, 07 / 10 / 2020
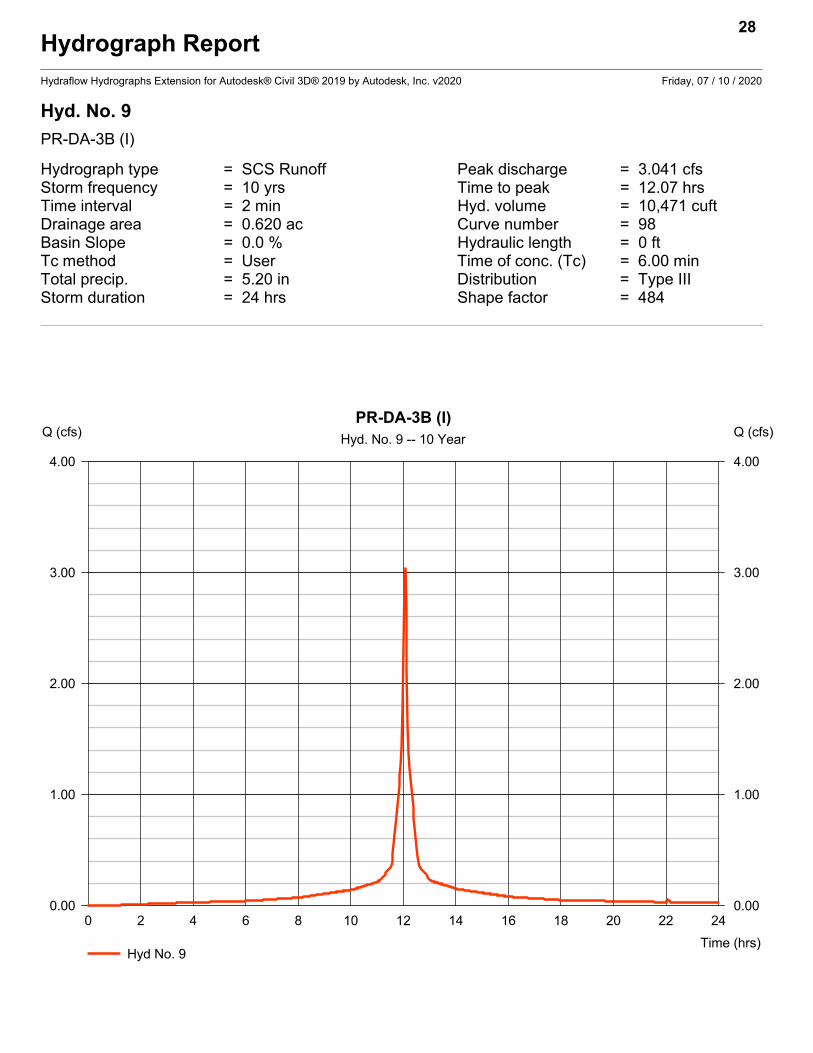
Hyd. No. 9
PR-DA-3B (I)
Hydrograph type = SCS Runoff Peak discharge = 3.041 cfsStorm frequency = 10 yrs Time to peak = 12.07 hrsTime interval = 2 min Hyd. volume = 10,471 cuftDrainage area = 0.620 ac Curve number = 98Basin Slope = 0.0 % Hydraulic length = 0 ftTc method = User Time of conc. (Tc) = 6.00 minTotal precip. = 5.20 in Distribution = Type IIIStorm duration = 24 hrs Shape factor = 484
28
0 2 4 6 8 10 12 14 16 18 20 22 24
Q (cfs)
0.00 0.00
1.00 1.00
2.00 2.00
3.00 3.00
4.00 4.00
Q (cfs)
Time (hrs)
PR-DA-3B (I)Hyd. No. 9 -- 10 Year
Hyd No. 9
Hydrograph ReportHydraflow Hydrographs Extension for Autodesk® Civil 3D® 2019 by Autodesk, Inc. v2020 Friday, 07 / 10 / 2020
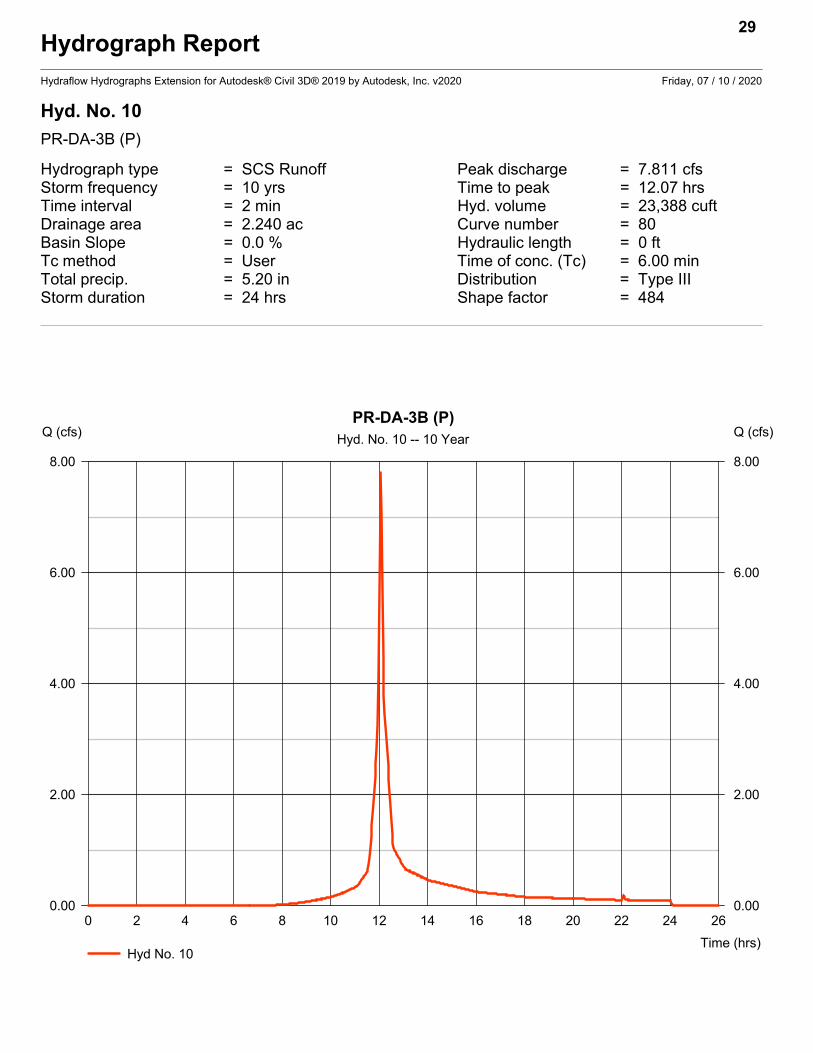
Hyd. No. 10
PR-DA-3B (P)
Hydrograph type = SCS Runoff Peak discharge = 7.811 cfsStorm frequency = 10 yrs Time to peak = 12.07 hrsTime interval = 2 min Hyd. volume = 23,388 cuftDrainage area = 2.240 ac Curve number = 80Basin Slope = 0.0 % Hydraulic length = 0 ftTc method = User Time of conc. (Tc) = 6.00 minTotal precip. = 5.20 in Distribution = Type IIIStorm duration = 24 hrs Shape factor = 484
29
0 2 4 6 8 10 12 14 16 18 20 22 24 26
Q (cfs)
0.00 0.00
2.00 2.00
4.00 4.00
6.00 6.00
8.00 8.00
Q (cfs)
Time (hrs)
PR-DA-3B (P)Hyd. No. 10 -- 10 Year
Hyd No. 10

Hydrograph ReportHydraflow Hydrographs Extension for Autodesk® Civil 3D® 2019 by Autodesk, Inc. v2020 Friday, 07 / 10 / 2020
Hyd. No. 11
PR-DA-3B COMBINED
Hydrograph type = Combine Peak discharge = 10.85 cfsStorm frequency = 10 yrs Time to peak = 12.07 hrsTime interval = 2 min Hyd. volume = 33,859 cuftInflow hyds. = 9, 10 Contrib. drain. area = 2.860 ac
30
0 2 4 6 8 10 12 14 16 18 20 22 24 26
Q (cfs)
0.00 0.00
2.00 2.00
4.00 4.00
6.00 6.00
8.00 8.00
10.00 10.00
12.00 12.00
Q (cfs)
Time (hrs)
PR-DA-3B COMBINEDHyd. No. 11 -- 10 Year
Hyd No. 11 Hyd No. 9 Hyd No. 10
Hydrograph ReportHydraflow Hydrographs Extension for Autodesk® Civil 3D® 2019 by Autodesk, Inc. v2020 Friday, 07 / 10 / 2020
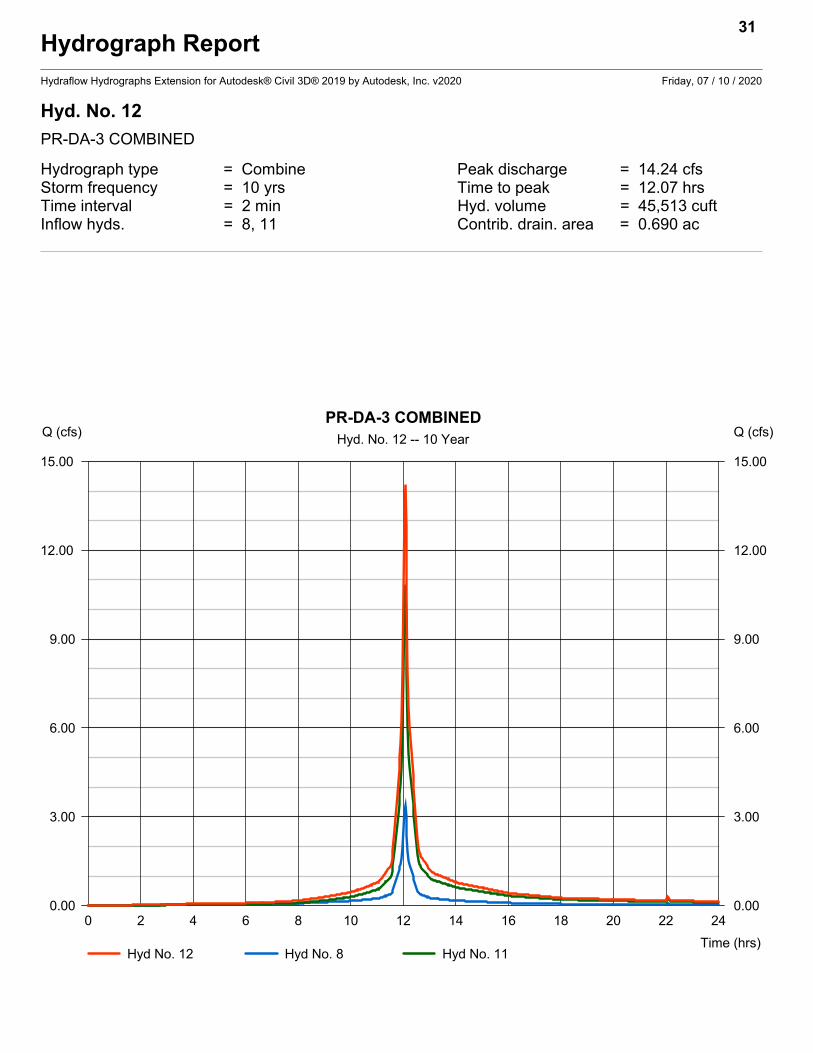
Hyd. No. 12
PR-DA-3 COMBINED
Hydrograph type = Combine Peak discharge = 14.24 cfsStorm frequency = 10 yrs Time to peak = 12.07 hrsTime interval = 2 min Hyd. volume = 45,513 cuftInflow hyds. = 8, 11 Contrib. drain. area = 0.690 ac
31
0 2 4 6 8 10 12 14 16 18 20 22 24
Q (cfs)
0.00 0.00
3.00 3.00
6.00 6.00
9.00 9.00
12.00 12.00
15.00 15.00
Q (cfs)
Time (hrs)
PR-DA-3 COMBINEDHyd. No. 12 -- 10 Year
Hyd No. 12 Hyd No. 8 Hyd No. 11
Hydrograph ReportHydraflow Hydrographs Extension for Autodesk® Civil 3D® 2019 by Autodesk, Inc. v2020 Friday, 07 / 10 / 2020
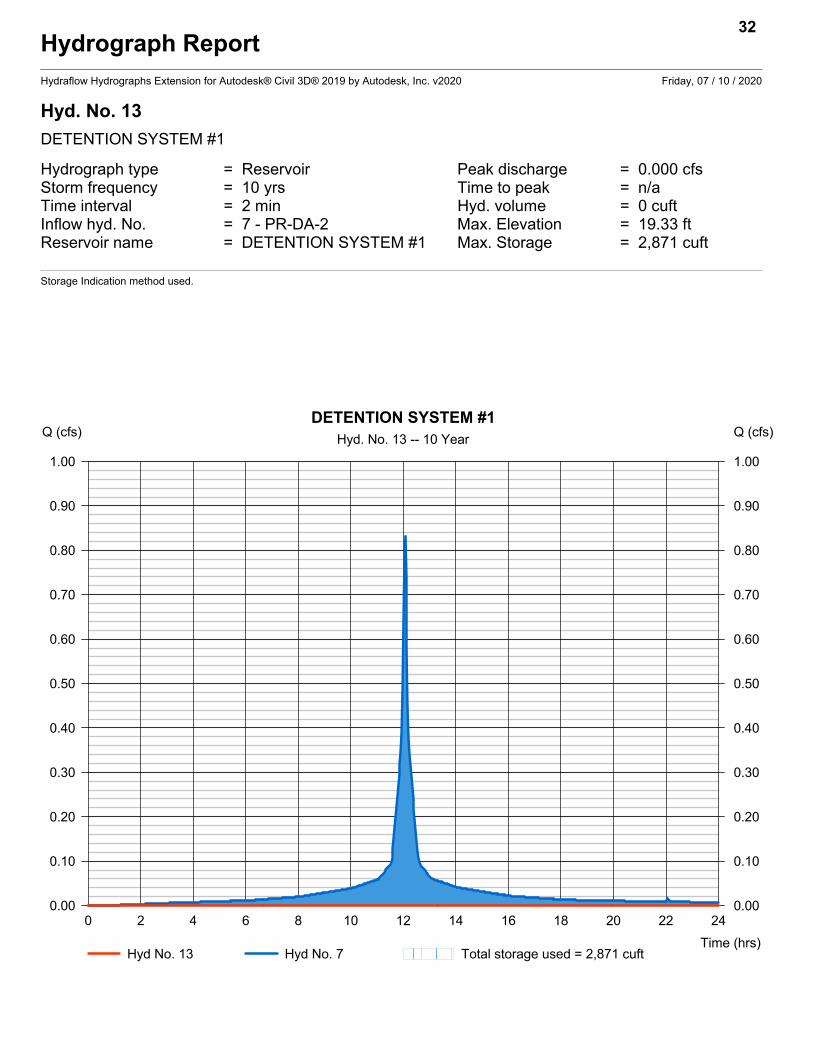
Hyd. No. 13
DETENTION SYSTEM #1
Hydrograph type = Reservoir Peak discharge = 0.000 cfsStorm frequency = 10 yrs Time to peak = n/aTime interval = 2 min Hyd. volume = 0 cuftInflow hyd. No. = 7 - PR-DA-2 Max. Elevation = 19.33 ftReservoir name = DETENTION SYSTEM #1 Max. Storage = 2,871 cuft
Storage Indication method used.
32
0 2 4 6 8 10 12 14 16 18 20 22 24
Q (cfs)
0.00 0.00
0.10 0.10
0.20 0.20
0.30 0.30
0.40 0.40
0.50 0.50
0.60 0.60
0.70 0.70
0.80 0.80
0.90 0.90
1.00 1.00
Q (cfs)
Time (hrs)
DETENTION SYSTEM #1Hyd. No. 13 -- 10 Year
Hyd No. 13 Hyd No. 7 Total storage used = 2,871 cuft
Hydrograph ReportHydraflow Hydrographs Extension for Autodesk® Civil 3D® 2019 by Autodesk, Inc. v2020 Friday, 07 / 10 / 2020
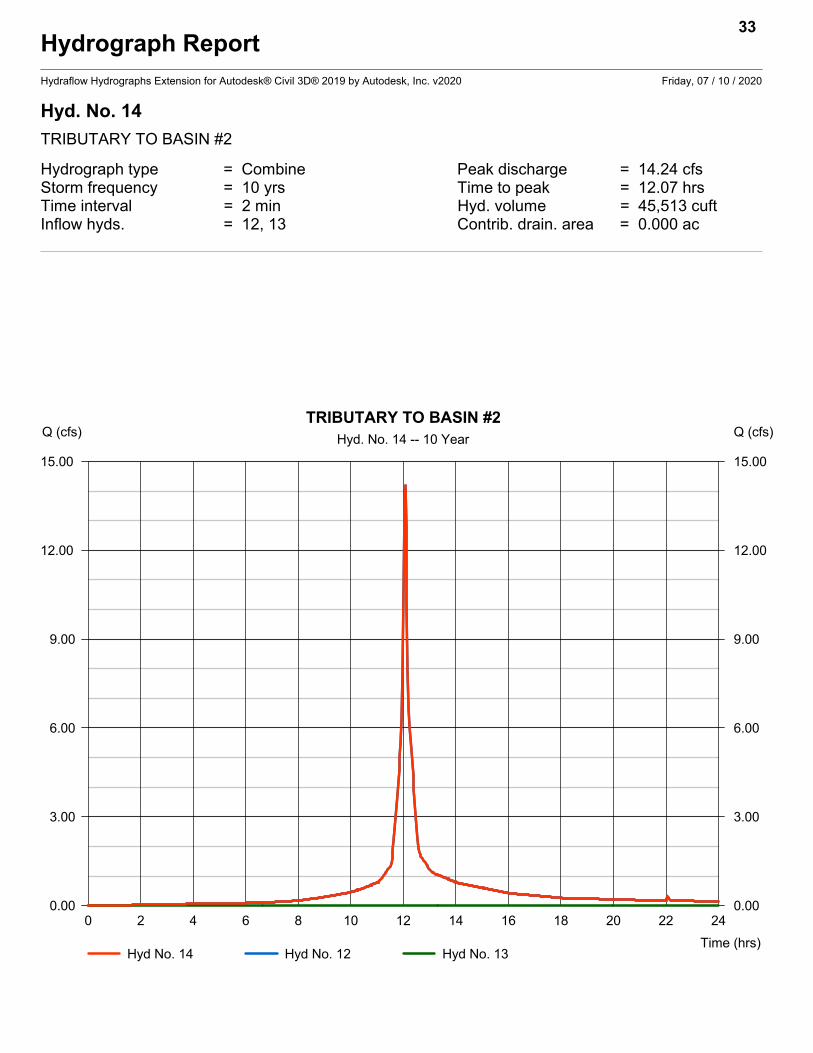
Hyd. No. 14
TRIBUTARY TO BASIN #2
Hydrograph type = Combine Peak discharge = 14.24 cfsStorm frequency = 10 yrs Time to peak = 12.07 hrsTime interval = 2 min Hyd. volume = 45,513 cuftInflow hyds. = 12, 13 Contrib. drain. area = 0.000 ac
33
0 2 4 6 8 10 12 14 16 18 20 22 24
Q (cfs)
0.00 0.00
3.00 3.00
6.00 6.00
9.00 9.00
12.00 12.00
15.00 15.00
Q (cfs)
Time (hrs)
TRIBUTARY TO BASIN #2Hyd. No. 14 -- 10 Year
Hyd No. 14 Hyd No. 12 Hyd No. 13
Hydrograph ReportHydraflow Hydrographs Extension for Autodesk® Civil 3D® 2019 by Autodesk, Inc. v2020 Friday, 07 / 10 / 2020
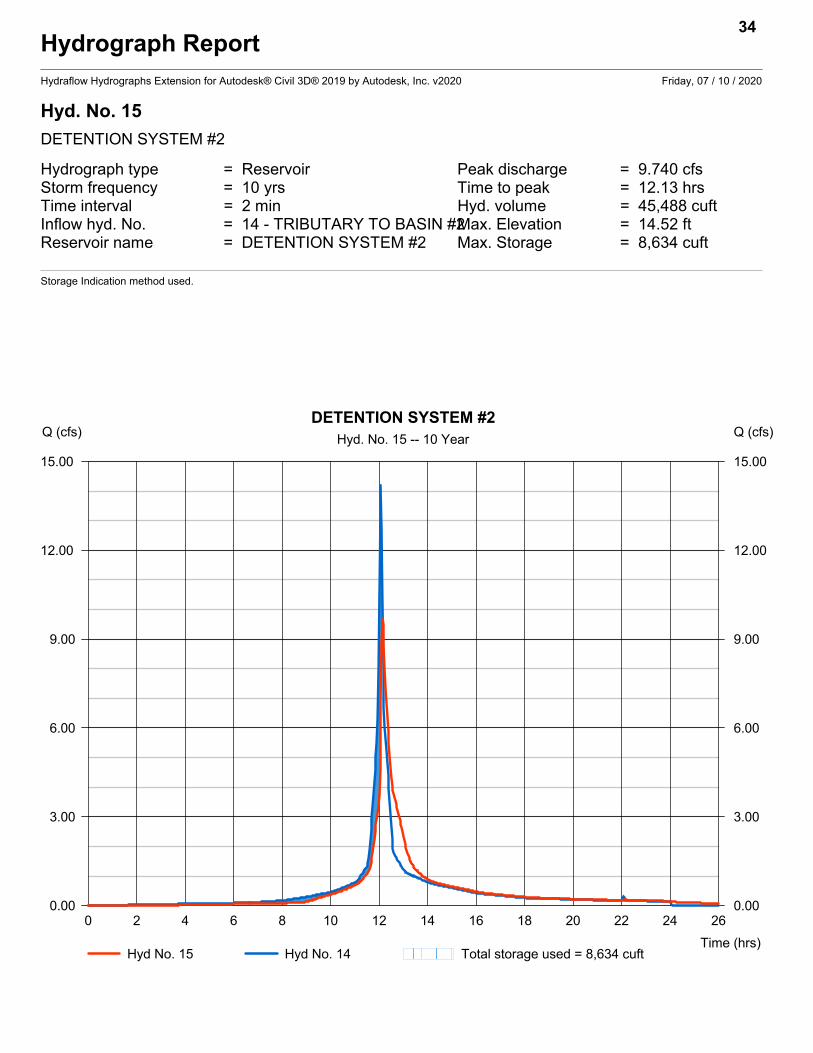
Hyd. No. 15
DETENTION SYSTEM #2
Hydrograph type = Reservoir Peak discharge = 9.740 cfsStorm frequency = 10 yrs Time to peak = 12.13 hrsTime interval = 2 min Hyd. volume = 45,488 cuftInflow hyd. No. = 14 - TRIBUTARY TO BASIN #2Max. Elevation = 14.52 ftReservoir name = DETENTION SYSTEM #2 Max. Storage = 8,634 cuft
Storage Indication method used.
34
0 2 4 6 8 10 12 14 16 18 20 22 24 26
Q (cfs)
0.00 0.00
3.00 3.00
6.00 6.00
9.00 9.00
12.00 12.00
15.00 15.00
Q (cfs)
Time (hrs)
DETENTION SYSTEM #2Hyd. No. 15 -- 10 Year
Hyd No. 15 Hyd No. 14 Total storage used = 8,634 cuft
Hydrograph ReportHydraflow Hydrographs Extension for Autodesk® Civil 3D® 2019 by Autodesk, Inc. v2020 Friday, 07 / 10 / 2020
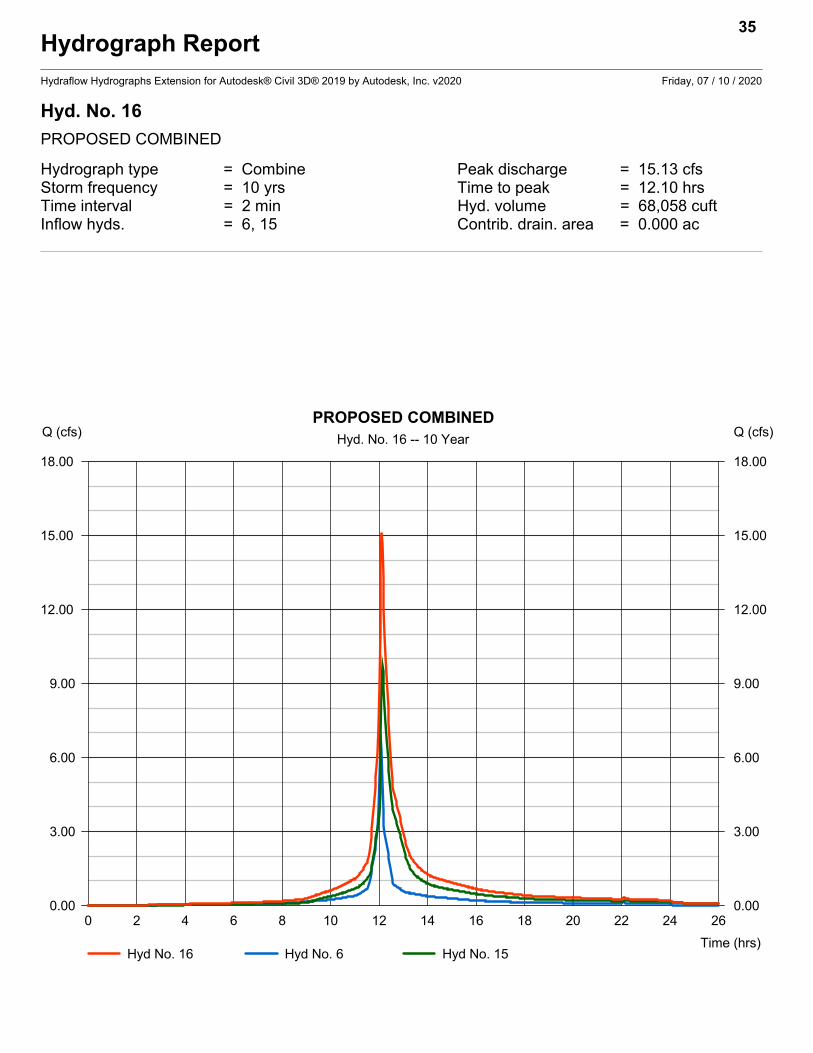
Hyd. No. 16
PROPOSED COMBINED
Hydrograph type = Combine Peak discharge = 15.13 cfsStorm frequency = 10 yrs Time to peak = 12.10 hrsTime interval = 2 min Hyd. volume = 68,058 cuftInflow hyds. = 6, 15 Contrib. drain. area = 0.000 ac
35
0 2 4 6 8 10 12 14 16 18 20 22 24 26
Q (cfs)
0.00 0.00
3.00 3.00
6.00 6.00
9.00 9.00
12.00 12.00
15.00 15.00
18.00 18.00
Q (cfs)
Time (hrs)
PROPOSED COMBINEDHyd. No. 16 -- 10 Year
Hyd No. 16 Hyd No. 6 Hyd No. 15
Hydrograph ReportHydraflow Hydrographs Extension for Autodesk® Civil 3D® 2019 by Autodesk, Inc. v2020 Friday, 07 / 10 / 2020
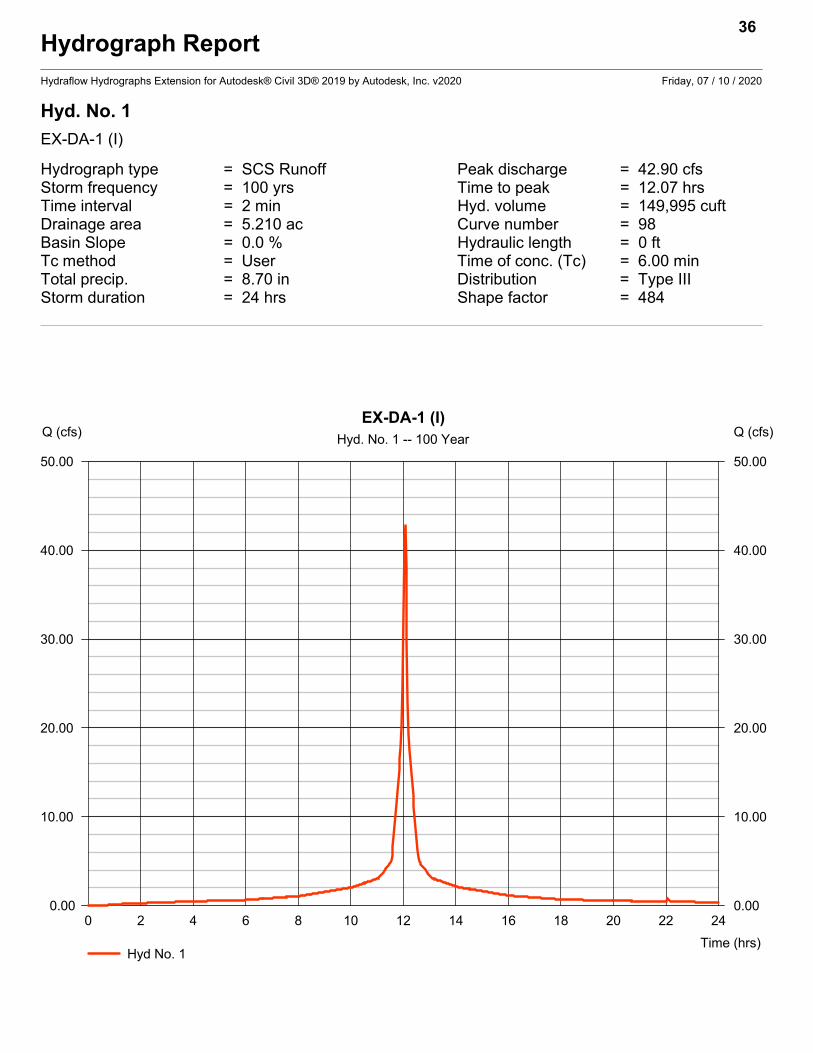
Hyd. No. 1
EX-DA-1 (I)
Hydrograph type = SCS Runoff Peak discharge = 42.90 cfsStorm frequency = 100 yrs Time to peak = 12.07 hrsTime interval = 2 min Hyd. volume = 149,995 cuftDrainage area = 5.210 ac Curve number = 98Basin Slope = 0.0 % Hydraulic length = 0 ftTc method = User Time of conc. (Tc) = 6.00 minTotal precip. = 8.70 in Distribution = Type IIIStorm duration = 24 hrs Shape factor = 484
36
0 2 4 6 8 10 12 14 16 18 20 22 24
Q (cfs)
0.00 0.00
10.00 10.00
20.00 20.00
30.00 30.00
40.00 40.00
50.00 50.00
Q (cfs)
Time (hrs)
EX-DA-1 (I)Hyd. No. 1 -- 100 Year
Hyd No. 1
Hydrograph ReportHydraflow Hydrographs Extension for Autodesk® Civil 3D® 2019 by Autodesk, Inc. v2020 Friday, 07 / 10 / 2020
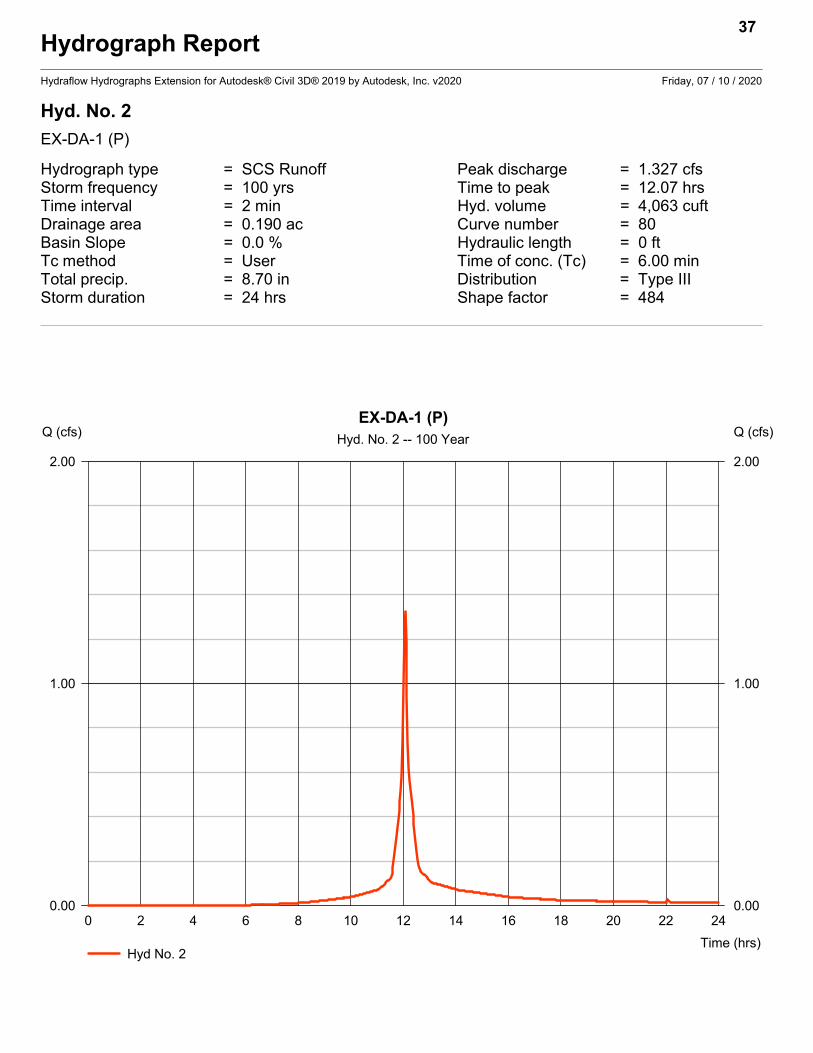
Hyd. No. 2
EX-DA-1 (P)
Hydrograph type = SCS Runoff Peak discharge = 1.327 cfsStorm frequency = 100 yrs Time to peak = 12.07 hrsTime interval = 2 min Hyd. volume = 4,063 cuftDrainage area = 0.190 ac Curve number = 80Basin Slope = 0.0 % Hydraulic length = 0 ftTc method = User Time of conc. (Tc) = 6.00 minTotal precip. = 8.70 in Distribution = Type IIIStorm duration = 24 hrs Shape factor = 484
37
0 2 4 6 8 10 12 14 16 18 20 22 24
Q (cfs)
0.00 0.00
1.00 1.00
2.00 2.00
Q (cfs)
Time (hrs)
EX-DA-1 (P)Hyd. No. 2 -- 100 Year
Hyd No. 2
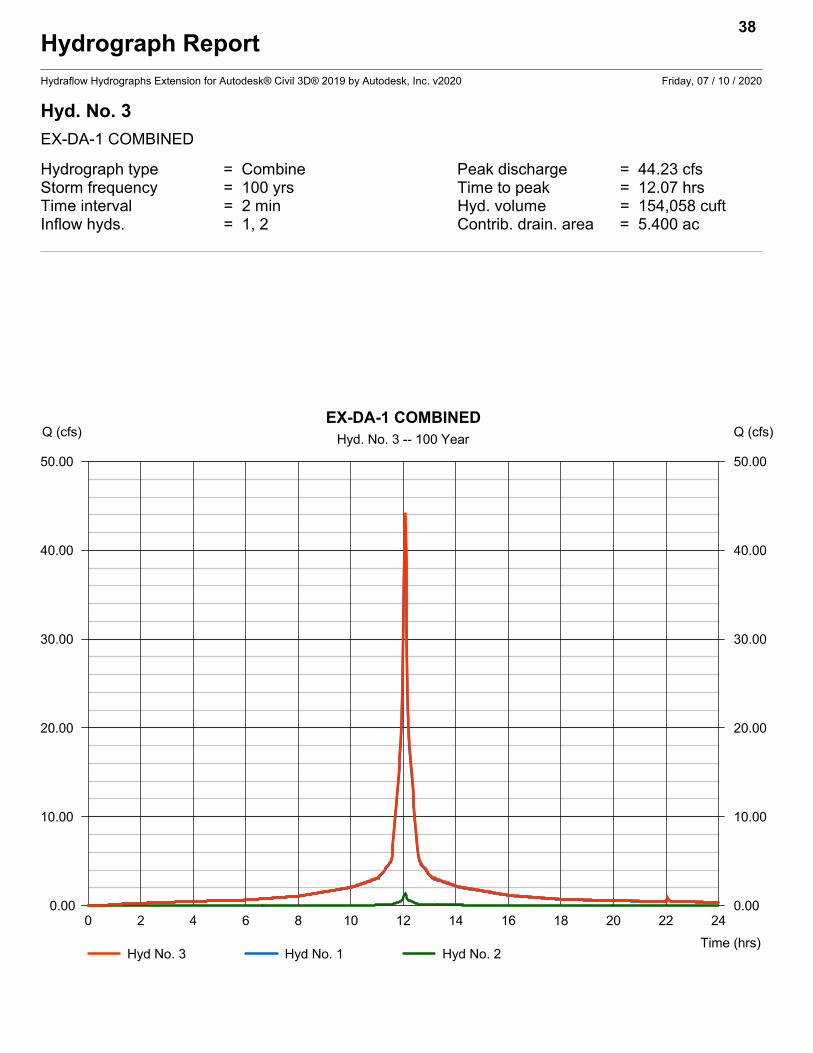
Hydrograph ReportHydraflow Hydrographs Extension for Autodesk® Civil 3D® 2019 by Autodesk, Inc. v2020 Friday, 07 / 10 / 2020
Hyd. No. 3
EX-DA-1 COMBINED
Hydrograph type = Combine Peak discharge = 44.23 cfsStorm frequency = 100 yrs Time to peak = 12.07 hrsTime interval = 2 min Hyd. volume = 154,058 cuftInflow hyds. = 1, 2 Contrib. drain. area = 5.400 ac
38
0 2 4 6 8 10 12 14 16 18 20 22 24
Q (cfs)
0.00 0.00
10.00 10.00
20.00 20.00
30.00 30.00
40.00 40.00
50.00 50.00
Q (cfs)
Time (hrs)
EX-DA-1 COMBINEDHyd. No. 3 -- 100 Year
Hyd No. 3 Hyd No. 1 Hyd No. 2
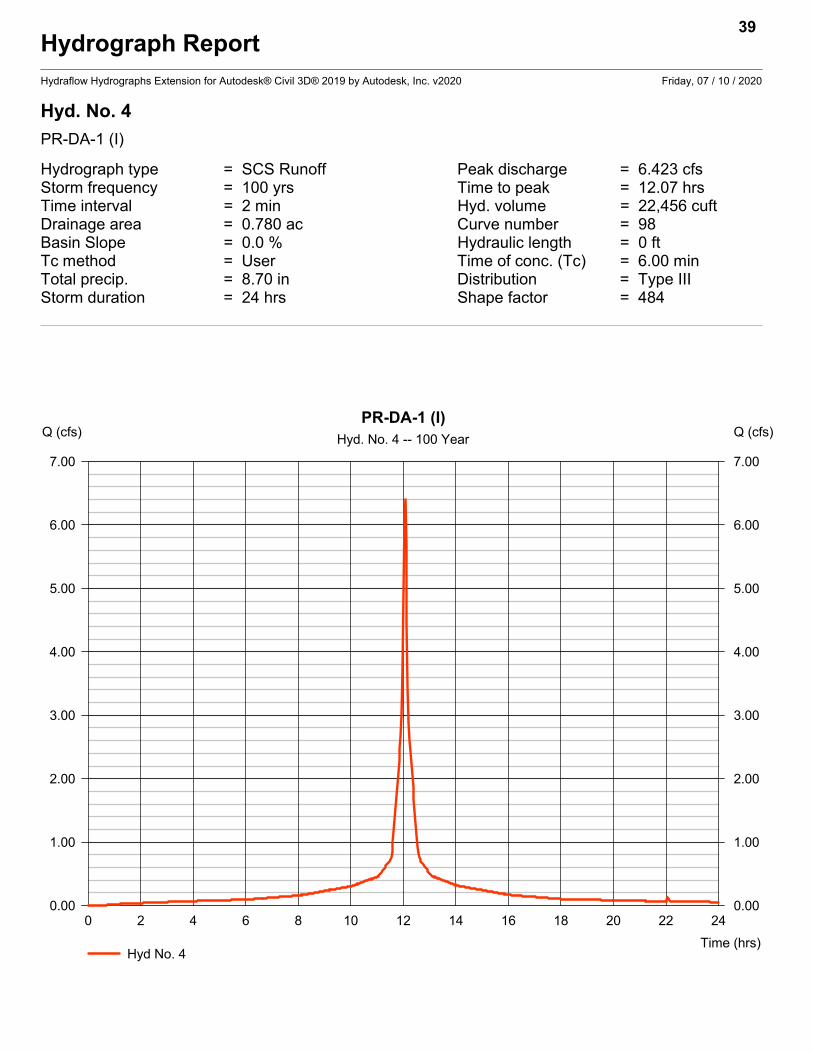
Hydrograph ReportHydraflow Hydrographs Extension for Autodesk® Civil 3D® 2019 by Autodesk, Inc. v2020 Friday, 07 / 10 / 2020
Hyd. No. 4
PR-DA-1 (I)
Hydrograph type = SCS Runoff Peak discharge = 6.423 cfsStorm frequency = 100 yrs Time to peak = 12.07 hrsTime interval = 2 min Hyd. volume = 22,456 cuftDrainage area = 0.780 ac Curve number = 98Basin Slope = 0.0 % Hydraulic length = 0 ftTc method = User Time of conc. (Tc) = 6.00 minTotal precip. = 8.70 in Distribution = Type IIIStorm duration = 24 hrs Shape factor = 484
39
0 2 4 6 8 10 12 14 16 18 20 22 24
Q (cfs)
0.00 0.00
1.00 1.00
2.00 2.00
3.00 3.00
4.00 4.00
5.00 5.00
6.00 6.00
7.00 7.00
Q (cfs)
Time (hrs)
PR-DA-1 (I)Hyd. No. 4 -- 100 Year
Hyd No. 4
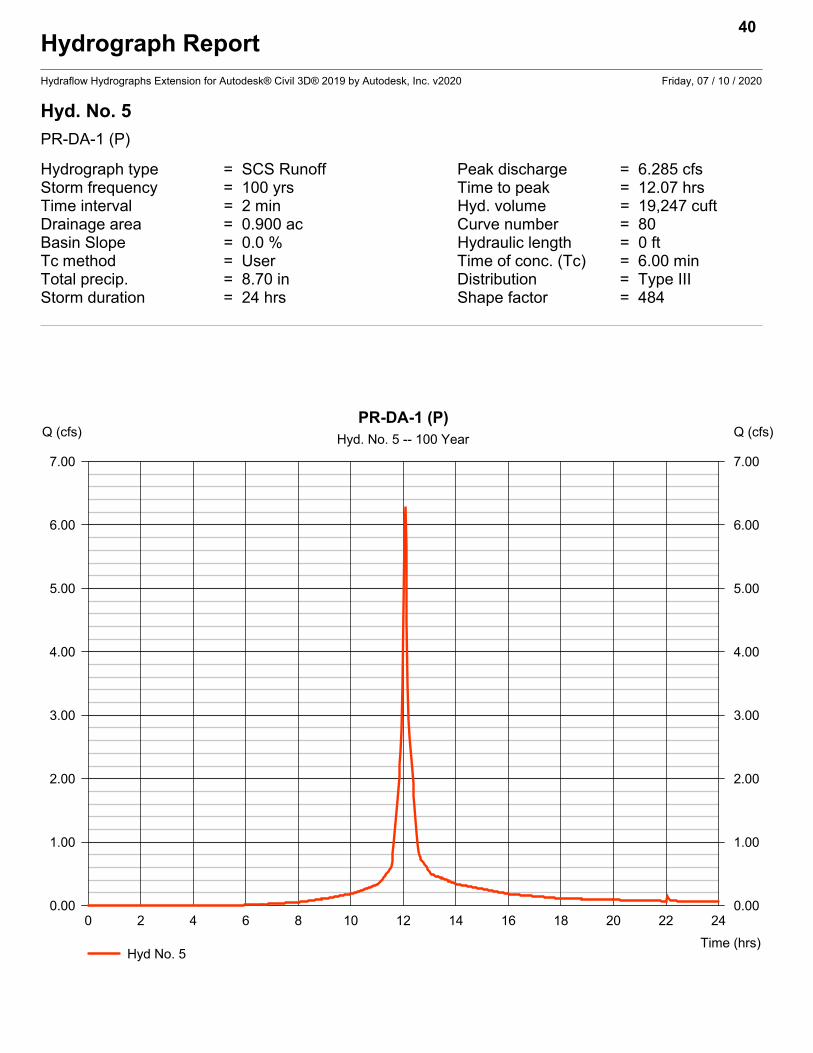
Hydrograph ReportHydraflow Hydrographs Extension for Autodesk® Civil 3D® 2019 by Autodesk, Inc. v2020 Friday, 07 / 10 / 2020
Hyd. No. 5
PR-DA-1 (P)
Hydrograph type = SCS Runoff Peak discharge = 6.285 cfsStorm frequency = 100 yrs Time to peak = 12.07 hrsTime interval = 2 min Hyd. volume = 19,247 cuftDrainage area = 0.900 ac Curve number = 80Basin Slope = 0.0 % Hydraulic length = 0 ftTc method = User Time of conc. (Tc) = 6.00 minTotal precip. = 8.70 in Distribution = Type IIIStorm duration = 24 hrs Shape factor = 484
40
0 2 4 6 8 10 12 14 16 18 20 22 24
Q (cfs)
0.00 0.00
1.00 1.00
2.00 2.00
3.00 3.00
4.00 4.00
5.00 5.00
6.00 6.00
7.00 7.00
Q (cfs)
Time (hrs)
PR-DA-1 (P)Hyd. No. 5 -- 100 Year
Hyd No. 5
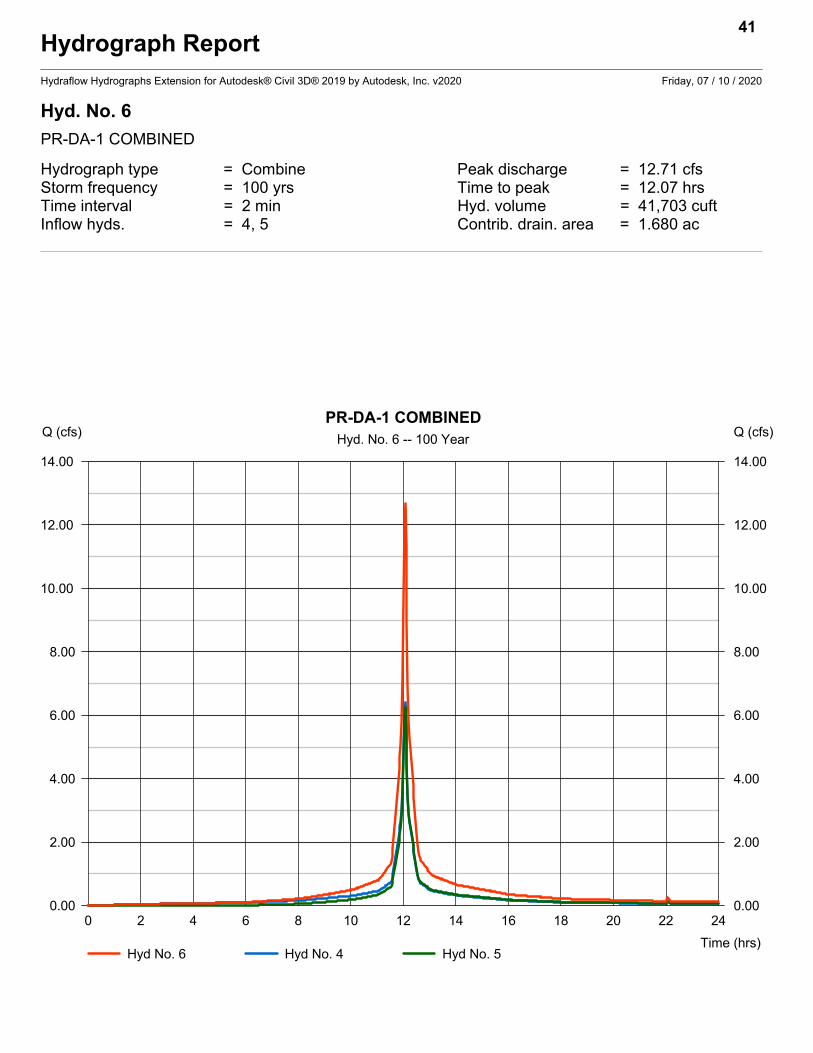
Hydrograph ReportHydraflow Hydrographs Extension for Autodesk® Civil 3D® 2019 by Autodesk, Inc. v2020 Friday, 07 / 10 / 2020
Hyd. No. 6
PR-DA-1 COMBINED
Hydrograph type = Combine Peak discharge = 12.71 cfsStorm frequency = 100 yrs Time to peak = 12.07 hrsTime interval = 2 min Hyd. volume = 41,703 cuftInflow hyds. = 4, 5 Contrib. drain. area = 1.680 ac
41
0 2 4 6 8 10 12 14 16 18 20 22 24
Q (cfs)
0.00 0.00
2.00 2.00
4.00 4.00
6.00 6.00
8.00 8.00
10.00 10.00
12.00 12.00
14.00 14.00
Q (cfs)
Time (hrs)
PR-DA-1 COMBINEDHyd. No. 6 -- 100 Year
Hyd No. 6 Hyd No. 4 Hyd No. 5
Hydrograph ReportHydraflow Hydrographs Extension for Autodesk® Civil 3D® 2019 by Autodesk, Inc. v2020 Friday, 07 / 10 / 2020
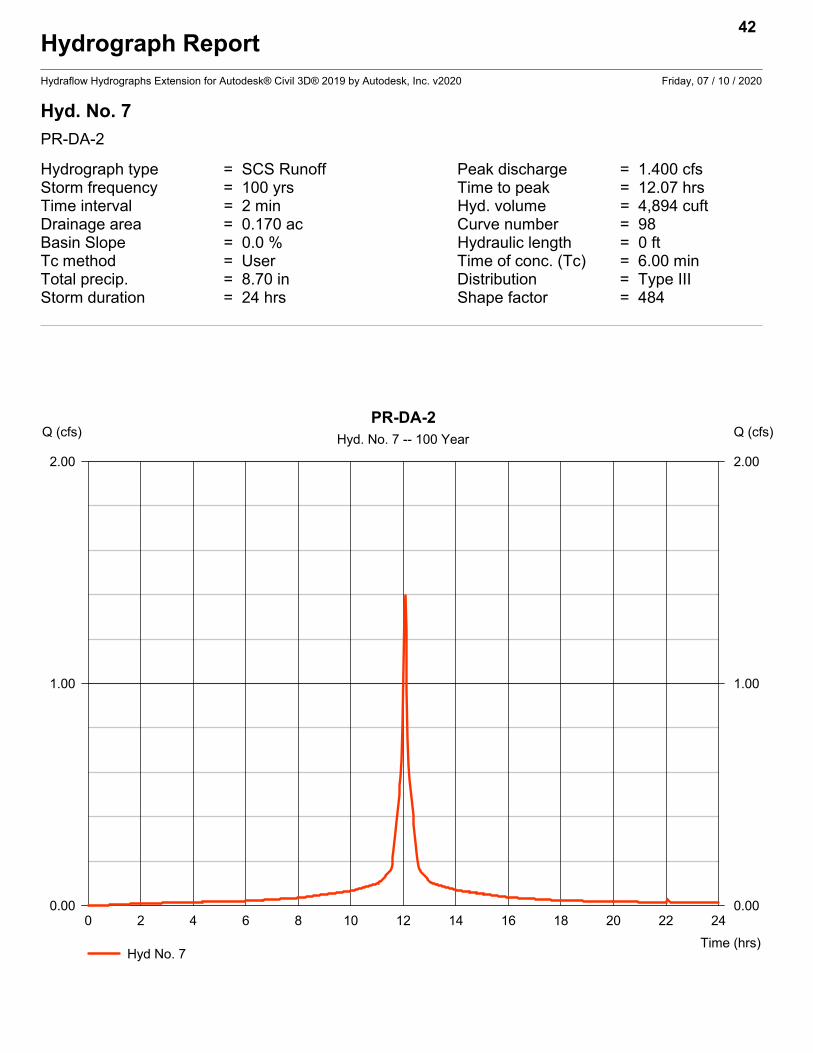
Hyd. No. 7
PR-DA-2
Hydrograph type = SCS Runoff Peak discharge = 1.400 cfsStorm frequency = 100 yrs Time to peak = 12.07 hrsTime interval = 2 min Hyd. volume = 4,894 cuftDrainage area = 0.170 ac Curve number = 98Basin Slope = 0.0 % Hydraulic length = 0 ftTc method = User Time of conc. (Tc) = 6.00 minTotal precip. = 8.70 in Distribution = Type IIIStorm duration = 24 hrs Shape factor = 484
42
0 2 4 6 8 10 12 14 16 18 20 22 24
Q (cfs)
0.00 0.00
1.00 1.00
2.00 2.00
Q (cfs)
Time (hrs)
PR-DA-2Hyd. No. 7 -- 100 Year
Hyd No. 7

Hydrograph ReportHydraflow Hydrographs Extension for Autodesk® Civil 3D® 2019 by Autodesk, Inc. v2020 Friday, 07 / 10 / 2020
Hyd. No. 8
PR-DA-3A
Hydrograph type = SCS Runoff Peak discharge = 5.682 cfsStorm frequency = 100 yrs Time to peak = 12.07 hrsTime interval = 2 min Hyd. volume = 19,865 cuftDrainage area = 0.690 ac Curve number = 98Basin Slope = 0.0 % Hydraulic length = 0 ftTc method = User Time of conc. (Tc) = 6.00 minTotal precip. = 8.70 in Distribution = Type IIIStorm duration = 24 hrs Shape factor = 484
43
0 2 4 6 8 10 12 14 16 18 20 22 24
Q (cfs)
0.00 0.00
1.00 1.00
2.00 2.00
3.00 3.00
4.00 4.00
5.00 5.00
6.00 6.00
Q (cfs)
Time (hrs)
PR-DA-3AHyd. No. 8 -- 100 Year
Hyd No. 8
Hydrograph ReportHydraflow Hydrographs Extension for Autodesk® Civil 3D® 2019 by Autodesk, Inc. v2020 Friday, 07 / 10 / 2020
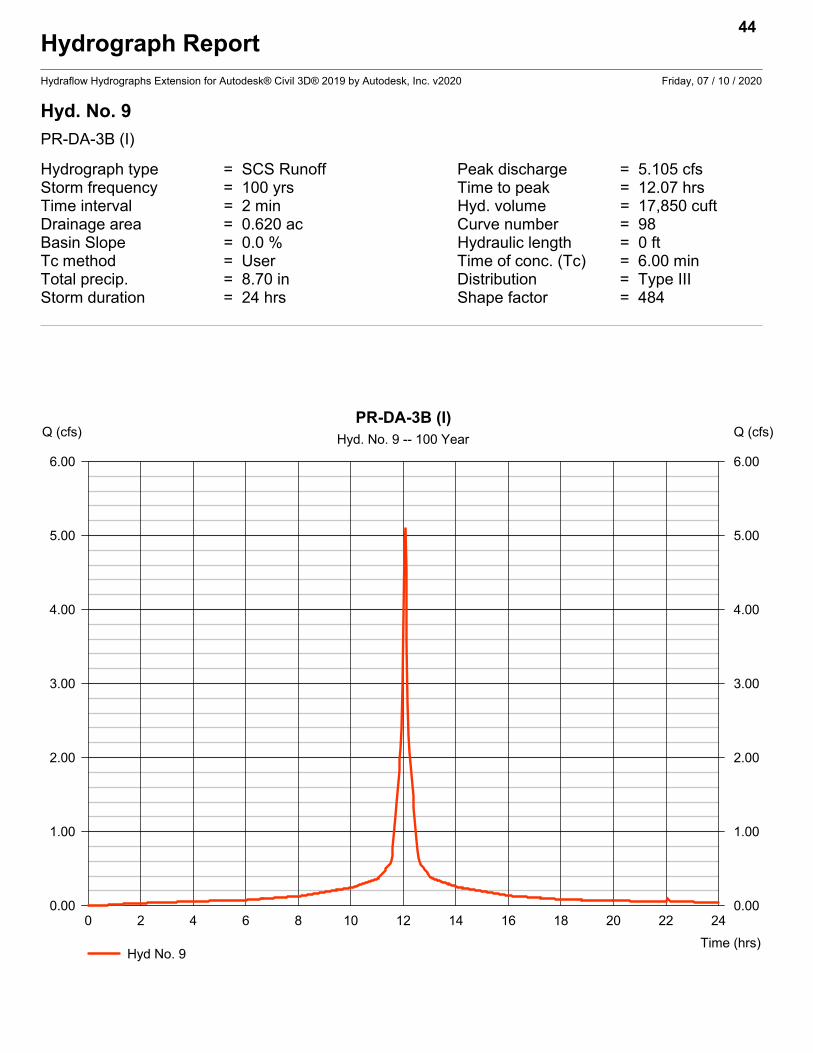
Hyd. No. 9
PR-DA-3B (I)
Hydrograph type = SCS Runoff Peak discharge = 5.105 cfsStorm frequency = 100 yrs Time to peak = 12.07 hrsTime interval = 2 min Hyd. volume = 17,850 cuftDrainage area = 0.620 ac Curve number = 98Basin Slope = 0.0 % Hydraulic length = 0 ftTc method = User Time of conc. (Tc) = 6.00 minTotal precip. = 8.70 in Distribution = Type IIIStorm duration = 24 hrs Shape factor = 484
44
0 2 4 6 8 10 12 14 16 18 20 22 24
Q (cfs)
0.00 0.00
1.00 1.00
2.00 2.00
3.00 3.00
4.00 4.00
5.00 5.00
6.00 6.00
Q (cfs)
Time (hrs)
PR-DA-3B (I)Hyd. No. 9 -- 100 Year
Hyd No. 9
Hydrograph ReportHydraflow Hydrographs Extension for Autodesk® Civil 3D® 2019 by Autodesk, Inc. v2020 Friday, 07 / 10 / 2020
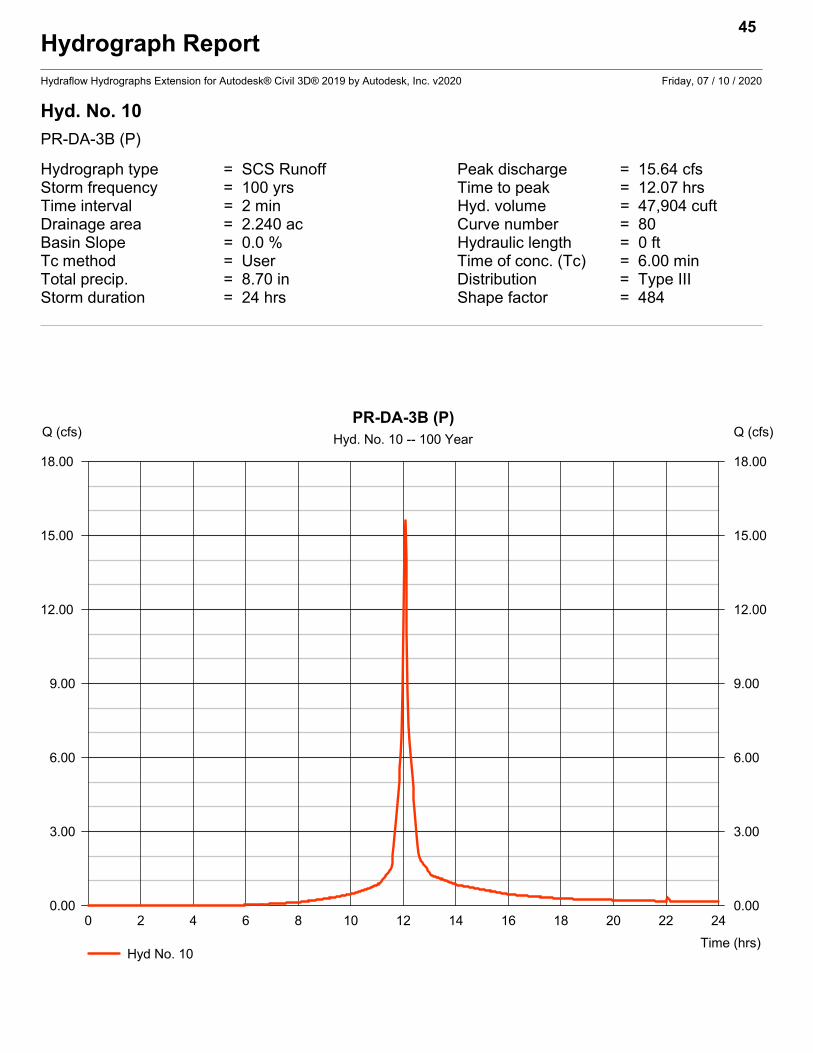
Hyd. No. 10
PR-DA-3B (P)
Hydrograph type = SCS Runoff Peak discharge = 15.64 cfsStorm frequency = 100 yrs Time to peak = 12.07 hrsTime interval = 2 min Hyd. volume = 47,904 cuftDrainage area = 2.240 ac Curve number = 80Basin Slope = 0.0 % Hydraulic length = 0 ftTc method = User Time of conc. (Tc) = 6.00 minTotal precip. = 8.70 in Distribution = Type IIIStorm duration = 24 hrs Shape factor = 484
45
0 2 4 6 8 10 12 14 16 18 20 22 24
Q (cfs)
0.00 0.00
3.00 3.00
6.00 6.00
9.00 9.00
12.00 12.00
15.00 15.00
18.00 18.00
Q (cfs)
Time (hrs)
PR-DA-3B (P)Hyd. No. 10 -- 100 Year
Hyd No. 10
Hydrograph ReportHydraflow Hydrographs Extension for Autodesk® Civil 3D® 2019 by Autodesk, Inc. v2020 Friday, 07 / 10 / 2020
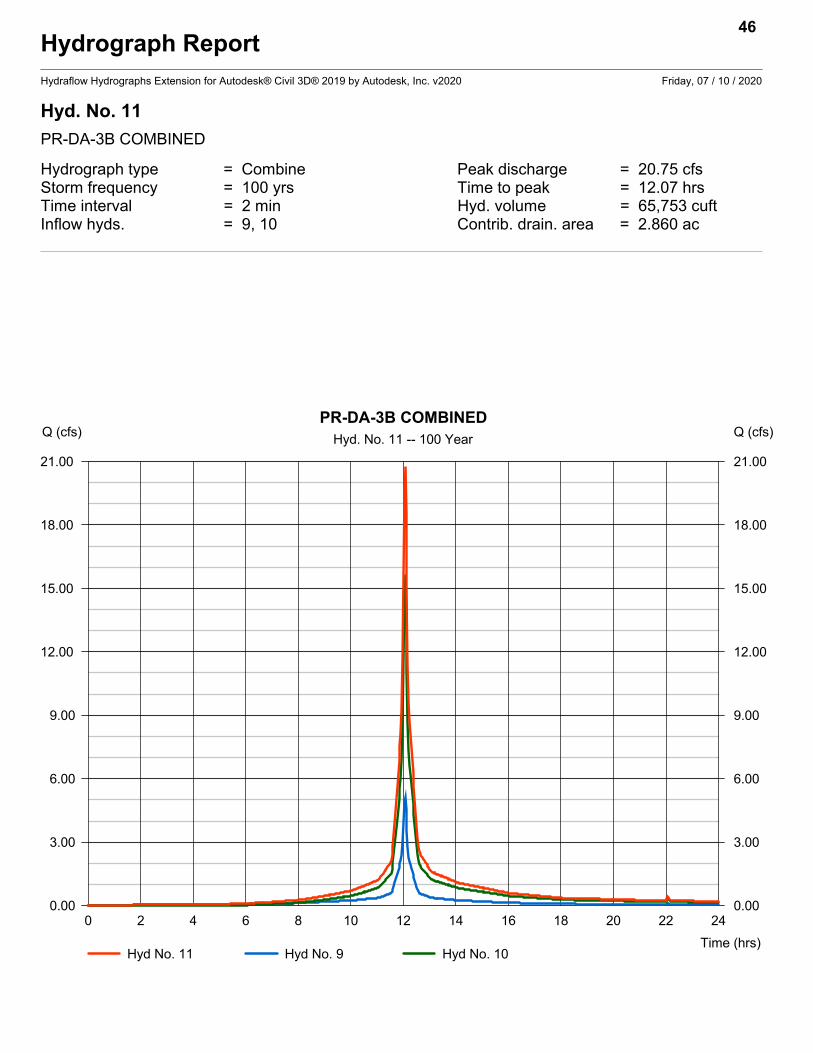
Hyd. No. 11
PR-DA-3B COMBINED
Hydrograph type = Combine Peak discharge = 20.75 cfsStorm frequency = 100 yrs Time to peak = 12.07 hrsTime interval = 2 min Hyd. volume = 65,753 cuftInflow hyds. = 9, 10 Contrib. drain. area = 2.860 ac
46
0 2 4 6 8 10 12 14 16 18 20 22 24
Q (cfs)
0.00 0.00
3.00 3.00
6.00 6.00
9.00 9.00
12.00 12.00
15.00 15.00
18.00 18.00
21.00 21.00
Q (cfs)
Time (hrs)
PR-DA-3B COMBINEDHyd. No. 11 -- 100 Year
Hyd No. 11 Hyd No. 9 Hyd No. 10
Hydrograph ReportHydraflow Hydrographs Extension for Autodesk® Civil 3D® 2019 by Autodesk, Inc. v2020 Friday, 07 / 10 / 2020
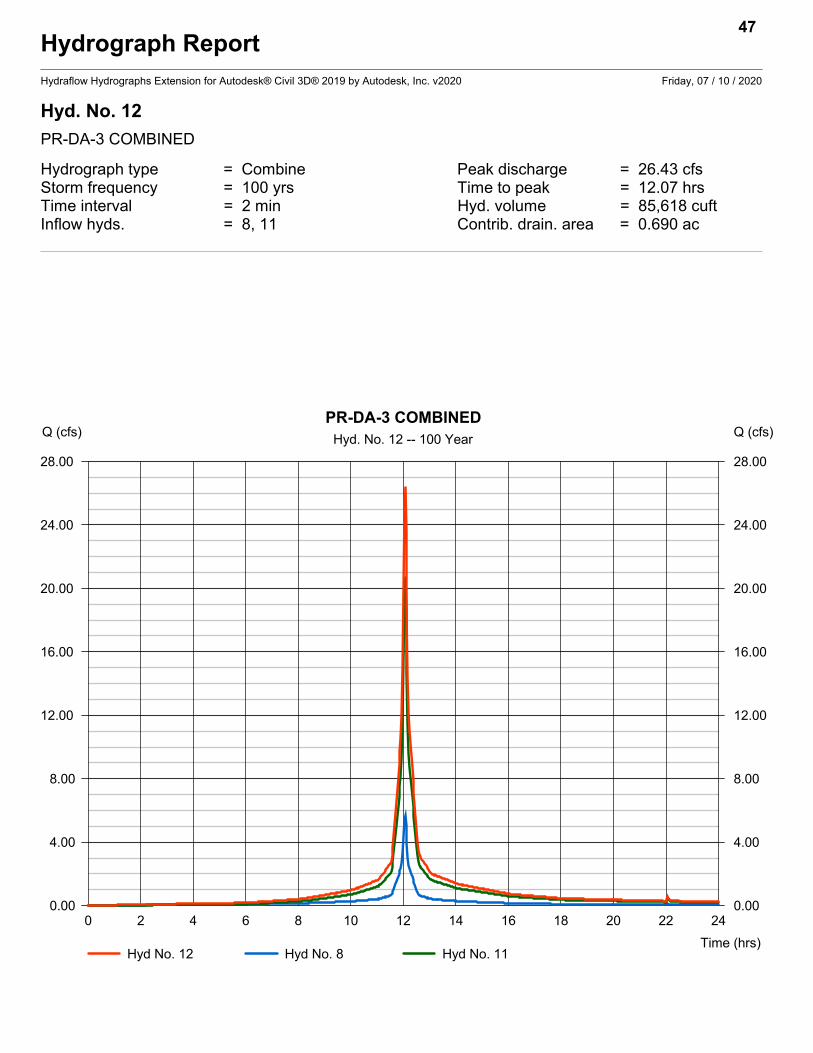
Hyd. No. 12
PR-DA-3 COMBINED
Hydrograph type = Combine Peak discharge = 26.43 cfsStorm frequency = 100 yrs Time to peak = 12.07 hrsTime interval = 2 min Hyd. volume = 85,618 cuftInflow hyds. = 8, 11 Contrib. drain. area = 0.690 ac
47
0 2 4 6 8 10 12 14 16 18 20 22 24
Q (cfs)
0.00 0.00
4.00 4.00
8.00 8.00
12.00 12.00
16.00 16.00
20.00 20.00
24.00 24.00
28.00 28.00
Q (cfs)
Time (hrs)
PR-DA-3 COMBINEDHyd. No. 12 -- 100 Year
Hyd No. 12 Hyd No. 8 Hyd No. 11
Hydrograph ReportHydraflow Hydrographs Extension for Autodesk® Civil 3D® 2019 by Autodesk, Inc. v2020 Friday, 07 / 10 / 2020
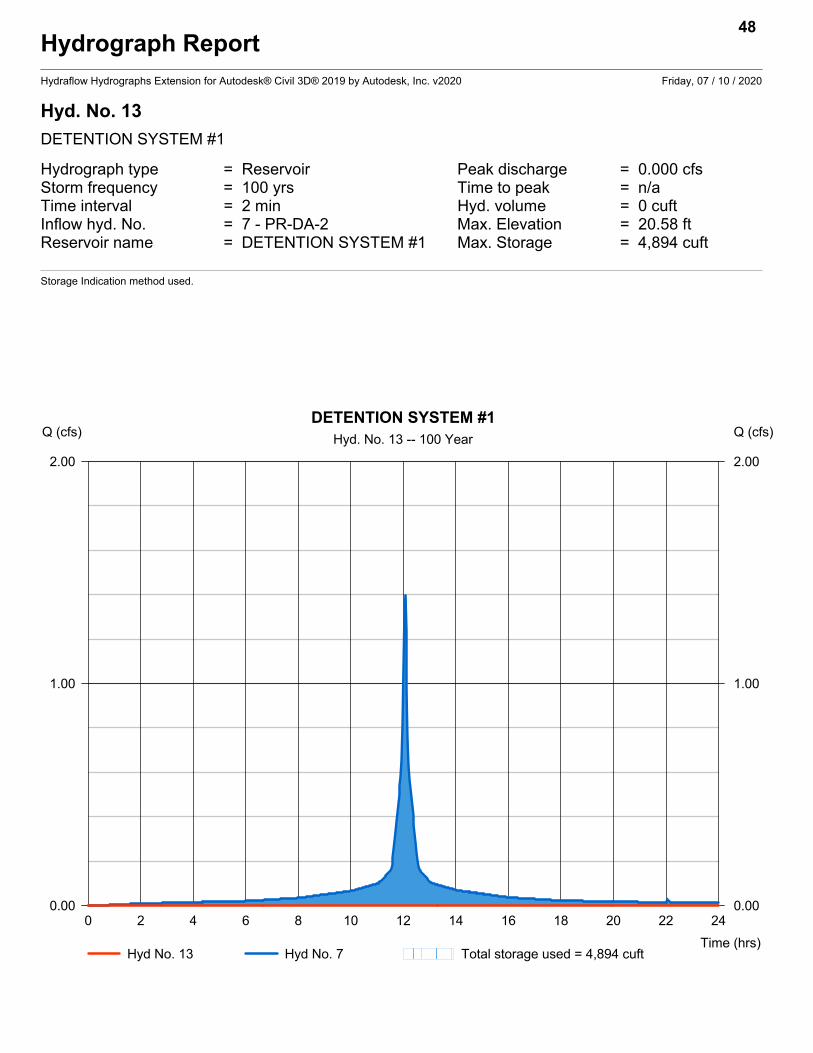
Hyd. No. 13
DETENTION SYSTEM #1
Hydrograph type = Reservoir Peak discharge = 0.000 cfsStorm frequency = 100 yrs Time to peak = n/aTime interval = 2 min Hyd. volume = 0 cuftInflow hyd. No. = 7 - PR-DA-2 Max. Elevation = 20.58 ftReservoir name = DETENTION SYSTEM #1 Max. Storage = 4,894 cuft
Storage Indication method used.
48
0 2 4 6 8 10 12 14 16 18 20 22 24
Q (cfs)
0.00 0.00
1.00 1.00
2.00 2.00
Q (cfs)
Time (hrs)
DETENTION SYSTEM #1Hyd. No. 13 -- 100 Year
Hyd No. 13 Hyd No. 7 Total storage used = 4,894 cuft

Hydrograph ReportHydraflow Hydrographs Extension for Autodesk® Civil 3D® 2019 by Autodesk, Inc. v2020 Friday, 07 / 10 / 2020
Hyd. No. 14
TRIBUTARY TO BASIN #2
Hydrograph type = Combine Peak discharge = 26.43 cfsStorm frequency = 100 yrs Time to peak = 12.07 hrsTime interval = 2 min Hyd. volume = 85,618 cuftInflow hyds. = 12, 13 Contrib. drain. area = 0.000 ac
49
0 2 4 6 8 10 12 14 16 18 20 22 24
Q (cfs)
0.00 0.00
4.00 4.00
8.00 8.00
12.00 12.00
16.00 16.00
20.00 20.00
24.00 24.00
28.00 28.00
Q (cfs)
Time (hrs)
TRIBUTARY TO BASIN #2Hyd. No. 14 -- 100 Year
Hyd No. 14 Hyd No. 12 Hyd No. 13
Hydrograph ReportHydraflow Hydrographs Extension for Autodesk® Civil 3D® 2019 by Autodesk, Inc. v2020 Friday, 07 / 10 / 2020
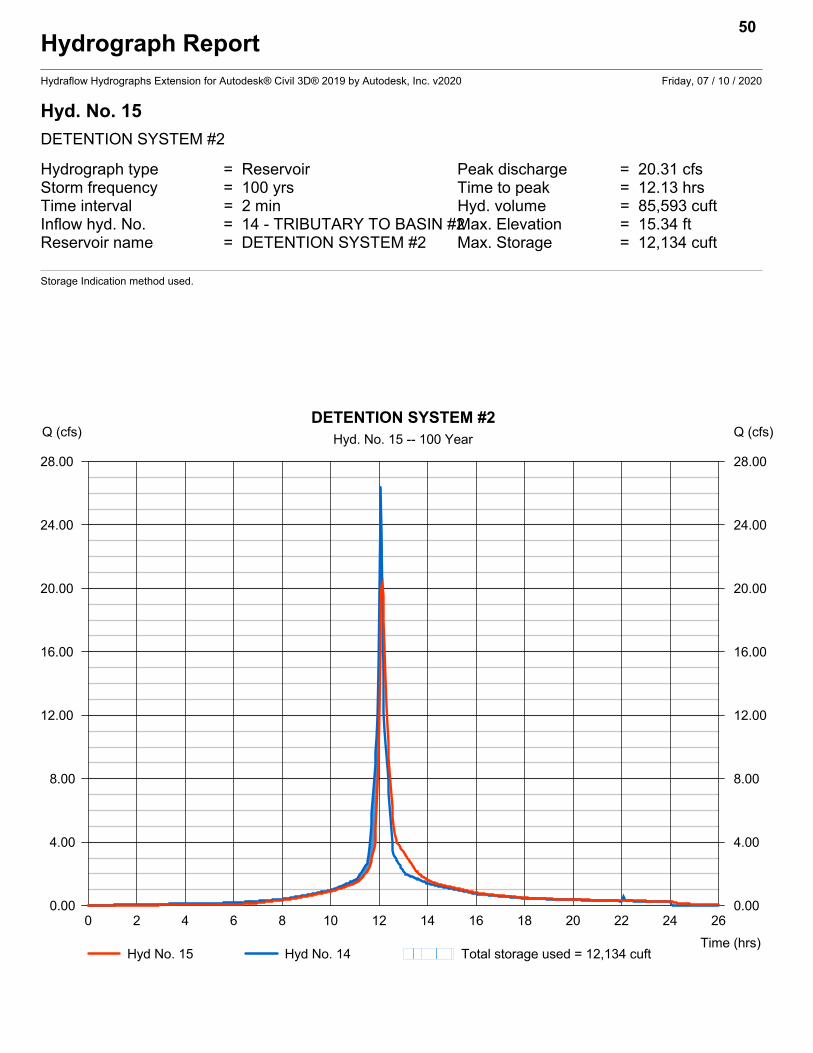
Hyd. No. 15
DETENTION SYSTEM #2
Hydrograph type = Reservoir Peak discharge = 20.31 cfsStorm frequency = 100 yrs Time to peak = 12.13 hrsTime interval = 2 min Hyd. volume = 85,593 cuftInflow hyd. No. = 14 - TRIBUTARY TO BASIN #2Max. Elevation = 15.34 ftReservoir name = DETENTION SYSTEM #2 Max. Storage = 12,134 cuft
Storage Indication method used.
50
0 2 4 6 8 10 12 14 16 18 20 22 24 26
Q (cfs)
0.00 0.00
4.00 4.00
8.00 8.00
12.00 12.00
16.00 16.00
20.00 20.00
24.00 24.00
28.00 28.00
Q (cfs)
Time (hrs)
DETENTION SYSTEM #2Hyd. No. 15 -- 100 Year
Hyd No. 15 Hyd No. 14 Total storage used = 12,134 cuft

Hydrograph ReportHydraflow Hydrographs Extension for Autodesk® Civil 3D® 2019 by Autodesk, Inc. v2020 Friday, 07 / 10 / 2020
Hyd. No. 16
PROPOSED COMBINED
Hydrograph type = Combine Peak discharge = 31.42 cfsStorm frequency = 100 yrs Time to peak = 12.10 hrsTime interval = 2 min Hyd. volume = 127,296 cuftInflow hyds. = 6, 15 Contrib. drain. area = 0.000 ac
51
0 2 4 6 8 10 12 14 16 18 20 22 24 26
Q (cfs)
0.00 0.00
5.00 5.00
10.00 10.00
15.00 15.00
20.00 20.00
25.00 25.00
30.00 30.00
35.00 35.00
Q (cfs)
Time (hrs)
PROPOSED COMBINEDHyd. No. 16 -- 100 Year
Hyd No. 16 Hyd No. 6 Hyd No. 15

Pond Reports
Pond Report 15
Hydraflow Hydrographs Extension for Autodesk® Civil 3D® 2019 by Autodesk, Inc. v2020 Friday, 07 / 10 / 2020
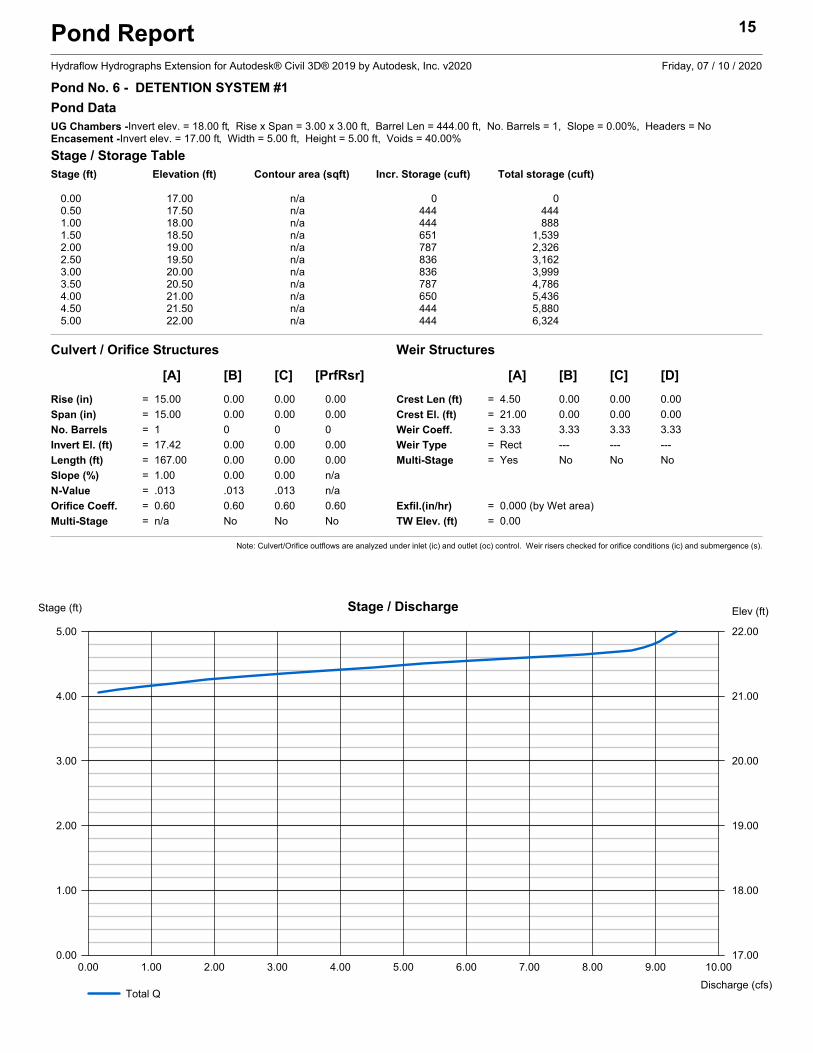
Pond No. 6 - DETENTION SYSTEM #1
Pond DataUG Chambers -Invert elev. = 18.00 ft, Rise x Span = 3.00 x 3.00 ft, Barrel Len = 444.00 ft, No. Barrels = 1, Slope = 0.00%, Headers = NoEncasement -Invert elev. = 17.00 ft, Width = 5.00 ft, Height = 5.00 ft, Voids = 40.00%
Stage / Storage TableStage (ft) Elevation (ft) Contour area (sqft) Incr. Storage (cuft) Total storage (cuft)
0.00 17.00 n/a 0 00.50 17.50 n/a 444 4441.00 18.00 n/a 444 8881.50 18.50 n/a 651 1,5392.00 19.00 n/a 787 2,3262.50 19.50 n/a 836 3,1623.00 20.00 n/a 836 3,9993.50 20.50 n/a 787 4,7864.00 21.00 n/a 650 5,4364.50 21.50 n/a 444 5,8805.00 22.00 n/a 444 6,324
Culvert / Orifice Structures Weir Structures
[A] [B] [C] [PrfRsr] [A] [B] [C] [D]
Rise (in) = 15.00 0.00 0.00 0.00
Span (in) = 15.00 0.00 0.00 0.00
No. Barrels = 1 0 0 0
Invert El. (ft) = 17.42 0.00 0.00 0.00
Length (ft) = 167.00 0.00 0.00 0.00
Slope (%) = 1.00 0.00 0.00 n/a
N-Value = .013 .013 .013 n/a
Orifice Coeff. = 0.60 0.60 0.60 0.60
Multi-Stage = n/a No No No
Crest Len (ft) = 4.50 0.00 0.00 0.00
Crest El. (ft) = 21.00 0.00 0.00 0.00
Weir Coeff. = 3.33 3.33 3.33 3.33
Weir Type = Rect --- --- ---
Multi-Stage = Yes No No No
Exfil.(in/hr) = 0.000 (by Wet area)
TW Elev. (ft) = 0.00
Note: Culvert/Orifice outflows are analyzed under inlet (ic) and outlet (oc) control. Weir risers checked for orifice conditions (ic) and submergence (s).
0.00 1.00 2.00 3.00 4.00 5.00 6.00 7.00 8.00 9.00 10.00
Stage (ft)
0.00 17.00
1.00 18.00
2.00 19.00
3.00 20.00
4.00 21.00
5.00 22.00
Elev (ft)
Discharge (cfs)
Stage / Discharge
Total Q
Pond Report 18
Hydraflow Hydrographs Extension for Autodesk® Civil 3D® 2019 by Autodesk, Inc. v2020 Friday, 07 / 10 / 2020
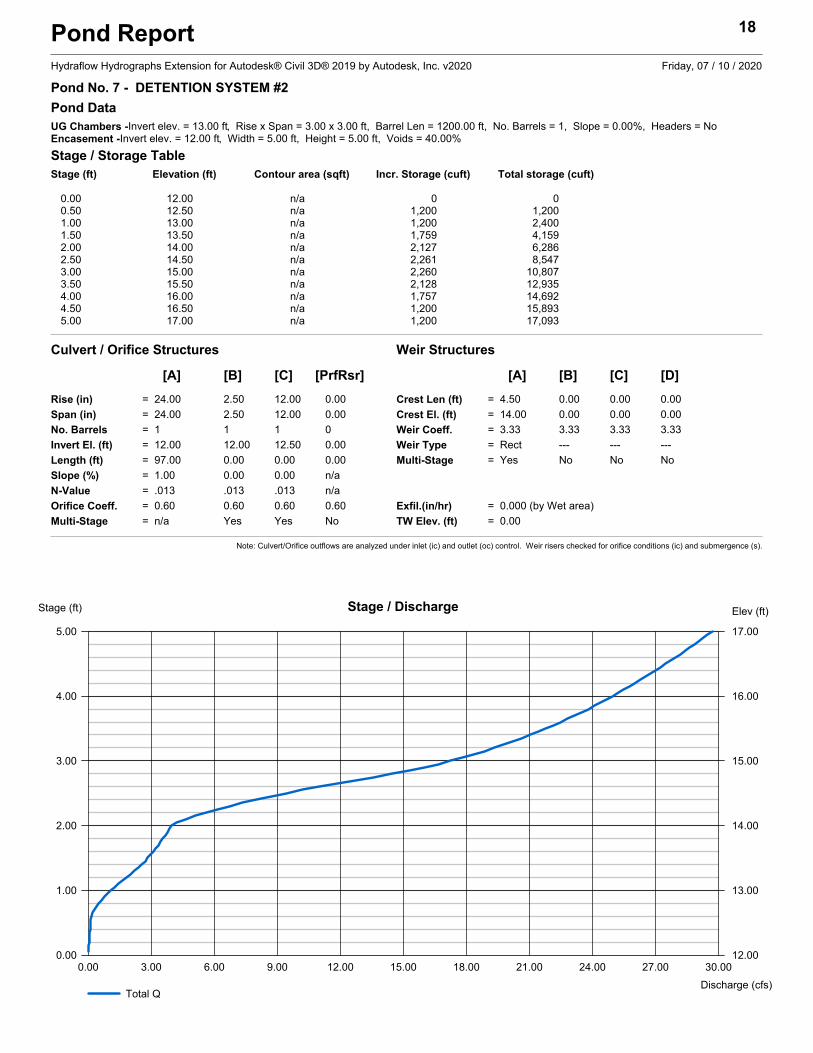
Pond No. 7 - DETENTION SYSTEM #2
Pond DataUG Chambers -Invert elev. = 13.00 ft, Rise x Span = 3.00 x 3.00 ft, Barrel Len = 1200.00 ft, No. Barrels = 1, Slope = 0.00%, Headers = NoEncasement -Invert elev. = 12.00 ft, Width = 5.00 ft, Height = 5.00 ft, Voids = 40.00%
Stage / Storage TableStage (ft) Elevation (ft) Contour area (sqft) Incr. Storage (cuft) Total storage (cuft)
0.00 12.00 n/a 0 00.50 12.50 n/a 1,200 1,2001.00 13.00 n/a 1,200 2,4001.50 13.50 n/a 1,759 4,1592.00 14.00 n/a 2,127 6,2862.50 14.50 n/a 2,261 8,5473.00 15.00 n/a 2,260 10,8073.50 15.50 n/a 2,128 12,9354.00 16.00 n/a 1,757 14,6924.50 16.50 n/a 1,200 15,8935.00 17.00 n/a 1,200 17,093
Culvert / Orifice Structures Weir Structures
[A] [B] [C] [PrfRsr] [A] [B] [C] [D]
Rise (in) = 24.00 2.50 12.00 0.00
Span (in) = 24.00 2.50 12.00 0.00
No. Barrels = 1 1 1 0
Invert El. (ft) = 12.00 12.00 12.50 0.00
Length (ft) = 97.00 0.00 0.00 0.00
Slope (%) = 1.00 0.00 0.00 n/a
N-Value = .013 .013 .013 n/a
Orifice Coeff. = 0.60 0.60 0.60 0.60
Multi-Stage = n/a Yes Yes No
Crest Len (ft) = 4.50 0.00 0.00 0.00
Crest El. (ft) = 14.00 0.00 0.00 0.00
Weir Coeff. = 3.33 3.33 3.33 3.33
Weir Type = Rect --- --- ---
Multi-Stage = Yes No No No
Exfil.(in/hr) = 0.000 (by Wet area)
TW Elev. (ft) = 0.00
Note: Culvert/Orifice outflows are analyzed under inlet (ic) and outlet (oc) control. Weir risers checked for orifice conditions (ic) and submergence (s).
0.00 3.00 6.00 9.00 12.00 15.00 18.00 21.00 24.00 27.00 30.00
Stage (ft)
0.00 12.00
1.00 13.00
2.00 14.00
3.00 15.00
4.00 16.00
5.00 17.00
Elev (ft)
Discharge (cfs)
Stage / Discharge
Total Q

Emergency Spillway Analysis
1 2 3 4
5
6
7
8
9
1
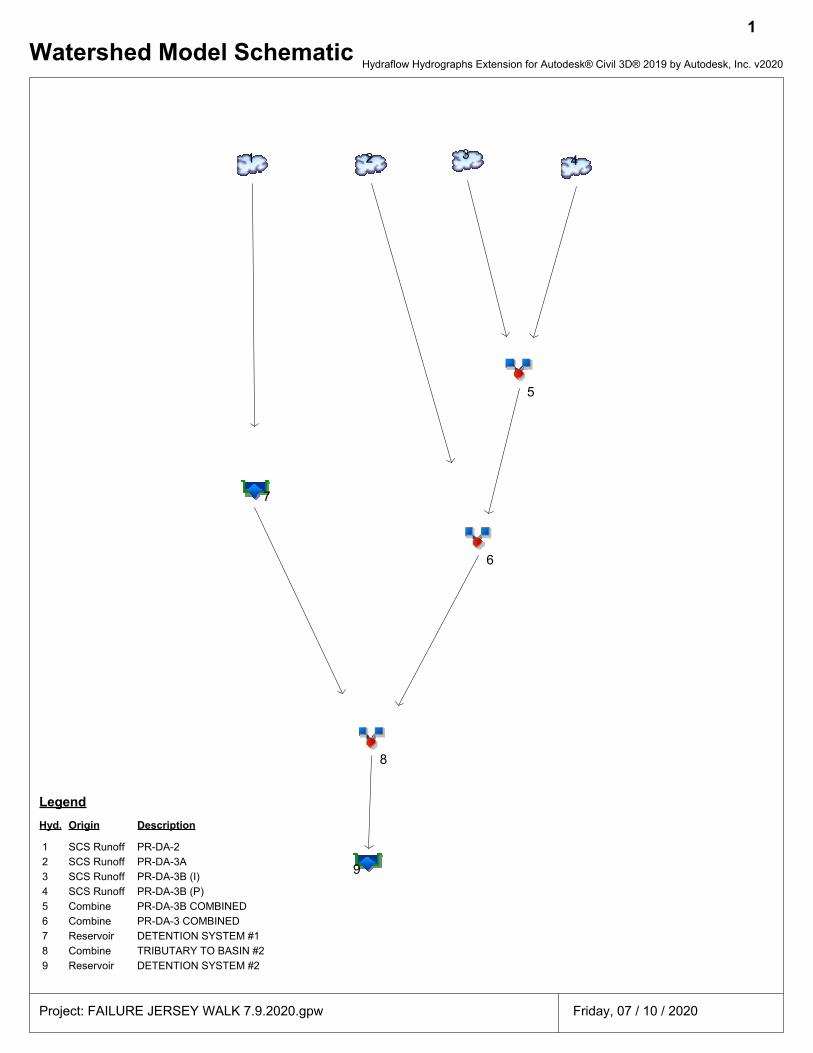
Watershed Model SchematicHydraflow Hydrographs Extension for Autodesk® Civil 3D® 2019 by Autodesk, Inc. v2020
Project: FAILURE JERSEY WALK 7.9.2020.gpw Friday, 07 / 10 / 2020
Hyd. Origin Description
Legend
1 SCS Runoff PR-DA-2
2 SCS Runoff PR-DA-3A
3 SCS Runoff PR-DA-3B (I)
4 SCS Runoff PR-DA-3B (P)
5 Combine PR-DA-3B COMBINED
6 Combine PR-DA-3 COMBINED
7 Reservoir DETENTION SYSTEM #1
8 Combine TRIBUTARY TO BASIN #2
9 Reservoir DETENTION SYSTEM #2

Hydrograph ReportHydraflow Hydrographs Extension for Autodesk® Civil 3D® 2019 by Autodesk, Inc. v2020 Friday, 07 / 10 / 2020
Hyd. No. 1
PR-DA-2
Hydrograph type = SCS Runoff Peak discharge = 0.542 cfsStorm frequency = 2 yrs Time to peak = 12.07 hrsTime interval = 2 min Hyd. volume = 1,832 cuftDrainage area = 0.170 ac Curve number = 98Basin Slope = 0.0 % Hydraulic length = 0 ftTc method = User Time of conc. (Tc) = 6.00 minTotal precip. = 3.40 in Distribution = Type IIIStorm duration = 24 hrs Shape factor = 484
2
0 2 4 6 8 10 12 14 16 18 20 22 24
Q (cfs)
0.00 0.00
0.10 0.10
0.20 0.20
0.30 0.30
0.40 0.40
0.50 0.50
0.60 0.60
0.70 0.70
0.80 0.80
0.90 0.90
1.00 1.00
Q (cfs)
Time (hrs)
PR-DA-2Hyd. No. 1 -- 2 Year
Hyd No. 1

Hydrograph ReportHydraflow Hydrographs Extension for Autodesk® Civil 3D® 2019 by Autodesk, Inc. v2020 Friday, 07 / 10 / 2020
Hyd. No. 2
PR-DA-3A
Hydrograph type = SCS Runoff Peak discharge = 2.199 cfsStorm frequency = 2 yrs Time to peak = 12.07 hrsTime interval = 2 min Hyd. volume = 7,436 cuftDrainage area = 0.690 ac Curve number = 98Basin Slope = 0.0 % Hydraulic length = 0 ftTc method = User Time of conc. (Tc) = 6.00 minTotal precip. = 3.40 in Distribution = Type IIIStorm duration = 24 hrs Shape factor = 484
3
0 2 4 6 8 10 12 14 16 18 20 22 24
Q (cfs)
0.00 0.00
1.00 1.00
2.00 2.00
3.00 3.00
Q (cfs)
Time (hrs)
PR-DA-3AHyd. No. 2 -- 2 Year
Hyd No. 2

Hydrograph ReportHydraflow Hydrographs Extension for Autodesk® Civil 3D® 2019 by Autodesk, Inc. v2020 Friday, 07 / 10 / 2020
Hyd. No. 3
PR-DA-3B (I)
Hydrograph type = SCS Runoff Peak discharge = 1.975 cfsStorm frequency = 2 yrs Time to peak = 12.07 hrsTime interval = 2 min Hyd. volume = 6,682 cuftDrainage area = 0.620 ac Curve number = 98Basin Slope = 0.0 % Hydraulic length = 0 ftTc method = User Time of conc. (Tc) = 6.00 minTotal precip. = 3.40 in Distribution = Type IIIStorm duration = 24 hrs Shape factor = 484
4
0 2 4 6 8 10 12 14 16 18 20 22 24
Q (cfs)
0.00 0.00
1.00 1.00
2.00 2.00
Q (cfs)
Time (hrs)
PR-DA-3B (I)Hyd. No. 3 -- 2 Year
Hyd No. 3
Hydrograph ReportHydraflow Hydrographs Extension for Autodesk® Civil 3D® 2019 by Autodesk, Inc. v2020 Friday, 07 / 10 / 2020
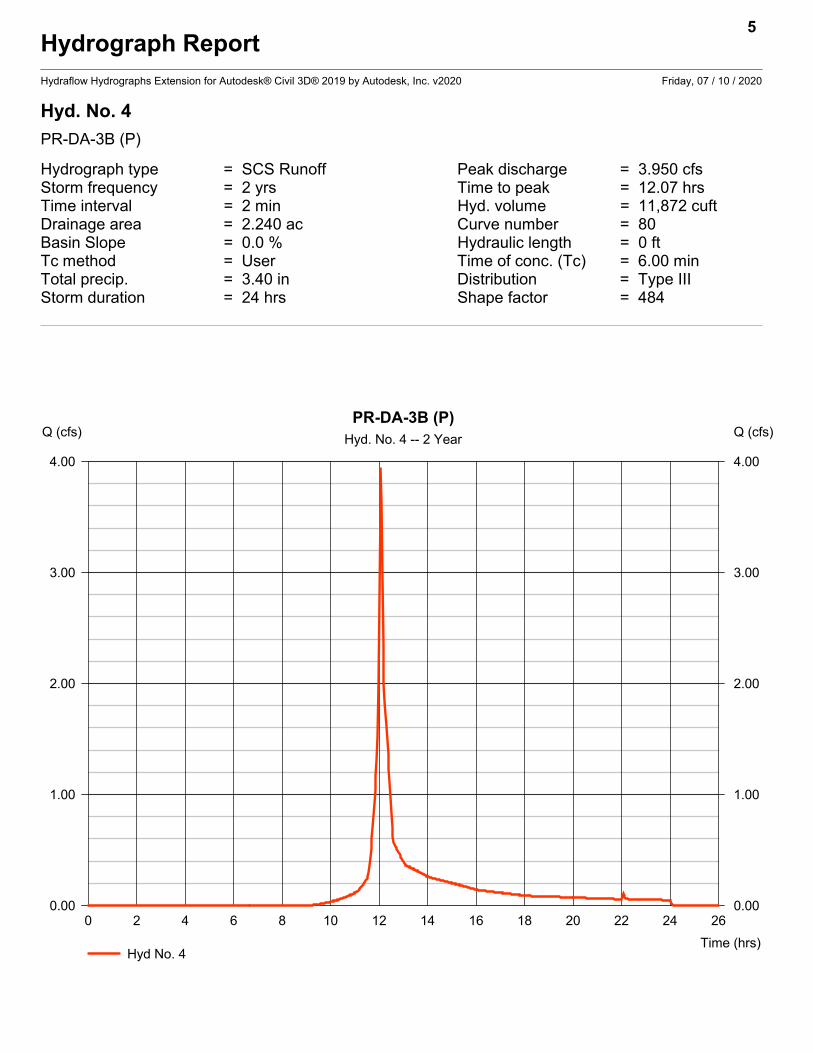
Hyd. No. 4
PR-DA-3B (P)
Hydrograph type = SCS Runoff Peak discharge = 3.950 cfsStorm frequency = 2 yrs Time to peak = 12.07 hrsTime interval = 2 min Hyd. volume = 11,872 cuftDrainage area = 2.240 ac Curve number = 80Basin Slope = 0.0 % Hydraulic length = 0 ftTc method = User Time of conc. (Tc) = 6.00 minTotal precip. = 3.40 in Distribution = Type IIIStorm duration = 24 hrs Shape factor = 484
5
0 2 4 6 8 10 12 14 16 18 20 22 24 26
Q (cfs)
0.00 0.00
1.00 1.00
2.00 2.00
3.00 3.00
4.00 4.00
Q (cfs)
Time (hrs)
PR-DA-3B (P)Hyd. No. 4 -- 2 Year
Hyd No. 4
Hydrograph ReportHydraflow Hydrographs Extension for Autodesk® Civil 3D® 2019 by Autodesk, Inc. v2020 Friday, 07 / 10 / 2020
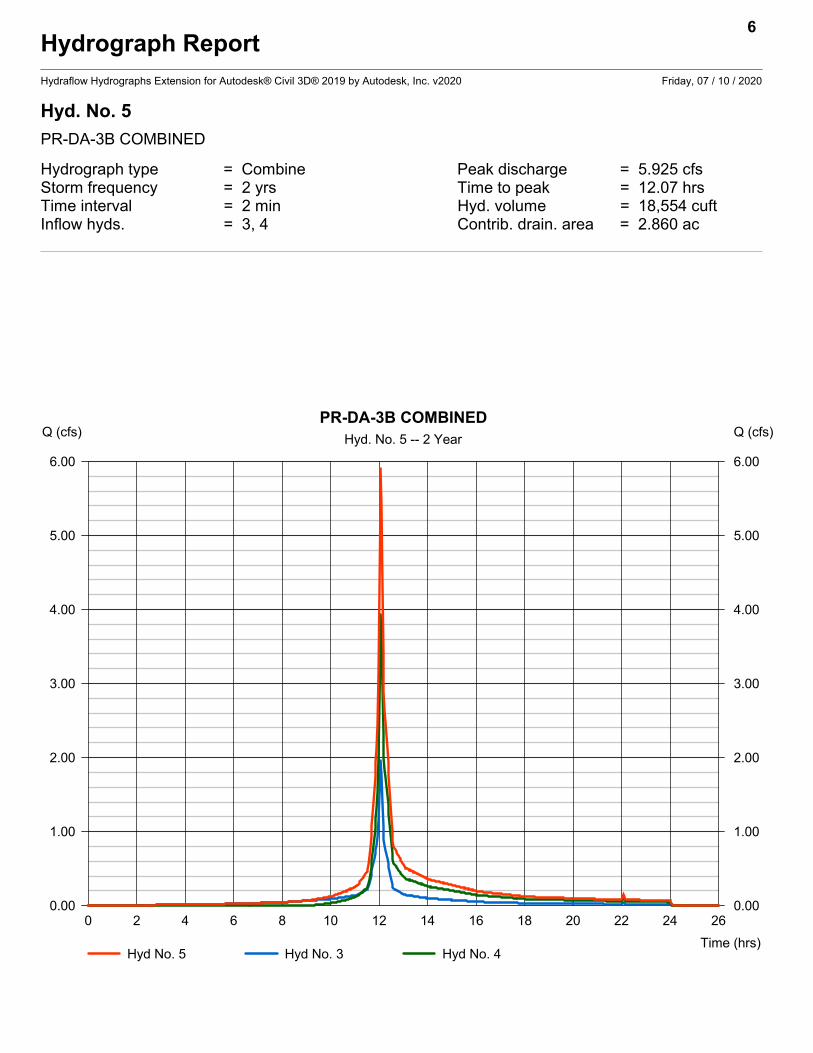
Hyd. No. 5
PR-DA-3B COMBINED
Hydrograph type = Combine Peak discharge = 5.925 cfsStorm frequency = 2 yrs Time to peak = 12.07 hrsTime interval = 2 min Hyd. volume = 18,554 cuftInflow hyds. = 3, 4 Contrib. drain. area = 2.860 ac
6
0 2 4 6 8 10 12 14 16 18 20 22 24 26
Q (cfs)
0.00 0.00
1.00 1.00
2.00 2.00
3.00 3.00
4.00 4.00
5.00 5.00
6.00 6.00
Q (cfs)
Time (hrs)
PR-DA-3B COMBINEDHyd. No. 5 -- 2 Year
Hyd No. 5 Hyd No. 3 Hyd No. 4

Hydrograph ReportHydraflow Hydrographs Extension for Autodesk® Civil 3D® 2019 by Autodesk, Inc. v2020 Friday, 07 / 10 / 2020
Hyd. No. 6
PR-DA-3 COMBINED
Hydrograph type = Combine Peak discharge = 8.124 cfsStorm frequency = 2 yrs Time to peak = 12.07 hrsTime interval = 2 min Hyd. volume = 25,990 cuftInflow hyds. = 2, 5 Contrib. drain. area = 0.690 ac
7
0 2 4 6 8 10 12 14 16 18 20 22 24 26
Q (cfs)
0.00 0.00
2.00 2.00
4.00 4.00
6.00 6.00
8.00 8.00
10.00 10.00
Q (cfs)
Time (hrs)
PR-DA-3 COMBINEDHyd. No. 6 -- 2 Year
Hyd No. 6 Hyd No. 2 Hyd No. 5
Hydrograph ReportHydraflow Hydrographs Extension for Autodesk® Civil 3D® 2019 by Autodesk, Inc. v2020 Friday, 07 / 10 / 2020
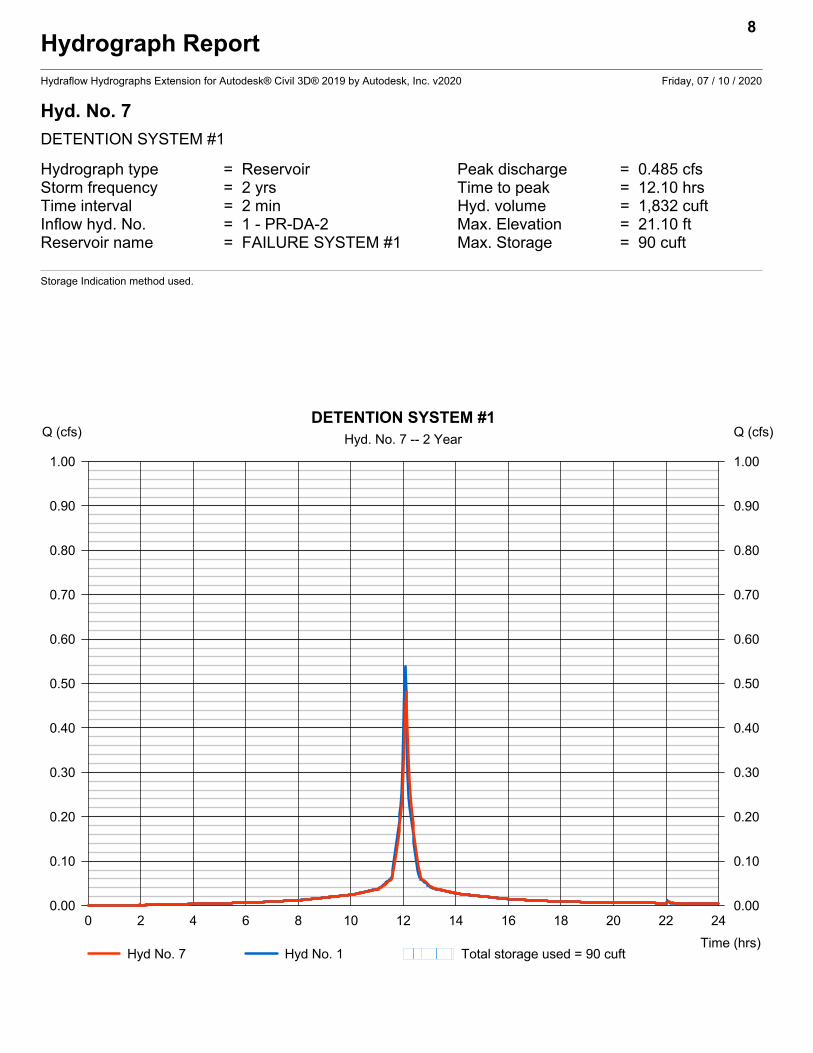
Hyd. No. 7
DETENTION SYSTEM #1
Hydrograph type = Reservoir Peak discharge = 0.485 cfsStorm frequency = 2 yrs Time to peak = 12.10 hrsTime interval = 2 min Hyd. volume = 1,832 cuftInflow hyd. No. = 1 - PR-DA-2 Max. Elevation = 21.10 ftReservoir name = FAILURE SYSTEM #1 Max. Storage = 90 cuft
Storage Indication method used.
8
0 2 4 6 8 10 12 14 16 18 20 22 24
Q (cfs)
0.00 0.00
0.10 0.10
0.20 0.20
0.30 0.30
0.40 0.40
0.50 0.50
0.60 0.60
0.70 0.70
0.80 0.80
0.90 0.90
1.00 1.00
Q (cfs)
Time (hrs)
DETENTION SYSTEM #1Hyd. No. 7 -- 2 Year
Hyd No. 7 Hyd No. 1 Total storage used = 90 cuft

Hydrograph ReportHydraflow Hydrographs Extension for Autodesk® Civil 3D® 2019 by Autodesk, Inc. v2020 Friday, 07 / 10 / 2020
Hyd. No. 8
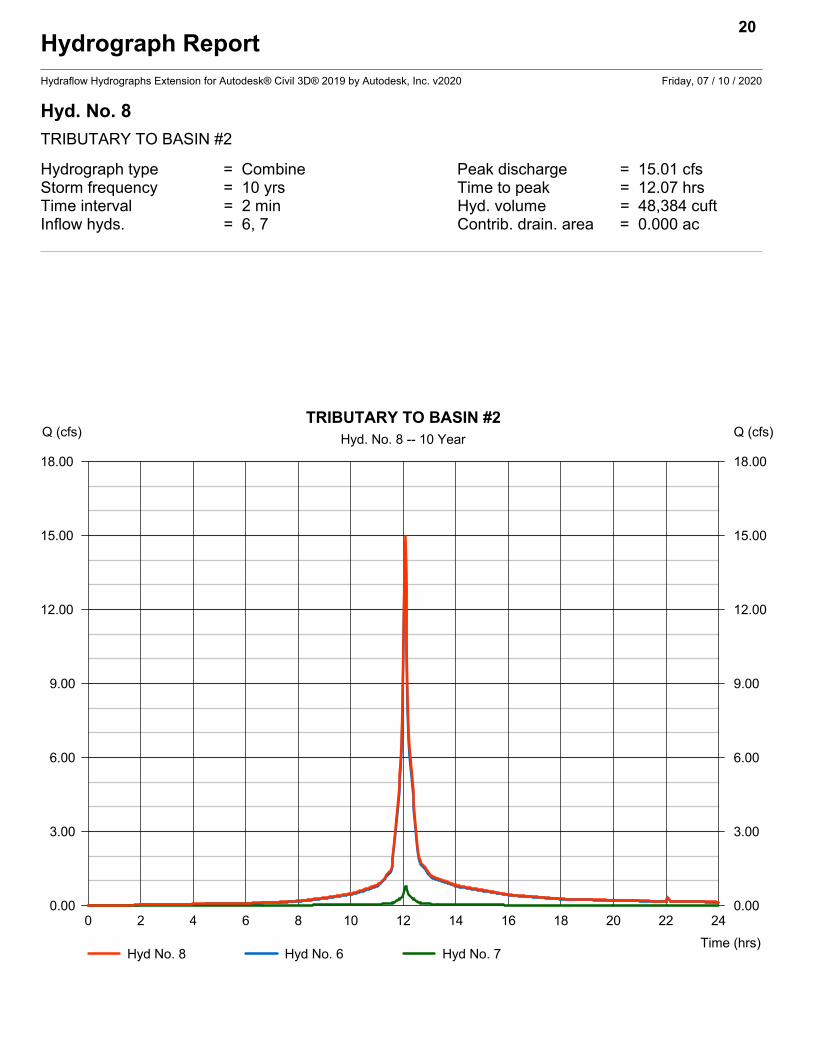
TRIBUTARY TO BASIN #2
Hydrograph type = Combine Peak discharge = 8.577 cfsStorm frequency = 2 yrs Time to peak = 12.07 hrsTime interval = 2 min Hyd. volume = 27,822 cuftInflow hyds. = 6, 7 Contrib. drain. area = 0.000 ac
10
0 2 4 6 8 10 12 14 16 18 20 22 24 26
Q (cfs)
0.00 0.00
2.00 2.00
4.00 4.00
6.00 6.00
8.00 8.00
10.00 10.00
Q (cfs)
Time (hrs)
TRIBUTARY TO BASIN #2Hyd. No. 8 -- 2 Year
Hyd No. 8 Hyd No. 6 Hyd No. 7

Hydrograph ReportHydraflow Hydrographs Extension for Autodesk® Civil 3D® 2019 by Autodesk, Inc. v2020 Friday, 07 / 10 / 2020
Hyd. No. 9
DETENTION SYSTEM #2
Hydrograph type = Reservoir Peak discharge = 7.676 cfsStorm frequency = 2 yrs Time to peak = 12.10 hrsTime interval = 2 min Hyd. volume = 27,821 cuftInflow hyd. No. = 8 - TRIBUTARY TO BASIN #2Max. Elevation = 14.64 ftReservoir name = FAILURE SYSTEM #2 Max. Storage = 1,813 cuft
Storage Indication method used.
11
0 2 4 6 8 10 12 14 16 18 20 22 24 26
Q (cfs)
0.00 0.00
2.00 2.00
4.00 4.00
6.00 6.00
8.00 8.00
10.00 10.00
Q (cfs)
Time (hrs)
DETENTION SYSTEM #2Hyd. No. 9 -- 2 Year
Hyd No. 9 Hyd No. 8 Total storage used = 1,813 cuft
Hydrograph ReportHydraflow Hydrographs Extension for Autodesk® Civil 3D® 2019 by Autodesk, Inc. v2020 Friday, 07 / 10 / 2020
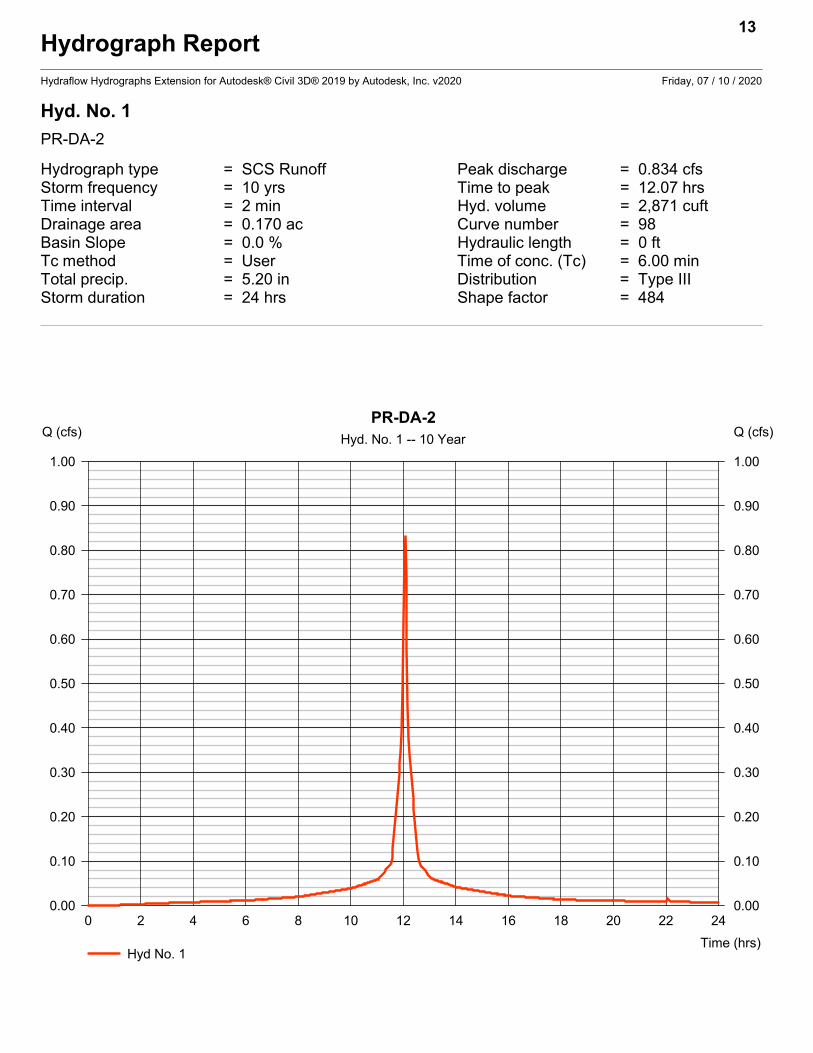
Hyd. No. 1
PR-DA-2
Hydrograph type = SCS Runoff Peak discharge = 0.834 cfsStorm frequency = 10 yrs Time to peak = 12.07 hrsTime interval = 2 min Hyd. volume = 2,871 cuftDrainage area = 0.170 ac Curve number = 98Basin Slope = 0.0 % Hydraulic length = 0 ftTc method = User Time of conc. (Tc) = 6.00 minTotal precip. = 5.20 in Distribution = Type IIIStorm duration = 24 hrs Shape factor = 484
13
0 2 4 6 8 10 12 14 16 18 20 22 24
Q (cfs)
0.00 0.00
0.10 0.10
0.20 0.20
0.30 0.30
0.40 0.40
0.50 0.50
0.60 0.60
0.70 0.70
0.80 0.80
0.90 0.90
1.00 1.00
Q (cfs)
Time (hrs)
PR-DA-2Hyd. No. 1 -- 10 Year
Hyd No. 1

Hydrograph ReportHydraflow Hydrographs Extension for Autodesk® Civil 3D® 2019 by Autodesk, Inc. v2020 Friday, 07 / 10 / 2020
Hyd. No. 2
PR-DA-3A
Hydrograph type = SCS Runoff Peak discharge = 3.385 cfsStorm frequency = 10 yrs Time to peak = 12.07 hrsTime interval = 2 min Hyd. volume = 11,654 cuftDrainage area = 0.690 ac Curve number = 98Basin Slope = 0.0 % Hydraulic length = 0 ftTc method = User Time of conc. (Tc) = 6.00 minTotal precip. = 5.20 in Distribution = Type IIIStorm duration = 24 hrs Shape factor = 484
14
0 2 4 6 8 10 12 14 16 18 20 22 24
Q (cfs)
0.00 0.00
1.00 1.00
2.00 2.00
3.00 3.00
4.00 4.00
Q (cfs)
Time (hrs)
PR-DA-3AHyd. No. 2 -- 10 Year
Hyd No. 2

Hydrograph ReportHydraflow Hydrographs Extension for Autodesk® Civil 3D® 2019 by Autodesk, Inc. v2020 Friday, 07 / 10 / 2020
Hyd. No. 3
PR-DA-3B (I)
Hydrograph type = SCS Runoff Peak discharge = 3.041 cfsStorm frequency = 10 yrs Time to peak = 12.07 hrsTime interval = 2 min Hyd. volume = 10,471 cuftDrainage area = 0.620 ac Curve number = 98Basin Slope = 0.0 % Hydraulic length = 0 ftTc method = User Time of conc. (Tc) = 6.00 minTotal precip. = 5.20 in Distribution = Type IIIStorm duration = 24 hrs Shape factor = 484
15
0 2 4 6 8 10 12 14 16 18 20 22 24
Q (cfs)
0.00 0.00
1.00 1.00
2.00 2.00
3.00 3.00
4.00 4.00
Q (cfs)
Time (hrs)
PR-DA-3B (I)Hyd. No. 3 -- 10 Year
Hyd No. 3
Hydrograph ReportHydraflow Hydrographs Extension for Autodesk® Civil 3D® 2019 by Autodesk, Inc. v2020 Friday, 07 / 10 / 2020
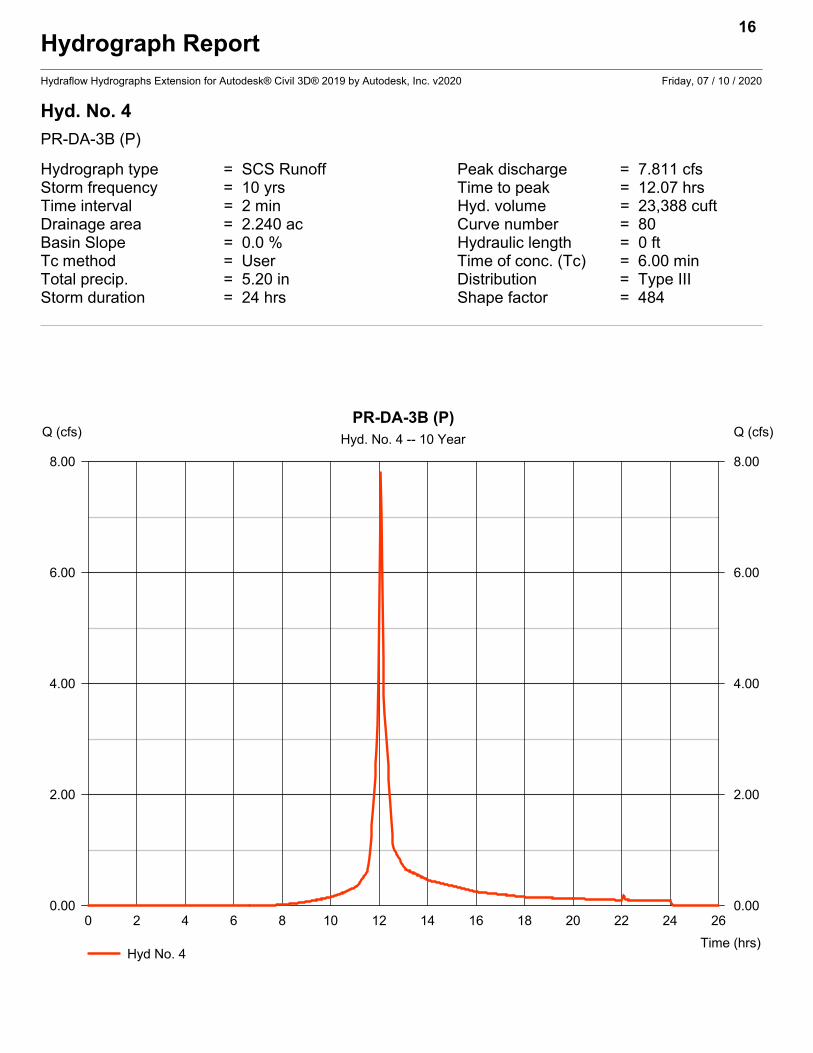
Hyd. No. 4
PR-DA-3B (P)
Hydrograph type = SCS Runoff Peak discharge = 7.811 cfsStorm frequency = 10 yrs Time to peak = 12.07 hrsTime interval = 2 min Hyd. volume = 23,388 cuftDrainage area = 2.240 ac Curve number = 80Basin Slope = 0.0 % Hydraulic length = 0 ftTc method = User Time of conc. (Tc) = 6.00 minTotal precip. = 5.20 in Distribution = Type IIIStorm duration = 24 hrs Shape factor = 484
16
0 2 4 6 8 10 12 14 16 18 20 22 24 26
Q (cfs)
0.00 0.00
2.00 2.00
4.00 4.00
6.00 6.00
8.00 8.00
Q (cfs)
Time (hrs)
PR-DA-3B (P)Hyd. No. 4 -- 10 Year
Hyd No. 4

Hydrograph ReportHydraflow Hydrographs Extension for Autodesk® Civil 3D® 2019 by Autodesk, Inc. v2020 Friday, 07 / 10 / 2020
Hyd. No. 5
PR-DA-3B COMBINED
Hydrograph type = Combine Peak discharge = 10.85 cfsStorm frequency = 10 yrs Time to peak = 12.07 hrsTime interval = 2 min Hyd. volume = 33,859 cuftInflow hyds. = 3, 4 Contrib. drain. area = 2.860 ac
17
0 2 4 6 8 10 12 14 16 18 20 22 24 26
Q (cfs)
0.00 0.00
2.00 2.00
4.00 4.00
6.00 6.00
8.00 8.00
10.00 10.00
12.00 12.00
Q (cfs)
Time (hrs)
PR-DA-3B COMBINEDHyd. No. 5 -- 10 Year
Hyd No. 5 Hyd No. 3 Hyd No. 4

Hydrograph ReportHydraflow Hydrographs Extension for Autodesk® Civil 3D® 2019 by Autodesk, Inc. v2020 Friday, 07 / 10 / 2020
Hyd. No. 6
PR-DA-3 COMBINED
Hydrograph type = Combine Peak discharge = 14.24 cfsStorm frequency = 10 yrs Time to peak = 12.07 hrsTime interval = 2 min Hyd. volume = 45,513 cuftInflow hyds. = 2, 5 Contrib. drain. area = 0.690 ac
18
0 2 4 6 8 10 12 14 16 18 20 22 24
Q (cfs)
0.00 0.00
3.00 3.00
6.00 6.00
9.00 9.00
12.00 12.00
15.00 15.00
Q (cfs)
Time (hrs)
PR-DA-3 COMBINEDHyd. No. 6 -- 10 Year
Hyd No. 6 Hyd No. 2 Hyd No. 5
Hydrograph ReportHydraflow Hydrographs Extension for Autodesk® Civil 3D® 2019 by Autodesk, Inc. v2020 Friday, 07 / 10 / 2020
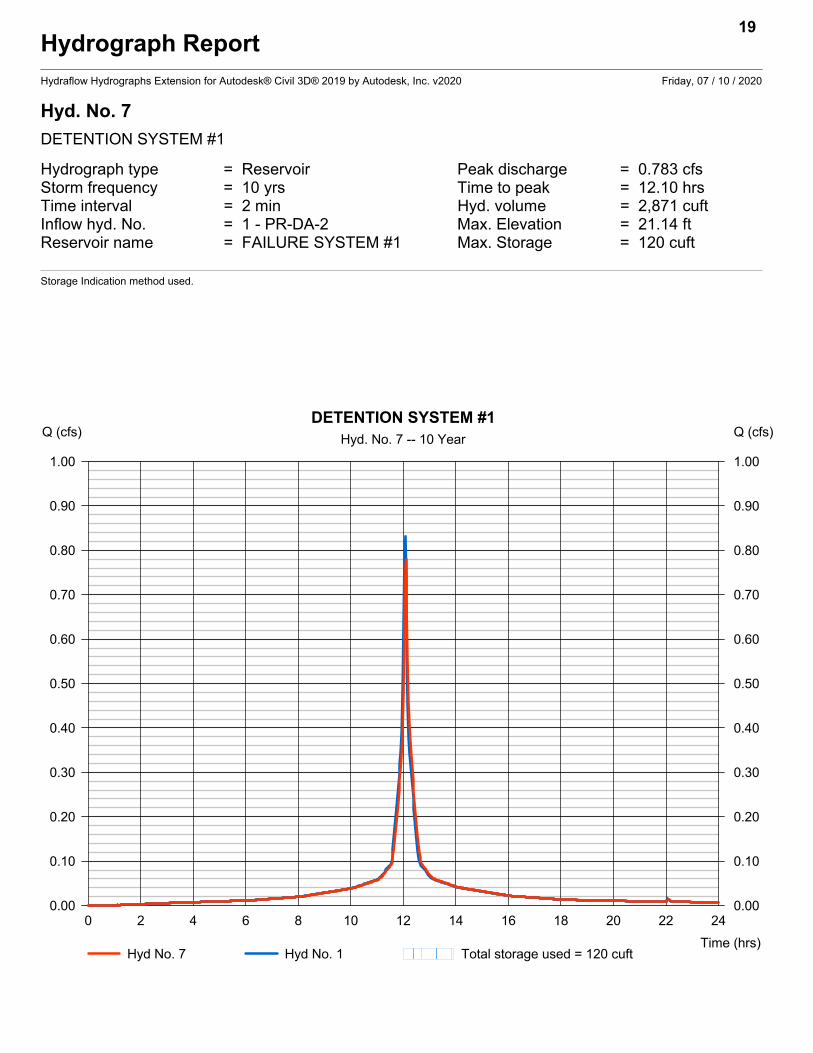
Hyd. No. 7
DETENTION SYSTEM #1
Hydrograph type = Reservoir Peak discharge = 0.783 cfsStorm frequency = 10 yrs Time to peak = 12.10 hrsTime interval = 2 min Hyd. volume = 2,871 cuftInflow hyd. No. = 1 - PR-DA-2 Max. Elevation = 21.14 ftReservoir name = FAILURE SYSTEM #1 Max. Storage = 120 cuft
Storage Indication method used.
19
0 2 4 6 8 10 12 14 16 18 20 22 24
Q (cfs)
0.00 0.00
0.10 0.10
0.20 0.20
0.30 0.30
0.40 0.40
0.50 0.50
0.60 0.60
0.70 0.70
0.80 0.80
0.90 0.90
1.00 1.00
Q (cfs)
Time (hrs)
DETENTION SYSTEM #1Hyd. No. 7 -- 10 Year
Hyd No. 7 Hyd No. 1 Total storage used = 120 cuft
Hydrograph ReportHydraflow Hydrographs Extension for Autodesk® Civil 3D® 2019 by Autodesk, Inc. v2020 Friday, 07 / 10 / 2020
Hyd. No. 8
TRIBUTARY TO BASIN #2
Hydrograph type = Combine Peak discharge = 15.01 cfsStorm frequency = 10 yrs Time to peak = 12.07 hrsTime interval = 2 min Hyd. volume = 48,384 cuftInflow hyds. = 6, 7 Contrib. drain. area = 0.000 ac
20
0 2 4 6 8 10 12 14 16 18 20 22 24
Q (cfs)
0.00 0.00
3.00 3.00
6.00 6.00
9.00 9.00
12.00 12.00
15.00 15.00
18.00 18.00
Q (cfs)
Time (hrs)
TRIBUTARY TO BASIN #2Hyd. No. 8 -- 10 Year
Hyd No. 8 Hyd No. 6 Hyd No. 7
Hydrograph ReportHydraflow Hydrographs Extension for Autodesk® Civil 3D® 2019 by Autodesk, Inc. v2020 Friday, 07 / 10 / 2020
Hyd. No. 9
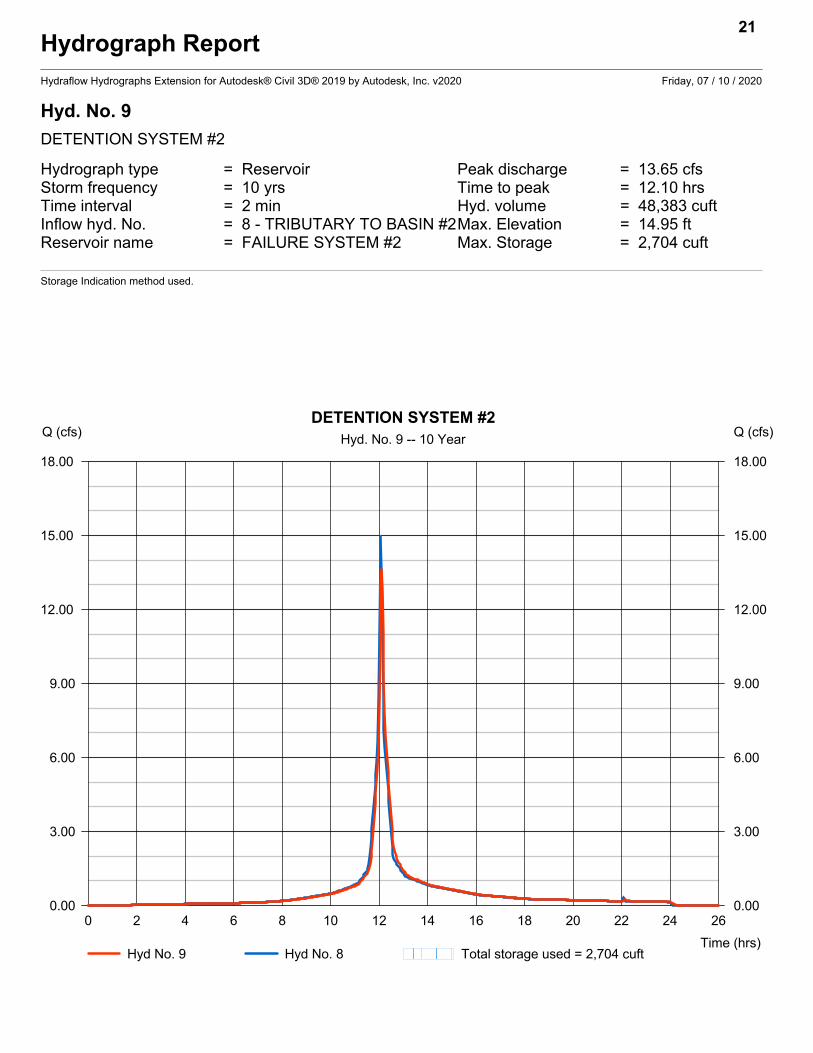
DETENTION SYSTEM #2
Hydrograph type = Reservoir Peak discharge = 13.65 cfsStorm frequency = 10 yrs Time to peak = 12.10 hrsTime interval = 2 min Hyd. volume = 48,383 cuftInflow hyd. No. = 8 - TRIBUTARY TO BASIN #2Max. Elevation = 14.95 ftReservoir name = FAILURE SYSTEM #2 Max. Storage = 2,704 cuft
Storage Indication method used.
21
0 2 4 6 8 10 12 14 16 18 20 22 24 26
Q (cfs)
0.00 0.00
3.00 3.00
6.00 6.00
9.00 9.00
12.00 12.00
15.00 15.00
18.00 18.00
Q (cfs)
Time (hrs)
DETENTION SYSTEM #2Hyd. No. 9 -- 10 Year
Hyd No. 9 Hyd No. 8 Total storage used = 2,704 cuft

Hydrograph ReportHydraflow Hydrographs Extension for Autodesk® Civil 3D® 2019 by Autodesk, Inc. v2020 Friday, 07 / 10 / 2020
Hyd. No. 1
PR-DA-2
Hydrograph type = SCS Runoff Peak discharge = 1.400 cfsStorm frequency = 100 yrs Time to peak = 12.07 hrsTime interval = 2 min Hyd. volume = 4,894 cuftDrainage area = 0.170 ac Curve number = 98Basin Slope = 0.0 % Hydraulic length = 0 ftTc method = User Time of conc. (Tc) = 6.00 minTotal precip. = 8.70 in Distribution = Type IIIStorm duration = 24 hrs Shape factor = 484
22
0 2 4 6 8 10 12 14 16 18 20 22 24
Q (cfs)
0.00 0.00
1.00 1.00
2.00 2.00
Q (cfs)
Time (hrs)
PR-DA-2Hyd. No. 1 -- 100 Year
Hyd No. 1
Hydrograph ReportHydraflow Hydrographs Extension for Autodesk® Civil 3D® 2019 by Autodesk, Inc. v2020 Friday, 07 / 10 / 2020
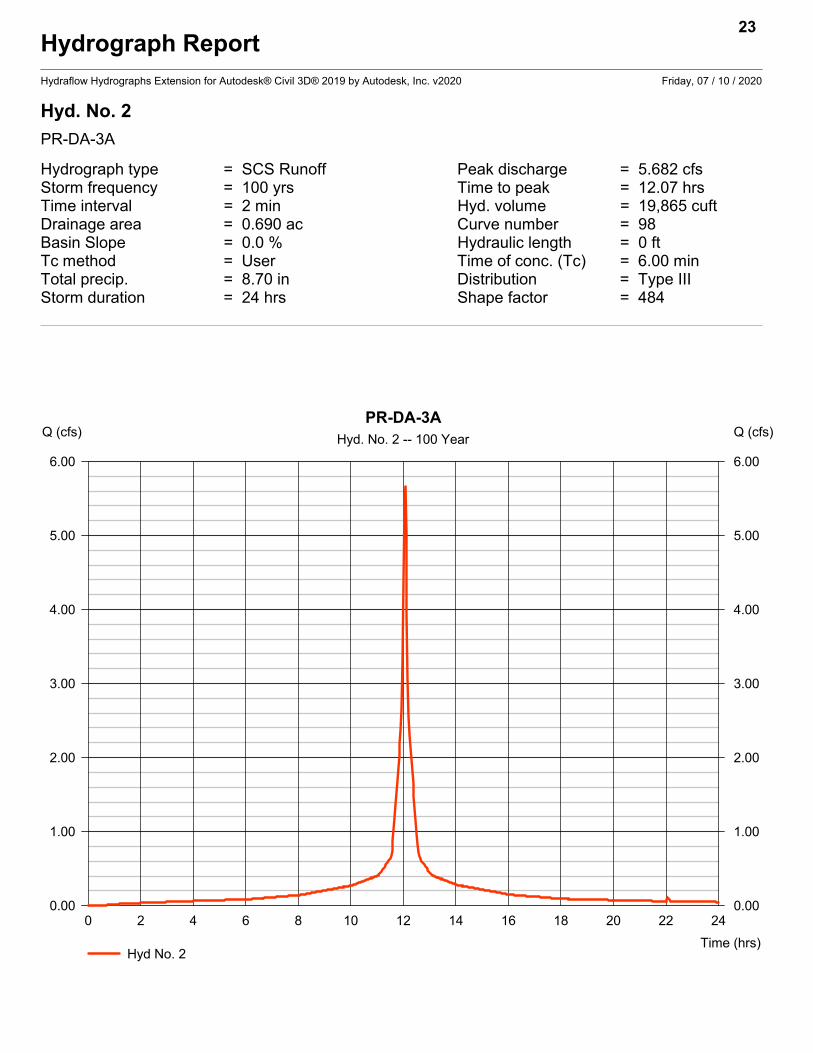
Hyd. No. 2
PR-DA-3A
Hydrograph type = SCS Runoff Peak discharge = 5.682 cfsStorm frequency = 100 yrs Time to peak = 12.07 hrsTime interval = 2 min Hyd. volume = 19,865 cuftDrainage area = 0.690 ac Curve number = 98Basin Slope = 0.0 % Hydraulic length = 0 ftTc method = User Time of conc. (Tc) = 6.00 minTotal precip. = 8.70 in Distribution = Type IIIStorm duration = 24 hrs Shape factor = 484
23
0 2 4 6 8 10 12 14 16 18 20 22 24
Q (cfs)
0.00 0.00
1.00 1.00
2.00 2.00
3.00 3.00
4.00 4.00
5.00 5.00
6.00 6.00
Q (cfs)
Time (hrs)
PR-DA-3AHyd. No. 2 -- 100 Year
Hyd No. 2
Hydrograph ReportHydraflow Hydrographs Extension for Autodesk® Civil 3D® 2019 by Autodesk, Inc. v2020 Friday, 07 / 10 / 2020
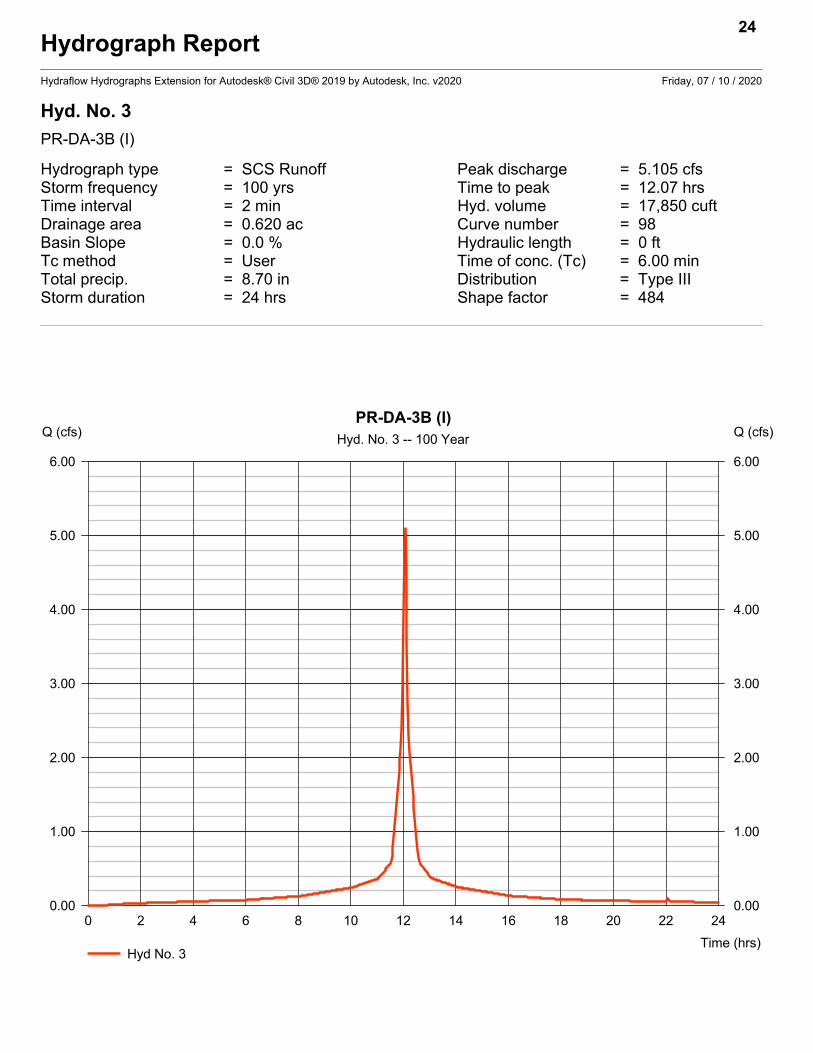
Hyd. No. 3
PR-DA-3B (I)
Hydrograph type = SCS Runoff Peak discharge = 5.105 cfsStorm frequency = 100 yrs Time to peak = 12.07 hrsTime interval = 2 min Hyd. volume = 17,850 cuftDrainage area = 0.620 ac Curve number = 98Basin Slope = 0.0 % Hydraulic length = 0 ftTc method = User Time of conc. (Tc) = 6.00 minTotal precip. = 8.70 in Distribution = Type IIIStorm duration = 24 hrs Shape factor = 484
24
0 2 4 6 8 10 12 14 16 18 20 22 24
Q (cfs)
0.00 0.00
1.00 1.00
2.00 2.00
3.00 3.00
4.00 4.00
5.00 5.00
6.00 6.00
Q (cfs)
Time (hrs)
PR-DA-3B (I)Hyd. No. 3 -- 100 Year
Hyd No. 3

Hydrograph ReportHydraflow Hydrographs Extension for Autodesk® Civil 3D® 2019 by Autodesk, Inc. v2020 Friday, 07 / 10 / 2020
Hyd. No. 4
PR-DA-3B (P)
Hydrograph type = SCS Runoff Peak discharge = 15.64 cfsStorm frequency = 100 yrs Time to peak = 12.07 hrsTime interval = 2 min Hyd. volume = 47,904 cuftDrainage area = 2.240 ac Curve number = 80Basin Slope = 0.0 % Hydraulic length = 0 ftTc method = User Time of conc. (Tc) = 6.00 minTotal precip. = 8.70 in Distribution = Type IIIStorm duration = 24 hrs Shape factor = 484
25
0 2 4 6 8 10 12 14 16 18 20 22 24
Q (cfs)
0.00 0.00
3.00 3.00
6.00 6.00
9.00 9.00
12.00 12.00
15.00 15.00
18.00 18.00
Q (cfs)
Time (hrs)
PR-DA-3B (P)Hyd. No. 4 -- 100 Year
Hyd No. 4

Hydrograph ReportHydraflow Hydrographs Extension for Autodesk® Civil 3D® 2019 by Autodesk, Inc. v2020 Friday, 07 / 10 / 2020
Hyd. No. 5
PR-DA-3B COMBINED
Hydrograph type = Combine Peak discharge = 20.75 cfsStorm frequency = 100 yrs Time to peak = 12.07 hrsTime interval = 2 min Hyd. volume = 65,753 cuftInflow hyds. = 3, 4 Contrib. drain. area = 2.860 ac
26
0 2 4 6 8 10 12 14 16 18 20 22 24
Q (cfs)
0.00 0.00
3.00 3.00
6.00 6.00
9.00 9.00
12.00 12.00
15.00 15.00
18.00 18.00
21.00 21.00
Q (cfs)
Time (hrs)
PR-DA-3B COMBINEDHyd. No. 5 -- 100 Year
Hyd No. 5 Hyd No. 3 Hyd No. 4

Hydrograph ReportHydraflow Hydrographs Extension for Autodesk® Civil 3D® 2019 by Autodesk, Inc. v2020 Friday, 07 / 10 / 2020
Hyd. No. 6
PR-DA-3 COMBINED
Hydrograph type = Combine Peak discharge = 26.43 cfsStorm frequency = 100 yrs Time to peak = 12.07 hrsTime interval = 2 min Hyd. volume = 85,618 cuftInflow hyds. = 2, 5 Contrib. drain. area = 0.690 ac
27
0 2 4 6 8 10 12 14 16 18 20 22 24
Q (cfs)
0.00 0.00
4.00 4.00
8.00 8.00
12.00 12.00
16.00 16.00
20.00 20.00
24.00 24.00
28.00 28.00
Q (cfs)
Time (hrs)
PR-DA-3 COMBINEDHyd. No. 6 -- 100 Year
Hyd No. 6 Hyd No. 2 Hyd No. 5
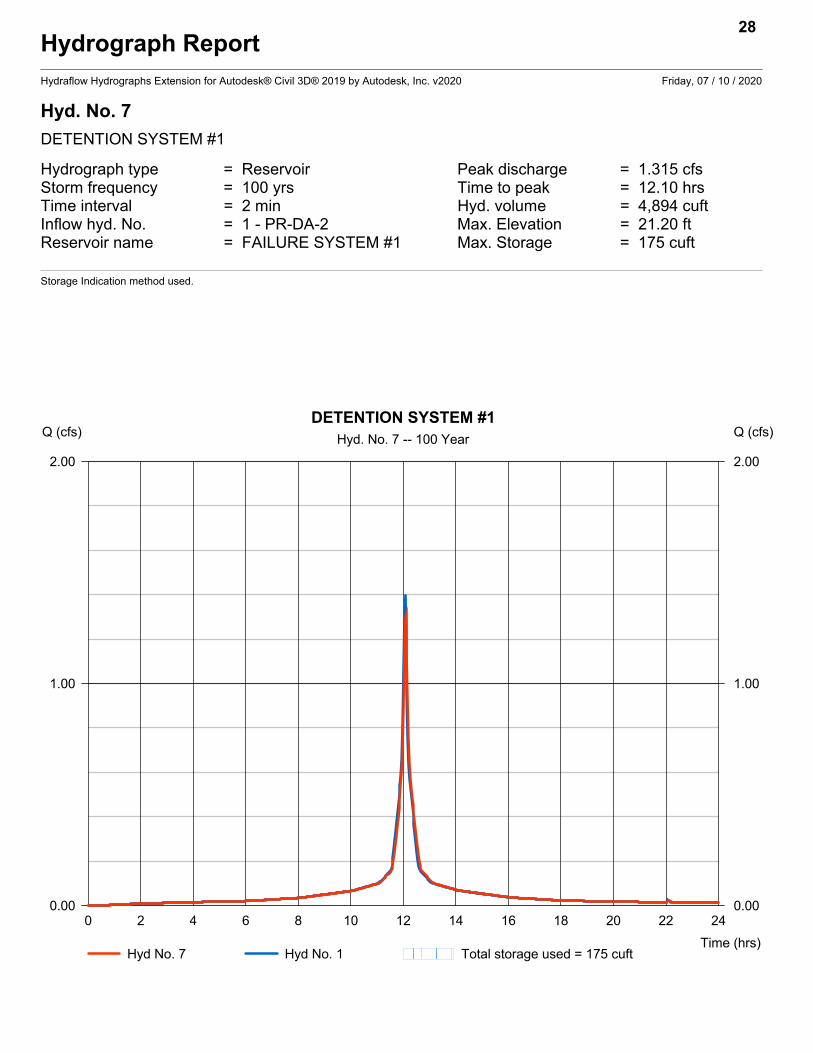
Hydrograph ReportHydraflow Hydrographs Extension for Autodesk® Civil 3D® 2019 by Autodesk, Inc. v2020 Friday, 07 / 10 / 2020
Hyd. No. 7
DETENTION SYSTEM #1
Hydrograph type = Reservoir Peak discharge = 1.315 cfsStorm frequency = 100 yrs Time to peak = 12.10 hrsTime interval = 2 min Hyd. volume = 4,894 cuftInflow hyd. No. = 1 - PR-DA-2 Max. Elevation = 21.20 ftReservoir name = FAILURE SYSTEM #1 Max. Storage = 175 cuft
Storage Indication method used.
28
0 2 4 6 8 10 12 14 16 18 20 22 24
Q (cfs)
0.00 0.00
1.00 1.00
2.00 2.00
Q (cfs)
Time (hrs)
DETENTION SYSTEM #1Hyd. No. 7 -- 100 Year
Hyd No. 7 Hyd No. 1 Total storage used = 175 cuft
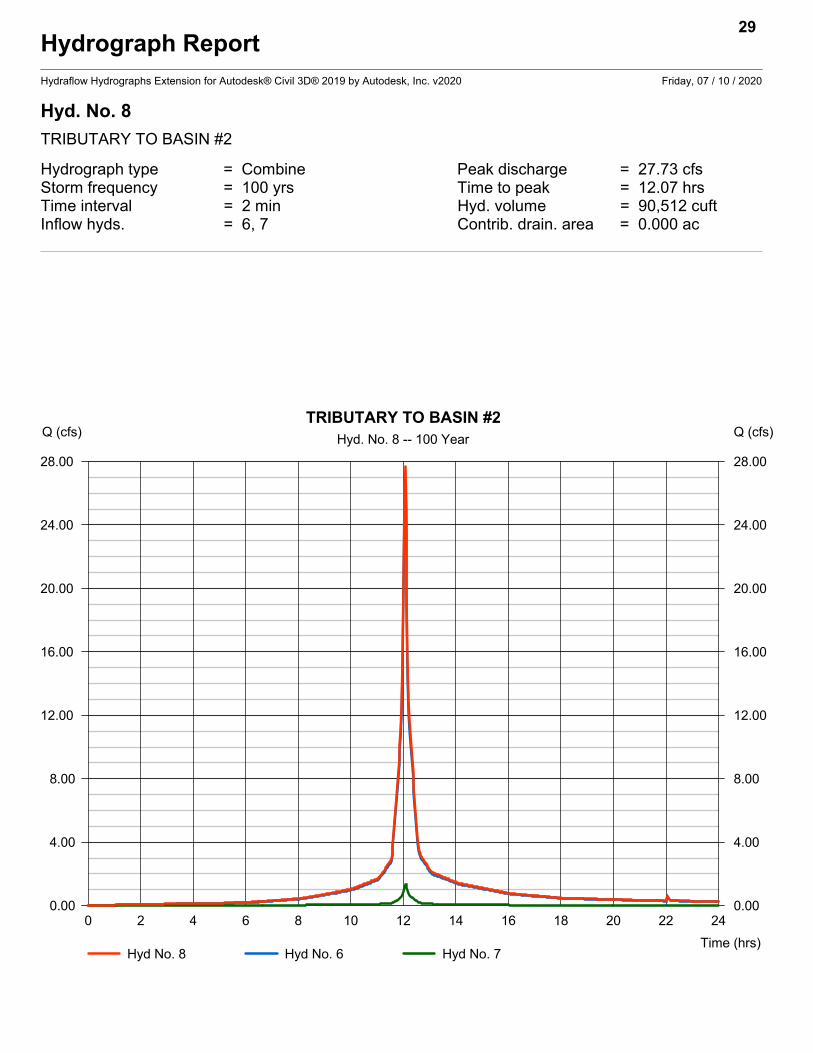
Hydrograph ReportHydraflow Hydrographs Extension for Autodesk® Civil 3D® 2019 by Autodesk, Inc. v2020 Friday, 07 / 10 / 2020
Hyd. No. 8
TRIBUTARY TO BASIN #2
Hydrograph type = Combine Peak discharge = 27.73 cfsStorm frequency = 100 yrs Time to peak = 12.07 hrsTime interval = 2 min Hyd. volume = 90,512 cuftInflow hyds. = 6, 7 Contrib. drain. area = 0.000 ac
29
0 2 4 6 8 10 12 14 16 18 20 22 24
Q (cfs)
0.00 0.00
4.00 4.00
8.00 8.00
12.00 12.00
16.00 16.00
20.00 20.00
24.00 24.00
28.00 28.00
Q (cfs)
Time (hrs)
TRIBUTARY TO BASIN #2Hyd. No. 8 -- 100 Year
Hyd No. 8 Hyd No. 6 Hyd No. 7
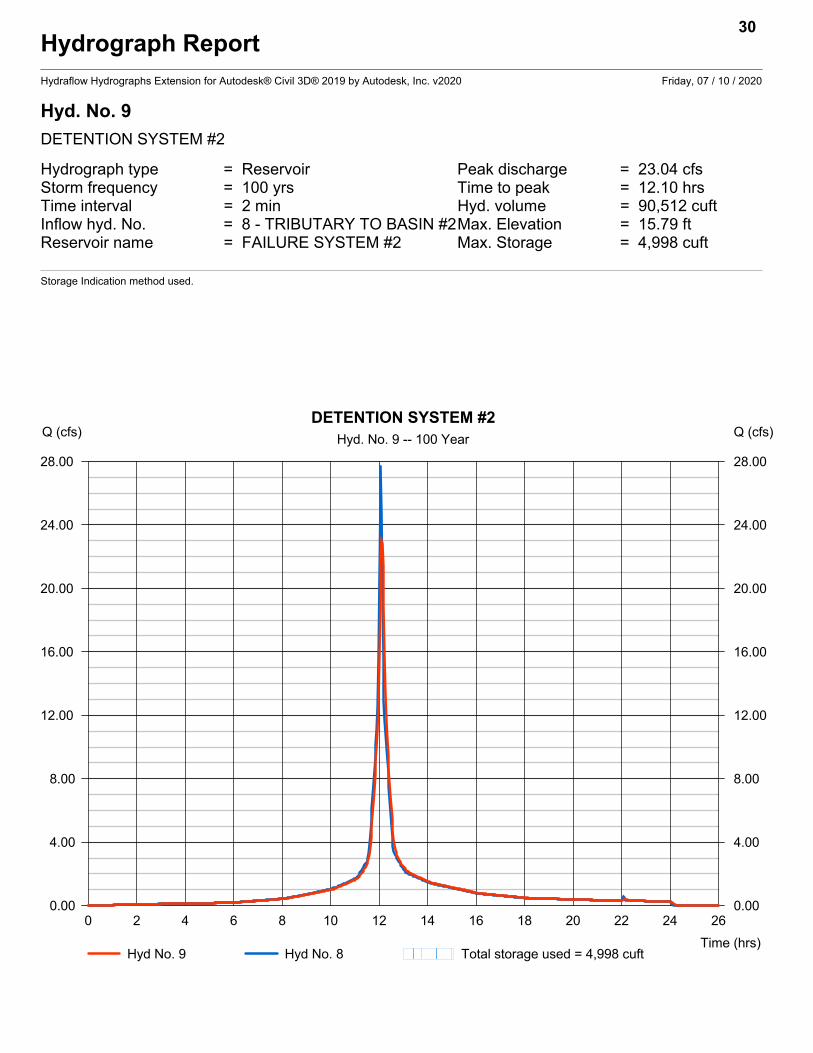
Hydrograph ReportHydraflow Hydrographs Extension for Autodesk® Civil 3D® 2019 by Autodesk, Inc. v2020 Friday, 07 / 10 / 2020
Hyd. No. 9
DETENTION SYSTEM #2
Hydrograph type = Reservoir Peak discharge = 23.04 cfsStorm frequency = 100 yrs Time to peak = 12.10 hrsTime interval = 2 min Hyd. volume = 90,512 cuftInflow hyd. No. = 8 - TRIBUTARY TO BASIN #2Max. Elevation = 15.79 ftReservoir name = FAILURE SYSTEM #2 Max. Storage = 4,998 cuft
Storage Indication method used.
30
0 2 4 6 8 10 12 14 16 18 20 22 24 26
Q (cfs)
0.00 0.00
4.00 4.00
8.00 8.00
12.00 12.00
16.00 16.00
20.00 20.00
24.00 24.00
28.00 28.00
Q (cfs)
Time (hrs)
DETENTION SYSTEM #2Hyd. No. 9 -- 100 Year
Hyd No. 9 Hyd No. 8 Total storage used = 4,998 cuft

Pond Reports
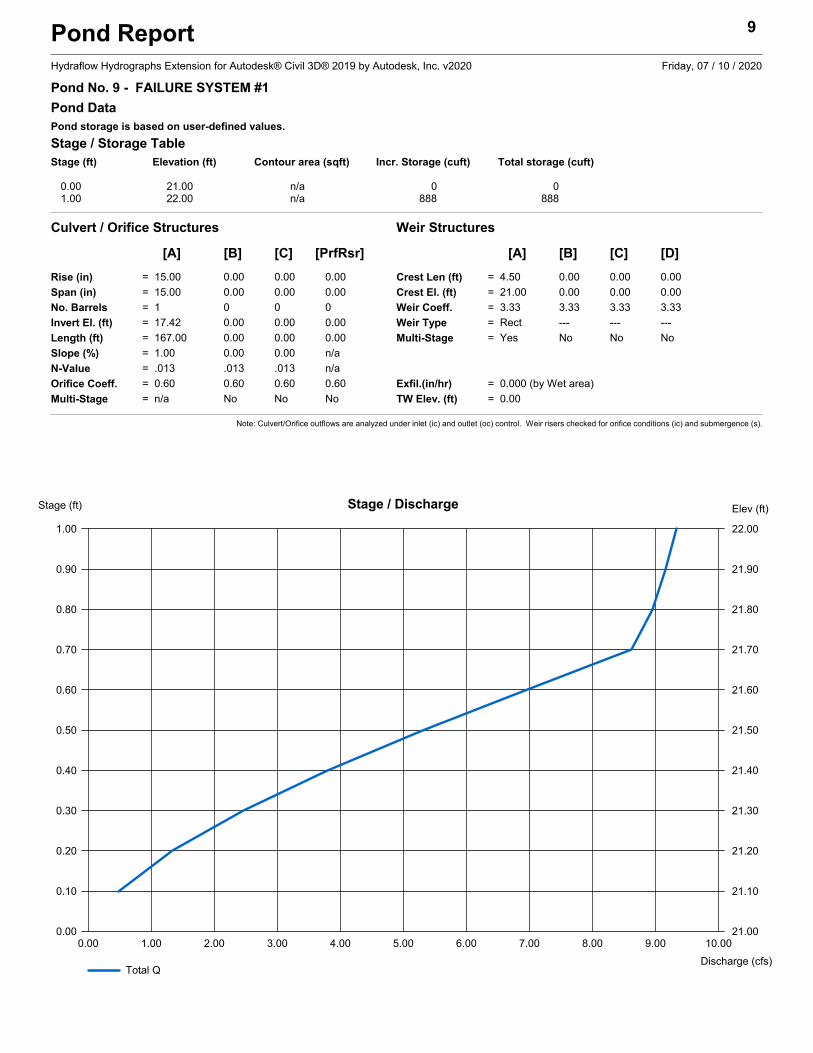
Pond Report 9
Hydraflow Hydrographs Extension for Autodesk® Civil 3D® 2019 by Autodesk, Inc. v2020 Friday, 07 / 10 / 2020
Pond No. 9 - FAILURE SYSTEM #1
Pond DataPond storage is based on user-defined values.
Stage / Storage TableStage (ft) Elevation (ft) Contour area (sqft) Incr. Storage (cuft) Total storage (cuft)
0.00 21.00 n/a 0 01.00 22.00 n/a 888 888
Culvert / Orifice Structures Weir Structures
[A] [B] [C] [PrfRsr] [A] [B] [C] [D]
Rise (in) = 15.00 0.00 0.00 0.00
Span (in) = 15.00 0.00 0.00 0.00
No. Barrels = 1 0 0 0
Invert El. (ft) = 17.42 0.00 0.00 0.00
Length (ft) = 167.00 0.00 0.00 0.00
Slope (%) = 1.00 0.00 0.00 n/a
N-Value = .013 .013 .013 n/a
Orifice Coeff. = 0.60 0.60 0.60 0.60
Multi-Stage = n/a No No No
Crest Len (ft) = 4.50 0.00 0.00 0.00
Crest El. (ft) = 21.00 0.00 0.00 0.00
Weir Coeff. = 3.33 3.33 3.33 3.33
Weir Type = Rect --- --- ---
Multi-Stage = Yes No No No
Exfil.(in/hr) = 0.000 (by Wet area)
TW Elev. (ft) = 0.00
Note: Culvert/Orifice outflows are analyzed under inlet (ic) and outlet (oc) control. Weir risers checked for orifice conditions (ic) and submergence (s).
0.00 1.00 2.00 3.00 4.00 5.00 6.00 7.00 8.00 9.00 10.00
Stage (ft)
0.00 21.00
0.10 21.10
0.20 21.20
0.30 21.30
0.40 21.40
0.50 21.50
0.60 21.60
0.70 21.70
0.80 21.80
0.90 21.90
1.00 22.00
Elev (ft)
Discharge (cfs)
Stage / Discharge
Total Q
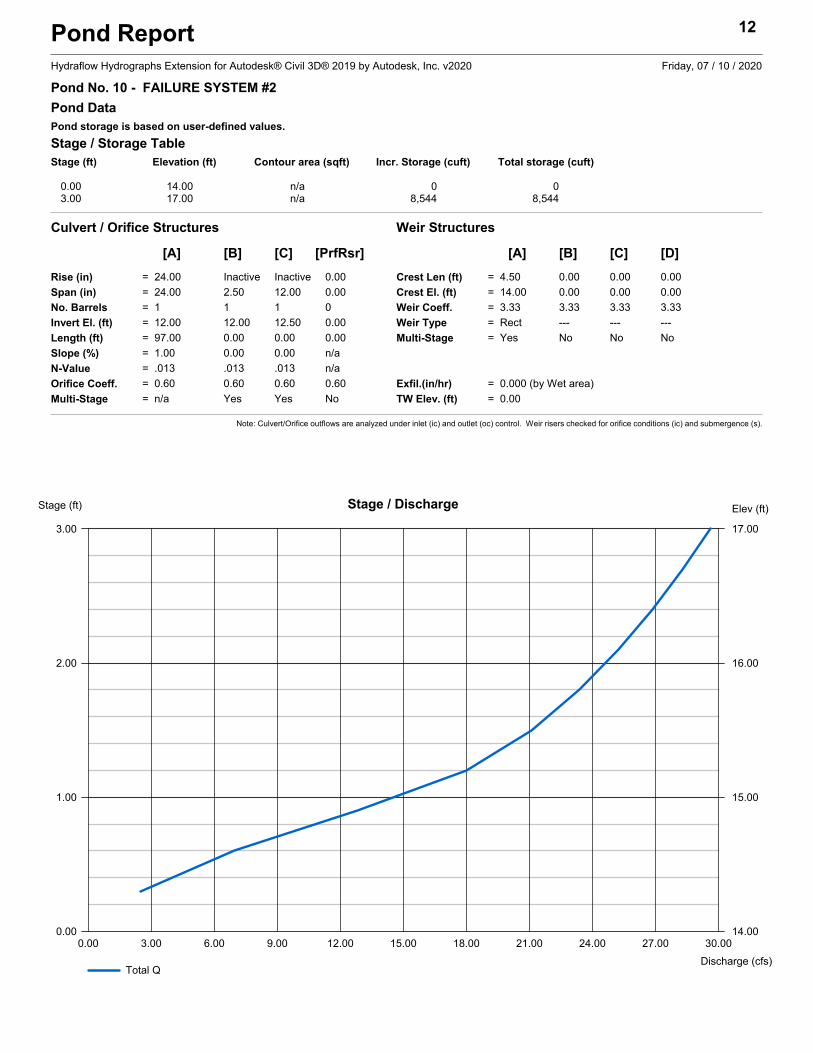
Pond Report 12
Hydraflow Hydrographs Extension for Autodesk® Civil 3D® 2019 by Autodesk, Inc. v2020 Friday, 07 / 10 / 2020
Pond No. 10 - FAILURE SYSTEM #2
Pond DataPond storage is based on user-defined values.
Stage / Storage TableStage (ft) Elevation (ft) Contour area (sqft) Incr. Storage (cuft) Total storage (cuft)
0.00 14.00 n/a 0 03.00 17.00 n/a 8,544 8,544
Culvert / Orifice Structures Weir Structures
[A] [B] [C] [PrfRsr] [A] [B] [C] [D]
Rise (in) = 24.00 Inactive Inactive 0.00
Span (in) = 24.00 2.50 12.00 0.00
No. Barrels = 1 1 1 0
Invert El. (ft) = 12.00 12.00 12.50 0.00
Length (ft) = 97.00 0.00 0.00 0.00
Slope (%) = 1.00 0.00 0.00 n/a
N-Value = .013 .013 .013 n/a
Orifice Coeff. = 0.60 0.60 0.60 0.60
Multi-Stage = n/a Yes Yes No
Crest Len (ft) = 4.50 0.00 0.00 0.00
Crest El. (ft) = 14.00 0.00 0.00 0.00
Weir Coeff. = 3.33 3.33 3.33 3.33
Weir Type = Rect --- --- ---
Multi-Stage = Yes No No No
Exfil.(in/hr) = 0.000 (by Wet area)
TW Elev. (ft) = 0.00
Note: Culvert/Orifice outflows are analyzed under inlet (ic) and outlet (oc) control. Weir risers checked for orifice conditions (ic) and submergence (s).
0.00 3.00 6.00 9.00 12.00 15.00 18.00 21.00 24.00 27.00 30.00
Stage (ft)
0.00 14.00
1.00 15.00
2.00 16.00
3.00 17.00
Elev (ft)
Discharge (cfs)
Stage / Discharge
Total Q

Geotechnical Investigation Analysis
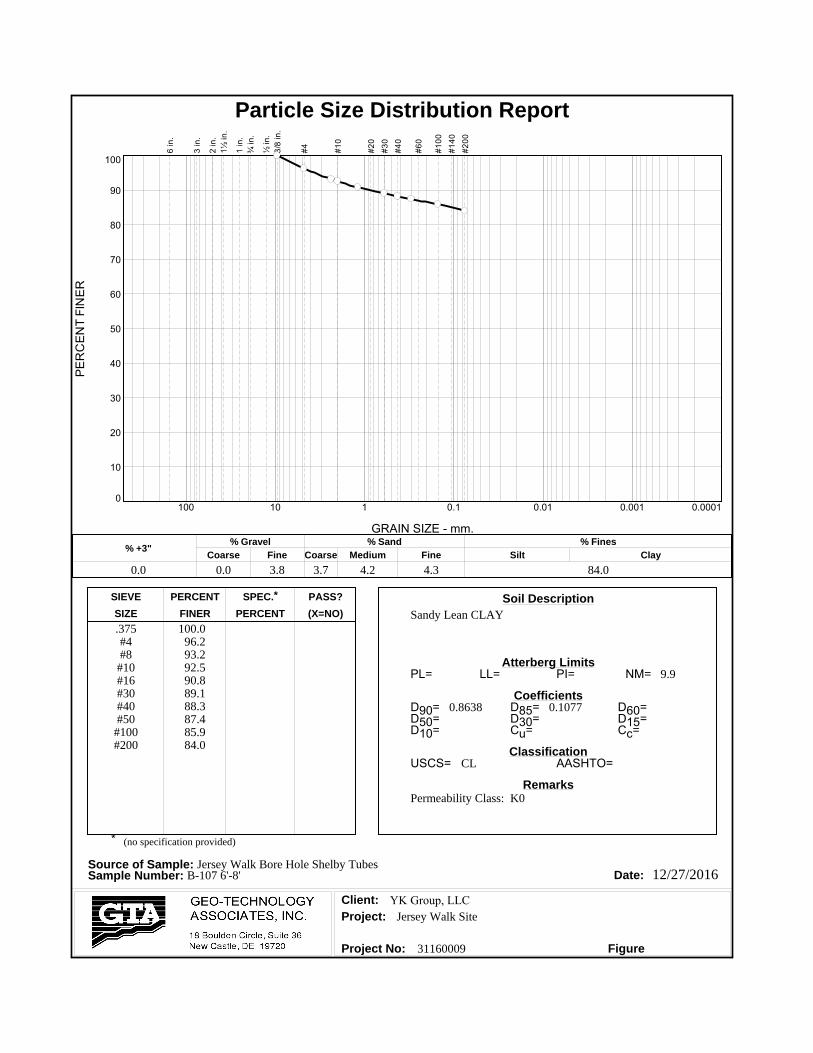
Particle Size Distribution Report
PE
RC
EN
T F
INE
R
0
10
20
30
40
50
60
70
80
90
100
GRAIN SIZE - mm.
0.00010.0010.010.1110100
% +3"Coarse
% Gravel
Fine Coarse Medium
% Sand
Fine Silt
% Fines
Clay
0.0 0.0 3.8 3.7 4.2 4.3 84.0
6 in
.
3 in
.
2 in
.
1½
in.
1 in
.
¾ in
.
½ in
.
3/8
in.
#4
#1
0
#2
0
#3
0
#4
0
#6
0
#1
00
#1
40
#2
00
SIEVE PERCENT SPEC.* PASS?
SIZE FINER PERCENT (X=NO)
Atterberg Limits
Coefficients
Classification
Remarks
Source of Sample: Jersey Walk Bore Hole Shelby TubesSample Number: B-107 6'-8' Date:
Client:
Project:
Project No: Figure
Soil Description Sandy Lean CLAY
.375#4#8#10#16#30#40#50
#100#200
100.096.293.292.590.889.188.387.485.984.0
9.9
0.8638 0.1077
CL
Permeability Class: K0
Jersey Walk Site
31160009
PL= LL= PI= NM=
D90= D85= D60=D50= D30= D15=D10= Cu= Cc=
USCS= AASHTO=
* (no specification provided)
12/27/2016
YK Group, LLC
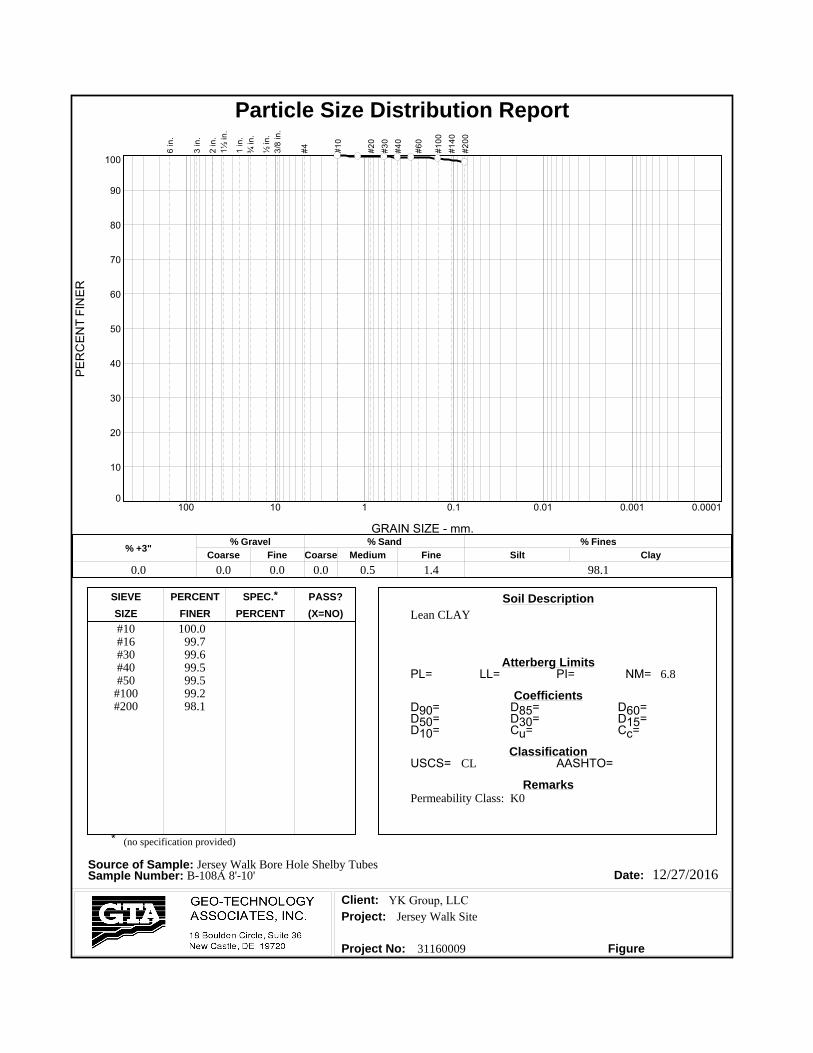
Particle Size Distribution Report
PE
RC
EN
T F
INE
R
0
10
20
30
40
50
60
70
80
90
100
GRAIN SIZE - mm.
0.00010.0010.010.1110100
% +3"Coarse
% Gravel
Fine Coarse Medium
% Sand
Fine Silt
% Fines
Clay
0.0 0.0 0.0 0.0 0.5 1.4 98.1
6 in
.
3 in
.
2 in
.
1½
in.
1 in
.
¾ in
.
½ in
.
3/8
in.
#4
#1
0
#2
0
#3
0
#4
0
#6
0
#1
00
#1
40
#2
00
SIEVE PERCENT SPEC.* PASS?
SIZE FINER PERCENT (X=NO)
Atterberg Limits
Coefficients
Classification
Remarks
Source of Sample: Jersey Walk Bore Hole Shelby Tubes Sample Number: B-108A 8'-10' Date:
Client:
Project:
Project No: Figure
Soil Description Lean CLAY
#10#16#30#40#50
#100#200
100.099.799.699.599.599.298.1
6.8
CL
Permeability Class: K0
Jersey Walk Site
31160009
PL= LL= PI= NM=
D90= D85= D60=D50= D30= D15=D10= Cu= Cc=
USCS= AASHTO=
* (no specification provided)
12/27/2016
YK Group, LLC
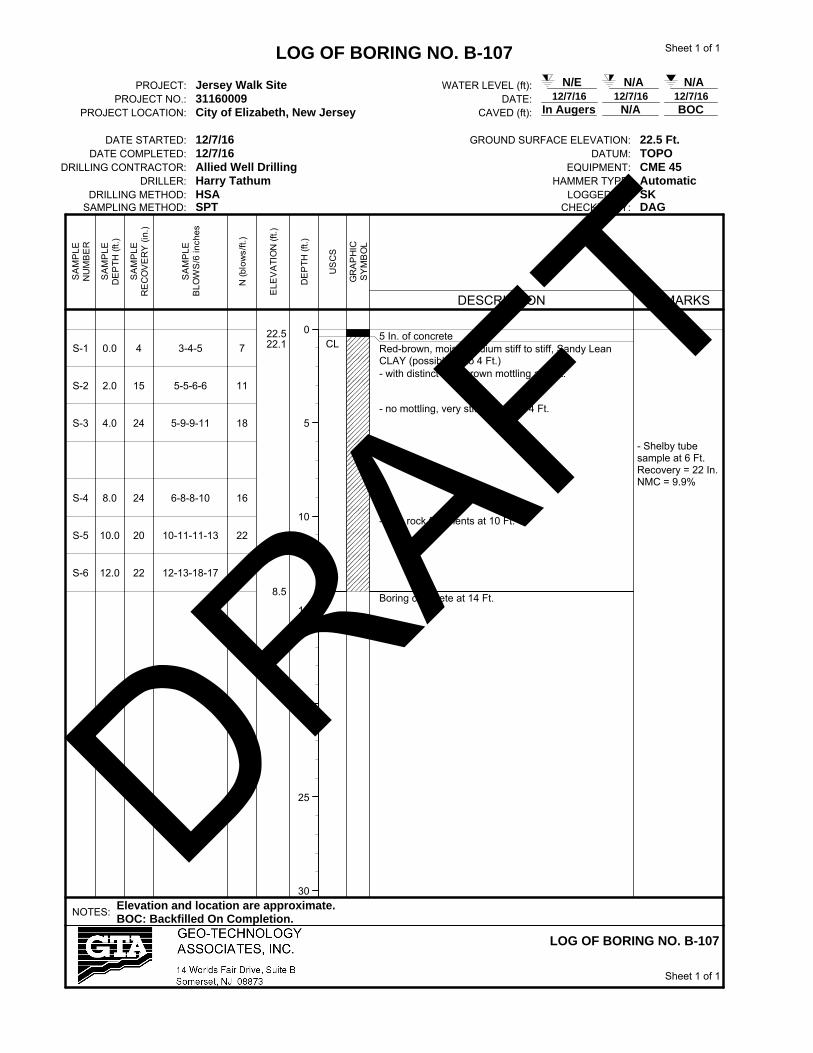
0
5
10
15
20
25
30
S-1
S-2
S-3
S-4
S-5
S-6
0.0
2.0
4.0
8.0
10.0
12.0
4
15
24
24
20
22
3-4-5
5-5-6-6
5-9-9-11
6-8-8-10
10-11-11-13
12-13-18-17
7
11
18
16
22
31
22.522.1
8.5
CL5 In. of concreteRed-brown, moist, medium stiff to stiff, Sandy LeanCLAY (possible fill to 4 Ft.)- with distinct dark brown mottling at 2 Ft.
- no mottling, very stiff to hard at 4 Ft.
- with rock fragments at 10 Ft.
Boring complete at 14 Ft.
- Shelby tubesample at 6 Ft.Recovery = 22 In.NMC = 9.9%
LOG OF BORING NO. B-107
PROJECT: Jersey Walk Site WATER LEVEL (ft): N/E N/A N/A
PROJECT NO.: 31160009 DATE: 12/7/16 12/7/16 12/7/16
PROJECT LOCATION: City of Elizabeth, New Jersey CAVED (ft): In Augers N/A BOC
DATE STARTED: 12/7/16 GROUND SURFACE ELEVATION: 22.5 Ft.DATE COMPLETED: 12/7/16 DATUM: TOPO
DRILLING CONTRACTOR: Allied Well Drilling EQUIPMENT: CME 45DRILLER: Harry Tathum HAMMER TYPE: Automatic
DRILLING METHOD: HSA LOGGED BY: SKSAMPLING METHOD: SPT CHECKED BY: DAG
NOTES:Elevation and location are approximate.BOC: Backfilled On Completion.
LOG OF BORING NO. B-107
SA
MP
LE
NU
MB
ER
SA
MP
LE
DE
PT
H (
ft.)
SA
MP
LE
RE
CO
VE
RY
(in
.)
SA
MP
LE
BL
OW
S/6
in
ch
es
N (
blo
ws/f
t.)
EL
EV
AT
ION
(ft
.)
DE
PT
H (
ft.)
US
CS
GR
AP
HIC
SY
MB
OL
DESCRIPTION REMARKS
Sheet 1 of 1
Sheet 1 of 1
DRAFT

0
5
10
15
20
25
30
S-1 0.0 8 4-4-6-50/4 10
21.0
19.5
Crushed concrete
Boring complete at 1-1/2 Ft. due to auger refusal onconcrete. Boring moved to B-108A location. See log forB-108A.
LOG OF BORING NO. B-108
PROJECT: Jersey Walk Site WATER LEVEL (ft): N/E N/A N/A
PROJECT NO.: 31160009 DATE: 12/5/16 12/5/16 12/5/16
PROJECT LOCATION: City of Elizabeth, New Jersey CAVED (ft): In Augers N/A BOC
DATE STARTED: 12/5/16 GROUND SURFACE ELEVATION: 21 Ft.DATE COMPLETED: 12/5/16 DATUM: TOPO
DRILLING CONTRACTOR: Allied Well Drilling EQUIPMENT: CME 45DRILLER: Harry Tathum HAMMER TYPE: Automatic
DRILLING METHOD: HSA LOGGED BY: SKSAMPLING METHOD: SPT CHECKED BY: DAG
NOTES:Elevation and location are approximate.BOC: Backfilled On Completion.
LOG OF BORING NO. B-108
SA
MP
LE
NU
MB
ER
SA
MP
LE
DE
PT
H (
ft.)
SA
MP
LE
RE
CO
VE
RY
(in
.)
SA
MP
LE
BL
OW
S/6
in
ch
es
N (
blo
ws/f
t.)
EL
EV
AT
ION
(ft
.)
DE
PT
H (
ft.)
US
CS
GR
AP
HIC
SY
MB
OL
DESCRIPTION REMARKS
Sheet 1 of 1
Sheet 1 of 1
DRAFT

0
5
10
15
20
25
30
S-1
S-2
S-3
S-4
S-5
S-6
S-7
0.0
2.0
4.0
6.0
10.0
12.0
14.0
5
15
17
16
20
15
24
2-2-2
3-3-3-4
4-5-7-7
5-5-7-8
6-9-12-12
4-5-8-12
10-12-12-8
4
6
12
12
21
13
24
21.020.5
7.0
5.0
CL
SM
6 In. of concreteRed-brown, wet, soft to very stiff, Lean CLAY (possiblefill)
- Moist at 8 Ft.
Brown, wet, medium dense, Silty SAND
Boring complete at 16 Ft
- Heavy rain on12/6/16.
- Shelby tubesample at 8 Ft.Recovery = 21 In.NMC = 6.8%
LOG OF BORING NO. B-108A
PROJECT: Jersey Walk Site WATER LEVEL (ft): N/E N/A N/A
PROJECT NO.: 31160009 DATE: 12/7/16 12/7/16 12/7/16
PROJECT LOCATION: City of Elizabeth, New Jersey CAVED (ft): In Augers N/A BOC
DATE STARTED: 12/7/16 GROUND SURFACE ELEVATION: 21 Ft.DATE COMPLETED: 12/7/16 DATUM: TOPO
DRILLING CONTRACTOR: Allied Well Drilling EQUIPMENT: CME 45DRILLER: Harry Tathum HAMMER TYPE: Automatic
DRILLING METHOD: HSA LOGGED BY: SKSAMPLING METHOD: SPT CHECKED BY: DAG
NOTES:Elevation and location are approximate.BOC: Backfilled On Completion.
LOG OF BORING NO. B-108A
SA
MP
LE
NU
MB
ER
SA
MP
LE
DE
PT
H (
ft.)
SA
MP
LE
RE
CO
VE
RY
(in
.)
SA
MP
LE
BL
OW
S/6
in
ch
es
N (
blo
ws/f
t.)
EL
EV
AT
ION
(ft
.)
DE
PT
H (
ft.)
US
CS
GR
AP
HIC
SY
MB
OL
DESCRIPTION REMARKS
Sheet 1 of 1
Sheet 1 of 1
DRAFT
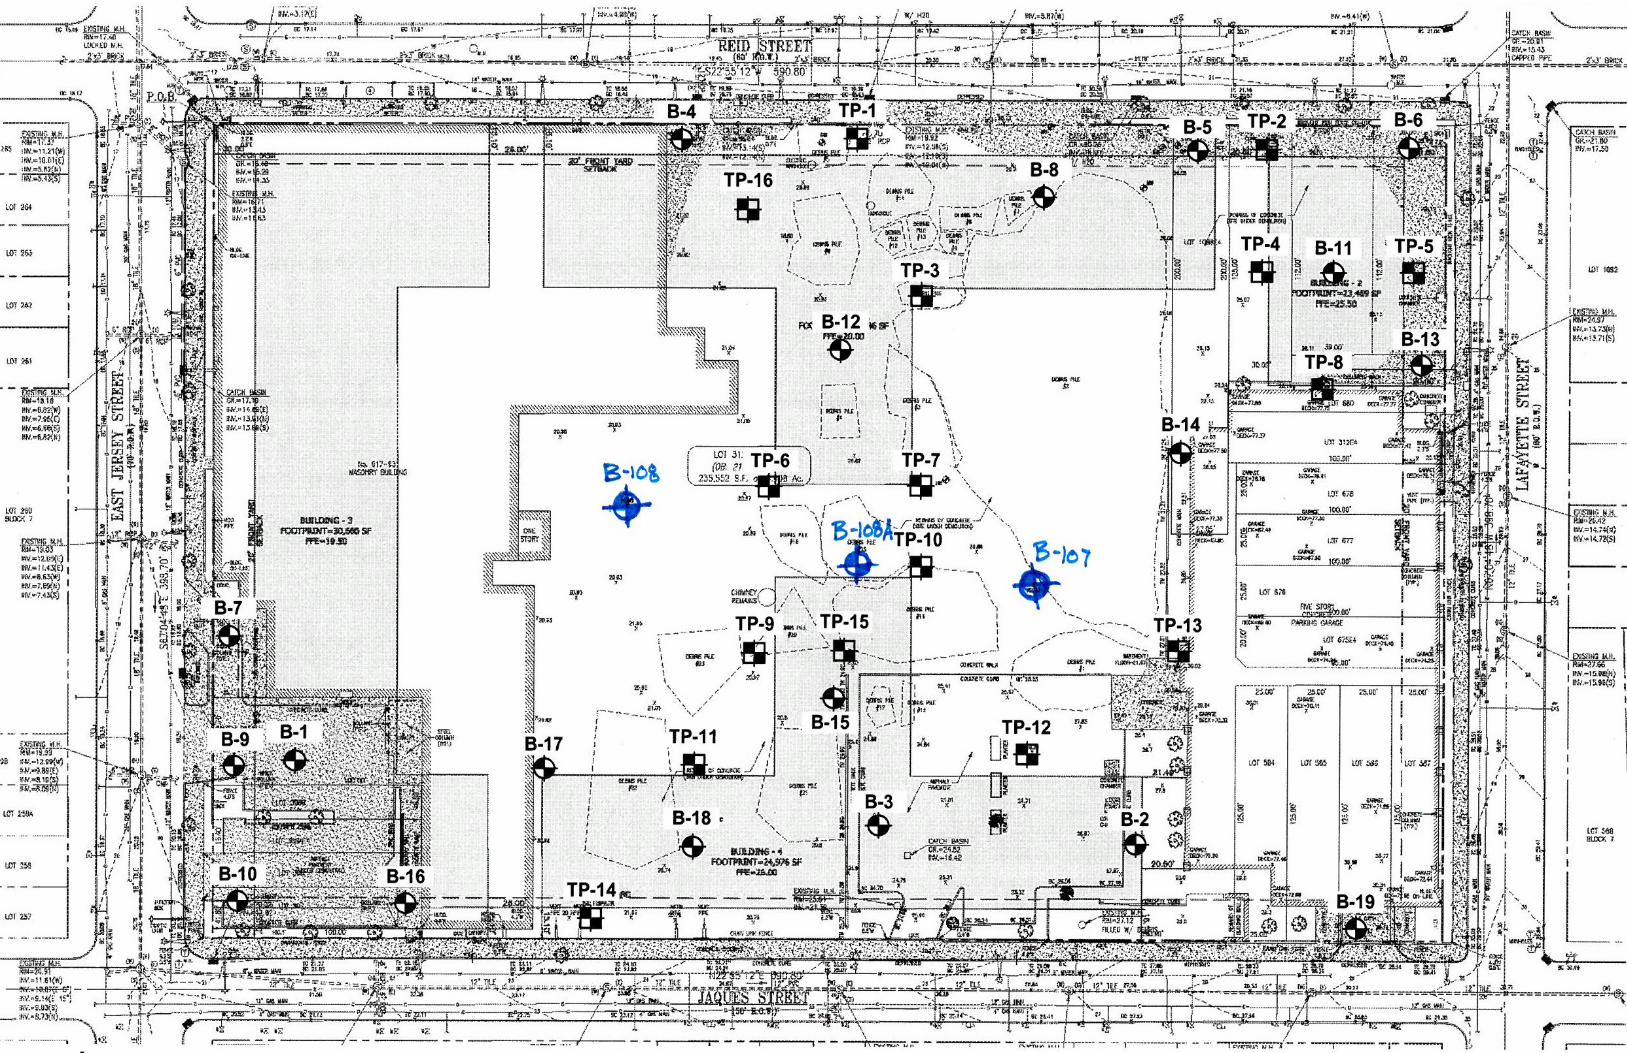

Pipe Calculations
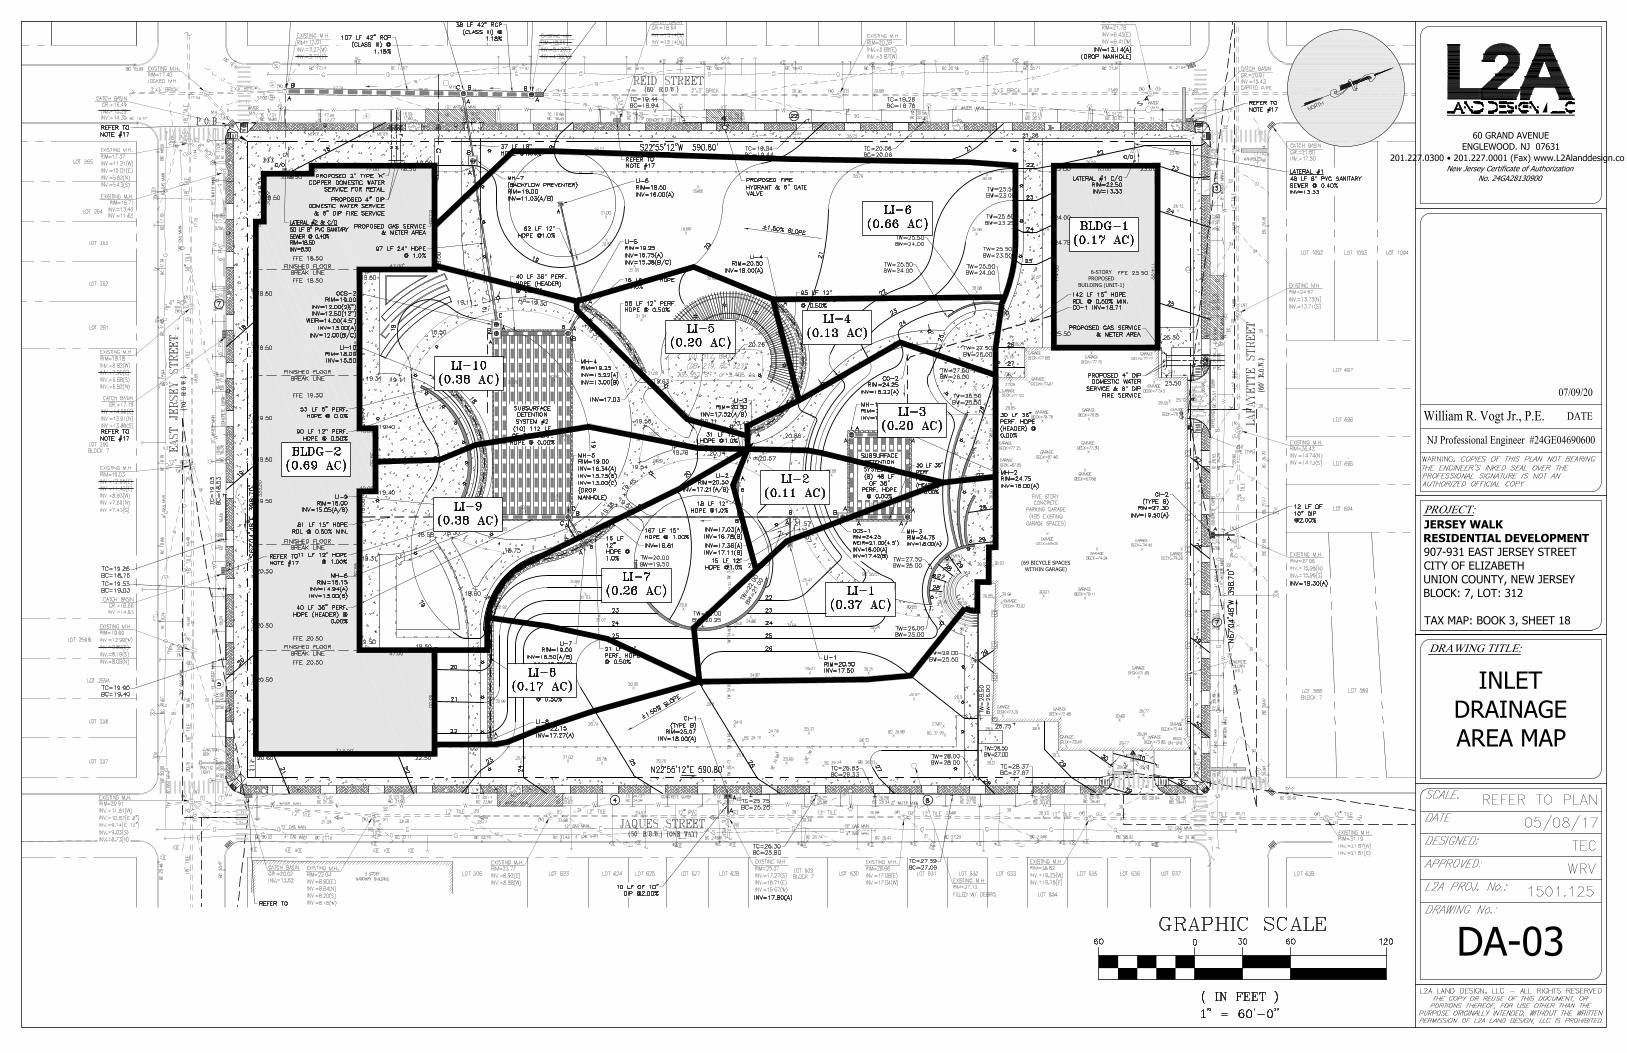
6-STORY
PROPOSED
BUILDING (UNIT-2)
6-STORY
PROPOSED
BUILDING (UNIT-1)
(69 BICYCLE SPACES
WITHIN GARAGE)
PROJECT:
DRAWING TITLE:
60 GRAND AVENUE
ENGLEWOOD. NJ 07631
201.227.0300 • 201.227.0001 (Fax) www.L2Alanddesign.com
New Jersey Certificate of Authorization
No. 24GA28130900
NJ Professional Engineer #24GE04690600
William R. Vogt Jr., P.E. DATE
JERSEY WALK
RESIDENTIAL DEVELOPMENT
907-931 EAST JERSEY STREET
CITY OF ELIZABETH
UNION COUNTY, NEW JERSEY
BLOCK: 7, LOT: 312
TAX MAP: BOOK 3, SHEET 18
07/09/20
INLET
DRAINAGE
AREA MAP
DA-03
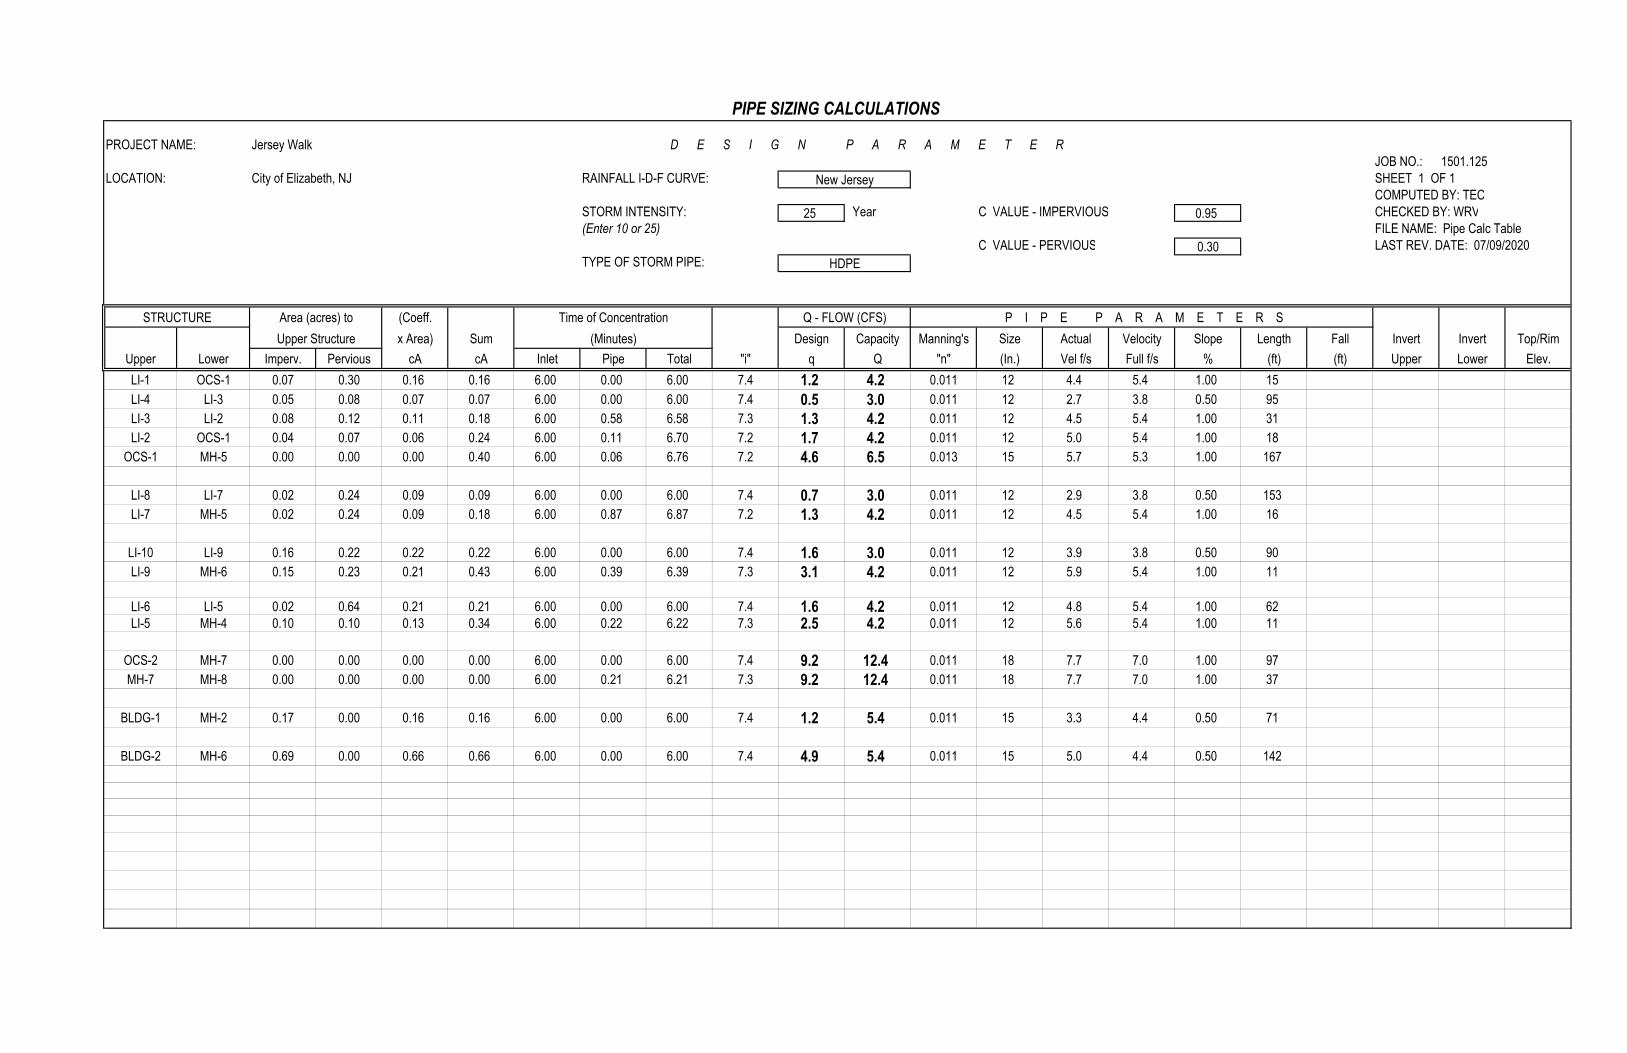
PIPE SIZING CALCULATIONS
PROJECT NAME: Jersey Walk D E S I G N P A R A M E T E R JOB NO.: 1501.125
LOCATION: City of Elizabeth, NJ RAINFALL I-D-F CURVE: New Jersey SHEET 1 OF 1 COMPUTED BY: TEC
STORM INTENSITY: 25 Year C VALUE - IMPERVIOUS 0.95 CHECKED BY: WRV(Enter 10 or 25) FILE NAME: Pipe Calc Table
C VALUE - PERVIOUS 0.30 LAST REV. DATE: 07/09/2020TYPE OF STORM PIPE: HDPE
STRUCTURE Area (acres) to (Coeff. Time of Concentration Q - FLOW (CFS) P I P E P A R A M E T E R SUpper Structure x Area) Sum (Minutes) Design Capacity Manning's Size Actual Velocity Slope Length Fall Invert Invert Top/Rim
Upper Lower Imperv. Pervious cA cA Inlet Pipe Total "i" q Q "n" (In.) Vel f/s Full f/s % (ft) (ft) Upper Lower Elev.LI-1 OCS-1 0.07 0.30 0.16 0.16 6.00 0.00 6.00 7.4 1.2 4.2 0.011 12 4.4 5.4 1.00 15LI-4 LI-3 0.05 0.08 0.07 0.07 6.00 0.00 6.00 7.4 0.5 3.0 0.011 12 2.7 3.8 0.50 95LI-3 LI-2 0.08 0.12 0.11 0.18 6.00 0.58 6.58 7.3 1.3 4.2 0.011 12 4.5 5.4 1.00 31LI-2 OCS-1 0.04 0.07 0.06 0.24 6.00 0.11 6.70 7.2 1.7 4.2 0.011 12 5.0 5.4 1.00 18
OCS-1 MH-5 0.00 0.00 0.00 0.40 6.00 0.06 6.76 7.2 4.6 6.5 0.013 15 5.7 5.3 1.00 167
LI-8 LI-7 0.02 0.24 0.09 0.09 6.00 0.00 6.00 7.4 0.7 3.0 0.011 12 2.9 3.8 0.50 153LI-7 MH-5 0.02 0.24 0.09 0.18 6.00 0.87 6.87 7.2 1.3 4.2 0.011 12 4.5 5.4 1.00 16
LI-10 LI-9 0.16 0.22 0.22 0.22 6.00 0.00 6.00 7.4 1.6 3.0 0.011 12 3.9 3.8 0.50 90LI-9 MH-6 0.15 0.23 0.21 0.43 6.00 0.39 6.39 7.3 3.1 4.2 0.011 12 5.9 5.4 1.00 11
LI-6 LI-5 0.02 0.64 0.21 0.21 6.00 0.00 6.00 7.4 1.6 4.2 0.011 12 4.8 5.4 1.00 62LI-5 MH-4 0.10 0.10 0.13 0.34 6.00 0.22 6.22 7.3 2.5 4.2 0.011 12 5.6 5.4 1.00 11
OCS-2 MH-7 0.00 0.00 0.00 0.00 6.00 0.00 6.00 7.4 9.2 12.4 0.011 18 7.7 7.0 1.00 97MH-7 MH-8 0.00 0.00 0.00 0.00 6.00 0.21 6.21 7.3 9.2 12.4 0.011 18 7.7 7.0 1.00 37
BLDG-1 MH-2 0.17 0.00 0.16 0.16 6.00 0.00 6.00 7.4 1.2 5.4 0.011 15 3.3 4.4 0.50 71
BLDG-2 MH-6 0.69 0.00 0.66 0.66 6.00 0.00 6.00 7.4 4.9 5.4 0.011 15 5.0 4.4 0.50 142


