Embed Size (px)
Citation preview

2020 Annual Report
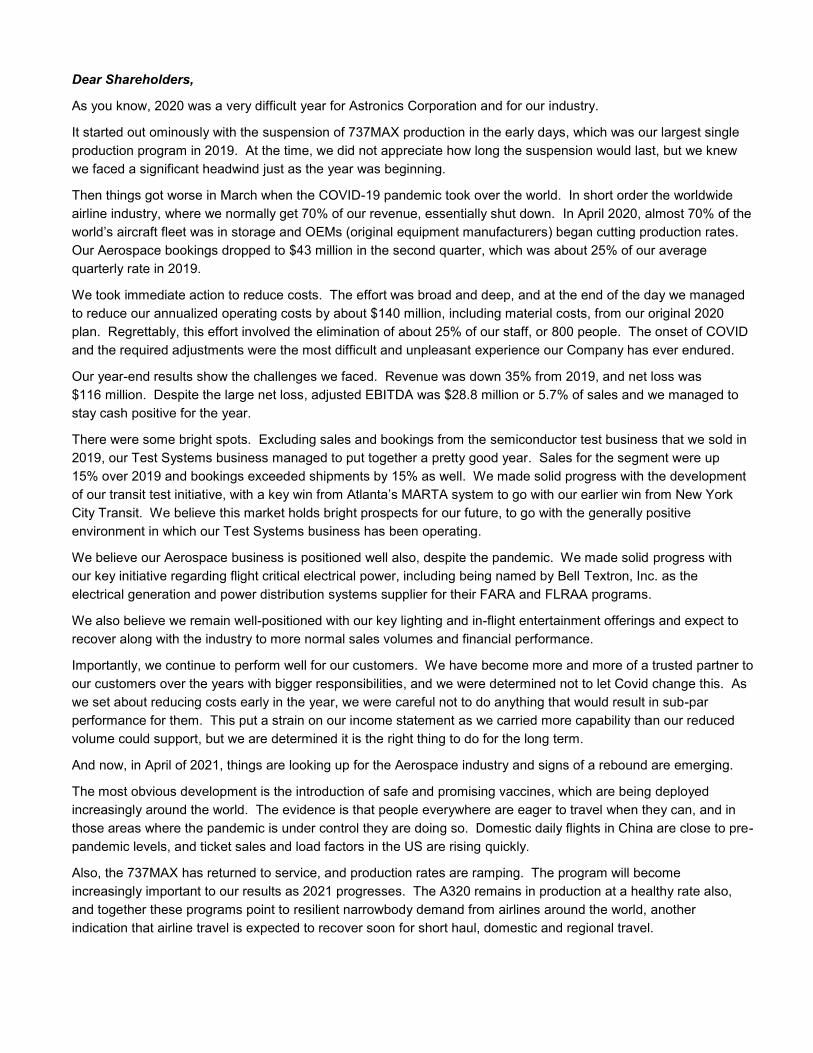
We work side-by-side with customers, integrating our array of power, connectivity, lighting, structures, interiors and test technologies to solve complex challenges.
For over 50 years, we have delivered creative, customer-focused solutions with exceptional responsiveness. Today, global airframe manufacturers, airlines, military branches, completion centers
and Fortune 500 companies rely on our collaborative spirit and innovation to deliver leading technology and solutions.
Astronics serves the world’s aerospace, defense, and other mission critical industries with proven,
innovative technology solutions. Our strategy is to grow value by developing
technologies, organically or through acquisition, for our targeted markets.
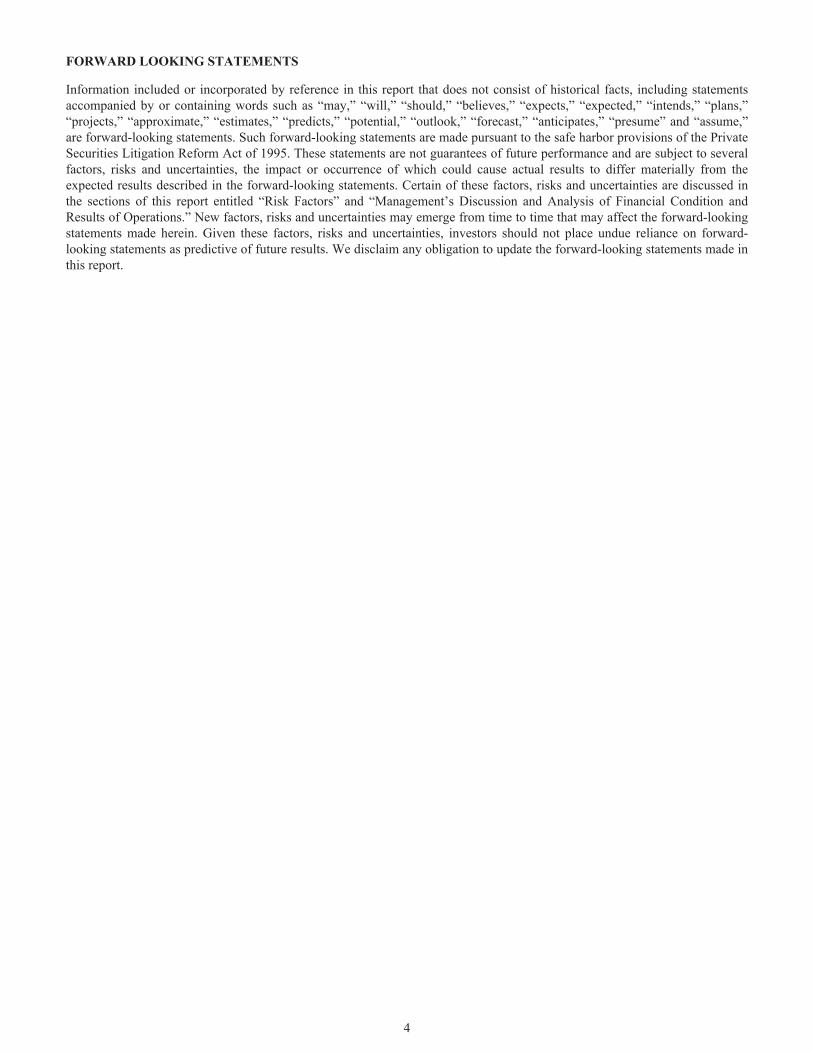
Aerospace
Test Systems
Commercial Aerospace
General Aviation
Defense & Government
83%
17%
2020 Sales: $502.6 million
52%
12%
30%
6%Other
Dear Shareholders,
As you know, 2020 was a very difficult year for Astronics Corporation and for our industry.
It started out ominously with the suspension of 737MAX production in the early days, which was our largest single production program in 2019. At the time, we did not appreciate how long the suspension would last, but we knew we faced a significant headwind just as the year was beginning.
Then things got worse in March when the COVID-19 pandemic took over the world. In short order the worldwide airline industry, where we normally get 70% of our revenue, essentially shut down. In April 2020, almost 70% of the world’s aircraft fleet was in storage and OEMs (original equipment manufacturers) began cutting production rates. Our Aerospace bookings dropped to $43 million in the second quarter, which was about 25% of our average quarterly rate in 2019.
We took immediate action to reduce costs. The effort was broad and deep, and at the end of the day we managed to reduce our annualized operating costs by about $140 million, including material costs, from our original 2020 plan. Regrettably, this effort involved the elimination of about 25% of our staff, or 800 people. The onset of COVID and the required adjustments were the most difficult and unpleasant experience our Company has ever endured.
Our year-end results show the challenges we faced. Revenue was down 35% from 2019, and net loss was $116 million. Despite the large net loss, adjusted EBITDA was $28.8 million or 5.7% of sales and we managed to stay cash positive for the year.
There were some bright spots. Excluding sales and bookings from the semiconductor test business that we sold in 2019, our Test Systems business managed to put together a pretty good year. Sales for the segment were up 15% over 2019 and bookings exceeded shipments by 15% as well. We made solid progress with the development of our transit test initiative, with a key win from Atlanta’s MARTA system to go with our earlier win from New York City Transit. We believe this market holds bright prospects for our future, to go with the generally positive environment in which our Test Systems business has been operating.
We believe our Aerospace business is positioned well also, despite the pandemic. We made solid progress with our key initiative regarding flight critical electrical power, including being named by Bell Textron, Inc. as the electrical generation and power distribution systems supplier for their FARA and FLRAA programs.
We also believe we remain well-positioned with our key lighting and in-flight entertainment offerings and expect to recover along with the industry to more normal sales volumes and financial performance.
Importantly, we continue to perform well for our customers. We have become more and more of a trusted partner to our customers over the years with bigger responsibilities, and we were determined not to let Covid change this. As we set about reducing costs early in the year, we were careful not to do anything that would result in sub-par performance for them. This put a strain on our income statement as we carried more capability than our reduced volume could support, but we are determined it is the right thing to do for the long term.
And now, in April of 2021, things are looking up for the Aerospace industry and signs of a rebound are emerging.
The most obvious development is the introduction of safe and promising vaccines, which are being deployed increasingly around the world. The evidence is that people everywhere are eager to travel when they can, and in those areas where the pandemic is under control they are doing so. Domestic daily flights in China are close to pre-pandemic levels, and ticket sales and load factors in the US are rising quickly.
Also, the 737MAX has returned to service, and production rates are ramping. The program will become increasingly important to our results as 2021 progresses. The A320 remains in production at a healthy rate also, and together these programs point to resilient narrowbody demand from airlines around the world, another indication that airline travel is expected to recover soon for short haul, domestic and regional travel.
International travel remains a watch item and is expected to recover more slowly than domestic travel. This means that widebody production rates and aftermarket activity are expected to remain under pressure for some time. Widebody airplanes are important to us, and our hope is that countries that have the pandemic under control establish travel corridors between themselves, allowing international travel between priority destinations without burdensome quarantine restrictions.
We are optimistic for 2021 and hope for a steady recovery, but also recognize that the pandemic has proven to be formidable, and it may not recede quietly. We will continue to watch conditions closely and adjust accordingly. We believe we can remain cash positive and as our revenue recovers, so will our income statement. We remain confident that our product portfolio is strong and desired by our customers, who continue to trust us with ever greater responsibilities.
Finally, I would like to thank the Astronics team for their considerable efforts during this trying time. I have long been impressed by the enthusiasm and capabilities that characterize our team, but never more than now. They have demonstrated an impressive combination of flexibility, determination, and resilience through these crazy times, and because of them I am very confident we will prevail.
Thank you for your interest in Astronics Corporation. We are glad to be finished with 2020, and we are increasingly hopeful about 2021 and beyond.
Sincerely, Peter J. Gundermann Chairman, President and CEO April 12, 2021
Reconciliation to Non-GAAP Performance Measures
In addition to reporting net income, a U.S. generally accepted accounting principle (“GAAP”) measure, we present Adjusted EBITDA (earnings before interest, income taxes, depreciation and amortization, non-cash equity-based compensation expense, goodwill, intangible and long-lived asset impairment charges, equity investment income or loss, legal reserves, settlements and recoveries, restructuring charges and gains or losses associated with the sale of businesses), which is a non-GAAP measure. The Company’s management believes Adjusted EBITDA is an important measure of operating performance because it allows management, investors and others to evaluate and compare the performance of its core operations from period to period by removing the impact of the capital structure (interest), tangible and intangible asset base (depreciation and amortization), taxes, equity-based compensation expense, goodwill, intangible and long-lived asset impairment charges, equity investment income or loss, legal reserves, settlements and recoveries, restructuring charges and gains or losses associated with the sale of businesses, which is not commensurate with the core activities of the reporting period in which it is included. As such, the Company uses Adjusted EBITDA as a measure of performance when evaluating its business and as a basis for planning and forecasting. Adjusted EBITDA is not a measure of financial performance under GAAP and is not calculated through the application of GAAP. As such, it should not be considered as a substitute for the GAAP measure of net income and, therefore, should not be used in isolation of, but in conjunction with, the GAAP measure. Adjusted EBITDA, as presented, may produce results that vary from the GAAP measure and may not be comparable to a similarly defined non-GAAP measure used by other companies.
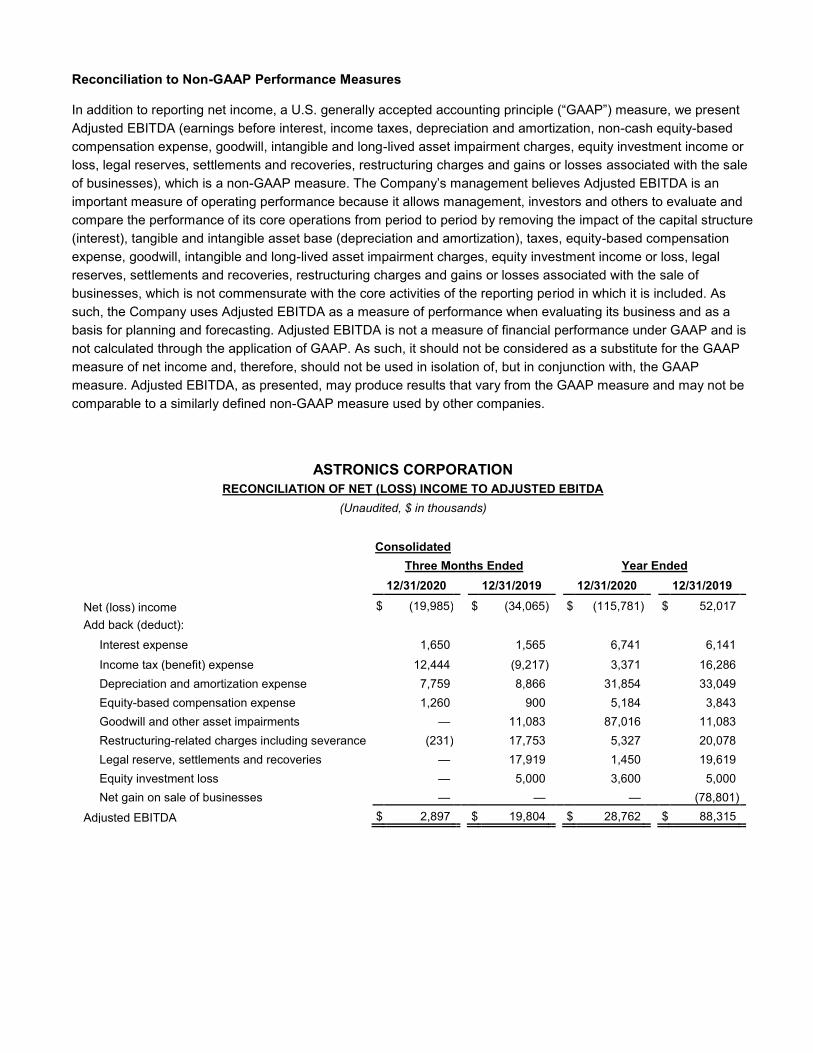
ASTRONICS CORPORATION RECONCILIATION OF NET (LOSS) INCOME TO ADJUSTED EBITDA
(Unaudited, $ in thousands)
Consolidated
Three Months Ended Year Ended
12/31/2020 12/31/2019 12/31/2020 12/31/2019
Net (loss) income $ (19,985) $ (34,065) $ (115,781) $ 52,017 Add back (deduct):
Interest expense 1,650 1,565 6,741 6,141 Income tax (benefit) expense 12,444 (9,217) 3,371 16,286 Depreciation and amortization expense 7,759 8,866 31,854 33,049 Equity-based compensation expense 1,260 900 5,184 3,843 Goodwill and other asset impairments — 11,083 87,016 11,083 Restructuring-related charges including severance (231) 17,753 5,327 20,078 Legal reserve, settlements and recoveries — 17,919 1,450 19,619 Equity investment loss — 5,000 3,600 5,000 Net gain on sale of businesses — — — (78,801)
Adjusted EBITDA $ 2,897 $ 19,804 $ 28,762 $ 88,315
FIVE-YEAR PERFORMANCE HIGHLIGHT
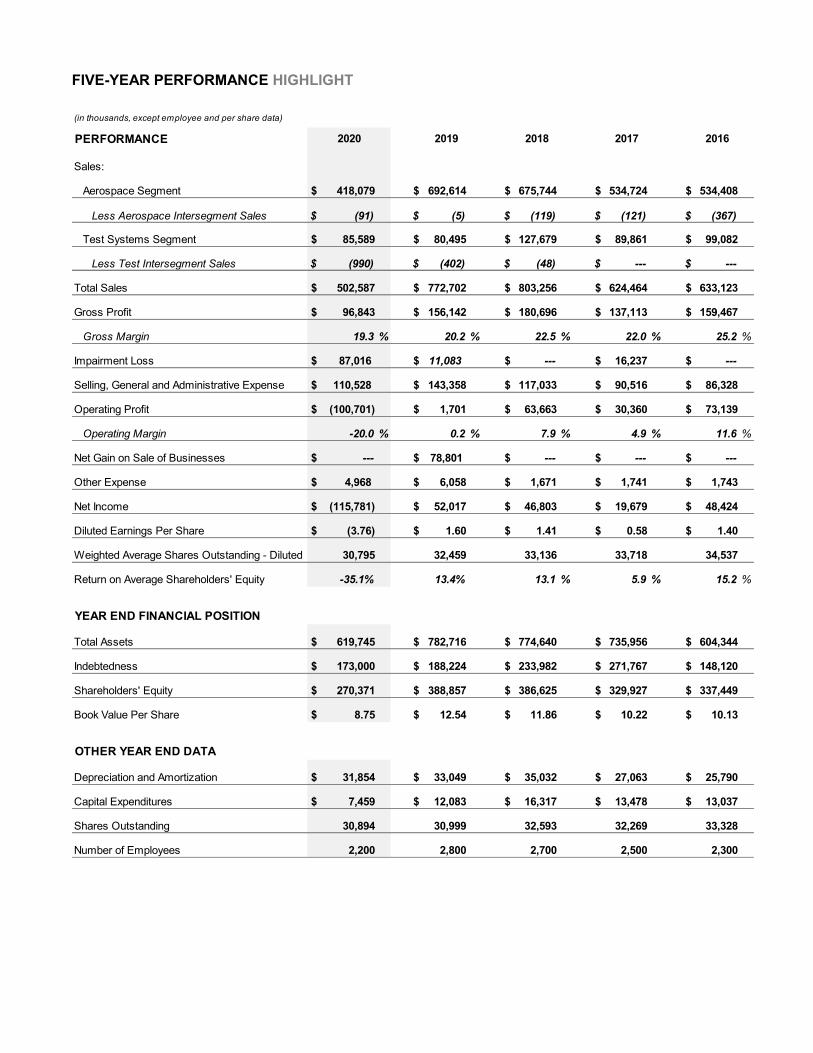
FIVE-YEAR PERFORMANCE HIGHLIGHTS
(in thousands, except employee and per share data)
PERFORMANCE 2017 2016
Sales:
Aerospace Segment $ 418,079 $ 692,614 $ 675,744 $ 534,724 $ 534,408
Less Aerospace Intersegment Sales $ (91) $ (5) $ (119) $ (121) $ (367)
Test Systems Segment $ 85,589 $ 80,495 $ 127,679 $ 89,861 $ 99,082
Less Test Intersegment Sales $ (990) $ (402) $ (48) $ --- $ ---
Total Sales $ 502,587 $ 772,702 $ 803,256 $ 624,464 $ 633,123
Gross Profit $ 96,843 $ 156,142 $ 180,696 $ 137,113 $ 159,467
Gross Margin 19.3 % 20.2 % 22.5 % 22.0 % 25.2 %
Impairment Loss $ 87,016 $ 11,083 $ --- $ 16,237 $ ---
Selling, General and Administrative Expense $ 110,528 $ 143,358 $ 117,033 $ 90,516 $ 86,328
Operating Profit $ (100,701) $ 1,701 $ 63,663 $ 30,360 $ 73,139
Operating Margin -20.0 % 0.2 % 7.9 % 4.9 % 11.6 %
Net Gain on Sale of Businesses $ --- $ 78,801 $ --- $ --- $ ---
Other Expense $ 4,968 $ 6,058 $ 1,671 $ 1,741 $ 1,743
Net Income $ (115,781) $ 52,017 $ 46,803 $ 19,679 $ 48,424
Diluted Earnings Per Share $ (3.76) $ 1.60 $ 1.41 $ 0.58 $ 1.40
Weighted Average Shares Outstanding - Diluted 30,795 32,459 33,136 33,718 34,537
Return on Average Shareholders' Equity -35.1% 13.4% 13.1 % 5.9 % 15.2 %
YEAR END FINANCIAL POSITION
Total Assets $ 619,745 $ 782,716 $ 774,640 $ 735,956 $ 604,344
Indebtedness $ 173,000 $ 188,224 $ 233,982 $ 271,767 $ 148,120
Shareholders' Equity $ 270,371 $ 388,857 $ 386,625 $ 329,927 $ 337,449
Book Value Per Share $ 8.75 $ 12.54 $ 11.86 $ 10.22 $ 10.13
OTHER YEAR END DATA
Depreciation and Amortization $ 31,854 $ 33,049 $ 35,032 $ 27,063 $ 25,790
Capital Expenditures $ 7,459 $ 12,083 $ 16,317 $ 13,478 $ 13,037
Shares Outstanding 30,894 30,999 32,593 32,269 33,328
Number of Employees 2,200 2,800 2,700 2,500 2,300
2020 2019 2018
FIVE-YEAR PERFORMANCE HIGHLIGHT
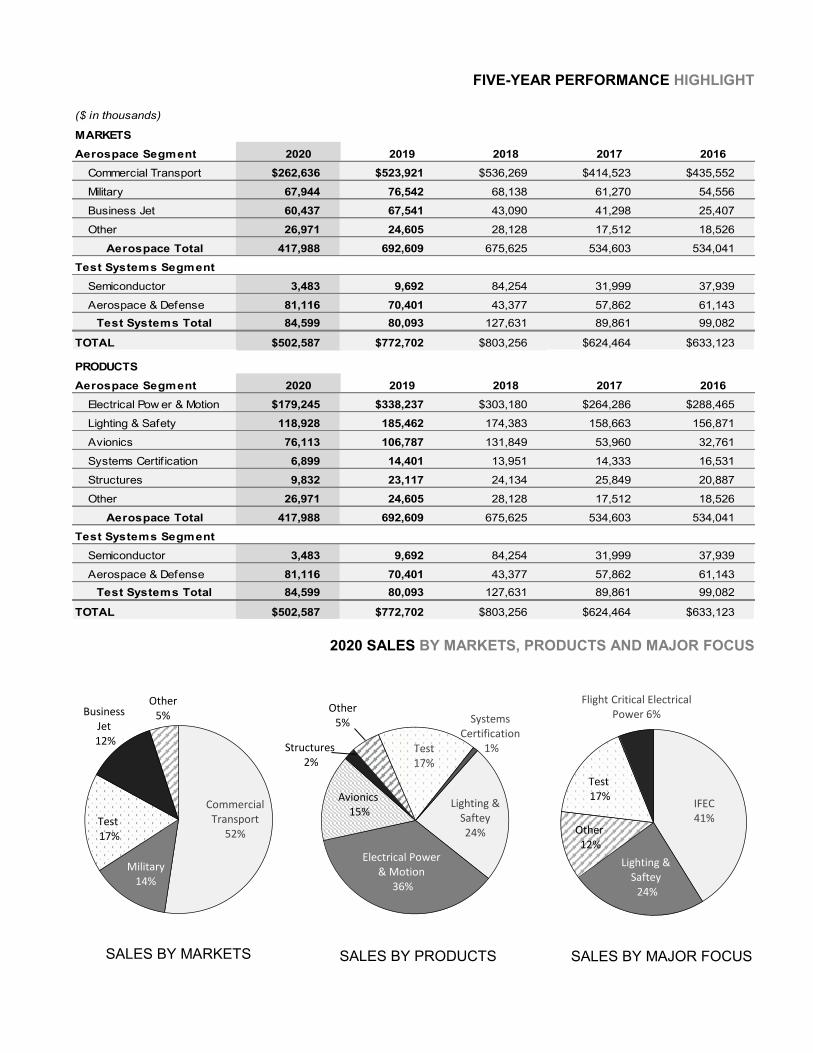
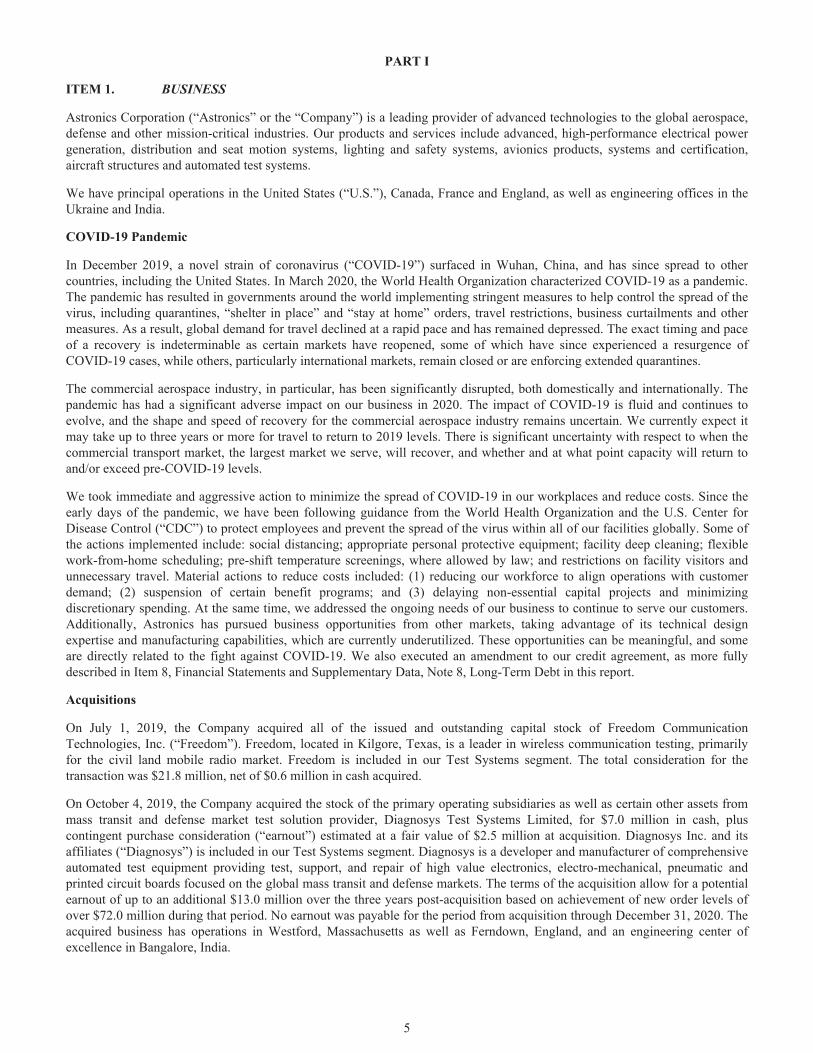
2020 SALES BY MARKETS, PRODUCTS AND MAJOR FOCUS
($ in thousands)
MARKETSAerospace Segment 2020 2019 2018 2017 2016
Commercial Transport $262,636 $523,921 $536,269 $414,523 $435,552
Military 67,944 76,542 68,138 61,270 54,556
Business Jet 60,437 67,541 43,090 41,298 25,407
Other 26,971 24,605 28,128 17,512 18,526
Aerospace Total 417,988 692,609 675,625 534,603 534,041
Test Systems SegmentSemiconductor 3,483 9,692 84,254 31,999 37,939
Aerospace & Defense 81,116 70,401 43,377 57,862 61,143Test Systems Total 84,599 80,093 127,631 89,861 99,082
TOTAL $502,587 $772,702 $803,256 $624,464 $633,123
PRODUCTSAerospace Segment 2020 2019 2018 2017 2016
Electrical Pow er & Motion $179,245 $338,237 $303,180 $264,286 $288,465
Lighting & Safety 118,928 185,462 174,383 158,663 156,871
Avionics 76,113 106,787 131,849 53,960 32,761
Systems Certif ication 6,899 14,401 13,951 14,333 16,531
Structures 9,832 23,117 24,134 25,849 20,887
Other 26,971 24,605 28,128 17,512 18,526
Aerospace Total 417,988 692,609 675,625 534,603 534,041
Test Systems SegmentSemiconductor 3,483 9,692 84,254 31,999 37,939
Aerospace & Defense 81,116 70,401 43,377 57,862 61,143Test Systems Total 84,599 80,093 127,631 89,861 99,082
TOTAL $502,587 $772,702 $803,256 $624,464 $633,123
SALES BY MARKETS SALES BY PRODUCTS SALES BY MAJOR FOCUS
Commercial Transport
52%
Military14%
Test17%
Business Jet12%
Other5%
Lighting & Saftey24%
Electrical Power & Motion
36%
Avionics15%
Structures2%
Other5%
Test17%
Systems Certification
1%
IFEC41%
Lighting & Saftey
24%
Other12%
Test17%
Flight Critical Electrical Power 6%

2020 Form 10-K
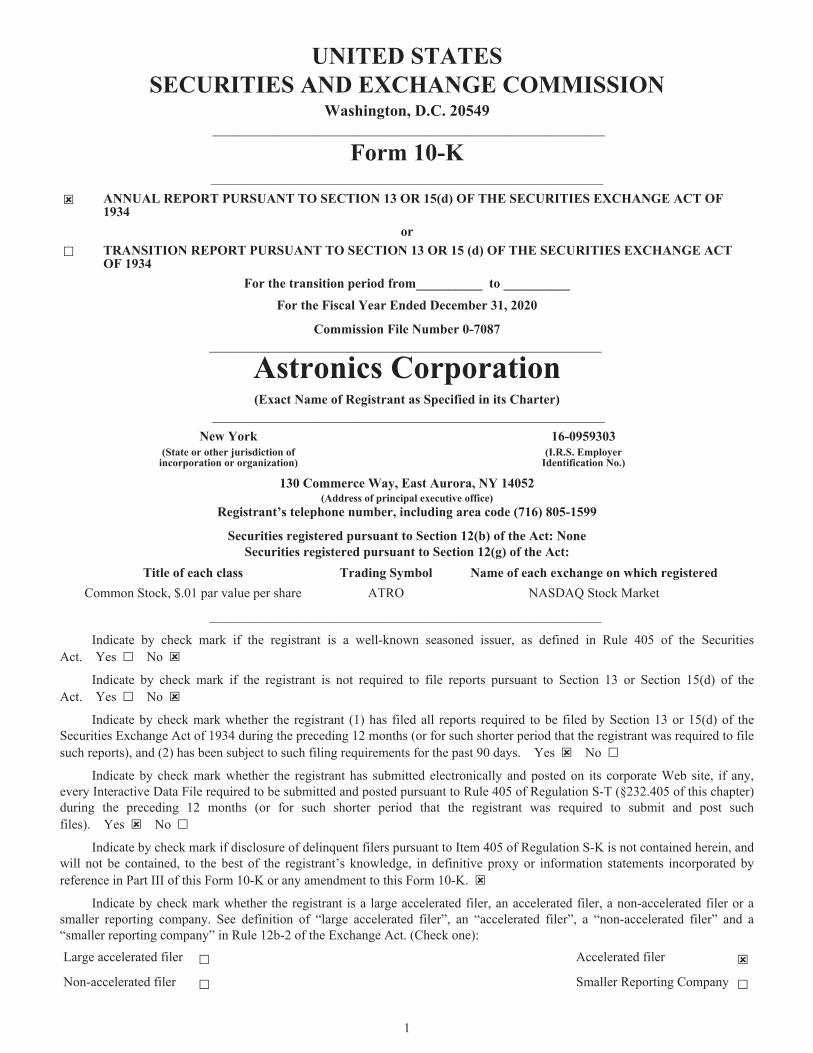
UNITED STATESSECURITIES AND EXCHANGE COMMISSION
Washington, D.C. 20549 ___________________________________________________________
Form 10-K___________________________________________________________
☒ ANNUAL REPORT PURSUANT TO SECTION 13 OR 15(d) OF THE SECURITIES EXCHANGE ACT OF 1934
or☐ TRANSITION REPORT PURSUANT TO SECTION 13 OR 15 (d) OF THE SECURITIES EXCHANGE ACT
OF 1934For the transition period from__________ to __________
For the Fiscal Year Ended December 31, 2020
Commission File Number 0-7087___________________________________________________________
Astronics Corporation(Exact Name of Registrant as Specified in its Charter)
___________________________________________________________New York 16-0959303
(State or other jurisdiction ofincorporation or organization)
(I.R.S. EmployerIdentification No.)
130 Commerce Way, East Aurora, NY 14052(Address of principal executive office)
Registrant’s telephone number, including area code (716) 805-1599
Securities registered pursuant to Section 12(b) of the Act: NoneSecurities registered pursuant to Section 12(g) of the Act:
Title of each class Trading Symbol Name of each exchange on which registeredCommon Stock, $.01 par value per share ATRO NASDAQ Stock Market
___________________________________________________________
Indicate by check mark if the registrant is a well-known seasoned issuer, as defined in Rule 405 of the Securities Act. Yes ☐ No ☒
Indicate by check mark if the registrant is not required to file reports pursuant to Section 13 or Section 15(d) of the Act. Yes ☐ No ☒
Indicate by check mark whether the registrant (1) has filed all reports required to be filed by Section 13 or 15(d) of the Securities Exchange Act of 1934 during the preceding 12 months (or for such shorter period that the registrant was required to file such reports), and (2) has been subject to such filing requirements for the past 90 days. Yes ☒ No ☐
Indicate by check mark whether the registrant has submitted electronically and posted on its corporate Web site, if any, every Interactive Data File required to be submitted and posted pursuant to Rule 405 of Regulation S-T (§232.405 of this chapter) during the preceding 12 months (or for such shorter period that the registrant was required to submit and post such files). Yes ☒ No ☐
Indicate by check mark if disclosure of delinquent filers pursuant to Item 405 of Regulation S-K is not contained herein, and will not be contained, to the best of the registrant’s knowledge, in definitive proxy or information statements incorporated by reference in Part III of this Form 10-K or any amendment to this Form 10-K. ☒
Indicate by check mark whether the registrant is a large accelerated filer, an accelerated filer, a non-accelerated filer or a smaller reporting company. See definition of “large accelerated filer”, an “accelerated filer”, a “non-accelerated filer” and a “smaller reporting company” in Rule 12b-2 of the Exchange Act. (Check one):
Large accelerated filer ☐ Accelerated filer ☒Non-accelerated filer ☐ Smaller Reporting Company ☐
1
Indicate by check mark whether the registrant has filed a report on and attestation to its management’s assessment of the effectiveness of its internal control over financial reporting under Section 404(b) of the Sarbanes-Oxley Act (15 U.S.C. 7262(b)) by the registered public accounting firm that prepared or issued its audit report. ☒
Indicate by check mark whether the registrant is a shell company (as defined in Rule 12b-2 of the Act). Yes ☐ No ☒
As of February 18, 2021, 30,894,143 shares were outstanding, consisting of 24,033,041 shares of Common Stock $.01 par value and 6,861,102 shares of Class B Stock $.01 par value. The aggregate market value, as of the last business day of the Company’s most recently completed second fiscal quarter, of the shares of Common Stock and Class B Stock of Astronics Corporation held by non-affiliates was approximately $266,000,000 (assuming conversion of all of the outstanding Class B Stock into Common Stock and assuming the affiliates of the Registrant to be its directors, executive officers and persons known to the Registrant to beneficially own more than 10% of the outstanding capital stock of the Corporation).
DOCUMENTS INCORPORATED BY REFERENCE
Portions of the Company’s Proxy Statement for the 2021 Annual Meeting of Shareholders to be held May 25, 2021 are incorporated by reference into Part III of this Report.
2
Table of Contents
ASTRONICS CORPORATIONIndex to Annual Report
on Form 10-K
Year Ended December 31, 2020 Page
PART IItem 1. Business 5Item 1A. Risk Factors 9Item 1B. Unresolved Staff Comments 16Item 2. Properties 16Item 3. Legal Proceedings 16Item 4. Mine Safety Disclosures 16
PART IIItem 5. Market for Registrant’s Common Equity, Related Stockholder Matters and Issuer Purchases of
Equity Securities 17Item 6. Selected Financial Data 19Item 7. Management’s Discussion and Analysis of Financial Condition and Results of Operations 20Item 7A. Quantitative and Qualitative Disclosures About Market Risk 32Item 8. Financial Statements and Supplementary Data 33Item 9. Changes In and Disagreements with Accountants on Accounting and Financial Disclosure 77Item 9A. Controls and Procedures 77Item 9B. Other Information 77
PART IIIItem 10. Directors, Executive Officers and Governance 78Item 11. Executive Compensation 78Item 12. Security Ownership of Certain Beneficial Owners and Management and Related Stockholder Matters 78Item 13. Certain Relationships and Related Transactions and Director Independence 78Item 14. Principal Accountant Fees and Services 79
PART IVItem 15. Exhibits and Financial Statement Schedules 80Item 16. Form 10-K Summary 84
3
FORWARD LOOKING STATEMENTS
Information included or incorporated by reference in this report that does not consist of historical facts, including statements accompanied by or containing words such as “may,” “will,” “should,” “believes,” “expects,” “expected,” “intends,” “plans,” “projects,” “approximate,” “estimates,” “predicts,” “potential,” “outlook,” “forecast,” “anticipates,” “presume” and “assume,” are forward-looking statements. Such forward-looking statements are made pursuant to the safe harbor provisions of the Private Securities Litigation Reform Act of 1995. These statements are not guarantees of future performance and are subject to several factors, risks and uncertainties, the impact or occurrence of which could cause actual results to differ materially from the expected results described in the forward-looking statements. Certain of these factors, risks and uncertainties are discussed in the sections of this report entitled “Risk Factors” and “Management’s Discussion and Analysis of Financial Condition and Results of Operations.” New factors, risks and uncertainties may emerge from time to time that may affect the forward-looking statements made herein. Given these factors, risks and uncertainties, investors should not place undue reliance on forward-looking statements as predictive of future results. We disclaim any obligation to update the forward-looking statements made in this report.
4
PART I
ITEM 1. BUSINESS
Astronics Corporation (“Astronics” or the “Company”) is a leading provider of advanced technologies to the global aerospace, defense and other mission-critical industries. Our products and services include advanced, high-performance electrical power generation, distribution and seat motion systems, lighting and safety systems, avionics products, systems and certification, aircraft structures and automated test systems.
We have principal operations in the United States (“U.S.”), Canada, France and England, as well as engineering offices in the Ukraine and India.
COVID-19 Pandemic
In December 2019, a novel strain of coronavirus (“COVID-19”) surfaced in Wuhan, China, and has since spread to other countries, including the United States. In March 2020, the World Health Organization characterized COVID-19 as a pandemic. The pandemic has resulted in governments around the world implementing stringent measures to help control the spread of the virus, including quarantines, “shelter in place” and “stay at home” orders, travel restrictions, business curtailments and other measures. As a result, global demand for travel declined at a rapid pace and has remained depressed. The exact timing and pace of a recovery is indeterminable as certain markets have reopened, some of which have since experienced a resurgence of COVID-19 cases, while others, particularly international markets, remain closed or are enforcing extended quarantines.
The commercial aerospace industry, in particular, has been significantly disrupted, both domestically and internationally. The pandemic has had a significant adverse impact on our business in 2020. The impact of COVID-19 is fluid and continues to evolve, and the shape and speed of recovery for the commercial aerospace industry remains uncertain. We currently expect it may take up to three years or more for travel to return to 2019 levels. There is significant uncertainty with respect to when the commercial transport market, the largest market we serve, will recover, and whether and at what point capacity will return to and/or exceed pre-COVID-19 levels.
We took immediate and aggressive action to minimize the spread of COVID-19 in our workplaces and reduce costs. Since the early days of the pandemic, we have been following guidance from the World Health Organization and the U.S. Center for Disease Control (“CDC”) to protect employees and prevent the spread of the virus within all of our facilities globally. Some of the actions implemented include: social distancing; appropriate personal protective equipment; facility deep cleaning; flexible work-from-home scheduling; pre-shift temperature screenings, where allowed by law; and restrictions on facility visitors and unnecessary travel. Material actions to reduce costs included: (1) reducing our workforce to align operations with customer demand; (2) suspension of certain benefit programs; and (3) delaying non-essential capital projects and minimizing discretionary spending. At the same time, we addressed the ongoing needs of our business to continue to serve our customers. Additionally, Astronics has pursued business opportunities from other markets, taking advantage of its technical design expertise and manufacturing capabilities, which are currently underutilized. These opportunities can be meaningful, and some are directly related to the fight against COVID-19. We also executed an amendment to our credit agreement, as more fully described in Item 8, Financial Statements and Supplementary Data, Note 8, Long-Term Debt in this report.
Acquisitions
On July 1, 2019, the Company acquired all of the issued and outstanding capital stock of Freedom Communication Technologies, Inc. (“Freedom”). Freedom, located in Kilgore, Texas, is a leader in wireless communication testing, primarily for the civil land mobile radio market. Freedom is included in our Test Systems segment. The total consideration for the transaction was $21.8 million, net of $0.6 million in cash acquired.
On October 4, 2019, the Company acquired the stock of the primary operating subsidiaries as well as certain other assets from mass transit and defense market test solution provider, Diagnosys Test Systems Limited, for $7.0 million in cash, plus contingent purchase consideration (“earnout”) estimated at a fair value of $2.5 million at acquisition. Diagnosys Inc. and its affiliates (“Diagnosys”) is included in our Test Systems segment. Diagnosys is a developer and manufacturer of comprehensive automated test equipment providing test, support, and repair of high value electronics, electro-mechanical, pneumatic and printed circuit boards focused on the global mass transit and defense markets. The terms of the acquisition allow for a potential earnout of up to an additional $13.0 million over the three years post-acquisition based on achievement of new order levels of over $72.0 million during that period. No earnout was payable for the period from acquisition through December 31, 2020. The acquired business has operations in Westford, Massachusetts as well as Ferndown, England, and an engineering center of excellence in Bangalore, India.
5
Divestitures
On February 13, 2019, the Company completed a divestiture of its semiconductor test business within the Test Systems segment. The business was not core to the future of the Test Systems segment. The total proceeds of the divestiture amounted to $103.8 million. The Company recorded a pre-tax gain on the sale of $80.1 million in the first quarter of 2019. The Company recorded income tax expense relating to the gain of $19.7 million.
The transaction also includes two elements of contingent earnouts. The “First Earnout” is calculated based on a multiple of all future sales of existing and certain future derivative products to existing and future customers in each annual period from 2019 through 2022. The First Earnout may not exceed $35.0 million in total. The “Second Earnout” is calculated based on a multiple of future sales related to an existing product and program with an existing customer exceeding an annual threshold for each annual period from 2019 through 2022. The Second Earnout is not capped. For the Second Earnout, if the applicable sales in an annual period do not exceed the annual threshold, no amounts will be paid relative to such annual period; the sales in such annual period do not carry over to the next annual period. Due to the degree of uncertainty associated with estimating the future sales levels of the divested business and its underlying programs, and the lack of reliable predictive market information, the Company has elected an accounting policy to recognize such earnout proceeds, if received, as additional gain on sale when such proceeds are realized or realizable. We consider the proceeds realizable when we have received communication from the purchaser of its calculation of the earnout and the parties reach agreement on the calculation. No amounts were payable to the Company under either earnout for the year ended December 31, 2019. On February 13, 2021, the Company was notified by the purchaser that they have calculated $10.7 million as being payable to the Company under the First and Second Earnouts for the year ended December 31, 2020. There is a period by which we and the purchaser will review the earnout calculation, which is underway. Upon completion of the review and agreement of any adjustments, the Company expects to record the additional gain on the sale in the first quarter of 2021.
On July 12, 2019, the Company sold intellectual property and certain assets associated with its Airfield Lighting product line for $1.0 million in cash. The Airfield Lighting product line, part of the Aerospace segment, was not core to the business and represented less than 1% of revenue. The Company recorded a pre-tax loss on the sale of approximately $1.3 million.
Products and Customers
Our Aerospace segment designs and manufactures products for the global aerospace industry. Product lines include lighting and safety systems, electrical power generation, distribution and motions systems, aircraft structures, avionics products, systems certification, and other products. Our Aerospace customers are the airframe manufacturers (“OEM”) that build aircraft for the commercial, military and general aviation markets, suppliers to those OEM’s, aircraft operators such as airlines, suppliers to the aircraft operators, and branches of the U.S. Department of Defense. During 2020, this segment’s sales were divided 64% to the commercial transport market, 16% to the military aircraft market, 14% to the business jet market and 6% to other markets. As a result of the COVID-19 pandemic and its adverse impact on air travel worldwide, the commercial aerospace industry has been significantly disrupted. The significant adverse impact of the COVID-19 pandemic on the commercial transport market channels has led to this market comprising a lower percentage of our net sales in fiscal 2020 than typical. Most of this segment’s sales are a result of contracts or purchase orders received from customers, placed on a day-to-day basis or for single year procurements rather than long-term multi-year contract commitments. On occasion, the Company does receive contractual commitments or blanket purchase orders from our customers covering multiple-year deliveries of hardware to our customers.
Our Test Systems segment designs, develops, manufactures and maintains automated test systems that support the aerospace and defense, communications and mass transit industries as well as training and simulation devices for both commercial and military applications. In the Test Systems segment, Astronics’ products are sold to a global customer base including OEM's and prime government contractors for both electronics and military products. The nature of our Test Systems business is such that it pursues large, often multi-year, projects.
Sales by segment, geographic region, major customer and foreign operations are provided in Note 20 of Item 8, Financial Statements and Supplementary Data in this report.
We have a significant concentration of business with two major customers; Panasonic Avionics Corporation (“Panasonic”) and The Boeing Company (“Boeing”). Sales to Panasonic accounted for 11.1% of sales in 2020, 13.0% of sales in 2019, and 14.4% of sales in 2018. Sales to Boeing accounted for 9.5% of sales in 2020, 13.6% of sales in 2019, and 14.3% of sales in 2018.
Strategy
Our strategy is to increase our value by developing technologies and capabilities either internally or through acquisition, and use those capabilities to provide innovative solutions to the aerospace and defense and other markets where our technology can be beneficial.
6
Practices as to Maintaining Working Capital
Liquidity is discussed in Part II, Item 7, Management’s Discussion and Analysis of Financial Condition and Results of Operations, in the Liquidity and Capital Resources section of this report.
Competitive Conditions
We experience considerable competition in the market sectors we serve, principally with respect to product performance and price, from various competitors, many of which are substantially larger and have greater resources. Success in the markets we serve depends upon product innovation, customer support, responsiveness and cost management. We continue to invest in developing the technologies and engineering support critical to competing in our markets.
Government Contracts
All U.S. government contracts, including subcontracts where the U.S. government is the ultimate customer, may be subject to termination at the election of the government. Our revenue stream relies on military spending. Approximately 16% of our consolidated sales were made to the military aircraft and military test systems markets combined.
Raw Materials
Materials, supplies and components are purchased from numerous sources. We believe that the loss of any one source, although potentially disruptive in the short-term, would not materially affect our operations in the long-term.
Seasonality
Our business is typically not seasonal.
Backlog
At December 31, 2020, our consolidated backlog was $283.4 million. At December 31, 2019, our backlog was $359.6 million. The decrease in backlog is attributable to the adverse impact that the COVID-19 pandemic has had on customer demand, particularly our commercial aerospace and business jet customers, domestically and internationally. The uncertainty of the duration of the pandemic and its impact on the aerospace industry is expected to continue to inhibit sales order backlog growth in the commercial OEM and commercial aftermarket channels until OEM build rates increase and commercial airlines increase spending on fleet improvements.
Backlog in the Aerospace segment was $191.1 million at December 31, 2020, of which $162.8 million is expected to be recognized as revenue in 2021. Backlog in the Test Systems segment was $92.3 million at December 31, 2020. The Test Systems segment expects to recognize as revenue $54.1 million of backlog in 2021.
Patents
We have a number of patents. While the aggregate protection of these patents is of value, our only material business that is dependent upon the protection afforded by these patents is our cabin power distribution products. Our patents and patent applications relate to electroluminescence, instrument panels, cord reels and handsets, and a broad patent covering the cabin power distribution technology. We regard our expertise and techniques as proprietary and rely upon trade secret laws and contractual arrangements to protect our rights. We have trademark protection in our major markets.
Research, Development and Engineering Activities
We are engaged in a variety of engineering and design activities as well as basic research and development activities directed to the substantial improvement or new application of our existing technologies. These costs are expensed when incurred and included in cost of products sold. Research, development and engineering costs amounted to approximately $86.8 million in 2020, $108.9 million in 2019 and $114.3 million in 2018.
7
Human Capital Resources
Human Capital Management and Corporate Culture
As of December 31, 2020, we employed approximately 2,200 employees, of whom approximately 1,800 were employed in the United States and approximately 400 were employed outside of the United States. We have approximately 60 hourly production employees at PECO who are subject to collective bargaining agreements. We also leverage temporary workers to provide flexibility for our business and manufacturing needs.
We greatly value our employees and recognize that, without them, the Company would not have achieved the success it has accomplished since inception. We strive to provide a positive, supportive work culture with a clear global vision and a collaborative work style. We strongly believe that a focus on learning and supporting career development can lead to success. With low attrition and high referral rates, Astronics Corporation regularly earns “best employer” awards.
As it relates to customers, investors, suppliers and partners, our Company is dedicated to conducting business with integrity and responsibility for the greater good. We promote honest and ethical conduct, compliance with applicable government regulations and accountability by all of its directors, officers and employees.
When considering an acquisition or partnership, we embed questions specific to human capital management within our due diligence approach. These questions are in the areas of culture, equal employment opportunity, compliance with governing bodies, ethics, as well as employee benefits. We ask these in an effort to ensure that the acquisition candidate is a positive cultural fit and to minimize any risk when assessing the acquisition candidate.
In addition, our Corporate Governance Guidelines outline expectations that the Board establish and promote policies that encourage a positive, supportive work culture. The Board recognizes that culture is critical to the long-term success of Astronics and our strategy.
Compensation Programs and Employee Benefits
We believe that future success largely depends upon our continued ability to attract and retain highly skilled employees. We provide employees with competitive salaries and bonuses, opportunities for equity ownership, development programs that enable continued learning and growth and a robust employment package that promotes well-being across all aspects of their lives, including;
• Health and dental insurance• Generous paid time off• 401(k), profit sharing, and bonus programs• Flexible spending accounts• Employee stock purchase plan• Disability and life insurance• Commute reduction, fitness, tuition programs• Community service opportunities
The COVID-19 pandemic has had a sudden and significant impact on the global economy, and particularly in the aerospace industry, causing us to make difficult cost conservation measures including workforce reductions activities to align capacity with expected demand as well as suspension of certain benefit programs. These measures were taken to maintain the financial health and liquidity of the business. We are continuously evaluating the impact of the COVID-19 pandemic which is dependent on future developments, including the duration of the pandemic and the its impact on the global economy and the aerospace industry, which are uncertain and cannot be predicted at this time. We will continue to strive to return to a normal level of employment opportunity and benefit offering for the valued employees of Astronics.
Employee Engagement
The lifeblood of any organization is its employee base. We rely on our individual subsidiaries to regularly gather employee feedback, using the method each subsidiary believes is most appropriate. In some instances that feedback is obtained through “Town Hall” formats; in other instances, it is obtained through surveys. We also expect our managers to solicit and, where applicable, use employee feedback to improve its business practices and working environment. We are proud to have received numerous awards, recognizing both product quality as well as the ability to provide an excellent work environment.
8
Diversity and Inclusion
Much of our success is rooted in the diversity of our teams and our commitment to inclusion. We believe that diversity and inclusion is critical for the attraction and retention of top talent. We employ policies and procedures to recruit women and minority talent as well as policies to ensure pay equality. Astronics has an Equal Employment Opportunity Policy whereby we commit to providing equal employment opportunity for all qualified employees and applicants.
Health and Safety
Astronics is committed to the safety of our customers and our employees. Each Astronics operation maintains environmental, health and safety policies that seek to promote the operation of its businesses in a manner that is protective of the health and safety of the public and its employees, particularly in the response to the global COVID-19 pandemic. We have implemented actions to maintain the health of our employees including social distancing measures, the use of masks, restricting visitors and unnecessary travel, and working from home whenever possible.
Our operations offer several health and welfare programs to employees to promote fitness and wellness and to encourage preventative healthcare. In addition, our employees are offered a confidential employee assistance program that provides professional counseling to employees and their family members. Also, many of our operations offer green space for employees to use during their breaks.
Available information
We file our financial information and other materials as electronically required with the Securities and Exchange Commission (“SEC”). These materials can be accessed electronically via the Internet at www.sec.gov. Such materials and other information about the Company are also available through our website at www.astronics.com.
ITEM 1A. RISK FACTORS
Covid-19 Pandemic Risks
The COVID-19 pandemic has adversely affected and is expected to continue to pose risks to our business, results of operations, financial condition and cash flows, and other epidemics or outbreaks of infectious diseases may have a similar impact. As previously disclosed, we face risks related to outbreaks of infectious diseases, including the ongoing COVID-19 pandemic. The COVID-19 coronavirus pandemic has caused significant volatility in financial markets, including the market price of our stock, and the aerospace industry, which has raised the prospect of an extended global recession. In response to COVID-19, national and local governments around the world have instituted certain measures, including travel bans, prohibitions or limits on group events and gatherings, shutdowns of certain businesses, curfews, shelter-in-place orders and recommendations to practice social distancing. Our operations have been deemed essential under applicable law, but there is no guarantee this will continue. We follow the COVID-19 guidelines from the CDC concerning the health and safety of our personnel, these measures have resulted in attenuating activity and, in some cases, required temporary closures of certain of our facilities, among other impacts. The duration of these measures is unknown, may be extended and additional measures, including facility closures, may be imposed.
Among the potential effects of COVID-19 and other similar outbreaks on the Company include, but are not limited to, the following:
• Reduced consumer and investor confidence, instability in the credit and financial markets, volatile corporate profits, and reduced business and consumer spending, which may adversely affect our results of operations by reducing our sales, margins and/or net income as a result of a slowdown in customer orders or order cancellations. In addition, volatility in the financial markets could increase the cost of capital and/or limit its availability.
• Economic uncertainty as a result of COVID-19 is expected to cause continued difficulty for our customers, suppliers and the Company to accurately forecast and plan future business activities.
• Aircraft manufacturers have experienced a disruption in production and demand as customers defer delivery of new aircraft, resulting in slowed or halted production at facilities throughout the world. Commercial airlines have experienced a significant reduction in air traffic. Commercial airlines and other manufacturers have focused on conserving cash to preserve liquidity, which has had a negative impact on airframe and aftermarket sales.
• The potential to weaken the financial position of some of our customers. If circumstances surrounding our customers’ financial capabilities were to deteriorate, asset write-downs or write-offs could negatively affect our operating results and, if large, could have a material adverse effect on our business, financial condition, results of operations and cash flow.
9
• Disruption of our supply chain. Our third-party manufacturers, suppliers, third-party distributors, sub-contractors and customers have been and may be disrupted by worker absenteeism, quarantines and restrictions on their employees’ ability to work, office and factory closures, disruptions to ports and other shipping infrastructure, border closures, or other travel or health-related restrictions. Depending on the magnitude of such effects on our manufacturing or the operations of our suppliers, third-party distributors, or sub-contractors, our supply chain, manufacturing and product shipments could be delayed, which could adversely affect our business, operations, and customer relationships.
• The need to incur additional restructuring charges to optimize our cost structure if a recovery in the aerospace market occurs slower than anticipated.
Recognizing the unprecedented nature, scale and uncertainty associated with this global health crisis, the duration and extent of the on-going impacts cannot be reasonably estimated at this time.
Market Risks
The loss of Boeing or Panasonic as major customers or a significant reduction in business with either of those customers would reduce our sales and earnings. In 2020, we had a concentration of sales to Boeing and Panasonic representing approximately 9.5% and 11.1% of our sales, respectively. The loss of either of these customers or a significant reduction in business with them would significantly reduce our sales and earnings.
In October 2018 and March of 2019, two commercial aircraft accidents led to the grounding by the Federal Aviation Administration and other regulators of the Boeing 737 MAX aircraft, on which we have significant content, and which represented our largest OEM production program before the pandemic. The grounding of the Boeing 737 MAX, which started in March of 2019, has caused the production rate of that aircraft to be lower than expected in fiscal year 2019 and 2020. The 737 MAX grounding affected our business both because of the production pause, impacting our line-fit content, and because it left many of our airline customers short of capacity, particularly in 2019 but continuing into 2020, which made them reluctant to take other aircraft out of service to install the types of retrofit products they buy from us. Although the 737 MAX was re-certified in the United States in November 2020 and in Europe in January 2021, if production rates do not materialize as anticipated, our Aerospace segment sales could be significantly impacted in the near or long-term, which could have a material adverse effect on our business, financial condition, results of operations, and cash flows. Even as deliveries of the 737 MAX program resumes, demand for the aircraft could be lower than was expected prior to the initial grounding of the aircraft due to the continuing effects of the COVID-19 pandemic.
The markets we serve are cyclical and sensitive to domestic and foreign economic conditions and events, which may cause our operating results to fluctuate. Demand for our products is, to a large extent, dependent on the demand and success of our customers' products where we are a supplier to an OEM. In our Aerospace segment, demand by the business jet markets for our products is dependent upon several factors, including capital investment, product innovations, economic growth and wealth creation and technology upgrades. In addition, the commercial airline industry is highly cyclical and sensitive to such things as fuel price increases, labor disputes, global economic conditions, availability of capital to fund new aircraft purchases and upgrades of existing aircraft and passenger demand, all of which have been significantly impacted by the ongoing COVID-19 pandemic. A change in any of these factors could result in a further reduction in the amount of air travel and the ability of airlines to invest in new aircraft or to upgrade existing aircraft. These factors would reduce orders for new aircraft and would likely reduce airlines’ spending for cabin upgrades for which we supply products, thus reducing our sales and profits. A reduction in air travel may also result in our commercial airline customers being unable to pay our invoices on a timely basis or not at all.
We are a supplier on various new aircraft programs just entering or expected to begin production in the future. As with any new program, there is risk as to whether the aircraft or program will be successful and accepted by the market. As is customary for our business, we purchase inventory and invest in specific capital equipment to support our production requirements generally based on delivery schedules provided by our customer. If a program or aircraft is not successful, we may have to write-off all or a part of the inventory, accounts receivable and capital equipment related to the program. A write-off of these assets could result in a significant reduction of earnings and cause covenant violations relating to our debt agreements. This could result in our being unable to borrow additional funds under our bank credit facility or being obliged to refinance or renegotiate the terms of our bank indebtedness.
In our Test Systems segment, the market for our products is concentrated with a limited number of significant customers accounting for a substantial portion of the purchases of test equipment. In any one reporting period, a single customer or several customers may contribute an even larger percentage of our consolidated sales. In addition, our ability to increase sales will depend, in part, on our ability to obtain orders from current or new significant customers. The opportunities to obtain orders from these customers may be limited, which may impair our ability to grow sales. We expect that sales of our Test Systems products will continue to be concentrated with a limited number of significant customers for the foreseeable future.
10
Additionally, demand for some of our test products is dependent upon government funding levels for our products, our ability to compete successfully for those contracts and our ability to develop products to satisfy the demands of our customers.
Our products are sold in highly competitive markets. Some of our competitors are larger, more diversified corporations and have greater financial, marketing, production and research and development resources. As a result, they may be better able to withstand the effects of periodic economic downturns. Our operations and financial performance will be negatively impacted if our competitors:
• develop products that are superior to our products;• develop products that are more competitively priced than our products;• develop methods of more efficiently and effectively providing products and services; or• adapt more quickly than we do to new technologies or evolving customer requirements.
We believe that the principal points of competition in our markets are product quality, price, design and engineering capabilities, product development, conformity to customer specifications, quality of support after the sale, timeliness of delivery and effectiveness of the distribution organization. Maintaining and improving our competitive position will require continued investment in manufacturing, engineering, quality standards, marketing, customer service and support and our distribution networks. If we do not maintain sufficient resources to make these investments, or are not successful in maintaining our competitive position, our operations and financial performance will suffer.
We depend on government contracts and subcontracts with defense prime contractors and subcontractors that may not be fully funded, may be terminated, or may be awarded to our competitors. The failure to be awarded these contracts, the failure to receive funding or the termination of one or more of these contracts could reduce our sales. Sales to the U.S. government and its prime contractors and subcontractors represent a significant portion of our business. The funding of these programs is generally subject to annual congressional appropriations, and congressional priorities are subject to change. In addition, government expenditures for defense programs may decline or these defense programs may be terminated. A decline in governmental expenditures or the termination of existing contracts may result in a reduction in the volume of contracts awarded to us. We have resources applied to specific government contracts and if any of those contracts were terminated, we may incur substantial costs redeploying those resources.
Contracting in the defense industry is subject to significant regulation, including rules related to bidding, billing and accounting kickbacks and false claims, and any non-compliance could subject us to fines and penalties or possible debarment. Like all government contractors, we are subject to risks associated with this contracting. These risks include the potential for substantial civil and criminal fines and penalties. These fines and penalties could be imposed for failing to follow procurement integrity and bidding rules, employing improper billing practices or otherwise failing to follow cost accounting standards, receiving or paying kickbacks or filing false claims. We have been, and expect to continue to be, subjected to audits and investigations by government agencies. The failure to comply with the terms of our government contracts could harm our business reputation. It could also result in suspension or debarment from future government contracts.
Strategic Risks
We may incur losses and liabilities as a result of our acquisition strategy. Growth by acquisition involves risks that could adversely affect our financial condition and operating results, including:
• diversion of management time and attention from our core business;• the potential exposure to unanticipated liabilities;• the potential that expected benefits or synergies are not realized and that operating costs increase;• the risks associated with incurring additional acquisition indebtedness, including that additional indebtedness
could limit our cash flow availability for operations and our flexibility;• difficulties in integrating the operations and personnel of acquired companies; and• the potential loss of key employees, suppliers or customers of acquired businesses.
In addition, any acquisition, once successfully integrated, could negatively impact our financial performance if it does not perform as planned, does not increase earnings, or does not prove otherwise to be beneficial to us.
If we are unable to adapt to technological change, demand for our products may be reduced. The technologies related to our products have undergone, and in the future may undergo, significant changes. To succeed in the future, we will need to continue to design, develop, manufacture, assemble, test, market and support new products and enhancements on a timely and cost-effective basis. Our competitors may develop technologies and products that are more effective than those we develop or that render our technology and products obsolete or uncompetitive. Furthermore, our products could become unmarketable if
11
new industry standards emerge. We may have to modify our products significantly in the future to remain competitive, and new products we introduce may not be accepted by our customers.
Our new product development efforts may not be successful, which would result in a reduction in our sales and earnings. We may experience difficulties that could delay or prevent the successful development of new products or product enhancements, and new products or product enhancements may not be accepted by our customers. In addition, the development expenses we incur may exceed our cost estimates, and new products we develop may not generate sales sufficient to offset our costs. If any of these events occur, our sales and profits could be adversely affected.
Operational Risks
Our business and operations could be adversely impacted in the event of a failure of our information technology infrastructure or adversely impacted by a successful cyber-attack. We are dependent on various information technologies throughout our Company to administer, store and support multiple business activities. We routinely experience various cybersecurity threats, threats to our information technology infrastructure, unauthorized attempts to gain access to our Company sensitive information, and denial-of-service attacks as do our customers, suppliers and subcontractors. We conduct regular periodic training of our employees as to the protection of sensitive information which includes security awareness training intended to prevent the success of “phishing” attacks.
The threats we face vary from attacks common to most industries to more advanced and persistent, highly organized adversaries, including nation states, which target us and other defense contractors because we protect sensitive information. If we are unable to protect sensitive information, our customers or governmental authorities could question the adequacy of our threat mitigation and detection processes and procedures, and depending on the severity of the incident, our customers’ data, our employees’ data, our intellectual property, and other third-party data (such as subcontractors, suppliers and vendors) could be compromised. As a consequence of their persistence, sophistication and volume, we may not be successful in defending against all such attacks. Due to the evolving nature of these security threats, the impact of any future incident cannot be predicted.
Although we work cooperatively with our customers, suppliers, and subcontractors to seek to minimize the impact of cyber threats, other security threats or business disruptions, we must rely on the safeguards put in place by these entities, which may affect the security of our information. These entities have varying levels of cybersecurity expertise and safeguards and their relationships with U.S. government contractors, such as Astronics, may increase the likelihood that they are targeted by the same cyber threats we face.
Our inability to adequately enforce and protect our intellectual property or defend against assertions of infringement could prevent or restrict our ability to compete. We rely on patents, trademarks and proprietary knowledge and technology, both internally developed and acquired, in order to maintain a competitive advantage. Our inability to defend against the unauthorized use of these rights and assets could have an adverse effect on our results of operations and financial condition. Litigation may be necessary to protect our intellectual property rights or defend against claims of infringement. This litigation could result in significant costs and divert our management’s focus away from operations. Refer to the risk factor related to pending patent infringement litigation above and Note 19 to the consolidated financial statements in Item 8 for further discussion.
If our subcontractors or suppliers fail to perform their contractual obligations, our prime contract performance and our ability to obtain future business could be materially and adversely impacted. Many of our contracts involve subcontracts with other companies upon which we rely to perform a portion of the services we must provide to our customers. There is a risk that we may have disputes with our subcontractors, including disputes regarding the quality and timeliness of work performed by the subcontractor or customer concerns about the subcontractor. Failure by our subcontractors to satisfactorily provide, on a timely basis, the agreed-upon supplies or perform the agreed-upon services may materially and adversely impact our ability to perform our obligations with our customer and could result in the assessment of late delivery penalties. Subcontractor performance deficiencies could result in a customer terminating our contract for default. A default termination could expose us to liability and substantially impair our ability to compete for future contracts and orders. In addition, a delay in our ability to obtain components and equipment parts from our suppliers may affect our ability to meet our customers’ needs and may have an adverse effect upon our profitability.
Some of our contracts contain late delivery penalties. Failure to deliver in a timely manner due to supplier problems, development schedule slides, manufacturing difficulties, or similar schedule-related events could have a material adverse effect on our business.
Our results of operations are affected by our fixed-price contracts, which could subject us to losses in the event that we have cost overruns. For the year ended December 31, 2020, fixed-price contracts represented almost all of the Company’s
12
sales. On fixed-price contracts, we agree to perform the scope of work specified in the contract for a predetermined price. Depending on the fixed price negotiated, these contacts may provide us with an opportunity to achieve higher profits based on the relationship between our costs and the contract’s fixed price. However, we bear the risk that increased or unexpected costs may reduce our profit.
The failure of our products may damage our reputation, necessitate a product recall or result in claims against us that exceed our insurance coverage, thereby requiring us to pay significant damages. Defects in the design and manufacture of our products may necessitate a product recall. We include complex system design and components in our products that could contain errors or defects, particularly when we incorporate new technology into our products. If any of our products are defective, we could be required to redesign or recall those products or pay substantial damages or warranty claims. Such an event could result in significant expenses, disrupt sales and affect our reputation and that of our products. We are also exposed to product liability claims. We carry aircraft and non-aircraft product liability insurance consistent with industry norms. However, this insurance coverage may not be sufficient to fully cover the payment of any potential claim. A product recall or a product liability claim not covered by insurance could have a material adverse effect on our business, financial condition and results of operations.
Financial Risks
We are subject to debt covenant restrictions. The terms of our credit facility may restrict our current and future operations, particularly our ability to take certain actions. Our credit facility contains certain financial covenants. An unexpected decline in our operating income could cause us to violate our covenants. A covenant violation could result in a default under the revolving credit facility. If any such default occurs, the lenders may elect to declare all outstanding borrowings, together with accrued interest and other amounts payable thereunder, to be immediately due and payable. The lenders also have the right in these circumstances to terminate any commitments they have to provide further borrowings. In addition, following an event of default, the lenders under the credit facility will have the right to proceed against the collateral granted to them to secure the debt, which includes our available cash. If the debt under the credit facility were to be accelerated, we cannot assure that our assets would be sufficient to repay in full our debt.
Additionally, our credit facility also contains a number of restrictive covenants that impose significant operating and financial restrictions on the Company and may limit our ability to engage in acts that may be in our long-term best interests. The credit facility includes covenants restricting, among other things, the ability of the Company to
• incur additional indebtedness;• pay dividends on or repurchase our capital stock;• make certain acquisitions or investments;• sell assets; and• engage in certain business activities.
The amount of debt we have outstanding, as well as any debt we may incur in the future, could have an adverse effect on our operational and financial flexibility. As of December 31, 2020, we had approximately $173.0 million of long-term debt outstanding. Changes to our level of debt subsequent to December 31, 2020 could have significant consequences to our business, including the following:
• Depending on interest rates and debt maturities, a substantial portion of our cash flow from operations could be dedicated to paying principal and interest on our debt, thereby reducing funds available for our acquisition strategy, capital expenditures or other purposes;
• A significant amount of additional debt could make us more vulnerable to changes in economic conditions or increases in prevailing interest rates;
• Our ability to obtain additional financing for acquisitions, capital expenditures or for other purposes could be impaired;
• The increase in the amount of debt we have outstanding and the associated interest expense increases the risk of non-compliance with some of the covenants in our debt agreements which require us to maintain specified financial ratios; and
• We may be more leveraged than some of our competitors, which may result in a competitive disadvantage.
13
A write-off of all or part of our goodwill or other intangible assets could adversely affect our operating results and net worth. At December 31, 2020, goodwill and net intangible assets were approximately 9.4% and 17.7% of our total assets, respectively. In 2020, we recorded goodwill impairment charges associated with four Aerospace reporting units, totaling $86.3 million. In 2019, we recorded goodwill and intangible asset impairment charges of $1.6 million and $6.2 million related to our AeroSat antenna business, respectively. Our goodwill and other intangible assets may increase in the future since our strategy includes growing through acquisitions. We may have to write-off all or part of our goodwill or purchased intangible assets if their value becomes impaired. Although this write-off would not result in an outlay of cash, it could reduce our earnings and net worth significantly.
We are subject to financing and interest rate exposure risks that could adversely affect our business, liquidity and operating results. Changes in the availability, terms and cost of capital, and increases in interest rates could cause our cost of doing business to increase and place us at a competitive disadvantage. At December 31, 2020, all of our debt was subject to variable interest rates.
The potential phase out of LIBOR may negatively impact our debt agreements and financial position, results of operations and liquidity. On July 27, 2017, the UK’s Financial Conduct Authority announced that it intends to phase out LIBOR by the end of 2021. The administrator of LIBOR has announced it will consult on its intention to cease the publication of the one week and two month USD LIBOR settings immediately following the LIBOR publication on December 31, 2021, and the remaining USD LIBOR settings immediately following the LIBOR publication on June 30, 2023. Extending the publication of certain USD LIBOR tenors until June 30, 2023 would allow most legacy USD LIBOR contracts to mature before LIBOR experiences disruptions. However, it is unclear whether different benchmark rates used to price indebtedness will develop. If LIBOR ceases to exist, we may need to renegotiate our debt agreements that extend beyond 2021 that utilize LIBOR as a factor in determining the interest rate, which may negatively impact the terms of such indebtedness. In addition, the overall financial markets may be disrupted as a result of the phase out or replacement of LIBOR. Disruption in the financial markets could have an adverse effect on our financial position, results of operations, and liquidity.
Our future operating results could be impacted by estimates used to calculate impairment losses on long-lived assets. The preparation of financial statements in conformity with U.S. generally accepted accounting principles requires management to make significant and subjective estimates and assumptions that may affect the reported amounts of long-lived assets in the financial statements. These estimates are integral in the determination of whether a potential non-cash impairment loss exists as well as the calculation of that loss. Actual future results could differ from those estimates. As discussed in Note 23 to the consolidated financial statements in Item 8, we recorded a long-lived asset impairment charge of approximately $0.7 million and $9.5 million in the years ending December 31, 2020 and 2019, respectively.
Changes in discount rates and other estimates could affect our future earnings and equity. Our goodwill asset impairment evaluations are determined using valuations that involve several assumptions, including discount rates, cash flow estimates, growth rates and terminal values. Certain of these assumptions, particularly the discount rate, are based on market conditions and are outside of our control. Changes in these assumptions could affect our future earnings and equity.
Additionally, pension obligations and the related costs are determined using actual results and actuarial valuations that involve several assumptions. The most critical assumption is the discount rate. Other assumptions include mortality, salary increases and retirement age. The discount rate assumptions are based on current market conditions and are outside of our control. Changes in these assumptions could affect our future earnings and equity.
Legal and Compliance Risks
We currently are involved or may become involved in the future, in legal proceedings that, if adversely adjudicated or settled, could materially impact our financial condition. As an aerospace company, we may become a party to litigation in the ordinary course of our business, including, among others, matters alleging product liability, warranty claims, breach of commercial or government contract or other legal actions. In general, litigation claims can be expensive and time consuming to bring or defend against and could result in settlements or damages that could significantly impact results of operations and financial condition.
Currently, our subsidiary, AES is a defendant in actions filed in various jurisdictions by Lufthansa Technik AG relating to an allegation of patent infringement and based on rulings to date we have concluded that losses related to these proceedings are probable. If these actions are decided adversely against the Company, the associated damages could result in a material adverse effect on our results of operations or financial condition.
Refer to Note 19 of our consolidated financial statements in Item 8 for discussion on this and other legal proceedings. Other than these proceedings, we are not party to any significant pending legal proceedings that management believes will result in a material adverse effect on our results of operations or financial condition.
14
Our operations in foreign countries expose us to political and currency risks and adverse changes in local legal and regulatory environments. In 2020, approximately 10% of our sales were made by our subsidiaries in foreign countries, predominately in our subsidiaries in France and Canada. Net assets held by our foreign subsidiaries total $63.3 million at December 31, 2020. Approximately 25% of our consolidated sales in 2020 were made to customers outside of the United States. Our financial results may be adversely affected by fluctuations in foreign currencies and by the translation of the financial statements of our foreign subsidiaries from local currencies into U.S. dollars. We expect international operations and export sales to continue to contribute to our earnings for the foreseeable future. Both the sales from international operations and export sales are subject in varying degrees to risks inherent in doing business outside of the U.S. Such risks include the possibility of unfavorable circumstances arising from host country laws or regulations, changes in tariff and trade barriers and import or export licensing requirements, and political or economic reprioritization, insurrection, civil disturbance or war.
Government regulations could limit our ability to sell our products outside the U.S. and could otherwise adversely affect our business. Certain of our sales are subject to compliance with U.S. export regulations. Our failure to obtain, or fully adhere to the limitations contained in, the requisite licenses, meet registration standards or comply with other government export regulations would hinder our ability to generate sales of our products outside the U.S. Compliance with these government regulations may also subject us to additional fees and operating costs. The absence of comparable restrictions on competitors in other countries may adversely affect our competitive position. In order to sell our products in European Union countries, we must satisfy certain technical requirements. If we are unable to comply with those requirements with respect to a significant quantity of our products, our sales in Europe would be restricted. Doing business internationally also subjects us to numerous U.S. and foreign laws and regulations, including regulations relating to import-export control, technology transfer restrictions, foreign corrupt practices and anti-boycott provisions. Our failure, or failure by an authorized agent or representative that is attributable to us, to comply with these laws and regulations could result in administrative, civil or criminal liabilities and could, in the extreme case, result in monetary penalties, suspension or debarment from government contracts or suspension of our export privileges, which would have a material adverse effect on us.
General Risks
Our future success depends to a significant degree upon the continued contributions of our management team and technical personnel. The loss of members of our management team could have a material and adverse effect on our business. In addition, competition for qualified technical personnel in our industry is intense, and we believe that our future growth and success will depend on our ability to attract, train and retain such personnel.
Future terror attacks, war, or other civil disturbances could negatively impact our business. Continued terror attacks, war or other disturbances could lead to economic instability and decreases in demand for our products, which could negatively impact our business, financial condition and results of operations. Terrorist attacks world-wide have caused instability from time to time in global financial markets and the aviation industry. The long-term effects of terrorist attacks on us are unknown. These attacks and the U.S. government’s continued efforts against terrorist organizations may lead to additional armed hostilities or to further acts of terrorism and civil disturbance in the U.S. or elsewhere, which may further contribute to economic instability.
If we fail to meet expectations of securities analysts or investors due to fluctuations in our sales or operating results, our stock price could decline significantly. Our sales and earnings may fluctuate from quarter to quarter due to a number of factors, including delays or cancellations of programs and the impacts of the ongoing COVID-19 pandemic. It is likely that in some future quarters our operating results may fall below the expectations of securities analysts or investors. In this event, the trading price of our stock could decline significantly.
Our stock price is volatile. For the year ended December 31, 2020, our stock price ranged from a low of $6.40 to a high of $28.92. The price of our common stock has been and likely will continue to be subject to wide fluctuations in response to a number of events and factors, such as:
• quarterly variations in operating results;• variances of our quarterly results of operations from securities analyst estimates;• changes in financial estimates;• announcements of technological innovations and new products;• news reports relating to trends in our markets;• the cancellation of major contracts or programs with our customers; and• impacts of the COVID-19 pandemic on the aerospace industry and our Company.
In addition, the stock market in general, and the market prices for companies in the aerospace and defense industry in particular, have experienced significant price and volume fluctuations that often have been unrelated to the operating performance of the companies affected by these fluctuations. These broad market fluctuations may adversely affect the market price of our
15
common stock, regardless of our operating performance. Global health crises, such as the current COVID-19 pandemic, with the breadth of its impact worldwide, and particularly on the aerospace industry, could also cause significant volatility in the market price.
ITEM 1B. UNRESOLVED STAFF COMMENTS
None
ITEM 2. PROPERTIES
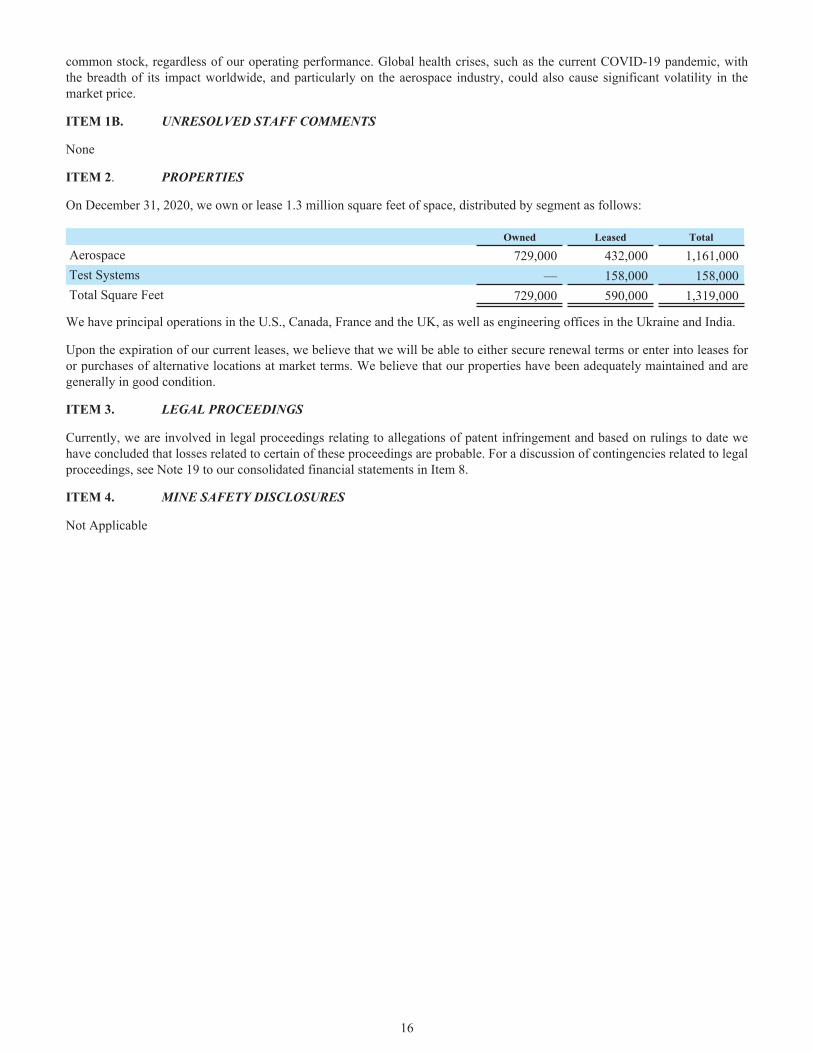
On December 31, 2020, we own or lease 1.3 million square feet of space, distributed by segment as follows:
Owned Leased Total
Aerospace 729,000 432,000 1,161,000 Test Systems — 158,000 158,000 Total Square Feet 729,000 590,000 1,319,000
We have principal operations in the U.S., Canada, France and the UK, as well as engineering offices in the Ukraine and India.
Upon the expiration of our current leases, we believe that we will be able to either secure renewal terms or enter into leases for or purchases of alternative locations at market terms. We believe that our properties have been adequately maintained and are generally in good condition.
ITEM 3. LEGAL PROCEEDINGS
Currently, we are involved in legal proceedings relating to allegations of patent infringement and based on rulings to date we have concluded that losses related to certain of these proceedings are probable. For a discussion of contingencies related to legal proceedings, see Note 19 to our consolidated financial statements in Item 8.
ITEM 4. MINE SAFETY DISCLOSURES
Not Applicable
16
PART II
ITEM 5. MARKET FOR REGISTRANT’S COMMON EQUITY, RELATED STOCKHOLDER MATTERS AND ISSUER PURCHASES OF EQUITY SECURITIES
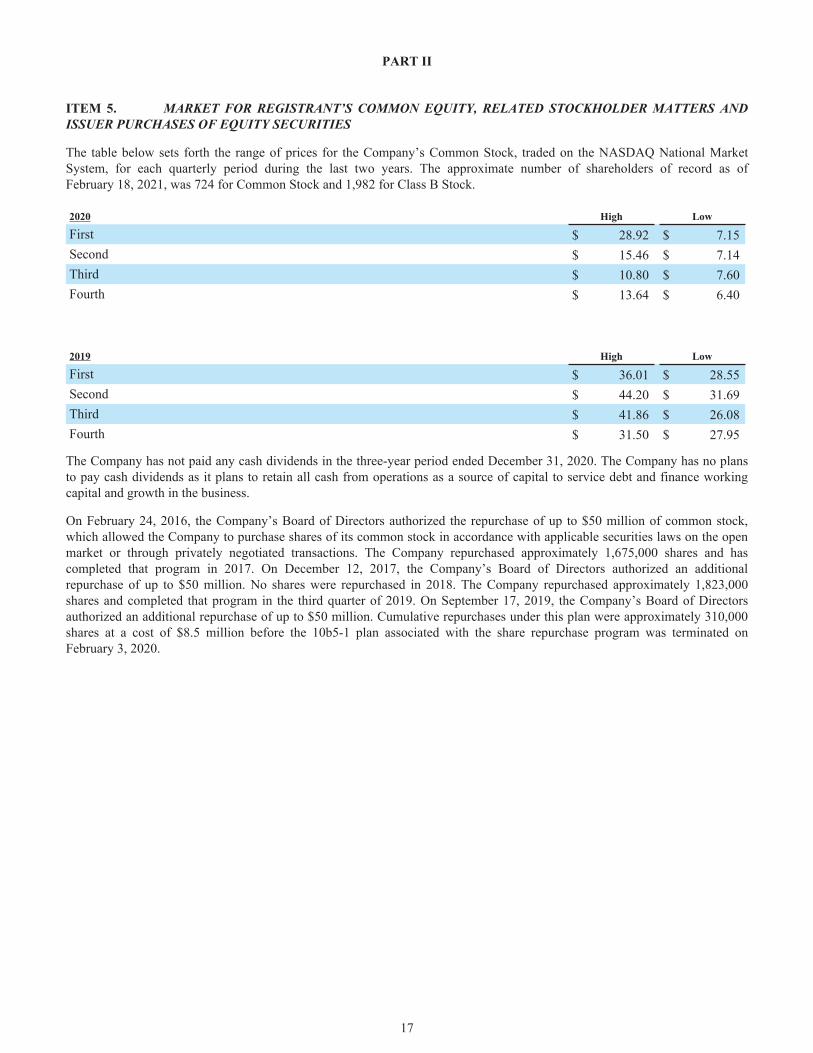
The table below sets forth the range of prices for the Company’s Common Stock, traded on the NASDAQ National Market System, for each quarterly period during the last two years. The approximate number of shareholders of record as of February 18, 2021, was 724 for Common Stock and 1,982 for Class B Stock.
2020 High Low
First $ 28.92 $ 7.15 Second $ 15.46 $ 7.14 Third $ 10.80 $ 7.60 Fourth $ 13.64 $ 6.40
2019 High Low
First $ 36.01 $ 28.55 Second $ 44.20 $ 31.69 Third $ 41.86 $ 26.08 Fourth $ 31.50 $ 27.95
The Company has not paid any cash dividends in the three-year period ended December 31, 2020. The Company has no plans to pay cash dividends as it plans to retain all cash from operations as a source of capital to service debt and finance working capital and growth in the business.
On February 24, 2016, the Company’s Board of Directors authorized the repurchase of up to $50 million of common stock, which allowed the Company to purchase shares of its common stock in accordance with applicable securities laws on the open market or through privately negotiated transactions. The Company repurchased approximately 1,675,000 shares and has completed that program in 2017. On December 12, 2017, the Company’s Board of Directors authorized an additional repurchase of up to $50 million. No shares were repurchased in 2018. The Company repurchased approximately 1,823,000 shares and completed that program in the third quarter of 2019. On September 17, 2019, the Company’s Board of Directors authorized an additional repurchase of up to $50 million. Cumulative repurchases under this plan were approximately 310,000 shares at a cost of $8.5 million before the 10b5-1 plan associated with the share repurchase program was terminated on February 3, 2020.
17
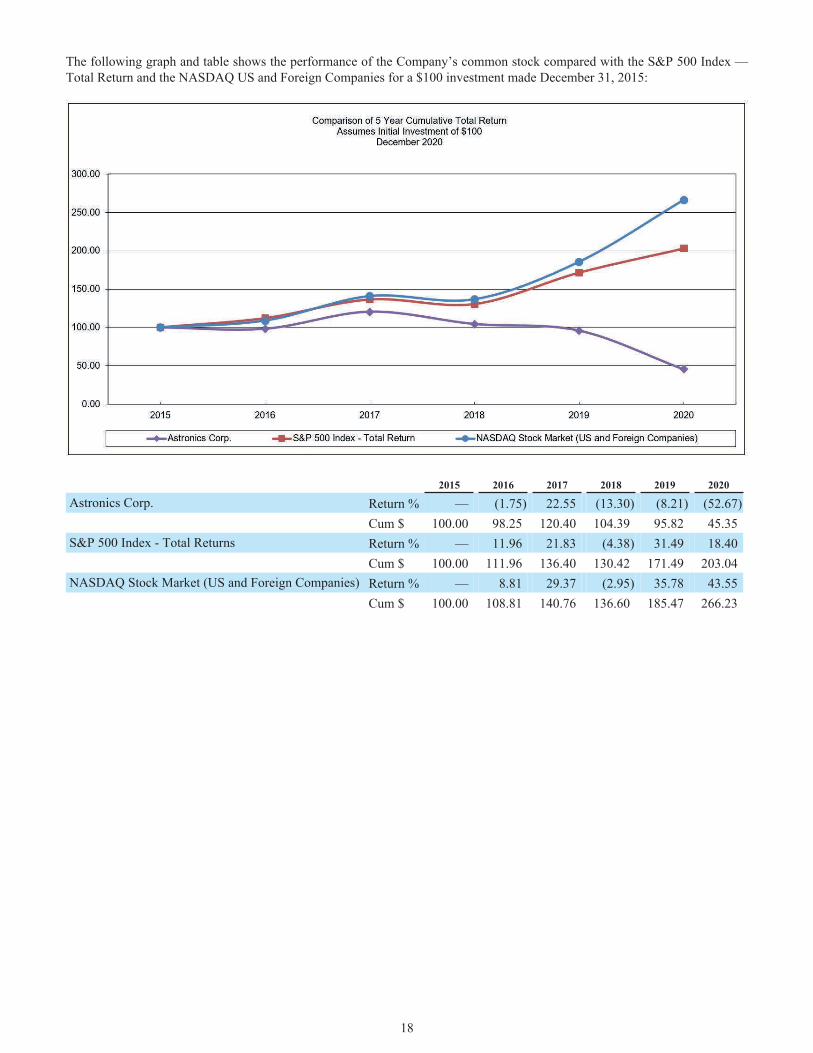
The following graph and table shows the performance of the Company’s common stock compared with the S&P 500 Index — Total Return and the NASDAQ US and Foreign Companies for a $100 investment made December 31, 2015:
2015 2016 2017 2018 2019 2020
Astronics Corp. Return % — (1.75) 22.55 (13.30) (8.21) (52.67) Cum $ 100.00 98.25 120.40 104.39 95.82 45.35
S&P 500 Index - Total Returns Return % — 11.96 21.83 (4.38) 31.49 18.40 Cum $ 100.00 111.96 136.40 130.42 171.49 203.04
NASDAQ Stock Market (US and Foreign Companies) Return % — 8.81 29.37 (2.95) 35.78 43.55 Cum $ 100.00 108.81 140.76 136.60 185.47 266.23
18
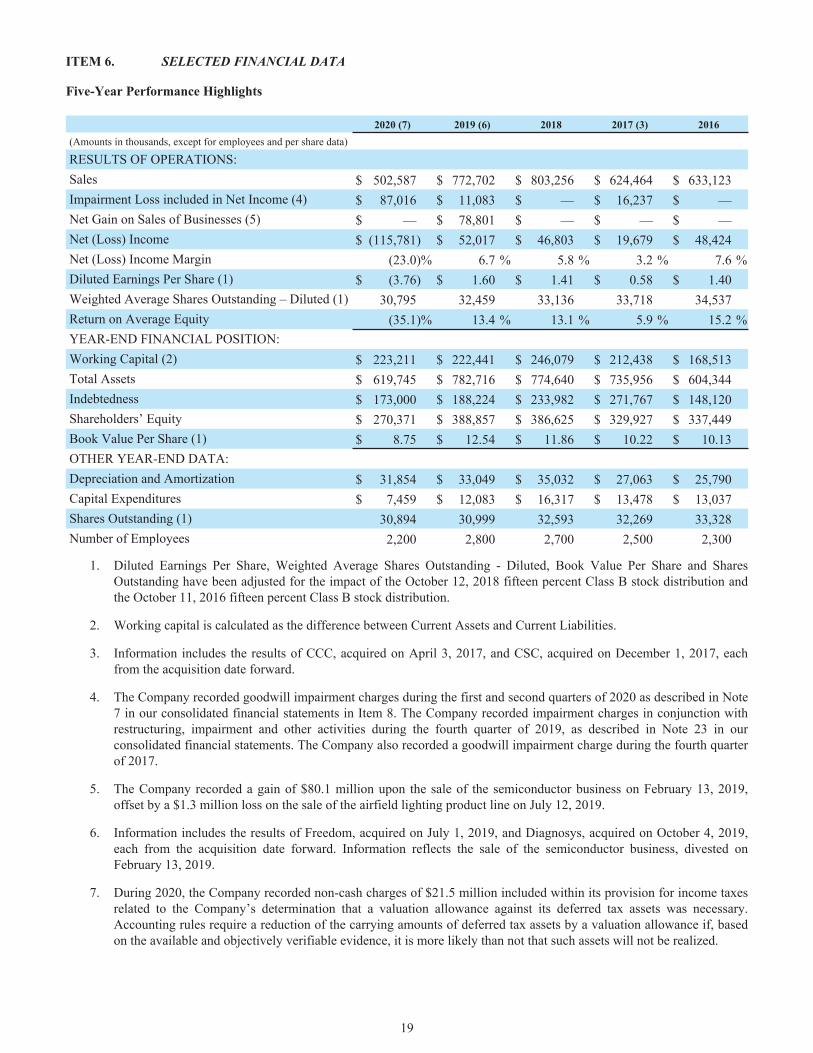
ITEM 6. SELECTED FINANCIAL DATA
Five-Year Performance Highlights
2020 (7) 2019 (6) 2018 2017 (3) 2016(Amounts in thousands, except for employees and per share data)
RESULTS OF OPERATIONS:Sales $ 502,587 $ 772,702 $ 803,256 $ 624,464 $ 633,123 Impairment Loss included in Net Income (4) $ 87,016 $ 11,083 $ — $ 16,237 $ — Net Gain on Sales of Businesses (5) $ — $ 78,801 $ — $ — $ — Net (Loss) Income $ (115,781) $ 52,017 $ 46,803 $ 19,679 $ 48,424 Net (Loss) Income Margin (23.0) % 6.7 % 5.8 % 3.2 % 7.6 %Diluted Earnings Per Share (1) $ (3.76) $ 1.60 $ 1.41 $ 0.58 $ 1.40 Weighted Average Shares Outstanding – Diluted (1) 30,795 32,459 33,136 33,718 34,537 Return on Average Equity (35.1) % 13.4 % 13.1 % 5.9 % 15.2 %YEAR-END FINANCIAL POSITION:Working Capital (2) $ 223,211 $ 222,441 $ 246,079 $ 212,438 $ 168,513 Total Assets $ 619,745 $ 782,716 $ 774,640 $ 735,956 $ 604,344 Indebtedness $ 173,000 $ 188,224 $ 233,982 $ 271,767 $ 148,120 Shareholders’ Equity $ 270,371 $ 388,857 $ 386,625 $ 329,927 $ 337,449 Book Value Per Share (1) $ 8.75 $ 12.54 $ 11.86 $ 10.22 $ 10.13 OTHER YEAR-END DATA:Depreciation and Amortization $ 31,854 $ 33,049 $ 35,032 $ 27,063 $ 25,790 Capital Expenditures $ 7,459 $ 12,083 $ 16,317 $ 13,478 $ 13,037 Shares Outstanding (1) 30,894 30,999 32,593 32,269 33,328 Number of Employees 2,200 2,800 2,700 2,500 2,300
1. Diluted Earnings Per Share, Weighted Average Shares Outstanding - Diluted, Book Value Per Share and Shares Outstanding have been adjusted for the impact of the October 12, 2018 fifteen percent Class B stock distribution and the October 11, 2016 fifteen percent Class B stock distribution.
2. Working capital is calculated as the difference between Current Assets and Current Liabilities.
3. Information includes the results of CCC, acquired on April 3, 2017, and CSC, acquired on December 1, 2017, each from the acquisition date forward.
4. The Company recorded goodwill impairment charges during the first and second quarters of 2020 as described in Note 7 in our consolidated financial statements in Item 8. The Company recorded impairment charges in conjunction with restructuring, impairment and other activities during the fourth quarter of 2019, as described in Note 23 in our consolidated financial statements. The Company also recorded a goodwill impairment charge during the fourth quarter of 2017.
5. The Company recorded a gain of $80.1 million upon the sale of the semiconductor business on February 13, 2019, offset by a $1.3 million loss on the sale of the airfield lighting product line on July 12, 2019.
6. Information includes the results of Freedom, acquired on July 1, 2019, and Diagnosys, acquired on October 4, 2019, each from the acquisition date forward. Information reflects the sale of the semiconductor business, divested on February 13, 2019.
7. During 2020, the Company recorded non-cash charges of $21.5 million included within its provision for income taxes related to the Company’s determination that a valuation allowance against its deferred tax assets was necessary. Accounting rules require a reduction of the carrying amounts of deferred tax assets by a valuation allowance if, based on the available and objectively verifiable evidence, it is more likely than not that such assets will not be realized.
19
ITEM 7. MANAGEMENT’S DISCUSSION AND ANALYSIS OF FINANCIAL CONDITION AND RESULTS OF OPERATIONS
OVERVIEW
Astronics Corporation, through its subsidiaries, is a leading supplier of advanced technologies and products to the global aerospace and defense and other mission-critical industries.
We have two reportable segments, Aerospace and Test Systems. Our Aerospace segment has principal operating facilities in the United States, Canada and France. Our Test Systems segment has principal operating facilities in the United States and the United Kingdom. We have engineering offices in the Ukraine and India.
Our Aerospace segment designs and manufactures products for the global aerospace industry. Product lines include lighting and safety systems, electrical power generation, distribution and seat motions systems, aircraft structures, avionics products, systems certification, and other products. Our primary Aerospace customers are the airframe manufacturers (“OEM”) that build aircraft for the commercial, military and general aviation markets, suppliers to those OEM’s, aircraft operators such as airlines, suppliers to the aircraft operators, and branches of the U.S. Department of Defense. Our Test Systems segment designs, develops, manufactures and maintains automated test systems that support the aerospace and defense, communications and mass transit industries as well as training and simulation devices for both commercial and military applications. In the Test Systems segment, Astronics’ products are sold to a global customer base including OEM's and prime government contractors for both electronics and military products.
Our strategy is to increase our value by developing technologies and capabilities, either internally or through acquisition, and using those capabilities to provide innovative solutions to our targeted markets where our technology can be beneficial.
Important factors affecting our growth and profitability are the ongoing impacts of the COVID-19 pandemic and the timing and extent of recovery (as discussed more fully below), the rate at which new aircraft are produced, government funding of military programs, our ability to have our products designed into new aircraft and the rates at which aircraft owners, including commercial airlines, refurbish or install upgrades to their aircraft. New aircraft build rates and aircraft owners spending on upgrades and refurbishments is cyclical and dependent on the strength of the global economy. Once designed into a new aircraft, the spare parts business is frequently retained by the Company. Future growth and profitability of the test business is dependent on developing and procuring new and follow-on business. The nature of our Test Systems business is such that it pursues large, often multi-year, projects. There can be significant periods of time between orders in this business which may result in large fluctuations of sales and profit levels and backlog from period to period. Test Systems segment customers include the Department of Defense, prime contractors to the Department of Defense, mass transit operators and prime contractors to mass transit operators.
Each of the markets that we serve presents opportunities that we expect will provide growth for the Company over the long-term. We continue to look for opportunities in all of our markets to capitalize on our core competencies to expand our existing business and to grow through strategic acquisitions.
Challenges which continue to face us include the ongoing COVID-19 pandemic and its continued impact on the aerospace industry and improving shareholder value through increasing profitability. Increasing profitability is dependent on many things, primarily sales growth, both acquired and organic, and the Company’s ability to control operating expenses and to identify means of creating improved productivity. Sales are driven by increased build rates for existing aircraft, market acceptance and economic success of new aircraft and our products, continued government funding of defense programs, the Company’s ability to obtain production contracts for parts we currently supply or have been selected to design and develop for new aircraft platforms and continually identifying and winning new business for our Test Systems segment.
Reduced aircraft build rates driven by a weak economy, aircraft groundings, tight credit markets, reduced air passenger travel and an increasing supply of used aircraft on the market would likely result in reduced demand for our products, which will result in lower profits. Reduction of defense spending may result in fewer opportunities for us to compete, which could result in lower profits in the future. Many of our newer development programs are based on new and unproven technology and at the same time we are challenged to develop the technology on a schedule that is consistent with specific programs. We will continue to address these challenges by working to improve operating efficiencies and focusing on executing on the growth opportunities currently in front of us.
RESTRUCTURING
The COVID-19 pandemic caused a significant impact on our sales and net income for fiscal 2020 and is expected to continue to do so into fiscal 2021. This is under the assumption that the COVID-19 pandemic will continue to adversely impact customer
20
demand for all market channels, with commercial transport (both OEM and aftermarket channels) being the most adversely impacted due to the pandemic's impact on air travel worldwide. As a result, the Company executed restructuring activities in the form of workforce reduction, primarily in the second quarter of 2020, to better align capacity with expected demand. Restructuring charges of $4.9 million in severance expense associated primarily with the Aerospace segment was recorded in the year ended December 31, 2020.
In the fourth quarter of 2019, in an effort to reduce the significant operating losses at our AeroSat business, we initiated a restructuring plan to reduce costs and minimize losses of our AeroSat antenna business. The plan focused the initiatives for the AeroSat business on near-term opportunities pertaining to business jet connectivity. The plan has a downsized manufacturing operation remaining in New Hampshire, with significantly reduced personnel and operating expenses. Impairments and restructuring charges recorded in 2019 as a result of the restructuring plan amounted to $28.8 million, all of which is included in the Aerospace segment. The Company incurred an impairment charge to right-of-use assets of approximately $0.7 million and $0.4 million in additional restructuring charges associated with severance at AeroSat during the year ended December 31, 2020.
ACQUISITIONS
On July 1, 2019, the Company acquired all of the issued and outstanding capital stock of Freedom Communication Technologies, Inc. (“Freedom”). Freedom, located in Kilgore, Texas, is a leader in wireless communication testing, primarily for the civil land mobile radio market. Freedom is included in our Test Systems segment. The total consideration for the transaction was $21.8 million, net of $0.6 million in cash acquired.
On October 4, 2019, the Company acquired the stock of the primary operating subsidiaries as well as certain other assets from mass transit and defense market test solution provider, Diagnosys Test Systems Limited, for $7.0 million in cash, plus earnouts estimated at a fair value of $2.5 million at acquisition. Diagnosys Inc. and its affiliates (“Diagnosys”) is included in our Test Systems segment. Diagnosys is a developer and manufacturer of comprehensive automated test equipment providing test, support, and repair of high value electronics, electro-mechanical, pneumatic and printed circuit boards focused on the global mass transit and defense markets. The terms of the acquisition allow for a potential earnout of up to an additional $13.0 million over the three years post-acquisition based on achievement of new order levels of over $72.0 million during that period. No earnout was payable for the period from acquisition through December 31, 2020. The acquired business has operations in Westford, Massachusetts as well as Ferndown, England, and an engineering center of excellence in Bangalore, India.
DIVESTITURES
On February 13, 2019, the Company completed a divestiture of its semiconductor test business within the Test Systems segment. The business was not core to the future of the Test Systems segment. The total cash proceeds received upon the divestiture amounted to $103.8 million. The Company recorded a pre-tax gain on the sale of $80.1 million in the first quarter of 2019. The Company recorded income tax expense relating to the gain of $19.7 million.
The transaction also includes two elements of contingent earnouts. The “First Earnout” is calculated based on a multiple of all future sales of existing and certain future derivative products to existing and future customers in each annual period from 2019 through 2022. The First Earnout may not exceed $35.0 million in total. The “Second Earnout” is calculated based on a multiple of future sales related to an existing product and program with an existing customer exceeding an annual threshold for each annual period from 2019 through 2022. The Second Earnout is not capped. For the Second Earnout, if the applicable sales in an annual period do not exceed the annual threshold, no amounts will be paid relative to such annual period; the sales in such annual period do not carry over to the next annual period. Due to the degree of uncertainty associated with estimating the future sales levels of the divested business and its underlying programs, and the lack of reliable predictive market information, the Company has elected an accounting policy to recognize such earnout proceeds, if received, as additional gain on sale when such proceeds are realized or realizable. We consider the proceeds realizable when we have received communication from the purchaser of its calculation of the earnout and the parties reach agreement on the calculation. No amounts were payable to the Company under either earnout for the year ended December 31, 2019. On February 13, 2021, the Company was notified by the purchaser that they have calculated $10.7 million as being payable to the Company under the First and Second Earnouts for the year ended December 31, 2020. There is a period by which we and the purchaser will review the earnout calculation, which is underway. Upon completion of the review and agreement of any adjustments, the Company expects to record the additional gain on the sale in the first quarter of 2021.
On July 12, 2019, the Company sold intellectual property and certain assets associated with its Airfield Lighting product line for $1.0 million in cash. The Airfield Lighting product line, part of the Aerospace segment, was not core to the business and represented less than 1% of revenue. The Company recorded a pre-tax loss on the sale of approximately $1.3 million.
21
MARKETS
Commercial Transport Market
The commercial transport market is our largest end market with sales driven by new aircraft production and aftermarket airline retrofit programs. In the commercial transport market, while many of our key long-term fundamentals remain intact, we continue to see near-term market pressure due to COVID-19. Despite solid progress on the vaccine front, 2021 will remain very challenging for our commercial transport products with improvement expected beginning in the second half of 2021 driven by the return to production of the 737 MAX and an expectation of improved activity with our airline customers. Aircraft build rates are expected to improve modestly during 2021 from current levels as production of the 737 MAX picks up, and the aftermarket is expected to strengthen over the course of the year as aircraft utilization and load factors increase. On the other hand, wide-body production rates and usage are expected to remain depressed throughout 2021 and possibly for several years due to low international travel demand caused by the pandemic.
Sales to the commercial transport market include sales of lighting and safety systems, electrical power generation, distribution and motions systems, aircraft structures, avionics products, systems certification, and other products. Sales to this market totaled approximately $262.6 million or 52.3% of our consolidated sales in 2020. As a result of the COVID-19 pandemic and its adverse impact on air travel worldwide, the commercial aerospace industry has been significantly disrupted. The significant impact of the COVID-19 pandemic on the commercial transport market channels has led to this market comprising a lower percentage of our net sales in fiscal 2020 than typical. When the commercial transport industry recovers from the disruption caused by the COVID-19 pandemic, we would expect commercial transport market sales to account for a percentage of net sales that is relatively in line with our historical results prior to the COVID-19 pandemic.
Maintaining and growing sales to the commercial transport market will depend not only on market recovery from the impacts of the COVID-19 pandemic, but also on airlines’ capital spending budgets for cabin upgrades as well as the purchase of new aircraft by global airlines. This spending by the airlines is impacted by their profits, cash flow and available financing as well as competitive pressures between the airlines to improve the travel experience for their passengers. We expect that new aircraft will be equipped with more passenger and aircraft connectivity and in-seat power than previous generation aircraft which drives demand for our avionics and power products. This market has historically experienced strong growth from airlines installing in-seat passenger power systems on their existing and newly delivered aircraft. Although the 737 MAX was re-certified in the United States in November 2020 and in Europe in January 2021, and that the demand for the aircraft in the long-term has not changed, further delays in regulatory approval of the Boeing 737 MAX in one or more jurisdictions could substantially decrease sales to this market in the near or long term which could have a material adverse effect on our business, financial condition, results of operations and cash flows. The 737 MAX situation affected us not only because it has been our largest production program, but also because the grounding reduced capacity in the world’s airline fleets, challenging our aftermarket business. Our ability to maintain and grow sales to this market depends on our ability to maintain our technological advantages over our competitors and maintain our relationships with major in-flight entertainment suppliers and global airlines.
Military Aerospace Market
Sales to the military aerospace market include sales of lighting & safety products, avionics products, electrical power & motion products and structures products. Sales to this market totaled approximately 13.5% of our consolidated sales and amounted to $67.9 million in 2020.
The military market is dependent on governmental funding which can change from year to year. Risks are that overall spending may be reduced in the future, specific programs may be eliminated or that we fail to win new business through the competitive bid process. Astronics does not have significant reliance on any one program such that cancellation of a particular program will cause material financial loss. We believe that we will continue to have opportunities similar to past years regarding this market.
Business Jet Market
The business jet market has also been impacted by the pandemic with new aircraft build rates significantly lower than the previous year. Most of our sales in this market are line-fit products driven by aircraft build rates although there are some aftermarket sales as well. We expect some improvement in the second half of 2021 moving into 2022 as build rates are expected to improve.
Sales to the business jet market include sales of lighting & safety products, avionics products, and electrical power & motion products. Sales to this market totaled approximately 12.0% of our consolidated sales in 2020 and amounted to $60.4 million.
Sales to the business jet market are driven by our ship set content on new aircraft and build rates of new aircraft. Business jet OEM build rates are impacted by global wealth creation and corporate profitability. We continue to see opportunities on new
22
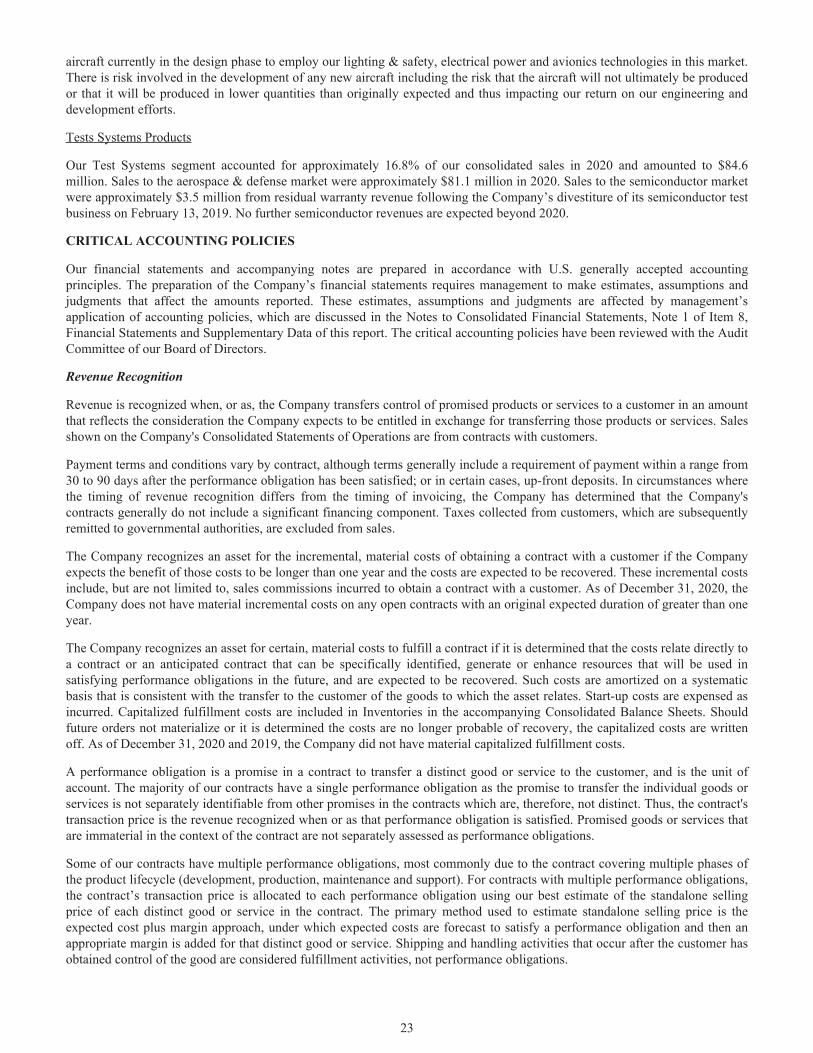
aircraft currently in the design phase to employ our lighting & safety, electrical power and avionics technologies in this market. There is risk involved in the development of any new aircraft including the risk that the aircraft will not ultimately be produced or that it will be produced in lower quantities than originally expected and thus impacting our return on our engineering and development efforts.
Tests Systems Products
Our Test Systems segment accounted for approximately 16.8% of our consolidated sales in 2020 and amounted to $84.6 million. Sales to the aerospace & defense market were approximately $81.1 million in 2020. Sales to the semiconductor market were approximately $3.5 million from residual warranty revenue following the Company’s divestiture of its semiconductor test business on February 13, 2019. No further semiconductor revenues are expected beyond 2020.
CRITICAL ACCOUNTING POLICIES
Our financial statements and accompanying notes are prepared in accordance with U.S. generally accepted accounting principles. The preparation of the Company’s financial statements requires management to make estimates, assumptions and judgments that affect the amounts reported. These estimates, assumptions and judgments are affected by management’s application of accounting policies, which are discussed in the Notes to Consolidated Financial Statements, Note 1 of Item 8, Financial Statements and Supplementary Data of this report. The critical accounting policies have been reviewed with the Audit Committee of our Board of Directors.
Revenue Recognition
Revenue is recognized when, or as, the Company transfers control of promised products or services to a customer in an amount that reflects the consideration the Company expects to be entitled in exchange for transferring those products or services. Sales shown on the Company's Consolidated Statements of Operations are from contracts with customers.
Payment terms and conditions vary by contract, although terms generally include a requirement of payment within a range from 30 to 90 days after the performance obligation has been satisfied; or in certain cases, up-front deposits. In circumstances where the timing of revenue recognition differs from the timing of invoicing, the Company has determined that the Company's contracts generally do not include a significant financing component. Taxes collected from customers, which are subsequently remitted to governmental authorities, are excluded from sales.
The Company recognizes an asset for the incremental, material costs of obtaining a contract with a customer if the Company expects the benefit of those costs to be longer than one year and the costs are expected to be recovered. These incremental costs include, but are not limited to, sales commissions incurred to obtain a contract with a customer. As of December 31, 2020, the Company does not have material incremental costs on any open contracts with an original expected duration of greater than one year.
The Company recognizes an asset for certain, material costs to fulfill a contract if it is determined that the costs relate directly to a contract or an anticipated contract that can be specifically identified, generate or enhance resources that will be used in satisfying performance obligations in the future, and are expected to be recovered. Such costs are amortized on a systematic basis that is consistent with the transfer to the customer of the goods to which the asset relates. Start-up costs are expensed as incurred. Capitalized fulfillment costs are included in Inventories in the accompanying Consolidated Balance Sheets. Should future orders not materialize or it is determined the costs are no longer probable of recovery, the capitalized costs are written off. As of December 31, 2020 and 2019, the Company did not have material capitalized fulfillment costs.
A performance obligation is a promise in a contract to transfer a distinct good or service to the customer, and is the unit of account. The majority of our contracts have a single performance obligation as the promise to transfer the individual goods or services is not separately identifiable from other promises in the contracts which are, therefore, not distinct. Thus, the contract's transaction price is the revenue recognized when or as that performance obligation is satisfied. Promised goods or services that are immaterial in the context of the contract are not separately assessed as performance obligations.
Some of our contracts have multiple performance obligations, most commonly due to the contract covering multiple phases of the product lifecycle (development, production, maintenance and support). For contracts with multiple performance obligations, the contract’s transaction price is allocated to each performance obligation using our best estimate of the standalone selling price of each distinct good or service in the contract. The primary method used to estimate standalone selling price is the expected cost plus margin approach, under which expected costs are forecast to satisfy a performance obligation and then an appropriate margin is added for that distinct good or service. Shipping and handling activities that occur after the customer has obtained control of the good are considered fulfillment activities, not performance obligations.
23
Some of our contracts offer price discounts or free units after a specified volume has been purchased. The Company evaluates these options to determine whether they provide a material right to the customer, representing a separate performance obligation. If the option provides a material right to the customer, revenue is allocated to these rights and recognized when those future goods or services are transferred, or when the option expires.
Contract modifications are routine in the performance of our contracts. Contracts are often modified to account for changes in contract specifications or requirements. In most instances, contract modifications are for goods or services that are distinct, and, therefore, are accounted for as new contracts. The effect of modifications has been reflected when identifying the satisfied and unsatisfied performance obligations, determining the transaction price and allocating the transaction price.
The majority of the Company’s revenue from contracts with customers is recognized at a point in time, when the customer obtains control of the promised product, which is generally upon delivery and acceptance by the customer. These contracts may provide credits or incentives, which may be accounted for as variable consideration. Variable consideration is estimated at the most likely amount to predict the consideration to which the Company will be entitled, and only to the extent it is probable that a subsequent change in estimate will not result in a significant revenue reversal when estimating the amount of revenue to recognize. Variable consideration is treated as a change to the sales transaction price and based on an assessment of all information (i.e., historical, current and forecasted) that is reasonably available to the Company, and estimated at contract inception and updated at the end of each reporting period as additional information becomes available. Most of our contracts do not contain rights to return product; where this right does exist, it is evaluated as possible variable consideration.
For contracts that are subject to the requirement to accrue anticipated losses, the company recognizes the entire anticipated loss in the period that the loss becomes probable.
For contracts with customers in which the Company promises to provide a product to the customer that has no alternative use to the Company and the Company has enforceable rights to payment for progress completed to date inclusive of profit, the Company satisfies the performance obligation and recognizes revenue over time, using costs incurred to date relative to total estimated costs at completion to measure progress toward satisfying our performance obligations. Incurred cost represents work performed, which corresponds with, and thereby best depicts, the transfer of control to the customer. Contract costs include labor, material and overhead.
The Company also recognizes revenue from service contracts (including service-type warranties) over time. The Company recognizes revenue over time during the term of the agreement as the customer is simultaneously receiving and consuming the benefits provided throughout the Company’s performance. The Company typically recognizes revenue on a straight-line basis throughout the contract period.
Reviews for Impairment of Long-Lived Assets
Goodwill Impairment Testing
Our goodwill is the result of the excess of purchase price over net assets acquired from acquisitions. As of December 31, 2020, we had approximately $58.3 million of goodwill. As of December 31, 2019, we had approximately $145.0 million of goodwill.
We identify our reporting units by assessing whether the components of our operating segments constitute businesses for which discrete financial information is available and segment management regularly reviews the operating results of those components. The Test Systems operating segment is its own reporting unit while the other reporting units are one level below our Aerospace operating segment.
Companies may perform a qualitative assessment as the initial step in the annual goodwill impairment testing process for all or selected reporting units under certain circumstances. Companies are also allowed to bypass the qualitative analysis and perform a quantitative analysis if desired. Economic uncertainties and the length of time from the calculation of a baseline fair value are factors that we would consider in determining whether to perform a quantitative test. The Company tests goodwill at the reporting unit level on an annual basis or more frequently if an event occurs or circumstances change that would more likely than not reduce the fair value of a reporting unit below its carrying amount.
Quantitative testing first requires a comparison of the fair value of each reporting unit to the carrying value. We use the discounted cash flow method to estimate the fair value of each of our reporting units. The discounted cash flow method incorporates various assumptions, the most significant being projected sales growth rates, operating profit margins and cash flows, the terminal growth rate and the discount rate. Management projects sales growth rates, operating margins and cash flows based on each reporting unit’s current business, expected developments and operational strategies. If the carrying value of the reporting unit exceeds its fair value, goodwill is considered impaired and any loss must be measured. Goodwill impairment
24
is measured as the amount by which a reporting unit's carrying value exceeds its fair value, not to exceed the carrying value of goodwill.
As a result of the qualitative factors related to the COVID-19 pandemic that surfaced during the first quarter of 2020, we performed interim quantitative assessments for the eight reporting units which had goodwill as of March 28, 2020, and an additional quantitative assessment for our PECO reporting unit as of June 27, 2020 driven by reductions from previously forecasted aircraft build rates. Based on our quantitative assessments, the Company recorded goodwill impairment charges associated with four Aerospace reporting units, totaling $86.3 million within the Impairment Loss line in the December 31, 2020 Consolidated Statements of Operations.
The Company’s five reporting units remaining with goodwill as of the first day of our fourth quarter were subject to the annual goodwill impairment test. Based on our quantitative assessments of our reporting units performed during our annual goodwill impairment test, we concluded that no additional goodwill impairment was required.
In 2019, we performed quantitative assessments for the reporting units which had goodwill as of the first day of the fourth quarter. Based on our quantitative assessment, the Company recorded a full goodwill impairment charge of approximately $1.6 million in the December 31, 2019 Consolidated Statements of Operations associated with the AeroSat reporting unit. The impairment loss was incurred in the Aerospace segment and is reported within the Impairment Loss line of the Consolidated Statements of Operations.
CONSOLIDATED RESULTS OF OPERATIONS AND OUTLOOK
(In thousands, except percentages) 2020 2019 (1) 2018
Sales $ 502,587 $ 772,702 $ 803,256 Gross Margin 19.3 % 20.2 % 22.5 %SG&A Expenses as a Percentage of Sales 22.0 % 18.6 % 14.6 %Impairment Loss $ 87,016 $ 11,083 $ — Net Gain on Sale of Businesses $ — $ 78,801 $ — Interest Expense $ 6,741 $ 6,141 $ 9,710 Effective Tax Rate (3.0) % 23.8 % 10.5 %Net (Loss) Income $ (115,781) $ 52,017 $ 46,803
(1) Financial results reflect the divestiture of the Test Systems’ semiconductor business on February 13, 2019, and the acquisitions of Freedom acquired in July 2019, and Diagnosys acquired in October 2019 (collectively, the “Acquired Businesses”).
A discussion by segment can be found at “Segment Results of Operations and Outlook” in this MD&A.
CONSOLIDATED OVERVIEW OF OPERATIONS
2020 Compared With 2019
Consolidated sales were down $270.1 million to $502.6 million compared to the prior year. Aerospace sales were down $274.6 million. Test System sales increased $4.5 million.
Consolidated cost of products sold decreased $210.8 million to $405.7 million in 2020 from $616.6 million in the prior year. The decrease was primarily due to lower sales volume in 2020 due to the combination of the impacts of the COVID-19 pandemic on aerospace markets and the continued 737 MAX grounding. The Company rapidly adjusted to the changed environment by aggressively adjusting its cost structure to changed demand, initiating workforce reduction activities and cost conservation activities including suspension of certain benefit programs and wage adjustments and reduction or elimination of discretionary spending. The lower volume and the impact of these measures resulted in a significant reduction in cost of products sold in 2020 compared with the prior year. Consolidated cost of products sold in 2019 included charges recorded for tariff expense of $5.9 million and $15.4 million of charges associated with the restructuring and impairment charges of our AeroSat antenna business which required classification within cost of products sold.
Selling, general and administrative (“SG&A”) expenses were $110.5 million compared with $143.4 million for the prior year period. The decrease in 2020 was due to the cost conservation activities referred to above, though these savings were partially offset by associated severance charges of $5.3 million. The prior year period included charges for a long-term patent dispute of
25
$19.6 million and impairment and restructuring charges related to the antenna business classified within SG&A expense of $2.4 million.
Further, non-cash impairment charges of $87.0 million in the Aerospace segment were recognized in the current year due to reduced expectations of future operating results due to the COVID-19 pandemic, which has significantly impacted the global economy, and particularly the aerospace industry. During the first quarter, the Company recognized full impairments of the goodwill of Astronics Connectivity Systems and Certification (“CSC”), PGA and Custom Control Concepts (“CCC”) reporting units, and a partial impairment of the goodwill of the PECO reporting unit. During the second quarter of 2020, an additional partial impairment of the PECO reporting unit goodwill was recorded.
The Company recorded in the prior-year period a gain of $80.1 million upon the sale of the semiconductor business on February 13, 2019, partially offset by a $1.3 million loss on the sale of the airfield lighting product line on July 12, 2019.
Consolidated net loss was $115.8 million, or $(3.76) per diluted share, compared with net income of $52.0 million, or $1.60 per diluted share in the prior year. The after-tax impact of the impairment loss in 2020 was $81.4 million, or $(2.64) per diluted share. The $80.1 million pre-tax gain on the sale of the semiconductor test business in contributed $60.4 million to net income after taxes in 2019.
Other expense, net of other income includes charges of $3.5 million and $5.0 million related to impairments of equity investments in 2020 and 2019, respectively.
The effective tax rate for 2020 was (3.0)%, compared with 23.8% in 2019. The effective tax rate in 2020 was impacted by a $21.5 million valuation allowance against federal deferred tax assets as well as permanently non-deductible goodwill impairments. See Note 11 of the consolidated financial statements at Item 8 of this report for additional information regarding the valuation allowance recorded in 2020.
2019 Compared With 2018
Consolidated sales for the full year of 2019 decreased $30.6 million to $772.7 million, primarily because of the divested semiconductor business which had sales of $9.7 million in 2019 and $84.3 million in 2018.
Consolidated cost of products sold decreased $6.0 million to $616.6 million in 2019 from $622.6 million in the prior year. The decline was due to lower sales, primarily due to the divestiture of the semiconductor business, partially offset with incremental tariff expense of $5.9 million and $15.4 million of charges associated with the restructuring and impairment charges of our AeroSat antenna business which required classification within cost of products sold.
SG&A expenses were $143.4 million, or 18.6% or sales, compared with $117.0 million, or 14.6% of sales, for the prior year period. The $26.3 million increase was due to increased legal reserves for the long-term patent dispute of $19.6 million and impairment and restructuring charges related to the antenna business classified within SG&A expense of $2.4 million.
The Company recorded a gain of $80.1 million upon the sale of the semiconductor business on February 13, 2019, offset by a $1.3 million loss on the sale of the airfield lighting product line on July 12, 2019.
Other expense, net of other income in 2019 includes a $5.0 million impairment of an equity investment.
Income Taxes
Our effective tax rates for 2020, 2019 and 2018 were (3.0)%, 23.8% and 10.5%, respectively. Our tax rate is affected by recurring items, such as tax rates in foreign jurisdictions and the relative amount of income we earn in those jurisdictions, which we expect to be fairly consistent in the near term. It is also affected by discrete items that may occur in any given year, but are not consistent from year to year. Our tax rate is also affected by the recognition of valuation allowances against deferred tax assets if, based on the available evidence, it is not more likely than not (defined as a likelihood of more than 50%) that all or a portion of such assets will not be realized. In addition to state income taxes, the following items had the most significant impact on the difference between our statutory U.S. federal income tax rate (21% in 2020, 2019 and 2018) and our effective tax rate:
2020:
1. Recognition of approximately $21.5 million of valuation allowance against federal deferred tax assets. See Note 11 of the consolidated financial statements at Item 8 of this report for additional information.
2. Permanently non-deductible goodwill impairment
26
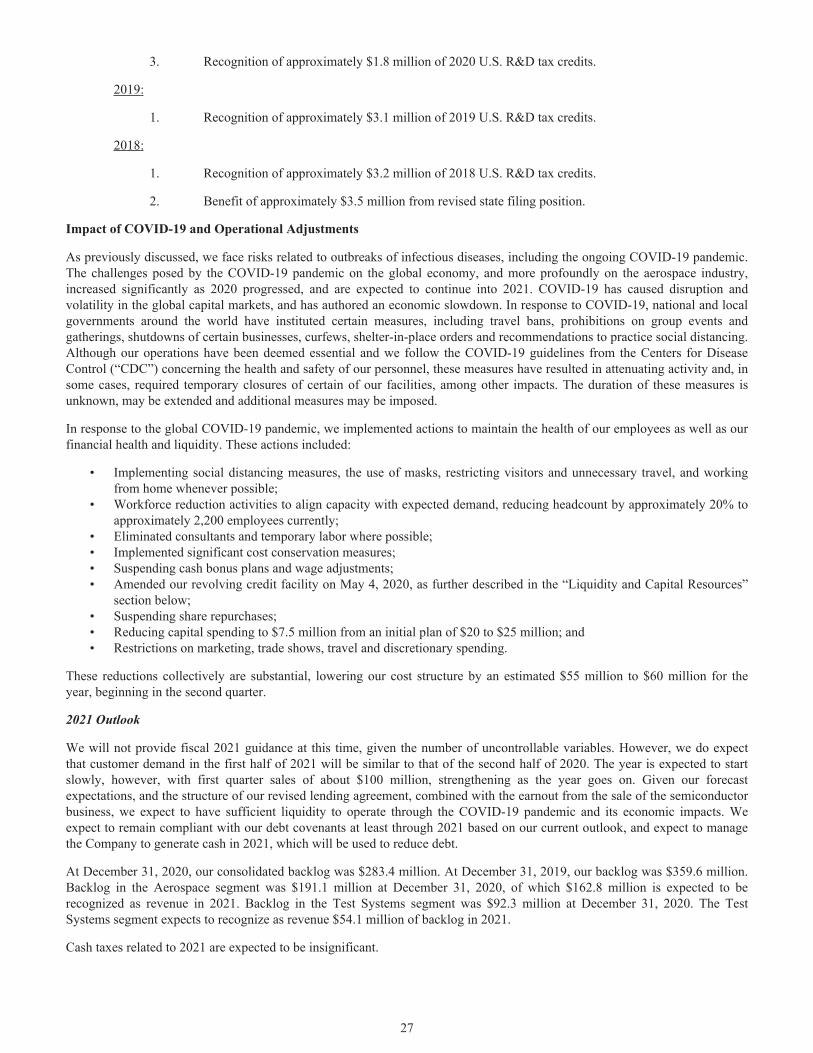
3. Recognition of approximately $1.8 million of 2020 U.S. R&D tax credits.
2019:
1. Recognition of approximately $3.1 million of 2019 U.S. R&D tax credits.
2018:
1. Recognition of approximately $3.2 million of 2018 U.S. R&D tax credits.
2. Benefit of approximately $3.5 million from revised state filing position.
Impact of COVID-19 and Operational Adjustments
As previously discussed, we face risks related to outbreaks of infectious diseases, including the ongoing COVID-19 pandemic. The challenges posed by the COVID-19 pandemic on the global economy, and more profoundly on the aerospace industry, increased significantly as 2020 progressed, and are expected to continue into 2021. COVID-19 has caused disruption and volatility in the global capital markets, and has authored an economic slowdown. In response to COVID-19, national and local governments around the world have instituted certain measures, including travel bans, prohibitions on group events and gatherings, shutdowns of certain businesses, curfews, shelter-in-place orders and recommendations to practice social distancing. Although our operations have been deemed essential and we follow the COVID-19 guidelines from the Centers for Disease Control (“CDC”) concerning the health and safety of our personnel, these measures have resulted in attenuating activity and, in some cases, required temporary closures of certain of our facilities, among other impacts. The duration of these measures is unknown, may be extended and additional measures may be imposed.
In response to the global COVID-19 pandemic, we implemented actions to maintain the health of our employees as well as our financial health and liquidity. These actions included:
• Implementing social distancing measures, the use of masks, restricting visitors and unnecessary travel, and working from home whenever possible;
• Workforce reduction activities to align capacity with expected demand, reducing headcount by approximately 20% to approximately 2,200 employees currently;
• Eliminated consultants and temporary labor where possible;• Implemented significant cost conservation measures;• Suspending cash bonus plans and wage adjustments;• Amended our revolving credit facility on May 4, 2020, as further described in the “Liquidity and Capital Resources”
section below;• Suspending share repurchases;• Reducing capital spending to $7.5 million from an initial plan of $20 to $25 million; and• Restrictions on marketing, trade shows, travel and discretionary spending.
These reductions collectively are substantial, lowering our cost structure by an estimated $55 million to $60 million for the year, beginning in the second quarter.
2021 Outlook
We will not provide fiscal 2021 guidance at this time, given the number of uncontrollable variables. However, we do expect that customer demand in the first half of 2021 will be similar to that of the second half of 2020. The year is expected to start slowly, however, with first quarter sales of about $100 million, strengthening as the year goes on. Given our forecast expectations, and the structure of our revised lending agreement, combined with the earnout from the sale of the semiconductor business, we expect to have sufficient liquidity to operate through the COVID-19 pandemic and its economic impacts. We expect to remain compliant with our debt covenants at least through 2021 based on our current outlook, and expect to manage the Company to generate cash in 2021, which will be used to reduce debt.
At December 31, 2020, our consolidated backlog was $283.4 million. At December 31, 2019, our backlog was $359.6 million. Backlog in the Aerospace segment was $191.1 million at December 31, 2020, of which $162.8 million is expected to be recognized as revenue in 2021. Backlog in the Test Systems segment was $92.3 million at December 31, 2020. The Test Systems segment expects to recognize as revenue $54.1 million of backlog in 2021.
Cash taxes related to 2021 are expected to be insignificant.
27
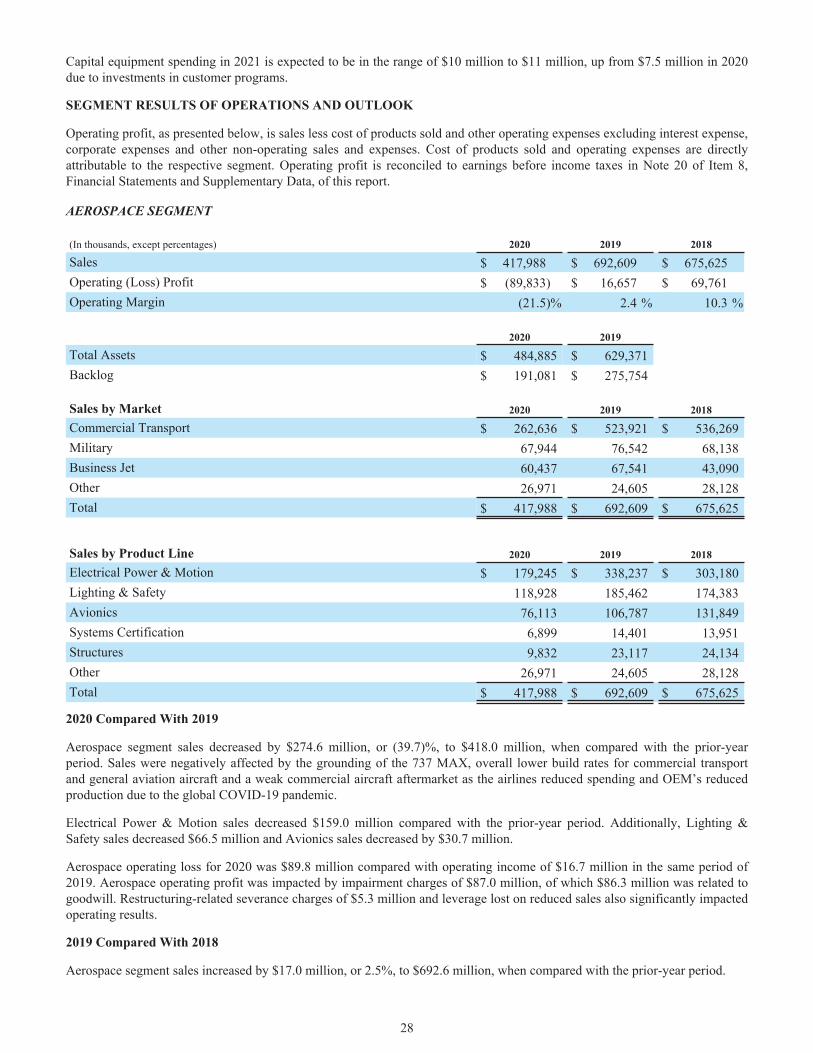
Capital equipment spending in 2021 is expected to be in the range of $10 million to $11 million, up from $7.5 million in 2020 due to investments in customer programs.
SEGMENT RESULTS OF OPERATIONS AND OUTLOOK
Operating profit, as presented below, is sales less cost of products sold and other operating expenses excluding interest expense, corporate expenses and other non-operating sales and expenses. Cost of products sold and operating expenses are directly attributable to the respective segment. Operating profit is reconciled to earnings before income taxes in Note 20 of Item 8, Financial Statements and Supplementary Data, of this report.
AEROSPACE SEGMENT
(In thousands, except percentages) 2020 2019 2018
Sales $ 417,988 $ 692,609 $ 675,625 Operating (Loss) Profit $ (89,833) $ 16,657 $ 69,761 Operating Margin (21.5) % 2.4 % 10.3 %
2020 2019
Total Assets $ 484,885 $ 629,371 Backlog $ 191,081 $ 275,754
Sales by Market 2020 2019 2018
Commercial Transport $ 262,636 $ 523,921 $ 536,269 Military 67,944 76,542 68,138 Business Jet 60,437 67,541 43,090 Other 26,971 24,605 28,128 Total $ 417,988 $ 692,609 $ 675,625
Sales by Product Line 2020 2019 2018
Electrical Power & Motion $ 179,245 $ 338,237 $ 303,180 Lighting & Safety 118,928 185,462 174,383 Avionics 76,113 106,787 131,849 Systems Certification 6,899 14,401 13,951 Structures 9,832 23,117 24,134 Other 26,971 24,605 28,128 Total $ 417,988 $ 692,609 $ 675,625
2020 Compared With 2019
Aerospace segment sales decreased by $274.6 million, or (39.7)%, to $418.0 million, when compared with the prior-year period. Sales were negatively affected by the grounding of the 737 MAX, overall lower build rates for commercial transport and general aviation aircraft and a weak commercial aircraft aftermarket as the airlines reduced spending and OEM’s reduced production due to the global COVID-19 pandemic.
Electrical Power & Motion sales decreased $159.0 million compared with the prior-year period. Additionally, Lighting & Safety sales decreased $66.5 million and Avionics sales decreased by $30.7 million.
Aerospace operating loss for 2020 was $89.8 million compared with operating income of $16.7 million in the same period of 2019. Aerospace operating profit was impacted by impairment charges of $87.0 million, of which $86.3 million was related to goodwill. Restructuring-related severance charges of $5.3 million and leverage lost on reduced sales also significantly impacted operating results.
2019 Compared With 2018
Aerospace segment sales increased by $17.0 million, or 2.5%, to $692.6 million, when compared with the prior-year period.
28
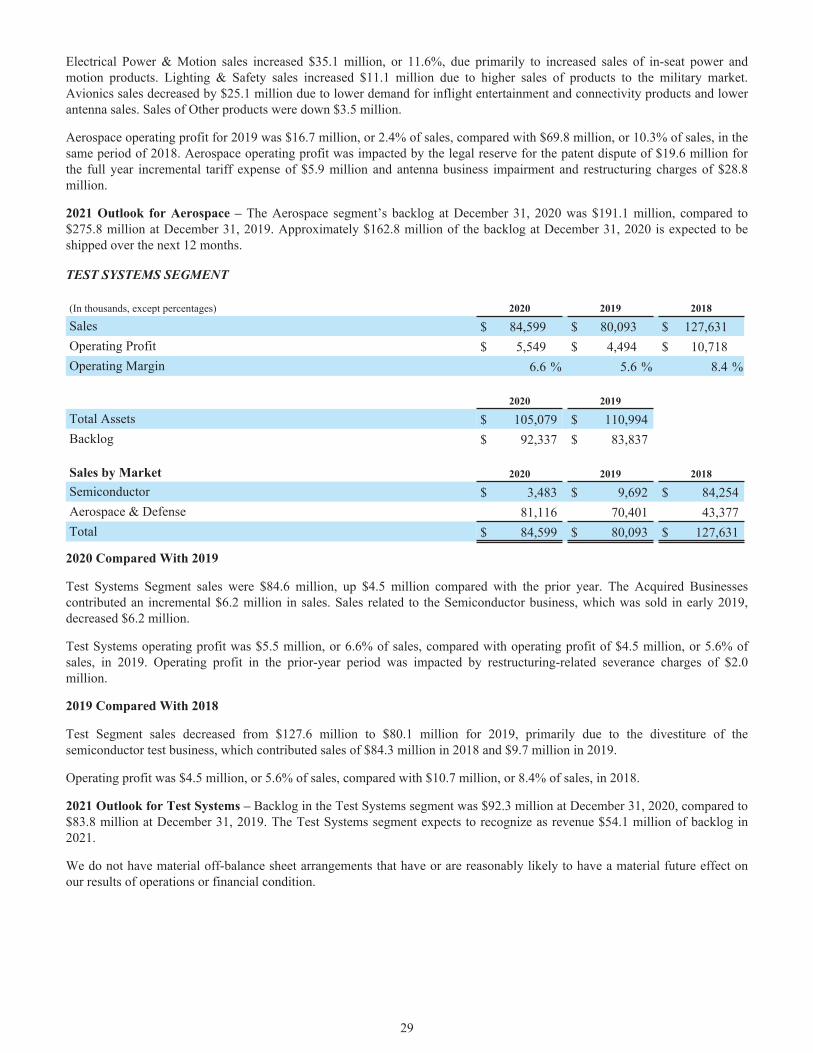
Electrical Power & Motion sales increased $35.1 million, or 11.6%, due primarily to increased sales of in-seat power and motion products. Lighting & Safety sales increased $11.1 million due to higher sales of products to the military market. Avionics sales decreased by $25.1 million due to lower demand for inflight entertainment and connectivity products and lower antenna sales. Sales of Other products were down $3.5 million.
Aerospace operating profit for 2019 was $16.7 million, or 2.4% of sales, compared with $69.8 million, or 10.3% of sales, in the same period of 2018. Aerospace operating profit was impacted by the legal reserve for the patent dispute of $19.6 million for the full year incremental tariff expense of $5.9 million and antenna business impairment and restructuring charges of $28.8 million.
2021 Outlook for Aerospace – The Aerospace segment’s backlog at December 31, 2020 was $191.1 million, compared to $275.8 million at December 31, 2019. Approximately $162.8 million of the backlog at December 31, 2020 is expected to be shipped over the next 12 months.
TEST SYSTEMS SEGMENT
(In thousands, except percentages) 2020 2019 2018
Sales $ 84,599 $ 80,093 $ 127,631 Operating Profit $ 5,549 $ 4,494 $ 10,718 Operating Margin 6.6 % 5.6 % 8.4 %
2020 2019
Total Assets $ 105,079 $ 110,994 Backlog $ 92,337 $ 83,837
Sales by Market 2020 2019 2018
Semiconductor $ 3,483 $ 9,692 $ 84,254 Aerospace & Defense 81,116 70,401 43,377 Total $ 84,599 $ 80,093 $ 127,631
2020 Compared With 2019
Test Systems Segment sales were $84.6 million, up $4.5 million compared with the prior year. The Acquired Businesses contributed an incremental $6.2 million in sales. Sales related to the Semiconductor business, which was sold in early 2019, decreased $6.2 million.
Test Systems operating profit was $5.5 million, or 6.6% of sales, compared with operating profit of $4.5 million, or 5.6% of sales, in 2019. Operating profit in the prior-year period was impacted by restructuring-related severance charges of $2.0 million.
2019 Compared With 2018
Test Segment sales decreased from $127.6 million to $80.1 million for 2019, primarily due to the divestiture of the semiconductor test business, which contributed sales of $84.3 million in 2018 and $9.7 million in 2019.
Operating profit was $4.5 million, or 5.6% of sales, compared with $10.7 million, or 8.4% of sales, in 2018.
2021 Outlook for Test Systems – Backlog in the Test Systems segment was $92.3 million at December 31, 2020, compared to $83.8 million at December 31, 2019. The Test Systems segment expects to recognize as revenue $54.1 million of backlog in 2021.
We do not have material off-balance sheet arrangements that have or are reasonably likely to have a material future effect on our results of operations or financial condition.
29
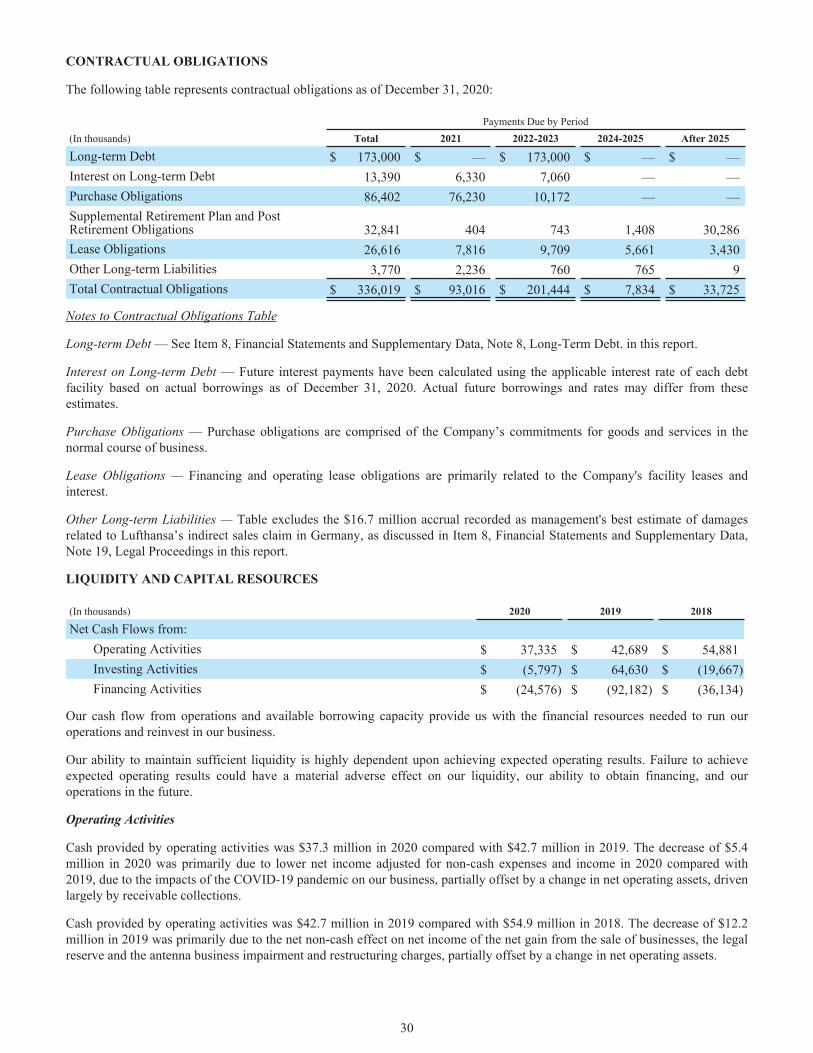
CONTRACTUAL OBLIGATIONS
The following table represents contractual obligations as of December 31, 2020:
Payments Due by Period(In thousands) Total 2021 2022-2023 2024-2025 After 2025
Long-term Debt $ 173,000 $ — $ 173,000 $ — $ — Interest on Long-term Debt 13,390 6,330 7,060 — — Purchase Obligations 86,402 76,230 10,172 — — Supplemental Retirement Plan and Post Retirement Obligations 32,841 404 743 1,408 30,286 Lease Obligations 26,616 7,816 9,709 5,661 3,430 Other Long-term Liabilities 3,770 2,236 760 765 9 Total Contractual Obligations $ 336,019 $ 93,016 $ 201,444 $ 7,834 $ 33,725
Notes to Contractual Obligations Table
Long-term Debt — See Item 8, Financial Statements and Supplementary Data, Note 8, Long-Term Debt. in this report.
Interest on Long-term Debt — Future interest payments have been calculated using the applicable interest rate of each debt facility based on actual borrowings as of December 31, 2020. Actual future borrowings and rates may differ from these estimates.
Purchase Obligations — Purchase obligations are comprised of the Company’s commitments for goods and services in the normal course of business.
Lease Obligations — Financing and operating lease obligations are primarily related to the Company's facility leases and interest.
Other Long-term Liabilities — Table excludes the $16.7 million accrual recorded as management's best estimate of damages related to Lufthansa’s indirect sales claim in Germany, as discussed in Item 8, Financial Statements and Supplementary Data, Note 19, Legal Proceedings in this report.
LIQUIDITY AND CAPITAL RESOURCES
(In thousands) 2020 2019 2018
Net Cash Flows from:Operating Activities $ 37,335 $ 42,689 $ 54,881 Investing Activities $ (5,797) $ 64,630 $ (19,667) Financing Activities $ (24,576) $ (92,182) $ (36,134)
Our cash flow from operations and available borrowing capacity provide us with the financial resources needed to run our operations and reinvest in our business.
Our ability to maintain sufficient liquidity is highly dependent upon achieving expected operating results. Failure to achieve expected operating results could have a material adverse effect on our liquidity, our ability to obtain financing, and our operations in the future.
Operating Activities
Cash provided by operating activities was $37.3 million in 2020 compared with $42.7 million in 2019. The decrease of $5.4 million in 2020 was primarily due to lower net income adjusted for non-cash expenses and income in 2020 compared with 2019, due to the impacts of the COVID-19 pandemic on our business, partially offset by a change in net operating assets, driven largely by receivable collections.
Cash provided by operating activities was $42.7 million in 2019 compared with $54.9 million in 2018. The decrease of $12.2 million in 2019 was primarily due to the net non-cash effect on net income of the net gain from the sale of businesses, the legal reserve and the antenna business impairment and restructuring charges, partially offset by a change in net operating assets.
30
Our cash flows from operations are primarily dependent on our net income adjusted for non-cash expenses and the timing of collections of receivables, level of inventory and payments to suppliers and employees. Sales and operating results of our Aerospace segment are influenced by the impact in 2020 of the COVID-19 pandemic on the aerospace industry, in particular, build rates of new aircraft, which are subject to general economic conditions, airline passenger travel and spending for government and military programs. Our Test Systems segment sales depends in part on capital expenditures of the aerospace & defense industry which, in turn, depend on current and future demand for those products. A reduction in demand for our customers’ products would adversely affect our operating results and cash flows. We maintain a revolving credit facility to fund our short and long-term capital requirements including working capital, acquisitions and share repurchase efforts.
Investing Activities
Cash used for investing activities in 2020 was $5.8 million, primarily the result of purchases of property, plant and equipment (“PP&E”) of $7.5 million, partially offset by proceeds from sales of PP&E.
Cash provided by investing activities in 2019 was $64.6 million, primarily the result of the $103.8 million in proceeds from the divestiture of the semiconductor business offset by purchases of property, plant and equipment (“PP&E”) of $12.1 million. Cash provided by investing activities in 2019 was also offset by net cash used for the purchases of Freedom and Diagnosys for $21.8 million and $7.0 million, respectively.
Cash used for investing activities in 2018 was $19.7 million, primarily related to purchases of PP&E of $16.3 million.
Our expectation for 2021 is that we will invest between $10 million and $11 million for PP&E. Future requirements for PP&E depend on numerous factors, including expansion of existing product lines and introduction of new products. Management believes that our cash flow from operations and current borrowing arrangements will provide for these capital expenditures. We expect to continue to evaluate acquisition opportunities in the future.
Financing Activities
The Company's Fifth Amended and Restated Credit Agreement (the “Agreement”) provided for a $500 million revolving credit line with the option to increase the line by up to $150 million. The maturity date of the loans under the Agreement is February 16, 2023. The maximum leverage ratio of funded debt to Adjusted EBITDA (as defined in the Agreement) was 3.75 to 1, increasing to 4.50 to 1 for up to four fiscal quarters following the closing of an acquisition permitted under the Agreement, subject to limitations. The Company paid interest on the unpaid principal amount of the facility at a rate equal to one-, three- or six-month LIBOR plus between 1.00% and 1.50% based upon the Company’s leverage ratio. The Company also paid a commitment fee to the Lenders in an amount equal to between 0.10% and 0.20% on the undrawn portion of the credit facility, based upon the Company’s leverage ratio.
The COVID-19 pandemic has significantly impacted the global economy, and particularly the aerospace industry, resulting in reduced expectations of the Company’s future operating results. As a result, the Company was projected to exceed its maximum leverage ratio in the fourth quarter of 2020. Accordingly, on May 4, 2020, the Company executed an amendment to the Agreement (the “Amended Facility”), which reduced the revolving credit line from $500 million to $375 million. The Amended Facility suspends the application of the maximum net leverage ratio up through and including the second quarter of 2021 (the “suspension period”). The maximum net leverage ratio will be 6.00 to 1 for the third quarter of 2021, 5.50 to 1 for the fourth quarter of 2021, 4.50 to 1 for the first quarter of 2022, and return to 3.75 to 1 for each quarter thereafter.
Through the third quarter of 2021, the Amended Facility requires the Company to maintain minimum liquidity, defined as unrestricted cash plus the unused revolving credit commitments, of $180.0 million at all times. Through the second quarter of 2021, the Company is required to maintain a minimum interest coverage ratio of 1.75x on a quarterly basis, except for the first quarter of 2021, which is set at 1.50x. The interest coverage ratio at December 31, 2020 was 6.34x. The Company was in compliance with its financial covenants at December 31, 2020. During the suspension period, the Company will pay interest on the unpaid principal amount of the Amended Facility at a rate equal to one-, three- or six-month LIBOR (which shall be at least 1.00%) plus 2.25%. The Company will also pay a commitment fee to the lenders in an amount equal to 0.35% on the undrawn portion of the Amended Facility. After the suspension period, the Company will pay interest on the unpaid principal amount of the Amended Facility at a rate equal to one-, three- or six-month LIBOR (which shall be at least 1.00%) plus between 1.00% to 2.25% based upon the Company’s leverage ratio. The Company will also pay a commitment fee to the lenders in an amount equal to 0.10% to 0.35% on the undrawn portion of the Amended Facility, based upon the Company’s leverage ratio. The Amended Facility provided for the payment of a consent fee of 15 basis points of the commitment for each consenting lender.
The Amended Facility also temporarily restricts certain activities, including acquisitions and share repurchases, and requires mandatory prepayments during the suspension period when the Company’s cash balance exceeds $100 million. In the first quarter of 2020, before executing the Amended Facility, we incurred approximately $150 million in new incremental
31
borrowings as a precautionary response to macroeconomic conditions caused by the COVID-19 pandemic. Subsequent to the execution of the Amended Facility, the Company made prepayments approximating $165.0 million.
The Company’s obligations under the Amended Facility are jointly and severally guaranteed by each domestic subsidiary of the Company other than non-material subsidiaries. The obligations are secured by a first priority lien on substantially all of the Company’s and the guarantors’ assets.
At December 31, 2020, there was $173.0 million outstanding on the revolving credit facility and there remains $200.9 million available subject to the minimum liquidity covenant discussed above, net of outstanding letters of credit. The credit facility allocates up to $20 million of the $375 million revolving credit line for the issuance of letters of credit, including certain existing letters of credit. At December 31, 2020, outstanding letters of credit totaled $1.1 million.
The primary financing activities in 2020 were related to net payments on our senior credit facility of $15.0 million and repurchase of approximately 282,000 shares at an aggregate cost of $7.7 million. The primary financing activities in 2019 related to a repurchase of approximately 1,851,000 shares at an aggregate cost of $50.8 million under our share purchase program, coupled with net payments on our senior credit facility of $39.0 million.
In the event of voluntary or involuntary bankruptcy of the Company or any subsidiary, all unpaid principal and other amounts owing under the Amended Facility automatically become due and payable. Other events of default, such as failure to make payments as they become due and breach of financial and other covenants, change of control, judgments over a certain amount, and cross default under other agreements give the agent the option to declare all such amounts immediately due and payable.
The Company’s cash needs for working capital, debt service, capital equipment, and acquisition opportunities during 2021 is expected to be met by cash flows from operations and cash balances and, if necessary, utilization of the revolving credit facility.
DIVIDENDS
Management believes that it should retain the capital generated from operating activities for investment in advancing technologies, acquisitions and debt retirement. Accordingly, there are no plans to institute a cash dividend program.
BACKLOG
At December 31, 2020, our consolidated backlog was $283.4 million. At December 31, 2019, our backlog was $359.6 million. Backlog in the Aerospace segment was $191.1 million at December 31, 2020, of which $162.8 million is expected to be recognized as revenue in 2021. Backlog in the Test Systems segment was $92.3 million at December 31, 2020, of which $54.1 million is expected to be recognized as revenue of in 2021.
RELATED-PARTY TRANSACTIONS
Information regarding certain relationships and related transactions is incorporated herein by reference to the information included in the Company’s 2021 Proxy Statement which will be filed with the Commission within 120 days after the end of the Company’s 2020 fiscal year.
RECENT ACCOUNTING PRONOUNCEMENTS
See Note 1 of the consolidated financial statements at Item 8 of this report.
ITEM 7A. QUANTITATIVE AND QUALITATIVE DISCLOSURES ABOUT MARKET RISK
The Company has limited exposure to fluctuation in foreign currency exchange rates to U.S. dollar, primarily in Canadian dollars and Euros currency. Approximately 90% of the Company’s consolidated sales are transacted in U.S. dollars. Net assets held in or measured in Canadian dollars amounted to $27.0 million at December 31, 2020. A 10% change in the value of the U.S. dollar versus the Canadian dollar would have had a $1.0 million impact to 2020 net income. Net assets held in or measured in Euros amounted to $32.3 million at December 31, 2020. A 10% change in the value of the U.S. dollar versus the Euros would have had a $0.4 million impact to 2020 net income.
Risk due to fluctuation in interest rates is a function of the Company’s floating rate debt obligations, which total approximately $173.0 million at December 31, 2020. A change of 1% in interest rates of all variable rate debt would impact annual net income by approximately $1.7 million, before income taxes.
32
ITEM 8. FINANCIAL STATEMENTS AND SUPPLEMENTARY DATA
REPORT OF INDEPENDENT REGISTERED PUBLIC ACCOUNTING FIRM
To the Shareholders and Board of Directors of Astronics Corporation
Opinion on the Financial Statements
We have audited the accompanying consolidated balance sheets of Astronics Corporation (the Company) as of December 31, 2020 and 2019, the related consolidated statements of operations, comprehensive (loss) income, shareholders' equity and cash flows for each of the three years in the period ended December 31, 2020, and the related notes and financial statement schedule listed in the Index at Item 15(a)(2)(collectively referred to as the “consolidated financial statements”). In our opinion, the consolidated financial statements present fairly, in all material respects, the financial position of the Company at December 31, 2020 and 2019, and the results of its operations and its cash flows for each of the three years in the period ended December 31, 2020, in conformity with U.S. generally accepted accounting principles.
We also have audited, in accordance with the standards of the Public Company Accounting Oversight Board (United States) (PCAOB), the Company's internal control over financial reporting as of December 31, 2020, based on criteria established in Internal Control-Integrated Framework issued by the Committee of Sponsoring Organizations of the Treadway Commission (2013 framework), and our report dated March 1, 2021 expressed an unqualified opinion thereon.
Adoption of New Accounting Standards
As discussed in Note 1 to the consolidated financial statements, the Company changed its method of accounting for leases as a result of the adoption of ASU No. 2016-02, Leases (Topic 842), as amended, effective January 1, 2019.
Basis for Opinion
These financial statements are the responsibility of the Company's management. Our responsibility is to express an opinion on the Company’s financial statements based on our audits. We are a public accounting firm registered with the PCAOB and are required to be independent with respect to the Company in accordance with the U.S. federal securities laws and the applicable rules and regulations of the Securities and Exchange Commission and the PCAOB.
We conducted our audits in accordance with the standards of the PCAOB. Those standards require that we plan and perform the audit to obtain reasonable assurance about whether the financial statements are free of material misstatement, whether due to error or fraud. Our audits included performing procedures to assess the risks of material misstatement of the financial statements, whether due to error or fraud, and performing procedures that respond to those risks. Such procedures included examining, on a test basis, evidence regarding the amounts and disclosures in the financial statements. Our audits also included evaluating the accounting principles used and significant estimates made by management, as well as evaluating the overall presentation of the financial statements. We believe that our audits provide a reasonable basis for our opinion.
Critical Audit Matters
The critical audit matters communicated below are matters arising from the current period audit of the financial statements that were communicated or required to be communicated to the audit committee and that: (1) relate to accounts or disclosures that are material to the financial statements and (2) involved our especially challenging, subjective or complex judgments. The communication of critical audit matters does not alter in any way our opinion on the consolidated financial statements, taken as a whole, and we are not, by communicating the critical audit matters below, providing separate opinions on the critical audit matters or on the accounts or disclosures to which they relate.
33
Valuation of GoodwillDescription of the Matter
As of December 31, 2020, the Company’s goodwill balance was $58.3 million and the Company recognized a total of $86.3 million in goodwill impairment charges during the year ended December 31, 2020. As discussed in Notes 1 and 7 of the consolidated financial statements, in addition to the annual goodwill impairment test performed as of the first day of the Company’s fourth quarter, as a result of qualitative factors related to the COVID-19 pandemic and further commercial aircraft order reductions, delays and cancellations at a major customer of one of the Company’s reporting units, the Company also performed interim goodwill impairment tests as of March 28, 2020 for all eight of its reporting units with goodwill and as of June 27, 2020 for one reporting unit with goodwill. The Company tests goodwill for impairment at the reporting unit level on an annual basis or more frequently if an event occurs or circumstances change that would more likely than not reduce the fair value of a reporting unit below its carrying amount. For each reporting unit, the Company performed the quantitative tests using the discounted cash flow method to estimate fair value. The discounted cash flow method incorporates various assumptions, the most significant being projected revenue growth rates and the weighted-average cost of capital. If the carrying value of the reporting unit exceeds its fair value, goodwill impairment is measured as the amount by which the reporting unit’s carrying value exceeds its fair value, not to exceed the carrying value of goodwill.
Auditing management’s assumptions was especially subjective due to the estimation required in determining the fair value of certain of the Company’s reporting units with goodwill. The fair value estimates for these reporting units were sensitive to the significant assumptions of the revenue growth rate and the weighted-average cost of capital, which are affected by expectations about the pace of global economic recovery from the COVID-19 pandemic, which affects future market and economic conditions, particularly those in the aerospace industry.
How We Addressed the Matter in Our Audit
We obtained an understanding, evaluated the design and tested the operating effectiveness of controls over the Company’s goodwill impairment test process, including the determination of the underlying significant assumptions described above, and the completeness and accuracy of the impairment analysis.
To test the estimated fair value of the Company’s reporting units, we performed audit procedures with the assistance of our valuation professionals that included, among others, assessing the methodology used, testing the significant assumptions discussed above and testing the underlying data used in the impairment analysis. We compared the significant assumptions used by management to current industry and economic trends, historical trends of the Company, and other relevant factors. We assessed the historical accuracy of management’s estimates, taking into consideration the effects of COVID-19, and performed sensitivity analyses of significant assumptions to evaluate the changes in the fair value of the reporting units that would result from changes in the assumptions. We also involved our valuation professionals to assist in our evaluation of the weighted average cost of capital used in the fair value estimates. In addition, we tested the reconciliation of the fair value of the Company’s reporting units to the market capitalization of the Company as of the annual impairment testing date.
Revenue RecognitionDescription of the Matter
For the year ended December 31, 2020, the Company’s revenues totaled $502.6 million. As discussed in Note 2 to the consolidated financial statements, some of the Company’s contracts with customers contain multiple performance obligations. The majority of the Company’s revenue from contracts with customers is recognized at a point in time when the customer obtains control of the product, which is generally upon delivery and acceptance by the customer. For contracts with customers in which the Company satisfies its promise to the customer to provide a service or a product that has no alternative use to the Company and the Company has enforceable rights to payment for progress completed to date inclusive of profit, the Company satisfies the performance obligation and recognizes revenue over time, using costs incurred to date relative to total estimated costs at completion to measure progress toward satisfying the Company’s performance obligations.
Auditing management’s evaluation of contracts with customers was especially challenging due to the effort required to analyze the terms and conditions of the Company’s various customer contracts given that such terms and conditions are nonstandard. This included the identification and determination of the performance obligations and the timing of revenue recognition.
34
How We Addressed the Matter in Our Audit
We obtained an understanding, evaluated the design, and tested the operating effectiveness of controls over the Company’s revenue recognition process. For example, we tested controls over management’s review of the terms and conditions of contracts with customers which included an analysis of the distinct performance obligations and a review of the conclusion as to whether revenue from such performance obligations should be recognized over time or at a point in time. We also tested management’s centralized monitoring control over completeness of the contract reviews and appropriateness of the accounting conclusions.
We performed procedures to test the identification and determination of the performance obligations and the timing of revenue recognition which included reading a sample of executed contracts and purchase orders to understand the contract, performing an independent assessment of the identification of distinct performance obligations and the appropriate timing of revenue recognition, testing the mathematical accuracy of revenue recognized based on costs incurred to date relative to total estimated costs at completion and comparing our assessment to that of management. We tested the completeness and accuracy of the Company’s contract summary documentation, specifically related to the identification and determination of distinct performance obligations and the timing of revenue recognition.
/s/ Ernst & Young LLP
We have served as the Company's auditor since 1992.Buffalo, New YorkMarch 1, 2021
35
MANAGEMENT’S REPORT ON INTERNAL CONTROL OVER FINANCIAL REPORTING
Our management is responsible for establishing and maintaining adequate internal control over financial reporting, as such term is defined in Rule 13a-15(f) and 15d-15(f) of the Exchange Act. Under the supervision and with the participation of our management, including the Chief Executive Officer and Chief Financial Officer, we conducted an evaluation of the effectiveness of our internal control over financial reporting as of December 31, 2020 based upon the framework in Internal Control – Integrated Framework originally issued in 2013 by the Committee of Sponsoring Organizations of the Treadway Commission (COSO). Based on that evaluation, our management concluded that our internal control over financial reporting is effective as of December 31, 2020.
Ernst & Young LLP, independent registered public accounting firm, has audited our consolidated financial statements included in this Annual Report on Form 10-K and, as part of their audit, has issued their report, included herein, on the effectiveness of our internal control over financial reporting.
By: /s/ Peter J. Gundermann March 1, 2021Peter J. GundermannPresident & Chief Executive Officer(Principal Executive Officer)
/s/ David C. Burney March 1, 2021David C. BurneyExecutive Vice President and Chief Financial Officer(Principal Financial Officer)
36
REPORT OF INDEPENDENT REGISTERED PUBLIC ACCOUNTING FIRM
To the Shareholders and Board of Directors of Astronics Corporation
Opinion on Internal Control Over Financial Reporting
We have audited Astronics Corporation’s internal control over financial reporting as of December 31, 2020, based on criteria established in Internal Control – Integrated Framework issued by the Committee of Sponsoring Organizations of the Treadway Commission (2013 framework) (the COSO criteria). In our opinion, Astronics Corporation (the Company) maintained, in all material respects, effective internal control over financial reporting as of December 31, 2020, based on the COSO criteria.
We also have audited, in accordance with the standards of the Public Company Accounting Oversight Board (United States) (PCAOB), the consolidated balance sheets of the Company as of December 31, 2020 and 2019, the related consolidated statements of operations, comprehensive (loss) income, shareholders’ equity and cash flows for each of the three years in the period ended December 31, 2020, and the related notes and financial statement schedule listed in the Index at Item 15(a)(2) and our report dated March 1, 2021 expressed an unqualified opinion thereon.
Basis for Opinion
The Company’s management is responsible for maintaining effective internal control over financial reporting and for its assessment of the effectiveness of internal control over financial reporting included in the accompanying Management’s Report on Internal Control Over Financial Reporting. Our responsibility is to express an opinion on the Company’s internal control over financial reporting based on our audit. We are a public accounting firm registered with the PCAOB and are required to be independent with respect to the Company in accordance with the U.S. federal securities laws and the applicable rules and regulations of the Securities and Exchange Commission and the PCAOB.
We conducted our audit in accordance with the standards of the PCAOB. Those standards require that we plan and perform the audit to obtain reasonable assurance about whether effective internal control over financial reporting was maintained in all material respects.
Our audit included obtaining an understanding of internal control over financial reporting, assessing the risk that a material weakness exists, testing and evaluating the design and operating effectiveness of internal control based on the assessed risk, and performing such other procedures as we considered necessary in the circumstances. We believe that our audit provides a reasonable basis for our opinion.
Definition and Limitations of Internal Control Over Financial Reporting
A company’s internal control over financial reporting is a process designed to provide reasonable assurance regarding the reliability of financial reporting and the preparation of financial statements for external purposes in accordance with generally accepted accounting principles. A company’s internal control over financial reporting includes those policies and procedures that (1) pertain to the maintenance of records that, in reasonable detail, accurately and fairly reflect the transactions and dispositions of the assets of the company; (2) provide reasonable assurance that transactions are recorded as necessary to permit preparation of financial statements in accordance with generally accepted accounting principles, and that receipts and expenditures of the company are being made only in accordance with authorizations of management and directors of the company; and (3) provide reasonable assurance regarding prevention or timely detection of unauthorized acquisition, use, or disposition of the company’s assets that could have a material effect on the financial statements.
Because of its inherent limitations, internal control over financial reporting may not prevent or detect misstatements. Also, projections of any evaluation of effectiveness to future periods are subject to the risk that controls may become inadequate because of changes in conditions, or that the degree of compliance with the policies or procedures may deteriorate.
/s/ Ernst & Young LLPBuffalo, New YorkMarch 1, 2021
37
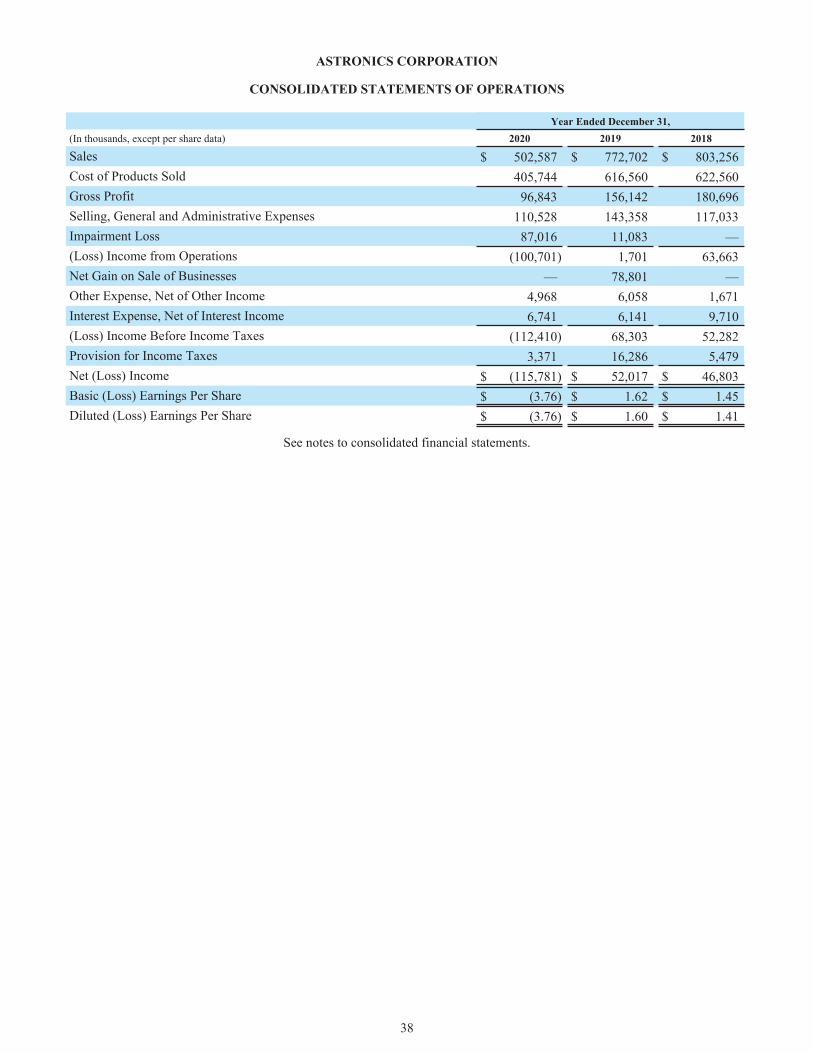
ASTRONICS CORPORATION
CONSOLIDATED STATEMENTS OF OPERATIONS
Year Ended December 31,(In thousands, except per share data) 2020 2019 2018
Sales $ 502,587 $ 772,702 $ 803,256 Cost of Products Sold 405,744 616,560 622,560 Gross Profit 96,843 156,142 180,696 Selling, General and Administrative Expenses 110,528 143,358 117,033 Impairment Loss 87,016 11,083 — (Loss) Income from Operations (100,701) 1,701 63,663 Net Gain on Sale of Businesses — 78,801 — Other Expense, Net of Other Income 4,968 6,058 1,671 Interest Expense, Net of Interest Income 6,741 6,141 9,710 (Loss) Income Before Income Taxes (112,410) 68,303 52,282 Provision for Income Taxes 3,371 16,286 5,479 Net (Loss) Income $ (115,781) $ 52,017 $ 46,803 Basic (Loss) Earnings Per Share $ (3.76) $ 1.62 $ 1.45 Diluted (Loss) Earnings Per Share $ (3.76) $ 1.60 $ 1.41
See notes to consolidated financial statements.
38
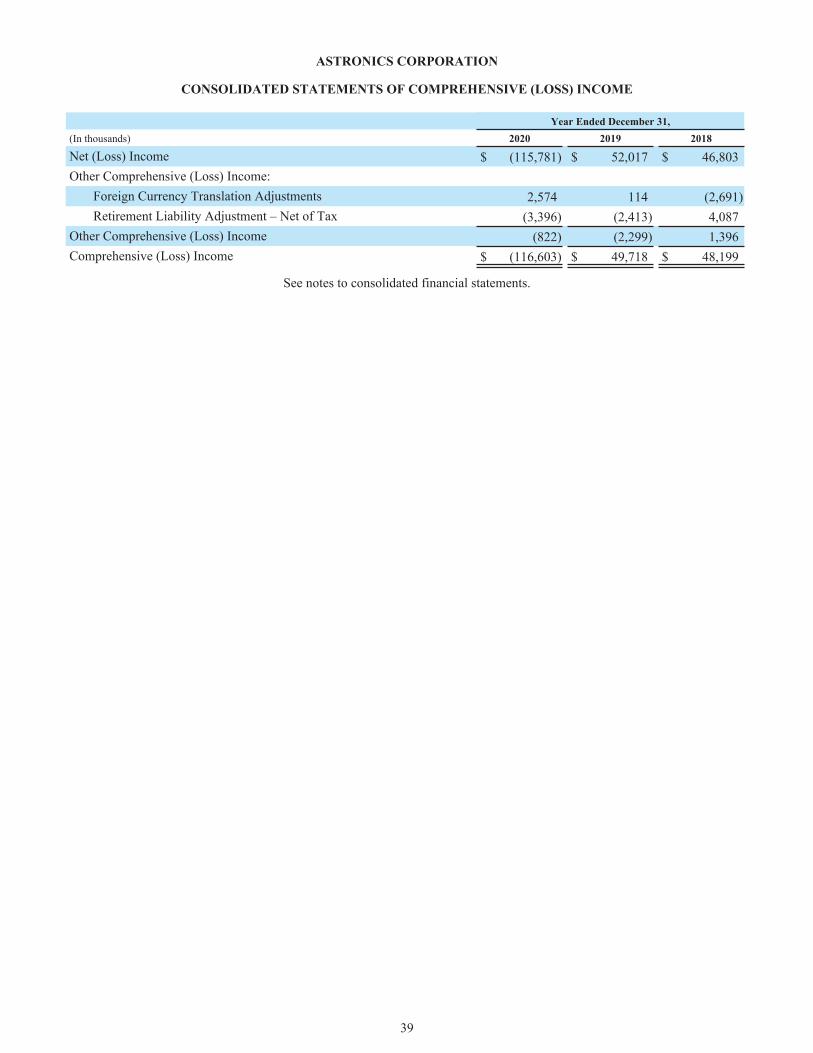
ASTRONICS CORPORATION
CONSOLIDATED STATEMENTS OF COMPREHENSIVE (LOSS) INCOME
Year Ended December 31,(In thousands) 2020 2019 2018
Net (Loss) Income $ (115,781) $ 52,017 $ 46,803 Other Comprehensive (Loss) Income:
Foreign Currency Translation Adjustments 2,574 114 (2,691) Retirement Liability Adjustment – Net of Tax (3,396) (2,413) 4,087
Other Comprehensive (Loss) Income (822) (2,299) 1,396 Comprehensive (Loss) Income $ (116,603) $ 49,718 $ 48,199
See notes to consolidated financial statements.
39
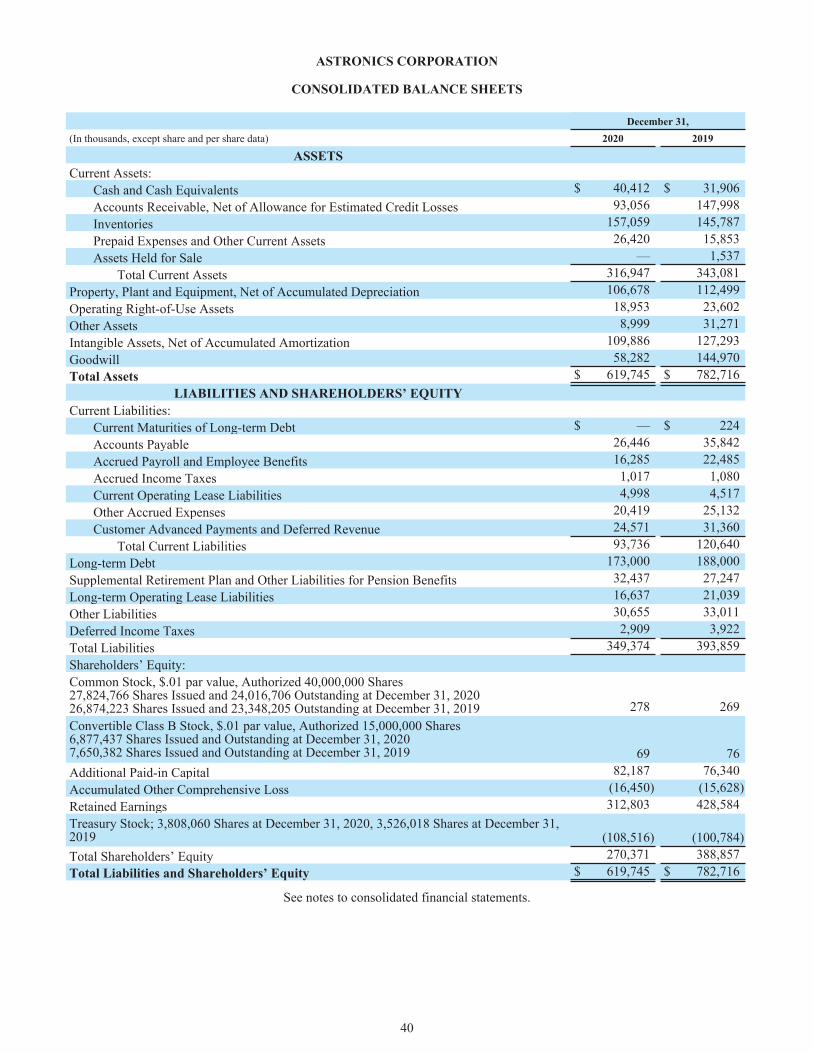
ASTRONICS CORPORATION
CONSOLIDATED BALANCE SHEETS
December 31,(In thousands, except share and per share data) 2020 2019
ASSETSCurrent Assets:
Cash and Cash Equivalents $ 40,412 $ 31,906 Accounts Receivable, Net of Allowance for Estimated Credit Losses 93,056 147,998 Inventories 157,059 145,787 Prepaid Expenses and Other Current Assets 26,420 15,853 Assets Held for Sale — 1,537
Total Current Assets 316,947 343,081 Property, Plant and Equipment, Net of Accumulated Depreciation 106,678 112,499 Operating Right-of-Use Assets 18,953 23,602 Other Assets 8,999 31,271 Intangible Assets, Net of Accumulated Amortization 109,886 127,293 Goodwill 58,282 144,970 Total Assets $ 619,745 $ 782,716
LIABILITIES AND SHAREHOLDERS’ EQUITYCurrent Liabilities:
Current Maturities of Long-term Debt $ — $ 224 Accounts Payable 26,446 35,842 Accrued Payroll and Employee Benefits 16,285 22,485 Accrued Income Taxes 1,017 1,080 Current Operating Lease Liabilities 4,998 4,517 Other Accrued Expenses 20,419 25,132 Customer Advanced Payments and Deferred Revenue 24,571 31,360
Total Current Liabilities 93,736 120,640 Long-term Debt 173,000 188,000 Supplemental Retirement Plan and Other Liabilities for Pension Benefits 32,437 27,247 Long-term Operating Lease Liabilities 16,637 21,039 Other Liabilities 30,655 33,011 Deferred Income Taxes 2,909 3,922 Total Liabilities 349,374 393,859 Shareholders’ Equity:Common Stock, $.01 par value, Authorized 40,000,000 Shares27,824,766 Shares Issued and 24,016,706 Outstanding at December 31, 202026,874,223 Shares Issued and 23,348,205 Outstanding at December 31, 2019 278 269 Convertible Class B Stock, $.01 par value, Authorized 15,000,000 Shares 6,877,437 Shares Issued and Outstanding at December 31, 20207,650,382 Shares Issued and Outstanding at December 31, 2019 69 76 Additional Paid-in Capital 82,187 76,340 Accumulated Other Comprehensive Loss (16,450) (15,628) Retained Earnings 312,803 428,584 Treasury Stock; 3,808,060 Shares at December 31, 2020, 3,526,018 Shares at December 31, 2019 (108,516) (100,784) Total Shareholders’ Equity 270,371 388,857 Total Liabilities and Shareholders’ Equity $ 619,745 $ 782,716
See notes to consolidated financial statements.
40
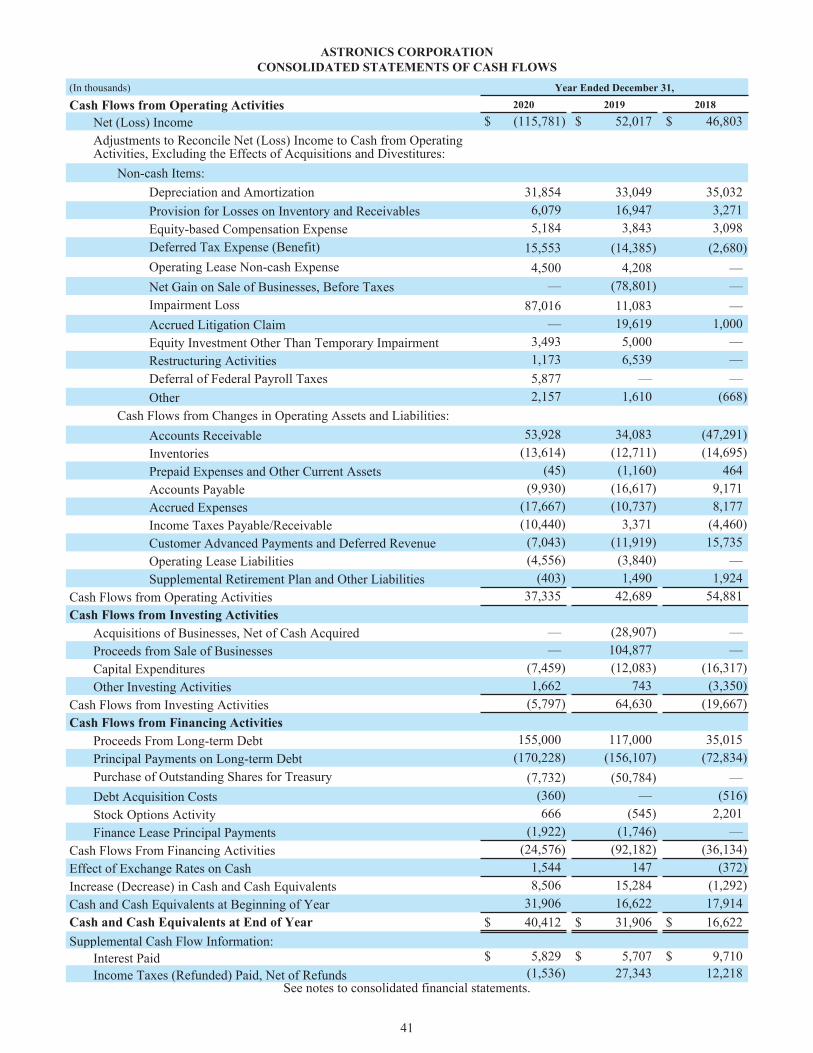
ASTRONICS CORPORATIONCONSOLIDATED STATEMENTS OF CASH FLOWS
(In thousands) Year Ended December 31,
Cash Flows from Operating Activities 2020 2019 2018
Net (Loss) Income $ (115,781) $ 52,017 $ 46,803 Adjustments to Reconcile Net (Loss) Income to Cash from Operating Activities, Excluding the Effects of Acquisitions and Divestitures:
Non-cash Items:Depreciation and Amortization 31,854 33,049 35,032 Provision for Losses on Inventory and Receivables 6,079 16,947 3,271 Equity-based Compensation Expense 5,184 3,843 3,098 Deferred Tax Expense (Benefit) 15,553 (14,385) (2,680) Operating Lease Non-cash Expense 4,500 4,208 — Net Gain on Sale of Businesses, Before Taxes — (78,801) — Impairment Loss 87,016 11,083 — Accrued Litigation Claim — 19,619 1,000 Equity Investment Other Than Temporary Impairment 3,493 5,000 — Restructuring Activities 1,173 6,539 — Deferral of Federal Payroll Taxes 5,877 — — Other 2,157 1,610 (668)
Cash Flows from Changes in Operating Assets and Liabilities:Accounts Receivable 53,928 34,083 (47,291) Inventories (13,614) (12,711) (14,695) Prepaid Expenses and Other Current Assets (45) (1,160) 464 Accounts Payable (9,930) (16,617) 9,171 Accrued Expenses (17,667) (10,737) 8,177 Income Taxes Payable/Receivable (10,440) 3,371 (4,460) Customer Advanced Payments and Deferred Revenue (7,043) (11,919) 15,735 Operating Lease Liabilities (4,556) (3,840) — Supplemental Retirement Plan and Other Liabilities (403) 1,490 1,924
Cash Flows from Operating Activities 37,335 42,689 54,881 Cash Flows from Investing Activities
Acquisitions of Businesses, Net of Cash Acquired — (28,907) — Proceeds from Sale of Businesses — 104,877 — Capital Expenditures (7,459) (12,083) (16,317) Other Investing Activities 1,662 743 (3,350)
Cash Flows from Investing Activities (5,797) 64,630 (19,667) Cash Flows from Financing Activities
Proceeds From Long-term Debt 155,000 117,000 35,015 Principal Payments on Long-term Debt (170,228) (156,107) (72,834) Purchase of Outstanding Shares for Treasury (7,732) (50,784) — Debt Acquisition Costs (360) — (516) Stock Options Activity 666 (545) 2,201 Finance Lease Principal Payments (1,922) (1,746) —
Cash Flows From Financing Activities (24,576) (92,182) (36,134) Effect of Exchange Rates on Cash 1,544 147 (372) Increase (Decrease) in Cash and Cash Equivalents 8,506 15,284 (1,292) Cash and Cash Equivalents at Beginning of Year 31,906 16,622 17,914 Cash and Cash Equivalents at End of Year $ 40,412 $ 31,906 $ 16,622 Supplemental Cash Flow Information:
Interest Paid $ 5,829 $ 5,707 $ 9,710 Income Taxes (Refunded) Paid, Net of Refunds (1,536) 27,343 12,218
See notes to consolidated financial statements.
41
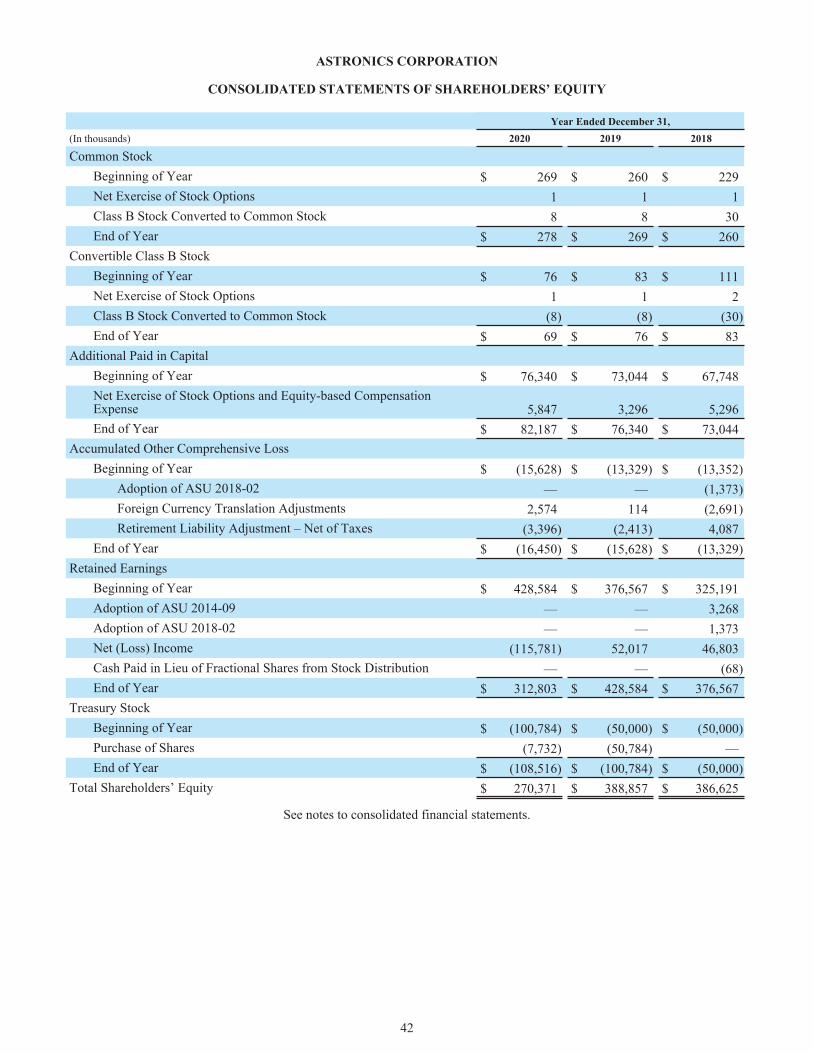
ASTRONICS CORPORATION
CONSOLIDATED STATEMENTS OF SHAREHOLDERS’ EQUITY
Year Ended December 31,(In thousands) 2020 2019 2018
Common StockBeginning of Year $ 269 $ 260 $ 229 Net Exercise of Stock Options 1 1 1 Class B Stock Converted to Common Stock 8 8 30 End of Year $ 278 $ 269 $ 260
Convertible Class B StockBeginning of Year $ 76 $ 83 $ 111 Net Exercise of Stock Options 1 1 2 Class B Stock Converted to Common Stock (8) (8) (30) End of Year $ 69 $ 76 $ 83
Additional Paid in CapitalBeginning of Year $ 76,340 $ 73,044 $ 67,748 Net Exercise of Stock Options and Equity-based Compensation Expense 5,847 3,296 5,296 End of Year $ 82,187 $ 76,340 $ 73,044
Accumulated Other Comprehensive LossBeginning of Year $ (15,628) $ (13,329) $ (13,352)
Adoption of ASU 2018-02 — — (1,373) Foreign Currency Translation Adjustments 2,574 114 (2,691) Retirement Liability Adjustment – Net of Taxes (3,396) (2,413) 4,087
End of Year $ (16,450) $ (15,628) $ (13,329) Retained Earnings
Beginning of Year $ 428,584 $ 376,567 $ 325,191 Adoption of ASU 2014-09 — — 3,268 Adoption of ASU 2018-02 — — 1,373 Net (Loss) Income (115,781) 52,017 46,803 Cash Paid in Lieu of Fractional Shares from Stock Distribution — — (68) End of Year $ 312,803 $ 428,584 $ 376,567
Treasury StockBeginning of Year $ (100,784) $ (50,000) $ (50,000) Purchase of Shares (7,732) (50,784) — End of Year $ (108,516) $ (100,784) $ (50,000)
Total Shareholders’ Equity $ 270,371 $ 388,857 $ 386,625
See notes to consolidated financial statements.
42
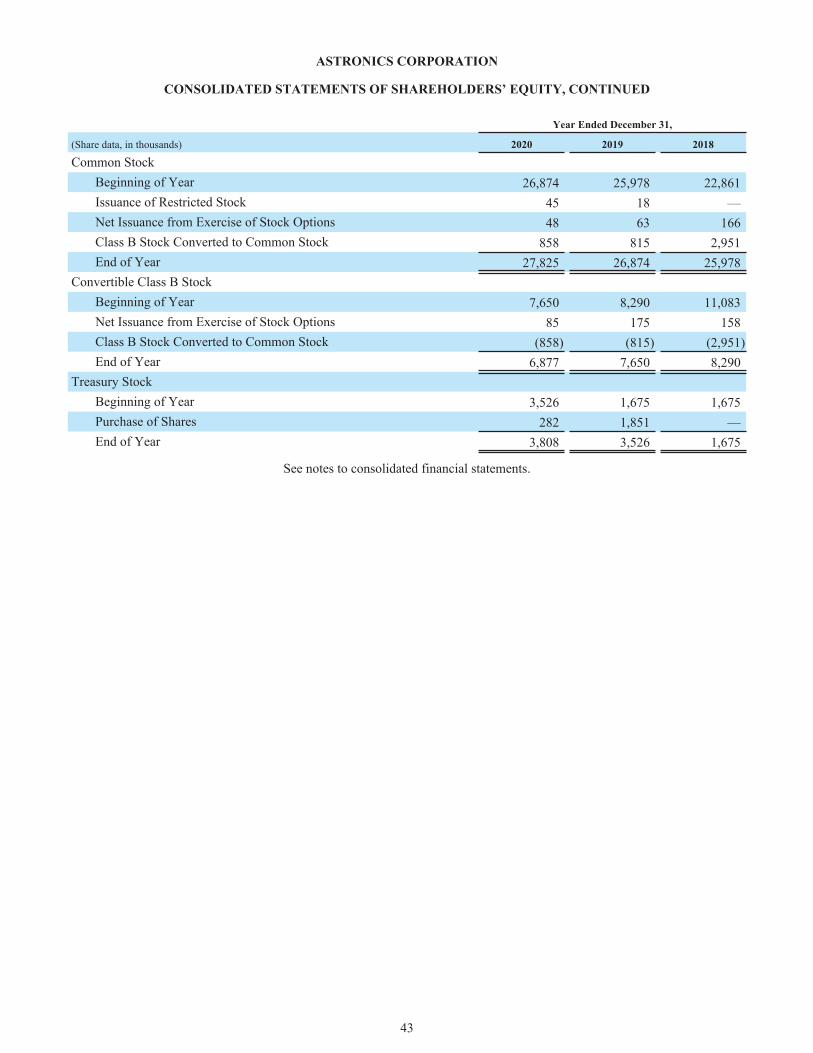
ASTRONICS CORPORATION
CONSOLIDATED STATEMENTS OF SHAREHOLDERS’ EQUITY, CONTINUED
Year Ended December 31,
(Share data, in thousands) 2020 2019 2018
Common StockBeginning of Year 26,874 25,978 22,861 Issuance of Restricted Stock 45 18 — Net Issuance from Exercise of Stock Options 48 63 166 Class B Stock Converted to Common Stock 858 815 2,951 End of Year 27,825 26,874 25,978
Convertible Class B StockBeginning of Year 7,650 8,290 11,083 Net Issuance from Exercise of Stock Options 85 175 158 Class B Stock Converted to Common Stock (858) (815) (2,951) End of Year 6,877 7,650 8,290
Treasury StockBeginning of Year 3,526 1,675 1,675 Purchase of Shares 282 1,851 — End of Year 3,808 3,526 1,675
See notes to consolidated financial statements.
43
NOTES TO CONSOLIDATED FINANCIAL STATEMENTS
NOTE 1 — SUMMARY OF SIGNIFICANT ACCOUNTING PRINCIPLES AND PRACTICES
Description of the Business
Astronics Corporation (“Astronics” or the “Company”) is a leading provider of advanced technologies to the global aerospace, defense and electronics industries. Our products and services include advanced, high-performance electrical power generation, distribution and motion systems, lighting and safety systems, avionics products, systems and certification, aircraft structures and automated test systems.
We have principal operations in the United States (“U.S.”), Canada, France and England, as well as engineering offices in the Ukraine and India.
The Company has two reportable segments, Aerospace and Test Systems. The Aerospace segment designs and manufactures products for the global aerospace and defense industry. Our Test Systems segment designs, develops, manufactures and maintains automated test systems that support the aerospace and defense, communications and mass transit industries as well as training and simulation devices for both commercial and military applications.
On February 13, 2019, the Company completed a divestiture of its semiconductor test business within the Test Systems segment. The business was not core to the future of the Test Systems segment. The total proceeds received for the sale amounted to $103.8 million, plus certain contingent earnouts as described in Note 22. The Company recorded a pre-tax gain on the sale of approximately $80.1 million. The Company recorded income tax expense relating to the gain of $19.7 million. On February 13, 2021, the Company was notified by the purchaser that they have calculated $10.7 million as being payable to the Company under the contingent earnouts related to the year ended December 31, 2020. There is a period by which we and the purchaser will review the earnout calculation, which is underway. Upon completion of the review and agreement of any adjustments, the Company expects to record the additional gain on the sale in the first quarter of 2021.
On July 1, 2019, the Company acquired all of the issued and outstanding capital stock of Freedom Communication Technologies, Inc. (“Freedom”). Freedom, located in Kilgore, Texas, is a leader in wireless communication testing, primarily for the civil land mobile radio market. Freedom is included in our Test Systems segment. The total consideration for the transaction was $21.8 million, net of $0.6 million in cash acquired.
On July 12, 2019, the Company sold intellectual property and certain assets associated with its Airfield Lighting product line for $1.0 million in cash. The Airfield Lighting product line, part of the Aerospace segment, was not core to the business and represented less than 1% of revenue. The Company recorded a pre-tax loss on the sale of approximately $1.3 million.
On October 4, 2019, the Company acquired the stock of the primary operating subsidiaries as well as certain other assets from mass transit and defense market test solution provider, Diagnosys Test Systems Limited, for $7.0 million in cash, plus contingent purchase consideration (“earnout”) estimated at a fair value of $2.5 million at acquisition. No earnout was payable for the period from acquisition through December 31, 2020. Diagnosys Inc. and its affiliates (“Diagnosys”) is included in our Test Systems segment. The acquired business has operations in Westford, Massachusetts as well as Ferndown, England, and an engineering center of excellence in Bangalore, India.
For more information regarding these acquisitions and divestitures see Note 21 and Note 22.
Impact of the COVID-19 Pandemic
In December 2019, a novel strain of coronavirus (“COVID-19”) surfaced in Wuhan, China, and has since spread to other countries, including the United States. On March 11, 2020, the World Health Organization classified the COVID-19 outbreak as a pandemic. The COVID-19 pandemic has had a sudden and significant impact on the global economy, and particularly in the aerospace industry, resulting in the grounding of the majority of the global commercial transportation fleet and significant cost cutting and cash preservation actions by the global airlines. This in turn has resulted in a significant reduction in airlines spending for both new aircraft and on upgrading their existing fleet with the Company’s products. We expect this low level of investment by the airlines will continue at least into 2021, however, the ultimate impact of COVID-19 on our business results of operations, financial condition and cash flows is dependent on future developments, including the duration of the pandemic and the related length of its impact on the global economy and the aerospace industry, which are uncertain and cannot be predicted at this time.
In response to the global COVID-19 pandemic, we took immediate and aggressive action to minimize the spread of COVID-19 in our workplaces and reduce costs. Since the early days of the pandemic, we have been following guidance from the World Health Organization and the U.S. Center for Disease Control to protect employees and prevent the spread of the virus within all
44
of our facilities globally. Some of the actions implemented include: social distancing; appropriate personal protective equipment; facility deep cleaning; flexible work-from-home scheduling; pre-shift temperature screenings, where allowed by law; and restrictions on facility visitors and unnecessary travel. Material actions to reduce costs included: (1) reducing our workforce to align operations with customer demand; (2) suspension of certain benefit programs; and (3) delaying non-essential capital projects and minimizing discretionary spending. At the same time, we addressed the ongoing needs of our business to continue to serve our customers. In addition to these measures, we amended our revolving credit facility on May 4, 2020, as further described in Note 8. We are also monitoring the impacts of COVID-19 on the fair value of assets. Refer to Note 7 for a discussion of goodwill impairment charges. Should future changes in sales, earnings and cash flows differ significantly from our expectations, long-lived assets to be held and used and goodwill could become impaired in the future.
The Company qualified for government subsidies from the Canadian and French government as a result of the COVID-19 pandemic’s impact on our foreign operations. The Canadian and French subsidies are income-based grants intended to reimburse the Company for certain employee wages. The grants are recognized as income over the periods in which the Company recognizes as expenses the costs the grants are intended to defray. The Company recorded $2.7 million in COVID-19 related government assistance in the Consolidated Statements of Operations for the year ended December 31, 2020, of which $2.4 million and $0.3 million was included in Cost of Products Sold and Selling, General and Administrative (“SG&A”) expenses, respectively.
Restructuring Activities
The COVID-19 pandemic has significantly impacted the global economy, and particularly the aerospace industry, resulting in reduced expectations of the Company’s future operating results. As a result, the Company executed restructuring activities in the form of workforce reduction, primarily in the second quarter of 2020, to align capacity with expected demand.
In the fourth quarter of 2019, in an effort to reduce the significant operating losses at our AeroSat business, we initiated a restructuring plan to reduce costs and minimize losses of our AeroSat antenna business. The plan narrows the initiatives for the AeroSat business to focus primarily on near-term opportunities pertaining to business jet connectivity. The plan has a downsized manufacturing operation remaining in New Hampshire, with significantly reduced personnel and operating expenses.
For more information regarding these restructuring plans see Note 23.
Principles of Consolidation
The consolidated financial statements include the accounts of the Company and its wholly owned subsidiaries. All intercompany transactions and balances have been eliminated.
Acquisitions are accounted for under the acquisition method and, accordingly, the operating results for the acquired companies are included in the Consolidated Statements of Operations from the respective dates of acquisition.
For additional information on the acquired businesses, see Note 21.
Cost of Products Sold, Engineering and Development and Selling, General and Administrative Expenses
Cost of products sold includes the costs to manufacture products such as direct materials and labor and manufacturing overhead as well as all engineering and developmental costs. The Company is engaged in a variety of engineering and design activities as well as basic research and development activities directed to the substantial improvement or new application of the Company’s existing technologies. These costs are expensed when incurred and included in cost of products sold. Research and development, design and related engineering expenses amounted to $86.8 million in 2020, $108.9 million in 2019 and $114.3 million in 2018. SG&A expenses include costs primarily related to our sales, marketing and administrative departments. Interest expense is shown net of interest income. Interest income was insignificant for the years ended December 31, 2020, 2019 and 2018.
Shipping and Handling
Shipping and handling costs are included in costs of products sold.
Equity-Based Compensation
The Company accounts for its stock options following Accounting Standards Codification (“ASC”) Topic 718, Compensation – Stock Compensation (“ASC Topic 718”). This Topic requires all equity-based payments to employees, including grants of employee stock options and restricted stock units (“RSU's”), to be recognized in the statement of earnings based on the grant
45
date fair value of the award. For awards with graded vesting, the Company uses a straight-line method of attributing the value of stock-based compensation expense, subject to minimum levels of expense, based on vesting. The Company accounts for forfeitures as they occur.
Under ASC Topic 718, stock compensation expense recognized during the period is based on the value of the portion of share-based payment awards that is ultimately expected to vest during the period. Equity-based compensation expense is included in SG&A expenses.
Cash and Cash Equivalents
All highly liquid instruments with a maturity of three months or less at the time of purchase are considered cash equivalents.
Accounts Receivable and Allowance for Estimated Credit Losses
Accounts receivable are composed of trade and contract receivables recorded at either the invoiced amount or costs in excess of billings, are expected to be collected within one year, and do not bear interest. The Company records a valuation allowance to account for estimated credit losses. The estimate for credit losses is based on the Company’s assessment of the collectability of customer accounts. The Company regularly reviews the allowance by considering factors such as the age of the receivable balances, historical experience, credit quality, current economic conditions, and reasonable and supportable forecasts of future economic conditions that may affect a customer’s ability to pay. Balances are written off when determined to be uncollectible.
The Company's exposure to credit losses may increase if its customers are adversely affected by global economic recessions, disruption associated with the current COVID-19 pandemic, industry conditions, or other customer-specific factors. Although the Company has historically not experienced significant credit losses, it is possible that there could be a material adverse impact from potential adjustments of the carrying amount of trade receivables and contract assets as airlines and other aerospace company’s cash flows are impacted by the COVID-19 pandemic.
Inventories
We record our inventories at the lower of cost or net realizable value. We determine the cost basis of our inventory on a first-in, first-out or weighted average basis using a standard cost methodology that approximates actual cost. The Company records reserves to provide for excess, slow moving or obsolete inventory. In determining the appropriate reserve, the Company considers the age of inventory on hand, the overall inventory levels in relation to forecasted demands as well as reserving for specifically identified inventory that the Company believes is no longer salable or whose value has diminished.
Property, Plant and Equipment
Property, plant and equipment are recorded at cost less accumulated depreciation. Depreciation of property, plant and equipment (“PP&E”) is computed using the straight-line method for financial reporting purposes and using accelerated methods for income tax purposes. Estimated useful lives of the assets are as follows: buildings, 25-40 years; machinery and equipment, 4-10 years. Leased buildings and associated leasehold improvements are amortized over the shorter of the terms of the lease or the estimated useful lives of the assets, with the amortization of such assets included within depreciation expense.
The cost of properties sold or otherwise disposed of and the accumulated depreciation thereon are eliminated from the accounts and the resulting gain or loss, as well as maintenance and repair expenses, is reflected within operating income. Replacements and improvements are capitalized.
Depreciation expense was approximately $13.3 million, $13.7 million and $15.0 million in 2020, 2019 and 2018, respectively.
Long-Lived Assets
Long-lived assets to be held and used are initially recorded at cost. The carrying value of these assets is evaluated for recoverability whenever adverse effects or changes in circumstances indicate that the carrying amount may not be recoverable. Impairments are recognized if future undiscounted cash flows from operations are not expected to be sufficient to recover long-lived assets. The carrying amounts are then reduced to fair value, which is typically determined by using a discounted cash flow model.
In conjunction with the deteriorating economic conditions associated with the COVID-19 pandemic, we recorded an impairment charge to right-of-use assets of approximately $0.7 million incurred in one reporting unit in the Aerospace segment within the Impairment Loss line in the Consolidated Statements of Operations in 2020. Additionally, we recorded a long-lived asset impairment charge of approximately $9.5 million in 2019 related to one reporting unit in the Aerospace segment. The charge was comprised of PP&E, intangible assets and right-of-use assets. See Note 23 for further information regarding the
46
restructuring and impairment charges. No other long-lived asset impairments were warranted based on the quantitative analysis performed.
Assets Held for Sale
Assets held for sale are to be reported at lower of its carrying amount or fair value less cost to sell. Judgment is required in estimating the sales price of assets held for sale and the time required to sell the assets. These estimates are based upon available market data and operating cash flows of the assets held for sale.
As of December 31, 2019, the Company had agreed to sell certain facilities within the Aerospace segment. Accordingly, the property, plant and equipment assets associated with these facilities have been classified as held for sale in the Consolidated Balance Sheets at December 31, 2019. These assets were sold during 2020. See Note 22 for additional information.
Goodwill
The Company tests goodwill at the reporting unit level on an annual basis or more frequently if an event occurs or circumstances change that would more likely than not reduce the fair value of a reporting unit below its carrying amount.
We may elect to perform a qualitative assessment that considers economic, industry and company-specific factors for all or selected reporting units. If, after completing the assessment, it is determined that it is more likely than not that the fair value of a reporting unit is less than its carrying value, we proceed to a quantitative test. We may also elect to perform a quantitative test instead of a qualitative test for any or all of our reporting units.
Quantitative testing requires a comparison of the fair value of each reporting unit to its carrying value. We use the discounted cash flow method to estimate the fair value of our reporting units. The discounted cash flow method incorporates various assumptions, the most significant being projected sales growth rates, operating margins and cash flows, the terminal growth rate and the weighted average cost of capital. If the carrying value of the reporting unit exceeds its fair value, the shortfall up to the carrying value of the goodwill represents the amount of goodwill impairment.
See Note 7 for further information regarding the goodwill impairment charges in 2020 and 2019. The 2018 assessment indicated no impairment to the carrying value of goodwill in any of the Company’s reporting units and no impairment charge was recognized.
Intangible Assets
The estimated fair values of acquired intangibles are generally determined based upon future economic benefits such as earnings and cash flows. Acquired identifiable intangible assets are recorded at fair value and are amortized over their estimated useful lives. Acquired intangible assets with an indefinite life are not amortized, but are reviewed for impairment at least annually or more frequently whenever events or changes in circumstances indicate that the carrying amounts of those assets are below their estimated fair values.
Impairment is tested under ASC Topic 350, Intangibles - Goodwill and Other, as amended by Accounting Standards Update (“ASU”) 2012-2. As the undiscounted cash flows of the AeroSat reporting unit were insufficient to recover the carrying value of the long-lived assets, the Company proceeded to determine the fair value of the intangible assets in AeroSat. The qualitative factors applied under this provision indicated no impairment to the Company’s indefinite lived intangible assets in 2020 or 2018. The Company concluded that the fair value of the intangible assets was de minimis as a result of their nominal projected future cash flows and the Company recorded a full impairment charge of approximately $6.2 million in the December 31, 2019 Consolidated Statements of Operations associated to intangible assets of the AeroSat reporting unit in conjunction with restructuring activities.
Financial Instruments
The Company’s financial instruments consist primarily of cash and cash equivalents, accounts receivable, accounts payable and long-term debt. The Company performs periodic credit evaluations of its customers’ financial condition and generally does not require collateral. The Company does not hold or issue financial instruments for trading purposes. Due to their short-term nature, the carrying values of cash and equivalents, accounts receivable and accounts payable approximate fair value. The carrying value of the Company’s variable rate long-term debt instruments also approximates fair value due to the variable rate feature of these instruments.
From time to time, the Company makes long-term, strategic equity investments in companies to promote business and strategic objectives. These investments as classified within Other Assets in the Consolidated Balance Sheets. For investments requiring equity method accounting, we recognize our share of the investee’s earnings or losses within Other Expense, Net of Other
47
Income in the Consolidated Statements of Operations. Such amounts were immaterial in 2020 and 2019, and not applicable in 2018. For investments not requiring equity method accounting, if the investment has no readily determinable fair value, we have elected the practicability exception of ASU 2016-01, under which the investment is measured at cost, less impairment, plus or minus observable price changes from orderly transactions of an identical or similar investment of the same issuer.
The Company determined there were indicators of impairment over one of its investments as a result of the investee’s deteriorating operating performance and limited access to capital. There were no observable price changes for this investment during 2020. We determined that the fair value of this investment was de minimis and a full impairment charge of $3.5 million was recorded within Other Expense, Net of Other Income in the accompanying Consolidated Statement Operations for the year ended December 31, 2020. A full impairment charge of $5.0 million for an additional investment was recorded in 2019. There was no such impairment was recorded in 2018.
Deferred Tax Asset Valuation Allowance
As a result of the COVID-19 pandemic and its adverse effects on the global economy and aerospace industry that began to take shape in the first quarter of fiscal 2020, the Company generated a significant taxable loss for the year ended December 31, 2020, which can be carried back under the CARES Act to recover previously paid income taxes. The Company records a valuation allowance against the deferred tax assets if and to the extent it is more likely than not that the Company will not recover the deferred tax assets. In evaluating the need for a valuation allowance, the Company weights all relevant positive and negative evidence, and considers among other factors, historical financial performance, projected future taxable income, scheduled reversals of deferred tax liabilities, the overall business environment, and tax planning strategies. Losses in recent periods and cumulative pre-tax losses in the three-year period ending with the current year, combined with the significant uncertainty brought about by the COVID-19 pandemic, is collectively considered significant negative evidence under ASC 740 when assessing whether an entity can use projected income as a basis for concluding that deferred tax assets are realizable on a more-likely-than-not basis. For purposes of assessing the recoverability of deferred tax assets, the Company determined that it could not include future projected earnings in the analysis due to recent history of losses and therefore had insufficient objective positive evidence that the Company will generate sufficient future pre-tax income to overcome the negative evidence of cumulative losses. Accordingly, during the year ended December 31, 2020, the Company determined that a portion of its deferred tax assets are not expected to be realizable in the future. As a result, the Company recorded a partial valuation allowance of approximately $23.3 million during the year ended December 31, 2020 against its U.S. federal deferred tax assets.
Use of Estimates
The preparation of financial statements in conformity with U.S. generally accepted accounting principles (“U.S. GAAP”) requires management to make estimates and assumptions that affect the reported amounts of assets and liabilities, the disclosure of contingent liabilities and the reported amounts of sales and expenses during the reporting periods in the financial statements and accompanying notes. Actual results could differ from those estimates.
Foreign Currency Translation
The Company accounts for its foreign currency translation in accordance with ASC Topic 830, Foreign Currency Translation. The aggregate transaction gain included in operations was insignificant in 2020 and 2018, and the loss included in operations was insignificant in 2019.
Dividends
The Company has not paid any cash dividends in the three-year period ended December 31, 2020.
Loss Contingencies
Loss contingencies may from time to time arise from situations such as claims and other legal actions. Loss contingencies are recorded as liabilities when it is probable that a liability has been incurred and the amount of the loss is reasonably estimable. In all other instances, legal fees are expensed as incurred. Disclosure is required when there is a reasonable possibility that the ultimate loss will exceed the recorded provision. Contingent liabilities are often resolved over long time periods. In recording liabilities for probable losses, management is required to make estimates and judgments regarding the amount or range of the probable loss. Management continually assesses the adequacy of estimated loss contingencies and, if necessary, adjusts the amounts recorded as better information becomes known.
48
Acquisitions
The Company accounts for its acquisitions under ASC Topic 805, Business Combinations and Reorganizations (“ASC Topic 805”). ASC Topic 805 provides guidance on how the acquirer recognizes and measures the consideration transferred, identifiable assets acquired, liabilities assumed, non-controlling interests, and goodwill acquired in a business combination. ASC Topic 805 also expands required disclosures surrounding the nature and financial effects of business combinations. See Note 21 regarding the acquisitions in 2019.
Newly Adopted and Recent Accounting Pronouncements
Recent Accounting Pronouncements Adopted
Standard Description Financial Statement Effect or Other Significant MattersASU No. 2016-13Financial Instruments - Credit Losses (Topic 326)
The standard replaces the incurred loss model with the current expected credit loss (“CECL”) model to estimate credit losses for financial assets measured at amortized cost and certain off-balance sheet credit exposures. The CECL model requires a Company to estimate credit losses expected over the life of the financial assets based on historical experience, current conditions and reasonable and supportable forecasts. The provisions of the standard are effective for fiscal years beginning after December 15, 2019 and interim periods within those fiscal years. Early adoption is permitted.
The amendment requires a modified retrospective approach by recording a cumulative-effect adjustment to retained earnings as of the beginning of the period of adoption. This ASU did not have a significant impact on our consolidated financial statements.
Date of adoption: Q1 2020
ASU No. 2018-13Fair Value Measurement (Topic 820)
The standard removes the disclosure requirements for the amount of and reasons for transfers between Level 1 and Level 2 of the fair value hierarchy. The provisions of this ASU are effective for years beginning after December 15, 2019, with early adoption permitted.
This ASU did not have a significant impact on our consolidated financial statements, as it only includes changes to disclosure requirements.
Date of adoption: Q1 2020
ASU No. 2016-02Leases (Topic 842)
The standard requires lessees to recognize most leases as assets and liabilities on the balance sheet, but record expenses on the statement of operations in a manner similar to current accounting. For lessors, the guidance modifies the classification criteria and accounting for sales-type and direct financing leases. The standard also requires additional disclosures about leasing arrangements and requires a modified retrospective transition approach for existing leases, whereby the standard will be applied to the earliest year presented. The provisions of the standard are effective for fiscal years beginning after December 15, 2018, including interim periods within those fiscal years. Early adoption is permitted.
The Company adopted this guidance as of January 1, 2019 using the cumulative-effect method. The standard requires lessees to recognize a lease liability and a right-of-use (“ROU”) asset on the balance sheet for operating leases. Accounting for finance leases is substantially unchanged. Prior year financial statements were not recast under the new method. We elected the package of transition provisions available for expired or existing contracts, which allowed us to carryforward our historical assessments of (1) whether contracts are or contain leases, (2) lease classification and (3) initial direct costs. As of January 1, 2019, operating lease ROU assets of approximately $18.4 million and lease liabilities of approximately $18.5 million were recognized on our balance sheet for our leased office and manufacturing facilities and equipment leases. There was a reclassification to ROU assets of $3.5 million from net PP&E for assets under existing finance leases at the transition date and a reclassification of existing lease liabilities of $6.5 million on our balance sheet for a leased facilities and equipment. The standard did not materially impact the Company's consolidated statements of operations or retained earnings. Refer to Note 19 for additional information.
Date of adoption: Q1 2019
49
Recent Accounting Pronouncements Not Yet Adopted
Standard Description Financial Statement Effect or Other Significant Matters
ASU No. 2018-14Compensation - Retirement Benefits - Defined Benefit Plans - General (Subtopic 715-20)
The standard includes updates to the disclosure requirements for defined benefit plans including several additions, deletions and modifications to the disclosure requirements. The provisions of this ASU are effective for years beginning after December 15, 2020, with early adoption permitted.
This ASU does not have a significant impact on our consolidated financial statements, as it only includes changes to disclosure requirements.
Planned date of adoption: Q1 2021
ASU No. 2019-12Income Taxes (Topic 740), Simplifying the Accounting for Income Taxes
The amendments in this update simplify the accounting for income taxes by removing certain exceptions to the general principles in Topic 740 and improve consistent application by clarifying and amending existing guidance. The amendments of this standard are effective for fiscal years beginning after December 15, 2020, including interim periods within those fiscal years. Early adoption is permitted, including adoption in any interim period for which financial statements have not been issued, with the amendments to be applied on a respective, modified retrospective or prospective basis, depending on the specific amendment.
This ASU simplifies the accounting for income taxes by, among other things, eliminating certain existing exceptions related to the general approach in ASC 740 relating to franchise taxes, reducing complexity in the interim-period accounting for year-to-date loss limitations and changes in tax laws, and clarifying the accounting for transactions outside of business combination that result in a step-up in the tax basis of goodwill. As we do not have material activity associated with items such as franchise taxes or the types of transactions described above, we do not expect any significant impact from relevant loss limitations and are not currently addressing enacted tax law changes for which this ASU applies, we do not expect this ASU to have a material impact on its consolidated results of operations and financial condition.
Planned date of adoption: Q1 2021ASU No. 2020-04Reference Rate Reform (Topic 848), Facilitation of the Effects of Reference Rate Reform on Financial Reporting
The amendments in Update 2020-04 are elective and apply to all entities that have contracts, hedging relationships, and other transactions that reference LIBOR or another reference rate expected to be discontinued due to reference rate reform. The new guidance provides the following optional expedients: simplify accounting analyses under current U.S. GAAP for contract modifications, simplify the assessment of hedge effectiveness, allow hedging relationships affected by reference rate reform to continue and allow a one-time election to sell or transfer debt securities classified as held to maturity that reference a rate affected by reference rate reform.
The amendments are effective for all entities from the beginning of an interim period that includes the issuance date of the ASU. An entity may elect to apply the amendments prospectively through December 31, 2022. The administrator of LIBOR has announced it will consult on its intention to cease the publication of the one week and two month USD LIBOR settings immediately following the LIBOR publication on December 31, 2021, and the remaining USD LIBOR settings immediately following the LIBOR publication on June 30, 2023. Extending the publication of certain USD LIBOR tenors until June 30, 2023 would allow most legacy USD LIBOR contracts to mature before LIBOR experiences disruptions. The Company is currently evaluating the impact of adopting this guidance.
Planned date of adoption: Before December 31, 2022
We consider the applicability and impact of all ASUs. ASUs not listed above were assessed and determined to be either not applicable, or had and are expected to have minimal impact on our financial statements and related disclosures.
NOTE 2 — REVENUE
Revenue is recognized when, or as, the Company transfers control of promised products or services to a customer in an amount that reflects the consideration the Company expects to be entitled in exchange for transferring those products or services. Sales shown on the Company's Consolidated Statements of Operations are from contracts with customers.
Payment terms and conditions vary by contract, although terms generally include a requirement of payment within a range from 30 to 90 days after the performance obligation has been satisfied; or in certain cases, up-front deposits. In circumstances where the timing of revenue recognition differs from the timing of invoicing, the Company has determined that the Company's
50
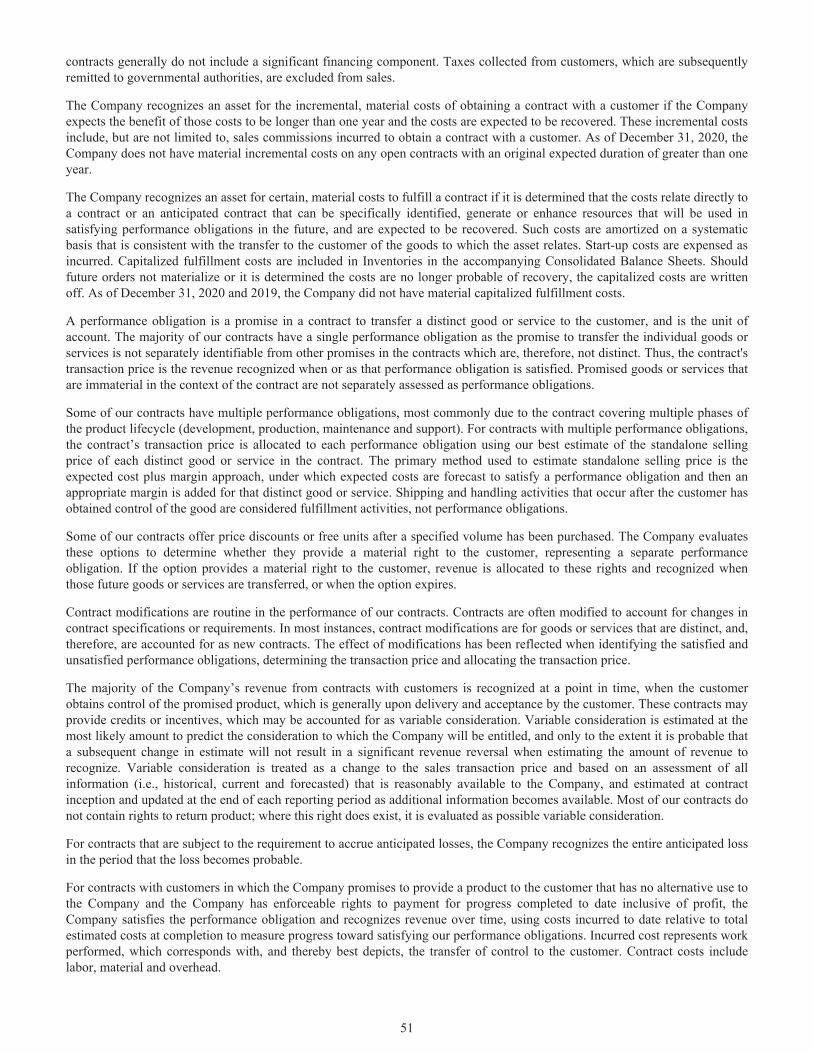
contracts generally do not include a significant financing component. Taxes collected from customers, which are subsequently remitted to governmental authorities, are excluded from sales.
The Company recognizes an asset for the incremental, material costs of obtaining a contract with a customer if the Company expects the benefit of those costs to be longer than one year and the costs are expected to be recovered. These incremental costs include, but are not limited to, sales commissions incurred to obtain a contract with a customer. As of December 31, 2020, the Company does not have material incremental costs on any open contracts with an original expected duration of greater than one year.
The Company recognizes an asset for certain, material costs to fulfill a contract if it is determined that the costs relate directly to a contract or an anticipated contract that can be specifically identified, generate or enhance resources that will be used in satisfying performance obligations in the future, and are expected to be recovered. Such costs are amortized on a systematic basis that is consistent with the transfer to the customer of the goods to which the asset relates. Start-up costs are expensed as incurred. Capitalized fulfillment costs are included in Inventories in the accompanying Consolidated Balance Sheets. Should future orders not materialize or it is determined the costs are no longer probable of recovery, the capitalized costs are written off. As of December 31, 2020 and 2019, the Company did not have material capitalized fulfillment costs.
A performance obligation is a promise in a contract to transfer a distinct good or service to the customer, and is the unit of account. The majority of our contracts have a single performance obligation as the promise to transfer the individual goods or services is not separately identifiable from other promises in the contracts which are, therefore, not distinct. Thus, the contract's transaction price is the revenue recognized when or as that performance obligation is satisfied. Promised goods or services that are immaterial in the context of the contract are not separately assessed as performance obligations.
Some of our contracts have multiple performance obligations, most commonly due to the contract covering multiple phases of the product lifecycle (development, production, maintenance and support). For contracts with multiple performance obligations, the contract’s transaction price is allocated to each performance obligation using our best estimate of the standalone selling price of each distinct good or service in the contract. The primary method used to estimate standalone selling price is the expected cost plus margin approach, under which expected costs are forecast to satisfy a performance obligation and then an appropriate margin is added for that distinct good or service. Shipping and handling activities that occur after the customer has obtained control of the good are considered fulfillment activities, not performance obligations.
Some of our contracts offer price discounts or free units after a specified volume has been purchased. The Company evaluates these options to determine whether they provide a material right to the customer, representing a separate performance obligation. If the option provides a material right to the customer, revenue is allocated to these rights and recognized when those future goods or services are transferred, or when the option expires.
Contract modifications are routine in the performance of our contracts. Contracts are often modified to account for changes in contract specifications or requirements. In most instances, contract modifications are for goods or services that are distinct, and, therefore, are accounted for as new contracts. The effect of modifications has been reflected when identifying the satisfied and unsatisfied performance obligations, determining the transaction price and allocating the transaction price.
The majority of the Company’s revenue from contracts with customers is recognized at a point in time, when the customer obtains control of the promised product, which is generally upon delivery and acceptance by the customer. These contracts may provide credits or incentives, which may be accounted for as variable consideration. Variable consideration is estimated at the most likely amount to predict the consideration to which the Company will be entitled, and only to the extent it is probable that a subsequent change in estimate will not result in a significant revenue reversal when estimating the amount of revenue to recognize. Variable consideration is treated as a change to the sales transaction price and based on an assessment of all information (i.e., historical, current and forecasted) that is reasonably available to the Company, and estimated at contract inception and updated at the end of each reporting period as additional information becomes available. Most of our contracts do not contain rights to return product; where this right does exist, it is evaluated as possible variable consideration.
For contracts that are subject to the requirement to accrue anticipated losses, the Company recognizes the entire anticipated loss in the period that the loss becomes probable.
For contracts with customers in which the Company promises to provide a product to the customer that has no alternative use to the Company and the Company has enforceable rights to payment for progress completed to date inclusive of profit, the Company satisfies the performance obligation and recognizes revenue over time, using costs incurred to date relative to total estimated costs at completion to measure progress toward satisfying our performance obligations. Incurred cost represents work performed, which corresponds with, and thereby best depicts, the transfer of control to the customer. Contract costs include labor, material and overhead.
51
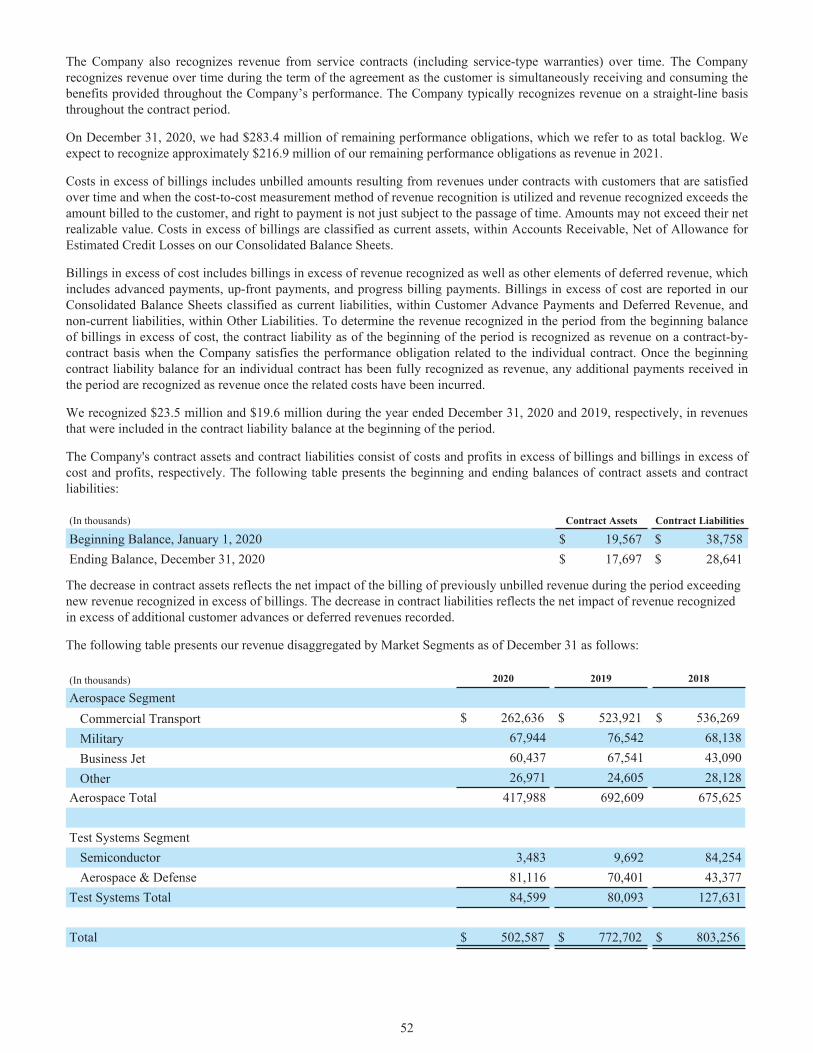
The Company also recognizes revenue from service contracts (including service-type warranties) over time. The Company recognizes revenue over time during the term of the agreement as the customer is simultaneously receiving and consuming the benefits provided throughout the Company’s performance. The Company typically recognizes revenue on a straight-line basis throughout the contract period.
On December 31, 2020, we had $283.4 million of remaining performance obligations, which we refer to as total backlog. We expect to recognize approximately $216.9 million of our remaining performance obligations as revenue in 2021.
Costs in excess of billings includes unbilled amounts resulting from revenues under contracts with customers that are satisfied over time and when the cost-to-cost measurement method of revenue recognition is utilized and revenue recognized exceeds the amount billed to the customer, and right to payment is not just subject to the passage of time. Amounts may not exceed their net realizable value. Costs in excess of billings are classified as current assets, within Accounts Receivable, Net of Allowance for Estimated Credit Losses on our Consolidated Balance Sheets.
Billings in excess of cost includes billings in excess of revenue recognized as well as other elements of deferred revenue, which includes advanced payments, up-front payments, and progress billing payments. Billings in excess of cost are reported in our Consolidated Balance Sheets classified as current liabilities, within Customer Advance Payments and Deferred Revenue, and non-current liabilities, within Other Liabilities. To determine the revenue recognized in the period from the beginning balance of billings in excess of cost, the contract liability as of the beginning of the period is recognized as revenue on a contract-by-contract basis when the Company satisfies the performance obligation related to the individual contract. Once the beginning contract liability balance for an individual contract has been fully recognized as revenue, any additional payments received in the period are recognized as revenue once the related costs have been incurred.
We recognized $23.5 million and $19.6 million during the year ended December 31, 2020 and 2019, respectively, in revenues that were included in the contract liability balance at the beginning of the period.
The Company's contract assets and contract liabilities consist of costs and profits in excess of billings and billings in excess of cost and profits, respectively. The following table presents the beginning and ending balances of contract assets and contract liabilities:
(In thousands) Contract Assets Contract Liabilities
Beginning Balance, January 1, 2020 $ 19,567 $ 38,758 Ending Balance, December 31, 2020 $ 17,697 $ 28,641
The decrease in contract assets reflects the net impact of the billing of previously unbilled revenue during the period exceeding new revenue recognized in excess of billings. The decrease in contract liabilities reflects the net impact of revenue recognized in excess of additional customer advances or deferred revenues recorded.
The following table presents our revenue disaggregated by Market Segments as of December 31 as follows:
(In thousands) 2020 2019 2018
Aerospace SegmentCommercial Transport $ 262,636 $ 523,921 $ 536,269 Military 67,944 76,542 68,138Business Jet 60,437 67,541 43,090Other 26,971 24,605 28,128
Aerospace Total 417,988 692,609 675,625
Test Systems SegmentSemiconductor 3,483 9,692 84,254Aerospace & Defense 81,116 70,401 43,377
Test Systems Total 84,599 80,093 127,631
Total $ 502,587 $ 772,702 $ 803,256
52
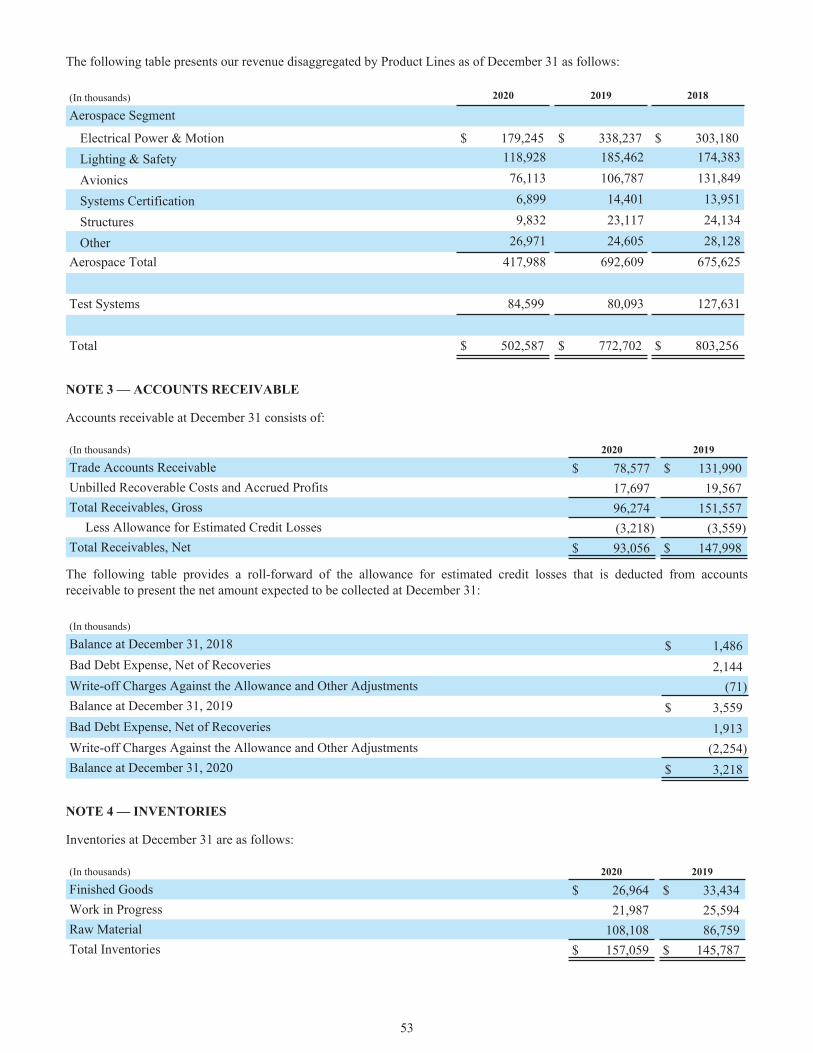
The following table presents our revenue disaggregated by Product Lines as of December 31 as follows:
(In thousands) 2020 2019 2018
Aerospace Segment
Electrical Power & Motion $ 179,245 $ 338,237 $ 303,180 Lighting & Safety 118,928 185,462 174,383
Avionics 76,113 106,787 131,849
Systems Certification 6,899 14,401 13,951
Structures 9,832 23,117 24,134
Other 26,971 24,605 28,128Aerospace Total 417,988 692,609 675,625
Test Systems 84,599 80,093 127,631
Total $ 502,587 $ 772,702 $ 803,256
NOTE 3 — ACCOUNTS RECEIVABLE
Accounts receivable at December 31 consists of:
(In thousands) 2020 2019
Trade Accounts Receivable $ 78,577 $ 131,990 Unbilled Recoverable Costs and Accrued Profits 17,697 19,567 Total Receivables, Gross 96,274 151,557
Less Allowance for Estimated Credit Losses (3,218) (3,559) Total Receivables, Net $ 93,056 $ 147,998
The following table provides a roll-forward of the allowance for estimated credit losses that is deducted from accounts receivable to present the net amount expected to be collected at December 31:
(In thousands)
Balance at December 31, 2018 $ 1,486 Bad Debt Expense, Net of Recoveries 2,144 Write-off Charges Against the Allowance and Other Adjustments (71) Balance at December 31, 2019 $ 3,559 Bad Debt Expense, Net of Recoveries 1,913 Write-off Charges Against the Allowance and Other Adjustments (2,254) Balance at December 31, 2020 $ 3,218
NOTE 4 — INVENTORIES
Inventories at December 31 are as follows:
(In thousands) 2020 2019
Finished Goods $ 26,964 $ 33,434 Work in Progress 21,987 25,594 Raw Material 108,108 86,759 Total Inventories $ 157,059 $ 145,787
53
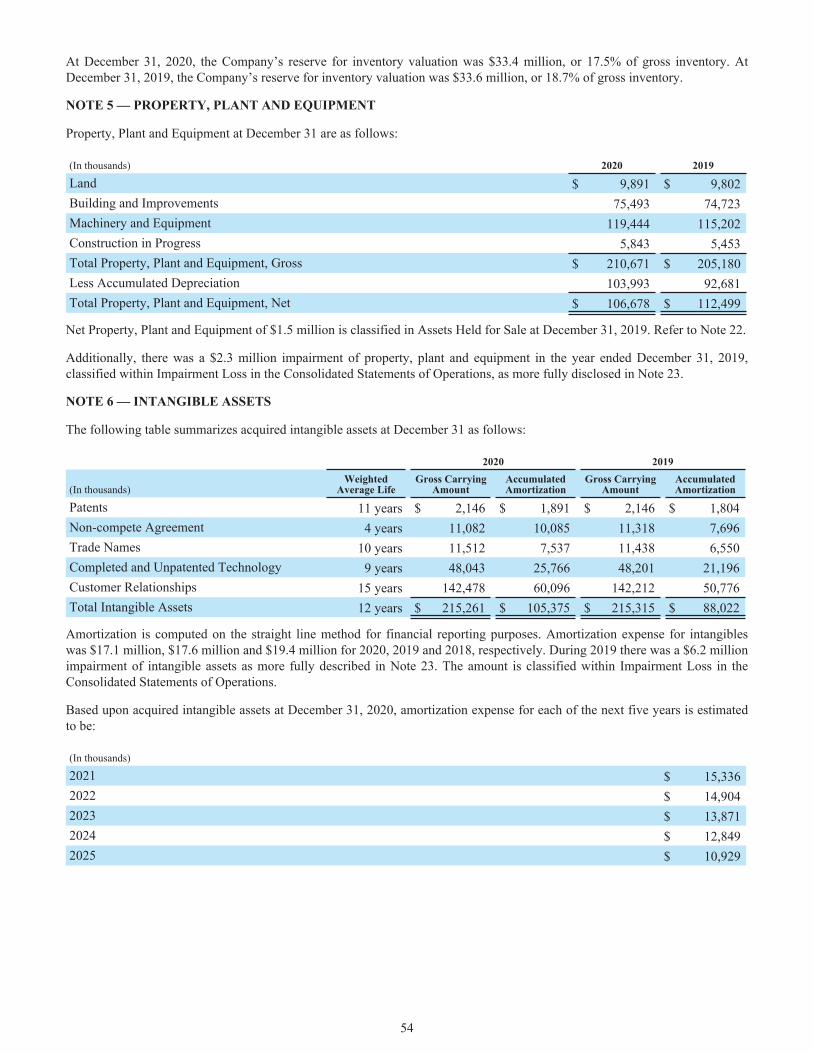
At December 31, 2020, the Company’s reserve for inventory valuation was $33.4 million, or 17.5% of gross inventory. At December 31, 2019, the Company’s reserve for inventory valuation was $33.6 million, or 18.7% of gross inventory.
NOTE 5 — PROPERTY, PLANT AND EQUIPMENT
Property, Plant and Equipment at December 31 are as follows:
(In thousands) 2020 2019
Land $ 9,891 $ 9,802 Building and Improvements 75,493 74,723 Machinery and Equipment 119,444 115,202 Construction in Progress 5,843 5,453 Total Property, Plant and Equipment, Gross $ 210,671 $ 205,180 Less Accumulated Depreciation 103,993 92,681 Total Property, Plant and Equipment, Net $ 106,678 $ 112,499
Net Property, Plant and Equipment of $1.5 million is classified in Assets Held for Sale at December 31, 2019. Refer to Note 22.
Additionally, there was a $2.3 million impairment of property, plant and equipment in the year ended December 31, 2019, classified within Impairment Loss in the Consolidated Statements of Operations, as more fully disclosed in Note 23.
NOTE 6 — INTANGIBLE ASSETS
The following table summarizes acquired intangible assets at December 31 as follows:
2020 2019
(In thousands)Weighted
Average LifeGross Carrying
AmountAccumulatedAmortization
Gross CarryingAmount
AccumulatedAmortization
Patents 11 years $ 2,146 $ 1,891 $ 2,146 $ 1,804 Non-compete Agreement 4 years 11,082 10,085 11,318 7,696 Trade Names 10 years 11,512 7,537 11,438 6,550 Completed and Unpatented Technology 9 years 48,043 25,766 48,201 21,196 Customer Relationships 15 years 142,478 60,096 142,212 50,776 Total Intangible Assets 12 years $ 215,261 $ 105,375 $ 215,315 $ 88,022
Amortization is computed on the straight line method for financial reporting purposes. Amortization expense for intangibles was $17.1 million, $17.6 million and $19.4 million for 2020, 2019 and 2018, respectively. During 2019 there was a $6.2 million impairment of intangible assets as more fully described in Note 23. The amount is classified within Impairment Loss in the Consolidated Statements of Operations.
Based upon acquired intangible assets at December 31, 2020, amortization expense for each of the next five years is estimated to be:
(In thousands)
2021 $ 15,336 2022 $ 14,904 2023 $ 13,871 2024 $ 12,849 2025 $ 10,929
54
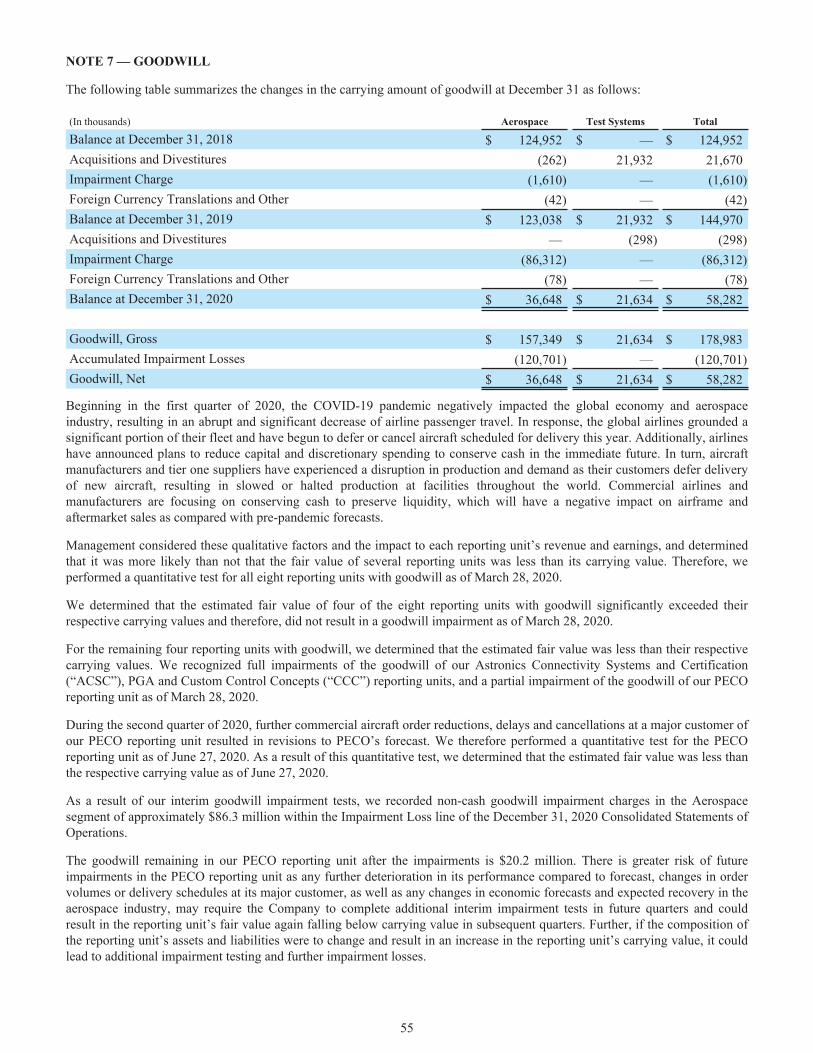
NOTE 7 — GOODWILL
The following table summarizes the changes in the carrying amount of goodwill at December 31 as follows:
(In thousands) Aerospace Test Systems Total
Balance at December 31, 2018 $ 124,952 $ — $ 124,952 Acquisitions and Divestitures (262) 21,932 21,670 Impairment Charge (1,610) — (1,610) Foreign Currency Translations and Other (42) — (42) Balance at December 31, 2019 $ 123,038 $ 21,932 $ 144,970 Acquisitions and Divestitures — (298) (298) Impairment Charge (86,312) — (86,312) Foreign Currency Translations and Other (78) — (78) Balance at December 31, 2020 $ 36,648 $ 21,634 $ 58,282
Goodwill, Gross $ 157,349 $ 21,634 $ 178,983 Accumulated Impairment Losses (120,701) — (120,701) Goodwill, Net $ 36,648 $ 21,634 $ 58,282
Beginning in the first quarter of 2020, the COVID-19 pandemic negatively impacted the global economy and aerospace industry, resulting in an abrupt and significant decrease of airline passenger travel. In response, the global airlines grounded a significant portion of their fleet and have begun to defer or cancel aircraft scheduled for delivery this year. Additionally, airlines have announced plans to reduce capital and discretionary spending to conserve cash in the immediate future. In turn, aircraft manufacturers and tier one suppliers have experienced a disruption in production and demand as their customers defer delivery of new aircraft, resulting in slowed or halted production at facilities throughout the world. Commercial airlines and manufacturers are focusing on conserving cash to preserve liquidity, which will have a negative impact on airframe and aftermarket sales as compared with pre-pandemic forecasts.
Management considered these qualitative factors and the impact to each reporting unit’s revenue and earnings, and determined that it was more likely than not that the fair value of several reporting units was less than its carrying value. Therefore, we performed a quantitative test for all eight reporting units with goodwill as of March 28, 2020.
We determined that the estimated fair value of four of the eight reporting units with goodwill significantly exceeded their respective carrying values and therefore, did not result in a goodwill impairment as of March 28, 2020.
For the remaining four reporting units with goodwill, we determined that the estimated fair value was less than their respective carrying values. We recognized full impairments of the goodwill of our Astronics Connectivity Systems and Certification (“ACSC”), PGA and Custom Control Concepts (“CCC”) reporting units, and a partial impairment of the goodwill of our PECO reporting unit as of March 28, 2020.
During the second quarter of 2020, further commercial aircraft order reductions, delays and cancellations at a major customer of our PECO reporting unit resulted in revisions to PECO’s forecast. We therefore performed a quantitative test for the PECO reporting unit as of June 27, 2020. As a result of this quantitative test, we determined that the estimated fair value was less than the respective carrying value as of June 27, 2020.
As a result of our interim goodwill impairment tests, we recorded non-cash goodwill impairment charges in the Aerospace segment of approximately $86.3 million within the Impairment Loss line of the December 31, 2020 Consolidated Statements of Operations.
The goodwill remaining in our PECO reporting unit after the impairments is $20.2 million. There is greater risk of future impairments in the PECO reporting unit as any further deterioration in its performance compared to forecast, changes in order volumes or delivery schedules at its major customer, as well as any changes in economic forecasts and expected recovery in the aerospace industry, may require the Company to complete additional interim impairment tests in future quarters and could result in the reporting unit’s fair value again falling below carrying value in subsequent quarters. Further, if the composition of the reporting unit’s assets and liabilities were to change and result in an increase in the reporting unit’s carrying value, it could lead to additional impairment testing and further impairment losses.
55
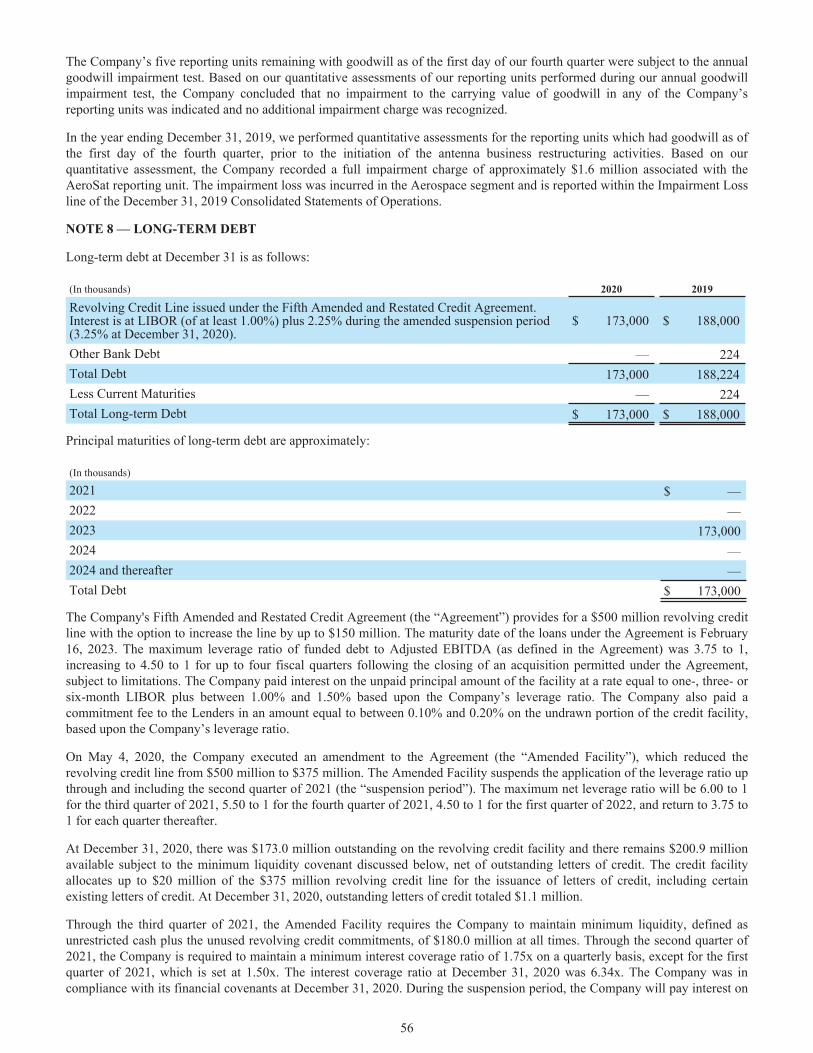
The Company’s five reporting units remaining with goodwill as of the first day of our fourth quarter were subject to the annual goodwill impairment test. Based on our quantitative assessments of our reporting units performed during our annual goodwill impairment test, the Company concluded that no impairment to the carrying value of goodwill in any of the Company’s reporting units was indicated and no additional impairment charge was recognized.
In the year ending December 31, 2019, we performed quantitative assessments for the reporting units which had goodwill as of the first day of the fourth quarter, prior to the initiation of the antenna business restructuring activities. Based on our quantitative assessment, the Company recorded a full impairment charge of approximately $1.6 million associated with the AeroSat reporting unit. The impairment loss was incurred in the Aerospace segment and is reported within the Impairment Loss line of the December 31, 2019 Consolidated Statements of Operations.
NOTE 8 — LONG-TERM DEBT
Long-term debt at December 31 is as follows:
(In thousands) 2020 2019
Revolving Credit Line issued under the Fifth Amended and Restated Credit Agreement. Interest is at LIBOR (of at least 1.00%) plus 2.25% during the amended suspension period (3.25% at December 31, 2020).
$ 173,000 $ 188,000
Other Bank Debt — 224 Total Debt 173,000 188,224 Less Current Maturities — 224 Total Long-term Debt $ 173,000 $ 188,000
Principal maturities of long-term debt are approximately:
(In thousands)
2021 $ — 2022 — 2023 173,000 2024 — 2024 and thereafter — Total Debt $ 173,000
The Company's Fifth Amended and Restated Credit Agreement (the “Agreement”) provides for a $500 million revolving credit line with the option to increase the line by up to $150 million. The maturity date of the loans under the Agreement is February 16, 2023. The maximum leverage ratio of funded debt to Adjusted EBITDA (as defined in the Agreement) was 3.75 to 1, increasing to 4.50 to 1 for up to four fiscal quarters following the closing of an acquisition permitted under the Agreement, subject to limitations. The Company paid interest on the unpaid principal amount of the facility at a rate equal to one-, three- or six-month LIBOR plus between 1.00% and 1.50% based upon the Company’s leverage ratio. The Company also paid a commitment fee to the Lenders in an amount equal to between 0.10% and 0.20% on the undrawn portion of the credit facility, based upon the Company’s leverage ratio.
On May 4, 2020, the Company executed an amendment to the Agreement (the “Amended Facility”), which reduced the revolving credit line from $500 million to $375 million. The Amended Facility suspends the application of the leverage ratio up through and including the second quarter of 2021 (the “suspension period”). The maximum net leverage ratio will be 6.00 to 1 for the third quarter of 2021, 5.50 to 1 for the fourth quarter of 2021, 4.50 to 1 for the first quarter of 2022, and return to 3.75 to 1 for each quarter thereafter.
At December 31, 2020, there was $173.0 million outstanding on the revolving credit facility and there remains $200.9 million available subject to the minimum liquidity covenant discussed below, net of outstanding letters of credit. The credit facility allocates up to $20 million of the $375 million revolving credit line for the issuance of letters of credit, including certain existing letters of credit. At December 31, 2020, outstanding letters of credit totaled $1.1 million.
Through the third quarter of 2021, the Amended Facility requires the Company to maintain minimum liquidity, defined as unrestricted cash plus the unused revolving credit commitments, of $180.0 million at all times. Through the second quarter of 2021, the Company is required to maintain a minimum interest coverage ratio of 1.75x on a quarterly basis, except for the first quarter of 2021, which is set at 1.50x. The interest coverage ratio at December 31, 2020 was 6.34x. The Company was in compliance with its financial covenants at December 31, 2020. During the suspension period, the Company will pay interest on
56
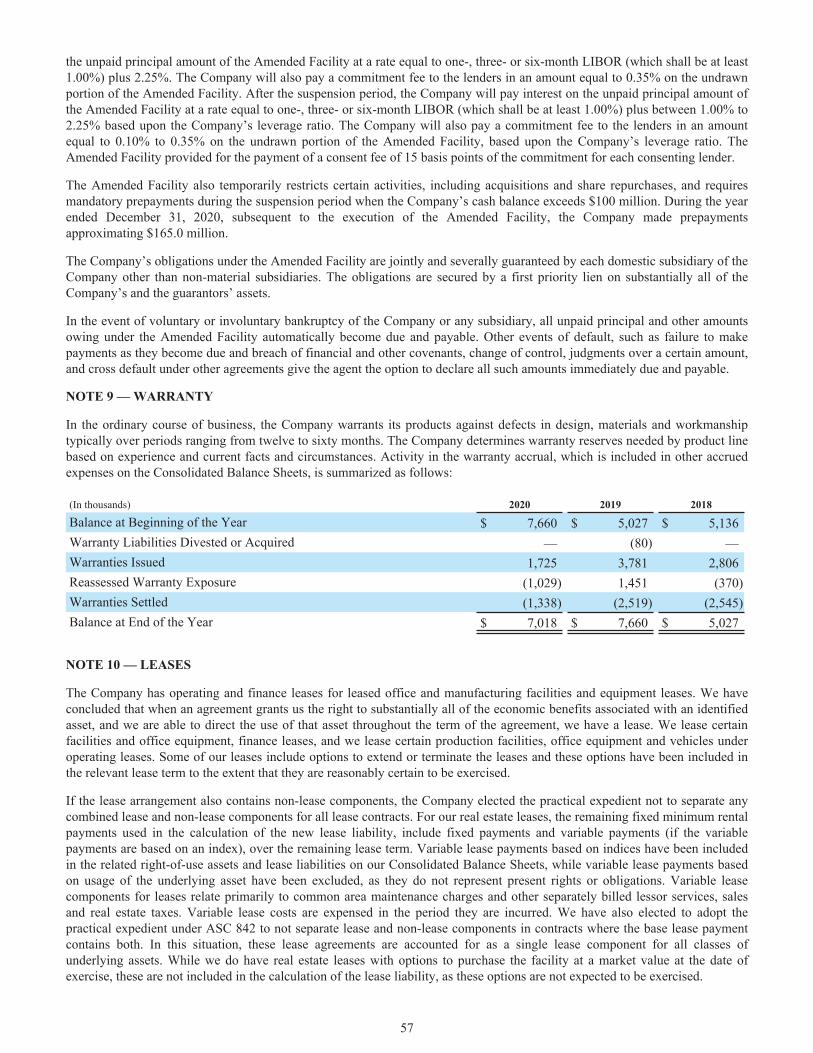
the unpaid principal amount of the Amended Facility at a rate equal to one-, three- or six-month LIBOR (which shall be at least 1.00%) plus 2.25%. The Company will also pay a commitment fee to the lenders in an amount equal to 0.35% on the undrawn portion of the Amended Facility. After the suspension period, the Company will pay interest on the unpaid principal amount of the Amended Facility at a rate equal to one-, three- or six-month LIBOR (which shall be at least 1.00%) plus between 1.00% to 2.25% based upon the Company’s leverage ratio. The Company will also pay a commitment fee to the lenders in an amount equal to 0.10% to 0.35% on the undrawn portion of the Amended Facility, based upon the Company’s leverage ratio. The Amended Facility provided for the payment of a consent fee of 15 basis points of the commitment for each consenting lender.
The Amended Facility also temporarily restricts certain activities, including acquisitions and share repurchases, and requires mandatory prepayments during the suspension period when the Company’s cash balance exceeds $100 million. During the year ended December 31, 2020, subsequent to the execution of the Amended Facility, the Company made prepayments approximating $165.0 million.
The Company’s obligations under the Amended Facility are jointly and severally guaranteed by each domestic subsidiary of the Company other than non-material subsidiaries. The obligations are secured by a first priority lien on substantially all of the Company’s and the guarantors’ assets.
In the event of voluntary or involuntary bankruptcy of the Company or any subsidiary, all unpaid principal and other amounts owing under the Amended Facility automatically become due and payable. Other events of default, such as failure to make payments as they become due and breach of financial and other covenants, change of control, judgments over a certain amount, and cross default under other agreements give the agent the option to declare all such amounts immediately due and payable.
NOTE 9 — WARRANTY
In the ordinary course of business, the Company warrants its products against defects in design, materials and workmanship typically over periods ranging from twelve to sixty months. The Company determines warranty reserves needed by product line based on experience and current facts and circumstances. Activity in the warranty accrual, which is included in other accrued expenses on the Consolidated Balance Sheets, is summarized as follows:
(In thousands) 2020 2019 2018
Balance at Beginning of the Year $ 7,660 $ 5,027 $ 5,136 Warranty Liabilities Divested or Acquired — (80) — Warranties Issued 1,725 3,781 2,806 Reassessed Warranty Exposure (1,029) 1,451 (370) Warranties Settled (1,338) (2,519) (2,545) Balance at End of the Year $ 7,018 $ 7,660 $ 5,027
NOTE 10 — LEASES
The Company has operating and finance leases for leased office and manufacturing facilities and equipment leases. We have concluded that when an agreement grants us the right to substantially all of the economic benefits associated with an identified asset, and we are able to direct the use of that asset throughout the term of the agreement, we have a lease. We lease certain facilities and office equipment, finance leases, and we lease certain production facilities, office equipment and vehicles under operating leases. Some of our leases include options to extend or terminate the leases and these options have been included in the relevant lease term to the extent that they are reasonably certain to be exercised.
If the lease arrangement also contains non-lease components, the Company elected the practical expedient not to separate any combined lease and non-lease components for all lease contracts. For our real estate leases, the remaining fixed minimum rental payments used in the calculation of the new lease liability, include fixed payments and variable payments (if the variable payments are based on an index), over the remaining lease term. Variable lease payments based on indices have been included in the related right-of-use assets and lease liabilities on our Consolidated Balance Sheets, while variable lease payments based on usage of the underlying asset have been excluded, as they do not represent present rights or obligations. Variable lease components for leases relate primarily to common area maintenance charges and other separately billed lessor services, sales and real estate taxes. Variable lease costs are expensed in the period they are incurred. We have also elected to adopt the practical expedient under ASC 842 to not separate lease and non-lease components in contracts where the base lease payment contains both. In this situation, these lease agreements are accounted for as a single lease component for all classes of underlying assets. While we do have real estate leases with options to purchase the facility at a market value at the date of exercise, these are not included in the calculation of the lease liability, as these options are not expected to be exercised.
57
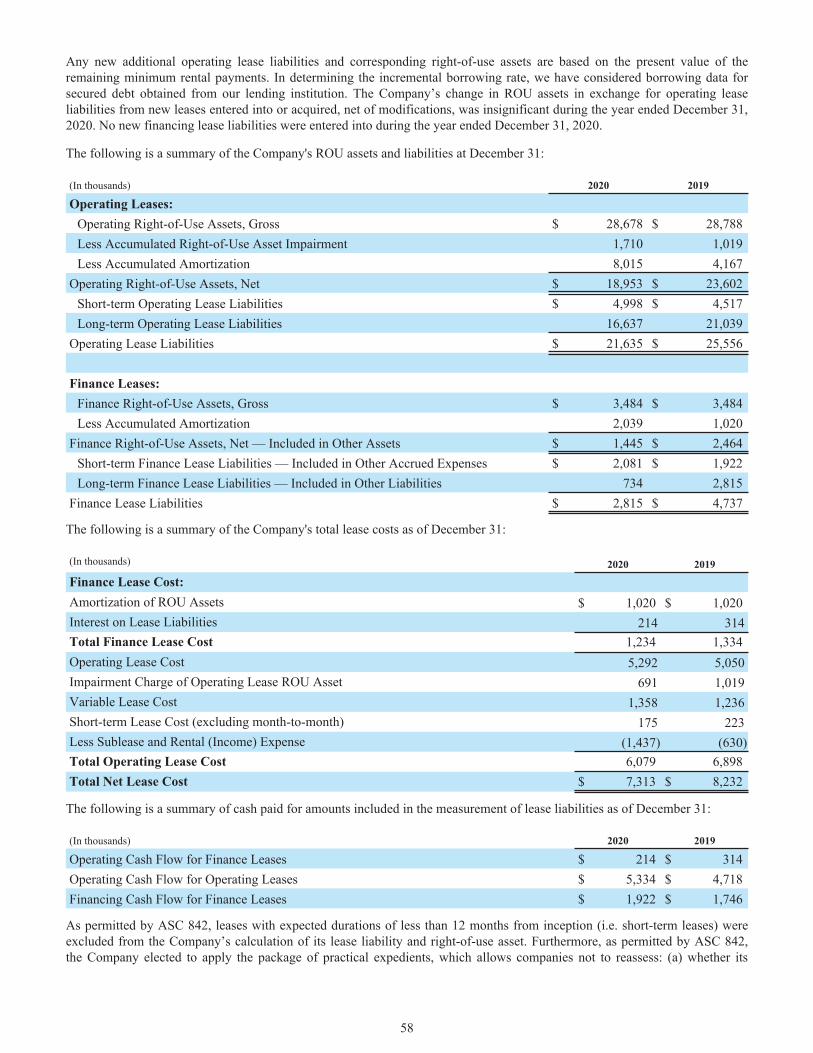
Any new additional operating lease liabilities and corresponding right-of-use assets are based on the present value of the remaining minimum rental payments. In determining the incremental borrowing rate, we have considered borrowing data for secured debt obtained from our lending institution. The Company’s change in ROU assets in exchange for operating lease liabilities from new leases entered into or acquired, net of modifications, was insignificant during the year ended December 31, 2020. No new financing lease liabilities were entered into during the year ended December 31, 2020.
The following is a summary of the Company's ROU assets and liabilities at December 31:
(In thousands) 2020 2019
Operating Leases:Operating Right-of-Use Assets, Gross $ 28,678 $ 28,788 Less Accumulated Right-of-Use Asset Impairment 1,710 1,019 Less Accumulated Amortization 8,015 4,167
Operating Right-of-Use Assets, Net $ 18,953 $ 23,602 Short-term Operating Lease Liabilities $ 4,998 $ 4,517 Long-term Operating Lease Liabilities 16,637 21,039
Operating Lease Liabilities $ 21,635 $ 25,556
Finance Leases:Finance Right-of-Use Assets, Gross $ 3,484 $ 3,484 Less Accumulated Amortization 2,039 1,020
Finance Right-of-Use Assets, Net — Included in Other Assets $ 1,445 $ 2,464 Short-term Finance Lease Liabilities — Included in Other Accrued Expenses $ 2,081 $ 1,922 Long-term Finance Lease Liabilities — Included in Other Liabilities 734 2,815
Finance Lease Liabilities $ 2,815 $ 4,737
The following is a summary of the Company's total lease costs as of December 31:
(In thousands) 2020 2019
Finance Lease Cost:Amortization of ROU Assets $ 1,020 $ 1,020 Interest on Lease Liabilities 214 314Total Finance Lease Cost 1,234 1,334 Operating Lease Cost 5,292 5,050Impairment Charge of Operating Lease ROU Asset 691 1,019Variable Lease Cost 1,358 1,236Short-term Lease Cost (excluding month-to-month) 175 223Less Sublease and Rental (Income) Expense (1,437) (630) Total Operating Lease Cost 6,079 6,898 Total Net Lease Cost $ 7,313 $ 8,232
The following is a summary of cash paid for amounts included in the measurement of lease liabilities as of December 31:
(In thousands) 2020 2019
Operating Cash Flow for Finance Leases $ 214 $ 314 Operating Cash Flow for Operating Leases $ 5,334 $ 4,718 Financing Cash Flow for Finance Leases $ 1,922 $ 1,746
As permitted by ASC 842, leases with expected durations of less than 12 months from inception (i.e. short-term leases) were excluded from the Company’s calculation of its lease liability and right-of-use asset. Furthermore, as permitted by ASC 842, the Company elected to apply the package of practical expedients, which allows companies not to reassess: (a) whether its
58
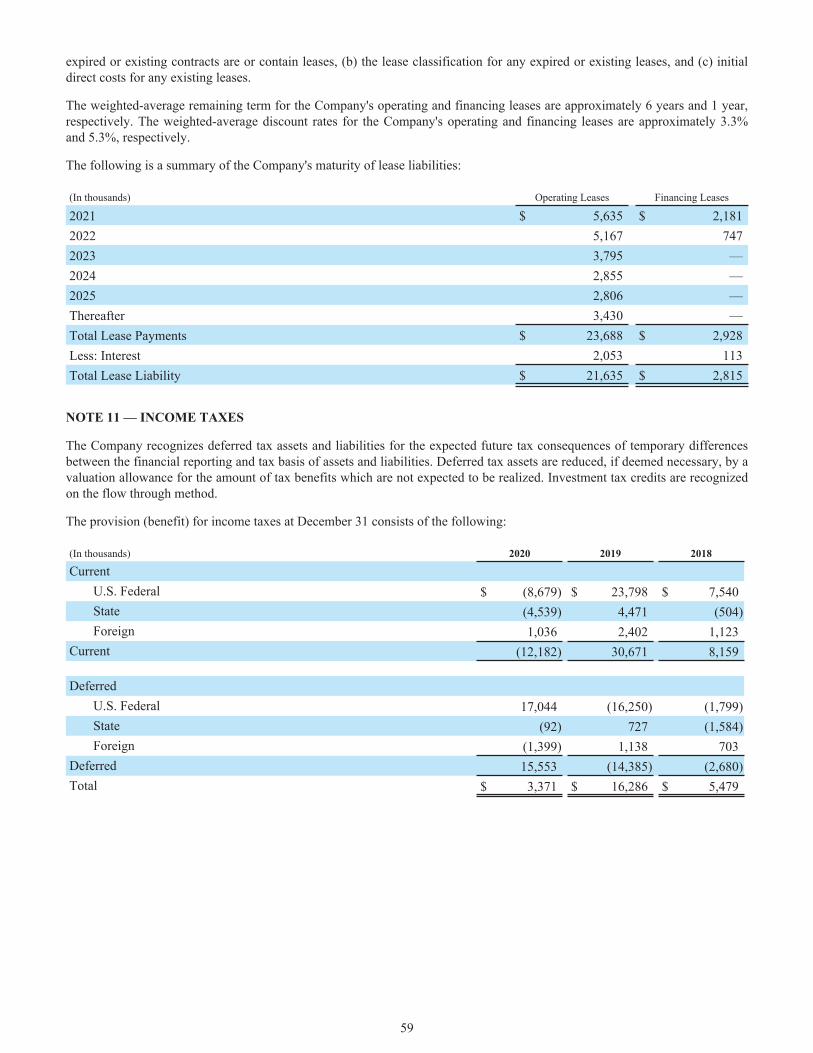
expired or existing contracts are or contain leases, (b) the lease classification for any expired or existing leases, and (c) initial direct costs for any existing leases.
The weighted-average remaining term for the Company's operating and financing leases are approximately 6 years and 1 year, respectively. The weighted-average discount rates for the Company's operating and financing leases are approximately 3.3% and 5.3%, respectively.
The following is a summary of the Company's maturity of lease liabilities:
(In thousands) Operating Leases Financing Leases
2021 $ 5,635 $ 2,181 2022 5,167 747 2023 3,795 — 2024 2,855 — 2025 2,806 — Thereafter 3,430 — Total Lease Payments $ 23,688 $ 2,928 Less: Interest 2,053 113 Total Lease Liability $ 21,635 $ 2,815
NOTE 11 — INCOME TAXES
The Company recognizes deferred tax assets and liabilities for the expected future tax consequences of temporary differences between the financial reporting and tax basis of assets and liabilities. Deferred tax assets are reduced, if deemed necessary, by a valuation allowance for the amount of tax benefits which are not expected to be realized. Investment tax credits are recognized on the flow through method.
The provision (benefit) for income taxes at December 31 consists of the following:
(In thousands) 2020 2019 2018
CurrentU.S. Federal $ (8,679) $ 23,798 $ 7,540 State (4,539) 4,471 (504) Foreign 1,036 2,402 1,123
Current (12,182) 30,671 8,159
DeferredU.S. Federal 17,044 (16,250) (1,799) State (92) 727 (1,584) Foreign (1,399) 1,138 703
Deferred 15,553 (14,385) (2,680) Total $ 3,371 $ 16,286 $ 5,479
59
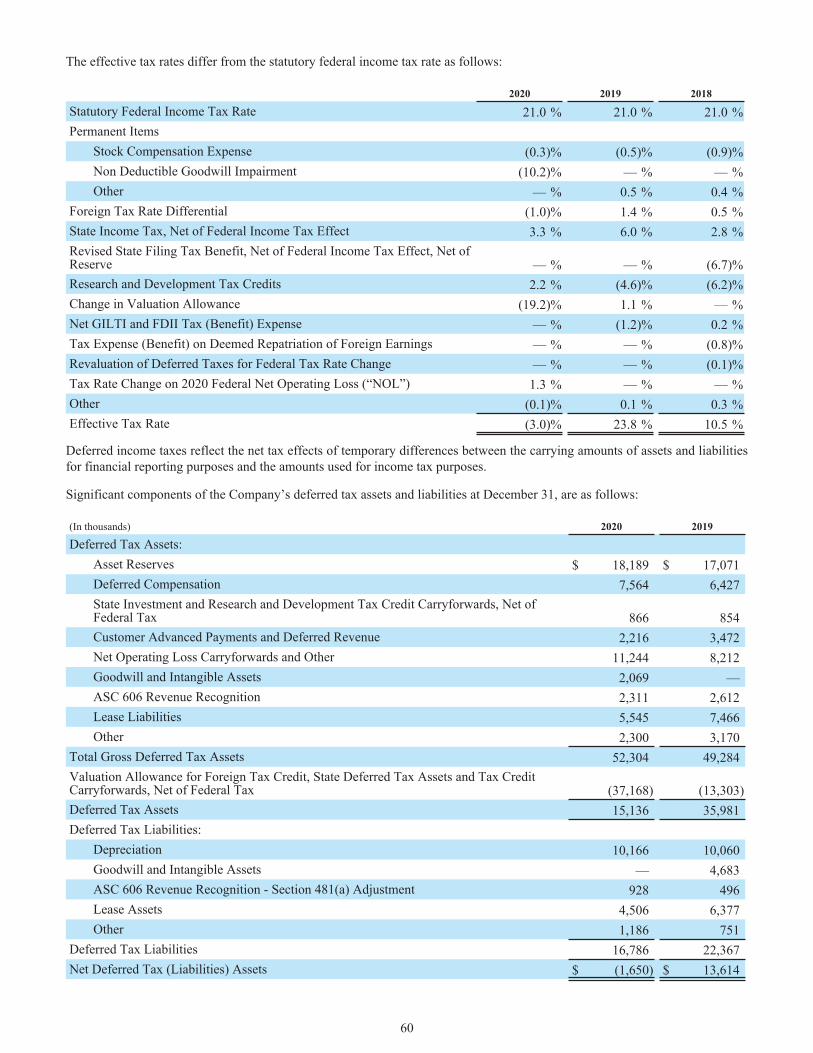
The effective tax rates differ from the statutory federal income tax rate as follows:
2020 2019 2018
Statutory Federal Income Tax Rate 21.0 % 21.0 % 21.0 %Permanent Items
Stock Compensation Expense (0.3) % (0.5) % (0.9) %Non Deductible Goodwill Impairment (10.2) % — % — %Other — % 0.5 % 0.4 %
Foreign Tax Rate Differential (1.0) % 1.4 % 0.5 %State Income Tax, Net of Federal Income Tax Effect 3.3 % 6.0 % 2.8 %Revised State Filing Tax Benefit, Net of Federal Income Tax Effect, Net of Reserve — % — % (6.7) %Research and Development Tax Credits 2.2 % (4.6) % (6.2) %Change in Valuation Allowance (19.2) % 1.1 % — %Net GILTI and FDII Tax (Benefit) Expense — % (1.2) % 0.2 %Tax Expense (Benefit) on Deemed Repatriation of Foreign Earnings — % — % (0.8) %Revaluation of Deferred Taxes for Federal Tax Rate Change — % — % (0.1) %Tax Rate Change on 2020 Federal Net Operating Loss (“NOL”) 1.3 % — % — %Other (0.1) % 0.1 % 0.3 %Effective Tax Rate (3.0) % 23.8 % 10.5 %
Deferred income taxes reflect the net tax effects of temporary differences between the carrying amounts of assets and liabilities for financial reporting purposes and the amounts used for income tax purposes.
Significant components of the Company’s deferred tax assets and liabilities at December 31, are as follows:
(In thousands) 2020 2019
Deferred Tax Assets:Asset Reserves $ 18,189 $ 17,071 Deferred Compensation 7,564 6,427 State Investment and Research and Development Tax Credit Carryforwards, Net of Federal Tax 866 854 Customer Advanced Payments and Deferred Revenue 2,216 3,472 Net Operating Loss Carryforwards and Other 11,244 8,212 Goodwill and Intangible Assets 2,069 — ASC 606 Revenue Recognition 2,311 2,612 Lease Liabilities 5,545 7,466 Other 2,300 3,170
Total Gross Deferred Tax Assets 52,304 49,284 Valuation Allowance for Foreign Tax Credit, State Deferred Tax Assets and Tax Credit Carryforwards, Net of Federal Tax (37,168) (13,303) Deferred Tax Assets 15,136 35,981 Deferred Tax Liabilities:
Depreciation 10,166 10,060 Goodwill and Intangible Assets — 4,683 ASC 606 Revenue Recognition - Section 481(a) Adjustment 928 496 Lease Assets 4,506 6,377 Other 1,186 751
Deferred Tax Liabilities 16,786 22,367 Net Deferred Tax (Liabilities) Assets $ (1,650) $ 13,614
60
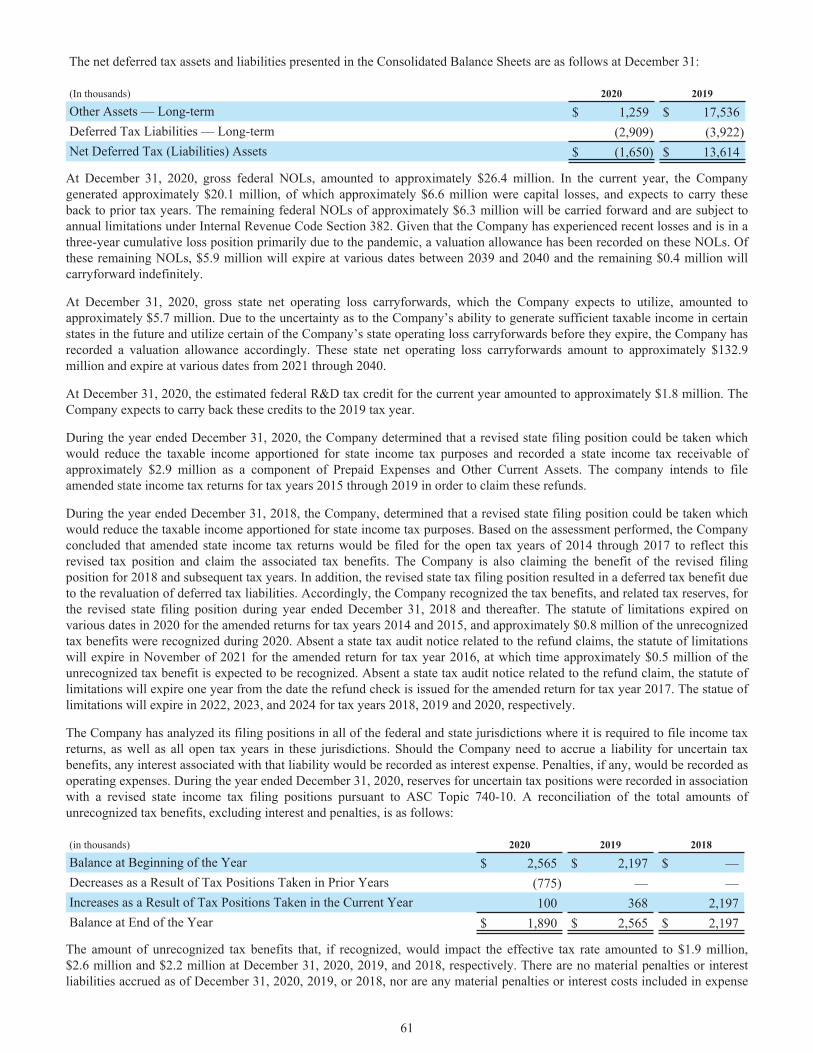
The net deferred tax assets and liabilities presented in the Consolidated Balance Sheets are as follows at December 31:
(In thousands) 2020 2019
Other Assets — Long-term $ 1,259 $ 17,536 Deferred Tax Liabilities — Long-term (2,909) (3,922) Net Deferred Tax (Liabilities) Assets $ (1,650) $ 13,614
At December 31, 2020, gross federal NOLs, amounted to approximately $26.4 million. In the current year, the Company generated approximately $20.1 million, of which approximately $6.6 million were capital losses, and expects to carry these back to prior tax years. The remaining federal NOLs of approximately $6.3 million will be carried forward and are subject to annual limitations under Internal Revenue Code Section 382. Given that the Company has experienced recent losses and is in a three-year cumulative loss position primarily due to the pandemic, a valuation allowance has been recorded on these NOLs. Of these remaining NOLs, $5.9 million will expire at various dates between 2039 and 2040 and the remaining $0.4 million will carryforward indefinitely.
At December 31, 2020, gross state net operating loss carryforwards, which the Company expects to utilize, amounted to approximately $5.7 million. Due to the uncertainty as to the Company’s ability to generate sufficient taxable income in certain states in the future and utilize certain of the Company’s state operating loss carryforwards before they expire, the Company has recorded a valuation allowance accordingly. These state net operating loss carryforwards amount to approximately $132.9 million and expire at various dates from 2021 through 2040.
At December 31, 2020, the estimated federal R&D tax credit for the current year amounted to approximately $1.8 million. The Company expects to carry back these credits to the 2019 tax year.
During the year ended December 31, 2020, the Company determined that a revised state filing position could be taken which would reduce the taxable income apportioned for state income tax purposes and recorded a state income tax receivable of approximately $2.9 million as a component of Prepaid Expenses and Other Current Assets. The company intends to file amended state income tax returns for tax years 2015 through 2019 in order to claim these refunds.
During the year ended December 31, 2018, the Company, determined that a revised state filing position could be taken which would reduce the taxable income apportioned for state income tax purposes. Based on the assessment performed, the Company concluded that amended state income tax returns would be filed for the open tax years of 2014 through 2017 to reflect this revised tax position and claim the associated tax benefits. The Company is also claiming the benefit of the revised filing position for 2018 and subsequent tax years. In addition, the revised state tax filing position resulted in a deferred tax benefit due to the revaluation of deferred tax liabilities. Accordingly, the Company recognized the tax benefits, and related tax reserves, for the revised state filing position during year ended December 31, 2018 and thereafter. The statute of limitations expired on various dates in 2020 for the amended returns for tax years 2014 and 2015, and approximately $0.8 million of the unrecognized tax benefits were recognized during 2020. Absent a state tax audit notice related to the refund claims, the statute of limitations will expire in November of 2021 for the amended return for tax year 2016, at which time approximately $0.5 million of the unrecognized tax benefit is expected to be recognized. Absent a state tax audit notice related to the refund claim, the statute of limitations will expire one year from the date the refund check is issued for the amended return for tax year 2017. The statue of limitations will expire in 2022, 2023, and 2024 for tax years 2018, 2019 and 2020, respectively.
The Company has analyzed its filing positions in all of the federal and state jurisdictions where it is required to file income tax returns, as well as all open tax years in these jurisdictions. Should the Company need to accrue a liability for uncertain tax benefits, any interest associated with that liability would be recorded as interest expense. Penalties, if any, would be recorded as operating expenses. During the year ended December 31, 2020, reserves for uncertain tax positions were recorded in association with a revised state income tax filing positions pursuant to ASC Topic 740-10. A reconciliation of the total amounts of unrecognized tax benefits, excluding interest and penalties, is as follows:
(in thousands) 2020 2019 2018
Balance at Beginning of the Year $ 2,565 $ 2,197 $ — Decreases as a Result of Tax Positions Taken in Prior Years (775) — — Increases as a Result of Tax Positions Taken in the Current Year 100 368 2,197 Balance at End of the Year $ 1,890 $ 2,565 $ 2,197
The amount of unrecognized tax benefits that, if recognized, would impact the effective tax rate amounted to $1.9 million, $2.6 million and $2.2 million at December 31, 2020, 2019, and 2018, respectively. There are no material penalties or interest liabilities accrued as of December 31, 2020, 2019, or 2018, nor are any material penalties or interest costs included in expense
61
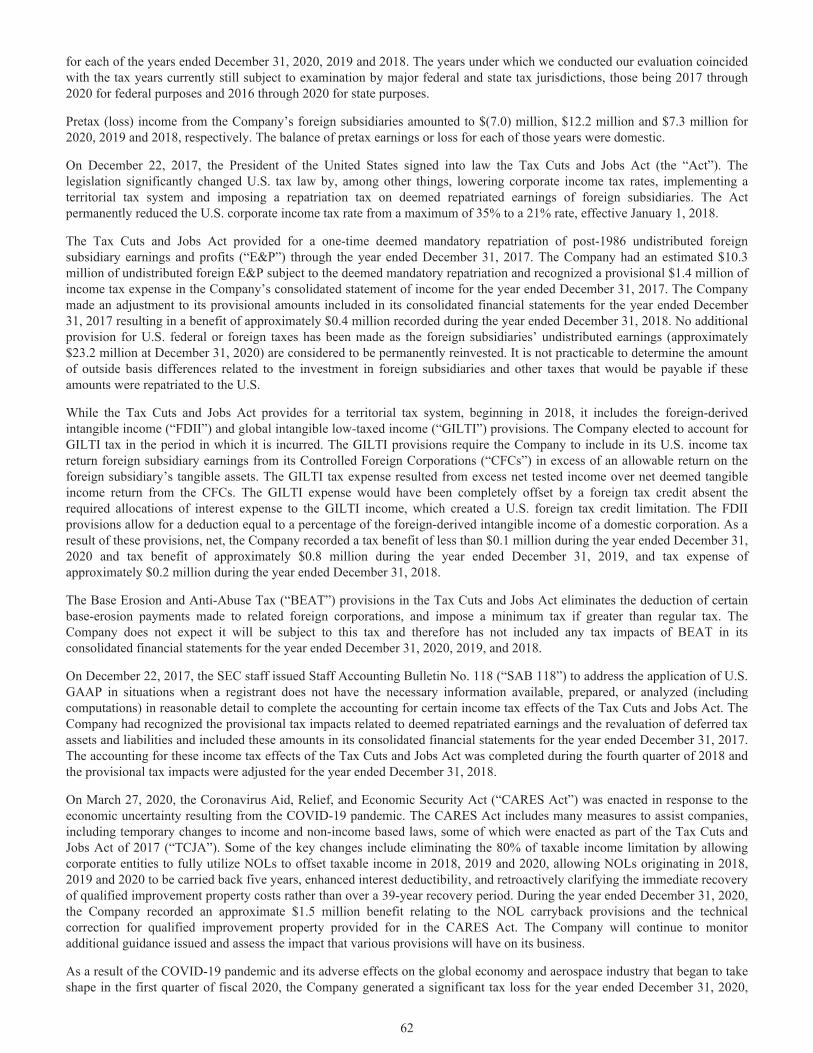
for each of the years ended December 31, 2020, 2019 and 2018. The years under which we conducted our evaluation coincided with the tax years currently still subject to examination by major federal and state tax jurisdictions, those being 2017 through 2020 for federal purposes and 2016 through 2020 for state purposes.
Pretax (loss) income from the Company’s foreign subsidiaries amounted to $(7.0) million, $12.2 million and $7.3 million for 2020, 2019 and 2018, respectively. The balance of pretax earnings or loss for each of those years were domestic.
On December 22, 2017, the President of the United States signed into law the Tax Cuts and Jobs Act (the “Act”). The legislation significantly changed U.S. tax law by, among other things, lowering corporate income tax rates, implementing a territorial tax system and imposing a repatriation tax on deemed repatriated earnings of foreign subsidiaries. The Act permanently reduced the U.S. corporate income tax rate from a maximum of 35% to a 21% rate, effective January 1, 2018.
The Tax Cuts and Jobs Act provided for a one-time deemed mandatory repatriation of post-1986 undistributed foreign subsidiary earnings and profits (“E&P”) through the year ended December 31, 2017. The Company had an estimated $10.3 million of undistributed foreign E&P subject to the deemed mandatory repatriation and recognized a provisional $1.4 million of income tax expense in the Company’s consolidated statement of income for the year ended December 31, 2017. The Company made an adjustment to its provisional amounts included in its consolidated financial statements for the year ended December 31, 2017 resulting in a benefit of approximately $0.4 million recorded during the year ended December 31, 2018. No additional provision for U.S. federal or foreign taxes has been made as the foreign subsidiaries’ undistributed earnings (approximately $23.2 million at December 31, 2020) are considered to be permanently reinvested. It is not practicable to determine the amount of outside basis differences related to the investment in foreign subsidiaries and other taxes that would be payable if these amounts were repatriated to the U.S.
While the Tax Cuts and Jobs Act provides for a territorial tax system, beginning in 2018, it includes the foreign-derived intangible income (“FDII”) and global intangible low-taxed income (“GILTI”) provisions. The Company elected to account for GILTI tax in the period in which it is incurred. The GILTI provisions require the Company to include in its U.S. income tax return foreign subsidiary earnings from its Controlled Foreign Corporations (“CFCs”) in excess of an allowable return on the foreign subsidiary’s tangible assets. The GILTI tax expense resulted from excess net tested income over net deemed tangible income return from the CFCs. The GILTI expense would have been completely offset by a foreign tax credit absent the required allocations of interest expense to the GILTI income, which created a U.S. foreign tax credit limitation. The FDII provisions allow for a deduction equal to a percentage of the foreign-derived intangible income of a domestic corporation. As a result of these provisions, net, the Company recorded a tax benefit of less than $0.1 million during the year ended December 31, 2020 and tax benefit of approximately $0.8 million during the year ended December 31, 2019, and tax expense of approximately $0.2 million during the year ended December 31, 2018.
The Base Erosion and Anti-Abuse Tax (“BEAT”) provisions in the Tax Cuts and Jobs Act eliminates the deduction of certain base-erosion payments made to related foreign corporations, and impose a minimum tax if greater than regular tax. The Company does not expect it will be subject to this tax and therefore has not included any tax impacts of BEAT in its consolidated financial statements for the year ended December 31, 2020, 2019, and 2018.
On December 22, 2017, the SEC staff issued Staff Accounting Bulletin No. 118 (“SAB 118”) to address the application of U.S. GAAP in situations when a registrant does not have the necessary information available, prepared, or analyzed (including computations) in reasonable detail to complete the accounting for certain income tax effects of the Tax Cuts and Jobs Act. The Company had recognized the provisional tax impacts related to deemed repatriated earnings and the revaluation of deferred tax assets and liabilities and included these amounts in its consolidated financial statements for the year ended December 31, 2017. The accounting for these income tax effects of the Tax Cuts and Jobs Act was completed during the fourth quarter of 2018 and the provisional tax impacts were adjusted for the year ended December 31, 2018.
On March 27, 2020, the Coronavirus Aid, Relief, and Economic Security Act (“CARES Act”) was enacted in response to the economic uncertainty resulting from the COVID-19 pandemic. The CARES Act includes many measures to assist companies, including temporary changes to income and non-income based laws, some of which were enacted as part of the Tax Cuts and Jobs Act of 2017 (“TCJA”). Some of the key changes include eliminating the 80% of taxable income limitation by allowing corporate entities to fully utilize NOLs to offset taxable income in 2018, 2019 and 2020, allowing NOLs originating in 2018, 2019 and 2020 to be carried back five years, enhanced interest deductibility, and retroactively clarifying the immediate recovery of qualified improvement property costs rather than over a 39-year recovery period. During the year ended December 31, 2020, the Company recorded an approximate $1.5 million benefit relating to the NOL carryback provisions and the technical correction for qualified improvement property provided for in the CARES Act. The Company will continue to monitor additional guidance issued and assess the impact that various provisions will have on its business.
As a result of the COVID-19 pandemic and its adverse effects on the global economy and aerospace industry that began to take shape in the first quarter of fiscal 2020, the Company generated a significant tax loss for the year ended December 31, 2020,
62
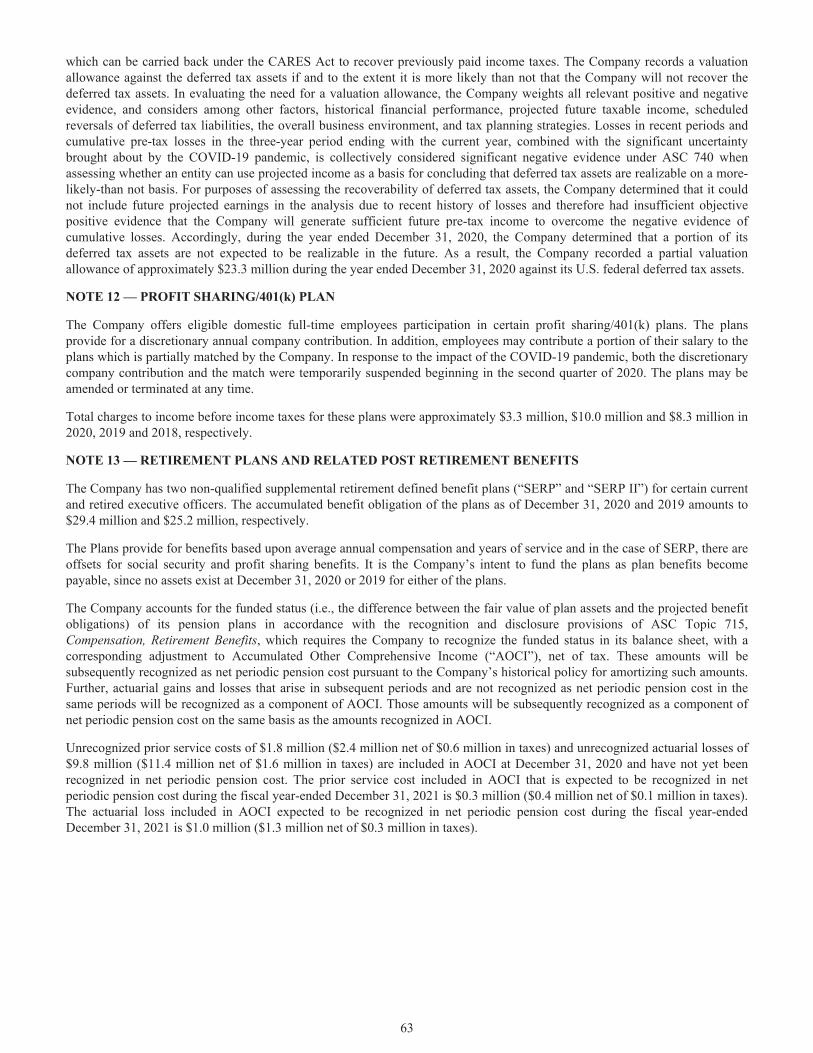
which can be carried back under the CARES Act to recover previously paid income taxes. The Company records a valuation allowance against the deferred tax assets if and to the extent it is more likely than not that the Company will not recover the deferred tax assets. In evaluating the need for a valuation allowance, the Company weights all relevant positive and negative evidence, and considers among other factors, historical financial performance, projected future taxable income, scheduled reversals of deferred tax liabilities, the overall business environment, and tax planning strategies. Losses in recent periods and cumulative pre-tax losses in the three-year period ending with the current year, combined with the significant uncertainty brought about by the COVID-19 pandemic, is collectively considered significant negative evidence under ASC 740 when assessing whether an entity can use projected income as a basis for concluding that deferred tax assets are realizable on a more-likely-than not basis. For purposes of assessing the recoverability of deferred tax assets, the Company determined that it could not include future projected earnings in the analysis due to recent history of losses and therefore had insufficient objective positive evidence that the Company will generate sufficient future pre-tax income to overcome the negative evidence of cumulative losses. Accordingly, during the year ended December 31, 2020, the Company determined that a portion of its deferred tax assets are not expected to be realizable in the future. As a result, the Company recorded a partial valuation allowance of approximately $23.3 million during the year ended December 31, 2020 against its U.S. federal deferred tax assets.
NOTE 12 — PROFIT SHARING/401(k) PLAN
The Company offers eligible domestic full-time employees participation in certain profit sharing/401(k) plans. The plans provide for a discretionary annual company contribution. In addition, employees may contribute a portion of their salary to the plans which is partially matched by the Company. In response to the impact of the COVID-19 pandemic, both the discretionary company contribution and the match were temporarily suspended beginning in the second quarter of 2020. The plans may be amended or terminated at any time.
Total charges to income before income taxes for these plans were approximately $3.3 million, $10.0 million and $8.3 million in 2020, 2019 and 2018, respectively.
NOTE 13 — RETIREMENT PLANS AND RELATED POST RETIREMENT BENEFITS
The Company has two non-qualified supplemental retirement defined benefit plans (“SERP” and “SERP II”) for certain current and retired executive officers. The accumulated benefit obligation of the plans as of December 31, 2020 and 2019 amounts to $29.4 million and $25.2 million, respectively.
The Plans provide for benefits based upon average annual compensation and years of service and in the case of SERP, there are offsets for social security and profit sharing benefits. It is the Company’s intent to fund the plans as plan benefits become payable, since no assets exist at December 31, 2020 or 2019 for either of the plans.
The Company accounts for the funded status (i.e., the difference between the fair value of plan assets and the projected benefit obligations) of its pension plans in accordance with the recognition and disclosure provisions of ASC Topic 715, Compensation, Retirement Benefits, which requires the Company to recognize the funded status in its balance sheet, with a corresponding adjustment to Accumulated Other Comprehensive Income (“AOCI”), net of tax. These amounts will be subsequently recognized as net periodic pension cost pursuant to the Company’s historical policy for amortizing such amounts. Further, actuarial gains and losses that arise in subsequent periods and are not recognized as net periodic pension cost in the same periods will be recognized as a component of AOCI. Those amounts will be subsequently recognized as a component of net periodic pension cost on the same basis as the amounts recognized in AOCI.
Unrecognized prior service costs of $1.8 million ($2.4 million net of $0.6 million in taxes) and unrecognized actuarial losses of $9.8 million ($11.4 million net of $1.6 million in taxes) are included in AOCI at December 31, 2020 and have not yet been recognized in net periodic pension cost. The prior service cost included in AOCI that is expected to be recognized in net periodic pension cost during the fiscal year-ended December 31, 2021 is $0.3 million ($0.4 million net of $0.1 million in taxes). The actuarial loss included in AOCI expected to be recognized in net periodic pension cost during the fiscal year-ended December 31, 2021 is $1.0 million ($1.3 million net of $0.3 million in taxes).
63
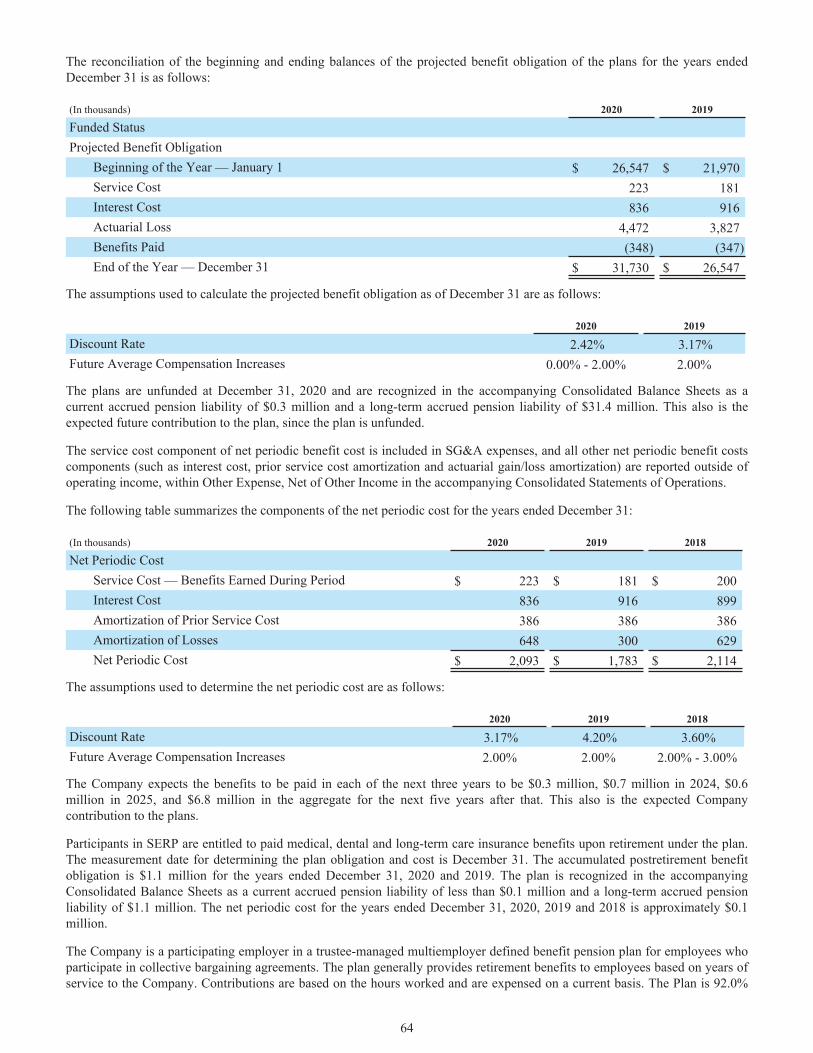
The reconciliation of the beginning and ending balances of the projected benefit obligation of the plans for the years ended December 31 is as follows:
(In thousands) 2020 2019
Funded StatusProjected Benefit Obligation
Beginning of the Year — January 1 $ 26,547 $ 21,970 Service Cost 223 181 Interest Cost 836 916 Actuarial Loss 4,472 3,827 Benefits Paid (348) (347) End of the Year — December 31 $ 31,730 $ 26,547
The assumptions used to calculate the projected benefit obligation as of December 31 are as follows:
2020 2019
Discount Rate 2.42% 3.17%Future Average Compensation Increases 0.00% - 2.00% 2.00%
The plans are unfunded at December 31, 2020 and are recognized in the accompanying Consolidated Balance Sheets as a current accrued pension liability of $0.3 million and a long-term accrued pension liability of $31.4 million. This also is the expected future contribution to the plan, since the plan is unfunded.
The service cost component of net periodic benefit cost is included in SG&A expenses, and all other net periodic benefit costs components (such as interest cost, prior service cost amortization and actuarial gain/loss amortization) are reported outside of operating income, within Other Expense, Net of Other Income in the accompanying Consolidated Statements of Operations.
The following table summarizes the components of the net periodic cost for the years ended December 31:
(In thousands) 2020 2019 2018
Net Periodic CostService Cost — Benefits Earned During Period $ 223 $ 181 $ 200 Interest Cost 836 916 899 Amortization of Prior Service Cost 386 386 386 Amortization of Losses 648 300 629 Net Periodic Cost $ 2,093 $ 1,783 $ 2,114
The assumptions used to determine the net periodic cost are as follows:
2020 2019 2018
Discount Rate 3.17% 4.20% 3.60%Future Average Compensation Increases 2.00% 2.00% 2.00% - 3.00%
The Company expects the benefits to be paid in each of the next three years to be $0.3 million, $0.7 million in 2024, $0.6 million in 2025, and $6.8 million in the aggregate for the next five years after that. This also is the expected Company contribution to the plans.
Participants in SERP are entitled to paid medical, dental and long-term care insurance benefits upon retirement under the plan. The measurement date for determining the plan obligation and cost is December 31. The accumulated postretirement benefit obligation is $1.1 million for the years ended December 31, 2020 and 2019. The plan is recognized in the accompanying Consolidated Balance Sheets as a current accrued pension liability of less than $0.1 million and a long-term accrued pension liability of $1.1 million. The net periodic cost for the years ended December 31, 2020, 2019 and 2018 is approximately $0.1 million.
The Company is a participating employer in a trustee-managed multiemployer defined benefit pension plan for employees who participate in collective bargaining agreements. The plan generally provides retirement benefits to employees based on years of service to the Company. Contributions are based on the hours worked and are expensed on a current basis. The Plan is 92.0%
64
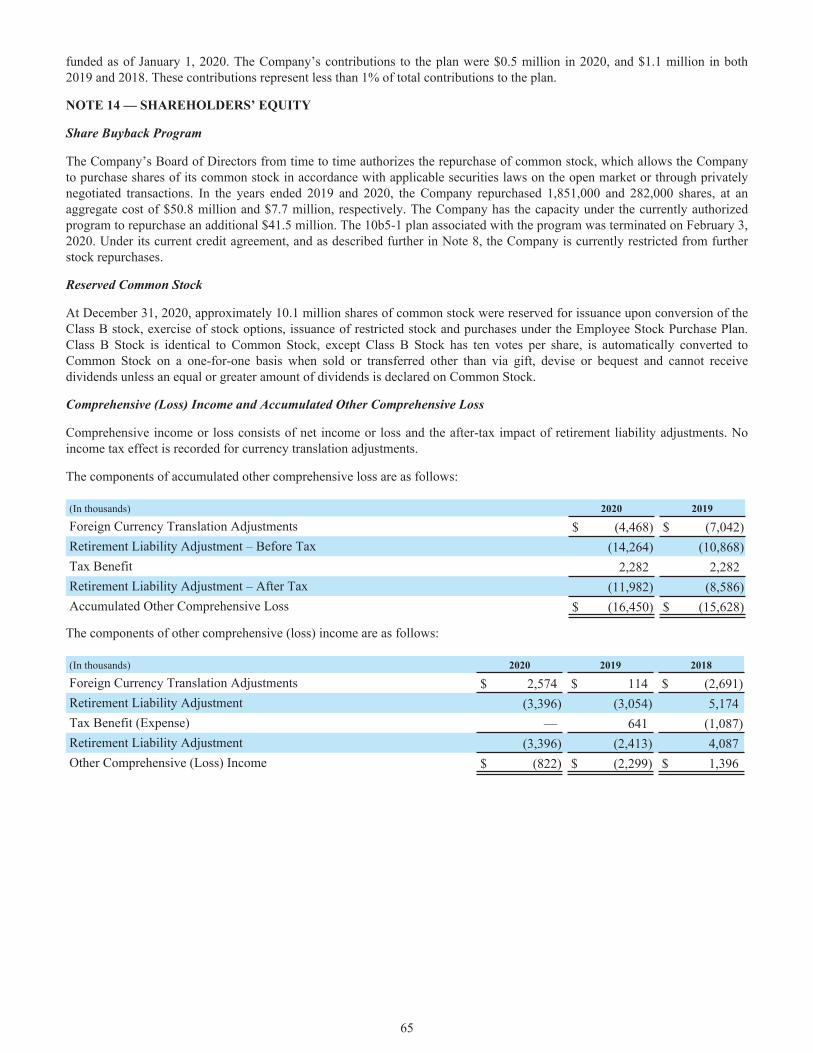
funded as of January 1, 2020. The Company’s contributions to the plan were $0.5 million in 2020, and $1.1 million in both 2019 and 2018. These contributions represent less than 1% of total contributions to the plan.
NOTE 14 — SHAREHOLDERS’ EQUITY
Share Buyback Program
The Company’s Board of Directors from time to time authorizes the repurchase of common stock, which allows the Company to purchase shares of its common stock in accordance with applicable securities laws on the open market or through privately negotiated transactions. In the years ended 2019 and 2020, the Company repurchased 1,851,000 and 282,000 shares, at an aggregate cost of $50.8 million and $7.7 million, respectively. The Company has the capacity under the currently authorized program to repurchase an additional $41.5 million. The 10b5-1 plan associated with the program was terminated on February 3, 2020. Under its current credit agreement, and as described further in Note 8, the Company is currently restricted from further stock repurchases.
Reserved Common Stock
At December 31, 2020, approximately 10.1 million shares of common stock were reserved for issuance upon conversion of the Class B stock, exercise of stock options, issuance of restricted stock and purchases under the Employee Stock Purchase Plan. Class B Stock is identical to Common Stock, except Class B Stock has ten votes per share, is automatically converted to Common Stock on a one-for-one basis when sold or transferred other than via gift, devise or bequest and cannot receive dividends unless an equal or greater amount of dividends is declared on Common Stock.
Comprehensive (Loss) Income and Accumulated Other Comprehensive Loss
Comprehensive income or loss consists of net income or loss and the after-tax impact of retirement liability adjustments. No income tax effect is recorded for currency translation adjustments.
The components of accumulated other comprehensive loss are as follows:
(In thousands) 2020 2019
Foreign Currency Translation Adjustments $ (4,468) $ (7,042) Retirement Liability Adjustment – Before Tax (14,264) (10,868) Tax Benefit 2,282 2,282 Retirement Liability Adjustment – After Tax (11,982) (8,586) Accumulated Other Comprehensive Loss $ (16,450) $ (15,628)
The components of other comprehensive (loss) income are as follows:
(In thousands) 2020 2019 2018
Foreign Currency Translation Adjustments $ 2,574 $ 114 $ (2,691) Retirement Liability Adjustment (3,396) (3,054) 5,174 Tax Benefit (Expense) — 641 (1,087) Retirement Liability Adjustment (3,396) (2,413) 4,087 Other Comprehensive (Loss) Income $ (822) $ (2,299) $ 1,396
65
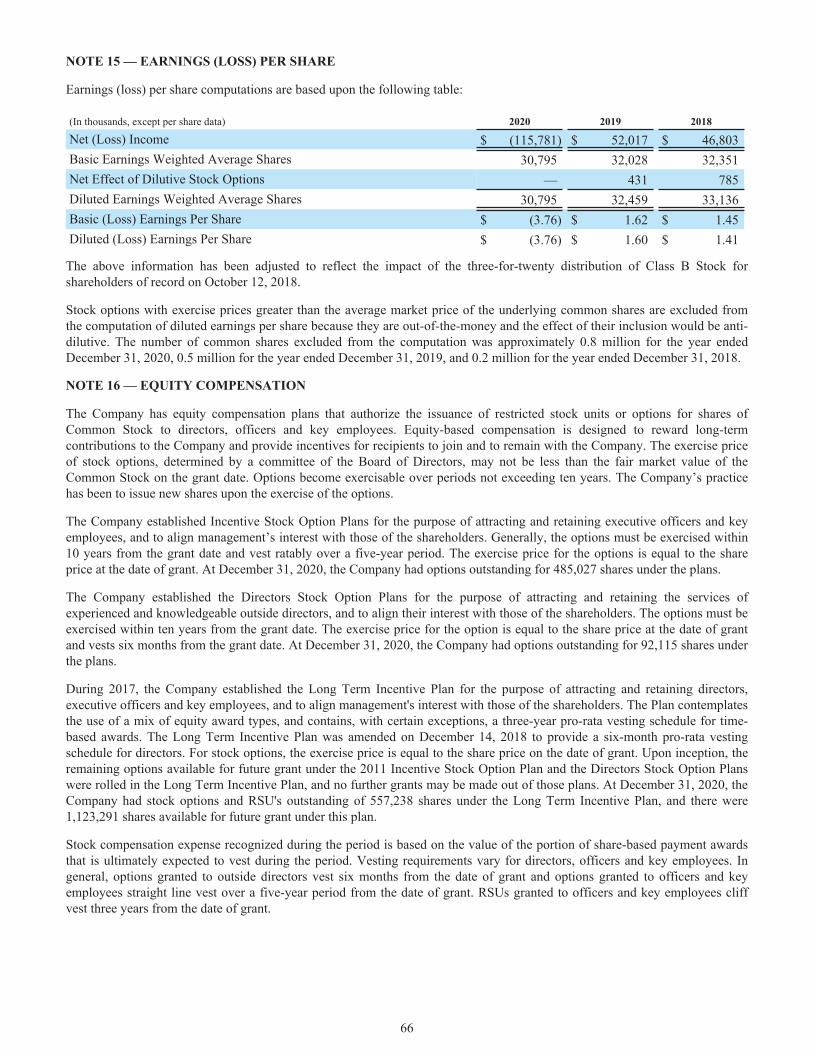
NOTE 15 — EARNINGS (LOSS) PER SHARE
Earnings (loss) per share computations are based upon the following table:
(In thousands, except per share data) 2020 2019 2018
Net (Loss) Income $ (115,781) $ 52,017 $ 46,803 Basic Earnings Weighted Average Shares 30,795 32,028 32,351 Net Effect of Dilutive Stock Options — 431 785 Diluted Earnings Weighted Average Shares 30,795 32,459 33,136 Basic (Loss) Earnings Per Share $ (3.76) $ 1.62 $ 1.45 Diluted (Loss) Earnings Per Share $ (3.76) $ 1.60 $ 1.41
The above information has been adjusted to reflect the impact of the three-for-twenty distribution of Class B Stock for shareholders of record on October 12, 2018.
Stock options with exercise prices greater than the average market price of the underlying common shares are excluded from the computation of diluted earnings per share because they are out-of-the-money and the effect of their inclusion would be anti-dilutive. The number of common shares excluded from the computation was approximately 0.8 million for the year ended December 31, 2020, 0.5 million for the year ended December 31, 2019, and 0.2 million for the year ended December 31, 2018.
NOTE 16 — EQUITY COMPENSATION
The Company has equity compensation plans that authorize the issuance of restricted stock units or options for shares of Common Stock to directors, officers and key employees. Equity-based compensation is designed to reward long-term contributions to the Company and provide incentives for recipients to join and to remain with the Company. The exercise price of stock options, determined by a committee of the Board of Directors, may not be less than the fair market value of the Common Stock on the grant date. Options become exercisable over periods not exceeding ten years. The Company’s practice has been to issue new shares upon the exercise of the options.
The Company established Incentive Stock Option Plans for the purpose of attracting and retaining executive officers and key employees, and to align management’s interest with those of the shareholders. Generally, the options must be exercised within 10 years from the grant date and vest ratably over a five-year period. The exercise price for the options is equal to the share price at the date of grant. At December 31, 2020, the Company had options outstanding for 485,027 shares under the plans.
The Company established the Directors Stock Option Plans for the purpose of attracting and retaining the services of experienced and knowledgeable outside directors, and to align their interest with those of the shareholders. The options must be exercised within ten years from the grant date. The exercise price for the option is equal to the share price at the date of grant and vests six months from the grant date. At December 31, 2020, the Company had options outstanding for 92,115 shares under the plans.
During 2017, the Company established the Long Term Incentive Plan for the purpose of attracting and retaining directors, executive officers and key employees, and to align management's interest with those of the shareholders. The Plan contemplates the use of a mix of equity award types, and contains, with certain exceptions, a three-year pro-rata vesting schedule for time-based awards. The Long Term Incentive Plan was amended on December 14, 2018 to provide a six-month pro-rata vesting schedule for directors. For stock options, the exercise price is equal to the share price on the date of grant. Upon inception, the remaining options available for future grant under the 2011 Incentive Stock Option Plan and the Directors Stock Option Plans were rolled in the Long Term Incentive Plan, and no further grants may be made out of those plans. At December 31, 2020, the Company had stock options and RSU's outstanding of 557,238 shares under the Long Term Incentive Plan, and there were 1,123,291 shares available for future grant under this plan.
Stock compensation expense recognized during the period is based on the value of the portion of share-based payment awards that is ultimately expected to vest during the period. Vesting requirements vary for directors, officers and key employees. In general, options granted to outside directors vest six months from the date of grant and options granted to officers and key employees straight line vest over a five-year period from the date of grant. RSUs granted to officers and key employees cliff vest three years from the date of grant.
66
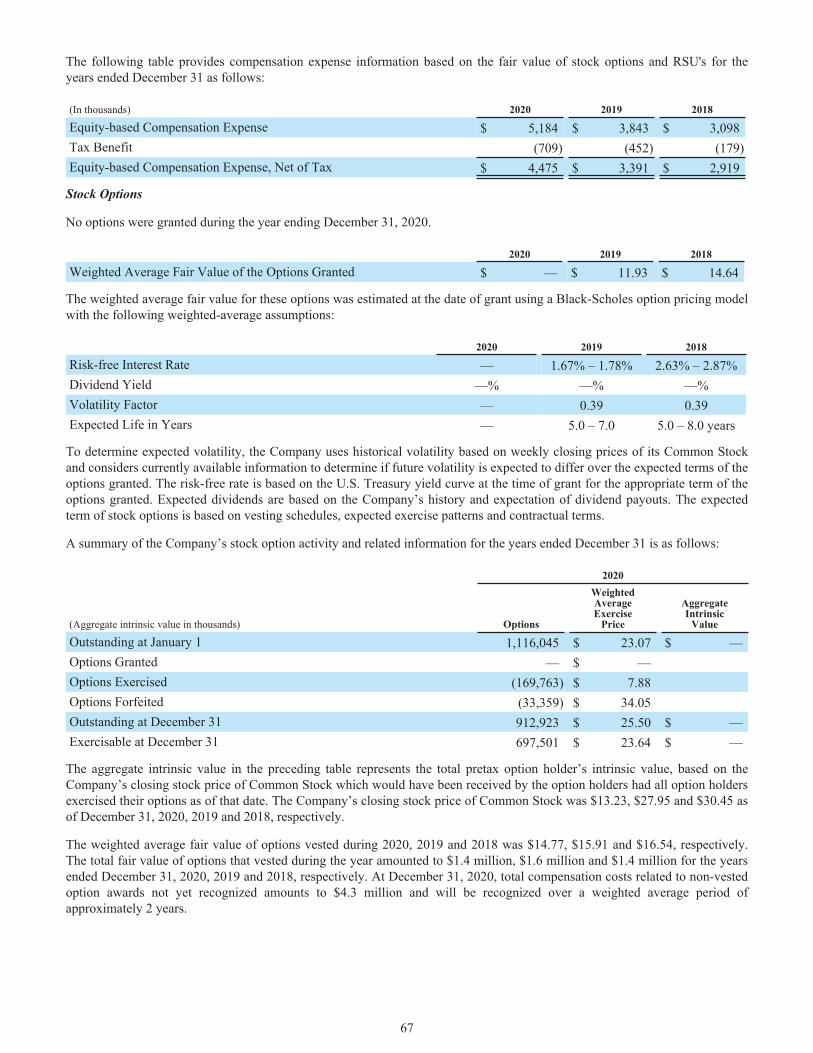
The following table provides compensation expense information based on the fair value of stock options and RSU's for the years ended December 31 as follows:
(In thousands) 2020 2019 2018
Equity-based Compensation Expense $ 5,184 $ 3,843 $ 3,098 Tax Benefit (709) (452) (179) Equity-based Compensation Expense, Net of Tax $ 4,475 $ 3,391 $ 2,919
Stock Options
No options were granted during the year ending December 31, 2020.
2020 2019 2018
Weighted Average Fair Value of the Options Granted $ — $ 11.93 $ 14.64
The weighted average fair value for these options was estimated at the date of grant using a Black-Scholes option pricing model with the following weighted-average assumptions:
2020 2019 2018
Risk-free Interest Rate — 1.67% – 1.78% 2.63% – 2.87%Dividend Yield —% —% —%Volatility Factor — 0.39 0.39Expected Life in Years — 5.0 – 7.0 5.0 – 8.0 years
To determine expected volatility, the Company uses historical volatility based on weekly closing prices of its Common Stock and considers currently available information to determine if future volatility is expected to differ over the expected terms of the options granted. The risk-free rate is based on the U.S. Treasury yield curve at the time of grant for the appropriate term of the options granted. Expected dividends are based on the Company’s history and expectation of dividend payouts. The expected term of stock options is based on vesting schedules, expected exercise patterns and contractual terms.
A summary of the Company’s stock option activity and related information for the years ended December 31 is as follows:
2020
(Aggregate intrinsic value in thousands) Options
WeightedAverageExercise
Price
AggregateIntrinsic
Value
Outstanding at January 1 1,116,045 $ 23.07 $ — Options Granted — $ — Options Exercised (169,763) $ 7.88 Options Forfeited (33,359) $ 34.05 Outstanding at December 31 912,923 $ 25.50 $ — Exercisable at December 31 697,501 $ 23.64 $ —
The aggregate intrinsic value in the preceding table represents the total pretax option holder’s intrinsic value, based on the Company’s closing stock price of Common Stock which would have been received by the option holders had all option holders exercised their options as of that date. The Company’s closing stock price of Common Stock was $13.23, $27.95 and $30.45 as of December 31, 2020, 2019 and 2018, respectively.
The weighted average fair value of options vested during 2020, 2019 and 2018 was $14.77, $15.91 and $16.54, respectively. The total fair value of options that vested during the year amounted to $1.4 million, $1.6 million and $1.4 million for the years ended December 31, 2020, 2019 and 2018, respectively. At December 31, 2020, total compensation costs related to non-vested option awards not yet recognized amounts to $4.3 million and will be recognized over a weighted average period of approximately 2 years.
67
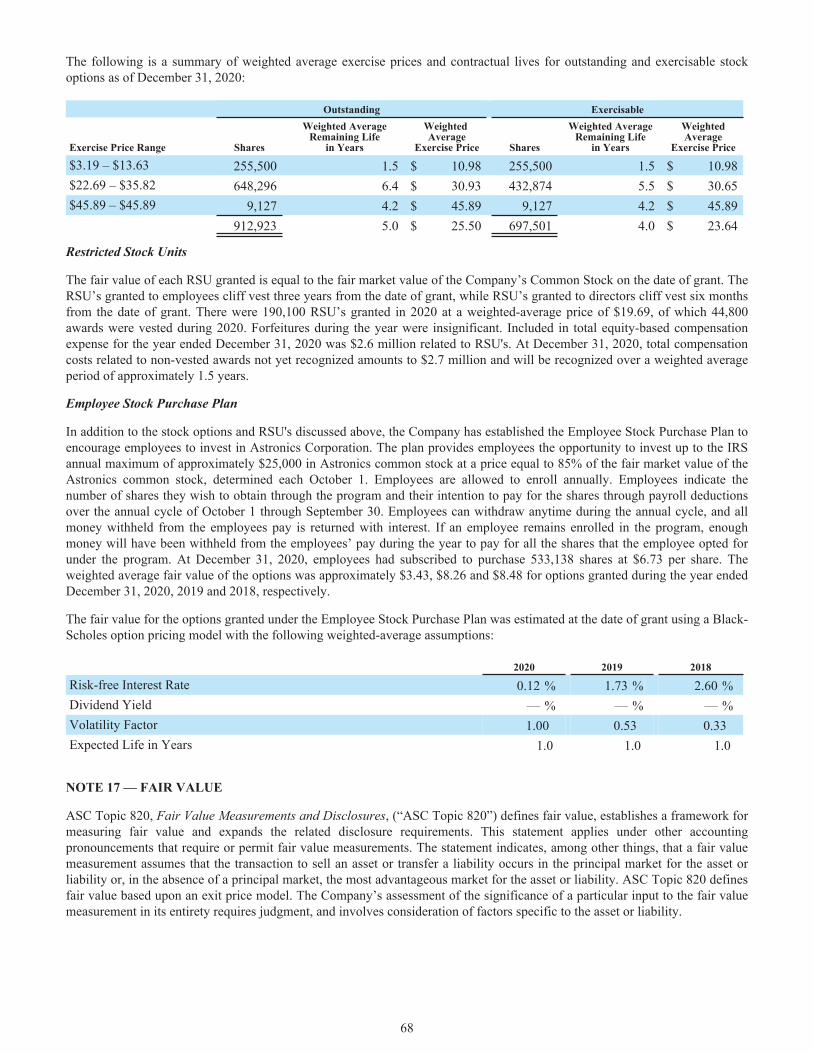
The following is a summary of weighted average exercise prices and contractual lives for outstanding and exercisable stock options as of December 31, 2020:
Outstanding Exercisable
Exercise Price Range Shares
Weighted AverageRemaining Life
in Years
Weighted Average
Exercise Price Shares
Weighted AverageRemaining Life
in Years
WeightedAverage
Exercise Price
$3.19 – $13.63 255,500 1.5 $ 10.98 255,500 1.5 $ 10.98 $22.69 – $35.82 648,296 6.4 $ 30.93 432,874 5.5 $ 30.65 $45.89 – $45.89 9,127 4.2 $ 45.89 9,127 4.2 $ 45.89
912,923 5.0 $ 25.50 697,501 4.0 $ 23.64
Restricted Stock Units
The fair value of each RSU granted is equal to the fair market value of the Company’s Common Stock on the date of grant. The RSU’s granted to employees cliff vest three years from the date of grant, while RSU’s granted to directors cliff vest six months from the date of grant. There were 190,100 RSU’s granted in 2020 at a weighted-average price of $19.69, of which 44,800 awards were vested during 2020. Forfeitures during the year were insignificant. Included in total equity-based compensation expense for the year ended December 31, 2020 was $2.6 million related to RSU's. At December 31, 2020, total compensation costs related to non-vested awards not yet recognized amounts to $2.7 million and will be recognized over a weighted average period of approximately 1.5 years.
Employee Stock Purchase Plan
In addition to the stock options and RSU's discussed above, the Company has established the Employee Stock Purchase Plan to encourage employees to invest in Astronics Corporation. The plan provides employees the opportunity to invest up to the IRS annual maximum of approximately $25,000 in Astronics common stock at a price equal to 85% of the fair market value of the Astronics common stock, determined each October 1. Employees are allowed to enroll annually. Employees indicate the number of shares they wish to obtain through the program and their intention to pay for the shares through payroll deductions over the annual cycle of October 1 through September 30. Employees can withdraw anytime during the annual cycle, and all money withheld from the employees pay is returned with interest. If an employee remains enrolled in the program, enough money will have been withheld from the employees’ pay during the year to pay for all the shares that the employee opted for under the program. At December 31, 2020, employees had subscribed to purchase 533,138 shares at $6.73 per share. The weighted average fair value of the options was approximately $3.43, $8.26 and $8.48 for options granted during the year ended December 31, 2020, 2019 and 2018, respectively.
The fair value for the options granted under the Employee Stock Purchase Plan was estimated at the date of grant using a Black-Scholes option pricing model with the following weighted-average assumptions:
2020 2019 2018
Risk-free Interest Rate 0.12 % 1.73 % 2.60 %Dividend Yield — % — % — %Volatility Factor 1.00 0.53 0.33 Expected Life in Years 1.0 1.0 1.0
NOTE 17 — FAIR VALUE
ASC Topic 820, Fair Value Measurements and Disclosures, (“ASC Topic 820”) defines fair value, establishes a framework for measuring fair value and expands the related disclosure requirements. This statement applies under other accounting pronouncements that require or permit fair value measurements. The statement indicates, among other things, that a fair value measurement assumes that the transaction to sell an asset or transfer a liability occurs in the principal market for the asset or liability or, in the absence of a principal market, the most advantageous market for the asset or liability. ASC Topic 820 defines fair value based upon an exit price model. The Company’s assessment of the significance of a particular input to the fair value measurement in its entirety requires judgment, and involves consideration of factors specific to the asset or liability.
68
ASC Topic 820 establishes a valuation hierarchy for disclosure of the inputs to valuation used to measure fair value. This hierarchy prioritizes the inputs into three broad levels as follows:
Level 1 inputs are quoted prices (unadjusted) in active markets for identical assets or liabilities.
Level 2 inputs are quoted prices for similar assets and liabilities in active markets or inputs that are observable for the asset or liability, either directly or indirectly through market corroboration, for substantially the full term of the financial instrument.
Level 3 inputs are unobservable inputs based on our own assumptions used to measure assets and liabilities at fair value.
On a Recurring Basis:
A financial asset or liability’s classification within the hierarchy is determined based on the lowest level input that is significant to the fair value measurement.
The terms of the Diagnosys acquisition allow for a potential earnout of up to an additional $13.0 million over the next three years based on achievement of new order levels of over $72.0 million during that period. The fair value of this contingent consideration was estimated at $2.5 million at acquisition. The fair value assigned to the earnout is determined using the real options method, which requires Level 3 inputs such as new order forecasts, discount rate, volatility factors, and other market variables to assess the probability of Diagnosys achieving certain order levels over the period. Based on actual and forecasted new orders, the fair value was reduced to $2.2 million as of December 31, 2020.
There were no other financial assets or liabilities carried at fair value measured on a recurring basis at December 31, 2020 or 2019.
On a Non-recurring Basis:
In accordance with the provisions of ASC Topic 350, Intangibles – Goodwill and Other, the Company estimates the fair value of reporting units, utilizing unobservable Level 3 inputs. Level 3 inputs require significant management judgment due to the absence of quoted market prices or observable inputs for assets of a similar nature. The Company utilizes a discounted cash flow method to estimate the fair value of reporting units utilizing unobservable inputs. The fair value measurement of the reporting unit under the step-one analysis of the quantitative goodwill impairment test are classified as Level 3 inputs.
As further discussed in Note 7, we performed interim quantitative assessments for the reporting units which had goodwill as of March 28, 2020 and an additional interim quantitative assessment for the PECO reporting unit as of June 27, 2020. The Company recorded non-cash goodwill impairment charges associated with four Aerospace reporting units, totaling approximately $86.3 million. The impairment loss was calculated as the difference between the fair value of the reporting unit (which was calculated using level 3 inputs) and the carrying value of the reporting unit. No additional impairment was deemed necessary as a result of our annual test performed as of the first day of the fourth quarter in 2020.
In 2019, we performed quantitative assessments for the reporting units which had goodwill as of the first day of the fourth quarter, prior to the initiation of the AeroSat restructuring activities. Based on our quantitative assessment, the Company recorded a full impairment charge of approximately $1.6 million in the December 31, 2019 Consolidated Statements of Operations associated with the AeroSat reporting unit.
There were no impairment charges to goodwill in any of the Company’s reporting units in 2018.
Long-lived assets are evaluated for recoverability whenever adverse effects or changes in circumstances indicate that the carrying value may not be recoverable. The recoverability test consists of comparing the undiscounted projected cash flows with the carrying amount. Should the carrying amount exceed undiscounted projected cash flows, an impairment loss would be recognized to the extent the carrying amount exceeds fair value. In conjunction with the deteriorating economic conditions associated with the COVID-19 pandemic, we recorded an impairment charge to ROU assets of approximately $0.7 million incurred in the Aerospace segment within the Impairment Loss line in the Consolidated Statements of Operations for the year ended December 31, 2020.
In conjunction with the restructuring of AeroSat in 2019, the Company recorded impairment charges to long-lived assets including intangible assets, property, plant and equipment and ROU assets of approximately $9.5 million in the Consolidated Statements of Operations for the year ended December 31, 2019.
There were no impairment charges to any of the Company’s long-lived assets in either of the Company’s segments in 2018.
69
From time to time, the Company makes long-term, strategic equity investments in companies to promote business and strategic objectives. These investments are included in Other Assets on the Consolidated Balance Sheets. One of the investments incurred a full impairment charge which accounts for $3.5 million recorded within the Other Expense, Net of Other Income line in the accompanying Consolidated Statements of Operations for the year ended December 31, 2020. A full impairment charge of $5.0 million for an additional investment was recorded in 2019. No such impairment was recorded in 2018. These are Level 3 measurements as there were no observable price changes during the year.
The Freedom and Diagnosys intangible assets acquired in 2019 were valued using a discounted cash flow methodology, as of their respective acquisitions dates, and are classified as Level 3 inputs.
Of the severance charges recorded, $2.6 million and $2.8 million in 2020 and 2019, respectively, qualify as one-time termination benefit arrangements and were initially measured at fair value using level 3 inputs.
Due to their short-term nature, the carrying value of cash and equivalents, accounts receivable and accounts payable approximate fair value. The carrying value of the Company’s variable rate long-term debt instruments also approximates fair value due to the variable rate feature of these instruments.
NOTE 18 — SELECTED QUARTERLY FINANCIAL INFORMATION
The following table summarizes selected quarterly financial information for 2020 and 2019:
Quarter Ended
(Unaudited) Dec. 31, Sep. 26, June 27, March 28, Dec. 31, Sep. 28, June 29, March 30,
(In thousands, except for per share data) 2020 2020 2020 2020 2019 2019 2019 2019
Sales $ 114,803 $ 106,506 $ 123,694 $ 157,584 $ 198,412 $ 177,018 $ 189,098 $ 208,174 Gross Profit (sales less cost of products sold) $ 19,118 $ 15,173 $ 26,833 $ 35,719 $ 26,908 $ 36,794 $ 40,363 $ 52,077 Impairment Loss $ — $ — $ 12,608 $ 74,408 $ 11,083 $ — $ — $ — (Loss) Income Before Income Taxes $ (7,541) $ (11,141) $ (24,451) $ (69,277) $ (43,282) $ 1,760 $ 8,830 $ 100,995 Net (Loss) Income $ (19,985) $ (5,254) $ (23,579) $ (66,963) $ (34,065) $ 1,210 $ 6,726 $ 78,146 Basic (Loss) Earnings Per Share $ (0.65) $ (0.17) $ (0.77) $ (2.17) $ (1.10) $ 0.04 $ 0.21 $ 2.40 Diluted (Loss) Earnings Per Share $ (0.65) $ (0.17) $ (0.77) $ (2.17) $ (1.10) $ 0.04 $ 0.20 $ 2.35
The Company recorded a partial valuation allowance of approximately $7.0 million and $14.1 million against its U.S. federal deferred tax assets during the first and fourth quarters of 2020, respectively. The Company recorded goodwill impairment charges in the first and second quarters of 2020 as discussed in Note 7. Additionally, several events occurred in the fourth quarter of 2019 which impacted the results as presented. Information included in 2019 is impacted by a significant increase to a legal reserve as well as restructuring, impairment and other charges as discussed in Note 19 and Note 23 in our consolidated financial statements, respectively.
Information for 2019 includes the results of Freedom, acquired on July 1, 2019, and Diagnosys, acquired on October 4, 2019, each from the acquisition date forward. Information for 2019 reflects the divestiture of the semiconductor business on February 13, 2019.
NOTE 19 — LEGAL PROCEEDINGS
Lufthansa
On December 29, 2010, Lufthansa Technik AG (“Lufthansa”) filed a Statement of Claim in the Regional State Court of Mannheim, Germany. Lufthansa’s claim asserted that a subsidiary of the Company, AES, sold, marketed, and brought into use in Germany a power supply system that infringes upon a German patent held by Lufthansa. Lufthansa sought an order requiring AES to stop selling and marketing the allegedly infringing power supply system, a recall of allegedly infringing products sold to commercial customers in Germany since November 26, 2003, and compensation for damages related to direct sales of the allegedly infringing power supply system in Germany (referred to as “direct sales”). The claim did not specify an estimate of damages and a related damages claim is being pursued by Lufthansa in separate court proceedings in an action filed in July 2017, as further discussed below.
In February 2015, the Regional State Court of Mannheim, Germany held that the patent was infringed. The judgment did not require AES to recall products that are already installed in aircraft or had been sold to other end users. The decision did not quantify damages but required AES to provide certain financial information regarding its direct sales of the infringing product into Germany to enable Lufthansa to make an estimate of requested damages.
70
The Company appealed to the Higher Regional Court of Karlsruhe. On November 15, 2016, the Higher Regional Court of Karlsruhe upheld the lower court’s decision. The Company sought permission to appeal to the German Federal Supreme Court. By judgment of March 26, 2019, the German Federal Supreme Court dismissed AES's appeal. With this decision, the above-mentioned proceedings are complete.
In July 2017, Lufthansa filed an action in the Regional State Court of Mannheim for payment of damages caused by the AES’s direct sales of the product into Germany. A first instance decision in this matter was handed down on December 6, 2019. According to this ruling, Lufthansa was awarded damages in the amount of approximately $3.2 million plus interest. Prior to 2019, the Company had accrued $1.0 million related to this matter. As a result of the judgment on direct sales into Germany, the Company recognized an incremental reserve of $3.5 million in its December 31, 2019 financial statements related to this matter. In 2020, AES made payment of $4.7 million, inclusive of interest, in satisfaction of the first instance judgment. AES has appealed this decision and the appeal is currently pending before the Higher Regional Court of Karlsruhe. If the first instance judgment is later reversed on appeal, the Company could reclaim any amounts that were previously paid to Lufthansa that are in excess of the amount awarded by the appellate court, but there can be no assurances that we will be successful on such appeal.
On December 29, 2017, Lufthansa filed another infringement action against AES in the Regional State Court of Mannheim claiming that sales by AES to its international customers have infringed Lufthansa's patent if AES's customers later shipped the products to Germany (referred to as “indirect sales”). This action, therefore, addresses sales other than those covered by the action filed on December 29, 2010, discussed above. In this action, served on April 11, 2018, Lufthansa sought an order obliging AES to provide information and accounting and a finding that AES owes damages for the attacked indirect sales. Moreover, Lufthansa sought accounting and a finding that the sale of individual components of the EmPower system – either directly to Germany or to international customers if these customers later shipped these products to Germany – constitutes an indirect patent infringement of Lufthansa's patent in Germany. In addition, Lufthansa sought an order obliging AES to confirm by an affidavit that the accounting provided in September 2015 was accurate and a finding that AES is also liable for damages for the sale of modified products if the modification of the products was not communicated to all subsequent buyers of the products. No amount of claimed damages has been specified by Lufthansa.
A first instance decision in this matter was issued on December 6, 2019. The Court found that indirect sales (as defined above) by AES to international customers infringe the patent under the conditions specified in the judgment and that the sale of components of the EmPower system to Germany constitutes an indirect patent infringement. Moreover, the Court granted Lufthansa's request for an affidavit confirming that the accounting provided in September 2015 was accurate. The Court rejected Lufthansa's claim that AES is also liable for damages for the sale of modified products. This means that AES is not liable for damages based on the sale of modified outlet units that removed the infringing feature. AES and Lufthansa both appealed this decision and the appeal is currently pending before the Higher Regional Court of Karlsruhe. In its appeal, Lufthansa requested an additional finding that AES shall be held liable for all damages (in an unspecified amount) caused by AES’s alleged incorrect accounting of its past sales.
On April 28, 2020, Lufthansa asked AES to provide the accounting on indirect sales (as defined above) and the sale of individual parts and an affidavit confirming the accuracy of the September 2015 accounting of direct sales. AES completed and delivered the final accounting on January 29, 2021.
If the December 6, 2019 decision of the Regional State Court of Mannheim is confirmed on appeal, AES would be responsible for payment of damages for indirect sales of patent-infringing EmPower in-seat power supply systems in the period from December 29, 2007 to May 22, 2018. AES modified the outlet units at the end of 2014 and substantially all of the modified outlet units sold from 2015 do not infringe the patent of Lufthansa. As a result, the period for which AES is liable for damages in connection with indirect sales substantially finished at the end of 2014.
After the accounting, Lufthansa is expected to enforce its claim for damages in separate court proceedings. These proceedings would most likely be tried before the Mannheim Court again, which makes it probable that the Mannheim court will determine the damages for the indirect sales on the basis of the same principles as in the direct sales proceedings (unless the latter ruling of the Mannheim court is reversed on appeal). Based on the information available and the determination of the damages in the direct sales claim discussed above, we estimated that the Company’s total exposure related to these matters that was probable and that could be reasonably estimated at December 31, 2019 was approximately $11.6 million plus approximately $4.5 million of accrued interest, for a total of approximately $16.1 million which is reflected as a liability in the Consolidated Balance Sheets as of December 31, 2019. Interest will accrue at a rate of 5% above the European Central Bank rate until final payment to Lufthansa. Approximately $0.6 million, representing additional interest accrued during 2020, was recorded in the year ended December 31, 2020. These expenses are reflected within Selling, General and Administrative Expenses in the Company’s Consolidated Statements of Operations for the respective periods.
71
In connection with the indirect sales claims, we currently believe it is unlikely that the appeals process will be completed and the damages and related interest will be paid before December 31, 2021. Therefore, the liability related to this matter, totaling $16.7 million, is classified within Other Liabilities (non-current) in the Consolidated Balance Sheets at December 31, 2020.
In December 2017, Lufthansa filed patent infringement cases in the United Kingdom (“UK”) and in France against AES. The Lufthansa patent expired in May 2018. In those cases, Lufthansa accuses AES of having manufactured, used, sold and offered for sale a power supply system, and offered and supplied parts for a power supply system that infringed upon a Lufthansa patent in those respective countries.
In the French matter, there was a hearing on the validity of the patent in October 2020. On December 4, 2020, the Court held the French patent invalid for all asserted claims. There can consequently be no finding of infringement on first instance. LHT has appealed this judgment. A date for the hearing of the appeal has not yet been set.
In the UK matter, a trial took place in June 2020 to address the issues of infringement and validity of the patent. On June 22, 2020, the Court held the UK patent valid and 3 out of 4 asserted claims infringed. In contrast to the decisions in Germany, the UK Court found that the modified components infringed a valid claim of the patent. If AES is not successful in any appeal phase, then the post-modification outlet units will be included in the calculation of monetary relief. Lufthansa has yet to file a case for damages, which would need to be determined at a separate trial and would require extensive data gathering and analysis which has not yet been completed. Additionally, on January 22, 2021, the Court of Appeal granted AES permission to appeal parts of the first instance decision, determining that AES’s appeal has a reasonable prospect of success. The appeal hearing is scheduled to begin on November 2, 2021.
Separate from any such damages Lufthansa may seek in connection with the UK infringement decision discussed above, as a result of the first instance judgement in their favor, Lufthansa will be entitled to reimbursement from AES of a proportion of its legal expenditures in the UK case. An interim reimbursement of approximately $1.3 million was paid to Lufthansa in August 2020. The associated expense was recorded in the Consolidated Statements of Operations in the year ended December 31, 2020 within Selling, General & Administrative Expenses. If the first instance decision is reversed on appeal, AES would be entitled to seek the return of such amounts from Lufthansa, as well as reimbursement of AES’s legal fees.
Each of the German, France and UK claims are separate and distinct. Validity and infringement of the Lufthansa patent in each country is a matter for the courts in each of these countries, whose laws differ from each other. In addition, the principles of calculating damages in each jurisdiction differ substantially. Therefore, the Company has assessed each matter separately and cannot apply the same calculation methodology as in the German direct and indirect matters. However, it is reasonably possible that additional damages and interest could be incurred if the appellate court in France was to rule in favor of Lufthansa, or if any appeal in the UK matter is unsuccessful, but at this time we cannot reasonably estimate the range of loss. As loss exposure is not estimable at this time, the Company has not recorded any liability with respect to either the French or the UK matters as of December 31, 2020.
On November 26, 2014, Lufthansa filed a complaint in the United States District for the Western District of Washington. Lufthansa’s complaint in that action alleges that AES manufacture, uses, sells and offers for sale a power supply system that infringes upon a U.S. patent held by Lufthansa. The patent at issue in the U.S. action is based on technology similar to that involved in the German action. On April 25, 2016, the Court issued its ruling on claim construction, holding that the sole independent claim in the patent is indefinite, rendering all claims in the patent indefinite. Based on this ruling, AES filed a motion for summary judgment on the grounds that the Court’s ruling that the patent is indefinite renders the patent invalid and unenforceable. On July 20, 2016, the U.S. District Court granted the motion for summary judgement and issued an order dismissing all claims against AES with prejudice.
Lufthansa appealed the District Court’s decision to the United States Court of Appeals for the Federal Circuit. On October 19, 2017, the Federal Circuit affirmed the district court’s decision, holding that the sole independent claim of the patent is indefinite, rending all claims on the patent indefinite. Lufthansa did not file a petition for en banc rehearing or petition the U.S. Supreme Court for a writ of certiorari. Therefore, there is no longer a risk of exposure from that lawsuit.
Other
On March 23, 2020, Teradyne, Inc. filed a complaint against the Company and its subsidiary, Astronics Test Systems (“ATS”) (together, “the Defendants”) in the United States District Court for the Central District of California alleging patent and copyright infringement, and certain other related claims. The Defendants moved to dismiss certain claims from the case. On November 6, 2020, the Court dismissed the Company from the case, and also dismissed a number of claims, though the patent and copyright infringement claims remain. The case is currently in discovery. In addition, on December 21, 2020, ATS filed a petition with the US Patent Trial and Appeal Board (“PTAB”), seeking to invalidate the subject patent. The parties are waiting
72
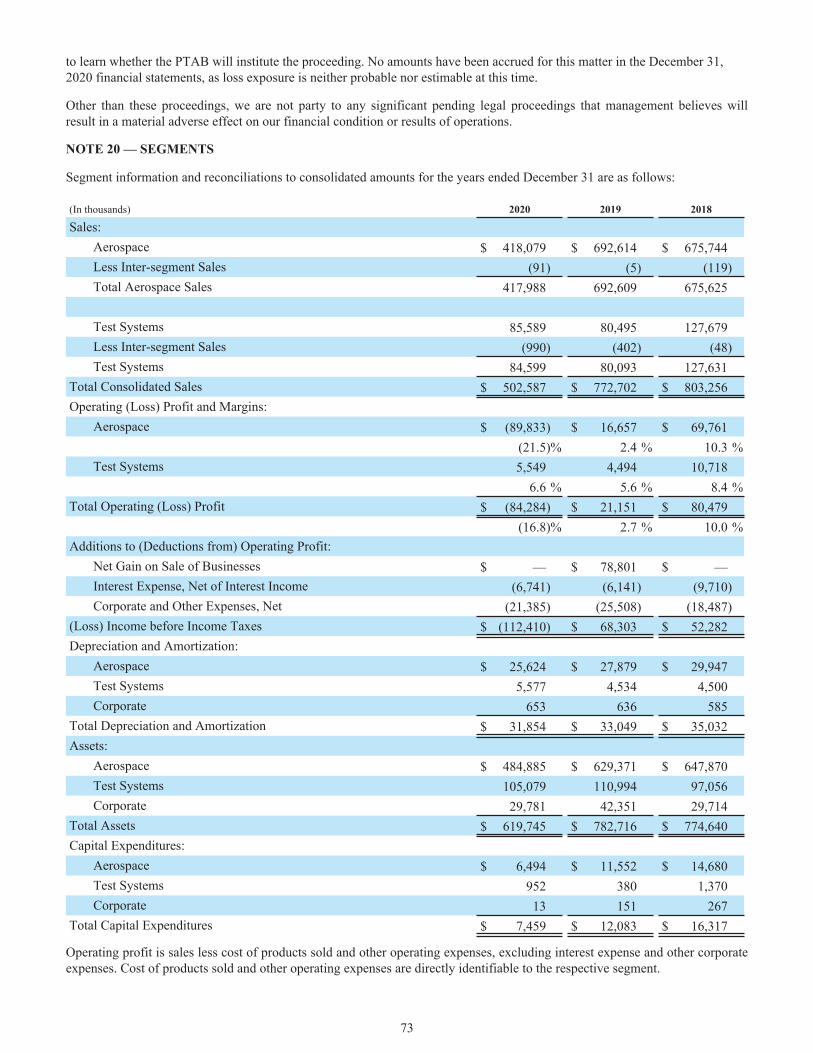
to learn whether the PTAB will institute the proceeding. No amounts have been accrued for this matter in the December 31, 2020 financial statements, as loss exposure is neither probable nor estimable at this time.
Other than these proceedings, we are not party to any significant pending legal proceedings that management believes will result in a material adverse effect on our financial condition or results of operations.
NOTE 20 — SEGMENTS
Segment information and reconciliations to consolidated amounts for the years ended December 31 are as follows:
(In thousands) 2020 2019 2018
Sales:Aerospace $ 418,079 $ 692,614 $ 675,744 Less Inter-segment Sales (91) (5) (119) Total Aerospace Sales 417,988 692,609 675,625
Test Systems 85,589 80,495 127,679 Less Inter-segment Sales (990) (402) (48) Test Systems 84,599 80,093 127,631
Total Consolidated Sales $ 502,587 $ 772,702 $ 803,256 Operating (Loss) Profit and Margins:
Aerospace $ (89,833) $ 16,657 $ 69,761 (21.5) % 2.4 % 10.3 %
Test Systems 5,549 4,494 10,718 6.6 % 5.6 % 8.4 %
Total Operating (Loss) Profit $ (84,284) $ 21,151 $ 80,479 (16.8) % 2.7 % 10.0 %
Additions to (Deductions from) Operating Profit:Net Gain on Sale of Businesses $ — $ 78,801 $ — Interest Expense, Net of Interest Income (6,741) (6,141) (9,710) Corporate and Other Expenses, Net (21,385) (25,508) (18,487)
(Loss) Income before Income Taxes $ (112,410) $ 68,303 $ 52,282 Depreciation and Amortization:
Aerospace $ 25,624 $ 27,879 $ 29,947 Test Systems 5,577 4,534 4,500 Corporate 653 636 585
Total Depreciation and Amortization $ 31,854 $ 33,049 $ 35,032 Assets:
Aerospace $ 484,885 $ 629,371 $ 647,870 Test Systems 105,079 110,994 97,056 Corporate 29,781 42,351 29,714
Total Assets $ 619,745 $ 782,716 $ 774,640 Capital Expenditures:
Aerospace $ 6,494 $ 11,552 $ 14,680 Test Systems 952 380 1,370 Corporate 13 151 267
Total Capital Expenditures $ 7,459 $ 12,083 $ 16,317
Operating profit is sales less cost of products sold and other operating expenses, excluding interest expense and other corporate expenses. Cost of products sold and other operating expenses are directly identifiable to the respective segment.
73
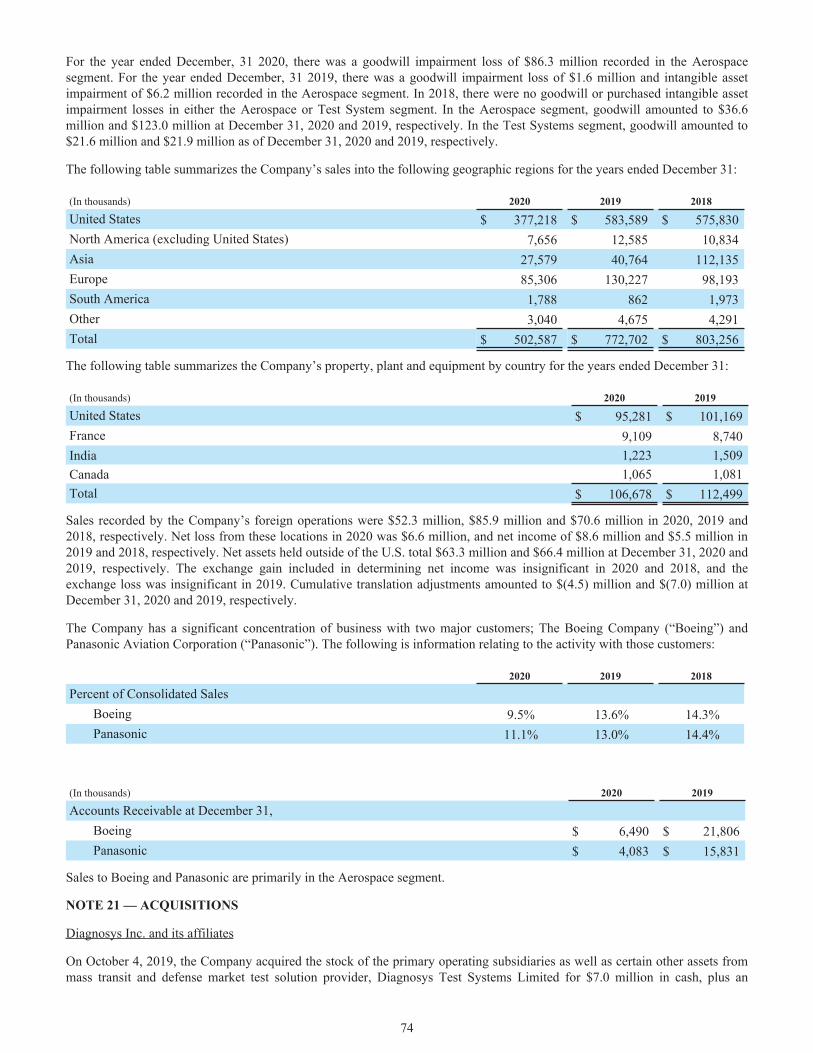
For the year ended December, 31 2020, there was a goodwill impairment loss of $86.3 million recorded in the Aerospace segment. For the year ended December, 31 2019, there was a goodwill impairment loss of $1.6 million and intangible asset impairment of $6.2 million recorded in the Aerospace segment. In 2018, there were no goodwill or purchased intangible asset impairment losses in either the Aerospace or Test System segment. In the Aerospace segment, goodwill amounted to $36.6 million and $123.0 million at December 31, 2020 and 2019, respectively. In the Test Systems segment, goodwill amounted to $21.6 million and $21.9 million as of December 31, 2020 and 2019, respectively.
The following table summarizes the Company’s sales into the following geographic regions for the years ended December 31:
(In thousands) 2020 2019 2018
United States $ 377,218 $ 583,589 $ 575,830 North America (excluding United States) 7,656 12,585 10,834 Asia 27,579 40,764 112,135 Europe 85,306 130,227 98,193 South America 1,788 862 1,973 Other 3,040 4,675 4,291 Total $ 502,587 $ 772,702 $ 803,256
The following table summarizes the Company’s property, plant and equipment by country for the years ended December 31:
(In thousands) 2020 2019
United States $ 95,281 $ 101,169 France 9,109 8,740 India 1,223 1,509 Canada 1,065 1,081 Total $ 106,678 $ 112,499
Sales recorded by the Company’s foreign operations were $52.3 million, $85.9 million and $70.6 million in 2020, 2019 and 2018, respectively. Net loss from these locations in 2020 was $6.6 million, and net income of $8.6 million and $5.5 million in 2019 and 2018, respectively. Net assets held outside of the U.S. total $63.3 million and $66.4 million at December 31, 2020 and 2019, respectively. The exchange gain included in determining net income was insignificant in 2020 and 2018, and the exchange loss was insignificant in 2019. Cumulative translation adjustments amounted to $(4.5) million and $(7.0) million at December 31, 2020 and 2019, respectively.
The Company has a significant concentration of business with two major customers; The Boeing Company (“Boeing”) and Panasonic Aviation Corporation (“Panasonic”). The following is information relating to the activity with those customers:
2020 2019 2018
Percent of Consolidated SalesBoeing 9.5% 13.6% 14.3%Panasonic 11.1% 13.0% 14.4%
(In thousands) 2020 2019
Accounts Receivable at December 31,Boeing $ 6,490 $ 21,806 Panasonic $ 4,083 $ 15,831
Sales to Boeing and Panasonic are primarily in the Aerospace segment.
NOTE 21 — ACQUISITIONS
Diagnosys Inc. and its affiliates
On October 4, 2019, the Company acquired the stock of the primary operating subsidiaries as well as certain other assets from mass transit and defense market test solution provider, Diagnosys Test Systems Limited for $7.0 million in cash, plus an
74
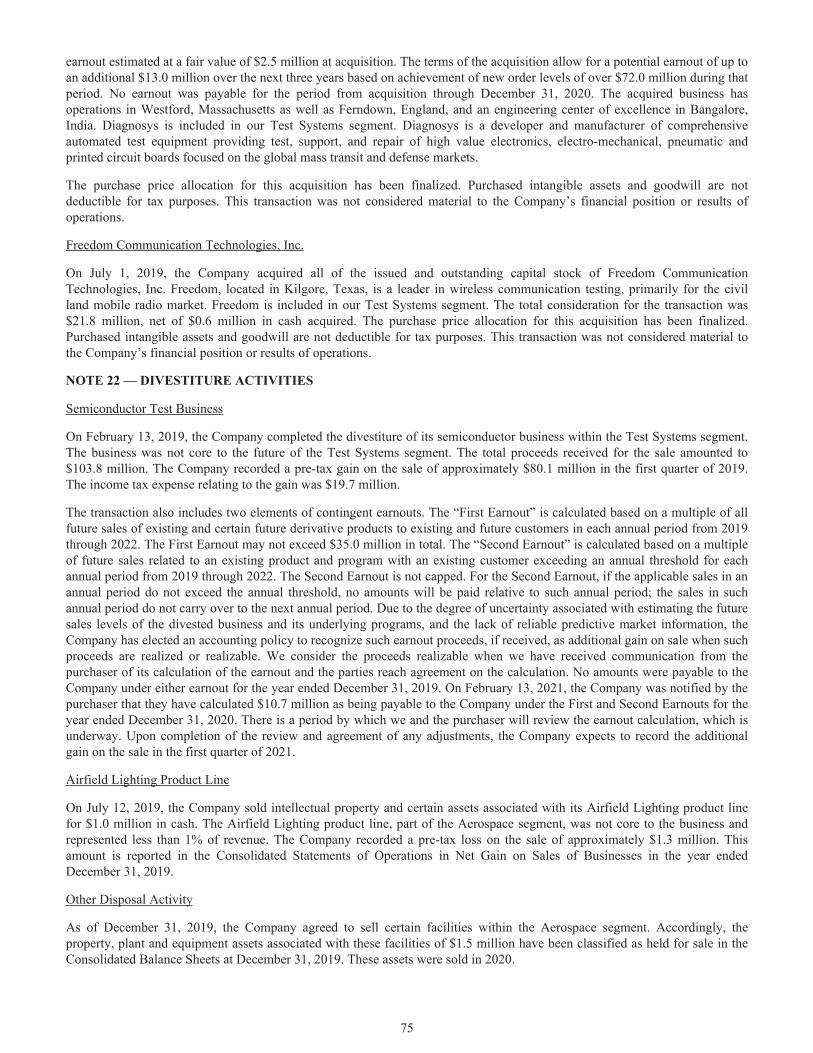
earnout estimated at a fair value of $2.5 million at acquisition. The terms of the acquisition allow for a potential earnout of up to an additional $13.0 million over the next three years based on achievement of new order levels of over $72.0 million during that period. No earnout was payable for the period from acquisition through December 31, 2020. The acquired business has operations in Westford, Massachusetts as well as Ferndown, England, and an engineering center of excellence in Bangalore, India. Diagnosys is included in our Test Systems segment. Diagnosys is a developer and manufacturer of comprehensive automated test equipment providing test, support, and repair of high value electronics, electro-mechanical, pneumatic and printed circuit boards focused on the global mass transit and defense markets.
The purchase price allocation for this acquisition has been finalized. Purchased intangible assets and goodwill are not deductible for tax purposes. This transaction was not considered material to the Company’s financial position or results of operations.
Freedom Communication Technologies, Inc.
On July 1, 2019, the Company acquired all of the issued and outstanding capital stock of Freedom Communication Technologies, Inc. Freedom, located in Kilgore, Texas, is a leader in wireless communication testing, primarily for the civil land mobile radio market. Freedom is included in our Test Systems segment. The total consideration for the transaction was $21.8 million, net of $0.6 million in cash acquired. The purchase price allocation for this acquisition has been finalized. Purchased intangible assets and goodwill are not deductible for tax purposes. This transaction was not considered material to the Company’s financial position or results of operations.
NOTE 22 — DIVESTITURE ACTIVITIES
Semiconductor Test Business
On February 13, 2019, the Company completed the divestiture of its semiconductor business within the Test Systems segment. The business was not core to the future of the Test Systems segment. The total proceeds received for the sale amounted to $103.8 million. The Company recorded a pre-tax gain on the sale of approximately $80.1 million in the first quarter of 2019. The income tax expense relating to the gain was $19.7 million.
The transaction also includes two elements of contingent earnouts. The “First Earnout” is calculated based on a multiple of all future sales of existing and certain future derivative products to existing and future customers in each annual period from 2019 through 2022. The First Earnout may not exceed $35.0 million in total. The “Second Earnout” is calculated based on a multiple of future sales related to an existing product and program with an existing customer exceeding an annual threshold for each annual period from 2019 through 2022. The Second Earnout is not capped. For the Second Earnout, if the applicable sales in an annual period do not exceed the annual threshold, no amounts will be paid relative to such annual period; the sales in such annual period do not carry over to the next annual period. Due to the degree of uncertainty associated with estimating the future sales levels of the divested business and its underlying programs, and the lack of reliable predictive market information, the Company has elected an accounting policy to recognize such earnout proceeds, if received, as additional gain on sale when such proceeds are realized or realizable. We consider the proceeds realizable when we have received communication from the purchaser of its calculation of the earnout and the parties reach agreement on the calculation. No amounts were payable to the Company under either earnout for the year ended December 31, 2019. On February 13, 2021, the Company was notified by the purchaser that they have calculated $10.7 million as being payable to the Company under the First and Second Earnouts for the year ended December 31, 2020. There is a period by which we and the purchaser will review the earnout calculation, which is underway. Upon completion of the review and agreement of any adjustments, the Company expects to record the additional gain on the sale in the first quarter of 2021.
Airfield Lighting Product Line
On July 12, 2019, the Company sold intellectual property and certain assets associated with its Airfield Lighting product line for $1.0 million in cash. The Airfield Lighting product line, part of the Aerospace segment, was not core to the business and represented less than 1% of revenue. The Company recorded a pre-tax loss on the sale of approximately $1.3 million. This amount is reported in the Consolidated Statements of Operations in Net Gain on Sales of Businesses in the year ended December 31, 2019.
Other Disposal Activity
As of December 31, 2019, the Company agreed to sell certain facilities within the Aerospace segment. Accordingly, the property, plant and equipment assets associated with these facilities of $1.5 million have been classified as held for sale in the Consolidated Balance Sheets at December 31, 2019. These assets were sold in 2020.
75
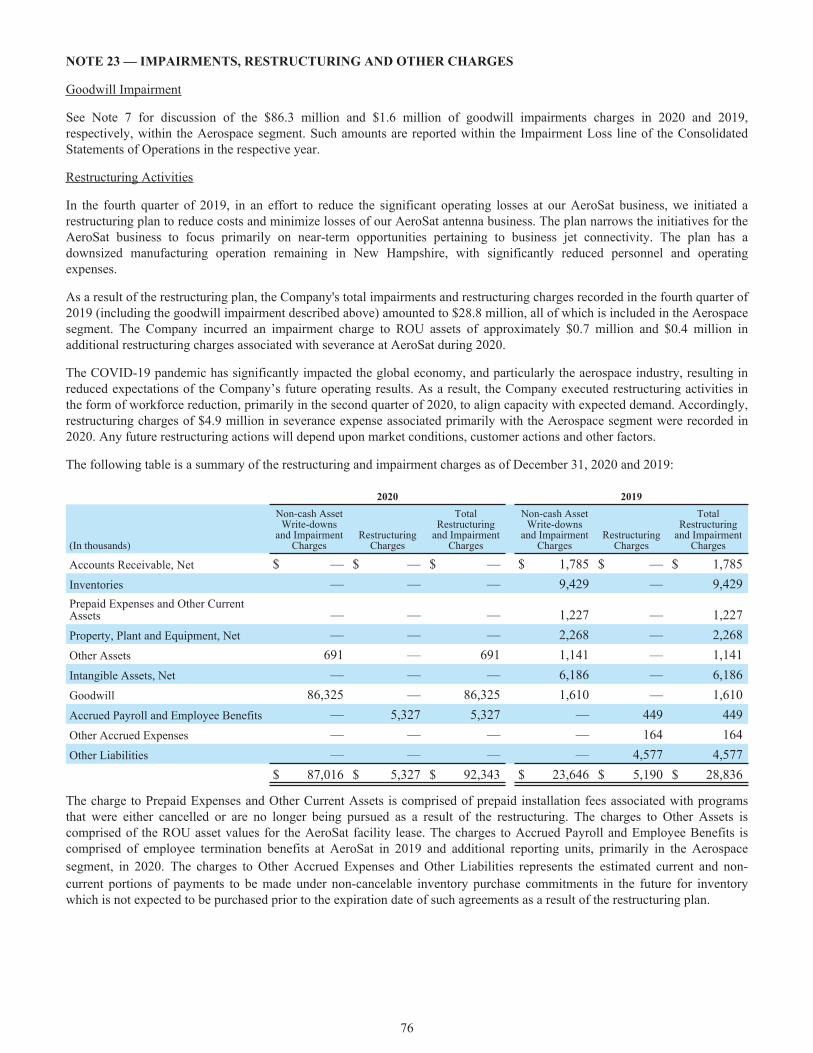
NOTE 23 — IMPAIRMENTS, RESTRUCTURING AND OTHER CHARGES
Goodwill Impairment
See Note 7 for discussion of the $86.3 million and $1.6 million of goodwill impairments charges in 2020 and 2019, respectively, within the Aerospace segment. Such amounts are reported within the Impairment Loss line of the Consolidated Statements of Operations in the respective year.
Restructuring Activities
In the fourth quarter of 2019, in an effort to reduce the significant operating losses at our AeroSat business, we initiated a restructuring plan to reduce costs and minimize losses of our AeroSat antenna business. The plan narrows the initiatives for the AeroSat business to focus primarily on near-term opportunities pertaining to business jet connectivity. The plan has a downsized manufacturing operation remaining in New Hampshire, with significantly reduced personnel and operating expenses.
As a result of the restructuring plan, the Company's total impairments and restructuring charges recorded in the fourth quarter of 2019 (including the goodwill impairment described above) amounted to $28.8 million, all of which is included in the Aerospace segment. The Company incurred an impairment charge to ROU assets of approximately $0.7 million and $0.4 million in additional restructuring charges associated with severance at AeroSat during 2020.
The COVID-19 pandemic has significantly impacted the global economy, and particularly the aerospace industry, resulting in reduced expectations of the Company’s future operating results. As a result, the Company executed restructuring activities in the form of workforce reduction, primarily in the second quarter of 2020, to align capacity with expected demand. Accordingly, restructuring charges of $4.9 million in severance expense associated primarily with the Aerospace segment were recorded in 2020. Any future restructuring actions will depend upon market conditions, customer actions and other factors.
The following table is a summary of the restructuring and impairment charges as of December 31, 2020 and 2019:
2020 2019
(In thousands)
Non-cash Asset Write-downs
and Impairment Charges
Restructuring Charges
Total Restructuring
and Impairment Charges
Non-cash Asset Write-downs
and Impairment Charges
Restructuring Charges
Total Restructuring
and Impairment Charges
Accounts Receivable, Net $ — $ — $ — $ 1,785 $ — $ 1,785 Inventories — — — 9,429 — 9,429 Prepaid Expenses and Other Current Assets — — — 1,227 — 1,227 Property, Plant and Equipment, Net — — — 2,268 — 2,268 Other Assets 691 — 691 1,141 — 1,141 Intangible Assets, Net — — — 6,186 — 6,186 Goodwill 86,325 — 86,325 1,610 — 1,610 Accrued Payroll and Employee Benefits — 5,327 5,327 — 449 449 Other Accrued Expenses — — — — 164 164 Other Liabilities — — — — 4,577 4,577
$ 87,016 $ 5,327 $ 92,343 $ 23,646 $ 5,190 $ 28,836
The charge to Prepaid Expenses and Other Current Assets is comprised of prepaid installation fees associated with programs that were either cancelled or are no longer being pursued as a result of the restructuring. The charges to Other Assets is comprised of the ROU asset values for the AeroSat facility lease. The charges to Accrued Payroll and Employee Benefits is comprised of employee termination benefits at AeroSat in 2019 and additional reporting units, primarily in the Aerospace segment, in 2020. The charges to Other Accrued Expenses and Other Liabilities represents the estimated current and non-current portions of payments to be made under non-cancelable inventory purchase commitments in the future for inventory which is not expected to be purchased prior to the expiration date of such agreements as a result of the restructuring plan.
76
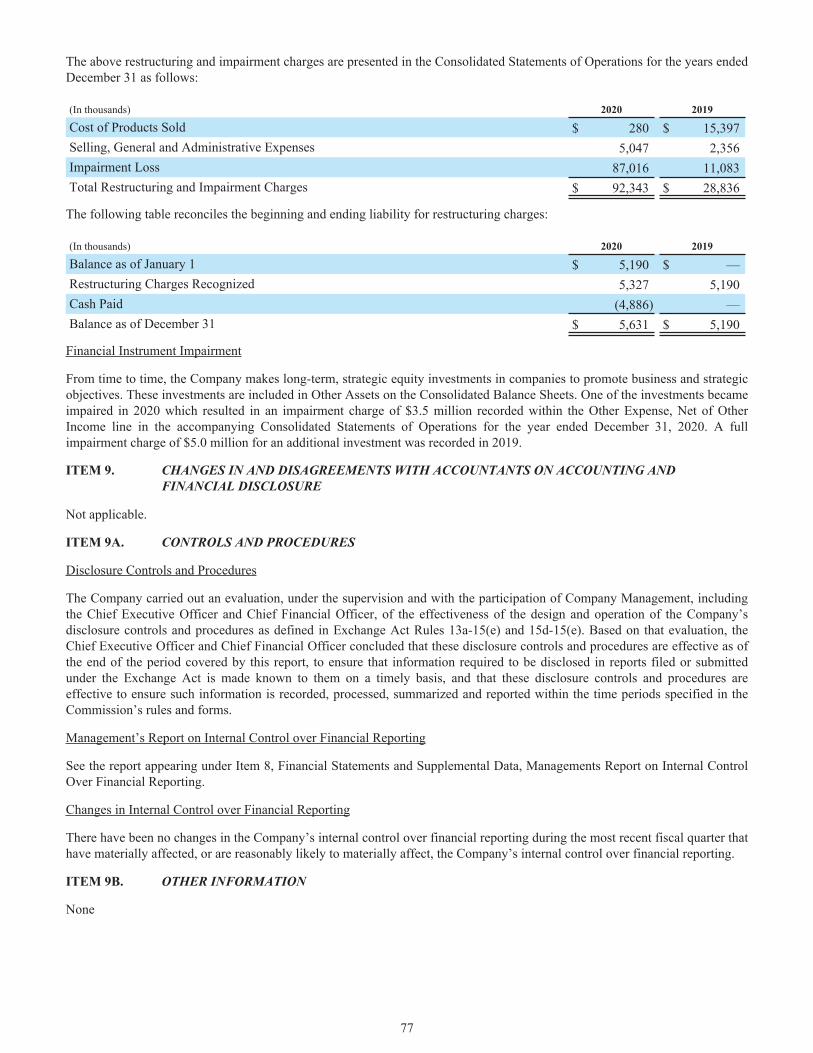
The above restructuring and impairment charges are presented in the Consolidated Statements of Operations for the years ended December 31 as follows:
(In thousands) 2020 2019
Cost of Products Sold $ 280 $ 15,397 Selling, General and Administrative Expenses 5,047 2,356 Impairment Loss 87,016 11,083 Total Restructuring and Impairment Charges $ 92,343 $ 28,836
The following table reconciles the beginning and ending liability for restructuring charges:
(In thousands) 2020 2019
Balance as of January 1 $ 5,190 $ — Restructuring Charges Recognized 5,327 5,190 Cash Paid (4,886) — Balance as of December 31 $ 5,631 $ 5,190
Financial Instrument Impairment
From time to time, the Company makes long-term, strategic equity investments in companies to promote business and strategic objectives. These investments are included in Other Assets on the Consolidated Balance Sheets. One of the investments became impaired in 2020 which resulted in an impairment charge of $3.5 million recorded within the Other Expense, Net of Other Income line in the accompanying Consolidated Statements of Operations for the year ended December 31, 2020. A full impairment charge of $5.0 million for an additional investment was recorded in 2019.
ITEM 9. CHANGES IN AND DISAGREEMENTS WITH ACCOUNTANTS ON ACCOUNTING AND FINANCIAL DISCLOSURE
Not applicable.
ITEM 9A. CONTROLS AND PROCEDURES
Disclosure Controls and Procedures
The Company carried out an evaluation, under the supervision and with the participation of Company Management, including the Chief Executive Officer and Chief Financial Officer, of the effectiveness of the design and operation of the Company’s disclosure controls and procedures as defined in Exchange Act Rules 13a-15(e) and 15d-15(e). Based on that evaluation, the Chief Executive Officer and Chief Financial Officer concluded that these disclosure controls and procedures are effective as of the end of the period covered by this report, to ensure that information required to be disclosed in reports filed or submitted under the Exchange Act is made known to them on a timely basis, and that these disclosure controls and procedures are effective to ensure such information is recorded, processed, summarized and reported within the time periods specified in the Commission’s rules and forms.
Management’s Report on Internal Control over Financial Reporting
See the report appearing under Item 8, Financial Statements and Supplemental Data, Managements Report on Internal Control Over Financial Reporting.
Changes in Internal Control over Financial Reporting
There have been no changes in the Company’s internal control over financial reporting during the most recent fiscal quarter that have materially affected, or are reasonably likely to materially affect, the Company’s internal control over financial reporting.
ITEM 9B. OTHER INFORMATION
None
77
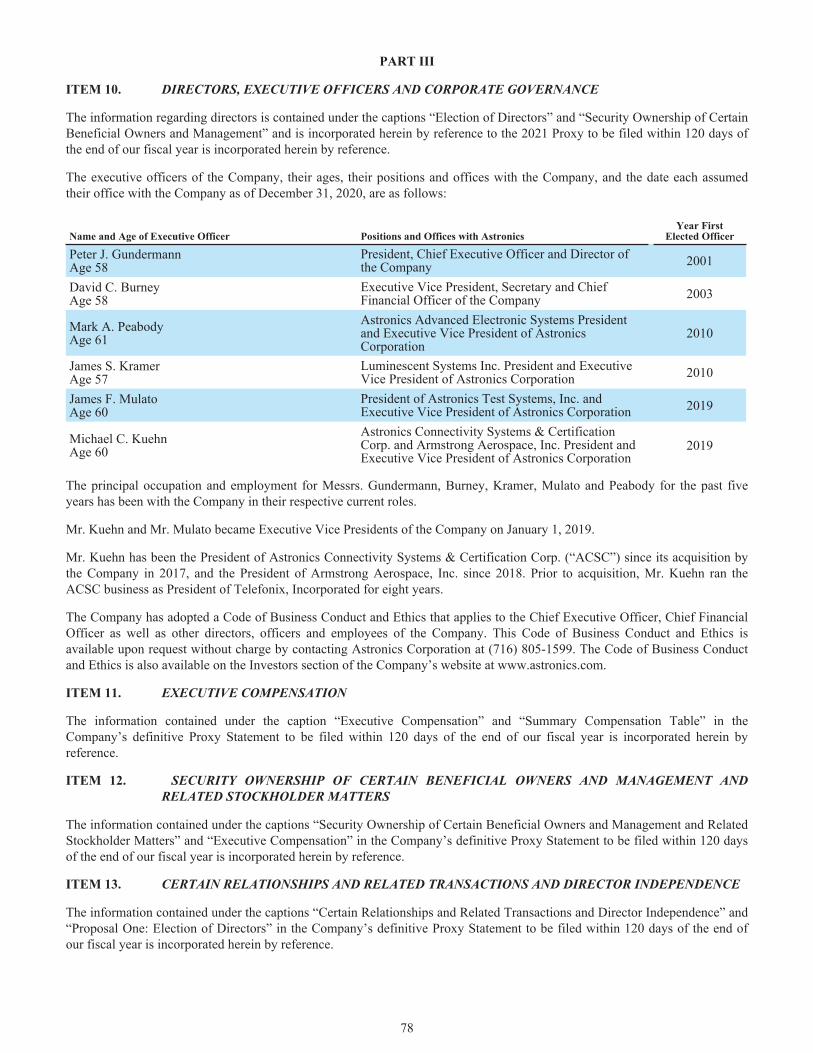
PART III
ITEM 10. DIRECTORS, EXECUTIVE OFFICERS AND CORPORATE GOVERNANCE
The information regarding directors is contained under the captions “Election of Directors” and “Security Ownership of Certain Beneficial Owners and Management” and is incorporated herein by reference to the 2021 Proxy to be filed within 120 days of the end of our fiscal year is incorporated herein by reference.
The executive officers of the Company, their ages, their positions and offices with the Company, and the date each assumed their office with the Company as of December 31, 2020, are as follows:
Name and Age of Executive Officer Positions and Offices with Astronics
Year FirstElected Officer
Peter J. GundermannAge 58
President, Chief Executive Officer and Director of the Company
2001
David C. BurneyAge 58
Executive Vice President, Secretary and Chief Financial Officer of the Company
2003
Mark A. PeabodyAge 61
Astronics Advanced Electronic Systems President and Executive Vice President of Astronics Corporation
2010
James S. KramerAge 57
Luminescent Systems Inc. President and Executive Vice President of Astronics Corporation
2010
James F. MulatoAge 60
President of Astronics Test Systems, Inc. and Executive Vice President of Astronics Corporation 2019
Michael C. KuehnAge 60
Astronics Connectivity Systems & Certification Corp. and Armstrong Aerospace, Inc. President and Executive Vice President of Astronics Corporation
2019
The principal occupation and employment for Messrs. Gundermann, Burney, Kramer, Mulato and Peabody for the past five years has been with the Company in their respective current roles.
Mr. Kuehn and Mr. Mulato became Executive Vice Presidents of the Company on January 1, 2019.
Mr. Kuehn has been the President of Astronics Connectivity Systems & Certification Corp. (“ACSC”) since its acquisition by the Company in 2017, and the President of Armstrong Aerospace, Inc. since 2018. Prior to acquisition, Mr. Kuehn ran the ACSC business as President of Telefonix, Incorporated for eight years.
The Company has adopted a Code of Business Conduct and Ethics that applies to the Chief Executive Officer, Chief Financial Officer as well as other directors, officers and employees of the Company. This Code of Business Conduct and Ethics is available upon request without charge by contacting Astronics Corporation at (716) 805-1599. The Code of Business Conduct and Ethics is also available on the Investors section of the Company’s website at www.astronics.com.
ITEM 11. EXECUTIVE COMPENSATION
The information contained under the caption “Executive Compensation” and “Summary Compensation Table” in the Company’s definitive Proxy Statement to be filed within 120 days of the end of our fiscal year is incorporated herein by reference.
ITEM 12. SECURITY OWNERSHIP OF CERTAIN BENEFICIAL OWNERS AND MANAGEMENT AND RELATED STOCKHOLDER MATTERS
The information contained under the captions “Security Ownership of Certain Beneficial Owners and Management and Related Stockholder Matters” and “Executive Compensation” in the Company’s definitive Proxy Statement to be filed within 120 days of the end of our fiscal year is incorporated herein by reference.
ITEM 13. CERTAIN RELATIONSHIPS AND RELATED TRANSACTIONS AND DIRECTOR INDEPENDENCE
The information contained under the captions “Certain Relationships and Related Transactions and Director Independence” and “Proposal One: Election of Directors” in the Company’s definitive Proxy Statement to be filed within 120 days of the end of our fiscal year is incorporated herein by reference.
78

ITEM 14. PRINCIPAL ACCOUNTANT FEES AND SERVICES
The information contained under the caption “Audit and Non-Audit Fees” in the Company’s definitive Proxy Statement to be filed within 120 days of the end of our fiscal year is incorporated herein by reference.
79
PART IV
ITEM 15. EXHIBITS AND FINANCIAL STATEMENT SCHEDULES
a. The documents filed as a part of this report are as follows:
1. The following financial statements are included:
i. Consolidated Statements of Operations for the years ended December 31, 2020, 2019 and 2018 ii. Consolidated Statements of Comprehensive (Loss) Income for the years ended December 31,
2020, 2019 and 2018iii. Consolidated Balance Sheets as of December 31, 2020 and 2019iv. Consolidated Statements of Cash Flows for the years ended December 31, 2020, 2019 and 2018 v. Consolidated Statements of Shareholders’ Equity for the years ended December 31, 2020, 2019
and 2018 vi. Notes to Consolidated Financial Statementsvii. Reports of Independent Registered Public Accounting Firmviii. Management’s Report on Internal Control Over Financial Reporting
2. Financial Statement Schedule
Schedule II. Valuation and Qualifying Accounts
All other consolidated financial statement schedules are omitted because they are inapplicable, not required, or the information is included elsewhere in the consolidated financial statements or the notes thereto.
3. Exhibits
80
ExhibitNo. Description
3 (a) Restated Certificate of Incorporation, incorporated by reference to the registrant’s 2013 Annual Report on Form 10-K, Exhibit 3(a), filed March 7, 2014 (File No. 000-07087).
(b) By-Laws, as amended, incorporated by reference to the registrant’s 2008 Annual Report on Form 10-K, Exhibit 3(b), filed March 11, 2009 (File No. 000-07087).
(c) Certificate of Amendment of the Certificate of Incorporation of Astronics Corporation, incorporated by reference to the registrant’s Form 8-K, Exhibit 3.1, filed July 1, 2016 (File No. 000-07087).
10.1* Restated Thrift and Profit Sharing Retirement Plan, incorporated by reference to the registrant’s 2010 Annual Report on Form 10-K, Exhibit 10.1, filed March 3, 2011 (File No. 000-07087).
10.2* 2001 Stock Option Plan, incorporated by reference to the registrant’s 2010 Annual Report on Form 10-K, Exhibit 10.4, filed March 3, 2011 (File No. 000-07087).
10.3* Non-Qualified Supplemental Retirement Plan, incorporated by reference to the registrant’s 2010 Annual Report on Form 10-K, Exhibit 10.5, filed March 3, 2011 (File No. 000-07087).
10.4* Employment Termination Benefits Agreement dated December 16, 2003 between Astronics Corporation and Peter J. Gundermann, President and Chief Executive Officer of Astronics Corporation, incorporated by reference to the registrant’s 2010 Annual Report on Form 10-K, Exhibit 10.6, filed March 3, 2011 (File No. 000-07087).
10.5* Employment Termination Benefits Agreement dated December 16, 2003 between Astronics Corporation and David C. Burney, Vice President and Chief Financial Officer of Astronics Corporation, incorporated by reference to the registrant’s 2010 Annual Report on Form 10-K, Exhibit 10.7, filed March 3, 2011 (File No. 000-07087).
10.6* 2005 Director Stock Option Plan, incorporated by reference to the registrant’s 2010 Annual Report on Form 10-K, Exhibit 10.8, filed March 3, 2011 (File No. 000-07087).
10.7* Supplemental Retirement Plan, Amended and Restated, March 6, 2012, incorporated by reference to the registrant’s 2012 Annual Report on Form 10-K, Exhibit 10.10, filed February 22, 2013 (File No. 000-07087).
10.8* First Amendment of the Employment Termination Benefits Agreement dated December 30, 2008 between Astronics Corporation and Peter J. Gundermann, President and Chief Executive Officer of Astronics, incorporated by reference to the registrant’s 2008 Annual Report on Form 10-K, Exhibit 10.11, filed March 11, 2009 (File No. 000-07087).
10.9* First Amendment of the Employment Termination Benefits Agreement dated December 30, 2008 between Astronics Corporation and David C. Burney, Vice President and Chief Financial Officer of Astronics Corporation, incorporated by reference to the registrant’s 2008 Annual Report on Form 10-K, Exhibit 10.12, filed March 11, 2009 (File No. 000-07087).
10.10* Employment Termination Benefits Agreement Dated February 18, 2005 between Astronics Corporation and Mark A. Peabody, Executive Vice President of Astronics Advanced Electronic Systems, Inc., incorporated by reference to the registrant’s 2010 Annual Report on Form 10-K, Exhibit 10.13, filed March 3, 2011 (File No. 000-07087).
10.11* First Amendment of the Employment Termination Benefits Agreement dated December 31, 2008 between Astronics Corporation and Mark A. Peabody, Executive Vice President of Astronics Advanced Electronic Systems, Inc., incorporated by reference to the registrant’s 2010 Annual Report on Form 10-K, Exhibit 10.14, filed March 3, 2011 (File No. 000-07087).
10.12* Form of Indemnification Agreement as executed by each of Astronics Corporation’s Directors and Executive Officers, incorporated by reference to the registrant’s 2010 Annual Report on Form 10-K, Exhibit 10.15, filed March 3, 2011 (File No. 000-07087).
10.13* 2011 Employee Stock Option Plan, incorporated by reference to the registrant’s Form S-8, Exhibit 4.1 filed on August 4, 2011 (File No. 000-07087).
10.14* Supplemental Retirement Plan II, incorporated by reference to the registrant’s 2012 Annual Report on Form 10-K, Exhibit 10.18, filed February 22, 2013 (File No. 000-07087).
10.15* Astronics Corporation 2017 Long Term Incentive Plan (incorporated by reference as Exhibit A to the Registrant’s Definitive Proxy Statement on Schedule 14A, as filed with the Commission on April 17, 2017).
81
10.16 Asset Purchase Agreement entered as of October 26, 2017, by and among Talon Acquisition Corp., Telefonix, Incorporated, Product Development Technologies, LLC, and Paul Burke filed as Exhibit 10.1 on Form 8-K filed on October 27, 2017 (File No. 000-07087).
10.17 Fifth Amended and Restated Credit Agreement entered into by and among Astronics Corporation, HSBC Bank USA, National Association, HSBC Securities (USA) Inc. and Merrill Lynch, Pierce, Fenner & Smith Inc., and Suntrust Bank, filed as Exhibit 10.1 on Form 8-K filed on February 21, 2018 (File No. 000-07087).
10.18 Amended and Restated Asset Purchase Agreement dated as of February 13, 2019 by and Among Astronics Test Systems, Inc., Astronics Corporation and Advantest Test Solutions, Inc., filed as Exhibit 10.1 on Form 8-K filed on February 19, 2019 (File No. 000-07087).
10.19 Amendment to the Astronics Corporation 2017 Long Term Incentive Plan, dated December 14, 2018.
10.20 Amendment No. 1 to the Fifth Amended and Restated Credit Agreement, filed as Exhibit 10.1 on Form 8-K filed on May 4, 2020 (File No. 000-07087).
21** Subsidiaries of the Registrant; filed herewith.
23** Consent of Independent Registered Public Accounting Firm; filed herewith.
31.1** Certification of Chief Executive Officer pursuant to Exchange Act Rule 13a-14(a) as adopted pursuant to Section 302 of the Sarbanes-Oxley Act of 2002; filed herewith.
31.2** Certification of Chief Financial Officer pursuant to Exchange Act Rule 13a-14(a) as adopted pursuant to Section 302 of the Sarbanes-Oxley Act of 2002; filed herewith.
32** Certification pursuant to 18 U.S.C. Section 1350 as adopted pursuant to Section 906 of the Sarbanes-Oxley Act of 2002; filed herewith.
101.INS** XBRL Instance Document
101.SCH** XBRL Taxonomy Extension Schema Document
101.CAL** XBRL Taxonomy Extension Calculation Linkbase Document
101.DEF** XBRL Taxonomy Extension Definition Linkbase Document
101.LAB** XBRL Taxonomy Extension Label Linkbase Document
101.PRE** XBRL Taxonomy Extension Presentation Linkbase Document * Identifies a management contract or compensatory plan or arrangement as required by Item 15(a) (3) of Form 10-K.
** Submitted electronically herewith
82
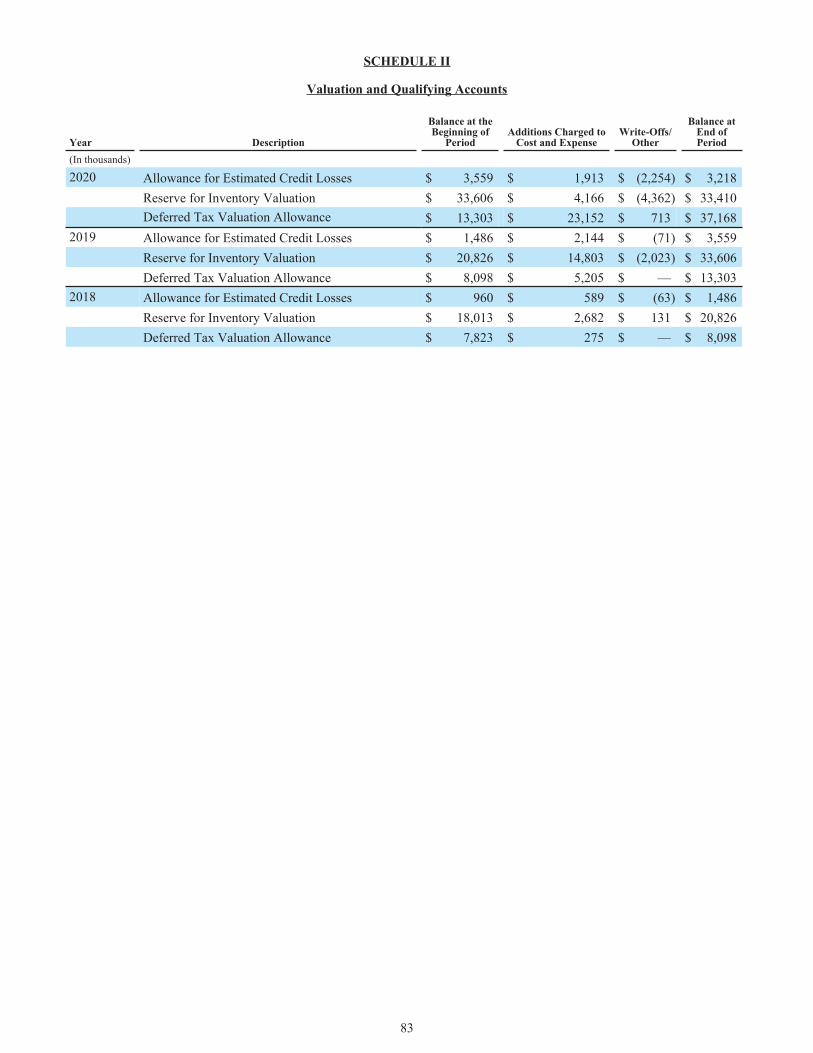
SCHEDULE II
Valuation and Qualifying Accounts
Year Description
Balance at theBeginning of
PeriodAdditions Charged to
Cost and ExpenseWrite-Offs/
Other
Balance atEnd ofPeriod
(In thousands)
2020 Allowance for Estimated Credit Losses $ 3,559 $ 1,913 $ (2,254) $ 3,218 Reserve for Inventory Valuation $ 33,606 $ 4,166 $ (4,362) $ 33,410 Deferred Tax Valuation Allowance $ 13,303 $ 23,152 $ 713 $ 37,168
2019 Allowance for Estimated Credit Losses $ 1,486 $ 2,144 $ (71) $ 3,559 Reserve for Inventory Valuation $ 20,826 $ 14,803 $ (2,023) $ 33,606 Deferred Tax Valuation Allowance $ 8,098 $ 5,205 $ — $ 13,303
2018 Allowance for Estimated Credit Losses $ 960 $ 589 $ (63) $ 1,486 Reserve for Inventory Valuation $ 18,013 $ 2,682 $ 131 $ 20,826 Deferred Tax Valuation Allowance $ 7,823 $ 275 $ — $ 8,098
83

ITEM 16. FORM 10-K SUMMARY
None.
84
SIGNATURES
Pursuant to the requirements of Section 13 or 15(d) of the Securities Exchange Act of 1934, the Registrant has duly caused this report to be signed on its behalf by the undersigned; thereunto duly authorized, on March 1, 2021.
Astronics Corporation
By /s/ Peter J. Gundermann By /s/ David C. BurneyPeter J. Gundermann President and Chief Executive Officer
David C. Burney, Executive Vice President, Chief Financial Officer
Pursuant to the requirements of the Securities Exchange Act of 1934, this report has been signed below by the following persons on behalf of the Registrant and in the capacities and on the dates indicated.
Signature Title Date
/s/ Peter J. Gundermann President and Chief Executive Officer
(Principal Executive Officer)
March 1, 2021Peter J. Gundermann
/s/ David C. Burney Executive Vice President, Chief Financial Officer
(Principal Financial Officer)
March 1, 2021David C. Burney
/s/ Nancy L. Hedges Corporate Controller and Principal Accounting Officer
March 1, 2021
Nancy L. Hedges
/s/ Raymond W. Boushie
Director
March 1, 2021Raymond W. Boushie
/s/ Robert T. Brady
Director
March 1, 2021Robert T. Brady
/s/ Tonit Calaway
Director
March 1, 2021Tonit Calaway
/s/ Jeffry D. Frisby
Director
March 1, 2021Jeffry D. Frisby
/s/ Peter J. Gundermann
Director
March 1, 2021Peter J. Gundermann
/s/ Warren C. Johnson
Director
March 1, 2021Warren C. Johnson
/s/ Robert S. Keane
Director
March 1, 2021Robert S. Keane
/s/ Neil Kim
Director
March 1, 2021Neil Kim
/s/ Mark J. Moran
Director
March 1, 2021Mark J. Moran
85
SHAREHOLDER INFORMATION Corporate Headquarters Astronics Corporation 130 Commerce Way East Aurora, New York 14052 716.805.1599 www.astronics.com 2021 Annual Meeting
The Annual Meeting will be held on Tuesday, May 25, 2021, at 10:00 a.m. Eastern Time at Astronics Test Systems: 12889 Ingenuity Drive Orlando, FL 32826
Investor Relations Investors, stockbrokers, security analysts and others seeking information about Astronics Corporation should contact:
David C. Burney Chief Financial Officer 716.805.1599 [email protected]
Deborah K. Pawlowski Kei Advisors LLC 716.843.3908 [email protected]
Transfer Agent For services, such as reporting a change of address, replacement of lost stock certificates, conversion of Class B shares, changes in registered ownership, or for inquiries about your account, contact:
EQ Shareowner Services 1110 Centre Pointe Curve, Suite 101 Mendota Heights, MN 55120 Tel: 800.468.9716 651.450.4064 www.shareowneronline.com
Attorneys Hodgson Russ LLP Buffalo, New York Independent Auditors Ernst & Young LLP Buffalo, New York
DIRECTORS AND OFFICERS
EXECUTIVE LEADERSHIP
Peter J. Gundermann Chairman, President and Chief Executive Officer, Astronics Corporation
David C. Burney Executive Vice President- Finance and Chief Financial Officer, Astronics Corporation
James S. Kramer Executive Vice President, Astronics Corporation President, Astronics Luminescent Systems Inc.
Michael C. Kuehn Executive Vice President, Astronics Corporation President, Astronics Connectivity Systems and Certification Corporation
James F. Mulato Executive Vice President, Astronics Corporation President, Astronics Test Systems
Mark A. Peabody Executive Vice President, Astronics Corporation President, Astronics Aerospace
BOARD OF DIRECTORS
Peter J. Gundermann President and Chief Executive Officer, Astronics Corporation Chairman of the Board, Astronics Corporation
Raymond W. Boushie 1, 2C President and Chief Executive Officer, retired, Crane Aerospace and Electronics
Robert T. Brady 1C, 3 Chief Executive Officer and Executive Chairman of the Board, retired, Moog Inc.
Tonit Calaway2C, 3 Executive Vice President, Chief Administrative Officer, General Counsel and Secretary, BorgWarner Inc.
Jeffry D. Frisby 1, 3C President and Chief Executive Officer, PCX Aerostructures, LLC; former President and Chief Executive Officer, Triumph Group Inc.
Warren C. Johnson 2, 3 President, retired, Aircraft Group for Moog, Inc.
Robert Keane 1, 2 Chairman, President and Chief Executive Officer, Cimpress plc
Neil Kim 1, 2 Executive Vice President and Chief Technology Officer, retired, Marvell Technology Group Ltd.
Mark Moran 2, 3 Chief Operations Officer, retired, Continental Airlines 1 Audit Committee 2 Compensation Committee 3 Nominating/Governance Committee C Committee Chairman

Nasdaq: ATRO
130 Commerce Way ● East Aurora, New York 14052 716.805.1599 ● www.astronics.com


