Embed Size (px)
Citation preview
DFG Sonderforschungsbereich 700 Governance in Räumen begrenzter Staatlichkeit - Neue Formen des Regierens?
DFG Collaborative Research Center (SFB) 700 Governance in Areas of Limited Statehood - New Modes of Governance?
Approaches and Methods
Jan Böhnke/Jan Koehler/Christoph Zürcher
Assessing the Impact of Development Cooperation in Northeast Afghanistan
SFB-Governance Working Paper Series • No. 43 • February 2013
DFG Collaborative Research Center (SFB) 700
Freie Universität Berlin
Alfried-Krupp-Haus Berlin
Binger Straße 40
14197 Berlin
Germany
Phone: +49-30-838 58502
Fax: +49-30-838 58540
E-mail: [email protected]
Web: www.sfb-governance.de/en
SFB-Governance Working Paper Series
Edited by the Collaborative Research Center (SFB) 700 “Governance In Areas of Limited Statehood - New Modes of Gover-
nance?”
The SFB-Governance Working Paper Series serves to disseminate the research results of work in progress prior to publication
to encourage the exchange of ideas and academic debate. Inclusion of a paper in the Working Paper Series should not limit
publication in any other venue. Copyright remains with the authors.
Copyright for this issue: Jan Böhnke/Jan Koehler/Christoph Zürcher
Editorial assistance and production: Anna Jüschke/Sophie Perl
All SFB-Governance Working Papers can be downloaded free of charge from www.sfb-governance.de/en/publikationen or
ordered in print via e-mail to [email protected].
Böhnke, Jan/Koehler, Jan/Zürcher, Christoph 2013: Assessing the Impact of Development Cooperation in Northeast Afgha-
nistan: Approaches and Methods. SFB-Governance Working Paper Series, No. 43, Collaborative Research Center (SFB) 700,
Berlin, February 2013.
ISSN 1864-1024 (Internet)
ISSN 1863-6896 (Print)
This publication has been funded by the German Research Foundation (DFG).
SFB-Governance Working Paper Series • No. 43 • February 2013 | 3
Assessing the Impact of Development Cooperation in Northeast Afghanistan: Approaches and MethodsJan Böhnke, Jan Koehler and Christoph Zürcher
Abstract
This report is a documentation of the methodological approach for an impact assessment
of development intervention in conflict zones. We designed this approach for one specific
region, Northeast Afghanistan, but we believe that it can easily be adapted to other regions
and other contexts.
This report is one result of an eight-year cooperative research project conducted by the Ger-
man Federal Ministry for Economic Cooperation and Development (BMZ), evaluation divi-
sion, and Freie Universität Berlin’s Collaborative Research Center (SFB) 700. The overall objec-
tives of this project are, first, to develop a method for assessing the impact of development
cooperation in conflict zones, and second, to apply this method in Northeast Afghanistan. The
experiences from the first round of the emerging longitudinal impact assessment were taken
into consideration in the present report. The basic question that we seek to address is whether
development cooperation positively affects the stabilization of a conflict zone through a posi-
tive impact on general attitudes toward foreign intervention, on the legitimacy of the Afghan
state, and on perceived security threats.
Zusammenfassung
Dieser Bericht dokumentiert das methodologische Vorgehen, das wir für die Wirkungsbeob-
achtung einer Entwicklungsintervention in einem Konfliktgebiet entworfen und implemen-
tiert haben. Das Vorgehen wurde auf eine bestimmte Region, nämlich Nordost-Afghanistan,
zugeschnitten. Wir gehen aber davon aus, dass die Methode auch auf andere Regionen und
Kontexte angepasst werden kann.
Der vorliegende Methodenbericht ist eines der Ergebnisse, die aus einer Kooperation zwi-
schen dem Sonderforschungsbereich (SFB) 700 der Freien Universität Berlin und dem Bun-
desministerium für Entwicklung und Wirtschaftliche Zusammenarbeit (BMZ) über einen
Zeitraum von acht Jahren hervorgegangen ist. Ziel der Kooperation ist es, eine Methode zu
entwickeln, mit der man die Wirkung von Entwicklungsmaßnahmen in Konfliktgebieten er-
fassen kann. Diese Methode wurde dann in Nordost Afghanistan getestet. Die Erfahrungen
aus der ersten Runde der so entstehenden Langzeitwirkungsbeobachtung gingen in den hier
vorliegenden Methodenbericht ein. Die zentrale Frage, der wir mit der Forschungskoopera-
tion in Nordost-Afghanistan nachgehen, ist, ob Entwicklungsmaßnahmen eine positive Wir-
kung auf die Stabilisierung von Konfliktzonen haben, indem sie die Haltung der Bevölkerung
gegenüber der externen Intervention, gegenüber dem afghanischen Staat und im Hinblick
auf die eigene Sicherheit positiv beeinflussen.
Assessing the Impact of Development Cooperation in Northeast Afghanistan | 4
Table of Content
Preface 5
1. The challenge 6
2. The strategy 72.1 The strategic framework 82.2 The general model 11
3. Data and data collection 133.1 The surveys 143.2 Profiles 183.3 Quarterly reports 203.4 Qualitative case studies 213.5 Secondary sources 22
4. Analysis: Explaining change 254.1 Inferring causality 254.2 Triangulation: Qualitative, quantitative, and GIS 264.3 Measuring aid 284.4 Operationalization 314.5 The regression models 364.6 Findings 37
5. Difficulties and lessons learned 395.1 Logistical challenges 395.2 Data challenges 405.3 Conceptional challenges 415.4 Is the method applicable in other contexts? 43
Literature 44
SFB-Governance Working Paper Series • No. 43 • February 2013 | 5
Preface
This report can be read as a stand-alone document. However, readers may also want to consult the following resources:
The final results of this project can be found in full in Böhnke, Koehler, and Zürcher (2010), “Assessing the Impact of Development Cooperation in North East Afghanistan: Final Report,” Evaluation Report 049, Bonn: Bundesministerium für wirtschaftliche Zusammenarbeit und Entwicklung (BMZ). The present report explains how we obtained these results.
Initial results were published in an interim report: Zürcher, Koehler, and Böhnke (2007), “As-sessing the Impact of Development Cooperation in North East Afghanistan: Interim Report,” Evaluation Report 028, Bonn: BMZ.
Later results were published in Böhnke, Köhler, and Zürcher (2009), “Evaluation von Entwick-lungszusammenarbeit zur Stabilisierung in Post-Konflikt-Zonen: Anwendung eines Mixed-Method Surveys in Nordost-Afghanistan,” Zeitschrift für Evaluation 8, 215-235.
In planning this research, we prepared an inception report that contains a conflict assessment of the target area, a brief analysis of German development projects’ portfolios in the region, and a first outline of the methods to be developed. See Koehler and Zürcher (2007), “Assessing the Impact of Development Cooperation in North East Afghanistan: Prestudy,” BMZ Evaluation Working Papers, Bonn: BMZ.
Finally, results from related qualitative research are documented in Koehler (2008), “Auf der Suche nach Sicherheit: Die internationale Intervention in Nordost-Afghanistan,” SFB-Gover-nance Working Paper Series No. 17, Berlin: SFB 700.
Koehler, Jan (2010), “Empirische Interventionsforschung – eine Problemannäherung am Beispiel Afghanistans,” in: Bonacker, Thorsten/Daxner, Michael/Free, Jan/Zürcher, Christoph (Eds.): Interventionskultur. Zur Soziologie von Interventionsgesellschaften, Wiesbaden, 219-259.
Koehler, Jan (2012), “Social Order within and beyond the Shadow of Hierarchy. Governance Pat-terns in Afghanistan,” SFB-Governance Working Papers Series No. 33, Berlin: SFB 700.
We are grateful for valuable comments received during three rounds of presentation at the BMZ (October 23, 2006; February 2, 2007; January 11, 2010), and during presentations in 2009 at ETH Zurich, Yale University, UC San Diego, and University of Ottawa.
Assessing the Impact of Development Cooperation in Northeast Afghanistan | 6
1. The challenge
Measuring the cumulative impact of development aid in conflict zones (areas threatened by, in the midst of, or recovering from serious organized violence) is imperative, because the planning and implementation of effective strategies to strengthen stability in conflict zones must be based on valid impact assessments. But in reality, this is a daunting task. What makes it so dif-ficult?
First, there is a wide range of methodological problems. The first one can be formulated as fol-lows: How can we know what would have happened if there had not been an intervention? This nasty little question lurks behind any impact assessment. To give an example: To claim that a specific bundle of development projects have made life safer for the rural population of a dis-trict in Afghanistan means that we are reasonably sure that the same district, had it not received this bundle of development projects, would be less safe and less stable. Hence, we have to know what would have happened if.
There are different ways of answering this type of question: One is to link a specific develop-ment project to a specific outcome. Carefully tracing the processes – step by step – by which the stimuli created by a project lead to a certain outcome lends a certain plausibility to the argu-ment that it was indeed the project that contributed to these changes. A second way is to com-pare the actual development (for example, of household incomes in villages that participate in a poverty relief program) with the expected “normal” future development. Such a comparison requires that we can estimate with some confidence how the future development would have looked without the intervention. A third way is to compare how households that received aid have fared compared to households that did not. Provided that all households are similar at the outset of the program, one can attribute observable differences with some plausibility to the impact aid. For this study, we used the first and the third approach, but adapted both to the context. This is described later in the report.
The second challenge stems from the nearly insatiable appetite for data that is typical for com-plex research questions. Imagine first that a researcher wants to assess the success of a hous-ing program for returning refugees. He would probably be satisfied with data on the number of houses built, the number of inhabitants in these new apartments, and the overall number of refugees. By contrast, imagine that the same researcher now wants to assess the cumulative impact of development cooperation on stability in a conflict zone. He invariably will need to collect data on different aspects of “stability” (for example: violent incidents, threat perception, refugees, organized crime, etc.), but he will also need high resolution data on the many develop-ment projects which may have had an impact on the situation. Finally, he also needs data on factors beyond development projects that may have caused the observed changes. There is a fair chance that the researcher will end up with an insanely long and completely unfeasible list of data he thinks he needs. Hence, what he really needs is a strategy that allows him to minimize the data to a feasible amount.
SFB-Governance Working Paper Series • No. 43 • February 2013 | 7
The third challenge arises from real life and can be summarized as “no roads, no names, no data.” It is one peculiarity of conflict zones that they are often “logistically demanding.” That is, it may take ages to travel from A to B, and one cannot be entirely sure of reaching B in one piece. Another peculiarity is that reliable data is a scarce good in conflict zones. Statistical de-partments are a privilege of the few rich and stable countries (and even there, obtaining data can be a Kafkaesque task). But obtaining data in a conflict zone is often Don Quixote-esque: One needs to convince the myriad IOs and NGOs to share their data, which they are often reluctant to do. The lack of transparency by many of these advocates of transparency and accountably is a stunning reality. But even if one gets from A to B and then back to A after a successful hunt for precious data, there is yet another obstacle: In a country like Afghanistan, there is significant confusion when it comes to village names or exact administrative borders. Many villages have no official names at all, while others have more than one name. District borders are unknown, irrelevant, or just in the process of being redrawn. As a result, localizing where a specific de-velopment project took place turns into a piece of investigative journalism. The only reliable information stems from GPS data, but recording project locations with GPS in a systematic way is not yet standard operational procedure in the development community and can be a serious security risk in Afghanistan (both Government and Taliban may react nervously to GPS devices). Hence, the research strategy must take into account the challenging conditions typical to conflict zones.
Donors are usually demanding and impatient. When they commission an impact assessment, they like it to be scientific, and they would like to have it next month. But peace does not break out over night, impacts cannot be assessed by next week, and science is slow. Fortunately, in this project we have a partner who understands these challenges and has given us all the sup-port we needed. In the following section, we try to describe our approach to coping with these challenges.
2. The strategy
At its most basic level, in order to conduct a valid impact assessment, researchers need first to define their overall strategy, which sets the course for the rest of the research process. They need to set up a strategic framework that defines which social changes and processes at which level they think will make the conflict zone more stable. This type of framework thus defines what is relevant to observe, and what is not. It is against these criteria of relevancy that the impact of development cooperation can be assessed.
Second, taking into account the strategic framework, researchers then have to define the general model of how they think these relevant changes may occur. The general model specifies which social changes the research will focus on, and which factors may have caused these changes. At its most basic level, this general model is a set of plausible and testable assumptions about the causes of the changes observed.
Assessing the Impact of Development Cooperation in Northeast Afghanistan | 8
Thirdly, researchers have to define what data is needed in order to pinpoint the changes they are interested in, and to trace the factors they think may have caused these changes.
Finally, researchers have to devise an analytical strategy that allows them to gauge the extent to which observed changes are attributable to development interventions (thereby separating the impact of development interventions from the impact of other causal factors such as natural environment, demographic factors, migration, or hostile actions by external armed fractions).
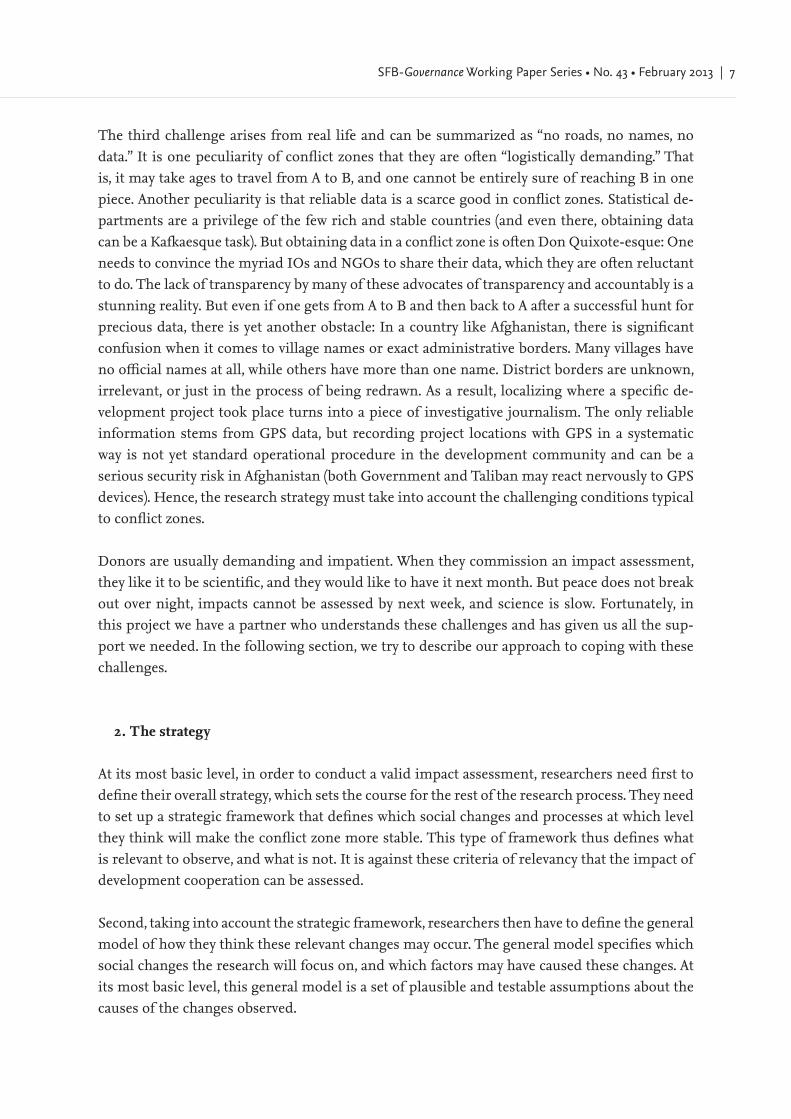
Each of these four steps requires consequential decisions. On the following pages we will brief-ly recapitulate how we tackled specific problems for this specific impact assessment, and why we did so.
2.1 The strategic framework
An impact assessment of the cumulative impact of development aid has to derive ex post from the relevant criteria against which cumulative impact and success can be assessed. This is quite different from evaluating projects and programs, for which the relevant criteria (the outputs and outcomes) are usually defined and documented in logframes (logistical frameworks), proj-ect planning matrixes, or impact models. By contrast, an assessment of cumulative impact of development aid has to investigate whether the cumulative outcomes of many development programs have had an impact on the situation in the conflict zone in general. At the core of the issue, then, is the following question: What makes a conflict zone less vulnerable to relapsing into violence? Evidently, the possible answers to this question are infinite in number and range from idiosyncratic events (for example, the mood of a US army commander) to long-term struc-tural factors (for example, “global warming”). It is a key objective of the strategic framework to reduce the possible range of answers, that is, to reduce complexity.
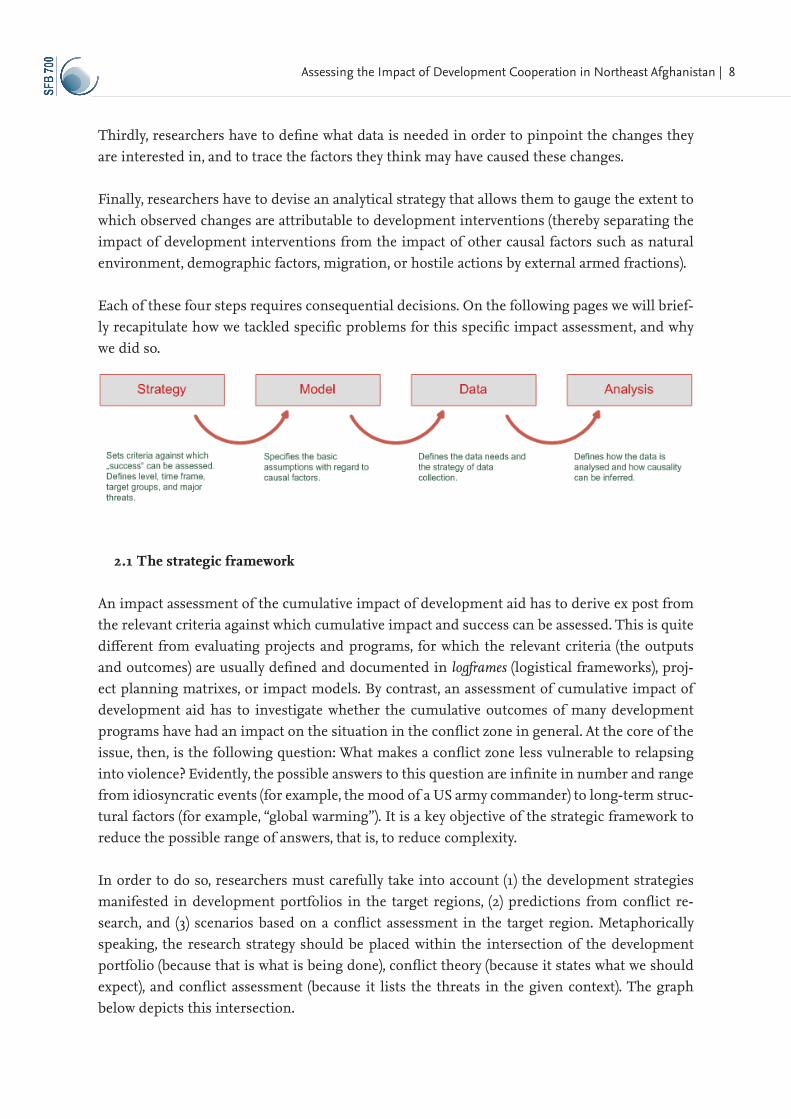
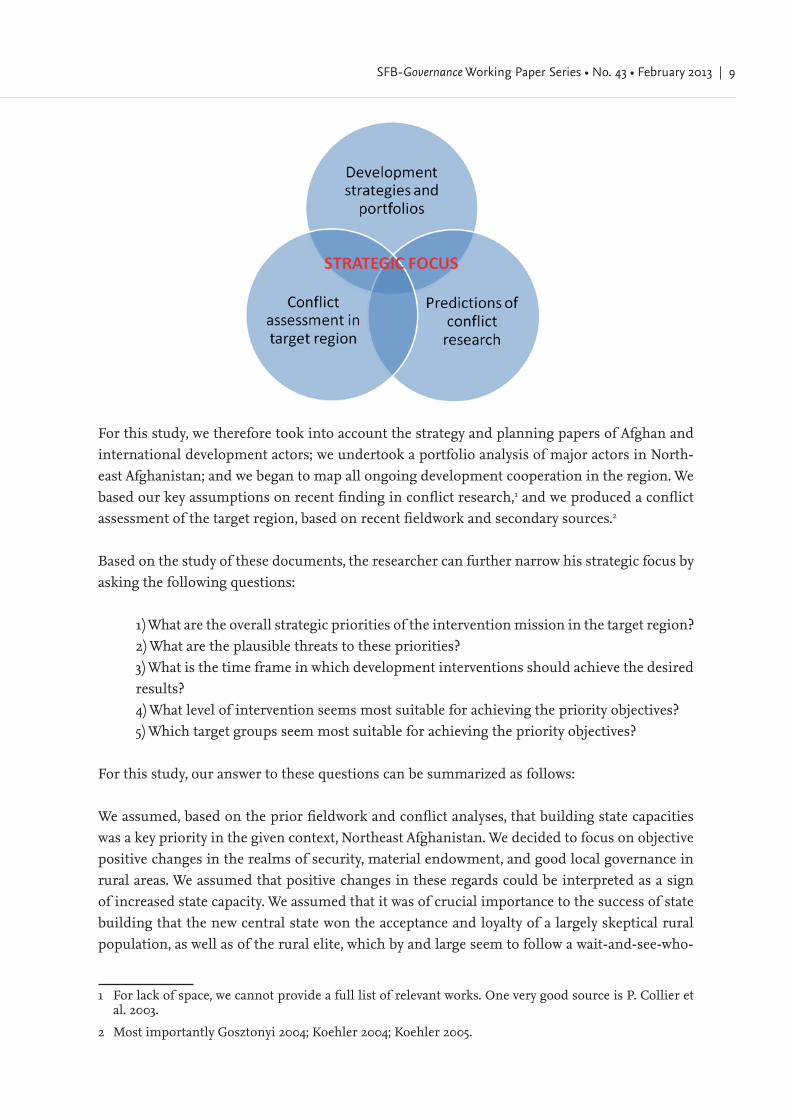
In order to do so, researchers must carefully take into account (1) the development strategies manifested in development portfolios in the target regions, (2) predictions from conflict re-search, and (3) scenarios based on a conflict assessment in the target region. Metaphorically speaking, the research strategy should be placed within the intersection of the development portfolio (because that is what is being done), conflict theory (because it states what we should expect), and conflict assessment (because it lists the threats in the given context). The graph below depicts this intersection.
SFB-Governance Working Paper Series • No. 43 • February 2013 | 9
For this study, we therefore took into account the strategy and planning papers of Afghan and international development actors; we undertook a portfolio analysis of major actors in North-east Afghanistan; and we began to map all ongoing development cooperation in the region. We based our key assumptions on recent finding in conflict research,1 and we produced a conflict assessment of the target region, based on recent fieldwork and secondary sources.2
Based on the study of these documents, the researcher can further narrow his strategic focus by asking the following questions:
1) What are the overall strategic priorities of the intervention mission in the target region? 2) What are the plausible threats to these priorities? 3) What is the time frame in which development interventions should achieve the desired results? 4) What level of intervention seems most suitable for achieving the priority objectives?5) Which target groups seem most suitable for achieving the priority objectives?
For this study, our answer to these questions can be summarized as follows:
We assumed, based on the prior fieldwork and conflict analyses, that building state capacities was a key priority in the given context, Northeast Afghanistan. We decided to focus on objective positive changes in the realms of security, material endowment, and good local governance in rural areas. We assumed that positive changes in these regards could be interpreted as a sign of increased state capacity. We assumed that it was of crucial importance to the success of state building that the new central state won the acceptance and loyalty of a largely skeptical rural population, as well as of the rural elite, which by and large seem to follow a wait-and-see-who-
1 For lack of space, we cannot provide a full list of relevant works. One very good source is P. Collier et al. 2003.
2 Most importantly Gosztonyi 2004; Koehler 2004; Koehler 2005.
Assessing the Impact of Development Cooperation in Northeast Afghanistan | 10
wins strategy. We identified as the main threat to the emerging Afghan state the development of a rentier state and corruption by drug money. Because the stabilization of conflict zones requires quick progress, we intended to measure changes within a timeframe of no more than two to five years.
Below we provide a brief justification of these choices.3
Strategic priorities: State capacities and security
Afghanistan will not become a stable, self-sustainable, and peaceful state without the establish-ment of an administrative base with which to exercise state capacities. The strategies of the international community and the findings of conflict assessments on the central and local levels converge on this point (e.g. Islamic Republic of Afghanistan 2006; Koehler/Zürcher 2007; Wimmer/Conrad 2002). Development projects should contribute to strengthening state capaci-ties. Increased state capacities should then be reflected at the regional and local level by visible improvements in security, welfare, and good governance.
Threats
Frontloading aid may create incentives for the Afghan state to turn into a rentier state (cf. Cra-mer/Goodhand 2002). As a result, the state will grow weaker, not stronger, and Afghan owner-ship of the process is far from complete. Furthermore, the drug economy poses the threat of corrupting the state-building process (cf. Koehler/Zürcher 2007). Drug money goes to regional power brokers and, in the long run, strengthens bad local governance. Lastly, the main threat to stability seems to be that the central state is unable to convince local power holders to align with the state (cf. Gosztonyi/Koehler 2010).
Time frame: Impact in three years
Conflict research shows that a post-conflict zone faces the highest danger of relapsing into war during the first three years after cease-fire (Collier/Sambanis 2005). Hence, in conflict zones, different from non-conflictive development environments, development projects should have a visible impact within no more than three years after implementation. This requirement seems even more adequate in light of recent negative tendencies in the security situation in Afghani-stan.
Level: Beyond Kabul, in rural areas
State building must reach into the provinces. The findings from peace and conflict assessments on the regional level stress that the key problem of the Afghan state-building mission is the weakness of the central state vis-à-vis entrenched local powerbrokers (Koehler 2012; Gosztonyi/
3 For more details, please consult the inception report.
SFB-Governance Working Paper Series • No. 43 • February 2013 | 11
Fararoon 2004). Yet, there is a high demand among the rural population for a state that delivers security, visible material improvement, and increased good local governance, and that helps to strengthen conflict-processing capacities at regional level. Development projects should con-tribute on the regional and local level to visible material improvement, good local governance, security, and better conflict-processing capacities.
Target groups
Development projects should provide incentives and resources to regional powerbrokers and local populations in order to win their loyalty for the state-building process (cf. Koehler 2008). Hence, development projects should have an impact with a short to medium time frame, and they should focus on target groups from district populations and district elites.
2.2 The general model
A general model frames the major hypothesis of the investigation. It proposes causal chains that produce changes that are, according to the strategic framework, helpful for stabilizing the conflict zone and plausibly attributable to the ongoing development projects. It specifies which social changes the research will focus on, and which factors may have caused these changes. At its most basic, this type of general model is a set of testable assumptions about the causes of the changes observed.
So, how can aid contribute to peace building in conflict zones? It is perhaps too optimistic to assume that the tools development actors usually have at their disposal will have an immediate effect on the security situation. Development aid in poor post-conflict countries first and fore-most intends to increase the provision of basic services for the population. In particular, devel-opment actors aim to increase access to food and drinking water and to rehabilitate or build basic infrastructure. Presumably, drilling wells and building bridges will not disarm warlords, and refurnishing schools will not increase the counterinsurgency capacities of the government. But consider this instance:4 In the spring of 2006, forces hostile to the Afghan government and international actors attacked schools in the Northeast of Afghanistan. Recently refurnished buildings were burned. In some communities, however, the local population prevented attacks on their schools. In Taloqan, for example, local residents had knowledge of the planned at-tack, and alerted local authorities, which in turn asked international military forces for help. Examples like this demonstrate that under certain circumstances, the local population will choose cooperation with international actors over cooperation with insurgents or other armed groups, despite the risks associated with opposing armed gunmen. In this instance, the positive consequences for the local communities from continued cooperation with development actors outweighed the risks of opposing local armed groups.
4 This episode was communicated to one of the authors during fieldwork in September 2006 in Talo-qan.
Assessing the Impact of Development Cooperation in Northeast Afghanistan | 12
This example underlines what might be self-evident: the success of an intervention mission depends to a large extent on the attitudes of local population to the international military forces and the development actors, and sustainable peace is not possible as long as substan-tial segments of the population are neutral or even hostile toward the state-building project. Hence, the population needs to be convinced that it is ultimately beneficial for them to become stakeholders in the intervention process and to engage in prolonged cooperation with the ex-ternal interveners and the government. The rationale for distributing development aid in post-conflict situations is therefore not only to address the needs of the population, but also to make cooperation with the interveners more attractive. Providing aid, it is hoped, will help capture hearts and minds and increase local support for the mission. More support among the local population may then translate into a better security environment, which reduces the costs of the political transition that international actors seek to support.
But interveners (be they development actors or military forces) operating in fragile conflict zones not only seek to gain the acceptance and the cooperation of the local population, they also hope that development aid increases the legitimacy of the government and thus helps to sta-bilize the situation. Aid programs may help to increase the administrative capacity of the state, which enables the state to better provide basic services to its population. Much of the overall aid allocated to fragile states is actually earmarked for capacity building. Aid may also be spent on food aid and basic infrastructure. Development actors have recently become anxious not to compete with the state. They often distribute aid through government institutions, hoping that aid will increase the acceptance and legitimacy not only of development actors, but also of state actors. A legitimate and capable state, it is hoped, will command the loyalty of its citizens and withstand insurgents’ attempts to claim power. It is also seen as the best option for an end to materially and politically costly interventions (cf. Bundesregierung 2010).
To sum up, while the overarching rationale for providing aid in conflict zones lies in protect-ing the livelihood of people, development and military actors expect other benefits too: Aid, it is hoped, helps reduce the risks for military and development actors in the field because the material benefits will induce communities to share vital information and intelligence with the interveners rather than with the insurgents. This will make the environment safer, and the op-erations of development actors and counterinsurgents more efficient. Furthermore, aid is also thought to convince the population that a prolonged cooperation with international interven-ers is preferable to cooperating with the armed opposition. Aid is also thought to bolster the le-gitimacy of the state, either by building the state’s capacity to deliver public goods, or by directly delivering public goods in the name of the state. A more legitimate state and more positive at-titudes toward international military and civilian interveners then add up to an environment in which the intervention stands better chances of success, and which is conducive to maintaining a situation of increased security. International engagement in conflict zones is ultimately based on these assumptions.
SFB-Governance Working Paper Series • No. 43 • February 2013 | 13
Drawing on these reflections, we can now formulate our model:
Development cooperation leads to a stabilization of conflict zones because development cooperation has a positive impact on general attitudes toward the international intervention, because it strengthens the legitimacy of the Afghan state, and because it reduces perceived security threats.
The next task is now to develop a research design that allows us to test these assumptions and identify the causal mechanisms that may explain the observed impact.
3. Data and data collection
The model serves as a guideline to specify what data is needed. Accordingly, in our case we needed to collect data on development cooperation (the independent variable that causes the effects in which we are interested) and on the dependent variables (the caused effects). These are: attitudes toward the international intervention, legitimacy of the Afghan state, and reduced security threats.
However, there are clearly factors other than development aid that may have an impact on general attitudes, legitimacy of the Afghan state, and perceived security threats. We also needed to include these factors in the model because we had to control for these variables in order to identify the net effect of the independent variable. Hence, we also needed data on factors such as ethnicity, size and location of the village, resources available to the household and village, and individual characteristics of the respondents (for a full list of variables see below).
All of this created a hunger for data. We employed five different methods of data collection:
First, we conducted a baseline and follow-up survey among households in the target region. We made sure that our sample was representative for the community (more on sampling below), which let us establish profiles of 79 communities in four districts. We needed to run two surveys in order to be able to compare the differences over time.
Second, we asked trained local teams to collect data in so-called community profiles and dis-trict profiles. Here we collected data that refers to the communities (or districts) as whole, for example, demographic data, the political constitution of the village, the number of schools, or the access to markets. Data contained in these community profiles complemented data from the surveys and allowed us to crosscheck data by comparing the survey and the community profiles. The same logic applies to the community cluster and district profiles. The profile data is, compared to the data from the survey, more objective (expert based) whereas the survey data is more subjective (respondent based). Profile data refers to the whole community or district, whereas survey data is based on respondents’ perception.
Assessing the Impact of Development Cooperation in Northeast Afghanistan | 14
Thirdly, we commissioned semi-structured reports, to be filled in by trained local correspon-dents four times a year. These quarterly reports recorded major events and significant changes, for example major new development initiatives, outbreaks of violence, local conflicts, and natu-ral disasters. Most of this sort of data could not adequately be captured in surveys or in profiles. The quarterly reports are also used to construct time series on a limited range of variables (e.g. local governance, access to resources, etc.).
Fourthly, we conducted in-depth qualitative case studies, mainly in regions that showed atypical high or low values in the dependent variables, for example communities with specific security or development issues. Structured village histories were compiled for all 80 villages, and in 40 of those villages local as well as external researches followed up on the histories in subsequent open group interviews (ethnographic probes). Case studies were also used to better understand some selected instruments of development work (as in the case of the development funds). For these case studies we relied on standard qualitative methods, including expert interviews, focus groups interviews, and ethnographic participatory observation.
Lastly, we mined existing data bases and, where feasible, imported data into our own databases. For example, we used a baseline survey from a development agency to create data on the mate-rial situation of some communities in our sample, and we used unclassified ISAF databases and other accessible incident lists to map security incidents in our target region. We also added information on projects received from donors, implementing development agencies and from the communities into this data base.
The following sections describe in more detail these five data mining approaches.
3.1 The surveys
The unit of analysis
We assumed that the impact of development cooperation should be observable at the commu-nal level. Consequently, we designed a baseline questionnaire that allowed us to gather relevant data on our variables for selected communities. The main unit of analysis was therefore the community.
We further assumed that, in Afghanistan, it was the household (rather than the individual) that forms the underlying structure of the village. This is because households pool resources, hence, for example, the question of whether an individual is poor or rich is of little help, because it is the households that are poor or rich. Since we wanted to control for material endowment, we decided to focus on households.
We surveyed 2034 households in 77 communities in 2007 and 2132 households in 79 commu-nities in 2009. The communities are located in four districts in Northeast Afghanistan: Imam Sahib, Aliabad, Warsaj, and Taloqan within the provinces of Kunduz and Takhar.
SFB-Governance Working Paper Series • No. 43 • February 2013 | 15
Sampling
Eighty communities were initially selected for this study. Because of overall sample size, we could gather data in only 77 villages in 2007 and in 79 villages in 2009.
Half of the communities were selected by random sampling. All known communities within a district were coded with numbers. A random number processor was then used to identify ten communities in each of the four target districts. The remaining 50 percent were selected for their diversity in terms of five criteria: (1) size; (2) remoteness; (3) estimated natural resource base (access to irrigated or rain-fed land, access to pastures, forest); (4) estimated vulnerability to natural disasters; (5) ethnic and religious composition.
Within the communities, households were sampled randomly in both 2007 and 2009.5 The size of the sample varied according to the size of the community to ensure that the sample was rep-resentative of the community as a whole. In 2007, 2034 heads of households were interviewed, followed by 2132 households in 2009.
The interviewed heads of households in both waves combined were male, on average 45 years old. 35.6 % were Uzbek, 31.1 % Tajik, 19.3 % Pashtu, 5.0 % Hazara, 3.7% Arab, 3.3% Turkmen, and 1.4 % Aimaq.
In 2007, the households consisted on average of 10.4 people and contained between one and eight core families. Respondents said they had attended, on average, 1.3 years of school. 79% of respondents said they were peasants; 80% said they owned some land. In 2009, the households consisted on average of 11.3 people and again contained between one and eight core families. Respondents in 2009 said they had attended, on average, 2.0 years to school. 71% of the respon-dents in 2009 indicated they were peasants, and 79% said that they owned some land.
Implementation
The surveys were conducted by an Afghan research organization (OSDR: Organisation for Sus-tainable Development and Research, until 2007 a sub-unit of Coordination of Afghan Relief or COAR). It is challenging to conduct a survey in regions with no available population data on the community level, because researchers cannot devise a sampling plan beforehand. Before conducting interviews in a community, the interview teams held an initial meeting with shura members, elders, and other local representatives.6 During that meeting they established the number of households in the village. Once the teams had this information, they calculated the number of interviews that were needed in order to get a representative sample. Once the elders granted permission, the team conducted the interviews. Since the team was conducting the
5 For mainly logistical reasons, we decided not to collect panel data.
6 The term shura generally refers to a gathering of mature men for consultations on issues of collective concern. Here it refers to the village council. The shura is traditionally the body that exercises local, communal governance.
Assessing the Impact of Development Cooperation in Northeast Afghanistan | 16
interviews with the official blessing of the elders, response rates were very high (above 95% in both waves).
In the 2009 survey, a special community coversheet was designed to capture relevant informa-tion on the spatial organization of the village, the sampling strategy within the village and the specific circumstances of interviewing within that village.
The two main limiting resources in doing survey research is the budget available to the re-searchers, and the time that it takes respondents to answer. Interviews should therefore be lim-ited to a maximum of ninety minutes; otherwise they are no longer feasible. In our study, the average interview in 2007 lasted for about 64 minutes, with a minimum of 40 and a maximum of 105 minutes; in 2009 the average was about 61 minutes, with a minimum of 35 (with one refusal after five minutes) and a maximum of 100 minutes.
Before implementing the survey, we made sure that the questionnaire was peer-reviewed by country experts. Furthermore, we carefully followed the process of translating the questions into Dari, making sure that the translation “meant” what we had in mind. Specific phrases had to be adapted to local usages and local meanings. The enumerators then received intensive training. A one-week training and preparation workshop was held in Kabul from February 21 to 28, 2007. Finally, we ran a pre-test with 35 respondents in a village in the vicinity of Kabul. For the follow-up survey, the training was repeated and lessons learned were integrated into questionnaire and survey strategy (February 20-24, 2009). The questionnaire was tested among team members.
The content
The survey was designed to generate data on objective indicators of development cooperation and local capacities. Furthermore, we also asked about subjective perceptions of respondents on topics such as the coverage and usefulness of development cooperation projects within the community, or the perception of everyday security. A major challenge of survey design is to make measurable (“operationalize”) the concepts that one is interest in. Each concept has to be transformed into questions that cover relevant aspects. Often it is necessary to divide broad and quite abstract concepts into various sub-concepts. For example, in order to assess levels of security, one might divide the concept “security” into “physical security,” “land tenure security,” and “threat perception.” A detailed overview of the main concepts we sought to cover is given below. Note that in the final analysis, we did not make use of all concepts and indicators.
Resource endowment
This section seeks to establish a measure for the households’ overall resource endowment. Re-sources can stem from different sources, such as access to land, livestock, or off-farm income; hence, the questions pertain to different sources of income. We also included questions about the perception of the household’s resource endowment. It is important to measure households’
SFB-Governance Working Paper Series • No. 43 • February 2013 | 17
resource endowment because (1) we want to monitor changes over time, and (2) we need to con-trol for income when analyzing other factors.
Security
This section asks about the perception of security: which foreign and domestic actor(s) the respondent credits for bringing about positive changes, and which groups are seen as a threat. We also asked about concrete security incidents experienced by the interlocutors and their household members. Finally, we asked whether the respondent had heard about the Provincial Reconstruction Team (PRT) in Kunduz, and how he assessed the PRTs impact.
Conflict processing
This section asks about the number of violent conflicts that have occurred within the commu-nity; we asked which actors were seen as most capable of regulating arising conflicts in a non-violent, just, and procedural way. Finally, we asked whether respondents thought they could turn to the state authority when they believed their claims had been unjustly ignored.
Community/shura
This section seeks to investigate power structures within the community. The focus is on wheth-er respondents think their community is governed by a few powerful individuals, or rather by a collective body that enjoys legitimacy. The shura is the collective body that traditionally takes important decisions within a community. The National Solidarity Program (NSP) has further promoted the emergence of so called CDCs (Community Development Councils) to become a major body for community-driven development. Often, traditional shuras and the new CDCs converge. In this section, we ask whether respondents think that their shuras are representa-tive, accessible, and legitimate, and what role they play with regard to choosing development projects.
Local organizational capacities, social capital, communal norms
Community-driven development – which is the prevailing strategy in Afghanistan’s rural areas – seeks to increase a community’s capacity for collective action. In this section, we ask about prevailing norms and practices of solidarity and mutual support that facilitate collective action.
Networking and mobility
This section investigates where and how often community members actually meet and interact inside and outside of their communities. Interaction is seen as a proxy for possible networking, which in turn is considered fundamental to the emergence of a civil society.
Assessing the Impact of Development Cooperation in Northeast Afghanistan | 18
State services and legitimacy
This section asks about respondents’ perception of the state’s capacity to deliver services. We focused on basic sectors such as drinking water, roads, electricity, jobs, and schooling (note that security was covered in other sections). We also asked about other actors’ capacities to deliver services in these sectors. Other questions pertained to tax payment, perception of the police forces, or credit opportunities for households. Finally, we also elicited respondents’ percep-tions of whether state officials at the district and provincial level take care of the needs of the population.
Norms and values
This section asked for respondents’ positions on disputed questions. Answers to these ques-tions may reveal more or less skepticism toward the values that accompany the international community’s efforts at rebuilding Afghanistan. Specifically, we asked for the respondents’ views with regard to schooling for boys and girls, wage labor opportunities for women, and whether the presence of development agencies and foreign troops poses a threat to local values and customs.
NGO/IO perception
This section asked whether respondents think that their households and their communities have been beneficiaries of development projects or not. Again, we focused on basic sectors such as drinking water, irrigation, roads, electricity, jobs, and schooling.
Information on respondents
In the last section, we collected information on the level of education, ethnic and religious af-filiation, and size of the households.
3.2 Profiles
A separate team was trained to collect relevant data for village and district profiles. The data collection for the profiles can best be understood as a combination of expert interviews and fo-cus group interviews. A trained team of enumerators compiled data according to standardized questions, based on their expert knowledge, and based on lengthy interviews with community authorities, community councils, or community elders. These profiles contain information on the history, demography, ethnic composition, political and social organization, resource en-dowment, and levels of received aid of the communities. It should be noted that in other set-tings, much of this data would be readily available from statistics and census information. In the Afghan context, however, we had to collect this data ourselves.
SFB-Governance Working Paper Series • No. 43 • February 2013 | 19
The community profile consists of 54 questions and a coversheet. In addition, the profiling includes a structured set of questions regarding the history of the village (see village history in annex). In the second round of data collection, the set of questions on the village history was adapted to results from the analysis of the 2007 dataset.
As a first step, the name(s) of the community were established. As unlikely as it may sound, this proved to be a challenge. Often there are no official village names and no formal system of community self-administration is in place. The name of the community often depends on the situation and who is asking (someone from a neighboring village, someone from the provin-cial center, someone from Kabul). Villages may be named after an influential person and may change when the name-sponsoring patron leaves. Some villages take a new name after a signifi-cant incident, for example a landslide. Furthermore it is often unclear which administrative or territorial unit a certain name refers to: for example, the water-using community of a village can differ from the land-owning community, and the community council may only represent a portion of the village households. The fact that names and borders of communities are fluid does not, however, mean that communities as functional units are undefined or weak. Of the 80 communities surveyed, 59 were (locally) clearly defined political and social units with rep-resentative institutions. The remaining communities, while lacking a body of collective repre-sentation, had no problem indicating agreed borders of their village to the external researchers. Hence, the GPS coordinates of the village were recorded (in terms of settlement, not agricul-tural land belonging to village and households!), along with names, alternative names, former names collected, and the village’s various bodies of political representation.
Second, the profiles established basic demographic data, which unfortunately is not readily available. In this context it should be noted that Afghans in rural areas have, over the course of the century, repeatedly resisted attempts by the central government to collect census data. Of-ten enumerators had to interview village functionaries capable of reading and writing and ask them for data. A good starting point was usually the headmaster of the school, the mullah, or a medical professional. The profiles contain data on numbers of households, numbers of fami-lies, ethnic composition, migrants, and returned internally displaced persons (IDPs).
Third, the profiles collect data on resource endowment and infrastructure. For example, we col-lected data on access to irrigated land and to pasture, on schools, on health care institutions and energy supply within or near the community, and on access to markets.
Fourth, the profiles collect data on aid input. Specifically, we asked enumerators to compile a list of development projects in which the community has participated over the past two years. Aid input is the main independent variable for this research, and we collect and use data from as many different sources as possible. This is because answers to these questions are likely to be given with a hidden strategic agenda. A community that reports a high level of aid input may receive less aid in the next round; hence, interlocutors tend to understate the real levels of received aid. For example, in the village of Chumchugjar, interlocutors initially stated that that
Assessing the Impact of Development Cooperation in Northeast Afghanistan | 20
they received nothing over the past two years, but with a little insistence and looking around we could then identify seven projects, the highest score for any village surveyed.
Fifth, the village profiles collect information on the socio-political organization of the commu-nity (communal governance). Specifically we asked about the village’s leadership, about military commanders, and whether there was a traditional shura or a community development council (the so-called “development shura”).
Finally, we asked about recent migration patterns that may have affected the community, about displaced persons that had returned after 2001. We also asked about violent conflicts that af-fected the community.
In addition to the village profile, we asked standardized questions on major events and changes over the past two generations (a period of 40 years, covering the transition from the ancient regime of Sahir Shah through the various modernization attempts of first Daud Khan, then the socialist governments and Soviet occupation to civil war, Taliban rule, and the present interven-tion). These questions add historical depth to the community profiles. A community history consists of 14 questions, which capture trends in the political, economic, and social organiza-tion of the village. Major violent incidents and cases of conflict are also recorded. This allows us to identify changes in agricultural production, trade patterns, off-farm economic opportunities, migration patterns, and political affiliation of the community.
In 2009 we used the village histories to follow up on specific trends and patterns we identified in the analysis of the 2007 histories and ethnographic probes (for the probes, see qualitative case studies below). These questions are concerned with patterns of governance over time, the role of the state over time, informal taxation and the role of commanders, ethnic division of labor, and the general economic wellbeing in chronological comparison.
We also collected similar data on the sub-district (mantaqa) and district levels. The mantaqa and district profile questionnaires are also provided in the appendix.
3.3 Quarterly reports
The quarterly reports are semi-structured reports, to be filled in by local correspondents four times per year. The correspondents were trained during a week-long workshop in Kabul. These reports cover 40 out of 80 communities (full coverage would have been desirable, but not fea-sible given the logistical difficulties and the budget constraints).
The quarterly reports record major events and significant changes that affect the dependent variables but that are not captured in village profiles and surveys, such as major new develop-ment initiatives, outbreaks of violence, natural disasters, etc. While the surveys and profiles pro-vide “snapshots” of a given situation at a given time, the quarterly reports provide information on change. They allow us to trace processes. They serve as a source to construct time series on
SFB-Governance Working Paper Series • No. 43 • February 2013 | 21
specific variables relating to security, development, and state presence in terms of services (e.g., employment, education, protection, conflict resolution) and demands (e.g., taxation, reforms, recruitment). The quarterly reports are designed to trace processes of institutionalization and de-institutionalization over time.
The standardized questions focus on political leadership in the communities; conflicts within the communities; violent conflicts affecting the communities; threats and developments that affect the security situation of the communities; relations between the community and state of-ficials and institutions, especially instances of compliance and non-compliance with state rules; and new projects and new aid flows that affect the community.
3.4 Qualitative case studies
A fourth method of data collection takes place through qualitative case studies. For many com-plex social situations, it is true that valid information is not easily obtained via standardized questionnaires. Often, more subtle qualitative methods are required to understand what drives social change: the incentives of actors, the rules and institutions informing the strategies of ac-tors, and possible causal links to political, social, and economic framework conditions. This ap-proach is, however, more time-consuming than collecting quantitative data via questionnaire.
We conducted a series of qualitative studies in order to gain in-depth understanding of key units of analysis – above all the village communities, but also specific development instruments and district as well as provincial governance. Special attention was given to cases that illustrated specific issues with regard to the key variables of security, state penetration, and development.
Most importantly, each village community is treated as a specific case. We compiled case-spe-cific information from the survey, the profiles and histories, and the quarterlies on each village.
In addition, 40 of the 80 villages were visited by local and external researchers to conduct eth-nographical probes into more delicate questions of local governance and conflicts within the community. These interviews were conducted with a small group of key informants in each village. The interviewers took the village histories as a starting point of conversation and de-veloped their questions on the contemporary situation from there. In most cases, this method justified itself as an ice-breaker because people, particularly in difficult security and governance contexts, tend to speak more openly about past conflicts and political issues that about contem-porary issues. The information gained through the discussion of a village’s recent history can then be used to trace issues that will most remain important at present.
Finally, information gathered from secondary sources (see below) was also compiled for each community case study. Geo-referencing and GIS coding of external information, specifically regarding security incidents and development activities, was used to determine whether these factors affected the target villages with reasonable likelihood. In the process of constructing
Assessing the Impact of Development Cooperation in Northeast Afghanistan | 22
a case study for each community, the data from each of the different sources had been cross-checked.
The information obtained and compiled on each village was also used to guide and fine-tune the quarterly reporting by the local teams. Information needs and contradictions between data-sets were communicated to the teams, and the teams were asked to clarify the questions during the next round of data collection.
Finally, two rounds of field visits were organized and conducted by a team of local and external researchers to visit a selection of communities and trace particularly interesting cases/stories with key informants. In some cases in 2009, these interviews had to be conducted outside of the respective villages, owing to security concerns communicated by the informant to the research-ers (Lala Maidan in Aliabad is one such example).
As a result, we produced community case studies of varying depth. 80 communities are covered by two profiles, a community history, and a follow up. All of them are georeferenced, and sec-ondary source data has been used for analysis. 79 of the communities have been surveyed. The quarterly reports and the ethnographic probes covered 40 communities. Specific field visits and interviews were conducted in 2007 and 2009 in about 30 communities.
The resulting cross-checked and cross-referenced datasets for 2007 and 2009 are used to arrive at aggregated indicators for a number of key variables for each community: security, develop-ment, local governance, resource endowment, state penetration, and conflict processing. This method contributes to an analysis of relevant change in dependent key variables over time. It helps to crosscheck the results of the statistical analysis of causality and change.
3.5 Secondary sources
Finally, we complement our data by mining existing sources of data collection, such as CiMiC village profiles, EON Baseline Survey 2006, ISAF ACSP (Afghanistan Country Stability Picture) as of June 2007, NRVA 2003–05 (National Risk & Vulnerability Assessment), UNAMA “Who does what where” development input mapping North-East (database updated only until 2005), and other, classified sources. The focus is on socio-economic data that complements our own survey data, as well as security related incidents and aid input. In order to ascribe secondary data to our selected communities, it is necessary to be able to identify the exact geographical position to which the data refers. In other words, data from secondary sources must be matched to one of the communities within our sample. Often, this is not possible. In other cases it is feasible, but the process is extremely time consuming. However, a lot of valuable data is being collected, and it is worth the major effort to collate this data, when feasible, in a common database.
SFB-Governance Working Paper Series • No. 43 • February 2013 | 23
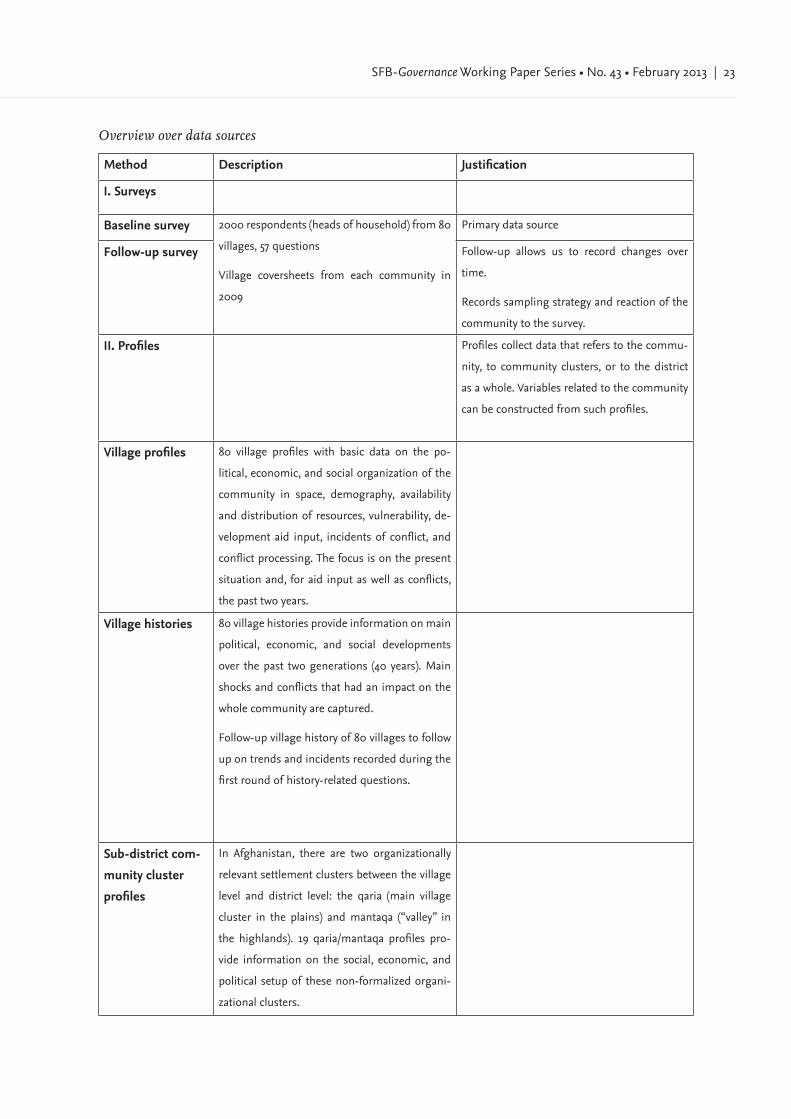
Overview over data sources
Method Description Justification
I. Surveys
Baseline survey 2000 respondents (heads of household) from 80
villages, 57 questions
Village coversheets from each community in
2009
Primary data source
Follow-up survey Follow-up allows us to record changes over
time.
Records sampling strategy and reaction of the
community to the survey.
II. Profiles Profiles collect data that refers to the commu-
nity, to community clusters, or to the district
as a whole. Variables related to the community
can be constructed from such profiles.
Village profiles 80 village profiles with basic data on the po-
litical, economic, and social organization of the
community in space, demography, availability
and distribution of resources, vulnerability, de-
velopment aid input, incidents of conflict, and
conflict processing. The focus is on the present
situation and, for aid input as well as conflicts,
the past two years.
Village histories 80 village histories provide information on main
political, economic, and social developments
over the past two generations (40 years). Main
shocks and conflicts that had an impact on the
whole community are captured.
Follow-up village history of 80 villages to follow
up on trends and incidents recorded during the
first round of history-related questions.
Sub-district com-
munity cluster
profiles
In Afghanistan, there are two organizationally
relevant settlement clusters between the village
level and district level: the qaria (main village
cluster in the plains) and mantaqa (“valley” in
the highlands). 19 qaria/mantaqa profiles pro-
vide information on the social, economic, and
political setup of these non-formalized organi-
zational clusters.
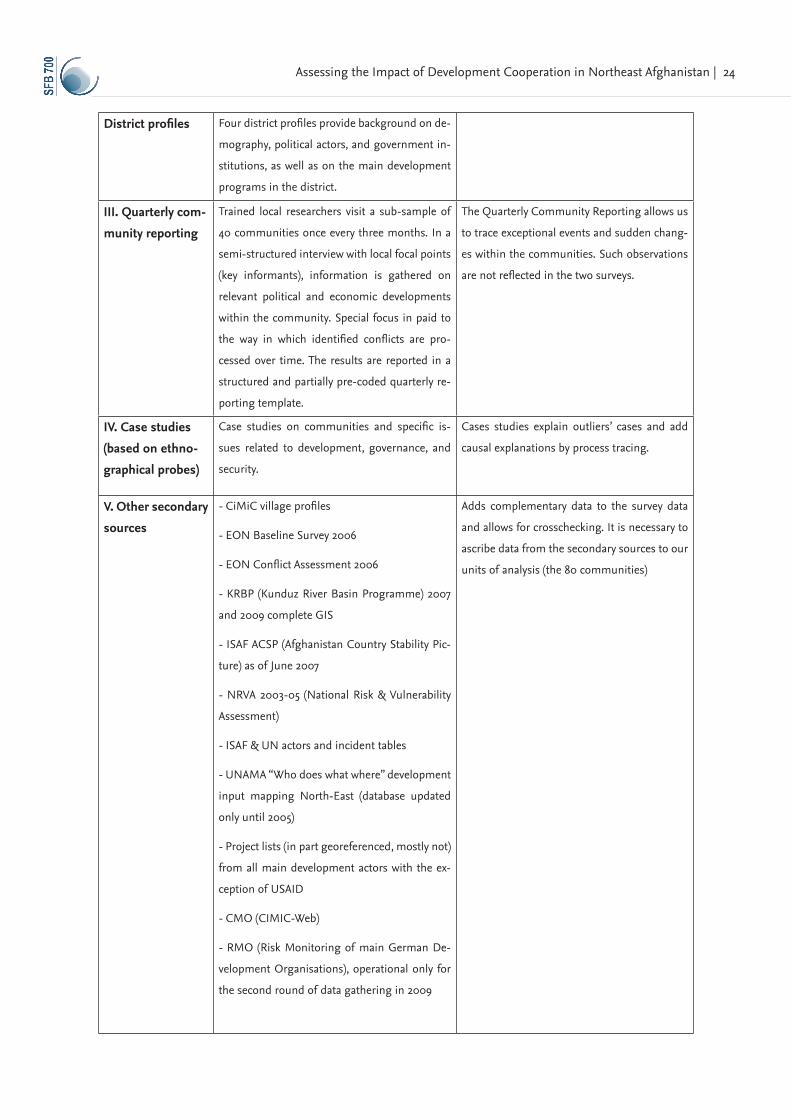
Assessing the Impact of Development Cooperation in Northeast Afghanistan | 24
District profiles Four district profiles provide background on de-
mography, political actors, and government in-
stitutions, as well as on the main development
programs in the district.
III. Quarterly com-
munity reporting
Trained local researchers visit a sub-sample of
40 communities once every three months. In a
semi-structured interview with local focal points
(key informants), information is gathered on
relevant political and economic developments
within the community. Special focus in paid to
the way in which identified conflicts are pro-
cessed over time. The results are reported in a
structured and partially pre-coded quarterly re-
porting template.
The Quarterly Community Reporting allows us
to trace exceptional events and sudden chang-
es within the communities. Such observations
are not reflected in the two surveys.
IV. Case studies
(based on ethno-
graphical probes)
Case studies on communities and specific is-
sues related to development, governance, and
security.
Cases studies explain outliers’ cases and add
causal explanations by process tracing.
V. Other secondary
sources
- CiMiC village profiles
- EON Baseline Survey 2006
- EON Conflict Assessment 2006
- KRBP (Kunduz River Basin Programme) 2007
and 2009 complete GIS
- ISAF ACSP (Afghanistan Country Stability Pic-
ture) as of June 2007
- NRVA 2003-05 (National Risk & Vulnerability
Assessment)
- ISAF & UN actors and incident tables
- UNAMA “Who does what where” development
input mapping North-East (database updated
only until 2005)
- Project lists (in part georeferenced, mostly not)
from all main development actors with the ex-
ception of USAID
- CMO (CIMIC-Web)
- RMO (Risk Monitoring of main German De-
velopment Organisations), operational only for
the second round of data gathering in 2009
Adds complementary data to the survey data
and allows for crosschecking. It is necessary to
ascribe data from the secondary sources to our
units of analysis (the 80 communities)
SFB-Governance Working Paper Series • No. 43 • February 2013 | 25
4. Analysis: Explaining change
4.1 Inferring causality
The objective of this research is to assess the impact of development aid. Put differently, we want to find out whether development aid or other factors have caused the changes that we are interested in. Hence, we are interested in causality. Causality or causation is usually defined as the relationship between one event (the cause) and another event (the effect), which is the con-sequence (result) of the first.
The “gold standard” for causation is the randomized experiment (cf. OECD 2012): take a large number of communities, randomly divide them into two groups, provide one group with de-velopment aid and prohibit the other group from receiving aid, then determine whether one group shows the effects that development aid was thought to produce.
However, it is hardly possible to perform this type of experiment in most contexts. It may be neither ethical nor politically wise to deny one group of communities development aid. And, in most case, communities differ from each other and are exposed to different external factors; hence, one precondition of the experiment – that units of analysis must be alike – is hardly ever met. With regard to our sample, the 80 communities in Northeast Afghanistan, there is no clear-cut divide between communities that have received aid projects and those that have not. In fact, the overwhelming majority of communities have received some aid, although the mix of projects differed.7 No community received zero aid. Furthermore, communities do differ with regard to many factors. Thus, the natural experiment could not be performed.
However, the basic logic of how to infer causality still applies: Assessing the impact of an in-tervention on its environment requires, first, that we observe changes, and second, that we can plausibly attribute these changes to the intervention whose impact we are investigating. It fol-lows that we must define a strategy that allows us to monitor changes over time and to insulate the causal factors we are interested in from other possible factors. Research strategies therefore rely on two types of comparison: the first compares changes over time; the second compares a treatment group (a group that benefits from an intervention) with a control group (a group that did not benefit from the intervention). However, even if our findings correspond to our expectations, we still cannot be sure that these changes are indeed attributable to development
7 When we use the expert-based measures, we find the following picture: With regard to aid modality, we found that three villages received a project related to organizational
development; ten villages received one or more capacity-building projects; 19 villages received direct aid, and 60 villages received one or more infrastructure projects.
When we looked at the sectors, we found that one village received projects related to building gov-ernment capacity; three villages received one project with an impact on the health sector; six villages received one project with an impact on sustainable economical development; ten villages received projects with an impact on the educational sector; 15 villages received one project with an impact on the electricity sector; 22 villages received projects with an impact on rural development; 28 villages received projects with an impact on roads and bridges; and 34 villages received projects with an impact on the water and sanitation sector.
Assessing the Impact of Development Cooperation in Northeast Afghanistan | 26
aid. Hence, a sound research strategy requires that we find a way to ensure that other factors that may have caused the observed changes are similar (“hold constant”) for both groups. For example, communities within both groups should have similar access to land, be located in similar climatic regions, and have similar access to off-farm sources of income. They should, ideally, only differ with regard to the one development project that benefited one group, but not the other.
To sum up, inferring causality requires that we trace changes over time, that we can define a treatment group and a control group, and that other factors are similar (“hold constant”) for both groups. In reality, these conditions are hardly ever met. Hence, there is a need for auxiliary strategies.
4.2 Triangulation: Qualitative, quantitative, and GIS
For complex research it is often advisable to rely on more than one method. In the social sci-ences, the term triangulation is used to indicate the application of more than one method in a study that aims to double- (or triple-)check its results. This is also called “cross-examination.” The idea is that a researcher can be more confident in a result if different methods lead to the same result.
For this research, we use a variety of methods, as we briefly mentioned already in the discus-sion of our data mining strategy. It should be noted, however, that for all methods, the basic underlying logic requirements of how to infer causality remain the same. Whatever method the researcher chooses, inferring causality will always require that changes over time can be related to certain characteristics displayed by units of analysis. Also, all methods require that the researcher defines the concepts he or she is interested in and then defines measurements for these concepts. This process is called operationalization.
Our first method is to conduct qualitative case studies. As we have argued above, in many com-plex social situations, valid information is not easily obtained via standardized questionnaires. Often more subtle qualitative methods are required to understand the incentives of actors, rules, and the institutions informing their strategies, as well as possible causal links to political, social, and economic framework conditions. This approach is, however, more time-consum-ing than collecting quantitative data by questionnaire. Well-crafted case studies can be used for comparative purposes, but they are also useful in tracing specific processes. The general method of process tracing is to generate and analyze data on the causal mechanisms, meaning processes, events, actions, expectations, and other intervening variables that link putative causes to observed effects. Process tracing assesses causal mechanisms rather that causal effects. In process tracing, the researcher investigates whether the causal process that a theory hypoth-esizes is in fact evident in the sequence and values of the intervening variables. The process tracing method attempts to identify the intervening causal process – the causal chain and causal mechanism – between an independent variable and an outcome (dependent variable).
SFB-Governance Working Paper Series • No. 43 • February 2013 | 27
Second, we rely on statistical techniques in order to identify general patterns; one technique that we use is regression analysis. The general purpose of regression analysis is to learn more about the relationship between several independent or predictor variables and a dependent variable. These “multiple” regression models provide the possibility to investigate the amount of variance shared between each of the independent variables and the specific dependent vari-able. Meanwhile, all other independent variables are held constant, which is often meant by the notion of “controlling” for the other independent variables. This means that the results of a regression analysis present the partial correlation between one of the independent variables and the dependent variable (henceforth the “two focal variables”). This principle remains the same regardless of the type of regression model applied (OLS, binominal logistic, ordinal pro-bit); only the specific interpretation of the results depends on the model. For example, while non-standardized coefficients in the OLS model can be interpreted as the change in score units in the dependent variable, the coefficients in the binomial logistic model are interpreted as changes in the odds for the target category of the dependent variable.
Using regression models, it is therefore possible to statistically disentangle complex patterns of correlations between sets of variables. If these variables are also measured at different points in time, it is possible to test for basic conditions of causality: correlation with time-order and non-spuriousness. As stated above, regression models identify partial correlations between the two focal variables, which means that assuming all relevant variables were entered into the model, the correlation reflects the pure association between these variables. Additionally, when con-founding variables that measure possible alternative explanations are entered into the model, it is possible to rule out their influence on the correlation between the two focal variables: after entering the additional variables as independent variables (i.e., “controlling” for them), the cor-relation between the two focal variables does (or does not) still exist. This provides evidence that the correlation between the focal variables did not (or did) result from the other independent variables. This way, the association can be tested for spuriousness. And lastly, when a correlation between the focal variables still exists after entering other control variables, and the indepen-dent variable of the pair was measured before the dependent variable, this provides evidence for a causal relationship between the two.
This type of analysis obviously relies on the measurement of the variables. We need to define valid measurements for all of the concepts that we intend to use in the analysis. We describe all measurements below, in the section “Measuring Aid” and “Operationalization.”
Third, other methods may be used in order to better understand the results. For this study, we also used a GIS-based analysis. GIS (geographic information system) is a system for capturing, storing, analyzing, and managing data and associated attributes that are spatially referenced. GIS is a tool that allows users to relate data to a specific geographic location.
In this study we use GIS for a number of purposes. First, we transfer GPS data and informa-tion from participatory mapping exercises at the village level into GIS in order to establish the most credible location and area of our target villages. Second, we relate information on security
Assessing the Impact of Development Cooperation in Northeast Afghanistan | 28
incidents and development activities to the target communities. Third, we visualize important characteristics of the communities for analysis (e.g., the ethnic composition of communities, development input, threat perception, and Western value indices).
4.3 Measuring aid
Every research strategy requires that we define valid measurements for all concepts that we in-tend to measure. For some concepts, this is a straightforward process. For example, the size of a village can be measured by the number of people living there. For other concepts, finding a valid measurement is much more difficult and requires recourse to theoretical reasoning. “Aid” is one such concept.
There are different ways of measuring development aid, and none is perfect. One way is to simply take the money spent on development as a measure of aid. There are several problems with this option. For one, it is very difficult to get accurate budget data from all development agencies active in a given region. Furthermore, most budgets of development agencies do not break down figures to the district or community level. Finally, different agencies may have very different overheads costs: for example, agency A spends 1000 USD on community A, and agency B spends 1000 USD on community B, but it may be that community A receives a net value of 600 USD, and community B only 300 USD, due to higher transaction costs in agency B. These differences in overhead costs distort data unless there was a way to correct for this distortion.
Another, alternative way is to measure development aid where it is actually received. This is lo-gistically much more demanding, since it requires that one actually count projects at the com-munal level, but it has the advantage that aid is directly attributable to our units of analysis. For this research report, we decided to measure development aid at the receiving end.
But the number of projects implemented within or near a given community is only one aspect of aid. It tells us something about the frequency of aid projects, but little about the utility of a given aid project to the community. Since we intend to capture the actual distribution of aid and the perceived usefulness of aid, we employ different measures of aid. The first (Number of Projects) is based on the number of projects that a community received. Information on aid projects was collected from various aid organizations and from the village profiles. The aid projects were then georeferenced and fed into a GIS database.
We also use two perception-based measures of aid that reflect the perception of respondents with regard to how much the household or community, in a given sector, profited from aid projects.
The first of these (Direct Aid) captures whether individual households, rather than the com-munity as a whole, directly benefited from household-level development projects (for example, food aid, training or advice, salary, rents).
SFB-Governance Working Paper Series • No. 43 • February 2013 | 29
The second subjective measure (Aid Class) seeks to capture the type and the utility of aid to the community, according to respondents’ perception. Data exploration revealed that communities received quite different mixes of development aid. For example, in 2007, 5.9% of the communi-ties received food aid (but 112 of 120 cases (households) in Warsaj); 5.5% benefitted from train-ing/advice/capacity-building (50 cases in Aliabad; 2 in Imam Sahib; 28 in Taloqan; 32 in Warsaj); 46.5% of communities profited from schooling projects; 14.2% from electricity (but 269 of 289 cases in Warsaj); 65.9% from projects related to roads and bridges; 2.5% from projects aimed at creating jobs. 16% received projects in agricultural extension services; 65.9% reported having received projects related to drinking water, and 24.1% related to irrigation (mostly in Imam Sahib). There are regional patterns: Food aid, electricity, and jobs were predominately found in Warsaj, whereas irrigation projects are predominately found outside Warsaj. Training and advice is underrepresented in Imam Sahib. All other variables seem to be free of severe regional accumulation.
Although these questions measure the perception of aid projects, it is still problematic to use these variables in a regression analysis. The answers cannot be added up to one score (mea-suring a range from “no aid” to “aid in all sectors”) because this would mean either dropping respondents from the analysis who did not remember some types of projects (or refused to answer the question) or imputing their values with statistical methods that again rely on as-sumptions that are fallible. Entering each of the variables as a predictor in the regression (to estimate the specific effects of every aid sector) would mean, on the one hand, including many predictors only for this concept, and on the other hand not investigating interaction effects (i.e., additive effects of different types of aid sectors as well as effects of the combinations of aid sec-tors) because, as presented above, in regression only partial correlations can be estimated. One could use interaction effects between the aid sectors to investigate the effects of combinations, but this would increase the number of predictors even further. Therefore, we decided to use a Latent Class Analysis to explore mixtures of the aid sectors remembered by our respondents.
Latent Class Analysis (LCA) is a statistical tool to explore data for mixtures in categorical data. LCA has the advantage over factor and cluster analysis that no scaling properties have to be assumed. LCA estimates different classes of units of analysis that can be characterized by a com-mon pattern of category probabilities. The easiest case is the so-called “one class solution” that corresponds to the usual sample-mean-based analytic methods. In this solution, it is assumed that all units of analysis stem from the same distribution. In most cases this mean-based solu-tion does not yield the most accurate description of the data. In LCA solutions with an ascend-ing number of classes, class affiliations are estimated and their fit to the data is evaluated via the probability that the estimated model actually produced the data (so-called “likelihood”). This fit is compared to the number of parameters needed to estimate this solution. The solution that indicates the best fit with the fewest possible parameters is the number of classes to be used to describe the data most effectively. For this analysis we used the BIC. These Aid Classes can be seen as the relevant combinations of remembered aid sectors.
Assessing the Impact of Development Cooperation in Northeast Afghanistan | 30
We entered the respondents’ answers from both waves into the LCA. This makes it possible to identify patterns that can be used to describe mixtures in both waves. If one pattern is irrelevant in one wave, the contingency table between the aid class of the responses and the variable for that wave would show that no (or nearly no) responses were present in this class at one point in time. Using LCA on the respondents’ answers for both waves revealed six classes, reflecting the mix of projects from which the communities benefited from 2005–2007, according to respon-dents’ perceptions (the category probabilities are given in the appendix).
Class 1 (5.1%; n = 214): Schooling and irrigation
Respondents in the first class report an aid mix that is mostly characterized by schooling and irrigation projects. Compared to the general trend, respondents in this class rarely report proj-ects from the sectors “roads and bridges” or “drinking water.”
Class 2 (9.0%; n = 377): Medium coverage across all sectors
Respondents in this class report having received projects across all sectors. In line with the gen-eral trend, most projects reported were in the sectors of “roads and bridges,” “drinking water,” and “schooling.” The number of reported projects in other sectors is in line with the general trend, or slightly above, which leads us to label this class “medium coverage on all sectors.”
Class 3 (21.4%; n = 891): Infrastructure with electricity
Respondents in this class report projects in the sectors “road and bridges,” “drinking water,” “schooling,” and “electricity.” While the first two sectors show lower probabilities than the gen-eral trend, the latter two show higher probabilities. This class is very similar to Class 5, but has fewer irrigation projects and more electricity projects. We label this aid mix “Infrastructure with electricity.”
Class 4 (35.4%; n = 1476): Low coverage
Respondents in this class recall fewer projects than respondents in other classes. Respondents remember some projects in the sectors of “roads and bridges,” “schooling,” and “drinking wa-ter,” but clearly below the general trend. For all other sectors, respondents recall very few proj-ects. We label this class “Low coverage.”
Class 5 (28.3%; n = 1181): Infrastructure with irrigation
Respondents in this class recall projects in the sectors “roads and bridges,” “drinking water,” “schooling,” and “irrigation,” with a higher probability than the mean trend suggests. The prob-ability of recalling projects in the other sectors is lower. The pattern is comparable to that of class three, but the general level of remembered projects is somewhat higher, and in this class nearly no electricity projects were remembered.
SFB-Governance Working Paper Series • No. 43 • February 2013 | 31
Class 6 (0.6%; n = 27): Don’t know
The sixth class is characterized by a clear pattern of “don’t know” responses on all sectors. Only 27 respondents belonged to this class; hence, we exclude this class from further analysis.
The five Aid Classes were effect-coded with a dummy for each class except for the fourth. Since this was the class with the lowest coverage compared to all other classes, the interpretation of regression coefficients for the dummies for the other classes is straightforward: Receiving the specific mix of aid of this class and (in essence) more than in the low-coverage class, has the ef-fect XY on the dependent variable (Aid Class 1–Aid Class 5).
4.4 Operationalization
This section describes how we measured the variables used in the statistical analysis.
Independent variable: Aid
As reported above, we used different measurements for aid. The first (Number of Projects) is based on the number of projects that a community received. Using data from development organiza-tions in the region and data collected during field visits to the communities, we compiled a list of georeferenced development projects and attributed them to the communities in the sample. This variable was constructed twice: once for the aid projects between 2005 and 2007, and a sec-ond time for aid projects between 2007 and 2009.
We also use two perception-based measures of aid that reflect the perception of respondents in relation to how much the household or community, in a given sector, profited from aid proj-ects. The first (Direct Aid) captures whether individual households, rather than the community as a whole, said that they directly benefited from household-level development projects (for example food aid, training or advice, salary, rents) during the preceding two years.8 The answers were summed for every individual yielding a score representing the number of sectors in which respondents remembered receiving direct help. Based on the answers we constructed a score, coding 0 when no help was received by the individual household, 1 if projects in one sector were received, and 2 if projects in two or more sectors were received.
The second subjective measure (Aid Class 1–5) is a dummy variable, denoting membership in one of the five aid classes except for the fourth (see above).
Additionally, since fewer than 3% of the respondents in both waves were able to remember any projects in the community that created jobs, this variable was not used in the LCA (see above).
8 For the household, the sectors were: food aid, training/advice, salary/rent, credit, and others. For the community: food aid, training/advice, schooling, electricity supply, job, agricultural extension services, roads and bridges, drinking water, irrigation.
Assessing the Impact of Development Cooperation in Northeast Afghanistan | 32
Since we did not want to lose that information, this was the only aid variable that was entered as a single dummy.
Dependent variables: Attitudes, state legitimacy, threat perceptions
Attitudes toward the activities of the interveners are proxied by an index calculated using answers to six value statements about respondents’ perceptions of state schooling for boys and girls, wage labor for women and men, and the presence of civilian and military actors.9 Principal Compo-nent Analysis showed that the first component extracts 39.84% of the variance in the answers. The measure of internal consistency is Cronbach-α = 0.67. The scale ranges from 0–10, 10 being the most positive attitudes.
Attitudes toward foreign forces are proxied by an index (0–10) based on answers to the question, “How afraid are you of the following groups – Foreign Forces” (Q12) and the rating of “The presence of foreign troops is threatening local customs and Islamic values in our community.” Again, higher values represent a more affirmative rating.
We proxy state legitimacy by satisfaction with government as measured by the rating of the per-formance of district governments (Q54). Respondents were asked to rate to what extent the district government took care of the needs of the communities. Hence, this is a strictly output-oriented measure for legitimacy that assesses the state’s capacity as a service provider. While we acknowledge that this variable does not capture more subtle procedural-based concepts of legitimacy, we maintain that, in conflict zones, the state’s legitimacy first and foremost depends on its ability to provide basic public services.
Threat perceptions of respondents are based on their membership in threat classes. In order to identify these classes, we used a procedure similar to the one we used for the aid classes. We asked respondents to indicate which actors were threatening to them: Please indicate, if you are afraid of the following groups: 1 = not afraid, 2 = somewhat afraid, 3 = very afraid. (“Refused to answer” and “Don’t know” were also response categories). Respondents could choose from a list of eight ac-tors: criminal groups, external militias, Taliban, local militias (these are militias that typically recruit from communities with which the respondents are familiar), foreign forces, district po-lice, Afghan central security forces, and Afghan provincial and district security forces. In order
9 The statements are:1) Education of boys in schools has a positive impact on our community. The state should therefore
improve the availability of schooling for boys in our community.2) Education of girls in schools has a positive impact on our community. The state should therefore
improve the availability of schooling for girls in our community.3) Wage labor is becoming more and more important for the financial well-being of households. It
would be good for the community if off-farm job opportunities would increase for both men and women.
4) State schooling is complementary to local customs and Islamic values. I think it has a positive impact on the moral constitution of the community.
5) I feel that foreign development aid is threatening our local way of life and Islamic values in our community, although it may bring material benefits.
6) The presence of foreign troops is threatening local customs and Islamic values in our community.
SFB-Governance Working Paper Series • No. 43 • February 2013 | 33
to obtain a clearer picture of who is afraid of whom and how much, we ran a latent class analysis again.10 The analysis identified five classes, each of which correspond to a distinct threat profile. Again, respondents from both waves were entered in order to identify meaningful clusters over the full time range (for other details on why and how the analysis was carried out, please see above on remembered aid projects at the community level).
Class 1: Refused to answer/Threats from non-state armed actors (3.2% / n = 134)
Respondents in this class perceive no threats from Afghan forces and foreign forces. They tend to feel threatened by non-state armed actors (Taliban, criminal gangs, and militias), but with a very high probability, they refuse to answer this question. Members of class 1 (size: 3.22% / n = 134) show a very high probability of refusing to state whether they feel threatened by non-state groups such as Taliban, criminals, and militias. In the subsequent analysis, this class is not in-cluded.11
Class 2: Medium perceived threat level from all non-state armed actors (12.1%; n = 504)
Members of the second class indicate that they almost never feel afraid of the Afghan military forces (both reaching nearly 100% in the category “not afraid”). For all other groups, category 2 “somewhat afraid” is a prominent answer; in comparison to the other classes identified, respon-dents in this class are labeled as perceiving a medium threat level from all groups other than the Afghan military forces.
Class 3: Threatened by all groups (5.7%; n = 237)
Members of this class feel threatened by all groups. Most members of this class are “somewhat afraid” or very threatened by foreign forces, external armed men, Taliban, and criminal groups. They are also likely to feel somewhat threatened by Afghan forces.
Class 4: No threat (53.5%; n = 2226)
Members of this class in general do not feel threatened.
10 The analysis is (as for the aid projects at the community level) again based on the 2007 and 2009 re-spondents; that is, we ran an LCA on the overall sample of 4166 respondents.
11 A high refusal rate may be caused by fear of disclosing one’s real views or by a peculiar coding behav-ior of the interviewer. We found that this class was only present in 2009. Members of this class were found in only 16 villages, 15 of which are in Taloquan. Furthermore, results seem to be contingent on the coding behavior of one specific interviewer. In 12 of these villages, the majority of respondents belonged to class 5 (highly threatened by non-state actors). Furthermore, members of class 1 do not seem to belong predominately to one ethnic group, nor is there any other observed association with a single factor that may make this group distinct. We therefore reassigned 128 members of class 1 to class 5, and 6 members, based on their membership probability, to class 4. For further analysis, we use only four classes.
Assessing the Impact of Development Cooperation in Northeast Afghanistan | 34
Class 5: Highly threatened by non-state armed actors (25.6%; n = 1064)
Members of this class feel clearly threatened by non-state armed actors (Taliban, criminals, and militias).
Control variables
We created several variables that proxy various characteristics of the households and commu-nities that may have an impact on the dependent variables. These might cause either spurious correlations (see above on regression analysis) or, especially in the case of village characteristics and the districts, are broad categories that can capture various other influences that might ex-plain the correlation between two focal variables.
We created variables for the ethnic affiliation (Pashtu, Uzbek, Tajik, other) of the respondents. Some scholars argue that attitudes toward foreign presence differ between ethnic groups, and that especially among Pashtu, mistrust towards the international interveners may be greater that among minority groups. Creating indicator variables for ethnicity with “Pashtu” as the reference category allows us to test this assumption.
To control for a household’s material well-being, we asked the respondents to indicate whether it was hard for them to buy even simple food products, whether they could spend money on clothes and social obligations, or whether they could buy luxury goods or even anything they wanted (Material Well-Being). Based on this, we created an index that reflects the self-reported material situation of the household.
Several characteristics of the villages were coded and entered into the analysis. One aspect that should be checked is whether the villages are generally similar enough in terms of (pre-)treat-ment variables so that comparisons between them are reasonable. One way to check for this is to assess whether villages’ characteristics stem from one multivariate normal distribution. Since no satisfying test for this hypothesis exists, it could be done by checking whether the cases are grouped close to a multivariate mean. In this case, multivariate refers to the (pre-)treatment variables in terms of which the villages should be similar in order to rule out pre-treatment differences as possible alternative explanations.
We used the Mahalanobis distance of the villages to assess this aspect of our data. The Mahala-nobis distance is a measure of how far a single case (here, a village) deviates from a multivariate mean value (i.e., “centroid”). A multivariate mean value can be imagined most easily for the case of two variables. Plotting cases on two variables means producing a scatterplot that shows the joint distribution of cases for these two variables. The bivariate mean or centroid would be the joint mean of both distributions, or graphically the center of mass of the scatterplot. For our villages, the multivariate mean of the district dummies (leaving Warsaj as a reference category), objective Aid in both 2007 and 2009, size, periphery, and vulnerability were used as indicators to estimate the Mahalanobis distances. Since these variables all have very different ranges (see
SFB-Governance Working Paper Series • No. 43 • February 2013 | 35
below), which would influence the overall mean, therefore, they were standardized (Mean = 0; SD = 1) before the calculation of the Mahalanobis distances.
The Mahalanobis distance has the advantage that it is χ²-distributed with the number of vari-ables used to estimate the distances as degrees of freedom. All cases that show higher distances than 26.12 (which is the χ² cut off for 99% at eight degrees of freedom) can be assumed to be multivariate outliers and therefore cases that cannot be matched (at least for the variables under consideration) to the other cases.
No villages fulfilled this criterion, with the highest two villages being A20 (Maha = 20.49) and W15 (Maha = 16.53). All in all, we can therefore say that the villages are comparable to each other – at least with regard to these structural variables.
Establishing that the villages are similar to each other is crucial because after the regression, the interpretation of the coefficients is as follows: “For a person in a village that received x projects in 2007 and y projects by 2009, the effect of variable z is β.” Clearly, it is closely related to the notion of matching. The analysis of the Mahalanobis distances revealed that the variables un-der consideration are more or less in the same range for all villages, so that effects found in the regression can be attributed to other factors than distribution of these variables in our sample.
We now provide a closer description of the village characteristics that were coded. We created a variable (Periphery) indicating whether a community was easy accessible or remotely located. One way of thinking about the impact of peripheral location is that the more remote a village is, the more cautious it may be toward the intervention. On the other hand, it could also be the case that remote villages are more in need of development aid and less exposed to propaganda efforts by anti-Western or anti-central government forces. Hence, we wanted to empirically in-vestigate whether peripheral location was a valid predictor.
Our survey team also coded the vulnerability of the villages (Vulnerability), indicating the degree to which a community is threatened by natural disasters,12 as well as a variable indicating the population size (Size) of the village.
We also used the districts as a control variable (Aliabad, Imam Sahib, Taloquan, and Warsaj, repre-sented by effect codings with Warsaj as the reference group). There was not one specific hypoth-esis that we expected to test with the district dummies. Rather, we took the district dummy as a black box for the combined effect of other, unobserved influences. If one or all district dum-mies were significant, as we expected to be the case, we could take this as a marker for an idio-syncratic combination of factors that is intrinsic to this given district and requires additional research. At the very least, significant district dummies signal that conditions differ across dis-tricts, hence development actors should study these differences and design policies accord-
12 The vulnerability score was assigned by our survey teams to each community. It is standard procedure for development work to assess a community’s vulnerability to natural disasters. Communities that were deemed prone to natural disasters (mainly mudslides) were coded as 1, other communities as 0.
Assessing the Impact of Development Cooperation in Northeast Afghanistan | 36
ingly. As presented above discussing the logic of the regression analysis, the district dummies capture a broad range of possible confounding factors that might cause spurious correlations between two focal variables.
We controlled for the respondents’ individual perceptions of the security situation by asking respondents to rate whether security, in their opinion, had increased or decreased during the last two years (Security Change).
4.5 The regression models
Equipped with the data, we can now run the regressions. We are interested in identifying the impact of aid on: (1) attitudes, (2) acceptance of foreign troops, (3) state legitimacy, and (4) per-ceived threats. For each of these four dependent variables, we created seven models with in-creasing complexity.
Cross-sectional models
We apply five cross-sectional models for the two periods of 2005–2007 and 2007–2009. In model 1, we only enter the measures for perceived aid. In model 2, we add our objective measure for aid (the number of projects). In model 3, we add various measures for the perceived changes in the security situation and for threat perceptions. Model 4 adds ethnicity and the material situation of the household. In model 5, we also control for size, location, and district of the community.
This procedure has two purposes. The first goal is to identify whether there are any correlations between aid and each dependent variable. Entering the perception-based measures of aid as well as objective measures of aid in the first two models answers the question of whether any correlations between aid and each dependent variable exist at all (the focal variables). Entering more and more control variables in each of the following models helps to identify whether—and if so, at which point—the correlation between the variables vanishes. If this happens, it provides evidence that these variables entered in this step are better candidates for either pre-dicting the dependent variable or explaining the previously observed correlation between mea-sures of aid and the dependent variable of that model (spuriousness; see above). A second goal of this analysis is to identify predictors that have a strong influence on the dependent variables, which can be identified by tests of significance of the predictors and changes in the measure of relevance (e.g., r²) for that model.
The cross-sectional/trend models
The cross-sectional models only present information on correlations within both survey waves. And while the criteria of correlation and spuriousness can be tested, no temporal order – and therefore no evidence for causal relationships – can be established. Therefore, we also con-structed two models that include the means of various variables measured in 2007 in order to estimate their effects on dependent variables in 2009. We did this for two reasons. First, these
SFB-Governance Working Paper Series • No. 43 • February 2013 | 37
models allow us to capture the lasting impact of structural characteristics and perceptions mea-sured in 2007 on our dependent variables in 2009. If one of the aggregated measures from 2007 is significantly correlated with the dependent variable while controlling for several other independent variables, a strong argument for time-ordered correlation and therefore possible causality, is established. Second, we were interested in finding out whether the characteristics measured in 2007 might explain the massive impact of the district variables on our dependent variables. Recall that we used the four different districts in order to capture the impact of unob-served external variables for which we cannot specifically control in our cross-sectional models. These were effect coded, meaning that three of the four districts were entered as dummies us-ing the last one as a reference category. In general, these district variables are significant and explain much of the variance in most models. So in model 6, we included all cross-sectional predictors from the 2009 data set, as well as estimated mean values for specific characteris-tics of the villages from 2007 (such as mean resource base or mean perceived state legitimacy, for example), but we dropped the district dummies. Therefore, we could use this model to observe whether any of our aggregated measures (e.g., mean resource base per village, mean remembered Aid Class per village) or structural variables assessed in 2007 (e.g., objective aid for 2005–2007) correlate with the dependent variables measured from the respondents in 2009. In model 7, we then add the variables for the districts. Variables that are significant in model 6, that are measured in 2007, and that are still significant in model 7 fulfill – at least on the level of regression analysis – the conditions of correlation, non-spuriousness (at least for this set of independent variables) and time-order. As expected, these variables are significant in most models. But we also find that they are highly correlated with some of the independent variables (represented by a resulting increase in the variance inflation factors, or VIF).
4.6 Findings
In this section, we will report the main findings of the statistical analysis. For a presentation and discussion of all results, see Böhnke et al. 2010.
Major trends 2007–2009
1) Development aid continues to reach the communitiesDevelopment aid, predominately small-scale, infrastructural aid, continues to reach commu-nities in Northeast Afghanistan. Compared to 2007, significantly more communities reported having benefited from development aid by 2009. As in 2007, a majority of respondents thought that international development actors contributed positively to the quality of roads, access to drinking water, and access to schooling. More households had access to piped drinking water and electricity. The disbursement of food aid had also increased. As in 2007, respondents did not think that jobs are being created.
2) The Afghan state is seen as contributing to the provision of basic goodsVery different from 2007, respondents in 2009 saw the Afghan state as also contributing to the provision of basic goods. In 2007, improvement in roads, schooling, water, and electricity were
Assessing the Impact of Development Cooperation in Northeast Afghanistan | 38
only attributed to development organizations; by 2009, the Afghan state was seen as contribut-ing at the same level as development organizations.
3) Development actors are met with more cautionDespite this continuing progress, Afghans in 2009 were more distrustful of development orga-nizations than they had been two years before. Around 40% thought that foreign development organizations were a threat to local and Islamic values.
4) Foreign forces are met with more cautionCompared to 2007, foreign forces were seen as considerably less helpful in increasing security in 2009. In 2007, almost 80% of respondents thought that foreign forces contributed to secu-rity; in 2009, this figure fell to 60.6%. Hence, the perceived usefulness of foreign forces rapidly decreased over the course of two years. Likewise, the percentage of respondents who felt threat-ened by foreign forces rose from 5% in 2007 to 30% in 2009.
5) Perception of threat is dramatically on the riseCompared to 2007, we noted a general and dramatic increase in threat perceptions by 2009: The percentage of those who did not feel threatened at all fell from 87.3% in 2007 to 21.12% in 2009. The percentage of those who felt highly threatened rose from 3.64% in 2007 to 46.46% in 2009. The highest reported threats in 2009 were perceived as coming from criminal groups, external militias, and the Taliban.
6) Households and communities still remain safeDespite the increase in threat perception, an overwhelming majority of respondents reported in 2009 that the physical security of households and communities remains intact.
The impact of aid
7) Aid positively influences attitudes toward the intervention mission…For 2005–2007, we find that development aid has a small but statistically significant impact on the general attitudes of respondents toward the intervention.
8) …but only in a secure environmentThis effect vanishes for the period 2007–2009, when threat perceptions are on the rise. In gen-eral, the acceptance of the intervention is predominantly driven by perceptions of security and threats.
9) Aid has a small and positive impact on people’s perceptions of the Afghan provincial and district govern-mentsBoth in 2007 and 2009, the perceived level of received aid has influenced the perceived legiti-macy of the Afghan government. Respondents who report having profited from development projects are more likely to think that the Afghan district and provincial governments are re-sponsive to the needs of the communities.
SFB-Governance Working Paper Series • No. 43 • February 2013 | 39
10) The positive effect of aid on attitudes and legitimacy is short-term and non-cumulativeThe small positive effects of aid on attitudes toward the intervention operation and on per-ceived responsiveness of the government are short-term and cannot be stockpiled: more posi-tive attitudes in 2007 did not cause more positive attitudes in 2009. This implies that accep-tance and legitimacy are not slowly accumulated, but rather need to be constantly earned.
11) Aid has no impact on how foreign forces are perceivedThe mostly small infrastructural aid projects, which were implemented widely across Northeast Afghanistan from 2005–2009, did not have an impact on attitudes toward foreign forces. Rather, respondents’ attitudes toward foreign forces were driven by how they rated their own security. 12) Aid has no effect on threat perceptionsMore aid does not reduce respondents’ perceptions of threat. We do not find evidence that development aid is positively, consistently, and significantly associated with the level of threat perception.
5. Difficulties and lessons learned
5.1 Logistical challenges
It is easy to underestimate the logistical challenges of a country like Afghanistan. Apart from the usual difficulties related to transportation and communication, we had to deal with villages that had no univocal official name, or that various names were used for the same village. Even after an extensive identification process, there were still 12 villages in the sample that used multiple names. About one third of the villages initially selected on maps and according to official village lists provided by the UN had to be changed or specified – some of them did not exist at all, oth-ers had a significantly different location. Some names referred to areas rather than individual villages.
Generally speaking, maps are rare and not up-to-date; we found that the Soviet military maps of the 1970s and 1980s at a scale of 1:50,000 were still the most detailed and reliable topographic references. NATO maps, based on the Russian maps, were worse in detail and less reliable. Until 2009, many agencies and international organizations were using maps with district and provincial divisions and boundaries that were already outdated by 2007 (the reason being that parliament had not ratified the new administrative division of Afghanistan until 2008; district administrations and responsibilities according to the new division had, however, already been in place long before ratification).
Hence, district and provincial borders were changing during our fieldwork from 2007–2009. As a result, one of the target villages was suddenly located outside our target provinces (Baghlan) and a number of villages were located in newly created or changed districts (Khanabad in Kun-duz and Baharak in Takhar).
Assessing the Impact of Development Cooperation in Northeast Afghanistan | 40
Information received from the administration was incomplete and at times simply wrong. The district administration in Imam Sahib, for instance, admitted readily that they had no idea how many people, families, or households resided in the district. It took the administration three days to comment on our initial list of target villages and add information on whether each community existed, on the size of the communities, and on the ethnic composition of the communities. Most information received from the agricultural department proved to be wrong when we visited the villages.
These facts make the seemingly simple a real challenge: randomized sampling without maps, lists of villages, and population size became adventurous, and it became difficult to establish the locality of the 80 communities that we included in our sample. We ended up preparing our own maps (based on the Soviet maps) and widely using GPS to locate villages.
Defining village borders proved to be even more challenging than pinpointing the village loca-tions and names. After initial data collection, it took a two-day workshop with all field teams to consolidate the sometimes very contradictory information received from the village shura (par-ticipatory mapping exercise on prepared topographical maps at a scale of 1:20,000), the GPS-data collected by the profile teams, the information obtained from various maps, and finally information available from Google Earth or satellite imagery.
There are reasons for this messiness. Settlements in Afghanistan are not the same adminis-trative units known as “village communities” in modern Western states. Village communities in Afghanistan are not standardized and can be anything from a lose accumulation of home-steads with no political organization to integrated communities with political representation, a headman as connection to the district-level state authority, and functionaries. In addition, settlement patterns have not been stable at all. Scarce land and labor, natural disasters, war, and ethnic religious violence has led to migration on a massive scale. Finally, from the point of view of Afghan villagers, it can make sense to remain “illegible”13 – that is, not being accounted for in name and number by the unpredictable authorities. This is one way of evading the attempts of a central authority to govern the space, and as Afghans know, this can be an important skill when those in power arbitrarily use and abuse their power.
5.2 Data challenges
We overestimated the quality of the data that is available on ongoing development aid projects. Data provided by various state and non-state agencies was often of very poor quality, and not all organizations seem to record data. Most organizations do not collect georeferenced data about the location of the projects either. This is specifically the case when donors rely exclusively on local implementation partners who may or may not identify exact project locations correctly. Many organizations also keep only aggregated information for the records and do not archive
13 For the concept of modern states making their subjects “legible” and subjects evasive strategies see Scott 1998.
SFB-Governance Working Paper Series • No. 43 • February 2013 | 41
exact project locations. USAID has earned a particularly bad reputation for its lack of transpar-ency about their work in the field and for not sharing data.
We also found that demographic and other basic statistical data is hardly available in Afghani-stan. In part, this has historical reasons. As discussed above, neither the Afghan state nor its various foreign patrons ever succeeded in making its citizens “legible.” Even prior to occupa-tion and civil war, no reliable census had been conducted. As a result, there is no reliable data on demography, the local economy, or issues of local governance. However, since international organizations and foreign donors require data, numbers and statistics are drawn up – but of-ten from very unreliable sources. A comparison of available demography data for the districts in Kunduz and Takhar revealed that the data widely varied among the various sources; when, rarely, data from different sources is identical, it appears to have been copy and pasted without revealing or crosschecking the source. Faulty data often ends up being copied into the statistics used by ISAF or UN agencies. As a consequence, neither the Afghan state nor international or-ganizations has reliable data.
Lastly, obtaining data on sensitive issues in an increasingly insecure and hostile environment is difficult. Sound qualitative and quantitative data collection relies on trust. Without trust, communication can be refused, and information can be withheld or intentionally manipulated. For surveys, trust requirements are minimal and abstract – but the situation still requires trust that giving or withholding information will not threaten the security of households or village. For qualitative interviewing on sensitive issues such as conflicts and micropolitics, the issue of trust is more complex since the interviewer must try to understand local semantics (how local people understand the issues they are asked to explain) and reach beyond normative facades of local communities (i.e., the way the respondent feels he should portray the issues he is asked to explain). In the increasingly insecure environment after 2009, when open insurgency and counter-insurgency activities in the Kunduz province were on the rise, interview partners were often reluctant to speak openly. Some key informants preferred to be interviewed outside their villages in safe locations. Also, the quarterly monitoring teams witnessed increasing reluctance to share information with them – at one stage, we even had to delay reporting and adjust the questions because the teams reported they were accused of being spies.
5.3 Conceptional challenges
It is not feasible to cover a society in a representative sense as a whole. This is not only a prob-lem of access to data (see logistics above) or bad/missing data (see data problems above), but it is also a conceptual problem that follows from a Western modernist bias. The problem is that in places like Afghanistan, “society” in a Western, state-centered sense does not exist. The cat-egories we use in order to disaggregate a society in its distinct parts – e.g., urban/rural, young/old, man/woman, educated/uneducated, ethnic groups, socio-professional groups, elites, cen-ter/periphery – may not be applicable. The existence, meaning, and relevance of those analytical categories need to be understood within the local context. For example, “youth” or “women” are, in rural Afghanistan, conceptually different than, for instance, in an urban Scandinavian con-
Assessing the Impact of Development Cooperation in Northeast Afghanistan | 42
text. Such local knowledge needs to be developed and refined over time and usually does not exist before the start of the evaluation project. Teaming up with local experts and training local researchers helps to mitigate this problem, but does not entirely solve it.
Related to local concepts of social organization is the problem of access to various relevant groups. It is difficult to convince heads of households to allow interviews to be conducted with other household members on issues related to the whole household or the community, since he (or in some cases, she) represents the whole household in the community. Interviews with members of the household who lack political agency – i.e., women and minors – are difficult in the rural context. Interviews with women are difficult in general, since women can only be interviewed by other women, but women interviewers have to be accompanied by a male rela-tive (maharam). This complicates the interview situation and significantly increases the costs of the survey.
Finally, it is not only difficult to gather data on the key variables of “aid” and “security,” but it is often also a conceptual problem to define measurement for these variables. Above, we have de-scribed how we solved this problem for the concept of “aid.” We have not yet fully addressed the question of how to measure security. For now, we have relied on perception of security. Clearly, it is desirable to move toward an objective measure of security. As of now, there are still consid-erable problems with security measurements that are currently being used. Take for instance the security incident lists produced by many agencies, among them ISAF. Such lists compile data on security incidents, such as roadside bombs, kidnappings, violent clashes between armed groups, etc. Most of these lists also provide a georeference to indicate where the security inci-dent took place. The problem is that virtually all such incidents have security implications for different places with different connotations and different geographical scopes.
To give an example: An attempt to bomb a school in Taloquan is reported. The bombs are found and defused because residents of Taloquan provided information on the pending attack. The bombs were assembled somewhere else, and the masterminds behind the bombing live in yet another place. For which locality do we code a negative security incident? For the place where the bombs were planted? For the place where the bombs were assembled? For the place where those who planted the bomb live? For the place where those who ordered the bombing live? Also, while these are all possible locations for “bad” security, the fact that the residents of Taloquan cooperated with the authorities and prevented the attack is clearly a sign of “good” security. How do we code and georeference this? The problems of spatial attribution of security incidents is complex, but needs to be addressed; otherwise, it will not be possible to causally link a treatment (be it aid or military action) to a change in the security situation. At the very least, the available incident lists need to be recoded for (a) connotations (plus, minus, neutral), (b) scope (local, community, mantaqa, district etc.), and (c) multitude of locations. This requires sound background information on the incident and the ability to crosscheck data. This is some-thing we plan to work on in the next phase of the project.
SFB-Governance Working Paper Series • No. 43 • February 2013 | 43
5.4 Is the method applicable in other contexts?
The approach that we have developed in this project relies on a bundle of methods. These can be adapted to different contexts, which makes our approach replicable beyond Afghanistan.
It should be noted, however, that the approach presented is time consuming and labor inten-sive. This not only refers to the data collection and data analysis, but also to the development of suitable tools to gather data. Developing (or adapting) questionnaires and semi-structured interview guidelines is time consuming. It also requires that the researchers are familiar with the political, social, and cultural context of the target regions; otherwise the concepts and ques-tions will not “work” in the given context, rendering the data useless.
It is also necessary that the evaluation team is comfortable using both qualitative and quantita-tive methods in order to combine advanced statistical methods and fieldwork on the ground. One of the most challenging but also rewarding tasks in the framework of a multi-method evaluation is the organization of an ongoing dialogue and exchange between statistical results and evidence from qualitative data, such as interviews and observations in the field. Such a dialogue needs to take place from the project design to the final analysis: Knowledge about the local understanding of certain concepts must be taken into consideration when developing the survey tools; results from surveys need to be interpreted in light of the local context and per-haps local idiosyncratic events. Data gathered from qualitative sources need to be coded in or-der to be used for further statistical analysis. In doing so, data will be aggregated, which implies that information is lost; thus, it is important that researchers also store the original qualitative data for future reference.
Summing up, we are convinced that our approach can be successfully adapted to other contexts, but the team must meet certain requirements: Team members should be trained in qualitative and quantitative methods, and sound knowledge of the local context is required. The dialogue between qualitative and quantitative methods needs to be structured; it should be taken into consideration that such a complex endeavor is time consuming and will not produce quick results. In planning such evaluations, the evaluation units of development agencies should ac-knowledge that the earlier the evaluation team is involved in the mission on the ground, the easier it will be for the evaluators to collect the correct data later on. Accompanying evaluations are arguably easier to do than ex post evaluations. But even under ideal circumstances, complex impact evaluations are highly demanding in terms of time, skills, and resources. One way to deal with these demands is to foster sustained cooperation between development organizations and research institutions.
Assessing the Impact of Development Cooperation in Northeast Afghanistan | 44
Literature
Böhnke, Jan/Koehler, Jan/Zürcher, Christoph 2010: Assessing the Impact of Development Coopera-tion in North East Afghanistan 2005-2009: Final Report, BMZ Evaluation Reports 049, Bonn.
Bundesregierung 2010: Fortschrittsbericht der Bundesregierung zur Lage in Afghanistan 2010, BT-Drucksache 17/4250, Berlin.
Collier, Paul/Elliot, Lani/Hegre, Havard/Hoeffler, Anke/Reynal-Querol, Marta/Sambanis, Nicholas 2003: Breaking the Conflict Trap. Civil War and Development Policy, A World Bank Policy Re-search Report, Washington, DC.
Collier, Paul/Sambanis, Nicholas 2005: Understanding Civil War: Evidence and Analysis, Vol. 1, Af-rica, Washington, DC.
Cramer, Christopher/Goodhand, Jonathan 2002: Try Again, Fail Again, Fail Better? War, the State, and the ‘Post-Conflict’ challenge in Afghanistan, in: Development and Change, 33: 5, 885-909.
OECD 2012: Guidance on evaluating peacebuilding activities in settings of conflict and fra-gility – improving learning for results, DAC Guidelines and Reference Series, DCD/DAC(2012)40/FINAL, Paris.
Gosztonyi, Kristof 2004: Konfliktbearbeitung unter besonderer Berücksichtigung von Drogen und alternativer Entwicklung – Kunduz, Takhar und Baghlan Provinzen (Teilbericht), Eschborn.
Gosztonyi, Kristof/Fararoon, Romin 2004: Analysis of Peace and Conflict Potential in Afghan Ba-dakhshan, Afghanistan, http://www.arc-berlin.com/pages/currentprojects.htm, last ac-cessed 21 January 2013.
Gosztonyi, Kristóf/Koehler, Jan 2010: PCA Analysis North Afghanistan, Kabul/Berlin.Islamic Republic of Afghanistan 2006: The Afghanistan Compact, London, http://www.nato.int/
isaf/docu/epub/pdf/afghanistan_compact.pdf, last accessed 21 January 2013.Koehler, Jan 2004: Assessing peace and conflict potentials in the target region of the GTZ Central
Asia and Northern Afghanistan programme to foster food security, regional cooperation and stability, http://www.arc-berlin.com/pdf/Integrated%20Report_04.pdf, last accessed 21 January 2013.
Koehler, Jan 2005: Conflict processing and the Opium Poppy Economy in Afghanistan, PAL In-ternal Document No. 5, Jalalabad, http://www.arc-berlin.com/pdf-sept/Drugs_and_Con-flict_full.pdf, last accessed 21 January 2013.
Koehler, Jan 2008: Auf der Suche nach Sicherheit. Die internationale Intervention in Nordost-Afghanistan, SFB-Governance Working Paper Series No. 17, Berlin.
Koehler, Jan 2012: Social Order within and beyond the Shadow of Hierarchy. Governance Pat-terns in Afghanistan, SFB-Governance Working Papers Series No. 33, Berlin.
Koehler, Jan/Zürcher, Christoph 2007: Statebuilding, Conflict and Narcotics in Afghanistan: A View from Below, in: International Peacekeeping, 14: 1, 62-74.
Scott, James C. 1998: Seeing like a State: How Certain Schemes to Improve the Human Condition have Failed, New Haven, CT.

SFB-Governance Working Paper Series • No. 43 • February 2013 | 45 | 45
Wimmer, Andreas/Schetter, Conrad 2002: State-Formation First: Recommendations for Recon-struction and Peace-Making in Afghanistan, Bonn.
Assessing the Impact of Development Cooperation in Northeast Afghanistan | 46
Previously published Working Papers from the SFB-Governance Working Paper Series
Börzel. Tanja A./van Hüllen, Vera/Lohaus, Mathis 2013: Governance Transfer by Regional Organizations. Following a Global
Script?, SFB-Governance Working Paper Series, No. 42, Collaborative Research Center (SFB) 700, Berlin, January
2013.
Goikhman, Izabella/Herrmann, Barbara 2012: The Governance Discourse in China. SFB-Governance Working Paper Series,
No. 41, Collaborative Research Center (SFB) 700, Berlin, November 2012.
Willms, Jan 2012: Justice through Armed Groups’ Governance – An Oxymoron? SFB-Governance Working Paper Series, No.
40, Collaborative Research Center (SFB) 700, Berlin, October 2012.
Ickler, Christian/Wiesel, John 2012: New Method, Different War? Evaluating Supervised Machine Learning by Coding Armed
Conflict, SFB-Governance Working Paper Series, No. 39, Collaborative Research Center (SFB) 700, Berlin, Septem-
ber 2012.
Livingston, Steven/Walter-Drop, Gregor 2012: Information and Communication Technologies in Areas of Limited Statehood,
SFB-Governance Working Paper Series, No. 38, Collaborative Research Center (SFB) 700, Berlin, September 2012.
Schüren, Verena 2012: Two TRIPs to Innovation. Pharmaceutical Innovation Systems in India and Brazil, SFB-Governance
Working Paper Series, No. 37, Collaborative Research Center (SFB) 700, Berlin, June 2012.
Sonderforschungsbereich 700: Grundbegriffe der Governanceforschung, SFB-Governance Working Paper Series, No. 36, 2.
revised edition, Collaborative Research Center (SFB) 700, Berlin, June 2012.
Eimer, Thomas R. 2012: When Modern Science Meets Traditional Knowledge: A Multi-Level Process of Adaption and Resi-
stance, SFB-Governance Working Paper Series, No. 35, Collaborative Research Center (SFB) 700, Berlin, June 2012.
Kötter, Matthias 2012: Non-State Justice Institutions: A Matter of Fact and a Matter of Legislation, SFB-Governance Working
Paper Series, No. 34, Collaborative Research Center (SFB) 700, Berlin, June 2012.
Koehler, Jan 2012: Social Order Within and Beyond the Shadows of Hierarchy. Governance-Patchworks in Afghanistan, SFB-
Governance Working Paper Series, No. 33, Collaborative Research Center (SFB) 700, Berlin, June 2012.
Risse, Thomas 2012: Governance Configurations in Areas of Limited Statehood. Actors, Modes, Institutions, and Resources,
SFB-Governance Working Paper Series, No. 32, Collaborative Research Center (SFB) 700, Berlin, March 2012.
Hönke, Jana, with Thomas, Esther 2012: Governance for Whom? – Capturing the Inclusiveness and Unintended Effects of
Governance, SFB-Governance Working Paper Series, No. 31, Collaborative Research Center (SFB) 700, Berlin, April
2012.
These publications can be downloaded from www.sfb-governance.de/publikationen or ordered in printed versions via e-
mail to [email protected].
SFB-Governance Working Paper Series • No. 43 • February 2013 | 47
The Authors
Jan Böhnke studied psychology and po-
litical sciences at the University of Kon-
stanz in Germany. Since 2005 he has
been working as a freelance research
consultant in several fields, especially
quality management and evaluation in
health care and medical research. In
2007 he held a research fellowship at
Freie Universität Berlin, where he worked on the survey de-
sign for the “Northeast Afghanistan Longitudinal Study.” He
has been working on that project ever since and is responsible
for data management and quantitative analyses. Since 2007
he has worked as a lecturer and research associate at Trier
University. His research and teaching activities cover quanti-
tative as well as qualitative research methodology with a focus
on process evaluation. In 2010 and 2011 he was granted an
ERASMUS scholarship to visit the Psychometrics Centre at
the University of Cambridge to teach multivariate research
methods.
Contact: [email protected]
Jan Koehler received his degree from
Freie Universität Berlin in Social An-
thropology. He is a research fellow
and field research supervisor at the
Collaborative Research Center (SFB)
700 in the C9 project and has been
responsible for the fieldwork as well
as for the development of qualitative
research methods. Over the past years he has supervised a
number of impact assessments and conflict analyses for inter-
national, governmental, and non-governmental development
agencies in conflict zones and fragile states. His experience
includes extensive fieldwork in Afghanistan and the succes-
sor states of the Soviet Union. He has focused primarily on
conflict and peace processes in the South Caucasus, Central
Asia, and Afghanistan. The results of his work are available in
various publications.
Contact: [email protected]
Christoph Zürcher is a professor at
the Graduate School of Public and In-
ternational Affairs at the University of
Ottawa. He received his PhD from the
University of Bern, Switzerland. Pre-
vious teaching and research appoint-
ments include the University of Kon-
stanz, the Institut d’Études Politiques
d’Aix-en-Provence, Stanford University, and Freie Universität
Berlin. His research and teaching interests include conflict
research, methods of conflict research, state building and in-
tervention, international governance, and development. His
regional focus is the former Soviet Union, especially Russia,
the Caucasus, and Central Asia including Afghanistan
Contact: [email protected]
Governance has become a central theme in social science
research. The Collaborative Research Center (SFB) 700 Gov-
ernance in Areas of Limited Statehood investigates govern-
ance in areas of limited statehood, i.e. developing countries,
failing and failed states, as well as, in historical perspective,
different types of colonies. How and under what conditions
can governance deliver legitimate authority, security, and
welfare, and what problems are likely to emerge? Operating
since 2006 and financed by the German Research Founda-
tion (DFG), the Research Center involves the Freie Univer-
sität Berlin, the University of Potsdam, the European Uni-
versity Institute, the Hertie School of Governance, the Ger-
man Institute for International and Security Affairs (SWP),
and the Social Science Research Center Berlin (WZB).
Research Framework Partner Organizations
Host University:Freie Universität Berlin
University of Potsdam
Hertie School of Governance
German Institute for International and Security Affairs (SWP)
Social Science Research Center Berlin (WZB)