Embed Size (px)
Citation preview

Promoting Regional Cooperation in Northeast Asia on Climate Change
Dr. Sh. Enkhbayar, Senior Research Fellow, Economic Research Institute for Northeast Asia (ERINA)
Dr. Georgy Safonov, Invited Overseas Researcher, ERINA/National Research University-Higher School of Economics
Ulaanbaatar Dialogue on Northeast Asian SecurityIII International Conference
16-17 June 2016

Outline
1. Introduction
2. GHG Emissions Global Trend Northeast Asia (NEA)
3. NEA at the Crossroads: Carbon Future vs the LEP (Low emission path) NEA Emission Reduction Targets “Carbon Budget” & Carbon Future LEP Alternatives and Prospective Projects
4. Conclusions
2

1. Introduction
• While the world’s climate has always varied naturally, the vast majority of scientists now believe that rising concentrations of “greenhouse gases (GHG)” in the Earth’s atmosphere resulting from economic and demographic growth since the industrial revolution are overriding this natural variability and leading to potentially irreversible climate change;
• Scientists warn that the planet is warming faster than previously thought and we must limit the global mean temperature rise to 2 C from the pre-industrial level (GHG concentration in the atmosphere must be stabilized below 450 ppm), (IPCC);
• CO2 from energy represents almost 70% of global anthropogenic emissions (IEA);
• The global primary energy demand is expected to grow further by around 20% by 2030 from the 2013 level, whereas about 1.3 billion or 18% of the global population still have no access to electricity (IEA, 2015).
• As the IEA noted: “Given the long lifetime of CO2 in the atmosphere, stabilizing concentrations of greenhouse gases at any level would require a large reduction of global CO2 emissions from current levels”;
• Thus, we face a dual challenge of economic growth and preserving the environment and climate at the same time.
3
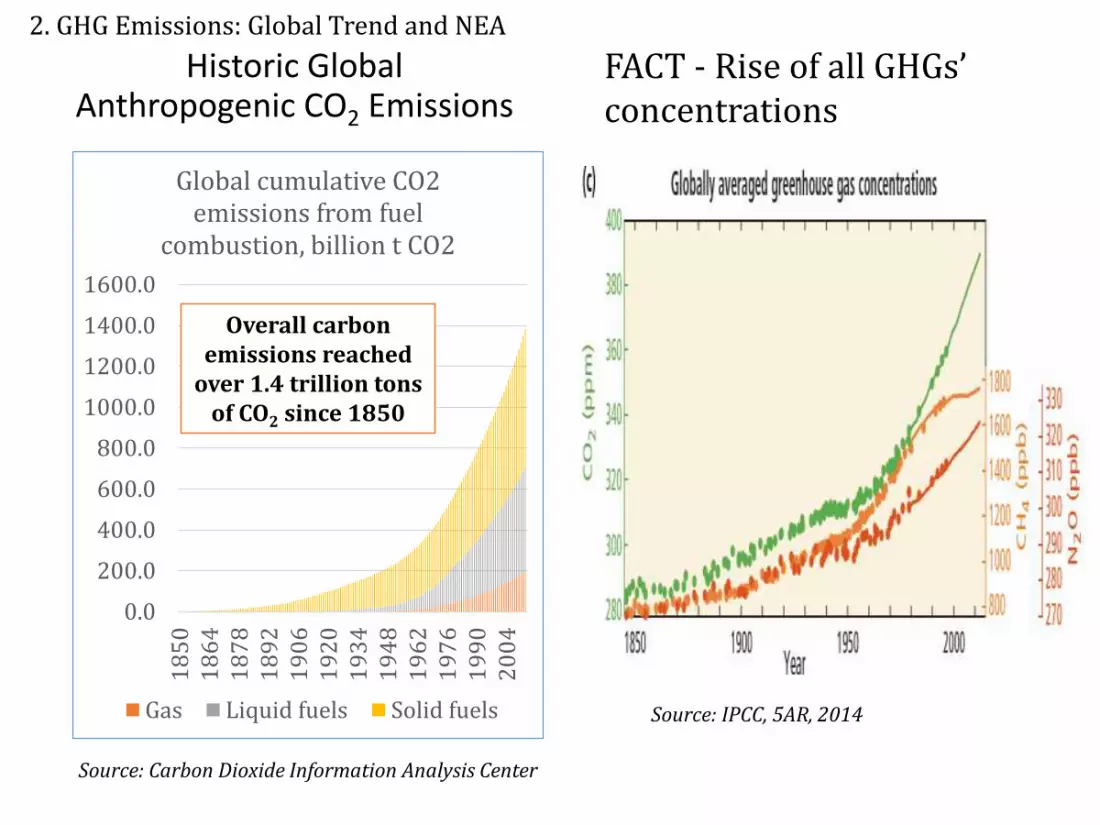
Historic Global Anthropogenic CO2 Emissions
0.0
200.0
400.0
600.0
800.0
1000.0
1200.0
1400.0
1600.0
18
50
18
64
18
78
18
92
19
06
19
20
19
34
19
48
19
62
19
76
19
90
20
04
Global cumulative CO2 emissions from fuel
combustion, billion t CO2
Gas Liquid fuels Solid fuels
Source: Carbon Dioxide Information Analysis Center
Overall carbon emissions reached
over 1.4 trillion tons of CO2 since 1850
FACT - Rise of all GHGs’ concentrations
Source: IPCC, 5AR, 2014
2. GHG Emissions: Global Trend and NEA

Source: IEA database
CO2 Emissions by NEA Countries, Million tCO2
-
2 000.0
4 000.0
6 000.0
8 000.0
10 000.0
12 000.0
14 000.0
1990 1991 1992 1993 1994 1995 1996 1997 1998 1999 2000 2001 2002 2003 2004 2005 2006 2007 2008 2009 2010 2011 2012 2013
Japan Rep. of Korea Russia DPR of Korea China Mongolia

NEA: GHG Emissions by Sources
JAPAN (2014)Energy
Industry
Agriculture
Waste
RUSSIA (2014) CHINA (2005)
Rep. of Korea (2012)
MONGOLIA (2006)DPR of Korea (2002)
Source: UNFCCC database

Drivers of CO2 Emissions (Kaya Decomposition)
7
-6% -4% -2% 0% 2% 4% 6% 8% 10% 12%
World
Japan
Korea
Russia
DPRK
Mongolia
PRC
Average annual percentage changes between 1990-2012
Carbon intensity(CO2/TPES)
Energy intensity(TPES/GDP)
GDP per population(GDP per capita)
Population
CO2 emissions
GHG emissions continue to rise due to population and wealth growths.

1364
657
22
2812
1042
536
44
2758
0
500
1000
1500
2000
2500
3000
Japan Rep. of Korea Mongolia Russia
National GHG Reduction Targets under the Paris Agreement (Million CO2e)
2014 (MNG-2010, RK-2012) 2030
Source: UNFCCC database
3. NEA at the Crossroads: Carbon Future vs the LEP (Low emission path): NEA Emission Reduction Targets

NEA GHG Emissions Reduction Targets
Quantified Economy-wide
Emission Reduction Targets for
2020
INDC (Intended Nationally
Determined Contributions)
Japan 3.8% reduction in 2020 compared to the
2005 level.
26% reduction by FY2030 compared to
the FY2013 level (25.4% reduction
compared to the FY2005 level.
Russia Reduction within a range of 15% - 25%
by 2020, compared with the 1990 level.
25%-30% reduction by 2030 compared
to 1990 levels.
ROK Reduce by 30% from “business as usual
(BAU)” emissions in 2020.
37% reduction of its BAU emissions by
2030.
China Lower CO2 emissions per unit of GDP by
40% - 45% by 2020, compared to the
2005 level.
Peak by 2030, lower CO2 emissions per
unit of GDP by 60% - 65% by 2030
from the 2005 level.
Mongolia Non-quantified reduction measures. 14% reduction by 2030 compared to
BAU (excluding LULUCF).
9Source: UNFCCC (Submissions by the Governments to the UNFCCC)

CO2 Accumulation Capacity of the Atmosphere
0
0.2
0.4
0.6
0.8
1
1800-18491850-1899
1900-1949
1950-1999
2000-2012
Over 50%
of capacity
has already used...
~2°C
Limit of emissions for 20C target
With current
trend, the rest
will end up
in the 2040s
Source: IPCC (2013-2014)
3 NEA at the Crossroads: Carbon Future vs the LEP (Low emission path): Carbon Budget

GHG emissions must peak by 2020, then have to drop to less than half of 1990 level.
11
0
50
100
150
2000
2010
2020
2030
2040
2050
2060
2070
2080
2090
2100
Billion tonnes CO2
per year
Business As Usual:- Atmospheric CO2
concentration rises to 980 ppm;- The world gets 4.9°C
warmer.
Low Emissions Path: - Atmospheric CO2
concentration is stabilized
at 450 ppm;- Temperature rise is below 2°C.
Source: Adapted from Climate Scoreboard © Climate Interactive 19 April
2013 www.ClimateScoreboard.org

Carbon Budget of Northeast Asia Consistent with the Low Emission Path (LEP)
12
Year
Global CO2
Emissions
consistent
with the
LEP
Gt/year
CO2 Emissions from Fuel CombustionAnnual Carbon
"Budget" (MtCO2)
World
total Gt/
year
Share of
global
total %
World, total,
MtCO2
NEA, total
NEA
share,
%
World NEA
1990 27.64 20.97 76% 20,974 5,869 28%NEA shall emit
7,567 MtCO2 less
in 2050 than it
emits currently.Average
2010–
2012
37.7 31.2 83% 31,187 11,307 36%
2020 41.26 34.17
83%
34,174 12,385
36%
2,987 1,077
2030 27.37 22.67 22,669 8,215 −8,518 −3,092
2040 18.29 15.15 15,149 5,490 −16,038 −5,817
2050 12.46 10.32 10,320 3,740 −20,867 −7,56
7
Note: Carbon budget = LEPYEAR – Current CO2 (av.2010-2012)

Carbon emissions from combustion of all these fuels would lead to emission of 4.7 trillion t CO2. The NEA alone is able to warm the Earth by 2 degrees Celsius 3 times!
Reserves of Conventional and Non-conventional Fuels in the North East Asian Countries
Coal Oil Natural gas Shale oil Shale gas Gas-hydrates
Reserves of fuels, bln toe
China 79.8 2.6 2.9 90.2 94.9 100.0
Russia (Siberia+Far East)
121.8 14.4 27.1 174.0 0.3 913.0
Mongolia 70 na na 11.9 0.05 na
South Korea 0.1 na na na na 1.2
North Korea 3.2 0.1 na na na na
Japan 0.2 na na na na 16.6
Total reserves, bln toe
275.1 17.1 30.0 276.1 95.2 1030.8
Carbon emissions, Billion tCO2
1,089.6 52.5 76.3 847.7 223.9 2,421.1
3. NEA at the Crossroads: Carbon Future vs the LEP (Low emission path): Carbon Future

Carbon Future: World Coal Deposits
Source: Maps of world http://www.mapsofworld.com/business/industries/coal-energy/world-coal-deposits.html

Carbon Future: Shale Oil and Gas
Source: Energy Information Administration, http://www.eia.gov/analysis/studies/worldshalegas/

Carbon Future: Methane-hydrates
Source: World Ocean Review http://worldoceanreview.com/en/wor-1/energy/methane-hydrates/
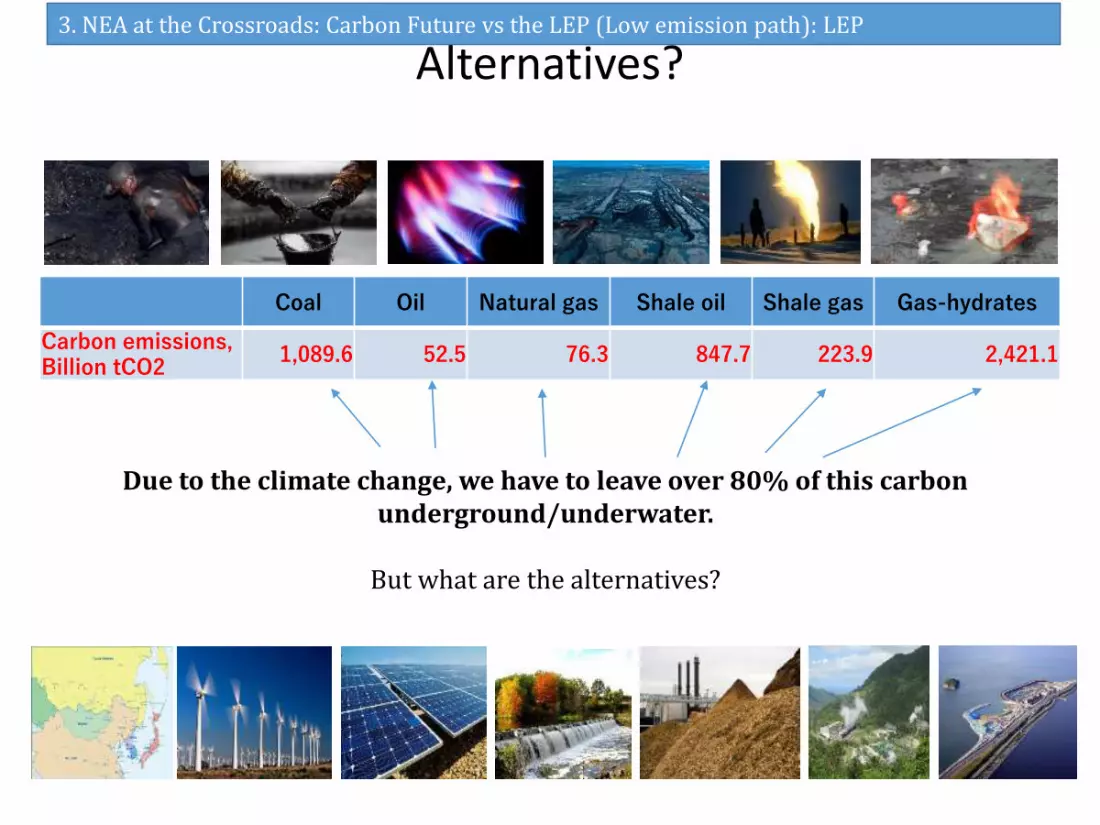
Alternatives?
Coal Oil Natural gas Shale oil Shale gas Gas-hydrates
Carbon emissions, Billion tCO2
1,089.6 52.5 76.3 847.7 223.9 2,421.1
Due to the climate change, we have to leave over 80% of this carbon underground/underwater.
But what are the alternatives?
3. NEA at the Crossroads: Carbon Future vs the LEP (Low emission path): LEP

Renewable Energy Potentials in NEA
Wind Solar PV Hydro Biomass Geothermal Tidal
China 1500 - 2800 GW 2700 GW 400 - 700 GW 273 - 648 Mtce/y na 20 - 100 GW
Japan 1800 GW 350 GW 44 GW na 14 GW >87 TWh/y
Russia (Siberia+Far East)
3910 TWh/y 2300 mtce/y 1441 TWh/y >500 TWh/y >20 TWh/y >100 GW
Mongolia 900 - 1100 GW >1000GW 6.4 GW na na na
South Korea 186.5 TWh/y 10.4 TWh/y na na na >4 GW
Renewable energy resources are sufficient to cover all the energy needs of NEA. Thus, cooperation among the NEA countries may reduce costs, improve reliability of energy supply, facilitate economic growth and technological modernization.
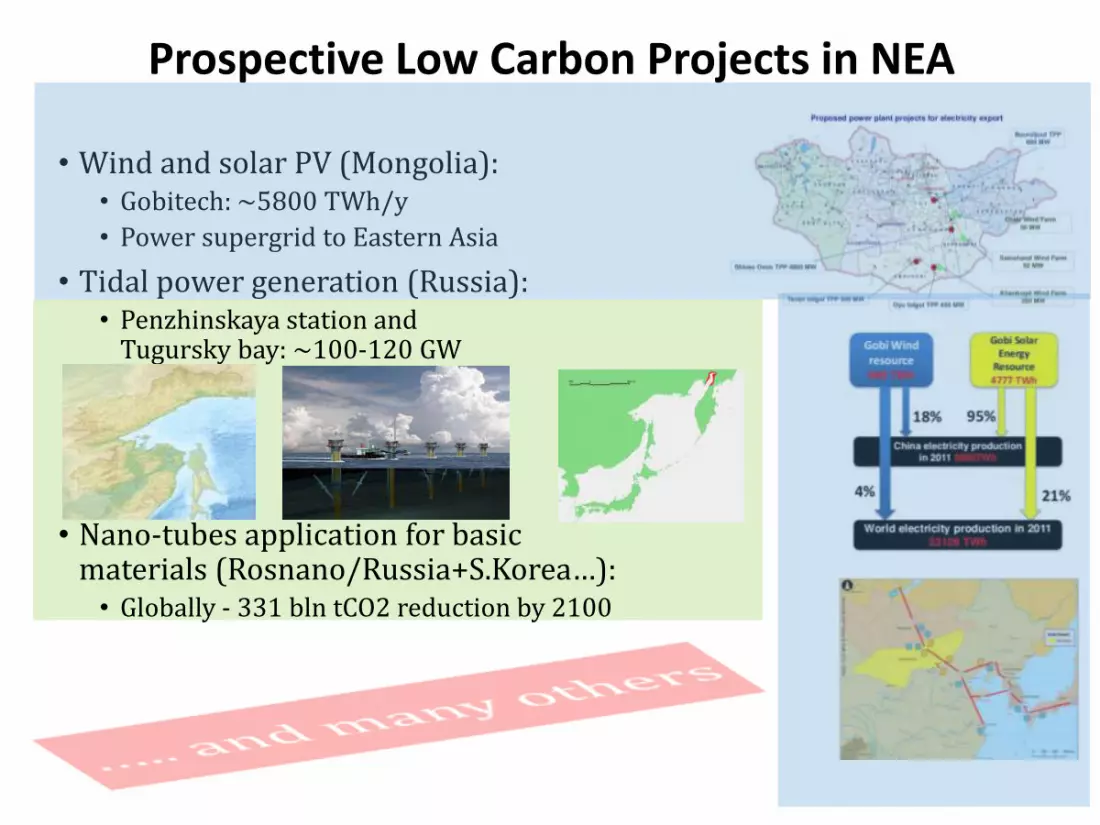
Prospective Low Carbon Projects in NEA
• Wind and solar PV (Mongolia): • Gobitech: ~5800 TWh/y
• Power supergrid to Eastern Asia
• Tidal power generation (Russia):• Penzhinskaya station and
Tugursky bay: ~100-120 GW
• Nano-tubes application for basic materials (Rosnano/Russia+S.Korea…):• Globally - 331 bln tCO2 reduction by 2100

4. Conclusions
• The current efforts of NEA countries on GHG mitigation are not sufficient to avoid dangerous climate change;
• If the region is to stay within the boundaries of its carbon budget in compliance with the global 2°C target, all the fossil fuels need to be replaced with renewable energy or other zero-emission alternatives by 2050;
• In fact, renewable energy potentials in NEA is sufficient enough to meet all the energy needs of the region;
• Therefore, NEA countries need to enhance cooperative activities to realize various ideas and prospective projects already in the pipeline;
• This UB dialogue is one of the important platforms to exchange views and enhance cooperation in the region; and we welcomed the inclusion in this dialogue (UBD) a special session on environment for the first time. We hope the environmental issues will emerge as a regular pillar of further discussions within the framework of the UBD;
• As the next/first step to enhance the regional environmental cooperation, we propose to begin experts’ level joint study to formulate the “Strategy and Action Plan for the NEA Low Emission Path (LEP)”and we will be happy to extend our further collaboration.
20

Reference links:• http://www.ibtimes.co.uk/gas-hydrate-china-start-commercial-production-flammable-ice-1465892
• http://www.bp.com/content/dam/bp/pdf/energy-economics/statistical-review-2015/bp-statistical-review-of-world-energy-2015-oil-section.pdf
• http://www.bp.com/content/dam/bp/pdf/energy-economics/statistical-review-2015/bp-statistical-review-of-world-energy-2015-coal-section.pdf
• http://ac.gov.ru/files/publication/a/1437.pdf
• http://www.eia.gov/analysis/studies/worldshalegas/
• http://ubpost.mongolnews.mn/?p=3553
• https://www.eia.gov/analysis/studies/worldshalegas/pdf/Mongolia_2013.pdf
• http://www.energy-pedia.com/news/south-korea/south-korea-to-tap-gas-hydrate-reserves-in-east-sea
• http://www.indexmundi.com/g/g.aspx?c=ks&v=137
• http://www.ogj.com/articles/print/volume-97/issue-1/in-this-issue/exploration/glimmers-of-hope-seen-in-north-korean-basins-markets.html
• http://burneft.ru/archive/issues/2011-12/1
• https://en.wikipedia.org/wiki/Coal_in_China
• https://en.wikipedia.org/wiki/Petroleum_industry_in_China
• http://www.rusnano.com/projects/otchet-etap3
• https://dash.harvard.edu/bitstream/handle/1/5029360/McElroy_Wind_China.pdf?sequence=2
• https://www.chinadialogue.net/article/show/single/en/5264-Can-China-reclaim-its-place-as-a-world-leader-in-tidal-power-
• http://www.env.go.jp/earth/report/h23-03/full.pdf
• http://www.nippon.com/en/in-depth/a01203/
• http://www.iea.org/publications/freepublications/publication/renewrus_2003.pdf
• http://www.nrec.mn/en/index.php?pid=49&nid=19
• http://www.un-page.org/files/public/mongolia_stocktaking.pdf
• http://www.irena.org/DocumentDownloads/Publications/IRENA_RRA_Mongolia_2016.pdf

22
ERINA Economic Research Institute for Northeast Asia13F, Bandaijima Bldg, Bandaijima 5-1, Chuo-ku,
Niigata-city, 950-0078 JapanTel: 025-290-5545Fax: 025-249-7550
Web: http://www.erina.or.jp