Embed Size (px)
Citation preview
Andrew YeoumSID: 305147021
BUSS7902 Final Report
Introduction
This project is an exercise in modernization theory,
which posits that a strong and positive relationship
exists between economic development and democracy, with
the causal direction running from the former to the
latter. Understanding the relationship between these two
variables and the causal direction of the relationship
remains one of the major and ongoing endeavors of
political science inquiry. Are rich countries more likely
to be democratic because democracy makes countries rich,
or is development conducive to democracy? Modernization
theory is one of the most important and established
theoretical areas in the field of comparative politics,
and arguably the only work in the field that has ever
truly earned the accolade of “theory” (McClintock, 2005).
This being the case, the hypothesis is a much-tested one,
but its empirical and methodological approaches remain
contested. Much dispute also stems from issues related to
1
Andrew YeoumSID: 305147021
conceptual and definitional disagreements on economic
development, on the one hand, and the nature of democracy
itself on the other, and how these two variables are
defined and measured as independent or dependent
variables.
The purpose of this project is to test a particular
variant of modernization theory, one that was put forward
by political scientist Adam Przeworski in his much cited
1997 article in World Politics, “Modernization: Theories and
Facts”. Using time-series cross-sectional regression,
Przeworski (1997) argued that indices of development,
such as economic growth, industrialization and
urbanization were poor indicators of why countries
actually make the transition to democracy, but they may
go a long way in explaining why democracies endure and
consolidate. The goal of this project is to test whether
this theory holds true approximately 22 years from the
exit year of his data, 1990, to a recent year, 2012. If
democracies with higher levels of economic development
are quantatively assessed to have generally better levels
of democratic development, then the theory holds. The
2
Andrew YeoumSID: 305147021
independent variable will focus on only one, but arguably
the most illuminating, indicator of economic development
– per capita income measured through Gross Domestic
Product (GDP). The dependent variable is the countries
that are considered, as of 2012, to be democracies in at
least the formal, electoral sense. In defining the
variables in such a manner, this paper seeks to test the
hypothesis that countries with higher per capita incomes
are more likely to enjoy better states of democracy. The
hypothesis is thus a relational one, rather than causal.
It seeks to ascertain whether a strong, positive
relationship exist between high-income countries and
their levels of democratic consolidation. It is intended
that the existence of such a relationship will illustrate
the significance of economic development to a nation’s
democratic consolidation. More precisely, it will show
that higher (per capita) income levels are a good
indicator for the state of democracy in democratic
countries.
Background to the problem
3
Andrew YeoumSID: 305147021
In what is now a classic article in the American Political
Science Review, the sociologist Seymour Martin Lipset (1959)
argued that there is a correlation between economic
development and democracy. He argued that rich countries
are much more likely than poor countries to be
democracies, or in his own words, “The more well-to-do a
nation, the greater the chances that it will sustain
democracy”.1 Distinguishing among stable democracies,
unstable democracies, unstable dictatorships, and stable
dictatorships both in Europe and the Americas, Lipset
showed how these regime types correlated with indices of
wealth, industrialization, education, and urbanization.
Part of the reason that this became called
‘modernization’ theory is that it presumed that economic
development and modernization caused democracy. The
contemporary debate over modernization theory has in many
respects circled around Lipset’s original research
agenda. Lipset’s argument was widely accepted in the
1960s, then contested in the 1970s after the breakdown of
democratic regimes in Latin America’s wealthier nations,
1 See Seymour Martin Lipset, “Some Social Requisites of Democracy” (1959) 53 (1) American Political Science Review 69-105.
4
Andrew YeoumSID: 305147021
and ultimately reaffirmed in the 1990s as these and many
other nations made the transition to democracy. In many
of these cases, transitions seemed to follow impressive
periods of economic development.
Critics of Lipset took issue with the theory’s
relatively unproblematic picture of social change,
arguing that it was too linear, teleological and too
optimistic. One of the most important critics of Lipset
was Dankwark Rustow (1970), who criticized modernization
theory for focusing only on ‘environmental factors’ like
income, economic growth and urbanization. Rustow argued
that just because greater wealth and democracy happened
to appear at the same time in some places – correlation –
that didn’t mean that wealth caused democracy. The
decisions made by individuals, social groups, political
leaders and institutions were just as important. These
were very important in Latin America in the 1970s, he
argued, helping to explain why some countries became
democratic in the region and others did not.
Samuel Huntington (1968), in his seminal work Political
Order in Changing Societies, argued that modernization theorists
5
Andrew YeoumSID: 305147021
were right in seeing economic development as unleashing
profound social changes, but wrong in assuming those
changes would necessarily be benign or progressive. 2 He
argued that there is nothing inevitable about economic
development leading to democratic change. Indeed,
whatever the threshold at which development is supposed
to undermine authoritarian regimes, dictatorships
survived for years in countries that reached the upper-
middle or even high-income brackets. Nevertheless,
Huntington (1968) was in general agreement with Lipset,
and he laid out four key intervening variables between
development and democracy: (1) A higher level of
education, literacy, and media sources are all more
likely in a wealthy society; (2) Political disputes and
corruption are less costly, and a more prosperous society
gives people diverse and broader options; (3) Society is
too complex for an authoritarian system; (4) Stable
middle class is the best support for a democracy.
Within modernization theory, the question of why,
exactly, development leads to and/or sustains democracy
2 Samuel P. Huntington, Political Order in Changing Societies (Yale University Press, 1968).
6
Andrew YeoumSID: 305147021
has been the subject of intense debate. Some of the more
recent literature on modernization theory has focused
their inquiry almost exclusively on exploring the
intervening variables or the causal mechanisms involved.
Economic development, after all, does not in and of
itself causes democratic institutions to emerge
automatically when a country attains a certain level of
GDP. Some prominent political scientists in this area is
(Inglehart and Welzel 2005) argued that economic
development is conducive to democracy to the extent that
it, first, creates a large, educated and articulate
middle class who become accustomed to self-expression and
thought, and second, transforms people’s values and
motivations. His view that mass cultural and attitudinal
changes are the crucial intervening variables between
economic development and political outcomes drew heavily
on the vast amount of data he collected from societies
containing 85% of the world's population through the
World Values Survey. Other scholars (Carles Boix 2003 and
Acemoglu and Robinson 2005) have examined the ways in
which economic inequality and stratification influence a
7
Andrew YeoumSID: 305147021
country's regime type (although they disagree over the
precise role played by inequality and stratification
patterns).
Alongside these endless empirical studies of the
correlation between wealth and democracy and its
intervening variables, Przeworski’s contribution to the
debate becomes highly significant. In reassessing
Lipset’s original thesis, Przeworski pointed out that
before any testing of hypotheses are even attempted, a
very important distinction must be made between the
processes of democratic transition, on the one hand, and
democratic consolidation, on the other. This distinction,
he argued, is crucial because it affected the
implications of empirical outcomes. A certain factor, say
variable X, may be an explanatory factor in both the
transitional phase and consolidation phase, but another
factor, variable Y, may go towards explaining the former
phase but may be irrelevant as an explanatory factor in
the latter phase, and vice versa.
Przeworski argued that the first wave of
modernization theory had erred in its failure to
8
Andrew YeoumSID: 305147021
differentiate the dependent variable between the
establishment of democracy (“democratization”) and its
sustainability (“consolidation”). Much of the literature
on modernization theory tended to conflate these two
distinct stages of democracy into a single, unproblematic
dependent variable. He noted that the fragility of
democratic norms and values in many so-called
“democratized” nations with some of the trappings of a
formal democracy (e.g. holding elections) attested to
both the difficulty and importance of consolidating
democracy. According to Przeworski, this is where
economic development enters as the crucial independent
variable to explain the dependent variable defined as
consolidated democracy, as oppose to mere
democratization. In fact, he asserted, evidence showed
that economic development played an important role in
fostering the former but not the latter (i.e. it explains
why democracy endures, but not why it emerges). A 1997
study (Przeworski and Limongi 1997) of 135 countries
examined between 1950 and 1990 showed that for democratic
countries with a GDP per capita of USD 7,001 or above
9
Andrew YeoumSID: 305147021
(the high income threshold in 1990), the statistical
probability of them descending into authoritarianism was
zero. That probability increased monotonically for the
democracies falling into the lower income brackets. In
other words, above $7,001, democracies could
theoretically expect to last forever, and indeed not a
single high-income democracy during the 40-year period
ever fell.
Methodology
The type of study undertaken was a two-variable cross
sectional linear regression, using the sample regression
model. The temporal dimension involved a stationarized
series for a single time-unit, year 2012. The spatial
dimension concerned nation states as the units of
analysis. Using the variables, data sets and sampling
explained below, this project was conducted in three
phases. The first phase involved the regression of
democracy scores and per capita GDP of the sample
countries and charting them on a scatter plot, with the
values of the dependent variable (Y) displayed on the
10
Andrew YeoumSID: 305147021
vertical (intercept) axis and the values of the
independent variable (X) on the horizontal (slope) axis.
The pattern was a positive one, running from lower-left
to upper-right, i.e. the more rightward values on the
horizontal axis, the higher values on the vertical axis.
The parameters of the regression model were estimated
using the ordinary least-squares (OLS) estimator. To
assess the overall fit between the regression model and
the dependent variable (“goodness of fit”) the second
phase involved measuring the uncertainty of the OLS
regression line via coefficient of determination, or -
squared statistic ). The third phase involved
hypothesis testing via the test of significance approach.
Being a directional hypothesis test with a positive
expectation, the one-tailed t test was more appropriate
for this study than the two-tailed test.
The basic idea of two-variable regression is that we
are fitting the “best” line through a scatter plot of
data that represent the democratic countries. This line,
which is defined by its slope and y-intercept, serves as
a statistical model of reality. Theories about political
11
Andrew YeoumSID: 305147021
phenomena, by their very nature, are necessarily
probabilistic rather than deterministic (Kellstedt and
Whitten 2009). Ultimately, this project is trying to
explain processes that involve human behavior, which is
complex and bound to involve random elements. It is not
expected that all of the data points to line up perfectly
on a straight line, so the values of our dependent
variable is construed as having both a systemic
component, , and a stochastic (or random)
component, . In two-variable regression, information
from the sample data is used to make inferences about the
underlying or unseen population of interest, which in our
case are all democratic countries in the world. Thus,
and are described as parameter estimates, and can be
written in terms of expectations: E (Y| )
, and the estimated stochastic component, the “residual”
or the sample error term, can be rewritten as .
But how “good” the estimated regression line is of true
population regression function (PRF) depends on specific
assumptions – aside from the fact that it is linear in
12
Andrew YeoumSID: 305147021
the parameters – about how the stochastic are
generated.
Assumptions and Limitations
In estimating the regression model, a large set of
assumptions is made about the unseen population model.
The statistical analysis of the model in this study made
the following assumptions about the stochastic terms
and about our model specification.
Assumptions about : the assumption that the
independent variable ( ) is uncorrelated with the
disturbance term is automatically fulfilled in our
case since the GDP figures for per capita income,
the variable, is obviously non-stochastic, i.e.
its value is a fixed number. The assumption that
values are measured without error in turn assumes
that any variability from our regression line is due
to , and not to measurement problems in . There
are obvious problems with this assumption since many
13
Andrew YeoumSID: 305147021
potential errors exist in any GDP measurement (e.g.
economic activities that are hard for governments to
measure), but it assumes, for the purposes of
estimating our OLS model, that the denominator (i.e.
population) in our calculation, GDP of countries for
2012, is measured exactly correctly.
No Bias: the random term represents all
factors not included in the model, and assumes that
they are unrelated to the variable explicitly
introduced in this model, the values of per capita
GDP. Thus, given the value of , the expected value
of the disturbance term is zero: .
has variance : Homoscedasticity: it was assumed
that the variance of each is constant, or
homoscedastic: . In other words, in assumes
that the democracy scores for each countries (the
values represented by the DI scores, discussed below
in “Variables and Data”) are spread around their
mean values with the same variance.
14
Andrew YeoumSID: 305147021
No Autocorrelation: it is assumed that there is no
correlation, or systemic relationship, between two
error terms. This assumption of autocorrelation,
expressed, , means the error terms
are random. It assumes that any two DI scores for
countries are uncorrelated because only vary as
varies (since and ’s are fixed GDP numbers), and
so if ’s are uncorrelated, the ’s will also be
uncorrelated.
Correct Model Specification: it is assumed that the
model is correctly specified and that there cannot
be some other variable(s) (s) that may also affect
the democracy scores. In reality, there may be
additional variables that can be theorized to be
causally related to democratic consolidation, and to
realistically make the specification assumption, all
such variables should be included in the model.
Since the statistical model of reality is served
only by the two-variable regression line this study
must be construed as being simply the first (but
15
Andrew YeoumSID: 305147021
important) step toward the multiple regression
model. The latter model, however, is beyond the
scope of this study and it is acknowledged that an
obvious shortfall is the inability to account, or
control for, (s) as we measure our independent
variable of interest and our dependent variable .
A further limitation worth mentioning is that the model
in this study does not account for intervening variables,
or the causal mechanism, involved between the two and
variables introduced in the study. That is, even if one
can assume for a moment that higher income levels cause
higher levels of democratic development, a more complete
explanation may add that causes because leads to,
or is at least correlated with, for example a growing and
educated middle class or that prosperity contributes to
political stability in general, conditions that are often
seen as necessary (although not sufficient) for
democratic consolidation.
16
Andrew YeoumSID: 305147021
Variables and Data
As discussed earlier, the independent variable, defined
in this study as per capita income, is a continuous
variable and is measured as GDP per capita in current
United States Dollars (USD) using the 2012 calculations
provided by the World Bank in its online database, World
Databank. GDP per capita is the market value of all goods
and services produced inside a country at a given time
divided by the population of that country, and so is
effectively a per capita measure of the total income
received by all sectors of an economy within that country
at that given time. The GDP indicator is thus related to
national accounts and is not a measure of wealth or
living standards.3 A limitation with the GDP figures used
in this study is its nominal measurement in USD market
exchange rates, and so the World Bank’s calculations do
3 The GDP indicator has been criticized for its numerous limitations,and is not unproblematic when it comes to measuring a country’s levelof economic development. The limitations are too manifold and multifaceted for a detailed treatment here, but it may suffice to note that the GDP framework does not directly account for levels of real wealth, productivity, industrialization, urbanization, standardsof living and quality of life, or economic sophistication and complexity. It is, however, strongly and positively correlated with these indices of development and still remains a frequently used de facto indicator of a nation’s economic development.
17
Andrew YeoumSID: 305147021
not reflect a country’s real, or purchasing power parity
(PPP) GDP and its relative price levels.
The dependent variable is defined as the “state of
democracy” (SOD), measured using the Democracy Index (DI)
compiled by the Economist Intelligence Unit (EIU). The DI
measures the state of democracy in 167 countries based on
60 indicators grouped into five different categories:
electoral process and pluralism, civil liberties,
functioning of government, political participation, and
political culture. The DI then assigns a numerical score
to countries and places them into one of four regime
types: full democracies (8.00-10.00), flawed democracies
(6.00-7.99); hybrid regimes (4.00-5.99); and
authoritarian regimes (0.00-3.99). In order to
operationalize the dependent variable, the measurement
metric of SOD was treated and measured as a continuous
variable by ignoring the DI’s categorization of regime
types and focusing only on its numeric scores so as to
give SOD equal unit differences, i.e. so that any
increase in the value of SOD always mean that it is more
democratic, whereas if the DI regime types were also
18
Andrew YeoumSID: 305147021
adopted, SOD would be an ordinal variable whereby a
country with one-unit increase from say 6.05 to 7.05
would still be classified as a “flawed democracy”.
Quantifying “democracy” and levels of democratic
development through the use of numeric indexes is not
without its own problems, and remains a contentious issue
in the field of comparative politics, not least because
democracy is itself one of the most contested
definitional concepts in the social and political
science. Aside from methodological considerations, the
quantification of democracy is further complicated by
disagreements that exist along ideological, ideational,
or even ontological lines (Scmitter and Karl 1991). In
spite of these problems, quantitative measurements of
democracy can be seen to have a functional advantage, and
numerous non-partisan organizations rigorously study
countries around the world and apply variables to
determine whether a democracy exists, and to determine
its quality and the extent to which it is considered
durable.
19
Andrew YeoumSID: 305147021
The US-based Freedom House publishes its annual
Freedom in the World (FIW) report (which assigns numerical
scores and then classifies countries as “free”, “partly
free” and “not free”) and the Center for Systemic Peace
maintains the Polity data series (see Polity IV for latest
version). The US National Endowment for Democracy also
conducts research and fields expert opinions.
Supplementing these are the World Values Survey (WVS) and
the work of other polling organizations such as Pew and
Gallup, which routinely measure the attitudes and values
of people around the world as they pertain to preferences
and proclivities for types of governments.
The choice of the EIU’s DI over other numeric
indexes measuring “democracy” and its ancillary elements
came from consideration of the “thin” and “thick”
components of democracy in comparative politics (Coppedge
2005). At the most fundamental (or thin) level, democracy
is simply a system of governance with popular sovereignty
or majority rule. Also known as “electoral democracy”,
this definition describes the processes by which a
government derives its authority or mandate. But this
20
Andrew YeoumSID: 305147021
represents only one side of the equation, and a (thick)
designation of democracy factors into account other
constitutive elements that go towards a “liberal
democracy”, such as governance by rule of law,
accountability and the protection of civil liberties.
Though how these two basic components of democracy –
electoral and liberal – are represented may differ, it is
widely accepted that a truly democratic system of
governance must comprise both.
The FIW and the EIU’s DI both express this critical
combination of the thin and thick components of
democracy. Other indicators such as the widely used
Polity data series (Polity IV) simply measure a state’s
level of democracy based on evaluations of elections (its
competitiveness, openness and level of participation), a
minimalist criterion many consider thin and narrow. In
turn, the DI was chosen over FIW because the latter’s
measurements of thick components like the state of
political freedoms and civil liberties was deemed not
“thick” enough. FIW surveys do not encompass sufficiently
or at all some features that determine how substantive
21
Andrew YeoumSID: 305147021
democracy is or its quality. Freedom is an essential
component of democracy, but not sufficient. Indeed, FIW
emphasizes the formal existence of liberties rather than
the actual exercise of freedom, according to (Przeworski
2003, 277) who gave the following example:
Look at the United States…It’s a country where half
of the population doesn’t vote, even in presidential
elections; where barriers of entry to politics are
enormous; in which practices which in other
countries would be considered political corruption
are ubiquitous; where the same two parties speak in
a commercially sponsored unison; a country in which,
at least for black American males, being free means
only being out of jail; the oldest democracy in the
world which has the highest rate of incarceration in
the world.
In the FIW surveys, two crucially important substantive
elements of democracy, political participation and
functioning of government, are taken into account only in
a marginal and formal way. In contrast, the EIU’s DI
treats these two elements as “necessary components” that
go towards a “full and consolidated democracy”, and was
22
Andrew YeoumSID: 305147021
thus deemed preferable to the FIW’s more formalistic
measure of substantive democracy.
Population and Sample
The question being asked in this paper is whether higher
per capita income levels bear a strong positive
relationship with the “state of democracy” in democratic
countries. The population of this study therefore
encompasses all “democracies” in the world, i.e.
countries that are already democratic in at least the
electoral sense.
The sampling frame for the dependent variable is the
DI’s list of 167 countries, which as mentioned above,
groups the countries into four categories: full
democracies (8.00-10.00), flawed democracies (6.00-7.99);
hybrid regimes (4.00-5.99); and authoritarian regimes
(0.00-3.99). Countries are given overall and categorical
scores from 0–10 (a snapshot sample provided in Table 4
below). This project uses only the overall scores. The
frame for the independent variable is the list of 192
23
Andrew YeoumSID: 305147021
countries listed in the World Bank’s DataBank under its
“GDP per capita (current US$)” indicator. The DataBank
lists the level of GDP per capita measured in current USD
according to country and by year (from 1980-2012) grouped
into five-year brackets from 1982 onwards (a snapshot
sample of the frame list can be seen below in Table 3).
As mentioned earlier, the time unit for this project is
the year 2012 only.
Since we are only interested in democratic
countries, the sample selected from these frames are all
the states listed in the DI with a numeric score of 6.00
and above, and for which income data was available on the
World Bank database. GDP figures for some DI-based
democratic countries were unavailable for the particular
year we were interested in (e.g. New Zealand and Israel
for 2012), and others like Taiwan is excluded in the
DataBank due to its de facto legal status. This left us
with a sample of 75 DI-based democratic countries for
which DataBank had figures for, out of DI’s sample frame
of 79 democracies (i.e. those with DI scores of 6.00 and
above).
24
Andrew YeoumSID: 305147021
Results
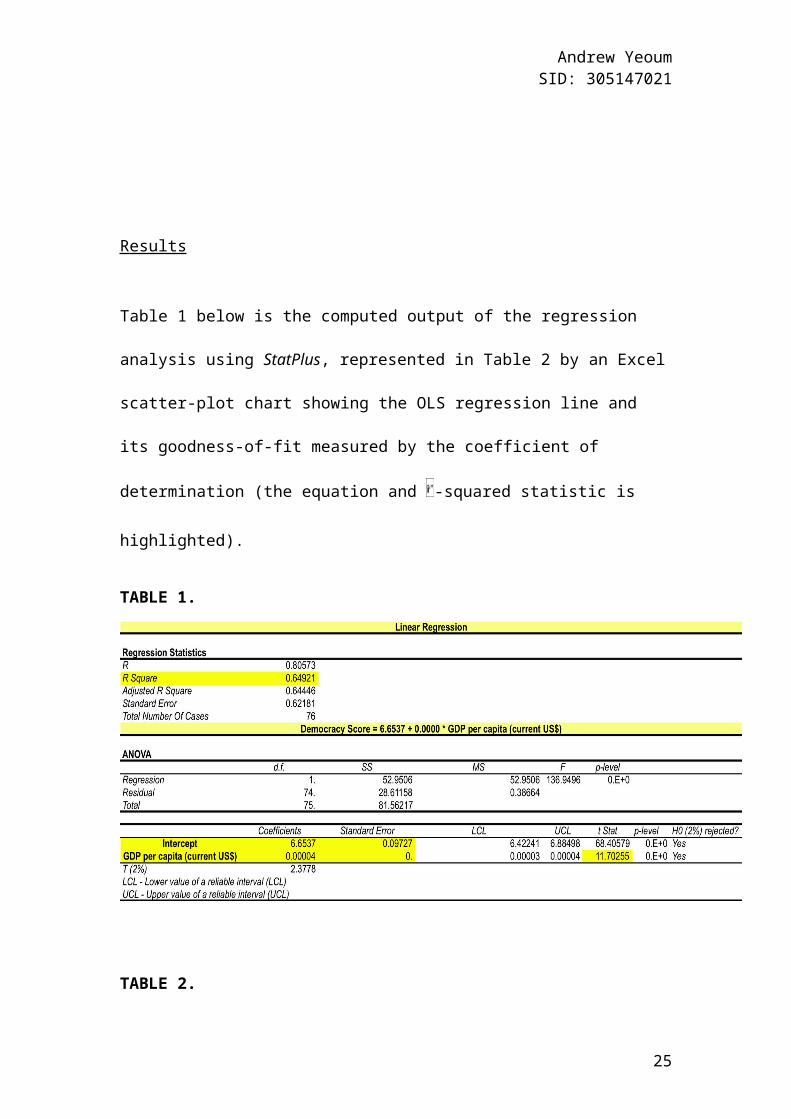
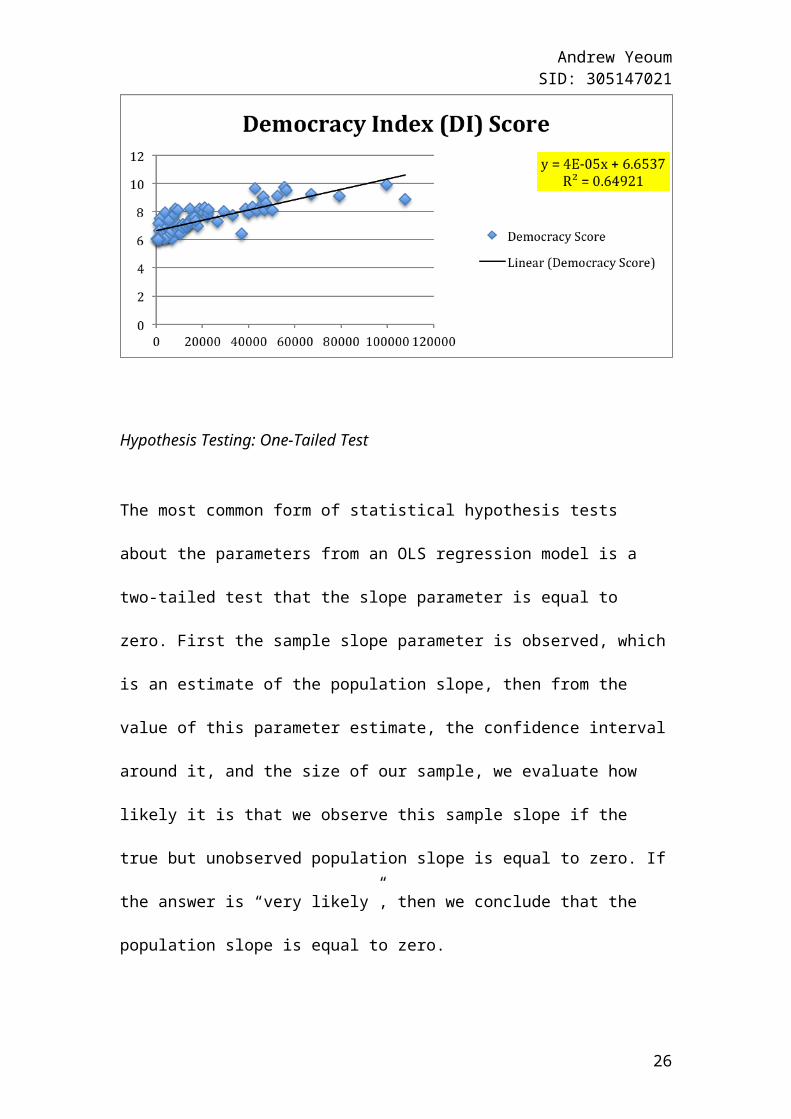
Table 1 below is the computed output of the regression
analysis using StatPlus, represented in Table 2 by an Excel
scatter-plot chart showing the OLS regression line and
its goodness-of-fit measured by the coefficient of
determination (the equation and -squared statistic is
highlighted).
TABLE 1.
TABLE 2.
25
Andrew YeoumSID: 305147021
Hypothesis Testing: One-Tailed Test
The most common form of statistical hypothesis tests
about the parameters from an OLS regression model is a
two-tailed test that the slope parameter is equal to
zero. First the sample slope parameter is observed, which
is an estimate of the population slope, then from the
value of this parameter estimate, the confidence interval
around it, and the size of our sample, we evaluate how
likely it is that we observe this sample slope if the
true but unobserved population slope is equal to zero. If
the answer is “very likely”, then we conclude that the
population slope is equal to zero.
26
Andrew YeoumSID: 305147021
In reality, though, most political science
hypotheses are that a parameter is either positive or
negative and not just that the parameter is different
from zero (Gerring 2012). Our theory is that the higher
the levels of economic development as measured by GDP per
capita, the better will be the democracy scores for the
democratic countries. In other words, it is a
directional hypothesis where we expect to see a positive
relationship between GDP per capita and democracy scores,
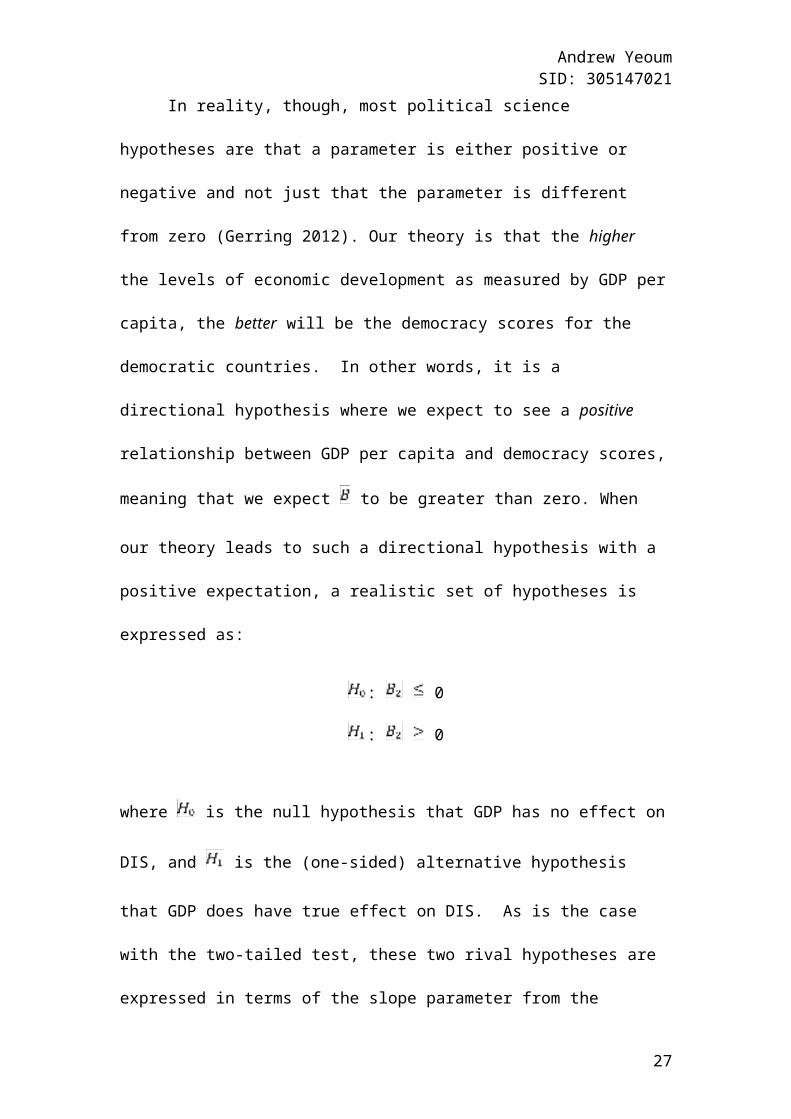
meaning that we expect to be greater than zero. When
our theory leads to such a directional hypothesis with a
positive expectation, a realistic set of hypotheses is
expressed as:
: 0
: 0
where is the null hypothesis that GDP has no effect on
DIS, and is the (one-sided) alternative hypothesis
that GDP does have true effect on DIS. As is the case
with the two-tailed test, these two rival hypotheses are
expressed in terms of the slope parameter from the
27
Andrew YeoumSID: 305147021
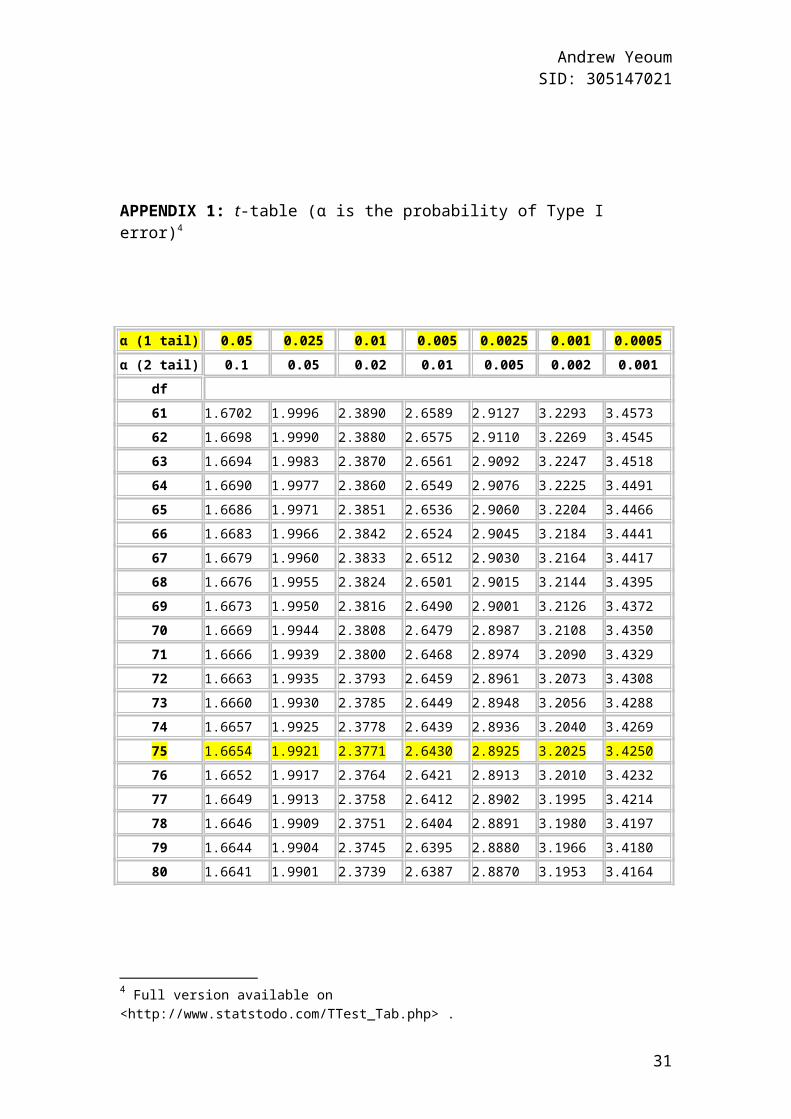
population regression model. Using the one-tail row from
the t-table in Appendix 1, we find that for 75 degrees of
freedom (d.f.), we have the following critical t values:
Level of Significance Critical t
0.01 2.3771
0.025 1.9921
0.05 1.6654
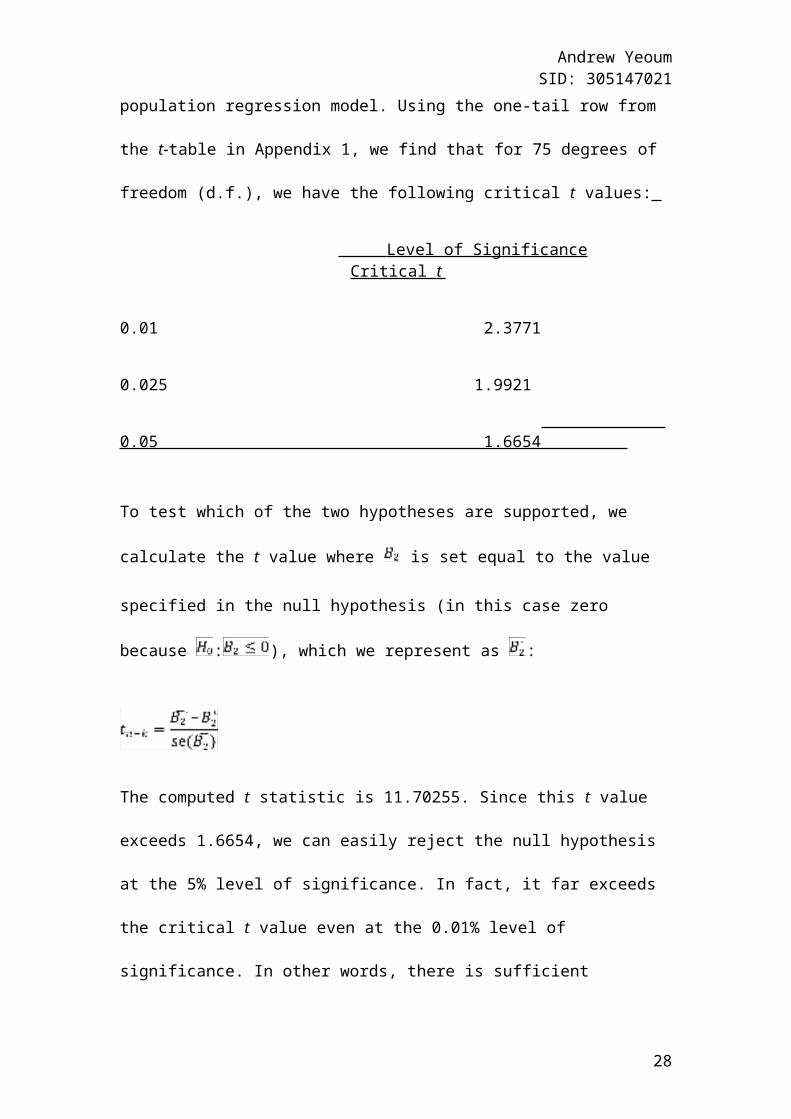
To test which of the two hypotheses are supported, we
calculate the t value where is set equal to the value
specified in the null hypothesis (in this case zero
because : ), which we represent as :
The computed t statistic is 11.70255. Since this t value
exceeds 1.6654, we can easily reject the null hypothesis
at the 5% level of significance. In fact, it far exceeds
the critical t value even at the 0.01% level of
significance. In other words, there is sufficient
28

Andrew YeoumSID: 305147021
evidence to conclude that income (GDP per capita)
increases SOD.
Goodness-of-Fit: R-Squared Statistic
The findings above illustrate that the estimated
intercept and slope coefficients are individually
statistically significant (i.e. significantly different
from zero). This suggests that the sample regression
function fits the data reasonably well. The goodness of
that fit was measured as the coefficient of
determination, . The computed statistics for our two-
variable model of democracy score is 0.64921. It
indicates that our model accounts for about 65% of the
variation in the dependent variable. Since can at most
be 1, and in our case is measured as a percentage of a
properly stationarized (rather than time) series, the
computed should be interpreted as high. It explains
almost 65% of the variation in democracy scores in 2012
with just one measure of the economy, GDP per capita.
When we start to think of all the different (Z) variables
29
Andrew YeoumSID: 305147021
– such as external influences, individual and group
agency, culture, ideology, values, historical or
geopolitical factors – that may potentially be involved
but not in this simple model, this level of accuracy is
rather impressive. In fact, it can be suggested that this
tells us something remarkable about democratic
consolidation or levels of democratic development – that
per capita income levels (and by extension, the economy)
is extremely important.
30
Andrew YeoumSID: 305147021
APPENDIX 1: t-table (α is the probability of Type I error)4
α (1 tail) 0.05 0.025 0.01 0.005 0.0025 0.001 0.0005α (2 tail) 0.1 0.05 0.02 0.01 0.005 0.002 0.001
df61 1.6702 1.9996 2.3890 2.6589 2.9127 3.2293 3.457362 1.6698 1.9990 2.3880 2.6575 2.9110 3.2269 3.454563 1.6694 1.9983 2.3870 2.6561 2.9092 3.2247 3.451864 1.6690 1.9977 2.3860 2.6549 2.9076 3.2225 3.449165 1.6686 1.9971 2.3851 2.6536 2.9060 3.2204 3.446666 1.6683 1.9966 2.3842 2.6524 2.9045 3.2184 3.444167 1.6679 1.9960 2.3833 2.6512 2.9030 3.2164 3.441768 1.6676 1.9955 2.3824 2.6501 2.9015 3.2144 3.439569 1.6673 1.9950 2.3816 2.6490 2.9001 3.2126 3.437270 1.6669 1.9944 2.3808 2.6479 2.8987 3.2108 3.435071 1.6666 1.9939 2.3800 2.6468 2.8974 3.2090 3.432972 1.6663 1.9935 2.3793 2.6459 2.8961 3.2073 3.430873 1.6660 1.9930 2.3785 2.6449 2.8948 3.2056 3.428874 1.6657 1.9925 2.3778 2.6439 2.8936 3.2040 3.426975 1.6654 1.9921 2.3771 2.6430 2.8925 3.2025 3.425076 1.6652 1.9917 2.3764 2.6421 2.8913 3.2010 3.423277 1.6649 1.9913 2.3758 2.6412 2.8902 3.1995 3.421478 1.6646 1.9909 2.3751 2.6404 2.8891 3.1980 3.419779 1.6644 1.9904 2.3745 2.6395 2.8880 3.1966 3.418080 1.6641 1.9901 2.3739 2.6387 2.8870 3.1953 3.4164
4 Full version available on <http://www.statstodo.com/TTest_Tab.php> .
31
Andrew YeoumSID: 305147021
Bibliography
Acemohlu, Daron and Robinson, James A., Economic Origins of
Dictatorship and Democracy (Cambridge University Press, 2005).
Boix, Carles, Democracy and Redistribution (Cambridge
University Press, 2003); Economic Origins of Dictatorship and
Democracy (Cambridge University Press, 2005).
Coppedge, Michael, “Defining and measuring democracy”
(2005), Working paper, International Political Science Association,
April.
Gerring, John, Social Science Methodology: A Unified Framework
(Cambridge University Press, 2012).
Huntington, Samuel P., Political Order in Changing Societies (Yale
32
Andrew YeoumSID: 305147021
University Press, 1968).
Inglehart, Ronald and Welzel, Christian, Modernization,
Cultural Change, and Democracy: The Human Development Sequence
(Cambridge University Press, 2005).
Kellstedt, Paul and Whitten, Guy, The Fundamentals of
Political Science Research (Cambridge University Press,
2009).
Lipset, Seymour Martin, “Some Social Requisites of
Democracy” (1959) 53 (1) American Political Science Review 69.
McClintock, Cynthia, “Lipset’s Legacy,” (2005) 16 (2)
Journal of Democracy 163.
O’Donnell, Guillermo A., Modernization and Bureaucratic-
Authoritarianism (University of California Press, 1973).
Przeworski, Adam, Economics and Philosophy (Cambridge
University Press, 2003).
33
Andrew YeoumSID: 305147021
Przeworski, Adam and Limongi, Fernando, “Modernization:
Theories and Facts” (1997) 49 (1) World Politics 155.
Rustow, Dankwart A., “Transitions to Democracy: Toward a
Dynamic Model” (1970) 2 (3) Comparative Politics 337.
Scmitter, Philippe and Karl, Terry, “What Democracy is…
And is Not” (1991) 12 Journal of Democracy 67.
34


