Embed Size (px)
Citation preview
Journal of Volcanology and Geothermal Research 178 (2008) 366–377
Contents lists available at ScienceDirect
Journal of Volcanology and Geothermal Research
j ourna l homepage: www.e lsev ie r.com/ locate / jvo lgeores
Ash fallout scenarios at Vesuvius: Numerical simulations and implications forhazard assessment
G. Macedonio a,⁎, A. Costa b,1, A. Folch a,2
a Istituto Nazionale di Geofisica e Vulcanologia, Osservatorio Vesuviano, Napoli, Italyb Department of Earth Sciences - University of Bristol, UK
⁎ Corresponding author.E-mail addresses: [email protected] (G. Macedonio
[email protected] (A. Folch).1 Now at Istituto Nazionale di Geofisica e Vulcano
Napoli, Italy.2 Now at Earth Science Department, Barcelona Su
Nacional de Supercomputación, Spain.
0377-0273/$ – see front matter © 2008 Elsevier B.V. Aldoi:10.1016/j.jvolgeores.2008.08.014
a b s t r a c t
a r t i c l e i n f oArticle history:
Volcanic ash fallout subsequ Received 18 February 2008Accepted 22 August 2008Available online 14 September 2008Keywords:volcanic ash falloutvolcanic hazardcomputer modelVesuvius
ent to a possible renewal of the Vesuvius activity represents a serious threat tothe highly urbanized area around the volcano. In order to assess the relative hazard we consider threedifferent possible scenarios such as those following Plinian, Sub-Plinian, and violent Strombolian eruptions.Reference eruptions for each scenario are similar to the 79 AD (Pompeii), the 1631 AD (or 472 AD) and the1944 AD Vesuvius events, respectively. Fallout deposits for the first two scenarios are modeled usingHAZMAP, a model based on a semi-analytical solution of the 2D advection–diffusion–sedimentationequation. In contrast, fallout following a violent Strombolian event is modeled by means of FALL3D, anumerical model based on the solution of the full 3D advection–diffusion–sedimentation equation which isvalid also within the atmospheric boundary layer. Inputs for models are total erupted mass, eruption columnheight, bulk grain-size, bulk component distribution, and a statistical set of wind profiles obtained by theNCEP/NCAR re-analysis. We computed ground load probability maps for different ash loadings. In the case ofa Sub-Plinian scenario, the most representative tephra loading maps in 16 cardinal directions were alsocalculated. The probability maps obtained for the different scenarios are aimed to give support to the riskmitigation strategies.
© 2008 Elsevier B.V. All rights reserved.
1. Introduction
Volcanic ash fallout constitutes a serious hazards to communitiessettled around active explosive volcanoes. The assessment of suchhazards are, consequently, a matter of importance for public safety involcanic regions like the highly urbanized area around Vesuvius,inhabited by millions of people. Hazards associated with a possiblerenewal of explosive activity at Vesuvius have been a subject of severalstudies (e.g., Barberi et al., 1990; Macedonio et al., 1990; Cioni et al.,2003). However, all previous studies assessed hazards for a Sub-Plinianscenario only and did not consider other higher and lower magnitudeevents. The most severe ash fallout hazard associated with Plinian andSub-Plinian eruptions, further subdivided in Sub-Plinian I and Sub-Plinian II by Cioni et al. (2008-this issue), is due to the collapse of roofsbecause of ash loading that potentially involves areas up to fewhundreds of km2. Effects and damage associated with a violent
), [email protected] (A. Costa),
logia, Osservatorio Vesuviano,
percomputing Center, Centro
l rights reserved.
Strombolian eruption are less severe from those of a Plinian or a Sub-Plinian scenario. However, several eruptive episodes at Etna and othervolcanoes (e.g., 1944 AD Vesuvius) have shown that eruptions of lowermagnitude can also create serious problems to local communities,especially in very urbanized areas (such as the Neapolitan area). Besidepossible roof collapses by ash loading in limited areas close to thevolcano, volcanic ash can also cause, even for minor events, severedisruption of transportation systems due to loss of visibility, disruptionto communications due to interference to radio waves or direct damageto communications, temporary shut down of airports and aerialcorridors, partial or total destruction of agricultural crops and damageto forestry, irritation of eyes and skin and potential respiratorysymptoms produced by ash inhalation. Our goal here is to investigateash fallout in the Vesuvius area for three different scenarios representa-tive of a Plinian, a Sub-Plinian I, and a violent Strombolian eruptionsrespectively using as a reference well-documented eruptions such asthose occurred in 79 AD, 1631 AD, 472 AD, and 1944 AD.
The Sub-Plinian II category, characterized by a lower intensity andMagnitude than Sub-Plinian I (Cioni et al., 2008), was not investigatedin the present study.
Among the Plininan eruptions, the 79 AD Vesuvius eruption issurely one of the most extensively studied eruptions ever. It is famousfor the destruction of the Roman towns of Pompeii and Herculaneumand for the detailed chronicles written by the Roman lawyer Pliny the
367G. Macedonio et al. / Journal of Volcanology and Geothermal Research 178 (2008) 366–377
Younger who described the events in which his uncle, Pliny the Elder,died. The volcanological aspects of the 79 AD eruption have beendescribed by numerous authors (e.g. Lirer et al., 1973; Santacroce,1983; Sigurdsson et al., 1985; Carey and Sigurdsson, 1987; Santacroce,1987; Lirer et al., 1993; Scandone et al., 1993). The eruption comprisedseveral phases. The graded Plinian fallout deposit associated with thepurely magmatic phase, with a high sustained eruption columnbetween 15 and 26 km (Carey and Sigurdsson, 1987), shows a lowerlayer of white phonolitic pumice (“White pumice”) overlaid by anupper layer of tephritic-phonolitic pumice (“Gray pumice”). Thiseruptive phase ended with the collapse of the eruptive column andthe subsequent emplacement of pyroclastic flows.
Two Sub-Plinian I eruptions are considered here (those occurred in1631 and 472 AD). The eruption occurred in 1631 AD started on 16December 1631 and produced a sustained column for about 8 h withan average height of 16 km, whereas the eruption occurred in 472 AD,also known as the “Pollena” eruption (Santacroce, 1983; Rosi andSantacroce, 1983; Mastrolorenzo et al., 2002; Principe et al., 2004;Rolandi et al., 2004; Cioni et al., 2008-this issue), produces a sustainedcolumn between 12 and 20 km.
Finally, the violent Strombolian eruption occurred in 1944 AD andwas the last eruptive event that occurred at Vesuvius. The eruptivephase started with a sequence of lava flows followed by fire-fountaining episodes which evolved into a convecting eruptivecolumn sustained for few days ending up with a phase of Vulcanianexplosions (Imbò, 1949) with maximum column height of 5 km.
For each scenario we computed ground ash load probability mapswhich can provide potential decision-support to the hazard assess-ment for future eruptions at Vesuvius.
2. Models for volcanic ash transport and fallout
The ash fallout models we apply consider only the transport anddeposition of lapilli and coarse ash, i.e., tephra particles from fewmms toseveral microns in diameter (from Φ≃−5 to Φ≃4). Beyond a certaindistance from the eruption column, the dispersion and sedimentation oftephra is governed mainly by wind transport, turbulent diffusion, andsettling of particles by gravity (Armienti et al., 1988; Macedonio et al.,1988). Particles with a similar dynamic regime are commonly groupedinto families or classes which, in general, can have interactions amongthem. Aggregation of finer particles during their fall (e.g. Cornell et al.,1983) is the most obvious evidence for particle interaction. However, ifthe concentration of particles is sufficiently dilute one can neglectinteraction among particles belonging to different classes. Under thishypothesis the concentration of particles of class j is described throughthe mass conservation equation as (Costa et al., 2006):
ACj
Atþ UX
ACj
AXþ UY
ACj
AYþ UZ−Vsj� �ACj
AZ¼ −Cjj � U þ Cj
AVsj
AZA
AXρKX
ACj=ρAX
� �þ A
AYρKY
ACj=ρAY
� �þ A
AZρKZ
ACj=ρAZ
� �þ Sj
ð1Þ
where Cj denotes concentration of particle class j, t is time, (UX,UY,UZ)are the components of the wind velocity vector, KX,KY and KZ are theturbulent diffusion coefficients (diagonal terms of the turbulentdiffusion tensor), ρ is the atmospheric density, and Vsj and Sj stand,respectively, for the terminal settling velocity and source term forclass j. The advection–diffusion–sedimentation (ADS) Eq. (1), is ofgeneral applicability and must be solved numerically. However, undercertain additional hypothesis, it can be simplified to derive analyticalor semi-analytical solutions.
2.1. A model for high eruptive column: Plinian and Sub-Plinian scenarios
For large eruptive columns most of the ash transport processoccurs outside the Atmospheric Boundary Layer (ABL). Consequently,
in a first-order approach, it can be assumed that the vertical diffusioncomponent is negligible with respect to the horizontal ones and thatthe terrain effects and the vertical wind component become a second-order effect. In addition, if one assumes also that the horizontal windcomponents are constant in time and uniform along the horizontaldomain, Eq. (1) simplifies to:
ACj
Atþ Ux
ACj
Axþ Uy
ACj
Ay−AVsjCj
Az¼ Kx
A2Cj
Ax2þ Ky
A2Cj
Ay2þ Sj: ð2Þ
The model HAZMAP (Macedonio et al., 2005) we used for thesimulations is based on a semi-analytical solution of the simplifiedEq. (2). Dividing the vertical computational domain intoNlayer layers inwhich settling and wind velocity are assumed constant, the total masson the ground MG can be computed as the sum of the contributionsfrom each of the point sources distributed above the vent and fromeach particle settling velocity class:
MG x; yð Þ ¼ ∑Nvs
j¼1∑
Nsources
i¼1
Mifj2πσ2
Gi
exp −x−xGið Þ2þ y−yGið Þ2
2σ2Gi
" #ð3Þ
where YxGi ¼ Yx0i þ ∑k→UkΔtk and σGi
2 =2KΣkΔtk are the center and thevariance of the Gaussian respectively (Δtk=(zk−zk −1)/vs,k is the timefor a particle to cross the layer k), Nsources indicates the number ofsource points, Nvs is the total number of settling velocity classes, Mi isthe total mass emitted from the point source in the layer i (ΣiMi=Mtot,with Mtot total mass injected into the system), and fj is the fraction ofthat mass belonging to the settling velocity class j (Σjfj=1). In accord toMacedonio et al. (2005) and Pfeiffer et al. (2005), the source term forthe Plinian and Sub-Plinian I eruptions was described using amodifiedparameterization proposed by Suzuki (1983).
2.2. A model for low eruptive column: the violent Strombolian scenario
For low eruptive columns (such the ones produced, for instance,during violent Strombolian events) most of the simplifying assump-tions made to reduce Eqs. (1) to (2) are not longer valid becausesignificant transport of ash occurs inside the ABL. In fact, wind fieldsand turbulent tensor components inside the ABL are much complexand terrain effects are, in general, not negligible. Moreover effects ofbent-over on the plume due to the wind are not negligible. On theother hand, since winds in the lower part of the atmosphere varyrapidly in time and in space, there is a strong need to forecast thetemporal evolution of both airborne ash concentration and ashdeposit on the ground. It follows that simplified steady semi-analytical models like HAZMAP are not fully adequate in this context.For this reason we make use of the model FALL3D (Costa et al., 2006)to simulate ash fallout for the case of the violent Strombolian scenario.This model adopts realistic near surface wind fields that account forterrain effects, uses a realistic evaluation of the turbulent atmosphericdiffusion based on the Monin–Obukhov similarity theory and a LargeEddy approach, and describe the source term using a model based onthe Buoyant Plume Theory (BPT) as in Bursik (2001). For furtherdetails about the model see Costa et al. (2006). Obviously, Eq. (1)needs to be solved numerically and, in consequence, the modelbecomes less suitable to perform statistical studies and/or to solveinverse problems because the computational requirements becomegreater.
3. Ash fallout simulations and hazard maps
In this Section we describe the volcanological and meteorologicaldata used for the analysis of ash fallout hazard from explosiveeruptions at Vesuvius and we show the obtained hazard maps for thedifferent scenarios.
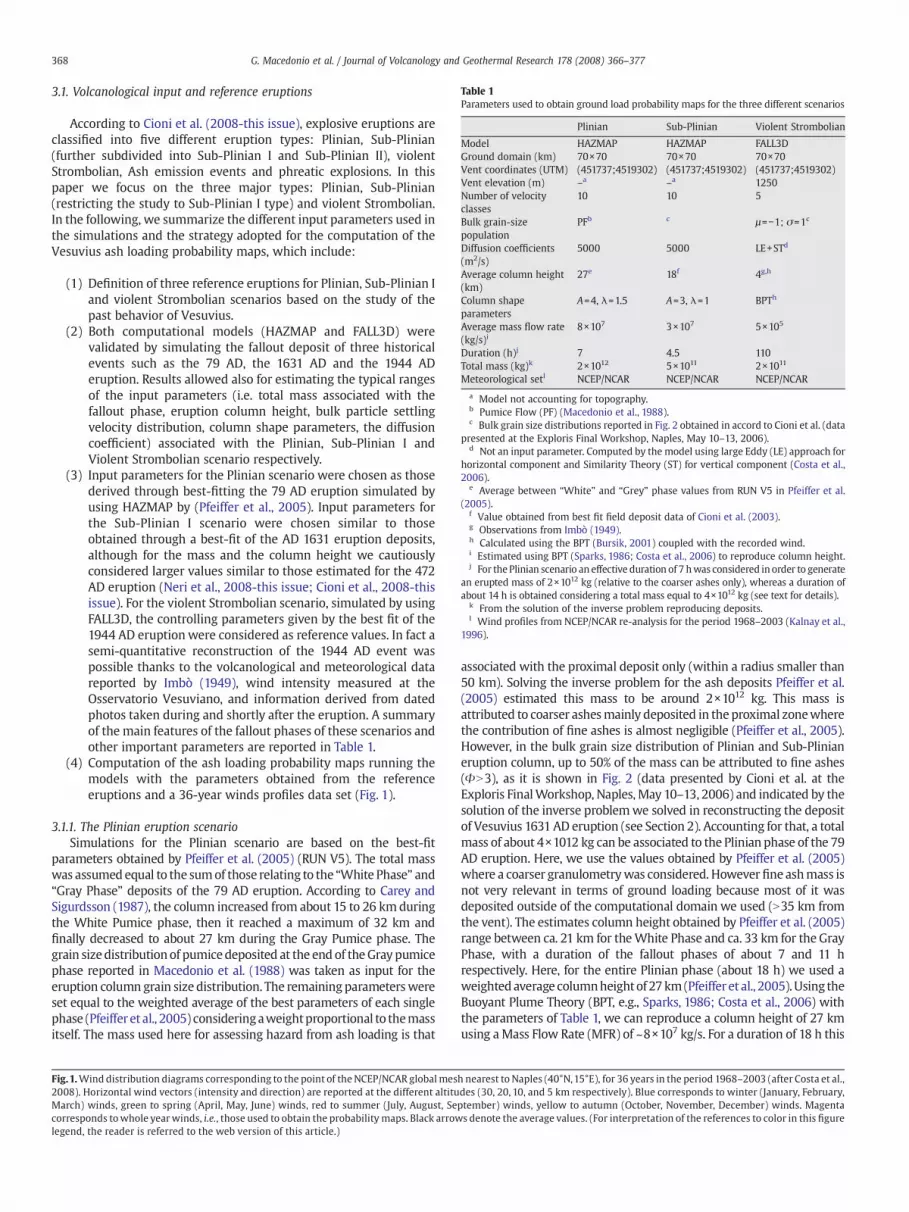
Table 1Parameters used to obtain ground load probability maps for the three different scenarios
Plinian Sub-Plinian Violent Strombolian
Model HAZMAP HAZMAP FALL3DGround domain (km) 70×70 70×70 70×70Vent coordinates (UTM) (451737;4519302) (451737;4519302) (451737;4519302)Vent elevation (m) –a –a 1250Number of velocityclasses
10 10 5
Bulk grain-sizepopulation
PFb c µ=−1; σ=1c
Diffusion coefficients(m2/s)
5000 5000 LE+STd
Average column height(km)
27e 18f 4g,h
Column shapeparameters
A=4, λ=1.5 A=3, λ=1 BPTh
Average mass flow rate(kg/s)i
8×10⁷ 3×10⁷ 5×10⁵
Duration (h)j 7 4.5 110Total mass (kg)k 2×10¹² 5×10¹¹ 2×10¹¹
Meteorological setl NCEP/NCAR NCEP/NCAR NCEP/NCAR
a Model not accounting for topography.b Pumice Flow (PF) (Macedonio et al., 1988).c Bulk grain size distributions reported in Fig. 2 obtained in accord to Cioni et al. (data
presented at the Exploris Final Workshop, Naples, May 10–13, 2006).d Not an input parameter. Computed by the model using large Eddy (LE) approach for
horizontal component and Similarity Theory (ST) for vertical component (Costa et al.,2006).
e Average between “White” and “Grey” phase values from RUN V5 in Pfeiffer et al.(2005).
f Value obtained from best fit field deposit data of Cioni et al. (2003).g Observations from Imbò (1949).h Calculated using the BPT (Bursik, 2001) coupled with the recorded wind.i Estimated using BPT (Sparks, 1986; Costa et al., 2006) to reproduce column height.j For the Plinian scenario an effective duration of 7 hwas considered in order to generate
an erupted mass of 2×10¹² kg (relative to the coarser ashes only), whereas a duration ofabout 14 h is obtained considering a total mass equal to 4×10¹² kg (see text for details).
k From the solution of the inverse problem reproducing deposits.l Wind profiles from NCEP/NCAR re-analysis for the period 1968–2003 (Kalnay et al.,
1996).
368 G. Macedonio et al. / Journal of Volcanology and Geothermal Research 178 (2008) 366–377
3.1. Volcanological input and reference eruptions
According to Cioni et al. (2008-this issue), explosive eruptions areclassified into five different eruption types: Plinian, Sub-Plinian(further subdivided into Sub-Plinian I and Sub-Plinian II), violentStrombolian, Ash emission events and phreatic explosions. In thispaper we focus on the three major types: Plinian, Sub-Plinian(restricting the study to Sub-Plinian I type) and violent Strombolian.In the following, we summarize the different input parameters used inthe simulations and the strategy adopted for the computation of theVesuvius ash loading probability maps, which include:
(1) Definition of three reference eruptions for Plinian, Sub-Plinian Iand violent Strombolian scenarios based on the study of thepast behavior of Vesuvius.
(2) Both computational models (HAZMAP and FALL3D) werevalidated by simulating the fallout deposit of three historicalevents such as the 79 AD, the 1631 AD and the 1944 ADeruption. Results allowed also for estimating the typical rangesof the input parameters (i.e. total mass associated with thefallout phase, eruption column height, bulk particle settlingvelocity distribution, column shape parameters, the diffusioncoefficient) associated with the Plinian, Sub-Plinian I andViolent Strombolian scenario respectively.
(3) Input parameters for the Plinian scenario were chosen as thosederived through best-fitting the 79 AD eruption simulated byusing HAZMAP by (Pfeiffer et al., 2005). Input parameters forthe Sub-Plinian I scenario were chosen similar to thoseobtained through a best-fit of the AD 1631 eruption deposits,although for the mass and the column height we cautiouslyconsidered larger values similar to those estimated for the 472AD eruption (Neri et al., 2008-this issue; Cioni et al., 2008-thisissue). For the violent Strombolian scenario, simulated by usingFALL3D, the controlling parameters given by the best fit of the1944 AD eruptionwere considered as reference values. In fact asemi-quantitative reconstruction of the 1944 AD event waspossible thanks to the volcanological and meteorological datareported by Imbò (1949), wind intensity measured at theOsservatorio Vesuviano, and information derived from datedphotos taken during and shortly after the eruption. A summaryof the main features of the fallout phases of these scenarios andother important parameters are reported in Table 1.
(4) Computation of the ash loading probability maps running themodels with the parameters obtained from the referenceeruptions and a 36-year winds profiles data set (Fig. 1).
3.1.1. The Plinian eruption scenarioSimulations for the Plinian scenario are based on the best-fit
parameters obtained by Pfeiffer et al. (2005) (RUN V5). The total masswas assumedequal to the sumof those relating to the “White Phase” and“Gray Phase” deposits of the 79 AD eruption. According to Carey andSigurdsson (1987), the column increased from about 15 to 26 kmduringthe White Pumice phase, then it reached a maximum of 32 km andfinally decreased to about 27 km during the Gray Pumice phase. Thegrain sizedistributionof pumicedeposited at the end of theGray pumicephase reported in Macedonio et al. (1988) was taken as input for theeruption column grain size distribution. The remaining parameterswereset equal to the weighted average of the best parameters of each singlephase (Pfeiffer et al., 2005) consideringaweightproportional to themassitself. The mass used here for assessing hazard from ash loading is that
Fig.1.Wind distribution diagrams corresponding to the point of the NCEP/NCAR globalmes2008). Horizontal wind vectors (intensity and direction) are reported at the different altituMarch) winds, green to spring (April, May, June) winds, red to summer (July, August, Secorresponds towhole year winds, i.e., those used to obtain the probability maps. Black arrowlegend, the reader is referred to the web version of this article.)
associated with the proximal deposit only (within a radius smaller than50 km). Solving the inverse problem for the ash deposits Pfeiffer et al.(2005) estimated this mass to be around 2×10¹² kg. This mass isattributed to coarser ashesmainly deposited in the proximal zonewherethe contribution of fine ashes is almost negligible (Pfeiffer et al., 2005).However, in the bulk grain size distribution of Plinian and Sub-Plinianeruption column, up to 50% of the mass can be attributed to fine ashes(ΦN3), as it is shown in Fig. 2 (data presented by Cioni et al. at theExploris FinalWorkshop, Naples, May 10–13, 2006) and indicated by thesolution of the inverse problemwe solved in reconstructing the depositof Vesuvius 1631 AD eruption (see Section 2). Accounting for that, a totalmass of about 4×10¹² kg can be associated to the Plinian phase of the 79AD eruption. Here, we use the values obtained by Pfeiffer et al. (2005)where a coarser granulometrywas considered. However fine ashmass isnot very relevant in terms of ground loading because most of it wasdeposited outside of the computational domain we used (N35 km fromthe vent). The estimates column height obtained by Pfeiffer et al. (2005)range between ca. 21 km for theWhite Phase and ca. 33 km for the GrayPhase, with a duration of the fallout phases of about 7 and 11 hrespectively. Here, for the entire Plinian phase (about 18 h) we used aweightedaverage columnheightof 27km(Pfeiffer et al., 2005).Using theBuoyant Plume Theory (BPT, e.g., Sparks, 1986; Costa et al., 2006) withthe parameters of Table 1, we can reproduce a column height of 27 kmusing aMass Flow Rate (MFR) of ~8×10⁷ kg/s. For a duration of 18 h this
h nearest to Naples (40°N,15°E), for 36 years in the period 1968–2003 (after Costa et al.,des (30, 20, 10, and 5 km respectively). Blue corresponds to winter (January, February,ptember) winds, yellow to autumn (October, November, December) winds. Magentas denote the average values. (For interpretation of the references to color in this figure
369G. Macedonio et al. / Journal of Volcanology and Geothermal Research 178 (2008) 366–377

Fig. 2. Bulk grain size distribution considered as representative for a Plinian/Sub-Plinianeruption column (on the top) and for a violent Strombolian eruption column (on thebottom) respectively. Bulk values of 80% pumices and 20% lithics/crystal were considered.
370 G. Macedonio et al. / Journal of Volcanology and Geothermal Research 178 (2008) 366–377
means a total mass of about 5×10¹² kg which is comparable with thevalue we found through best fit considering 50% of fine ash mass.
3.1.2. The Sub-Plinian I eruption scenarioInput parameters for the Sub-Plinian I scenario were found
through best fitting field deposits data from Cioni et al. (2003). Inthis case since we do not have direct information on the grain sizedistribution inside the column, the bulk grain size distribution chosenas representative of a Sub-Plinian I eruption is that of Fig. 2 (in accordto Cioni et al. (2008-this issue) and reported by Cioni et al. at theExploris Final Workshop, Naples, May 10–13, 2006). Results of thefitting procedure are shown in Fig. 3. The total mass of the 1631 ADeruptionwas estimated to be about 2×10¹¹ kg with an average columnheight of about 16 km.
Using the BPT (e.g., Sparks,1986; Bursik, 2001)with these values,wecan reproduce a column height of 16 kmwith a MFR of ~2×10⁷ kg/s.
The above parameters were obtained through a minimizationprocedure which accounted for the best fit of the total final depositsand, at the same time, of deposits associated with both “Black” and“White” phases. In particular, the inverse problem we solved for thesingle phases indicated that column height associated with the initial“Black” phase was ≳ 20 kmwith a total mass of ~1.5×10¹¹ kg whereasthe height associated with the “White” phase was ≲ 10 kmwith a totalmass of ~0.5×10¹¹ kg.
Moreover, using the BPT model we obtained a mass flow rate of~4×10⁷ kg/s for the “Black” phase and ~3×10⁶ kg/s for the “White”
phase. Considering a total mass of ~1.5×10¹¹ kg for the “Black” phaseand ~0.5×10¹¹ kg for the “White” phase, we have a duration of about1–3 h for the “Black” phase and 5–7 h for the “White” phase. Thesevalues are comparable with the total mass of 1.8×10¹¹ kg (0.07 km3DRE) estimated from isopachs of the deposits by Rosi et al. (1993).
The 472 AD (“Pollena”) eruption, also Sub-Plinian I, produced acolumn with a height between 12 and 20 km (Sulpizio et al., 2005).However, there are different estimations about the volume of thedeposit of the Pollena eruption, such as: 0.32 km3 (Rosi andSantacroce, 1983), 0.5 km3 (Mastrolorenzo et al., 2002), 0.42 km3
(Cioni et al., 2003), 1.2 km3 (Rolandi et al., 2004), and 1.38 km3
(Sulpizio et al., 2005), corresponding, respectively, to a mass of2.9×1011, 4.5×10¹¹, 3.8×10¹¹, 1.1×10¹² and 1.2×10¹² kg (assuming amean deposit density of 900 kg/m3 as reported in Cioni et al. (2003)).
Here, following Cioni et al. (2008-this issue), for the mass of theSub-Plinian I scenario (see Table 1), we adopt the average value of5×1011 kg which corresponds to a deposit of about 0.5 km3.Moreover, a column height of 18 km was adopted for Sub-Plinian Ieruptions. Scenarios corresponding to greater volumes, such as thosesuggested by Sulpizio et al. (2005), are implicitly considered in thePlinian scenario.
3.1.3. The violent Strombolian scenarioThe explosive phase of the 1944 AD eruption started during the
night of 21 March. Following a series of fire-fountaining episodes, theeruption intensity increased to form a convecting eruptive column. Amaximum column height of about 6 km was reached around 1 p.m.(local time) on 22 March. Eruptive columns from 2 to 4 km wereproduced in the following days (from 23 to 26 March). In order toreconstruct the wind field during this period we used records from aground station located at the Osservatorio Vesuviano historicalbuilding (in Herculaneum) as well as a “pseudo-sounding” at thesame location. Upper air winds were constrained by Imbo's descrip-tion (Imbò, 1949). On March 23 upper wind intensity varied fromabout 17 m/s at 5 km to 11 m/s at 1.3 km and had a NW direction.Lower wind intensity was around 4 m/s at 1 km blowing from Wdirection. A sudden increase of wind intensity (of about 10–15 m/s)and change in direction (to NNE) were observed on March 25. In orderto reconstruct the 1944 event, measured winds were spatiallyassimilated on a fine scale (accounting for topographic effects) andtemporally interpolated by using the meteorological processorCALMET (Scire et al., 2000). Themass of the explosive phase estimatedfrom the deposits is about 2.5×10¹¹ kg (Cioni et al., 2003), inagreement with the volume of violent Strombolian eruptions of theorder of 108 m3, or less, reported by Cioni et al. (2008-this issue) andthe column height reached a maximum of 5 km (Cioni et al., 2003).Using a buoyant plume theory which accounts for plume bent overdue to wind (Bursik, 2001), essential for low eruption columns, wecame out with an average mass flow rate of 5×10⁵ kg/s (in agreementwith Cioni et al., 2008-this issue), in order to reproduce the observedaverage column height of about 4 km. Considering this average massflow rate and the duration of the explosive phase (about 120 h) theerupted mass would be 2.16×10¹¹ kg, a value in good agreement withthat reported by Cioni et al. (2003).
Bulk granulometry reported in Fig. 2 is used as representative ofgrain-size distribution of a violent Strombolian eruption column.
The rest of the input parameters were evaluated through a semi-quantitative reconstruction of the event by using FALL3D model.Simulation results show good agreement with observations (seeFig. 4). In fact, besides the excellent reproduction of the total mass, thismodel was able to reconstruct satisfactorily the observed deposits.The area enclosed by the 10 cm isopach is about 180 km2, close to the270 km2 reported in Cioni et al. (2003). Some deposit values observedwere from 30 to 100 cm at Terzigno, 10 cm at Angri and Pagani, and3 cm at Meta di Sorrento (Imbò, 1949). These values are in goodagreement with the simulation, which gives 74.3 cm at Terzigno,
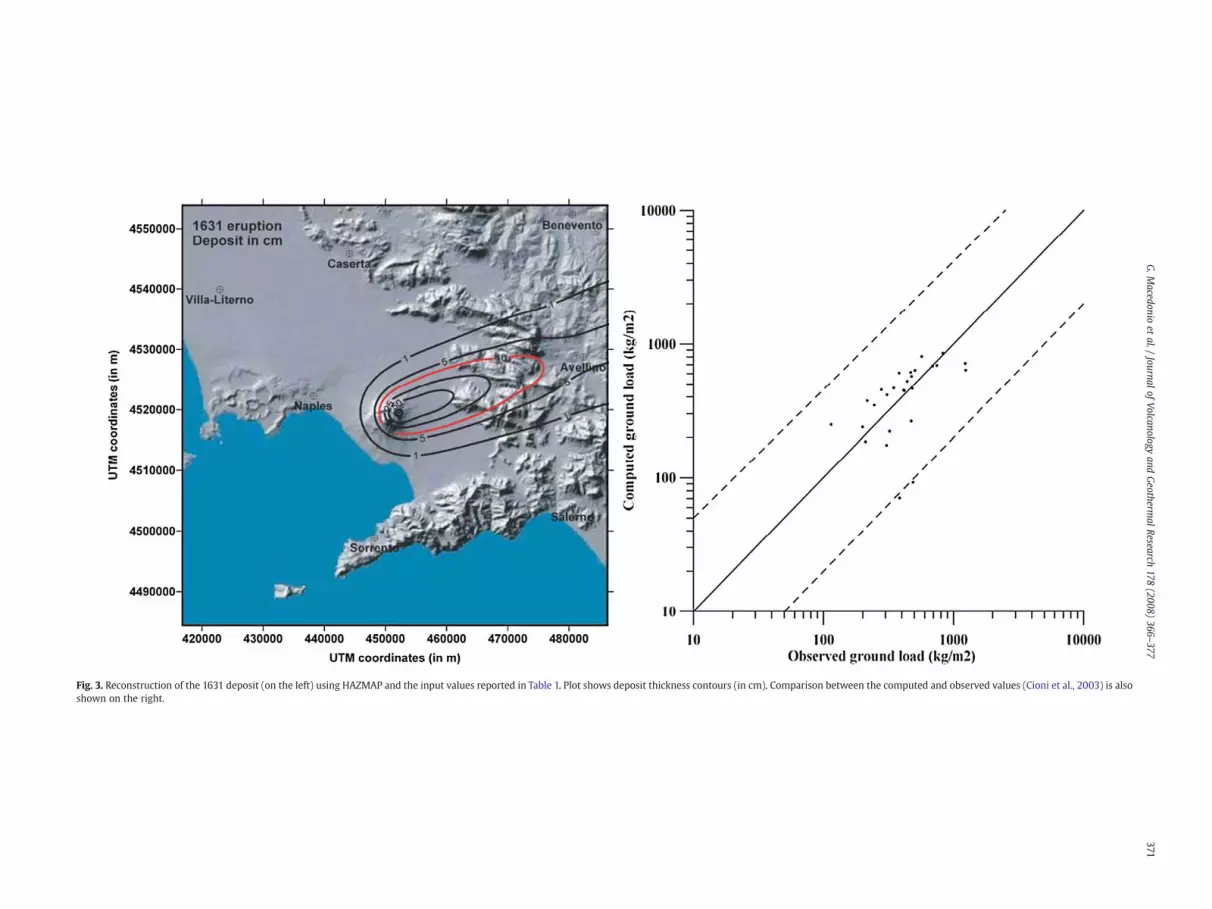
Fig. 3. Reconstruction of the 1631 deposit (on the left) using HAZMAP and the input values reported in Table 1. Plot shows deposit thickness contours (in cm). Comparison betwe the computed and observed values (Cioni et al., 2003) is alsoshown on the right.
371G.M
acedonioet
al./Journal
ofVolcanology
andGeotherm
alResearch
178(2008)
366–377
en
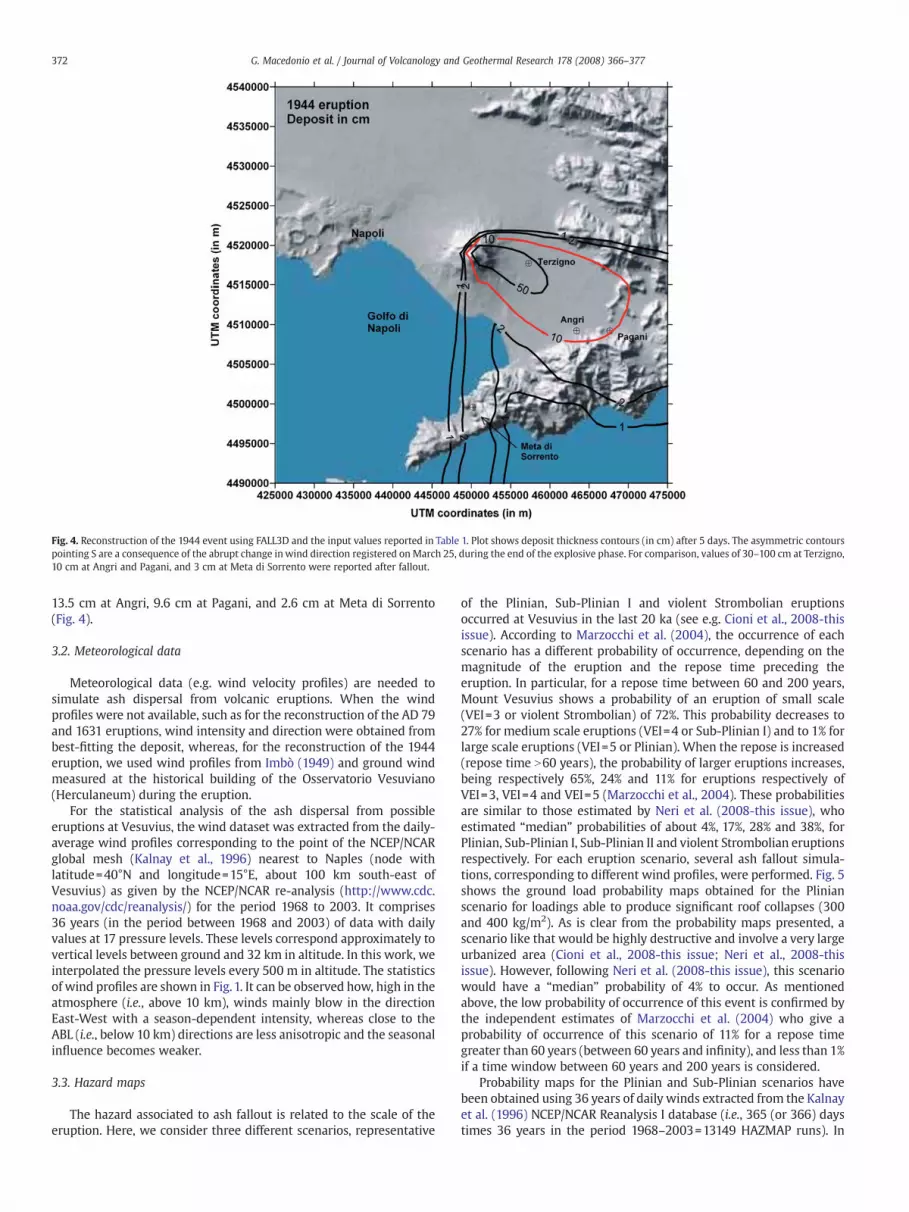
Fig. 4. Reconstruction of the 1944 event using FALL3D and the input values reported in Table 1. Plot shows deposit thickness contours (in cm) after 5 days. The asymmetric contourspointing S are a consequence of the abrupt change inwind direction registered on March 25, during the end of the explosive phase. For comparison, values of 30–100 cm at Terzigno,10 cm at Angri and Pagani, and 3 cm at Meta di Sorrento were reported after fallout.
372 G. Macedonio et al. / Journal of Volcanology and Geothermal Research 178 (2008) 366–377
13.5 cm at Angri, 9.6 cm at Pagani, and 2.6 cm at Meta di Sorrento(Fig. 4).
3.2. Meteorological data
Meteorological data (e.g. wind velocity profiles) are needed tosimulate ash dispersal from volcanic eruptions. When the windprofiles were not available, such as for the reconstruction of the AD 79and 1631 eruptions, wind intensity and direction were obtained frombest-fitting the deposit, whereas, for the reconstruction of the 1944eruption, we used wind profiles from Imbò (1949) and ground windmeasured at the historical building of the Osservatorio Vesuviano(Herculaneum) during the eruption.
For the statistical analysis of the ash dispersal from possibleeruptions at Vesuvius, the wind dataset was extracted from the daily-average wind profiles corresponding to the point of the NCEP/NCARglobal mesh (Kalnay et al., 1996) nearest to Naples (node withlatitude=40°N and longitude=15°E, about 100 km south-east ofVesuvius) as given by the NCEP/NCAR re-analysis (http://www.cdc.noaa.gov/cdc/reanalysis/) for the period 1968 to 2003. It comprises36 years (in the period between 1968 and 2003) of data with dailyvalues at 17 pressure levels. These levels correspond approximately tovertical levels between ground and 32 km in altitude. In this work, weinterpolated the pressure levels every 500 m in altitude. The statisticsof wind profiles are shown in Fig. 1. It can be observed how, high in theatmosphere (i.e., above 10 km), winds mainly blow in the directionEast-West with a season-dependent intensity, whereas close to theABL (i.e., below 10 km) directions are less anisotropic and the seasonalinfluence becomes weaker.
3.3. Hazard maps
The hazard associated to ash fallout is related to the scale of theeruption. Here, we consider three different scenarios, representative
of the Plinian, Sub-Plinian I and violent Strombolian eruptionsoccurred at Vesuvius in the last 20 ka (see e.g. Cioni et al., 2008-thisissue). According to Marzocchi et al. (2004), the occurrence of eachscenario has a different probability of occurrence, depending on themagnitude of the eruption and the repose time preceding theeruption. In particular, for a repose time between 60 and 200 years,Mount Vesuvius shows a probability of an eruption of small scale(VEI=3 or violent Strombolian) of 72%. This probability decreases to27% for medium scale eruptions (VEI=4 or Sub-Plinian I) and to 1% forlarge scale eruptions (VEI=5 or Plinian). When the repose is increased(repose time N60 years), the probability of larger eruptions increases,being respectively 65%, 24% and 11% for eruptions respectively ofVEI=3, VEI=4 and VEI=5 (Marzocchi et al., 2004). These probabilitiesare similar to those estimated by Neri et al. (2008-this issue), whoestimated “median” probabilities of about 4%, 17%, 28% and 38%, forPlinian, Sub-Plinian I, Sub-Plinian II and violent Strombolian eruptionsrespectively. For each eruption scenario, several ash fallout simula-tions, corresponding to different wind profiles, were performed. Fig. 5shows the ground load probability maps obtained for the Plinianscenario for loadings able to produce significant roof collapses (300and 400 kg/m2). As is clear from the probability maps presented, ascenario like that would be highly destructive and involve a very largeurbanized area (Cioni et al., 2008-this issue; Neri et al., 2008-thisissue). However, following Neri et al. (2008-this issue), this scenariowould have a “median” probability of 4% to occur. As mentionedabove, the low probability of occurrence of this event is confirmed bythe independent estimates of Marzocchi et al. (2004) who give aprobability of occurrence of this scenario of 11% for a repose timegreater than 60 years (between 60 years and infinity), and less than 1%if a time window between 60 years and 200 years is considered.
Probability maps for the Plinian and Sub-Plinian scenarios havebeen obtained using 36 years of daily winds extracted from the Kalnayet al. (1996) NCEP/NCAR Reanalysis I database (i.e., 365 (or 366) daystimes 36 years in the period 1968–2003=13149 HAZMAP runs). In
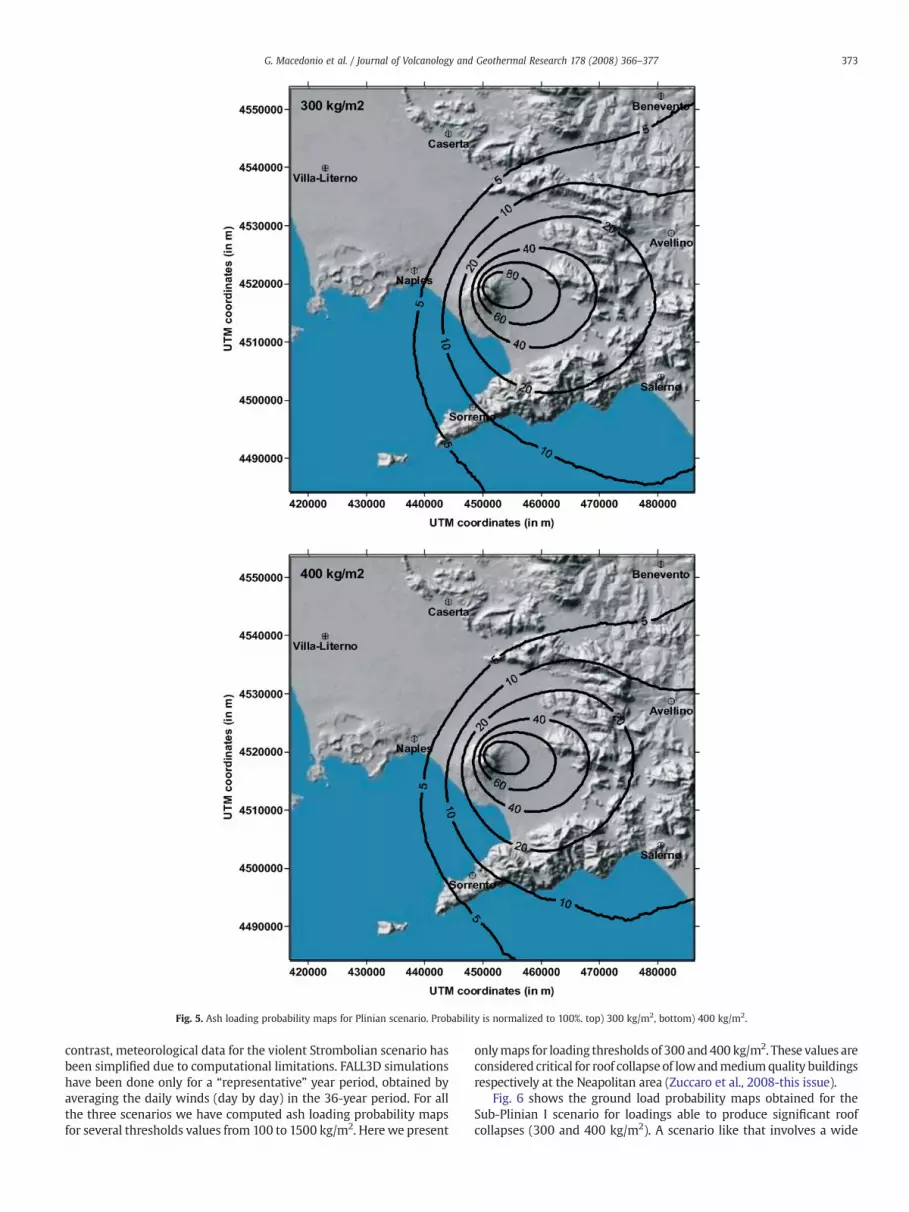
Fig. 5. Ash loading probability maps for Plinian scenario. Probability is normalized to 100%. top) 300 kg/m2, bottom) 400 kg/m2.
373G. Macedonio et al. / Journal of Volcanology and Geothermal Research 178 (2008) 366–377
contrast, meteorological data for the violent Strombolian scenario hasbeen simplified due to computational limitations. FALL3D simulationshave been done only for a “representative” year period, obtained byaveraging the daily winds (day by day) in the 36-year period. For allthe three scenarios we have computed ash loading probability mapsfor several thresholds values from 100 to 1500 kg/m2. Here we present
onlymaps for loading thresholds of 300 and 400 kg/m2. These values areconsidered critical for roof collapse of lowandmediumquality buildingsrespectively at the Neapolitan area (Zuccaro et al., 2008-this issue).
Fig. 6 shows the ground load probability maps obtained for theSub-Plinian I scenario for loadings able to produce significant roofcollapses (300 and 400 kg/m2). A scenario like that involves a wide
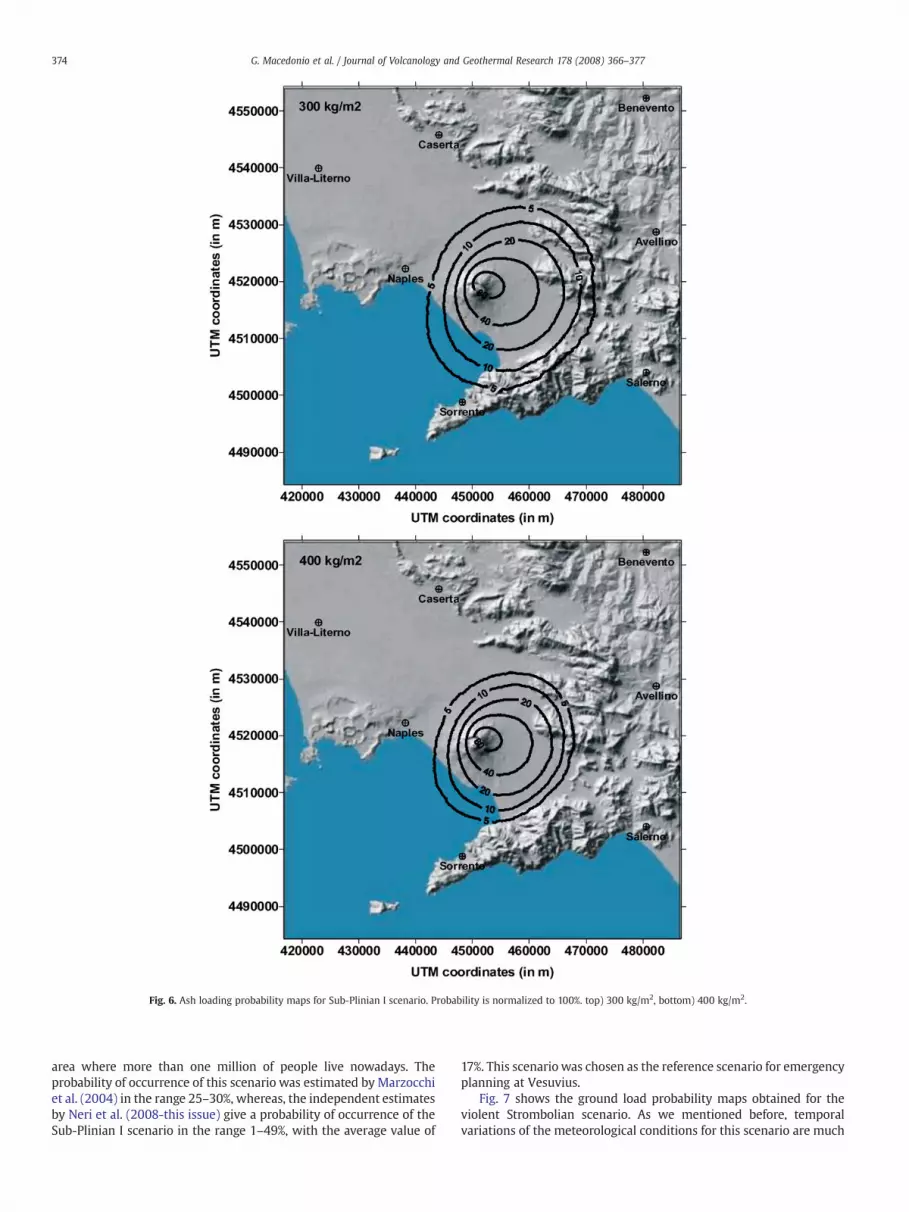
Fig. 6. Ash loading probability maps for Sub-Plinian I scenario. Probability is normalized to 100%. top) 300 kg/m2, bottom) 400 kg/m2.
374 G. Macedonio et al. / Journal of Volcanology and Geothermal Research 178 (2008) 366–377
area where more than one million of people live nowadays. Theprobability of occurrence of this scenario was estimated by Marzocchiet al. (2004) in the range 25–30%, whereas, the independent estimatesby Neri et al. (2008-this issue) give a probability of occurrence of theSub-Plinian I scenario in the range 1–49%, with the average value of
17%. This scenario was chosen as the reference scenario for emergencyplanning at Vesuvius.
Fig. 7 shows the ground load probability maps obtained for theviolent Strombolian scenario. As we mentioned before, temporalvariations of the meteorological conditions for this scenario are much

Fig. 7. Ash loading probability maps for violent Strombolian scenario. Probability is normalized to 100%. top) 300 kg/m2, bottom) 400 kg/m2.
375G. Macedonio et al. / Journal of Volcanology and Geothermal Research 178 (2008) 366–377
more important because of both the lower eruptive column and thelonger eruption duration. In order to capture these features simula-tions for hazard assessment have been done using an “average”meteorological year obtained by the 36-years average daily winds andconsidering an eruption which starts every 5 days with a duration of5 days. Note that this approach is not consistent with the previous
methodology for hazard assessment. In fact we have not performed13149 simulations relative to the 36 years but the probability maps inthis case were made considering only 73 (365/5) final outputs.
As for the previous cases, in Fig. 7 we report the ground loadprobability maps obtained for the violent Strombolian scenario forloadings of 300 and 400 kg/m2. As previously discussed this is the
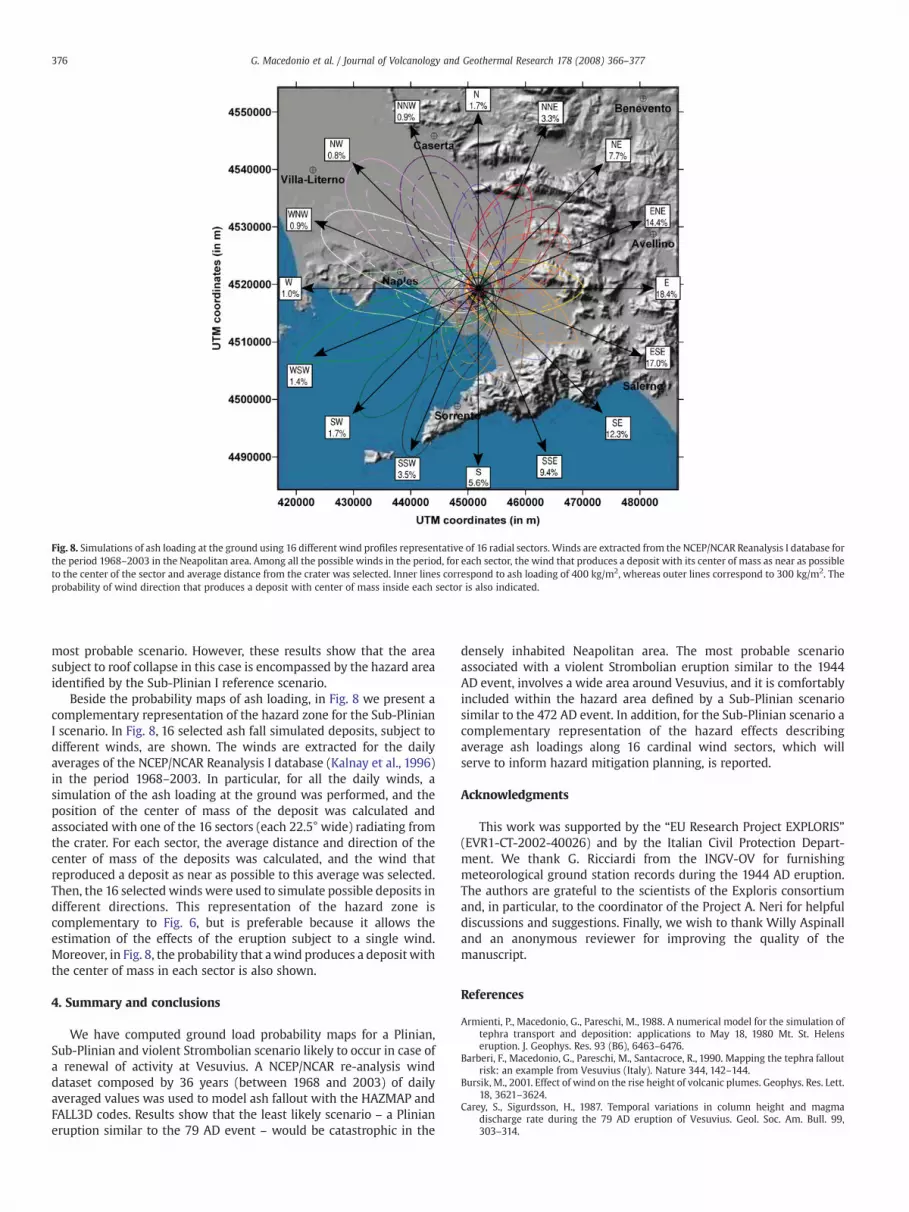
Fig. 8. Simulations of ash loading at the ground using 16 different wind profiles representative of 16 radial sectors. Winds are extracted from the NCEP/NCAR Reanalysis I database forthe period 1968–2003 in the Neapolitan area. Among all the possible winds in the period, for each sector, the wind that produces a deposit with its center of mass as near as possibleto the center of the sector and average distance from the crater was selected. Inner lines correspond to ash loading of 400 kg/m2, whereas outer lines correspond to 300 kg/m2. Theprobability of wind direction that produces a deposit with center of mass inside each sector is also indicated.
376 G. Macedonio et al. / Journal of Volcanology and Geothermal Research 178 (2008) 366–377
most probable scenario. However, these results show that the areasubject to roof collapse in this case is encompassed by the hazard areaidentified by the Sub-Plinian I reference scenario.
Beside the probability maps of ash loading, in Fig. 8 we present acomplementary representation of the hazard zone for the Sub-PlinianI scenario. In Fig. 8, 16 selected ash fall simulated deposits, subject todifferent winds, are shown. The winds are extracted for the dailyaverages of the NCEP/NCAR Reanalysis I database (Kalnay et al., 1996)in the period 1968–2003. In particular, for all the daily winds, asimulation of the ash loading at the ground was performed, and theposition of the center of mass of the deposit was calculated andassociated with one of the 16 sectors (each 22.5° wide) radiating fromthe crater. For each sector, the average distance and direction of thecenter of mass of the deposits was calculated, and the wind thatreproduced a deposit as near as possible to this average was selected.Then, the 16 selected winds were used to simulate possible deposits indifferent directions. This representation of the hazard zone iscomplementary to Fig. 6, but is preferable because it allows theestimation of the effects of the eruption subject to a single wind.Moreover, in Fig. 8, the probability that awind produces a deposit withthe center of mass in each sector is also shown.
4. Summary and conclusions
We have computed ground load probability maps for a Plinian,Sub-Plinian and violent Strombolian scenario likely to occur in case ofa renewal of activity at Vesuvius. A NCEP/NCAR re-analysis winddataset composed by 36 years (between 1968 and 2003) of dailyaveraged values was used to model ash fallout with the HAZMAP andFALL3D codes. Results show that the least likely scenario – a Plinianeruption similar to the 79 AD event – would be catastrophic in the
densely inhabited Neapolitan area. The most probable scenarioassociated with a violent Strombolian eruption similar to the 1944AD event, involves a wide area around Vesuvius, and it is comfortablyincluded within the hazard area defined by a Sub-Plinian scenariosimilar to the 472 AD event. In addition, for the Sub-Plinian scenario acomplementary representation of the hazard effects describingaverage ash loadings along 16 cardinal wind sectors, which willserve to inform hazard mitigation planning, is reported.
Acknowledgments
This work was supported by the “EU Research Project EXPLORIS”(EVR1-CT-2002-40026) and by the Italian Civil Protection Depart-ment. We thank G. Ricciardi from the INGV-OV for furnishingmeteorological ground station records during the 1944 AD eruption.The authors are grateful to the scientists of the Exploris consortiumand, in particular, to the coordinator of the Project A. Neri for helpfuldiscussions and suggestions. Finally, we wish to thank Willy Aspinalland an anonymous reviewer for improving the quality of themanuscript.
References
Armienti, P., Macedonio, G., Pareschi, M., 1988. A numerical model for the simulation oftephra transport and deposition: applications to May 18, 1980 Mt. St. Helenseruption. J. Geophys. Res. 93 (B6), 6463–6476.
Barberi, F., Macedonio, G., Pareschi, M., Santacroce, R., 1990. Mapping the tephra falloutrisk: an example from Vesuvius (Italy). Nature 344, 142–144.
Bursik, M., 2001. Effect of wind on the rise height of volcanic plumes. Geophys. Res. Lett.18, 3621–3624.
Carey, S., Sigurdsson, H., 1987. Temporal variations in column height and magmadischarge rate during the 79 AD eruption of Vesuvius. Geol. Soc. Am. Bull. 99,303–314.
377G. Macedonio et al. / Journal of Volcanology and Geothermal Research 178 (2008) 366–377
Cioni, R., Longo, A., Macedonio, G., Santacroce, R., Sbrana, A., Sulpizio, D., Andronico, D.,2003. Assessing pyroclastic fall hazard through field data and numericalsimulations: example from Vesuvius. J. Geophys. Res. 108 (B2), 2063–2073.
Cioni, R., Bertagnini, A., Santacroce, R., Andronico, D., 2008. Explosive a activity anderuption scenarios at Somma–Vesuvius (Italy): a review. J. Volcanol. Geotherm. Res.178, 331–346 (this issue).
Cornell, W., Carey, S., Sigurdsson, H., 1983. Computer simulation and transport of theCampanian Y-5 ash. J. Volcanol. Geotherm. Res. 17, 89–109.
Costa, A., Macedonio, G., Folch, A., 2006. A three-dimensional Eulerian model fortransport and deposition of volcanic ashes. Earth Planet. Sci. Lett. 241, 634–647.
Costa, A., Dell'Erba, F., Di Vitoi, M., Isaiai, R.G.M., Orsi, G., Pfeiffer, T., 2008. Assessment ofthe volcanic ash loading hazard from Phlegrean Fields Caldera (Italy). Bull. Volcanol.66, 703–724. doi:10.1007/s00445-008-0220-3.
Imbò, G., 1949. Annali dell'Osservatorio Vesuviano - Volume unico celebrativo del Icentenario dell'Osservatorio Vesuviano. Stabilimento Tipografico G. Genovese,Napoli, Italy.
Kalnay, E., Kanamitsu, M., Kister, R., Collins,W., Deaven, D., Gandin, L., Iredell, M., Saha,S.G.W.,Woollen, J., Zhu, Y., Chelliah,M., Ebisuzaki, M., Higgins,W., Janowiak, J., Mo,K., Ropelewski, C., Wang, J., Leetmaa, A., Reynolds, R., Jenne, R., Joseph, D., 1996.The NCEP/NCAR 40-years reanalysis project. Bull. Am. Meteorol. Soc. 77, 437–470data available at http://www.cdc.noaa.gov/cdc/reanalysis/.
Lirer, L., Pescatore, T., Booth, B., Walker, G., 1973. Two plinian pumice-fall deposits fromSomma–Vesuvius, Italy. Geol. Soc. Am. Bull. 84, 759–772.
Lirer, L., Munno, R., Petrosino, P., Vinci, A., 1993. Tephrostratigraphy of teh A.D. 79pyroclastic deposits in the perivolcanic area of Vesuvius. J. Volcanol. Geotherm. Res.58, 133–149.
Macedonio, G., Pareschi, M., Santacroce, R., 1990. Renewal of volcanic activity atVesuvius: tephra fallout. J. Volcanol. Geotherm. Res. 40, 327–342.
Macedonio, G., Pareschi, M., Santacroce, R., 1988. A numerical simulation of the Plinianfall phase of the 79 AD eruption of Vesuvius. J. Geophys. Res. 93 (B12), 14817–14827.
Macedonio, G., Costa, A., Longo, A., 2005. A computer model for volcanic ash fallout andassessment of subsequent hazard. Comput. Geosci. 31, 837–845.
Marzocchi, W., Sandri, L., Gasparini, P., Newhall, C., Boschi, E., 2004. Quantifyingprobabilities of volcanic events: the example of volcanic hazard at Mount Vesuvius.J. Geophys. Res. 109 (B11201). doi:10.1029/2004JB003155 18 pp.
Mastrolorenzo, G., Palladino, D., Vecchio, G., Taddeucci, J., 2002. The 472 AD Pollenaeruption of Somma–Vesuvius (Italy) and its environmental impact at the end of theRoman Empire. J. Volcanol. Geotherm. Res. 113, 19–36.
Neri, A., Aspinall, W., Cioni, R., Bertagnini, A., Baxter, P., Zuccaro, G., Andronico, D.,Barsotti, S., Cole, P., Esposti Ongaro, T., Hincks, T., Macedonio, G., Papale, P., Rosi, M.,Santacroce, R., Woo, G., 2008. Developing an event tree for probabilistic hazard andrisk assessment at Vesuvius. J. Volcanol. Geotherm. Res. 178, 397–415 (this issue).
Pfeiffer, T., Costa, A., Macedonio, G., 2005. A model for the numerical simulation oftephra fall deposits. J. Volcanol. Geotherm. Res. 140, 273–294.
Principe, C., Tanguy, J., Arrighi, S., Paiotti, A., Le Goff, M., Zoppi, U., 2004. Chronology ofVesuvius' activity from A.D. 79 to 1631 based on archaeomagnetism of lavas andhistorical sources. Bull. Volcanol. 66, 703–724. doi:10.1007/s00445-004-0348-8.
Rolandi, G., Munno, R., Postiglione, I., 2004. The AD 472 eruption of the Somma volcano.J. Volcanol. Geotherm. Res. 129, 291–319.
Rosi, M., Santacroce, R., 1983. The A.D. 472 “Pollena” Eruption: volcanological andpetrological data from this poorly known Plinian-type event at Vesuvius. J. Volcanol.Geotherm. Res. 17, 249–271.
Rosi, M., Principe, C., Vecci, R., 1993. The 1631 Vesuvian eruption: a reconstruction basedon historical and stratigraphical data,. J. Volcanol. Geotherm. Res. 58, 151–182.
Santacroce, R., 1983. A general model for the behaviour of the Somma Vesuvius volcaniccomplex. J. Volcanol. Geotherm. Res. 17, 237–248.
Santacroce, R. (Ed.), 1987. Somma-Vesuvius. Vol. Monografia n. 114(8) of Quaderni de LaRicerca Scientifica. CNR, Roma. 230 pp.
Scandone, R., Giacomelli, L., Gasparini, P., 1993. Mount Vesuvius: 2000 yrs ofvolcanological observations. J. Volcanol. Geotherm. Res. 58, 263–271.
Scire,, J.S., Robe, F.R., Fernau, M.E., Yamartino, R.J., 2000. A User's Guide for the CALMETMeteorological Model. Tech. Rep. Version 5. Earth Tech, Inc., 196 Baker Avenue,Concord, MA 01742.
Sigurdsson, H., Carey, S., Cornell, W., Pescatore, T., 1985. The eruption of Vesuvius in A.D.79. Natl. Geogr. Res. 1, 332–387.
Sparks, R., 1986. The dimensions and dynamics of volcanic eruption columns. Bull.Volcanol. 48, 3–15.
Sulpizio, R., Mele, D., Dellino, P., La Volpe, L., 2005. A complex, subplinian-type eruption fromlow-viscosity tephritic to tephritic-phonolitic magma: the AD 472 (Pollena) eruption ofSomma–Vesuvius, Italy. Bull. Volcanol. 67, 673–767. doi:10.1007/s00445-005-0414-x.
Suzuki, T., 1983. A theoretical model for dispersion of tephra. In: Shimozuru, D.,Yokoyama, I. (Eds.), Arc Volcanism: Physics and Tectonics. Terra Scientific Publish-ing Company (TERRAPUB), Tokyo, pp. 93–113.
Zuccaro, G., Cacace, F., Spence, R., Baxter, P., 2008. Impact of explosive eruptionscenarios at vesuvius. J. Volcanol. Geotherm. Res. 178, 416–453 (this issue).doi:10.1016/j.jvolgeores.2008.01.005.


