Embed Size (px)
Citation preview
.
1343
ARE BUILDING MATERIALS STOCKS A HEDGE AGAINST INFLATION IN
NIGERIA
E. Chuke NWUDE
1
ABSTRACT
This paper investigates the extent to which stocks of Building materials firms listed in Nigerian
Stock Exchange (NSE) are a hedge against the expected and unexpected inflation in Nigeria over
the period 2000–2011. Unexpected inflation is computed as the difference between the actual
inflation and the estimates of the expected inflation. The study used real rate of return on equity
and regression analysis to find the stocks that provide positive real return and offer inflation-
hedging potentials respectively. The findings revealed that in terms of real return based on
shareholders’ funds and total return to equity, all the firms were not susceptible to adverse effect
of inflation but when based on dividend yield all the firms offered no significant hedge against
inflation.
Keywords: Return on equity, Real return, Nominal return, Consumer price index, Inflation-hedging
capacity, Shareholders funds, Dividend yield, Capital gain yield
INTRODUCTION1
Inflation creates a perennial concern for government, policymakers, and investors (individuals
and firms) generally; it causes uncertainty, decreases the purchasing power of money, and
ultimately stunts investment and economic activity (Nwude and Herbert, 2013). In consequence,
investors are always looking out for the best way to protect their wealth from the ravages of
inflation. Preserving the purchasing power of one‟s investment is the essence of inflation hedging
which is vital in achieving long-term financial security. However, because long-term inflation
rates will always be highly uncertain, it is difficult to preserve the real value of one‟s assets by
relying on traditional stock and bond investments alone. Accordingly, active investors seem to
develop a proclivity to rotate investments into asset classes with different characteristics.
One classical way to hedge against inflation is to diversify into a number of instruments or assets
– financial and real – such as stocks, precious metals, foreign currencies and other durable assets.
In fact, investment analysts believe that the selective use of commodities within one‟s investment
strategy can prove highly effective not just for achieving portfolio diversification but also as a
hedge against inflation, albeit with additional risk. There is a long-held theoretical inflation-
hedging strategy about investing in a tangible asset whose supply cannot be increased at the same
rate as the currency in which it is being measured. Besides, there is a sense in holding an asset
with growing demand and limited supply whose intrinsic value is equally increasing might even
harbour a better inflation-hedging attribute.
1Dept. of Banking & Finance, Faculty of Business Administration, Enugu Campus, University of Nigeria,
Nigeria
Asian Journal of Empirical Research
journal homepage: http://aessweb.com/journal-detail.php?id=5004
Asian Journal of Empirical Research, 3(10)2013: 1343-1361
1344
The present authors have recently conducted a series of empirical investigations into the
inflation-hedging characteristics of stocks of a wide range of product-specific firms quoted on the
Nigerian Stock Exchange (NSE). In an earlier study, we investigated the extent to which stocks
of breweries listed in NSE are a hedge against the expected and unexpected inflation in Nigeria
(Nwude and Herbert, 2013). This and subsequent studies present the results of empirical
exploration of this important phenomenon of interest in a variety of stocks quoted on the NSE. In
the present study, we report the investment performance of Building materials stocks listed in the
NSE with respect to their inflation-hedging potential.
The relationship between stock returns and inflation suggests that investment in equity markets
can provide a good hedge against inflation if the revenue and earnings of a company grow over
time. Consequently, while governments and policymakers evolve various policies and strategies
(fiscal and monetary), investors on their part jostle for smart ways to protect the purchasing
power of their investments. In this fifth paper, we look at the stocks of Building materials firms
as a recessionary hedge and portfolio diversification tool. In particular, long-term investments,
such as equities and bonds, are mostly vulnerable to inflation. Hence, long-term investors show
much concern about the risk of inflation. Precisely, investors face a common problem: how to
maintain the purchasing power of their asset holdings over time and achieve a level of real
returns consistent with their investment objectives. Both dimensions of this problem are often
considered together, but there remains an active debate regarding the first, namely which asset
type provides the most effective hedge against inflation. The focus on inflation-hedging
properties, naturally, panders to the fluctuations in inflation itself. The most intense burst of
activity in this area followed the persistent rise in inflation through the 1970s to the 1980s.
However, because inflation has remained a constant threat in the economic development of most
developing countries, chiefly those of Sub-Sahara Africa (SSA), and with the impetus of
government reforms and diversification of the economy, there is a renewed focus on inflation
hedging properties of stocks of quoted firms in those sectors.
Countries like Nigeria with a constant history of inflation have a lot more to contend with after
the recent global financial crisis of 2007/2008. The meltdown forced governments all over the
world to evolve policy tools aimed at stemming the tidal wave of the raging financial tsunami.
These policy tools warranted particularly massive injections of liquidity and quantitative easing,
with significant implications for risk of inflation. Even before the crisis, inflation had been rising
on a global scale. The economic implications of this crisis juxtaposing wider gaps in productivity
have unleashed inflation pressure on already weak economies, like Nigeria. While policymakers
are working hard to stabilize output and stave off deflation, inflation however remains a major
concern. Investors‟ apprehension makes inflation hedging an important component of an
investment strategy.
Over the years, investors have been concerned about the negative effects of rising inflation on the
purchasing power of their investments. While there are several investment options at the
investors‟ disposal, not all of them have inflation-hedging properties. In particular, following the
recent global financial meltdown with the attendant inflation worries spreading, investors are
scrambling to find smart ways to protect the purchasing power of their investments.
Traditional versus evolving inflation hedges
According to Nwude and Herhert (2013), since not all investment options have inflation-hedging
properties, in general, inflation hedges can be dichotomized into traditional versus evolving
approaches. Traditional inflation-hedging vehicles include commodities (agricultural products,
crude oil, precious metals, etc.) and commercial real estate. Commodities have enjoyed historical
appeal because of the tendency of their prices to keep pace with inflation. For example, the prices
Asian Journal of Empirical Research, 3(10)2013: 1343-1361
1345
of commodities such as agricultural products (cocoa, palm oil, foodstuffs in general), energy (oil
and gas), metals (gold, silver, copper) always go up as inflation rises. Sometimes, inflation is
induced by the increases in the prices of these goods. Unlike commodities, Treasury Inflation
Protection Securities (TIPS) adjust their principal and interest payments regularly (e.g. monthly)
according to changes in the Consumer Price Index (CPI), which is the most common measure of
inflation. In recent times, wealth management firms and financial advisers (e.g. Nuveen
Investments) have cautioned that the so-called traditional inflation hedges may not hold up so
well in today‟s technology-driven markets. This view is corroborated by a historical comparison
which shows that oil offers an excellent hedge against inflation on a 37-year compounded return
of 8.5% since 1970, while real estate returned 6.15% over the same time span (see Michael
Pento, Senior Market Strategist at Delta Global Advisors, Inc) (www.DeltaGlobalAdvisors.com).
He also found that TIPS have been worse inflation protection vehicles, with an average
compounded yield of just 5.4% since their inception in 1997. By comparison, gold's return over
that same ten-year timeframe has been 8.7%.
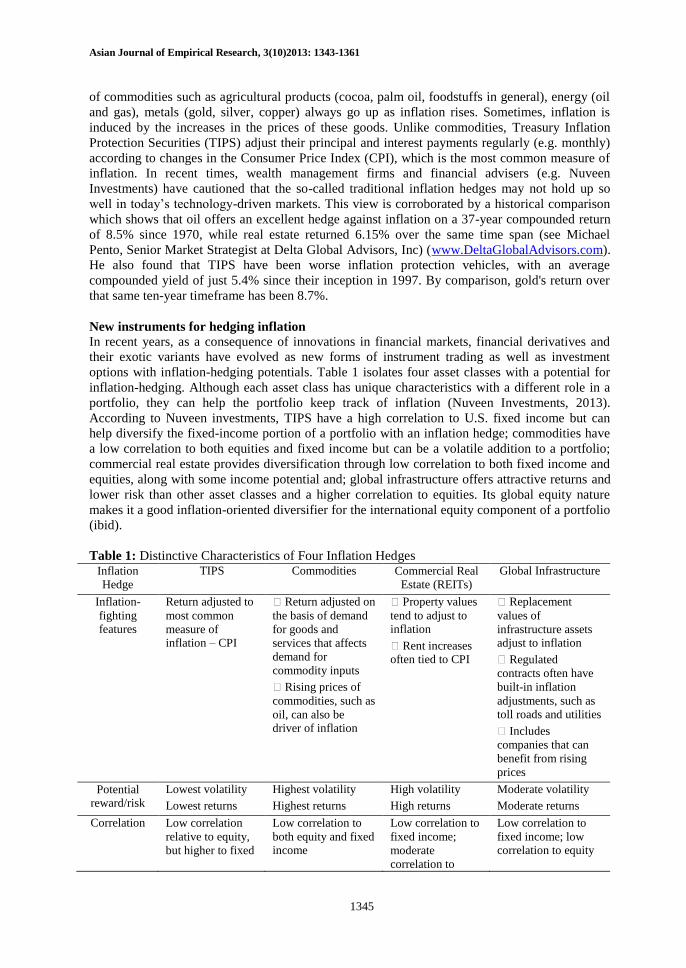
New instruments for hedging inflation
In recent years, as a consequence of innovations in financial markets, financial derivatives and
their exotic variants have evolved as new forms of instrument trading as well as investment
options with inflation-hedging potentials. Table 1 isolates four asset classes with a potential for
inflation-hedging. Although each asset class has unique characteristics with a different role in a
portfolio, they can help the portfolio keep track of inflation (Nuveen Investments, 2013).
According to Nuveen investments, TIPS have a high correlation to U.S. fixed income but can
help diversify the fixed-income portion of a portfolio with an inflation hedge; commodities have
a low correlation to both equities and fixed income but can be a volatile addition to a portfolio;
commercial real estate provides diversification through low correlation to both fixed income and
equities, along with some income potential and; global infrastructure offers attractive returns and
lower risk than other asset classes and a higher correlation to equities. Its global equity nature
makes it a good inflation-oriented diversifier for the international equity component of a portfolio
(ibid).
Table 1: Distinctive Characteristics of Four Inflation Hedges
Inflation Hedge
TIPS Commodities Commercial Real Estate (REITs)
Global Infrastructure
Inflation-
fighting features
Return adjusted to
most common
measure of inflation – CPI
Return adjusted on
the basis of demand
for goods and
services that affects
demand for
commodity inputs
Rising prices of
commodities, such as
oil, can also be driver of inflation
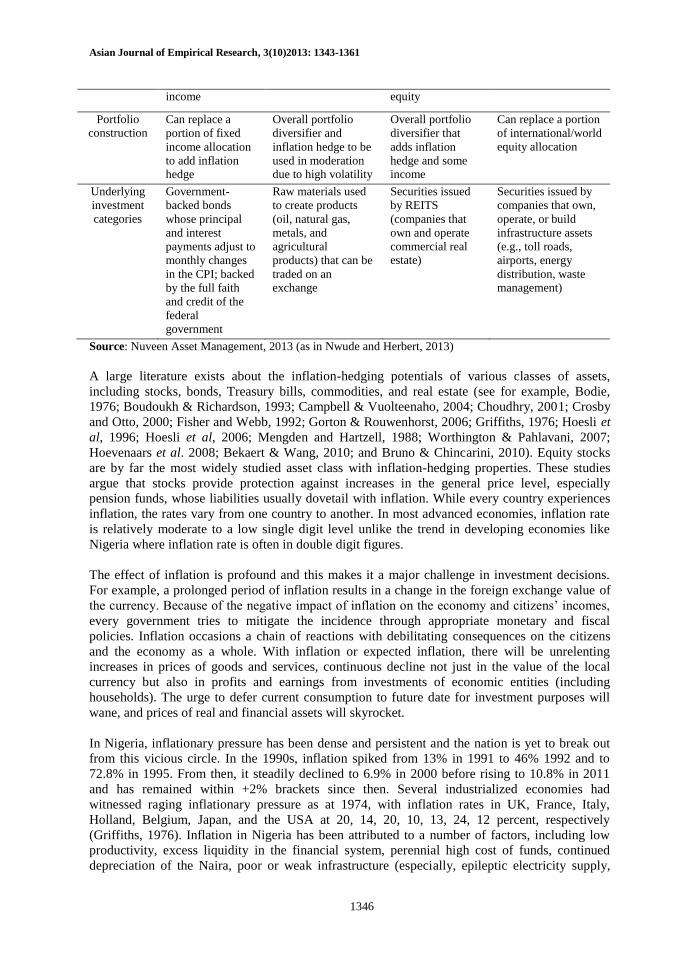
Property values
tend to adjust to inflation
Rent increases often tied to CPI
Replacement
values of
infrastructure assets adjust to inflation
Regulated
contracts often have
built-in inflation
adjustments, such as
toll roads and utilities
Includes
companies that can
benefit from rising
prices
Potential reward/risk
Lowest volatility
Lowest returns
Highest volatility
Highest returns
High volatility
High returns
Moderate volatility
Moderate returns
Correlation Low correlation
relative to equity,
but higher to fixed
Low correlation to
both equity and fixed income
Low correlation to
fixed income;
moderate
correlation to
Low correlation to
fixed income; low correlation to equity
Asian Journal of Empirical Research, 3(10)2013: 1343-1361
1346
income equity
Portfolio construction
Can replace a
portion of fixed
income allocation
to add inflation hedge
Overall portfolio
diversifier and
inflation hedge to be
used in moderation due to high volatility
Overall portfolio
diversifier that
adds inflation
hedge and some income
Can replace a portion
of international/world
equity allocation
Underlying
investment
categories
Government-
backed bonds
whose principal
and interest
payments adjust to
monthly changes
in the CPI; backed
by the full faith
and credit of the
federal
government
Raw materials used
to create products
(oil, natural gas,
metals, and
agricultural
products) that can be
traded on an exchange
Securities issued
by REITS
(companies that
own and operate
commercial real estate)
Securities issued by
companies that own,
operate, or build
infrastructure assets
(e.g., toll roads,
airports, energy
distribution, waste management)
Source: Nuveen Asset Management, 2013 (as in Nwude and Herbert, 2013)
A large literature exists about the inflation-hedging potentials of various classes of assets,
including stocks, bonds, Treasury bills, commodities, and real estate (see for example, Bodie,
1976; Boudoukh & Richardson, 1993; Campbell & Vuolteenaho, 2004; Choudhry, 2001; Crosby
and Otto, 2000; Fisher and Webb, 1992; Gorton & Rouwenhorst, 2006; Griffiths, 1976; Hoesli et
al, 1996; Hoesli et al, 2006; Mengden and Hartzell, 1988; Worthington & Pahlavani, 2007;
Hoevenaars et al. 2008; Bekaert & Wang, 2010; and Bruno & Chincarini, 2010). Equity stocks
are by far the most widely studied asset class with inflation-hedging properties. These studies
argue that stocks provide protection against increases in the general price level, especially
pension funds, whose liabilities usually dovetail with inflation. While every country experiences
inflation, the rates vary from one country to another. In most advanced economies, inflation rate
is relatively moderate to a low single digit level unlike the trend in developing economies like
Nigeria where inflation rate is often in double digit figures.
The effect of inflation is profound and this makes it a major challenge in investment decisions.
For example, a prolonged period of inflation results in a change in the foreign exchange value of
the currency. Because of the negative impact of inflation on the economy and citizens‟ incomes,
every government tries to mitigate the incidence through appropriate monetary and fiscal
policies. Inflation occasions a chain of reactions with debilitating consequences on the citizens
and the economy as a whole. With inflation or expected inflation, there will be unrelenting
increases in prices of goods and services, continuous decline not just in the value of the local
currency but also in profits and earnings from investments of economic entities (including
households). The urge to defer current consumption to future date for investment purposes will
wane, and prices of real and financial assets will skyrocket.
In Nigeria, inflationary pressure has been dense and persistent and the nation is yet to break out
from this vicious circle. In the 1990s, inflation spiked from 13% in 1991 to 46% 1992 and to
72.8% in 1995. From then, it steadily declined to 6.9% in 2000 before rising to 10.8% in 2011
and has remained within +2% brackets since then. Several industrialized economies had
witnessed raging inflationary pressure as at 1974, with inflation rates in UK, France, Italy,
Holland, Belgium, Japan, and the USA at 20, 14, 20, 10, 13, 24, 12 percent, respectively
(Griffiths, 1976). Inflation in Nigeria has been attributed to a number of factors, including low
productivity, excess liquidity in the financial system, perennial high cost of funds, continued
depreciation of the Naira, poor or weak infrastructure (especially, epileptic electricity supply,
Asian Journal of Empirical Research, 3(10)2013: 1343-1361
1347
poor transportation network, high cost of transportation amidst high pump price, incongruous
fiscal and monetary policies, and weak and corrupt governance.
From a macroeconomic standpoint, budget deficits are the fundamental cause of inflation,
particularly in countries with prolonged high inflation like developing economies, whose deficits
are nearly always financed through money creation. The period immediately following the return
to democratic political governance in Nigeria in 1999, witnessed persistent increases in
government expenditures and increase in aggregate demand which, in the process, resulted in a
general rise in the price level of goods and services as well as increase in interest rates. The
economic logic is that government‟s unguarded expenditures amidst a corrupt system of
governance will give rise to persistent fiscal deficits and inflation. The standard macroeconomic
theory argues that fiscally dominant governments running persistent deficits would sooner or
later finance the deficits via money creation, which naturally have inflationary effects (Dockery,
Ezeabasili & Herbert 2012). This view is supported by Fischer & Easterly (1990) who earlier
noted that rapid growth in the money supply could be driven by underlying fiscal imbalances,
which will detonate rapid inflation. The ensuing higher interest rates will crowd out private
investment and thus reduce private sector investment in productive activities less profitable as a
consequence of excessive government borrowing from the financial markets. The search for
alternative (protected) investment outlets compels investors to jostle for inflation-hedging assets.
Nigeria is chosen for this empirical investigation for a number of reasons. Despite the obvious
fact that Nigeria is an oil-rich country with a large inflow of oil revenue, the country has
nonetheless experienced prolonged spell of double-digit inflation. In fact, an important feature of
the Nigerian economy is the transition to high rates of inflation. In the 1970s, the overall inflation
rate averaged 15.3 percent; in the 1980s it increased to an average of 22.9 percent, and in the
1990s the average inflation rate soared to 30.6 percent, but by 2006 the economy experienced a
sharp average fall of 18.4 percent in the inflationary trend (Dockery et al., 2012). These high
rates of inflation are caused by the widening fiscal deficits, sources of deficit financing, and the
depreciation of the Naira exchange rate (Ezeabasili et al., 2012). The high inflation rates over a
prolonged period have resulted in substantial costs and large decline in purchasing power, at the
same time as the performance of the economy has declined, exacerbated by poor macroeconomic
management and political uncertainty (ibid.).
One of the perennial policy challenges facing Nigeria, and indeed most Sub-Saharan African
(SSA) countries, is inflation and how to control it. The challenge of controlling inflation has both
monetary and fiscal policy implications. Prior to the recent financial crisis, many developing
countries including Nigeria had been grappling with the insidious challenge of unrelenting
inflation. The conundrum caused by the financial meltdown forced policy makers and regulators
to quickly adopt a number of conventional and unconventional tools as experimental measures to
mitigate the tsunamic effects of the global financial crisis. These include a broad range of
stimulus packages and quantity easing. While these measures were aimed to resolve one problem
– the financial crisis – they nevertheless left in their trail another invidious challenge, inflation.
Thus, the crucial consideration for investment purpose is how to protect investments from the
scourge of inflation.
Since the 1990s, equity investment in banking stocks has been on a steady increase in the
Nigerian stock market. The main reason for this attraction is the belief that stock market
investment acts as a better inflation-hedge than most other investment assets. This constitutes the
basis of this research. Precisely, the questions are: Is this belief right or wrong? Is there any
evidence to support this assertion from the Nigerian Stock Market? In providing answers to these
questions, the remainder of this paper is structured as follows: the next section provides a
Asian Journal of Empirical Research, 3(10)2013: 1343-1361
1348
summary of the previous work and the section that follows deals with the methodology employed
in the empirical analysis. The penultimate section takes care of the empirical results and its
discussion, while the last section provides the summary of findings, concluding remarks and
recommendation.
LITERATURE REVIEW
There is a general concession that investment in common stocks is a good hedge against inflation.
The empirical evidence for this belief has its origin in the seminal work of Irving Fisher (1930)
which proposed that expected nominal interest rates should move in tandem with expected
inflation. Fama and Schwert (1977) exemplified how the Fisher (1930) proposal could be used to
test the inflation hedging characteristics of investment assets. Following Fama & Schwert (1977),
many studies have sprung up in determining the inflation hedging characteristics of some
investment assets. For example, with a quarterly data set covering the period 1976 and 1986 at
the property sector level and Treasury bill rate as a measure of expected inflation, Limmack &
Ward (1988) used the Fama and Schwert (1977) framework and found that all commercial
property sectors hedge against inflation and that only the industrial sector hedged against
unexpected inflation. Brown (1991) used monthly investment property databank returns from
1987 to 1990 to offer evidence that property provides a hedge against both expected and
unexpected inflation. Hamerlinks and Hoesli (1996) used cointegration approach to examine the
inflation-hedging capacity of the UK commercial property and found that it does not exhibit
short-term hedging characteristics but show a positive correspondence between property return
and expected/unexpected inflation in the long run.
Miles (1996) compared real returns on various types of investment in the U. K. over a period of
50 years and found that most tangible assets - commodities (with the exception of gold), houses,
land and equities - generated real returns above the average for all the asset classes, with the
highest return generated on equities. The assets whose returns are set in nominal terms such as
bonds, bank and building society deposits had the least performance over the period. The findings
of Hoesli et al. (1995) show that real estate has poorer short-term hedging characteristics than
shares, but better hedging characteristics than bonds. Newell (1996) examined the inflation-
hedging characteristics of Australian commercial property between 1984 and 1995 and found that
both office and retail property provide a good hedge against actual, expected and unexpected
inflation in 10 Australian cities studied. Hoesli (1994) used monthly, quarterly, annual and five-
year data on common stocks and real estate in Switzerland for the period between 1943 and 1991
and discovered that Swiss real estate provides a better hedge against inflation than common
stocks. Hamerlink & Hoesli (1996) employed hedonic and autoregressive models to show that
Swiss stocks, bonds, real estate and real estate mutual funds are positively related to expected
inflation and negatively related to unexpected inflation.
Hartzell et al. (1987) carried out a study on inflation-hedging potential of residential property,
commercial property, farmland, REITs, commingled real estate funds and stock exchange listed
property firms and found significantly positive coefficients for expected and unexpected
components of inflation. A later study by Park et al. (1990) on equity REITs in U.S.A. reported
significantly negative coefficients for both expected and unexpected inflation. Fogler (1984)
found positive impact of including real estate in portfolios of U.S.A. stocks and bonds. With
causality and cointegration analysis on the relationship between inflation and property returns,
Barkham et al. (1996) observed that in the short run, changes in expected and actual inflation
affect returns from investments in property. Bello (2005), splitting inflation into actual, expected,
and unexpected and applying the Fisher (1930) model and static regression analysis in assessing
inflation hedging attributes of ordinary shares, real estate, and Naira-denominated time deposits
Asian Journal of Empirical Research, 3(10)2013: 1343-1361
1349
between 1996 and 2002, discovered that the extent of hedging against actual inflation was highest
in ordinary shares, very weak in Naira-denominated time deposits, and non-existent in real estate.
However, hedging against expected inflation was seen only in real estate and Naira-denominated
time deposits.
The theoretical expectation is that a positive relationship exists between equity stock returns and
inflation since equity stock represents residual claims on the firm‟s assets. A large body of
evidence indicates that the stock market tends to perform poorly during inflationary periods
(Brueggeman et al., 1999; Bello, 2000; Brown, 1990). The rising inflation in the 1970s inspired a
number of studies on the hedging properties of a variety of assets against inflation, especially
equity stocks. For example, Bodie (1976), and Fama & Schwartz (1977) examined the inflation-
hedging properties of common stocks vis-à-vis other financial and real assets in the U.S. A
number of studies however have reported negative relationship between equity returns and
inflation (both unexpected inflation and expected inflation). These include Reilly et al. (1970),
Bodie (1976), Fama & Schewart (1977), Fama (1981), Day (1984), Erb & Harvey (1995), and
Chatrath et al., & Song (1996). Thus, contrary to the generally held belief, the empirical literature
shows that there is a negative relation between stock returns and inflation, implying therefore that
common stocks do not possess inflation-hedging properties.
Nevertheless, some other studies have found contrasting evidence to the above conclusion. For
example, in a study of 26 countries during the post war period, Gultekin (1983) found support for
the hypothesized relationship between stock returns and inflation. Other studies that support the
hypothesis of positive relationship between common stocks and inflation include, Boudoukh and
Richardson (1993) and Choudhary (2001).
The average conclusion from extant literature redounds to two facts: first, there is no consensus
on the empirical relationship between assets, in particular stocks and inflation; and second,
definitive details concerning inflation-hedging attributes of stocks and real estate are still unclear.
This ambivalent situation calls for more empirical evidence, especially in other sectors. As
Spierdijk & Umar (2013a&b) observed, most studies analyzing the relationship between stock
returns and inflation - that is, inflation-hedging properties of stocks - focus mainly on equity
indices that represent the aggregate stock market. Thus, assessment of inflation-hedging capacity
based on individual stocks, sectoral analysis of equity stocks, or specific sector assets has
received little empirical attention.
This study seeks to bridge this gap by assessing the inflation-hedging properties of specific sector
assets - Airlines/Automobile/Road transport/Maritime firms stocks – in this case, as part of a
much wider examination of the hedging-properties of sector-specific stocks. Besides, the lack of
empirical consensus on the inflation-hedging properties of common stocks is a sufficient
justification for further and sectoral examination of the phenomenon of interest. As evidenced by
the studies cited above, most of them have been in the developed economies, notably USA and
Europe. In recent times, many developing countries, including African countries, have embarked
on a plethora of economic and financial reforms with serious implications for monetary and fiscal
policies. An important component of government reforms in Nigeria, and many Sub-Saharan
African (SSA) countries, is the diversification of the economy. In Nigeria‟s case, there has been a
series of attempts to diversify the economy away from monolithic crude oil base to
Airlines/Automobile/Road transport/Maritime industries. Notwithstanding these efforts, inflation
in African countries has remained adamant and has continued to pose a serious challenge for both
policymakers and investors. For both government and investors, diversification into
Airlines/Automobile/Road transport/Maritime industries and other productive sectors opens up
the economy to greater investment opportunities. While empirical search for inflation-hedging
Asian Journal of Empirical Research, 3(10)2013: 1343-1361
1350
assets continue to engage researchers and professional investment analysts, assessment of
attributes of Airlines/Automobile/Road transport/Maritime firms stocks may be a fruitful
proposition and a useful contribution to the debate.
Inflation hedging and diversification: The potentials of agricultural commodities
Commodities are assets imbued with tangible properties, such as agricultural products, metals
and oil. Commodity investments have historically had a positive correlation with changes in
inflation and a low correlation to stock and bond returns (Worah and Johnson, 2013). Investment
analysts use commodities to hedge against inflation as well as to enhance portfolio
diversification. The underlying economic fundamentals, due largely to growing demand from
emerging markets and underinvestment in infrastructure, suggest a continuing upward trend in
commodities over the long term. However, the caution by Worah and Johnson (supra) those
commodities are volatile investments, which should only form a small part of a diversified
portfolio, may be apt even if somewhat at odds with their earlier postulation. The authors had
opined that “commodities have historically had a positive correlation with inflation and a non-
correlation with stock and bond returns, making them an attractive vehicle to enhance portfolio
diversification and guard against inflation”. There is no doubt that diversification does not
guarantee a profit nor does it protect against a loss; but it portends good omen for an economy,
for an investor, and for the society at large.
Despite the multi-year rally that has been witnessed across most of the commodity spectrum, only
recently have investors taken agricultural commodities seriously as an important inflation hedge
(ibid). These portfolio managers have further suggested that due to several watershed
macroeconomic factors, the agricultural commodities asset class may be entering into a secular
trend which will cause it to be a leading provider of real returns. As global money supply is
growing at approximately 15%, far above the production rates of most commodities, the increase
in the supply of agricultural commodities like gold is also running far below the rate of global
money supply growth. But unlike gold, the intrinsic value of agricultural commodities is
increasing because of their burgeoning use in energy production, the shrinking of available arable
land for crop production and growing demand from an increasingly prosperous world population,
especially China. Not only is the current supply and demand balance for agricultural commodities
favourable, but estimates from the Food and Agricultural Policy Research Institute (FAPRI)
suggested that the supply/demand balance will remain tight for the foreseeable future. Evidence
of this tightness is the fact that current stock-to-use ratios for many agricultural commodities are
at historic lows (ibid). Both capital values and income streams associated with prime agricultural
assets have remained relatively stable throughout history.
Agriculture in its ramification has investment portfolio attributes. First, agricultural land acts as a
recessionary hedge and portfolio diversification tool. Research by the firm, Agcapita Farmland
Investment Partnership (a Canadian based agriculture private equity firm – available on their
Agricultural Investment Report) - shows that farmland (and agriculture in general) acts as a hedge
against recession. Because it has repeatedly benefited from „flight to quality‟ investment
behaviour, agriculture performs comparatively well during times of market uncertainty, thus
acting as an ideal recessionary hedge. As the title of an Economist March 2009 article “Green
Shoots” puts it, “No matter how bad things get, people still need to eat” (The Economist, 2009).
Further, according to a UK 2011 agricultural land market survey, “Over the past three years,
farming and forestry have topped the investment performance league in the UK; the stable returns
from agricultural property during the past few years clearly show the recession proof nature of
this asset and its value in inflationary environments” (Savills Agricultural Land Market Survey
2011). A further study on US farmland conducted in 2002 compared the effects on portfolio
efficiency of including farmland in a mixed asset portfolio under market conditions of certainty
Asian Journal of Empirical Research, 3(10)2013: 1343-1361
1351
and uncertainty (Hardin and Cheng, 2005). The authors concluded that, in both certain and
uncertain world models, farmland could be shown to improve portfolio efficiency.
Farmland as a portfolio diversification tool
A number of studies and investment analyses - such as Ibbotson Associates, 1991; Hardin and
Cheng, 2005; Savill Survey, 2011; Worah and Johnson, 2013 - have shown that, historically,
farmland returns have a low or negative correlation with traditional asset classes such as stocks
and bonds and only a modest positive correlation with commercial real estate. A study in the US,
using data over a 33-year period up to the 1980s, considered six asset classes including farm real
estate, large and small capitalization stocks, long-term corporate bonds and Treasury bills. The
study concluded that inclusion of farmland in the portfolio had highly attractive characteristics,
particularly in view of the low correlation with other assets in the portfolio, especially large
capitalization stocks (Ibbotson Associates, 1991). These characteristics make farmland an
attractive diversification tool that can help reduce the impact of broader market volatility on a
diversified investment portfolio. The farmland component can be further diversified by varying
crop types, management styles and geographic distribution within the portfolio. In a direct
ownership structure, investors can acquire farmland across a range of farms in different countries
and/or climate zones and under different asset managers. (For more, the reader is referred to:
http://www.dgcassetmanagement.com/investing/agriculture/agricultural-land/farmland-
investment-portfolio-diversification#sthash.rZwzgz1m.dpuf).
METHODOLOGY
Like most of previous studies, this study followed the methodology of Fama and Schwert (1977).
The form of regression equation typically used in this regard is
Rit = αit + βIt + eit
where: Rit represents nominal return on the ith asset during period t, αit is a constant, β is inflation
hedging coefficient, It is the inflation rate during period t, while eit is a random disturbance.
The decision rule for β is as follows: An asset is a complete hedge against inflation if the value of
β is not significantly less than 1. An asset is a partial hedge against inflation if the value of β is
between 0 and 1. An asset has zero hedges against inflation if the value of β is not significantly
different from zero. An asset has a perverse hedge against inflation if the value of β is negative.
The inflation-hedging potential of each Airlines/Automobile/Road transport/Maritime stock was
assessed against actual inflation. In previous studies, measures of actual inflation were generally
derived from the consumer price index (CPI) percentage change, while proxies available to
estimate the level of expected inflation included economic variables at the time, such as short-
term interest rate, (e.g. 90-day Treasury Bill rates) as in Fama (1975), Fama and Schwert (1977),
Hoesli(1994), Limmack and Ward (1988). Others include survey-based inflation forecast as in
Newell (1995a, 1995b), Newell & Boyd (1995), and Park, Mullineaux & Chew (1990);
autoregressive integrated moving average (ARIMA)-based inflation estimates as in Brown
(1991), Fama & Gibons (1982), Hartzell et al. (1987), Limmack & Ward (1988). The unexpected
inflation is usually computed as the difference between the actual inflation and the estimates of
the expected inflation. In this study, the actual inflation proxy that was used is CPI percentage
change.
Our analysis covers the period 2000-2011. This period not only experienced high inflationary
trend but ensured a relatively homogenous phase as well as guarantee sufficient availability of
data of the companies‟ equity stocks. The returns on equity were compiled from the ordinary
Asian Journal of Empirical Research, 3(10)2013: 1343-1361
1352
shares of the seven active quoted Airlines/Automobile/Road transport/Maritime stocks on the
Nigerian Stock Exchange (NSE) using their annual reports and accounts from 2000-2011. The
return on equity was computed under five models namely; 1) return on equity based on
PAT/Shareholders‟ funds, 2) return on equity based on sum of dividend yield and capital gain
yield, 3) return on equity based on dividend yield before tax, and 4) return on equity based on
dividend yield after tax, 5) return on equity based on capital gain yield. This segregation is
necessary to capture the inflation potential of the stocks in terms of return on equity based on (1)
what the enterprise earns on shareholders‟ funds at its disposal, (2) the sum of earnings of
dividend yield and capital gains yield, (3) returns to the shareholders before tax, and (4) net
returns to the shareholders after tax, (5) what the shareholders earn based solely on capital gain.
RESULTS AND DISCUSSIONS
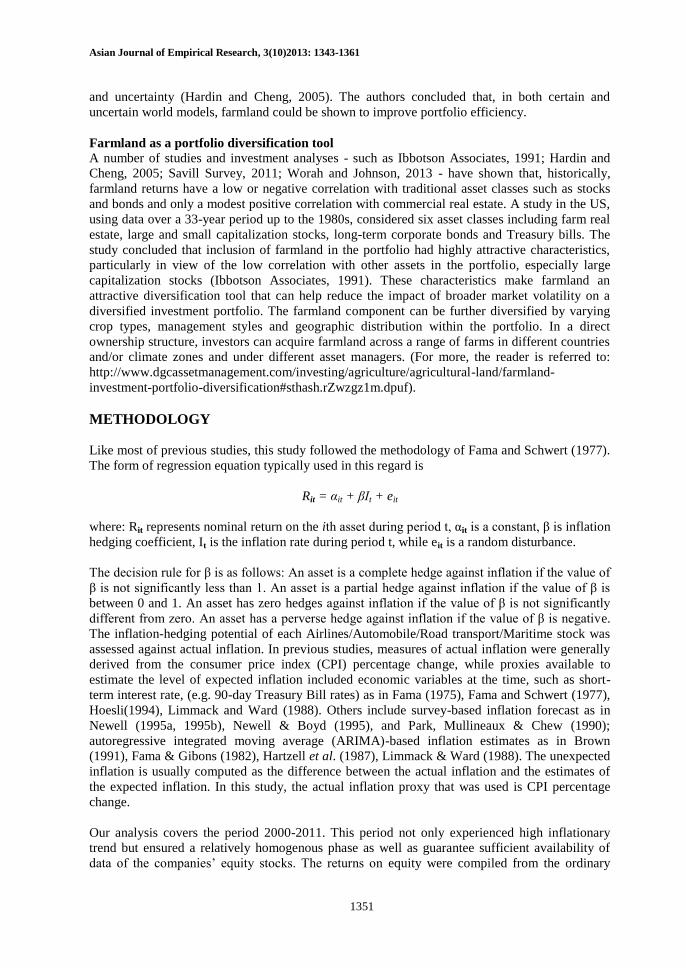
Tables 2 to 6 show the five categories of nominal returns on the equity sub-indices related to the
Building materials firms from 2000 to 2011.
Table 2: Actual Inflation Rates (%) and Nominal Return on Equity based on shareholders‟ funds (%)
Year Inflation Ashaka Benue CCNN N. Ropes N. Wire Wapco
2000 6.90 26.22 -33.64 -191.42 35.62 30.65 8.15
2001 18.9 39.34 -471.38 -550.28 56.48 33.46 9.26
2002 12.9 26.70 111.83 118.37 26.88 5.99 -15.03
2003 14.0 33.57 27.45 -16.04 11.45 -11.56 -52.67
2004 15.0 46.83 25.63 58.81 5.76 -16.08 -129.46
2005 17.9 53.80 -162.62 13.96 5.40 -3.93 19.27
2006 8.2 29.07 37.16 -2.26 7.95 -8.50 42.68
2007 5.4 14.95 13.03 4.40 7.14 -6.93 32.55
2008 11.6 16.18 30.14 38.49 10.05 1.31 27.81
2009 12.5 7.18 59.37 42.97 -85.47 -0.77 11.57
2010 13.7 18.61 49.80 - -1.19 - 10.11
2011 10.8 18.76 41.34 - 2.55 - 15.18
AVE 12.32 27.60 -22.66 -40.25 6.89 1.97 -1.71
STD 4.087 13.82 156.003 176.141 33.486 15.311 47.068
Source: Inflation rates from CBN statistical Bulletin 2011 and ROE computed from firms Annual Reports
Table 3: Actual Inflation Rates (%) and Nominal Return on Equity based on Dividend and
Capital gain Yields (%) Year Inflation Ashaka Benue CCNN N.Ropes N.Wire Wapco
2000 6.90 22.07 85.66 0.43 -1.66 5.54 -9.06
2001 18.9 100.08 -0.63 18.53 7.87 9.80 17.59
2002 12.9 49.70 0.63 109.09 8.33 -4.71 -25.10
2003 14.0 -11.02 -0.42 -18.26 0.96 -7.00 -12.89
2004 15.0 53.26 1.68 24.92 -5.71 -0.88 -1.94
2005 17.9 36.24 22.47 26.42 -20.71 0 -19.16
2006 8.2 59.09 183.50 49.45 39.81 0 196.03
2007 5.4 48.09 198.99 107.49 57.40 0 85.77
2008 11.6 -38.41 -12.49 -26.58 45.24 349.55 -74.79
2009 12.5 -69.24 -18.41 -28.10 -48.43 5.16 76.11
2010 13.7 73.40 55.11 - 3.66 -14.45 58.39
2011 10.8 8.39 131.83 - 235.69 -71.52 11.71
AVE 12.32 27.64 53.99 21.95 26.87 22.62 25.22
STD 4.087 48.252 78.070 46.330 71.838 105.137 70.480
Source: Inflation rates from CBN statistical Bulletin 2011 and ROE computed from firms Annual Reports
Asian Journal of Empirical Research, 3(10)2013: 1343-1361
1353
Table 4: Actual Inflation Rates (%) and Nominal Return on Equity based on Dividend Yield
before Tax (%) Year Inflation Ashaka Benue CCNN N.Ropes N.Wire Wapco
2000 6.90 8.72 0 0 0 7.84 0
2001 18.9 5.61 0 0 0 9.80 0
2002 12.9 3.06 0 0 0 0 0
2003 14.0 11.21 0 0 0 0 0
2004 15.0 13.35 0 1.73 0 0 0
2005 17.9 8.51 0 1.38 0 0 2.44
2006 8.2 3.54 0 0 3.50 0 2.77
2007 5.4 0 0 0 2.26 0 1.81
2008 11.6 0.79 0 5.94 1.57 0 4.33
2009 12.5 0 6.01 9.52 0 0 0.41
2010 13.7 1.49 1.96 - 0 0 0.65
2011 10.8 1.86 1.06 - 0 0 1.77
AVE 12.32 4.85 0.75 1.55 0.61 1.47 1.18
STD 4.087 4.576 1.766 3.046 1.181 3.459 1.434
Source: Inflation rates from CBN statistical Bulletin 2011 and ROE computed from firms Annual Reports
Table 5: Actual Inflation Rates (%) and Nominal Return on Equity based on Dividend Yield
afterTax (%) Year Inflation Ashaka Benue CCNN N. Ropes N. Wire Wapco
2000 6.90 7.85 0 0 0 7.06 0
2001 18.9 5.04 0 0 0 8.82 0
2002 12.9 2.75 0 0 0 0 0
2003 14.0 10.09 0 0 0 0 0
2004 15.0 12.01 0 1.55 0 0 0
2005 17.9 7.66 0 1.24 0 0 2.19
2006 8.2 3.18 0 0 3.15 0 2.49
2007 5.4 0 0 0 2.03 0 1.63
2008 11.6 0.71 0 5.35 1.42 0 3.89
2009 12.5 0 5.41 8.57 0 0 0.37
2010 13.7 1.34 1.76 - 0 0 0.59
2011 10.8 1.67 0.96 - 0 0 1.60
AVE 12.32 4.36 0.68 1.39 0.55 1.32 1.06
STD 4.087 4.118 1.589 2.743 1.063 3.113 1.288
Source: Inflation rates from CBN statistical Bulletin 2011 and ROE computed from firms Annual Reports
Table 6: Actual Inflation Rates (%) and Nominal Return on Equity based on Capital Gain Yield
(%) Year Inflation Ashaka Benue CCNN N. Ropes N. Wire Wapco
2000 6.90 13.34 85.66 0.43 -1.66 -2.30 -9.06
2001 18.9 94.48 -0.63 18.53 7.87 0 17.59
2002 12.9 46.64 0.63 109.09 8.33 -4.71 -25.10
2003 14.0 -22.22 -0.42 -18.26 0.96 -7.00 -12.89
2004 15.0 39.91 1.68 23.19 -5.71 -0.88 -1.94
2005 17.9 27.73 22.47 25.04 -20.71 0 -21.59
2006 8.2 55.56 183.50 49.45 36.31 0 193.26
2007 5.4 48.09 198.99 107.49 55.14 0 83.96
2008 11.6 -39.19 -12.49 -32.52 43.67 349.55 -79.11
2009 12.5 -69.24 -24.42 -37.62 -48.43 5.16 75.70
2010 13.7 71.91 53.15 75.66 3.66 -14.45 57.73
2011 10.8 6.53 130.76 -43.49 235.69 -71.52 9.94
Asian Journal of Empirical Research, 3(10)2013: 1343-1361
1354
2012 -43.31 -1.70 -46.16 -5.61 0 10.81
AVE 12.32 22.79 53.24 23.08 26.26 21.15 24.04
STD 4.087 47.523 78.496 53.459 71.666 105.418 70.415
Source: Inflation rates from CBN statistical Bulletin 2011 and ROE computed from firms Annual Reports
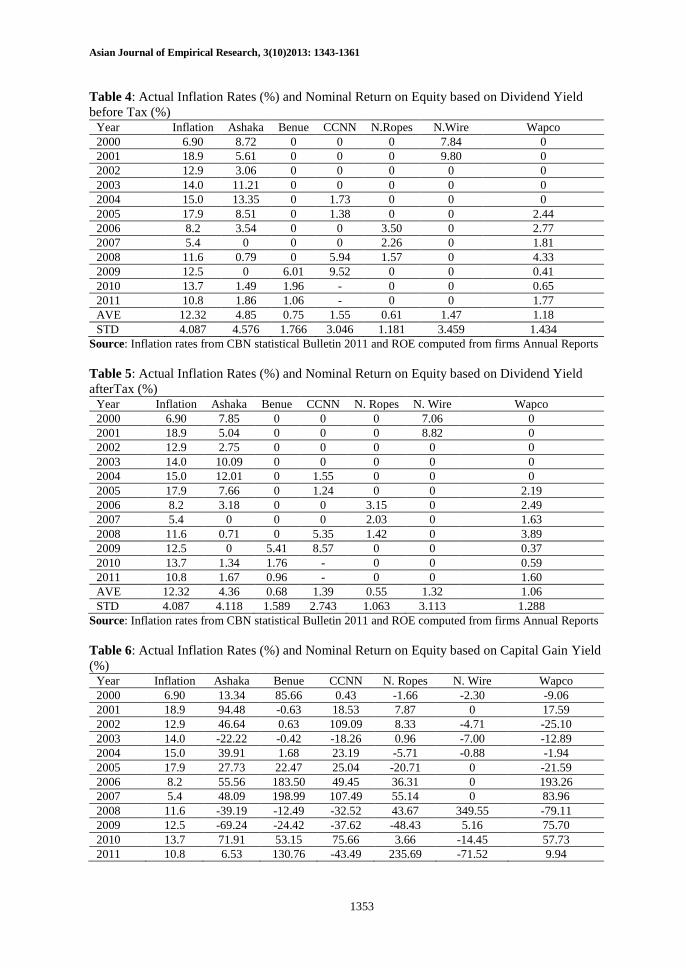
A test was carried out to find out if these building materials stocks provide positive real return on
equity over the period. Using the Fisher model, the return on equity in real term is given by the
model, R = (1+NR)/(1+IR) – 1, where NR represents nominal rate of return on equity, IR
represents inflation rate, and R represents real rate of return on equity. Applying the Model, the
real rate of return on each of the stocks has been computed and displayed in Table 7 to Table 11
showing the four classes of return on equity.
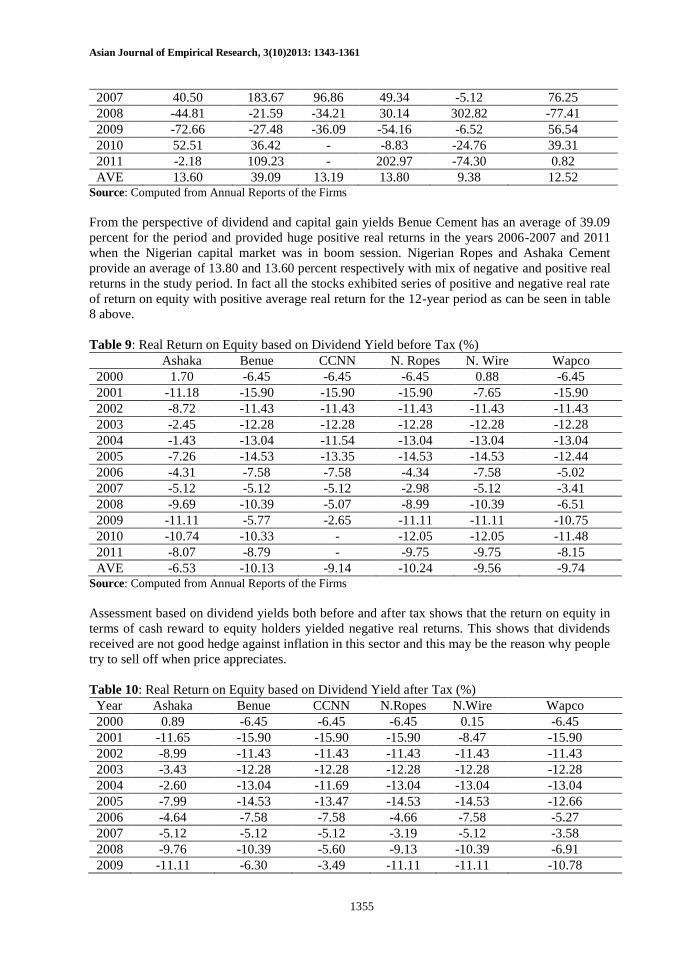
Table-7: Real Return on Equity based on Shareholders‟ funds (%)
Year Ashaka Benue CCNN N.Ropes N.Wire Wapco
2000 18.07 -37.92 -185.52 26.87 22.22 1.17
2001 17.19 -412.35 -478.70 31.61 12.25 -8.11
2002 12.22 87.63 93.42 12.38 -6.12 -24.74
2003 17.17 11.80 -26.35 -2.24 -22.42 -58.48
2004 27.68 9.24 38.10 -8.03 -27.03 -125.62
2005 31.45 -153.52 -2.60 -9.91 -17.89 1.94
2006 19.29 26.77 -9.67 -0.23 -15.43 31.87
2007 9.06 7.24 -0.95 1.65 -11.70 25.76
2008 4.10 16.61 24.09 -1.39 -9.22 14.53
2009 -4.73 41.66 27.08 -87.08 -11.80 -0.83
2010 4.32 31.75 - -13.10 - -3.16
2011 7.18 27.56 - -7.45 - 3.95
AVE 13.58 -28.63 -52.11 -4.74 -8.71 -11.81 Source: Computed from Annual Reports of the Firms
Based on enterprise return on shareholders‟ funds, Ashaka Cement has been consistent in
providing positive real return except in year 2009 and this culminated into an average of 13.58
percent. The huge negatives WAPCO Larfarge recorded in 2002-2004 turned its average return
into negative. Nigerian Ropes and Nigerian Wire Industries have been making losses especially
in real term, so it is not surprising to see each end up with average negative real return. Formerly
Benue cement but presently Dangote Cement came out of its crisis in 2002, slumped into it again
in 2005, have been on the positive path since 2006. However it reports an average negative return
of -28.63 percent for the 12-year period. It is not quite clear why Cement Company of Northern
Nigeria (CCNN) has not picked up and stabilized up to this moment. CCNN produced the worst
average real return of -52.11 percent. So far Ashaka, Benue, and WAPCO-Larfarge look
promising in terms of generating better future real return.
Table 8: Real Return on Equity based on Dividend and Capital Gain Yields (%)
Year Ashaka Benue CCNN N.Ropes N.Wire Wapco
2000 14.19 73.68 -6.05 -8.01 -1.27 -14.93
2001 68.28 -16.43 -0.31 -9.28 -7.65 -1.10
2002 32.60 -10.87 85.20 -4.05 -15.60 -33.66
2003 -21.95 -12.65 -28.30 -11.44 -18.42 -23.59
2004 33.27 -11.58 8.63 -18.01 -13.81 -14.73
2005 16.44 4.68 8.05 -32.23 -14.53 -30.91
2006 47.03 162.01 38.12 29.21 -7.58 173.60
Asian Journal of Empirical Research, 3(10)2013: 1343-1361
1355
2007 40.50 183.67 96.86 49.34 -5.12 76.25
2008 -44.81 -21.59 -34.21 30.14 302.82 -77.41
2009 -72.66 -27.48 -36.09 -54.16 -6.52 56.54
2010 52.51 36.42 - -8.83 -24.76 39.31
2011 -2.18 109.23 - 202.97 -74.30 0.82
AVE 13.60 39.09 13.19 13.80 9.38 12.52 Source: Computed from Annual Reports of the Firms
From the perspective of dividend and capital gain yields Benue Cement has an average of 39.09
percent for the period and provided huge positive real returns in the years 2006-2007 and 2011
when the Nigerian capital market was in boom session. Nigerian Ropes and Ashaka Cement
provide an average of 13.80 and 13.60 percent respectively with mix of negative and positive real
returns in the study period. In fact all the stocks exhibited series of positive and negative real rate
of return on equity with positive average real return for the 12-year period as can be seen in table
8 above.
Table 9: Real Return on Equity based on Dividend Yield before Tax (%)
Ashaka Benue CCNN N. Ropes N. Wire Wapco
2000 1.70 -6.45 -6.45 -6.45 0.88 -6.45
2001 -11.18 -15.90 -15.90 -15.90 -7.65 -15.90
2002 -8.72 -11.43 -11.43 -11.43 -11.43 -11.43
2003 -2.45 -12.28 -12.28 -12.28 -12.28 -12.28
2004 -1.43 -13.04 -11.54 -13.04 -13.04 -13.04
2005 -7.26 -14.53 -13.35 -14.53 -14.53 -12.44
2006 -4.31 -7.58 -7.58 -4.34 -7.58 -5.02
2007 -5.12 -5.12 -5.12 -2.98 -5.12 -3.41
2008 -9.69 -10.39 -5.07 -8.99 -10.39 -6.51
2009 -11.11 -5.77 -2.65 -11.11 -11.11 -10.75
2010 -10.74 -10.33 - -12.05 -12.05 -11.48
2011 -8.07 -8.79 - -9.75 -9.75 -8.15
AVE -6.53 -10.13 -9.14 -10.24 -9.56 -9.74 Source: Computed from Annual Reports of the Firms
Assessment based on dividend yields both before and after tax shows that the return on equity in
terms of cash reward to equity holders yielded negative real returns. This shows that dividends
received are not good hedge against inflation in this sector and this may be the reason why people
try to sell off when price appreciates.
Table 10: Real Return on Equity based on Dividend Yield after Tax (%)
Year Ashaka Benue CCNN N.Ropes N.Wire Wapco
2000 0.89 -6.45 -6.45 -6.45 0.15 -6.45
2001 -11.65 -15.90 -15.90 -15.90 -8.47 -15.90
2002 -8.99 -11.43 -11.43 -11.43 -11.43 -11.43
2003 -3.43 -12.28 -12.28 -12.28 -12.28 -12.28
2004 -2.60 -13.04 -11.69 -13.04 -13.04 -13.04
2005 -7.99 -14.53 -13.47 -14.53 -14.53 -12.66
2006 -4.64 -7.58 -7.58 -4.66 -7.58 -5.27
2007 -5.12 -5.12 -5.12 -3.19 -5.12 -3.58
2008 -9.76 -10.39 -5.60 -9.13 -10.39 -6.91
2009 -11.11 -6.30 -3.49 -11.11 -11.11 -10.78
Asian Journal of Empirical Research, 3(10)2013: 1343-1361
1356
2010 -10.87 -10.50 - -12.05 -12.05 -11.53
2011 -8.24 -8.88 - -9.75 -9.75 -8.31
AVE -6.96 -10.20 -9.30 -10.29 -9.69 -9.85 Source: Computed from Annual Reports of the Firms
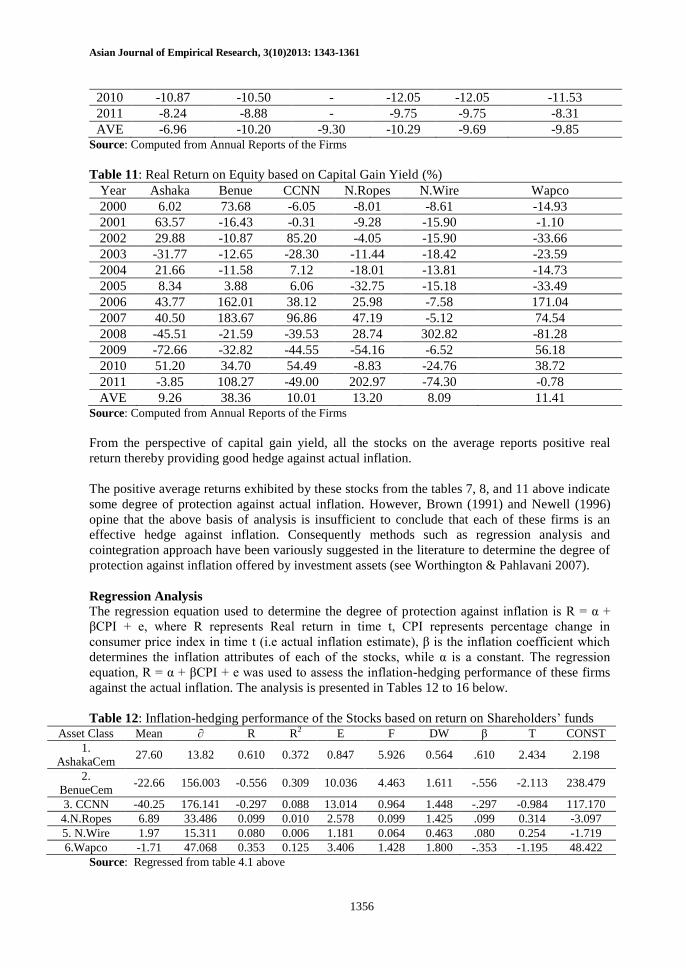
Table 11: Real Return on Equity based on Capital Gain Yield (%)
Year Ashaka Benue CCNN N.Ropes N.Wire Wapco
2000 6.02 73.68 -6.05 -8.01 -8.61 -14.93
2001 63.57 -16.43 -0.31 -9.28 -15.90 -1.10
2002 29.88 -10.87 85.20 -4.05 -15.90 -33.66
2003 -31.77 -12.65 -28.30 -11.44 -18.42 -23.59
2004 21.66 -11.58 7.12 -18.01 -13.81 -14.73
2005 8.34 3.88 6.06 -32.75 -15.18 -33.49
2006 43.77 162.01 38.12 25.98 -7.58 171.04
2007 40.50 183.67 96.86 47.19 -5.12 74.54
2008 -45.51 -21.59 -39.53 28.74 302.82 -81.28
2009 -72.66 -32.82 -44.55 -54.16 -6.52 56.18
2010 51.20 34.70 54.49 -8.83 -24.76 38.72
2011 -3.85 108.27 -49.00 202.97 -74.30 -0.78
AVE 9.26 38.36 10.01 13.20 8.09 11.41 Source: Computed from Annual Reports of the Firms
From the perspective of capital gain yield, all the stocks on the average reports positive real
return thereby providing good hedge against actual inflation.
The positive average returns exhibited by these stocks from the tables 7, 8, and 11 above indicate
some degree of protection against actual inflation. However, Brown (1991) and Newell (1996)
opine that the above basis of analysis is insufficient to conclude that each of these firms is an
effective hedge against inflation. Consequently methods such as regression analysis and
cointegration approach have been variously suggested in the literature to determine the degree of
protection against inflation offered by investment assets (see Worthington & Pahlavani 2007).
Regression Analysis
The regression equation used to determine the degree of protection against inflation is R = α +
βCPI + e, where R represents Real return in time t, CPI represents percentage change in
consumer price index in time t (i.e actual inflation estimate), β is the inflation coefficient which
determines the inflation attributes of each of the stocks, while α is a constant. The regression
equation, R = α + βCPI + e was used to assess the inflation-hedging performance of these firms
against the actual inflation. The analysis is presented in Tables 12 to 16 below.
Table 12: Inflation-hedging performance of the Stocks based on return on Shareholders‟ funds Asset Class Mean ∂ R R2 E F DW β T CONST
1.
AshakaCem 27.60 13.82 0.610 0.372 0.847 5.926 0.564 .610 2.434 2.198
2.
BenueCem -22.66 156.003 -0.556 0.309 10.036 4.463 1.611 -.556 -2.113 238.479
3. CCNN -40.25 176.141 -0.297 0.088 13.014 0.964 1.448 -.297 -0.984 117.170
4.N.Ropes 6.89 33.486 0.099 0.010 2.578 0.099 1.425 .099 0.314 -3.097
5. N.Wire 1.97 15.311 0.080 0.006 1.181 0.064 0.463 .080 0.254 -1.719
6.Wapco -1.71 47.068 0.353 0.125 3.406 1.428 1.800 -.353 -1.195 48.422
Source: Regressed from table 4.1 above
Asian Journal of Empirical Research, 3(10)2013: 1343-1361
1357
While Ashaka Cement returns moved appreciably in the same direction with inflation, Benue
Cement, CCNN and WAPCO-Larfarge returns moved in opposite direction as can be depicted
from the beta coefficients in table 12 above. One can infer that Ashaka Cement offered
substantial positive hedge against actual inflation while Benue Cement, CCNN and WAPCO-
Larfarge have perverse hedge against actual inflation. The extent of perverse inflation hedging
was highest in the ordinary shares of Benue Cement with β = -0.556.
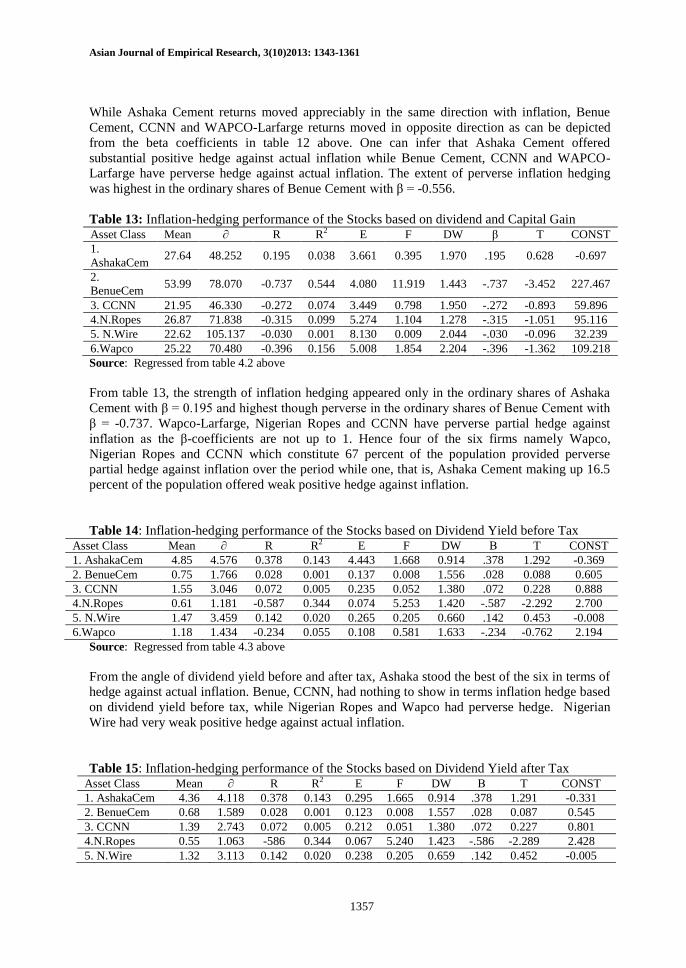
Table 13: Inflation-hedging performance of the Stocks based on dividend and Capital Gain Asset Class Mean ∂ R R2 E F DW β T CONST
1.
AshakaCem 27.64 48.252 0.195 0.038 3.661 0.395 1.970 .195 0.628 -0.697
2.
BenueCem 53.99 78.070 -0.737 0.544 4.080 11.919 1.443 -.737 -3.452 227.467
3. CCNN 21.95 46.330 -0.272 0.074 3.449 0.798 1.950 -.272 -0.893 59.896
4.N.Ropes 26.87 71.838 -0.315 0.099 5.274 1.104 1.278 -.315 -1.051 95.116
5. N.Wire 22.62 105.137 -0.030 0.001 8.130 0.009 2.044 -.030 -0.096 32.239
6.Wapco 25.22 70.480 -0.396 0.156 5.008 1.854 2.204 -.396 -1.362 109.218
Source: Regressed from table 4.2 above
From table 13, the strength of inflation hedging appeared only in the ordinary shares of Ashaka
Cement with β = 0.195 and highest though perverse in the ordinary shares of Benue Cement with
β = -0.737. Wapco-Larfarge, Nigerian Ropes and CCNN have perverse partial hedge against
inflation as the β-coefficients are not up to 1. Hence four of the six firms namely Wapco,
Nigerian Ropes and CCNN which constitute 67 percent of the population provided perverse
partial hedge against inflation over the period while one, that is, Ashaka Cement making up 16.5
percent of the population offered weak positive hedge against inflation.
Table 14: Inflation-hedging performance of the Stocks based on Dividend Yield before Tax Asset Class Mean ∂ R R2 E F DW Β T CONST
1. AshakaCem 4.85 4.576 0.378 0.143 4.443 1.668 0.914 .378 1.292 -0.369
2. BenueCem 0.75 1.766 0.028 0.001 0.137 0.008 1.556 .028 0.088 0.605
3. CCNN 1.55 3.046 0.072 0.005 0.235 0.052 1.380 .072 0.228 0.888
4.N.Ropes 0.61 1.181 -0.587 0.344 0.074 5.253 1.420 -.587 -2.292 2.700
5. N.Wire 1.47 3.459 0.142 0.020 0.265 0.205 0.660 .142 0.453 -0.008
6.Wapco 1.18 1.434 -0.234 0.055 0.108 0.581 1.633 -.234 -0.762 2.194
Source: Regressed from table 4.3 above
From the angle of dividend yield before and after tax, Ashaka stood the best of the six in terms of
hedge against actual inflation. Benue, CCNN, had nothing to show in terms inflation hedge based
on dividend yield before tax, while Nigerian Ropes and Wapco had perverse hedge. Nigerian
Wire had very weak positive hedge against actual inflation.
Table 15: Inflation-hedging performance of the Stocks based on Dividend Yield after Tax Asset Class Mean ∂ R R2 E F DW Β T CONST
1. AshakaCem 4.36 4.118 0.378 0.143 0.295 1.665 0.914 .378 1.291 -0.331
2. BenueCem 0.68 1.589 0.028 0.001 0.123 0.008 1.557 .028 0.087 0.545
3. CCNN 1.39 2.743 0.072 0.005 0.212 0.051 1.380 .072 0.227 0.801
4.N.Ropes 0.55 1.063 -586 0.344 0.067 5.240 1.423 -.586 -2.289 2.428
5. N.Wire 1.32 3.113 0.142 0.020 0.238 0.205 0.659 .142 0.452 -0.005
Asian Journal of Empirical Research, 3(10)2013: 1343-1361
1358
6.Wapco 1.06 1.288 -0.235 0.055 0.097 0.586 1.632 -.235 -0.765 1.977
Source: Regressed from table 4.4 above
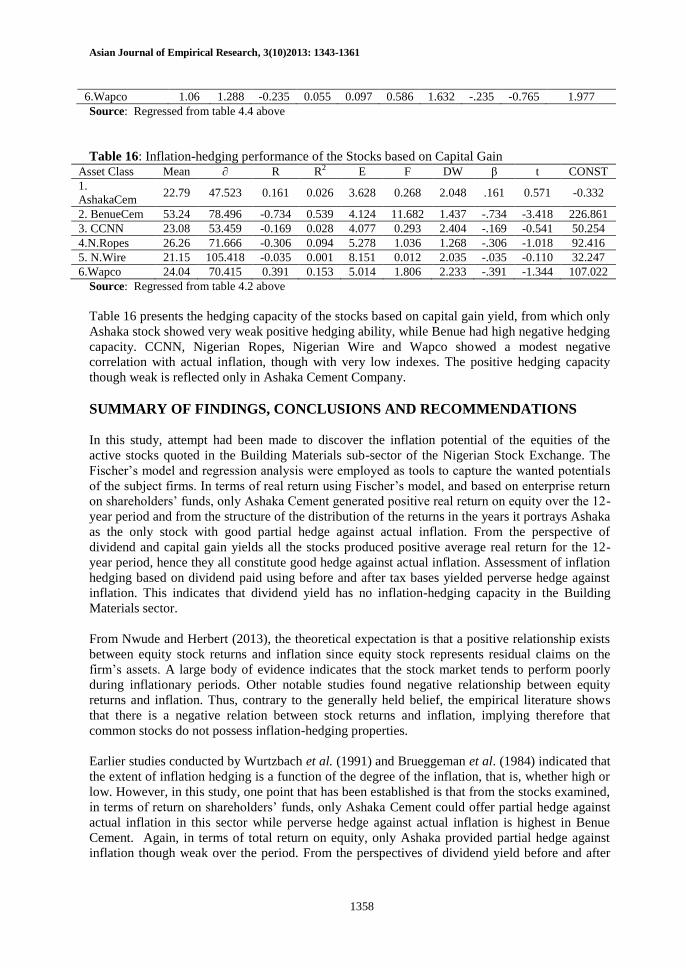
Table 16: Inflation-hedging performance of the Stocks based on Capital Gain Asset Class Mean ∂ R R2 E F DW β t CONST
1.
AshakaCem 22.79 47.523 0.161 0.026 3.628 0.268 2.048 .161 0.571 -0.332
2. BenueCem 53.24 78.496 -0.734 0.539 4.124 11.682 1.437 -.734 -3.418 226.861
3. CCNN 23.08 53.459 -0.169 0.028 4.077 0.293 2.404 -.169 -0.541 50.254
4.N.Ropes 26.26 71.666 -0.306 0.094 5.278 1.036 1.268 -.306 -1.018 92.416
5. N.Wire 21.15 105.418 -0.035 0.001 8.151 0.012 2.035 -.035 -0.110 32.247
6.Wapco 24.04 70.415 0.391 0.153 5.014 1.806 2.233 -.391 -1.344 107.022
Source: Regressed from table 4.2 above
Table 16 presents the hedging capacity of the stocks based on capital gain yield, from which only
Ashaka stock showed very weak positive hedging ability, while Benue had high negative hedging
capacity. CCNN, Nigerian Ropes, Nigerian Wire and Wapco showed a modest negative
correlation with actual inflation, though with very low indexes. The positive hedging capacity
though weak is reflected only in Ashaka Cement Company.
SUMMARY OF FINDINGS, CONCLUSIONS AND RECOMMENDATIONS
In this study, attempt had been made to discover the inflation potential of the equities of the
active stocks quoted in the Building Materials sub-sector of the Nigerian Stock Exchange. The
Fischer‟s model and regression analysis were employed as tools to capture the wanted potentials
of the subject firms. In terms of real return using Fischer‟s model, and based on enterprise return
on shareholders‟ funds, only Ashaka Cement generated positive real return on equity over the 12-
year period and from the structure of the distribution of the returns in the years it portrays Ashaka
as the only stock with good partial hedge against actual inflation. From the perspective of
dividend and capital gain yields all the stocks produced positive average real return for the 12-
year period, hence they all constitute good hedge against actual inflation. Assessment of inflation
hedging based on dividend paid using before and after tax bases yielded perverse hedge against
inflation. This indicates that dividend yield has no inflation-hedging capacity in the Building
Materials sector.
From Nwude and Herbert (2013), the theoretical expectation is that a positive relationship exists
between equity stock returns and inflation since equity stock represents residual claims on the
firm‟s assets. A large body of evidence indicates that the stock market tends to perform poorly
during inflationary periods. Other notable studies found negative relationship between equity
returns and inflation. Thus, contrary to the generally held belief, the empirical literature shows
that there is a negative relation between stock returns and inflation, implying therefore that
common stocks do not possess inflation-hedging properties.
Earlier studies conducted by Wurtzbach et al. (1991) and Brueggeman et al. (1984) indicated that
the extent of inflation hedging is a function of the degree of the inflation, that is, whether high or
low. However, in this study, one point that has been established is that from the stocks examined,
in terms of return on shareholders‟ funds, only Ashaka Cement could offer partial hedge against
actual inflation in this sector while perverse hedge against actual inflation is highest in Benue
Cement. Again, in terms of total return on equity, only Ashaka provided partial hedge against
inflation though weak over the period. From the perspectives of dividend yield before and after
Asian Journal of Empirical Research, 3(10)2013: 1343-1361
1359
tax, Ashaka stood as the best of the six in terms of hedge against actual inflation, followed by
Nigerian Wire, Benue Cement, and CCNN with weak positive hedge against actual inflation.
References
Barkham, R. J., Ward, C. W. R. & Henry, O. T. (1996). The Inflation-Hedging Characteristics of
U.K Property. Journal of Property Finance, Vol. 7, No. 1, pp. 62-76.
Bekaert, G., & Wang, X. S. (2010). Inflation Risk and the Inflation Risk Premium. Economic
Policy, Vol. 25, 755-806.
Bello, O. M. (2000). Risk Management in the Process of Property Development Construction in
Nigeria. Journal of the Federation of Construction Industry, Vol. 15, No. 3, pp. 15-23.
Bello, O. M. (2005). The Inflation-Hedging Attributes of Investments in Real Estate, Ordinary
Shares and Naira Denominated Deposits Between 1996 and 2002. Journal of Banking,
Vol. 1, No. 1, pp. 1-28.
Bodie, Z. (1976). Common Stocks as a Hedge against Inflation. Journal of Finance, Vol. 31, pp.
459-470.
Boudoukh, J. & Richardson, M. (1993). Stock Returns and Inflation: A Long-Horizon
Perspective. American Economic Review, Vol. 83, pp. 1346-1355.
Bruno, S. & Chincarini, L. (2010). A Historical Examination of Optimal Real Return Portfolios
for non-US Investors. Review of Financial Economics, Vol. 19, pp. 161-178.
Brown, P. (1990). United Kingdom Residential Price Expectations and Inflation. Land
Development Studies, Vol. 7, pp. 57-67.
Brown, G. (1991). Property Investment and the Capital Markets. London: E & FN Spon.
Brueggeman, W. Chen, A. & Thibodean, T. (1984). Real Estate Investment Funds: Performance
and Portfolio considerations. AREUEA Journal, 12, No. 3, 333-354.
Brueggeman, W. Chen, A. & Thibodean, T. (1992). Some Additional Evidence on the
Performance of Commingled Real Estate Investment Funds: 1972-1991. Journal of Real
Estate Research, Vol. 7, pp. 433-448.
Campbell, J. Y. & Vuolteenaho, T. (2004). Inflation Illusion and Stock Prices. The American
Economic Review, Vol. 94, pp. 19-23.
Choudhry, T. (2001). Inflation and rate of return on stocks. Journal of International Financial
Markets, Institutions and Money, Vol. 11, pp. 75-96.
Crosby, M. & Otto, G. (2000). Inflation and the Capital Stock. Journal of Money, Credit and
Banking, Vol. 32, No. 2, pp. 236-253.
Day, T. E. (1984). Real Stock Returns and inflation. Journal of Finance, Vol. 39, No. 2, pp. 493-
502.
Dockery, E., Ezeabasili, V. N. & Herbert, W. E. (2012). On the Relationship between Fiscal
Deficits and Inflation: Econometric Evidence for Nigeria. Economics and Finance Review,
Vol. 2, No. 7, pp. 17 – 30.
Erb, C. B. & Harvey, C. R. (1995). Inflation and World equity selection. Financial analyst
Journal, Vol. 51, No. 6, pp. 28-42.
Ezeabasili, V. N., Mojekwu, J. N. & Herbert, W. E. (2012). An Empirical Analysis of Fiscal
Deficits and Inflation in Nigeria. International Business and Management, Vol. 4, No. 1,
pp. 105-120.
Fama, E. F. (1981). Stock returns, real activity, inflation, and money. American Economic
Review, Vol. 7, No. 4, pp. 545–565.
Fama, E. F. & Schwart, G. W. (1977). Assets Returns and Inflation. Journal of Financial
Economics, Vol. 5, pp. 115-146.
Fama, E. F. (1975). Short Term Interest Rates as Predictors of Inflation. American Economic
Review, Vol. 653, pp. 269-282.
Asian Journal of Empirical Research, 3(10)2013: 1343-1361
1360
______. & Gibbons, M. (1982). Inflation Real returns and Investment. Journal of Monetary
Economics, Vol. 8, pp. 279-323.
Fama, E. F. & Schwert, G. (1977). Asset Returns and Inflation. Journal of Financial Economics,
Vol. 8, pp. 115-146.
Fisher, I. (1930). The Theory of Interest Rates. London: Macmillan.
Fischer, S. and Easterly, W. (1990). The Economic of the Government Budget Constraint. World
Bank Research Observer, vol. 5, issue. 2, pp. 127-42
Fisher, J. & Webb, B. (1992). Current Issues in the Analysis of Commercial Real Estate.
AREUEA Journal, Vol. 20, pp. 211-228.
Fogler, H. R. (1984). 20% in Real Estate: Can theory justify it? Journal of Portfolio Management,
Vol. 10, No. 2, pp. 6-13.
Gorton G. & Rouwenhorst, G. (2006). Facts and Fantasies about Commodity Futures. Financial
Analysts Journal Vol. 62, pp. 47-68.
Griffiths, B. (1976). Inflation: The Price of Prosperity. London: Wendenfeld and Nicolean.
Gultekin, M. (1983). Stock Market Returns and Inflation Forecasts: Evidence from other
Countries, Journal of Finance, Vol. 38, No. 1, pp. 49-65.
Hardin, W. G. And Cheng, P. (2005), Farmland Investment: A Semivariance Approach, Journal
of Real Estate Portfolio Management, Vol. 11, No. 2, pp. 187-196.
Hartzell, D. J. Shulman, D. G. & Wurtzebach, C. H. (1987). Refining the Analysis of Regional
Diversification for Income-Producing Real Estate. Journal of Real Estate Research, Vol.
2, No. 2, pp. 85-95.
Hoesli, M. (1994). Real Estate as a Hedge against Inflation: Learning from the Swiss Case.
Journal of Property Valuation and Management, Vol. 12, No. 3, pp. 51-59.
Hoesli, M. Matysiak, B. MacGregor, B. & Nanthakumaran, N. (1995). The Short Term Inflation
Hedging Characteristics of UK Real Estate A paper presented at Cutting Edge Conference,
Aberdeen, Scotland.
Hoesli, M. Matysiak, B. MacGregor, B. & Nanthakumaran, N. (1996). The Long-term Inflation
Hedging Characteristics of UK Commercial Property. Journal of Property Finance, Vol.
7, No. 1, pp. 50-61.
Hoesli, M., Lizieri, C. & MacGregor, B. (2006). The inflation hedging characteristics of US and
UK investments: a multi-factor error correction approach. Working Papers in Real Estate
& Planning. 01/06, University of Reading, U.K. http://centaur.reading.ac.uk/20758/
Hoevenaars, R. P. M., Molenaar, R. D. J., Schotman, P. C. & Steenkamp, T. B. M. (2008).
Strategic Asset Allocation with Liabilities: Beyond Stocks and Bonds. Journal of
Economic Dynamics & Control, Vol. 32, pp. 2939-2970.
Ibbotson Associates, (1991),
http://www.dgcassetmanagement.com/investing/agriculture/agricultural-land/farmland-
investment-portfolio-diversification#sthash.rZwzgz1m.dpuf)
Limmack, R. & Ward, C. (1988). Property Returns and Inflation. Land Development Studies,
Vol. 5, pp. 47-55.
Mengden, A. & Hartzell, D. J. (1988). Real Estate Investment Trusts: Are They Stocks or Real
Estate?’ Stocks Research-Real Estate, (New York, NY: Salmon Brothers Inc.
Miles, D. (1996). Property and Inflation‟ Journal of Property Finance, Vol. 7, No. 1, pp. 21-32.
Newell, G. (1995a). Inflation-Hedging Attributes of Australian Commercial Property. Australian
Land Economic Review, Vol. 1, pp. 31-37.
Newell, G. (1995b). Is Canadian Real Estate A Hedge Against Inflation. The Canadian
Appraiser, Vol. 39, pp. 25-27.
Newell, G. (1996). The Inflation-Hedging Characteristics of Australian Commercial Property:
1984-1995. Journal of Property Finance, Vol. 7, pp. 6-20.
Newell, G. & Boyd, T. (1995). Inflation-Hedging Attributes of New Zealand Commercial
Property. Journal of Property Finance, Vol. 7, pp. 6-20.
Asian Journal of Empirical Research, 3(10)2013: 1343-1361
1361
Nuveen Asset Investment (2013). Evolving Approaches to Hedging Inflation.
www.nuveen.com/Home/Documents/Viewer.aspx?fileId
Nwude, E. C. and Herbert, W. E. (2013). Are Brewery Stocks Inflation Hedges: Evidence from
Nigeria, Research Journal of Finance and Accounting, Vol. 4, No. 7, pp. 78-89.
Park, J. Mullineaux, D. J. & Chew, I. K. (1990). Are REITs Inflation Hedges? Journal of Real
Estate Finance and Economics, Vol. 3, No. 3, pp. 5-23.
Reilly, F.K., Johnson, G. L. & Smith, R. E. (1970). Inflation, Inflation hedges and Common
Stock. Financial Analysts Journal, Vol. 26, No. 1, pp. 104-110.
Savill Survey (2011), Savills Agricultural Land Market Survey
http://www.dgcassetmanagement.com/investing/agriculture/agricultural-land/farmland-
investment-portfolio-diversification#sthash.rZwzgz1m.dpuf )
Spierdijk, L. and Umar, Z. (2013a). The Inflation-Hedging properties of stocks, Bonds, Treasury
Bills and Commodity Futures, Discussion Paper No. 11/2011-089, February 7, 2013,
Netspar.
Spierdijk, L. and Umar, Z. (2013b). Are Commodity Futures a good Hedge against Inflation,
Discussion Paper No. 11/2010-078, April 25, 2013, Netspar.
Worah, M. and Johnson, R. G. (2013), Intelligent Commodity Indexing: A Practical Guide to
Investing in Commodities, McGraw-Hill Global Education Holding.
Worthington, A. C. & Pahlavani, M. (2007). Gold Investment as an Inflationary Hedge:
Cointegration Evidence with Allowance for Endogenous Structural Breaks. Applied
Financial Economics Letters, Vol. 3, pp. 259-262.


