Embed Size (px)
Citation preview
1
Antimicrobial Consumption (AMC) Surveillance in Hong Kong -
Wholesale Supply Data (2020)
January 2022

2
Contents Outline
• Background• Methodology• Results (2016-2020)
1. Overall antimicrobials wholesale supply quantity 2. Antimicrobials wholesale supply by different grouping
A. Distribution by WHO AWaRe categorisation B. Distribution by SectorC. ATC Pharmacological SubgroupD. 10 most supplied antimicrobials
3. Wholesale supply of selected broad-spectrum antimicrobials
• Remarks on interpretation of results• Summary• Recommendations

3
Background

4
Background
• The Hong Kong Strategy and Action Plan on Antimicrobial Resistance 2017-2022 was issued in July 2017
• Activity 3.1.2 suggests collecting antibiotic supply data from different sectors as proxy to reflect the overall usage and trend of antimicrobial usage
• Past summaries published in CHP website in 2018 (Year 14-16), 2019 (Year 14-17) and 2020 (Year 14-18)
• This presentation briefly accounts the surveillance findings for year 2016-2020
• Since the Action Plan was published in July 2017, the situation of 2016 has been chosen as baseline for comparison

5
Methodology

6
Scope of Data
• Antimicrobials wholesale supply data from licensed drug wholesalers (ever supplied antimicrobials under monitoring) in year 2020 to the following sectors were included:
• Department of Health (DH)• Hospital Authority (HA)• Private hospitals• Private doctors (mutually exclusive with Private Hospitals)• Dentists• Veterinary surgeons• Community pharmacies• Farmers (who had the Antibiotics Permits issued by the Director of
Agriculture, Fisheries and Conservation Department)
7
Definitions
• Surveillance period is defined by calendar year• Anatomical Therapeutic Chemical (ATC) classification
• This system is developed by the World Health Organisation (WHO)• It divided drugs into different groups according to the organ or system on
which they act and their therapeutic, pharmacological and chemical properties
• Defined Daily Dose (DDD)• A standardised unit adopted by WHO to facilitate comparison of drug usage• Defined as “the assumed average maintenance dose per day for a drug used
for its main indication in adults”• Each antimicrobial was assigned a DDD value per route of administration• DDD values are updated by WHO annually#
• As the year 2021 version of ATC/DDD was adopted in this report, the DDD figures of previous years have been re-calculated which would be different from the figures presented in the past reports
• For example, DDD value has been newly assigned for amoxicillin 250mg/ cloxacillin 250mg that 4 tablets equal to 1 DDD
# https://www.whocc.no/atc_ddd_alterations__cumulative/ddd_alterations/

8
Antimicrobials monitored
• Antimicrobials fall under the following WHO ATC classification (2020) were collected from licensed drug wholesalers:
• J01 – Antibacterials for systemic use• P01AB – Nitroimidazole derivatives, agents against amoebiasis
and other protozoal diseases• A07AA – Antibiotics, intestinal antiinfectives
• Antimicrobials which can be administered by the following routes were included as recommended by WHO
• Oral• Parenteral• Rectal• Inhalation
• Preparations for topical use were excluded
9
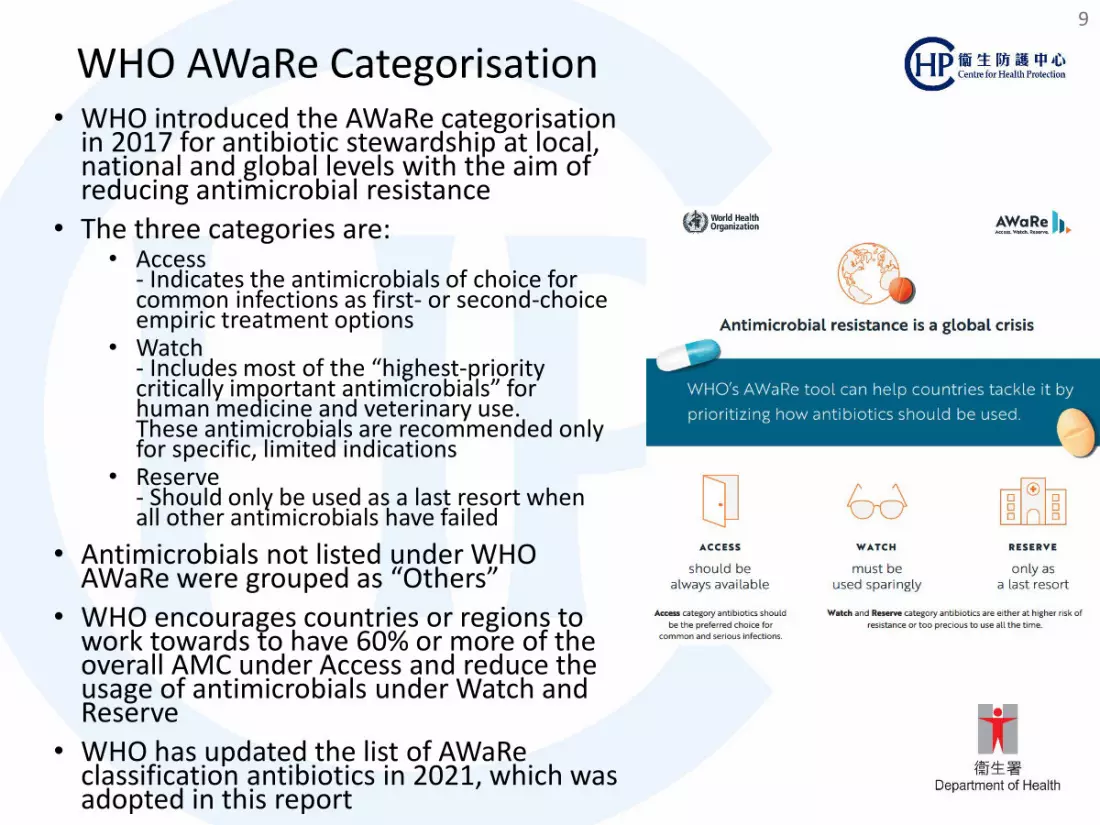
WHO AWaRe Categorisation• WHO introduced the AWaRe categorisation
in 2017 for antibiotic stewardship at local, national and global levels with the aim of reducing antimicrobial resistance
• The three categories are:• Access
- Indicates the antimicrobials of choice for common infections as first- or second-choice empiric treatment options
• Watch- Includes most of the “highest-priority critically important antimicrobials” for human medicine and veterinary use. These antimicrobials are recommended only for specific, limited indications
• Reserve- Should only be used as a last resort when all other antimicrobials have failed
• Antimicrobials not listed under WHO AWaRe were grouped as “Others”
• WHO encourages countries or regions to work towards to have 60% or more of the overall AMC under Access and reduce the usage of antimicrobials under Watch and Reserve
• WHO has updated the list of AWaReclassification antibiotics in 2021, which was adopted in this report

10
Broad-spectrum Antimicrobials (Big Guns)
The following broad-spectrum antimicrobials are important on treating resistant infections and being monitored in AMU surveillance with HA Dispensing Data. They are examined separately in this surveillance:
• Piperacillin/tazobactam• Ceftazidime• Cefoperazone/sulbactam• Cefepime• Ceftaroline fosamil• Ceftolozane/tazobactam• Ceftazidime/avibactam
• Meropenem• Ertapenem• Imipenem/cilastatin• Vancomycin• Linezolid• Daptomycin• Colistin• Teicoplanin
11
Measurement
• The following units were used:• Overall quantity of antimicrobials supplied to various sectors: DDD*• Supply quantity after considering the annual mid-year population of
Hong Kong: DDD per 1,000 inhabitants per day (DID)
• The following measurements were calculated:• Overall wholesale supply quantity• Antimicrobials wholesale supply by different grouping
• Distribution by WHO AWaRe categorisation• Distribution by Sector• ATC Pharmacological Subgroup• 10 most supplied antimicrobials
• Wholesale supply quantity of selected broad-spectrum antimicrobials
*The ATC/DDD Index (2020) published by the WHO Collaborating Centre for Drug Statistics Methodology were adopted

12
Statistical Method
• Year 2016 was chosen as the baseline for comparison as the Hong Kong Strategy and Action Plan on Antimicrobial Resistance 2017-2022 was issued in mid-2017 and such decision was endorsed by the High Level Steering Committee (HLSC)
• Following the practice of ECDC, compound annual growth rate (CAGR) is used to illustrate average annual rate of change when comparing antimicrobials dispensed in 2020 with that in 2016.
CAGR=(𝑆𝑆𝑆𝑆2020/𝑆𝑆𝑆𝑆2016)( ⁄1 4)−1
• In this equation, SU2020 is the total amount of antimicrobials supplied in year 2020, SU2016 is the total amount of antimicrobials supplied for year 2016
13
Results1. Overall antimicrobials wholesale supply (2016-2020)

14
1. Overall antimicrobials wholesale supply(2016-2020)
Year Average annual change
p-valueCompound annual
growth rate(16 to 20)2016 2017 2018 2019 2020
DDD in million* 54.54 49.68 50.29 52.11 37.22 - - -9.1%
DID* 20.37 18.41 18.49 19.02 13.63 -1.288 - -9.6%* Non-human use antimicrobials supplied in Hong Kong were excluded.- Only p-values with statistical significance will be shown
• A drastic decrease was observed in the overall supply in 2020 duringthe pandemic of COVID-19 when compared with that of 2019 (- 5.39DID, ↓28.3%)
• 9.6% decrease (CAGR for DID) in overall antimicrobials wholesalesupply in Hong Kong was observed from 2016 and 2020

15
Results2A. Antimicrobials wholesale supply (2016-2020) - Distribution by WHO AWaRe categorisation

16
2A. Antimicrobials wholesale supply (2016-2020) - Distribution by WHO AWaRe categorisation
• Antimicrobials under Access constituted 55.8% of all antimicrobials supplied in 2016 and increased to 61.5% in 2020
• The proportion of antimicrobials under Watch decreased steadily from 40.3% in 2016 to 34.5% in 2020

17
2A. Antimicrobials wholesale supply (2016-2020) - Distribution by WHO AWaRe categorisation
AWaReCategorisation
DDD per 1,000 inhabitants per day (DID)*Average annual change
p-value
Compound annual growth
rate(16 to 20)
Year 2016
Year 2017
Year 2018
Year 2019
Year 2020
Access 11.36 10.39 10.55 11.25 8.38 -0.511 - -7.3%Watch 8.20 7.36 7.28 7.07 4.70 -0.051 - -13.0%
Reserve 0.02 0.02 0.02 0.02 0.02 0.002 <0.05 10.7%#
Others 0.79 0.64 0.64 0.68 0.52 -0.728 - -9.9%* Non-human use antimicrobials supplied in Hong Kong were excluded.# CAGR figure for Reserve antimicrobials has to be interpreted with caution, as number of Reserve antimicrobials increased from 5 in 2016 to 10 in 2020- Only p-values with statistical significance will be shown
• The supply of antimicrobials under Access and Watch showed decrease of 7.3% and 13.0% in CAGR from 2016 to 2020 respectively
• As the total number of antimicrobials under Reserve supplied in Hong Kong increased from five in 2016 to ten in 2020. Therefore, the CAGR figure must be interpreted with caution

18
Results2B. Antimicrobials wholesale supply (2016-2020) - Distribution by Sector

19
2B. Antimicrobials wholesale supply (2016-2020) - Distribution by Sector
• In 2020, 49.4% of antimicrobials supplied in Hong Kong went to private doctors, followed by Hospital Authority (29.0%) and community pharmacies (7.5%)
• Percentage of antimicrobials supplied to community pharmacies decreased gradually from 18.5% in 2016 to 7.5% in 2020

20
2B. Antimicrobials wholesale supply (2016-2020) - Distribution by Sector
DDD per 1,000 inhabitant days (DID) Average annual change
p-value CAGR(16 to 20)Year
2016Year 2017
Year 2018
Year 2019
Year 2020
Human-use sectorsPrivate Doctors 10.82 9.69 10.44 10.96 6.83 -0.670 - -10.9%Hospital Authority 4.07 4.17 4.27 4.47 4.01 0.019 - -0.4%Community Pharmacies 3.82 2.51 1.61 1.46 1.04 -0.660 <0.05 -27.7%Private Hospitals 1.09 1.38 1.38 1.31 0.93 -0.040 - -3.9%Dentists 0.38 0.50 0.58 0.64 0.61 0.062 <0.05 12.9%Department of Health 0.19 0.17 0.21 0.17 0.19 0.001 - 0.3%- Only p-values with statistical significance will be shown
• Drastic decrease from 2019 to 2020 was observed in private doctors (37.7%), private hospitals (28.6%) and community pharmacies (28.4%)
• Among the supply for human use, supply to dentists showed the sharpest increase of 12.9% while supply to community pharmacies showed the sharpest decrease of 27.7% in CAGR

21
Antimicrobials wholesale supply for Community Pharmacies (by ATC Pharmacological Subgroup)
Note: Figures inside bar chart are DID (Annual percentage)
• When analysed by sectors, an obvious decrease was observed with community pharmacies from 2019 to 2020, and from 2016 to 2020
• Also an obvious continuous decrease could be seen from 2016 to 2020 (from 3.82 to 1.04 DID, ↓72.7%), contributed by almost all ATC pharmacological subgroups, especially beta-lactam antibacterials, penicillins (J01C) (↓84.8%)
• Smaller magnitudes of decrease could be seen with macrolides, lincosamides and stregtogramins(J01F), and tetracyclines (J01A) and quinolones (J01M)

22
Antimicrobials wholesale supply for Private Doctors (by ATC Pharmacological Subgroup)
Note: Figures inside bar chart are DID (Annual percentage)
• For private doctors, drastic decrease was observed from 2019 to 2020, opposite to the rising trend from 2017 to 2019
• Mainly contributed by beta-lactam antibacterials, penicillins (J01C) (↓1.75DID, 39.0%), macrolides, lincosamides and stregtogramins (J01F) (↓0.93DID, 44.5%), other beta-lactam antibacterials (J01D) (↓0.75DID, 47.2%), and quinolones (J01M) (↓0.46DID, 34.6%)

23
Antimicrobials wholesale supply for Hospital Authority (by ATC Pharmacological Subgroup)
Note: Figures inside bar chart are DID (Annual percentage)
• For Hospital Authority, the decrease from 2019 to 2020 was relatively mild• The most obvious decrease was the beta-lactam antibacterials, penicillins (J01C)
(↓0.36DID, 14.7%), while other groups remained rather stable in 2020
24
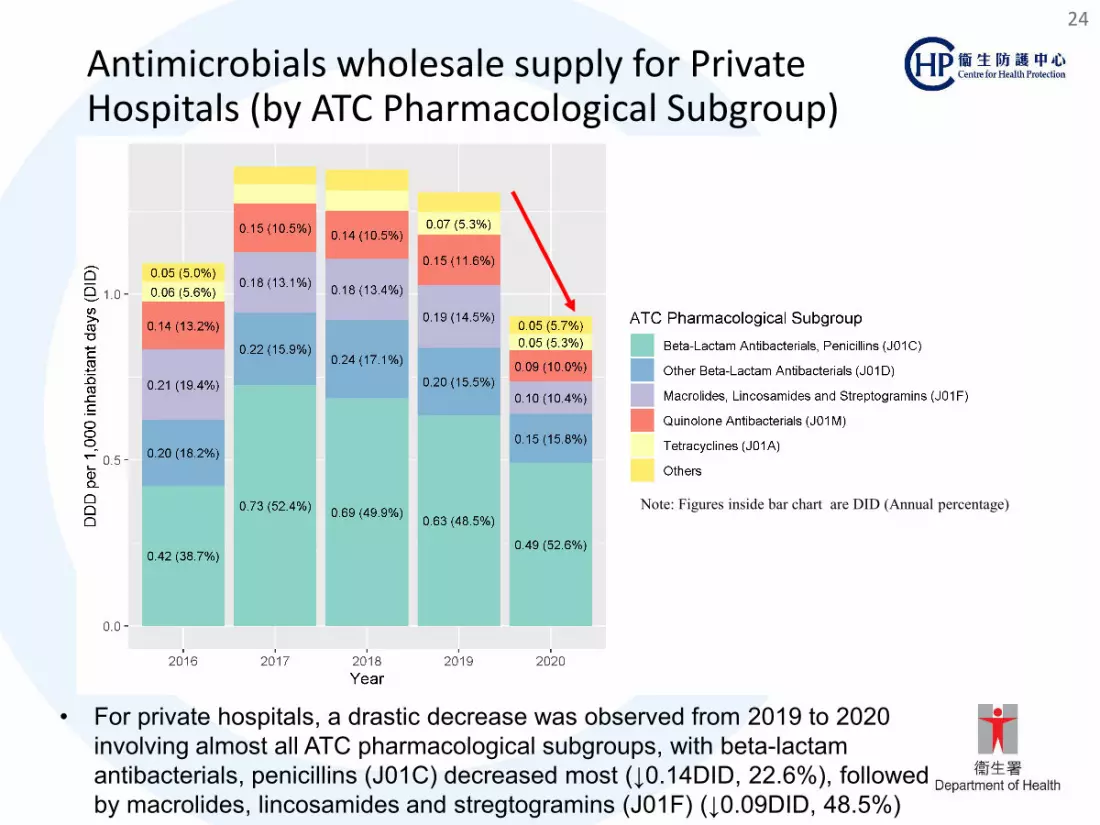
Antimicrobials wholesale supply for Private Hospitals (by ATC Pharmacological Subgroup)
Note: Figures inside bar chart are DID (Annual percentage)
• For private hospitals, a drastic decrease was observed from 2019 to 2020 involving almost all ATC pharmacological subgroups, with beta-lactam antibacterials, penicillins (J01C) decreased most (↓0.14DID, 22.6%), followed by macrolides, lincosamides and stregtogramins (J01F) (↓0.09DID, 48.5%)

25
Antimicrobials wholesale supply for Dentists (by ATC Pharmacological Subgroup)
Note: Figures inside bar chart are DID (Annual percentage)
• For dentists, all ATC pharmacological subgroups decreased mildly from 2019 to 2020, except tetracyclines (J01A), but the absolute quantity is small

26Antimicrobials wholesale supply for Department of Health (by ATC Pharmacological Subgroup)
• For DH, a mild increase was observed from 2019 to 2020 but the results should be interpreted with caution as the absolute change for each group is very small
Note: Figures inside bar chart are DID (Annual percentage)

27
Results2C. Antimicrobials wholesale supply in Hong Kong (by ATC Pharmacological Subgroup)

28
2C. Antimicrobials wholesale supply (2016-2020) - by ATC Pharmacological Subgroup
• In 2020, beta-lactam antibacterial, penicillins (J01C) was the most commonly supplied antimicrobial group (44.0%) by wholesale, followed by tetracyclines(J01A) (14.0%), macrolides, lincosamides and streptogramins (J01F) (12.2%), quinolone antibacterials (J01M) (11.8%), and other beta-lactam antibacterials(J01D) (10.0%)

29
2C. Antimicrobials wholesale supply (2016-2020) - by ATC Pharmacological Subgroup
ATC Pharmacological Subgroup DDD per 1,000 inhabitant days (DID) Average annual change
p-value
CAGR(16 to 20)Code Description Year
2016Year 2017
Year 2018
Year 2019
Year 2020
J01C Beta-Lactam Antibacterials, Penicillins 8.68 7.89 8.09 8.52 6.00 -0.473 - -8.8%J01A Tetracyclines 2.07 1.85 1.87 2.05 1.91 -0.011 - -2.0%
J01F Macrolides, Lincosamides and Streptogramins 3.34 2.96 2.89 2.82 1.66 -0.349 - -16.0%
J01M Quinolone Antibacterials 2.43 2.29 2.34 2.19 1.60 -0.175 - -9.9%J01D Other Beta-Lactam Antibacterials 2.85 2.30 2.17 2.19 1.36 -0.309 <0.05 -16.9%
P01ABNitroimidazole Derivatives, Agents Against Amoebiasis and Other Protozoal Diseases
0.43 0.47 0.44 0.51 0.42 0.002 - -0.5%
J01X Other Antibacterials 0.29 0.32 0.32 0.34 0.32 0.007 - 1.8%J01E Sulfonamides and Trimethoprim 0.21 0.19 0.22 0.21 0.18 -0.004 - -3.7%A07AA Antibiotics, Intestinal Antiinfectives <0.005 0.10 0.12 0.12 0.14 0.031 - NA#
J01G Aminoglycoside Antibacterials 0.05 0.05 0.05 0.05 0.03 -0.004 - -12.6%J01B Amphenicols <0.005 <0.005 <0.005 <0.005 - -0.002 <0.05 -J01R Combinations of Antimicrobials* - - - - - - - -
Total 20.37 18.41 18.49 19.02 13.63 -1.288 - -9.6%Note: - Only p-values with statistical significance will be shownAntimicrobials supplied for non-human use in Hong Kong (e.g. veterinary surgeons and farmers) were not included* There was no registered product under "Combinations of Antimicrobials" (J01R) in Hong Kong# The CAGR for antimicrobials under A07AA is not applicable as the 2016 figure was not complete
• Antimicrobials under J01X (Other Antibacterials) increased most (1.8% in CAGR) • Antimicrobials under J01F (Macrolides, Lincosamides and Streptogramins) and J01D (Other
Beta-Lactam Antibacterials) decreased most (-16.0% and -16.9% in CAGR respectively)• When assessing the average annual change, antimicrobials under J01D (Other Beta-Lactam
Antibacterials) and J01B (Amphenicols) reported annual average reduction of 0.309 and 0.002 DID respectively with statistical significance

30
2C. Antimicrobials wholesale supply (19 vs 20) -by ATC Pharmacological Subgroup
• When compared with that of 2019, beta-lactam antibacterials, penicillins (J01C) decreased most in terms of DID

31
Results2D. Antimicrobials wholesale supply in Hong Kong (10 most supplied antimicrobials)
32
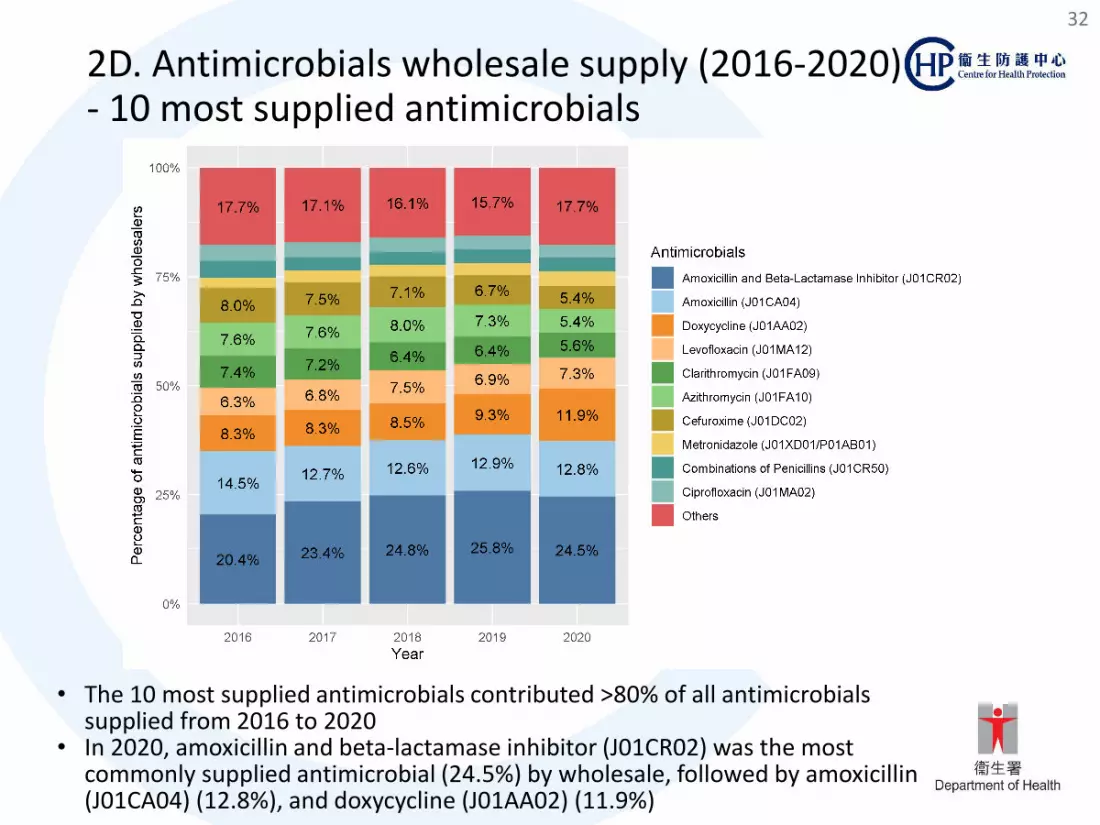
2D. Antimicrobials wholesale supply (2016-2020) - 10 most supplied antimicrobials
• The 10 most supplied antimicrobials contributed >80% of all antimicrobials supplied from 2016 to 2020
• In 2020, amoxicillin and beta-lactamase inhibitor (J01CR02) was the most commonly supplied antimicrobial (24.5%) by wholesale, followed by amoxicillin (J01CA04) (12.8%), and doxycycline (J01AA02) (11.9%)

33
2D. Antimicrobials wholesale supply (2016-2020) - 10 most supplied antimicrobials
ATC Chemical Substance DDD per 1,000 inhabitant days (DID) Average annual change
p-value CAGR(16 to 20)Code Description Year
2016Year 2017
Year 2018
Year 2019
Year 2020
J01CR02 Amoxicillin and Beta-Lactamase Inhibitor 4.16 4.31 4.59 4.91 3.34 -0.104 - -5.3%
J01CA04 Amoxicillin 2.95 2.34 2.33 2.45 1.74 -0.229 - -12.3%J01AA02 Doxycycline 1.69 1.54 1.58 1.77 1.63 0.012 - -0.9%J01MA12 Levofloxacin 1.29 1.26 1.39 1.30 0.99 -0.056 - -6.4%J01FA09 Clarithromycin 1.50 1.32 1.19 1.21 0.76 -0.159 <0.05 -15.6%J01FA10 Azithromycin 1.54 1.39 1.48 1.38 0.74 -0.161 - -16.8%J01DC02 Cefuroxime 1.63 1.39 1.31 1.27 0.73 -0.192 <0.05 -18.2%J01XD01/P01AB01 Metronidazole* 0.47 0.51 0.48 0.55 0.46 0.001 - -0.8%
J01CR50 Combinations of Penicillins 0.78 0.56 0.54 0.59 0.42 -0.069 - -14.2%J01MA02 Ciprofloxacin 0.74 0.63 0.62 0.59 0.40 -0.072 <0.05 -14.4%
Others 3.61 3.15 2.98 2.98 2.42 -0.257 <0.05 -9.6%Total 20.37 18.41 18.49 19.02 13.63 -1.288 - -9.6%
Note: Only p-values with statistical significance will be shownAntimicrobials supplied to veterinarians, and non-human use antimicrobials (i.e. ATC code starts with Q) were not included*Metronidazole was classified as J01XD01 if for parenteral use and P01AB01 if for oral/rectal use
• Supply of cefuroxime (J01DC02) and azithromycin (J01FA10) decreased most (-18.2% and -16.8% respectively in CAGR) from 2016 to 2020
• When examining the average annual change, supply of clarithromycin (J01FA09, average annual decrease of 0.159 DID), cefuroxime (J01DC02, average annual decrease of 0.192 DID) and ciprofloxacin (J01MA02, average annual decrease of 0.072 DID) reported average annual reduction in wholesale supply with statistical significance
34
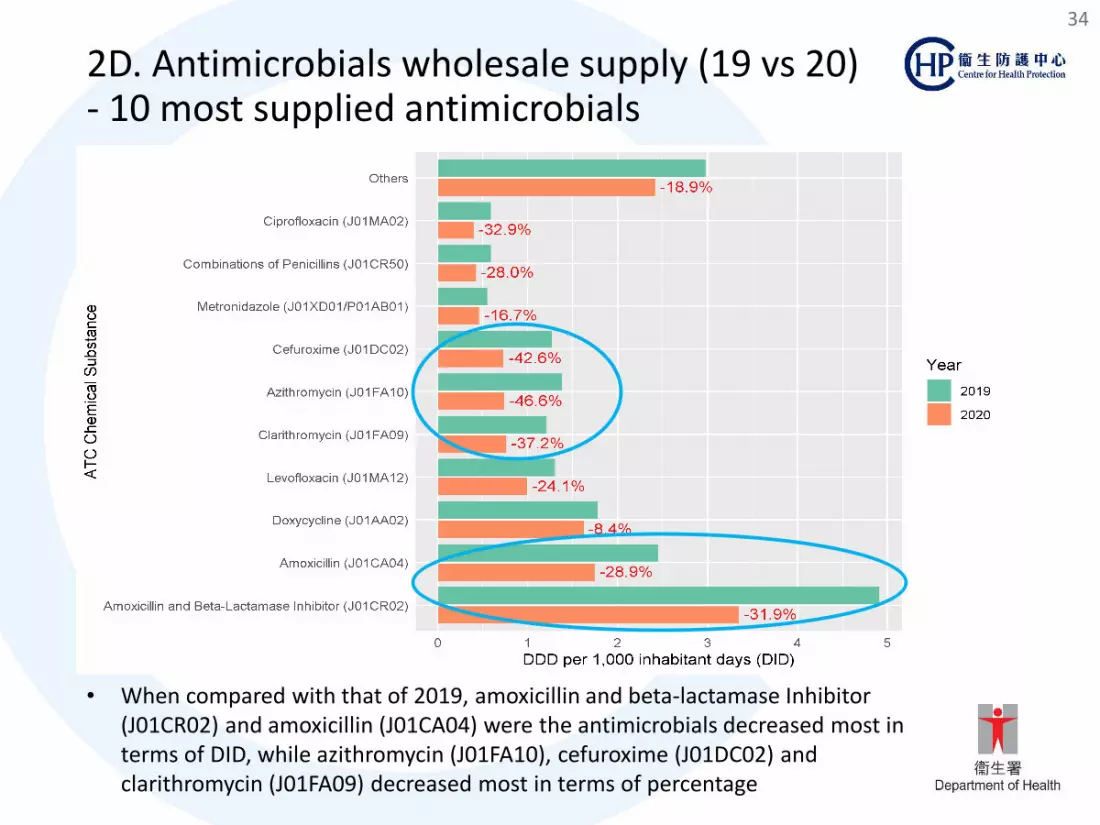
2D. Antimicrobials wholesale supply (19 vs 20) - 10 most supplied antimicrobials
• When compared with that of 2019, amoxicillin and beta-lactamase Inhibitor(J01CR02) and amoxicillin (J01CA04) were the antimicrobials decreased most in terms of DID, while azithromycin (J01FA10), cefuroxime (J01DC02) and clarithromycin (J01FA09) decreased most in terms of percentage

35
2D. Antimicrobials wholesale supply (19 vs 20) - 10 most supplied antimicrobials (Selected Sectors)

36
Results3. Wholesale supply of selected broad-spectrum antimicrobials

37
3. Wholesale supply of selected broad-spectrum antimicrobials
• In 2020, piperacillin/tazobactam was the most commonly supplied (43.5%) broad-spectrum antimicrobial, followed by meropenem (21.4%) and vancomycin (13.5%)
• Majority of these broad spectrum antimicrobials were supplied to HA and private hospitals from 2016 to 2020 (about 99%)

383. Wholesale supply of selected broad-spectrum antimicrobialsATC Chemical Substance DDD per 1,000 inhabitant days (DID)^ Average
annual change
p-value CAGR(16 to 20)
*Code Description
Beta-Lactam Antibacterials, Penicillins
Year 2016 Year 2017 Year 2018 Year 2019 Year 2020
J01CR05 Piperacillin/tazobactamOther Beta-Lactam Antibacterials
0.114 0.128 0.138 0.149 0.152 0.010 <0.01 7.4%
J01DH02 Meropenem 0.047 0.053 0.062 0.069 0.075 0.007 <0.01 12.5%J01DH03 Ertapenem 0.025 0.027 0.029 0.029 0.029 0.001 <0.05 4.5%J01DD02 Ceftazidime 0.009 0.009 0.010 0.012 0.011 0.001 - 4.6%J01DD62 Cefoperazone/sulbactam 0.011 0.009 0.010 0.009 0.008 -0.001 <0.05 -6.2%J01DE01 Cefepime 0.005 0.005 0.007 0.007 0.008 0.001 <0.05 13.2%J01DH51 Imipenem/cilastatin 0.004 0.003 0.003 0.003 0.002 -§ <0.01 -11.9%J01DI02 Ceftaroline fosamil 0.001 0.002 0.002 0.002 0.002 § - 11.1%J01DD52 Ceftazidime/avibactam - § - 0.001 0.001 § - -J01DI54 Ceftolozane/tazobactamOther Antibacterials
- § 0.001 0.001 0.001 § - -
J01XA01 Vancomycin 0.036 0.034 0.041 0.044 0.047 0.003 <0.05 7.3%J01XX08 Linezolid 0.008 0.008 0.009 0.009 0.008 § - 1.3%J01XX09 Daptomycin 0.003 0.004 0.004 0.005 0.004 § - 8.6%J01XB01 Colistin 0.002 0.002 0.002 0.002 0.002 -§ - -5.3%J01XA02 Teicoplanin § - § - - § - -Total Broad Spectrum Antibiotics
Total 0.263 0.284 0.315 0.341 0.350 0.023 <0.01 7.3%^ Antimicrobials supplied for non-human use in Hong Kong (e.g. veterinary surgeons and farmers) were not included* The CAGR for the supply of some antimicrobial is not applicable as it is a newly introduced antimicrobial which was not available in 2016- Only p-values with statistical significance will be shown § Less than 0.0005
• Total wholesale supply of selected broad-spectrum antimicrobials reported an average annual increase of 0.023 DID (or 7.3% increase in CAGR)with statistical significance
• Piperacillin/ tazobactam, meropenem and vancomycin have been the 3 most supplied selected broad-spectrum antimicrobials from 2016 to 2020. They accounted for about 78% of all selected broad-spectrum antimicrobials under monitoring in 2020

39
Remarks on interpretation of results (1)
• DDD is a technical unit of use that does not necessarily reflect the recommended or average prescribed dose
• There are no separate DDDs for children which makes the DDD estimates for paediatric formulations more difficult to interpret
• Change in DDD values in 2019 by WHO resulted in re-calculating of the past data and hence the figures in this presentation would be different from the figures presented in the past
*
* WHO ATC 2021 version was adopted for DDD calculation

40
Remarks on interpretation of results (2)• The surveillance of antimicrobials by wholesale supply in Hong
Kong is a voluntary self-reporting by licensed drug wholesalers and could have reporting errors
• Wholesale supply data is used as a proxy for the amount of antimicrobials supplied to each sector, therefore the figures are not equivalent to dispensing figures
• Wholesale supply data could be affected by marketing strategies, e.g. discount offers
• Readers are cautioned not to use the Hong Kong figures to make direct comparison with that of other countries as the health care services provision system and the methodology in collecting the surveillance data may not be the same

41
Summary (1)• The overall wholesale supply of antimicrobials decreased from 20.37
DID in 2016 to 19.02 DID 2019 • The overall wholesale supply of antimicrobials decreased drastically in
2020 to 13.63 DID during the pandemic of Covid-19 • With 61.5% of the overall antimicrobial supply under the Access
group of WHO AWaRe categorization, Hong Kong has exceeded the overall 60% benchmark under Access as recommended by WHO
• Majority of antimicrobials supplied in Hong Kong went to private doctors (49.4%), the major primary healthcare service providers, followed by Hospital Authority (29.0%) and community pharmacies (7.5%) in 2020

42
Summary (2)• During the pandemic of COVID-19 in 2020, drastic decrease was
observed when compared with that of 2019 in private doctors (↓4.13 DID, 37.7%), private hospitals (↓0.37 DID, 28.6%) and community pharmacies (↓0.41 DID, 28.4%), while the decrease in supply to HA (↓0.46 DID, 10.3%), and dentists (↓0.03 DID, 4.4%), were relatively mild
• The most drastic decrease was observed with antimicrobials such as amoxicillin and beta-lactamase Inhibitor (↓1.57 DID, 31.9%), amoxicillin (↓0.71 DID, 28.9%), azithromycin (↓0.65 DID, 46.6%), and cefuroxime (↓0.54 DID, 42.6%), clarithromycin (↓0.45 DID, 37.2%), levofloxacin (↓0.31 DID, 24.1%), doxycycline (↓0.15 DID, 8.4%), which are commonly prescribed for a range of infections including URTIs in the private community setting
• Overall wholesale supply of broad-spectrum antimicrobials showed an increase of 7.3% (compound annual growth rate) from 2016 to 2020

43
Recommendations
• As the majority of antimicrobials were supplied to private doctors (49.4%) and Hospital Authority (29.0%), strengthening the implementation of antibiotic stewardship programme in primary care and public hospitals are recommended
• Majority of the broad spectrum antimicrobials were supplied to HA or private hospitals. The continuous rising supply trend of these broad spectrum antimicrobials warrants to further enhance the promulgation of antibiotic stewardship programme at hospital setting

44
THE ENDThank you


![[Health Surveillance: Chagas disease, Health Surveillance]](https://img.dokumen.tips/doc/110x75/635408ff94e36fdd7609b2d5/health-surveillance-chagas-disease-health-surveillance.jpg)


