Embed Size (px)
Citation preview
Answer Key
Exercise Answers: Chapter 1 - Data and Tables
EXERCISE 1
1. Size may be quantitative, discrete e.g., 32”, 34”, etc or categorical, e.g., S, M, L, etc. Colour is qualitative.
2. Gender is categorical. Age is quantitative, continuous. Sport is qualitative.
3. a. Gender is categorical.
b. Breed is qualitative.
c. Weight is quantitative and continuous.
4. Height and diameter of flower and time taken are quantitative and continuous. Fertilizer used is qualitative.
5. Student’s own response but examples are:
Qualitative – metal used
Quantitative discrete – how many rings sold
Quantitative continuous – length of chain in necklace
Categorical – type of jewellery e.g., ring, necklace, bracelet etc.
6. Post code – qualitative (or categorical)
Town – qualitative
No. of bedrooms – quantitative, discrete
Parking - quantitative, discrete
Washing machine – categorical
Tumble dryer – categorical
Fire – categorical
Price - quantitative, discrete
Distance - quantitative, continuous
7. Student’s own response, but an example is:
Car Registration, Make, Model, Year, Colour
1
EXERCISE 2
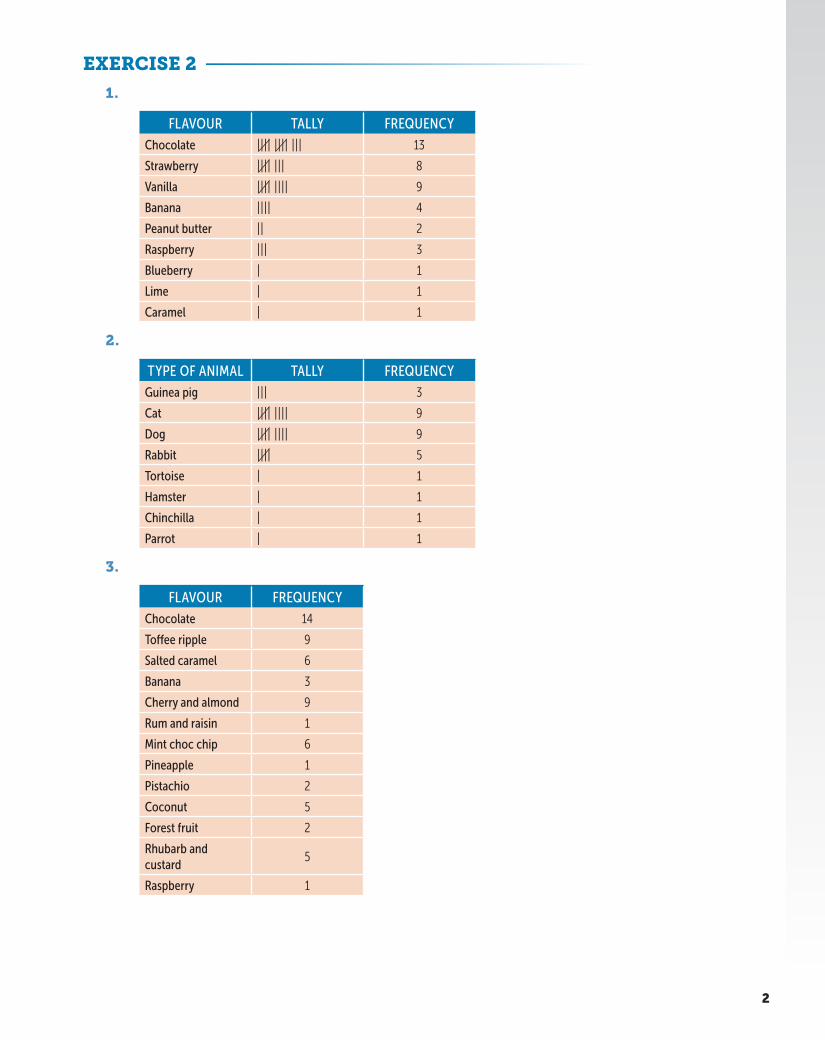
1.
FLAVOUR TALLY FREQUENCY
Chocolate |||| |||| ||| 13
Strawberry |||| ||| 8
Vanilla |||| |||| 9
Banana |||| 4
Peanut butter || 2
Raspberry ||| 3
Blueberry | 1
Lime | 1
Caramel | 1
2.
TYPE OF ANIMAL TALLY FREQUENCY
Guinea pig ||| 3
Cat |||| |||| 9
Dog |||| |||| 9
Rabbit |||| 5
Tortoise | 1
Hamster | 1
Chinchilla | 1
Parrot | 1
3.
FLAVOUR FREQUENCY
Chocolate 14
Toffee ripple 9
Salted caramel 6
Banana 3
Cherry and almond 9
Rum and raisin 1
Mint choc chip 6
Pineapple 1
Pistachio 2
Coconut 5
Forest fruit 2
Rhubarb and custard
5
Raspberry 1
2
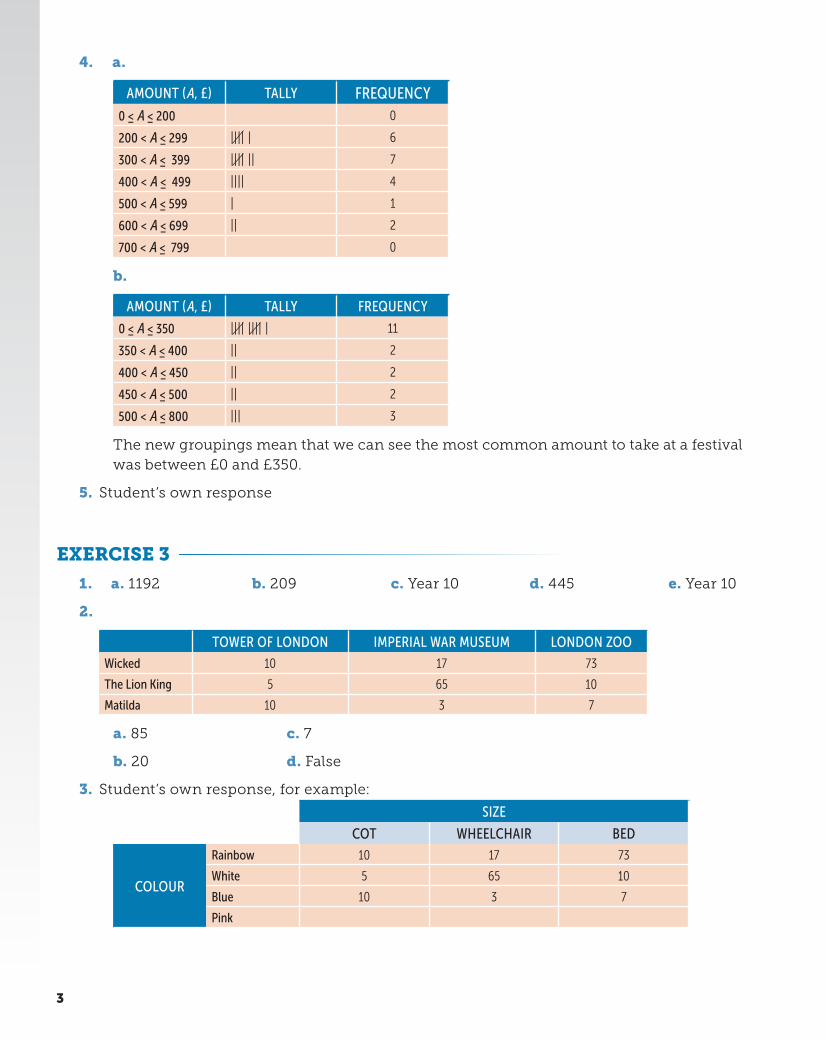
4. a.
AMOUNT (A, £) TALLY FREQUENCY0 ≤ A ≤ 200 0
200 < A ≤ 299 |||| | 6
300 < A ≤ 399 |||| || 7
400 < A ≤ 499 |||| 4
500 < A ≤ 599 | 1
600 < A ≤ 699 || 2
700 < A ≤ 799 0
b.
AMOUNT (A, £) TALLY FREQUENCY
0 ≤ A ≤ 350 |||| |||| | 11
350 < A ≤ 400 || 2
400 < A ≤ 450 || 2
450 < A ≤ 500 || 2
500 < A ≤ 800 ||| 3
The new groupings mean that we can see the most common amount to take at a festival was between £0 and £350.
5. Student’s own response
EXERCISE 3
1. a. 1192 b. 209 c. Year 10 d. 445 e. Year 10
2.
TOWER OF LONDON IMPERIAL WAR MUSEUM LONDON ZOO
Wicked 10 17 73
The Lion King 5 65 10
Matilda 10 3 7
a. 85
b. 20
c. 7
d. False
3. Student’s own response, for example:
COLOUR SIZE
COT WHEELCHAIR BED
COLOUR
Rainbow 10 17 73
White 5 65 10
Blue 10 3 7
Pink
3
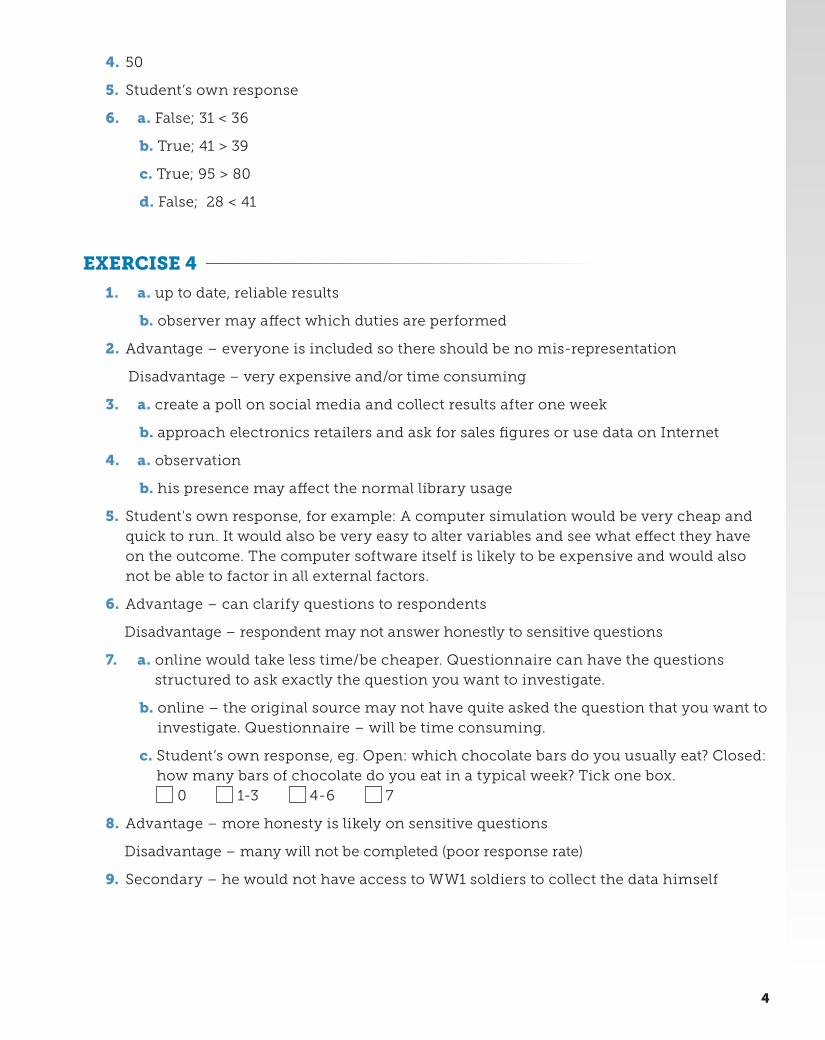
4. 50
5. Student’s own response
6. a. False; 31 < 36
b. True; 41 > 39
c. True; 95 > 80
d. False; 28 < 41
EXERCISE 4
1. a. up to date, reliable results
b. observer may affect which duties are performed
2. Advantage – everyone is included so there should be no mis-representation
Disadvantage – very expensive and/or time consuming
3. a. create a poll on social media and collect results after one week
b. approach electronics retailers and ask for sales figures or use data on Internet
4. a. observation
b. his presence may affect the normal library usage
5. Student's own response, for example: A computer simulation would be very cheap and quick to run. It would also be very easy to alter variables and see what effect they have on the outcome. The computer software itself is likely to be expensive and would also not be able to factor in all external factors.
6. Advantage – can clarify questions to respondents
Disadvantage – respondent may not answer honestly to sensitive questions
7. a. online would take less time/be cheaper. Questionnaire can have the questions structured to ask exactly the question you want to investigate.
b. online – the original source may not have quite asked the question that you want to investigate. Questionnaire – will be time consuming.
c. Student’s own response, eg. Open: which chocolate bars do you usually eat? Closed: how many bars of chocolate do you eat in a typical week? Tick one box.
0 1-3 4-6 7
8. Advantage – more honesty is likely on sensitive questions
Disadvantage – many will not be completed (poor response rate)
9. Secondary – he would not have access to WW1 soldiers to collect the data himself
4

EXERCISE 5
1. Explanatory – method of boiling; Response – time taken
2. a. Explanatory – temperature of water; Response – amount of algae
b. some fish may eat the algae or perhaps the amount of sunlight on different days
c. Keep the tank in a room where she can control the amount of sunlight
3. Student’s own response, for example:
a. Each evening, use a different coloured light bulb and count the maximum number of moths around the light bulb at any one time.
b. Explanatory variable – colour of light; Response variable – number of moths
c. One extraneous variable that may affect the experiment is temperature. A colder night may mean fewer moths are out.
4. a. yes – experiment does measure what is being studied
b. yes – there is no obvious reason why the results should not be consistent
c. Explanatory variable – amount of drug; Response variable – amount of calcium present
d. control group to see how much calcium is present if no drug is taken
5. Student’s own response, for example:
Have a group that uses the treatment and a control group that does not. Test all participants before starting to get their level of memory. Test all participants again at the end of the experiment to measure changes. Extraneous variables may include diet, exercise, living conditions, and medication the patient may be taking.
6. a. neither researcher nor participant know who has the protein shake
b. Student’s own response, for example:
Set up two groups, one to receive the protein shake and one to receive an identical looking shake. Ask someone else to determine who goes into which group and ask them to label the shakes with the participant names. Test athletic performance before shakes are consumed. Participants each consume their shake. Test athletic performance again to measure changes.
c. valid – test measures athletic performance
reliable – anyone could carry out the experiment and achieve the same results
5

Exam Practice Answers1. B
2. (a) Continuous (b) Discrete (c) Qualitative
3. Tallies 3, 10, 7, and 4 and all 4 frequencies correct. These need to be displayed as a five bar gate in each case in the tally column.
4. (a) (Median for Judge B =) 7or (Mean for Judge A =) 6.25 or (Total for Judge A =) 50 and (Total for Judge B =) 54
(b) The judges awarded different scores to the same dancer(s) or any reference to averages or totals being different or judges gave different rankings.
5. (a) (i) E
(a) (ii) B
(a) (iii) A or C
(a) (iv) A or C
(b) Discrete
Exercise Answers: Chapter 2 - Sampling
EXERCISE 1
1. Unlikely to be a fair sample as there’s no guarantee to get a side selection of different people. If they are all from Tara’s Facebook page, they are likely to be her friends and therefore to say nice things.
2. a. systematic sampling
b. Unlikely to give representative views of the town as only people currently using the nightclub were asked.
c. ask a random sample of townspeople
6
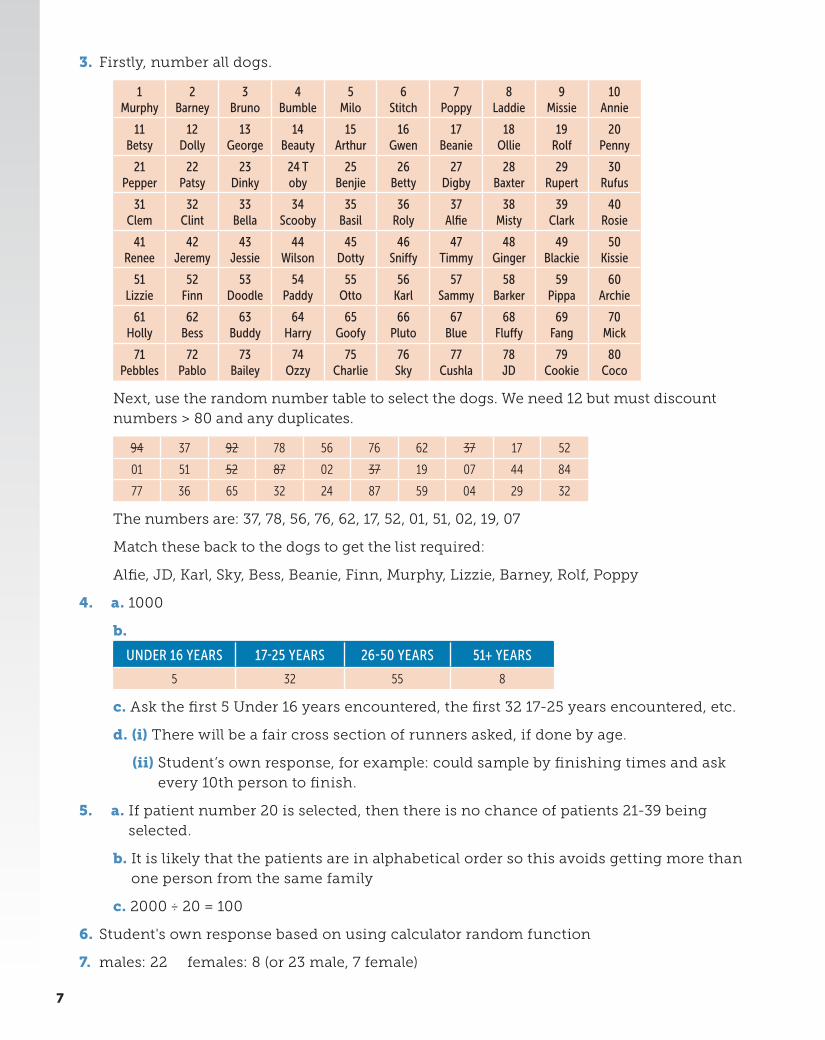
3. Firstly, number all dogs.
1 Murphy
2 Barney
3 Bruno
4 Bumble
5 Milo
6 Stitch
7 Poppy
8 Laddie
9 Missie
10 Annie
11 Betsy
12 Dolly
13 George
14 Beauty
15 Arthur
16 Gwen
17 Beanie
18 Ollie
19 Rolf
20 Penny
21 Pepper
22 Patsy
23 Dinky
24 T oby
25 Benjie
26 Betty
27 Digby
28 Baxter
29 Rupert
30 Rufus
31 Clem
32 Clint
33 Bella
34 Scooby
35 Basil
36 Roly
37 Alfie
38 Misty
39 Clark
40 Rosie
41 Renee
42 Jeremy
43 Jessie
44 Wilson
45 Dotty
46 Sniffy
47 Timmy
48 Ginger
49 Blackie
50 Kissie
51 Lizzie
52 Finn
53 Doodle
54 Paddy
55 Otto
56 Karl
57 Sammy
58 Barker
59 Pippa
60 Archie
61 Holly
62 Bess
63 Buddy
64 Harry
65 Goofy
66 Pluto
67 Blue
68 Fluffy
69 Fang
70 Mick
71 Pebbles
72 Pablo
73 Bailey
74 Ozzy
75 Charlie
76 Sky
77 Cushla
78 JD
79 Cookie
80 Coco
Next, use the random number table to select the dogs. We need 12 but must discount numbers > 80 and any duplicates.
94 37 92 78 56 76 62 37 17 52
01 51 52 87 02 37 19 07 44 84
77 36 65 32 24 87 59 04 29 32
The numbers are: 37, 78, 56, 76, 62, 17, 52, 01, 51, 02, 19, 07
Match these back to the dogs to get the list required:
Alfie, JD, Karl, Sky, Bess, Beanie, Finn, Murphy, Lizzie, Barney, Rolf, Poppy
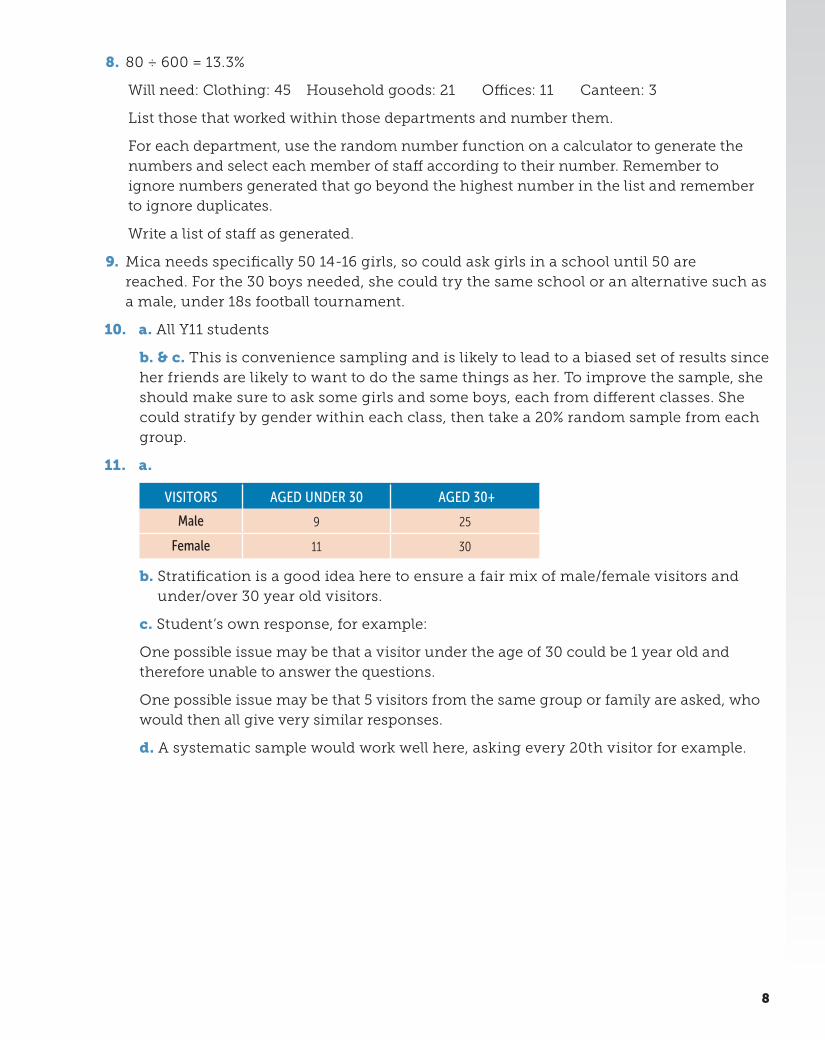
4. a. 1000
b.
UNDER 16 YEARS 17-25 YEARS 26-50 YEARS 51+ YEARS
5 32 55 8
c. Ask the first 5 Under 16 years encountered, the first 32 17-25 years encountered, etc.
d. (i) There will be a fair cross section of runners asked, if done by age.
(ii) Student’s own response, for example: could sample by finishing times and ask every 10th person to finish.
5. a. If patient number 20 is selected, then there is no chance of patients 21-39 being selected.
b. It is likely that the patients are in alphabetical order so this avoids getting more than one person from the same family
c. 2000 ÷ 20 = 100
6. Student's own response based on using calculator random function
7. males: 22 females: 8 (or 23 male, 7 female)
7
8. 80 ÷ 600 = 13.3%
Will need: Clothing: 45 Household goods: 21 Offices: 11 Canteen: 3
List those that worked within those departments and number them.
For each department, use the random number function on a calculator to generate the numbers and select each member of staff according to their number. Remember to ignore numbers generated that go beyond the highest number in the list and remember to ignore duplicates.
Write a list of staff as generated.
9. Mica needs specifically 50 14-16 girls, so could ask girls in a school until 50 are reached. For the 30 boys needed, she could try the same school or an alternative such as a male, under 18s football tournament.
10. a. All Y11 students
b. & c. This is convenience sampling and is likely to lead to a biased set of results since her friends are likely to want to do the same things as her. To improve the sample, she should make sure to ask some girls and some boys, each from different classes. She could stratify by gender within each class, then take a 20% random sample from each group.
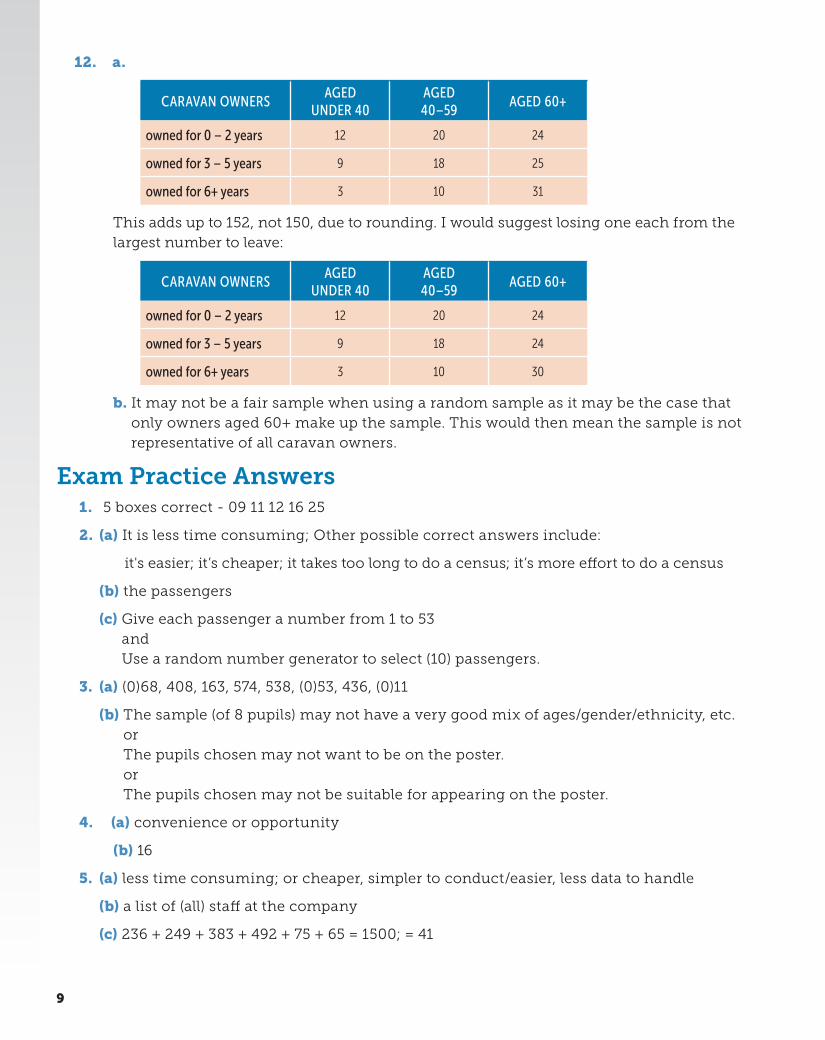
11. a.
VISITORS AGED UNDER 30 AGED 30+
Male 9 25
Female 11 30
b. Stratification is a good idea here to ensure a fair mix of male/female visitors and under/over 30 year old visitors.
c. Student’s own response, for example:
One possible issue may be that a visitor under the age of 30 could be 1 year old and therefore unable to answer the questions.
One possible issue may be that 5 visitors from the same group or family are asked, who would then all give very similar responses.
d. A systematic sample would work well here, asking every 20th visitor for example.
8
12. a.
CARAVAN OWNERSAGED
UNDER 40AGED 40–59
AGED 60+
owned for 0 – 2 years 12 20 24
owned for 3 – 5 years 9 18 25
owned for 6+ years 3 10 31
This adds up to 152, not 150, due to rounding. I would suggest losing one each from the largest number to leave:
CARAVAN OWNERSAGED
UNDER 40AGED 40–59
AGED 60+
owned for 0 – 2 years 12 20 24
owned for 3 – 5 years 9 18 24
owned for 6+ years 3 10 30
b. It may not be a fair sample when using a random sample as it may be the case that only owners aged 60+ make up the sample. This would then mean the sample is not representative of all caravan owners.
Exam Practice Answers1. 5 boxes correct - 09 11 12 16 25
2. (a) It is less time consuming; Other possible correct answers include:
it's easier; it’s cheaper; it takes too long to do a census; it’s more effort to do a census
(b) the passengers
(c) Give each passenger a number from 1 to 53 and Use a random number generator to select (10) passengers.
3. (a) (0)68, 408, 163, 574, 538, (0)53, 436, (0)11
(b) The sample (of 8 pupils) may not have a very good mix of ages/gender/ethnicity, etc. or The pupils chosen may not want to be on the poster. or The pupils chosen may not be suitable for appearing on the poster.
4. (a) convenience or opportunity
(b) 16
5. (a) less time consuming; or cheaper, simpler to conduct/easier, less data to handle
(b) a list of (all) staff at the company
(c) 236 + 249 + 383 + 492 + 75 + 65 = 1500; = 41
9

6. (a) 29, 44, 56, 38, 07
(b) 4 boys and 2 girls
7. (a) 27 or 28
(b) Assign a number to each of the 6th Form students from 1 to 381, noting names against numbers. Use the random number function on a calculator (or random number tables or random number generator online) to generate 25 numbers, discarding any repeats or any above 381. Match the 25 numbers back to the names from the original list to find the random sample.
8. (a) Parents of children at one primary school are not representative of all adults in the 3 villages - Other correct answers could be: only getting views of parents at one school; only asking the views of people who are parents; it is not representative
(b) Obtain the electoral roll for the villages. or Obtain a list of all adults in the villages. or Choose a random start point between the 1st and 40th adult. or Choose every 40th adult.
(c) 1875 ____ 8000
× 200 or 46.(875) or 47
(d). The figure of 53% is subject to sample variability. or Only a small proportion of the adults were sampled.
10

Exercise Answers: Chapter 3 - Charts and Diagrams 1
EXERCISE 1
1. a. 10
b. 3
c. 3
d. weeks 2 and 5
e.
NUMBER OF TRACKS DOWNLOADED
Week 1
Week 2
Week 3
Week 4
Week 5
Week 6
2.
GENRE NUMBER OF BOOKS BORROWED
Romance
Sci-fi
Horror
Non-fiction
Crime
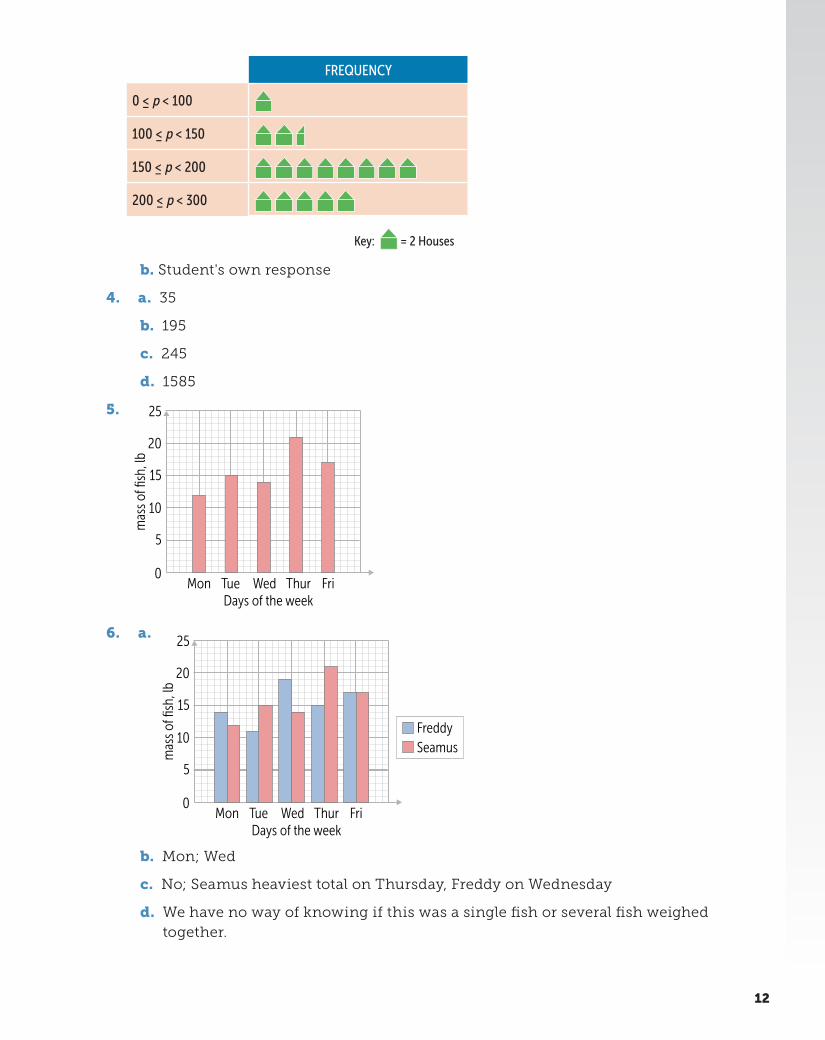
3. a.
PRICE, P (£1000) TALLY FREQUENCY
0 ≤ p < 100 | 1
100 ≤ p < 150 |||| 5
150 ≤ p < 200 |||| ||| 8
200 ≤ p < 300 |||| 5
300+ | 1
11
FREQUENCY
0 ≤ p < 100
100 ≤ p < 150
150 ≤ p < 200
200 ≤ p < 300
Key: = 2 Houses
b. Student's own response
4. a. 35
b. 195
c. 245
d. 1585
5.
mas
s of fi
sh, l
b
Days of the week
5
0Mon Tue FriWed Thur
10
15
20
25
6. a.
mas
s of fi
sh, l
b
Days of the week
5
0Mon Tue FriWed Thur
10
15
20
25
FreddySeamus
b. Mon; Wed
c. No; Seamus heaviest total on Thursday, Freddy on Wednesday
d. We have no way of knowing if this was a single fish or several fish weighed together.
12

7.
num
ber o
f she
ep
20
0Field 1 Field 2 Field 5Field 3 Field 4
40
60
80
100
120
140
160
180
Hour 1Hour 2Hour 3
8. a. 45
b. 50
c. 90
d.
num
ber o
f pup
ils
10
0Y7 Y8 Y9
20
30
40
50
60
70
80
BoysGirls
e. pe
rcen
tage
10
0Y7 Y8 Y9
20
30
40
50
60
70
80
90
100
BoysGirls
9. We do not know exact numbers borrowed, only percentages. If Staplehurst had 100 books borrowed in total, and Wadhurst had 1000, then Wadhurst would have had more fiction books borrowed.
13
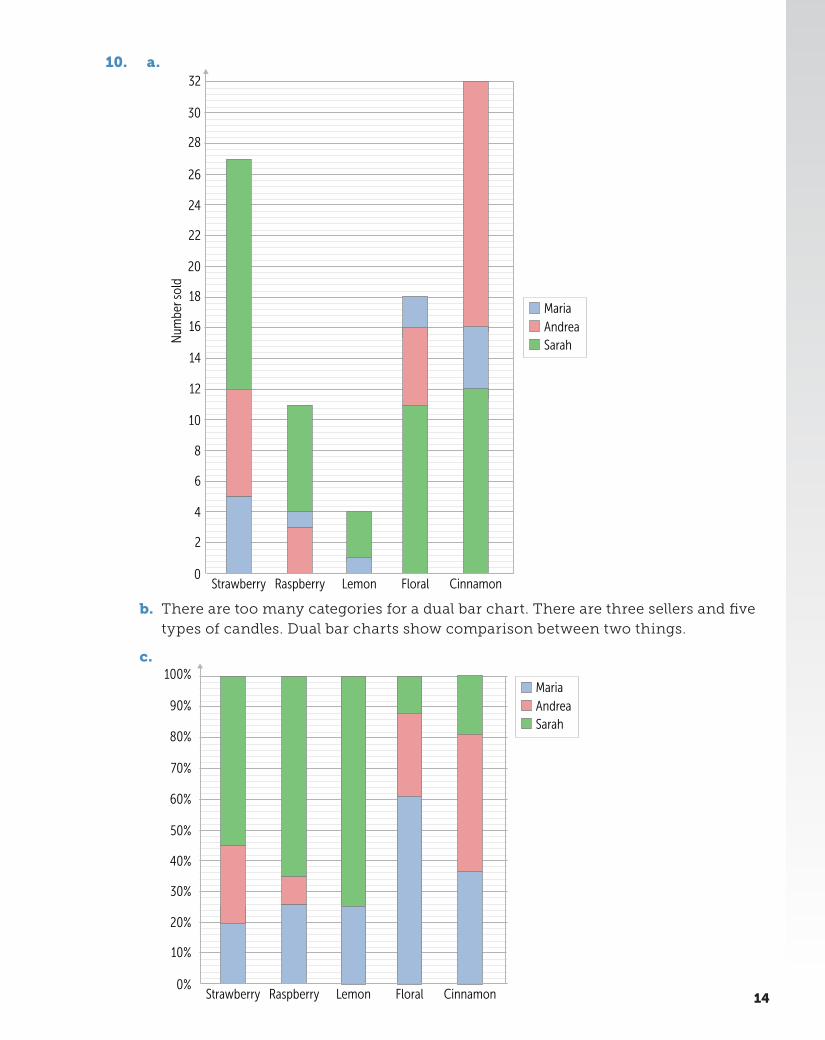
10. a.
Num
ber s
old
2
0Strawberry Raspberry Lemon Floral Cinnamon
4
6
8
10
12
14
16
18
20
22
24
26
28
30
32
MariaAndreaSarah
b. There are too many categories for a dual bar chart. There are three sellers and five types of candles. Dual bar charts show comparison between two things.
c.
10%
0%Strawberry Raspberry Lemon Floral Cinnamon
20%
30%
40%
50%
60%
70%
80%
90%
100%MariaAndreaSarah
14
11. The bar chart does not start at zero, so although the height for cats is double the height for dogs; cats = 24 and dogs = 22; 2 × 22 ≠ 24.
EXERCISE 2
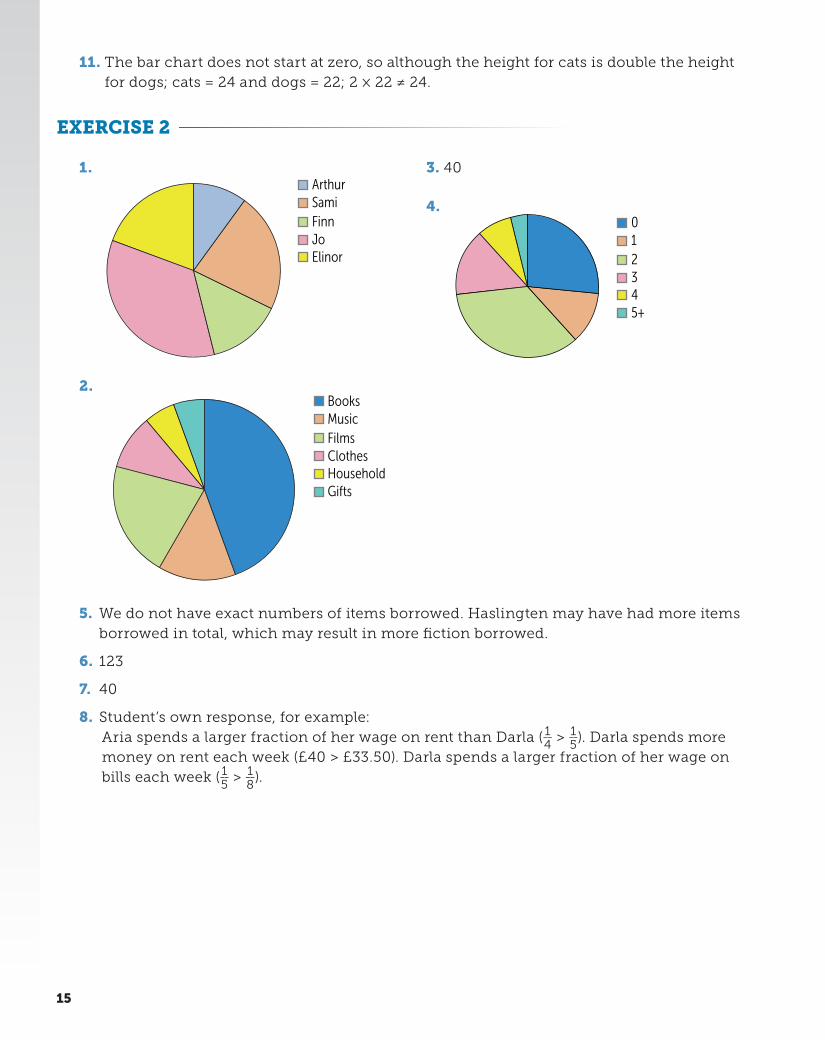
1. ArthurSamiFinnJoElinor
2. BooksMusicFilmsClothesHouseholdGifts
3. 40
4. 012345+
5. We do not have exact numbers of items borrowed. Haslingten may have had more items borrowed in total, which may result in more fiction borrowed.
6. 123
7. 40
8. Student’s own response, for example:Aria spends a larger fraction of her wage on rent than Darla ( 1 __ 4 > 1 __ 5 ). Darla spends more money on rent each week (£40 > £33.50). Darla spends a larger fraction of her wage on bills each week ( 1 __ 5 > 1 __
8 ).
15
EXERCISE 3
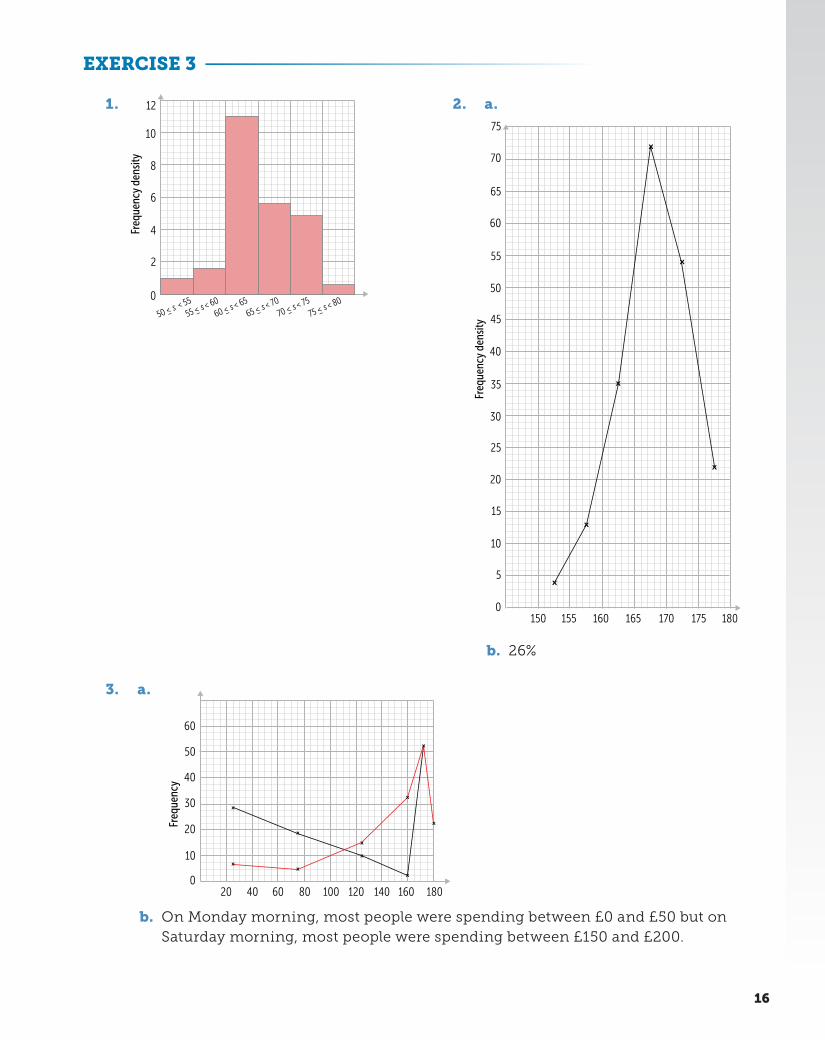
1.
Freq
uenc
y de
nsity
2
0
50 ≤ s < 55
55 ≤ s < 6060 ≤ s < 65
65 ≤ s < 7070 ≤ s < 75
75 ≤ s < 80
4
6
8
10
12 2. a.
Freq
uenc
y de
nsity
5
0150 155 160 165 170 175 180
10
15
20
25
30
35
40
45
50
55
60
65
70
75
b. 26%
3. a.
Freq
uenc
y
10
020 40 60 80 100 120 140 160 180
20
30
40
50
60
b. On Monday morning, most people were spending between £0 and £50 but on Saturday morning, most people were spending between £150 and £200.
16
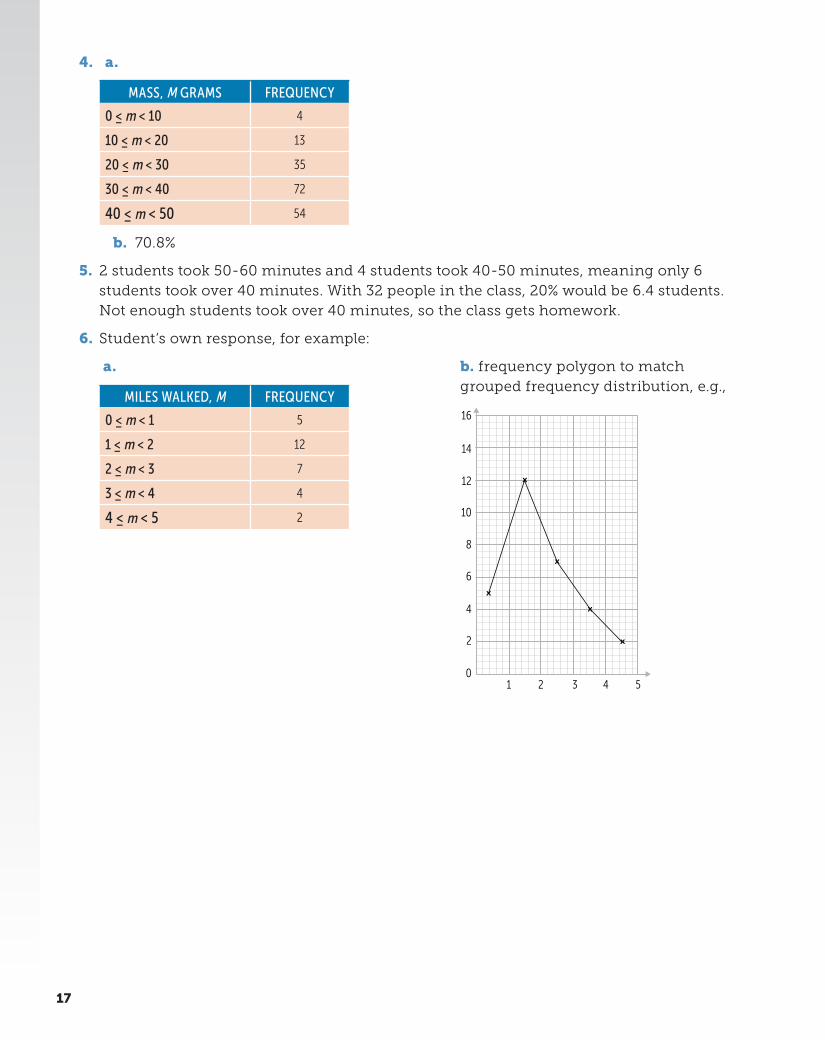
4. a.
MASS, M GRAMS FREQUENCY
0 ≤ m < 10 4
10 ≤ m < 20 13
20 ≤ m < 30 35
30 ≤ m < 40 72
40 ≤ m < 50 54
b. 70.8%
5. 2 students took 50-60 minutes and 4 students took 40-50 minutes, meaning only 6 students took over 40 minutes. With 32 people in the class, 20% would be 6.4 students. Not enough students took over 40 minutes, so the class gets homework.
6. Student’s own response, for example:
a.
MILES WALKED, M FREQUENCY
0 ≤ m < 1 5
1 ≤ m < 2 12
2 ≤ m < 3 7
3 ≤ m < 4 4
4 ≤ m < 5 2
b. frequency polygon to match grouped frequency distribution, e.g.,
2
01 2 3 4 5
4
6
8
10
12
14
16
17

Exam Practice Answers1.
Perc
enta
ge
Age group
20
05 - 7 8 - 13
40
60
80
100
Perc
enta
ge
Age group
20
05 - 7 8 - 13
40
60
80
100
2. (a) 7
(b) 1 __ 4
(c) bars of height 6 and 11, in any order; all bars of equal width and gaps of equal width, and correctly labelled
(d) (vertical) scale should start at 0; bars of unequal width (for Tim); label (for Rob) missing
3. 1 angle correct
or 1 sector drawn within tolerance; fully labelled and correct; Correct angles are 135º for green, 45º for red, and 180º for black
4. fully correct or ft their table (must include at least one half circle)
5. (a) 50
(b) 45 ___ 360
or 0.125 or 180(o) = 60 (students) or 90(o) = 30 (students) or 135(o) = 45 (students) or 3(o) = 1 (student)
(c) The angle is three times as big
or 3 × 45 = 135 or 135 ÷ 45 = 3
(d) height 45 for walk and height 10 for cycle; height 30 for car or height 35 for bus; height 30 for car and height 35 for bus and bars of equal width and gaps between the bars of equal width
18
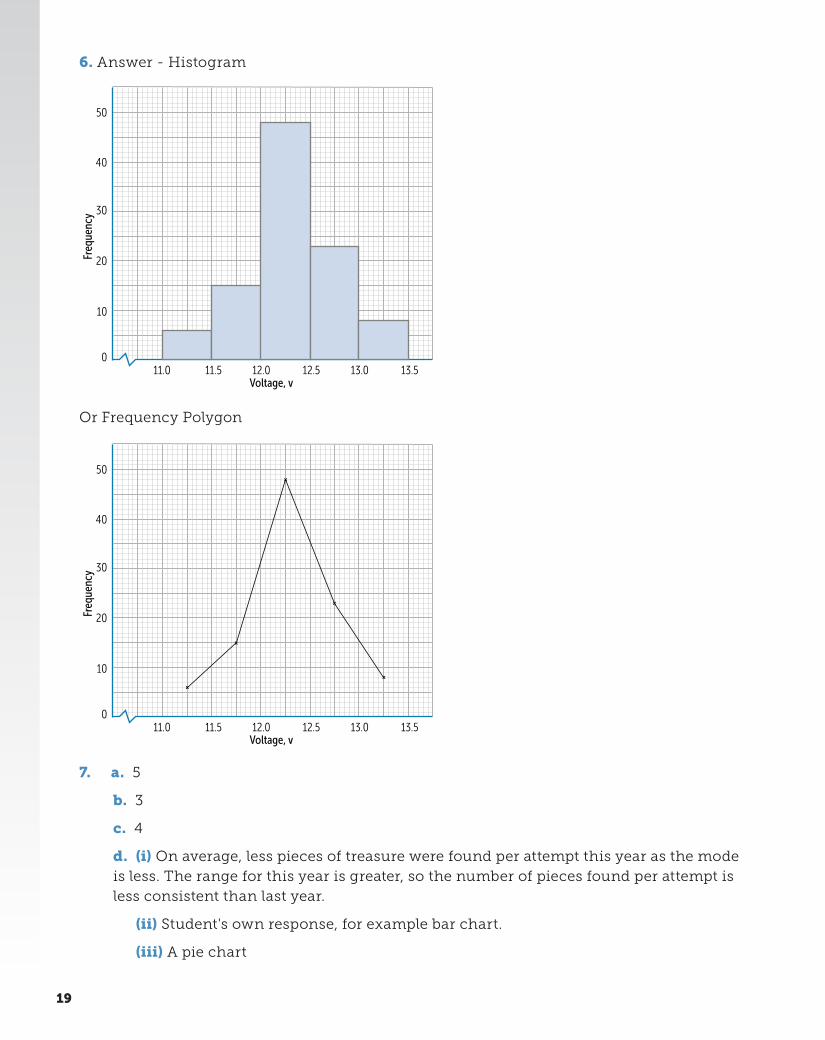
6. Answer - Histogram
Freq
uenc
y
Voltage, v
10
011.0 11.5 12.0 12.5 13.0 13.5
20
30
40
50
Or Frequency Polygon
Freq
uenc
y
Voltage, v
10
011.0 11.5 12.0 12.5 13.0 13.5
20
30
40
50
7. a. 5
b. 3
c. 4
d. (i) On average, less pieces of treasure were found per attempt this year as the mode is less. The range for this year is greater, so the number of pieces found per attempt is less consistent than last year.
(ii) Student's own response, for example bar chart.
(iii) A pie chart
19
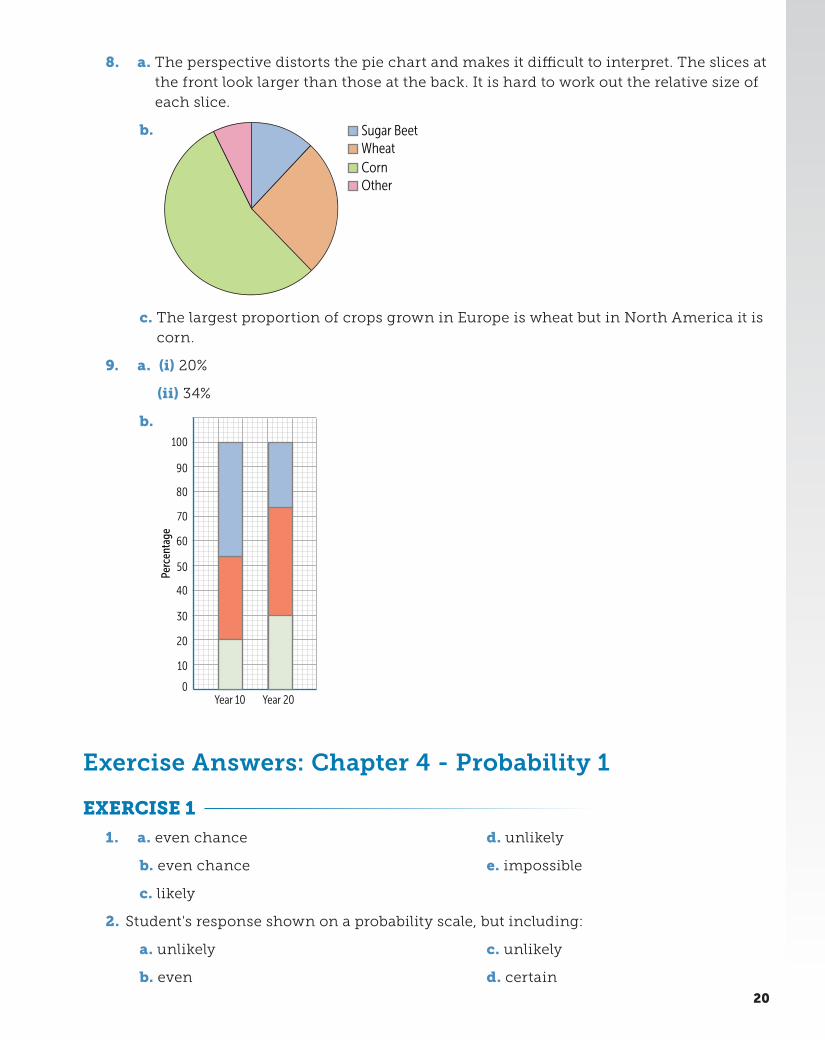
8. a. The perspective distorts the pie chart and makes it difficult to interpret. The slices at the front look larger than those at the back. It is hard to work out the relative size of each slice.
b. Sugar BeetWheatCornOther
c. The largest proportion of crops grown in Europe is wheat but in North America it is corn.
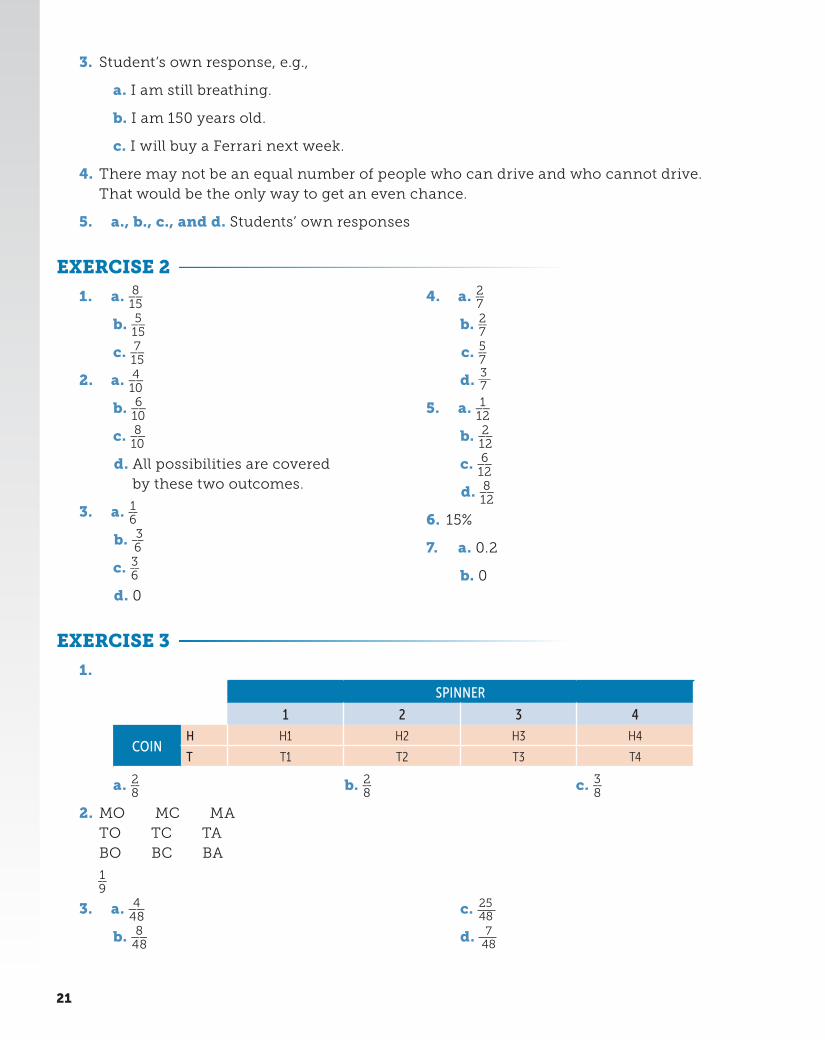
9. a. (i) 20%
(ii) 34%
b.
Perc
enta
ge
20
30
50
10
0Year 10 Year 20
40
60
70
80
90
100
Exercise Answers: Chapter 4 - Probability 1
EXERCISE 1
1. a. even chance
b. even chance
c. likely
d. unlikely
e. impossible
2. Student's response shown on a probability scale, but including:
a. unlikely
b. even
c. unlikely
d. certain
20
3. Student’s own response, e.g.,
a. I am still breathing.
b. I am 150 years old.
c. I will buy a Ferrari next week.
4. There may not be an equal number of people who can drive and who cannot drive. That would be the only way to get an even chance.
5. a., b., c., and d. Students’ own responses
EXERCISE 2
1. a. 8 __ 15
b. 5 __ 15
c. 7 __ 15
2. a. 4 __ 10
b. 6 __ 10
c. 8 __ 10
d. All possibilities are covered by these two outcomes.
3. a. 1 __ 6
b. 3 __ 6
c. 3 __ 6
d. 0
4. a. 2 __ 7
b. 2 __ 7
c. 5 __ 7
d. 37
5. a. 1 __ 12
b. 2 __ 12
c. 6 __ 12
d. 8 __ 12
6. 15%
7. a. 0.2
b. 0
EXERCISE 3
1.
COLOUR SPINNER
1 2 3 4
COINH H1 H2 H3 H4
T T1 T2 T3 T4
a. 2 __ 8
b. 2 __ 8
c. 3 __ 8
2. MO MC MA TO TC TA BO BC BA
1 __ 9
3. a. 4 __ 48
b. 8 __ 48
c. 2548
d. 748
21
4. a. She may watch other shows, too.
b. They are mutually exclusive, so 0.4 + 0.3 = 0.7.
5. a. 2 __ 6
b. 4 __ 6
c. 3 __ 6
d. 0
e. 4 __ 6
EXERCISE 4
1. a. 1 __ 25
b. 1 __ 25
c. 425
2. a. 9 ___ 160
b. 40 ___ 160
c. 15 ___ 160
3. a. 1 __ 36
b. 9 __ 36
c. 9 __ 36
d. 2 __ 36
4. a. 3 __ 42
b. 3 __ 42
c. 4 __ 42
5. 1 __ 8
EXERCISE 5
1. a. 0.91
b. 0.49
c. 0.09
2. a. 3064
b. 2564
c. 1564
d. 5564
3. a. 0.566
b. 0.252
c. 0.182
4. a. 4 __ 30
b. 4 __ 9
c. 0
5. a. 0.1
b. 1 __ 6
c. 1 ___ 40
6. a. 0.0225
b. 0.255
c. 0.2775
Exam Practice Answers1. unlikely; evens; certain; impossible; likely
2. (a) car
(b) 0
(c) 0.12 + 0.25 = 0.37
22
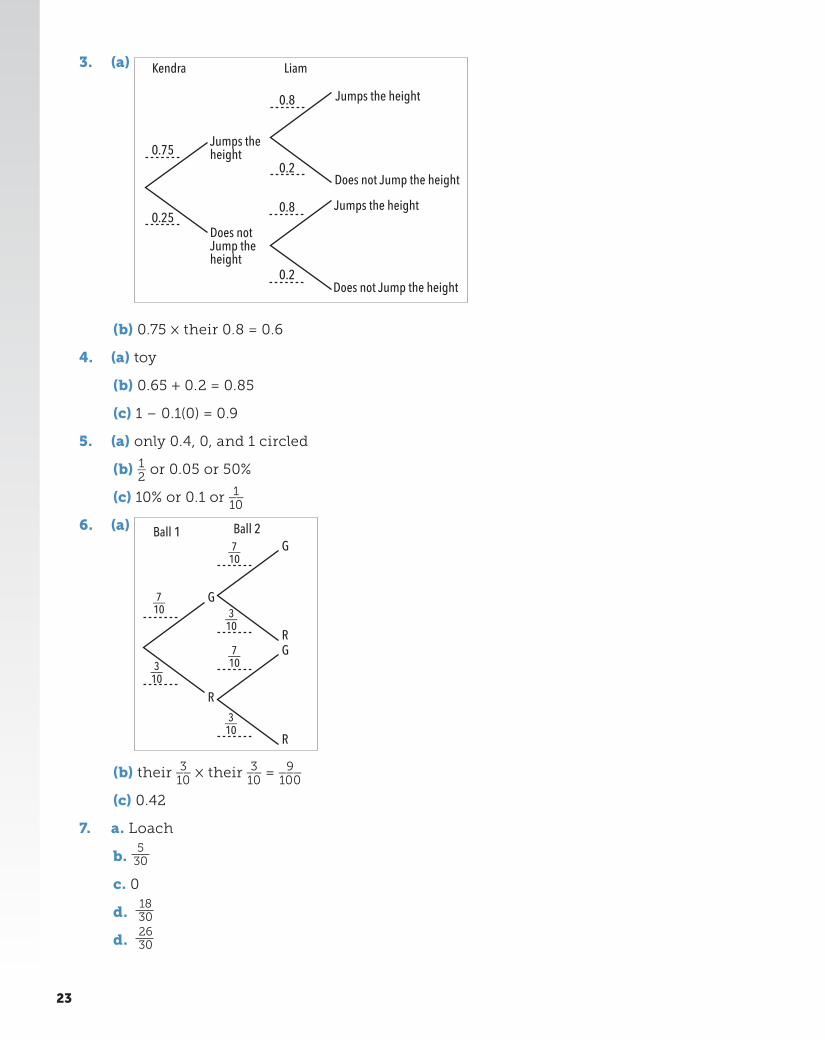
3. (a)
Jumps theheight
Jumps the height
Jumps the height
Does not Jump theheight
Does not Jump the height
Does not Jump the height
0.75
0.8
0.8
0.2
0.2
0.25
Kendra Liam
(b) 0.75 × their 0.8 = 0.6
4. (a) toy
(b) 0.65 + 0.2 = 0.85
(c) 1 – 0.1(0) = 0.9
5. (a) only 0.4, 0, and 1 circled
(b) 1 __ 2
or 0.05 or 50%
(c) 10% or 0.1 or 1 __ 10
6. (a)
G
G
G
R
R
R
7 __ 10
7 __ 10
7 __ 10
Ball 1 Ball 2
3 __ 10
3 __ 10
3 __ 10
(b) their 3 __ 10
× their 3 __ 10
= 9 ___ 100
(c) 0.42
7. a. Loach
b. 5
30
c. 0
d. 1830
d. 2630
23
Exercise Answers: Chapter 5 - Averages 1
EXERCISE 1
1. a. mode = 2, median = 4, mean = 4.67, range = 8
b. mode = 1, median = 6, mean = 5.4, range = 9
c. mode = 22 and 24, median = 23, mean = 23.56, range = 7
2. a. 14
b. 12
c. 11.6
3. green
4. 6 km
5. On average, Tilly drives further each day than Tessa.
6. Student’s own response, e.g., 1 2 3 6 6
7. Student’s own response, e.g., 1 1 2 4 6 7 9 9
8. Any value ≥ 71
9. a. £26.22
b. £26
10. 79.2 kg
11. Student’s own response, e.g., 3 4 6 6 8 9
12. Student’s own response, e.g., 1 1 3 5 20
13. £15 300
EXERCISE 2
1. a. £20.61
b. £14.21
2. average meal costs £8.83, so invite up to 113 guests
3. a. 10 < C ≤ 15
b. 10 < C < 15
c. £12.09
4. a. 3 500 < m ≤ 4 000
b. 3 215 g
c. 8 000 < m ≤ 12 000
d. 3 579 g
24
5. estimate of mean = 58.9 s
estimate of median = 57.95 s
mode = 56 s
The mean is the worst time, so quote either the median, or, even better, the mode.
6. On average, it takes fewer lessons to pass using Vroom.
7. 15.5
8. estimate of mean = £10 666.67
estimate of median = £10 000
mode = £16 000
The median is the lowest, so quote this.
EXERCISE 3
1. a. 24 24.25 24.5 24.5 24.5 24.75 25.25 26 26.75 28
b. 126.5 131.75 132 137 145
c. 2.325 2.275 2.9 2.975 2.95 3.4 3.45 4.025
d. 135.25 146.75 151.25 152.5 157.25 173.5 183.75 190 201
2. 455.5 502.75 536 574.5 542 506.25 450.5 364.5 267
There is an upwards trend for the first part of the year and then a significant downwards trend.
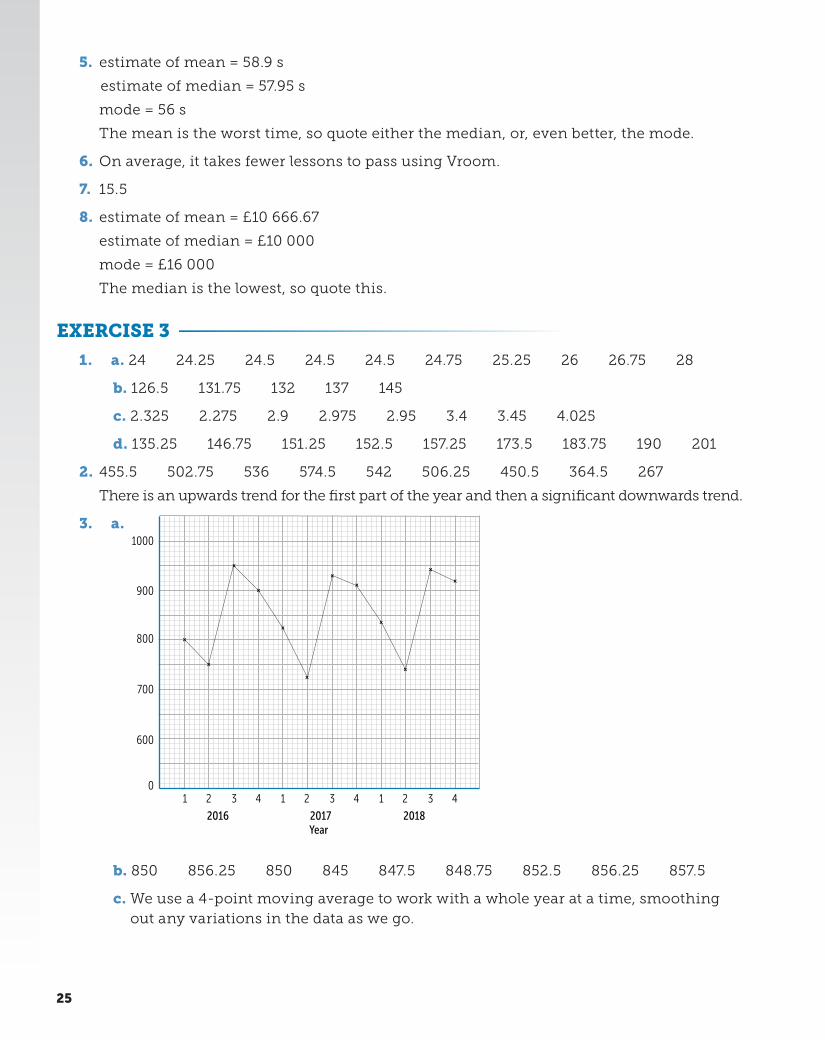
3. a.
Year
600
01 2 3 4
2016
1 2 3 4
2017
1 2 3 4
2018
700
800
900
1000
b. 850 856.25 850 845 847.5 848.75 852.5 856.25 857.5
c. We use a 4-point moving average to work with a whole year at a time, smoothing out any variations in the data as we go.
25
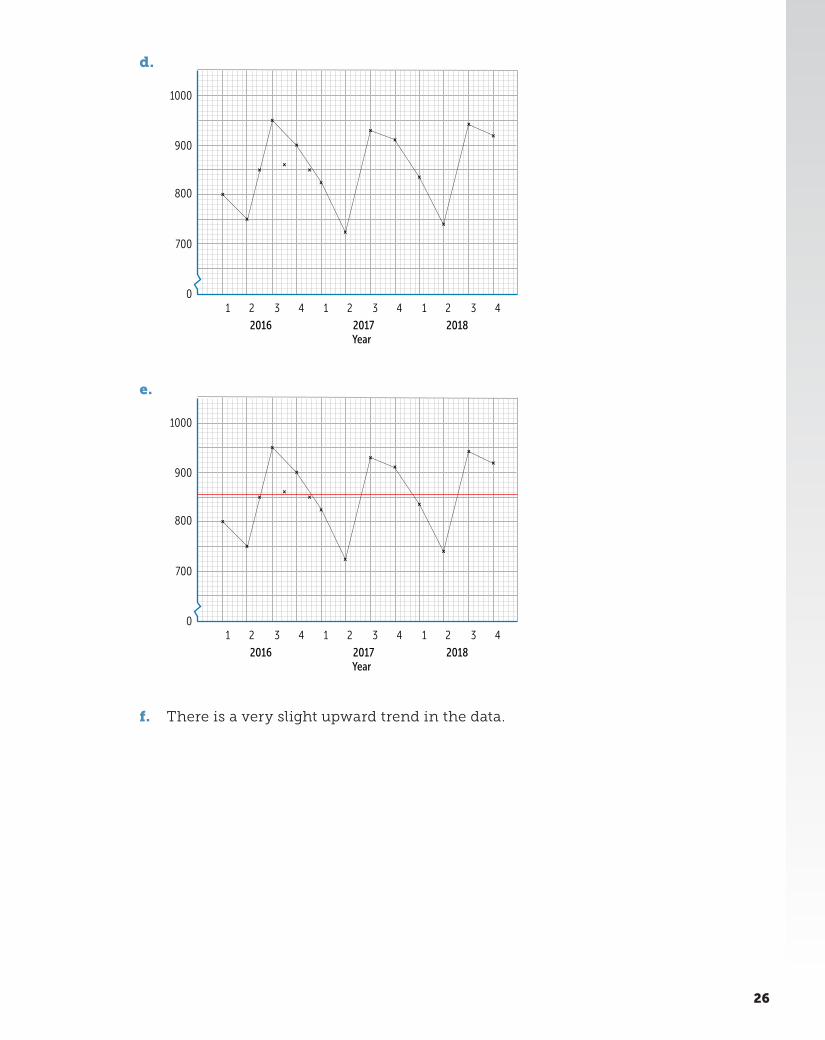
d.
Year
1 2 3 4
2016
1 2 3 4
2017
1 2 3 4
2018
700
0
800
900
1000
e.
Year
1 2 3 4
2016
1 2 3 4
2017
1 2 3 4
2018
700
0
800
900
1000
f. There is a very slight upward trend in the data.
26

4. a.
Year
Num
ber o
f Stu
dent
s
2009 2010 2011 2012 2013 2014 2015 2016 2017 2018
5700
5650
5500
5550
5600
5400
5450
5300
5350
5200
5250
5100
5150
5000
5050
4900
4950
4850
4800
b. 4979 5070 5203.25 5382.25 5458 5492.5
27
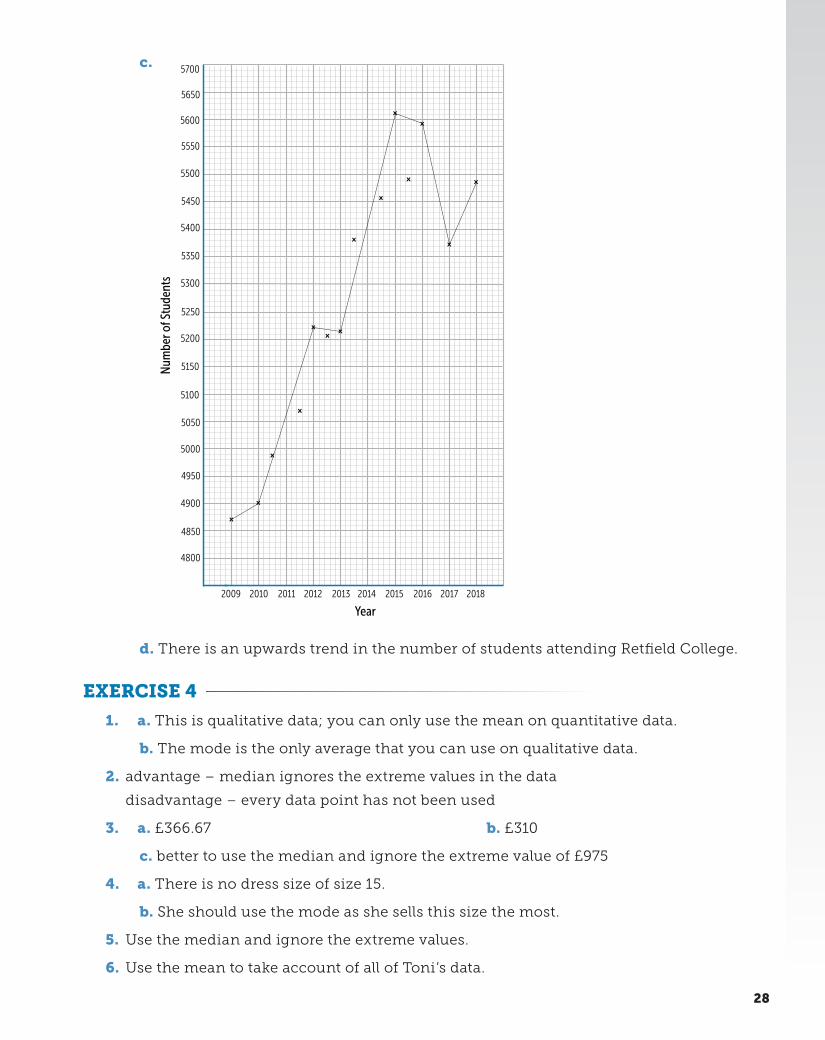
c.
Year
Num
ber o
f Stu
dent
s
2009 2010 2011 2012 2013 2014 2015 2016 2017 2018
5700
5650
5500
5550
5600
5400
5450
5300
5350
5200
5250
5100
5150
5000
5050
4900
4950
4850
4800
d. There is an upwards trend in the number of students attending Retfield College.
EXERCISE 4
1. a. This is qualitative data; you can only use the mean on quantitative data.
b. The mode is the only average that you can use on qualitative data.
2. advantage – median ignores the extreme values in the data
disadvantage – every data point has not been used
3. a. £366.67 b. £310
c. better to use the median and ignore the extreme value of £975
4. a. There is no dress size of size 15.
b. She should use the mode as she sells this size the most.
5. Use the median and ignore the extreme values.
6. Use the mean to take account of all of Toni’s data.
28
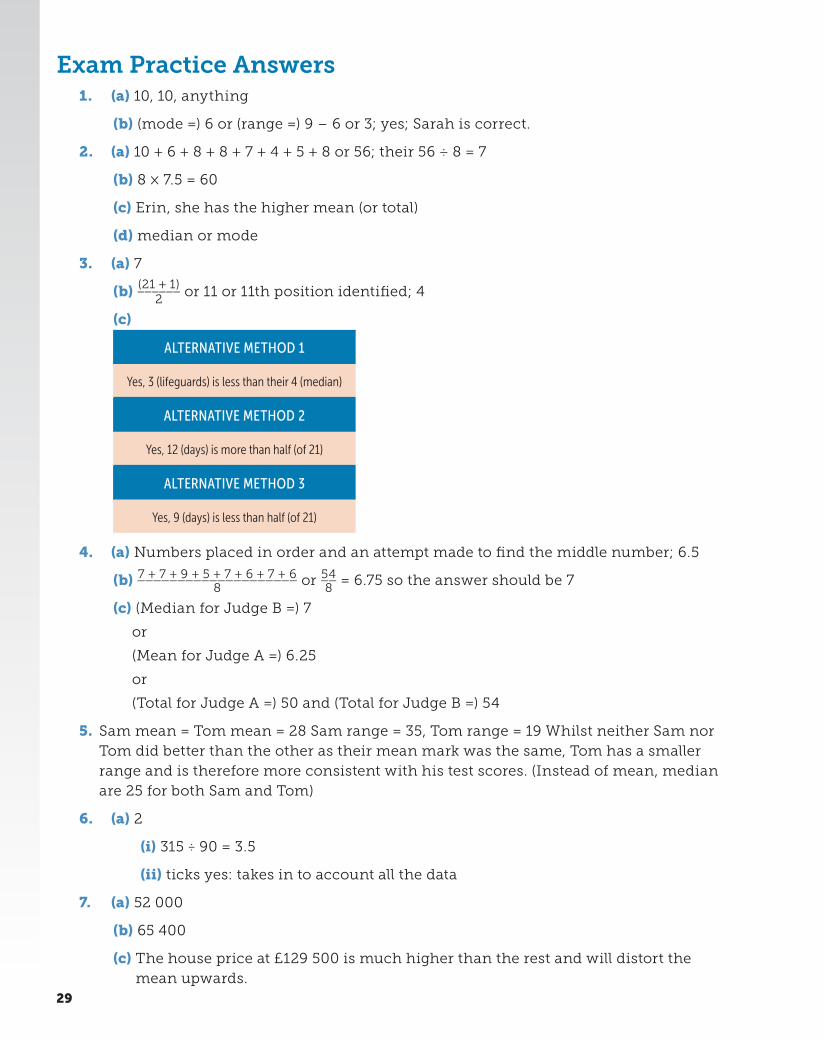
Exam Practice Answers1. (a) 10, 10, anything
(b) (mode =) 6 or (range =) 9 – 6 or 3; yes; Sarah is correct.
2. (a) 10 + 6 + 8 + 8 + 7 + 4 + 5 + 8 or 56; their 56 ÷ 8 = 7
(b) 8 × 7.5 = 60
(c) Erin, she has the higher mean (or total)
(d) median or mode
3. (a) 7
(b) (21 + 1) ______
2 or 11 or 11th position identified; 4
(c)
ALTERNATIVE METHOD 1
Yes, 3 (lifeguards) is less than their 4 (median)
ALTERNATIVE METHOD 2
Yes, 12 (days) is more than half (of 21)
ALTERNATIVE METHOD 3
Yes, 9 (days) is less than half (of 21)
4. (a) Numbers placed in order and an attempt made to find the middle number; 6.5
(b) 7 + 7 + 9 + 5 + 7 + 6 + 7 + 6 ____________________ 8
or 54 __ 8
= 6.75 so the answer should be 7
(c) (Median for Judge B =) 7
or
(Mean for Judge A =) 6.25
or
(Total for Judge A =) 50 and (Total for Judge B =) 54
5. Sam mean = Tom mean = 28 Sam range = 35, Tom range = 19 Whilst neither Sam nor Tom did better than the other as their mean mark was the same, Tom has a smaller range and is therefore more consistent with his test scores. (Instead of mean, median are 25 for both Sam and Tom)
6. (a) 2
(i) 315 ÷ 90 = 3.5
(ii) ticks yes: takes in to account all the data
7. (a) 52 000
(b) 65 400
(c) The house price at £129 500 is much higher than the rest and will distort the mean upwards.
29
Exercise Answers: Chapter 6 - Charts and Diagrams 2
EXERCISE 1
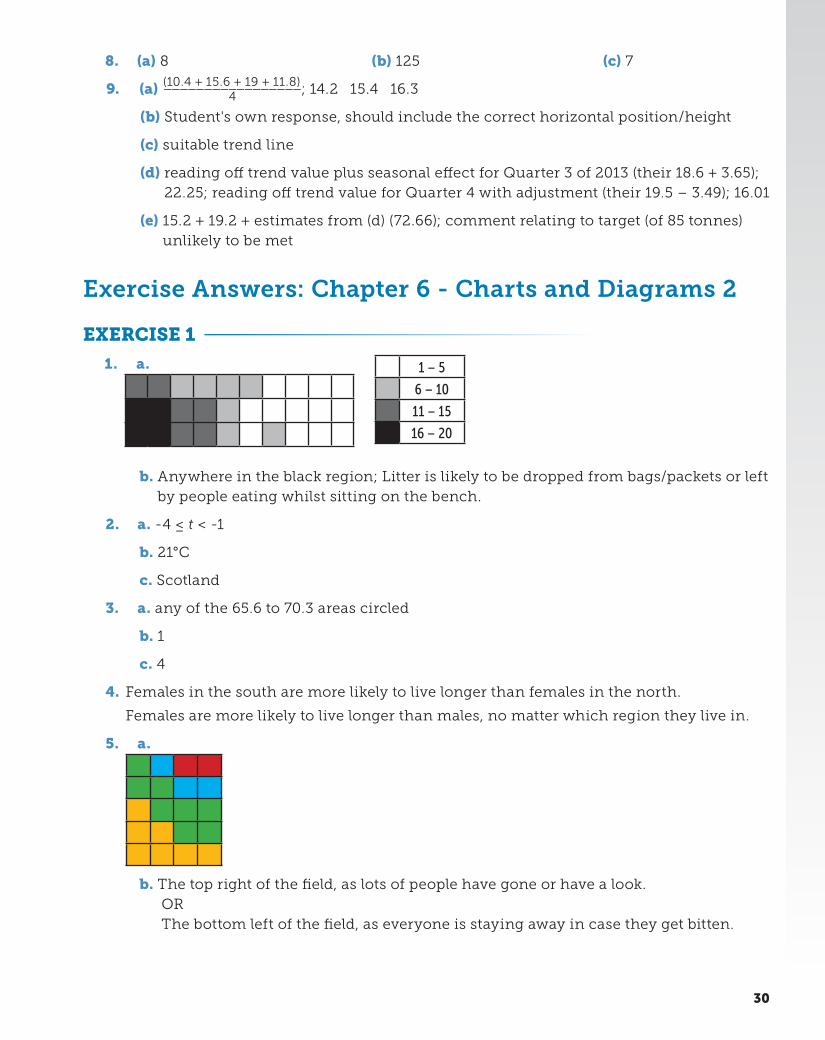
1. a.
b. Anywhere in the black region; Litter is likely to be dropped from bags/packets or left by people eating whilst sitting on the bench.
2. a. -4 ≤ t < -1
b. 21°C
c. Scotland
3. a. any of the 65.6 to 70.3 areas circled
b. 1
c. 4
4. Females in the south are more likely to live longer than females in the north.
Females are more likely to live longer than males, no matter which region they live in.
5. a.
b. The top right of the field, as lots of people have gone or have a look. OR The bottom left of the field, as everyone is staying away in case they get bitten.
1 – 5
6 – 10
11 – 15
16 – 20
8. (a) 8 (b) 125 (c) 7
9. (a) (10.4 + 15.6 + 19 + 11.8) _________________ 4 ; 14.2 15.4 16.3
(b) Student's own response, should include the correct horizontal position/height
(c) suitable trend line
(d) reading off trend value plus seasonal effect for Quarter 3 of 2013 (their 18.6 + 3.65); 22.25; reading off trend value for Quarter 4 with adjustment (their 19.5 – 3.49); 16.01
(e) 15.2 + 19.2 + estimates from (d) (72.66); comment relating to target (of 85 tonnes) unlikely to be met
30
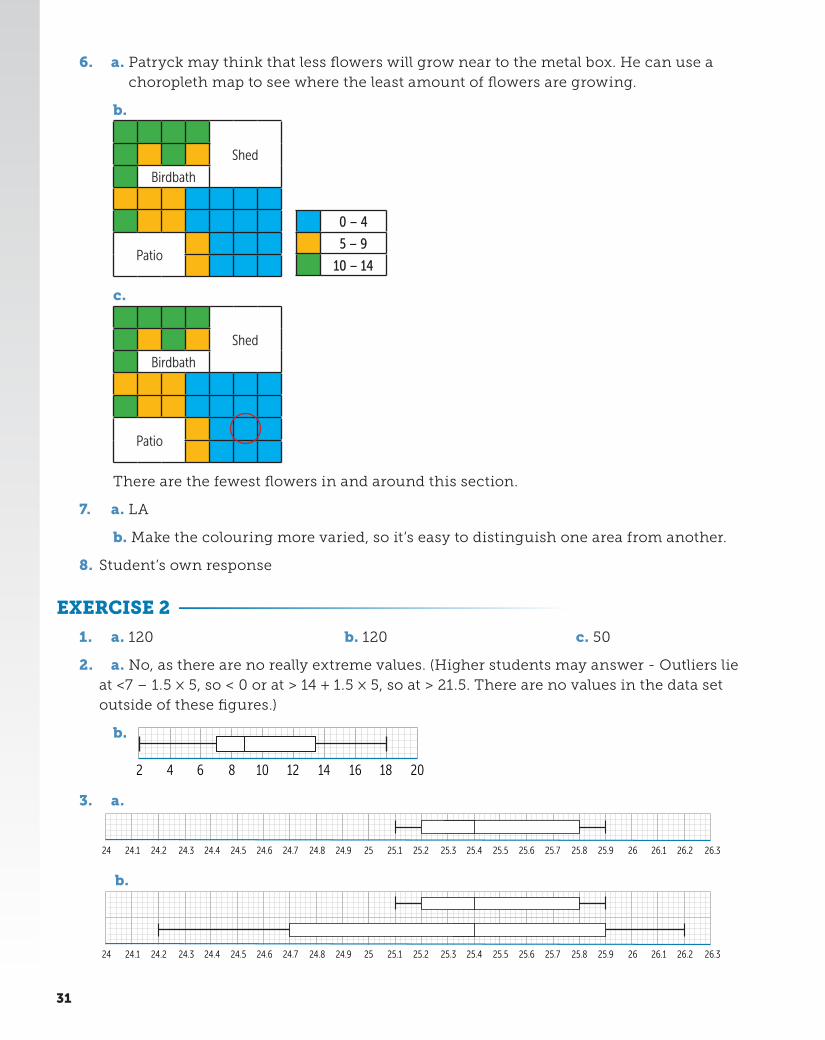
6. a. Patryck may think that less flowers will grow near to the metal box. He can use a choropleth map to see where the least amount of flowers are growing.
b.
Shed
Birdbath
Patio
c.
Shed
Birdbath
Patio
There are the fewest flowers in and around this section.
7. a. LA
b. Make the colouring more varied, so it’s easy to distinguish one area from another.
8. Student’s own response
EXERCISE 2
1. a. 120 b. 120 c. 50
2. a. No, as there are no really extreme values. (Higher students may answer - Outliers lie at <7 – 1.5 × 5, so < 0 or at > 14 + 1.5 × 5, so at > 21.5. There are no values in the data set outside of these figures.)
b.
2 4 6 8 10 12 14 16 18 20
3. a.
25 25.1 25.2 25.3 25.4 25.5 25.6 25.7 25.8 25.924 24.1 24.2 24.3 24.4 24.5 24.6 24.7 24.8 24.9 26 26.1 26.2 26.3
b.
25 25.1 25.2 25.3 25.4 25.5 25.6 25.7 25.8 25.924 24.1 24.2 24.3 24.4 24.5 24.6 24.7 24.8 24.9 26 26.1 26.2 26.3
0 – 4
5 – 9
10 – 14
31
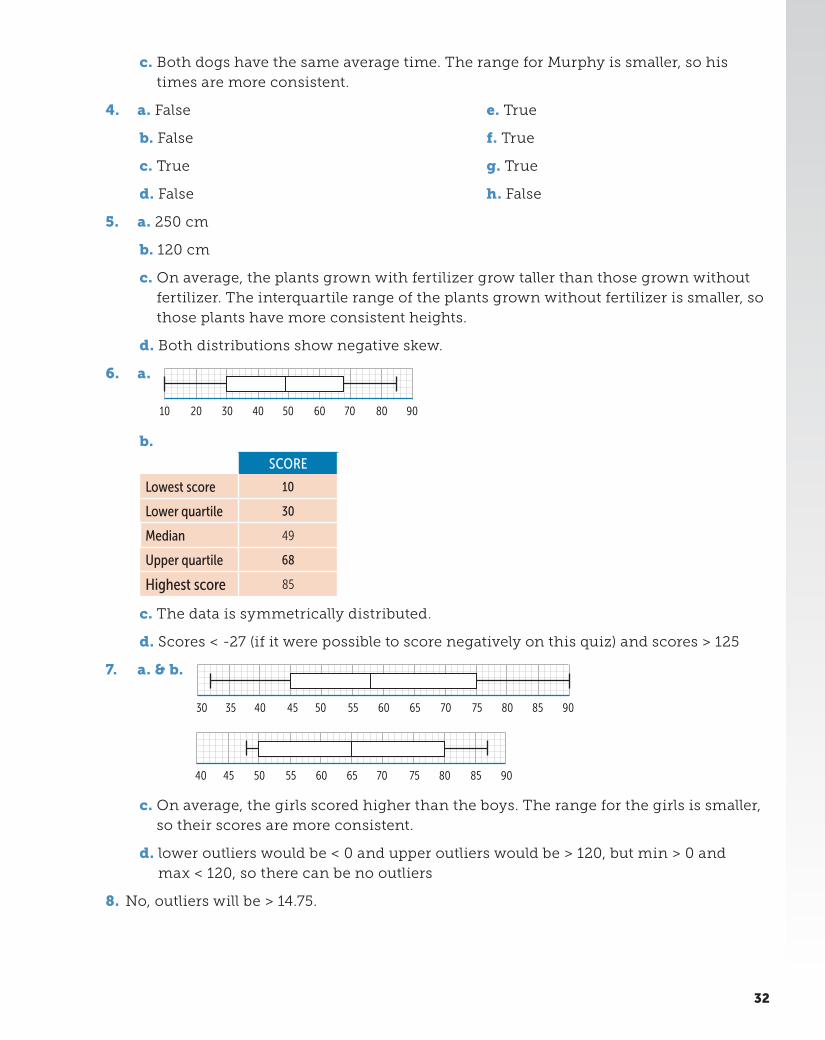
c. Both dogs have the same average time. The range for Murphy is smaller, so his times are more consistent.
4. a. False
b. False
c. True
d. False
e. True
f. True
g. True
h. False
5. a. 250 cm
b. 120 cm
c. On average, the plants grown with fertilizer grow taller than those grown without fertilizer. The interquartile range of the plants grown without fertilizer is smaller, so those plants have more consistent heights.
d. Both distributions show negative skew.
6. a.
10 20 30 40 50 60 70 80 90
b.
SCORE
Lowest score 10
Lower quartile 30
Median 49
Upper quartile 68
Highest score 85
c. The data is symmetrically distributed.
d. Scores < -27 (if it were possible to score negatively on this quiz) and scores > 125
7. a. & b.
30 35 40 45 50 55 60 65 70 75 80 85 90
40 45 50 55 60 65 70 75 80 85 90
c. On average, the girls scored higher than the boys. The range for the girls is smaller, so their scores are more consistent.
d. lower outliers would be < 0 and upper outliers would be > 120, but min > 0 and max < 120, so there can be no outliers
8. No, outliers will be > 14.75.
32

9.
40 45 50 55 60 65 70 75 80 85 90
10.
4000 5000 6000 7000 8000 9000 10000 2240 16009
EXERCISE 3
1.
0 5 7 7 8 9
1 0 1 3 4 4 6 8
2 3 9
3 2
Key: 1|1 means 11 birds
2. a.
TIM GAVIN
9 0 0 0 0 0 0
8 7 4 4 4 3 2 1 1 2 4
4 3 2 1 0 2 1 2 2 2 4 5 8
0 3 0 1 3 8
4 0 1
5 8
7 6 5
Key: 1|1|2 means 11 for Tim and 12 for Gavin
b. 319
c. 1
19
d. The median height for Tim is 14, the median height for Gavin is 25, so on average, Gavin’s seeds grew taller than Tim’s.
3. a. False
b. False
c. could be taken so, as second class has two modes: 12 and 27 the mode for first class is 25, so 27 > 25
d. False
e. True
f. False
33
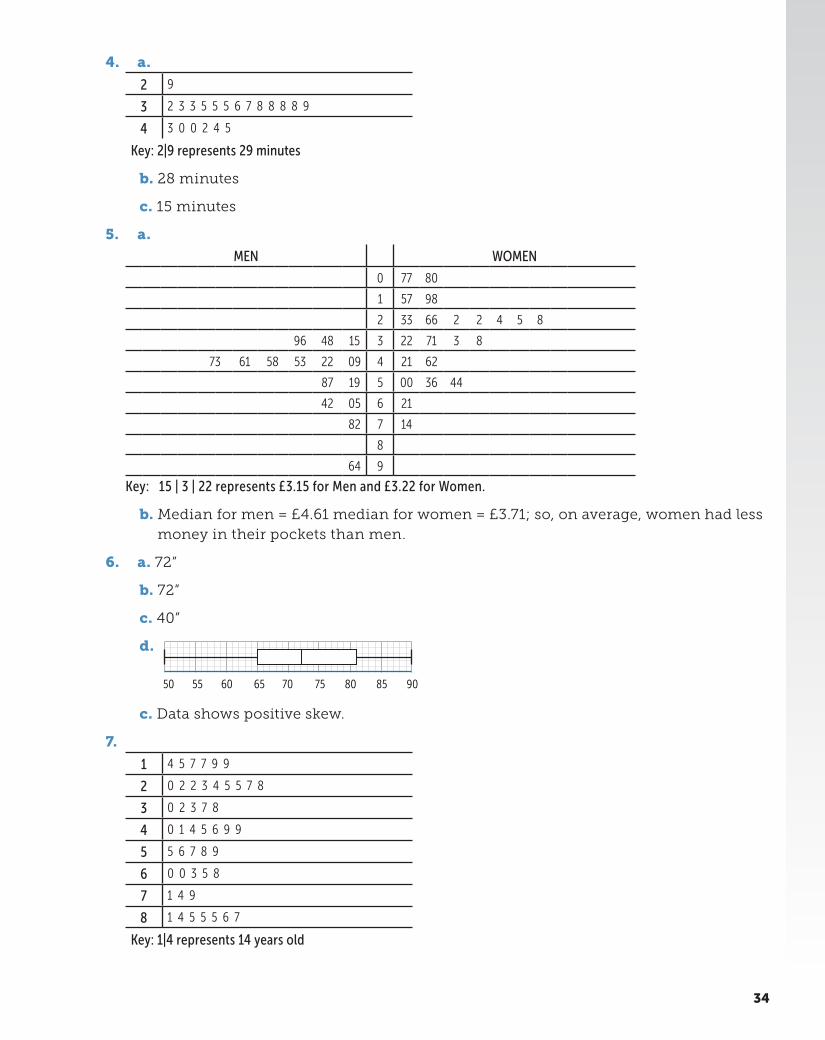
4. a.
2 9
3 2 3 3 5 5 5 6 7 8 8 8 8 9
4 3 0 0 2 4 5
Key: 2|9 represents 29 minutes
b. 28 minutes
c. 15 minutes
5. a.
MEN WOMEN
0 77 80
1 57 98
2 33 66 2 2 4 5 8
96 48 15 3 22 71 3 8
73 61 58 53 22 09 4 21 62
87 19 5 00 36 44
42 05 6 21
82 7 14
8
64 9
Key: 15 | 3 | 22 represents £3.15 for Men and £3.22 for Women.
b. Median for men = £4.61 median for women = £3.71; so, on average, women had less money in their pockets than men.
6. a. 72”
b. 72”
c. 40”
d.
50 55 60 65 70 75 80 85 90
c. Data shows positive skew.
7.
1 4 5 7 7 9 9
2 0 2 2 3 4 5 5 7 8
3 0 2 3 7 8
4 0 1 4 5 6 9 9
5 5 6 7 8 9
6 0 0 3 5 8
7 1 4 9
8 1 4 5 5 5 6 7
Key: 1|4 represents 14 years old
34
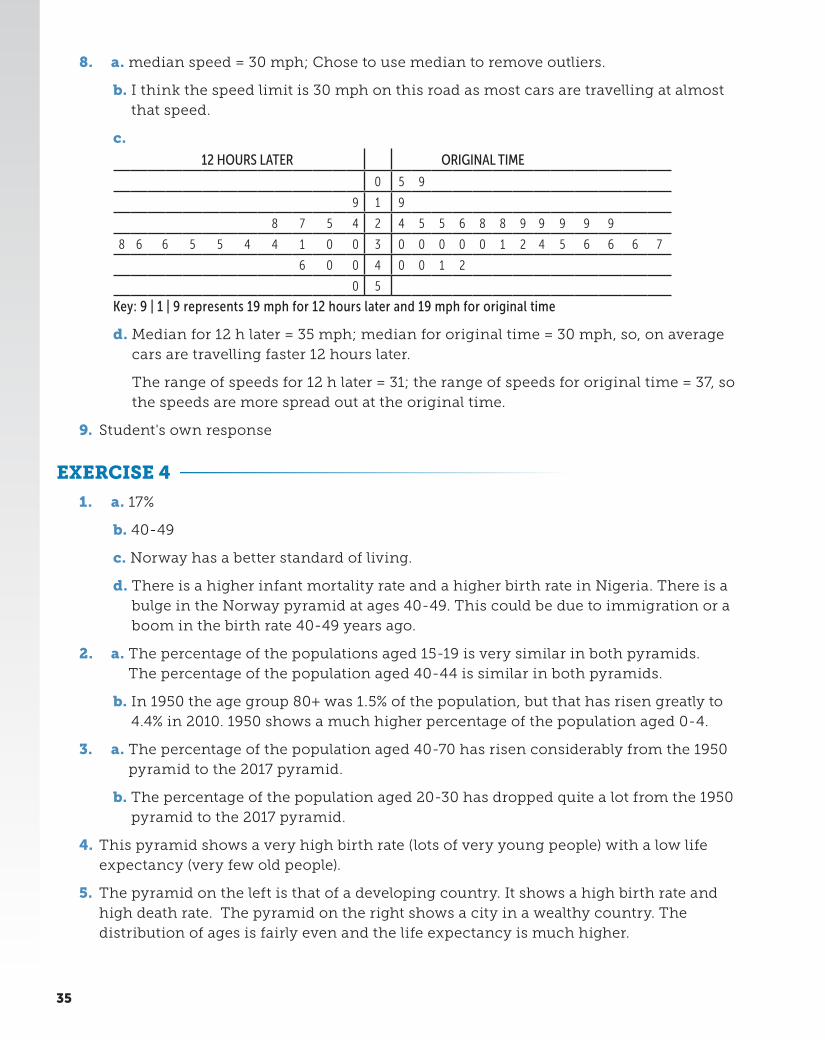
8. a. median speed = 30 mph; Chose to use median to remove outliers.
b. I think the speed limit is 30 mph on this road as most cars are travelling at almost that speed.
c.
12 HOURS LATER ORIGINAL TIME
0 5 9
9 1 9
8 7 5 4 2 4 5 5 6 8 8 9 9 9 9 9
8 6 6 5 5 4 4 1 0 0 3 0 0 0 0 0 1 2 4 5 6 6 6 7
6 0 0 4 0 0 1 2
0 5
Key: 9 | 1 | 9 represents 19 mph for 12 hours later and 19 mph for original time
d. Median for 12 h later = 35 mph; median for original time = 30 mph, so, on average cars are travelling faster 12 hours later.
The range of speeds for 12 h later = 31; the range of speeds for original time = 37, so the speeds are more spread out at the original time.
9. Student's own response
EXERCISE 4
1. a. 17%
b. 40-49
c. Norway has a better standard of living.
d. There is a higher infant mortality rate and a higher birth rate in Nigeria. There is a bulge in the Norway pyramid at ages 40-49. This could be due to immigration or a boom in the birth rate 40-49 years ago.
2. a. The percentage of the populations aged 15-19 is very similar in both pyramids. The percentage of the population aged 40-44 is similar in both pyramids.
b. In 1950 the age group 80+ was 1.5% of the population, but that has risen greatly to 4.4% in 2010. 1950 shows a much higher percentage of the population aged 0-4.
3. a. The percentage of the population aged 40-70 has risen considerably from the 1950 pyramid to the 2017 pyramid.
b. The percentage of the population aged 20-30 has dropped quite a lot from the 1950 pyramid to the 2017 pyramid.
4. This pyramid shows a very high birth rate (lots of very young people) with a low life expectancy (very few old people).
5. The pyramid on the left is that of a developing country. It shows a high birth rate and high death rate. The pyramid on the right shows a city in a wealthy country. The distribution of ages is fairly even and the life expectancy is much higher.
35

Exam Practice Answers1. 60
2. (a)
480 500 520 540 560 580 600
Rower C
time (seconds)
(b) & (c) Rower B; Rower A: The interquartile range is more than 40 (seconds).; Rower C: Their median time was greater/ slower than 540 (seconds).
3. (a)
16 14 12 10 8 6 4 2 0Percentage of Population
0 2 4 6 8 10 12 14 16Percentage of Population
0-9
10-19
20-29
30-39
40-49
50-59
60-69
70-79
80+
(b) 25.6%
(c) 40–49
(d) There are more females than males in the 70-79 and 80+ age groups. The percentage drops for both females and males in the 80+ age group but there is a larger decrease for females.
4. (a) Route A: shorter time on average; greater variations in time; outliers present or reference skewness
(b)(i) Route A: more likely than on B (50%)
(ii) Route B: always arrives within 40 mins
5. (a) 72 (b) 1.6 million (c) 453 million
(d) The bars for males and females in India get smaller as the age increases and much smaller after the age of 50-59. In Japan the bars for males and females get smaller after the age 60-69 and decreases by a smaller percentage of the population.
36
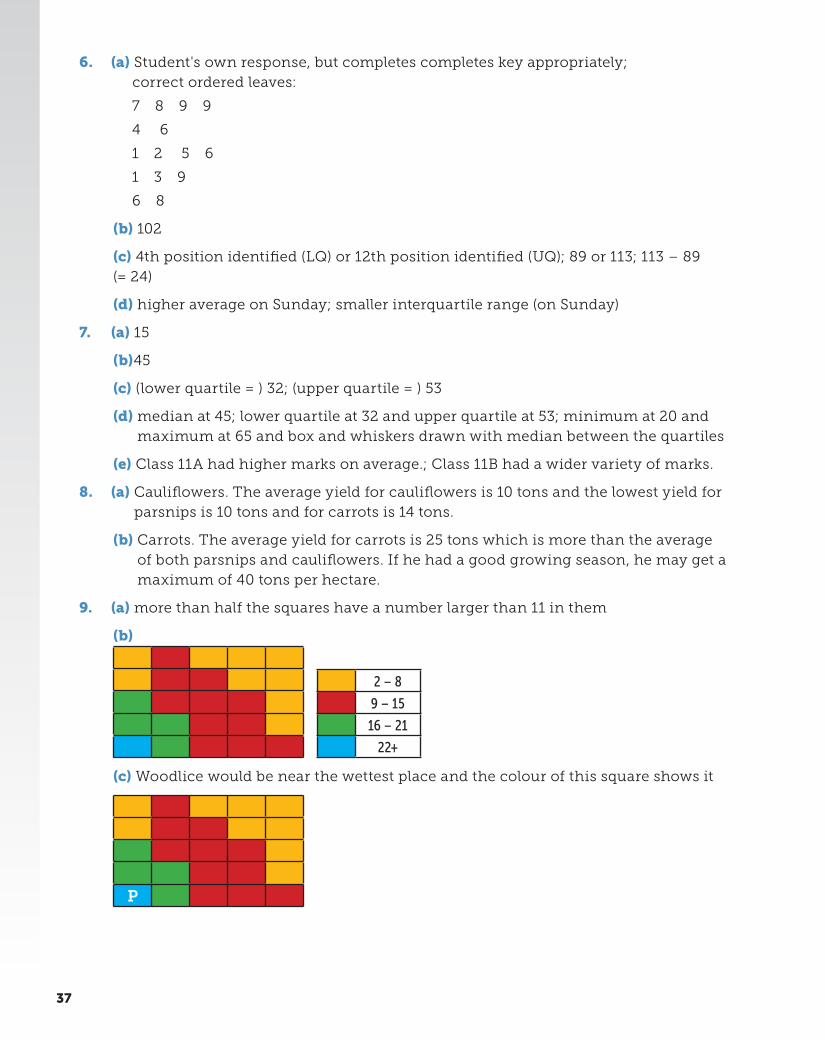
6. (a) Student's own response, but completes completes key appropriately; correct ordered leaves:
7 8 9 9
4 6
1 2 5 6
1 3 9
6 8
(b) 102
(c) 4th position identified (LQ) or 12th position identified (UQ); 89 or 113; 113 – 89 (= 24)
(d) higher average on Sunday; smaller interquartile range (on Sunday)
7. (a) 15
(b)45
(c) (lower quartile = ) 32; (upper quartile = ) 53
(d) median at 45; lower quartile at 32 and upper quartile at 53; minimum at 20 and maximum at 65 and box and whiskers drawn with median between the quartiles
(e) Class 11A had higher marks on average.; Class 11B had a wider variety of marks.
8. (a) Cauliflowers. The average yield for cauliflowers is 10 tons and the lowest yield for parsnips is 10 tons and for carrots is 14 tons.
(b) Carrots. The average yield for carrots is 25 tons which is more than the average of both parsnips and cauliflowers. If he had a good growing season, he may get a maximum of 40 tons per hectare.
9. (a) more than half the squares have a number larger than 11 in them
(b)
(c) Woodlice would be near the wettest place and the colour of this square shows it
P
2 – 8
9 – 15
16 – 21
22+
37

Exercise Answers: Chapter 7 - Averages 2
EXERCISE 1
1. a.
Num
nber
of V
isito
rs (1
000s
)
Year 1
400
01 2 3 4 1 2 3 4 1 2 3 4
500
600
700
Year 2 Year 3
b. 4-point moving averages are:
492 500 522 500 54 6500 59 1000 64 3000 64 2000 63 6000 63 2000 63 5500
38
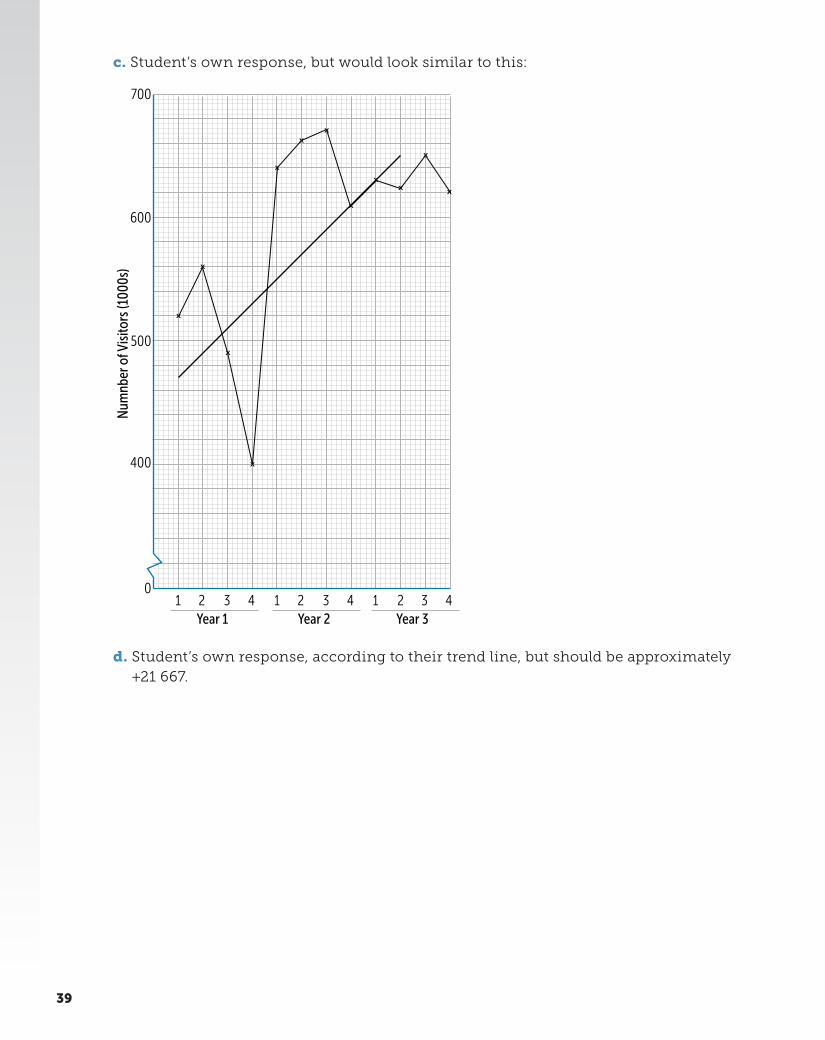
c. Student’s own response, but would look similar to this:
Year 1
01 2 3 4 1 2 3 4 1 2 3 4
Year 2 Year 3
400
500
600
700
Num
nber
of V
isito
rs (1
000s
)
d. Student’s own response, according to their trend line, but should be approximately +21 667.
39
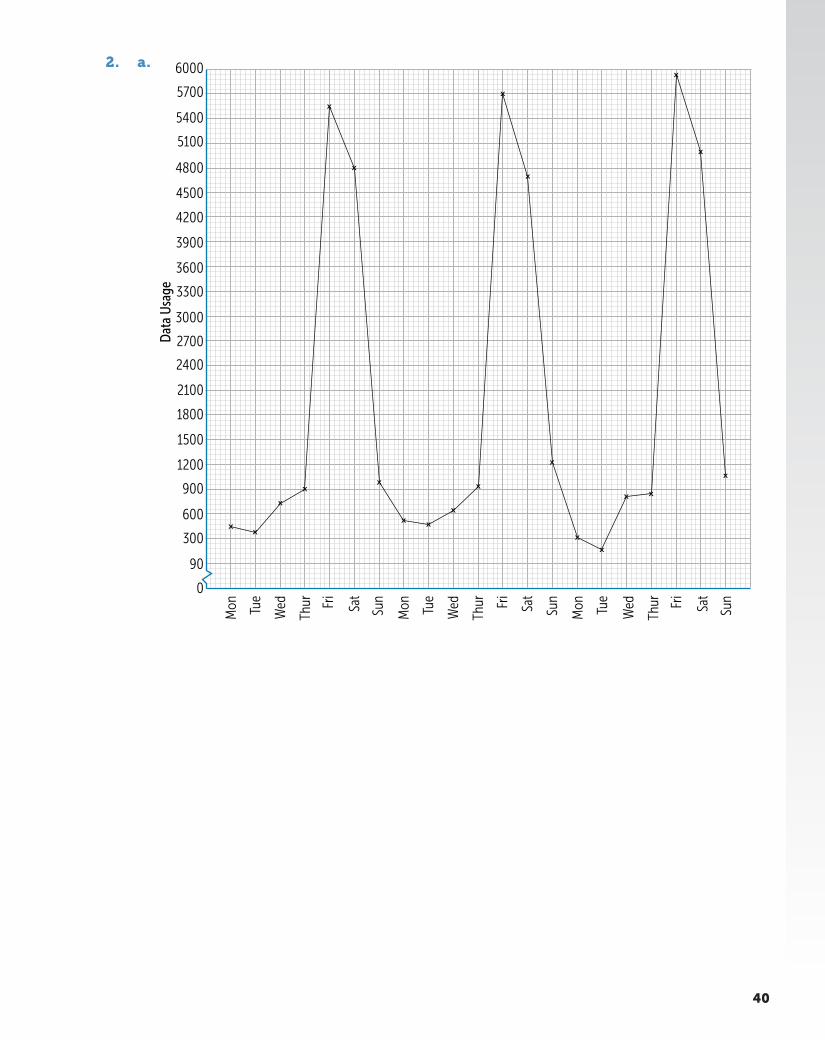
2. a.
Dat
a U
sage
Week 1
300
90
0
600
900
1200
1500
1800
2100
2400
2700
3000
3300
3600
3900
4200
4500
4800
5100
5400
5700
6000
Mon Tu
e
Wed
Thur Fr
i
Sat
Sun
Tue
Wed
Thur Fr
i
Sat
Sun
Mon
Week 2
Tue
Wed
Thur Fr
i
Sat
Sun
Mon
Week 3
40
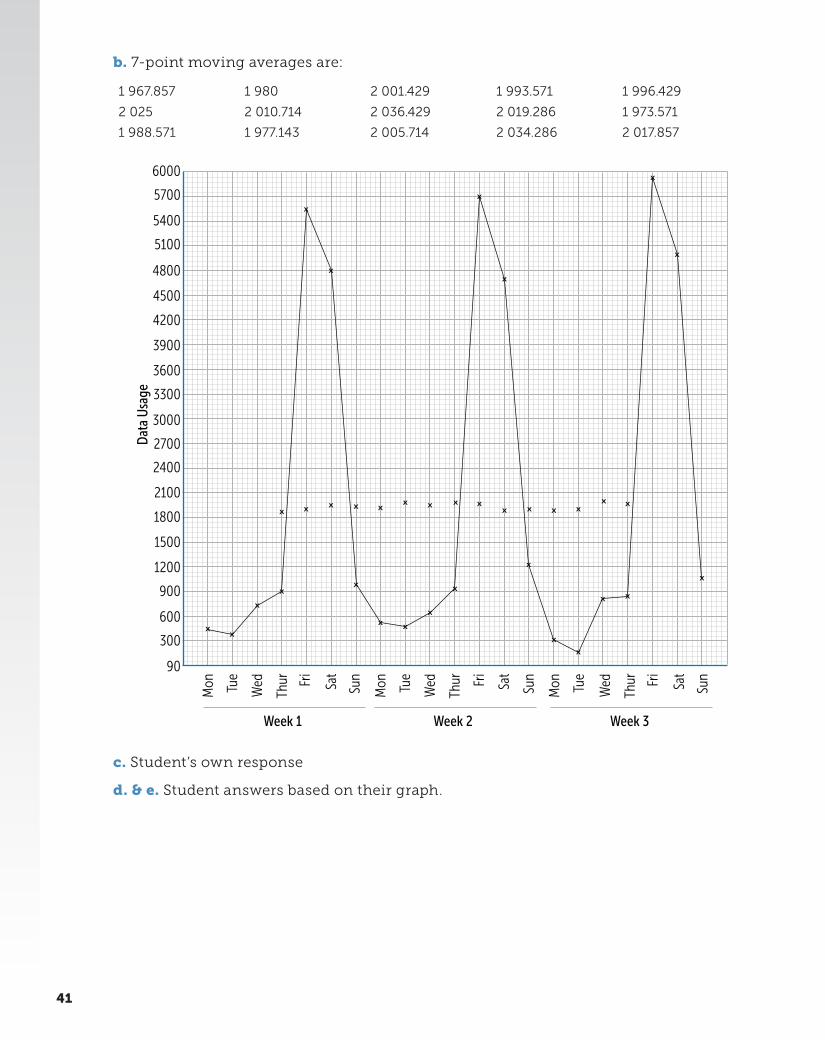
b. 7-point moving averages are:
1 967.857 1 980 2 001.429 1 993.571 1 996.429
2 025 2 010.714 2 036.429 2 019.286 1 973.571
1 988.571 1 977.143 2 005.714 2 034.286 2 017.857D
ata
Usa
ge
Week 1
300
90
600
900
1200
1500
1800
2100
2400
2700
3000
3300
3600
3900
4200
4500
4800
5100
5400
5700
6000
Mon Tu
e
Wed
Thur Fr
i
Sat
Sun
Tue
Wed
Thur Fr
i
Sat
Sun
Mon
Week 2
Tue
Wed
Thur Fr
i
Sat
Sun
Mon
Week 3
c. Student’s own response
d. & e. Student answers based on their graph.
41
3. a.
Num
ber o
f Vis
its
Week 1
100
200
300
400
500
600
700
800
900
1000
1100
1200
1300
1400
1500
1600
Mon Tu
e
Wed
Thur Fr
i
Sat
Sun
Tue
Wed
Thur Fr
i
Sat
Sun
Mon
Week 2
Tue
Wed
Thur Fr
i
Sat
Sun
Mon
Week 3
Tue
Wed
Thur Fr
i
Sat
Sun
Mon
Week 4
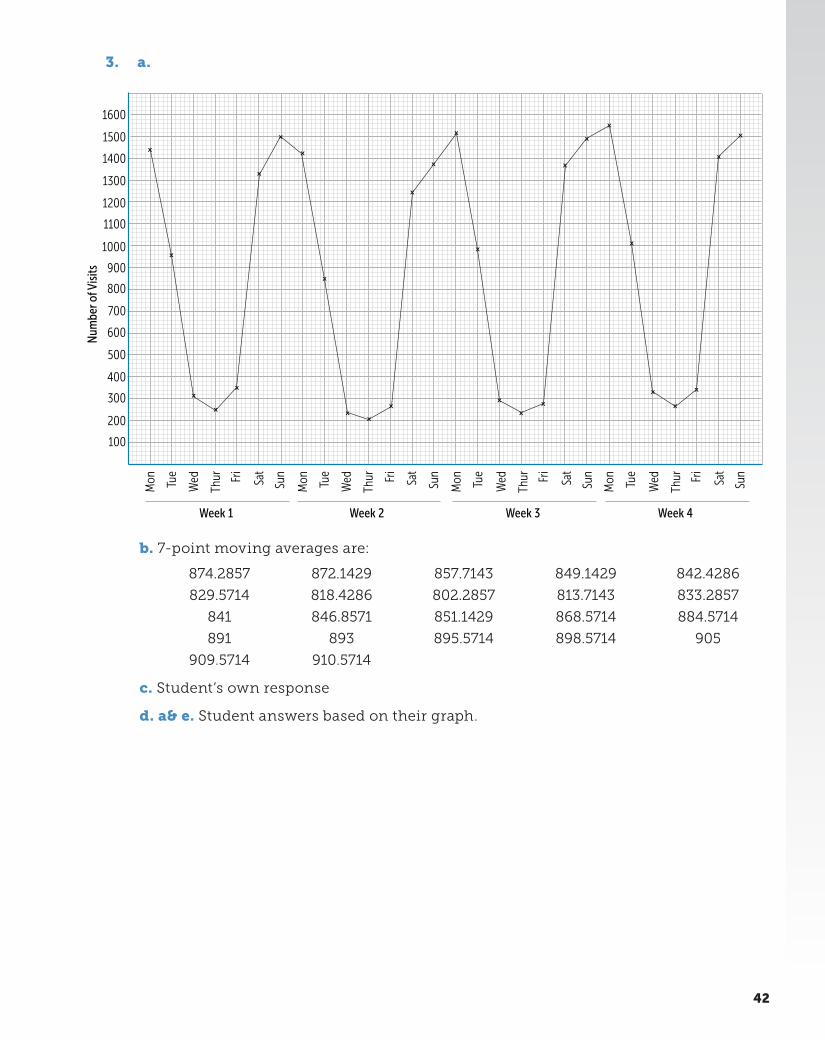
b. 7-point moving averages are:
874.2857 872.1429 857.7143 849.1429 842.4286
829.5714 818.4286 802.2857 813.7143 833.2857
841 846.8571 851.1429 868.5714 884.5714
891 893 895.5714 898.5714 905
909.5714 910.5714
c. Student’s own response
d. a& e. Student answers based on their graph.
42
4. a.
Week 1
200
300
400
500
600
700
800
900
1000
1100
1200
1300
1400
1500
Tue
Wed
Thur Fr
i
Sat
Tue
Wed
Thur Fr
i
Sat
Week 2
Tue
Wed
Thur Fr
i
Sat
Week 3
Tue
Wed
Thur Fr
i
Sat
Week 4
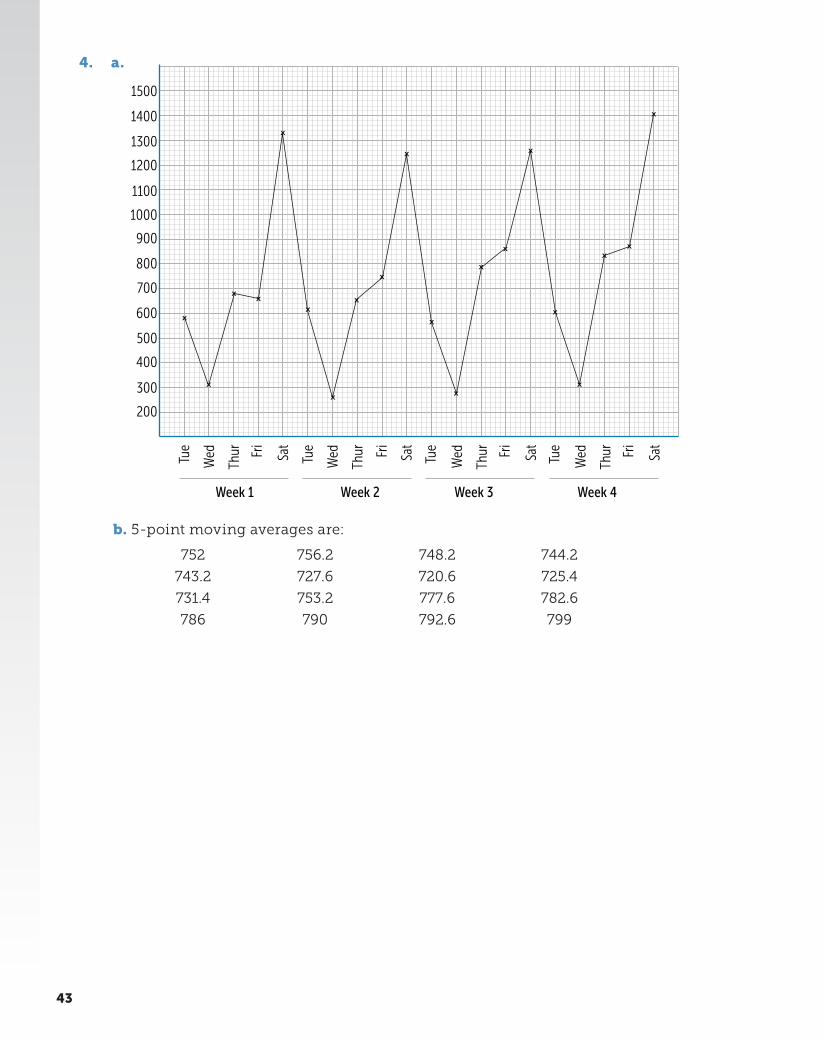
b. 5-point moving averages are:
752 756.2 748.2 744.2
743.2 727.6 720.6 725.4
731.4 753.2 777.6 782.6
786 790 792.6 799
43
c.
Week 1
200
300
400
500
600
700
800
900
1000
1100
1200
1300
1400
1500
Tue
Wed
Thur Fr
i
Sat
Tue
Wed
Thur Fr
i
Sat
Week 2
Tue
Wed
Thur Fr
i
Sat
Week 3
Tue
Wed
Thur Fr
i
Sat
Week 4
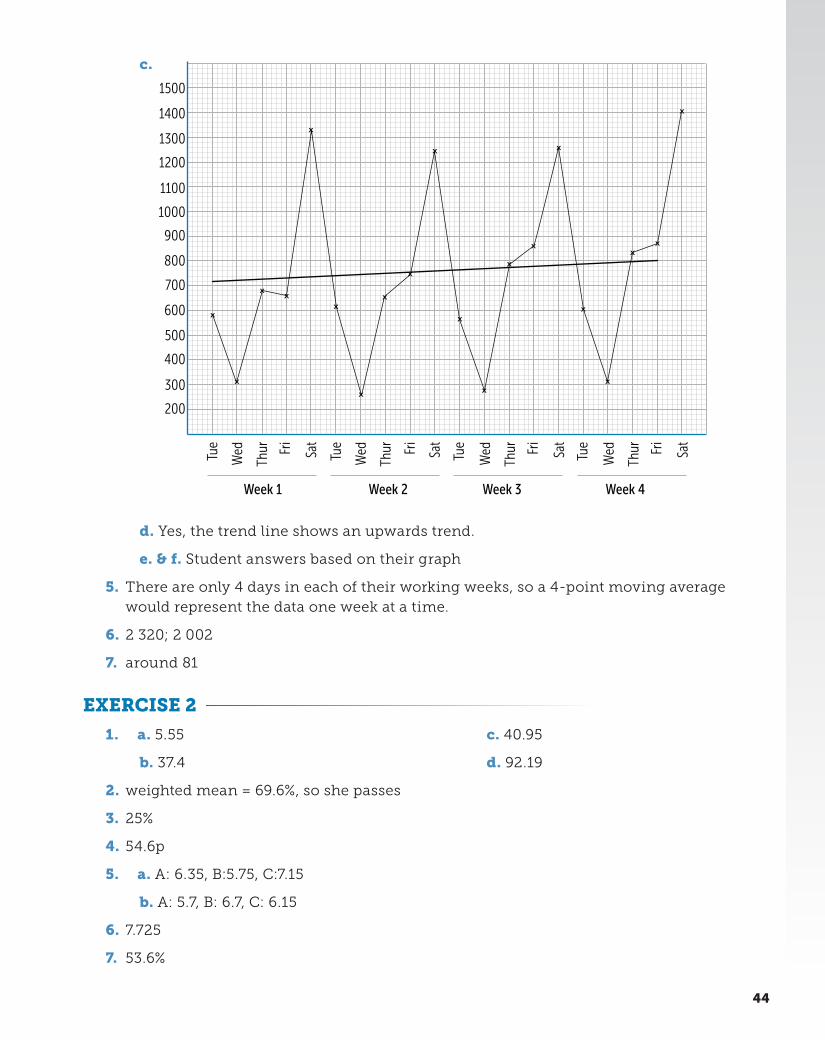
d. Yes, the trend line shows an upwards trend.
e. & f. Student answers based on their graph
5. There are only 4 days in each of their working weeks, so a 4-point moving average would represent the data one week at a time.
6. 2 320; 2 002
7. around 81
EXERCISE 2
1. a. 5.55
b. 37.4
c. 40.95
d. 92.19
2. weighted mean = 69.6%, so she passes
3. 25%
4. 54.6p
5. a. A: 6.35, B:5.75, C:7.15
b. A: 5.7, B: 6.7, C: 6.15
6. 7.725
7. 53.6%
44
EXERCISE 3
1. a. 4
b. 5.13
c. 25.68
2. 1.11
3. 5
4. 0.5
5. geometric mean = 0.9, so overall decrease
6. 5
EXERCISE 4
1. a. 165.06; 80.08
b. 1 894
2. a. 106.25; 112.5; 133.33
b. 15.94
3. 105
4. 2
5. 55
EXERCISE 5
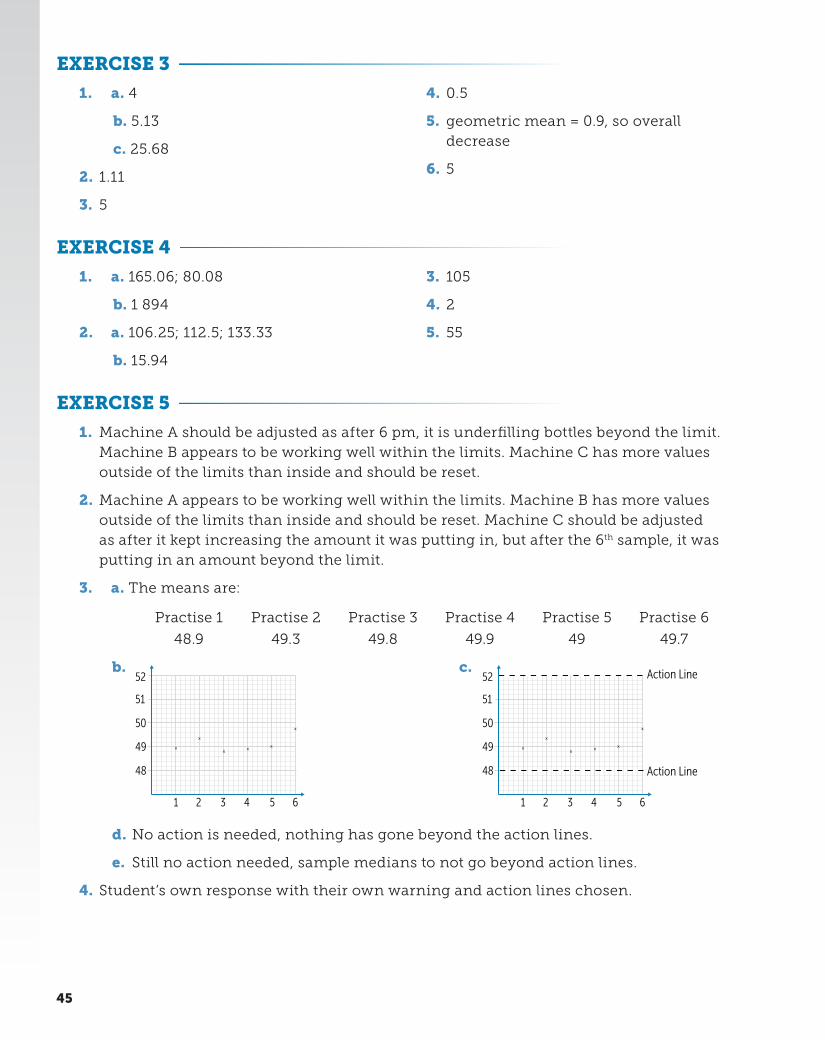
1. Machine A should be adjusted as after 6 pm, it is underfilling bottles beyond the limit. Machine B appears to be working well within the limits. Machine C has more values outside of the limits than inside and should be reset.
2. Machine A appears to be working well within the limits. Machine B has more values outside of the limits than inside and should be reset. Machine C should be adjusted as after it kept increasing the amount it was putting in, but after the 6th sample, it was putting in an amount beyond the limit.
3. a. The means are:
Practise 1 Practise 2 Practise 3 Practise 4 Practise 5 Practise 6
48.9 49.3 49.8 49.9 49 49.7
b.
1
48
49
50
51
52
2 3 4 5 6
c.
1
48
49
50
51
52
2 3 4 5 6
Action Line
Action Line
d. No action is needed, nothing has gone beyond the action lines.
e. Still no action needed, sample medians to not go beyond action lines.
4. Student’s own response with their own warning and action lines chosen.
45
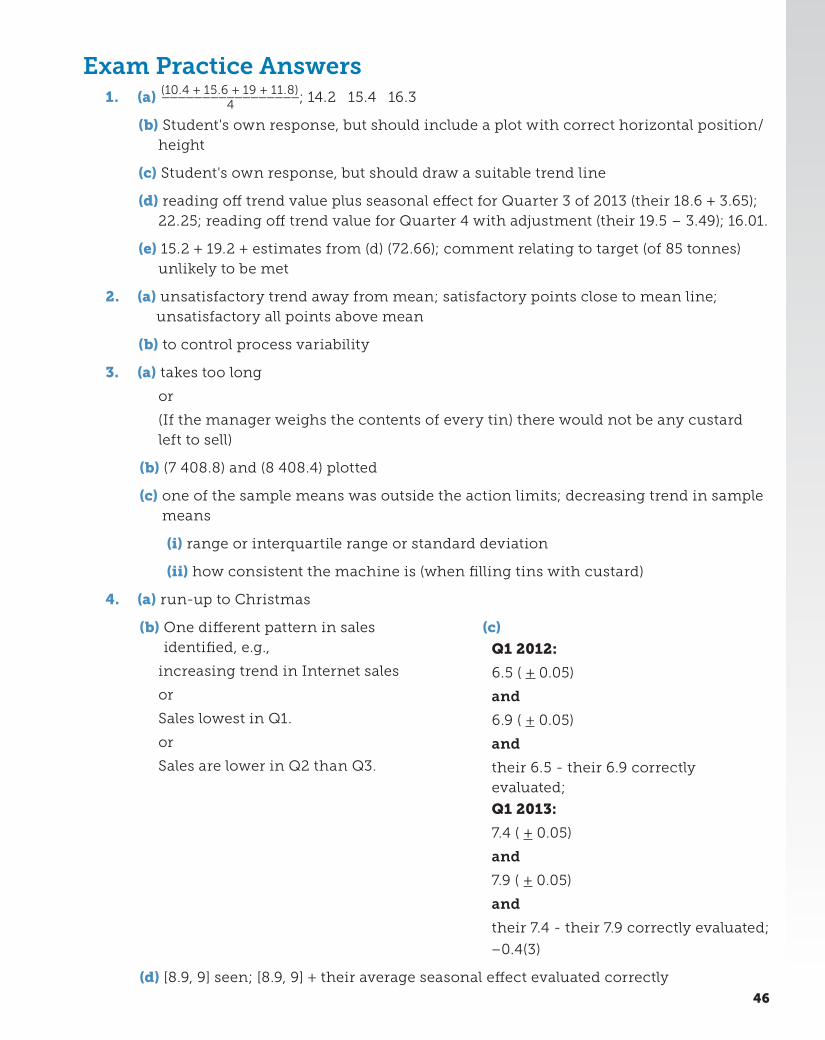
Exam Practice Answers1. (a) (10.4 + 15.6 + 19 + 11.8)
_________________ 4 ; 14.2 15.4 16.3
(b) Student's own response, but should include a plot with correct horizontal position/height
(c) Student's own response, but should draw a suitable trend line
(d) reading off trend value plus seasonal effect for Quarter 3 of 2013 (their 18.6 + 3.65); 22.25; reading off trend value for Quarter 4 with adjustment (their 19.5 – 3.49); 16.01.
(e) 15.2 + 19.2 + estimates from (d) (72.66); comment relating to target (of 85 tonnes) unlikely to be met
2. (a) unsatisfactory trend away from mean; satisfactory points close to mean line; unsatisfactory all points above mean
(b) to control process variability
3. (a) takes too long
or
(If the manager weighs the contents of every tin) there would not be any custard left to sell)
(b) (7 408.8) and (8 408.4) plotted
(c) one of the sample means was outside the action limits; decreasing trend in sample means
(i) range or interquartile range or standard deviation
(ii) how consistent the machine is (when filling tins with custard)
4. (a) run-up to Christmas
(b) One different pattern in sales identified, e.g.,
increasing trend in Internet sales
or
Sales lowest in Q1.
or
Sales are lower in Q2 than Q3.
(c)
Q1 2012:
6.5 ( + 0.05)
and
6.9 ( + 0.05)
and
their 6.5 - their 6.9 correctly evaluated;
Q1 2013:
7.4 ( + 0.05)
and
7.9 ( + 0.05)
and
their 7.4 - their 7.9 correctly evaluated;
−0.4(3)
(d) [8.9, 9] seen; [8.9, 9] + their average seasonal effect evaluated correctly
46
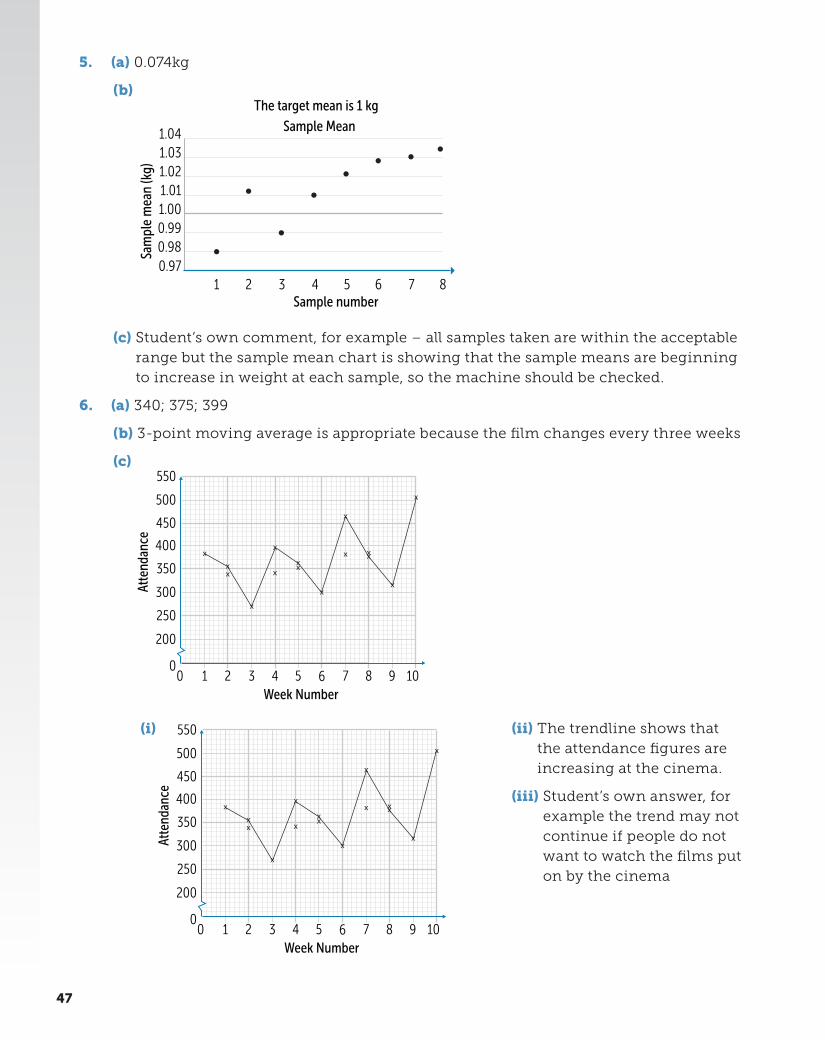
5. (a) 0.074kg
(b)
1
1.041.031.021.011.000.990.980.97
2 3 4Sample number
Sam
ple
mea
n (k
g)
5 6 7 8 1
0.100.080.060.040.02
02 3 4
Sample number
Sample Mean Sample Range
The target mean is 1 kg The acceptable range is 0.08 kg
Sam
ple
rang
e (k
g)
5 6 7 8
(c) Student’s own comment, for example – all samples taken are within the acceptable range but the sample mean chart is showing that the sample means are beginning to increase in weight at each sample, so the machine should be checked.
6. (a) 340; 375; 399
(b) 3-point moving average is appropriate because the film changes every three weeks
(c)
Atte
ndan
ce
Week Number
200
250
300
350
400
450
500
550
010 2 3 4 5 6 7 8 9 10
(i)
Atte
ndan
ce
Week Number
200
250
300
350
400
450
500
550
010 2 3 4 5 6 7 8 9 10
(ii) The trendline shows that the attendance figures are increasing at the cinema.
(iii) Student’s own answer, for example the trend may not continue if people do not want to watch the films put on by the cinema
47
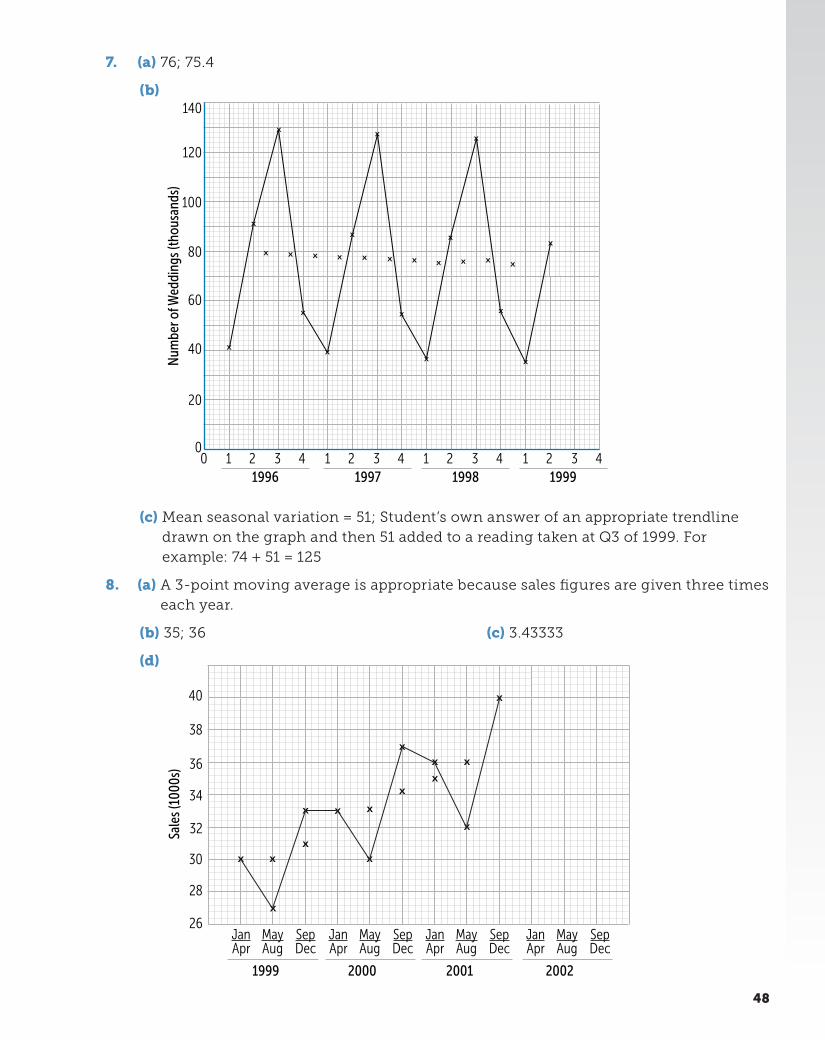
7. (a) 76; 75.4
(b)
Num
ber o
f Wed
ding
s (th
ousa
nds)
1996
20
00 1 2 3 4 1 2 3 4 1 2 3 4 1 2 3 4
40
80
100
60
120
140
1997 1998 1999
(c) Mean seasonal variation = 51; Student’s own answer of an appropriate trendline drawn on the graph and then 51 added to a reading taken at Q3 of 1999. For example: 74 + 51 = 125
8. (a) A 3-point moving average is appropriate because sales figures are given three times each year.
(b) 35; 36 (c) 3.43333
(d)
Sale
s (1
000s
)
28
26
1999
JanApr
MayAug
SepDec
30
34
36
32
38
40
2000
JanApr
MayAug
SepDec
2001
JanApr
MayAug
SepDec
2002
JanApr
MayAug
SepDec
48
(e) Student’s own answer from their trend line reading plus 3.43333, for example 41.83.
9. (a) 1.2 + 1.4 + 0.9 + 1.3 ______________ 4 or 1.2; 4
√ _________________
1.2 × 1.4 × 0.9 × 1.3 or 1.18(4…); 0.16
(b) 18.(4…)(%)
Exercise Answers: Chapter 8 - Cumulative Frequency
EXERCISE 1
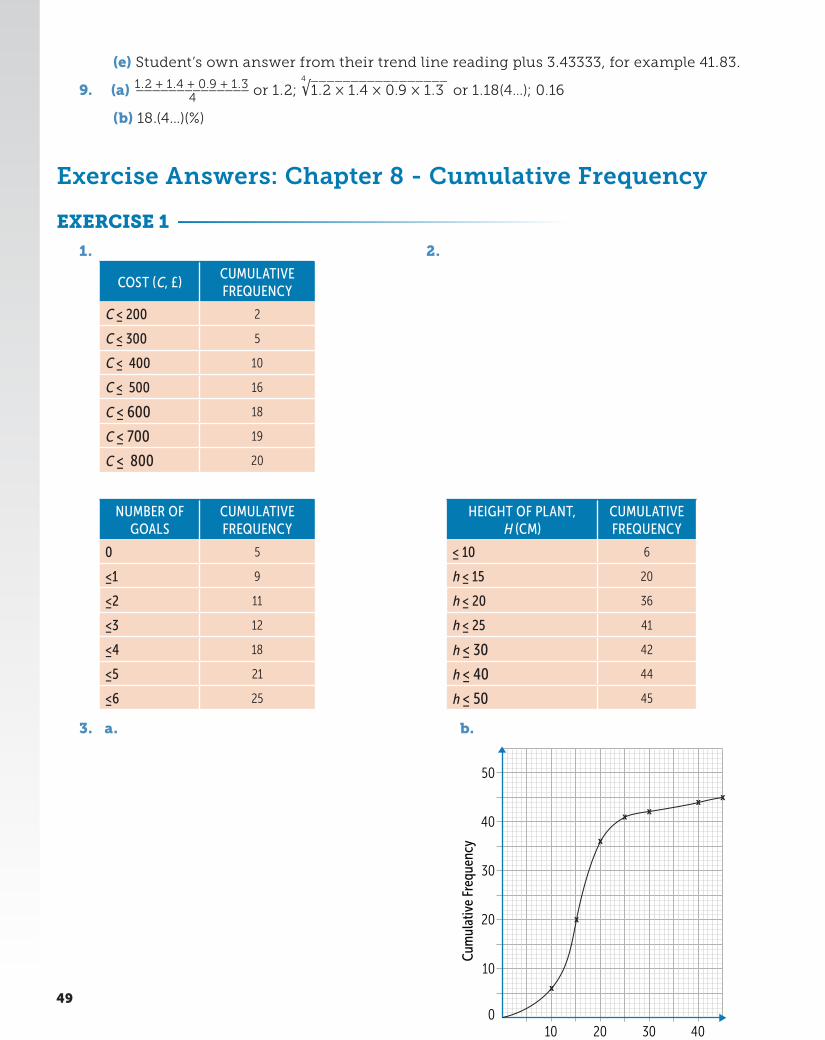
1.
COST (C, £)CUMULATIVE FREQUENCY
C ≤ 200 2
C ≤ 300 5
C ≤ 400 10
C ≤ 500 16
C ≤ 600 18
C ≤ 700 19
C ≤ 800 20
2.
NUMBER OF GOALS
CUMULATIVE FREQUENCY
0 5
≤1 9
≤2 11
≤3 12
≤4 18
≤5 21
≤6 25
3. a.
HEIGHT OF PLANT, H (CM)
CUMULATIVE FREQUENCY
≤ 10 6
h ≤ 15 20
h ≤ 20 36
h ≤ 25 41
h ≤ 30 42
h ≤ 40 44
h ≤ 50 45
b.
Cum
ulat
ive
Freq
uenc
y
010 20 30 40
10
20
30
Height of plant (cm)
40
50
49

4. a.
TIME TAKEN, T (MINUTES)
CUMULATIVE FREQUENCY
≤ 25 5
t ≤ 28 30
t ≤ 30 75
t ≤ 32 113
t ≤ 35 177
t ≤ 40 196
t ≤ 50 200
b.
Cum
ulat
ive
Freq
uenc
y
0
10 20 30 40 50 60 70 80
90
100
110
120
130
140
150
160
170
180
190
200
10
20
30
Time taken (min)
40
50
60
70
80
c. about 25% (student’s own answer)
d. as we don’t know the exact number of people who finished in under 29 minutes
5.
010
Cum
ulat
ive
Freq
uenc
y
20
Ribbon (metres)
30 40 50
10
20
30
40
50
50
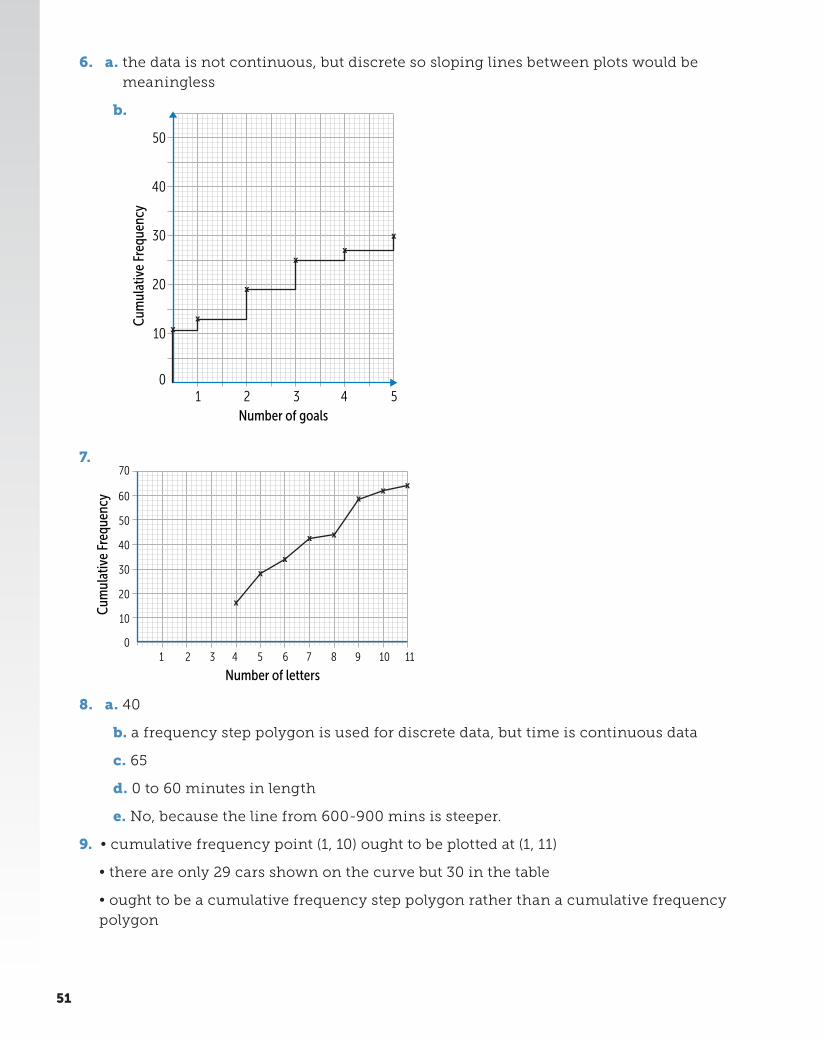
6. a. the data is not continuous, but discrete so sloping lines between plots would be meaningless
b.
Cum
ulat
ive
Freq
uenc
y
Number of goals
01 2 3 4 5
10
20
30
40
50
7.
Cum
ulat
ive
Freq
uenc
y
Number of letters
01 2 3 4 5 6 7 8 9 10 11
10
20
30
40
50
60
70
8. a. 40
b. a frequency step polygon is used for discrete data, but time is continuous data
c. 65
d. 0 to 60 minutes in length
e. No, because the line from 600-900 mins is steeper.
9. • cumulative frequency point (1, 10) ought to be plotted at (1, 11)
• there are only 29 cars shown on the curve but 30 in the table
• ought to be a cumulative frequency step polygon rather than a cumulative frequency polygon
51
EXERCISE 2
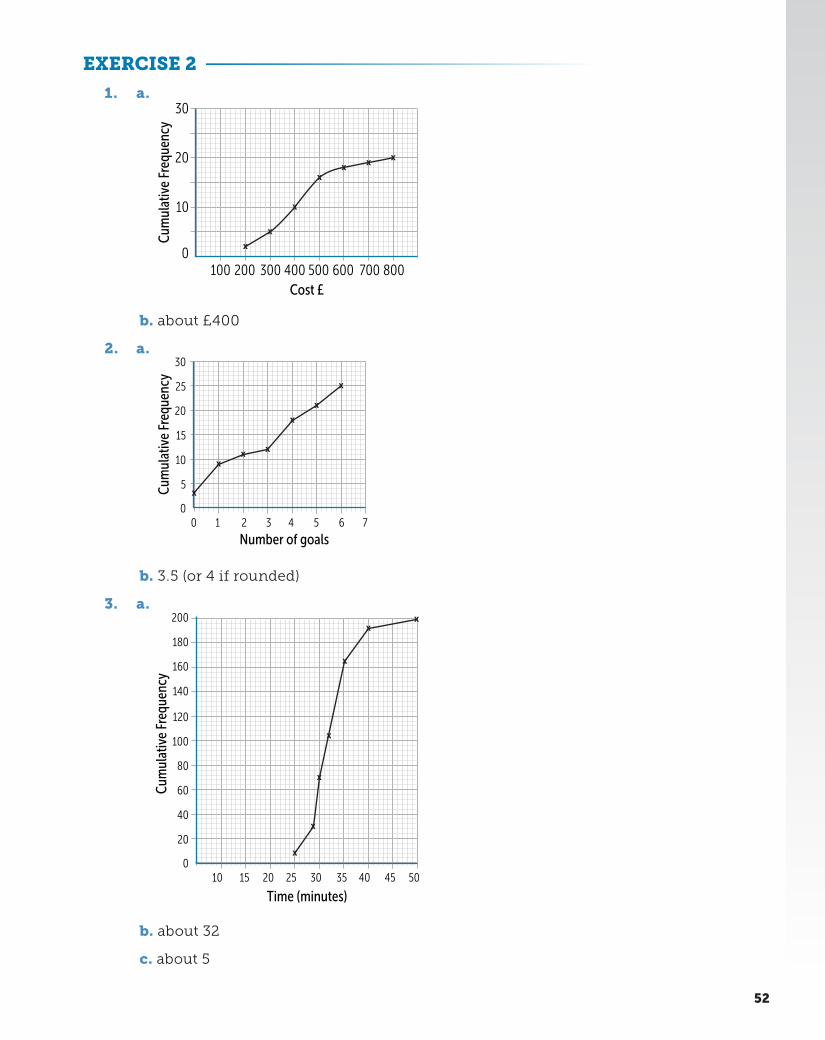
1. a.
Cum
ulat
ive
Freq
uenc
y
Cost £
0100 200 300 400 500 600 700 800
10
20
30
b. about £400
2. a.
Cum
ulat
ive
Freq
uenc
y
Number of goals
010 2 3 4 5 6 7
5
10
15
20
25
30
b. 3.5 (or 4 if rounded)
3. a.
Cum
ulat
ive
Freq
uenc
y
Time (minutes)
010 15 20 25 30 35 40 45 50
20
40
60
80
100
120
140
160
180
200
b. about 32
c. about 5
52
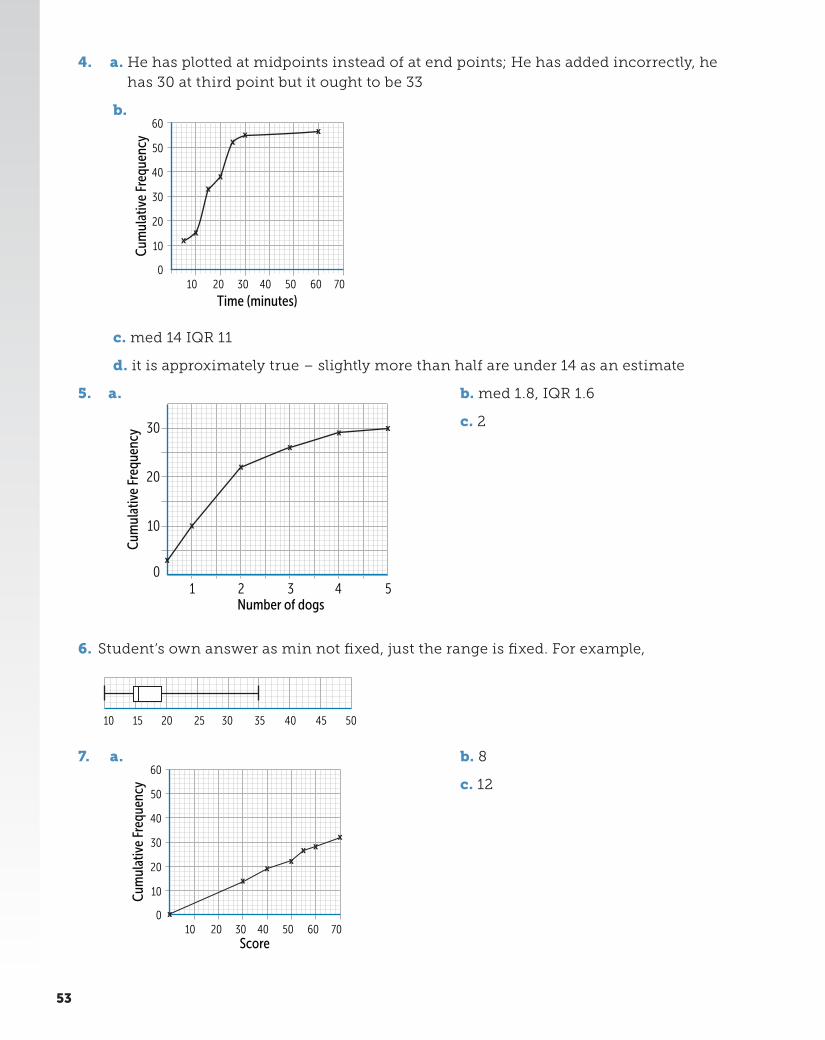
4. a. He has plotted at midpoints instead of at end points; He has added incorrectly, he has 30 at third point but it ought to be 33
b.
Cum
ulat
ive
Freq
uenc
y
Time (minutes)
010 20 30 40 50 60 70
10
20
30
40
50
60
c. med 14 IQR 11
d. it is approximately true – slightly more than half are under 14 as an estimate
5. a.
Cum
ulat
ive
Freq
uenc
y
Number of dogs
01 2 3 4 5
10
20
30
b. med 1.8, IQR 1.6
c. 2
6. Student’s own answer as min not fixed, just the range is fixed. For example,
10 15 20 25 30 35 40 5045
7. a.
Cum
ulat
ive
Freq
uenc
y
Score
010 20 30 40 50 60 70
10
20
30
40
50
60b. 8
c. 12
53
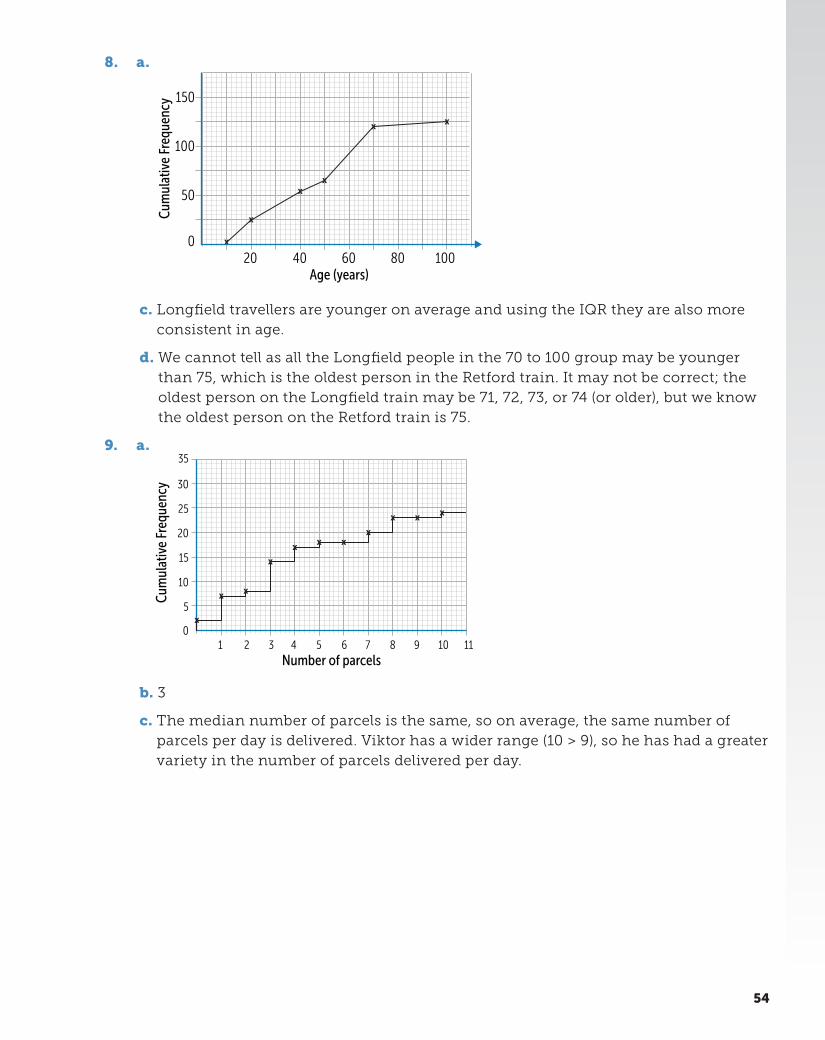
8. a.
020 40 60 80 100
50
100
150
Cum
ulat
ive
Freq
uenc
y
Age (years)
c. Longfield travellers are younger on average and using the IQR they are also more consistent in age.
d. We cannot tell as all the Longfield people in the 70 to 100 group may be younger than 75, which is the oldest person in the Retford train. It may not be correct; the oldest person on the Longfield train may be 71, 72, 73, or 74 (or older), but we know the oldest person on the Retford train is 75.
9. a.
Cum
ulat
ive
Freq
uenc
y
Number of parcels
01 2 3 4 5 6 7 8 9 10 11
5
10
15
20
25
30
35
b. 3
c. The median number of parcels is the same, so on average, the same number of parcels per day is delivered. Viktor has a wider range (10 > 9), so he has had a greater variety in the number of parcels delivered per day.
54

EXERCISE 3
1. a. False
b. False
c. True
d. False
e. True
2. a.
Cum
ulat
ive
Freq
uenc
y
Time (minutes)
010 15 20 25 30 35 40 45 50
20
40
60
80
100
120
140
160
180
200
b. 6
c. 2
3. a.
Cum
ulat
ive
Freq
uenc
y
Time (minutes)
05 10 15 20 25 30 35 40 45 50 60 6555
5
10
15
20
25
30
35
b. 4 or 5 c. 30
d. probably incorrect as 35 mins has just gone past 27
4. A = P; B = S; C = R; D = Q
55
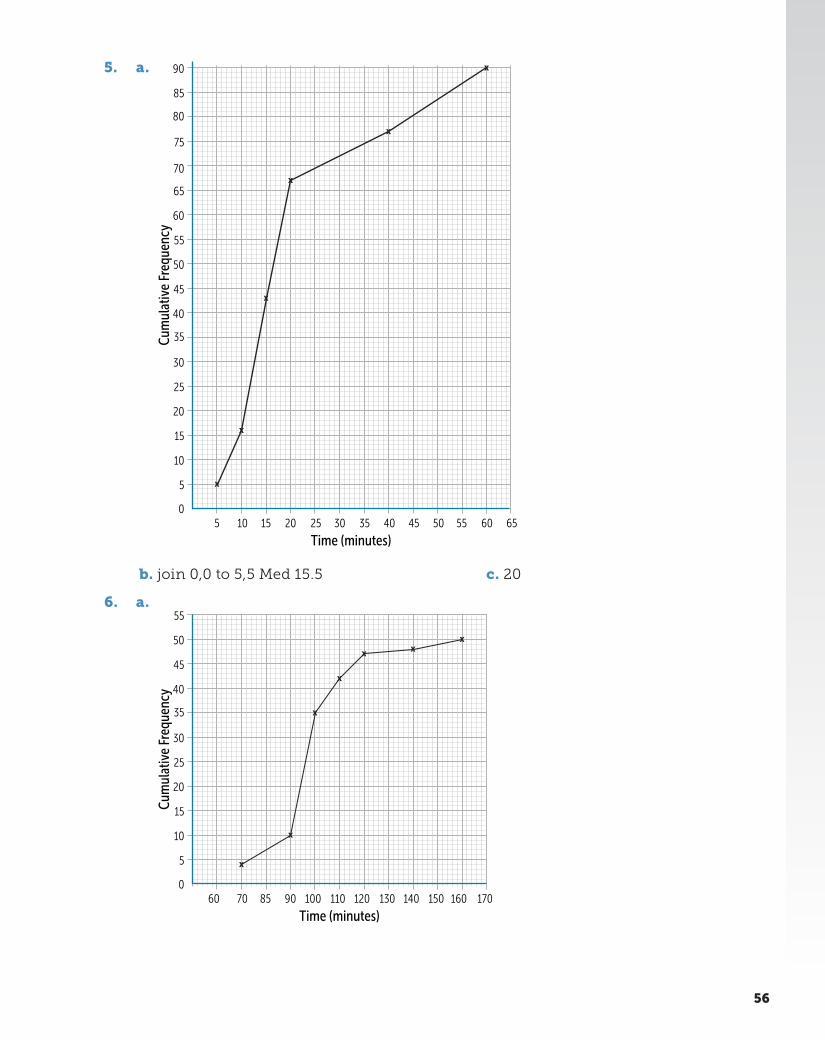
5. a.
Cum
ulat
ive
Freq
uenc
y
Time (minutes)
05 10 15 20 25 30 35 40 45 50 60 6555
5
10
15
20
25
30
35
40
45
50
55
60
65
70
75
80
85
90
b. join 0,0 to 5,5 Med 15.5 c. 20
6. a.
Cum
ulat
ive
Freq
uenc
y
Time (minutes)
060 70 85 90 100 110 120 130 140 150 170160
5
10
15
20
25
30
35
40
45
50
55
56

b. 10
c.
110 115 120 125 130 135 140 145 150 15560 65 70 75 80 85 90 95 100 105 160
7. a.
Cum
ulat
ive
Freq
uenc
y
Time (minutes)
02 4 6 8 10 12 14 16
5
10
15
20
25
30
35
40
45
50
55
b. median = 8; IQR = 2
c. Outliers are outside the limits of 8 ± 1.5 × 2, so outside of 5 and 13. Therefore, 1 is an outlier, but 13 is not.
d. D9-D1
8. a. 41.3 mins
b. 52 mins
9. a. 42.7 mins
b. 85% have completed in less than 47.86 minutes, so he is correct, it is slightly more
c. 10.28 mins
57
Exam Practice Answers1.
Cum
ulat
ive
Freq
uenc
y
Height (m)5.2 m
02 4 6 8 10 12
10
20
30
40
50
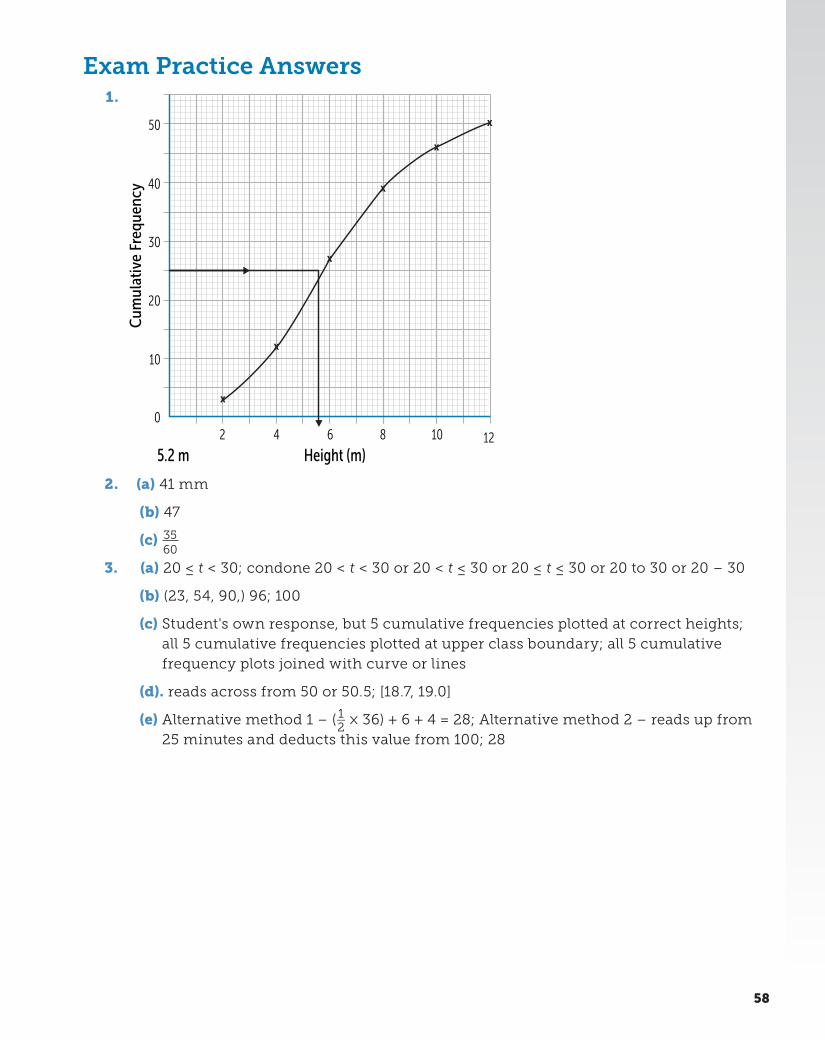
2. (a) 41 mm
(b) 47
(c) 3560
3. (a) 20 ≤ t < 30; condone 20 < t < 30 or 20 < t ≤ 30 or 20 ≤ t ≤ 30 or 20 to 30 or 20 – 30
(b) (23, 54, 90,) 96; 100
(c) Student's own response, but 5 cumulative frequencies plotted at correct heights; all 5 cumulative frequencies plotted at upper class boundary; all 5 cumulative frequency plots joined with curve or lines
(d). reads across from 50 or 50.5; [18.7, 19.0]
(e) Alternative method 1 – ( 1 __ 2
× 36) + 6 + 4 = 28; Alternative method 2 – reads up from 25 minutes and deducts this value from 100; 28
58
4.
Cum
ulat
ive
Freq
uenc
y
Distance from nearest postbox, d (metres)
People Living in Towns
0100 200 300 400 500
10
20
30
40
50
60
70
80
90
100
Cum
ulat
ive
Freq
uenc
y
Distance from nearest postbox, d (metres)
People Living in Towns
0100 200 300 400 500
10
20
30
40
50
60
70
80
90
100
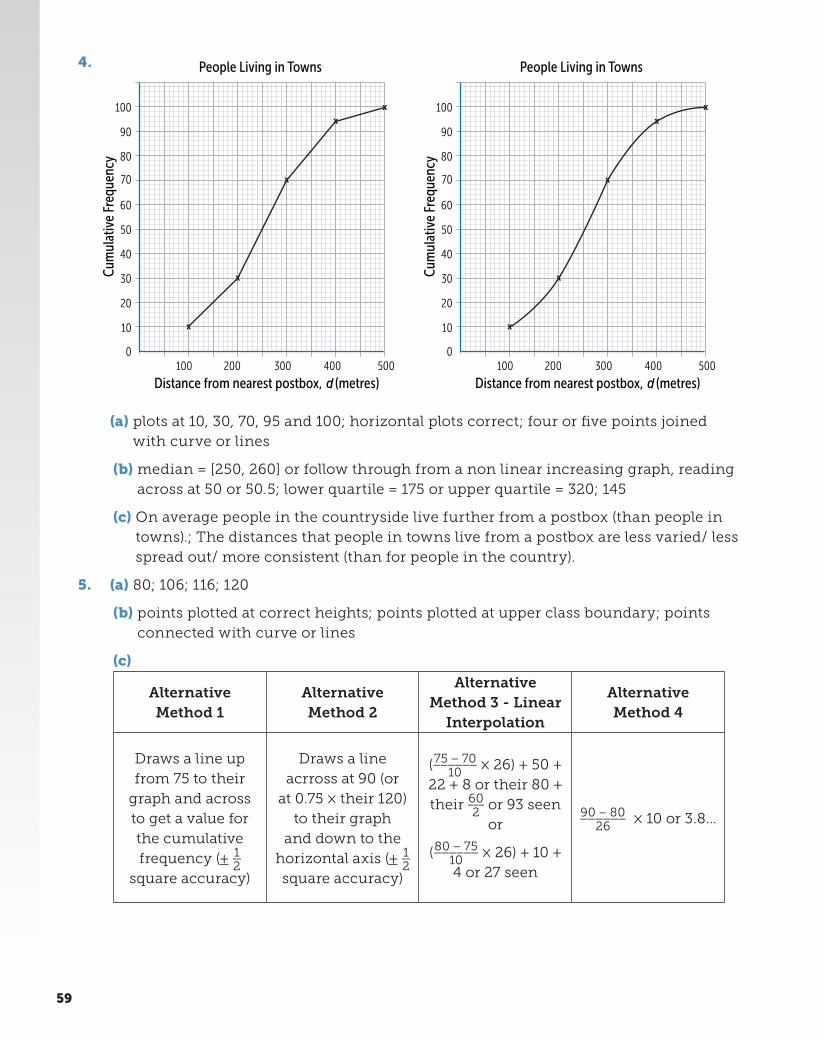
(a) plots at 10, 30, 70, 95 and 100; horizontal plots correct; four or five points joined with curve or lines
(b) median = [250, 260] or follow through from a non linear increasing graph, reading across at 50 or 50.5; lower quartile = 175 or upper quartile = 320; 145
(c) On average people in the countryside live further from a postbox (than people in towns).; The distances that people in towns live from a postbox are less varied/ less spread out/ more consistent (than for people in the country).
5. (a) 80; 106; 116; 120
(b) points plotted at correct heights; points plotted at upper class boundary; points connected with curve or lines
(c)
Alternative Method 1
Alternative Method 2
Alternative Method 3 - Linear
Interpolation
Alternative Method 4
Draws a line up from 75 to their
graph and across to get a value for the cumulative frequency (+ 1 __
2
square accuracy)
Draws a line acrross at 90 (or
at 0.75 × their 120) to their graph
and down to the horizontal axis (+ 1 __
2
square accuracy)
( 75 − 70 ______ 10
× 26) + 50 + 22 + 8 or their 80 + their 60 ___
2 or 93 seen
or
( 80 − 75 ______ 10
× 26) + 10 + 4 or 27 seen
90 − 80 ______ 26
× 10 or 3.8...
59
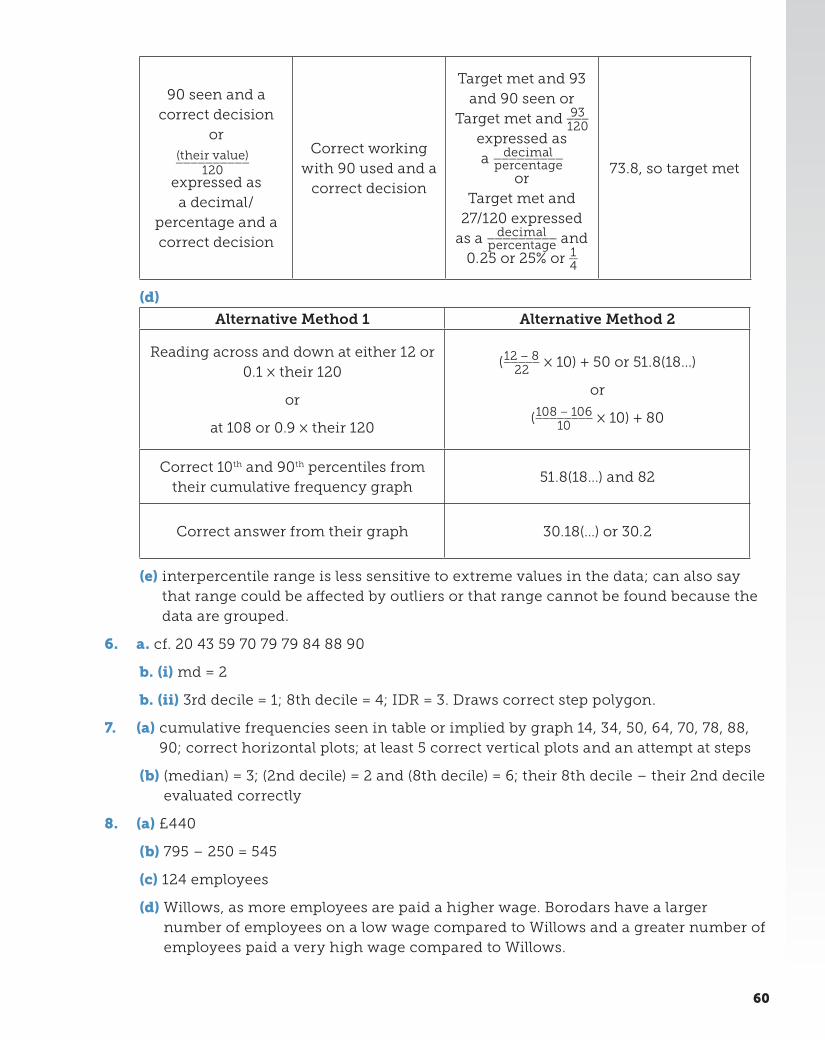
90 seen and a correct decision
or
(their value) __________ 120
expressed as
a decimal/percentage and a correct decision
Correct working with 90 used and a
correct decision
Target met and 93 and 90 seen or
Target met and 93 ___ 120
expressed as a decimal _________ percentage
or Target met and
27/120 expressed as a decimal _________ percentage and
0.25 or 25% or 1 __ 4
73.8, so target met
(d)
Alternative Method 1 Alternative Method 2
Reading across and down at either 12 or 0.1 × their 120
or
at 108 or 0.9 × their 120
( 12 − 8 _____ 22
× 10) + 50 or 51.8(18...)
or
( 108 − 106 ________ 10
× 10) + 80
Correct 10th and 90th percentiles from their cumulative frequency graph
51.8(18...) and 82
Correct answer from their graph 30.18(...) or 30.2
(e) interpercentile range is less sensitive to extreme values in the data; can also say that range could be affected by outliers or that range cannot be found because the data are grouped.
6. a. cf. 20 43 59 70 79 79 84 88 90
b. (i) md = 2
b. (ii) 3rd decile = 1; 8th decile = 4; IDR = 3. Draws correct step polygon.
7. (a) cumulative frequencies seen in table or implied by graph 14, 34, 50, 64, 70, 78, 88, 90; correct horizontal plots; at least 5 correct vertical plots and an attempt at steps
(b) (median) = 3; (2nd decile) = 2 and (8th decile) = 6; their 8th decile – their 2nd decile evaluated correctly
8. (a) £440
(b) 795 – 250 = 545
(c) 124 employees
(d) Willows, as more employees are paid a higher wage. Borodars have a larger number of employees on a low wage compared to Willows and a greater number of employees paid a very high wage compared to Willows.
60
Exercise Answers: Chapter 9 - Probability 2
EXERCISE 1
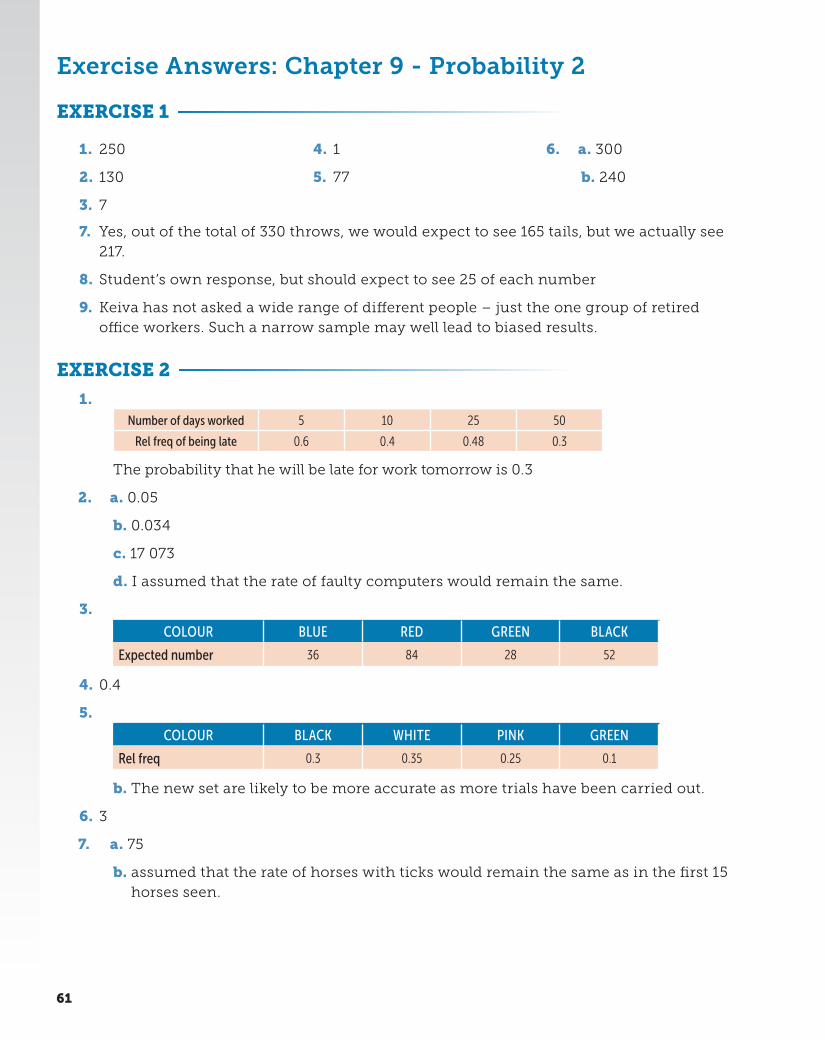
1. 250
2. 130
3. 7
4. 1
5. 77
6. a. 300
b. 240
7. Yes, out of the total of 330 throws, we would expect to see 165 tails, but we actually see 217.
8. Student’s own response, but should expect to see 25 of each number
9. Keiva has not asked a wide range of different people – just the one group of retired office workers. Such a narrow sample may well lead to biased results.
EXERCISE 2
1. Number of days worked 5 10 25 50
Rel freq of being late 0.6 0.4 0.48 0.3
The probability that he will be late for work tomorrow is 0.3
2. a. 0.05
b. 0.034
c. 17 073
d. I assumed that the rate of faulty computers would remain the same.
3.
COLOUR BLUE RED GREEN BLACK
Expected number 36 84 28 52
4. 0.4
5.
COLOUR BLACK WHITE PINK GREEN
Rel freq 0.3 0.35 0.25 0.1
b. The new set are likely to be more accurate as more trials have been carried out.
6. 3
7. a. 75
b. assumed that the rate of horses with ticks would remain the same as in the first 15 horses seen.
61

EXERCISE 3
1. a. 0.25
b. 0.11
c. 0.73
2. a. 29 __ 75
b. 23 __ 75
c. 21 __ 75
3. a. 0.049
b. 0.105
c. 0.095
d. 0.421
4. a. 904
b. 11
c. 0.073
d. 0.114
e. 55 ___ 194
f. 281 ___ 380
EXERCISE 4
1. a. 24
b. 9
c. 0.3375
d. 0.7
e. 0.6125
2.
Owns a dog Owns a cat
237 158
101
204
3. a. Amazon Music Spotify
3 4
2
6
b. 6 __ 15
c. 7
d. 8 __ 15
4. a. 59
b. 18
c. 29
d. 0.55
e. 0.18
62
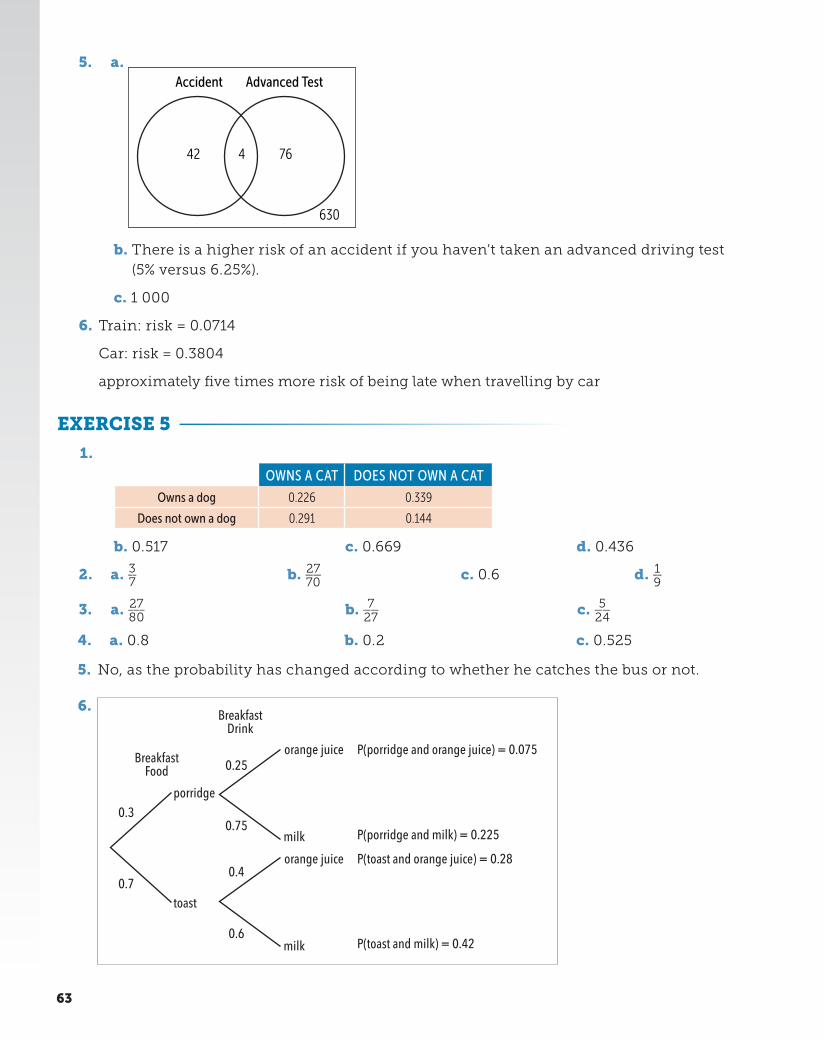
5. a. Accident Advanced Test
42 4
630
76
b. There is a higher risk of an accident if you haven’t taken an advanced driving test (5% versus 6.25%).
c. 1 000
6. Train: risk = 0.0714
Car: risk = 0.3804
approximately five times more risk of being late when travelling by car
EXERCISE 5
1.
OWNS A CAT DOES NOT OWN A CAT
Owns a dog 0.226 0.339
Does not own a dog 0.291 0.144
b. 0.517 c. 0.669 d. 0.436
2. a. 3 __ 7 b. 27 __ 70
c. 0.6 d. 1 __ 9
3. a. 27 ___ 80
b. 7 __ 27
c. 5 __ 24
4. a. 0.8 b. 0.2 c. 0.525
5. No, as the probability has changed according to whether he catches the bus or not.
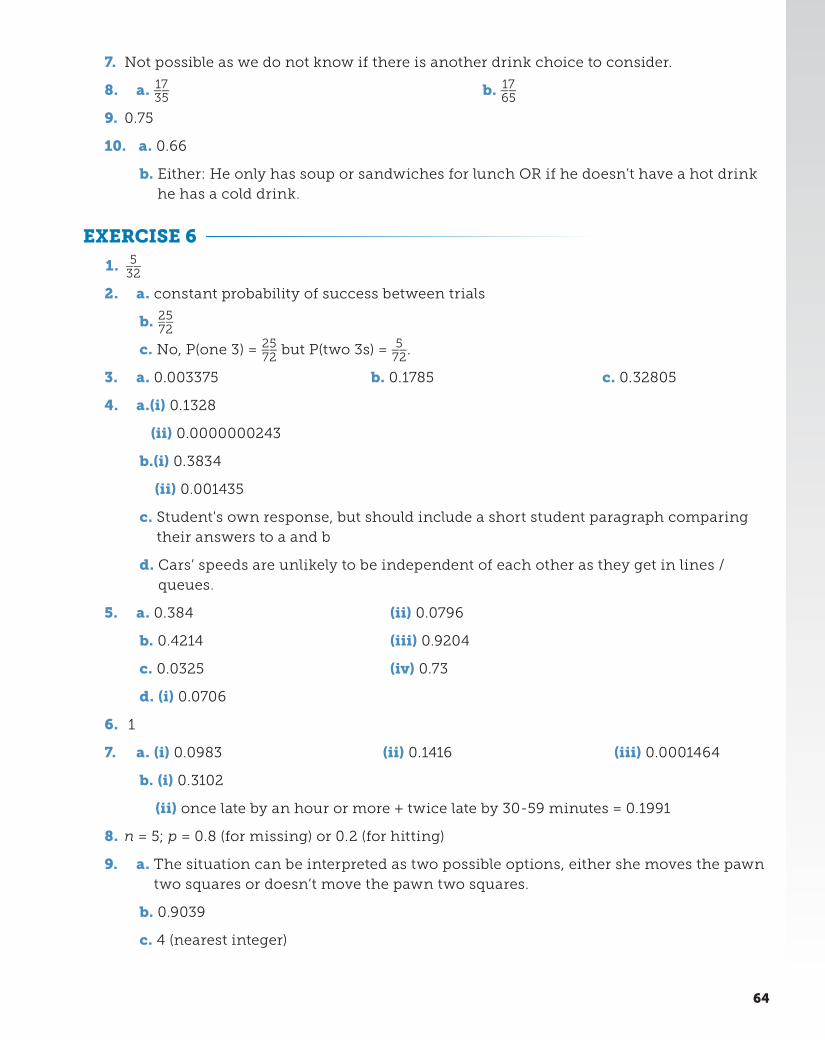
6.
porridge
orange juice P(porridge and orange juice) = 0.075
P(porridge and milk) = 0.225
P(toast and orange juice) = 0.28
P(toast and milk) = 0.42
orange juice
toast
milk
milk
0.3
0.25
0.4
0.75
0.6
0.7
Breakfast Food
Breakfast Drink
63
7. Not possible as we do not know if there is another drink choice to consider.
8. a. 17 __ 35 b. 17 __ 65
9. 0.75
10. a. 0.66
b. Either: He only has soup or sandwiches for lunch OR if he doesn’t have a hot drink he has a cold drink.
EXERCISE 6
1. 5 __ 32
2. a. constant probability of success between trials
b. 25 __ 72
c. No, P(one 3) = 25 __ 72
but P(two 3s) = 5 __ 72
.
3. a. 0.003375 b. 0.1785 c. 0.32805
4. a.(i) 0.1328
(ii) 0.0000000243
b.(i) 0.3834
(ii) 0.001435
c. Student's own response, but should include a short student paragraph comparing their answers to a and b
d. Cars’ speeds are unlikely to be independent of each other as they get in lines / queues.
5. a. 0.384
b. 0.4214
c. 0.0325
d. (i) 0.0706
(ii) 0.0796
(iii) 0.9204
(iv) 0.73
6. 1
7. a. (i) 0.0983 (ii) 0.1416 (iii) 0.0001464
b. (i) 0.3102
(ii) once late by an hour or more + twice late by 30-59 minutes = 0.1991
8. n = 5; p = 0.8 (for missing) or 0.2 (for hitting)
9. a. The situation can be interpreted as two possible options, either she moves the pawn two squares or doesn’t move the pawn two squares.
b. 0.9039
c. 4 (nearest integer)
64

10. a. The first marble taken out is not replaced
b. to ensure thorough mixing between marked and unmarked marbles
c. 71
11. Rod estimates 200 in his lake, Anita estimates 150 in hers. So, Rod’s.
12. Catch a random sample of butterflies and mark them with a small harmless spot or similar. Release them and several days later catch a new sample. Calculate an estimate from this sample.
Exam Practice Answers1. (a) (i) 2088
4000 or 261
500 or 0.52(2) or 52(.2)%
(ii) 7024000 or 351
2000 or 0.1755 or 0.176 or 17.55% or 17.6%
(b)
Alternative Method 1 Alternative Method 2
468 ____ 2350
or 0.199(...) or 0.2(0)
or
446 ____ 1650
or 0.27(03...)
468 ____ 2350
( × 1650)
or
446 ____ 1650
( × 2350)
Answer: No
and
0.199(...) or 0.2(0)
and
0.27(03...)
Answer: No
and
[328.35, 330] or [634.5, 635.212]
2. (a) (the number of) train journeys that took more than 100 minutes
(b) 32 (+) 25 = 57
(c) 15 __ 47 or 0.31(…) or 0.32 or 31.9(…)% or 32%
3. 40 ÷ 5 = 8
4. (a) 70 total Angus; 85 total Ayrshire; all 8 remaining values correct
ANGUS HEREFORD AYRSHIRE TOTAL
Tested 28 50 34 112
Not Tested 42 75 51 168
Total 70 125 85 280
(b) (i) their 75280
(ii) their 70 + 125 or 280 – their 85 or 195; 195280
65
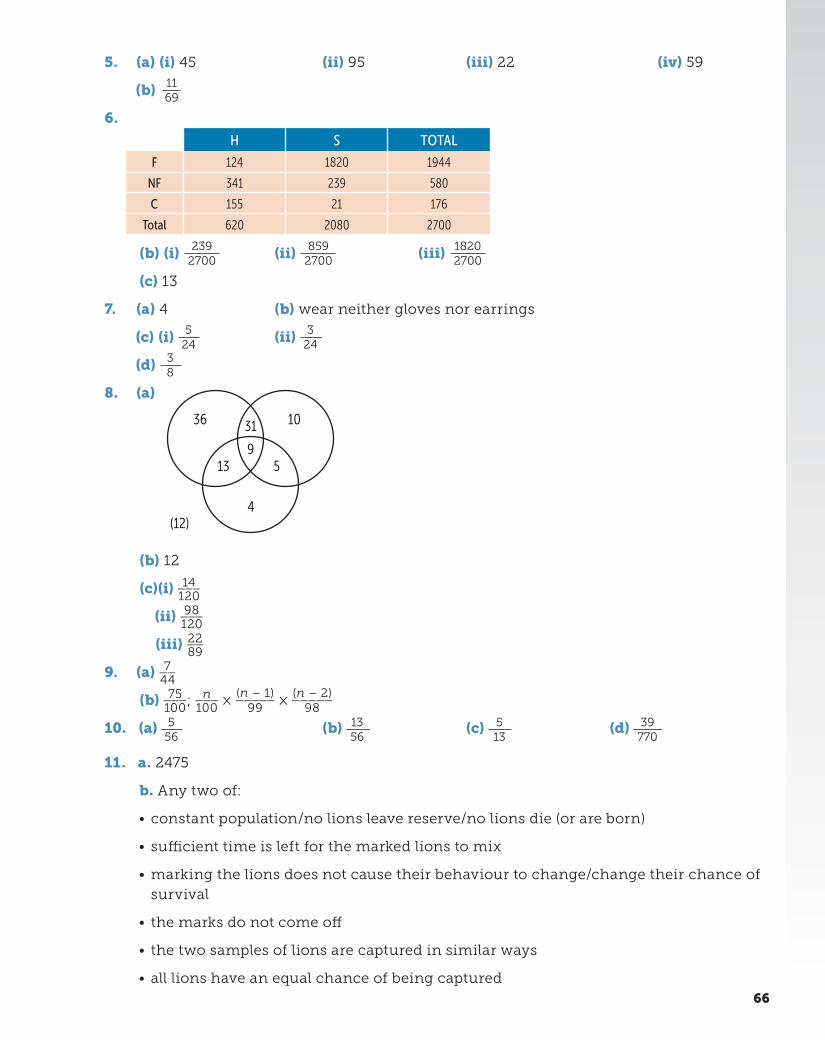
5. (a) (i) 45 (ii) 95 (iii) 22 (iv) 59
(b) 1169
6.
H S TOTAL
F 124 1820 1944
NF 341 239 580
C 155 21 176
Total 620 2080 2700
(b) (i) 2392700
(ii) 8592700 (iii) 1820
2700
(c) 13
7. (a) 4 (b) wear neither gloves nor earrings
(c) (i) 524
(ii) 324
(d) 3
8
8. (a)
36 10
13
(12)
5
31
4
9
(b) 12
(c)(i) 14 ___ 120
(ii) 98 ___ 120
(iii) 22 __ 89
9. (a) 7 __ 44
(b) 75 ___ 100
; n ___ 100
× (n – 1) _____
99 × (n – 2)
_____ 98
10. (a) 5
56 (b)
1356
(c) 513
(d) 39
770
11. a. 2475
b. Any two of:
• constant population/no lions leave reserve/no lions die (or are born)
• sufficient time is left for the marked lions to mix
• marking the lions does not cause their behaviour to change/change their chance of survival
• the marks do not come off
• the two samples of lions are captured in similar ways
• all lions have an equal chance of being captured 66
Exercise Answers: Chapter 10 - Charts and Diagrams 3
EXERCISE 1
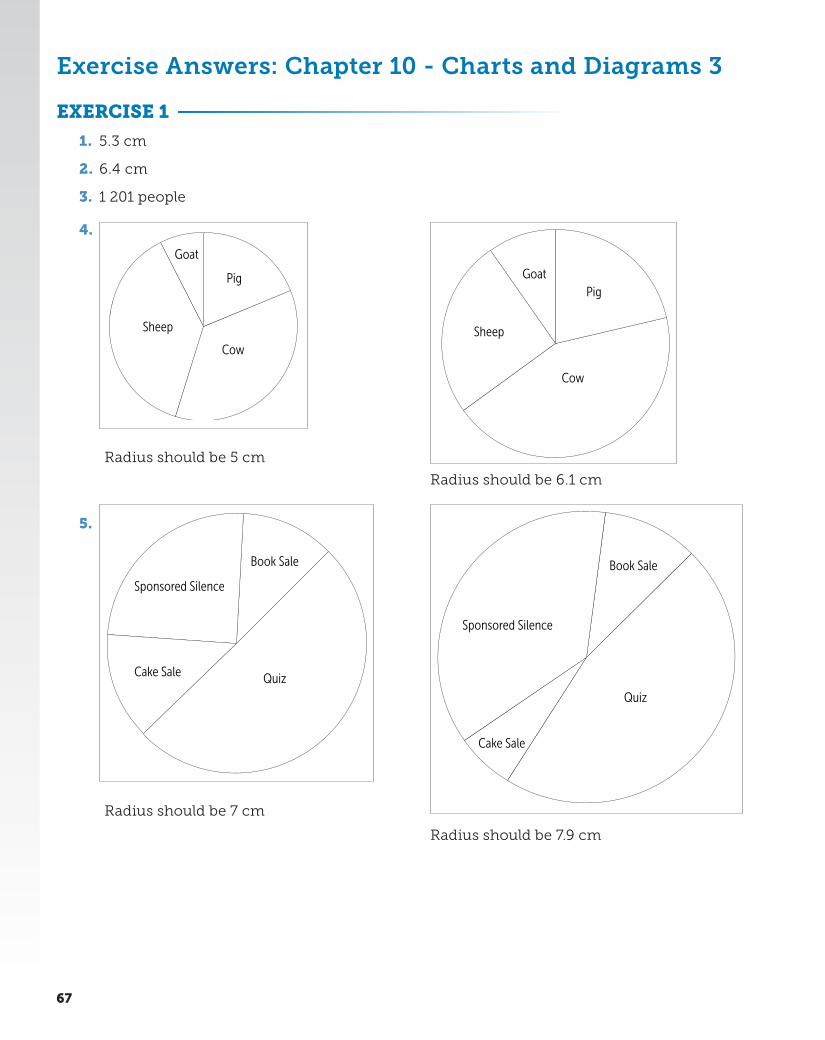
1. 5.3 cm
2. 6.4 cm
3. 1 201 people
4.
Pig
Cow
Goat
Sheep
Radius should be 5 cm
Pig
Cow
Goat
Sheep
Radius should be 6.1 cm
5.
Sponsored Silence
Book Sale
QuizCake Sale
Radius should be 7 cm
Sponsored Silence
Book Sale
Quiz
Cake Sale
Radius should be 7.9 cm
67
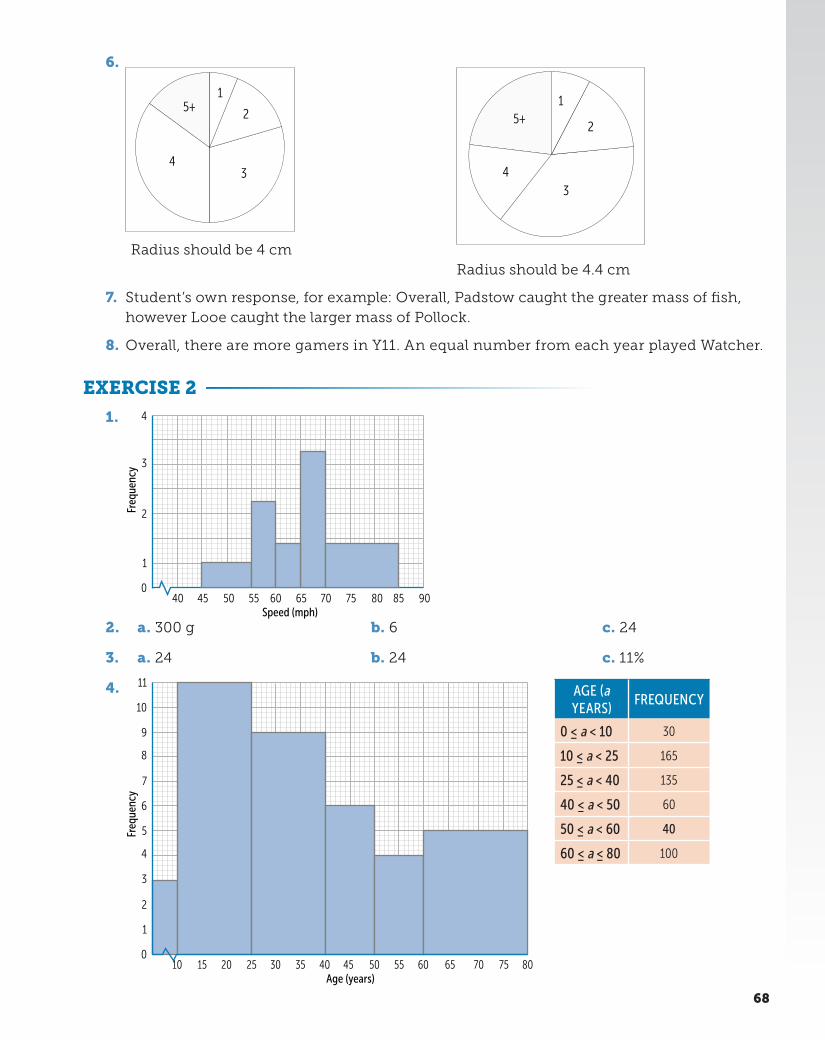
6.
34
5+ 1
2
Radius should be 4 cm
3
4
5+ 1
2
Radius should be 4.4 cm
7. Student’s own response, for example: Overall, Padstow caught the greater mass of fish, however Looe caught the larger mass of Pollock.
8. Overall, there are more gamers in Y11. An equal number from each year played Watcher.
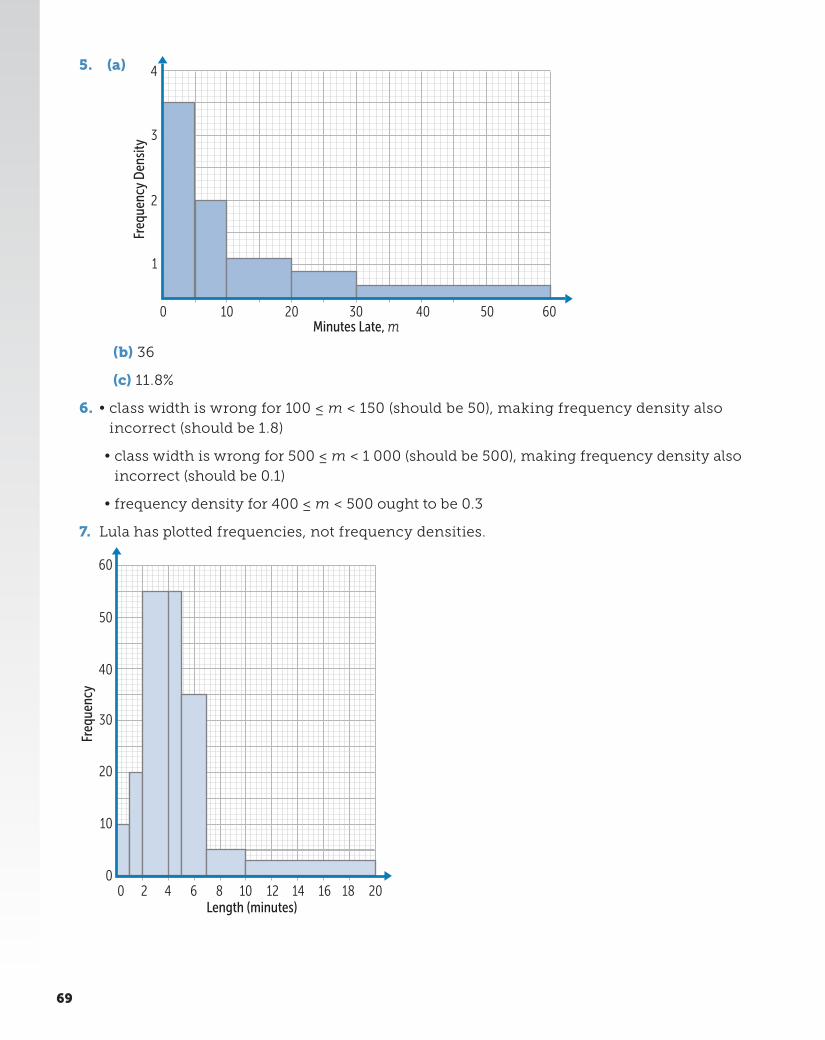
EXERCISE 2
1.
Freq
uenc
y
Speed (mph)
1
2
3
040 45 50 55 60 65 70 75 80 9085
4
2. a. 300 g b. 6 c. 24
4.
Freq
uenc
y
Age (years)
1
3
2
5
4
010 15 20 25 30 35 40 45 50 55 60 65 70 75 80
7
6
9
8
11
10
AGE (a YEARS)
FREQUENCY
0 ≤ a < 10 30
10 ≤ a < 25 165
25 ≤ a < 40 135
40 ≤ a < 50 60
50 ≤ a < 60 40
60 ≤ a ≤ 80 100
3. a. 24 b. 24 c. 11%
68
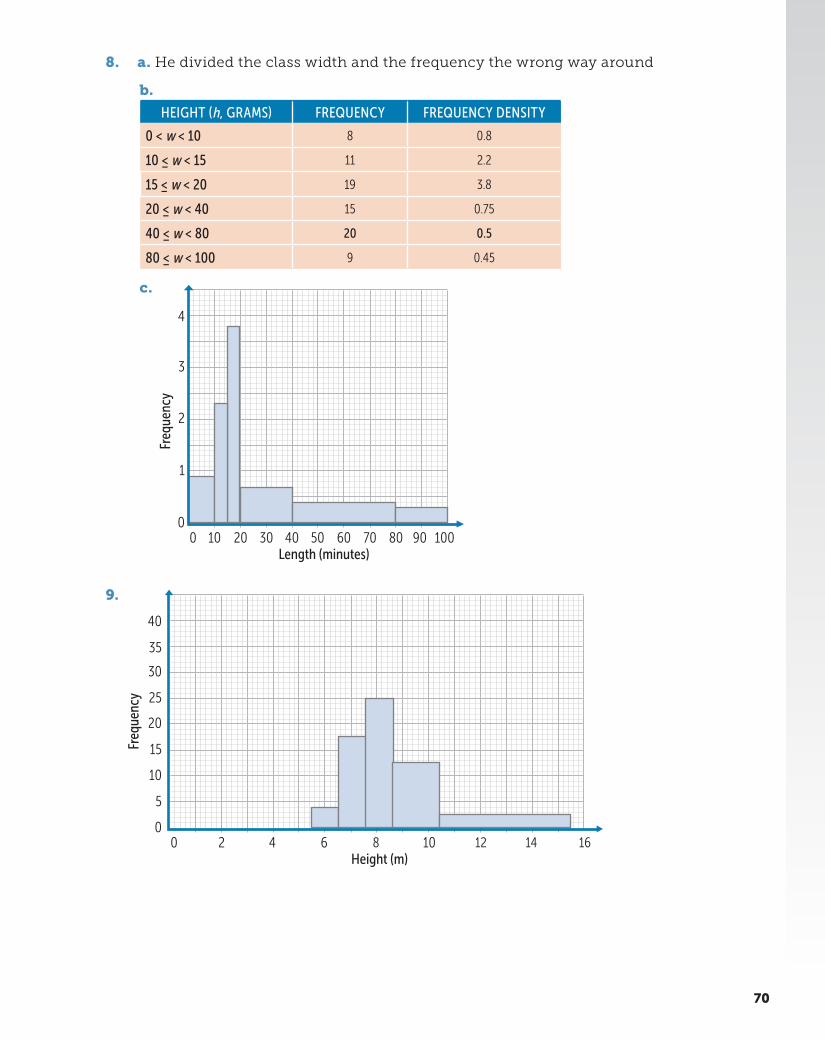
5. (a)
Freq
uenc
y D
ensi
ty
Minutes Late, m0
4
3
2
1
10 20 30 40 50 60
(b) 36
(c) 11.8%
6. • class width is wrong for 100 ≤ m < 150 (should be 50), making frequency density also incorrect (should be 1.8)
• class width is wrong for 500 ≤ m < 1 000 (should be 500), making frequency density also incorrect (should be 0.1)
• frequency density for 400 ≤ m < 500 ought to be 0.3
7. Lula has plotted frequencies, not frequency densities.
Freq
uenc
y
Length (minutes)
00 2 4 6 8 10 12 14 16 18 20
10
20
30
40
50
60
69
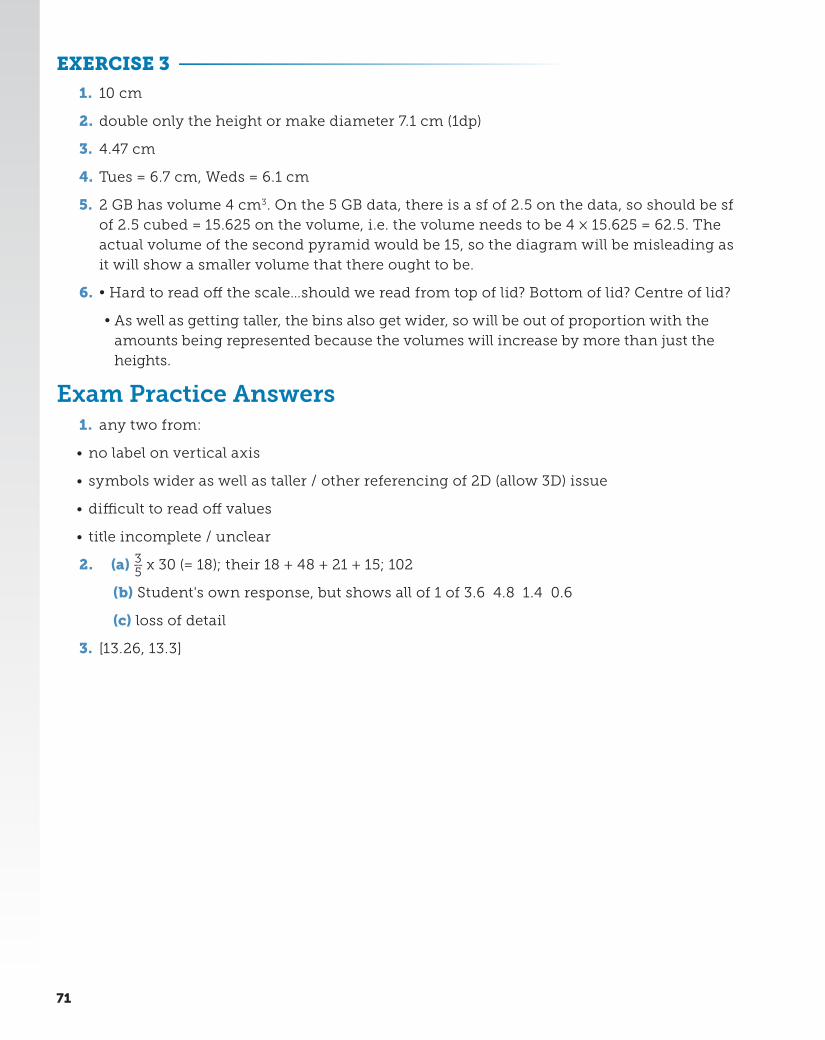
8. a. He divided the class width and the frequency the wrong way around
b.
HEIGHT (h, GRAMS) FREQUENCY FREQUENCY DENSITY
0 < w < 10 8 0.8
10 ≤ w < 15 11 2.2
15 ≤ w < 20 19 3.8
20 ≤ w < 40 15 0.75
40 ≤ w < 80 20 0.5
80 ≤ w < 100 9 0.45
c.
Freq
uenc
y
Length (minutes)
00 10 20 30 40 50 60 70 80 90 100
1
2
3
4
9.
Freq
uenc
y
Height (m)
00 2 4 6 8 10 12 14 16
10
20
30
40
5
15
25
35
70
EXERCISE 3
1. 10 cm
2. double only the height or make diameter 7.1 cm (1dp)
3. 4.47 cm
4. Tues = 6.7 cm, Weds = 6.1 cm
5. 2 GB has volume 4 cm3. On the 5 GB data, there is a sf of 2.5 on the data, so should be sf of 2.5 cubed = 15.625 on the volume, i.e. the volume needs to be 4 × 15.625 = 62.5. The actual volume of the second pyramid would be 15, so the diagram will be misleading as it will show a smaller volume that there ought to be.
6. • Hard to read off the scale…should we read from top of lid? Bottom of lid? Centre of lid?
• As well as getting taller, the bins also get wider, so will be out of proportion with the amounts being represented because the volumes will increase by more than just the heights.
Exam Practice Answers1. any two from:
• no label on vertical axis
• symbols wider as well as taller / other referencing of 2D (allow 3D) issue
• difficult to read off values
• title incomplete / unclear
2. (a) 3 __ 5 x 30 (= 18); their 18 + 48 + 21 + 15; 102
(b) Student's own response, but shows all of 1 of 3.6 4.8 1.4 0.6
(c) loss of detail
3. [13.26, 13.3]
71

4.
Freq
uenc
y D
ensi
ty
Time, t (minutes)
00 10 20 30 40 50 60
2
4
6
8
10
12
14
5. (a) 5625
(b) 100 000
(c) student's own response for example, the castle had more than half of the visitors in April but only one quarter in August. The dinosaur museum went from having one fifth of visitors in April down to only one twelfth in August.
6. (a) James has plotted the frequency not the frequency density
(b)
Fre
quen
cy
mass of penguins, x (kg)
010 20 30 405 15 25 35 45
2
1
4
3
7. Although the lengths of each egg are doubling, the area of the eggs is actually 4 times as big.
72
Exercise Answers: Chapter 11 - Scatter Diagrams, Correlation and Regression
EXERCISE 1
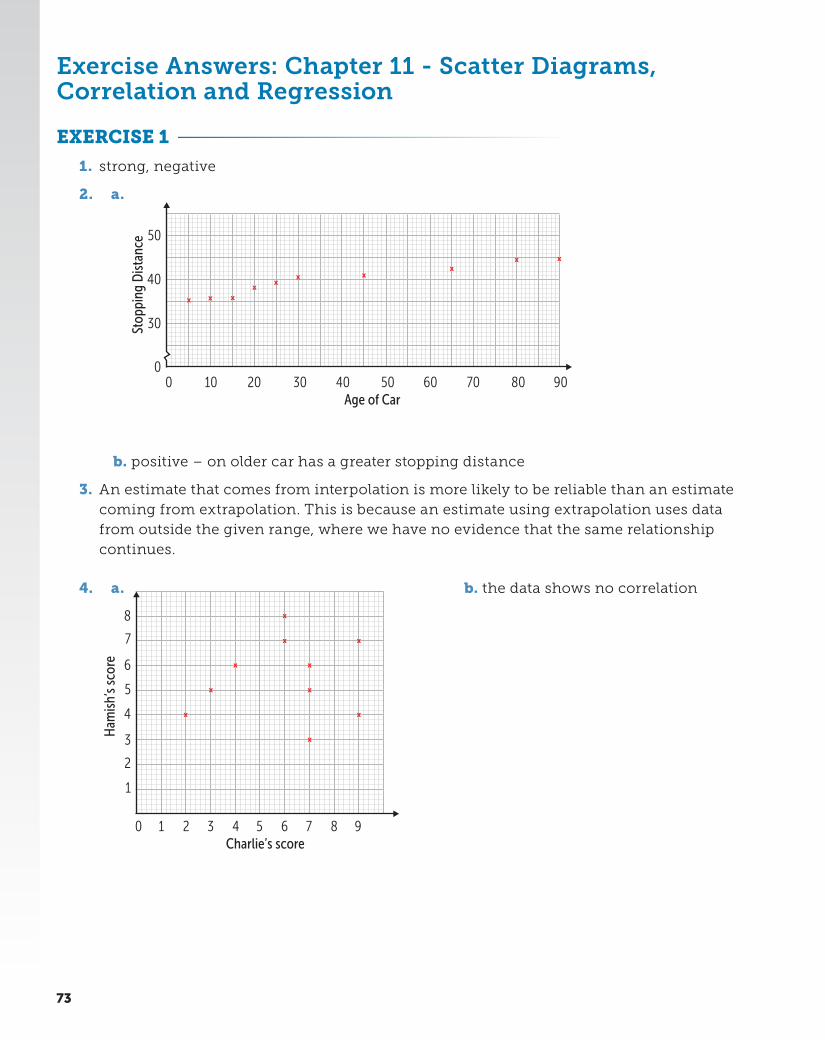
1. strong, negative
2. a.
Age of Car
Stop
ping
Dis
tanc
e
0 100
30
40
50
20 30 40 50 60 70 80 90
b. positive – on older car has a greater stopping distance
3. An estimate that comes from interpolation is more likely to be reliable than an estimate coming from extrapolation. This is because an estimate using extrapolation uses data from outside the given range, where we have no evidence that the same relationship continues.
4. a.
Charlie’s score
Ham
ish’
s sc
ore
0 1
1
2
3
4
5
6
7
8
2 3 4 5 6 7 8 9
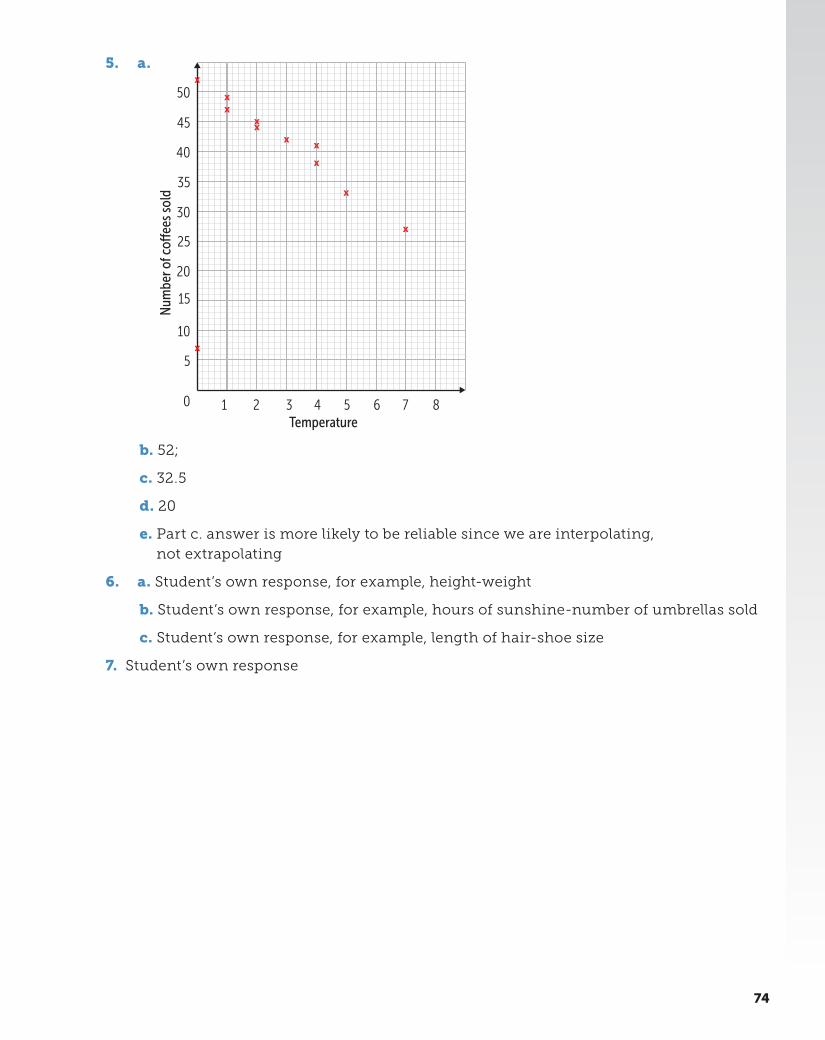
b. the data shows no correlation
73
5. a.
Temperature
Num
ber o
f co�
ees
sold
5
10
15
20
25
30
35
40
45
50
0 1 2 3 4 5 6 7 8
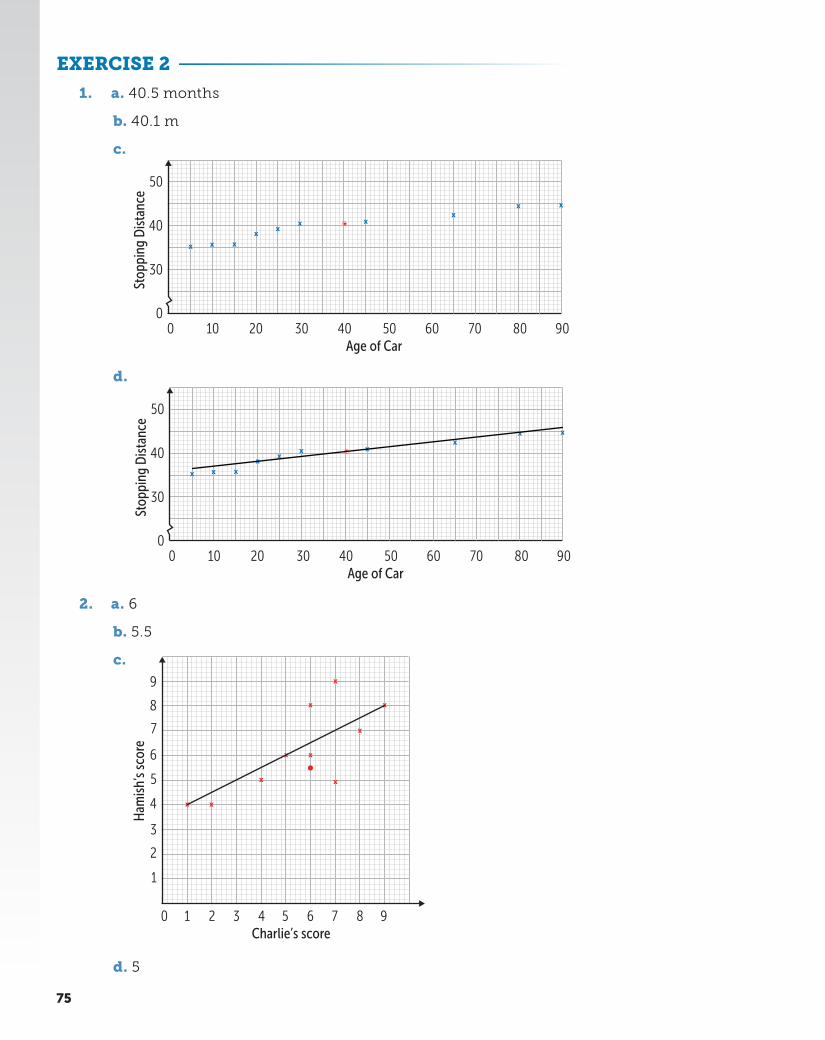
b. 52;
c. 32.5
d. 20
e. Part c. answer is more likely to be reliable since we are interpolating, not extrapolating
6. a. Student’s own response, for example, height-weight
b. Student’s own response, for example, hours of sunshine-number of umbrellas sold
c. Student’s own response, for example, length of hair-shoe size
7. Student’s own response
74
EXERCISE 2
1. a. 40.5 months
b. 40.1 m
c.
Age of Car
Stop
ping
Dis
tanc
e
0 100
30
40
50
20 30 40 50 60 70 80 90
d.
Age of Car
Stop
ping
Dis
tanc
e
0 100
30
40
50
20 30 40 50 60 70 80 90
2. a. 6
b. 5.5
c.
Charlie’s score
Ham
ish’
s sc
ore
0 1
1
2
3
4
5
6
7
8
9
2 3 4 5 6 7 8 9
d. 5
75
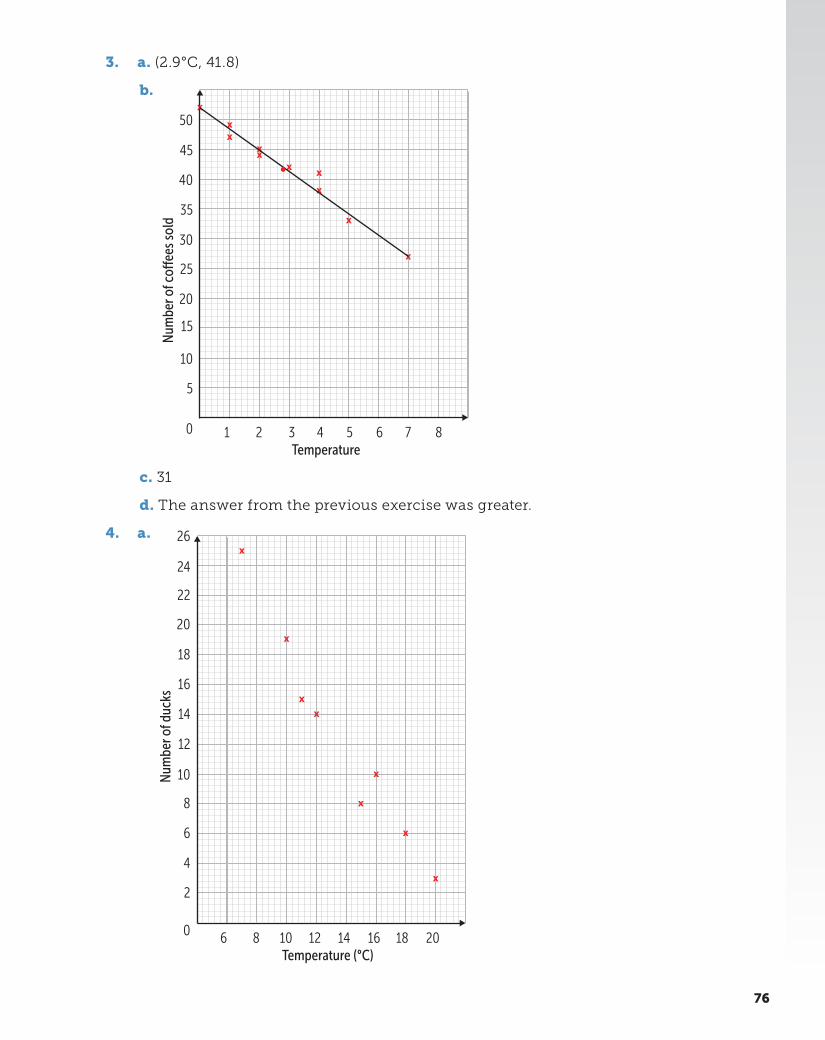
3. a. (2.9°C, 41.8)
b.
Temperature
Num
ber o
f co�
ees
sold
5
10
15
20
25
30
35
40
45
50
0 1 2 3 4 5 6 7 8
c. 31
d. The answer from the previous exercise was greater.
4. a.
Temperature (°C)
Num
ber o
f duc
ks
2
4
6
8
10
12
14
16
18
20
22
24
26
0 6 8 10 12 14 16 18 20
76
5. a.
Temperature
Num
ber o
f cal
lout
s
-4 -3
2
4
6
8
10
12
14
16
-2 -1 0 1 2 3 4 5 6 7 8
b.
Temperature (°C)
Num
ber o
f duc
ks
2
4
6
8
10
12
14
16
18
20
22
24
26
0 6 8 10 12 14 16 18 20
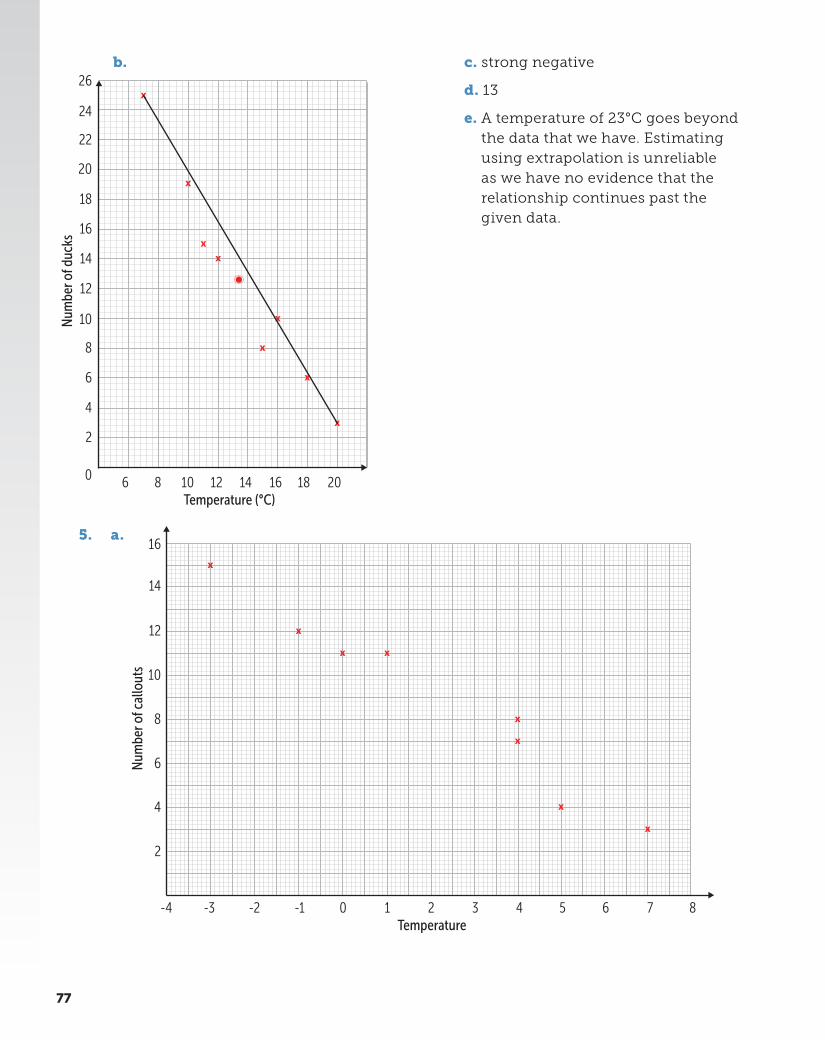
c. strong negative
d. 13
e. A temperature of 23°C goes beyond the data that we have. Estimating using extrapolation is unreliable as we have no evidence that the relationship continues past the given data.
77
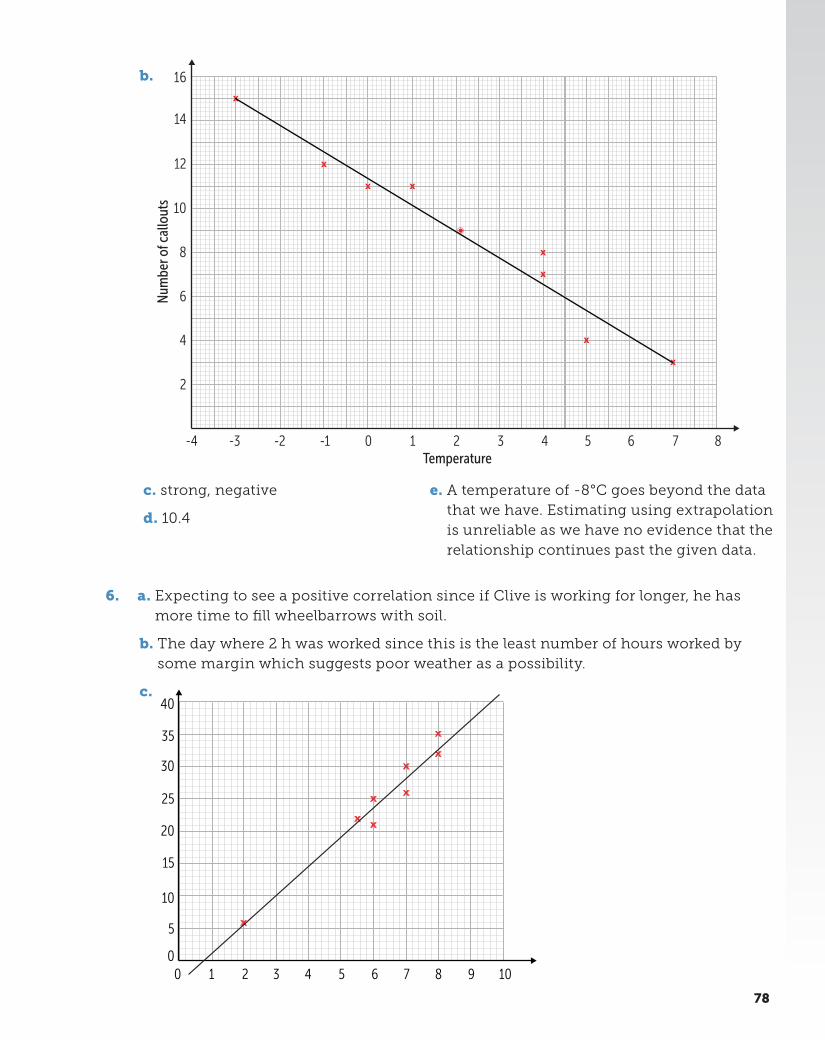
c. strong, negative
d. 10.4
e. A temperature of -8°C goes beyond the data that we have. Estimating using extrapolation is unreliable as we have no evidence that the relationship continues past the given data.
b.
Temperature
Num
ber o
f cal
lout
s
-4 -3
2
4
6
8
10
12
14
16
-2 -1 0 1 2 3 4 5 6 7 8
6. a. Expecting to see a positive correlation since if Clive is working for longer, he has more time to fill wheelbarrows with soil.
b. The day where 2 h was worked since this is the least number of hours worked by some margin which suggests poor weather as a possibility.
c.
0 10
10
5
15
20
25
30
35
40
2 3 4 5 6 7 8 9 10
78
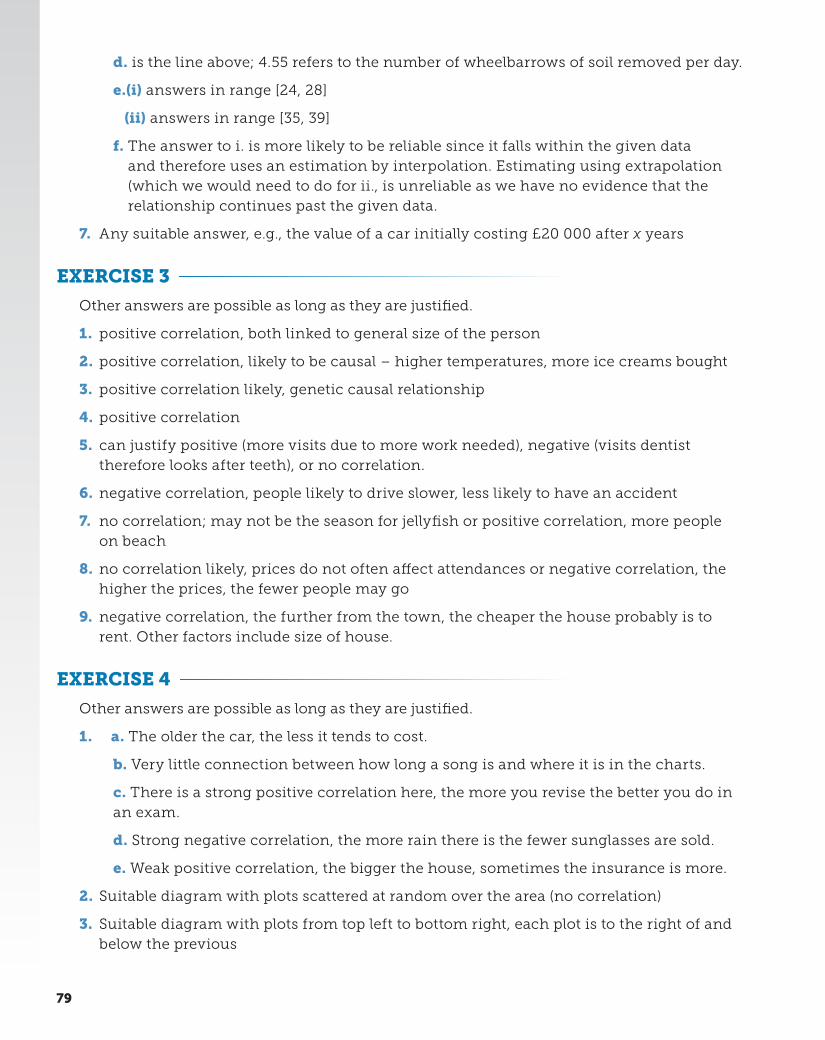
d. is the line above; 4.55 refers to the number of wheelbarrows of soil removed per day.
e.(i) answers in range [24, 28]
(ii) answers in range [35, 39]
f. The answer to i. is more likely to be reliable since it falls within the given data and therefore uses an estimation by interpolation. Estimating using extrapolation (which we would need to do for ii., is unreliable as we have no evidence that the relationship continues past the given data.
7. Any suitable answer, e.g., the value of a car initially costing £20 000 after x years
EXERCISE 3
Other answers are possible as long as they are justified.
1. positive correlation, both linked to general size of the person
2. positive correlation, likely to be causal – higher temperatures, more ice creams bought
3. positive correlation likely, genetic causal relationship
4. positive correlation
5. can justify positive (more visits due to more work needed), negative (visits dentist therefore looks after teeth), or no correlation.
6. negative correlation, people likely to drive slower, less likely to have an accident
7. no correlation; may not be the season for jellyfish or positive correlation, more people on beach
8. no correlation likely, prices do not often affect attendances or negative correlation, the higher the prices, the fewer people may go
9. negative correlation, the further from the town, the cheaper the house probably is to rent. Other factors include size of house.
EXERCISE 4
Other answers are possible as long as they are justified.
1. a. The older the car, the less it tends to cost.
b. Very little connection between how long a song is and where it is in the charts.
c. There is a strong positive correlation here, the more you revise the better you do in an exam.
d. Strong negative correlation, the more rain there is the fewer sunglasses are sold.
e. Weak positive correlation, the bigger the house, sometimes the insurance is more.
2. Suitable diagram with plots scattered at random over the area (no correlation)
3. Suitable diagram with plots from top left to bottom right, each plot is to the right of and below the previous
79
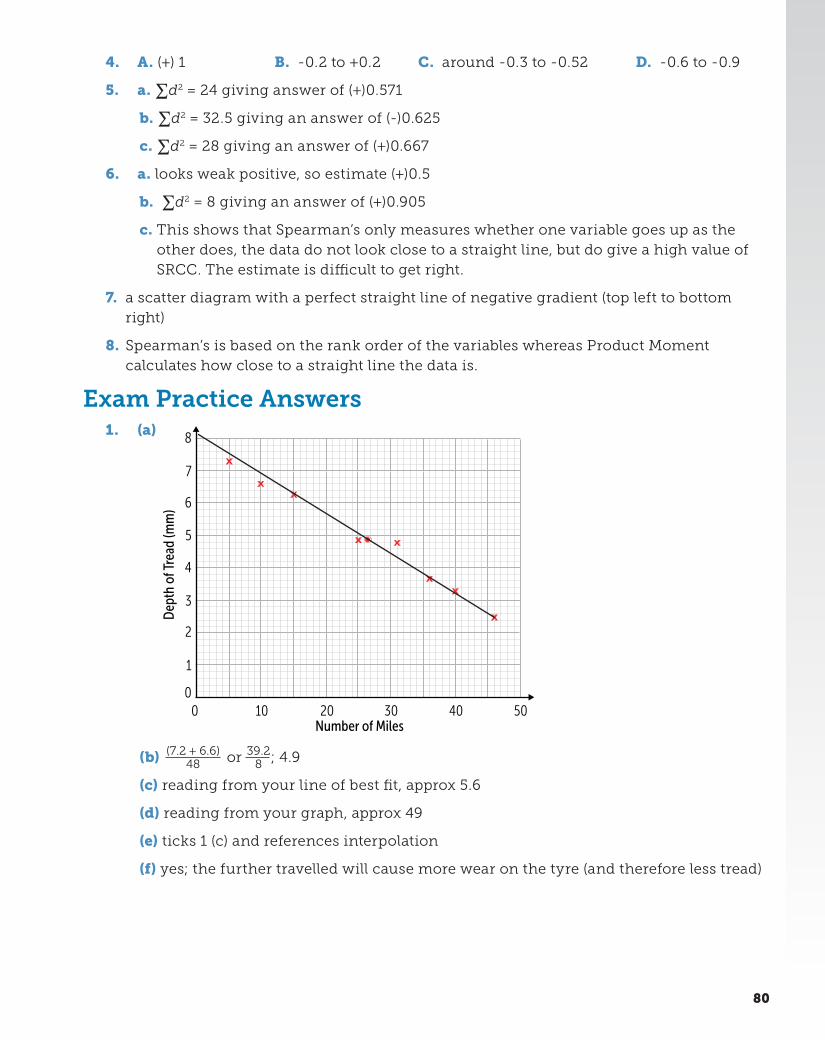
4. A. (+) 1 B. -0.2 to +0.2 C. around -0.3 to -0.52 D. -0.6 to -0.9
5. a. ∑d2 = 24 giving answer of (+)0.571
b. ∑d2 = 32.5 giving an answer of (-)0.625
c. ∑d2 = 28 giving an answer of (+)0.667
6. a. looks weak positive, so estimate (+)0.5
b. ∑d2 = 8 giving an answer of (+)0.905
c. This shows that Spearman’s only measures whether one variable goes up as the other does, the data do not look close to a straight line, but do give a high value of SRCC. The estimate is difficult to get right.
7. a scatter diagram with a perfect straight line of negative gradient (top left to bottom right)
8. Spearman’s is based on the rank order of the variables whereas Product Moment calculates how close to a straight line the data is.
Exam Practice Answers1. (a)
00
2
1
3
Dep
th o
f Tre
ad (m
m)
Number of Miles
4
5
6
7
8
10 20 30 40 50
(b) (7.2 + 6.6)48 or 39.2
8 ; 4.9
(c) reading from your line of best fit, approx 5.6
(d) reading from your graph, approx 49
(e) ticks 1 (c) and references interpolation
(f) yes; the further travelled will cause more wear on the tyre (and therefore less tread)
80
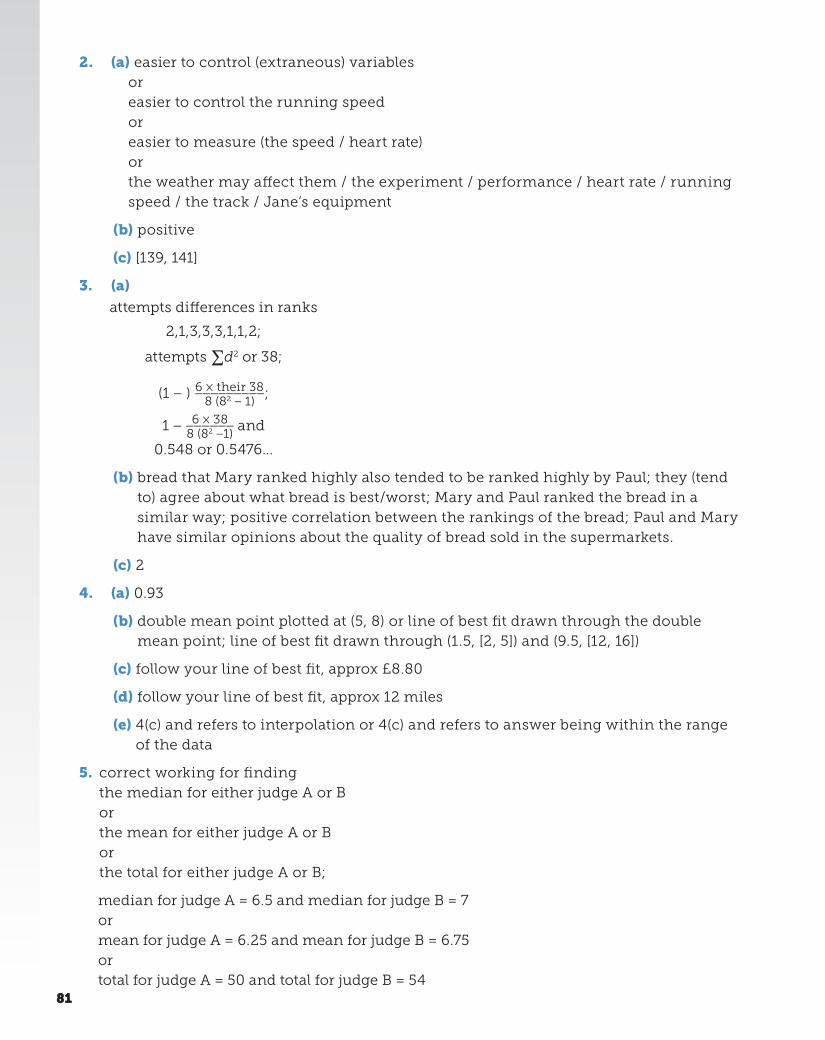
2. (a) easier to control (extraneous) variables or easier to control the running speed or easier to measure (the speed / heart rate) or the weather may affect them / the experiment / performance / heart rate / running speed / the track / Jane’s equipment
(b) positive
(c) [139, 141]
3. (a)
attempts differences in ranks
2,1,3,3,3,1,1,2;
attempts ∑d2 or 38;
(1 − ) 6 × their 38 _________ 8 (82 − 1)
;
1 − 6 × 38 ______ 8 (82 −1)
and
0.548 or 0.5476...
(b) bread that Mary ranked highly also tended to be ranked highly by Paul; they (tend to) agree about what bread is best/worst; Mary and Paul ranked the bread in a similar way; positive correlation between the rankings of the bread; Paul and Mary have similar opinions about the quality of bread sold in the supermarkets.
(c) 2
4. (a) 0.93
(b) double mean point plotted at (5, 8) or line of best fit drawn through the double mean point; line of best fit drawn through (1.5, [2, 5]) and (9.5, [12, 16])
(c) follow your line of best fit, approx £8.80
(d) follow your line of best fit, approx 12 miles
(e) 4(c) and refers to interpolation or 4(c) and refers to answer being within the range of the data
5. correct working for finding the median for either judge A or B or the mean for either judge A or B or the total for either judge A or B;
median for judge A = 6.5 and median for judge B = 7 or mean for judge A = 6.25 and mean for judge B = 6.75 or total for judge A = 50 and total for judge B = 54
81 81

Exercise Answers: Chapter 12 - Standard Deviation, Skew and Normal distribution
EXERCISE 1
Note that calculators offer sample and population standard deviation answers; these are the sample ones.
1. a. 19.9
b. 3.3
c. 2.8
d. 101, 102, 103...
e. 1.9
f. 1.9
g. standard deviation of d., e., & f. are all the same; this is because the spread of each set of numbers is the same
6. (a) more shots on goal, more goals scored
(b) unlikely to be connected
(c) limits for r + 1
2. a. Student’s own response, for example:
CITY TEMPERATURE (°C)
London 6
Manchester 7
Cardiff 9
Edinburgh 7
Glasgow 9
Liverpool 8
Belfast 9
Birmingham 9
York 7
Dublin 6
b. Student’s own response
c. Student’s own response according to their data, e.g., UK = 1.3, capital cities = 13.9
d. The standard deviation for the capital cities is much larger, which means there is more variation in the temperatures across the world than across cities in the UK.
3. On average, Keeley delivers more parcels than Dave. The standard deviation of Dave’s parcels is smaller than of Keeley’s parcels, so the number of parcels each day for Dave is more consistent.
4. Both data sets have the same average value, but the standard deviation of set A is smaller, so the values are more consistent in that data set.
5. 1.7
8282
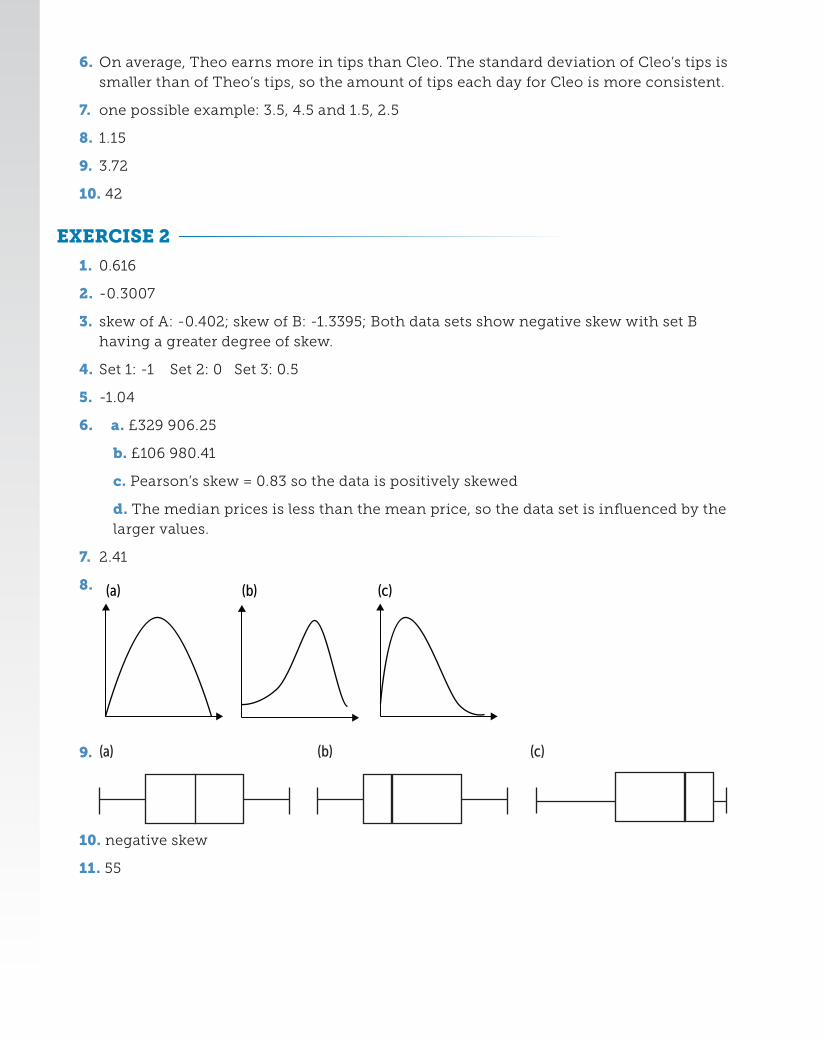
6. On average, Theo earns more in tips than Cleo. The standard deviation of Cleo’s tips is smaller than of Theo’s tips, so the amount of tips each day for Cleo is more consistent.
7. one possible example: 3.5, 4.5 and 1.5, 2.5
8. 1.15
9. 3.72
10. 42
EXERCISE 2
1. 0.616
2. -0.3007
3. skew of A: -0.402; skew of B: -1.3395; Both data sets show negative skew with set B having a greater degree of skew.
4. Set 1: -1 Set 2: 0 Set 3: 0.5
5. -1.04
6. a. £329 906.25
b. £106 980.41
c. Pearson’s skew = 0.83 so the data is positively skewed
d. The median prices is less than the mean price, so the data set is influenced by the larger values.
7. 2.41
8. (a) (b) (c)
9. (a) (b) (c)
10. negative skew
11. 55
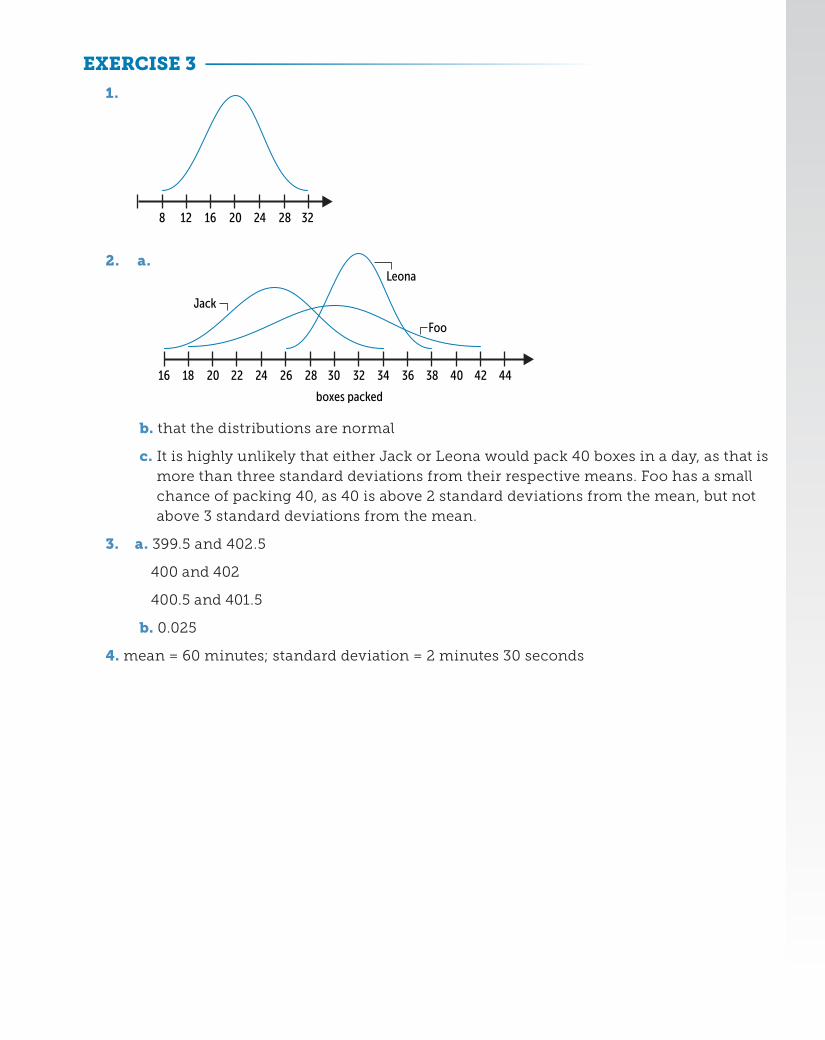
EXERCISE 3
1.
8 12 16 20 24 3228
2. a.
16 18 20 22 24 26 3028 32 34 36 38 40 42 44
boxes packed
Jack
Leona
Foo
b. that the distributions are normal
c. It is highly unlikely that either Jack or Leona would pack 40 boxes in a day, as that is more than three standard deviations from their respective means. Foo has a small chance of packing 40, as 40 is above 2 standard deviations from the mean, but not above 3 standard deviations from the mean.
3. a. 399.5 and 402.5
400 and 402
400.5 and 401.5
b. 0.025
4. mean = 60 minutes; standard deviation = 2 minutes 30 seconds
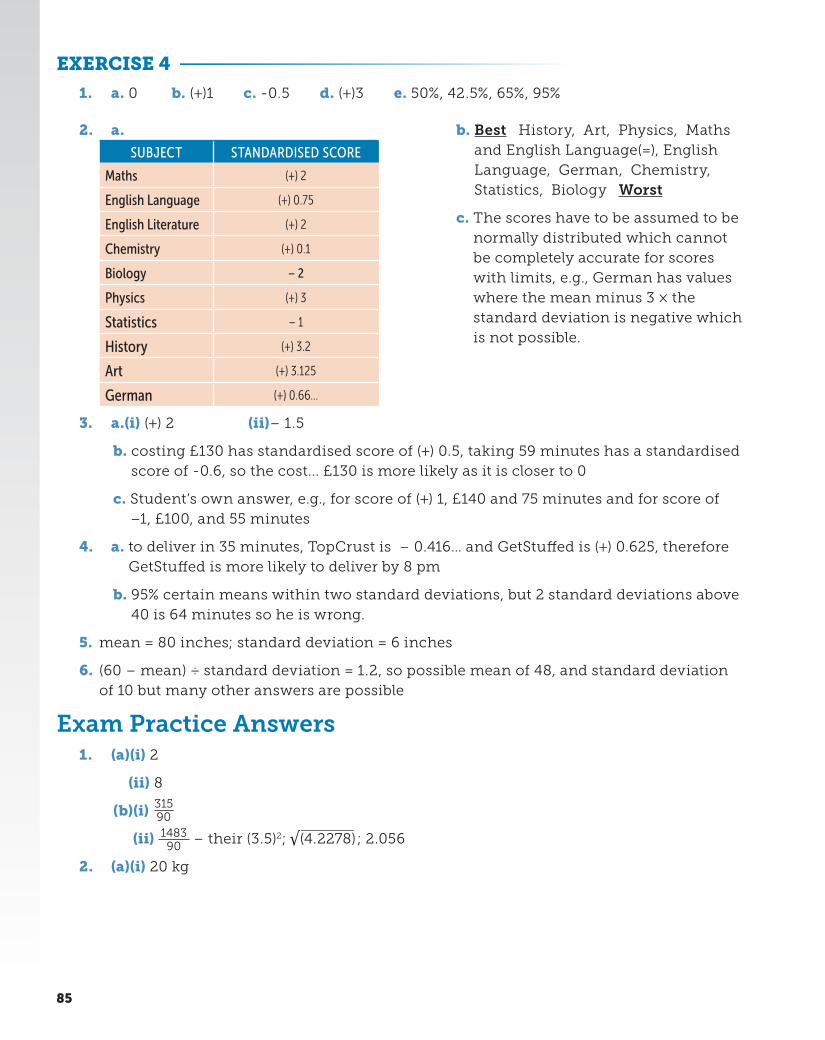
EXERCISE 4
1. a. 0 b. (+)1 c. -0.5 d. (+)3 e. 50%, 42.5%, 65%, 95%
2. a.
SUBJECT STANDARDISED SCORE
Maths (+) 2
English Language (+) 0.75
English Literature (+) 2
Chemistry (+) 0.1
Biology – 2
Physics (+) 3
Statistics – 1
History (+) 3.2
Art (+) 3.125
German (+) 0.66…
b. Best History, Art, Physics, Maths and English Language(=), English Language, German, Chemistry, Statistics, Biology Worst
c. The scores have to be assumed to be normally distributed which cannot be completely accurate for scores with limits, e.g., German has values where the mean minus 3 × the standard deviation is negative which is not possible.
3. a.(i) (+) 2 (ii)– 1.5
b. costing £130 has standardised score of (+) 0.5, taking 59 minutes has a standardised score of -0.6, so the cost... £130 is more likely as it is closer to 0
c. Student’s own answer, e.g., for score of (+) 1, £140 and 75 minutes and for score of –1, £100, and 55 minutes
4. a. to deliver in 35 minutes, TopCrust is – 0.416… and GetStuffed is (+) 0.625, therefore GetStuffed is more likely to deliver by 8 pm
b. 95% certain means within two standard deviations, but 2 standard deviations above 40 is 64 minutes so he is wrong.
5. mean = 80 inches; standard deviation = 6 inches
6. (60 – mean) ÷ standard deviation = 1.2, so possible mean of 48, and standard deviation of 10 but many other answers are possible
Exam Practice Answers1. (a)(i) 2
(ii) 8
(b)(i) 31590
(ii) 148390 – their (3.5)2; √
_ (4.2278) ; 2.056
2. (a)(i) 20 kg
85
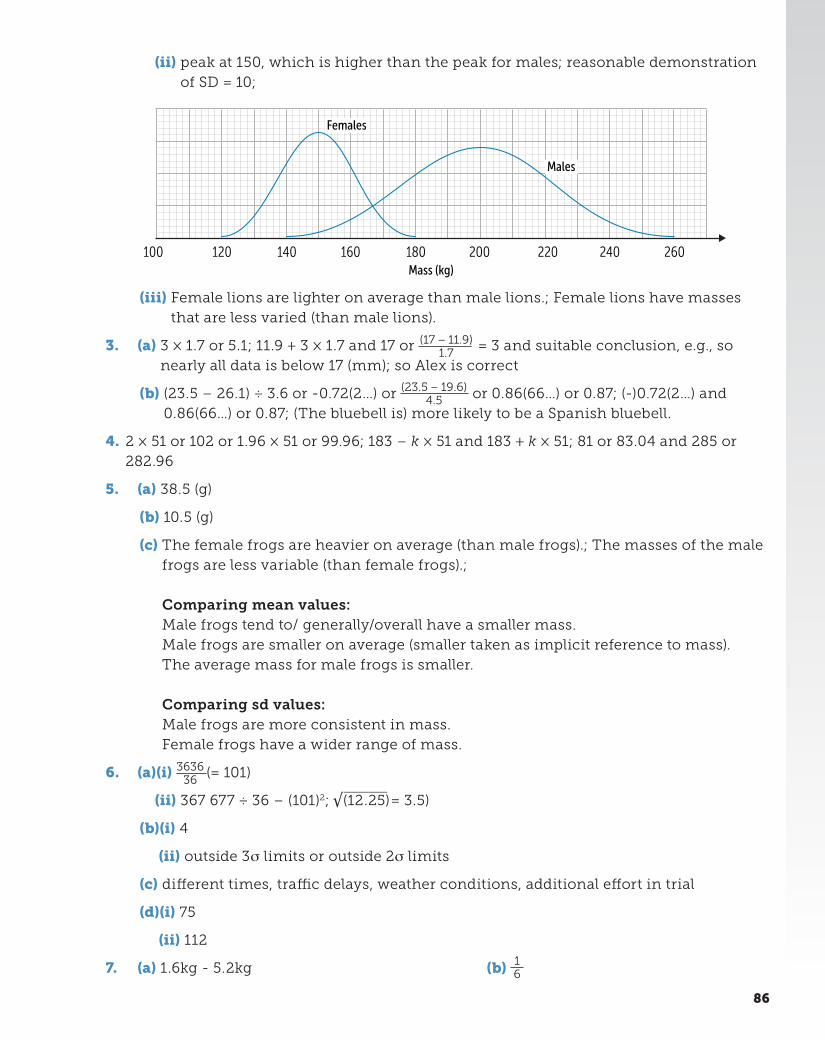
(ii) peak at 150, which is higher than the peak for males; reasonable demonstration of SD = 10;
100 120 140 160 180 200 220 240 260Mass (kg)
Males
Females
(iii) Female lions are lighter on average than male lions.; Female lions have masses that are less varied (than male lions).
3. (a) 3 × 1.7 or 5.1; 11.9 + 3 × 1.7 and 17 or (17 − 11.9)1.7
= 3 and suitable conclusion, e.g., so nearly all data is below 17 (mm); so Alex is correct
(b) (23.5 – 26.1) ÷ 3.6 or -0.72(2…) or (23.5 − 19.6)4.5 or 0.86(66…) or 0.87; (-)0.72(2…) and
0.86(66…) or 0.87; (The bluebell is) more likely to be a Spanish bluebell.
4. 2 × 51 or 102 or 1.96 × 51 or 99.96; 183 – k × 51 and 183 + k × 51; 81 or 83.04 and 285 or 282.96
5. (a) 38.5 (g)
(b) 10.5 (g)
(c) The female frogs are heavier on average (than male frogs).; The masses of the male frogs are less variable (than female frogs).; Comparing mean values: Male frogs tend to/ generally/overall have a smaller mass. Male frogs are smaller on average (smaller taken as implicit reference to mass). The average mass for male frogs is smaller. Comparing sd values: Male frogs are more consistent in mass. Female frogs have a wider range of mass.
6. (a)(i) 363636
(= 101)
(ii) 367 677 ÷ 36 – (101)2; √ _
(12.25) = 3.5)
(b)(i) 4
(ii) outside 3σ limits or outside 2σ limits
(c) different times, traffic delays, weather conditions, additional effort in trial
(d)(i) 75
(ii) 112
7. (a) 1.6kg - 5.2kg (b) 16
86


