Embed Size (px)
Citation preview
IOP PUBLISHING NANOTECHNOLOGY
Nanotechnology 19 (2008) 115703 (9pp) doi:10.1088/0957-4484/19/11/115703
Anomalous high pressure behaviour innanosized rare earth sesquioxidesNita Dilawar1, Deepak Varandani1, Shalini Mehrotra1,Himanshu K Poswal2, Surinder M Sharma2 andAshis K Bandyopadhyay1
1 Pressure & Vacuum Standards, National Physical Laboratory, Dr K S Krishnan Road,New Delhi 110012, India2 High Pressure Physics Division, Bhabha Atomic Research Centre, Trombay,Mumbai 400085, India
Received 26 October 2007, in final form 21 December 2007Published 19 February 2008Online at stacks.iop.org/Nano/19/115703
AbstractWe report Raman spectroscopic studies of the nanosized rare earth sesquioxides, namelyyttrium sesquioxide (Y2O3), gadolinium sesquioxide (Gd2O3) and samarium sesquioxide(Sm2O3), under high pressure. The samples were characterized using x-ray diffraction, Ramanspectroscopy and atomic force microscopy at atmospheric pressures. Y2O3 and Gd2O3 werefound to be cubic at ambient, while Sm2O3 was found to be predominantly cubic with a smallfraction of monoclinic phase. The strongest Raman peaks are observed at 379, 344 and363 cm−1, respectively, for Y2O3, Sm2O3 and Gd2O3. All the samples were found to benanosized with 50–90 nm particle sizes. The high pressures were generated using a Mao–Belltype diamond anvil cell and a conventional laser Raman spectrometer is used to monitor thepressure-induced changes. Y2O3 seems to undergo a crystalline to partial amorphous transitionwhen pressurized up to about 19 GPa, with traces of hexagonal phase. However, on release ofpressure, the hexagonal phase develops into the dominant phase. Gd2O3 is also seen to developinto a mixture of amorphous and hexagonal phases on pressurizing. However, on release ofpressure Gd2O3 does not show any change and the transformation is found to be irreversible.On the other hand, Sm2O3 shows a weakening of cubic phase peaks while monoclinic phasepeaks gain intensity up to about a pressure of 6.79 GPa. However, thereafter the monoclinicphase peaks also reduce in intensity and mostly disordering sets in which does not showsignificant reversal as the pressure is released. The results obtained are discussed in detail.
(Some figures in this article are in colour only in the electronic version)
1. Introduction
The Ln2O3 rare earth sesquioxides in the lanthanide series area group of compounds that are attractive from a technologicalviewpoint and are unique from a scientific viewpoint. Variousapplications of these compounds have been reported, forexample they are used as catalysts for the synthesis of manyother 4f materials and in chemical processing to silicone-stabilized additive packages and corrosion inhibitors, etc.From the basic physics point of view, these compounds exhibitinteresting optical, magnetic and electronic properties withpotential applications in colour cathode ray tubes (CRT), tri-phosphor fluorescent lamps, x-ray intensifying screens, etc [1].Many products like data storage, magnetostrictive alloys,magnetic refrigeration, cement additives, paints, coatings, etc,
have been designed and fabricated from them. Recently rareearth sesquioxides have been investigated for high permittivitymaterials, namely alternate gate material insulator [2]. Y2O3
has a wide energy bandgap, high refractive index with thermalstability up to 2325 ◦C and thus has been used as an opticalcoating material. In addition, other RE oxides are alsoconsidered as potential candidates for high-k oxides, becauseof their high relative permittivity (εr = 12.4–14.8) andstability [7]. Because Gd2O3 has been reported to effectivelypassivate the GaAs surface [8], RE oxide films are expectedto find applications in the passivation of III–V compoundsemiconductors as well. Due to these interesting applications,it is crucial to understand the characteristics of different phasesof these rare earth oxide systems and their formation.
0957-4484/08/115703+09$30.00 © 2008 IOP Publishing Ltd Printed in the UK1
Nanotechnology 19 (2008) 115703 N Dilawar et al
The rare earth sesquioxides at ambient temperature andpressure are known to exist in three structural modifications.These three phases are designated as A, B and C,corresponding to hexagonal (in most cases space groupP3m1), monoclinic (in most cases space group C2/m) andcubic phase (in most cases space group Ia3), respectively. Thecubic phase unit cell has bixbyite structure which contains 16molecules of Ln2O3 (T7
h, Ia3) and the resulting structure has24 Ln3+ ions on sites with C33i (S6) symmetry [3]. Urban et al[4] studied the lanthanide C-type oxides using the Raman andIR spectroscopy and reported the electron–phonon coupling inthese compounds.
The stability of these rare earth sesquioxides at roomtemperature and pressure depends on cation and anion radiusratios [5]. A-type phase is found to be stable from La toNd, B-type from Sm to Gd and cubic for other rare earthsesquioxides. From C → B → A phases, there is decreaseof the molar volume. Hence pressure is also expected to givesimilar changes. It has been reported that phases obtainedunder pressure are metastable at atmospheric pressure [6].
In recent years there has been a tremendous interest inthe studies of various metallic, semiconducting [9, 10] andoxide [11, 12] based nanomaterials. This is related to thenovel, electronic, optical and structural properties exhibited byvarious nanomaterials. The increase in surface to volume ratioof atoms and quantum confinement effects are two principalreasons for the observed variations in the various properties ofthe nanomaterials. Further the large percentage of high energygrain boundaries present in nanomaterials make them moresensitive to external influence such as pressure. In particular,in this context nano rare earth materials like sesquioxides havea wide variety of potential applications, including fuel cells,chemical–mechanical polishing (CMP), ultra-fine polishing,catalytic converters and catalysis, high efficiency luminescentmaterials (for flat panel displays, plasma displays), red powderactivation of colour TV, sintering aids, rare earth magnets, etc.
In view of the above, the high pressure behaviour of thesematerials is expected to give insight into the effect of nanosizeon the pressure-induced changes. We have already reportedthe effect of pressure on nanosized Eu2O3 [13]. In the presentwork we report the effect of pressure on nanosized C-type rareearth sesquioxides, namely Y2O3, Sm2O3 and Gd2O3.
2. Experimental details
2.1. Sample
The Y2O3, Sm2O3 and Gd2O3 samples used in the presentstudy are commercially prepared powders from JohnsonMatthey Rare Earth Products, UK. The powders were used forthe present studies in the as-received state and not subjectedto any pre-treatment and, as per the manufacturer claims, thecommon metal impurities are in ppm level.
2.2. High pressure device
A Mao–Bell type diamond anvil cell DAC (Diacell Products,UK, Model B-05) with octagonal diamond flats having about600 μm diameter culets was used to generate high pressure.The powder sample was loaded in the gasket hole along
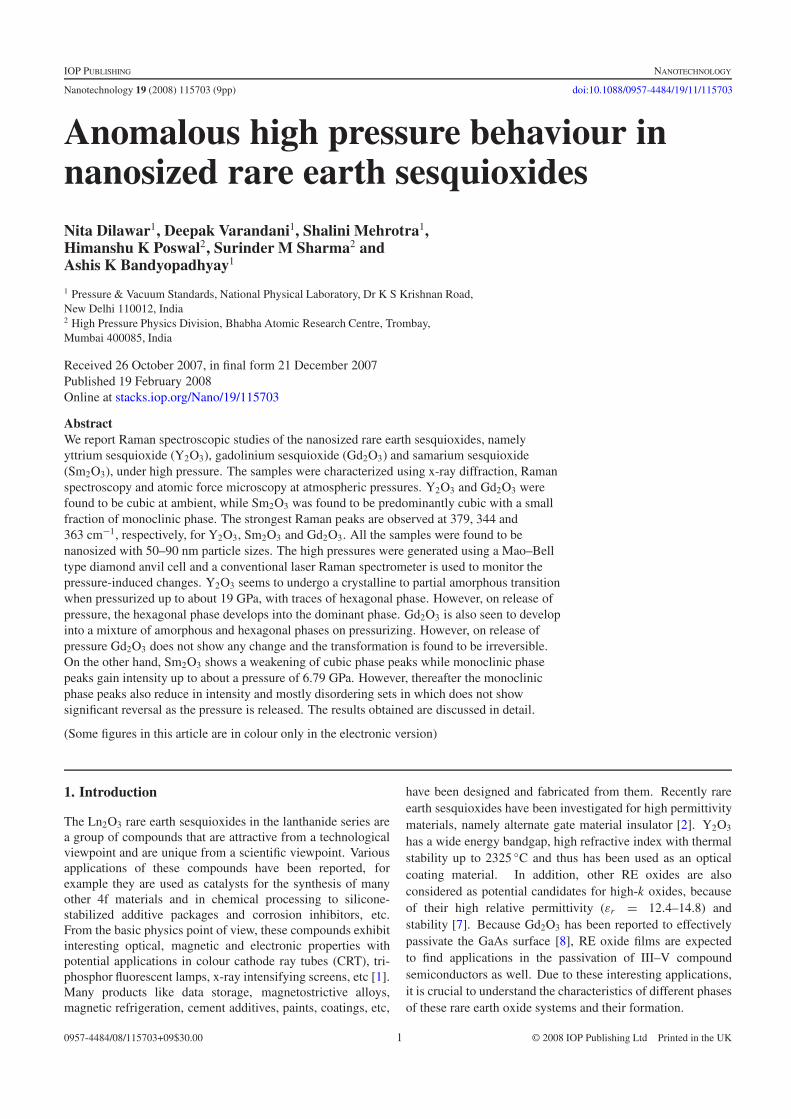
Figure 1. XRD patterns for Y2O3, Sm2O3 and Gd2O3 under ambientconditions.
with a few small ruby chips (5–10 μm) for monitoring thepressure in Raman experiments, from the wavelength shift ofits fluorescence peaks.
The pressure transmitting medium used in our studieswas a 4:1 mixture of methanol:ethanol which remains quasi-hydrostatic up to around 20 GPa. The pressure remainedhydrostatic throughout the studied range as indicated by theruby fluorescence curves (not shown).
2.3. Raman spectrometer
Raman scattering measurements at high pressure were carriedout using a 514.5 nm line of Ar ion laser, Model Innova70, Coherent, USA. The laser power on the sample was keptat about 100 mW and the scattered radiation collected inthe back-scattering geometry was analysed using a doublemonochromator coupled to a water-cooled photomultipliertube. The obtained Raman spectra were deconvoluted usingthe Voigt fit [14, 15].
2.4. Atomic force microscope
Digital Instruments (Veeco Metrology Group, Nanoscope IIIa)equipment was used to obtain the atomic force microscope(AFM) image of the samples under ambient conditions. Themeasurement was done in the contact mode at a scanning rateof around 0.5 Hz using the standard silicon nitride tip NP-20.
3. Results and discussion
3.1. Characterization at ambient
The phase identification of the rare earth sesquioxides in thepresent study was carried out using XRD. Figure 1 showsthe XRD patterns obtained for all the samples. From thesepatterns, it is clear that the ambient phase for each of thesamples studied is cubic and the observed peaks agree verywell with JCPDS data card nos. 25-1200, 15-813 and 12-0797,for Y2O3, Sm2O3 and Gd2O3, respectively. Slight exceptionsare observed in the case of Sm2O3. In Sm2O3, though the
2
Nanotechnology 19 (2008) 115703 N Dilawar et al
(a) (b)
(c)
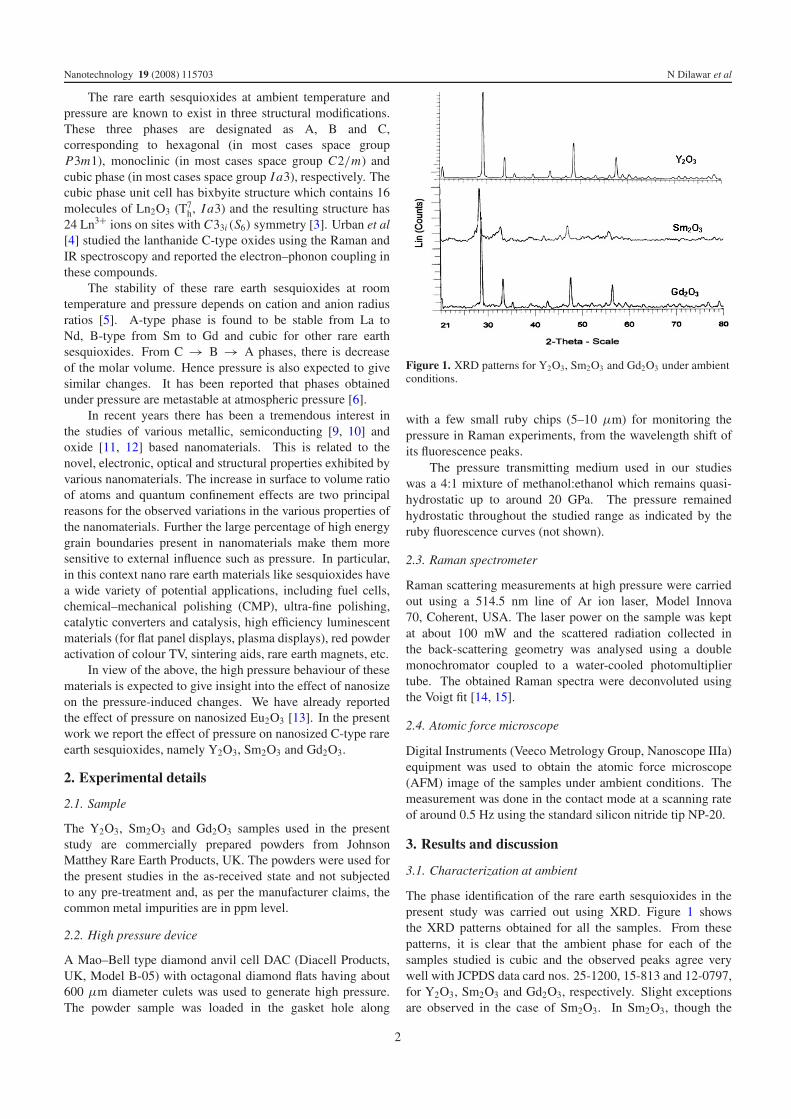
Figure 2. Atomic force micrographs for (a) Y2O3, (b) Sm2O3 and (c) Gd2O3.
predominant phase is the cubic phase, however, a few extrapeaks are also observed which do not correspond to the cubicphase. These additional peaks correspond to the monoclinicphase.
It is well known that the broadening of the lines in thex-ray patterns is attributed to the nature of crystallites. Thepeak width for each of the samples was used to calculate thediameter d of the crystallites by means of the Debye–Scherrerequation [16]
d = Kλ/β cos θ
which is applicable for crystals which are smaller than 100 nm.In the above equation λ is the wavelength of the x-rays, β is thefull width at half-maximum of the diffraction peak (in radians)and θ represents the maximum scatter angle. However, in theabove equation the instrument factor has to be subtracted fromthe factor β , which is found to be 0.054◦ in our samples. Hencefrom the obtained data for each of the samples the crystallitesize was calculated and was found to vary in the range from 35to 65 nm.
The particle size estimation of the samples has furtherbeen carried out from the AFM images. Figure 2 shows 3D(1 μm × 1 μm) AFM images obtained for Y2O3, Sm2O3 andGd2O3, respectively. From the images it appears that there is auniform particle distribution in the samples.
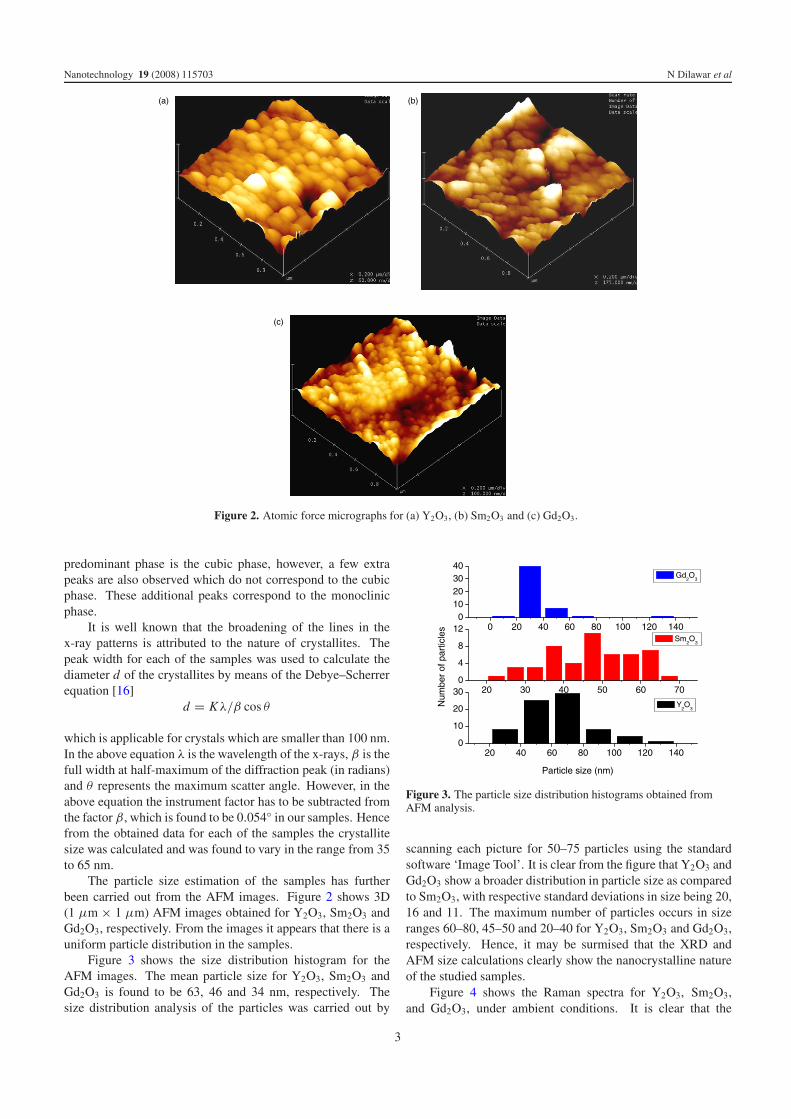
Figure 3 shows the size distribution histogram for theAFM images. The mean particle size for Y2O3, Sm2O3 andGd2O3 is found to be 63, 46 and 34 nm, respectively. Thesize distribution analysis of the particles was carried out by
20 40 60 80 100 120 1400
10
20
30
Particle size (nm)
Y2O
3
20 30 40 50 60 700
4
8
12
Num
ber
of p
artic
les
Sm2O
3
0 20 40 60 80 100 120 1400
10203040
Gd2O
3
Figure 3. The particle size distribution histograms obtained fromAFM analysis.
scanning each picture for 50–75 particles using the standardsoftware ‘Image Tool’. It is clear from the figure that Y2O3 andGd2O3 show a broader distribution in particle size as comparedto Sm2O3, with respective standard deviations in size being 20,16 and 11. The maximum number of particles occurs in sizeranges 60–80, 45–50 and 20–40 for Y2O3, Sm2O3 and Gd2O3,respectively. Hence, it may be surmised that the XRD andAFM size calculations clearly show the nanocrystalline natureof the studied samples.
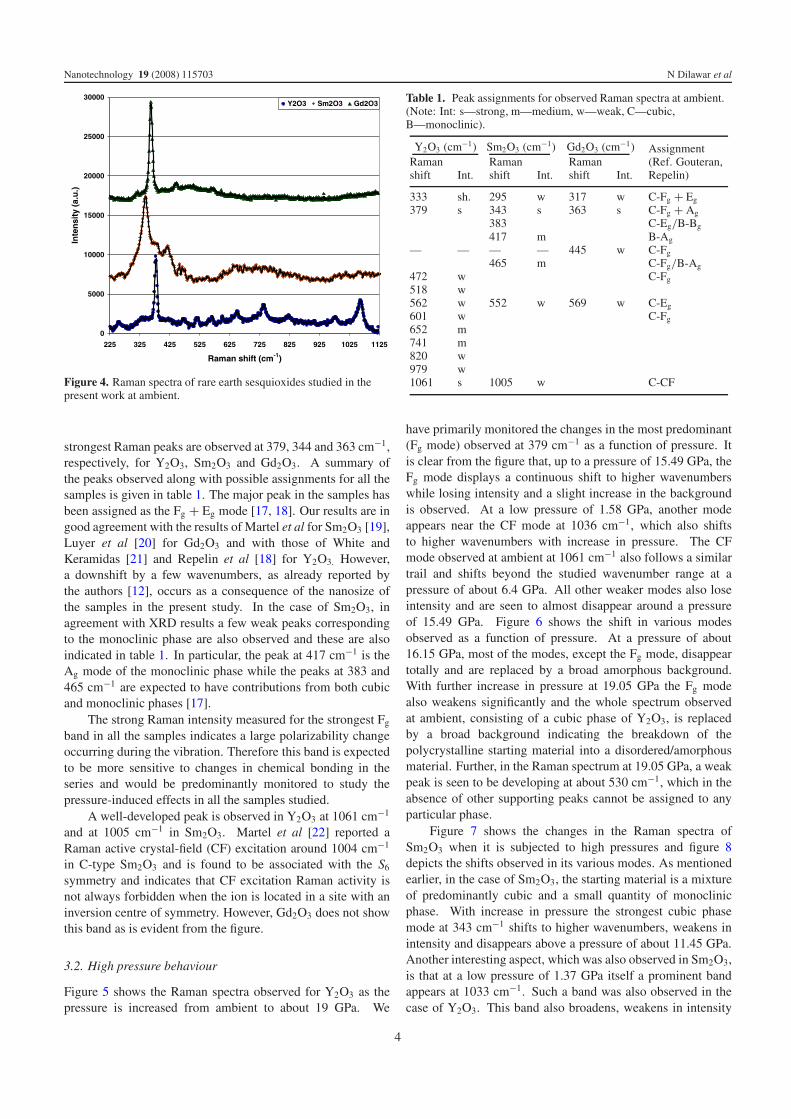
Figure 4 shows the Raman spectra for Y2O3, Sm2O3,and Gd2O3, under ambient conditions. It is clear that the
3
Nanotechnology 19 (2008) 115703 N Dilawar et al
0
5000
10000
15000
20000
25000
30000
225 325 425 525 625 725 825 925 1025 1125
Raman shift (cm-1)
Inte
nsi
ty (
a.u
.)
Y2O3 Sm2O3 Gd2O3
Figure 4. Raman spectra of rare earth sesquioxides studied in thepresent work at ambient.
strongest Raman peaks are observed at 379, 344 and 363 cm−1,respectively, for Y2O3, Sm2O3 and Gd2O3. A summary ofthe peaks observed along with possible assignments for all thesamples is given in table 1. The major peak in the samples hasbeen assigned as the Fg + Eg mode [17, 18]. Our results are ingood agreement with the results of Martel et al for Sm2O3 [19],Luyer et al [20] for Gd2O3 and with those of White andKeramidas [21] and Repelin et al [18] for Y2O3. However,a downshift by a few wavenumbers, as already reported bythe authors [12], occurs as a consequence of the nanosize ofthe samples in the present study. In the case of Sm2O3, inagreement with XRD results a few weak peaks correspondingto the monoclinic phase are also observed and these are alsoindicated in table 1. In particular, the peak at 417 cm−1 is theAg mode of the monoclinic phase while the peaks at 383 and465 cm−1 are expected to have contributions from both cubicand monoclinic phases [17].
The strong Raman intensity measured for the strongest Fg
band in all the samples indicates a large polarizability changeoccurring during the vibration. Therefore this band is expectedto be more sensitive to changes in chemical bonding in theseries and would be predominantly monitored to study thepressure-induced effects in all the samples studied.
A well-developed peak is observed in Y2O3 at 1061 cm−1
and at 1005 cm−1 in Sm2O3. Martel et al [22] reported aRaman active crystal-field (CF) excitation around 1004 cm−1
in C-type Sm2O3 and is found to be associated with the S6
symmetry and indicates that CF excitation Raman activity isnot always forbidden when the ion is located in a site with aninversion centre of symmetry. However, Gd2O3 does not showthis band as is evident from the figure.
3.2. High pressure behaviour
Figure 5 shows the Raman spectra observed for Y2O3 as thepressure is increased from ambient to about 19 GPa. We
Table 1. Peak assignments for observed Raman spectra at ambient.(Note: Int: s—strong, m—medium, w—weak, C—cubic,B—monoclinic).
Y2O3 (cm−1) Sm2O3 (cm−1) Gd2O3 (cm−1)Ramanshift Int.
Ramanshift Int.
Ramanshift Int.
Assignment(Ref. Gouteran,Repelin)
333 sh. 295 w 317 w C-Fg + Eg
379 s 343 s 363 s C-Fg + Ag
383 C-Eg/B-Bg
417 m B-Ag
— — — — 445 w C-Fg
465 m C-Fg/B-Ag
472 w C-Fg
518 w562 w 552 w 569 w C-Eg
601 w C-Fg
652 m741 m820 w979 w1061 s 1005 w C-CF
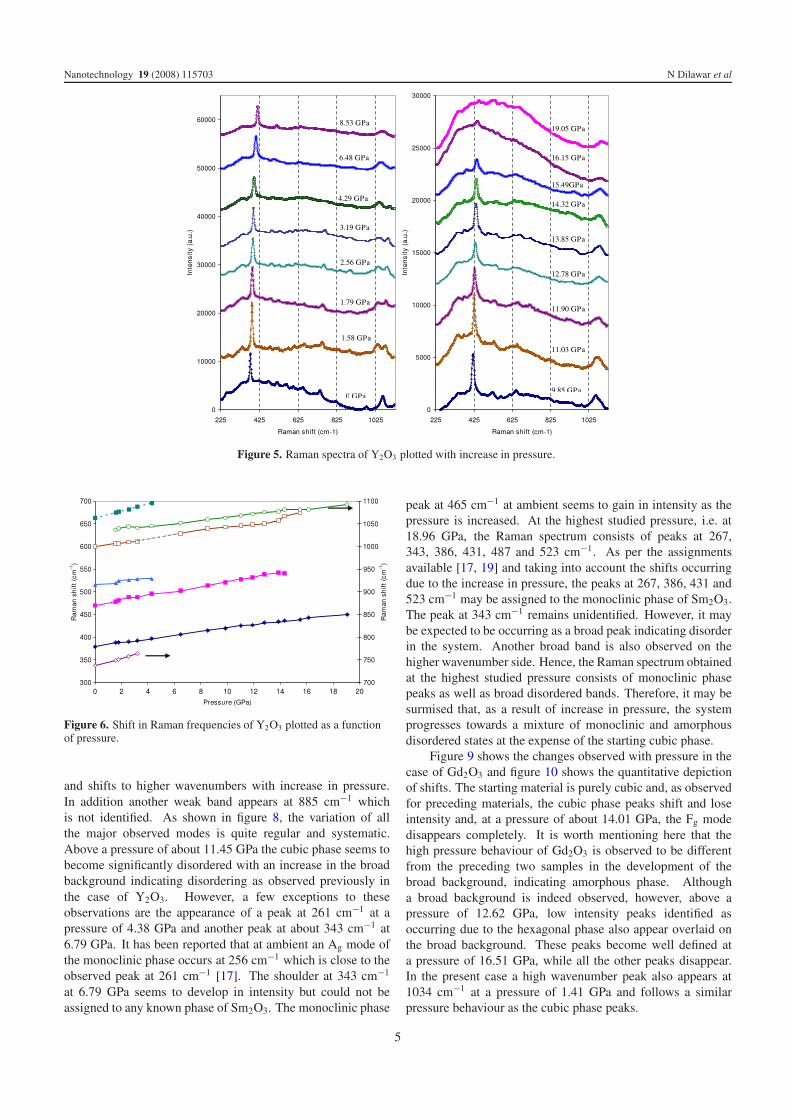
have primarily monitored the changes in the most predominant(Fg mode) observed at 379 cm−1 as a function of pressure. Itis clear from the figure that, up to a pressure of 15.49 GPa, theFg mode displays a continuous shift to higher wavenumberswhile losing intensity and a slight increase in the backgroundis observed. At a low pressure of 1.58 GPa, another modeappears near the CF mode at 1036 cm−1, which also shiftsto higher wavenumbers with increase in pressure. The CFmode observed at ambient at 1061 cm−1 also follows a similartrail and shifts beyond the studied wavenumber range at apressure of about 6.4 GPa. All other weaker modes also loseintensity and are seen to almost disappear around a pressureof 15.49 GPa. Figure 6 shows the shift in various modesobserved as a function of pressure. At a pressure of about16.15 GPa, most of the modes, except the Fg mode, disappeartotally and are replaced by a broad amorphous background.With further increase in pressure at 19.05 GPa the Fg modealso weakens significantly and the whole spectrum observedat ambient, consisting of a cubic phase of Y2O3, is replacedby a broad background indicating the breakdown of thepolycrystalline starting material into a disordered/amorphousmaterial. Further, in the Raman spectrum at 19.05 GPa, a weakpeak is seen to be developing at about 530 cm−1, which in theabsence of other supporting peaks cannot be assigned to anyparticular phase.
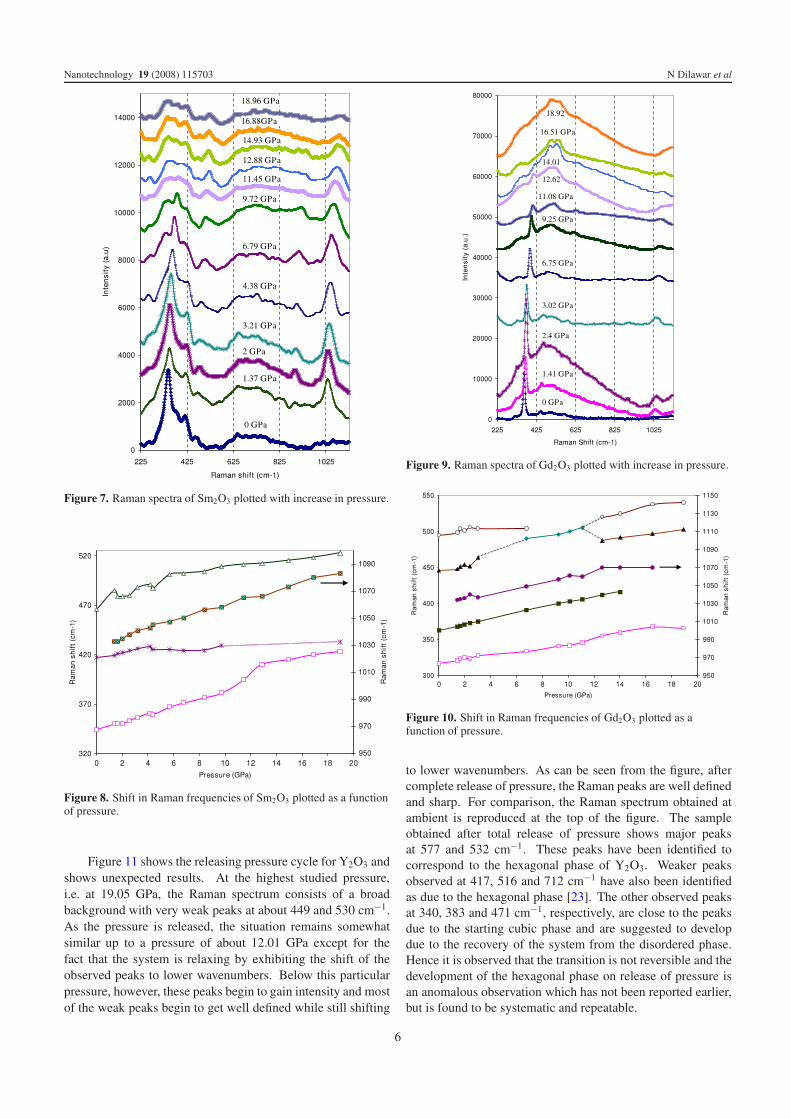
Figure 7 shows the changes in the Raman spectra ofSm2O3 when it is subjected to high pressures and figure 8depicts the shifts observed in its various modes. As mentionedearlier, in the case of Sm2O3, the starting material is a mixtureof predominantly cubic and a small quantity of monoclinicphase. With increase in pressure the strongest cubic phasemode at 343 cm−1 shifts to higher wavenumbers, weakens inintensity and disappears above a pressure of about 11.45 GPa.Another interesting aspect, which was also observed in Sm2O3,is that at a low pressure of 1.37 GPa itself a prominent bandappears at 1033 cm−1. Such a band was also observed in thecase of Y2O3. This band also broadens, weakens in intensity
4
Nanotechnology 19 (2008) 115703 N Dilawar et al
Figure 5. Raman spectra of Y2O3 plotted with increase in pressure.
Figure 6. Shift in Raman frequencies of Y2O3 plotted as a functionof pressure.
and shifts to higher wavenumbers with increase in pressure.In addition another weak band appears at 885 cm−1 whichis not identified. As shown in figure 8, the variation of allthe major observed modes is quite regular and systematic.Above a pressure of about 11.45 GPa the cubic phase seems tobecome significantly disordered with an increase in the broadbackground indicating disordering as observed previously inthe case of Y2O3. However, a few exceptions to theseobservations are the appearance of a peak at 261 cm−1 at apressure of 4.38 GPa and another peak at about 343 cm−1 at6.79 GPa. It has been reported that at ambient an Ag mode ofthe monoclinic phase occurs at 256 cm−1 which is close to theobserved peak at 261 cm−1 [17]. The shoulder at 343 cm−1
at 6.79 GPa seems to develop in intensity but could not beassigned to any known phase of Sm2O3. The monoclinic phase
peak at 465 cm−1 at ambient seems to gain in intensity as thepressure is increased. At the highest studied pressure, i.e. at18.96 GPa, the Raman spectrum consists of peaks at 267,343, 386, 431, 487 and 523 cm−1. As per the assignmentsavailable [17, 19] and taking into account the shifts occurringdue to the increase in pressure, the peaks at 267, 386, 431 and523 cm−1 may be assigned to the monoclinic phase of Sm2O3.The peak at 343 cm−1 remains unidentified. However, it maybe expected to be occurring as a broad peak indicating disorderin the system. Another broad band is also observed on thehigher wavenumber side. Hence, the Raman spectrum obtainedat the highest studied pressure consists of monoclinic phasepeaks as well as broad disordered bands. Therefore, it may besurmised that, as a result of increase in pressure, the systemprogresses towards a mixture of monoclinic and amorphousdisordered states at the expense of the starting cubic phase.
Figure 9 shows the changes observed with pressure in thecase of Gd2O3 and figure 10 shows the quantitative depictionof shifts. The starting material is purely cubic and, as observedfor preceding materials, the cubic phase peaks shift and loseintensity and, at a pressure of about 14.01 GPa, the Fg modedisappears completely. It is worth mentioning here that thehigh pressure behaviour of Gd2O3 is observed to be differentfrom the preceding two samples in the development of thebroad background, indicating amorphous phase. Althougha broad background is indeed observed, however, above apressure of 12.62 GPa, low intensity peaks identified asoccurring due to the hexagonal phase also appear overlaid onthe broad background. These peaks become well defined ata pressure of 16.51 GPa, while all the other peaks disappear.In the present case a high wavenumber peak also appears at1034 cm−1 at a pressure of 1.41 GPa and follows a similarpressure behaviour as the cubic phase peaks.
5
Nanotechnology 19 (2008) 115703 N Dilawar et al
Figure 7. Raman spectra of Sm2O3 plotted with increase in pressure.
Figure 8. Shift in Raman frequencies of Sm2O3 plotted as a functionof pressure.
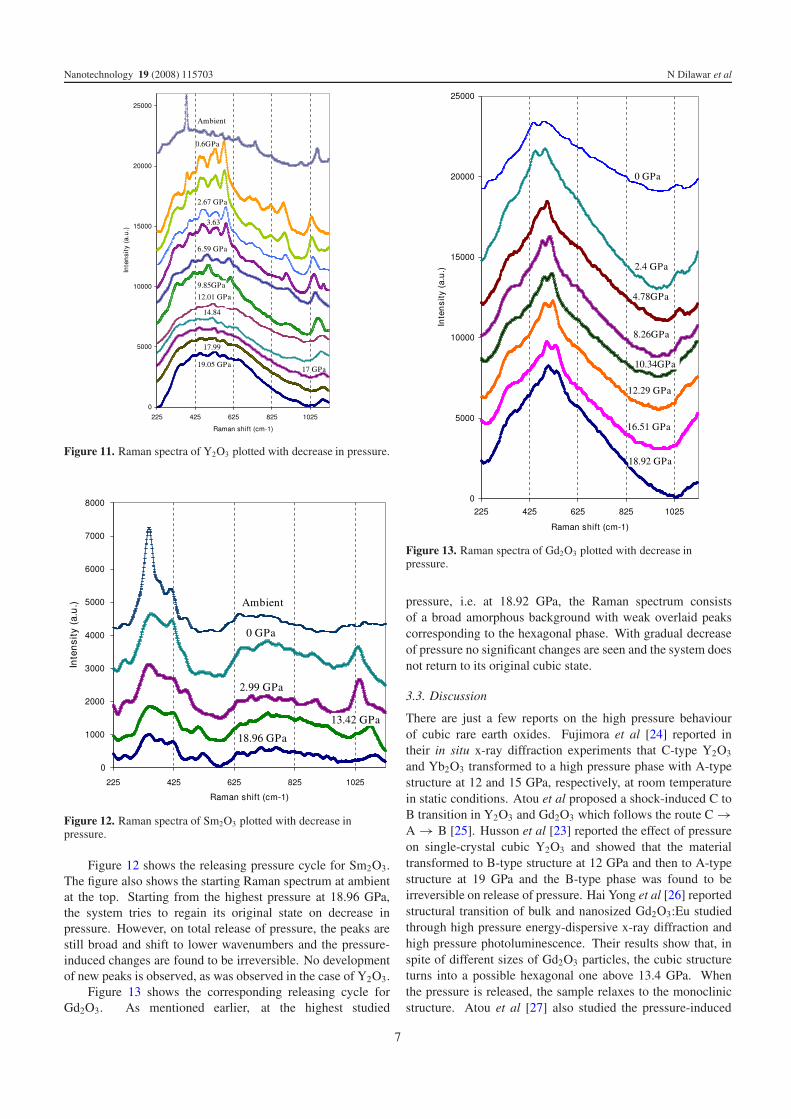
Figure 11 shows the releasing pressure cycle for Y2O3 andshows unexpected results. At the highest studied pressure,i.e. at 19.05 GPa, the Raman spectrum consists of a broadbackground with very weak peaks at about 449 and 530 cm−1.As the pressure is released, the situation remains somewhatsimilar up to a pressure of about 12.01 GPa except for thefact that the system is relaxing by exhibiting the shift of theobserved peaks to lower wavenumbers. Below this particularpressure, however, these peaks begin to gain intensity and mostof the weak peaks begin to get well defined while still shifting
Figure 9. Raman spectra of Gd2O3 plotted with increase in pressure.
Figure 10. Shift in Raman frequencies of Gd2O3 plotted as afunction of pressure.
to lower wavenumbers. As can be seen from the figure, aftercomplete release of pressure, the Raman peaks are well definedand sharp. For comparison, the Raman spectrum obtained atambient is reproduced at the top of the figure. The sampleobtained after total release of pressure shows major peaksat 577 and 532 cm−1. These peaks have been identified tocorrespond to the hexagonal phase of Y2O3. Weaker peaksobserved at 417, 516 and 712 cm−1 have also been identifiedas due to the hexagonal phase [23]. The other observed peaksat 340, 383 and 471 cm−1, respectively, are close to the peaksdue to the starting cubic phase and are suggested to developdue to the recovery of the system from the disordered phase.Hence it is observed that the transition is not reversible and thedevelopment of the hexagonal phase on release of pressure isan anomalous observation which has not been reported earlier,but is found to be systematic and repeatable.
6
Nanotechnology 19 (2008) 115703 N Dilawar et al
Figure 11. Raman spectra of Y2O3 plotted with decrease in pressure.
Figure 12. Raman spectra of Sm2O3 plotted with decrease inpressure.
Figure 12 shows the releasing pressure cycle for Sm2O3.The figure also shows the starting Raman spectrum at ambientat the top. Starting from the highest pressure at 18.96 GPa,the system tries to regain its original state on decrease inpressure. However, on total release of pressure, the peaks arestill broad and shift to lower wavenumbers and the pressure-induced changes are found to be irreversible. No developmentof new peaks is observed, as was observed in the case of Y2O3.
Figure 13 shows the corresponding releasing cycle forGd2O3. As mentioned earlier, at the highest studied
Figure 13. Raman spectra of Gd2O3 plotted with decrease inpressure.
pressure, i.e. at 18.92 GPa, the Raman spectrum consistsof a broad amorphous background with weak overlaid peakscorresponding to the hexagonal phase. With gradual decreaseof pressure no significant changes are seen and the system doesnot return to its original cubic state.
3.3. Discussion
There are just a few reports on the high pressure behaviourof cubic rare earth oxides. Fujimora et al [24] reported intheir in situ x-ray diffraction experiments that C-type Y2O3
and Yb2O3 transformed to a high pressure phase with A-typestructure at 12 and 15 GPa, respectively, at room temperaturein static conditions. Atou et al proposed a shock-induced C toB transition in Y2O3 and Gd2O3 which follows the route C →A → B [25]. Husson et al [23] reported the effect of pressureon single-crystal cubic Y2O3 and showed that the materialtransformed to B-type structure at 12 GPa and then to A-typestructure at 19 GPa and the B-type phase was found to beirreversible on release of pressure. Hai Yong et al [26] reportedstructural transition of bulk and nanosized Gd2O3:Eu studiedthrough high pressure energy-dispersive x-ray diffraction andhigh pressure photoluminescence. Their results show that, inspite of different sizes of Gd2O3 particles, the cubic structureturns into a possible hexagonal one above 13.4 GPa. Whenthe pressure is released, the sample relaxes to the monoclinicstructure. Atou et al [27] also studied the pressure-induced
7
Nanotechnology 19 (2008) 115703 N Dilawar et al
transition in polycrystalline powder of Gd2O3 and reported aC → A transition between 4.6 and 5.2 GPa which relaxed toa monoclinic structure on pressure release. To the best of ourknowledge, although there are reports of reversible B → Atransitions in Sm2O3, there are no reports on pressure-inducedbehaviour in C-type Sm2O3 [28, 29].
As mentioned earlier, on increasing pressure cycleamorphization/disorder has been observed at the highestpressure studied in all three samples. In addition toamorphization weak peaks belonging to the hexagonal phasehave been observed in Y2O3 and Gd2O3, while Sm2O3 showsweak peaks belonging to the monoclinic phase superimposedon a broad amorphous background. On releasing the pressureY2O3 ends up in mixed cubic and hexagonal phases, whileGd2O3 retains its high pressure (amorphous plus hexagonal)state. In the case of Sm2O3 the phase transformation underpressure is also irreversible and on release of pressure it endsup in a mixed amorphous and monoclinic phase. Further,in the case of Sm2O3, the starting sample is multiphase innature with both bulk stable cubic and metastable monoclinicphases coexisting. Thus in the present study, direct conversionof the cubic phase to partial hexagonal/monoclinic andamorphous phases on pressurization is observed. In additionthe phase transformation is found to be partially irreversiblefor Y2O3 and completely irreversible for Gd2O3 and Sm2O3.The following sections enumerate the possible reasons forthe anomalous high pressure behaviour (compared to bulk)observed in the three nanosesquioxides.
Under normal conditions, a comparison of molar volumesof the three structural types of the rare earth sesquioxidessuggests that application of high pressure should lead toa shift in phase boundaries. The structural transformationshould take place in the order C → B → A when thesesquioxides are subjected to increasing pressure. It must bepointed out that a cubic to monoclinic phase change produces asubstantial volume decrease of about 8%, while the monoclinicto hexagonal phase change produces only a minor volumechange [30]. Hyde and Anderson [31] showed that the A-type structure resembles very closely the B-type structure and avery small amount of anion shuffling would convert the A-typestructure to the B-type structure.
Compared to conventional polycrystalline materials,nanometre-sized particles can form in new phases andexhibit new or enhanced optical, electronic or structuralproperties [32, 33]. It is well known that the bulk propertiesof nanocrystalline materials depend on the high percentage ofgrain boundaries which, due to their high energy, are moreresponsive to the external influences and, hence, have also beenshown to demonstrate a size-dependent transition pressure.
It has been suggested by Skandan et al [34] that highpressure or high temperature phases stabilize at ambientconditions in the case of nanomaterials below a critical particlesize. This has been attributed to the additional hydrostaticpressure component in nanomaterials, due to the Gibbs–Thomson effect. The surface curvature of the nanometre-sized particles results in this additional hydrostatic pressurecomponent acting on the interior of the spherical particleswhose dimensions are related to the surface energy. If this
pressure component is high enough, e.g. below a criticalparticle diameter, high pressure phases with higher densitybecome thermodynamically favourable. As the parent phaseis compressed beyond its thermodynamic stability limit,molecular shapes and orientations become progressively moredeformed so as to prepare for a phase change with small finaldisplacements. In many cases this kinetic retardation gives riseto new metastable phases. It is well known that the kineticsof phase transformation depends in general on the pressure,temperature and the amount of non-hydrostatic stresses as wellas the existence of defects. Therefore, the barrier heights wouldalso depend on these parameters [35]. It has been suggestedthat, since the barrier to any transition is usually related tothe fragmentation of bulk materials into finite domains upontransition, these barriers to transition would be altered at finitesize of the nanocrystals [36].
Solid state amorphization is controlled by the relativeenergy of the defected crystalline phase and the amorphousphase. The crystalline to amorphous phase transformationoccurs when Ga < Gc + Gd, where Ga = free energy ofthe amorphous phase, Gc = free energy of the high pressurecrystalline phase and Gd = free energy increase due todefects. In the context of nanomaterials the defect controlledterm assumes importance due to the presence of increasedvolume fraction of grain boundaries. Hence the crystallineto amorphous phase transformation in nanomaterials underexternal stimuli such as pressurization, irradiation or milling,especially below a critical particle size, becomes possible. Onapplication and increase in pressure the nanoparticle size ofthe sesquioxides is expected to become even finer, leadingto further increase in the fraction of the grain boundarycomponent. This causes a constant increase in the defectenergy term Gd, eventually leading to amorphization of thematerial below some critical particle size at the expense ofthe normally observed high pressure phase. It has also beensuggested that for certain materials at the ambient the kineticsof the phase transformation reactions are slow and thereforean intermediate structural disarray is frozen in, resulting inamorphous form [35]. This finding also suggests that thestructural transformation with large volume changes mayalways proceed via an intermediate amorphous phase. Further,the few peaks in the pressurized samples belonging to either thehexagonal or the monoclinic phase may be due to a distributionin the particle size and/or non-hydrostatic pressure component.As has already been shown in the size distribution studiesabove, Sm2O3 shows the least particle size as well as sizedistribution, while Y2O3 and Gd2O3 show larger sizes as wellas size distribution. It is significant to note that the latter twohave shown the development of hexagonal phase while Sm2O3
does not show the hexagonal phase. This implies that theparticle size also plays a considerable role in the developmentof new phases on pressurization. Further studies includinghigh pressure band structure calculations using the TBLMTOmethod are underway to elucidate the precise mechanismaffecting these observations [37, 38].
The reversibility/irreversibility of any crystalline toamorphous phase transformation under pressure depends uponthe energy barrier on the path of the crystal to amorphous
8
Nanotechnology 19 (2008) 115703 N Dilawar et al
transformation and back. In observations on nanoparticles,Alivisatos et al [39] reported a hysteresis loop with awidth of a few GPa relative to a limiting thermodynamictransition pressure. This hysteresis loop narrowed at elevatedtemperatures and the position of the hysteresis loop was foundto be controlled by the size of the nanocrystals. The hysteresismight allow the formation of nanoparticles in metastablestructures following a pressurization–depressurization cycle.Now the thermodynamic surface considerations discussedabove apply to the downstroke transition also, and thethermodynamic pressure for the reverse transition will belowered. If the hysteresis loop is wide enough the practicalreverse transition pressure may become negative, so that thenanoparticles will remain in the high pressure structure fora very long time under ambient conditions. Furthermore, adifferent distribution of surfaces may lead to an otherwisefavoured transition pathway (such as the reverse of the pathadopted on the upward transition) being blocked, resulting inan alternative pathway being adopted. This implies that phasesdifferent from the starting phases may become possible in thecase of pressurization–depressurization cycles in the case ofnanocrystals [40]. Particularly in the case of nanocrystals,where the surface energy makes a major contribution tothe total free energy of the system, the transition path canactually determine the final state of the system [41]. Thusthe stabilization of metastable phases (amorphous/hexagonal)in the present study on subjecting the sesquioxides to apressurization–depressurization cycle may be the result of thesize-induced hysteresis.
4. Conclusions
In the present work, cubic nanocrystalline rare earthsesquioxides, namely Y2O3, Sm2O3 and Gd2O3, were studiedfor high pressure behaviour using Raman spectroscopy. Thesamples were characterized at ambient using XRD, AFM andRaman spectroscopy studies. The high pressure behaviourof the samples shows the introduction of disorder along withdevelopment of a hexagonal phase in Y2O3 and Gd2O3 whileSm2O3 shows amorphous features with weak monoclinic phasepeaks superimposed thereupon. An attempt has been made toelucidate the possible mechanisms for such observations.
Acknowledgments
The authors are grateful to Dr V Kumar, Director, NPL forbeing a constant source of encouragement. The financial grantfrom the Department of Science and Technology is gratefullyacknowledged. The authors also wish to thank Ms NandiniGarg for assistance in experimentation.
References
[1] Mikami M and Nakamura S 2006 J. Alloys Compounds408–412 687
[2] Mayayoshi M and Shirichiro N 2006 J. Alloys Compounds 687408
[3] Shaack G and Koningstein J A 1970 J. Opt. Soc. Am. 60 1110
[4] Urban M W and Cornilson B C 1987 J. Phys. Chem. Solids48 475
[5] Warshaw I and Roy R 1961 J. Phys. Chem. 65 2048[6] Hoekstra H R and Gingerich K A 1964 Science 146 1163[7] Cho M H, Ko D H, Jeong K, Whagbo S W, Whang C N,
Choi S C and Cho S J 1999 Thin Solid Films 349 266[8] Hong M, Kwo J, Kortan A R, Mannaerts J P and Sergent A M
1999 Science 283 1897[9] Bera S K, Choudhuri S, Bandyopadhyay A K, Chakraborty B R
and Pal A K 2001 J. Phys. D: Appl. Phys. 34 273[10] Pan L K, Chang Q S and Li C M 2004 J. Phys. Chem. B
108 3404[11] Rekhi S and Saxena S K 2001 J. Appl. Phys. 89 2968[12] Dilawar N, Mehrotra S, Varandani D, Kumaraswamy B V,
Haldar S K and Bandyopadhyay A K 2007 MaterialsCharacterization (Published online April 19)
[13] Dilawar N, Varandani D, Pandey V P, Kumar M,Shivaprasad S M, Sharma P K and Bandyopadhyay A K2006 J. Nanosci. Nanotechnol. 6 105
[14] Bandyopadhyay A K, Dilawar N, Kumar A V, Varandani D andSingh D 1998 Bull. Mater. Sci. 21 433
[15] Dilawar Nita 1997 PhD Thesis I.I.T Delhi[16] Cullity B D 1978 Elements of X-ray Diffraction (Reading, MA:
Addison-Wesley) p 102[17] Gouteron G, Michel D, Lejus A M and Zarembowitch J 1981
J. Solid State Chem. 38 288[18] Repelin Y, Proust C, Husson E and Benny J M 1995 J. Solid
State Chem. 118 163[19] Martel J F, Jandl S, Viana B and Vivien D 2000 J. Phys. Chem.
Solids 61 1455[20] Le Luyer C, Garcia-Murillo A, Bernstein E and Mugnier J 2003
J. Raman Spectrosc. 34 234[21] White W B and Keramidas V G 1972 Spectrochimica Acta 28A
501[22] Martel J F, Jandl S, Lejus A M, Viana B and Vivien D 1998
J. Alloys Compounds 275–277 353[23] Husson E, Proust C, Gillet P and Itie J P 1999 Mater. Res. Bull.
34 2085[24] Fujimura A, Kikegawa T and Iwasaki H 2007 private
communication to ref [26][25] Atou T, Kusaba K, Fukuoka K, Kikuchi M and Syono Y 1990
J. Solid State Chem. 89 378[26] Chen H Y, He C Y, Gao C X, Zhang J H, Gao S Y, Lu H L,
Nie Y G, Li D M, Kan S H and Zhou G H 2007 Chin. Phys.Lett. 24 158
[27] Atou T, Kusaba K, Syono Y, Kikegawa T and Iwasaki H 1992High Pressure Research ed Y Syono andM H Manghnani (Tokyo: TERRAPUB) p 469
[28] Atou T, Kusaba K, Tsuchida Y, Utsumi W, Yagi T andSyono Y 1989 Mater. Res. Bull. 24 1171
[29] Hongo T, Kondo K, Nakamura K G and Atou T 2007 J. Mater.Sci. 42 2582
[30] Hoekstra H R 1965 Inorg. Chem. 5 754[31] Hyde B G and Anderson S 1989 Inorganic Crystal Structures
(New York: Wiley) p 274[32] Eilers H and Tissue B M 1996 Chem. Phys. Lett. 251 74[33] Bonnet G, Lachkar M, Colson J C and Larpin J P 1995 Thin
Solid Fims 261 31[34] Skandan G, Foster C M, Frase H, Ali M N, Parker J C and
Hahn H 1992 Nanostruct. Mater. 1 313[35] Sharma S M and Sikka S K 1996 Prog. Mater. Sci. 40 1[36] San-Miguel A 2006 Chem. Soc. Rev. 35 876[37] Mehrotra S and Bandyopadhyay A K 2007 J. Alloys
Compounds 436 56[38] Mehrotra S, Sharma P, Rajagopalan M and
Bandyopadhyay A K 2006 Solid State Commun. 140 313[39] Jacobs K, Zaziski D, Scher E C, Herhold A B and
Alivisatos A P 2001 Science 293 1803[40] Morgan B J and Madden P A 2007 J. Phys. Chem. C 111 6724[41] Tolbert S H and Alivisatos A P 1994 Science 265 373
9


![[Anomalous pregnancies in ancient medicine]](https://img.dokumen.tips/doc/110x75/635b01af9d85dc43cb073b1d/anomalous-pregnancies-in-ancient-medicine.jpg)


