Embed Size (px)
Citation preview
ANNUAL REPORT AND ACCOUNTS 2015–16

Accounts presented to House of Commons pursuant to section 6(4) of the Government Resources & Accounts Act 2000 Annual Report presented to the House of Commons by Command of Her Majesty Ordered by the House of Commons to be printed on 13 July 2016.
HC 327
ANNUAL REPORT AND ACCOUNTS 2015–16

© Crown copyright 2016
This publication is licensed under the terms of the Open Government Licence v3.0 except where otherwise stated. To view this licence, visit nationalarchives.gov.uk/doc/open-government-licence/version/3 or write to the Information Policy Team: The National Archives, Kew, London TW9 4DU, or email: [email protected].
Where we have identified any third party copyright information you will need to obtain permission from the copyright holders concerned.
This publication is available at www.gov.uk/government/publications
Any enquiries regarding this publication should be sent to us at 3 Whitehall Place, London, SW1A 2AW Tel: 0300 060 4000 Email: [email protected]
Print ISBN 9781474131070
Web ISBN 9781474131087
ID P002802519 07/16
Printed on paper containing 75% recycled fibre content minimum
Printed in the UK by the Williams Lea Group on behalf of the Controller of Her Majesty’s Stationery Office
CONTENTSOUR MAIN ACHIEVEMENTS AT A GLANCE 5
SECRETARY OF STATE FOREWORD 6
REPORT OF THE PERMANENT SECRETARY 7
PERFORMANCE REPORT 8
OVERVIEW 9 Our purpose 9What we are aiming to achieve 9 How we are organised 9 Where we spent our money in 2015-16 12
PERFORMANCE ANALYSIS 14Aims and achievements 14Key issues and risks 22Looking ahead 26
ACCOUNTABILITY REPORT 28
CORPORATE GOVERNANCE REPORT 29Directors’ report 29Statement of Accounting Officer’s responsibilities 42Governance statement 43
REMUNERATION AND STAFF REPORT 58
PARLIAMENTARY ACCOUNTABILITY AND AUDIT REPORT 78
FINANCIAL STATEMENTS 98
TRUST STATEMENT 172
ANNEXES 196
ANNEX A: OUR DELIVERY PARTNERS 197ANNEX B: OUR MAJOR PROJECTS AND PROGRAMMES 200ANNEX C: SUSTAINABILITY REPORT 202ANNEX D: REGULATION, PARLIAMENT AND THE PUBLIC 208

PERFORMANCE REPORT
5
OUR MAIN ACHIEVEMENTS AT A GLANCE
We played a leading role in delivering a crucial new deal at COP21 in Paris to combat global climate change.
We helped consumers save £8.5 million on their energy bills through our second Power to Switch campaign.
We introduced a new planning process for shale to help deliver new gas supplies that will boost our economy and increase our security of supply.
We promoted a change of the law so that tenants can ask their landlords to improve heating and insulation.
We set up the Oil and Gas Authority, which will be formally established as a Government Company under the Energy Act 2016 and given new powers to support and regulate the industry.
We reformed renewable energy subsidies to ensure consumers are protected from higher energy bills.
We achieved major progress at Sellafield - 70% of radioactive material removed from one of the site’s oldest nuclear facilities and put it into safe modern storage.
We ran our second Capacity Market auction - securing future energy supply for 2019-20 at a low cost to consumers.
We enabled over 3 million smart meters to be operating in homes and businesses across Great Britain – putting consumers in control of their energy use.
ANNUAL REPORT AND ACCOUNTS 2015–16
6
SECRETARY OF STATE FOREWORD
The Department of Energy & Climate Change is committed to delivering the secure, affordable, clean energy that our families and businesses can rely on now and in the future.
Security of energy supply is our number one priority. The steps we have taken over the past year mean we have a high level of energy security for the long-term. We ran our second Capacity Market auction, which secured future energy supply for 2020. We introduced a new planning process for shale gas, to boost our supply of home grown energy. We have also provided £20 million worth of new funding to support our existing oil and gas industry. We are committed to keeping bills as low as possible for households and businesses across the country. We helped consumers save £8.5million on their energy bills through our second Power to Switch campaign. We took control of subsidies for onshore wind and solar power, reducing their impact on consumers. We are putting people and businesses in control of their energy usage by installing over 3 million smart meters across Great Britain and through our Energy Company Obligation, we are delivering on our commitment to insulate 200,000 homes a year to help the most vulnerable with their energy bills.
We are also playing our part in the global effort to tackle climate change. We had a leading role in the United Nations climate change conference in Paris, driving international action which commits to keeping global temperature rise to well below 2°C. We announced plans to close unabated coal plants by 2025. We are cutting carbon by supporting investment in heat networks, expanding offshore wind and nuclear and increasing our support for low carbon innovation, including a competition for small modular reactors. This work, too, makes sure that Government-wide priorities are met. We are increasing UK exports and foreign investment with our energy sector employment and skills. The creation of Northern Powerhouse is aided through the development of new nuclear, shale and renewables. The needs of businesses are at the top of the agenda by helping them to be more energy efficient.As the Government implements the will of the electorate as directed by the results of the EU Referendum held on 23 June 2016, the Department is in a strong position to rise to the challenge and continue to deliver effectively. I am proud of this progress that we have made over the past year and I am confident that our challenging future ambitions are within our grasp.
Amber RuddSecretary of State for Energy & Climate Change and Chair of Departmental Board
PERFORMANCE REPORT
7
REPORT OF THE PERMANENT SECRETARY
The Department has clear priorities to ensure that the UK has a secure, resilient energy system; to keep energy bills as low as possible for households and businesses; to secure ambitious international action on climate change
and reduce carbon emissions cost-effectively at home and to manage the UK’s energy legacy safely and responsibly. Over the past year, we have delivered strongly on these priorities. This report highlights the key achievements during 2015-16 towards these four headline objectives. For instance, we introduced a new planning process for shale to help deliver new gas supplies that will boost our economy and increase our security of supply. We are supporting the oil and gas industry during the current downturn in oil prices, including providing £20 million of new funding. We helped consumers save £8.5 million on their energy bills through our second Power to Switch campaign. The Department played a leading role in delivering the climate deal in Paris to combat global climate change, where 195 countries committed to limiting global warming to well below 2°C, and to a long-term goal of net zero emissions by the end of the century. This was a truly historic moment, including all of the largest global emitters for the first time, and marks an important turning point towards a sustainable and low carbon future. Following the Spending Review in 2015 and the publication of our Single Departmental Plan in February 2016, the Department is working hard to support its updated vision and objectives for this Parliament. In the coming year, we will deliver:• a Capacity Market auction following a recent
review –reflecting our clear focus on the UK’s security of energy supply;
• a Contracts for Difference allocation round – attracting further private investment into our low carbon future; and
• the fifth carbon budget – setting out our decarbonisation agenda into the 2030s.
We are about to begin the main roll-out of smart meters, which will bring accurate bills, real time information on energy use, and faster switching to families and small businesses by 2020. We have also doubled our innovation programme funding, to over £500 million over the Parliament, aimed at unlocking cheaper, cleaner technologies in the future.Internally, our people engagement survey scores remained strong during a time of change across the organisation, as we have restructured the Department and reduced in size. We are maintaining our focus on making the Department a great place to work, with clear objectives, strong leadership, and achieving the highest standards of professionalism. We were also proud this year to launch our Diversity and Inclusion Vision. While there is still much more work to do, we have significantly improved our gender balance at a Senior Civil Service level, and continue to work towards a better representation of our black and minority ethnic colleagues at senior leadership levels. Following the result of the EU referendum held on 23 June 2016, we recognise that there will be new challenges ahead. With our strong position and dedicated people, we are well equipped to deal with these. The hard work and success we currently celebrate will not change as we work together to deliver our objectives.We therefore welcome this annual report as a record of our achievements, and look forward to continuing to improve our capability and capacity in order to deliver the challenges of the year ahead.
Jeremy PocklingtonPrincipal Accounting Officer and Acting Permanent Secretary

PERFORMANCE REPORT
PERFORMANCE REPORT
9
OVERVIEW
Our purposeThe Department of Energy & Climate Change exists to make sure consumers have secure, affordable and clean energy now and in the future. This is critical for our economy, national security and household budgets.
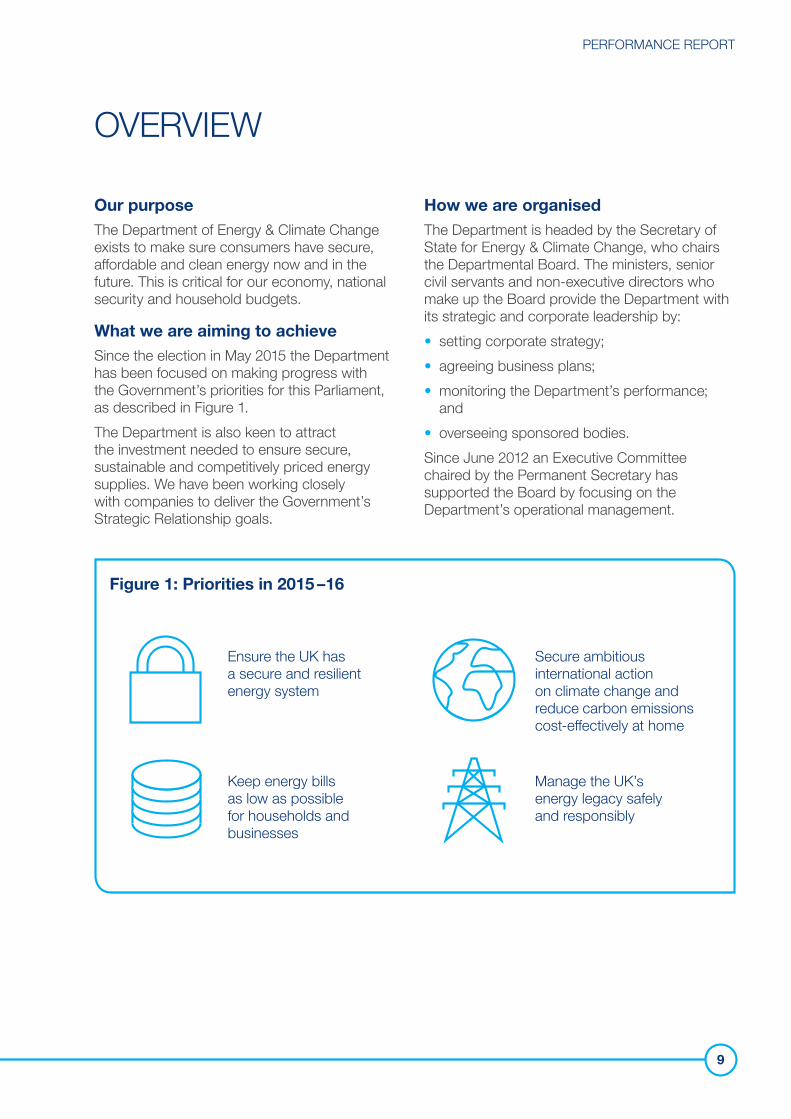
What we are aiming to achieveSince the election in May 2015 the Department has been focused on making progress with the Government’s priorities for this Parliament, as described in Figure 1.The Department is also keen to attract the investment needed to ensure secure, sustainable and competitively priced energy supplies. We have been working closely with companies to deliver the Government’s Strategic Relationship goals.
How we are organised The Department is headed by the Secretary of State for Energy & Climate Change, who chairs the Departmental Board. The ministers, senior civil servants and non-executive directors who make up the Board provide the Department with its strategic and corporate leadership by:• setting corporate strategy;• agreeing business plans;• monitoring the Department’s performance;
and • overseeing sponsored bodies. Since June 2012 an Executive Committee chaired by the Permanent Secretary has supported the Board by focusing on the Department’s operational management.
Figure 1: Priorities in 2015 –16
Ensure the UK has a secure and resilient energy system
Secure ambitious international action on climate change and reduce carbon emissions cost-effectively at home
Keep energy bills as low as possible for households and businesses
Manage the UK’s energy legacy safely and responsibly
ANNUAL REPORT AND ACCOUNTS 2015–16
10
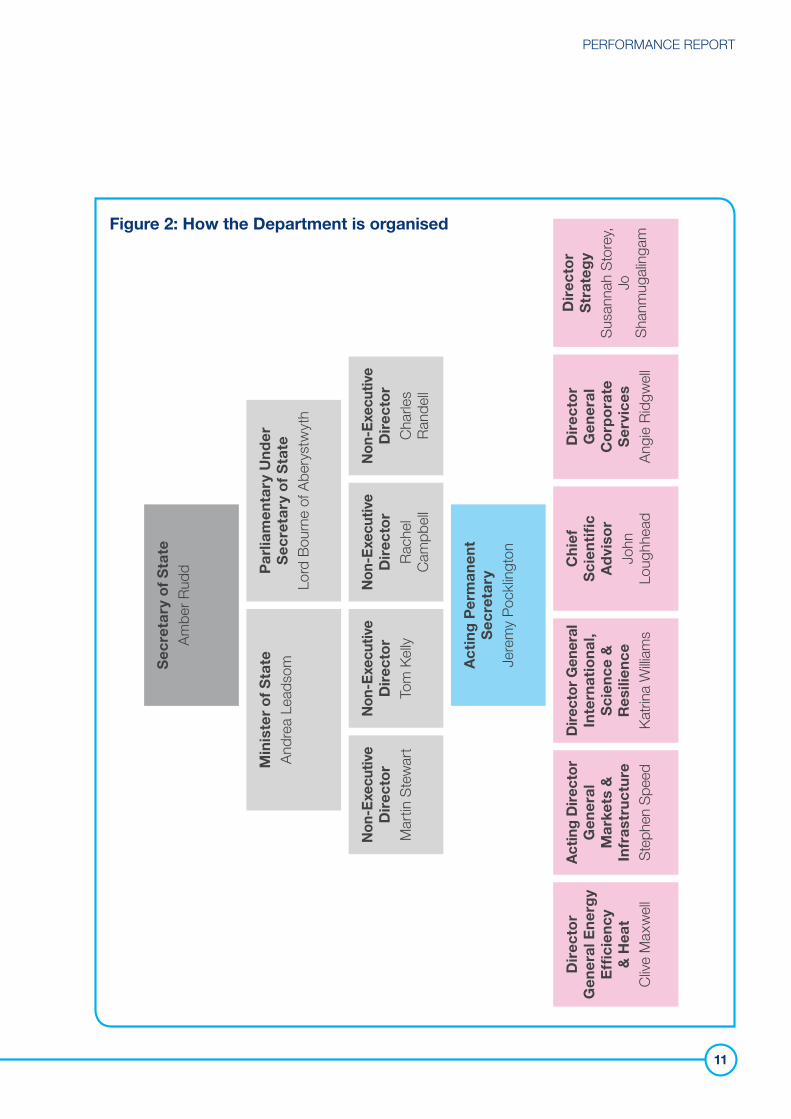
Figure 2 shows the structure of the Department as at 31 March 2016. We work in partnership with a wide range of organisations to deliver our policies and programmes. See Annex A for more details about these organisations and Annex B for our major projects and programmes.The Department currently has one executive agency – the Oil and Gas Authority (OGA) which is in the process of transitioning to a Government Company. The Department sponsors seven non-departmental public bodies (NDPBs). The executive NDPBs are:• the Civil Nuclear Police Authority (CNPA);• the Coal Authority;• the Nuclear Decommissioning Authority (NDA);
and• the Committee on Climate Change (CCC).
The advisory NDPBs are:• the Committee on Radioactive Waste
Management (CoRWM);• the Committee on Fuel Poverty(CFP); and• the Nuclear Liabilities Financing Assurance
Board (NLFAB).
We also oversee:• two public corporations – the National Nuclear
Laboratory (NNL) and the Nuclear Liabilities Fund (NLF); and
• two government-owned companies – the Low Carbon Contracts Company (LCCC) and the Electricity Settlements Company (ESC).
In addition, our group accounts consolidate:• four nuclear site licence companies which are
private companies operating sites on behalf of, and under contract from, the NDA – Sellafield Ltd, Magnox Ltd, Dounreay Site Restoration Ltd and LLW Repository Limited; and
• UK Climate Investments LLP which is a limited liability partnership with Green Investment Bank.
We work in partnership with:• a non-ministerial department – the Office
of Gas and Electricity Markets (Ofgem).
PERFORMANCE REPORT
11
Figure 2: How the Department is organised
etatf
S ddy
or R
ur ea bte mr Ace
S
e mat ot S dsf a
o er Le at es
ini
ndr
M Aht
er
ywe
nd tt sa y
Ut
y f S rebrat y
o f A
enra e o
mt ne r
ia r uc olr ea S
P d B
roL
Ne t
v ri atec
u r wo etcx e St
E r ni- iD tn r
o Ma
N
onevit
ecu r yo ll
t ec Kx eE ri m- o
D T
Non
vit l
ecu r l o l eet bhcx eE r ac m
p
i- R a
e D C
Non
evitec
u r o s ll
t e e
c lrx e nd
E r ha ai- C RD
n
ent notgya in
m ar lk
ert ce o
P cr P
g e y
n S mi et rcA Je
g l
ner
l
r y we
ot nc
at x
c E e e a
e l iar H Mi fic
D er f & ve
en E ilC
Gy
r eo d
ct ls
& r e
tue a per tien
er uc S
D e r nk tg ran asi G M r phe
t f ec n tI SA
la en
erl, s
a e mn & c a
io e in ll
G
it c er a ili W
o nt r ien
es inac te Sc
Rre t
n arD
i I K
dc af fi r i o ee ti
vis n
ien h
d Jo ghh
Ch
Sc A ouL
ll e er l t s wo a a e gt
or c dce en
er vipr Ri
i eror e
D G S giC nA
,y mer a
r o gy to ingt e S l ac t h ge Jori tra a unnD S nmsa au hS S
ANNUAL REPORT AND ACCOUNTS 2015–16
12
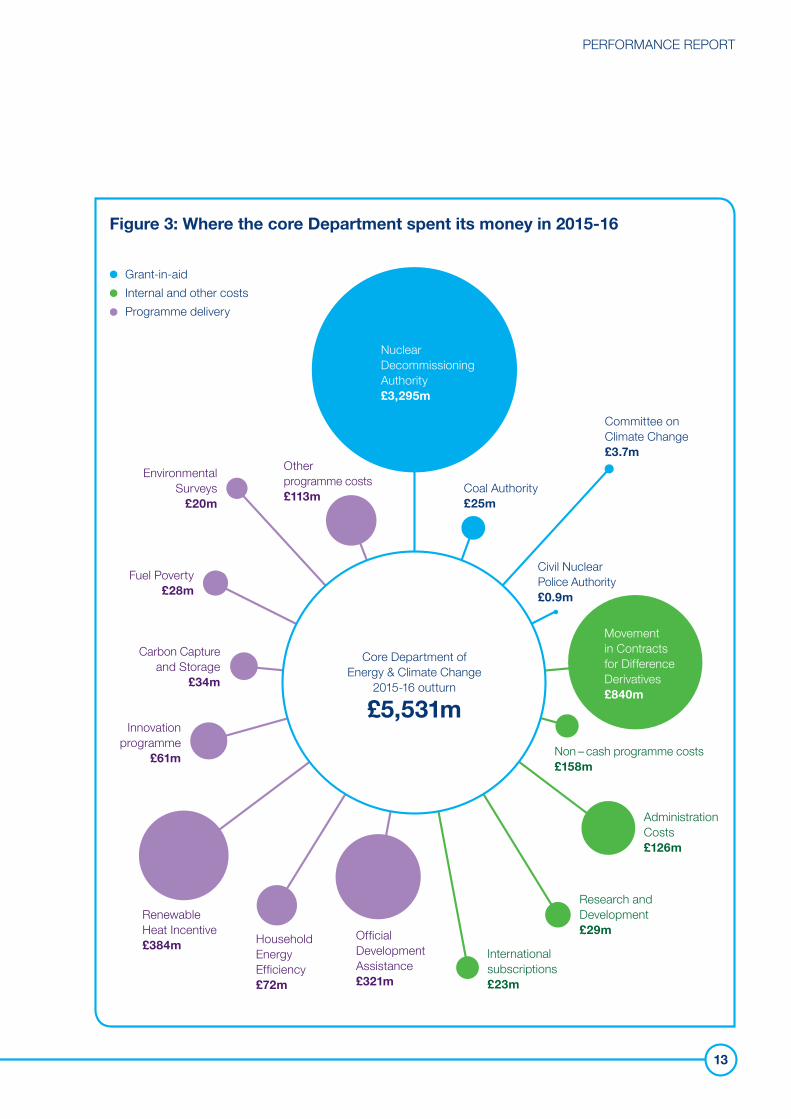
Where we spent our money in 2015-16The core Department’s gross expenditure1 for the year was £5.5 billion (see Figure 3). Of this, 60% (£3.3 billion) related to the Nuclear Decommissioning Authority (NDA). The remaining expenditure was split across:• grant-in-aid to other arm’s length bodies;• programme costs to deliver the Department’s
priorities; and• internal and other costs.The NDA raised income of £1.0 billion from its commercial activities which reduced the net cost of funding by the Department. The income mainly arose from the sale of reprocessed spent fuels, together with the sale of electricity for the last nine months operation of the remaining Magnox power station. The Department also received a payment of £113 million from surpluses in the Mineworkers Pension Scheme.
The significant items of expenditure recorded in the core Department were:£840 million – related to the movement in the Fair Value of the Contracts for Difference (CfD) since 2014-15;£384 million – related to delivering the Renewable Heat Incentive, a scheme to encourage homes and businesses to install heating systems using renewable sources of heat;£321 million – related to Official Development Assistance, as part of the Government’s commitment to spend 0.7% of Gross National Income on overseas aid.The Directors’ Report on pages 29 to 41 provides further details on allocation and utilisation of resources.
Note 1. The Department’s arm’s length bodies were funded through cash grant-in-aid
from the core Department – see Note 4 in the accounts. 2. Funding for the: • Coal Authority is for capital spend and running costs. • Committee on Climate Change is for capital spend and running costs,
some of which are funded by Defra and the devolved administrations. • Civil Nuclear Police Authority is for redundancy costs only. 3. Other programme costs include expenditure on a number of smaller schemes
and on staff costs that fall within programme.4. Non-cash programme costs includes an increase in the value of Provisions of £131m and
£21m for the unwinding of the discounted value of the balance of promissory notes issued by the Department, together with depreciation and amortisation costs and other non-cash charges - see Note 4 in the accounts.
1 Gross Expenditure for the core Department includes grant-in-aid cash funding for arm’s length bodies. The Department’s Departmental Expenditure Limit (DEL) budget (see Figure 4 and HM Treasury’s classifications on page 30) is on a consolidated basis and includes the core Department’s own expenditure plus that of the ALBs. Also included within the net expenditure for the Group are costs which fall to Annually Managed Expenditure (AME) budgets, such as movements in provisions and payments made under the Renewable Heat Incentive. DEL and AME budgets also include capital elements arising from movements on loans, investments and non-current assets, which are not included in the Consolidated Statement of Comprehensive Net Expenditure.
PERFORMANCE REPORT
13
Figure 3: Where the core Department spent its money in 2015-16
Nuclear DecommissioningAuthority£3,295m
Coal Authority £25m
Committee onClimate Change£3.7m
Civil Nuclear Police Authority£0.9m
Movementin Contractsfor DifferenceDerivatives £840m
Non – cash programme costs£158m
AdministrationCosts £126m
Research and Development£29m
International subscriptions£23m
OfficialDevelopment Assistance£321m
HouseholdEnergyEfficiency£72m
Renewable Heat Incentive£384m
Innovation programme
£61m
Carbon Capture and Storage
£34m
Fuel Poverty£28m
Environmental Surveys
£20m
Otherprogramme costs£113m
Grant-in-aidInternal and other costsProgramme delivery
Core Department ofEnergy & Climate Change
2015-16 outturn
£5,531m
ANNUAL REPORT AND ACCOUNTS 2015–16
14
PERFORMANCE ANALYSISAIMS AND ACHIEVEMENTSIn November 2015, the Secretary of State set out her vision for the UK’s energy and climate change policy for this Parliament. She has re-examined how the Department should address the balance between secure, affordable and clean energy.This section sets out the key achievements made in 2015-16 towards the Department’s four strategic and operational policy objectives.
Security and resilience
Ensuring the UK has a secure and resilient energy systemSecurity of supply is our first priority. In this Parliament, we are working across the electricity, oil and gas sectors to ensure that the UK has a well-functioning, competitive and resilient energy system that delivers for families and businesses. We are supporting a significant expansion in new nuclear energy and the establishment of the UK as a world leader in nuclear generating technology.
ElectricitySecure electricity supply is measured using an indicator called Loss of Load Expectation. This is the expected amount of time per year that the electricity supply cannot meet demand, when National Grid may need to use back-up balancing tools.
1.1 hours was how long the National Grid was likely to need to use such tools in 2015-16. The lower the Loss of Load Expectation, the more secure the electricity system.2 The Government has a target to make sure it does not go above 3 hours. Our score of 1.1 hours shows that we have a very high level of electricity security. It does not mean there was a loss of supply for this number of hours.
2 http://www2.nationalgrid.com/WorkArea/DownloadAsset.aspx?id=43310&utm_source=WOHome&utm _medium=web&utm_campaign=WO2015
PERFORMANCE REPORT
15
GasGas system capacity is measured through an assessment of how the system would cope if it lost its largest single piece of infrastructure (the ‘N-1’ indicator).
112–113%
is how much demand could be met if the largest piece of gas infrastructure failed (which is equivalent to 19% of total import capacity), even if demand was higher than usual in a severely cold winter.3This shows that we could maintain gas supply even in the most difficult circumstances we are likely to face.
Ensuring our future energy security supply In 2015-16 the Department took several important steps to ensure even greater security of supply. New nuclear In October 2015, Électricité de France (EDF) and its Chinese partner, China General Nuclear Power Corporation (CGN), signed a Strategic Investment Agreement relating to investment in Hinkley Point C. The Government and EDF finalised the detail of the Contract for Difference which offers increased price certainty for the electricity produced from Hinkley Point C, and the associated Funded Decommissioning Programme and Waste Transfer Contract.The Department announced the next steps it will be taking regarding Small Modular Reactors (SMRs) - investing £250m in an ambitious nuclear research and development programme, which includes a competition to identify the best value SMR design for the UK.
Oil and gasThe Oil and Gas Authority (OGA) became an executive agency of the Department on 1 April 2015, representing a critical step in implementing the recommendations of Sir Ian Wood’s 2014 review, looking at how to maximise economic recovery from the UK Continental Shelf. During 2015-16 the OGA has been transitioning to a Government Company. The bill to establish the status, objectives, functions, powers and duties of the OGA in its final form has continued to proceed through Parliament and is scheduled to complete in 2016. The Government announced a package of measures to support the UK oil and gas industry during the current downturn in oil prices in January 2016. This included £20 million of new funding for a second round of new seismic surveys in 2016 and a new ministerial group to coordinate the UK’s response to the oil price, focusing on vital issues such as exports, skills and investment.Shale gas planning applications will be fast-tracked through a new, dedicated planning process. Plans will ensure local people have a strong say over the development of shale exploration in their area, but also that communities and the industry benefit from a swift process for developing safe and suitable new sites. The Department provided the public with independent evidence about the robustness of the existing shale gas regulatory regime. We are establishing independent environmental monitoring by working with a research consortium, led by the British Geological Survey, to gather baseline environmental data, which will also be made available to the public.We continued to develop and refine the Capacity Market, consulting in March 2016 on reforms to ensure it maintains high levels of energy security in electricity.
3 https://www.gov.uk/government/uploads/system/uploads/attachment_data/file/468170/51686_HC_482_DECC_Print.pdf
ANNUAL REPORT AND ACCOUNTS 2015–16
16
Keeping bills low
Keeping energy bills as low as possible for households and businessesWe are committed to keeping bills as low as possible for households and businesses. Government policies have had a direct positive impact on energy bills.
Impact of government policies on average annual household energy bills
£90is the amount by which bills would have been higher in 2014 without government policies. The average household dual-fuel bill for 2014 was estimated to be £1,369, and this figure would have been £90 higher without work done by the Department.
Fuel poor households
87% is the percentage of fuel poor4 households that were living in housing at energy efficiency Band E or above5 in 2013, an improvement from 79% in 2010.6 We have a fuel poverty target to ensure that as many fuel poor homes as is reasonably practicable achieve a minimum energy efficiency rating of Band E by 2020, and Band C, by 2030. The bespoke fuel poverty energy efficiency rating methodology is used for this purpose.
Impact of government policies on average annual energy bills of Energy Intensive Industries (EIIs) eligible for all available government support
11%is the impact of government policies on this group’s average energy bills in 2014. The average total gas and electricity bill for these users in 2014 was estimated to be £9.6 million, although there is large variation in this group. In 2020 the range of support measures available to eligible EIIs could reduce the cost of policies on their energy bills by up to 80% compared with what they would pay in the absence of support.
4 Fuel poverty in England is measured by the Low Income High Costs definition, which considers households to be in fuel poverty if they have required fuel costs that are above average (the national median level) and were they to spend that amount they would be left with a residual income below the official poverty line https://www.gov.uk/government/collections/fuel-poverty-statistics
5 This is known as the fuel poverty energy efficiency rating, more information on which can be found at: https://www.gov.uk/government/publications/fuel-poverty-england-regulations-2014-and-methodology
6 https://www.gov.uk/government/uploads/system/uploads/attachment_data/file/468011/Fuel_Poverty_Report_2015.pdf
PERFORMANCE REPORT
17
Smart meters
3.1 million smart and advanced meters are now operating in homes and businesses across Great Britain.7 This is just the beginning of the foundation stage of the roll-out of these meters under the Smart Meter Implementation Programme. The main installation stage commences in 2016-17, with 53 million meters expected to be installed by the end of 2020. By this date every household and small business will have been offered smart electricity and gas meters. The meters:• give consumers up-to-date information about
how much gas and/or electricity they are using in pounds and pence;
• ensure accurate bills; • enable faster switching; and• provide the foundation for a more flexible
energy system.
Home insulation
173,000 homeshave had at least one insulation measure installed since the start of the current Parliament.
Switching suppliers
21% increasein switching in October 2015 during the Power to Switch campaign, compared with the same period the previous year.8 The campaign encouraged people to switch energy suppliers, and the increase was directly in line with the campaign launch and end dates. Average savings were £305 per household, resulting in an additional £8.5 million of consumer savings. The campaign was awarded the Government Communication Service Campaign of the Month for January 2016.
Controlling subsidies The Department announced its intention to close the Renewables Obligation to new onshore wind and new solar photovoltaic (PV) generating stations (at 5MW and below, building on previous intervention to close large stations) in Great Britain from 1 April 2016, a year before the scheduled closure of the scheme. It also consulted on reforming the Feed-in Tariff, which has been hugely successful in attracting investment in small-scale renewable electricity deployment. The scheme now supports over 860,000 installations with a total of 4.9GW of renewable electricity generating capacity across all supported technologies. The review concluded to keep the scheme open with new tariffs. We believe they will provide appropriate rates of return within a capped budget, to allow deployment to come forward while providing significantly better value for money to bill payers.
7 https://www.gov.uk/government/statistics/statistical-release-and-data-smart-meters-great-britain-quarter-4-20158 Data from Ofgem-accredited price comparison sites.
ANNUAL REPORT AND ACCOUNTS 2015–16
18
Decarbonisation
Securing ambitious international action on climate change and reducing carbon emissions cost-effectively at homeThe Government is committed to the Climate Change Act and to meeting our climate change target of at least an 80% reduction in emissions by 2050. This must be done while keeping our energy supply safe and low cost.
Greenhouse gases
1072 MtCO2eis the level of total UK greenhouse gas (GHG) emissions for 2013 and 2014 combined.9 Emissions in 2014 (514.4 MtCO2e) showed a 36% reduction since 1990 levels and a 14% reduction since 2010 levels. The UK net carbon emissions target for the current carbon budget period (2013-17) is 2,782 MtCO2e and we are on track to meet this.
Conference of Parties (COP) 21
195 countries reached a historic new global climate agreement at the United Nations Climate Change Conference in Paris in December 2015. The deal took a significant step forward to reducing global emissions. For the first time ever, all the participating countries, including the world’s largest emitters, have committed to act together to combat climate change and be held accountable. The deal undertakes to keep global temperature rise to well below 2°C and sets out a clear long-term goal of net zero emissions in the second half of the century, showing that the world is committed to decarbonising. Progress towards this goal will be independently assessed in 2018 and every five years thereafter. Countries will review their targets every five years from 2020. The long-term goal sends a strong signal to investors, businesses and policy makers that the world is moving to a low carbon economy and provides confidence that will help drive the scale of investment needed.
9 2014 UK greenhouse gas emissions: final figures - data tables
PERFORMANCE REPORT
19
International Climate FundBetween April 2011 and March 2016, the International Climate Fund (ICF) provided £3.87 billion (of which the Department’s share was £1.33 billion) to address climate change, and safeguard the lives and livelihoods of the most vulnerable. A set of key performance indicators (KPIs) have been developed and field tested to capture concrete results of this funding. These results will be updated as our climate work progresses and early results achieved as at April 2015 can be found at https://www.gov.uk/government/uploads/system/uploads/attachment_data/file/463954/ICF_Results_Note_Final.pdf.
Carbon budgets (CBs)The UK is on track to meet the second CB period (2013-17) and the third (2018-22). UK emissions continue to fall; recently the UK saw one of the largest annual reductions in emissions on record, against the backdrop of a growing economy.However, we have been clear that carbon budgets through the rest of the 2020s will be challenging. There is currently a shortfall over the fourth CB (2023-27) where our emissions are projected to be 10% greater than the cap set by the budget. Not all detailed policy proposals for reducing emissions during the fourth CB are in place and therefore are not taken into account within the this projection. We are currently developing options to meet the fourth CB budget during this Parliament and expect to publish our new Emissions Reduction Plan by the end of 2016 setting out our proposals through the 2020s.
Rights for tenantsFrom April 2016, tenants will have the right to request consent for improvements to make their homes easier and cheaper to keep warm, which the landlord cannot unreasonably refuse. We have worked with the sector to develop industry guidance to help landlords, tenants, local authorities and other interested bodies to understand and prepare for the regulations before they begin to apply.
2020 renewables targetThe UK is continuing to make progress towards the 2020 renewables target of 15% of final energy consumption from renewable sources. Our latest progress report confirmed the UK surpassed the target for 2013 and 2014 with an average 6.3% of final energy consumption coming from renewable sources over the two years, against a target of 5.4%.
ANNUAL REPORT AND ACCOUNTS 2015–16
20
Energy legacy
Managing the UK’s energy legacy safely and responsiblyWe continue to manage our energy legacy sustainably and responsibly. We are discharging our legal liabilities effectively and managing the security risks from the legacies of our nuclear and coal industries and other energy interests.
Nuclear decommissioningThe Nuclear Decommissioning Authority’s (NDA) mid-year report for 2015-1610 covers 84 targets, encompassing site restoration, spent fuels, integrated waste management, business optimisation and critical enablers:• 4 targets are now complete; • 67 are green (on target);• 5 are amber (behind target with
possibility of recovery); • 8 are red (behind target); and • 1 is on hold. The NDA generated just over £1 billion in commercial income, primarily through reprocessing of nuclear fuel and electricity generation. It also oversaw the completion of an open competition to decommission 12 of its sites. Real progress has been made in decommissioning the oldest nuclear sites in the UK, including reducing radioactivity levels by 70% in one of the Sellafield priority programmes, and other changes at Sellafield to reduce costs, accelerate work and improve accountability.
Coal Authority
97%of the Coal Authority’s 2015-16 objectives have been achieved,11 indicating that good progress continues to be made with its five year plan.
Responsible managementWe have been working hard in many additional ways to manage the UK’s energy legacy safely and responsibly in 2015-16, including by: • supporting the NDA’s work in the safe
management of nuclear waste;• administering concessionary fuel entitlements
and personal claims for those previously involved in coal mining;
• sponsoring the Coal Authority;• working with the Oil and Gas Authority (OGA)
and industry to assist the maximum extension of field life; and
• ensuring field decommissioning is delivered in a safe, efficient and cost-effective manner, while minimising the risk to the environment and other users of the sea.
10 https://www.gov.uk/government/publications/nda-quarterly-performance-report-quarter-3-status-for-2015-16 11 pp. 12 & 20: https://www.gov.uk/government/uploads/system/uploads/attachment_data/file/441750/10420-TSO-CA-
R_A-2014-15_AccessibleM1.pdf
PERFORMANCE REPORT
21
Geological disposalThe following steps have also been taken in one of our major projects, the Geological Disposal Facility (GDF) programme for nuclear waste:• Radioactive Waste Management published the
National Geological Screening Guidance and consultation responses in March 2016;12
• worked with communities through public dialogue events in Manchester and Swindon to understand a range of views relating to siting a GDF; and
• the Government response to the consultation on the Scoping Report for the Appraisal of Sustainability of the National Policy Statement for the GDF was published on 1 February 2016.13
12 https://www.gov.uk/government/consultations/public-consultation-on-national-geological-screening13 https://www.gov.uk/government/uploads/system/uploads/attachment_data/file/496180/37203_Final_AoS_Scoping_
Report_26_1_16.pdf
ANNUAL REPORT AND ACCOUNTS 2015–16
22
KEY ISSUES AND RISKSThe Department is responsible for a complex agenda and there are a significant number of risks that can and do impact on delivery. Many of these risks exist outside of the direct control, or even influence, of the Department such as:• global markets affected by continuing
low oil prices; • climate change affected by the carbon
footprints of other nations; and • the ever evolving threat of cybercrime.Following the result of the EU Referendum held on 23 June 2016, where the UK voted to leave the European Union, the Department is continuing to consider the impact this may have on its ability to deliver its objectives. The Department’s objectives have not changed as a result of the referendum, and the work we do will continue as normal unless directed otherwise by the Government. The impact of the referendum will depend in large part on the arrangements which are agreed with the European Union and other international partners in due course. With regard to foreign exchange risks arising from the referendum result, the Department considers the potential impact on the financial position of the Department to be low.Alongside these challenges, we manage a range of multifaceted and important risks and issues which the Department seeks to mitigate where it is reasonably practical and cost effective to do so. These are handled through the risk and issue management processes that the senior leadership manages, enabling the Department to maintain focus on delivery.
PRINCIPAL RISKS
Security and resilience
Ensuring the UK has a secure and resilient energy system The main risk to successful delivery of this objective is the Department being unable to secure the necessary investment required to develop the diverse and sustainable energy infrastructure needed in a resilient energy system. In particular, this includes funding for new gas and nuclear generation, delivery of the Hinkley Point C nuclear power station and the impacts of continuing low oil prices on the financial viability of the UK continental shelf.A diverse energy mix is crucial. An over-reliance on certain types of energy generation can jeopardise the resilience and security of supply, if those energy sources face disruption. Disruption to supply of energy could come from:• industrial action;• infrastructure failures or closures
due to accidents;• terrorism;• cyber-attacks; and• market disruption from legal challenges
to funding decisions.Each of these risks requires a multi-agency mitigation response. The Department is working with colleagues across Government, the energy industry and with foreign governments to reduce these risks.
PERFORMANCE REPORT
23
Energy
Keeping energy bills as low as possible for households and businessesThe risks to fulfilling these objectives fall in two key areas: the detrimental impact our policies may have on consumer energy bills and movements in wholesale energy prices.A number of the Government’s energy schemes and low carbon policies are funded through levies placed on energy suppliers, who in turn pass the cost of the levies on to consumers in their energy bills. In order to limit the impact on consumer bills the Department and HM Treasury established the Levy Control Framework (LCF) which caps the amount that can be passed to consumers.The 2020-21 cap is £7.6 billion (this is in 2011-12 prices). There are many external factors that can affect the costs of the LCF, such as fossil fuel prices, so to help mitigate against the uncertainty a ‘headroom’ of 20% is available over the cap to allow for cost fluctuations that are out of the Department’s control. If this headroom is exceeded, the Department will rapidly agree a plan with HM Treasury to bring spending back down to the agreed profile. The Department regularly reviews its forecasts to improve the accuracy of LCF calculations.We have worked with industry stakeholders to progress the planned start of services from the Data and Communications Company in August 2016 and to prepare for the main installation stage for smart meters from mid-2016 to the end of 2020.
Decarbonisation
Securing ambitious international action on climate change and reducing carbon emissions cost-effectively at homeThe Department has continued to manage risks associated with meeting our obligations on legislated carbon budgets (CBs) and the UK’s 2020 renewables targets.The Department works with stakeholders inside and outside Government in order to develop options to meet the existing gap on the fourth CB, as discussed on page 19. An inter-ministerial group on clean growth has been established to consider a range of cross-departmental issues relating to decarbonisation and air quality. The Department intends to publish long-term proposals and plans at the end of 2016 on how to meet our CB obligations as required by the Climate Change Act.Our commitment to achieving energy reform was supported in the Spending Review, which increased the budget level for both Renewable Heat Incentive schemes (domestic and non-domestic) to £1.15 billion by March 2021. We are considering the implications of the funding on heat for the 2020 target and the Department for Transport (DfT) will be consulting later this year on meeting the transport fuel sub-target of 10%.We made a substantial contribution to the global climate agreement, which was signed by 195 countries at the 21st Conference of the Parties in Paris (COP 21). To build upon this success, we are developing our strategy to help deliver international action on climate change and are focused on tackling the risks that threaten a positive outcome.
ANNUAL REPORT AND ACCOUNTS 2015–16
24
Energy legacy
Managing the UK’s energy legacy safely and responsiblyGiven the long-term nature of the UK’s nuclear decommissioning and waste management programmes, this area is, and will continue to be, one of particular uncertainty and risk. The Department and the NDA maintain an on-going programme of activity to limit the risk of a security or safety incident at a UK civil nuclear site and to reduce potential NDA capability shortfalls.The Department worked closely with the NDA in preparing a major change to the business model for managing the Sellafield site. This allowed the smooth transfer to the new model on 1 April 2016.The Department, NDA and UK Government Investments (formerly the Shareholder Executive) – who manage the Government’s ownership interest in the NDA – reviewed the NDA’s governance early in the year. This has led to changes in NDA board structures and the appointment of new non-executive board members to provide extra depth, support and experience. Work is on-going to improve protocols around the sanctioning of major projects, namely:• agreeing what goes to the Department and
what to HM Treasury;• timescales;• the principles for departmental approval; and • performance and risk monitoring.
The NDA and its contractors continue to manage decommissioning risks on behalf of the Department. Their risk exposure and mitigation activities have included:• significant progress with Sellafield
decommissioning targets;• the completion of defueling at Oldbury
in January 2016; and• the first shipment of nuclear material from
Dounreay to Sellafield, in December 2015.Risks arising from the UK’s coal legacy include the physical impacts of mining on the environment and public safety. These are managed through the Coal Authority by mitigations, such as mine water treatment schemes, a 24 hour emergency response service and a proactive inspection regime.
PERFORMANCE REPORT
25
Corporate capability Delivery of our objectives depends on us having sufficient resources, the right skills mix and effectively prioritising these across our objectives. We have introduced processes to mitigate these risks to help us to prepare for the delivery of ministerial priorities throughout the new Parliament and in implementing our new staff structures. As well as meeting our resource capacity requirements, we have been working to enhance our staff capability. The focus in 2015-16 was on improving skills in team and staff management. In the coming year we will look to improve our leadership capability, with specific attention given to analysis, modelling and policy development.Broader challenges faced by the Department from future risks include: • the suitability of our IT for upcoming changes
to corporate infrastructure;• the management and reduction of financial
and reputational implications of legal challenges to the Department’s activity; and
• the inclusion of data security considerations within all our procedures and new system requirements.
There is also a large aspect of corporate risk which concerns our finances and budgets - we continue to manage associated risks while ensuring as a Department we strive to deliver value to the tax payer. The risks include costs arising from the UK’s energy legacy (referred to above) and from CfD expenditure risks arising from uncertainty around future forecasts of wholesale electricity prices. The Department will continue to be exposed to the risk that it exceeds its financial budget in any given delivery year. This reflects the fact that the Department’s policies often rely on a range of assumptions, some of which are volatile, such as price changes, the rate of technology development and prevailing weather conditions. All these risks make it difficult to forecast the cost of longer term commitments in relation to policies and financial instruments with high degrees of certainty. A range of financial controls remain in place to manage this, such as financial monitoring processes, maintenance of contingency funds to meet unexpected pressures and re-allocation of budgets in response to forecasts and risk assessments.
ANNUAL REPORT AND ACCOUNTS 2015–16
26
LOOKING AHEAD
Security and resilienceSecurity of supply is our number one priority. To ensure we maintain high energy security and resilience levels we will:• reform the Capacity Market to ensure it will
bring forward the new gas plant we need in a timely way;
• do all we can to encourage investment in shale exploration, building on the UK’s world-class oil and gas expertise; and
• progress plans for a new nuclear fleet so we can provide low carbon electricity at scale.
Keeping bills low We will continue to put energy consumers in control of their energy bills, including the roll-out of smart meters, which enters the main installation stage in 2016-17. We will introduce new policies on heat and will reform the Renewable Heat Incentive. We will also reform the Energy Company Obligation to focus on the fuel poor.
PERFORMANCE REPORT
27
DecarbonisationThis year we will set the level of the fifth carbon budget and lay our plans for the UK’s climate targets in our new emissions reduction plan.We have doubled our innovation programme to £500 million, and we will launch a competition on Small Modular Reactors.Internationally, we will continue to play a leadership role to implement the 21st Conference of Parties (COP 21) agreement reached in Paris by: • helping to create the conditions to raise global
ambitions on climate change;• levelling the playing field for UK business,
including by promoting carbon pricing globally; and
• providing at least £5.8 billion (of which the Department’s share will be £2 billion) of funding through the International Climate Fund between 2016 and 2021 to help the world’s poorest countries tackle climate change as part of their core national development planning and to promote clean growth.
Energy legacy
We are continuing to make progress on decommissioning the UK’s nuclear legacy at the 17 sites owned by the Nuclear Decommissioning Authority on our behalf. This includes:• implementing the plan to drive through
improvements at our largest, most complex site in Sellafield;
• stopping the reprocessing of nuclear fuel in the UK by 2020; and
• generating £1 billion of efficiencies in nuclear decommissioning work in the years 2016-17 to 2019-20.
We will also continue to ensure that our coal legacy is safely managed, and that North Sea oil and gas infrastructure is safely decommissioned as it reaches the end of its life.
Jeremy PocklingtonPrincipal Accounting Officer and Acting Permanent Secretary1 July 2016

ACCOUNTABILITY REPORT
ACCOUNTABILITY REPORT
29
CORPORATE GOVERNANCE REPORTDIRECTORS’ REPORTIn 2015-16 the Department’s costs were £106.5 billion in delivering our objectives of managing the UK’s energy legacy safely and making sure consumers have clean, secure and affordable energy now and in the future.The Department made notable progress across its portfolio:
Securing energy supplies• We ran our second Capacity Market auction -
securing the bulk of the future energy supply for 2019-20 at a lower clearing price than the first auction for 2018-19;
• We set up the Oil and Gas Authority on 1 April 2015 and provided additional support to the industry by providing £20 million of new funding for seismic surveys as announced at Budget 2015.
Controlling energy costs• We acted swiftly to reduce the cost of
our policies by taking control of subsidies, including for solar photovoltaics and onshore wind;
• We also ran the second Power to Switch campaign, which helped consumers save £8.5 million in 2015-16;
Decarbonisation in the UK and internationally• The Government played a leading role
in delivering a new global deal at COP 21 in Paris;
• At home, UK emissions continued to fall in a growing economy;
Managing the UK energy legacy • We made significant progress at Sellafield -
70% of radioactive material removed from one of the site’s oldest nuclear facilities and put into safe modern storage.
Resource allocated (estimate) and utilised (outturn)In 2015-16 the Department’s net budget was £112.5 billion to deliver on its ambitions and it utilised £105.4 billion. This included a budget of £108.4 billion and expenditure of £101.4 billion for non-cash items. These non-cash items are currently recognised in the accounts in order to give the full picture of the Department’s financial position. However, the associated cash outflows will not occur until the future. These outflows include the nuclear decommissioning provision accounted for in accordance with International Accounting Standard IAS 37 and CfD derivatives accounted for under IAS 39. The remaining budget of £4.1 billion and expenditure of £4.0 billion related to cash items - where cash outflows occurred in the financial year.Within the Department’s total funding allocation, Parliament sets specific control totals for the different DEL and AME budgets – spending must be kept within all of these control totals (see page 30 for HM Treasury’s classifications). The Department remained within its budgetary control totals, as well as the Net Cash Requirement set by Parliament.
ANNUAL REPORT AND ACCOUNTS 2015–16
30
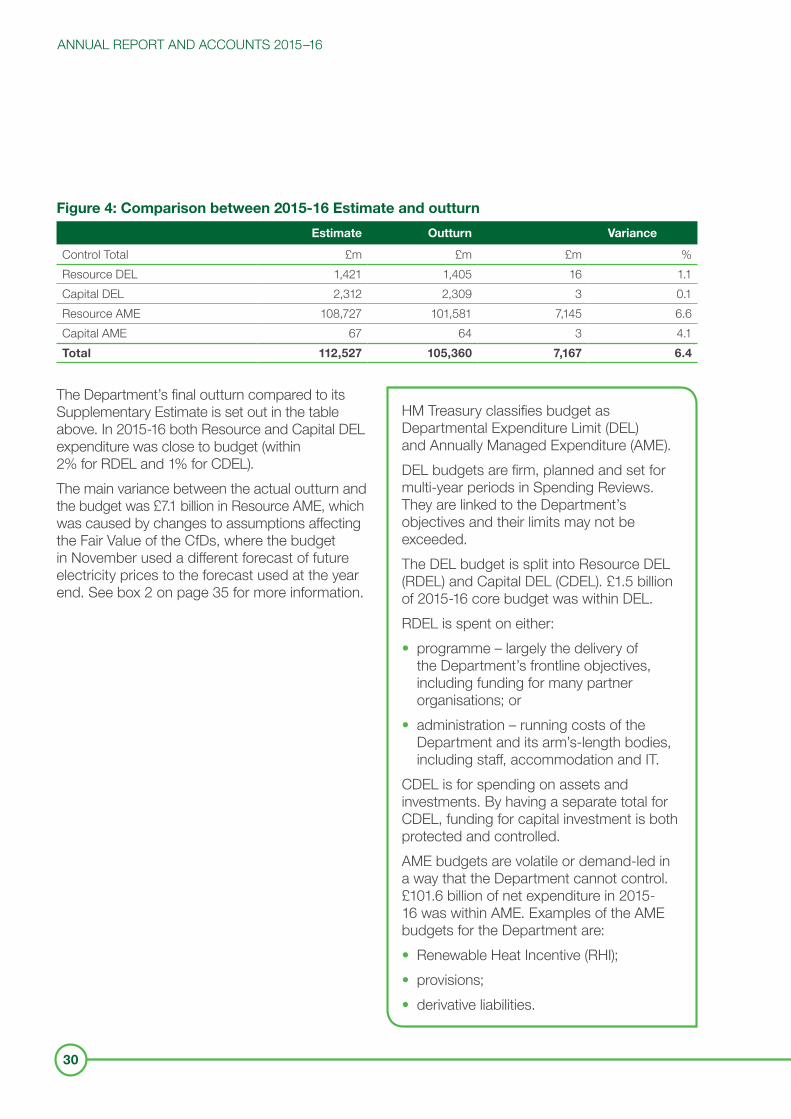
Figure 4: Comparison between 2015-16 Estimate and outturn
Estimate Outturn Variance
Control Total £m £m £m %Resource DEL 1,421 1,405 16 1.1Capital DEL 2,312 2,309 3 0.1Resource AME 108,727 101,581 7,145 6.6Capital AME 67 64 3 4.1Total 112,527 105,360 7,167 6.4
The Department’s final outturn compared to its Supplementary Estimate is set out in the table above. In 2015-16 both Resource and Capital DEL expenditure was close to budget (within 2% for RDEL and 1% for CDEL).The main variance between the actual outturn and the budget was £7.1 billion in Resource AME, which was caused by changes to assumptions affecting the Fair Value of the CfDs, where the budget in November used a different forecast of future electricity prices to the forecast used at the year end. See box 2 on page 35 for more information.
HM Treasury classifies budget as Departmental Expenditure Limit (DEL) and Annually Managed Expenditure (AME).DEL budgets are firm, planned and set for multi-year periods in Spending Reviews. They are linked to the Department’s objectives and their limits may not be exceeded. The DEL budget is split into Resource DEL (RDEL) and Capital DEL (CDEL). £1.5 billion of 2015-16 core budget was within DEL.RDEL is spent on either:• programme – largely the delivery of
the Department’s frontline objectives, including funding for many partner organisations; or
• administration – running costs of the Department and its arm’s-length bodies, including staff, accommodation and IT.
CDEL is for spending on assets and investments. By having a separate total for CDEL, funding for capital investment is both protected and controlled.AME budgets are volatile or demand-led in a way that the Department cannot control. £101.6 billion of net expenditure in 2015-16 was within AME. Examples of the AME budgets for the Department are:• Renewable Heat Incentive (RHI); • provisions;• derivative liabilities.
ACCOUNTABILITY REPORT
31
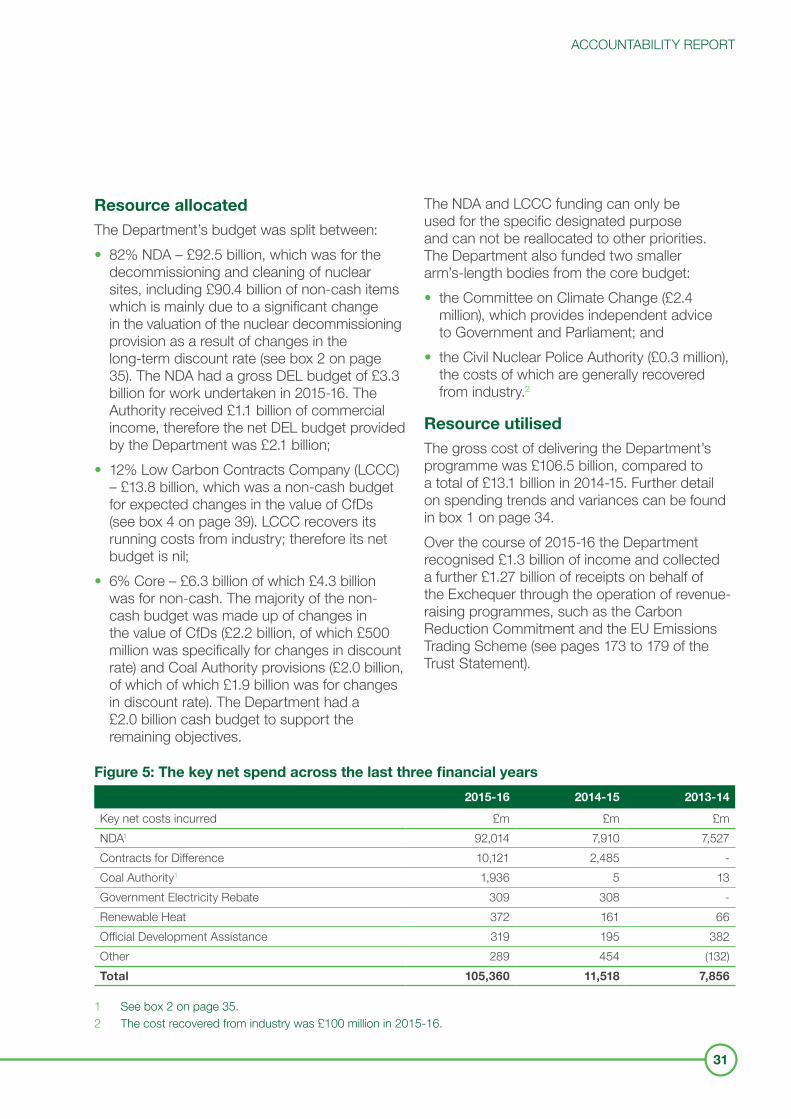
Resource allocatedThe Department’s budget was split between:• 82% NDA – £92.5 billion, which was for the
decommissioning and cleaning of nuclear sites, including £90.4 billion of non-cash items which is mainly due to a significant change in the valuation of the nuclear decommissioning provision as a result of changes in the long-term discount rate (see box 2 on page 35). The NDA had a gross DEL budget of £3.3 billion for work undertaken in 2015-16. The Authority received £1.1 billion of commercial income, therefore the net DEL budget provided by the Department was £2.1 billion;
• 12% Low Carbon Contracts Company (LCCC) – £13.8 billion, which was a non-cash budget for expected changes in the value of CfDs (see box 4 on page 39). LCCC recovers its running costs from industry; therefore its net budget is nil;
• 6% Core – £6.3 billion of which £4.3 billion was for non-cash. The majority of the non-cash budget was made up of changes in the value of CfDs (£2.2 billion, of which £500 million was specifically for changes in discount rate) and Coal Authority provisions (£2.0 billion, of which of which £1.9 billion was for changes in discount rate). The Department had a £2.0 billion cash budget to support the remaining objectives.
The NDA and LCCC funding can only be used for the specific designated purpose and can not be reallocated to other priorities. The Department also funded two smaller arm’s-length bodies from the core budget:• the Committee on Climate Change (£2.4
million), which provides independent advice to Government and Parliament; and
• the Civil Nuclear Police Authority (£0.3 million), the costs of which are generally recovered from industry.2
Resource utilisedThe gross cost of delivering the Department’s programme was £106.5 billion, compared to a total of £13.1 billion in 2014-15. Further detail on spending trends and variances can be found in box 1 on page 34.Over the course of 2015-16 the Department recognised £1.3 billion of income and collected a further £1.27 billion of receipts on behalf of the Exchequer through the operation of revenue-raising programmes, such as the Carbon Reduction Commitment and the EU Emissions Trading Scheme (see pages 173 to 179 of the Trust Statement).
Figure 5: The key net spend across the last three financial years
2015-16 2014-15 2013-14
Key net costs incurred £m £m £mNDA1 92,014 7,910 7,527Contracts for Difference 10,121 2,485 -Coal Authority1 1,936 5 13Government Electricity Rebate 309 308 -Renewable Heat 372 161 66Official Development Assistance 319 195 382Other 289 454 (132)Total 105,360 11,518 7,856
1 See box 2 on page 35.2 The cost recovered from industry was £100 million in 2015-16.
ANNUAL REPORT AND ACCOUNTS 2015–16
32
Statement of Financial Position (SoFP)Overall total assets less total liabilities was £(179.2) billion, compared to £(77.3) billion in 2014-15 and £(69.2) billion in 2013-14.The significant increase is driven by the changes to the valuation of the provisions, particularly the nuclear decommissioning provision. This is due to the change in the long-term discount rate, which inflated the present value of expected
future long-term costs. In prior years the discount rate had an opposite effect (see box 2 on page 35 for further detail). The value of the provisions has remained stable on an undiscounted basis.
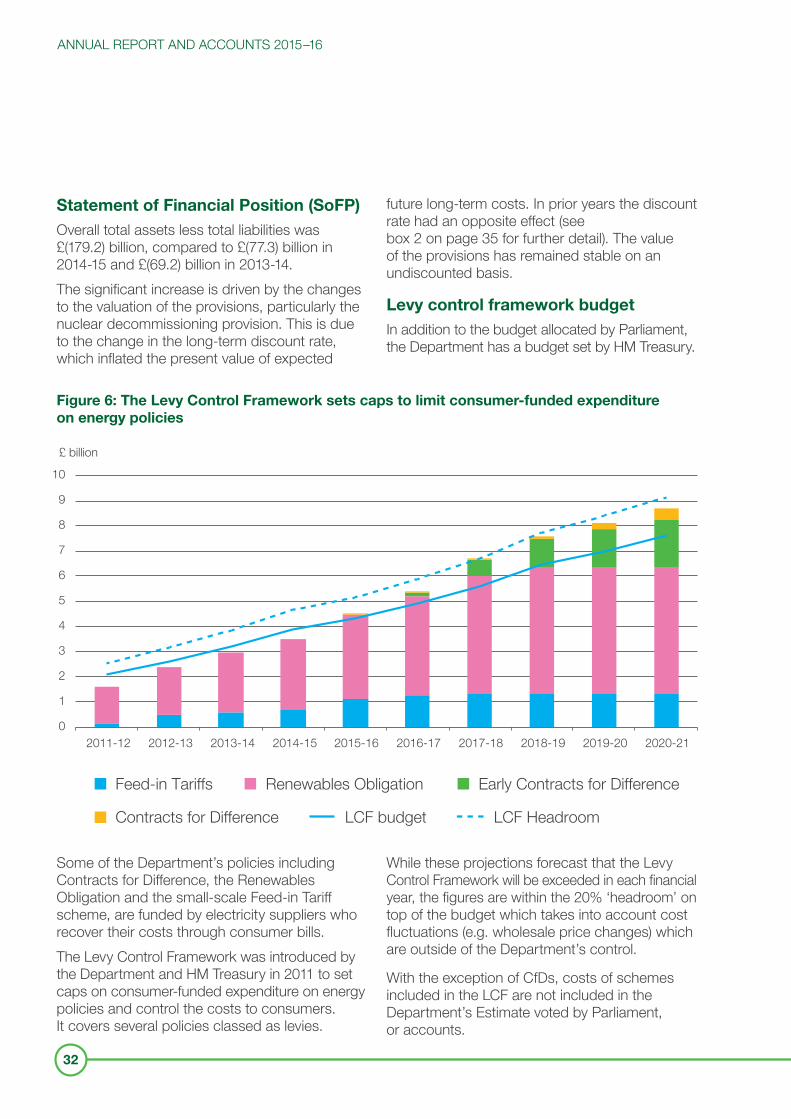
Levy control framework budgetIn addition to the budget allocated by Parliament, the Department has a budget set by HM Treasury.
Figure 6: The Levy Control Framework sets caps to limit consumer-funded expenditure on energy policies
£ billion
0
1
2
3
4
5
6
7
8
9
10
2011-12 2012-13 2013-14 2014-15 2015-16 2016-17 2017-18 2018-19 2019-20 2020-21
Feed-in Tariffs Renewables Obligation Early Contracts for Difference
Contracts for Difference LCF budget LCF Headroom
Some of the Department’s policies including Contracts for Difference, the Renewables Obligation and the small-scale Feed-in Tariff scheme, are funded by electricity suppliers who recover their costs through consumer bills.The Levy Control Framework was introduced by the Department and HM Treasury in 2011 to set caps on consumer-funded expenditure on energy policies and control the costs to consumers. It covers several policies classed as levies.
While these projections forecast that the Levy Control Framework will be exceeded in each financial year, the figures are within the 20% ‘headroom’ on top of the budget which takes into account cost fluctuations (e.g. wholesale price changes) which are outside of the Department’s control.
With the exception of CfDs, costs of schemes included in the LCF are not included in the Department’s Estimate voted by Parliament, or accounts.
ACCOUNTABILITY REPORT
33
Cost savingsThe Government has made clear that it is committed to continuing to reduce the deficit. Like the rest of Whitehall, the Department will make a significant contribution to meeting that objective. The Spending Review settlement for the Department represents a reduction of 22% of total RDEL budgets between 2015-16 and 2019-20. In addition, the Spending Review declared changes to several major programmes which will reduce spending across the Department’s DEL and AME budgets. The Government announced the closure of the Carbon Capture and Storage (CCS) Commercialisation Programme, which included up to £1 billion in potential capital funding to support projects involved in a competition to develop CCS technology. The Department is also consulting on changes to the RHI scheme to ensure that the renewable heat industry is supported in the most cost-effective way. The RHI forecasts to 2020-21 were amended during the Spending Review - the expected expenditure in 2020-21 will now be £700 million lower than the previous forecasts by the Office for Budget Responsibility (OBR).
Our prioritiesIn addition to realising these savings, the Department will focus on delivering a broad and complex policy portfolio.
We will secure energy supplies by: • incentivising the building of new power
stations, particularly new gas to replace the ageing estate;
• doing all we can to encourage shale exploration safely and responsibly; and
• supporting the development of new nuclear in the UK.
We aim to keep bills as low as possible by:• continuing to put consumers in control of their
energy use including through the roll out of smart meters;
• reforming the RHI and starting a new programme to provide capital funding and investment to heat network projects; and
• reforming the Energy Company Obligation to focus on those consumers in most need.
We will support the development of clean energy by:• setting the level of the fifth carbon budget
and laying out our plans for the UK’s climate targets in our new emissions reduction plan;
• increasing our investment in innovation over the Spending Review period, including running a competition to find the best value Small Modular Reactors for the UK; and
• internationally, maintaining the Government’s commitment to providing Official Development Assistance and continuing to advocate strong action on international climate change following the agreement made at COP 21 in Paris.
We will continue to manage our energy legacy safely and responsibly:• tackling the UK’s civil nuclear legacy securely
and cost-effectively;• supporting those previously involved in coal
mining and sponsoring the management of its lasting impacts by the Coal Authority;
• working with the industry and the Oil and Gas Authority to ensure the decommissioning of oil and gas infrastructure is properly planned for and delivered.
ANNUAL REPORT AND ACCOUNTS 2015–16
34
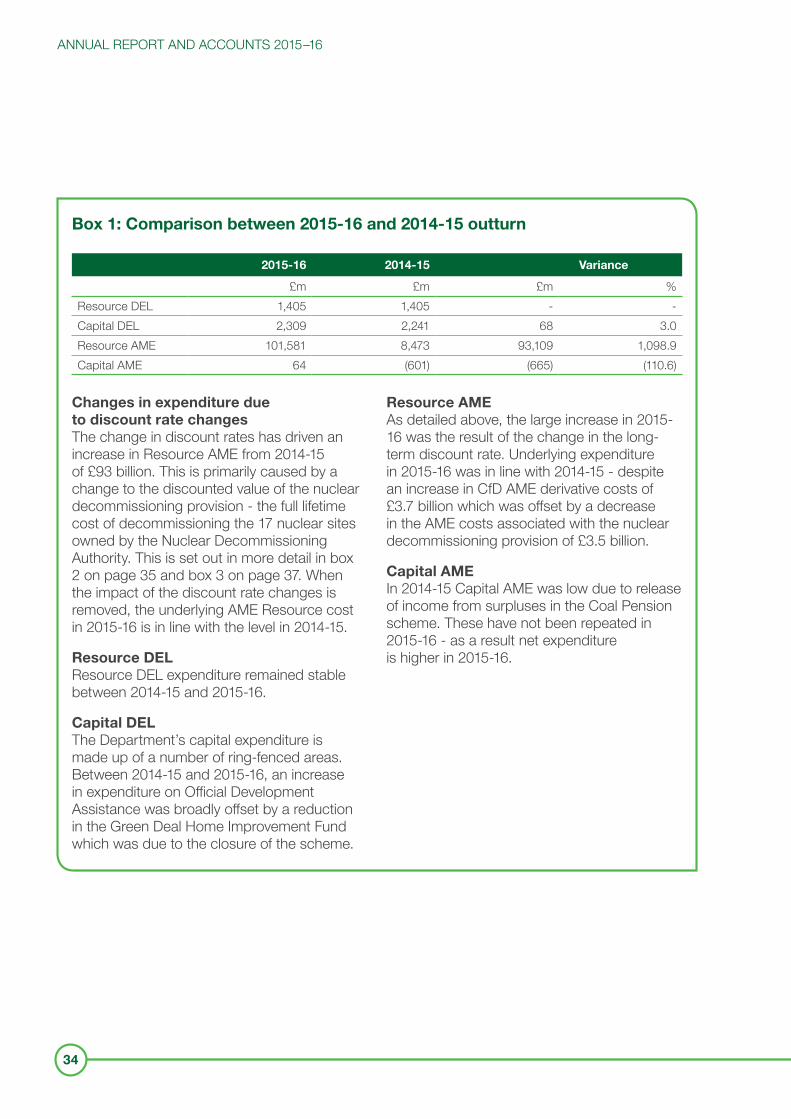
Box 1: Comparison between 2015-16 and 2014-15 outturn
2015-16 2014-15 Variance
£m £m £m %Resource DEL 1,405 1,405 - -Capital DEL 2,309 2,241 68 3.0Resource AME 101,581 8,473 93,109 1,098.9Capital AME 64 (601) (665) (110.6)
Changes in expenditure due to discount rate changesThe change in discount rates has driven an increase in Resource AME from 2014-15 of £93 billion. This is primarily caused by a change to the discounted value of the nuclear decommissioning provision - the full lifetime cost of decommissioning the 17 nuclear sites owned by the Nuclear Decommissioning Authority. This is set out in more detail in box 2 on page 35 and box 3 on page 37. When the impact of the discount rate changes is removed, the underlying AME Resource cost in 2015-16 is in line with the level in 2014-15.
Resource DELResource DEL expenditure remained stable between 2014-15 and 2015-16.
Capital DELThe Department’s capital expenditure is made up of a number of ring-fenced areas. Between 2014-15 and 2015-16, an increase in expenditure on Official Development Assistance was broadly offset by a reduction in the Green Deal Home Improvement Fund which was due to the closure of the scheme.
Resource AMEAs detailed above, the large increase in 2015-16 was the result of the change in the long-term discount rate. Underlying expenditure in 2015-16 was in line with 2014-15 - despite an increase in CfD AME derivative costs of £3.7 billion which was offset by a decrease in the AME costs associated with the nuclear decommissioning provision of £3.5 billion.
Capital AMEIn 2014-15 Capital AME was low due to release of income from surpluses in the Coal Pension scheme. These have not been repeated in 2015-16 - as a result net expenditure is higher in 2015-16.
ACCOUNTABILITY REPORT
35
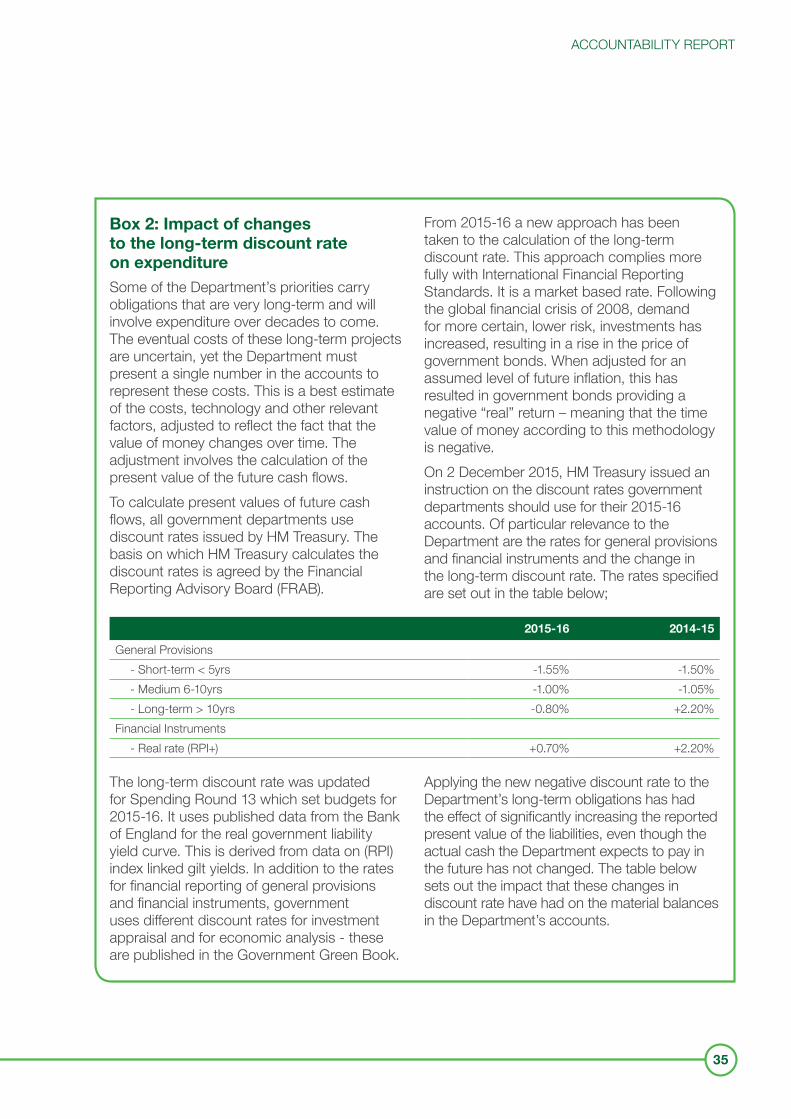
Box 2: Impact of changes to the long-term discount rate on expenditureSome of the Department’s priorities carry obligations that are very long-term and will involve expenditure over decades to come. The eventual costs of these long-term projects are uncertain, yet the Department must present a single number in the accounts to represent these costs. This is a best estimate of the costs, technology and other relevant factors, adjusted to reflect the fact that the value of money changes over time. The adjustment involves the calculation of the present value of the future cash flows. To calculate present values of future cash flows, all government departments use discount rates issued by HM Treasury. The basis on which HM Treasury calculates the discount rates is agreed by the Financial Reporting Advisory Board (FRAB).
From 2015-16 a new approach has been taken to the calculation of the long-term discount rate. This approach complies more fully with International Financial Reporting Standards. It is a market based rate. Following the global financial crisis of 2008, demand for more certain, lower risk, investments has increased, resulting in a rise in the price of government bonds. When adjusted for an assumed level of future inflation, this has resulted in government bonds providing a negative “real” return – meaning that the time value of money according to this methodology is negative.On 2 December 2015, HM Treasury issued an instruction on the discount rates government departments should use for their 2015-16 accounts. Of particular relevance to the Department are the rates for general provisions and financial instruments and the change in the long-term discount rate. The rates specified are set out in the table below;
2015-16 2014-15
General Provisions - Short-term < 5yrs -1.55% -1.50% - Medium 6-10yrs -1.00% -1.05% - Long-term > 10yrs -0.80% +2.20%Financial Instruments - Real rate (RPI+) +0.70% +2.20%
The long-term discount rate was updated for Spending Round 13 which set budgets for 2015-16. It uses published data from the Bank of England for the real government liability yield curve. This is derived from data on (RPI) index linked gilt yields. In addition to the rates for financial reporting of general provisions and financial instruments, government uses different discount rates for investment appraisal and for economic analysis - these are published in the Government Green Book.
Applying the new negative discount rate to the Department’s long-term obligations has had the effect of significantly increasing the reported present value of the liabilities, even though the actual cash the Department expects to pay in the future has not changed. The table below sets out the impact that these changes in discount rate have had on the material balances in the Department’s accounts.
ANNUAL REPORT AND ACCOUNTS 2015–16
36
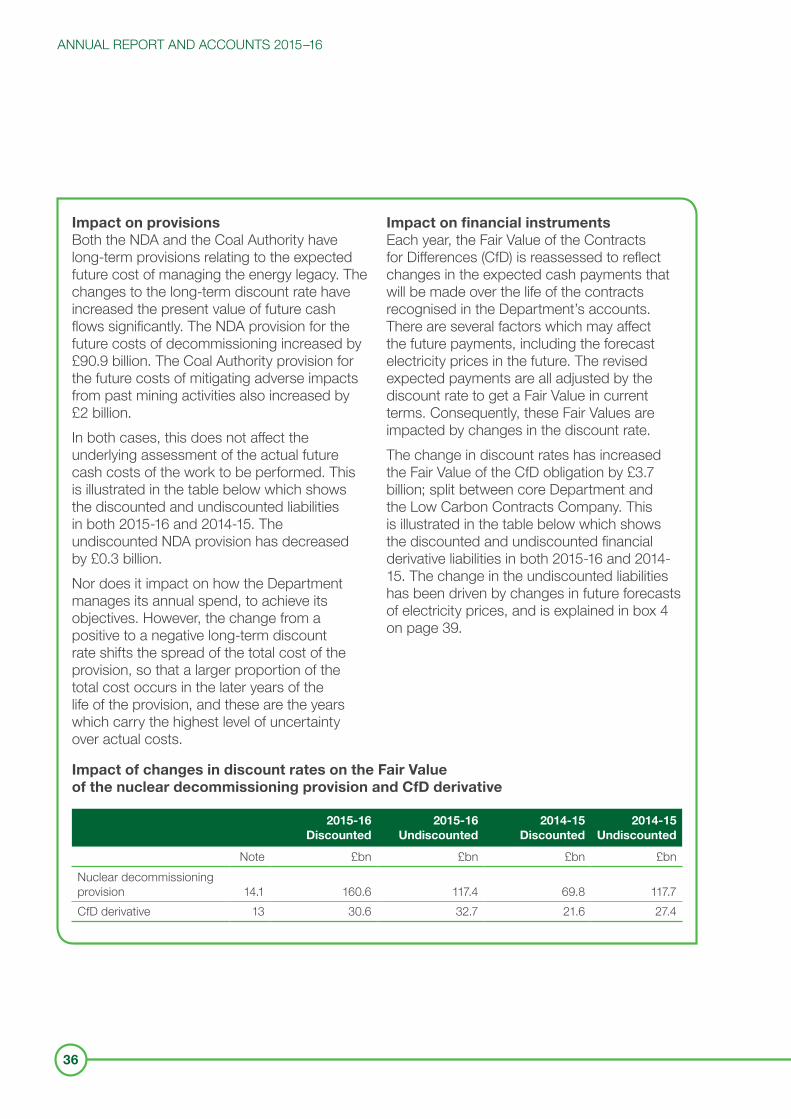
Impact on provisionsBoth the NDA and the Coal Authority have long-term provisions relating to the expected future cost of managing the energy legacy. The changes to the long-term discount rate have increased the present value of future cash flows significantly. The NDA provision for the future costs of decommissioning increased by £90.9 billion. The Coal Authority provision for the future costs of mitigating adverse impacts from past mining activities also increased by £2 billion.In both cases, this does not affect the underlying assessment of the actual future cash costs of the work to be performed. This is illustrated in the table below which shows the discounted and undiscounted liabilities in both 2015-16 and 2014-15. The undiscounted NDA provision has decreased by £0.3 billion.Nor does it impact on how the Department manages its annual spend, to achieve its objectives. However, the change from a positive to a negative long-term discount rate shifts the spread of the total cost of the provision, so that a larger proportion of the total cost occurs in the later years of the life of the provision, and these are the years which carry the highest level of uncertainty over actual costs.
Impact on financial instrumentsEach year, the Fair Value of the Contracts for Differences (CfD) is reassessed to reflect changes in the expected cash payments that will be made over the life of the contracts recognised in the Department’s accounts. There are several factors which may affect the future payments, including the forecast electricity prices in the future. The revised expected payments are all adjusted by the discount rate to get a Fair Value in current terms. Consequently, these Fair Values are impacted by changes in the discount rate.The change in discount rates has increased the Fair Value of the CfD obligation by £3.7 billion; split between core Department and the Low Carbon Contracts Company. This is illustrated in the table below which shows the discounted and undiscounted financial derivative liabilities in both 2015-16 and 2014-15. The change in the undiscounted liabilities has been driven by changes in future forecasts of electricity prices, and is explained in box 4 on page 39.
Impact of changes in discount rates on the Fair Value of the nuclear decommissioning provision and CfD derivative
2015-16 Discounted
2015-16 Undiscounted
2014-15 Discounted
2014-15 Undiscounted
Note £bn £bn £bn £bnNuclear decommissioning provision 14.1 160.6 117.4 69.8 117.7CfD derivative 13 30.6 32.7 21.6 27.4
ACCOUNTABILITY REPORT
37
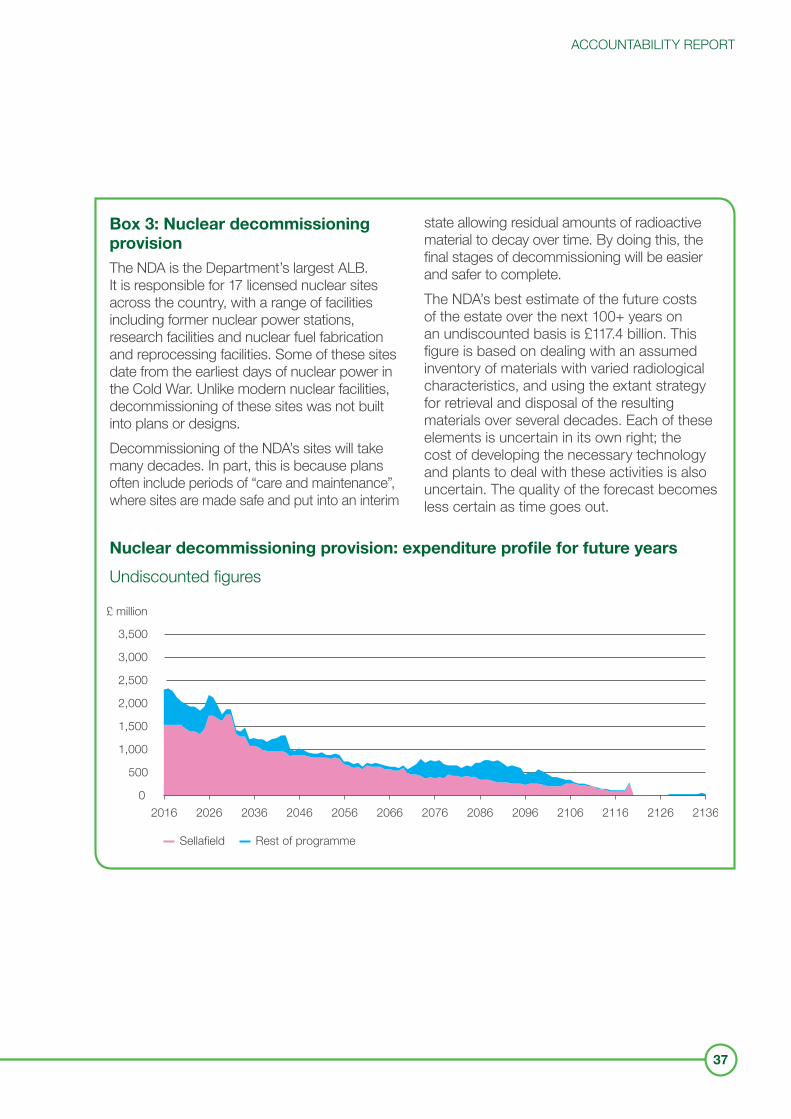
Box 3: Nuclear decommissioning provisionThe NDA is the Department’s largest ALB. It is responsible for 17 licensed nuclear sites across the country, with a range of facilities including former nuclear power stations, research facilities and nuclear fuel fabrication and reprocessing facilities. Some of these sites date from the earliest days of nuclear power in the Cold War. Unlike modern nuclear facilities, decommissioning of these sites was not built into plans or designs. Decommissioning of the NDA’s sites will take many decades. In part, this is because plans often include periods of “care and maintenance”, where sites are made safe and put into an interim
state allowing residual amounts of radioactive material to decay over time. By doing this, the final stages of decommissioning will be easier and safer to complete. The NDA’s best estimate of the future costs of the estate over the next 100+ years on an undiscounted basis is £117.4 billion. This figure is based on dealing with an assumed inventory of materials with varied radiological characteristics, and using the extant strategy for retrieval and disposal of the resulting materials over several decades. Each of these elements is uncertain in its own right; the cost of developing the necessary technology and plants to deal with these activities is also uncertain. The quality of the forecast becomes less certain as time goes out.
Nuclear decommissioning provision: expenditure profile for future years
Undiscounted figures
0
500
1,000
1,500
2,000
2,500
3,000
3,500
2016 2026 2036 2046 2056 2066 2076 2086 2096 2106 2116 2126 2136
Sellafield Rest of programme
£ million

ANNUAL REPORT AND ACCOUNTS 2015–16
38
NDA has reviewed the methodologies used in the calculation, taking into account HM Treasury Green Book guidance and the need to remove optimism bias. Typically a project many years into the future, where technology is new or the nature of material to be handled is unconfirmed, could have a range of estimates from -50% to +300%. In light of uncertainties in the estimate, NDA considers it prudent to present a credible range of outcomes. The range for the current year is £95 billion to £218 billion on an undiscounted basis.
In-year changes to the provision Changes in the provision estimate have arisen from: • the value of work completed during the
financial year, which is released from the provision, reducing it by £2.9 billion;
• the expected value of future work increases, as the NDA improves its knowledge of the uncertainties that it faces and how best to deal with them. This has caused a net increase of £1.8 billion.
Effect of the change in the discount rateA change in discount rates only affects the discounted total, it has no impact on the undiscounted cost. The undiscounted total of the nuclear decommissioning provision is £117.4 billion at the end of 2015-16 (2014-15: £117.7 billion). The application of the negative short, medium, and long-term rates produce an overall discounted total as shown in the accounts of £160.7 billion. If discount rates had remained unchanged the provision would be £71.1 billion. The rationale for the changes in discount rates is set out in box 2 on page 35.
ACCOUNTABILITY REPORT
39
Box 4: Contracts for Difference (CfDs)CfDs are designed to incentivise the investment needed to sustainably deliver the UK’s goals for renewable and other low carbon electricity. The contracts provide the generator with a stable pre-agreed price (the “strike price”) for the lifetime of the contract. This is done by paying the difference where prices are less than the strike price and receiving the difference when prices are higher than the strike price.
Strike pricesThe strike price is the price that generators will receive for the electricity they supply, with the support payments actually paid (or repaid) being the difference between this price and the market reference price.
Low Carbon Contracts Company (LCCC)Difference payments (i.e. the support payments) under the contracts are funded through a levy paid by licensed energy suppliers. The LCCC is the company established by Government to collect the levy, manage the CfDs and pay or receive the contracted difference payments. Currently the LCCC is managing 40 CfDs.
Fair ValueIn order to comply with the relevant accounting standards, the Department is required to estimate the Fair Value of future CfD payments. At the end of 2015-16 this was estimated to be £30.6 billion (2014-15: £21.6 billion) – which was calculated using a model that forecasts the rate of generation, expected demand for electricity and electricity prices over the term of the contract. The figures in accounts represent management’s best current estimate within a range of scenarios which are likely to change over time. The sensitivities are set out in detail in Note 13 on page 154.
Accounting treatment for the liabilityThe initial Fair Value of £19.1 billion was deferred upon initial contract recognition in 2014-15 in accordance with accounting standards. Subsequent movements in the Fair Value of the CfDs have been recognised in the accounts; the net cost of these movements was £10.1 billion in 2015-16 (2014-15: £2.5 billion). Further details on the CfDs can be found in Note 13 on page 150. Detail of the impact of the change in the discount rate on the Fair Value of CfDs can be found in box 2 on page 35.
ANNUAL REPORT AND ACCOUNTS 2015–16
40
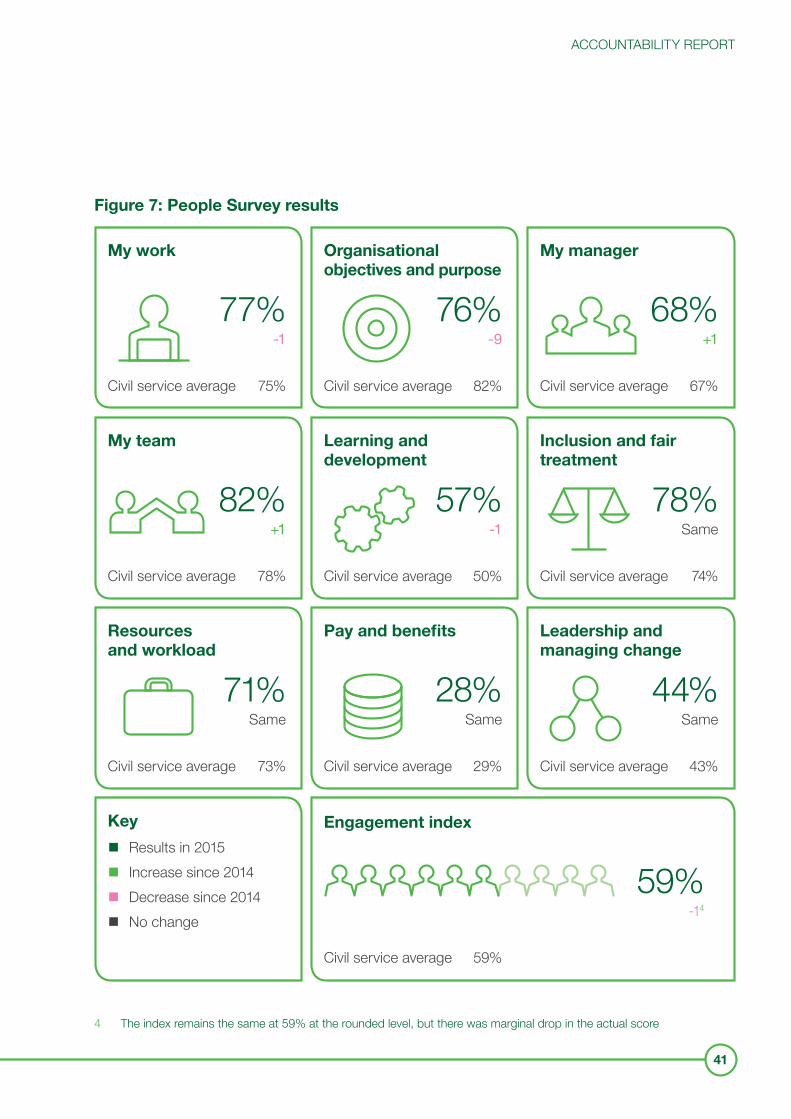
Staff attitudesEach year the Department takes part in the Civil Service People Survey. In the 2015 survey, our engagement index remained at 59%, which ranked the Department 47th out of 96 Civil Service organisations surveyed. The Department’s response rate was 95%; 4 points up from the previous year, the highest for its size and second highest across the participating departments. Figure 7 shows our results. In response to the survey results, our Executive Committee agreed to continue focusing on five areas for improvement and added a sixth area:• leading and managing change; • my manager; • diversity and inclusion; • resources and workload; • organisational unity; • organisational objectives and purpose.In addition, team leaders have been working closely with their teams to identify areas for improvement and are taking local actions. For more information, see ‘the Staff Report’ pages 72 to 77 and the summary of key findings for the Department’s Public Attitudes Tracker.3
Other information
Reporting entitiesA description of the reporting entities can be found in Note 22 on page 171 to the accounts.
Events after the reporting periodDetails of such events can be found in Note 21 on page 170 to the accounts.
Pension liabilitiesStaff who joined the public sector after 1 April 2015 can become members of either the Alpha or Partnership pension schemes. Existing staff at 31 March 2015 will also have past contributions
held in one or more of the Principal Civil Service Pension Schemes (PCSPS). The Department’s contributions into the schemes as an employer are reflected in the accounts within staff costs, in Note 3 on pages 119 to 120. The PCSPS and alpha schemes are unfunded, multi-employer defined benefit schemes and the Department is consequently unable to identify its share of the underlying assets and liabilities. The schemes are therefore not reflected on the Department’s Statement on Financial Position. Further details can be found in Note 8.7 on page 142 to the accounts.
Payment of suppliersThe Department is an approved signatory to the Better Payment Practice Code. The Department monitors payments against a 5 working-day target and in 2015-16 98.8% of payments were made within 5 working days compared to 99.37% in 2014-15.
Disclosure of audit informationThe Accounting Officer and directors have taken all necessary steps to obtain all relevant audit information and bring it to the attention of the Department’s auditors. They are not aware of any missing audit information or of any relevant information not brought before the auditors.
Personal dataThere have been no significant reported incidents of lost personal data.
Board detailsPlease see the Governance Statement on pages 43 to 57.
Jeremy PocklingtonPrincipal Accounting Officer and Acting Permanent Secretary1 July 2016
3 https://www.gov.uk/government/uploads/system/uploads/attachment_data/file/519488/PAT_Wave_17_Summary_of_key_findings.pdf
ACCOUNTABILITY REPORT
41
Figure 7: People Survey results
My work
77% -1
Civil service average 75%
Organisational objectives and purpose
76% -9
Civil service average 82%
My manager
68% +1
Civil service average 67%
My team
82% +1
Civil service average 78%
Learning and development
57% -1
Civil service average 50%
Inclusion and fair treatment
78% Same
Civil service average 74%
Resources and workload
71% Same
Civil service average 73%
Pay and benefits
28% Same
Civil service average 29%
Leadership and managing change
44% Same
Civil service average 43%
Key
Results in 2015 Increase since 2014 Decrease since 2014 No change
Engagement index
59%
-14
Civil service average 59%
4 The index remains the same at 59% at the rounded level, but there was marginal drop in the actual score
ANNUAL REPORT AND ACCOUNTS 2015–16
42
STATEMENT OF ACCOUNTING OFFICER’S RESPONSIBILITIES Under the Government Resources and Accounts Act 2000 (the GRAA), HM Treasury has directed the Department of Energy & Climate Change to prepare, for each financial year, consolidated resource accounts detailing the resources acquired, held or disposed of, and the use of resources, during the year by the Department (inclusive of its executive agency) and its sponsored non-departmental and other arm’s length public bodies designated by order made under the GRAA by Statutory Instrument 2015 No. 632 as amended by Statutory Instrument 2015 No. 2062 (together known as the ‘Departmental Group’, consisting of the Department and sponsored bodies listed at Note 22 to the accounts). The accounts are prepared on an accruals basis and must give a true and fair view of the state of affairs of the Department and the Departmental Group and of the net resource outturn, application of resources, changes in taxpayers’ equity and cash flows of the Departmental Group for the financial year. In preparing the accounts, the Accounting Officer of the Department is required to comply with the requirements of the Government Financial Reporting Manual and in particular to: • observe the Accounts Direction issued by the
Treasury, including the relevant accounting and disclosure requirements, and apply suitable accounting policies on a consistent basis;
• ensure that the Department has in place appropriate and reliable systems and procedures to carry out the consolidation process;
• make judgements and estimates on a reasonable basis, including those judgements involved in consolidating the accounting information provided by non-departmental and other arm’s length public bodies;
• state whether applicable accounting standards as set out in the Government Financial Reporting Manual have been followed, and disclose and explain any material departures in the accounts; and
• prepare the accounts on a going concern basis. HM Treasury has appointed the Permanent Head of the Department as Accounting Officer of the Department of Energy & Climate Change. The Accounting Officer of the Department has also appointed the Chief Executives of its sponsored non-departmental and other arm’s length public bodies as Accounting Officers of those bodies. The Accounting Officer of the Department is responsible for ensuring that appropriate systems and controls are in place to ensure that: • any grants that the Department makes to its
sponsored bodies are used for their intended purposes; and
• income and expenditure of the sponsored bodies are properly accounted for, in the consolidation of the resource accounts.
Under their terms of appointment, the Accounting Officers of the sponsored bodies are accountable for the use, including the regularity and propriety, of the grants received and the other income and expenditure of the sponsored bodies.The responsibilities of an Accounting Officer are set out in Managing Public Money published by HM Treasury. They include:• the propriety and regularity of the public
finances for which the Accounting Officer is answerable;
• keeping proper records: and • safeguarding the assets of the Department,
non-departmental or other arm’s-length public body for which the Accounting Officer is responsible.
ACCOUNTABILITY REPORT
43
GOVERNANCE STATEMENTIntroductionThis Governance Statement sets out the governance, risk management and internal control arrangements for the Department, in accordance with HM Treasury guidance. It applies to the financial year 1 April 2015 to 31 March 2016 and up to the date of approval of the Annual Report and Accounts. It integrates information about the Department’s non-departmental public bodies (NDPBs) included in the consolidated group accounts. The Department’s goals affect every household and business throughout the UK. As a result; many of the Department’s programmes are also highly interdependent, complex and long-term. It has been necessary for governance, structures, staffing and systems to evolve as we develop and implement policy, and deliver on our major programmes and projects.
Report of the lead non-executive director The Department’s team of non-executive directors on the main Board remained the same in 2015-16, providing stability and consistency. We did, though, say goodbye to Barry Rourke, who left the Department in February 2016 after six years’ of excellent service. We thank him for his efforts and wish him well for the future.In our role as non-executive directors, Rachel Campbell and I provided advice on the Department’s Consumer First project in our capacity as Consumer Champions. I also continue to advise the recently established Energy Consumer Board. Charles Randell has been assisting with the impact of the low oil price on the UK Continental Shelf. Tom Kelly has provided valuable advice on governance and added rigour to examination of some of the key assumptions which underlie a number of the Department’s forecasts.
In 2015-16 the Secretary of State, Amber Rudd, announced her vision and priorities for energy and climate change policy to deliver secure, affordable and clean energy. The Department has developed this vision and has delivered on a number of key milestones, including securing Royal Assent for the Energy Bill, and reforming the Capacity Market. Departmental governance structures have been firmly established with the creation of six Policy Boards, which constitute the second tier of governance. This new structure has simplified governance beneath the Departmental Board and has provided more clarity on reporting lines. We continue to work to ensure good visibility and lines of communication exist between all layers of the Department’s governance arrangements. The Department has also run a Voluntary Exit Scheme to reduce its size. This process has now been successfully completed and, following a business planning process, the Department is now structured to deliver its ambitious and important programme of work. My Non-Executive Director colleagues and I have found the Department to be very open and receptive to advice and recommendations. During 2015-16, the Department has made much progress and is in good shape for the future challenges ahead.
Martin Stewart Lead Non-Executive Director
ANNUAL REPORT AND ACCOUNTS 2015–16
44
DEPARTMENTAL BOARD AND LEADERSHIP TEAM1. Amber Rudd Secretary of State for Energy & Climate Change and Chair of the Departmental Board Amber Rudd MP was appointed Secretary of State for Energy & Climate Change on 11 May 2015. Elected as Conservative MP for Hastings and Rye in 2010, in the last Parliament she served as Parliamentary Private Secretary to the Chancellor of the Exchequer and subsequently Parliamentary Under-Secretary of State for Energy & Climate Change. Before entering Parliament, Amber worked in investment banking in the City of London and New York, before moving into venture capital.
2. Andrea Leadsom Minister of State Andrea Leadsom is the Conservative MP for South Northamptonshire. She has served as Minister of State for Energy at the Department since 11 May 2015, having previously held the post of Economic Secretary to the Treasury from April 2014. Andrea worked in the banking and finance industry for 25 years, including as Head of Corporate Governance and Senior Investment Officer at Invesco Perpetual, one of the UK’s largest retail fund managers.
3. Lord Bourne of AberystwythParliamentary Under Secretary of State Lord Bourne was appointed Parliamentary Under Secretary of State for the Department and the Wales Office in May 2015, and is also a Lord in Waiting. He was Assembly Member for Mid and West Wales from 1999 to 2011 and Leader of the Opposition in the National Assembly for Wales between 2007 and 2011. He has taught law at Hong Kong University, the London School of Economics and at Cambridge University and was Professor of Law at Swansea Law School.
4. Martin Stewart Lead Non-Executive Director and Deputy Chair of the Departmental Board Martin Stewart is the current Football Association’s Chief Financial Officer. He is also a non-executive director and Audit Committee Chair at the London 2017 World Championship Athletics Organisation, as well as being a non-executive director of TV broadcaster OSN. He was previously the CEO of Eurotaxglass Ltd, CFO and Board Member at BskyB plc, CFO and Board Member at EMI plc. He was also a Director General at Cableuropa, a member of LOCOG’s Board of Directors, where he was Chair of the Audit Committee and member of the Remuneration Committee.
5. Tom Kelly Non-Executive Director Tom Kelly is a Strategic Communications Adviser at HS2. He was previously at Network Rail where he was Corporate Communications Director until the end of March 2014. He previously spent 16 years with the BBC working in Belfast and London, and nearly a decade in government, first as Director of Communications at the Northern Ireland Office, and then from 2001 to 2007 as the Prime Minister’s official spokesperson. Following Downing Street, Tom moved to BAA then the Financial Services Authority, before Network Rail.
6. Charles Randell CBENon-Executive Director Charles Randell CBE is an independent director of the Bank of England’s Prudential Regulation Authority, which supervises UK banks, insurance companies and large investment firms. Until 2013 he was a partner in Slaughter and May. He worked on the electricity and gas privatisations, the strategic review of British Nuclear Fuels Limited, the restructuring of British Energy, and extensive global financial crisis work for HM Treasury. Private sector clients included major energy companies. Charles is a Visiting Fellow at Queen Mary University of London.
ACCOUNTABILITY REPORT
45
7. Rachel Campbell Non-Executive Director Rachel Campbell is the Global Head of People, Performance and Culture for KPMG International. She is accountable for the firm’s global people strategy and communications. Previously she was the UK Head of People (and of Europe LLP) and was a Board member of both the UK and Europe LLP firms. Rachel is a chartered accountant and has operated as an audit partner for the firm working predominantly with global fast-moving consumer goods clients. She is a Fellow of the Chartered Institute of Personnel and Development.
8. Caroline Mawhood Non-Executive Member Caroline Mawhood has been a prominent figure in auditing for more than 30 years. She was Assistant Auditor General at the National Audit Office until 2009 and President of the Chartered Institute of Public Finance and Accountancy. She is also a non-executive member of the Audit Committees of the Debt Management Office, the Corporation of London and the Audit Progress Committee of the European Commission. She is also the Honorary Treasurer of Breast Cancer Now and a trustee of the Wimbledon Guild.
9. Jayne Scott Non-Executive Member Jayne Scott has extensive experience as a non-executive director, currently holding appointments with the Marine Management Organisation and the Professional Standards Authority. She was previously a Non-Executive Director and Audit Committee Chair of Ofgem, and Deputy Chair of ENTRUST. She is a qualified chartered accountant, having worked for PricewaterhouseCoopers, Lothian Health Board and Fife Health Board. She won the Scottish Finance Director of the Year Award for the public sector in 1998.
10. Barry Rourke Non-Executive Member Barry Rourke is a chartered accountant and was for many years a partner with PricewaterhouseCoopers, until early retirement in 2001. While there, Barry specialised in audit and advisory work in the oil and gas and mining industries. He is currently Chair of 3Legs Resources plc and a Non-Executive Director of New World Resources NV, Croydon Economic Development Company and Surrey and Borders Partnership NHS Foundation Trust. Barry completed term as NEM on 8 February 2016.
11. Stephen Lovegrove Permanent Secretary Stephen Lovegrove became Permanent Secretary in February 2013 and left on 22 April 2016 to become Permanent Secretary of the Ministry of Defence. Previously, he was Chief Executive during a 9-year stint at the Shareholder Executive and head of the European media team during 10 years at Deutsche Bank. Stephen was Government representative on the board of LOCOG, a trustee of the Charities Aid Foundation, Chair of British Nuclear Fuels Limited and a Non-Executive Director of Grosvenor Britain and Ireland.
12. Jeremy Pocklington Acting Permanent Secretary Jeremy Pocklington is acting Permanent Secretary, stepping up from DG of the Markets and Infrastructure Group. He was Director of the Enterprise and Growth Unit at HM Treasury, which he joined in 1997, and advised on public spending for the Department and many other Government departments. From 2009 to 2012 he was Director of the Economic and Domestic Affairs Secretariat at the Cabinet Office.

ANNUAL REPORT AND ACCOUNTS 2015–16
46
13. Clive Maxwell Executive Member Clive Maxwell is DG, Energy Efficiency and Heat at the Department. Previously, Clive was Chief Executive at the Office of Fair Trading (OFT) from July 2012 to February 2014, after being on its board as an Executive Director and working as Senior Director, Services Sector. Prior to joining the OFT, Clive worked in a wide range of roles for HM Treasury from 1992 to 2009, and for the European Competition Network and the EU’s Financial Services Committee.
14. Angie Ridgwell Executive Member Angie Ridgwell joined the Department as DG for Corporate Services in October 2013. Prior to this, Angie was Interim City Director (CEO) and Interim Strategic Director of Organisational Design for Bristol City Council. She has had a successful career working with a range of local authorities and government agencies, as well as in the private sector, including as Chief Executive and Chief Finance Officer.
15. Katrina Williams Executive Member Katrina Williams is the Department’s DG for International, Science and Resilience. Prior to this Katrina was DG for Strategy, Evidence and Customers at Defra, having been its DG for Food and Farming. Throughout her career she has had a range of roles in DTI and Cabinet Office as well as MAFF and Defra and has twice served in HM Diplomatic Service in the UK’s Permanent Representation to the EU in Brussels.
16. Stephen Speed Acting Executive Member Stephen Speed is acting DG of the Markets and Infrastructure group, stepping up from Director of Energy Development, which looked after UK oil and gas reserves, including new shale gas plays, the environmental regulation of offshore oil and gas activity, and legacy management of former nationalised coal mining activities. His team also
advises ministers on major energy infrastructure planning consent decisions. Stephen was previously Chief Executive and Inspector General of the Insolvency Service and Director of Regional Economic Development at BIS.
17. John Loughhead Executive Member Professor John Loughhead OBE FREng FTSE was appointed Chief Scientific Advisor for the Department in October 2014. Previously, John was Executive Director of the UK Energy Research Centre. He has been active in energy systems research for over 30 years, developing new generation, conversion and system technologies, and has extensive interactions with UK and international government bodies on energy policy and technology development. John is a chartered engineer, graduating in mechanical engineering from Imperial College, London.
18. Susannah Storey Executive Member Susannah Storey joined the Department in March 2013 and became Strategy Director in September 2013. Susannah was previously at BIS where she was Director of the Royal Mail and Postal Services team in the Shareholder Executive and a Non-Executive Director of Post Office Ltd. She joined the Shareholder Executive in 2006 and was Director for a variety of portfolio companies, Chief Operating Officer and a member of the Executive Committee. Before that, she worked in UK Corporate Finance at Schroders and then Citigroup.
19. Jo Shanmugalingam Executive Member Jo Shanmugalingam joined the Department in April 2013 and became Strategy Director in September 2013. Prior to that, Jo worked at BIS where roles included responsibility for Lord Heseltine’s review of growth policy and the UK’s corporate governance framework. From 2005 to 2011 Jo worked for the Shareholder Executive in a number of different roles including responsibility for the 2011 Postal Services Act and the Government’s policy and shareholder interests in Post Office Ltd. Jo and Susannah job share the strategy director role.
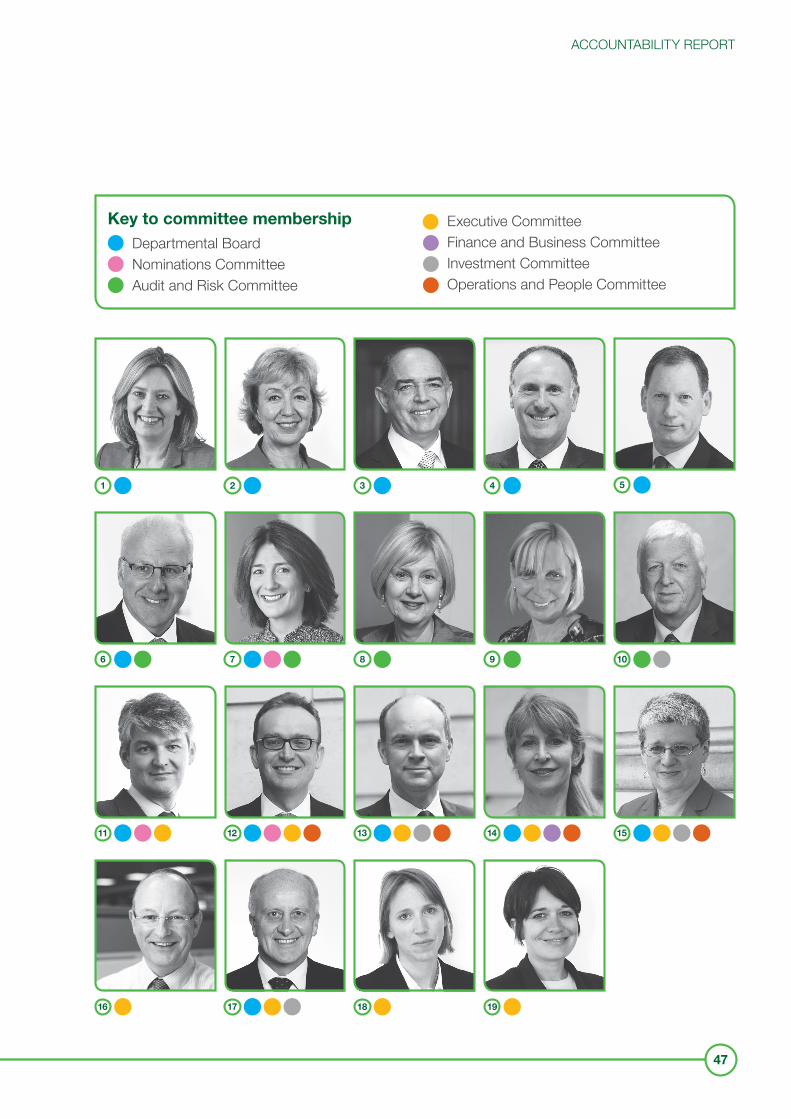
ACCOUNTABILITY REPORT
47
14
9 10
5
15
4
13
8
3
12
7
2
11
6
1
Key to committee membership Departmental Board Nominations Committee Audit and Risk Committee
Executive Committee Finance and Business Committee Investment Committee Operations and People Committee
19181716
ANNUAL REPORT AND ACCOUNTS 2015–16
48
Governance structures In 2015-16, the Department’s governance structures have undergone continuous improvement. The Departmental Board is attended by ministers, non-executive directors (NEDs) and the executive team. It provides collective strategic leadership, with responsibilities for performance, risk, and delivery, including appropriate oversight of NDPBs. The Board has been supported in its work by the Audit and Risk Committee, the Nominations Committee and the Executive Committee, the Chairs of which are drawn from the Board. The Board has a full complement of NEDs with a good mix of skills and experiences, enabling it to discharge its duties effectively. Full membership of the committees is provided on page 47.The Departmental Board held five meetings in 2015-16, and there was an additional meeting between the executive team and NEDs. At each meeting, the Board received reports from the Permanent Secretary, the Departmental Performance Report and the Departmental Risk Register (DRR). The Board conducted an evaluation of its own effectiveness in February 2016, following up on a light touch review in February 2015. The 2016 review concluded that the Board was effective. The Board will continue to look at its long-term planning and monitor effectiveness on an ongoing basis. The Audit and Risk Committee met six times in 2015-16. This committee is chaired by Charles Randell, one of our Non-Executive Directors. Assurance was provided on the quality of the Department’s Annual Report and Accounts, the effectiveness of governance, risk management and internal control arrangements.
The Nominations Committee met four times in 2015-16. This committee is chaired by Rachel Campbell, one of our Non-Executive Directors. Assurance was provided on the systems for identifying and developing leadership and talent, plans for Directors General appointments, as well as incentives and rewards for Executive Board members.The Departmental Board delegates certain responsibilities to the Executive Committee (ExCo). The remit of ExCo is to ensure the operational management of the Department is effective in delivering its strategy. The Committee has focused on ensuring the Department is equipped to implement the priorities of the new Government. In October 2013 a committee structure was implemented through which the ExCo could delegate some of its responsibility to three committees:• Finance and Business Committee;• Investment Committee; and• Operations and People Committee.This structure is now well established and consequently effective support is being provided to ExCo. Each Committee provides a monthly written report to ExCo, summarising progress, decisions and issues for escalation, as appropriate. The Finance and Business Committee is responsible for monitoring performance, finance, risks, and the development of the Department’s business plans and Annual Report and Accounts. It meets on a monthly basis.
ACCOUNTABILITY REPORT
49
The Investment Committee is responsible for approving new projects and programmes and assesses the performance of existing activity at major milestones. Its role is to consider whether planned investments, programmes and policies are strategically important, affordable, supported by a sound business case, and offer value for money to the Department. It meets fortnightly, depending on volume of business. This year the Investment Committee underwent a review. ExCo and Audit and Risk Committee agreed recommendations which included lowering the delegation threshold to £10 million (including potentially delegating decisions on cases between £10-100 million to a sub-committee), introducing a strict gated process, and the introduction of a pooled membership, including independent members.
The Operations and People Committee is responsible for ensuring that we have the right people with the right skills in the right working environment with the right tools. The Committee’s purpose is to ensure the Department has the staff capability, buildings and IT services to deliver its objectives. It also oversees operational matters to ensure the Department complies with Cabinet Office and legal requirements including information management, transparency, digital strategies, security management, and shared services needs. It meets on a monthly basis.The Department has revised the official second tier of governance by streamlining 84 governance forums into six Policy Boards to fulfil this function. These Boards oversee key cross-cutting policy and strategy advice in their areas, providing assurance to the ExCo on policy and providing a forum for individual teams to seek advice on their policy work. This new structure has simplified governance below the departmental level, ensuring that reporting lines are clearer.
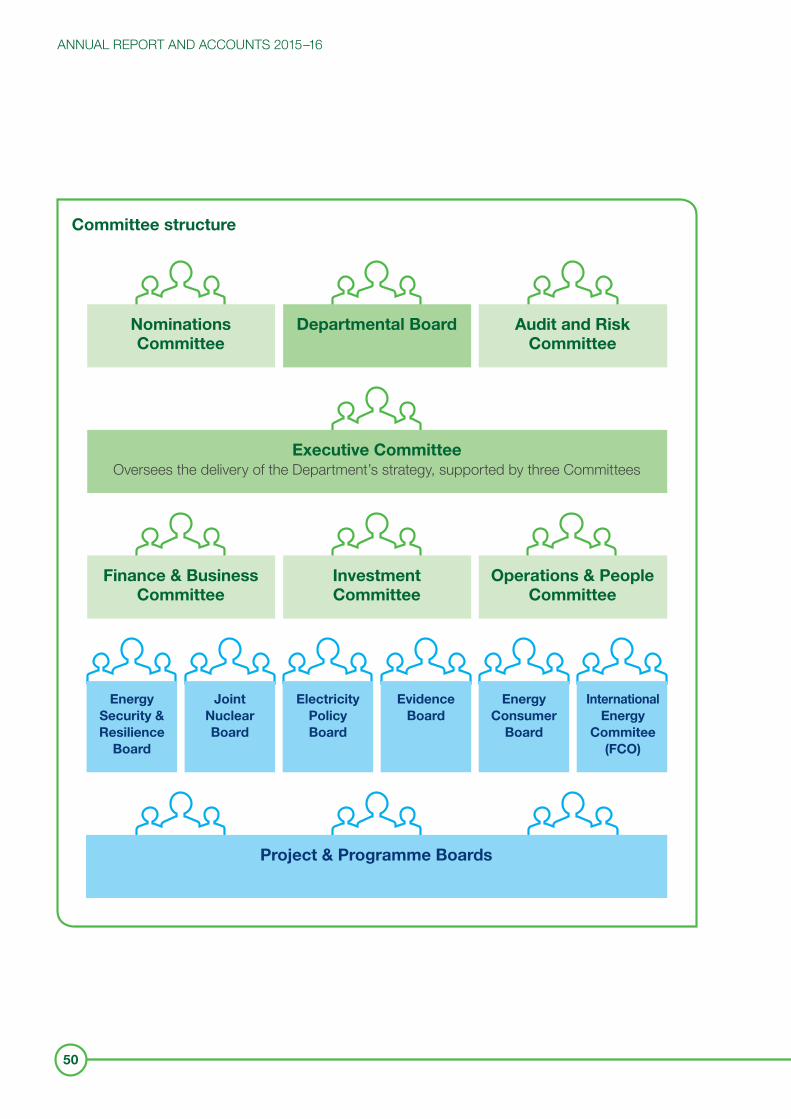
ANNUAL REPORT AND ACCOUNTS 2015–16
International Energy
Commitee (FCO)
Energy Consumer
Board
Evidence Board
Electricity Policy Board
Joint Nuclear Board
Energy Security & Resilience
Board
Executive CommitteeOversees the delivery of the Department’s strategy, supported by three Committees
Project & Programme Boards
Finance & Business Committee
Nominations Committee
Investment Committee
Departmental Board
Operations & People Committee
Audit and Risk Committee
Committee structure
50
ACCOUNTABILITY REPORT
51
Compliance with the Corporate Governance Code The Department has complied with the Cabinet Office’s Corporate Governance in Central Government Departments: Code of good practice with the following exception. A non-executive member of the Audit and Risk Committee, Caroline Mawhood, will have served the Department from February 2010 to June 2016. This is four months beyond the usual six-year term. The Secretary of State and the Permanent Secretary extended the appointment for this short period to ensure the Committee kept the benefit of her particular expertise and knowledge of the Nuclear Decommissioning Authority (NDA) through to the end of the 2015-16 financial reporting cycle.
Board appointments Succession is planned and new Board members receive an induction to the Department. The induction includes briefing on the Board itself, the new member’s role, including propriety matters, general briefing on the work of the Department, and more specific briefing to support their understanding of issues brought before the Board. All Board members are required to declare any personal or business interest which may influence their judgement in discharging their obligations, or which may be perceived to do so by a reasonable member of the public. These interests include, without limitation, personal direct and indirect pecuniary interests and any such interests of close family members and/or of people living in the same household as the Board member. The Department collects this information twice a year from executive and non-executive Board members and on the appointment of new members. Where a Board member has a specific conflict of interest, they will not take part in any related discussion at the Board or other meetings. Three conflicts of interest were raised this year and were managed in line with the relevant procedures.
Project management The Department looks to continuously improve how its responsibilities are managed by providing specialist training and development opportunities, tools and support. The Department’s collection of tools, templates and processes for project delivery – the Project Delivery Toolkit – underwent two revisions during 2015 to ensure that it remains relevant and simple. This includes clear guidance to help project and programme teams to improve delivery and provide the necessary level of management documentation.The Department has also continued to develop the project delivery capabilities of its staff. In addition to generic project management training and qualifications for staff at all levels, the Department also remains committed to the Government-wide Project Leadership Programme Pilot and the Major Projects Leadership Academy.A Departmental Performance Report is produced each month to provide an update on project delivery, financial position and to escalate any items. The report is first reviewed by the Finance and Business Committee, which escalates items as required, ahead of the Executive Committee review. The Department’s portfolio has been more fully defined and a comprehensive set of performance indicators is used to focus discussions. We continue to engage closely with the Government’s Infrastructure and Projects Authority on our most high profile initiatives.
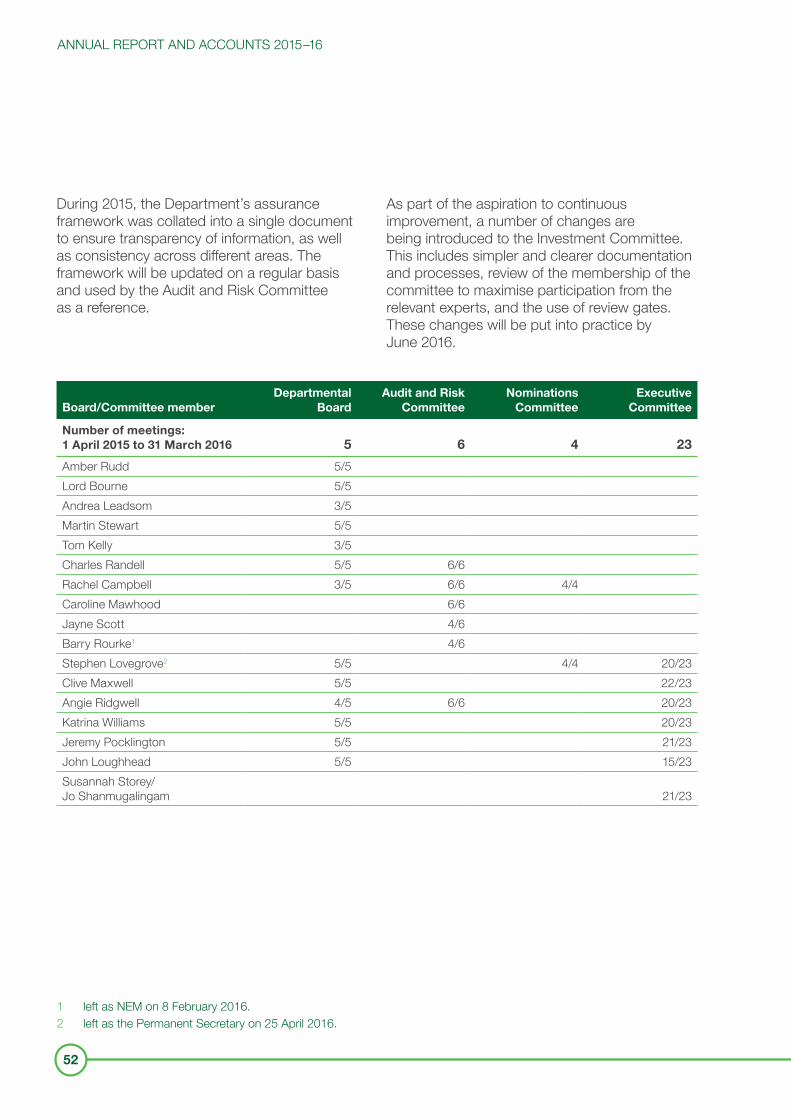
ANNUAL REPORT AND ACCOUNTS 2015–16
52
During 2015, the Department’s assurance framework was collated into a single document to ensure transparency of information, as well as consistency across different areas. The framework will be updated on a regular basis and used by the Audit and Risk Committee as a reference.
As part of the aspiration to continuous improvement, a number of changes are being introduced to the Investment Committee. This includes simpler and clearer documentation and processes, review of the membership of the committee to maximise participation from the relevant experts, and the use of review gates. These changes will be put into practice by June 2016.
Board/Committee memberDepartmental
BoardAudit and Risk
CommitteeNominations
CommitteeExecutive
Committee
Number of meetings: 1 April 2015 to 31 March 2016 5 6 4 23
Amber Rudd 5/5Lord Bourne 5/5Andrea Leadsom 3/5Martin Stewart 5/5Tom Kelly 3/5Charles Randell 5/5 6/6Rachel Campbell 3/5 6/6 4/4Caroline Mawhood 6/6Jayne Scott 4/6Barry Rourke1 4/6Stephen Lovegrove2 5/5 4/4 20/23Clive Maxwell 5/5 22/23Angie Ridgwell 4/5 6/6 20/23Katrina Williams 5/5 20/23Jeremy Pocklington 5/5 21/23John Loughhead 5/5 15/23Susannah Storey/ Jo Shanmugalingam 21/23
1 left as NEM on 8 February 2016.2 left as the Permanent Secretary on 25 April 2016.
ACCOUNTABILITY REPORT
53
Approach to risk management The Department has an established risk management policy and framework, which is supported by a central risk advisor, designated risk champions in each business group and cross-departmental training.The Department maintains a Departmental Risk Register (DRR) comprising its top risks. During 2015-16 it has been refined to reflect the Single Departmental Plan (SDP), capturing both the top risks to policy and programme delivery and the key corporate threats to the management and health of the Department. The DRR includes risks identified and escalated by the business or included directly by the Executive Team or one of its committees. Mitigation measures are identified and all risks in the DRR have mitigation measures in place to reduce them to a target level by an agreed date. Key changes to the risks, including any new or escalated threats, are reviewed each month by the Finance and Business Committee. The Finance and Business Committee updates the Executive Committee each month on any significant changes to the departmental risks as part of a broader report also covering departmental performance, financial management and human resources. The Departmental Board receives an update on the Department’s strategic risk profile each quarter. The DRR is supported by underlying risk registers maintained at programme, project and business levels. Key risks are reported each month using a standard highlight report template. The Department requires each major programme to define its overall risk appetite and all individual risks are required to have target reduction levels to reflect the level of exposure that can be tolerated.
The effectiveness of the Department’s risk management arrangements continues to be reviewed by the Audit and Risk Committee. Additionally, an independent review of the Department’s portfolio, programme and project management maturity (including risk management) is undertaken each year using a model developed by the Cabinet Office. Findings from the 2015-16 review show that risk management remains the most mature of the Department’s programme and project management processes. The Department’s principal risks are described in the Performance Report on pages 22 to 25.
Governance of executive agency
Oil and Gas Authority The Oil and Gas Authority (OGA) was created as one of the key recommendations of Sir Ian Wood’s 2014 review looking at how to maximise economic recovery from the UK Continental Shelf. It was established as an Executive Agency of the Department on 1 April 2015. However, in order to ensure greater operational independence, it is set to transition into a Government Company by summer 2016, subject to the will of Parliament. The OGA is largely funded by an industry levy, which was introduced on 1 October 2015. The OGA’s role is to regulate, influence and promote the UK’s oil and gas industry to achieve its statutory principal objective of Maximising the Economic Recovery of UK (MER UK) offshore oil and gas resources. The MER UK Strategy was laid in Parliament on 28 January 2016 and came into force on 18 March 2016.The OGA has also published its Corporate Plan, which outlines its priorities and plans for the period 2016 to 2021.
ANNUAL REPORT AND ACCOUNTS 2015–16
54
Governance of non-departmental public bodies The Department sponsors four non-departmental public bodies (NDPBs). It is also associated with several other bodies for delivery purposes. Each NDPB is overseen by a sponsor team, with the exception of the Nuclear Decommissioning Authority (NDA). However the NDA has a policy sponsor and a coordination unit is currently being set up. These sponsor teams agree the body’s remit and monitor performance. The sponsor teams work with their NDPBs to support their high-level aims. The Department also ensures that its NDPBs have robust governance structures in place to complement the Department’s structures and ensure clear accountability for finance, risk and performance. This involves regular reporting of performance against delivery plans. The Department has contractual agreements with each of its delivery partners, ensuring clear, accountable roles and performance measures.
Nuclear Decommissioning Authority The Nuclear Decommissioning Authority (NDA) is the largest of the Department’s NDPBs. Funded through a mixture of direct grant and commercial income, it currently accounts for two-thirds of our annual budget. The Department has continued to utilise the expertise of UK Government Investments (formerly the Shareholder Executive) to provide oversight and governance of the NDA.For these purposes, UKGI is an integral part of the Department, providing advice via the Director General for International, Science and Resilience to the Accounting Officer and ministers on all matters relating to the performance of the NDA. The detailed arrangements are set out in a Framework Document.The NDA publishes a five-year Strategy and an Annual Business Plan (both of which are subject to full public consultation and both the Department and Scottish Government ministerial agreement) setting out its long- and short-term delivery milestones.
Governance of government-owned companies The Low Carbon Contracts Company (LCCC) and Electricity Settlements Company (ESC) are two Government-owned companies that became operational on 1 August 2014. They were established to deliver key elements of the Government’s Electricity Market Reform (EMR) Programme. The operational costs of the companies are funded via a levy on electricity suppliers. The Department publicly consults on these costs annually, in advance of ministerial approval for regulations to be amended to provide the required income.The Department has put in place a team to provide oversight and governance of the LCCC and ESC with support from UKGI. The team provides advice to the Accounting Officer and ministers on all matters relating to the performance of LCCC and ESC. The relationship between the companies and the Department is principally set out in a Shareholder Framework Document, which is publicly available on the companies’ websites. In line with the UK Corporate Governance Code, the companies will publish their accounts, which are consolidated into the Department’s Annual group accounts. The LCCC and ESC make presentations on their activities to the Executive Committee on an annual basis. The Department has two shareholder representative directors on the Boards of LCCC and ESC, and a shareholder representative director sits on the companies’ Audit and Risk Committee and the Remuneration Committee.
Triennial reviews One triennial review was undertaken during 2015-16, this was for the Committee for Radioactive Waste Management (CoRWM) and was published in December 2015. The review concluded that CoRWM should continue in its role as an advisory NDPB providing independent advice to UK Government and
ACCOUNTABILITY REPORT
55
Devolved Administration Ministers on the long-term management of radioactive waste, based on informed scrutiny of the available evidence. The review found that the NDPB model allows the delivery of this function independently of Government, which is crucial in maintaining public trust in the UK Government’s geological disposal programme and other radioactive waste management programmes.The triennial review of Fuel Poverty Advisory Group (FPAG) in 2014, concluded that FPAG performed an important function as an expert advisory group and that it should continue in this role as an advisory NDPB. The Department proceeded to reform the group during 2015 leading to the establishment of the Committee on Fuel Poverty on 25 January 2016.
Departmental reviews As part of the Cabinet Office’s transformation strategy, the Department is committed to ensuring each of its NDPBs is reviewed at least once during the life of this Parliament. These reviews (which replace the triennial review programme) will ensure that the respective bodies are still performing a necessary function and that they are discharging that function in the best way. Some of the Department’s bodies will also undergo functional reviews centrally, with bodies across Government that perform a similar function.
Review of effectiveness of the system of governance, risk management and internal control An annual review of the effectiveness of the system of governance, risk management and internal control has been informed by officials, Internal Audit and comments made by the NAO. The Audit and Risk Committee also provides further assurance. The review has provided assurance that the system continued to improve during 2015-16.
Group statements on governance, risk management and internal control Directors General provide a statement to Internal Audit on the effectiveness of the system in-year and at the year-end for their Group, plus an action plan for improvements. The Head of Internal Audit and the Chair of the Audit and Risk Committee review each statement with the relevant Director General and discuss the key findings with the Permanent Secretary. These discussions have confirmed that there has been an improvement in the governance of the Department following reforms that were made during the course of the year. To develop this further over the course of the coming year, there will be a focus on ensuring the reforms become fully embedded within the governance framework. The Department will also continue to develop its risk management framework by seeking to ensure it is fully embedded across the organisation.
Assurance statements from NDPBs The Department’s executive NDPBs each conduct a review of the effectiveness of their governance, risk management and internal control in the Governance Statements of their accounts. The respective Governance Statements concluded as follows:
Nuclear Decommissioning Authority (NDA)No significant control issues have arisen in the year. Overall, the NDA’s system of internal control is assessed as being generally sound and appropriate to meet the Authority’s objectives. In addition, there is an adequate and effective control environment operating across the wider NDA estate, which includes the NDA subsidiary organisations and the Site Licence Companies that it contracts with.
ANNUAL REPORT AND ACCOUNTS 2015–16
56
Coal Authority The Coal Authority has an established governance, risk management and control framework supported by an appropriate organisational culture. This framework continues to evolve at sufficient pace to manage the Authority’s risks as it becomes increasingly commercial and remains proportionate, fit for purpose and working as intended.
Civil Nuclear Police Authority (CNPA) There were no significant weaknesses in the CNPA’s internal controls in 2015-16 that affected the achievement of its key policies, aims and objectives.
Committee on Climate Change The Committee has had no significant control issues during 2015-16 and has no significant weaknesses to address.
Transactional processing The majority of the Department’s financial and HR processes are provided by Shared Services Connected Limited (SSCL) and are therefore not directly governed or controlled by the Department. For the period covered by this statement, the Department has placed reliance on assurances provided by the Cabinet Office under the terms of its Framework Agreement with SSCL. The following independent assurance reports were provided by SSCL to the Cabinet Office during 2015-16 and were subsequently shared with the Department: • a report on the operating effectiveness of
controls in accordance with the International Standard on Assurance Engagement (ISAE3402); and
• internal audit reports in respect of the 2015-16 annual audit plan.
The opinion provided in the ISAE 3402 report confirms that the controls applied by SSCL were reasonable and operated effectively during the course of 2015-16. In respect of the Internal audit reports, Substantial and Moderate opinions were provided in some assurance areas reviewed by Internal Audit. However, the assurance and
audit information obtained in accordance with the Framework agreement does not indicate any significant weaknesses in SSCL’s control arrangements during 2015-16 which would need to be disclosed in the Governance Statement. The Department has appropriate representation within the SSCL governance structure and works closely with the Defra Intelligent Customer Functions. We also remain in regular contact with SSCL in order to maintain oversight of their performance in delivering the service to the Department.
Internal audit Annual Report The Head of internal audit provides an annual report on the systems of governance, risk management and control operating in the Department based on the work undertaken during the year, the outcome of the annual review of corporate governance, knowledge of the business environment, known instances of fraud and the work of others such as the National Audit Office.This work concluded in an opinion of “moderate” reflecting that some improvements are required to enhance the adequacy and effectiveness of the framework of governance, risk management and control.Overall, the Internal Audit Report found evidence of continued improvement in the governance, risk management and control framework. These improvements, such as the reforms to the Tier 2 Governance arrangements, challenges to the effectiveness of mitigation actions to key risks by the Audit and Risk Committee and improved visibility of contracts through the development of the contract register demonstrate the positive trajectory being taken by the Department. The report also acknowledged there have been some control issues over the year, most notably around preparations for migration to the Shared Services single operating platform. In such instances management are taking steps to strengthen control as a result. The report also noted that the Department will be smaller following the outcome of the Spending Review.
ACCOUNTABILITY REPORT
57
However, it continues to carry a significant amount of risk and will need to be able to prioritise effectively if it is to continue to deliver effectively against its objectives. The introduction of a prioritisation model is a useful tool in making effective decisions around future priorities.
Other key governance activities
Machinery of Government changes There has been no machinery of Government changes in 2015-16.
Levy Control Framework One of the Government’s priorities is to bring about the transition to low carbon generation as cost effectively and securely as possible: the Levy Control Framework is one of the tools to help achieve this. As a matter of routine, consumer impacts are kept under review as policies are developed, implemented, and our models go through routine updates.
Local Government The Department has provided grants to local authorities totalling £25 million during the year under Section 31 of the Local Government Act 2003.
Single Departmental Plan Internally, the Department will monitor its progress against its objectives through the newly established Single Departmental Plan5. This is published at https://www.gov.uk/government/publications/decc-single-departmental-plan-2015-to-2020.
Ministerial directions There have been no ministerial directions issued in 2015-16.
Single Operating PlatformThe Single Operating Platform (SOP) is a Cabinet Office coordinated change programme. The focus of the initiative is to migrate participating government departments from their existing in-
house Oracle platforms and associated systems for HR, Finance and Procurement on to an upgraded single Oracle platform. SOP is being developed and operated through the Cabinet Office selected technology partner SSCL. The Department migrated successful to SOP in May 2016, with system and service stability being managed via an agreed support and assurance model.
Quality assurance modelling The Department has systematic, multidisciplinary quality assurance processes for all evidence and analytical outputs (including developing and using models) with clear roles and responsibilities for individuals and boards. Risks related to evidence are logged, managed and escalated appropriately. Quality assurance of models is appropriate and consistent with the Department’s quality assurance guidance, and also with the Aqua Book6 (a good practice guide for quality assurance across government).
ConclusionI have considered the evidence provided in the production of the Annual Governance Statement and the independent advice provided by the Head of Internal Audit and the Audit and Risk Committee. I conclude that the Department has made improvements during the year to strengthen governance, internal controls and risk management. There is a clear steer for the Department on how to improve further and this will be taken forward in 2016-17.
Jeremy PocklingtonPrincipal Accounting Officer and Acting Permanent Secretary1 July 2016
5 https://www.gov.uk/government/publications/decc-single-departmental-plan-2015-to-2020/single-departmen-tal-plan-2015-to-2020
6 https://www.gov.uk/government/uploads/system/uploads/attachment_data/file/416478/aqua_book_final_web.pdf
ANNUAL REPORT AND ACCOUNTS 2015–16
58
REMUNERATION AND STAFF REPORTREMUNERATION REPORTThe remuneration policy for senior civil servants is set by the Prime Minister following independent advice from the Review Body on Senior Salaries. The Review Body also advises the Prime Minister from time to time on the pay and pensions of Members of Parliament and their allowances; on Peers’ allowances; and on the pay, pensions and allowances of Ministers and others whose pay is determined by the Ministerial and Other Salaries Act 1975. In reaching its recommendations, the Review Body is to have regard to the following considerations:• the need to recruit, retain and motivate suitably
able and qualified people to exercise their different responsibilities;
• regional and local variations in labour markets and their effects on the recruitment and retention of staff;
• Government policies for improving the public services including the requirement on departments to meet the output targets for the delivery of departmental services;
• the funds available to departments as set out in the Government’s departmental expenditure limits; and
• the Government’s inflation target.The Review Body takes account of the evidence it receives about wider economic considerations and the affordability of its recommendations.Further information about the work of the Review Body can be found at www.ome.uk.com.
1. Performance and rewardThe Senior Civil Service (SCS) pay system includes relative performance assessments. Individuals are assessed as being in the Top, Achieving or Low Group of their pay band.
2. Nominations CommitteeThe remuneration approach for civil servants who are not members of the Departmental Board is reviewed by the Nominations Committee (of the Board). The Members of the Nominations Committee are:
Rachel Campbell Non-Executive Director (Chair)
Stephen Lovegrove Permanent SecretaryChristina Duncan Director of People
and OperationsStanding Attendees:
Angie Ridgwell Director General of Corporate Services
Martin Stewart Lead Non-Executive Director
The Terms of Reference of the Nominations Committee are:• scrutinising systems for identifying and
developing leadership and high potential;• scrutinising plans for orderly succession
of appointments to the Board and Director General roles, in order to maintain an appropriate balance of skills and experience; and
• scrutinising incentives and rewards for executive Board members and Directors General, and advising on the extent to which these arrangements are effective at improving performance.
ACCOUNTABILITY REPORT
59
3. Civil Service contracts The Constitutional Reform and Governance Act 2010 requires Civil Service appointments to be on merit on the basis of fair and open competition. The recruitment principles published by the Civil Service Commission specify the circumstances when appointments may be made otherwise. Further information about the work of the Civil Service Commission can be found at http://civilservicecommission.independent.gov.uk/.Early termination other than through misconduct would result in the individual receiving compensation as set out in the Civil Service Compensation Scheme.The officials covered by this report hold appointments which are open-ended until they reach the normal retiring age.
4. Salary and pension entitlements for ministers of the DepartmentThe remainder of this Remuneration Report contains audited information. The remuneration of ministers is determined in accordance with the provisions of the Ministerial and Other Salaries Act 1975 (as amended by the Ministerial and Other Salaries Order 1996) and the Ministerial and Other Pensions and Salaries Act 1991. The salary and pension entitlements of the Ministers of the Department of Energy & Climate Change for the year ending 31 March 2016 are set out in Figure 8.
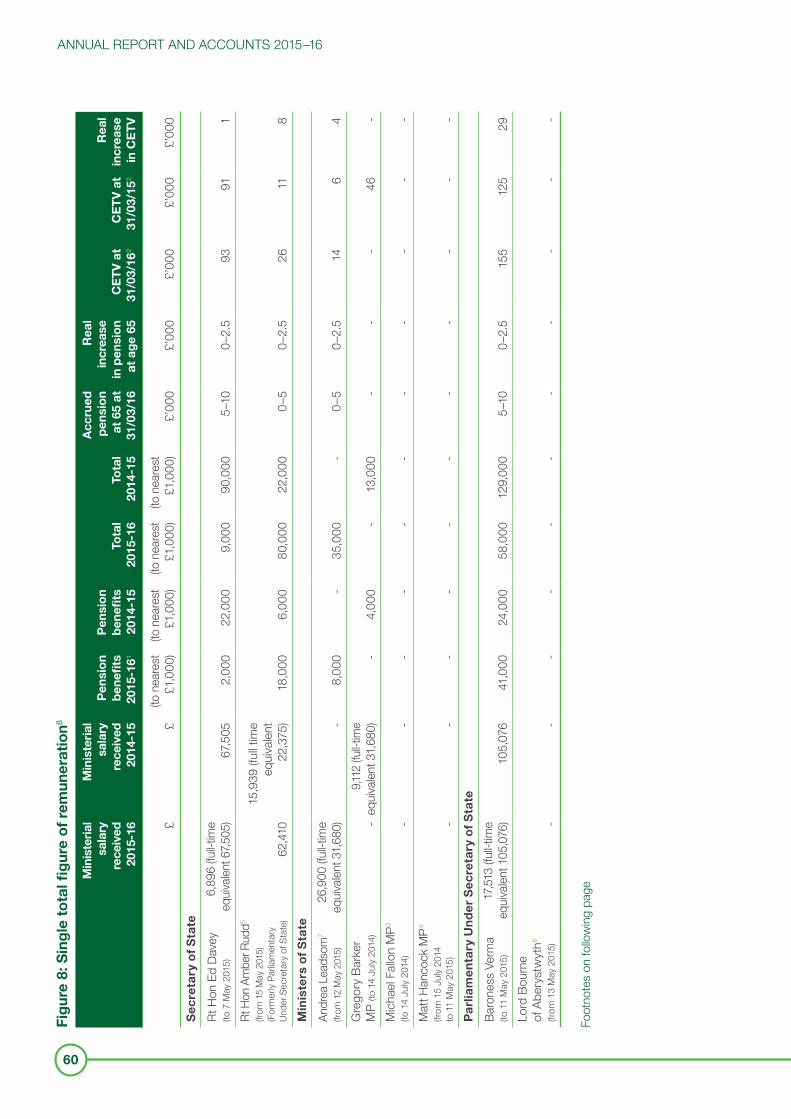
ANNUAL REPORT AND ACCOUNTS 2015–16
60
Fig
ure
8: S
ing
le t
ota
l fig
ure
of
rem
uner
atio
n8
Min
iste
rial
sa
lary
re
ceiv
ed
2015
-16
Min
iste
rial
sa
lary
re
ceiv
ed
2014
-15
Pen
sio
n b
enefi
ts
2015
-161
Pen
sio
n b
enefi
ts
2014
-15
Tota
l 20
15-1
6To
tal
2014
-15
Acc
rued
p
ensi
on
at 6
5 at
31
/03/
16
Rea
l in
crea
se
in p
ensi
on
at a
ge
65C
ET
V a
t 31
/03/
162
CE
TV
at
31/0
3/15
2
Rea
l in
crea
se
in C
ET
V
££
(to n
eare
st
£1,0
00)
(to n
eare
st
£1,0
00)
(to n
eare
st
£1,0
00)
(to n
eare
st
£1,0
00)
£’00
0£’
000
£’00
0£’
000
£’00
0
Sec
reta
ry o
f S
tate
Rt H
on E
d Da
vey
(to
7 M
ay 2
015)
6,89
6 (fu
ll-tim
e eq
uivale
nt 6
7,505
)67
,505
2,00
022
,000
9,00
090
,000
5–10
0–2.
593
911
Rt H
on A
mbe
r Rud
d5 (fr
om 1
5 M
ay 2
015)
(F
orm
erly
Parlia
men
tary
Un
der S
ecre
tary
of S
tate
)62
,410
15,9
39 (f
ull t
ime
equi
vale
nt
22,3
75)
18,0
006,
000
80,0
0022
,000
0–5
0–2.
526
118
Min
iste
rs o
f S
tate
Andr
ea L
eads
om7
(from
12
May
201
5)26
,900
(full
-tim
e eq
uivale
nt 3
1,68
0)-
8,00
0-
35,0
00-
0–5
0–2.
514
64
Gre
gory
Bar
ker
MP
(to 1
4 Ju
ly 20
14)
-9,1
12 (fu
ll-tim
e eq
uiva
lent 3
1,68
0)-
4,00
0-
13,0
00-
--
46-
Mic
hael
Fal
lon
MP3
(to 1
4 Ju
ly 20
14)
--
--
--
--
--
-M
att H
anco
ck M
P4 (fr
om 1
5 Ju
ly 20
14
to 1
1 M
ay 2
015)
--
--
--
--
--
-P
arlia
men
tary
Un
der
Sec
reta
ry o
f S
tate
Baro
ness
Ver
ma
(to 1
1 M
ay 2
015)
17,5
13 (f
ull-t
ime
equiv
alent
105
,076
)10
5,07
6 41
,000
24,0
0058
,000
129,
000
5–10
0–2.
515
512
529
Lord
Bou
rne
of A
bery
stw
yth6
(from
13
May
201
5)-
--
--
--
--
--
Foot
note
s on
follo
win
g pa
ge
ACCOUNTABILITY REPORT
61
This report is based on accrued payments made by the Department and thus recorded in the accounts. In respect of ministers in the House of Commons, departments bear only the cost of the additional ministerial remuneration. The annual salary for their services as a Member of Parliament (£67,060 from 1 April 2014, £74,000 from 8 May 2015) and various allowances to which they are entitled, are borne centrally. The arrangement for ministers in the House of Lords is different in that they do not receive a salary but rather an additional remuneration which cannot be quantified separately from their Ministerial salaries. The total remuneration, as well as the allowances to which they are entitled, is paid by the Department and is therefore shown in full in the figures above.Salary and pension entitlements for the members of the Departmental BoardThe Departmental Board constitutes ministers, reported in the table above, executive members and non-executive directors, all of whom are reported in the tables below.The salary and pension entitlements of the executive members of the Departmental Board are given in Figure 9.
1 The value of pension benefits accrued during the year is calculated as (the real increase in pension multiplied by 20) less (the contributions made by the individual). The real increase excludes increases due to inflation or any increase or decrease due to a transfer of pension rights.
2 The The Cash Equivalent Transfer Value (CETV) at 31 March 2016 for members leaving the Department is at the date they left the Department; the CETV at 31 March 2015 for members joining the Department is at the date they joined the Department.
3 Joint Minister with Department for Business, Innovation & Skills (BIS) from 28 March 2013 to 14 July 2014, taking up the role of Secretary for Defence from 15 July 2014. Ministerial salary and pension details will be found in the 2015-16 Ministry of Defence Annual Report and Accounts.
4 Joint Minister with BIS from 14 July 2014 to 11 May, 2015. Details of the ministerial salary and pension can be found in the 2015-16 BIS Annual Report and Accounts.
5 Secretary of State Rt Hon Amber Rudd was Parliamentary Under Secretary of State until 12 May 2015 so 2014-15 comparatives relate to that earlier role.
6 Lord Bourne is 50% DECC/ 50% Welsh Office. His ministerial salary is reported under a Lord in Waiting as his Parliamentry under secretary role is unpaid.
7 Andrea Leadsom moved to the Department during 2015-16. Her salary was subject to adjustments to charge it correctly between departments, and as such,the salary disclosed may be less than it ought to be.
8 Single total figure of remuneration and CETV disclosures for each minister and director are subject to NAO audit opinion.
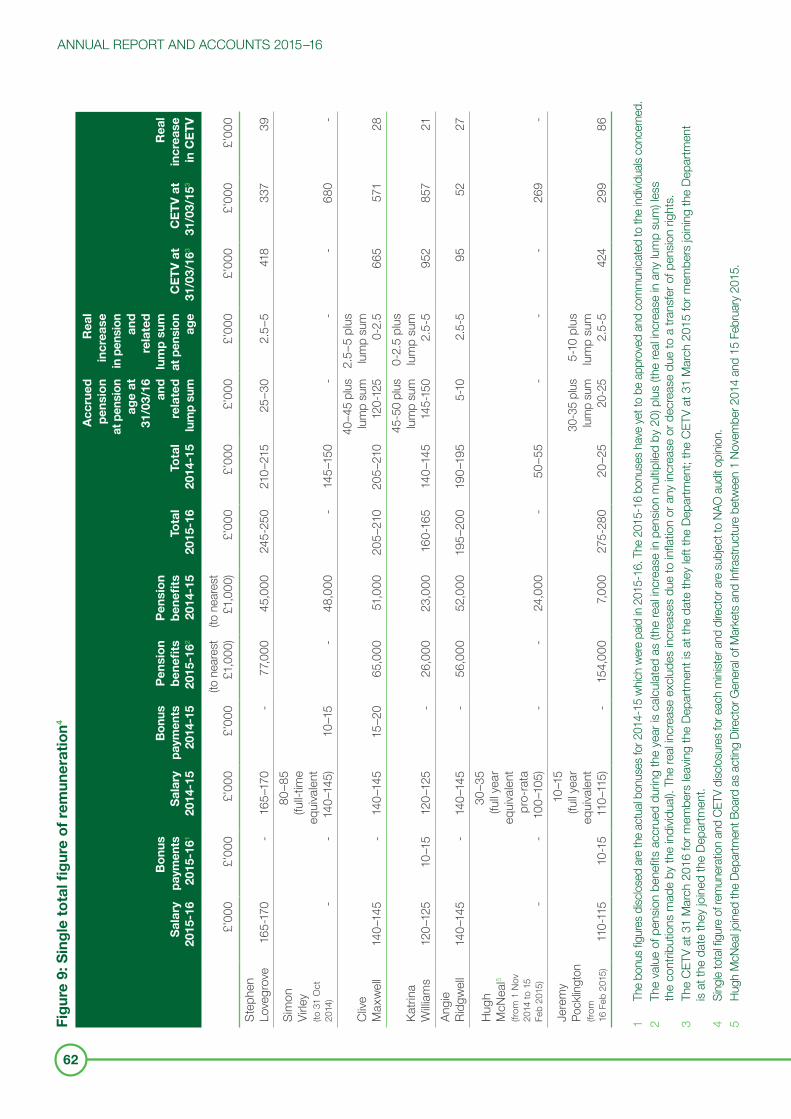
ANNUAL REPORT AND ACCOUNTS 2015–16
62
Fig
ure
9: S
ing
le t
ota
l fig
ure
of
rem
uner
atio
n4
Sal
ary
2015
-16
Bo
nus
paym
ents
20
15-1
61
Sal
ary
2014
-15
Bon
us
paym
ents
20
14-1
5
Pen
sio
n b
enefi
ts
2015
-162
Pen
sio
n b
enefi
ts
2014
-15
Tota
l 20
15-1
6To
tal
2014
-15
Acc
rued
p
ensi
on
at p
ensi
on
age
at
31/0
3/16
an
d
rela
ted
lu
mp
sum
Rea
l in
crea
se
in p
ensi
on
and
re
late
d
lum
p s
um
at p
ensi
on
age
CE
TV
at
31/0
3/16
3
CE
TV
at
31/0
3/15
3
Rea
l in
crea
se
in C
ET
V
£’00
0£’
000
£’00
0£’
000
(to n
eare
st
£1,0
00)
(to n
eare
st
£1,0
00)
£’00
0£’
000
£’00
0£’
000
£’00
0£’
000
£’00
0
Step
hen
Love
grov
e 16
5-17
0-
165–
170
-77
,000
45,0
0024
5-25
021
0–21
525
–30
2.5–
541
833
739
Sim
on
Virle
y (to
31
Oct
20
14)
--
80–8
5 (fu
ll-tim
e eq
uiva
lent
14
0–14
5)10
–15
-48
,000
-14
5–15
0-
--
680
-
Clive
M
axw
ell
140–
145
-14
0–14
515
–20
65,0
0051
,000
205–
210
205–
210
40–4
5 pl
us
lump
sum
12
0-12
5
2.5–
5 pl
us
lump
sum
0-
2.5
665
571
28
Katri
na
Willi
ams
120–
125
10–1
512
0–12
5-
26,0
0023
,000
160-
165
140–
145
45-5
0 pl
us
lump
sum
14
5-15
0
0-2.
5 pl
us
lum
p su
m
2.5-
595
285
721
Angi
e Ri
dgw
ell
140–
145
-14
0–14
5-
56,0
0052
,000
195–
200
190–
195
5-10
2.5-
595
5227
Hugh
M
cNea
l5 (fr
om 1
Nov
20
14 to
15
Feb
2015
)-
-
30–3
5 (fu
ll yea
r eq
uiva
lent
pr
o-ra
ta
100–
105)
--
24,0
00-
50–5
5-
--
269
-
Jere
my
Pock
lingt
on
(from
16
Feb
201
5)11
0-11
510
-15
10–1
5 (fu
ll yea
r eq
uiva
lent
11
0–11
5)-
154,
000
7,000
275-
280
20–2
5
30-3
5 pl
us
lump
sum
20
-25
5-10
plu
s lu
mp
sum
2.
5-5
424
299
86
ned.
oved
and
com
mun
icate
d to
the
indivi
duals
con
cer
ea
se in
any
lum
p su
m) le
ss
eal in
crea
se d
ue to
a tr
ansf
er o
f pen
sion
right
s.ch
201
5 fo
r mem
bers
join
ing
the
Depa
rtmen
t
ease
in p
ensio
n m
ultip
lied
by 2
0) p
lus
(the
rea
se o
r dec
rch
201
6 fo
r mem
bers
leav
ing
the
Depa
rtmen
t is
at th
e da
te th
ey le
ft th
e De
partm
ent;
the
CETV
at 3
1 M
ar
e su
bject
to N
AO a
udit o
pinion
.e
betw
een
1 No
vem
ber 2
014
and
15 F
ebru
ary 2
015.
e pa
id in
2015
-16.
The
201
5-16
bon
uses
hav
e ye
t to
be a
ppr
eal in
crea
ses
due
to in
flatio
n or
any
incr
ecto
r ar
ted
as (t
he r
ease
exc
lude
s in
crea
l incr
es fo
r eac
h m
inist
er a
nd d
irec
tor G
ener
al of
Mar
kets
and
Infra
stru
ctur
e th
e ac
tual
bonu
ses f
or 2
014-
15 w
hich
wer
emun
erat
ion a
nd C
ETV
disclo
sur
d as
act
ing D
ir
es d
isclos
ed a
r
e of
r
The
bonu
s figu
rTh
e va
lue
of p
ensio
n be
nefit
s ac
crue
d du
ring
the
year
is c
alcul
ath
e co
ntrib
utio
ns m
ade
by th
e in
divid
ual).
The
rTh
e CE
TV a
t 31
Mar
is at
the
date
they
join
ed th
e De
partm
ent.
Sing
le to
tal fi
gur
Hugh
McN
eal jo
ined
the
Depa
rtmen
t Boa
r
1 2 3 4 5
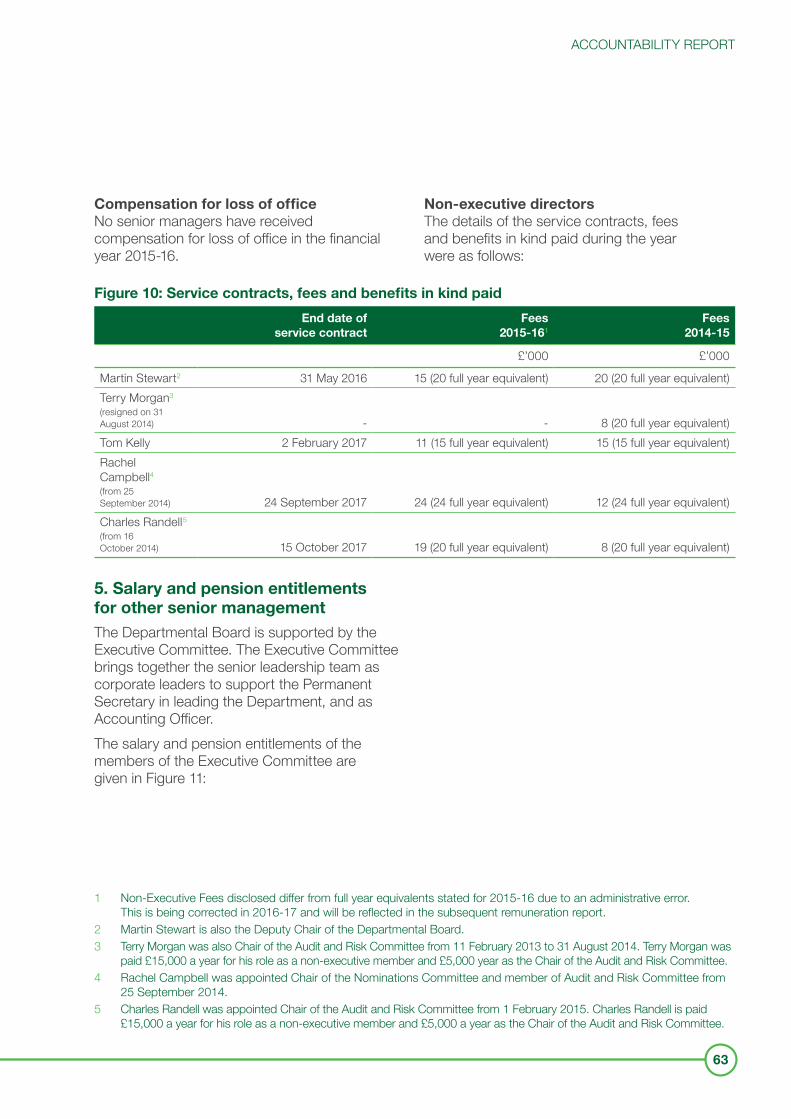
ACCOUNTABILITY REPORT
63
Compensation for loss of officeNo senior managers have received compensation for loss of office in the financial year 2015-16.
Non-executive directorsThe details of the service contracts, fees and benefits in kind paid during the year were as follows:
Figure 10: Service contracts, fees and benefits in kind paid
End date of service contract
Fees 2015-161
Fees 2014-15
£’000 £’000
Martin Stewart2 31 May 2016 15 (20 full year equivalent) 20 (20 full year equivalent)Terry Morgan3 (resigned on 31 August 2014) - - 8 (20 full year equivalent) Tom Kelly 2 February 2017 11 (15 full year equivalent) 15 (15 full year equivalent)Rachel Campbell4 (from 25 September 2014) 24 September 2017 24 (24 full year equivalent) 12 (24 full year equivalent)Charles Randell5 (from 16 October 2014) 15 October 2017 19 (20 full year equivalent) 8 (20 full year equivalent)
5. Salary and pension entitlements for other senior management The Departmental Board is supported by the Executive Committee. The Executive Committee brings together the senior leadership team as corporate leaders to support the Permanent Secretary in leading the Department, and as Accounting Officer.The salary and pension entitlements of the members of the Executive Committee are given in Figure 11:
1 Non-Executive Fees disclosed differ from full year equivalents stated for 2015-16 due to an administrative error. This is being corrected in 2016-17 and will be reflected in the subsequent remuneration report.
2 Martin Stewart is also the Deputy Chair of the Departmental Board. 3 Terry Morgan was also Chair of the Audit and Risk Committee from 11 February 2013 to 31 August 2014. Terry Morgan was
paid £15,000 a year for his role as a non-executive member and £5,000 year as the Chair of the Audit and Risk Committee.4 Rachel Campbell was appointed Chair of the Nominations Committee and member of Audit and Risk Committee from
25 September 2014.5 Charles Randell was appointed Chair of the Audit and Risk Committee from 1 February 2015. Charles Randell is paid
£15,000 a year for his role as a non-executive member and £5,000 a year as the Chair of the Audit and Risk Committee.
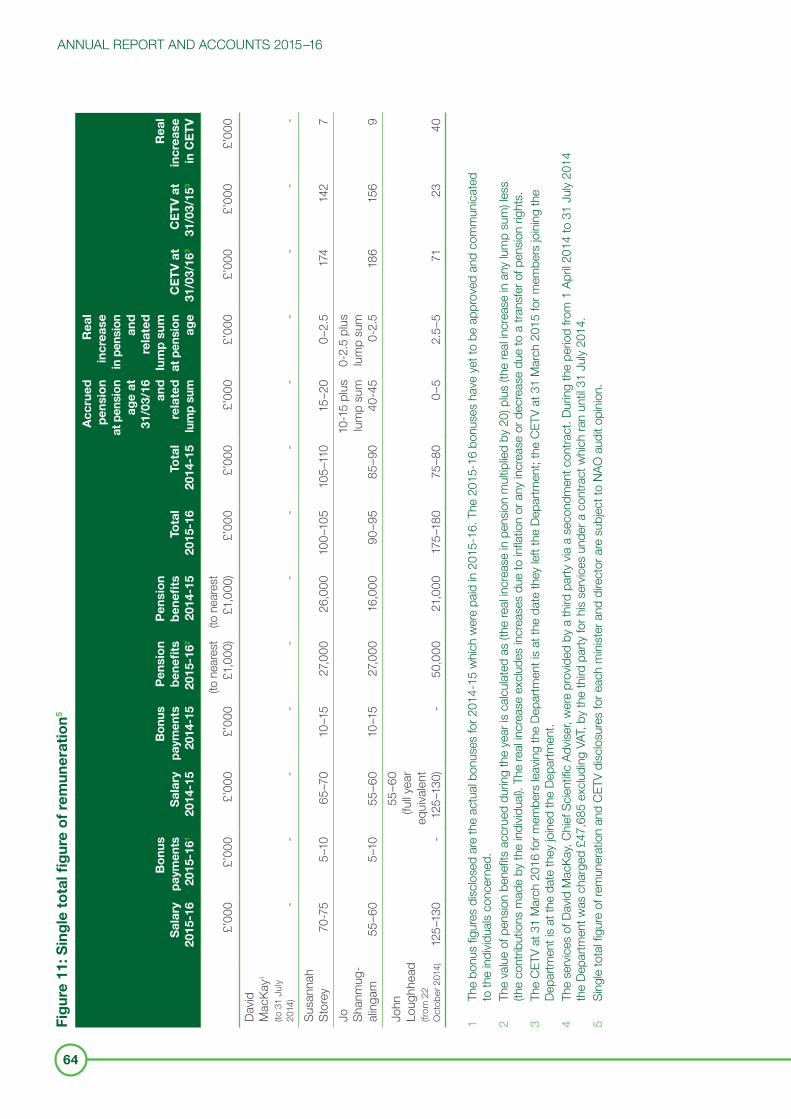
ANNUAL REPORT AND ACCOUNTS 2015–16
64
Fig
ure
11: S
ing
le t
ota
l fig
ure
of
rem
uner
atio
n5
Sal
ary
2015
-16
Bo
nus
paym
ents
20
15-1
61
Sal
ary
2014
-15
Bon
us
paym
ents
20
14-1
5
Pen
sio
n b
enefi
ts
2015
-162
Pen
sio
n b
enefi
ts
2014
-15
Tota
l 20
15-1
6To
tal
2014
-15
Acc
rued
p
ensi
on
at p
ensi
on
age
at
31/0
3/16
an
d
rela
ted
lu
mp
sum
Rea
l in
crea
se
in p
ensi
on
and
re
late
d
lum
p s
um
at p
ensi
on
age
CE
TV
at
31/0
3/16
3
CE
TV
at
31/0
3/15
3
Rea
l in
crea
se
in C
ET
V
£’00
0£’
000
£’00
0£’
000
(to n
eare
st
£1,0
00)
(to n
eare
st
£1,0
00)
£’00
0£’
000
£’00
0£’
000
£’00
0£’
000
£’00
0
David
M
acKa
y4 (to
31
July
2014
)-
--
--
--
--
--
--
Susa
nnah
St
orey
70-7
55–
1065
–70
10–1
527
,000
26,0
0010
0–10
510
5–11
015
–20
0–2.
517
414
27
Jo
Shan
mug
- al
inga
m55
–60
5–10
55–6
010
–15
27,0
0016
,000
90–9
585
–90
10-1
5 pl
us
lum
p su
m
40-4
5
0-2.
5 pl
us
lum
p su
m
0-2.
518
615
69
John
Lo
ughh
ead
(from
22
Oct
ober
201
4)12
5–13
0-
55–6
0 (fu
ll yea
r eq
uiva
lent
12
5–13
0)-
50,0
0021
,000
175–
180
75–8
00–
52.
5–5
7123
40
oved
and
com
mun
icate
d ea
se in
any
lum
p su
m) le
ssea
se d
ue to
a tr
ansf
er o
f pen
sion
right
s.ch
201
5 fo
r mem
bers
join
ing
the
om 1
Apr
il 201
4 to
31
July
2014
e pa
id in
201
5-16
. The
201
5-16
bon
uses
hav
e ye
t to
be a
ppr
eal in
crea
se in
pen
sion
mul
tiplie
d by
20)
plu
s (th
e r
ease
or d
ecr
eal in
crea
ses
due
to in
flatio
n or
any
incr
d pa
rty v
ia a
seco
ndm
ent c
ontra
ct. D
urin
g th
e pe
riod
fr
ted
as (t
he r
d pa
rty fo
r his
serv
ices
unde
r a c
ontra
ct w
hich
ran
until
31 J
uly
2014
.ec
tor a
re s
ubjec
t to
NAO
aud
it op
inio
n.
e th
e ac
tual
bonu
ses
for 2
014-
15 w
hich
wer
The
valu
e of
pen
sion
bene
fits
accr
ued
durin
g th
e ye
ar is
calc
ula ov
ided
by
a th
ir
ease
exc
lude
s in
cr
e pr
, by
the
thir
eal in
cr es fo
r eac
h m
inist
er a
nd d
irTA
es d
isclo
sed
arne
d.
(the
cont
ribut
ions
mad
e by
the
indi
vidua
l). Th
e r
, Chi
ef S
cient
ific A
dvise
r, w
er
emun
erat
ion
and
CETV
disc
losu
r
The
bonu
s fig
urto
the
indi
vidua
ls co
ncer
ch 2
016
for m
embe
rs le
avin
g th
e De
partm
ent i
s at
the
date
they
left
the
Depa
rtmen
t; th
e CE
TV a
t 31
Mar
The
CETV
at 3
1 M
arDe
partm
ent i
s at
the
date
they
join
ed th
e De
partm
ent.
The
serv
ices
of D
avid
Mac
Kay
the
Depa
rtmen
t was
cha
rged
£47
,685
exc
ludi
ng V
e of
rSi
ngle
tota
l figu
r
1 2 3 4 5
ACCOUNTABILITY REPORT
65
6. NotesThe information relates only to the most senior managers of the core Department. Similar information relating to the chief executives and most senior managers of the bodies within the Department family is given in the separate accounts of those bodies.‘Salary’ includes: • gross salary; • overtime; • reserved rights to London weighting
or London allowances; • recruitment and retention allowances; • private office allowances; and• any other allowance to the extent that
it is subject to UK taxation.Bonuses are based on performance levels attained and are made as part of the appraisal process. Bonuses relate to the performance in the year in which they become payable to the individual. The bonuses reported in 2015-16 are the 2014-15 bonuses as the 2015-16 bonuses have yet to be approved and communicated to the individuals concerned.Reporting bodies are required to disclose the relationship between the remuneration of the highest paid director in their organisation and the median remuneration of the organisation’s workforce.7 The banded remuneration of the highest-paid director for the Department in the financial year 2015-16 was £165-170,000 (2014-15: £165-170,000), this was 3.4 times (2014-15: 3.5 times) the median remuneration of the workforce, which was £49,410 (2014-15: £48,578). In 2015-16, 4 employees (2014-15: 7)
received remuneration in excess of the banded remuneration of the highest-paid director. Remuneration ranged from £18,100 to £280,000 in 2015-16 (2014-15: 17,600 to £280,000). Total remuneration includes salary, non-consolidated performance-related pay and benefits in kind. It does not include severance payments, employer pension contributions and the cash equivalent transfer value of pensions.No Ministers, Board members or other senior management were in receipt of benefits in kind for the financial years 2015-16 or 2014-15.
Ministerial pensionsPension benefits for ministers are provided by the Parliamentary Contributory Pension Fund (PCPF). The scheme is made under statute and the rules are set out in the Ministers’ Pension Scheme 2015.8 Those ministers who are Members of Parliament may also accrue an MP’s pension under the PCPF (details of which are not included in this report). A new MP’s pension scheme was introduced from May 2015, although members who were aged 55 or older on 1 April 2013 have transitional protection to remain in the previous final salary pension scheme.Benefits for ministers are payable from State Pension age under the 2015 scheme. Pensions are revalued annually in line with Pensions Increase legislation both before and after retirement. The contribution rate from May 2015 is 11.1% and the accrual rate is 1.77% of pensionable earnings.The figure shown for pension value includes the total pension payable to the member under both the pre- and post- 2015 ministerial pension schemes.
7 Fair pay disclosures are subject to NAO audit opinion.8 Available at http://researchbriefings.parliament.uk/ResearchBriefing/Summary/SN06283
ANNUAL REPORT AND ACCOUNTS 2015–16
66
Cash Equivalent Transfer Value (CETV) This is the actuarially assessed capitalised value of the pension scheme benefits accrued by a member at a particular point in time. The benefits valued are the member’s accrued benefits and any contingent spouse’s pension payable from the scheme. A CETV is a payment made by a pension scheme or arrangement to secure pension benefits in another pension scheme or arrangements when the member leaves a scheme and chooses to transfer the pension benefits they have accrued in their former scheme. The pension figures shown relate to the benefits that the individual has accrued as a consequence of their total ministerial service, not just their current appointment as a minister. CETVs are calculated in accordance with The Occupational Pension Scheme (Transfer Values) (Amendment) Regulations 2008 and do not take account of any actual or potential reduction to benefits resulting from Lifetime Allowance tax which may be due when pension benefits are taken.Real increase in CETV This is the element of the increase in accrued pension funded by the Exchequer. It excludes increase due to inflation and contribution paid by the minister. It is worked out using common market valuation factors for the start and end of the period.
Civil Service pensionsPension benefits are provided through the Civil Service pension arrangements. From 1 April 2015 a new pension scheme for civil servants was introduced – the Civil Servants and Others Pension Scheme or alpha, which provides benefits on a career average basis with a normal pension age equal to the member’s State Pension Age (or 65 if higher). From that date all newly appointed civil servants and the majority of those already in service joined alpha. Prior to that date, civil servants participated n the Principal Civil Service Pension Scheme PCSPS). The PCSPS has four sections: three providing benefits on a final salary basis (classic, premium or classic plus) with a normal pension age of 60; and one providing benefits on a whole career basis (nuvos) with a normal pension age of 65.These statutory arrangements are unfunded with the cost of benefits met by monies voted by Parliament each year. Pensions payable under classic, premium, classic plus, nuvos and alpha are increased annually in line with Pensions Increase legislation. Existing members of the PCSPS who were within 10 years of their normal pension age on 1 April 2012 remained in the PCSPS after 1 April 2015. Those who were between 10 years and 13 years and 5 months from their normal pension age on 1 April 2012 will switch into alpha sometime between 1 June 2015 and 1 February 2022. All members who switch to alpha have their PCSPS benefits ‘banked’ with those with earlier benefits in one of the final salary sections of the PCSPS, with those benefits based on their final salary when they leave alpha. (The pension figures quoted for officials show pension earned in PCSPS or alpha as appropriate. Where the official has benefits in both the PCSPS and alpha the figure quoted is the combined value of their benefits in the two schemes). Members joining from October 2002 may opt for either the appropriate defined benefit arrangement or a ‘money purchase’ stakeholder pension with an employer contribution (partnership pension account).
ACCOUNTABILITY REPORT
67
Employee contributions are salary-related and range between 3% and 8.05% of pensionable earnings for members of classic (and members of alpha who were members of classic immediately before joining alpha) and between 4.6% and 8.05% for members of premium, classic plus, nuvos and all other members of alpha. Benefits in classic accrue at the rate of 1/80th of final pensionable earnings for each year of service. In addition, a lump sum equivalent to three years initial pension is payable on retirement. For premium, benefits accrue at the rate of 1/60th of final pensionable earnings for each year of service. Unlike classic, there is no automatic lump sum. Classic plus is essentially a hybrid with benefits for service before 1 October 2002 calculated broadly as per classic and benefits for service from October 2002 worked out as in premium. In nuvos a member builds up a pension based on his pensionable earnings during their period of scheme membership. At the end of the scheme year (31 March) the member’s earned pension account is credited with 2.3% of their pensionable earnings in that scheme year and the accrued pension is uprated in line with Pensions Increase legislation. Benefits in alpha build up in a similar way to nuvos, except that the accrual rate is 2.32%. In all cases members may opt to give up (commute) pension for a lump sum up to the limits set by the Finance Act 2004.
The partnership pension account is a stakeholder pension arrangement. The employer makes a basic contribution of between 3% and 12.5% up to 30 September 2015 and 8% and 14.75% from 1 October 2015 (depending on the age of the member) into a stakeholder pension product chosen by the employee from a panel of providers. The employee does not have to contribute, but where they do make contributions, the employer will match these up to a limit of 3% of pensionable salary (in addition to the employer’s basic contribution). Employers also contribute a further 0.8% of pensionable salary up to 30 September 2015 and 0.5% of pensionable salary from 1 October 2015 to cover the cost of centrally provided risk benefit cover (death in service and ill health retirement).The accrued pension quoted is the pension the member is entitled to receive when they reach pension age, or immediately on ceasing to be an active member of the scheme if they are already at or over pension age. Pension age is 60 for members of classic, premium and classic plus, 65 for members of nuvos, and the higher of 65 or State Pension Age for members of alpha. (The pension figures quoted for officials show pension earned in PCSPS or alpha as appropriate. Where the official has benefits in both the PCSPS and alpha, the figure quoted is the combined value of their benefits in the two schemes, but part of that pension may be payable from different ages).Further details about Civil Service pension arrangements can be found at www.civilservicepensionscheme.org.uk.
ANNUAL REPORT AND ACCOUNTS 2015–16
68
The Cash Equivalent Transfer Value A Cash Equivalent Transfer Value (CETV) is the actuarially assessed capitalised value of the pension scheme benefits accrued by a member at a particular point in time. The benefits valued are the member’s accrued benefits and any contingent spouse’s pension payable from the scheme. A CETV is a payment made by a pension scheme or arrangement to secure pension benefits in another pension scheme or arrangement when the member leaves a scheme and chooses to transfer the benefits accrued in their former scheme. The pension figures shown relate to the benefits that the individual has accrued as a consequence of their total membership of the pension scheme, not just their service in a senior capacity to which disclosure applies.
The figures include the value of any pension benefit in another scheme or arrangement which the member has transferred to the Civil Service Pension arrangements. They also include any additional pension benefit accrued to the member as a result of their purchasing additional pension benefits at their own cost. CETVs are worked out in accordance with The Occupational Pension Schemes (Transfer Values) (Amendment) Regulations 2008 and do not take account of any actual or potential reduction to benefits resulting from Lifetime Allowance Tax which may be due when pension benefits are taken.Real increase in CETV This reflects the increase in CETV that is funded by the employer. It does not include the increase in accrued pension due to inflation, contributions paid by the employee (including the value of any benefits transferred from another pension scheme or arrangement) and uses common market valuation factors for the start and end of the period.
7. Spend on consultancy and temporary staff
2015-16 2014-15
Core and Agency NDPBs Total
Core and Agency NDPBs Total
£’000 £’000 £’000 £’000 £’000 £’000
Consultancy 4,311 3,926 8,237 5,485 4,155 9,640Temporary staff 7,147 4,559 11,706 6,245 3,594 9,839Total 11,458 8,485 19,943 11,730 7,749 19,479
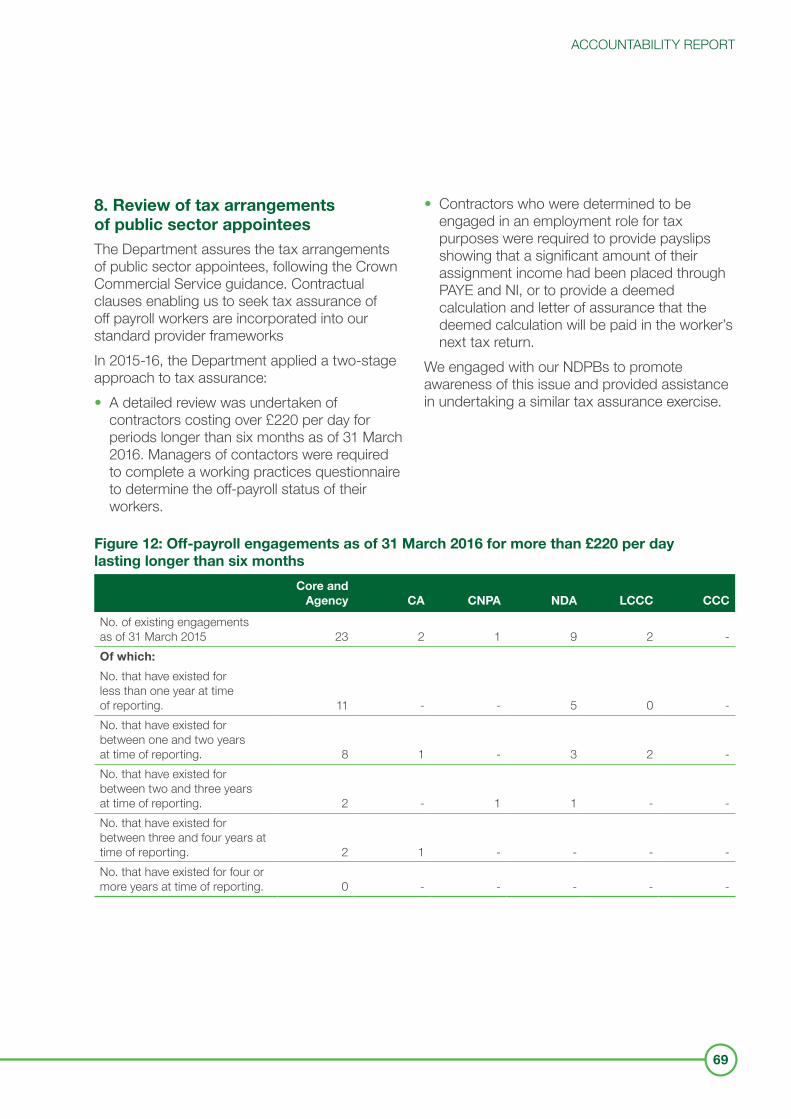
ACCOUNTABILITY REPORT
69
8. Review of tax arrangements of public sector appointees The Department assures the tax arrangements of public sector appointees, following the Crown Commercial Service guidance. Contractual clauses enabling us to seek tax assurance of off payroll workers are incorporated into our standard provider frameworks In 2015-16, the Department applied a two-stage approach to tax assurance: • A detailed review was undertaken of
contractors costing over £220 per day for periods longer than six months as of 31 March 2016. Managers of contactors were required to complete a working practices questionnaire to determine the off-payroll status of their workers.
• Contractors who were determined to be engaged in an employment role for tax purposes were required to provide payslips showing that a significant amount of their assignment income had been placed through PAYE and NI, or to provide a deemed calculation and letter of assurance that the deemed calculation will be paid in the worker’s next tax return.
We engaged with our NDPBs to promote awareness of this issue and provided assistance in undertaking a similar tax assurance exercise.
Figure 12: Off-payroll engagements as of 31 March 2016 for more than £220 per day lasting longer than six months
Core and Agency CA CNPA NDA LCCC CCC
No. of existing engagements as of 31 March 2015 23 2 1 9 2 -Of which:
No. that have existed for less than one year at time of reporting. 11 - - 5 0 -No. that have existed for between one and two years at time of reporting. 8 1 - 3 2 -No. that have existed for between two and three years at time of reporting. 2 - 1 1 - -No. that have existed for between three and four years at time of reporting. 2 1 - - - -No. that have existed for four or more years at time of reporting. 0 - - - - -

ANNUAL REPORT AND ACCOUNTS 2015–16
70
Figure 13: New off-payroll engagements, or those that reached six months in duration, between 1 April 2015 and 31 March 2016, for more than £220 per day and lasting longer than six months
Core and Agency CA CNPA NDA LCCC CCC
No. of new engagements, or those that reached six months in duration, between 1 April 2015 and 31 March 2016 37 2 1 9 2 -No. of the above which include contractual clauses giving the Department the right to request assurance in relation to income tax and National Insurance obligations 31 2 - 9 2 -No. for whom assurance has been requested 37 2 1 9 2 -Of which:
No. for whom assurance has been received 34 2 1 8 2 -No. for whom assurance has not been received 31 - - 12 - -No. that have been terminated as a result of assurance not being received. 13 - - - - -
1 Assurance was either insufficient or not provided.2 One individual left the NDA before further action was taken.3 One individual’s engagement was terminated. Two individuals left the Department before further action was taken.
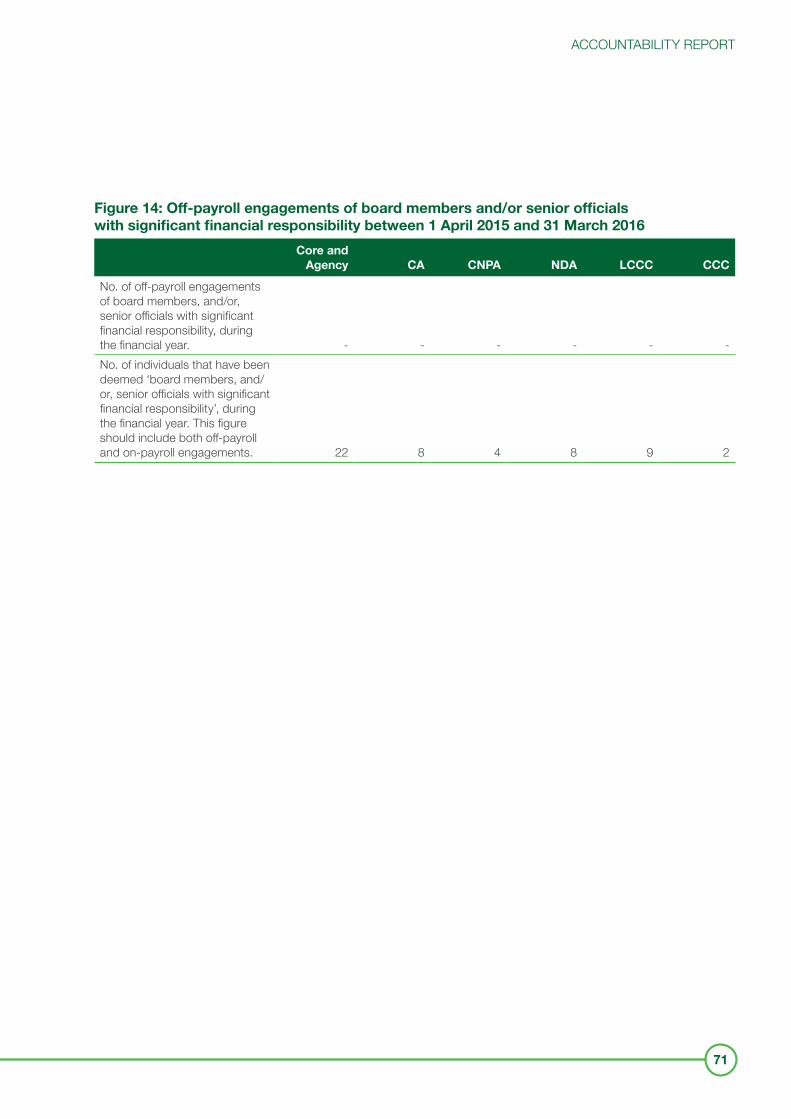
ACCOUNTABILITY REPORT
71
Figure 14: Off-payroll engagements of board members and/or senior officials with significant financial responsibility between 1 April 2015 and 31 March 2016
Core and Agency CA CNPA NDA LCCC CCC
No. of off-payroll engagements of board members, and/or, senior officials with significant financial responsibility, during the financial year. - - - - - -No. of individuals that have been deemed ‘board members, and/or, senior officials with significant financial responsibility’, during the financial year. This figure should include both off-payroll and on-payroll engagements. 22 8 4 8 9 2
ANNUAL REPORT AND ACCOUNTS 2015–16
72
STAFF REPORTBuilding capability The Department has continued to invest in the development of its people. The focus has been on driving capability in the four main priority areas for the Civil Service: • leading and managing change;• commercial skills and behaviours;• project delivery; and • digital services. In the area of leadership and managing change, our People Survey score remains constant at 44% which is 1% higher than the Civil Service average, but 8% lower than high performers. In response we:• launched our revised manager induction;• launched a new mentoring scheme with
130 new partnerships formed;• set clear expectations for our professions
to support professional development;• launched a revised commercial development
offer, with over 100 attendees to date;• continued to focus efforts on improving
the way we manage performance; and• delivered an Open Policy Making programme
for all senior civil servants in the Department to lead our work as a consumer-focused Department.
We have continued to use our commercial specialists recruited in 2014-15 to lead the delivery of our commercial awareness programme at introductory level.Thirty contract managers have undertaken the International Association for Contract and Commercial Management (IACCM) Programme.
Nineteen of our project leaders have completed or are currently attending the Major Projects Leadership Academy (MPLA) programme. Our project delivery specialists deliver in-house seminars to build the Department’s specific capability.We are sponsoring 4 senior policy makers on the Executive Masters in Public Policy, a new qualification.On digital services, we have increased our awareness levels by 30% through targeted communications. Assessment panels have increased our knowledge of Digital by Default schemes and support our policy design. We have continued to support the development of fast streamers, apprentices, diversity internships and the Movement to Work scheme. We have continued to offer a small number of both inward and outward loans and secondments to increase our understanding of industry and to develop our talent pipeline.The Department participates in cross-departmental talent schemes, including Future Leaders, Senior Leaders and the High Potential Development Scheme. We work in partnership with other departments on a tailored talent scheme for Grade 6 and 7 staff.
ACCOUNTABILITY REPORT
73
Diversity and InclusionWe are committed to creating a diverse and inclusive workforce. Although there is still work to do, we have made progress. Last year we launched our Diversity and Inclusion Vision, which sets out our ambitions. We also launched our Diversity Goals, which are the Department’s targets for diversity representation rates at a range of staff grades. The targets were developed to address the issue of underrepresentation of:• women in the Senior Civil Service (SCS); • black and minority ethnic (BAME) staff;• lesbian, gay and bisexual and transgender
(LGBT) staff; and• staff with disabilities across all grades
in the Department.The Department has begun to embed the Diversity and Inclusion Vision. All directorates in the Department have been asked to take ownership of the agenda and to pledge actions they will take to improve diversity and inclusion outcomes. There have been improvements in our diversity representation rates. For example, the proportion of women has increased from 31% in January 2014 to 41% by January 2015. During the last year the proportion of women at SCS pay band 2 and above has also increased from19% to 28% and the proportion of BAME staff in SCS grades has increased from 1% to 4%.We recognise that, despite progression in some areas, movement remains slow in others. BAME representation and representation of those with disabilities at Grade 6 and 7 is lower than the targets we have set ourselves for 2015-16, as is the representation of LGBT staff in the SCS. We therefore have more work to do to ensure that we meet our diversity and inclusion aims.
In recent months we have:• relaunched our Domestic Violence Support
Group and trained a significant number of line managers;
• promoted the executive officer, higher executive officer and senior executive officer Positive Action Pathways cross-government development programmes to staff, providing support via a workshop and further support to the four members of staff who were awarded places;
• matched 108 mentees with mentors and ensured that we have 64 SCS on our departmental Reverse Mentoring scheme;
• put in place a Partnership Agreement with our Staff Diversity Networks;
• continued to actively encourage our people to declare their diversity status;
• established a Mental Health and Wellbeing Group for the Department; and
• launched our Mental Health First Aid Service which provides first support to those in the Department who seek help due to a mental health concern.
The Department is committed to ensuring equality of opportunity for all disabled employees. As part of the Department’s job application process candidates who have a disability who apply for a post in the Department (under the Guaranteed Interview Scheme) are automatically put forward to the interview stage provided they satisfy the minimum criteria. The Department makes this clear in its job adverts and application forms. The Department also promotes external vacancies in a range of diversity media.
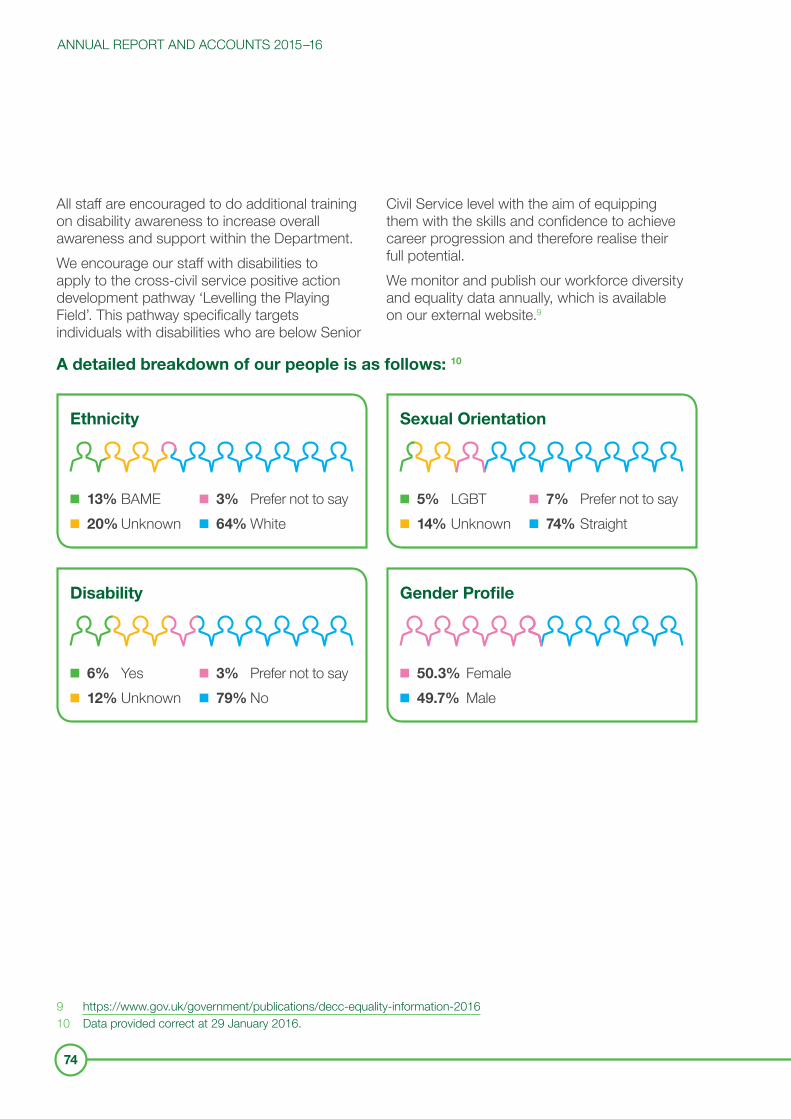
ANNUAL REPORT AND ACCOUNTS 2015–16
74
All staff are encouraged to do additional training on disability awareness to increase overall awareness and support within the Department. We encourage our staff with disabilities to apply to the cross-civil service positive action development pathway ‘Levelling the Playing Field’. This pathway specifically targets individuals with disabilities who are below Senior
Civil Service level with the aim of equipping them with the skills and confidence to achieve career progression and therefore realise their full potential.We monitor and publish our workforce diversity and equality data annually, which is available on our external website.9
A detailed breakdown of our people is as follows: 10
9 https://www.gov.uk/government/publications/decc-equality-information-201610 Data provided correct at 29 January 2016.
Ethnicity
Disability
Sexual Orientation
Gender Profile
13% BAME20% Unknown
6% Yes12% Unknown
5% LGBT14% Unknown
50.3% Female49.7% Male
3% Prefer not to say64% White
3% Prefer not to say79% No
7% Prefer not to say74% Straight
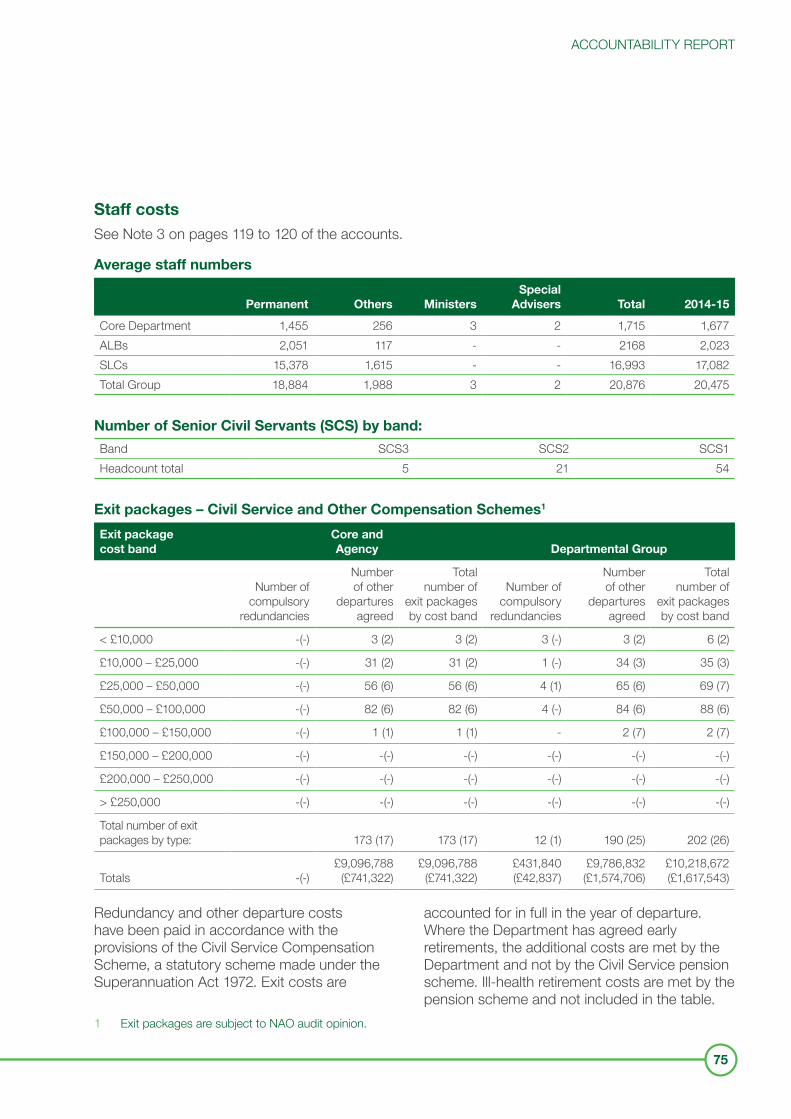
ACCOUNTABILITY REPORT
75
Staff costsSee Note 3 on pages 119 to 120 of the accounts.
Average staff numbers
Permanent Others MinistersSpecial
Advisers Total 2014-15
Core Department 1,455 256 3 2 1,715 1,677 ALBs 2,051 117 - - 2168 2,023SLCs 15,378 1,615 - - 16,993 17,082Total Group 18,884 1,988 3 2 20,876 20,475
Number of Senior Civil Servants (SCS) by band:
Band SCS3 SCS2 SCS1Headcount total 5 21 54
Exit packages – Civil Service and Other Compensation Schemes1
Exit package cost band
Core and Agency Departmental Group
Number of compulsory
redundancies
Number of other
departures agreed
Total number of
exit packages by cost band
Number of compulsory
redundancies
Number of other
departures agreed
Total number of
exit packages by cost band
< £10,000 -(-) 3 (2) 3 (2) 3 (-) 3 (2) 6 (2)
£10,000 – £25,000 -(-) 31 (2) 31 (2) 1 (-) 34 (3) 35 (3)
£25,000 – £50,000 -(-) 56 (6) 56 (6) 4 (1) 65 (6) 69 (7)
£50,000 – £100,000 -(-) 82 (6) 82 (6) 4 (-) 84 (6) 88 (6)
£100,000 – £150,000 -(-) 1 (1) 1 (1) - 2 (7) 2 (7)
£150,000 – £200,000 -(-) -(-) -(-) -(-) -(-) -(-)
£200,000 – £250,000 -(-) -(-) -(-) -(-) -(-) -(-)
> £250,000 -(-) -(-) -(-) -(-) -(-) -(-)
Total number of exit packages by type: 173 (17) 173 (17) 12 (1) 190 (25) 202 (26)
Totals -(-) £9,096,788
(£741,322) £9,096,788
(£741,322)£431,840 (£42,837)
£9,786,832 (£1,574,706)
£10,218,672 (£1,617,543)
Redundancy and other departure costs have been paid in accordance with the provisions of the Civil Service Compensation Scheme, a statutory scheme made under the Superannuation Act 1972. Exit costs are
accounted for in full in the year of departure. Where the Department has agreed early retirements, the additional costs are met by the Department and not by the Civil Service pension scheme. Ill-health retirement costs are met by the pension scheme and not included in the table.
1 Exit packages are subject to NAO audit opinion.
ANNUAL REPORT AND ACCOUNTS 2015–16
76
Communicating with our employees The Department continues to use the full range of its internal communications channels, both face to face and digital, to engage with staff and promote key information on matters of concern to them. This includes regular formal and informal meetings with the Departmental Trade Union Side, creating a positive employee-relations environment. Key areas of consultation during 2015-16:• organisational changes associated with
reshaping the Department to better meet organisational priorities, including proposals for a voluntary exit scheme for employees;
• a refreshed restructuring, redeployment and redu- ndancy policy to align with Cabinet Office guidance;
• an updated attendance management policy (diversity networks were also consulted); and
• a revised annual awards process (Celebrating Success) (diversity networks were also consulted).
Health and safety We have a strong record in providing a safe and supportive work environment, and had no accidents to report in accordance with the Reporting of Injuries, Diseases and Dangerous Occurrences Regulations 2013 (RIDDOR). There were no enforcement actions against the Department.Health and Safety is monitored quarterly by the Health and Safety Committee.The Department considers the wellbeing of staff to be paramount and works within the framework of the Civil Service Health and Wellbeing Strategy. The focus is mental health, musculoskeletal health and a healthy lifestyle.
Sickness absence The Department is committed to supporting the physical and mental health of its people. A refreshed and updated attendance management policy was introduced on 20 July 2015 with the launch supported by workshops for all line managers. The policy aligned the Department with the Civil Service model and focused on:• improving absence reporting;• promoting workplace wellness;• a culture of attendance; and • removing barriers to work. We have an occupational health provision and an employee assistance provider in place to provide additional support. The average number of days lost due to sickness was 2.Rates of sickness absence in the Department have historically been relatively low, reflecting both the small policy nature of the Department, and our flexible working practices. A move from a paper based reporting system for sickness absence, to an electronically based system in June 2016 has lowered the risk of underreporting and may therefore result in a small increase in sickness absence figures in 2016-17.

ACCOUNTABILITY REPORT
77
Health serviceThe Department uses an independent, confidential occupational health service. Individuals are asked for their consent to a referral to the Department’s medical adviser for an assessment of their fitness for work or to help the Department consider reasonable adjustments to support them in the workplace in accordance with our duty under the Equality Act 2010. In addition, to help ensure that staff have the best opportunity to continue their employment, the Department also provides dedicated information and a counselling support service through our Employee Assistance Programme.
Whistleblowing The Department has a whistleblowing policy and procedure in place which provides clear guidance for employees on the avenues they can use to raise concerns. The importance of raising concerns and the process for doing so is publicised to all employees of the Department on a regular basis. Nominated officers are also available to provide impartial and confidential support and advice to employees and line managers. The Department monitors all concerns raised and the action taken to resolve and address issues. An Annual Report is also provided to the Department’s Audit and Risk Commitment for review.
Jeremy PocklingtonPrincipal Accounting Officer and Acting Permanent Secretary1 July 2016
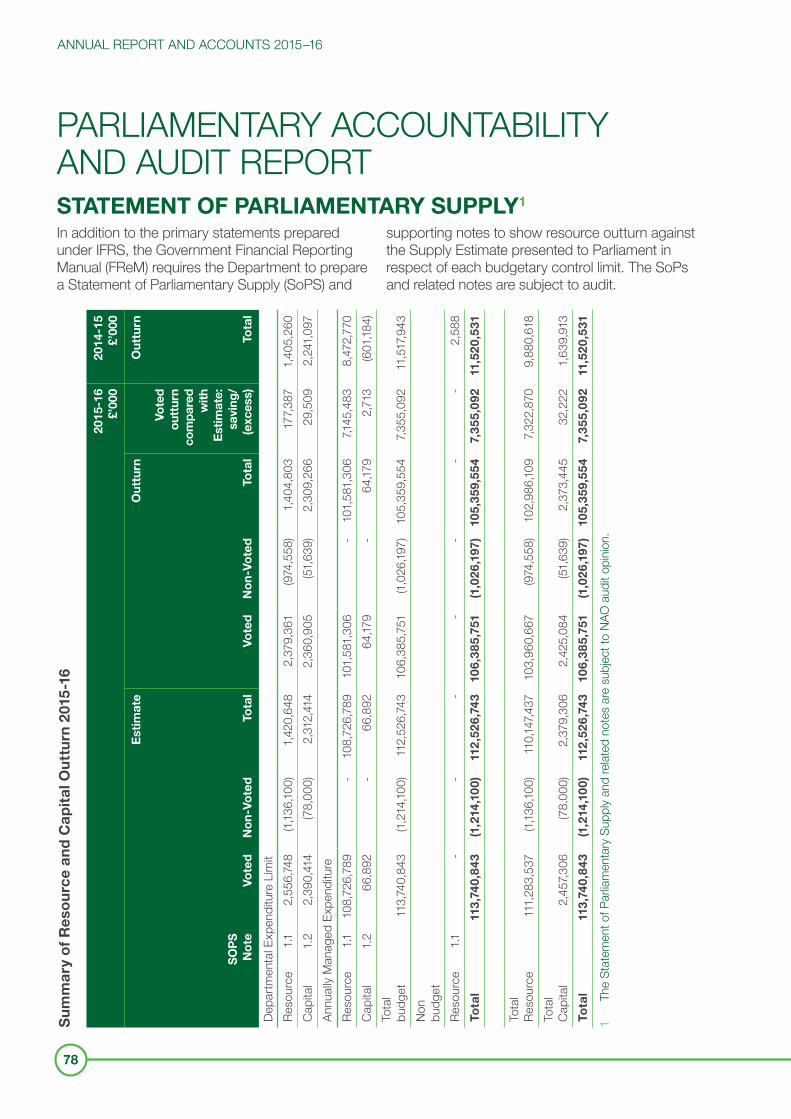
ANNUAL REPORT AND ACCOUNTS 2015–16
78
61-510n
2r
uttu
l Oatipa
d C
ne
acr
uose
f R
y o
ram
mu
S
PARLIAMENTARY ACCOUNTABILITY AND AUDIT REPORT STATEMENT OF PARLIAMENTARY SUPPLY1
In addition to the primary statements prepared supporting notes to show resource outturn against under IFRS, the Government Financial Reporting the Supply Estimate presented to Parliament in Manual (FReM) requires the Department to prepare respect of each budgetary control limit. The SoPs a Statement of Parliamentary Supply (SoPS) and and related notes are subject to audit.
2015
-16
£’00
020
14-1
5 £’
000
Est
imat
eO
uttu
rnO
uttu
rn
SO
PS
N
ote
Vote
dN
on-
Vote
dTo
tal
Vote
dN
on-
Vote
dTo
tal
Vote
d
out
turn
co
mp
ared
w
ith
Est
imat
e:
savi
ng/
(exc
ess)
Tota
l
Depa
rtmen
tal E
xpen
ditu
re L
imit
Reso
urce
1.12,
556,
748
(1,13
6,10
0)1,
420,
648
2,37
9,36
1(9
74,5
58)
1,40
4,80
3 1
77,3
871,
405,
260
Capi
tal
1.2
2,39
0,41
4 (7
8,00
0)2,
312,
414
2,36
0,90
5(5
1,63
9)2,
309,
266
29,
509
2,24
1,09
7 An
nual
ly M
anag
ed E
xpen
ditu
reRe
sour
ce1.1
108,
726,
789
-10
8,72
6,78
9 10
1,58
1,30
6-
101,
581,
306
7,145
,483
8,47
2,77
0 Ca
pita
l1.
266
,892
-
66,8
92
64,17
9-
64,17
92,
713
(601
,184)
Tota
l bu
dget
113,
740,
843
(1,21
4,100
)11
2,52
6,74
3 10
6,38
5,75
1(1,
026,
197)
105,
359,
554
7,355
,092
11,5
17,9
43
Non
bu
dget
Reso
urce
1.1-
--
--
--
2,58
8 To
tal
113,
740,
843
(1,2
14,1
00)
112
,526
,743
10
6,38
5,75
1(1
,026
,197
)10
5,35
9,55
47,
355,
092
11,5
20,5
31
Tota
l Re
sour
ce11
1,28
3,53
7 (1,
136,
100)
110,
147,4
37
103,
960,
667
(974
,558
)10
2,98
6,10
97,3
22,8
709,
880,
618
Tota
l Ca
pita
l2,
457,3
06
(78,
000)
2,37
9,30
6 2,
425,
084
(51,
639)
2,37
3,44
532
,222
1,63
9,91
3 To
tal
113,
740,
843
(1,2
14,1
00)
112
,526
,743
10
6,38
5,75
1(1
,026
,197
)10
5,35
9,55
47,
355,
092
11,5
20,5
31
1 Th
e St
atem
ent o
f Par
liam
enta
ry S
uppl
y an
d re
lated
not
es a
re s
ubjec
t to
NAO
aud
it op
inio
n.
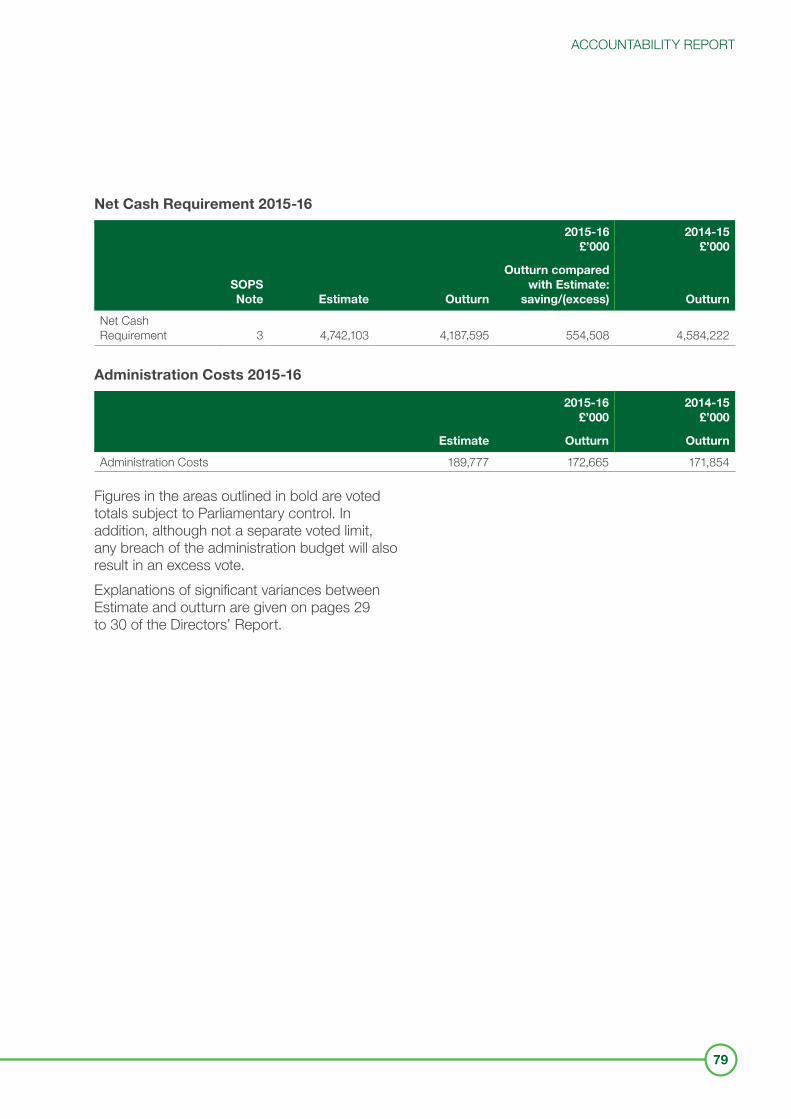
ACCOUNTABILITY REPORT
79
Net Cash Requirement 2015-16
2015-16 £’000
2014-15 £’000
SOPS Note Estimate Outturn
Outturn compared with Estimate:
saving/(excess) Outturn
Net Cash Requirement 3 4,742,103 4,187,595 554,508 4,584,222
Administration Costs 2015-16
2015-16 £’000
2014-15 £’000
Estimate Outturn Outturn
Administration Costs 189,777 172,665 171,854
Figures in the areas outlined in bold are voted totals subject to Parliamentary control. In addition, although not a separate voted limit, any breach of the administration budget will also result in an excess vote. Explanations of significant variances between Estimate and outturn are given on pages 29 to 30 of the Directors’ Report.
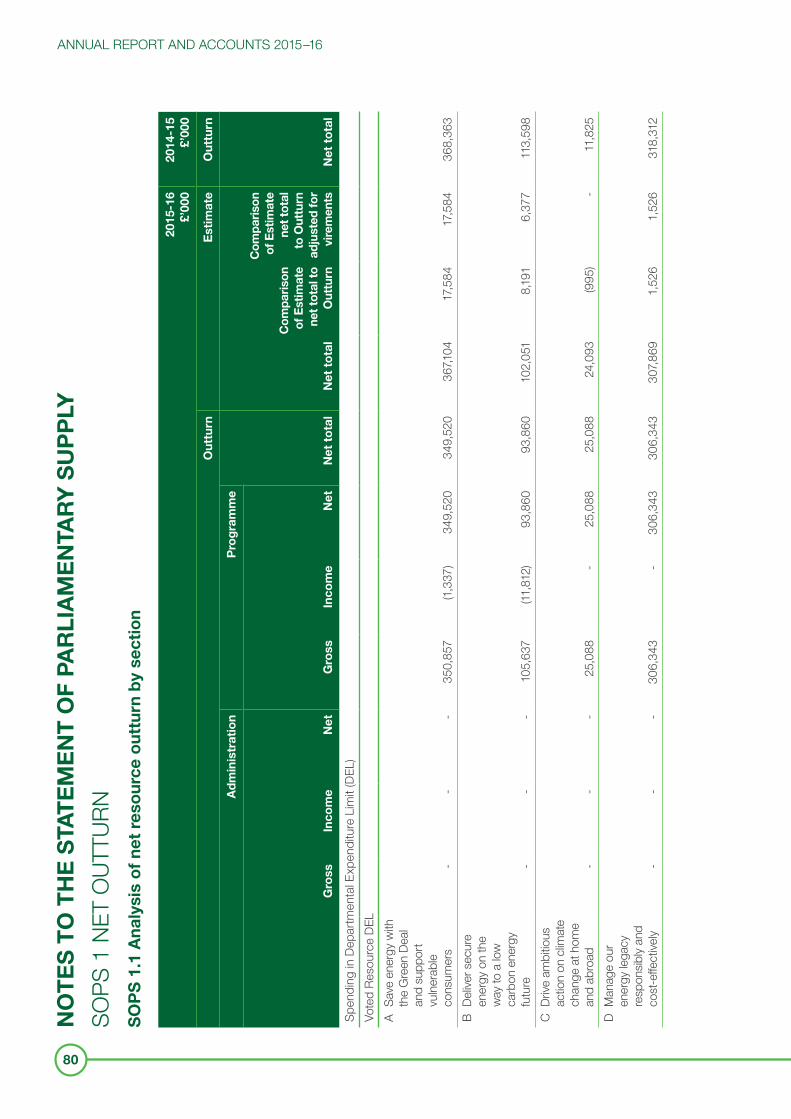
ANNUAL REPORT AND ACCOUNTS 2015–16
80
NO
TE
S T
O T
HE
STA
TE
ME
NT
OF
PAR
LIA
ME
NTA
RY
SU
PP
LY
SOPS
1 N
ET O
UTTU
RNS
OP
S 1
.1 A
naly
sis
of
net
reso
urce
out
turn
by
sect
ion
2015
-16
£’00
020
14-1
5 £’
000
Out
turn
Est
imat
eO
uttu
rn
Ad
min
istr
atio
nP
rog
ram
me
Gro
ssIn
com
eN
etG
ross
Inco
me
Net
Net
to
tal
Net
to
tal
Com
pari
son
of E
stim
ate
net
tota
l to
O
uttu
rn
Com
pari
son
of E
stim
ate
net
tota
l to
Out
turn
ad
just
ed fo
r vi
rem
ents
Net
to
tal
Spen
ding
in D
epar
tmen
tal E
xpen
ditu
re L
imit
(DEL
)Vo
ted
Reso
urce
DEL
A Sa
ve e
nerg
y w
ith
the
Gre
en D
eal
and
supp
ort
vuln
erab
le co
nsum
ers
--
-35
0,85
7(1,
337)
349,
520
349,
520
367,1
04
17,5
8417
,584
368,
363
B De
liver
sec
ure
ener
gy o
n th
e w
ay to
a lo
w
carb
on e
nerg
y fu
ture
--
-10
5,63
7 (11
,812
)93
,860
93,8
6010
2,05
1 8,
191
6,37
711
3,59
8 C
Drive
am
bitio
us
actio
n on
clim
ate
chan
ge a
t hom
e an
d ab
road
--
-25
,088
-
25,0
88
25,0
88
24,0
93
(995
)-
11,8
25
D M
anag
e ou
r en
ergy
lega
cy
resp
onsib
ly an
d co
st-e
ffect
ively
--
-30
6,34
3-
306,
343
306,
343
307,8
69
1,52
61,
526
318,
312
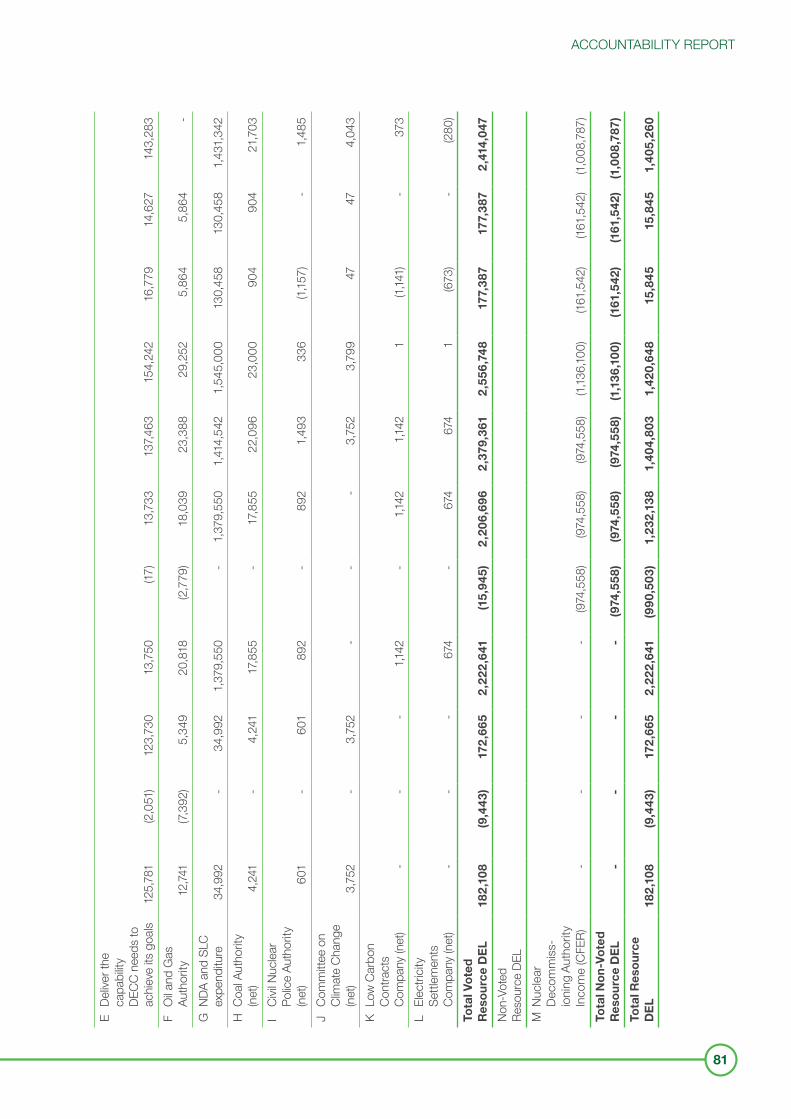
ACCOUNTABILITY REPORT
81
E De
liver
the
capa
bility
DE
CC n
eeds
to
achi
eve
its g
oals
125,
781
(2,0
51)
123,
730
13,7
50
(17)
13,7
33
137,4
63
154,
242
16,7
79
14,6
27
143,
283
F O
il and
Gas
Au
thor
ity12
,741
(7,39
2)5,
349
20,8
18
(2,7
79)
18,0
39
23,3
8829
,252
5,
864
5,86
4-
G N
DA a
nd S
LC
expe
nditu
re34
,992
-
34,9
92
1,37
9,55
0-
1,37
9,55
01,
414,
542
1,54
5,00
0 13
0,45
813
0,45
81,
431,
342
H Co
al Au
thor
ity
(net
)4,
241
-4,
241
17,8
55-
17,8
5522
,096
23,0
00
904
904
21,7
03
I Ci
vil N
uclea
r Po
lice
Auth
ority
(n
et)
601
-60
1 89
2 -
892
1,49
3 33
6 (1,
157)
-1,
485
J Co
mm
ittee
on
Clim
ate
Chan
ge
(net
)3,
752
-3,
752
--
-3,
752
3,79
9 47
47
4,
043
K Lo
w C
arbo
n Co
ntra
cts
Com
pany
(net
)-
--
1,142
-1,1
421,1
421
(1,14
1)-
373
L El
ectri
city
Settl
emen
ts
Com
pany
(net
)-
--
674
-67
467
41
(673
) -
(280
)To
tal V
ote
d
Res
our
ce D
EL
182
,108
(9,4
43)
172
,665
2,2
22,6
41(1
5,94
5)2
,206
,696
2,3
79,3
612
,556
,748
17
7,38
717
7,38
72
,414
,047
Non-
Vote
d Re
sour
ce D
ELM
Nuc
lear
De
com
miss
- io
ning
Aut
horit
y In
com
e (C
FER)
--
--
(974
,558
)(9
74,5
58)
(974
,558
)(1,
136,
100)
(161,
542)
(161,
542)
(1,00
8,78
7)To
tal N
on-
Vote
d
Res
our
ce D
EL
--
--
(974
,558
)(9
74,5
58)
(974
,558
)(1
,136
,100
)(1
61,5
42)
(161
,542
)(1
,008
,787
)
Tota
l Res
our
ce
DE
L18
2,1
08(9
,443
)17
2,6
652
,222
,641
(990
,503
)1,
232
,138
1,40
4,80
31,
420,
648
15,8
4515
,845
1,40
5,26
0
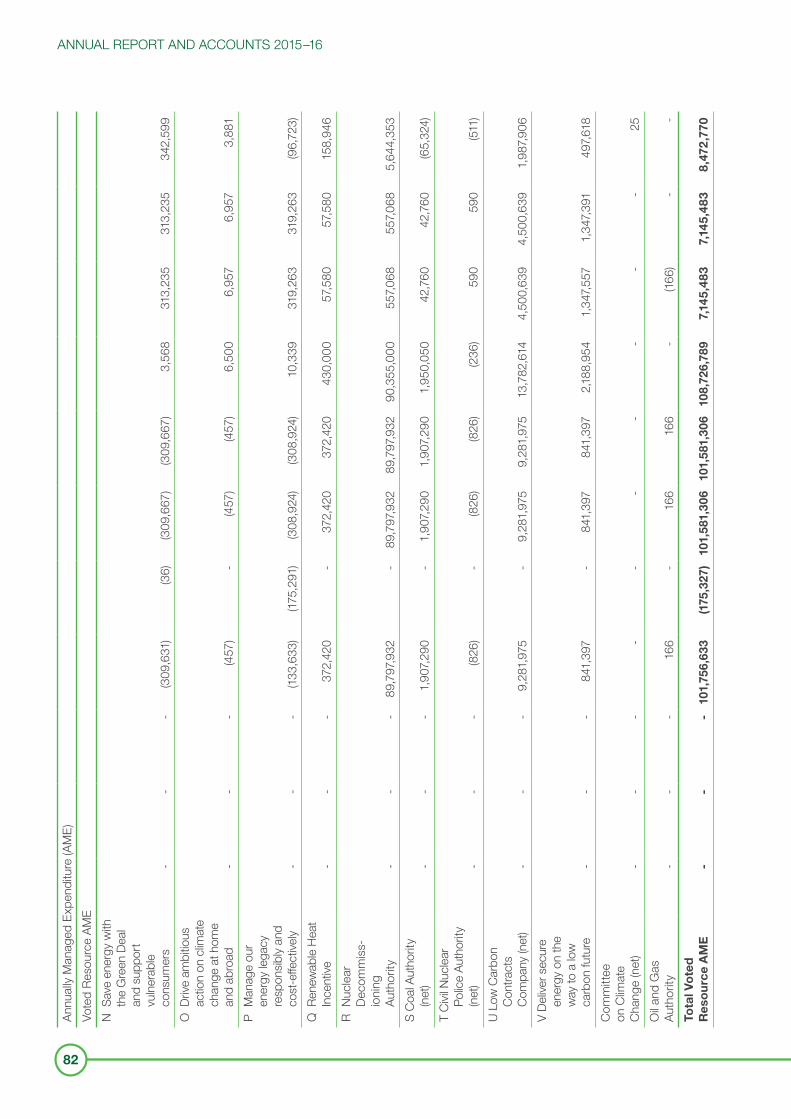
ANNUAL REPORT AND ACCOUNTS 2015–16
82
Annu
ally
Man
aged
Exp
endi
ture
(AM
E)Vo
ted
Reso
urce
AM
EN
Save
ene
rgy
with
th
e G
reen
Dea
l an
d su
ppor
t vu
lner
able
cons
umer
s-
--
(309
,631
)(3
6)(3
09,6
67)
(309
,667
)3,
568
313,
235
313,
235
342,
599
O D
rive
ambi
tious
ac
tion
on c
limat
e ch
ange
at h
ome
and
abro
ad-
--
(457
)-
(457
)(4
57)
6,50
0 6,
957
6,95
7 3,
881
P M
anag
e ou
r en
ergy
lega
cy
resp
onsib
ly an
d co
st-e
ffect
ively
--
-(13
3,63
3)(17
5,29
1)(3
08,9
24)
(308
,924
)10
,339
31
9,26
3 31
9,26
3 (9
6,72
3)Q
Ren
ewab
le He
at
Ince
ntive
--
-37
2,42
0 -
372,
420
372,
420
430,
000
57,5
80
57,5
80
158,
946
R Nu
clea
r De
com
miss
- io
ning
Au
thor
ity-
--
89,7
97,9
32-
89,7
97,9
3289
,797
,932
90,3
55,0
00
557,0
6855
7,068
5,64
4,35
3 S
Coal
Auth
ority
(n
et)
--
-1,
907,2
90
-1,
907,2
90
1,90
7,290
1,
950,
050
42,7
60
42,7
60
(65,
324)
T Ci
vil N
uclea
r Po
lice
Auth
ority
(n
et)
--
-(8
26)
-(8
26)
(826
)(2
36)
590
590
(511
)U
Low
Car
bon
Cont
ract
s Co
mpa
ny (n
et)
--
-9,
281,
975
-9,
281,
975
9,28
1,97
5 13
,782
,614
4,
500,
639
4,50
0,63
9 1,
987,9
06
V De
liver
sec
ure
ener
gy o
n th
e w
ay to
a lo
w
carb
on fu
ture
--
-84
1,39
7 -
841,
397
841,
397
2,188
,954
1,
347,5
57
1,34
7,391
497,6
18
Com
mitt
ee
on C
limat
e
Chan
ge (n
et)
--
--
--
--
--
25
Oil a
nd G
as
Auth
ority
--
-16
6-
166
166
-(16
6)-
-To
tal V
ote
d
Res
ou
rce
AM
E-
--
101,
756,
633
(175
,327
)10
1,58
1,30
610
1,58
1,30
610
8,72
6,78
9 7,
145,
483
7,14
5,48
38,
472
,770
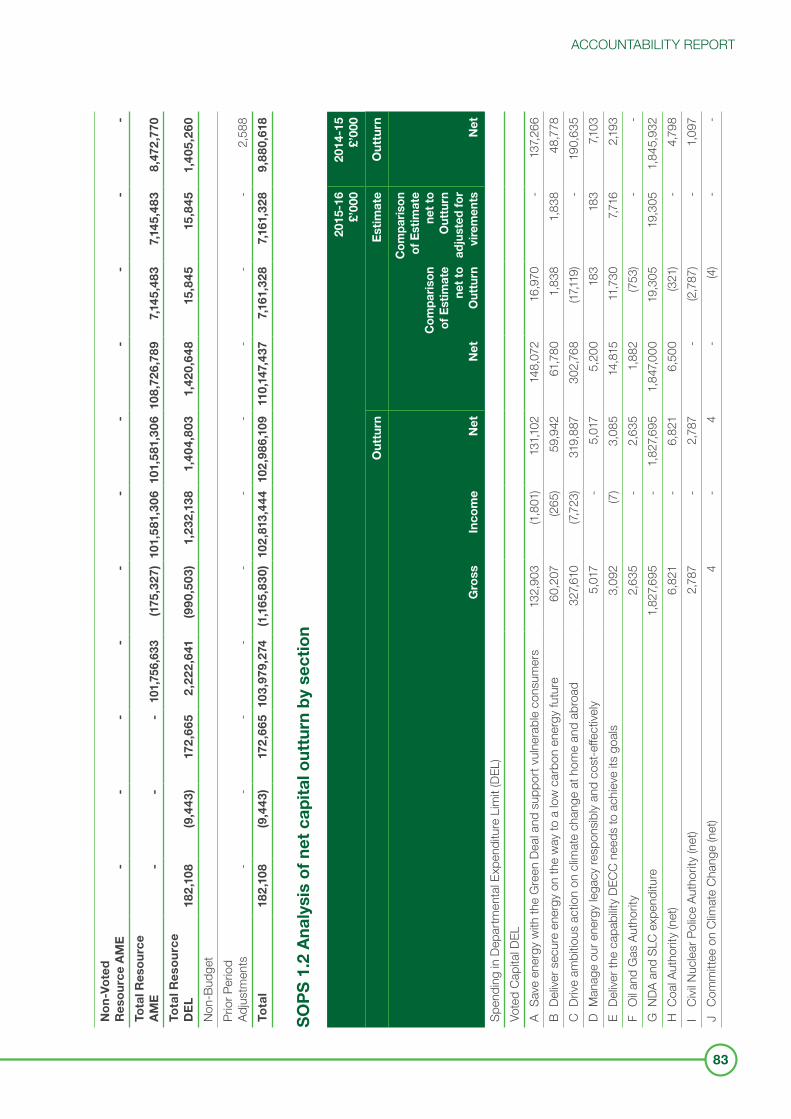
ACCOUNTABILITY REPORT
83
No
n-V
ote
d
Res
ou
rce
AM
E-
--
--
--
--
--
Tota
l Res
ou
rce
AM
E-
--
101,
756,
633
(175
,327
)10
1,58
1,30
610
1,58
1,30
610
8,72
6,78
9 7,
145,
483
7,14
5,48
38,
472
,770
Tota
l Res
ou
rce
DE
L18
2,1
08(9
,443
)17
2,6
652
,222
,641
(990
,503
)1,
232
,138
1,40
4,80
31,
420,
648
15,8
4515
,845
1,40
5,26
0
Non
-Bud
get
Prio
r Per
iod
Adju
stm
ents
--
--
--
--
--
2,58
8 To
tal
182
,108
(9,4
43)
172
,665
103,
979,
274
(1,1
65,8
30)
102,
813,
444
102,
986,
109
110,
147,
437
7,16
1,32
87,
161,
328
9,88
0,61
8
SO
PS
1.2
Ana
lysi
s o
f ne
t ca
pit
al o
uttu
rn b
y se
ctio
n
2015
-16
£’00
020
14-1
5 £’
000
Out
turn
Est
imat
eO
uttu
rn
Gro
ssIn
com
eN
etN
et
Com
pari
son
of E
stim
ate
net
to
Out
turn
Com
pari
son
of E
stim
ate
net
to
Out
turn
ad
just
ed fo
r vi
rem
ents
Net
Spen
ding
in D
epar
tmen
tal E
xpen
ditu
re L
imit
(DEL
)Vo
ted
Capi
tal D
ELA
Save
ene
rgy
with
the
Gre
en D
eal a
nd s
uppo
rt vu
lner
able
con
sum
ers
132,
903
(1,80
1)13
1,102
148,
072
16,9
70-
137,2
66
B De
liver
sec
ure
ener
gy o
n th
e w
ay to
a lo
w c
arbo
n en
ergy
futu
re60
,207
(2
65)
59,9
42
61,7
80
1,83
8 1,
838
48,7
78
C Dr
ive a
mbi
tious
act
ion
on c
limat
e ch
ange
at h
ome
and
abro
ad32
7,610
(7,72
3)31
9,88
730
2,76
8 (17
,119)
-19
0,63
5 D
Man
age
our e
nerg
y le
gacy
resp
onsib
ly an
d co
st-e
ffect
ively
5,01
7 -
5,01
7 5,
200
183
183
7,103
E
Deliv
er th
e ca
pabi
lity
DECC
nee
ds to
ach
ieve
its
goal
s3,
092
(7)
3,08
514
,815
11
,730
7,716
2,193
F
Oil a
nd G
as A
utho
rity
2,63
5-
2,63
51,
882
(753
)-
-G
NDA
and
SLC
exp
endi
ture
1,82
7,695
-
1,82
7,695
1,
847,0
00
19,3
05
19,3
05
1,84
5,93
2 H
Coa
l Aut
horit
y (n
et)
6,82
1 -
6,82
1 6,
500
(321
)-
4,79
8 I
Civil
Nuc
lear
Pol
ice
Auth
ority
(net
)2,
787
-2,
787
-(2
,787
)-
1,09
7 J
Com
mitt
ee o
n Cl
imat
e Ch
ange
(net
)4
-4
-(4
)-
-
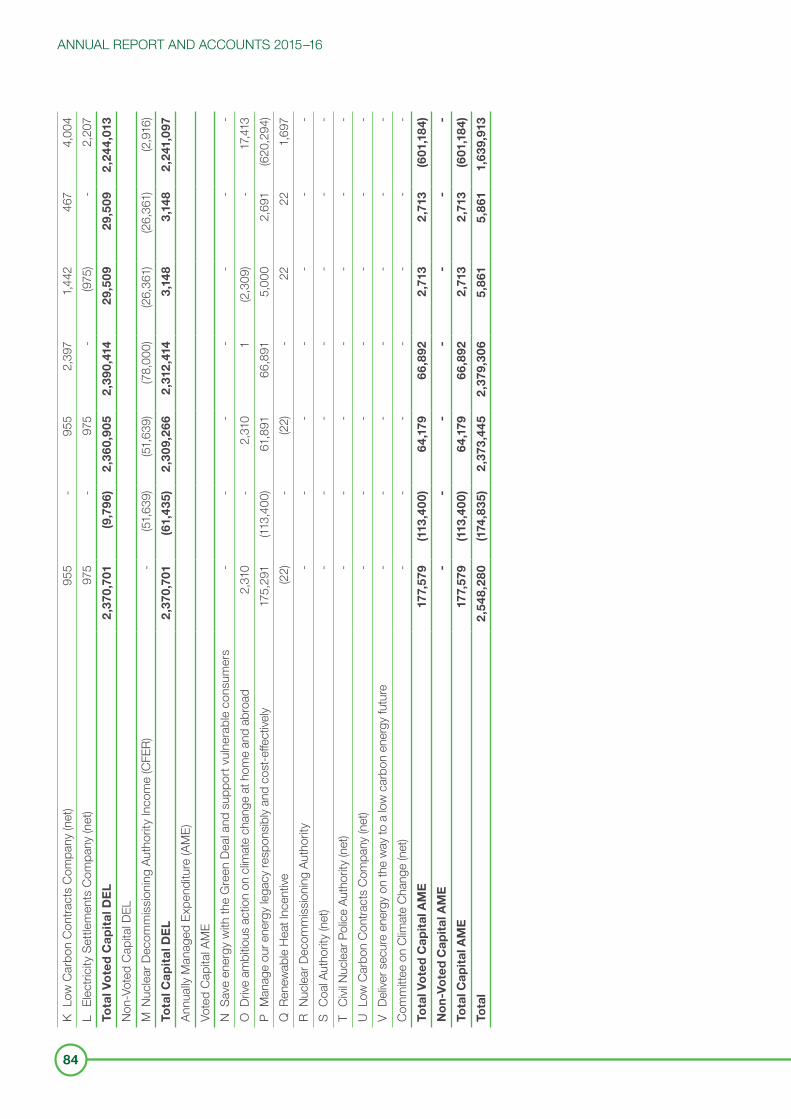
ANNUAL REPORT AND ACCOUNTS 2015–16
84
K Lo
w C
arbo
n C
ontra
cts
Com
pany
(net
)95
5-
955
2,39
7 1,
442
467
4,00
4 L
Elec
trici
ty S
ettle
men
ts C
ompa
ny (n
et)
975
-97
5-
(975
)-
2,20
7 To
tal V
ote
d C
apit
al D
EL
2,3
70,7
01(9
,796
)2
,360
,905
2,3
90,4
14
29,5
0929
,509
2,2
44,0
13
Non
-Vot
ed C
apita
l DEL
M N
ucle
ar D
ecom
miss
ioni
ng A
utho
rity
Inco
me
(CFE
R)-
(51,
639)
(51,
639)
(78,
000)
(26,
361)
(26,
361)
(2,9
16)
Tota
l Cap
ital
DE
L2
,370
,701
(61,
435)
2,3
09,2
662
,312
,414
3,
148
3,14
82
,241
,097
Annu
ally
Man
aged
Exp
endi
ture
(AM
E)Vo
ted
Capi
tal A
ME
N Sa
ve e
nerg
y w
ith th
e G
reen
Dea
l and
sup
port
vuln
erab
le c
onsu
mer
s -
--
--
--
O D
rive
ambi
tious
act
ion
on c
limat
e ch
ange
at h
ome
and
abro
ad2,
310
-2,
310
1 (2
,309
)-
17,4
13
P M
anag
e ou
r ene
rgy
lega
cy re
spon
sibly
and
cost
-effe
ctive
ly17
5,29
1 (11
3,40
0)61
,891
66
,891
5,
000
2,69
1(6
20,2
94)
Q R
enew
able
Heat
Ince
ntive
(22)
-(2
2)-
22
22
1,69
7 R
Nucle
ar D
ecom
miss
ioni
ng A
utho
rity
--
--
--
-S
Coal
Auth
ority
(net
)-
--
--
--
T Ci
vil N
uclea
r Pol
ice A
utho
rity
(net
)-
--
--
--
U Lo
w C
arbo
n Co
ntra
cts
Com
pany
(net
)-
--
--
--
V De
liver
sec
ure
ener
gy o
n th
e w
ay to
a lo
w c
arbo
n en
ergy
futu
re-
--
--
--
Com
mitt
ee o
n Cl
imat
e Ch
ange
(net
)-
--
--
--
Tota
l Vo
ted
Cap
ital
AM
E17
7,57
9(1
13,4
00)
64,1
7966
,892
2
,713
2,7
13(6
01,1
84)
No
n-V
ote
d C
apit
al A
ME
--
--
--
-
Tota
l Cap
ital
AM
E17
7,57
9(1
13,4
00)
64,1
7966
,892
2
,713
2,7
13(6
01,1
84)
Tota
l2
,548
,280
(174
,835
)2
,373
,445
2,3
79,3
06
5,86
15,
861
1,63
9,91
3
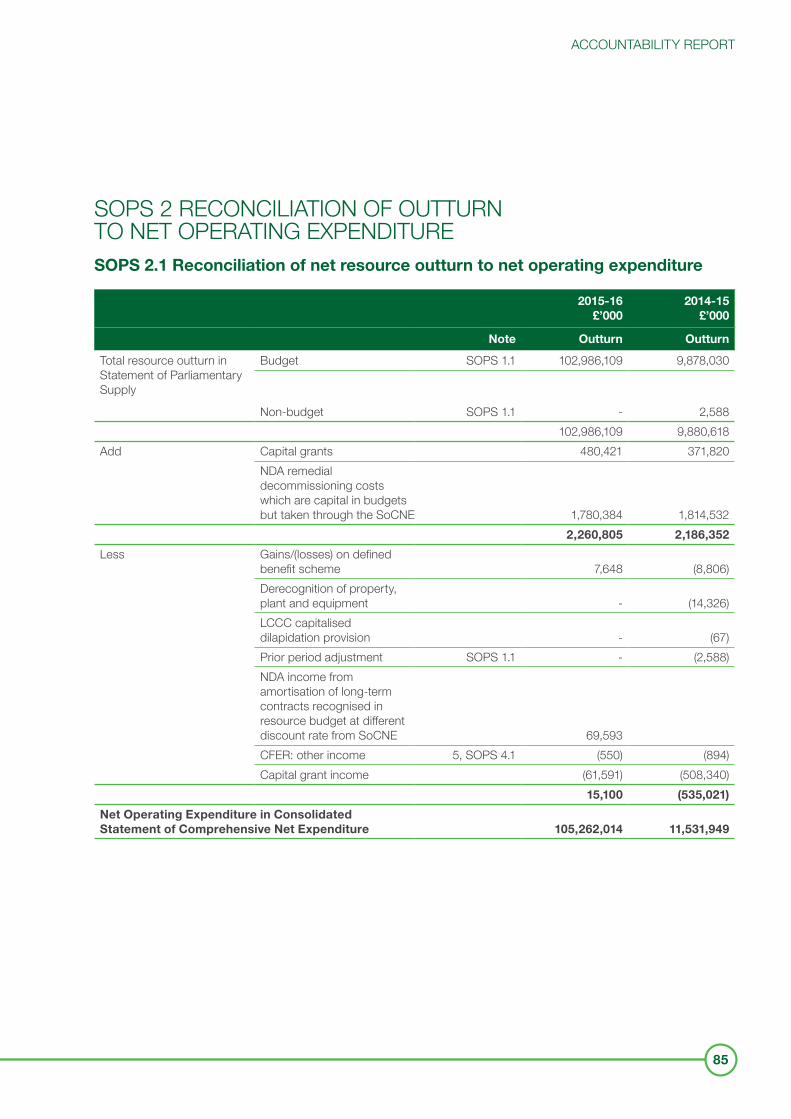
ACCOUNTABILITY REPORT
85
SOPS 2 RECONCILIATION OF OUTTURN TO NET OPERATING EXPENDITURESOPS 2.1 Reconciliation of net resource outturn to net operating expenditure
2015-16 £’000
2014-15 £’000
Note Outturn Outturn
Total resource outturn in Statement of Parliamentary Supply
Budget SOPS 1.1 102,986,109 9,878,030
Non-budget SOPS 1.1 - 2,588 102,986,109 9,880,618
Add Capital grants 480,421 371,820 NDA remedial decommissioning costs which are capital in budgets but taken through the SoCNE 1,780,384 1,814,532
2,260,805 2,186,352
Less Gains/(losses) on defined benefit scheme 7,648 (8,806)Derecognition of property, plant and equipment - (14,326)LCCC capitalised dilapidation provision - (67)Prior period adjustment SOPS 1.1 - (2,588)NDA income from amortisation of long-term contracts recognised in resource budget at different discount rate from SoCNE 69,593 CFER: other income 5, SOPS 4.1 (550) (894)Capital grant income (61,591) (508,340)
15,100 (535,021)
Net Operating Expenditure in Consolidated Statement of Comprehensive Net Expenditure 105,262,014 11,531,949
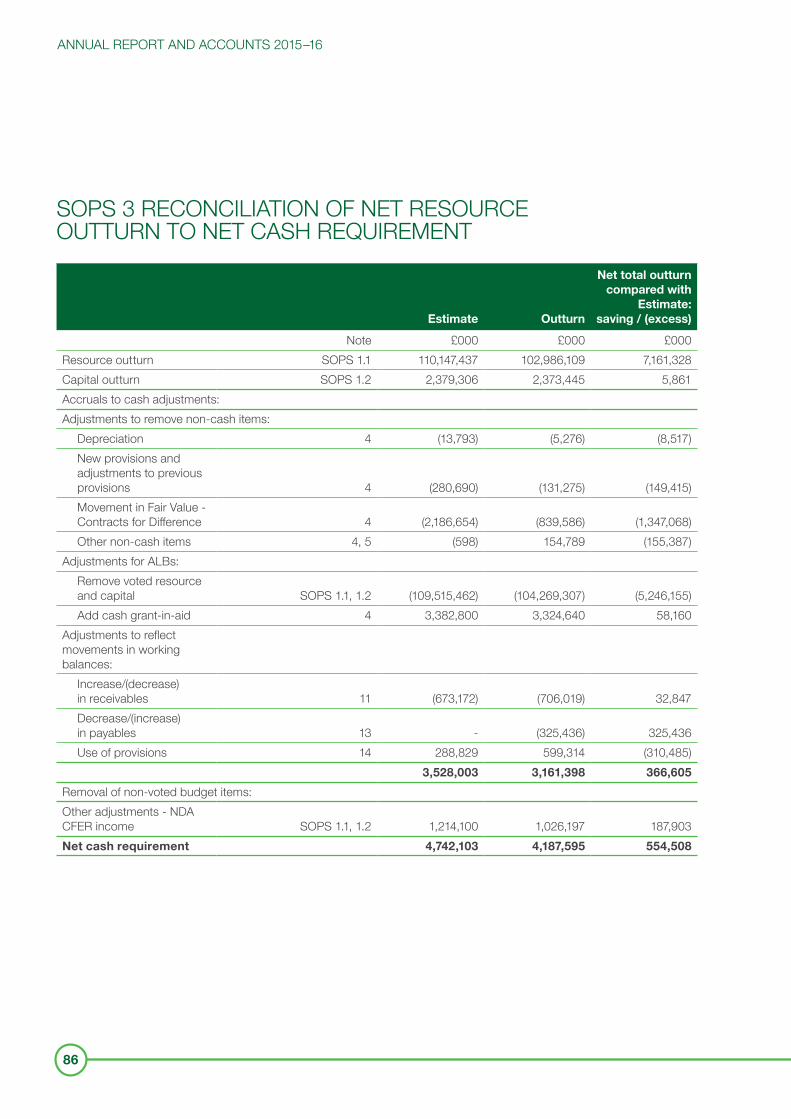
ANNUAL REPORT AND ACCOUNTS 2015–16
86
SOPS 3 RECONCILIATION OF NET RESOURCE OUTTURN TO NET CASH REQUIREMENT
Estimate Outturn
Net total outturn compared with
Estimate: saving / (excess)
Note £000 £000 £000Resource outturn SOPS 1.1 110,147,437 102,986,109 7,161,328Capital outturn SOPS 1.2 2,379,306 2,373,445 5,861Accruals to cash adjustments:Adjustments to remove non-cash items: Depreciation 4 (13,793) (5,276) (8,517) New provisions and
adjustments to previous provisions 4 (280,690) (131,275) (149,415)
Movement in Fair Value - Contracts for Difference 4 (2,186,654) (839,586) (1,347,068)
Other non-cash items 4, 5 (598) 154,789 (155,387)Adjustments for ALBs: Remove voted resource
and capital SOPS 1.1, 1.2 (109,515,462) (104,269,307) (5,246,155) Add cash grant-in-aid 4 3,382,800 3,324,640 58,160 Adjustments to reflect movements in working balances: Increase/(decrease)
in receivables 11 (673,172) (706,019) 32,847 Decrease/(increase)
in payables 13 - (325,436) 325,436 Use of provisions 14 288,829 599,314 (310,485)
3,528,003 3,161,398 366,605
Removal of non-voted budget items:Other adjustments - NDA CFER income SOPS 1.1, 1.2 1,214,100 1,026,197 187,903 Net cash requirement 4,742,103 4,187,595 554,508
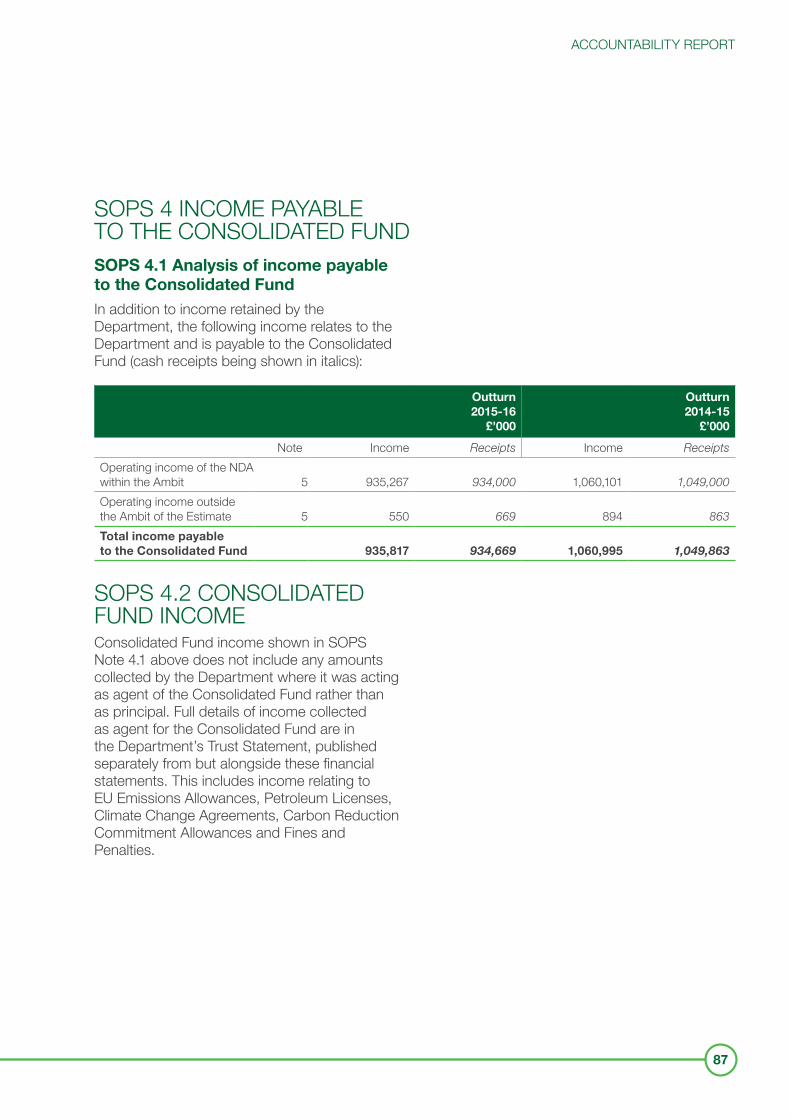
ACCOUNTABILITY REPORT
87
SOPS 4 INCOME PAYABLE TO THE CONSOLIDATED FUNDSOPS 4.1 Analysis of income payable to the Consolidated FundIn addition to income retained by the Department, the following income relates to the Department and is payable to the Consolidated Fund (cash receipts being shown in italics):
Outturn 2015-16
£’000
Outturn 2014-15
£’000
Note Income Receipts Income Receipts
Operating income of the NDA within the Ambit 5 935,267 934,000 1,060,101 1,049,000
Operating income outside the Ambit of the Estimate 5 550 669 894 863 Total income payable to the Consolidated Fund 935,817 934,669 1,060,995 1,049,863
SOPS 4.2 CONSOLIDATED FUND INCOMEConsolidated Fund income shown in SOPS Note 4.1 above does not include any amounts collected by the Department where it was acting as agent of the Consolidated Fund rather than as principal. Full details of income collected as agent for the Consolidated Fund are in the Department’s Trust Statement, published separately from but alongside these financial statements. This includes income relating to EU Emissions Allowances, Petroleum Licenses, Climate Change Agreements, Carbon Reduction Commitment Allowances and Fines and Penalties.
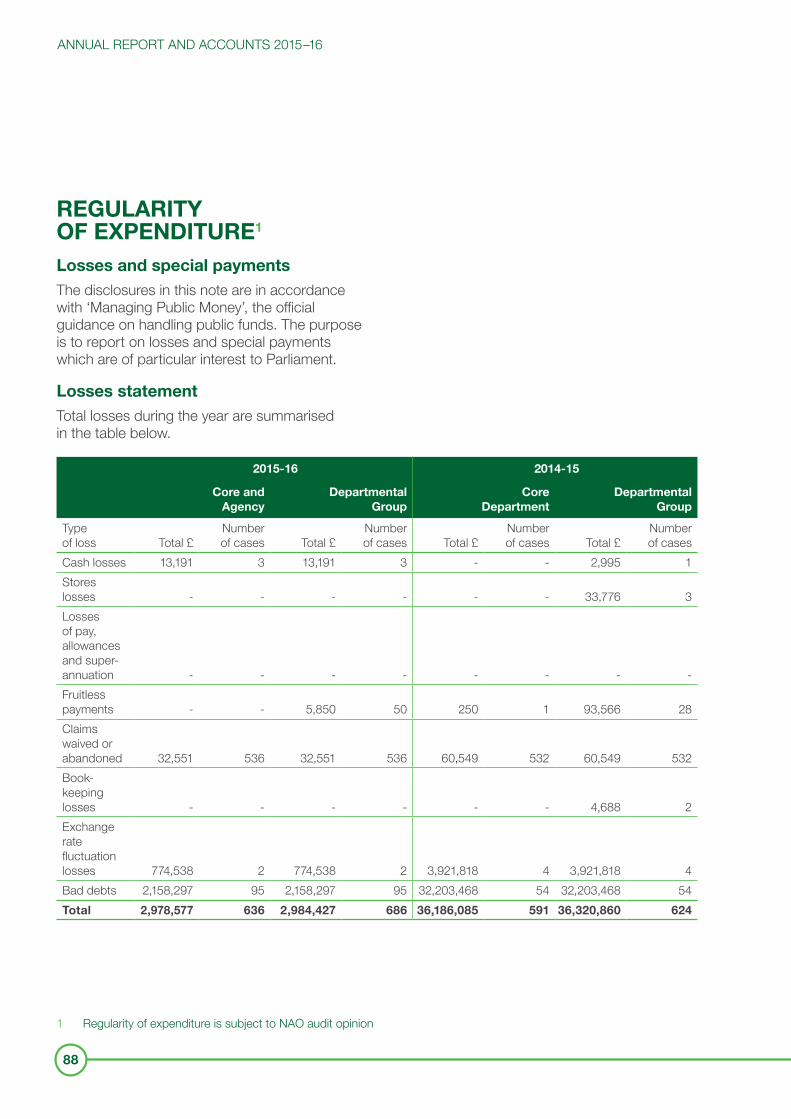
ANNUAL REPORT AND ACCOUNTS 2015–16
88
REGULARITY OF EXPENDITURE1
Losses and special paymentsThe disclosures in this note are in accordance with ‘Managing Public Money’, the official guidance on handling public funds. The purpose is to report on losses and special payments which are of particular interest to Parliament.
Losses statementTotal losses during the year are summarised in the table below.
2015-16 2014-15
Core and Agency
Departmental Group
Core Department
Departmental Group
Type of loss Total £
Number of cases Total £
Number of cases Total £
Number of cases Total £
Number of cases
Cash losses 13,191 3 13,191 3 - - 2,995 1 Stores losses - - - - - - 33,776 3 Losses of pay, allowances and super- annuation - - - - - - - -Fruitless payments - - 5,850 50 250 1 93,566 28 Claims waived or abandoned 32,551 536 32,551 536 60,549 532 60,549 532 Book-keeping losses - - - - - - 4,688 2 Exchange rate fluctuation losses 774,538 2 774,538 2 3,921,818 4 3,921,818 4 Bad debts 2,158,297 95 2,158,297 95 32,203,468 54 32,203,468 54 Total 2,978,577 636 2,984,427 686 36,186,085 591 36,320,860 624
1 Regularity of expenditure is subject to NAO audit opinion
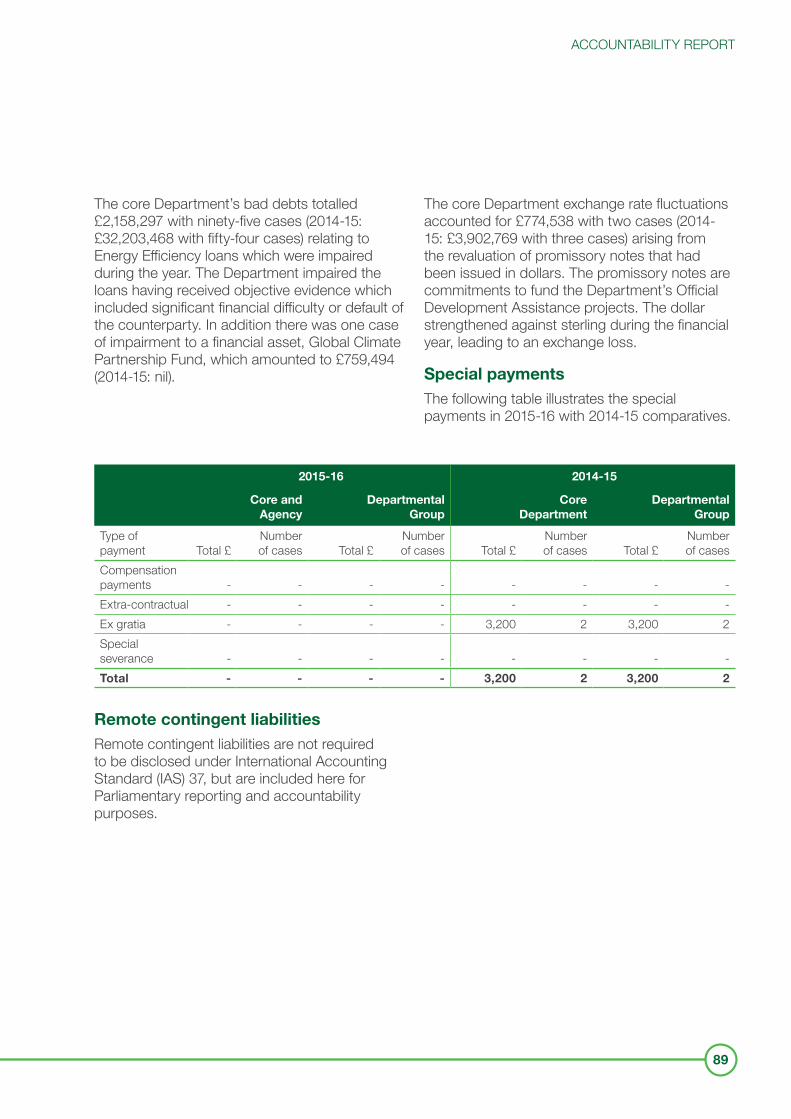
ACCOUNTABILITY REPORT
89
The core Department’s bad debts totalled £2,158,297 with ninety-five cases (2014-15: £32,203,468 with fifty-four cases) relating to Energy Efficiency loans which were impaired during the year. The Department impaired the loans having received objective evidence which included significant financial difficulty or default of the counterparty. In addition there was one case of impairment to a financial asset, Global Climate Partnership Fund, which amounted to £759,494 (2014-15: nil).
The core Department exchange rate fluctuations accounted for £774,538 with two cases (2014- 15: £3,902,769 with three cases) arising from the revaluation of promissory notes that had been issued in dollars. The promissory notes are commitments to fund the Department’s Official Development Assistance projects. The dollar strengthened against sterling during the financial year, leading to an exchange loss.
Special paymentsThe following table illustrates the special payments in 2015-16 with 2014-15 comparatives.
2015-16 2014-15
Core and Agency
Departmental Group
Core Department
Departmental Group
Type of payment Total £
Number of cases Total £
Number of cases Total £
Number of cases Total £
Number of cases
Compensation payments - - - - - - - -Extra-contractual - - - - - - - -Ex gratia - - - - 3,200 2 3,200 2 Special severance - - - - - - - -Total - - - - 3,200 2 3,200 2
Remote contingent liabilitiesRemote contingent liabilities are not required to be disclosed under International Accounting Standard (IAS) 37, but are included here for Parliamentary reporting and accountability purposes.
ANNUAL REPORT AND ACCOUNTS 2015–16
90
Unquantifiable The Department has the following unquantifiable contingent liabilities none of which are a contingent liability requiring disclosure under IAS 37, since the possibility of an outflow of economic benefits at settlement is remote.The liabilities below are unquantifiable due to the nature of the liability and the uncertainties surrounding them.
Core DepartmentStatutory indemnities• Indemnity given for National Grid’s liabilities
with regards to the interconnector linking the UK and France.
Other Indemnities • Nuclear Liabilities Fund – Indemnities have
been given to the Trustees of the Fund appointed by the Secretary of State. These indemnities are for personal liability due of potential legal action against the Fund.
• Nuclear Liabilities Fund – Indemnities have been given to the British Energy (now EdF Energy) appointed Trustees of the Fund. These indemnities are for personal liability due to potential legal action against the Fund. These indemnities can only be benefited following a failed recourse to an indemnity from EDF Energy.
• Low Carbon Contracts Company & Electricity Settlements Company – Indemnities have been given to Department staff appointed by the Department as Directors. These indemnities are against personal liability due to potential legal action against the companies. Indemnities are valid for claims made against the companies up to 6 years following the date of any event.
• Low Carbon Contracts Company & Electricity Settlements Company – Indemnities were been given to Directors for events before ‘commercial directors’ and officers’ insurance’ was in place. Insurance is now in place, but where the cover is insufficient the indemnity remains.
Other remote contingent liabilities
Core Department• Statutory liability in the event of a nuclear
accident in the UK for third-party claims in excess of the operator’s liability.
• Liability for non-compliance with the Cogeneration Directive (2004/8/EC): in the event contractors for the Department incorrectly certify combined heat and power plants.
• Liability for costs of retrieving and disposing of sealed radioactive sources in the event that a company keeping such sources becomes insolvent under the High Activity Sealed Sources (HASS) Directive: Council Directive 2003/122/EURATOM.
• Indemnity has been given to the Secretary of State for liability under section 9 of The Radioactive Contaminated Land (Modification of Enactments) (England) (Amendment) Regulations 2007 SI 2007/3245. The regulations deem the Secretary of State to be the appropriate person to bear responsibility for remediation of land contaminated by a nuclear occurrence.
• An indemnity for loss or damage caused to other Parties to the Energy Research Partnership consortium agreement.
• Under the EU Emissions Trading Scheme, Member States are required to appoint a Single Auction Monitor to oversee the auctioning of allowances in Phase III. The Joint Procurement Agreement for the Single Auction Monitor (JPA) provides for Member States to indemnify the Commission should the Commission be required to compensate a third party or another Member State for damages which arise in connection with the JPA. The Department has undertaken to support Ofgem’s costs for administering the Renewables Obligation scheme. Where there is insufficient money in both the buyout fund and late payment fund, the remaining costs for England and Wales will be met by the Department.
ACCOUNTABILITY REPORT
91
• The Department has indemnified Elexon Ltd against third-party claims relating to the design and or implementation of Contracts for Difference (CfD) and Capacity Markets (CM) settlement systems which are not covered by insurance and/or guarantees by their sub-contractors.
• Planning Act 2008: Liability for compensation payable in the event that a Development Consent Order is subject to a legal challenge which leads to a revocation of an order.
• Organisation for Economic Co-operation and Development (OECD) and International Energy Agency (IEA): an indemnity for any loss to the IEA arising from use of its data in the Department’s Global Climate Change 2050 Pathways Calculator, limited to maximum of £100,000.
• Nuclear Liabilities Fund (NLF) - A constructive obligation was created in 2002 when the then Secretary of State for Trade and Industry stated in the House of Commons that the Government would underwrite the NLF in respect of British Energy’s uncontracted and decommissioning liabilities to the extent that the assets of the Fund fall short. The Department is responsible for these liabilities to the extent that the NLF is insufficient to meet liabilities as they fall due.
• Given the extended time period over which the British Energy’s liabilities will be paid (some in over 100 years’ time), there is a high level of uncertainty relating to the eventual funding position of the NLF. The undiscounted value of the liabilities is £19.7 billion (2014-15: £19.5 billion) and the discounted liabilities are £33.0 billion (2014-15: £7.5 billion). This is because in line with HM Treasury guidance we used the long-term discount of negative 0.8% (2014-15: positive 2.2%). This has increased the
discounted value of the liabilities but, as this change is the result of a technical accounting measure, the undiscounted value is unaffected. The reasons for the change in HM Treasury guidance is explained in box 2 on page 35. The value of the fund was £9.2 billion (2014-15: £9.1 billion). The trustees consider that in the absence of unplanned events the fund will be sufficient to meet all of its forecast liabilities. As such it would not be appropriate for the Department to consider the fund as either a contingent liability or a contingent asset at the current time.
Indemnities
Departmental ALBs • Non-quantifiable contingent liabilities arising
from indemnities given as part of contracts for the management of the Low Level Waste Repository, Sellafield and Dounreay. These indemnities are in respect of the uninsurable residual risk that courts in a country which is not party to the Paris and Brussels Conventions on third-party liability in the field of nuclear energy may accept jurisdiction to determine liability in the event of a nuclear incident.
• International Carrier Bond – during the year, the NDA procured a US bond on behalf of their subsidiary, INS Ltd, in order to meet US law in respect of vessels calling at US ports for commercial purposes. This Bond is required to ensure that all duties, taxes and fees owed to the US federal government are paid. The Bond would therefore be only called on in the case of non-payment of any of the above by the NDA, and the total cost would not be expected to exceed $100,000.
ANNUAL REPORT AND ACCOUNTS 2015–16
92
Other potential or expected liabilitiesThe Department has entered into the following quantifiable arrangements, none of which are a contingent liability requiring disclosure under IAS 37. The following information has been provided in the interests of transparency.
Departmental ALBs • Contract for Difference (CfD): The CfD in
respect of Hinkley Point C (HPC) power station will provide the developer, NNB Generation Company (NNBG) with price certainty for electricity generated at the power station for the 35 year term of the contract.A Departmental minute was presented to Parliament on the 21st October 2015 setting out the total expected support to HPC through the CfD, which is in the range of £4 billion to £19 billion based upon the following assumptions;• The Department’s high forecasts of
electricity prices support the lowest end of the range (£4 billion), and the upper end of the range (£19 billion) is calculated based on low forecasts of electricity prices with an assumption of flat carbon prices after 2030.
• Real 2012 prices have been discounted using the social discount rate of 3.5% published in the Government Green Book.
The existing CfD contracts set out in Note 14 of the accounts are based upon the low forecasts of electricity prices with an assumption of flat carbon prices after 2030. They have been calculated using the discount rates that HM Treasury require us to use for Financial Reporting in the year of recognition (see box 2 on page 35).
The minute also set out the potential liabilities that could arise from the Government entering into related waste transfer contracts (WTCs). These contracts concern the provision NNBG must make for their waste disposal. Under the WTCs, the Government will provide a waste disposal service to the operator, for which NNBG will pay a risk fee at the start of generation and a capped waste transfer price that will be set after a further 25 years. There is no expected cost to the taxpayer, because the cap is set at a conservative level and the Department thinks it is unlikely it will be breached.
• Capacity agreements: These are statutory arrangements between National Grid (as System Operator) and capacity providers. They require the capacity provider to be able to provide a given level of capacity in relevant delivery years when called upon to do so by National Grid. To date, two auctions have been held for capacity to be delivered in 2018-19 and 2019-20. These awarded 49.26 GW of capacity agreements at a cost of £1.805 billion, and 45.37 GW capacity agreements at a cost of £1.081 billion respectively. The payments to the capacity providers will be funded by a levy on licensed electricity suppliers. The Department has responsibility for administrating the settlement process. This role is carried out by the Electricity Settlements Company (ESC), a company set up and owned by the Department. The obligation for the ESC to make capacity payments only arises when the respective levy is received from licensed suppliers and the generator provides the agreed level of capacity. The potential payments arising from these arrangements are set out in the following table:
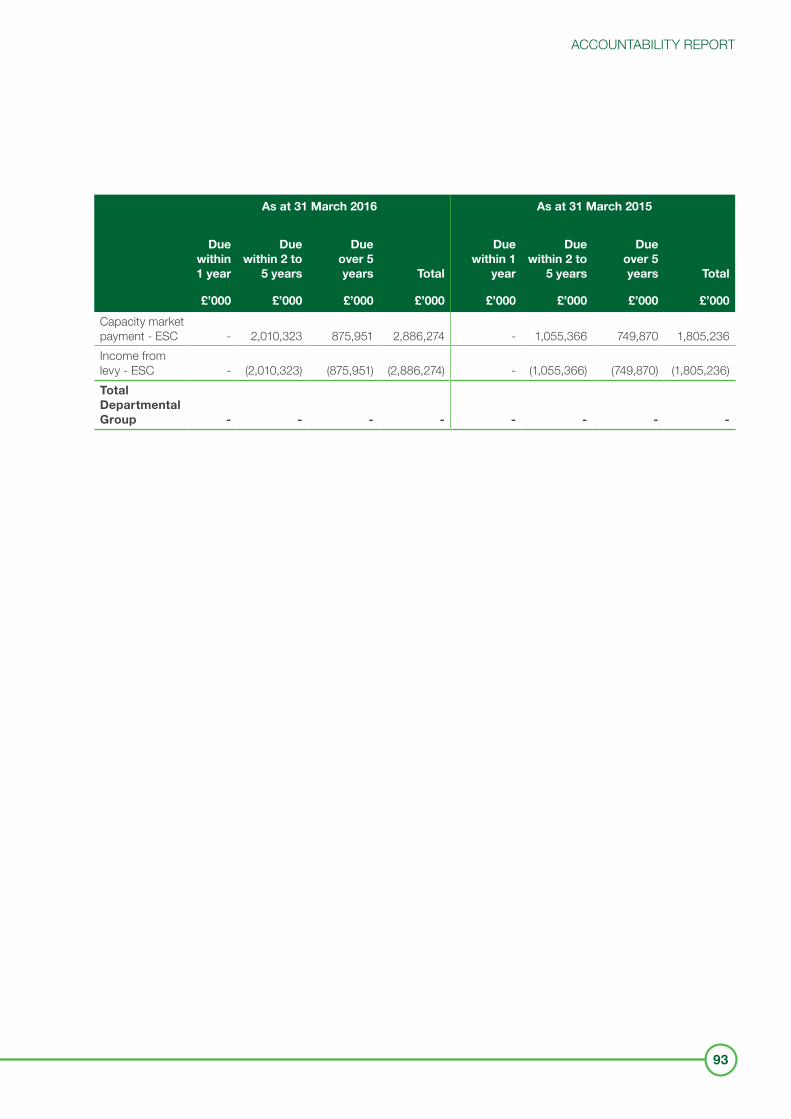
ACCOUNTABILITY REPORT
93
As at 31 March 2016 As at 31 March 2015
Due within 1 year
£’000
Due within 2 to
5 years
£’000
Due over 5 years
£’000
Total
£’000
Due within 1
year
£’000
Due within 2 to
5 years
£’000
Due
over 5 years
£’000
Total
£’000
Capacity market payment - ESC - 2,010,323 875,951 2,886,274 - 1,055,366 749,870 1,805,236 Income from levy - ESC - (2,010,323) (875,951) (2,886,274) - (1,055,366) (749,870) (1,805,236)Total Departmental Group - - - - - - - -
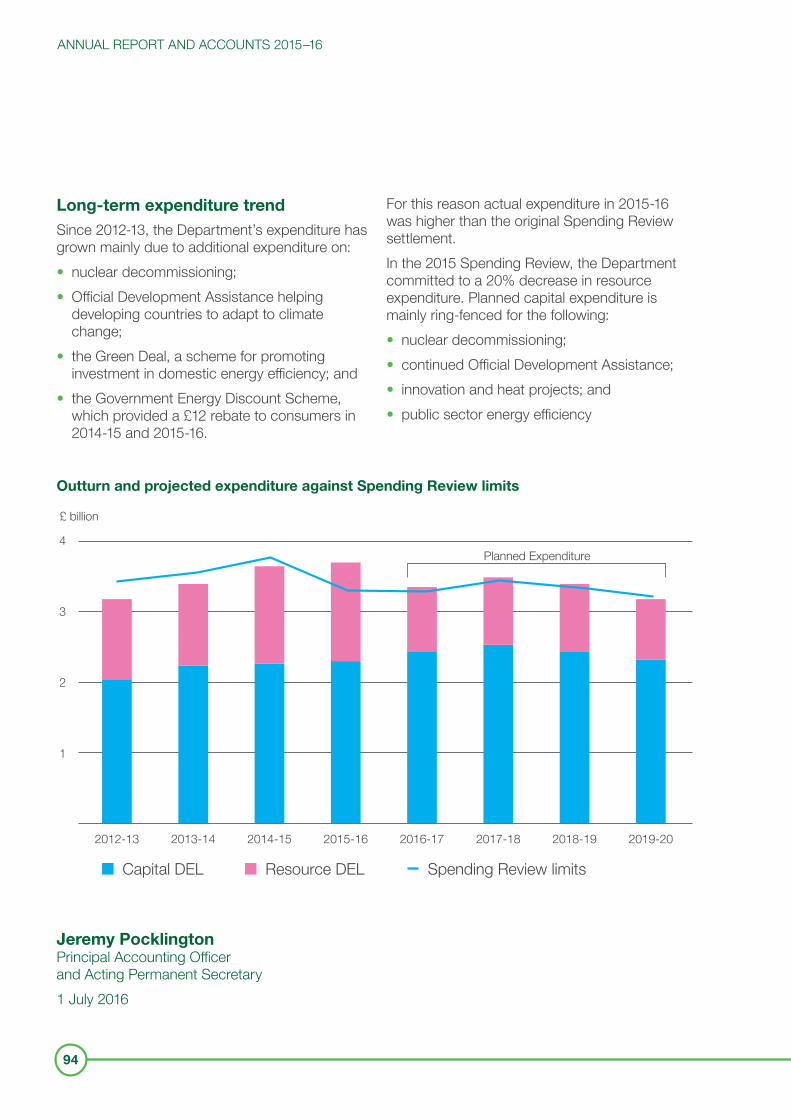
ANNUAL REPORT AND ACCOUNTS 2015–16
94
Long-term expenditure trendSince 2012-13, the Department’s expenditure has grown mainly due to additional expenditure on:• nuclear decommissioning;• Official Development Assistance helping
developing countries to adapt to climate change;
• the Green Deal, a scheme for promoting investment in domestic energy efficiency; and
• the Government Energy Discount Scheme, which provided a £12 rebate to consumers in 2014-15 and 2015-16.
For this reason actual expenditure in 2015-16 was higher than the original Spending Review settlement.In the 2015 Spending Review, the Department committed to a 20% decrease in resource expenditure. Planned capital expenditure is mainly ring-fenced for the following:• nuclear decommissioning;• continued Official Development Assistance; • innovation and heat projects; and• public sector energy efficiency
Outturn and projected expenditure against Spending Review limits
2012-13
1
2
3
4
£ billion
Capital DEL Resource DEL Spending Review limits
Planned Expenditure
2013-14 2014-15 2015-16 2016-17 2017-18 2018-19 2019-20
Jeremy PocklingtonPrincipal Accounting Officer and Acting Permanent Secretary1 July 2016
ACCOUNTABILITY REPORT
95
THE CERTIFICATE AND REPORT OF THE COMPTROLLER AND AUDITOR GENERAL TO THE HOUSE OF COMMONSI certify that I have audited the financial statements of the Department of Energy & Climate Change and of its Departmental Group for the year ended 31 March 2016 under the Government Resources and Accounts Act 2000. The Department consists of the core Department and its agencies. The Departmental Group consists of the Department and the bodies designated for inclusion under the Government Resources and Accounts Act 2000 (Estimates and Accounts) Order 2015. The financial statements comprise: the Department’s and Departmental Group’s Statements of Comprehensive Net Expenditure, Financial Position, Cash Flows, Changes in Taxpayers’ Equity; and the related notes. I have also audited the Statement of Parliamentary Supply and the related notes. These financial statements have been prepared under the accounting policies set out within them. I have also audited the information in the Remuneration Report and Parliamentary Accountability disclosures within the Accountability Report that is described in those reports as having been audited.
Respective responsibilities of the Accounting Officer and auditorAs explained more fully in the Statement of Accounting Officer’s Responsibilities, the Accounting Officer is responsible for the preparation of the financial statements and for being satisfied that they give a true and fair view. My responsibility is to audit, certify and report on the financial statements in accordance with the Government Resources and Accounts Act 2000. I conducted my audit in accordance with International Standards on Auditing (UK and Ireland). Those standards require me and my staff to comply with the Auditing Practices Board’s Ethical Standards for Auditors.
Scope of the audit of the financial statementsAn audit involves obtaining evidence about the amounts and disclosures in the financial statements sufficient to give reasonable assurance that the financial statements are free from material misstatement, whether caused by fraud or error. This includes an assessment of: whether the accounting policies are appropriate to the Department’s and the Departmental Group’s circumstances and have been consistently applied and adequately disclosed; the reasonableness of significant accounting estimates made by the Accounting Officer; and the overall presentation of the financial statements. In addition I read all the financial and non-financial information in the Annual Report to identify material inconsistencies with the audited financial statements and to identify any information that is apparently materially incorrect based on, or materially inconsistent with, the knowledge acquired by me in the course of performing the audit. If I become aware of any apparent material misstatements or inconsistencies I consider the implications for my certificate.
ANNUAL REPORT AND ACCOUNTS 2015–16
96
I am required to obtain evidence sufficient to give reasonable assurance that the Statement of Parliamentary Supply properly presents the outturn against voted Parliamentary control totals and that those totals have not been exceeded. The voted Parliamentary control totals are Departmental Expenditure Limits (Resource and Capital), Annually Managed Expenditure (Resource and Capital), Non-Budget (Resource) and Net Cash Requirement. I am also required to obtain evidence sufficient to give reasonable assurance that the expenditure and income recorded in the financial statements have been applied to the purposes intended by Parliament and the financial transactions recorded in the financial statements conform to the authorities which govern them.
Opinion on regularityIn my opinion, in all material respects:• the Statement of Parliamentary Supply
properly presents the outturn against voted Parliamentary control totals for the year ended 31 March 2016 and shows that those totals have not been exceeded; and
• the expenditure and income recorded in the financial statements have been applied to the purposes intended by Parliament and the financial transactions recorded in the financial statements conform to the authorities which govern them.
Opinion on financial statements In my opinion:• the financial statements give a true and fair
view of the state of the Department’s and the Departmental Group’s affairs as at 31 March 2016 and of the Department’s net operating cost and Departmental Group’s net operating cost for the year then ended; and
• the financial statements have been properly prepared in accordance with the Government Resources and Accounts Act 2000 and HM Treasury directions issued thereunder.
Emphasis of matter – Provisions for nuclear decommissioning and Contracts for Difference (CfD) derivativeWithout qualifying my opinion, I draw attention to the disclosures made in Notes 1.33 and 14.1 to the financial statements concerning the uncertainties inherent in the provisions relating to the costs of dealing with nuclear decommissioning liability. As set out in these notes, given the complexity and the very long timescales involved, a considerable degree of uncertainty remains over the value of the liabilities. Significant changes to the liabilities could occur as a result of subsequent information and events which are different from the current assumptions adopted.Note 14 shows the increase in the liability in 2015-16 arising from the changes in the long term discount rates, underlining the uncertainty inherent in management’s estimate associated with the long timescales involved and discount rate assumptions. A further impact of the change to a negative long term discount rate for provisions is that, as disclosed, the later years, for which there is greater uncertainty over the underlying future costs, constitute a larger proportion of the liability estimate thereby amplifying the overall level of uncertainty.I also draw attention to the disclosures made in Notes 1.32 and 13 to the financial statements concerning the measurement of liabilities relating to CfDs. As this note describes, the Fair Value of these liabilities is highly sensitive to assumptions regarding future prices and volumes, particularly in view of the long timescales involved.
ACCOUNTABILITY REPORT
97
Opinion on other mattersIn my opinion:• the part of the Remuneration Report and
Parliamentary Accountability disclosures to be audited has been properly prepared in accordance with HM Treasury directions made under the Government Resources and Accounts Act 2000; and
• the information given in the Performance Report and Accountability Report for the financial year for which the financial statements are prepared is consistent with the financial statements.
Matters on which I report by exceptionI have nothing to report in respect of the following matters which I report to you if, in my opinion:• adequate accounting records have not been
kept or returns adequate for my audit have not been received from branches not visited by my staff; or
• the financial statements and the part of the Remuneration Report to be audited are not in agreement with the accounting records and returns; or
• I have not received all of the information and explanations I require for my audit; or
• the Governance Statement does not reflect compliance with HM Treasury’s guidance.
Report I have no observations to make on these financial statements.
Sir Amyas C E MorseComptroller and Auditor General6 July 2016National Audit Office 157-197 Buckingham Palace Road Victoria, London SW1W 9SP

FINANCIALSTATEMENTS
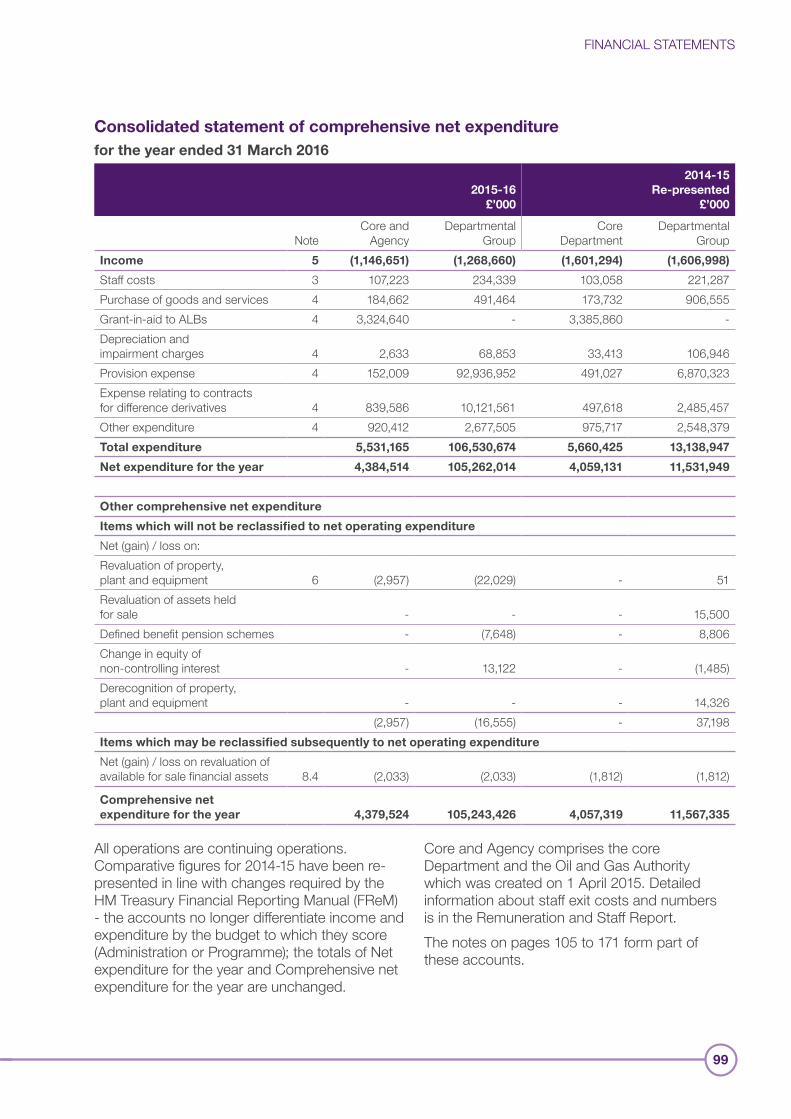
FINANCIAL STATEMENTS
99
Consolidated statement of comprehensive net expenditurefor the year ended 31 March 2016
2015-16 £’000
2014-15 Re-presented
£’000
NoteCore and
AgencyDepartmental
GroupCore
DepartmentDepartmental
GroupIncome 5 (1,146,651) (1,268,660) (1,601,294) (1,606,998)
Staff costs 3 107,223 234,339 103,058 221,287 Purchase of goods and services 4 184,662 491,464 173,732 906,555 Grant-in-aid to ALBs 4 3,324,640 - 3,385,860 -Depreciation and impairment charges 4 2,633 68,853 33,413 106,946 Provision expense 4 152,009 92,936,952 491,027 6,870,323 Expense relating to contracts for difference derivatives 4 839,586 10,121,561 497,618 2,485,457 Other expenditure 4 920,412 2,677,505 975,717 2,548,379 Total expenditure 5,531,165 106,530,674 5,660,425 13,138,947
Net expenditure for the year 4,384,514 105,262,014 4,059,131 11,531,949
Other comprehensive net expenditure
Items which will not be reclassified to net operating expenditure
Net (gain) / loss on:Revaluation of property, plant and equipment 6 (2,957) (22,029) - 51 Revaluation of assets held for sale - - - 15,500 Defined benefit pension schemes - (7,648) - 8,806 Change in equity of non-controlling interest - 13,122 - (1,485)Derecognition of property, plant and equipment - - - 14,326
(2,957) (16,555) - 37,198 Items which may be reclassified subsequently to net operating expenditure
Net (gain) / loss on revaluation of available for sale financial assets 8.4 (2,033) (2,033) (1,812) (1,812)
Comprehensive net expenditure for the year 4,379,524 105,243,426 4,057,319 11,567,335
All operations are continuing operations. Comparative figures for 2014-15 have been re-presented in line with changes required by the HM Treasury Financial Reporting Manual (FReM) - the accounts no longer differentiate income and expenditure by the budget to which they score (Administration or Programme); the totals of Net expenditure for the year and Comprehensive net expenditure for the year are unchanged.
Core and Agency comprises the core Department and the Oil and Gas Authority which was created on 1 April 2015. Detailed information about staff exit costs and numbers is in the Remuneration and Staff Report.The notes on pages 105 to 171 form part of these accounts.
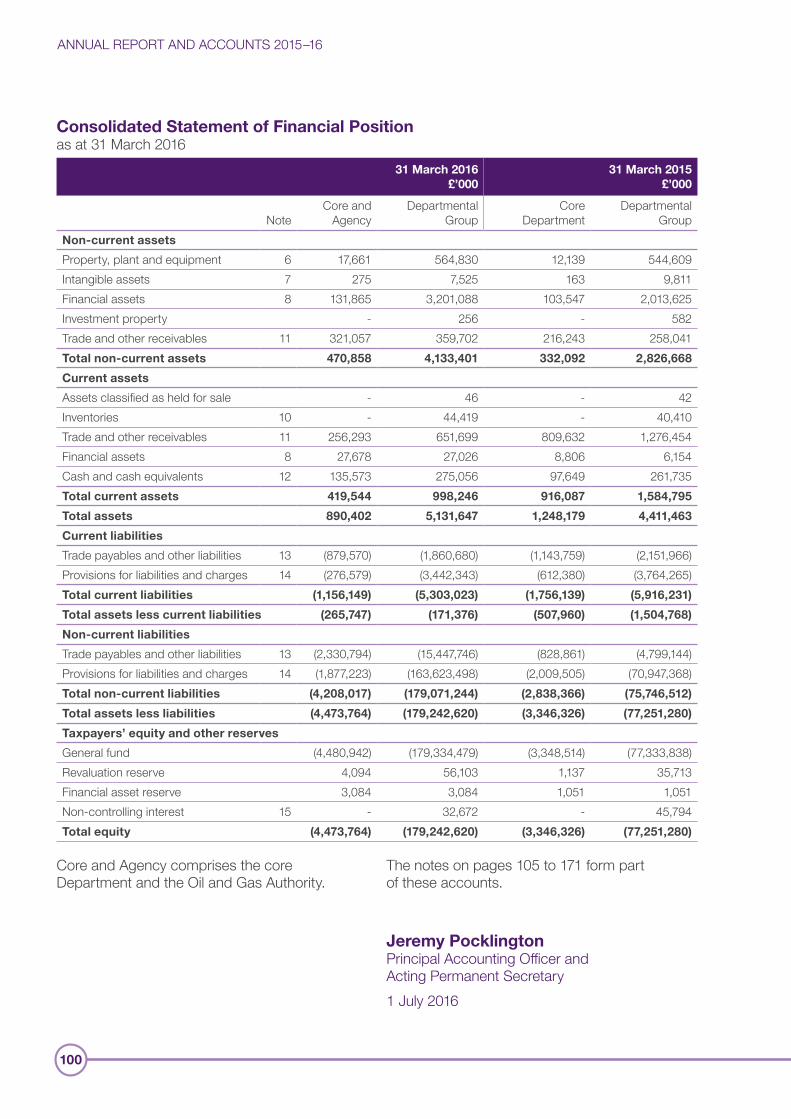
ANNUAL REPORT AND ACCOUNTS 2015–16
100
Consolidated Statement of Financial Positionas at 31 March 2016
31 March 2016 £’000
31 March 2015 £’000
NoteCore and
AgencyDepartmental
GroupCore
DepartmentDepartmental
GroupNon-current assets
Property, plant and equipment 6 17,661 564,830 12,139 544,609 Intangible assets 7 275 7,525 163 9,811 Financial assets 8 131,865 3,201,088 103,547 2,013,625 Investment property - 256 - 582 Trade and other receivables 11 321,057 359,702 216,243 258,041 Total non-current assets 470,858 4,133,401 332,092 2,826,668
Current assets
Assets classified as held for sale - 46 - 42Inventories 10 - 44,419 - 40,410 Trade and other receivables 11 256,293 651,699 809,632 1,276,454 Financial assets 8 27,678 27,026 8,806 6,154 Cash and cash equivalents 12 135,573 275,056 97,649 261,735 Total current assets 419,544 998,246 916,087 1,584,795
Total assets 890,402 5,131,647 1,248,179 4,411,463
Current liabilities
Trade payables and other liabilities 13 (879,570) (1,860,680) (1,143,759) (2,151,966)Provisions for liabilities and charges 14 (276,579) (3,442,343) (612,380) (3,764,265)Total current liabilities (1,156,149) (5,303,023) (1,756,139) (5,916,231)
Total assets less current liabilities (265,747) (171,376) (507,960) (1,504,768)
Non-current liabilities
Trade payables and other liabilities 13 (2,330,794) (15,447,746) (828,861) (4,799,144)Provisions for liabilities and charges 14 (1,877,223) (163,623,498) (2,009,505) (70,947,368)Total non-current liabilities (4,208,017) (179,071,244) (2,838,366) (75,746,512)
Total assets less liabilities (4,473,764) (179,242,620) (3,346,326) (77,251,280)
Taxpayers’ equity and other reserves
General fund (4,480,942) (179,334,479) (3,348,514) (77,333,838)Revaluation reserve 4,094 56,103 1,137 35,713 Financial asset reserve 3,084 3,084 1,051 1,051 Non-controlling interest 15 - 32,672 - 45,794 Total equity (4,473,764) (179,242,620) (3,346,326) (77,251,280)
Core and Agency comprises the core Department and the Oil and Gas Authority.
The notes on pages 105 to 171 form part of these accounts.
Jeremy PocklingtonPrincipal Accounting Officer and Acting Permanent Secretary1 July 2016
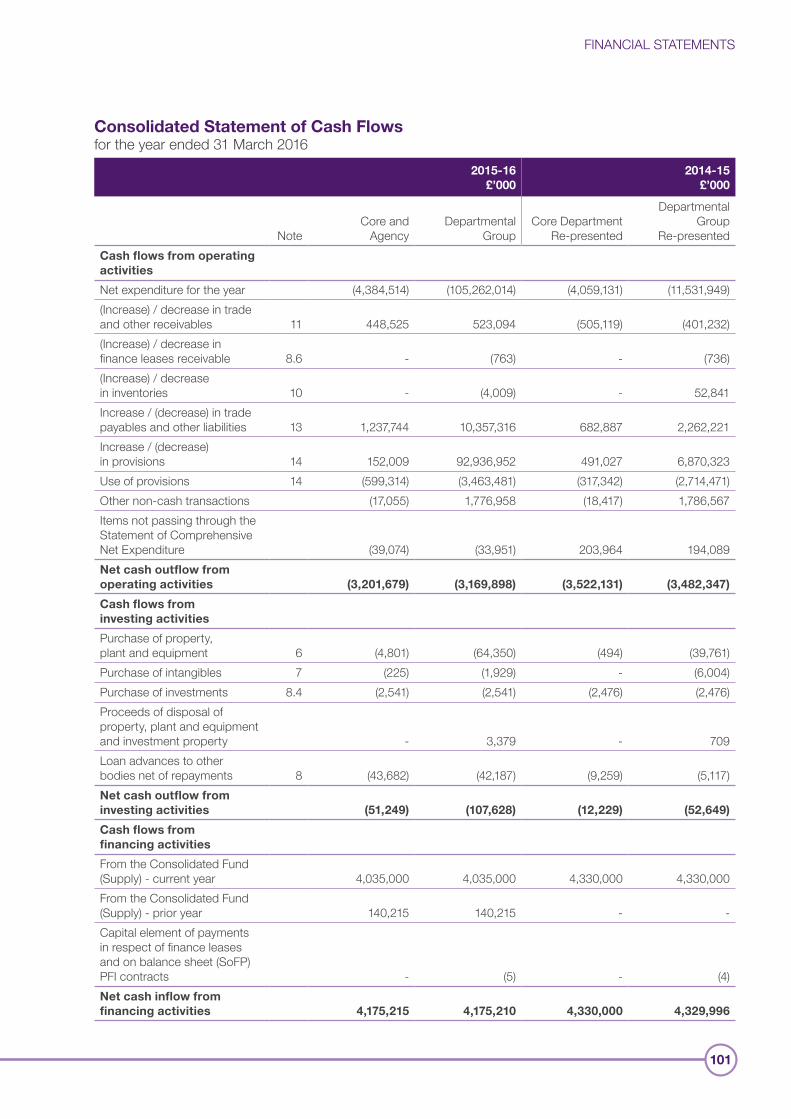
FINANCIAL STATEMENTS
101
Consolidated Statement of Cash Flowsfor the year ended 31 March 2016
2015-16 £’000
2014-15 £’000
NoteCore and
AgencyDepartmental
GroupCore Department
Re-presented
Departmental Group
Re-presentedCash flows from operating activities
Net expenditure for the year (4,384,514) (105,262,014) (4,059,131) (11,531,949)(Increase) / decrease in trade and other receivables 11 448,525 523,094 (505,119) (401,232)(Increase) / decrease in finance leases receivable 8.6 - (763) - (736)(Increase) / decrease in inventories 10 - (4,009) - 52,841 Increase / (decrease) in trade payables and other liabilities 13 1,237,744 10,357,316 682,887 2,262,221 Increase / (decrease) in provisions 14 152,009 92,936,952 491,027 6,870,323 Use of provisions 14 (599,314) (3,463,481) (317,342) (2,714,471)Other non-cash transactions (17,055) 1,776,958 (18,417) 1,786,567Items not passing through the Statement of Comprehensive Net Expenditure (39,074) (33,951) 203,964 194,089 Net cash outflow from operating activities (3,201,679) (3,169,898) (3,522,131) (3,482,347)
Cash flows from investing activities
Purchase of property, plant and equipment 6 (4,801) (64,350) (494) (39,761)Purchase of intangibles 7 (225) (1,929) - (6,004)Purchase of investments 8.4 (2,541) (2,541) (2,476) (2,476)Proceeds of disposal of property, plant and equipment and investment property - 3,379 - 709 Loan advances to other bodies net of repayments 8 (43,682) (42,187) (9,259) (5,117)Net cash outflow from investing activities (51,249) (107,628) (12,229) (52,649)
Cash flows from financing activities
From the Consolidated Fund (Supply) - current year 4,035,000 4,035,000 4,330,000 4,330,000 From the Consolidated Fund (Supply) - prior year 140,215 140,215 - -Capital element of payments in respect of finance leases and on balance sheet (SoFP) PFI contracts - (5) - (4)Net cash inflow from financing activities 4,175,215 4,175,210 4,330,000 4,329,996
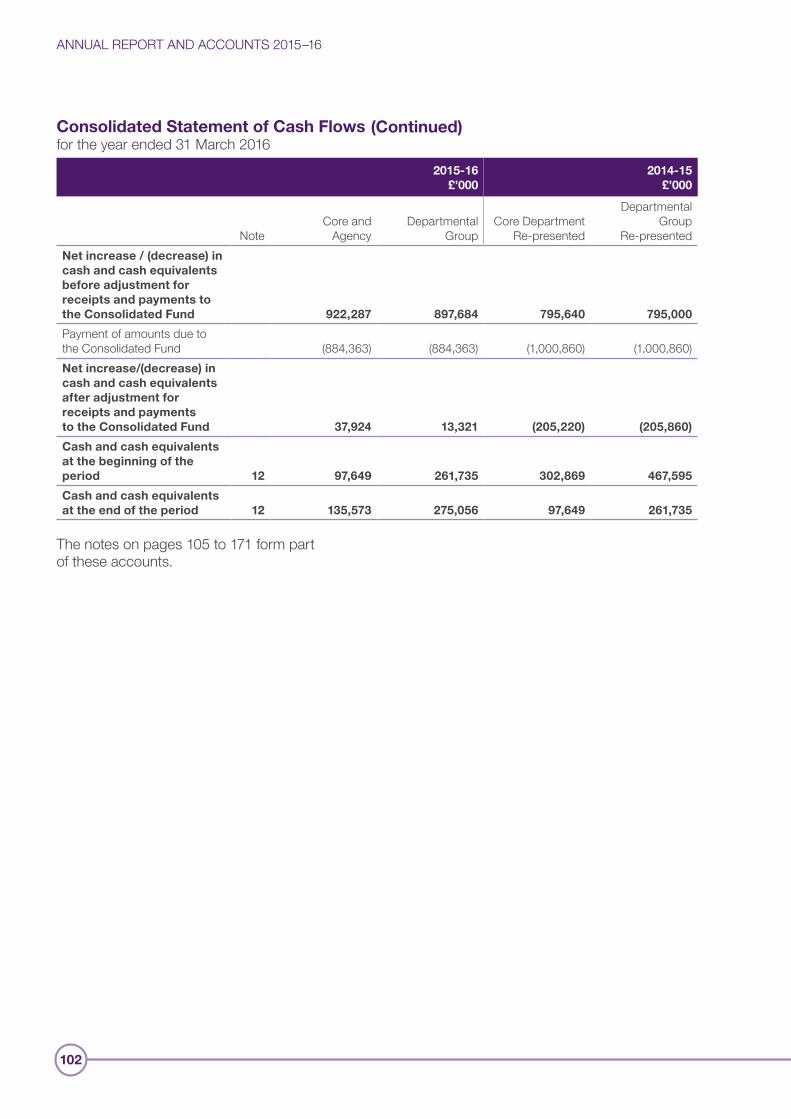
ANNUAL REPORT AND ACCOUNTS 2015–16
102
Consolidated Statement of Cash Flowsfor the year ended 31 March 2016
2015-16 £’000
2014-15 £’000
NoteCore and
AgencyDepartmental
GroupCore Department
Re-presented
Departmental Group
Re-presentedNet increase / (decrease) in cash and cash equivalents before adjustment for receipts and payments to the Consolidated Fund 922,287 897,684 795,640 795,000
Payment of amounts due to the Consolidated Fund (884,363) (884,363) (1,000,860) (1,000,860)Net increase/(decrease) in cash and cash equivalents after adjustment for receipts and payments to the Consolidated Fund 37,924 13,321 (205,220) (205,860)
Cash and cash equivalents at the beginning of the period 12 97,649 261,735 302,869 467,595
Cash and cash equivalents at the end of the period 12 135,573 275,056 97,649 261,735
The notes on pages 105 to 171 form part of these accounts.
(Continued)
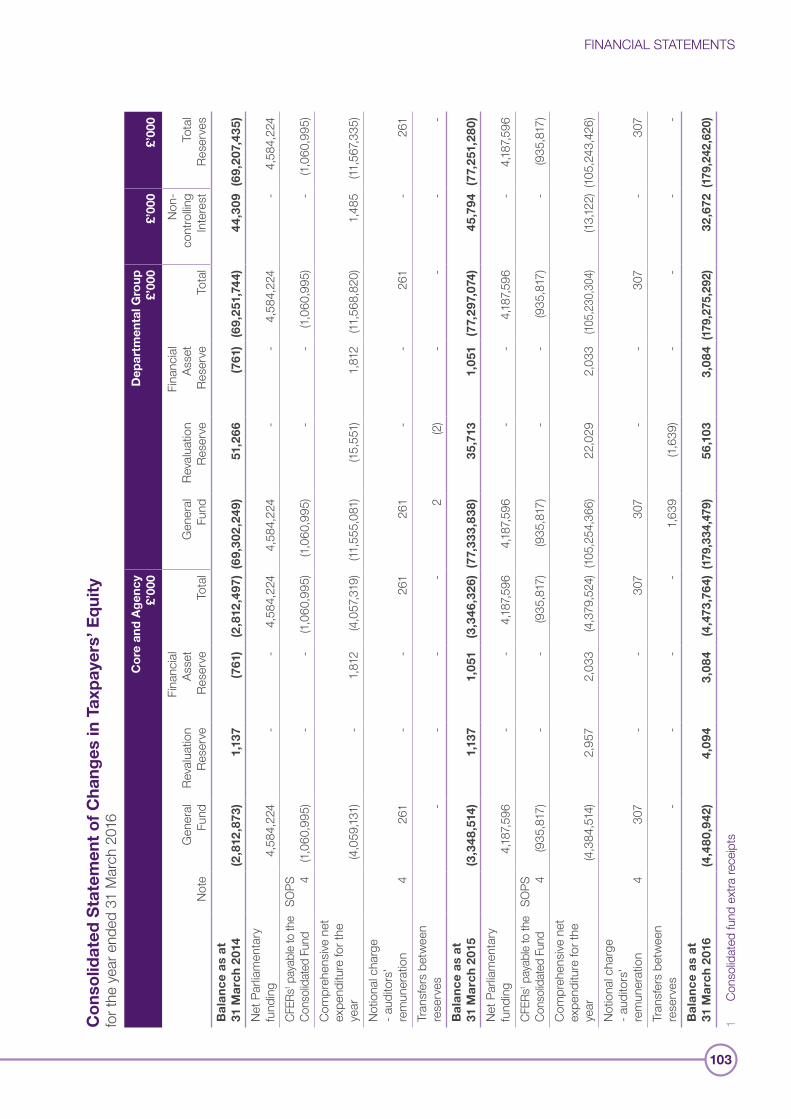
FINANCIAL STATEMENTS
103
Co
nso
lidat
ed S
tate
men
t o
f C
hang
es in
Tax
pay
ers’
Eq
uity
for t
he y
ear e
nded
31
Mar
ch 2
016
Co
re a
nd A
gen
cy
£’00
0D
epar
tmen
tal G
roup
£’
000
£’00
0£’
000
Not
eG
ener
al
Fund
Reva
luat
ion
Rese
rve
Fina
ncia
l As
set
Rese
rve
Tota
lG
ener
al
Fund
Reva
luat
ion
Rese
rve
Fina
ncia
l As
set
Rese
rve
Tota
l
Non
-co
ntro
lling
Inte
rest
Tota
l Re
serv
esB
alan
ce a
s at
31
Mar
ch 2
014
(2,8
12,8
73)
1,13
7 (7
61)
(2,8
12,4
97)
(69,
302
,249
)51
,266
(7
61)
(69,
251,
744)
44,3
09
(69,
207,
435)
Net
Par
liam
enta
ry
fund
ing
4,58
4,22
4 -
-4,
584,
224
4,58
4,22
4 -
-4,
584,
224
-4,
584,
224
CFER
s1 pay
able
to th
e Co
nsoli
date
d Fu
ndSO
PS 4
(1,06
0,99
5)-
-(1,
060,
995)
(1,06
0,99
5)-
-(1,
060,
995)
-(1,
060,
995)
Com
preh
ensiv
e ne
t ex
pend
iture
for t
he
year
(4,0
59,13
1)-
1,81
2 (4
,057
,319
)(11
,555
,081
)(15
,551
)1,
812
(11,5
68,8
20)
1,48
5 (11
,567
,335
)N
otio
nal c
harg
e - a
udito
rs'
rem
uner
atio
n4
261
--
261
261
--
261
-26
1 Tr
ansf
ers
betw
een
rese
rves
--
--
2 (2
)-
--
-B
alan
ce a
s at
31
Mar
ch 2
015
(3,3
48,5
14)
1,13
7 1,
051
(3,3
46,3
26)
(77,
333,
838)
35,7
13
1,05
1 (7
7,29
7,07
4)45
,794
(7
7,25
1,28
0)
Net
Par
liam
enta
ry
fund
ing
4,187
,596
--
4,187
,596
4,187
,596
--
4,187
,596
-4,1
87,5
96CF
ERs1 p
ayab
le to
the
Cons
olida
ted
Fund
SOPS
4(9
35,8
17)
--
(935
,817
)(9
35,8
17)
--
(935
,817
)-
(935
,817
)C
ompr
ehen
sive
net
expe
nditu
re fo
r the
ye
ar(4
,384
,514
)2,
957
2,03
3 (4
,379
,524
)(10
5,25
4,36
6)22
,029
2,
033
(105,
230,
304)
(13,12
2)(10
5,24
3,42
6)N
otio
nal c
harg
e - a
udito
rs'
rem
uner
atio
n4
307
--
307
307
--
307
-30
7 Tr
ansf
ers
betw
een
rese
rves
--
--
1,63
9 (1,
639)
--
--
Bal
ance
as
at
31 M
arch
201
6(4
,480
,942
)4,
094
3,08
4 (4
,473
,764
)(1
79,3
34,4
79)
56,1
03
3,08
4 (1
79,2
75,2
92)
32,6
72 (
179,
242,
620)
1 Co
nsol
idat
ed fu
nd e
xtra
rece
ipts
ANNUAL REPORT AND ACCOUNTS 2015–16
104
The General Fund represents the total assets less liabilities of the Group and of the core Department. The General Fund shows a deficit as a result of the large value of provisions and derivative liabilities for both the Group and the core Department; these future liabilities will be met out of future funding from Parliament. There is no reason to believe that future funding will not be forthcoming.The Revaluation Reserve reflects increases in the Fair Value of property plant and equipment carried at valuation in accordance with the accounting policy in note 1.10. The Financial Asset Reserve reflects the cumulative balance of revaluation adjustments to available for sale financial assets. The Non-controlling Interest represents aggregate reserves of the four nuclear site licence companies.The notes on pages 105 to 171 form part of these accounts.
FINANCIAL STATEMENTS
105
NOTES
1 STATEMENT OF ACCOUNTING POLICIES
1.1 Basis of accountingThese financial statements have been prepared in accordance with the 2015-16 Government Financial Reporting Manual (FReM) issued by HM Treasury. The accounting policies contained in the FReM apply International Financial Reporting Standards (IFRS) as adapted or interpreted for the public sector. Where the FReM permits a choice of accounting policy, the accounting policy which is judged to be most appropriate to the particular circumstances of the Department of Energy & Climate Change and its consolidated entities (the Group) for the purposes of giving a true and fair view has been selected. The particular policies adopted by the Group are described below. They have been applied consistently in dealing with items that are considered material to the accounts.
1.2 Accounting conventionThese accounts have been prepared under the historical cost convention modified to account for the revaluation of property, plant and equipment (except waste management assets), intangible assets, certain financial assets and liabilities and financial instruments as set out within these policies.As a departure from the FReM guidance, the Group has a specific Accounts Direction in respect of the accounting for waste management assets on an historical cost basis. These waste management assets are excluded from the requirement to revalue as part of property, plant and equipment as there is no reliable and cost effective revaluation methodology and are therefore carried at cost less accumulated depreciation and any impairment losses.
1.3 Basis of consolidationThe group accounts comprise a consolidation of the core Department, a new Supply financed executive agency, the Oil and Gas Authority, Non-Departmental Public Bodies (NDPBs) and other designated bodies which fall within the departmental boundary as defined in the FReM, being those entities listed in the Designation and Amendment Orders presented to Parliament (note 22). Designated bodies are termed Arms Length Bodies (‘ALBs’).Consolidated bodies prepare accounts in accordance with either the FReM or the Companies Act 2006 (for limited companies). All comply with IFRS as adopted by the European Union except for Radioactive Waste Management Limited and NDA Archives Limited. For those bodies that do not prepare accounts in accordance with the FReM, adjustments are made if necessary to consolidate the accounts in accordance with the FReM where differences in accounting policies would have a significant effect on these accounts.The Department and all entities included in the consolidation are domiciled in the UK. Transactions and balances between entities included in the consolidation are eliminated.
ANNUAL REPORT AND ACCOUNTS 2015–16
106
1.4 New accounting standards adopted in the yearIFRS 13 Fair Value Measurement and associated amendments to IAS 16 Property, Plant and Equipment and IAS 36 Impairment of Assets and FReM adaptations of the latter two were adopted from 1 April 2015. There was no significant impact on the accounts as IFRS 13 had already been applied in 2014-15 to the main affected area, the fair valuation of contracts for difference (note 13).
1.5 Applicable accounting standards and interpretations issued but not yet adopted and FReM changes for 2016-17IFRS 9 Financial Instruments requires financial assets to be classified on the basis of the entity’s business model and their contractual cash flow characteristics. The standard requires assets to be measured initially at Fair Value and subsequently at either Fair Value or amortised cost. It will require reclassification of Energy Efficiency loans and the Green Deal Finance Company loan from “Loans and receivables” to “Amortised cost” as the business model objective is to collect the contractual cash flows and the contractual cash flows represent solely payment of principal. Subsequent measurement is not expected to change as the above loans will continue to be measured at amortised cost. The Department will apply the standard when formally adopted in the FReM.No changes are currently proposed for the Treasury Financial Reporting Manual (FReM) for 2016-17.
1.6 Going concernThe consolidated Statement of Financial Position at 31 March 2016 shows net liabilities of £179,242 million (31 March 2015: £77,251 million). This reflects the inclusion of liabilities, in particular nuclear and coal provisions and CfD derivatives, which fall due in future years. Liabilities in excess of those to be funded by the Group will be met by future funding from Parliament. Such approval for amounts required for the next financial year is
voted on account when the Supply and Appropriation (Main Estimates) Bill is put before Parliament; there is no reason to believe that future approvals will not be forthcoming. It has accordingly been considered appropriate to adopt a going concern basis for the preparation of these financial statements.
1.7 Property, plant and equipmentAssets are capitalised as property, plant and equipment if they are intended for use on a continuing basis and their original purchase cost, on an individual or group basis, is £2k or more. The exception to this is assets relating to the Nuclear Decommissioning Authority (NDA) and Coal Authority (CA), which are capitalised as follows:NDAWith effect from 1 April 2014 existing assets on designated nuclear sites are only recognised where the economic element of the asset’s value at the reporting date exceeds £100k and the proportion of the asset relating to commercial activity exceeds 10%. Assets on non-designated sites are recognised where their value exceeds £2k. In future periods, existing assets on designated sites no longer meeting these recognition criteria will be impaired, with a charge to the Statement of Comprehensive Net Expenditure (SoCNE), and then eliminated. By applying clearer definitions of commercial materiality and higher materiality thresholds, a large volume of low value items are excluded from the financial statements without materially impacting on overall gross and net book values in the Statement of Financial Position (SoFP). Similarly by applying clearer definitions and more relevant materiality thresholds to future capital expenditure, the creation of new assets will be restricted to those which are a genuine and meaningful addition to the NDA’s commercial asset base.Changes in the estimated future cost of decommissioning, related to commercial property, plant and equipment, are offset by matching changes in the value of the IAS 37 property, plant and equipment asset.
FINANCIAL STATEMENTS
107
CAOperational mine water schemes and subsidence pumping stations are held at nil value on the SoFP because they are used to address pollution caused by past mining activities where the economic benefits have already been received. They are included within Assets under construction until brought into service at which point they are impaired to £nil carrying value with a charge to the SoCNE.
1.8 Property Freehold land and freehold and leasehold buildings are recorded at market value for existing use. Valuations are carried out at least biennially by external qualified valuers. For NDA property, plant and equipment carried at valuation, revaluations are currently performed on an annual basis to ensure that the carrying amount does not differ materially from that which would be determined using Fair Values at the reporting date. This includes assets used to support commercial activities, property located outside nuclear licensed site boundaries, and property located inside nuclear licensed site boundaries where a reliable and cost effective revaluation methodology exists.
1.9 Non-propertyIn accordance with the FReM the option has been taken to value some non-property assets on a depreciated historical cost basis, as a proxy for Fair Value where assets have short useful lives or are of low value, or both. Assets under construction are valued at cost.Where facilities have been commissioned, the estimated cost of decommissioning the facilities is recognised, to the extent that it is recognised as a provision under IAS 37, as part of the carrying value of the asset and depreciated over the useful life of the asset.
1.10 RevaluationIn accordance with the FReM, property, plant and equipment should be carried at valuation. However, the Group has a specific Accounts Direction that allows nuclear waste management assets to be excluded from this requirement where there is no reliable and cost effective revaluation methodology. Such waste management assets are therefore carried at cost less accumulated depreciation and any impairment charges. Where a reliable and cost effective revaluation methodology does exist, such waste management assets are carried at valuation.For property, plant and equipment carried at valuation, revaluations are performed with sufficient regularity that the carrying amount does not differ materially from that which would be determined using Fair Values at the reporting date. Any accumulated depreciation at the date of revaluation is eliminated and the resulting net amount restated to equal the revalued amount. Any revaluation increase arising is credited to the revaluation reserve, except to the extent that it reverses a revaluation decrease for the same asset previously recognised as an expense, in which case the increase is credited to the Statement of Comprehensive Net Expenditure to the extent of the decrease previously charged. A decrease in carrying amount arising on revaluation is charged as an expense to the extent that it exceeds the balance, if any, held in the revaluation reserve relating to a previous revaluation of that asset. On the subsequent derecognition of a revalued asset, the attributable revaluation surplus remaining in the revaluation reserve is transferred directly to the general fund.
ANNUAL REPORT AND ACCOUNTS 2015–16
108
1.11 DepreciationProperty, plant and equipment assets are depreciated at rates calculated to write them down to their estimated residual value on a straight line basis over their estimated useful lives. Assets are depreciated over the following periods:
Freehold and long leasehold land not depreciatedFreehold and leasehold buildings 10 to 60 yearsPlant, machinery and equipment 3 to 50 years or remaining life of leaseFurniture, fixtures and fittings 2 to 11 years or remaining life of leaseInformation technology 2 to 5 years
Assets under construction are not depreciated until they are available for use as intended by management. Leasehold buildings are depreciated over the shorter of their useful life or lease term.
1.12 Intangible assetsIntangible assets are stated at cost less accumulated amortisation and net of accumulated impairment losses as a proxy for Fair Value. The cost of intangible assets comprises the purchase cost and any directly attributable costs incidental to their acquisition. Intangible assets are capitalised where expenditure of £2k or more is incurred.Intangible assets are amortised over the shorter of their useful economic life or five years. Amortisation of intangible assets is charged to the Statement of Comprehensive Net Expenditure on a straight-line basis when the assets are available for use so as to allocate the carrying amounts of the intangible assets over their estimated useful economic lives.
1.13 ImpairmentAt each reporting date, the Group reviews the carrying amounts of its property, plant and equipment and intangible assets to determine whether there is any indication that those assets have suffered an impairment loss. If any such indication exists, the recoverable amount of the
asset is estimated in order to determine the extent of any impairment loss; an impairment loss is recognised when the carrying amount of an asset or cash-generating unit exceeds its recoverable amount. Recoverable amount is the higher of Fair Value less costs to sell and value in use. Impairment losses that do not result from a loss of economic value or service potential are taken to the revaluation reserve to the extent a revaluation reserve exists for the impaired asset. Impairment losses that arise from a clear consumption of economic benefit are charged to the Statement of Comprehensive Net Expenditure.Residual values and useful lives are reviewed, and adjusted if appropriate, at each reporting date.
1.14 Investment propertiesThe Group holds a number of properties which have been classified as investment properties and are not depreciated in accordance with IAS 40, but may be impaired or revalued to provide a carrying value at their estimated Fair Value. Full valuations are undertaken every five years. Gains and losses arising from changes in Fair Value of investment property are recognised in the Statement of Comprehensive Net Expenditure.
FINANCIAL STATEMENTS
109
1.15 Investments in subsidiariesInvestments in subsidiaries are stated at cost less, where appropriate, provision for impairment.
1.16 Inventories Inventories are stated at the lower of cost and net realisable value. Cost comprises direct materials and, where applicable, direct labour costs and those overheads that have been incurred in bringing the inventories to their present location and condition. Cost is calculated using the weighted average method. Net realisable value represents the estimated selling price less all estimated costs of completion and all costs to be incurred in marketing, selling and distribution. This is a departure from the FReM requirement to value inventories at current cost but this does not represent a material difference in valuation. Where necessary, inventory values are adjusted for obsolete, slow moving and defective items.Reprocessed uranium inventory is held at nil value pending development of long-term options and cost estimates for disposal of this material, however long-term storage and disposal costs are provided for.
1.17 Assets classified as held for saleAssets classified as held for sale are measured at the lower of carrying amount and Fair Value less costs to sell. Assets are classified as held for sale if their carrying amount will be recovered through a sale transaction rather than through continuing use. This condition is regarded as met only when the sale is highly probable, the asset is available for immediate sale in its present condition and the asset is actively marketed for sale. Management must be committed to the sale which should be expected to qualify for recognition as a completed sale within one year from the date of classification.
1.18 Research and developmentExpenditure on research is charged to the Statement of Comprehensive Net Expenditure in the year in which it is incurred.
Development expenditure is capitalised as an internally generated intangible asset only if all of the following criteria are met:• an asset is created that can be identified;• it is probable that the asset created will
generate future economic benefits; and• the development cost of the asset
can be measured reliably.
1.19 Operating income and revenue recognitionOperating income is income that relates directly to the operating activities of the Group and is recognised when the Group has performed its contractual obligations, the income can be measured reliably and it is probable that the economic benefits will flow to the Group. The core Department is required to identify income which it collects on behalf of the Consolidated Fund; this is taken through the Statement of Comprehensive Net Expenditure and is shown in SOPS note 4. Further income submitted to the Consolidated Fund is recorded in a separate Trust Statement published alongside this set of accounts.Revenue is measured at the Fair Value of the consideration received or receivable and represents amounts receivable for goods and services provided in the normal course of business.
1.20 ContractsWhere the outcome of a contract can be estimated reliably, revenue and costs are recognised by reference to the stage of completion of the contract activity at the reporting date. This is normally measured by the proportion that contract costs incurred for work performed to date bear to the estimated total contract costs, except where this would not be representative of the stage of completion. Variations in contract work, claims and incentive payments are included to the extent that they have been agreed with the customer.
ANNUAL REPORT AND ACCOUNTS 2015–16
110
Where the outcome of a contract cannot be estimated reliably, contract revenue is recognised to the extent of contract costs incurred where it is probable they will be recoverable. Contract costs are recognised as expenses in the period in which they are incurred.When it is probable that total contract costs will exceed total contract revenue, the expected loss is recognised as an expense immediately.
1.21 Foreign currenciesThese financial statements are presented in pounds sterling, which is the functional currency of the Group. Transactions that are denominated in a foreign currency are translated into sterling at the rate of exchange ruling on the date of each transaction. In preparing the financial statements, monetary assets and liabilities that are denominated in foreign currencies are retranslated at the rates prevailing at the reporting date. All translation differences of monetary assets and liabilities are included in the Consolidated Statement of Comprehensive Net Expenditure for the period.
1.22 LeasesLeases are classified as finance leases whenever the terms of the lease transfer substantially all the risks and rewards of ownership to the lessee. All other leases are classified as operating leases.
1.23 Finance leasesGroup as a lessorAmounts due from lessees under finance leases are recognised as receivables at the amount of the Group’s net investment in the lease. Finance lease income is allocated to accounting periods so as to reflect a constant periodic rate of return on the Group’s net investment outstanding in respect of the leases.
1.24 Operating leasesGroup as a lessorAssets which are subject to operating leases are presented in the Statement of Financial Position under property, plant and equipment. Rental income from operating leases is recognised on a straight-line basis over the term of the relevant lease. Initial direct costs incurred in negotiating and arranging an operating lease are added to the carrying amount of the leased asset and recognised on a straight-line basis over the lease term. The aggregate costs of any incentive to enter into an operating lease are also spread on a straight-line basis over the lease term.Group as a lesseeRentals payable under operating leases are charged to the Statement of Comprehensive Net Expenditure on a straight-line basis over the term of the relevant lease. Benefits received and receivable as an incentive to enter into an operating lease are also spread on a straight-line basis over the lease term.
1.25 Service concession arrangementsWhere an arrangement is within the scope of IFRIC 12 the Group, as grantor, includes the infrastructure assets on the Statement of Financial Position as non-current assets and recognises the corresponding lease creditor. Costs relating to the service element or interest charges are expensed as they are incurred.
1.26 Grants payableGrants payable are recognised in the period in which the grant recipient carries out the activity that creates an entitlement to the grant. Recognition of entitlement varies according to the details of individual schemes and the terms of the offers made. Unpaid and unclaimed grants are charged to the Statement of Comprehensive Net Expenditure on the basis of estimates of claims not received and are included in accruals in the Statement of Financial Position.
FINANCIAL STATEMENTS
111
In certain cases, grant contributions to international organisations are made in the form of promissory notes. The full amount of the promissory note is recognised as an expense in the period in which the note is deposited. Amounts not drawn down in cash from promissory notes at the reporting date are included in payables.
1.27 Staff costsUnder IAS 19, Employee Benefits, all staff costs must be recorded as an expense as the organisation is obligated to pay them; this includes the cost of any untaken leave as at the reporting date.
1.28 TaxationIncome and Corporation Tax The core Department is exempt from income and corporation tax by way of its Crown exemption. Some of the consolidated bodies are subject to corporation tax on taxable profits, including profits from any trading activity and interest receivable.Current tax assets and liabilities are measured at the amount expected to be recovered from or paid to taxation authorities, based on tax rates and laws that are enacted or substantively enacted by the reporting date.Deferred tax is recognised on all temporary differences arising between the tax base of assets and liabilities and their carrying amounts for financial reporting purposes.Deferred tax assets are recognised for all deductible temporary differences, carry forward of unused tax credits and unused tax losses, to the extent that it is probable that taxable profit will be available against which the deductible temporary differences, and the carry forward of unused tax credits and unused tax losses can be utilised. Deferred income tax assets and liabilities are measured on an undiscounted basis at the tax rates that are expected to apply when the related asset is realised or liability is settled, based on tax rates and laws enacted or substantively enacted at the reporting date. The carrying amount of deferred income tax assets is reviewed at each reporting date and
adjustments made to the extent that it is no longer probable that sufficient profits will be available. Value Added Tax (VAT) Most of the activities of the core Department are outside the scope of VAT and, in general, output tax does not apply. Some ALBs have trading activities where VAT is charged at the prevailing rate and where related input VAT costs are recoverable. Input VAT is also recovered on certain contracted-out services. Irrecoverable VAT is charged to the relevant expenditure category or, if appropriate, capitalised with additions to fixed assets. Where output tax is charged or input tax is recoverable, the amounts are stated net of VAT.
1.29 PensionsCore Department and ALBsPast and present employees of the core Department, the Oil and Gas Authority, the NDA, the Coal Authority, the Committee on Climate Change and Radioactive Waste Management Limited are covered by the provisions of the Principal Civil Service Pension Scheme (PCSPS) and, from 1 April 2015, of either the PCSPS or the Civil Servant and Other Pension Scheme. These defined benefit schemes are unfunded. The Group recognises the expected cost of these elements on a systematic and rational basis over the period during which it benefits from employees’ services by payment to the schemes of amounts calculated on an accruing basis. Liability for payment of future benefits is a charge on the schemes. In respect of the defined contribution schemes, the Group recognises the contributions payable for the year.Past and present employees of CNPA are covered by the provisions of the Combined Pension Scheme (CPS) of the UK Atomic Energy Authority (UKAEA), which is an unfunded defined benefit pension scheme which prepares its own scheme statements.The NDA participates in two funded defined benefit schemes. The liability recognised in the Statement of Financial
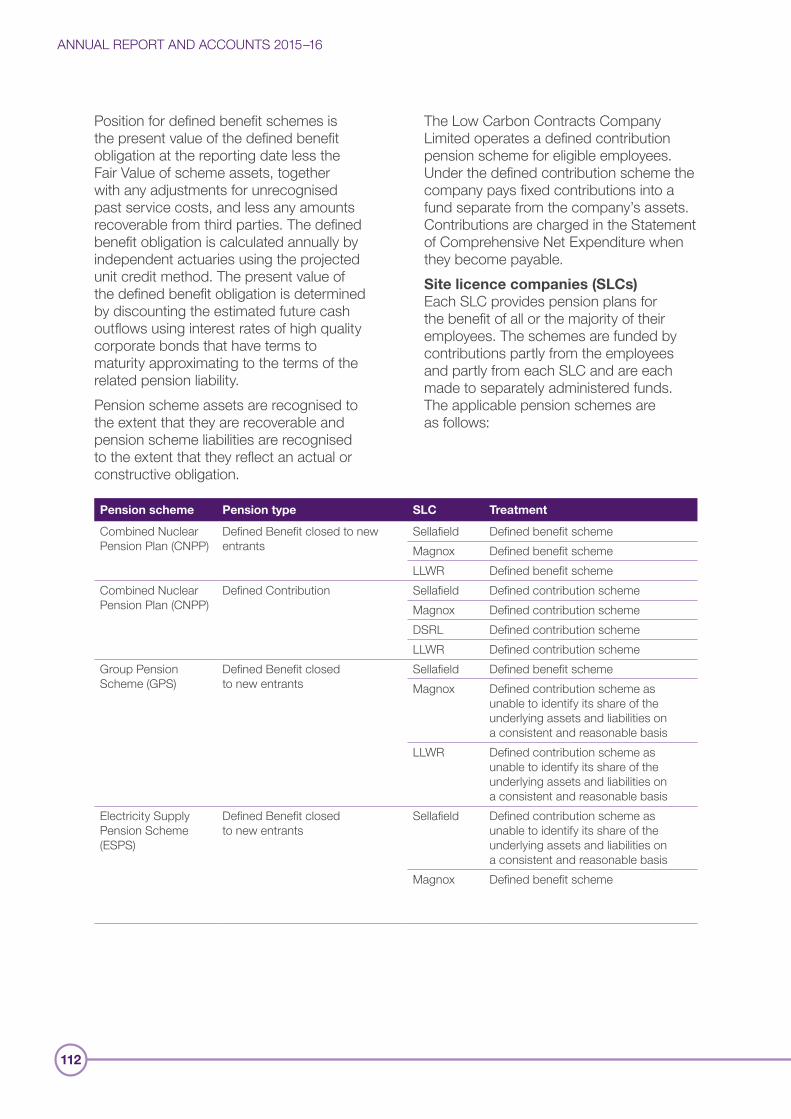
ANNUAL REPORT AND ACCOUNTS 2015–16
112
Position for defined benefit schemes is the present value of the defined benefit obligation at the reporting date less the Fair Value of scheme assets, together with any adjustments for unrecognised past service costs, and less any amounts recoverable from third parties. The defined benefit obligation is calculated annually by independent actuaries using the projected unit credit method. The present value of the defined benefit obligation is determined by discounting the estimated future cash outflows using interest rates of high quality corporate bonds that have terms to maturity approximating to the terms of the related pension liability. Pension scheme assets are recognised to the extent that they are recoverable and pension scheme liabilities are recognised to the extent that they reflect an actual or constructive obligation.
The Low Carbon Contracts Company Limited operates a defined contribution pension scheme for eligible employees. Under the defined contribution scheme the company pays fixed contributions into a fund separate from the company’s assets. Contributions are charged in the Statement of Comprehensive Net Expenditure when they become payable.Site licence companies (SLCs)Each SLC provides pension plans for the benefit of all or the majority of their employees. The schemes are funded by contributions partly from the employees and partly from each SLC and are each made to separately administered funds. The applicable pension schemes are as follows:
Pension scheme Pension type SLC Treatment
Combined Nuclear Pension Plan (CNPP)
Defined Benefit closed to new entrants
Sellafield Defined benefit schemeMagnox Defined benefit schemeLLWR Defined benefit scheme
Combined Nuclear Pension Plan (CNPP)
Defined Contribution Sellafield Defined contribution schemeMagnox Defined contribution schemeDSRL Defined contribution schemeLLWR Defined contribution scheme
Group Pension Scheme (GPS)
Defined Benefit closed to new entrants
Sellafield Defined benefit schemeMagnox Defined contribution scheme as
unable to identify its share of the underlying assets and liabilities on a consistent and reasonable basis
LLWR Defined contribution scheme as unable to identify its share of the underlying assets and liabilities on a consistent and reasonable basis
Electricity Supply Pension Scheme (ESPS)
Defined Benefit closed to new entrants
Sellafield Defined contribution scheme as unable to identify its share of the underlying assets and liabilities on a consistent and reasonable basis
Magnox Defined benefit scheme
FINANCIAL STATEMENTS
113
SLC schemes accounted for as defined benefit schemesWhere the company has an unconditional right to the actuarial surplus, and to the extent that it is recoverable, then it is recognised in full in the individual companies; all deficits are recognised in full in the individual companies. In all cases the surplus or deficit entails a corresponding deficit or surplus of the full value from the NDA. SLC schemes accounted for as defined contribution schemesContributions to defined contribution schemes are recognised in the Statement of Net Comprehensive Expenditure in the period in which they become payable.A summary of the performance of the funded defined benefit schemes are provided in these financial statements (note 8.7), with further information available in the NDA’s and Site Licence Companies’ financial statements. In accordance with IAS 19, the Scheme Managers are required to undertake a sensitivity analysis for each significant actuarial assumption as of the end of the financial reporting period, showing how the defined benefit obligation would have been affected by changes in the relevant actuarial assumptions that were reasonably possible at that date. This analysis, including details of the methods and assumptions used in preparing the sensitivity analysis, the limitations of these methods, and the reasons for any changes in methods and assumptions used in preparing the sensitivity analysis, has been provided in summary in note 8.7, with further information in the NDA’s and Site Licence Companies’ Financial Statements.
1.30 Financial assetsFinancial assets are classified into the following three specified categories: • financial assets ‘at Fair Value through
profit or loss’ (FVTPL);• loans and receivables;• financial assets available for sale.
The classification depends on the nature and purpose of the financial assets and is determined at the time of initial recognition. Management determines the categorisation of financial assets at initial recognition and re-evaluates this designation at each reporting date.The Group holds financial assets in the following categories:Loans and receivablesThese are non-derivative financial assets with fixed or determinable payments that are not quoted in an active market. Loans and receivables, held by the Departmental Group comprise cash and cash equivalents, receivables and loans.Loans and receivables are measured at amortised cost using the effective interest rate method, less any impairment. Interest income is recognised by applying the effective interest rate, except for short-term receivables when the recognition of interest would be immaterial.The effective interest rate method is a method of calculating the amortised cost of a financial asset and of allocating interest income over the relevant period. The effective interest rate is the rate that exactly discounts estimated future cash receipts through the expected life of the financial asset or, where appropriate, a shorter period, to the net carrying value of the financial asset.Cash and cash equivalents comprise cash in hand and other short term highly liquid investments which are readily convertible to known amounts of cash and which are subject to insignificant risk of changes in value and have an original maturity of three months or less. The carrying amount of these assets approximates to their Fair Value. Financial assets available for saleThese are non-derivative financial assets designated as such or not classified in any of the other categories above. This includes the investment in the Global Climate Partnership Fund (GCPF) and Asia Climate Partners Fund shown in note 8.4.
ANNUAL REPORT AND ACCOUNTS 2015–16
114
After initial recognition, these financial assets are carried at Fair Value. Gains and losses in Fair Value are recognised directly in Taxpayers’ Equity except for impairment losses. Impairment losses are recognised in the Statement of Comprehensive Net Expenditure. On derecognition, the cumulative gain or loss previously recognised in equity is recognised in the Statement of Comprehensive Net Expenditure.The Group holds a number of special and ordinary shares. Special shares are not recorded in the Statement of Financial Position and ordinary shares, which are interests in public bodies outside the departmental boundary, are valued at historical cost, less any impairments. Impairment and derecognitionFinancial assets, other than those at FVTPL, are assessed for indicators of impairment at each reporting date. Financial assets are impaired where there is objective evidence that, as a result of one or more events that occurred after the initial recognition of the financial asset, the estimated future cash flows of the asset have been impacted. Gains or losses when the asset is impaired or derecognised are recognised in the Statement of Comprehensive Net Expenditure.The carrying amount of the financial asset is reduced by the impairment loss directly for all financial assets with the exception of trade receivables, where the carrying amount is reduced through the use of an allowance account. When a trade receivable is considered uncollectible, it is written off against the allowance account. Subsequent recoveries of amounts previously written off are credited against the allowance account. Changes in the carrying amount of the allowance account are recognised in the Statement of Comprehensive Net Expenditure.If, in a subsequent period, the amount of the impairment loss decreases and the decrease can be related objectively to an event occurring after the impairment was recognised, the previously recognised impairment loss is reversed through
the Statement of Comprehensive Net Expenditure to the extent that the carrying amount of the financial asset at the date the impairment is reversed does not exceed what the amortised cost would have been had the impairment not been recognised.Financial assets are derecognised when the rights to receive future cash flows have expired or are transferred and the Group has transferred substantially all the risks and rewards of ownership.
1.31 Financial liabilitiesThe Group classifies financial liabilities into the following two categories:• financial liabilities at Fair Value through
profit or loss (FVTPL); and• other financial liabilities.The categorisation depends on the purpose for which the financial liability is held or acquired. Management determines the categorisation of financial liabilities at initial recognition and re-evaluates this designation at each reporting date.The Group holds financial liabilities in the following categories:Financial liabilities at Fair Value through profit or loss (FVTPL)Financial liabilities are classified as FVTPL where the financial liability is either held for trading or it is designated as FVTPL. A financial liability is classified as held for trading if it has been incurred principally for the purpose of disposal in the near future or it is a derivative that is not designated and effective as a hedging instrument. Financial liabilities classified as FVTPL are stated at Fair Value, with any resultant gain or loss recognised in profit or loss, unless it is a derivative whose Fair Value is based on unobservable inputs (see note 1.32 relating to CfD contracts). The net gain or loss recognised in the Statement of Comprehensive Net Expenditure incorporates any interest paid on the financial liability.
FINANCIAL STATEMENTS
115
Financial liabilities classified as FVTPL are those related to CfD contracts and commodity supply contracts shown in note 13.Other financial liabilitiesOther financial liabilities, including trade and other payables, are initially measured at Fair Value, net of transaction costs. Other financial liabilities are subsequently measured at amortised cost using the effective interest rate method, with interest expense recognised on an effective yield basis.Impairment and derecognitionFinancial liabilities are derecognised when, and only when, the obligations are discharged, cancelled or they expire.
1.32 Derivatives Derivatives are initially recognised at Fair Value on the date on which the derivative contract is entered into and are subsequently remeasured to their Fair Value at each reporting date. CfD derivativesThe CfD contracts are recognised at Fair Value in accordance with IAS 39. The transaction price is usually the best evidence of Fair Value on initial recognition of these contracts. However, in the case of CfDs, the transaction price on entering the contract is nil as neither side is required to pay any consideration upfront. The CfD Fair Value on day one is considered to be the total contractual liability as calculated using a valuation model. More details on this are set out in note 13.The application guidance of IAS 39 states that, when the Fair Value is not the same as the transaction price on day one and the Fair Value is based on unobservable data, the ‘day one’ loss arising should be deferred i.e. it would not score in the financial statements (including in the measurement of the liability on the Statement of Financial Position). IAS 39 requires that in these cases, day one gains and losses are deferred either until market data becomes available, or changes in factor (inputs) arise which market participants would take into account.
Under accounting standards, whilst the core Department and LCCC have recognised the CfD contracts, the total value of the derivatives would not be reflected in the Statement of Financial Position of either the Departmental Group or the company. Adopting the technical treatment means that the Department and LCCC are only required to recognise the movements in the Fair Value of CfD derivatives at each reporting date and the incremental recognition of the ‘day one deferred losses’ over contract lifetime. The day one loss represents the difference between the transaction price and Fair Value, and because transaction price for the CfDs is nil, the day one loss is the total liability on the day the Group became party to the contracts. By deferring the full loss, the Department and LCCC have a nil liability on the Statement of Financial Position when the contracts are initially recognised.The deferred loss will be incrementally charged to the income statement over the contract settlement period, following the construction and commissioning of the new low carbon generating plant.Changes in Fair Value arising after day one are recognised in the reporting period in which they occur and are accounted for in the Statement of Comprehensive Net Expenditure and shown on the Statement of Financial Position as they arise.A derivative is presented as a non- current asset or a non-current liability if the remaining maturity of the instrument is more than twelve months and it is not expected to be realised or settled within twelve months. Other derivatives are presented as current assets or current liabilities.Derivatives embedded in other financial instruments or other host contracts are treated as separate derivatives when their risks and characteristics are not closely related to those of the host contracts and the host contracts are not measured at Fair Value through profit or loss.
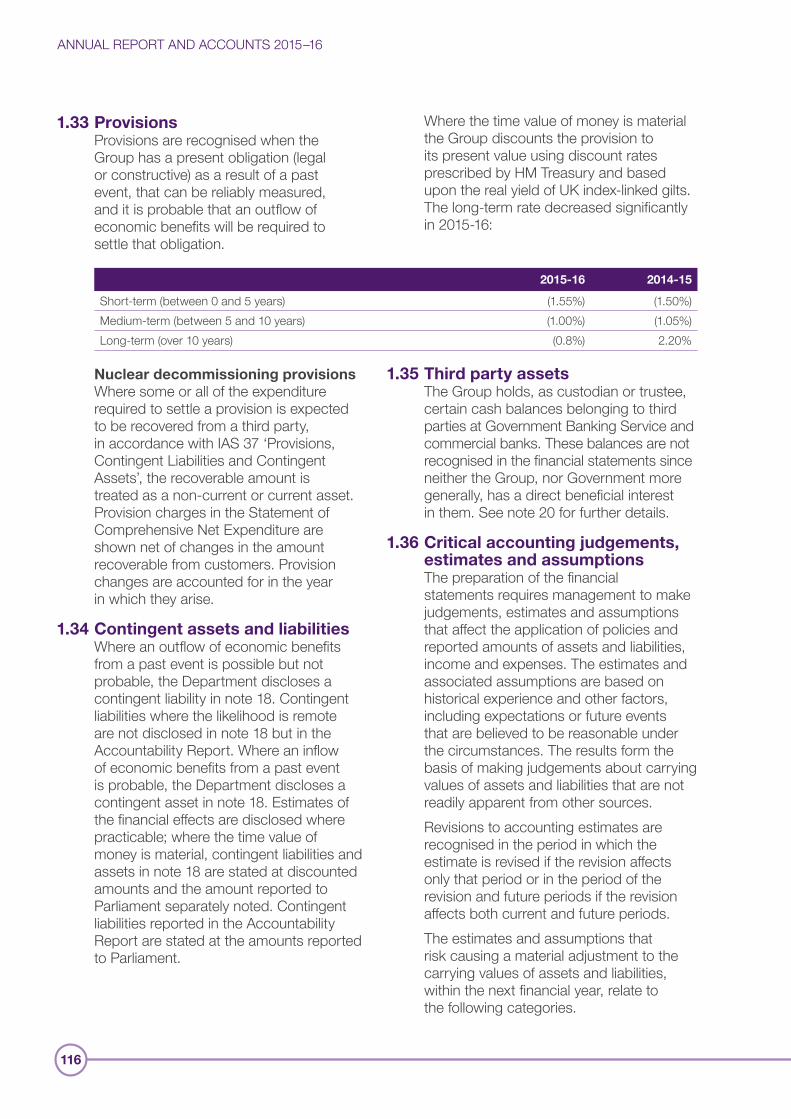
ANNUAL REPORT AND ACCOUNTS 2015–16
116
1.33 ProvisionsProvisions are recognised when the Group has a present obligation (legal or constructive) as a result of a past event, that can be reliably measured, and it is probable that an outflow of economic benefits will be required to settle that obligation.
Where the time value of money is material the Group discounts the provision to its present value using discount rates prescribed by HM Treasury and based upon the real yield of UK index-linked gilts. The long-term rate decreased significantly in 2015-16:
2015-16 2014-15
Short-term (between 0 and 5 years) (1.55%) (1.50%)Medium-term (between 5 and 10 years) (1.00%) (1.05%)Long-term (over 10 years) (0.8%) 2.20%
Nuclear decommissioning provisionsWhere some or all of the expenditure required to settle a provision is expected to be recovered from a third party, in accordance with IAS 37 ‘Provisions, Contingent Liabilities and Contingent Assets’, the recoverable amount is treated as a non-current or current asset. Provision charges in the Statement of Comprehensive Net Expenditure are shown net of changes in the amount recoverable from customers. Provision changes are accounted for in the year in which they arise.
1.34 Contingent assets and liabilitiesWhere an outflow of economic benefits from a past event is possible but not probable, the Department discloses a contingent liability in note 18. Contingent liabilities where the likelihood is remote are not disclosed in note 18 but in the Accountability Report. Where an inflow of economic benefits from a past event is probable, the Department discloses a contingent asset in note 18. Estimates of the financial effects are disclosed where practicable; where the time value of money is material, contingent liabilities and assets in note 18 are stated at discounted amounts and the amount reported to Parliament separately noted. Contingent liabilities reported in the Accountability Report are stated at the amounts reported to Parliament.
1.35 Third party assetsThe Group holds, as custodian or trustee, certain cash balances belonging to third parties at Government Banking Service and commercial banks. These balances are not recognised in the financial statements since neither the Group, nor Government more generally, has a direct beneficial interest in them. See note 20 for further details.
1.36 Critical accounting judgements, estimates and assumptionsThe preparation of the financial statements requires management to make judgements, estimates and assumptions that affect the application of policies and reported amounts of assets and liabilities, income and expenses. The estimates and associated assumptions are based on historical experience and other factors, including expectations or future events that are believed to be reasonable under the circumstances. The results form the basis of making judgements about carrying values of assets and liabilities that are not readily apparent from other sources.Revisions to accounting estimates are recognised in the period in which the estimate is revised if the revision affects only that period or in the period of the revision and future periods if the revision affects both current and future periods.The estimates and assumptions that risk causing a material adjustment to the carrying values of assets and liabilities, within the next financial year, relate to the following categories.
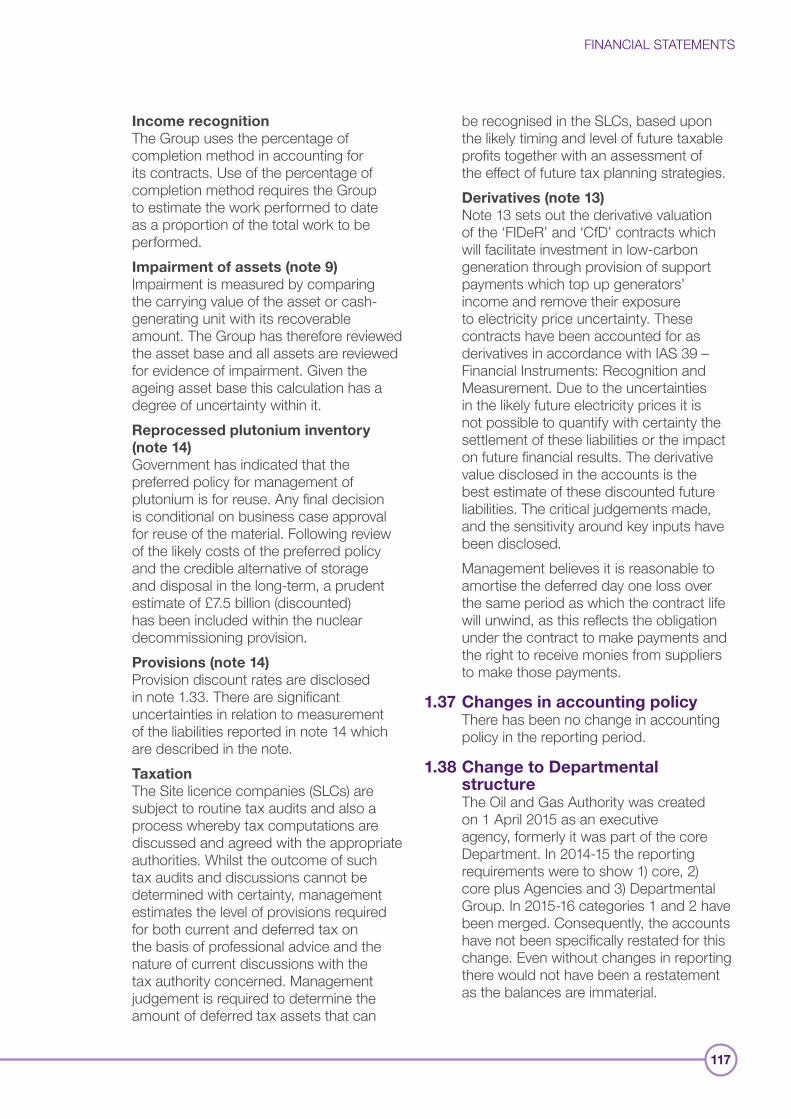
FINANCIAL STATEMENTS
117
Income recognitionThe Group uses the percentage of completion method in accounting for its contracts. Use of the percentage of completion method requires the Group to estimate the work performed to date as a proportion of the total work to be performed.Impairment of assets (note 9)Impairment is measured by comparing the carrying value of the asset or cash-generating unit with its recoverable amount. The Group has therefore reviewed the asset base and all assets are reviewed for evidence of impairment. Given the ageing asset base this calculation has a degree of uncertainty within it. Reprocessed plutonium inventory (note 14)Government has indicated that the preferred policy for management of plutonium is for reuse. Any final decision is conditional on business case approval for reuse of the material. Following review of the likely costs of the preferred policy and the credible alternative of storage and disposal in the long-term, a prudent estimate of £7.5 billion (discounted) has been included within the nuclear decommissioning provision.Provisions (note 14) Provision discount rates are disclosed in note 1.33. There are significant uncertainties in relation to measurement of the liabilities reported in note 14 which are described in the note.TaxationThe Site licence companies (SLCs) are subject to routine tax audits and also a process whereby tax computations are discussed and agreed with the appropriate authorities. Whilst the outcome of such tax audits and discussions cannot be determined with certainty, management estimates the level of provisions required for both current and deferred tax on the basis of professional advice and the nature of current discussions with the tax authority concerned. Management judgement is required to determine the amount of deferred tax assets that can
be recognised in the SLCs, based upon the likely timing and level of future taxable profits together with an assessment of the effect of future tax planning strategies.Derivatives (note 13)Note 13 sets out the derivative valuation of the ‘FIDeR’ and ‘CfD’ contracts which will facilitate investment in low-carbon generation through provision of support payments which top up generators’ income and remove their exposure to electricity price uncertainty. These contracts have been accounted for as derivatives in accordance with IAS 39 – Financial Instruments: Recognition and Measurement. Due to the uncertainties in the likely future electricity prices it is not possible to quantify with certainty the settlement of these liabilities or the impact on future financial results. The derivative value disclosed in the accounts is the best estimate of these discounted future liabilities. The critical judgements made, and the sensitivity around key inputs have been disclosed.Management believes it is reasonable to amortise the deferred day one loss over the same period as which the contract life will unwind, as this reflects the obligation under the contract to make payments and the right to receive monies from suppliers to make those payments.
1.37 Changes in accounting policyThere has been no change in accounting policy in the reporting period.
1.38 Change to Departmental structureThe Oil and Gas Authority was created on 1 April 2015 as an executive agency, formerly it was part of the core Department. In 2014-15 the reporting requirements were to show 1) core, 2) core plus Agencies and 3) Departmental Group. In 2015-16 categories 1 and 2 have been merged. Consequently, the accounts have not been specifically restated for this change. Even without changes in reporting there would not have been a restatement as the balances are immaterial.
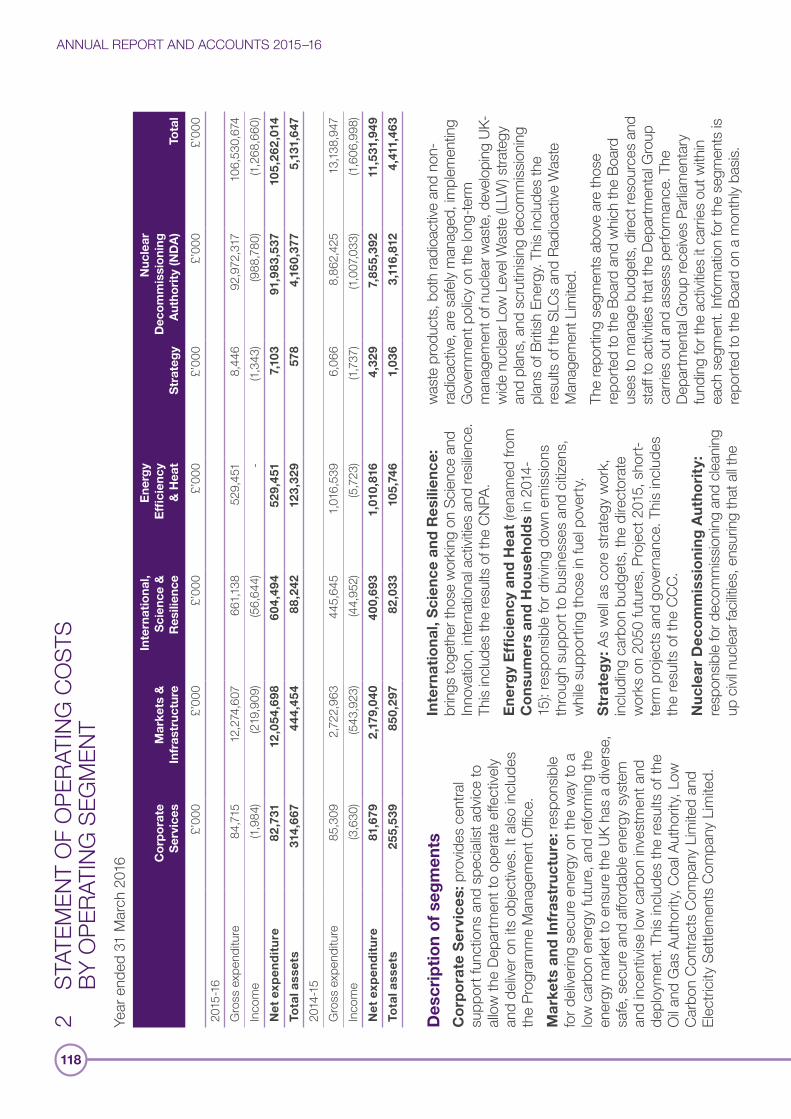
118
ANNUAL REPORT AND ACCOUNTS 2015–162
STAT
EMEN
T O
F O
PERA
TING
CO
STS
BY
OPE
RATI
NG S
EGM
ENT
Year
end
ed 3
1 M
arch
201
6 Co
rpo
rate
S
ervi
ces
Mar
kets
&
Infr
astr
uctu
re
Inte
rnat
iona
l, S
cien
ce &
R
esili
ence
Ene
rgy
Effi
cien
cy
& H
eat
Str
ateg
y
Nuc
lear
D
eco
mm
issi
oni
ng
Aut
hori
ty (N
DA
)To
tal
£’00
0£’
000
£’00
0£’
000
£’00
0£’
000
£’00
020
15-1
6G
ross
exp
endi
ture
84,7
15
12,2
74,6
0766
1,138
529,
451
8,44
6 92
,972
,317
10
6,53
0,67
4In
com
e(1,
984)
(219
,909
)(5
6,64
4)-
(1,34
3)(9
88,7
80)
(1,26
8,66
0)N
et e
xpen
dit
ure
82,7
31
12,0
54,6
98
604,
494
529,
451
7,10
3 91
,983
,537
10
5,26
2,0
14
Tota
l ass
ets
314,
667
444,
454
88,2
42
123,
329
578
4,16
0,37
75,
131,
647
2014
-15
Gro
ss e
xpen
ditu
re85
,309
2,
722,
963
445,
645
1,01
6,53
9 6,
066
8,86
2,42
5 13
,138,
947
Inco
me
(3,6
30)
(543
,923
)(4
4,95
2)(5
,723
)(1,
737)
(1,00
7,033
)(1,
606,
998)
Net
exp
end
itu
re81
,679
2
,179
,040
40
0,69
3 1,
010,
816
4,32
9 7,
855,
392
11,5
31,9
49
Tota
l ass
ets
255,
539
850,
297
82,0
33
105,
746
1,03
6 3,
116,
812
4,41
1,46
3
Des
crip
tio
n o
f se
gm
ents
Co
rpo
rate
Ser
vice
s: p
rovid
es c
entra
l su
ppor
t fun
ctio
ns a
nd s
pecia
list a
dvic
e to
all
ow th
e De
partm
ent t
o op
erat
e eff
ectiv
ely
and
deliv
er o
n its
obj
ectiv
es. I
t also
inclu
des
the
Prog
ram
me
Man
agem
ent O
ffice.
Mar
kets
an
d In
fras
tru
ctu
re: r
espo
nsib
le fo
r deli
verin
g se
cure
ene
rgy
on th
e w
ay to
a
low
car
bon
ener
gy fu
ture
, and
refo
rmin
g th
e en
ergy
mar
ket t
o en
sure
the
UK h
as a
dive
rse,
sa
fe, s
ecur
e an
d aff
orda
ble
ener
gy s
yste
m
and
ince
ntivi
se lo
w c
arbo
n inv
estm
ent a
nd
depl
oym
ent.
This
inclu
des
the
resu
lts o
f the
O
il and
Gas
Aut
horit
y, Co
al Au
thor
ity, L
ow
Carb
on C
ontra
cts
Com
pany
Lim
ited
and
Elec
tricit
y Se
ttlem
ents
Com
pany
Lim
ited.
Inte
rnat
ion
al, S
cien
ce a
nd
Res
ilien
ce:
bring
s to
geth
er th
ose
wor
king
on S
cienc
e an
d In
nova
tion,
inte
rnat
iona
l act
ivitie
s an
d re
silien
ce.
This
includ
es th
e re
sults
of t
he C
NPA.
En
erg
y E
ffici
ency
an
d H
eat (
rena
med
from
C
on
sum
ers
and
Ho
use
ho
lds
in 2
014-
15):
resp
onsib
le fo
r driv
ing
dow
n em
issio
ns
thro
ugh
supp
ort t
o bu
sines
ses
and
citize
ns,
whi
le su
ppor
ting
thos
e in
fuel
pove
rty.
Str
ateg
y: A
s w
ell a
s co
re s
trate
gy w
ork,
in
cludi
ng c
arbo
n bu
dget
s, th
e di
rect
orat
e w
orks
on
2050
futu
res,
Pro
ject
201
5, s
hort-
term
pro
ject
s an
d go
vern
ance
. Thi
s in
clude
s th
e re
sults
of t
he C
CC.
Nu
clea
r D
eco
mm
issi
on
ing
Au
tho
rity
: re
spon
sible
for d
ecom
miss
ionin
g an
d cle
aning
up
civi
l nuc
lear f
acilit
ies, e
nsur
ing th
at a
ll the
was
te p
rodu
cts,
bot
h ra
dioa
ctive
and
non
-ra
dioa
ctive
, are
saf
ely m
anag
ed, im
plem
entin
g G
over
nmen
t pol
icy o
n th
e lo
ng-te
rm
man
agem
ent o
f nuc
lear w
aste
, dev
elopi
ng U
K-w
ide
nucle
ar L
ow L
evel
Was
te (L
LW) s
trate
gy
and
plan
s, a
nd s
crut
inisin
g de
com
miss
ionin
g pl
ans
of B
ritish
Ene
rgy.
This
includ
es th
e re
sults
of t
he S
LCs
and
Radi
oact
ive W
aste
M
anag
emen
t Lim
ited.
The
repo
rting
seg
men
ts a
bove
are
thos
e re
porte
d to
the
Boar
d an
d w
hich
the
Boar
d us
es to
man
age
budg
ets,
dire
ct re
sour
ces
and
staff
to a
ctivi
ties
that
the
Depa
rtmen
tal G
roup
ca
rries
out
and
ass
ess
perfo
rman
ce. T
he
Depa
rtmen
tal G
roup
rece
ives
Parlia
men
tary
fu
nding
for t
he a
ctivi
ties
it ca
rries
out
with
in
each
seg
men
t. In
form
atio
n fo
r the
seg
men
ts is
re
porte
d to
the
Boar
d on
a m
onth
ly ba
sis.
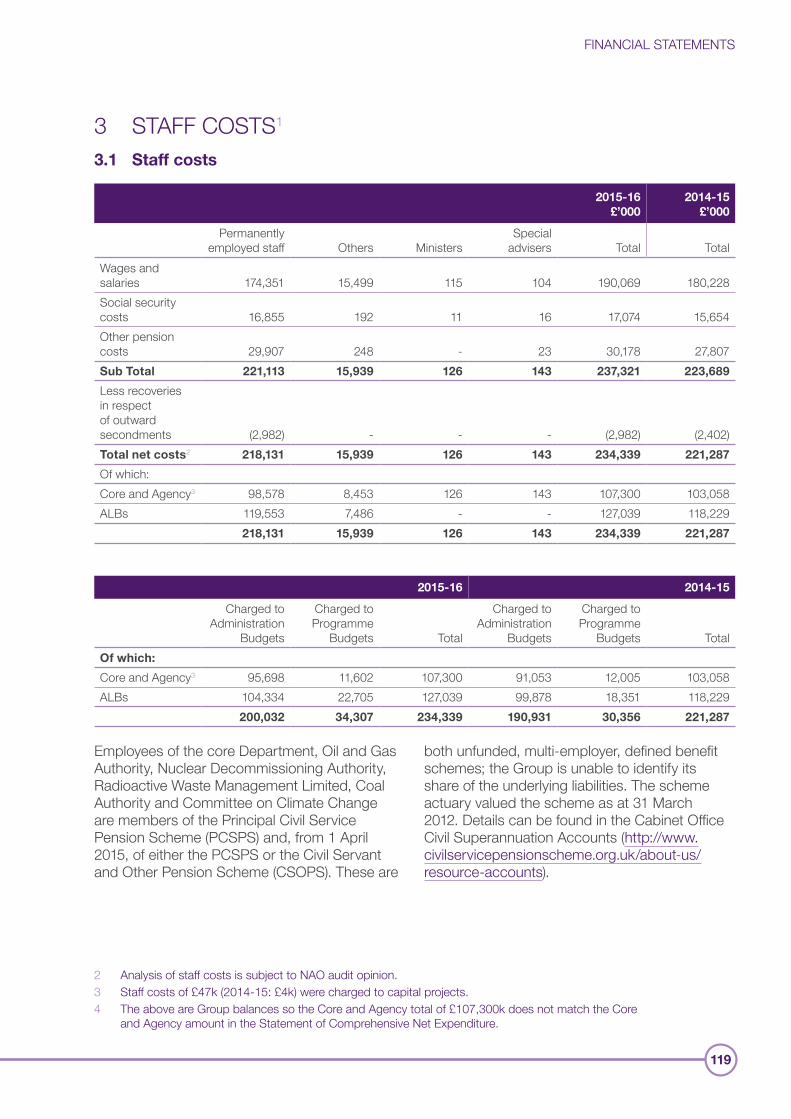
FINANCIAL STATEMENTS
119
3 STAFF COSTS1
3.1 Staff costs
2015-16 £’000
2014-15 £’000
Permanently employed staff Others Ministers
Special advisers Total Total
Wages and salaries 174,351 15,499 115 104 190,069 180,228 Social security costs 16,855 192 11 16 17,074 15,654 Other pension costs 29,907 248 - 23 30,178 27,807 Sub Total 221,113 15,939 126 143 237,321 223,689
Less recoveries in respect of outward secondments (2,982) - - - (2,982) (2,402)Total net costs2 218,131 15,939 126 143 234,339 221,287
Of which:Core and Agency3 98,578 8,453 126 143 107,300 103,058 ALBs 119,553 7,486 - - 127,039 118,229
218,131 15,939 126 143 234,339 221,287
2015-16 2014-15
Charged to Administration
Budgets
Charged to Programme
Budgets Total
Charged to Administration
Budgets
Charged to Programme
Budgets TotalOf which:
Core and Agency3 95,698 11,602 107,300 91,053 12,005 103,058 ALBs 104,334 22,705 127,039 99,878 18,351 118,229
200,032 34,307 234,339 190,931 30,356 221,287
Employees of the core Department, Oil and Gas Authority, Nuclear Decommissioning Authority, Radioactive Waste Management Limited, Coal Authority and Committee on Climate Change are members of the Principal Civil Service Pension Scheme (PCSPS) and, from 1 April 2015, of either the PCSPS or the Civil Servant and Other Pension Scheme (CSOPS). These are
both unfunded, multi-employer, defined benefit schemes; the Group is unable to identify its share of the underlying liabilities. The scheme actuary valued the scheme as at 31 March 2012. Details can be found in the Cabinet Office Civil Superannuation Accounts (http://www.civilservicepensionscheme.org.uk/about-us/resource-accounts).
2 Analysis of staff costs is subject to NAO audit opinion.3 Staff costs of £47k (2014-15: £4k) were charged to capital projects.4 The above are Group balances so the Core and Agency total of £107,300k does not match the Core
and Agency amount in the Statement of Comprehensive Net Expenditure.
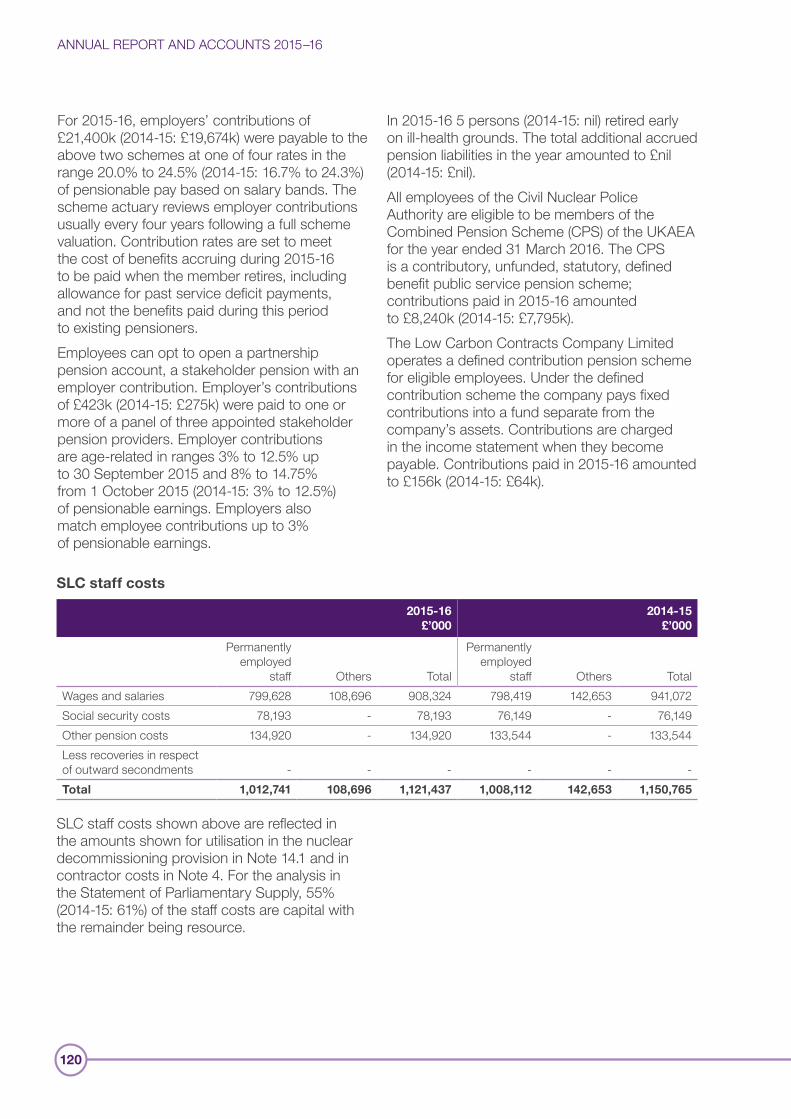
ANNUAL REPORT AND ACCOUNTS 2015–16
120
For 2015-16, employers’ contributions of £21,400k (2014-15: £19,674k) were payable to the above two schemes at one of four rates in the range 20.0% to 24.5% (2014-15: 16.7% to 24.3%) of pensionable pay based on salary bands. The scheme actuary reviews employer contributions usually every four years following a full scheme valuation. Contribution rates are set to meet the cost of benefits accruing during 2015-16 to be paid when the member retires, including allowance for past service deficit payments, and not the benefits paid during this period to existing pensioners.Employees can opt to open a partnership pension account, a stakeholder pension with an employer contribution. Employer’s contributions of £423k (2014-15: £275k) were paid to one or more of a panel of three appointed stakeholder pension providers. Employer contributions are age-related in ranges 3% to 12.5% up to 30 September 2015 and 8% to 14.75% from 1 October 2015 (2014-15: 3% to 12.5%) of pensionable earnings. Employers also match employee contributions up to 3% of pensionable earnings.
In 2015-16 5 persons (2014-15: nil) retired early on ill-health grounds. The total additional accrued pension liabilities in the year amounted to £nil (2014-15: £nil).All employees of the Civil Nuclear Police Authority are eligible to be members of the Combined Pension Scheme (CPS) of the UKAEA for the year ended 31 March 2016. The CPS is a contributory, unfunded, statutory, defined benefit public service pension scheme; contributions paid in 2015-16 amounted to £8,240k (2014-15: £7,795k).The Low Carbon Contracts Company Limited operates a defined contribution pension scheme for eligible employees. Under the defined contribution scheme the company pays fixed contributions into a fund separate from the company’s assets. Contributions are charged in the income statement when they become payable. Contributions paid in 2015-16 amounted to £156k (2014-15: £64k).
SLC staff costs
2015-16 £’000
2014-15 £’000
Permanently employed
staff Others Total
Permanently employed
staff Others TotalWages and salaries 799,628 108,696 908,324 798,419 142,653 941,072 Social security costs 78,193 - 78,193 76,149 - 76,149 Other pension costs 134,920 - 134,920 133,544 - 133,544 Less recoveries in respect of outward secondments - - - - - -Total 1,012,741 108,696 1,121,437 1,008,112 142,653 1,150,765
SLC staff costs shown above are reflected in the amounts shown for utilisation in the nuclear decommissioning provision in Note 14.1 and in contractor costs in Note 4. For the analysis in the Statement of Parliamentary Supply, 55% (2014-15: 61%) of the staff costs are capital with the remainder being resource.
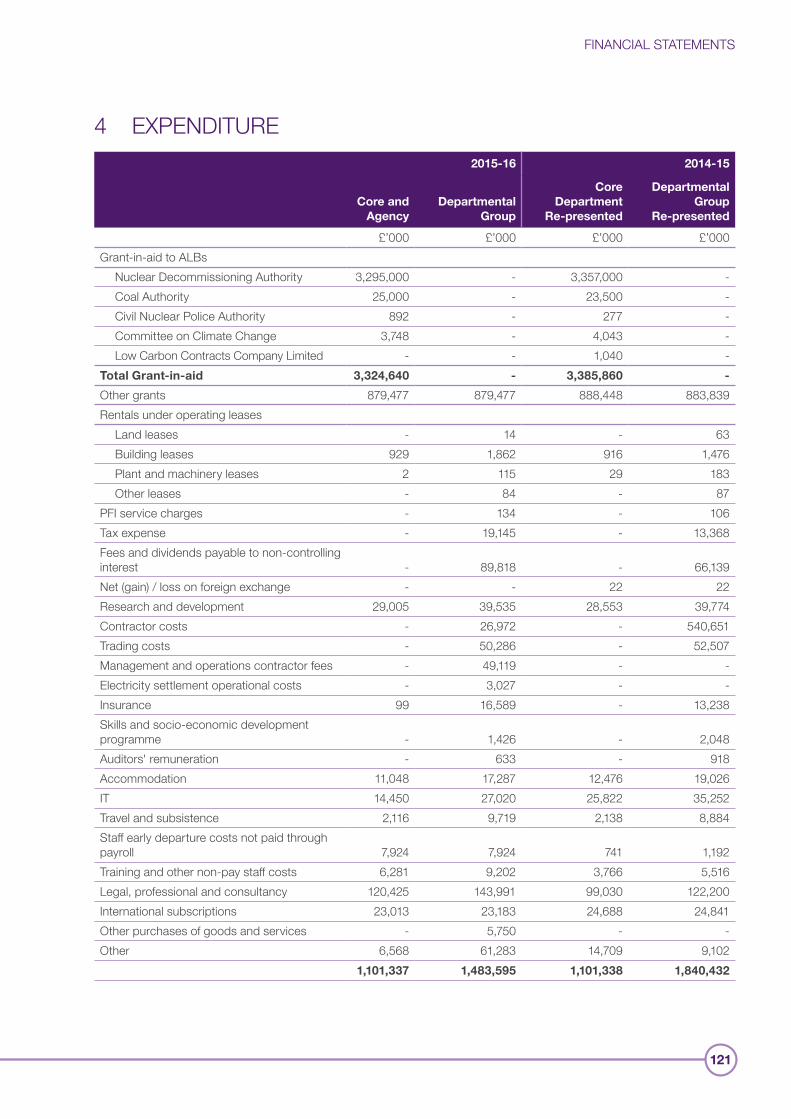
FINANCIAL STATEMENTS
121
4 EXPENDITURE2015-16 2014-15
Core and Agency
Departmental Group
Core Department
Re-presented
Departmental Group
Re-presented
£’000 £’000 £’000 £’000Grant-in-aid to ALBs Nuclear Decommissioning Authority 3,295,000 - 3,357,000 - Coal Authority 25,000 - 23,500 - Civil Nuclear Police Authority 892 - 277 - Committee on Climate Change 3,748 - 4,043 - Low Carbon Contracts Company Limited - - 1,040 -Total Grant-in-aid 3,324,640 - 3,385,860 -
Other grants 879,477 879,477 888,448 883,839 Rentals under operating leases Land leases - 14 - 63 Building leases 929 1,862 916 1,476 Plant and machinery leases 2 115 29 183 Other leases - 84 - 87 PFI service charges - 134 - 106 Tax expense - 19,145 - 13,368 Fees and dividends payable to non-controlling interest - 89,818 - 66,139 Net (gain) / loss on foreign exchange - - 22 22 Research and development 29,005 39,535 28,553 39,774 Contractor costs - 26,972 - 540,651 Trading costs - 50,286 - 52,507 Management and operations contractor fees - 49,119 - -Electricity settlement operational costs - 3,027 - -Insurance 99 16,589 - 13,238 Skills and socio-economic development programme - 1,426 - 2,048 Auditors' remuneration - 633 - 918 Accommodation 11,048 17,287 12,476 19,026 IT 14,450 27,020 25,822 35,252 Travel and subsistence 2,116 9,719 2,138 8,884 Staff early departure costs not paid through payroll 7,924 7,924 741 1,192 Training and other non-pay staff costs 6,281 9,202 3,766 5,516 Legal, professional and consultancy 120,425 143,991 99,030 122,200 International subscriptions 23,013 23,183 24,688 24,841 Other purchases of goods and services - 5,750 - -Other 6,568 61,283 14,709 9,102
1,101,337 1,483,595 1,101,338 1,840,432
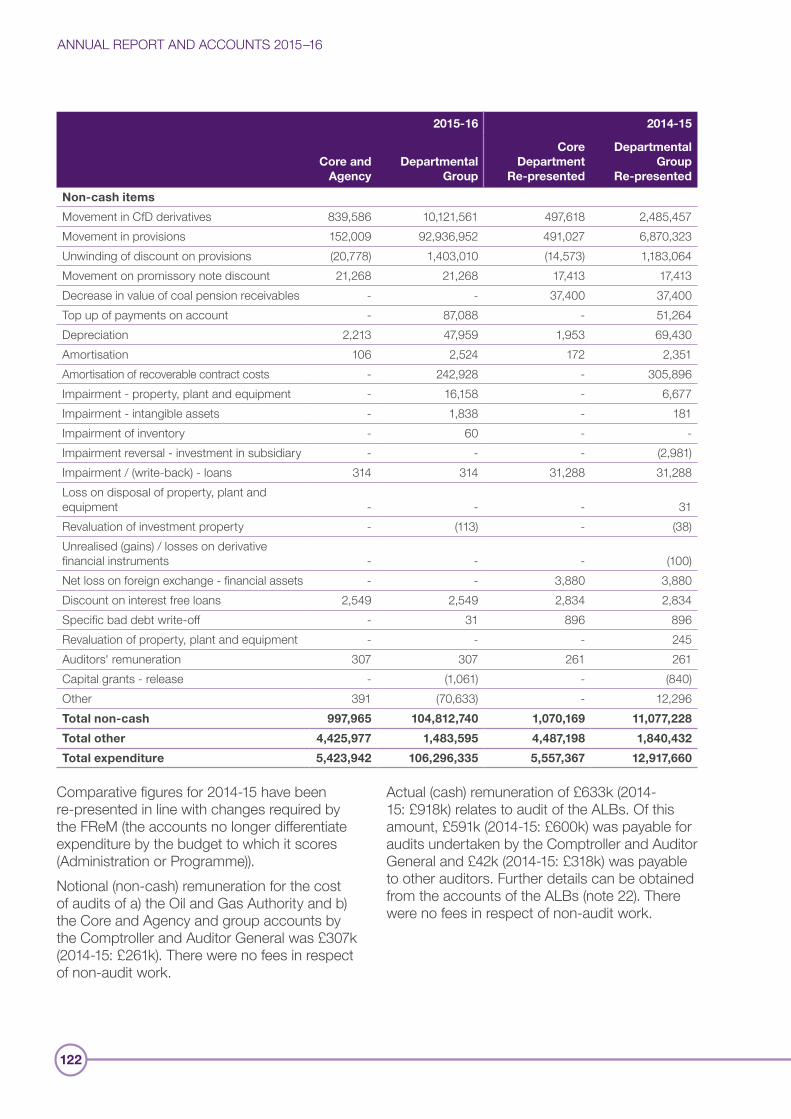
ANNUAL REPORT AND ACCOUNTS 2015–16
122
2015-16 2014-15
Core and Agency
Departmental Group
Core Department
Re-presented
Departmental Group
Re-presented
Non-cash items
Movement in CfD derivatives 839,586 10,121,561 497,618 2,485,457 Movement in provisions 152,009 92,936,952 491,027 6,870,323 Unwinding of discount on provisions (20,778) 1,403,010 (14,573) 1,183,064 Movement on promissory note discount 21,268 21,268 17,413 17,413 Decrease in value of coal pension receivables - - 37,400 37,400 Top up of payments on account - 87,088 - 51,264 Depreciation 2,213 47,959 1,953 69,430 Amortisation 106 2,524 172 2,351 Amortisation of recoverable contract costs - 242,928 - 305,896 Impairment - property, plant and equipment - 16,158 - 6,677 Impairment - intangible assets - 1,838 - 181 Impairment of inventory - 60 - -Impairment reversal - investment in subsidiary - - - (2,981)Impairment / (write-back) - loans 314 314 31,288 31,288 Loss on disposal of property, plant and equipment - - - 31 Revaluation of investment property - (113) - (38)Unrealised (gains) / losses on derivative financial instruments - - - (100)Net loss on foreign exchange - financial assets - - 3,880 3,880 Discount on interest free loans 2,549 2,549 2,834 2,834 Specific bad debt write-off - 31 896 896 Revaluation of property, plant and equipment - - - 245 Auditors' remuneration 307 307 261 261 Capital grants - release - (1,061) - (840)Other 391 (70,633) - 12,296 Total non-cash 997,965 104,812,740 1,070,169 11,077,228
Total other 4,425,977 1,483,595 4,487,198 1,840,432
Total expenditure 5,423,942 106,296,335 5,557,367 12,917,660
Comparative figures for 2014-15 have been re-presented in line with changes required by the FReM (the accounts no longer differentiate expenditure by the budget to which it scores (Administration or Programme)). Notional (non-cash) remuneration for the cost of audits of a) the Oil and Gas Authority and b) the Core and Agency and group accounts by the Comptroller and Auditor General was £307k (2014-15: £261k). There were no fees in respect of non-audit work.
Actual (cash) remuneration of £633k (2014-15: £918k) relates to audit of the ALBs. Of this amount, £591k (2014-15: £600k) was payable for audits undertaken by the Comptroller and Auditor General and £42k (2014-15: £318k) was payable to other auditors. Further details can be obtained from the accounts of the ALBs (note 22). There were no fees in respect of non-audit work.
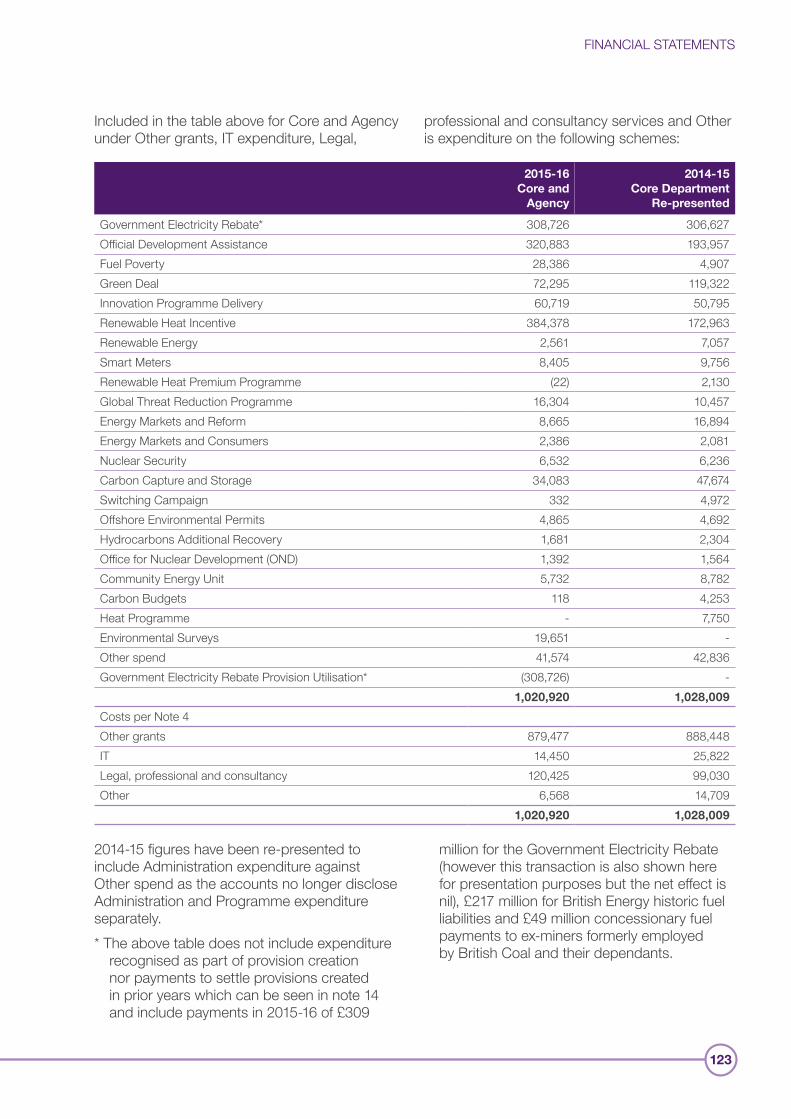
FINANCIAL STATEMENTS
123
Included in the table above for Core and Agency under Other grants, IT expenditure, Legal,
professional and consultancy services and Other is expenditure on the following schemes:
2015-16 Core and
Agency
2014-15 Core Department
Re-presented
Government Electricity Rebate* 308,726 306,627 Official Development Assistance 320,883 193,957 Fuel Poverty 28,386 4,907 Green Deal 72,295 119,322 Innovation Programme Delivery 60,719 50,795 Renewable Heat Incentive 384,378 172,963 Renewable Energy 2,561 7,057 Smart Meters 8,405 9,756 Renewable Heat Premium Programme (22) 2,130 Global Threat Reduction Programme 16,304 10,457 Energy Markets and Reform 8,665 16,894 Energy Markets and Consumers 2,386 2,081 Nuclear Security 6,532 6,236 Carbon Capture and Storage 34,083 47,674 Switching Campaign 332 4,972 Offshore Environmental Permits 4,865 4,692 Hydrocarbons Additional Recovery 1,681 2,304 Office for Nuclear Development (OND) 1,392 1,564 Community Energy Unit 5,732 8,782 Carbon Budgets 118 4,253 Heat Programme - 7,750 Environmental Surveys 19,651 -Other spend 41,574 42,836 Government Electricity Rebate Provision Utilisation* (308,726) -
1,020,920 1,028,009
Costs per Note 4Other grants 879,477 888,448 IT 14,450 25,822 Legal, professional and consultancy 120,425 99,030 Other 6,568 14,709
1,020,920 1,028,009
2014-15 figures have been re-presented to include Administration expenditure against Other spend as the accounts no longer disclose Administration and Programme expenditure separately.* The above table does not include expenditure
recognised as part of provision creation nor payments to settle provisions created in prior years which can be seen in note 14 and include payments in 2015-16 of £309
million for the Government Electricity Rebate (however this transaction is also shown here for presentation purposes but the net effect is nil), £217 million for British Energy historic fuel liabilities and £49 million concessionary fuel payments to ex-miners formerly employed by British Coal and their dependants.
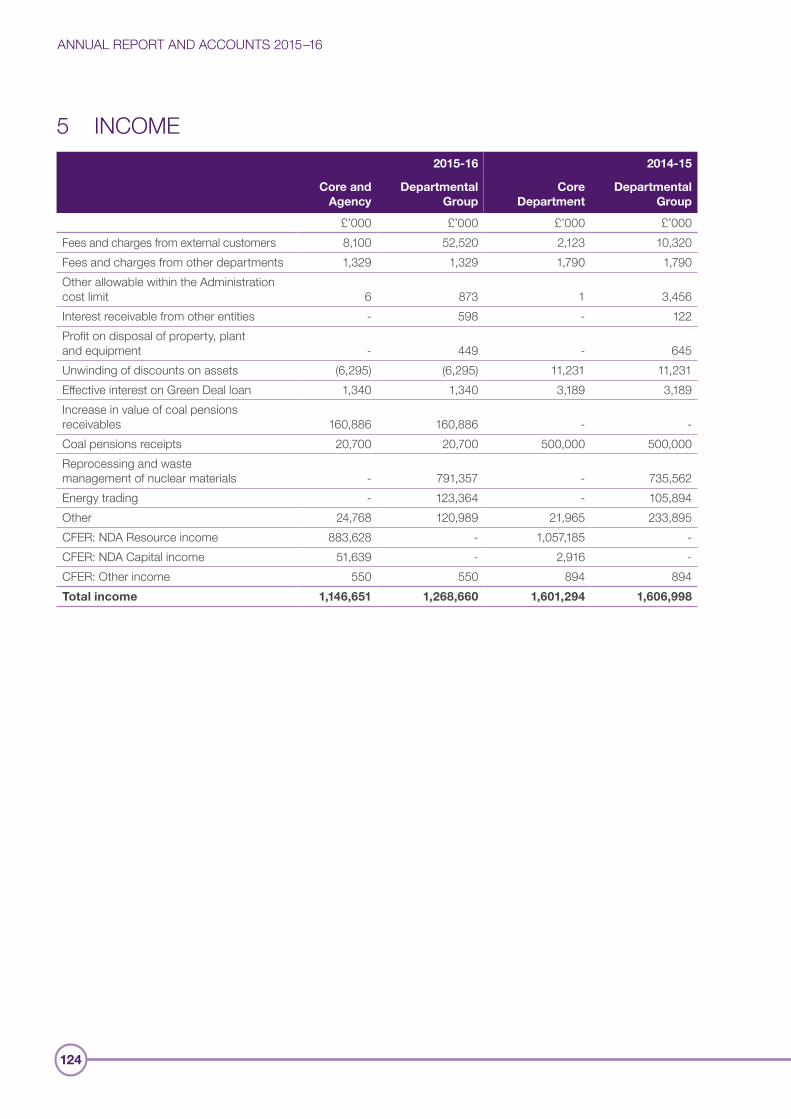
ANNUAL REPORT AND ACCOUNTS 2015–16
124
5 INCOME2015-16 2014-15
Core and Agency
Departmental Group
Core Department
Departmental Group
£’000 £’000 £’000 £’000Fees and charges from external customers 8,100 52,520 2,123 10,320 Fees and charges from other departments 1,329 1,329 1,790 1,790Other allowable within the Administration cost limit 6 873 1 3,456Interest receivable from other entities - 598 - 122Profit on disposal of property, plant and equipment - 449 - 645Unwinding of discounts on assets (6,295) (6,295) 11,231 11,231Effective interest on Green Deal loan 1,340 1,340 3,189 3,189Increase in value of coal pensions receivables 160,886 160,886 - -Coal pensions receipts 20,700 20,700 500,000 500,000Reprocessing and waste management of nuclear materials - 791,357 - 735,562Energy trading - 123,364 - 105,894 Other 24,768 120,989 21,965 233,895CFER: NDA Resource income 883,628 - 1,057,185 -CFER: NDA Capital income 51,639 - 2,916 -CFER: Other income 550 550 894 894 Total income 1,146,651 1,268,660 1,601,294 1,606,998
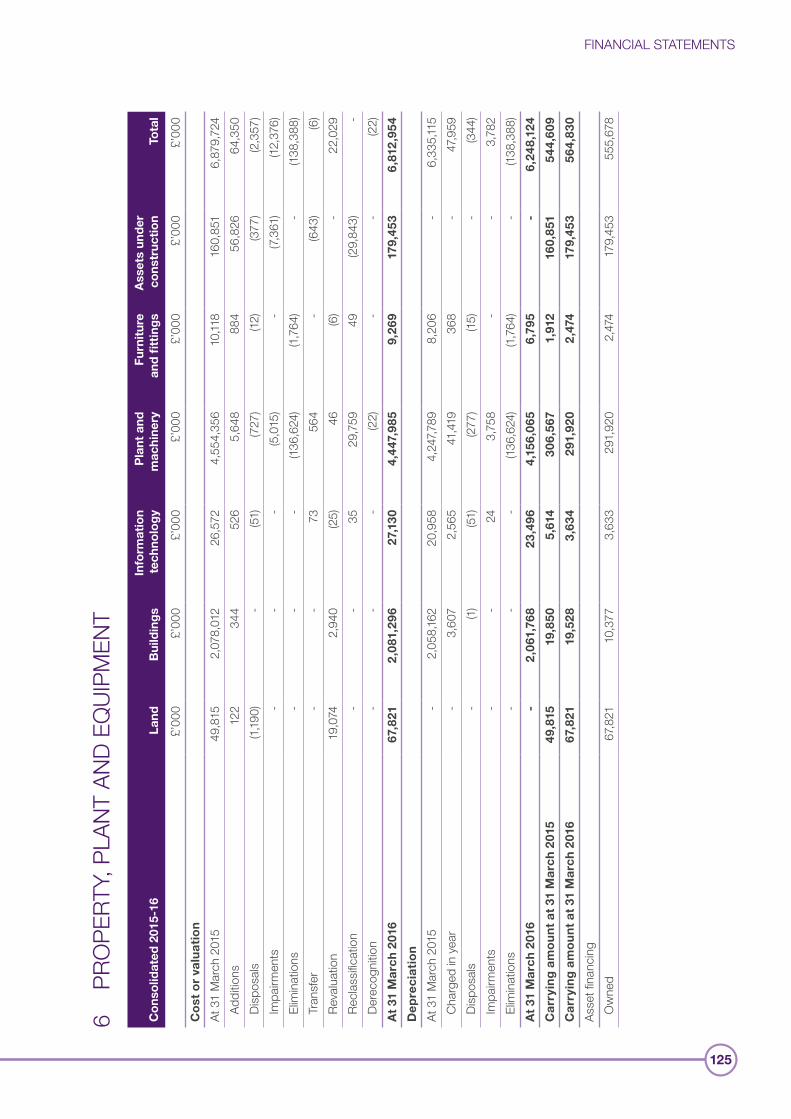
FINANCIAL STATEMENTS
125
6 PR
OPE
RTY,
PLA
NT A
ND E
QUI
PMEN
T
Co
nso
lidat
ed 2
015-
16La
ndB
uild
ing
sIn
form
atio
n te
chno
log
yP
lant
and
m
achi
nery
Furn
itur
e an
d fi
ttin
gs
Ass
ets
und
er
cons
truc
tio
nTo
tal
£’00
0£’
000
£’00
0£’
000
£’00
0£’
000
£’00
0C
ost
or
valu
atio
n
At 3
1 M
arch
201
549
,815
2,
078,
012
26,5
72
4,55
4,35
6 10
,118
160,
851
6,87
9,72
4 A
dditio
ns12
2 34
4 52
6 5,
648
884
56,8
26
64,3
50
Disp
osal
s(1,
190)
-(5
1)(7
27)
(12)
(377
)(2
,357
) I
mpa
irmen
ts-
--
(5,0
15)
-(7,
361)
(12,3
76)
Elim
inat
ions
--
-(13
6,62
4)(1,
764)
-(13
8,38
8) T
rans
fer
--
73
564
-(6
43)
(6)
Rev
alua
tion
19,0
74
2,94
0 (2
5)46
(6
)-
22,0
29
Rec
lass
ificat
ion
--
35
29,7
59
49
(29,
843)
- D
erec
ogni
tion
--
-(2
2)-
-(2
2)A
t 31
Mar
ch 2
016
67,8
21
2,0
81,2
96
27,1
30
4,44
7,98
5 9,
269
179,
453
6,81
2,9
54
Dep
reci
atio
n
At 3
1 M
arch
201
5-
2,05
8,16
2 20
,958
4,
247,7
89
8,20
6 -
6,33
5,11
5 C
harg
ed in
yea
r-
3,60
7 2,
565
41,4
19
368
-47
,959
D
ispos
als
-(1)
(51)
(277
)(15
)-
(344
) I
mpa
irmen
ts-
-24
3,
758
--
3,78
2 E
limin
atio
ns-
--
(136,
624)
(1,76
4)-
(138,
388)
At
31 M
arch
201
6-
2,0
61,7
68
23,4
96
4,15
6,06
5 6,
795
-6,
248,
124
Car
ryin
g a
mo
un
t at
31
Mar
ch 2
015
49,8
15
19,8
50
5,61
4 30
6,56
7 1,
912
160,
851
544,
609
Car
ryin
g a
mo
un
t at
31
Mar
ch 2
016
67,8
21
19,5
28
3,63
4 29
1,92
0 2
,474
17
9,45
3 56
4,83
0
Asse
t fina
ncin
g O
wne
d67
,821
10
,377
3,
633
291,
920
2,47
4 17
9,45
3 55
5,67
8

ANNUAL REPORT AND ACCOUNTS 2015–16
126
Co
nso
lidat
ed 2
015-
16La
ndB
uild
ing
sIn
form
atio
n te
chno
log
yP
lant
and
m
achi
nery
Furn
itur
e an
d fi
ttin
gs
Ass
ets
und
er
cons
truc
tio
nTo
tal
£’00
0£’
000
£’00
0£’
000
£’00
0£’
000
£’00
0 F
inan
ce le
ased
-9,1
51
1 -
--
9,152
C
arry
ing
am
ou
nt
at 3
1 M
arch
201
667
,821
19
,528
3,
634
291,
920
2,4
74
179,
453
564,
830
Of t
he to
tal:
Cor
e an
d Ag
ency
-9,1
51
2,73
5 19
1,
750
4,00
6 17
,661
O
ther
des
igna
ted
bodi
es67
,821
10
,377
89
9 29
1,90
1 72
4 17
5,44
7 54
7,169
C
arry
ing
am
ou
nt
at 3
1 M
arch
201
667
,821
19
,528
3,
634
291,
920
2,4
74
179,
453
564,
830
d 5 na y 1y , 0
e l . y e l
a e r l t b c e b
h 2 1t
e g f r 3e n t ia e e sr a ffi tcd n i s p ris
w e i rt t o c ffs s p rt st g u aaxu e i o oi x rr m
ere
o or d O
f p
ni as
d o f e e c tp sa y e aep i 1 M
d om xr t ae 6 b u e o
t 3t n s o ua i c t e1 s a nu t e
e a u d
one
o l d H
c o sa t m a l0o d f o s
a b
e
h 2 p d
a
e b du e i e v he e s a
s l ot e b l t e u h e u r tcg i
d s a a t r er q lh an lam .t s f li a n t u ont v d
e
1 M n
t e
s i nd e v a ii r ’ ttl e e e
s o yi sk g nu s t r
d b n r e m uan d
v
e t 3 a ir e e
t a
iqu
ipr eg lo
s w
r m
e ane h fic h on
s a nu i va
n t tn i il a l t
r l s l h u g a
d a
e o xa , p g c 7. e l A n ua s i s i 1e i d 0y a ne
n l d a
d v
u m nd li l qe nc tl i o aa e e r uu a g he 2
A l u h
e n fi ome v e h a nl il n p c ta t e C
d b r t ca n ea c h
ND
o rv h a a tu s e h ar n xh et r q u C d p m pl T a e wit
M
r el er b d b a o t e e s n g nd y m hsa e e d n n o , w e i
i d e a
dli d u p l ec ce e t mc e T a A ts fi a p at s i iu il
n D l Ad p i G n
s a
b a ue t on s d a pu W r s
s h qs e O o
e d
n E it t i d
il qe p
u F o h
h i ga o e
e
. I ai w l u o O ce i nc t . Tsot ffip l ri n k s fl
o a e ’ ssu h r ob e 1 t
t v A r o t c u
i
cc n w e C e n r t e ex G mss o o .
t o
r sa d £
i , f n ko h as o y e
e s l
d a
d
a e O
m t e b t d
a
y p o 6d c e 1n l r h cae n e eo e edm o s . rl to p at d
w l tir n v 6 a d t
o e £
, L e f ; p e nn t a
t
r 1l s oe i nna l g u
r 0 o p y S
o ds rp a sn te h ua oo e ei t one e a n ii ut o p
h 2 r k
i eucs b s d
c lu i c a act i sli x hs ra e D h e l m a
pa d
a
r or t e s w as A
n
c i y o m e t b
alu oo
5 W r V Gm 4 a lr hn fi re
v
r e g tsa t f i o
e c i
omr a e 1
Me
O l sm u eve h t 5n a t F 1 u sl sa t 3 op 0 h r r so 1 B a
R lT a a fi
C a a 2 v a T f 2 c b a
e . tnn r
m ul eoa i y es r mt ofr k
v tll ti k eir a
se
0 ha 9oe s t e l o 2s o h s
t
a r p 38 m
s b im
p ,5 s a , ty 1 t
ed
nl e )tl k 7g s ) £ eeu f £ 8
n o e 1.o st no r d b m
ia d f s t
c et o l
g a
g ,86
n t so 0 o u
e ja i y a
h n t 1 tr i n dan .
ep
rn i £ s a
i t nom i c ) e e (
c oi v he s a
a cs
dil h a t ir s u vpy se d a ati
A e
s w , h e il r l ay l Ar ie ce
fu
le
ND
t d d
mp a o s ti a rt ree i cv o o ptf s it e r p et o e n
o s c eal d
d a s f Ch c m t i
n l a t
, t u s t o hn t e r da mo e ii m g er nt
me ro n ut a c u e e at
na e a r oi ce h
a
c r m A c l
e y r u
e m c mi ir ir a ah pai
f ND re
b c mh
m p ri m d a i
up cl o m ee n f w cE In t
d c a I mp
I o mi w o a
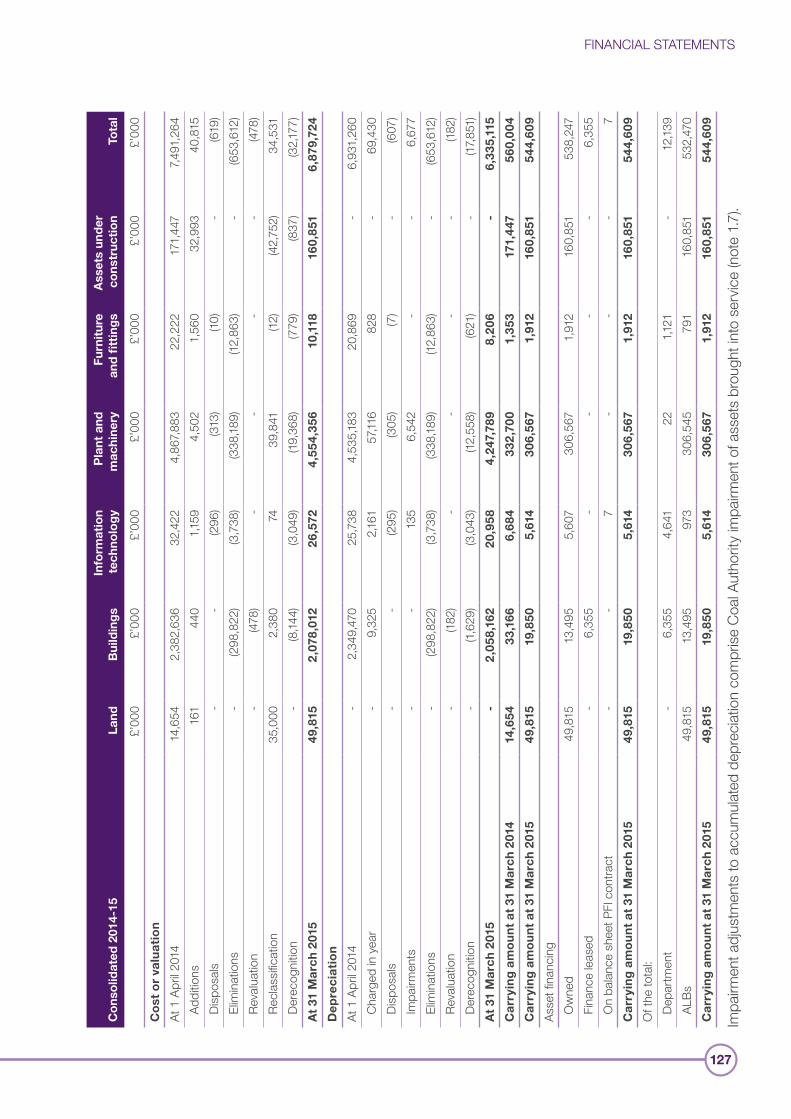
FINANCIAL STATEMENTS
127
Co
nso
lidat
ed 2
014-
15La
ndB
uild
ing
sIn
form
atio
n te
chno
log
yP
lant
and
m
achi
nery
Furn
itur
e an
d fi
ttin
gs
Ass
ets
und
er
cons
truc
tio
nTo
tal
£’00
0£’
000
£’00
0£’
000
£’00
0£’
000
£’00
0C
ost
or
valu
atio
n
At 1
Apr
il 201
414
,654
2,
382,
636
32,4
22
4,86
7,883
22
,222
17
1,44
7 7,4
91,2
64
Add
itions
161
440
1,159
4,
502
1,56
0 32
,993
40
,815
D
ispos
als
--
(296
)(3
13)
(10)
-(6
19)
Elim
inat
ions
-(2
98,8
22)
(3,7
38)
(338
,189)
(12,8
63)
-(6
53,6
12)
Rev
alua
tion
-(4
78)
--
--
(478
) R
ecla
ssific
atio
n35
,000
2,
380
74
39,8
41
(12)
(42,
752)
34,5
31
Der
ecog
nitio
n-
(8,14
4)(3
,049
)(19
,368
)(7
79)
(837
)(3
2,177
)A
t 31
Mar
ch 2
015
49,8
15
2,0
78,0
12
26,5
72
4,55
4,35
6 10
,118
16
0,85
1 6,
879,
724
Dep
reci
atio
n
At 1
Apr
il 201
4-
2,34
9,47
0 25
,738
4,
535,
183
20,8
69
-6,
931,
260
Cha
rged
in y
ear
-9,
325
2,161
57
,116
828
-69
,430
D
ispos
als
--
(295
)(3
05)
(7)
-(6
07)
Im
pairm
ents
--
135
6,54
2 -
-6,
677
Elim
inat
ions
-(2
98,8
22)
(3,7
38)
(338
,189)
(12,8
63)
-(6
53,6
12)
Rev
alua
tion
-(18
2)-
--
-(18
2) D
erec
ogni
tion
-(1,
629)
(3,0
43)
(12,5
58)
(621
)-
(17,8
51)
At
31 M
arch
201
5-
2,0
58,1
62
20,9
58
4,24
7,78
9 8,
206
-6,
335,
115
Car
ryin
g a
mo
un
t at
31
Mar
ch 2
014
14,6
54
33,1
66
6,68
4 33
2,7
00
1,35
3 17
1,44
7 56
0,00
4
Car
ryin
g a
mo
un
t at
31
Mar
ch 2
015
49,8
15
19,8
50
5,61
4 30
6,56
7 1,
912
160,
851
544,
609
Asse
t fina
ncin
g O
wne
d49
,815
13
,495
5,
607
306,
567
1,91
2 16
0,85
1 53
8,24
7 F
inan
ce le
ased
-6,
355
--
--
6,35
5 O
n ba
lanc
e sh
eet P
FI c
ontra
ct-
-7
--
-7
Car
ryin
g a
mo
un
t at
31
Mar
ch 2
015
49,8
15
19,8
50
5,61
4 30
6,56
7 1,
912
160,
851
544,
609
Of t
he to
tal:
Dep
artm
ent
-6,
355
4,64
1 22
1,1
21
-12
,139
ALB
s49
,815
13
,495
97
3 30
6,54
5 79
1 16
0,85
1 53
2,47
0 C
arry
ing
am
ou
nt
at 3
1 M
arch
201
549
,815
19
,850
5,
614
306,
567
1,91
2 16
0,85
1 54
4,60
9
Impa
irmen
t adj
ustm
ents
to a
ccum
ulat
ed d
epre
ciatio
n co
mpr
ise C
oal A
utho
rity
impa
irmen
t of a
sset
s br
ough
t int
o se
rvic
e (n
ote
1.7).
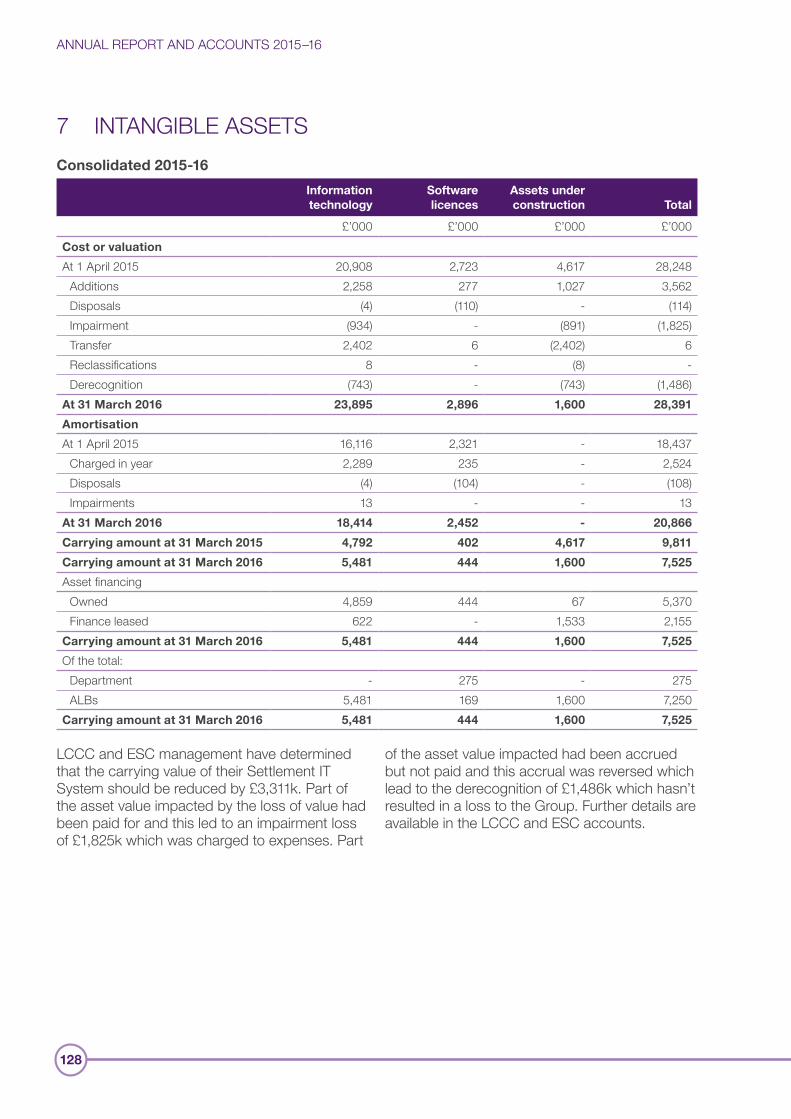
ANNUAL REPORT AND ACCOUNTS 2015–16
128
7 INTANGIBLE ASSETSConsolidated 2015-16
Information technology
Software licences
Assets under construction Total
£’000 £’000 £’000 £’000Cost or valuation
At 1 April 2015 20,908 2,723 4,617 28,248 Additions 2,258 277 1,027 3,562 Disposals (4) (110) - (114) Impairment (934) - (891) (1,825) Transfer 2,402 6 (2,402) 6 Reclassifications 8 - (8) - Derecognition (743) - (743) (1,486)At 31 March 2016 23,895 2,896 1,600 28,391
Amortisation
At 1 April 2015 16,116 2,321 - 18,437 Charged in year 2,289 235 - 2,524 Disposals (4) (104) - (108) Impairments 13 - - 13 At 31 March 2016 18,414 2,452 - 20,866
Carrying amount at 31 March 2015 4,792 402 4,617 9,811
Carrying amount at 31 March 2016 5,481 444 1,600 7,525
Asset financing Owned 4,859 444 67 5,370 Finance leased 622 - 1,533 2,155 Carrying amount at 31 March 2016 5,481 444 1,600 7,525
Of the total: Department - 275 - 275 ALBs 5,481 169 1,600 7,250 Carrying amount at 31 March 2016 5,481 444 1,600 7,525
LCCC and ESC management have determined that the carrying value of their Settlement IT System should be reduced by £3,311k. Part of the asset value impacted by the loss of value had been paid for and this led to an impairment loss of £1,825k which was charged to expenses. Part
of the asset value impacted had been accrued but not paid and this accrual was reversed which lead to the derecognition of £1,486k which hasn’t resulted in a loss to the Group. Further details are available in the LCCC and ESC accounts.
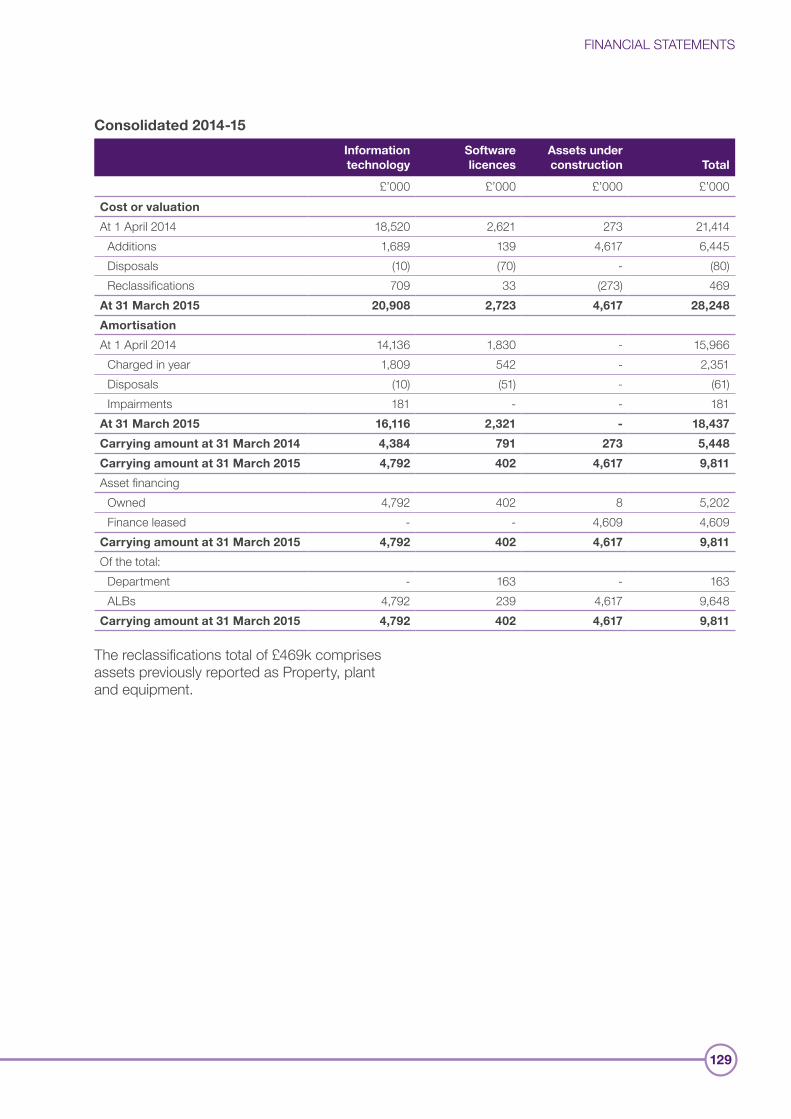
FINANCIAL STATEMENTS
129
Consolidated 2014-15
Information technology
Software licences
Assets under construction Total
£’000 £’000 £’000 £’000Cost or valuation
At 1 April 2014 18,520 2,621 273 21,414 Additions 1,689 139 4,617 6,445 Disposals (10) (70) - (80) Reclassifications 709 33 (273) 469 At 31 March 2015 20,908 2,723 4,617 28,248
Amortisation
At 1 April 2014 14,136 1,830 - 15,966 Charged in year 1,809 542 - 2,351 Disposals (10) (51) - (61) Impairments 181 - - 181 At 31 March 2015 16,116 2,321 - 18,437
Carrying amount at 31 March 2014 4,384 791 273 5,448
Carrying amount at 31 March 2015 4,792 402 4,617 9,811
Asset financing Owned 4,792 402 8 5,202 Finance leased - - 4,609 4,609 Carrying amount at 31 March 2015 4,792 402 4,617 9,811
Of the total: Department - 163 - 163 ALBs 4,792 239 4,617 9,648 Carrying amount at 31 March 2015 4,792 402 4,617 9,811
The reclassifications total of £469k comprises assets previously reported as Property, plant and equipment.
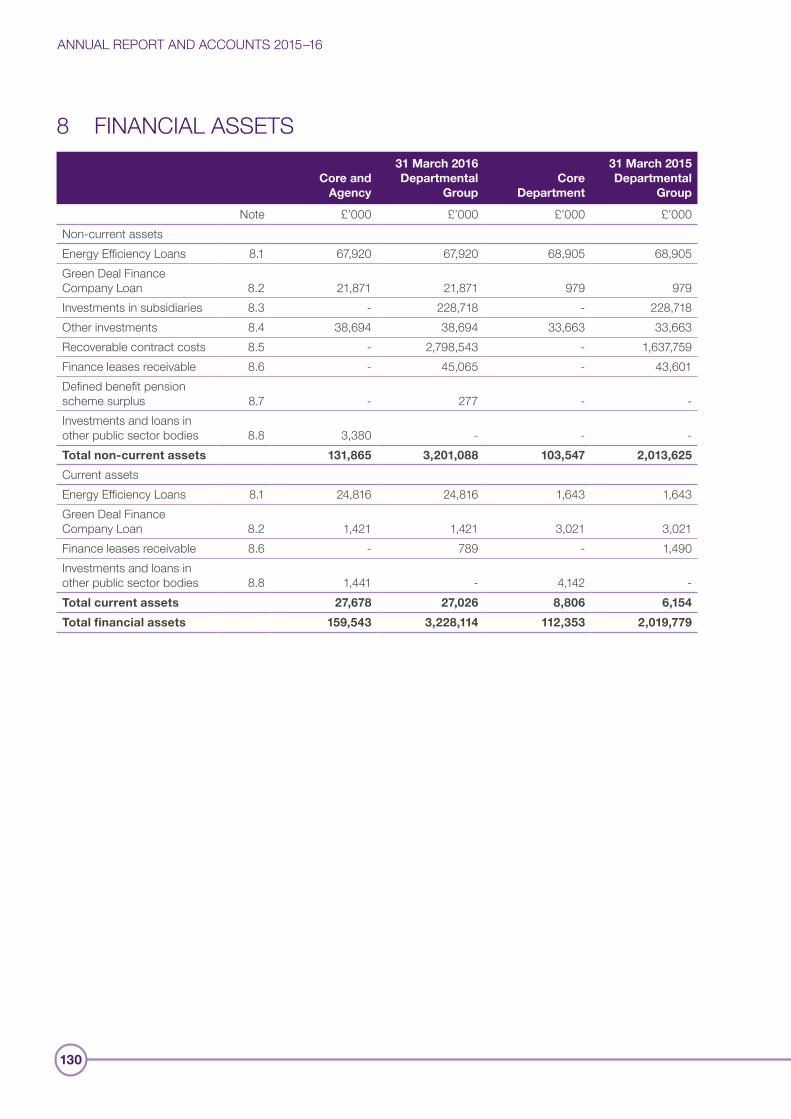
ANNUAL REPORT AND ACCOUNTS 2015–16
130
8 FINANCIAL ASSETS
Core and Agency
31 March 2016 Departmental
GroupCore
Department
31 March 2015 Departmental
Group
Note £’000 £’000 £’000 £’000Non-current assetsEnergy Efficiency Loans 8.1 67,920 67,920 68,905 68,905 Green Deal Finance Company Loan 8.2 21,871 21,871 979 979 Investments in subsidiaries 8.3 - 228,718 - 228,718 Other investments 8.4 38,694 38,694 33,663 33,663 Recoverable contract costs 8.5 - 2,798,543 - 1,637,759 Finance leases receivable 8.6 - 45,065 - 43,601 Defined benefit pension scheme surplus 8.7 - 277 - -Investments and loans in other public sector bodies 8.8 3,380 - - -Total non-current assets 131,865 3,201,088 103,547 2,013,625
Current assetsEnergy Efficiency Loans 8.1 24,816 24,816 1,643 1,643 Green Deal Finance Company Loan 8.2 1,421 1,421 3,021 3,021 Finance leases receivable 8.6 - 789 - 1,490 Investments and loans in other public sector bodies 8.8 1,441 - 4,142 -Total current assets 27,678 27,026 8,806 6,154
Total financial assets 159,543 3,228,114 112,353 2,019,779
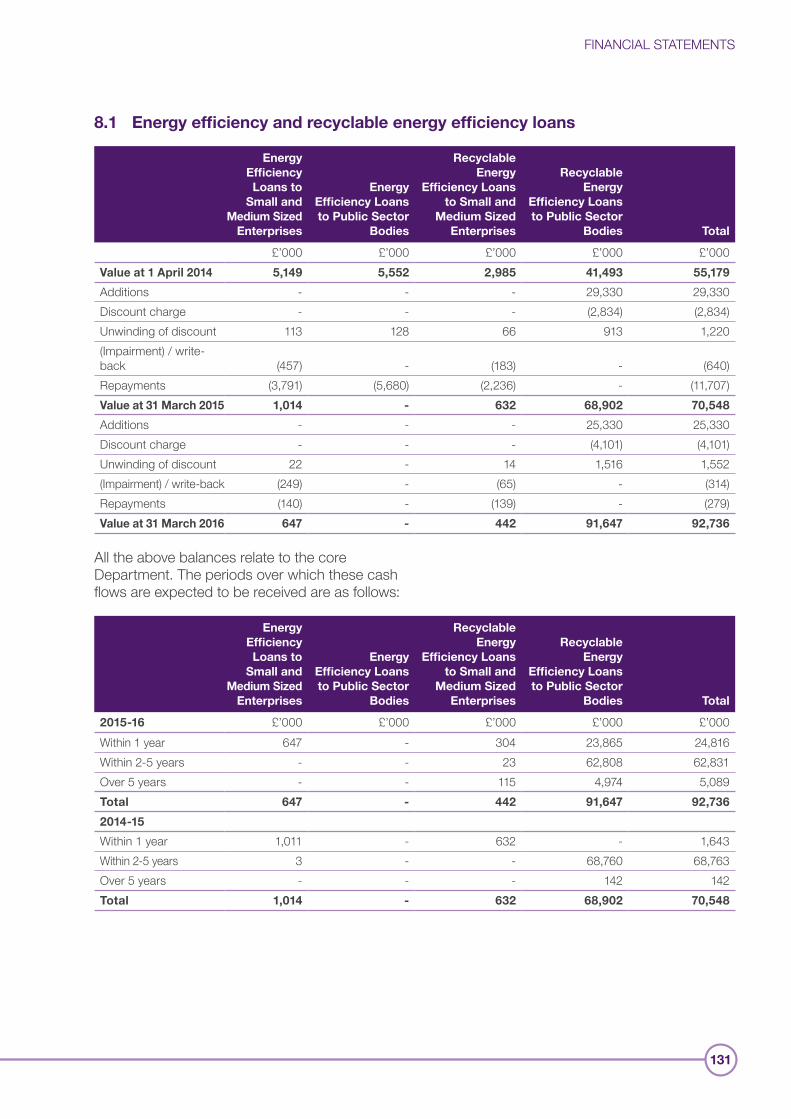
FINANCIAL STATEMENTS
131
8.1 Energy efficiency and recyclable energy efficiency loans
Energy Efficiency Loans to
Small and Medium Sized
Enterprises
Energy Efficiency Loans to Public Sector
Bodies
Recyclable Energy
Efficiency Loans to Small and
Medium Sized Enterprises
Recyclable Energy
Efficiency Loans to Public Sector
Bodies Total
£’000 £’000 £’000 £’000 £’000Value at 1 April 2014 5,149 5,552 2,985 41,493 55,179
Additions - - - 29,330 29,330 Discount charge - - - (2,834) (2,834)Unwinding of discount 113 128 66 913 1,220 (Impairment) / write-back (457) - (183) - (640)Repayments (3,791) (5,680) (2,236) - (11,707)Value at 31 March 2015 1,014 - 632 68,902 70,548
Additions - - - 25,330 25,330 Discount charge - - - (4,101) (4,101)Unwinding of discount 22 - 14 1,516 1,552 (Impairment) / write-back (249) - (65) - (314)Repayments (140) - (139) - (279)Value at 31 March 2016 647 - 442 91,647 92,736
All the above balances relate to the core Department. The periods over which these cash flows are expected to be received are as follows:
Energy Efficiency Loans to
Small and Medium Sized
Enterprises
Energy Efficiency Loans to Public Sector
Bodies
Recyclable Energy
Efficiency Loans to Small and
Medium Sized Enterprises
Recyclable Energy
Efficiency Loans to Public Sector
Bodies Total
2015-16 £’000 £’000 £’000 £’000 £’000Within 1 year 647 - 304 23,865 24,816 Within 2-5 years - - 23 62,808 62,831Over 5 years - - 115 4,974 5,089 Total 647 - 442 91,647 92,736
2014-15
Within 1 year 1,011 - 632 - 1,643 Within 2-5 years 3 - - 68,760 68,763 Over 5 years - - - 142 142 Total 1,014 - 632 68,902 70,548
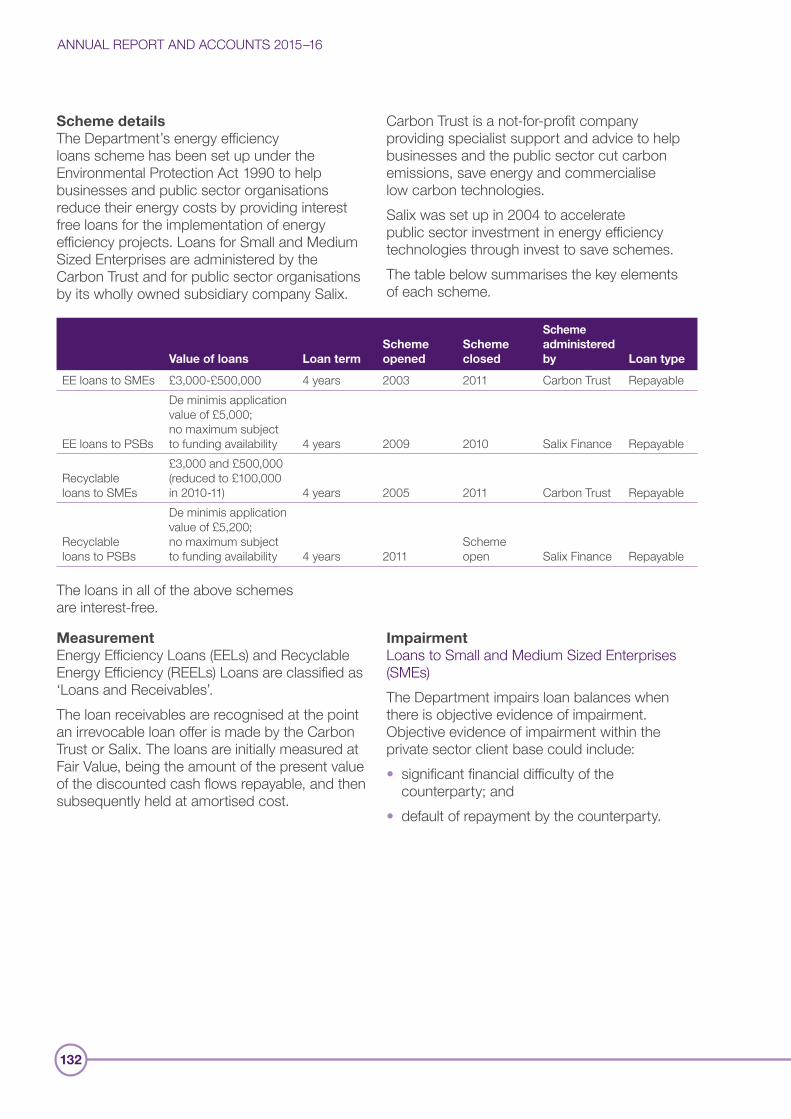
ANNUAL REPORT AND ACCOUNTS 2015–16
132
Scheme detailsThe Department’s energy efficiency loans scheme has been set up under the Environmental Protection Act 1990 to help businesses and public sector organisations reduce their energy costs by providing interest free loans for the implementation of energy efficiency projects. Loans for Small and Medium Sized Enterprises are administered by the Carbon Trust and for public sector organisations by its wholly owned subsidiary company Salix.
Carbon Trust is a not-for-profit company providing specialist support and advice to help businesses and the public sector cut carbon emissions, save energy and commercialise low carbon technologies. Salix was set up in 2004 to accelerate public sector investment in energy efficiency technologies through invest to save schemes. The table below summarises the key elements of each scheme.
Value of loans Loan termScheme opened
Scheme closed
Scheme administered by Loan type
EE loans to SMEs £3,000-£500,000 4 years 2003 2011 Carbon Trust Repayable
EE loans to PSBs
De minimis application value of £5,000; no maximum subject to funding availability 4 years 2009 2010 Salix Finance Repayable
Recyclable loans to SMEs
£3,000 and £500,000 (reduced to £100,000 in 2010-11) 4 years 2005 2011 Carbon Trust Repayable
Recyclable loans to PSBs
De minimis application value of £5,200; no maximum subject to funding availability 4 years 2011
Scheme open Salix Finance Repayable
The loans in all of the above schemes are interest-free.
MeasurementEnergy Efficiency Loans (EELs) and Recyclable Energy Efficiency (REELs) Loans are classified as ‘Loans and Receivables’.The loan receivables are recognised at the point an irrevocable loan offer is made by the Carbon Trust or Salix. The loans are initially measured at Fair Value, being the amount of the present value of the discounted cash flows repayable, and then subsequently held at amortised cost.
ImpairmentLoans to Small and Medium Sized Enterprises (SMEs)The Department impairs loan balances when there is objective evidence of impairment. Objective evidence of impairment within the private sector client base could include:• significant financial difficulty of the
counterparty; and• default of repayment by the counterparty.
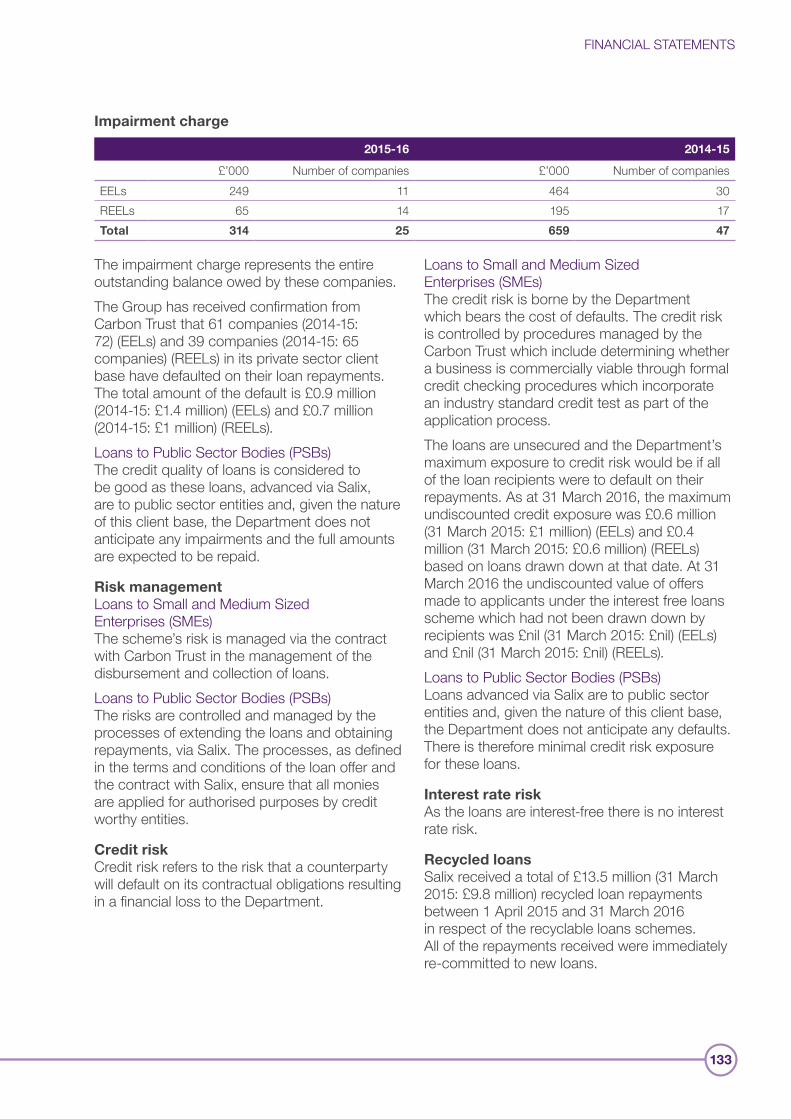
FINANCIAL STATEMENTS
133
Impairment charge
2015-16 2014-15
£’000 Number of companies £’000 Number of companiesEELs 249 11 464 30 REELs 65 14 195 17 Total 314 25 659 47
The impairment charge represents the entire outstanding balance owed by these companies.The Group has received confirmation from Carbon Trust that 61 companies (2014-15: 72) (EELs) and 39 companies (2014-15: 65 companies) (REELs) in its private sector client base have defaulted on their loan repayments. The total amount of the default is £0.9 million (2014-15: £1.4 million) (EELs) and £0.7 million (2014-15: £1 million) (REELs). Loans to Public Sector Bodies (PSBs) The credit quality of loans is considered to be good as these loans, advanced via Salix, are to public sector entities and, given the nature of this client base, the Department does not anticipate any impairments and the full amounts are expected to be repaid.
Risk managementLoans to Small and Medium Sized Enterprises (SMEs) The scheme’s risk is managed via the contract with Carbon Trust in the management of the disbursement and collection of loans.Loans to Public Sector Bodies (PSBs) The risks are controlled and managed by the processes of extending the loans and obtaining repayments, via Salix. The processes, as defined in the terms and conditions of the loan offer and the contract with Salix, ensure that all monies are applied for authorised purposes by credit worthy entities.
Credit riskCredit risk refers to the risk that a counterparty will default on its contractual obligations resulting in a financial loss to the Department.
Loans to Small and Medium Sized Enterprises (SMEs) The credit risk is borne by the Department which bears the cost of defaults. The credit risk is controlled by procedures managed by the Carbon Trust which include determining whether a business is commercially viable through formal credit checking procedures which incorporate an industry standard credit test as part of the application process. The loans are unsecured and the Department’s maximum exposure to credit risk would be if all of the loan recipients were to default on their repayments. As at 31 March 2016, the maximum undiscounted credit exposure was £0.6 million (31 March 2015: £1 million) (EELs) and £0.4 million (31 March 2015: £0.6 million) (REELs) based on loans drawn down at that date. At 31 March 2016 the undiscounted value of offers made to applicants under the interest free loans scheme which had not been drawn down by recipients was £nil (31 March 2015: £nil) (EELs) and £nil (31 March 2015: £nil) (REELs).Loans to Public Sector Bodies (PSBs) Loans advanced via Salix are to public sector entities and, given the nature of this client base, the Department does not anticipate any defaults. There is therefore minimal credit risk exposure for these loans.
Interest rate riskAs the loans are interest-free there is no interest rate risk.
Recycled loansSalix received a total of £13.5 million (31 March 2015: £9.8 million) recycled loan repayments between 1 April 2015 and 31 March 2016 in respect of the recyclable loans schemes. All of the repayments received were immediately re-committed to new loans.
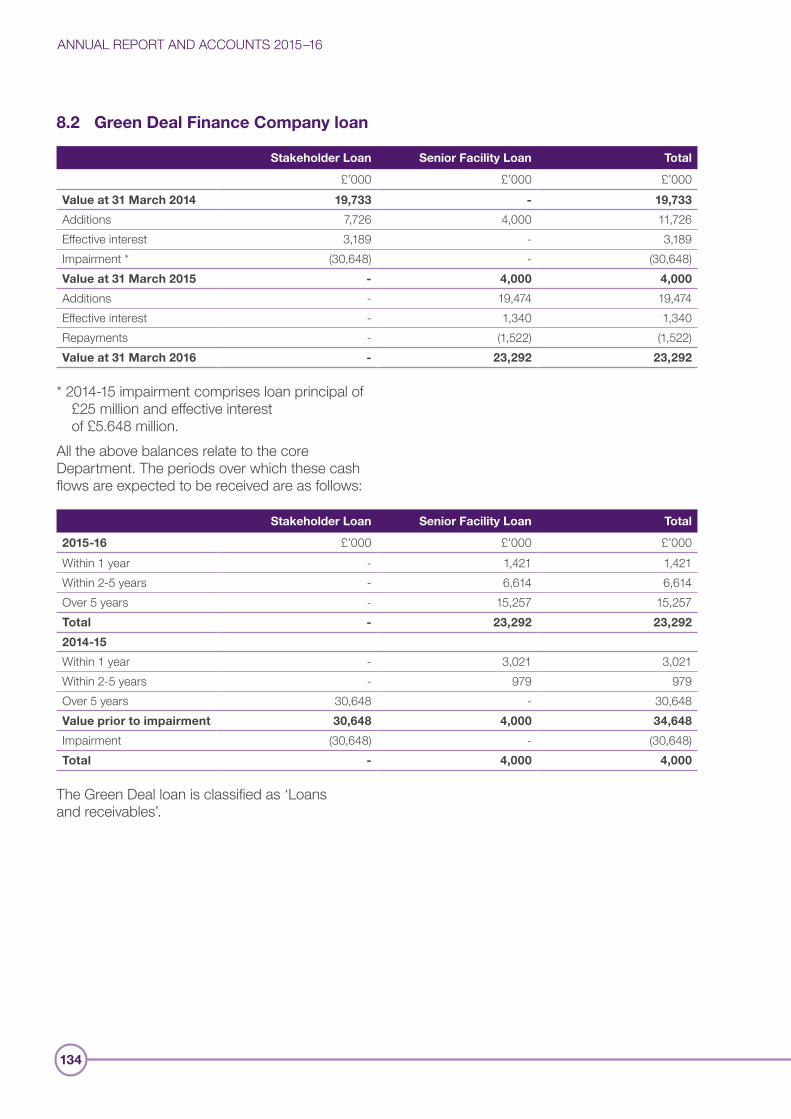
ANNUAL REPORT AND ACCOUNTS 2015–16
134
8.2 Green Deal Finance Company loan
Stakeholder Loan Senior Facility Loan Total
£’000 £’000 £’000Value at 31 March 2014 19,733 - 19,733
Additions 7,726 4,000 11,726 Effective interest 3,189 - 3,189 Impairment * (30,648) - (30,648)Value at 31 March 2015 - 4,000 4,000
Additions - 19,474 19,474 Effective interest - 1,340 1,340 Repayments - (1,522) (1,522)Value at 31 March 2016 - 23,292 23,292
* 2014-15 impairment comprises loan principal of £25 million and effective interest of £5.648 million.
All the above balances relate to the core Department. The periods over which these cash flows are expected to be received are as follows:
Stakeholder Loan Senior Facility Loan Total
2015-16 £’000 £’000 £’000Within 1 year - 1,421 1,421 Within 2-5 years - 6,614 6,614 Over 5 years - 15,257 15,257 Total - 23,292 23,292
2014-15
Within 1 year - 3,021 3,021 Within 2-5 years - 979 979 Over 5 years 30,648 - 30,648 Value prior to impairment 30,648 4,000 34,648
Impairment (30,648) - (30,648)Total - 4,000 4,000
The Green Deal loan is classified as ‘Loans and receivables’.
FINANCIAL STATEMENTS
135
Loan detailsThe stakeholder loan was made to the Green Deal Finance Company (GDFC), which offers Green Deal Finance to its customers. The Department initially invested in a development loan in the Green Deal Finance Company at an interest rate of 15.74% in September 2012. The development loan was converted to a £25 million stakeholder loan in March 2013 at an interest rate of 14%. This loan was fully impaired in 2014-15.In November 2014, the Department provided a further facility of up to £34 million of additional funding to GDFC, in the form of a senior facility loan. This facility expired at the end of December 2015, after which no further drawdowns were possible. At 31 March 2016 £23.47 million had been drawn down. Interest of £1.34 million at a rate of 5.7% (2014-15: £3.19 million) was accrued from this loan.
MeasurementThe loan receivables are recognised at the point the loan offer is made by the Department. The loans are initially measured at the Fair Value which is the transactional value of the amount of the loan advanced.
ImpairmentThe Department assesses at the end of each reporting period whether there is objective evidence that loan balances are impaired. Objective evidence of impairment within the private sector client base could include:• significant financial difficulty of the
counterparty; and• default of repayment by the counterparty. In assessing whether there was a need to impair the loan, the relevant factors in IAS 39: Financial Instruments: Recognition and Measurement were considered. This impairment review is an accounting exercise, undertaken by the Department, to ensure that the carrying value of the asset is not materially misstated. It does not impact on the amount which GDFC owes the Department since legal claim to the loan has not been waived.
For the senior loan, the outcome of the impairment review provided assurance that the Department is the only secured creditor on the loan book, that the model supporting the GDFC repayment schedule has been validated, and that the value of the loan book is in excess of the senior loan.For the stakeholder loan, no further impairment was required in 2015-16 as the £25 million loan and the effective interest to 31 March 2015 of £5.65 million was fully impaired at 31 March 2015.
Credit riskCredit risk refers to the risk that the counterparty will default on its contractual obligations resulting in a financial loss to the Department.Through the Department’s regular contact with GDFC and the reviews of operational performance, where the credit risk is high, an appropriate impairment is recognised in the financial statements.At 31 March 2015, the stakeholder loan was impaired in full and therefore the maximum undiscounted credit exposure was £nil. The senior facility loan of £23.3 million is secured against the loan book (31 March 2015: £4 million).
Interest rate riskAs the interest rate is fixed for the duration of the loan there is no interest rate risk.

ANNUAL REPORT AND ACCOUNTS 2015–16
136
8.3 Investments in subsidiariesThe carrying value of £228,718k in the Statement of Financial Position relates to subsidiaries of the NDA; these are listed in the table below along
with two subsidiaries of the core Department. These entities are all outside the Departmental Group boundary and not consolidated into these accounts. Ordinary shares are valued at historical cost as required by the FReM.
NameCountry of incorporation Nature of business Holding entity
Proportion of ordinary shares held
Nuclear Liabilities Fund Limited
UK Fund nuclear decommissioning
Core 100%
National Nuclear Laboratory Holdings Limited
UK Technology services Core 100%
Direct Rail Services Limited UK Rail transport services within the UK
NDA 100%
International Nuclear Services France SAS (i)
France Transportation of spent fuel NDA 100%
International Nuclear Services Japan KK (i)
Japan Transportation of spent fuel NDA 100%
International Nuclear Services Limited
UK Contract management and the transportation of spent fuel, reprocessing products and waste
NDA 100%
NDA Properties Limited UK Property management NDA 100%Pacific Nuclear Transport Limited (i)
UK Transportation of spent fuel, reprocessing products and waste
NDA 68.75%
Rutherford Indemnity Limited
Guernsey Nuclear insurance NDA 100%
(i) Ownership through International Nuclear Services Limited.The liquidation of INS Rokkasho KK, in which NDA had a 66% shareholding as at 31 March 2015, was completed on 21 August 2015.The Department owns two shares of £1 each in NNL Holdings Limited which has been set up to hold all of the shares in National Nuclear Laboratory Limited as detailed below.
The Department is required to disclose, for each investment which represents an interest in a subsidiary undertaking, an associate or joint venture which falls outside the departmental consolidation boundary, the Department’s share of the net assets and results of those bodies. This information is summarised below.
Nuclear Liabilities Fund Limited
£m
National Nuclear Laboratory Holdings Limited
£m
2015-16 2014-15 2015-16 2014-15Assets 9,200.0 9,004.1 140.8 127.2 Liabilities (9,200.0) (9,004.1) (76.1) (71.4)Net assets - - 64.7 55.8 Turnover (86.0) 69.4 101.3 99.6 Surplus / profit for the year 195.9 127.7 8.9 5.8
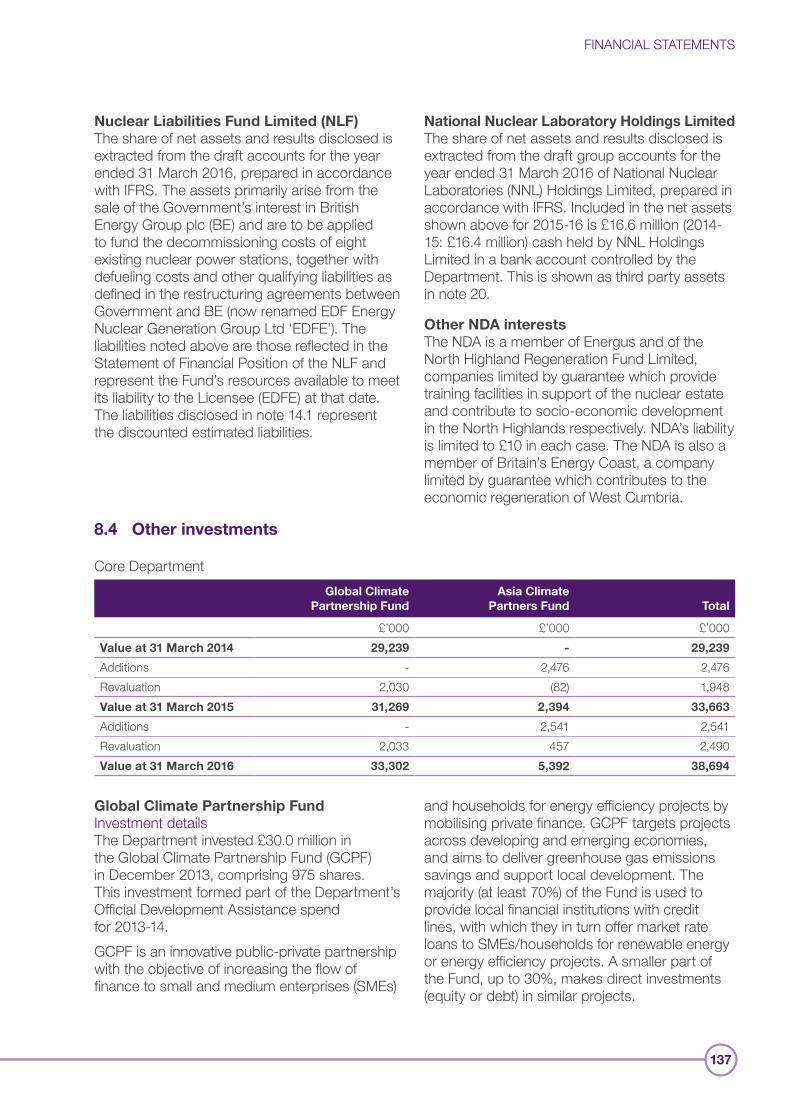
FINANCIAL STATEMENTS
137
Nuclear Liabilities Fund Limited (NLF) The share of net assets and results disclosed is extracted from the draft accounts for the year ended 31 March 2016, prepared in accordance with IFRS. The assets primarily arise from the sale of the Government’s interest in British Energy Group plc (BE) and are to be applied to fund the decommissioning costs of eight existing nuclear power stations, together with defueling costs and other qualifying liabilities as defined in the restructuring agreements between Government and BE (now renamed EDF Energy Nuclear Generation Group Ltd ‘EDFE’). The liabilities noted above are those reflected in the Statement of Financial Position of the NLF and represent the Fund’s resources available to meet its liability to the Licensee (EDFE) at that date. The liabilities disclosed in note 14.1 represent the discounted estimated liabilities.
National Nuclear Laboratory Holdings Limited The share of net assets and results disclosed is extracted from the draft group accounts for the year ended 31 March 2016 of National Nuclear Laboratories (NNL) Holdings Limited, prepared in accordance with IFRS. Included in the net assets shown above for 2015-16 is £16.6 million (2014-15: £16.4 million) cash held by NNL Holdings Limited in a bank account controlled by the Department. This is shown as third party assets in note 20.
Other NDA interestsThe NDA is a member of Energus and of the North Highland Regeneration Fund Limited, companies limited by guarantee which provide training facilities in support of the nuclear estate and contribute to socio-economic development in the North Highlands respectively. NDA’s liability is limited to £10 in each case. The NDA is also a member of Britain’s Energy Coast, a company limited by guarantee which contributes to the economic regeneration of West Cumbria.
8.4 Other investments
Core DepartmentGlobal Climate
Partnership FundAsia Climate
Partners Fund Total
£’000 £’000 £’000Value at 31 March 2014 29,239 - 29,239
Additions - 2,476 2,476 Revaluation 2,030 (82) 1,948 Value at 31 March 2015 31,269 2,394 33,663
Additions - 2,541 2,541 Revaluation 2,033 457 2,490 Value at 31 March 2016 33,302 5,392 38,694
Global Climate Partnership FundInvestment details The Department invested £30.0 million in the Global Climate Partnership Fund (GCPF) in December 2013, comprising 975 shares. This investment formed part of the Department’s Official Development Assistance spend for 2013-14.GCPF is an innovative public-private partnership with the objective of increasing the flow of finance to small and medium enterprises (SMEs)
and households for energy efficiency projects by mobilising private finance. GCPF targets projects across developing and emerging economies, and aims to deliver greenhouse gas emissions savings and support local development. The majority (at least 70%) of the Fund is used to provide local financial institutions with credit lines, with which they in turn offer market rate loans to SMEs/households for renewable energy or energy efficiency projects. A smaller part of the Fund, up to 30%, makes direct investments (equity or debt) in similar projects.
ANNUAL REPORT AND ACCOUNTS 2015–16
138
The Fund is structured into 3 tranches of shares, A, B and C. The Department’s investment is in the form of C shares. The Department and other donor C-shares act as a risk cushion for A and B shares. All shares provide annual returns and the process for paying returns from the revenues accrued follows a waterfall principle: A-share returns are paid first, then B, then C. Any losses or loan defaults are borne first by the C shares, then B and finally A shares. The Department’s investment in C shares gives it the right to a return, after claims by higher priority shares and transactions, up to a maximum of the lower of 6 month LIBOR or 2.2%. The returns are retained within the Fund in order to deliver additional results and better value for money. The Fund has no end date and the Department’s investment is for the long-term. Measurement The GCPF investment is classified as an ‘Available for Sale’ asset.Initial recognition was at Fair Value plus transaction costs. Subsequently the investment is carried at Fair Value. Gains and losses in Fair Value are recognised directly in Taxpayers’ Equity (Financial Asset Reserve), in line with the IAS 39 treatment of gains and losses on revaluation. Under IAS 21, any gains and losses arising from foreign exchange translation when determining Fair Value are recognised in the Financial Asset Reserve, consistent with the treatment of Fair Value gains and losses. As a non-monetary item, the investment does not need to be retranslated into sterling as at the reporting date.The Department’s investment in GCPF is denominated in US dollars. The initial recognition of the investment is at Fair Value which was the sterling equivalent of the cost of the shares bought. The C shares are not tradable and therefore there is no published index for their valuation.
Valuation technique The GCPF issues C shares in tranches. The Department invested in the fourth tranche issued by GCPF.The value per share of each C class tranche is determined by dividing the value of the total assets less liabilities allocable to the C class tranche by the number of shares of the C class tranche.The valuation of assets, liabilities, income and expenses attributed to the Fund are established using valuation and accounting principles in accordance with IFRS.Revaluation Revaluation represents the gain or loss on the Fund (where the loss is not as a result of an impairment). This includes exchange losses on conversion of dollars to sterling at the Fair Value measurement date compared to the initial recognition exchange rate.An upwards revaluation of £2.03 million was recognised in 2015-16 (2014-15: upwards revaluation of £2.03 million); the majority of which was due to an exchange gain as the value of the dollar strengthened against sterling between the date the investment was made and the Fair Value measurement date. Impairment Impairment of the Fund could be as a result of a fall in valuation of the C shares (in the case of an external event) compared to the Fair Value of the C shares at initial recognition. There was no impairment for 2015-16 (2014-15: nil), as the value of each C share increased since initial recognition and Fair Value measurement.Risk The C shares investment takes a first loss position; the risk to the investment is considered medium. The Department’s exposure is capped at the amount invested (2015-16: £33.3 million, 2014-15: £31.27 million) and experience of GCPF over the last 5 years and a similarly structured Fund over 8 years has shown that the first loss position has never had to be called upon. The GCPF has made a profit in the last 5 years of its operation.
FINANCIAL STATEMENTS
139
Asia Climate Partners FundInvestment details The Department invested £2.4 million in the Asia Climate Partners Fund (ACPF) in November 2014. A further investment of £2.5 million was made in June 2015. These investments formed part of the Department’s Official Development Assistance spend for 2014-15 and 2015-16.ACPF is an innovative public-private partnership aimed at bringing in new forms of private finance (e.g. pension and sovereign wealth funds) into low carbon investments. ACPF will invest in growth and mid-market opportunities across emerging Asia exclusively in clean energy and environment services on fully commercial terms.Returns due to the Department will depend on the performance of the Fund which will retain them during the term of the investment in order to deliver additional results and better value for money. The Department expects a return of 15% over the term of the investment (10 years with a possible extension of 2 years).Measurement The ACPF investment is classified as an ‘Available for Sale’ asset.The Department’s investment is denominated in US dollars. The investment is an equity investment in the partnership and represents the cash drawn down by the Trustee for payment into the partnership’s bank account for investing in equity instruments. The initial recognition of the investment is at Fair Value which was the sterling equivalent of cash paid into the partnership’s bank account. Subsequently the investment is carried at Fair Value. Gains and losses in Fair Value are recognised directly in profit and loss/Taxpayers’ Equity (Financial Asset Reserve) depending on the portion of the investment which is represented by a monetary asset and that portion of the investment which is a non-monetary asset. Under IAS 21, any gains and losses arising from foreign exchange translation when determining Fair Value of non-monetary assets are recognised in the Financial Asset Reserve, and any gains and losses on a monetary asset are taken to profit and loss.
Valuation technique The investment is represented by the sterling value of the dollars transferred to the partnership’s bank account using the exchange rate ruling at the reporting date. Where the cash has been used to make further investments in a fund or directly into another entity, the valuation is based on the latest financial statements of the fund or entity showing the value of the Department’s portion of the investment. Where possible the Department uses audited statements to determine the value of its investment.As at 31 March 2016, the value of the investment in the ACPF is represented by the sterling equivalent of the dollars in the partnership’s bank account.As at the reporting date the cash had not been invested in a fund or another entity. Exchange differences have been taken to the Statement of Comprehensive Net Expenditure.Revaluation Revaluation represents the gain or loss on the ACPF (where the loss is not as a result of an impairment). This includes exchange gains or losses on conversion of dollars to sterling at the reporting date for cash not yet invested in equities or other entities. Impairment Impairment of the ACPF is recognised in the Statement of Comprehensive Expenditure if there is objective evidence that the Fund assets are impaired. As no investments had been made at the reporting date there are no impairments to report.Risk The investment is considered to be of medium risk recognising that while the potential opportunities for return remain high, they are dependent on the underlying projects of which selection is ongoing. The projects are in developing countries and the overall investment is also exposed to dollar-sterling currency movements. The Department’s current risk exposure in ACPF is the carrying value of the investment at the reporting date which is £5.4 million (2014-15: £2.4 million) but in addition there is further potential exposure arising from the undrawn amount from an irrevocable promissory note issued by the Department. The undrawn amount is £28.2 million (2014-15: £30.7 million).
ANNUAL REPORT AND ACCOUNTS 2015–16
140
Membership fundThe Secretary of State for Energy & Climate Change has a share in the membership fund of Carbon Trust. The members’ fund at 31 March 2016 was £nil (31 March 2015: £nil).
Special sharesThe Secretary of State holds one Special Share in each of the entities listed below. The list is a summary and does not purport to be a comprehensive record of the terms of each respective shareholding.In accordance with the FReM these shares are required to be held off balance sheet. Further details can be obtained from the annual report and financial statements of each body.
Body in which the share is held and type and value of share Terms of shareholding
EDF Energy Nuclear Generation Group Limited (formerly British Energy Group plc) £1 Special Share
• British Energy Group plc Special Share created on 13 January 2005 and held jointly by the Secretary of State for Energy & Climate Change and the Secretary of State for Scotland.
• The consent of the Special Shareholder, which can only be refused on grounds of national security (except in relation to an amendment to the company’s Articles of Association), is required in respect of:
– various amendments to the company’s Articles of Association;
– any purchase of more than 15% of the company’s shares;
– the issue of shares carrying voting rights of 15% or more in the company;
– variations to the voting rights attaching to the company’s shares; and
– the giving of consent in respect of the issue of shares by, the sale of shares in or amendments to the Articles of Association of various subsidiaries in certain cases.
British Energy Limited (formerly British Energy Holdings plc) £1 Special Share
• British Energy Holdings plc Special Share created on 13 January 2005 and held jointly by the Secretary of State for Energy & Climate Change and the Secretary of State for Scotland.
• The consent of the Special Shareholder, which can only be refused on grounds of national security (except in relation to an amendment to the company’s Articles of Association), is required in respect of:
– various amendments to the company’s Articles of Association; and
– the giving of consent in respect of the issue of shares by, the sale of shares in or amendments to the Articles of Association of various subsidiaries in certain cases.
EDF Energy Nuclear Generation Limited (formerly British Energy Generation Ltd) £1 Special Share
• British Energy Generation Ltd Special Share created in 1996 is held solely by the Secretary of State for Energy & Climate Change.
• The consent of the Special Shareholder, which can only be refused on grounds of national security (except in relation to an amendment to the company’s Articles of Association), is required in respect of:
– various amendments to the company’s Articles of Association;
– the disposal of any of the nuclear power stations owned by the company; and
– prior to the permanent closure of such a station, the disposal of any asset which is necessary for the station to generate electricity.
FINANCIAL STATEMENTS
141
Body in which the share is held and type and value of share Terms of shareholding
British Energy Ltd (formerly British Energy plc) £1 Special Share
• British Energy plc Special Share created in 1996 is held solely by the Secretary of State for Energy and Climate Change.
• The consent of the Special Shareholder, which can only be refused on grounds of national security (except in relation to an amendment to the company’s Articles of Association), is required in respect of:
– various amendments to the company’s Articles of Association; and
– the giving of consent in respect of the issue of shares by, the sale of shares in or amendments to the Articles of Association of various subsidiaries in certain cases.
• The company has no significant assets or liabilities as a result of the restructuring scheme, which came into effect on 14 January 2005.
Nuclear Liabilities Fund Ltd
£1 Special Rights Redeemable Preference Share
• Created in 1996.
• The Secretary of State for Energy and Climate Change has a Special ‘A’ Share (there is also a ‘B’ Share held by British Energy).
• The consent of the Special Shareholder is required for any of the following:
– to change any of the provisions in the Memorandum of Association or Articles of Association;
– to alter the share capital or the rights attached thereto;
– the company to create or issue share options;
– the ‘B’ Special Shareholder or any of the Ordinary shareholders to dispose or transfer any of their rights in their shares;
– the company to pass a members voluntary winding-up resolution;
– the company to recommend, declare or pay a dividend;
– the company to create, issue or commit to give any loan capital;
– the company to issue a debenture; or
– the company to change its accounting reference date
8.5 Recoverable contract costsThe Group has commercial agreements in place under which some or all of the expenditure required to settle nuclear decommissioning provisions will be recovered from third parties.
Departmental Group
31 March 2016 31 March 2015
Recoverable contract costs relating to nuclear decommissioning provisions £’000 £’000Gross recoverable contract costs 7,220,778 5,660,730 Less applicable payments received on account (3,576,369) (3,503,250)Less associated contract loss provisions (845,866) (519,721)Total 2,798,543 1,637,759
The above balances relate to the NDA.
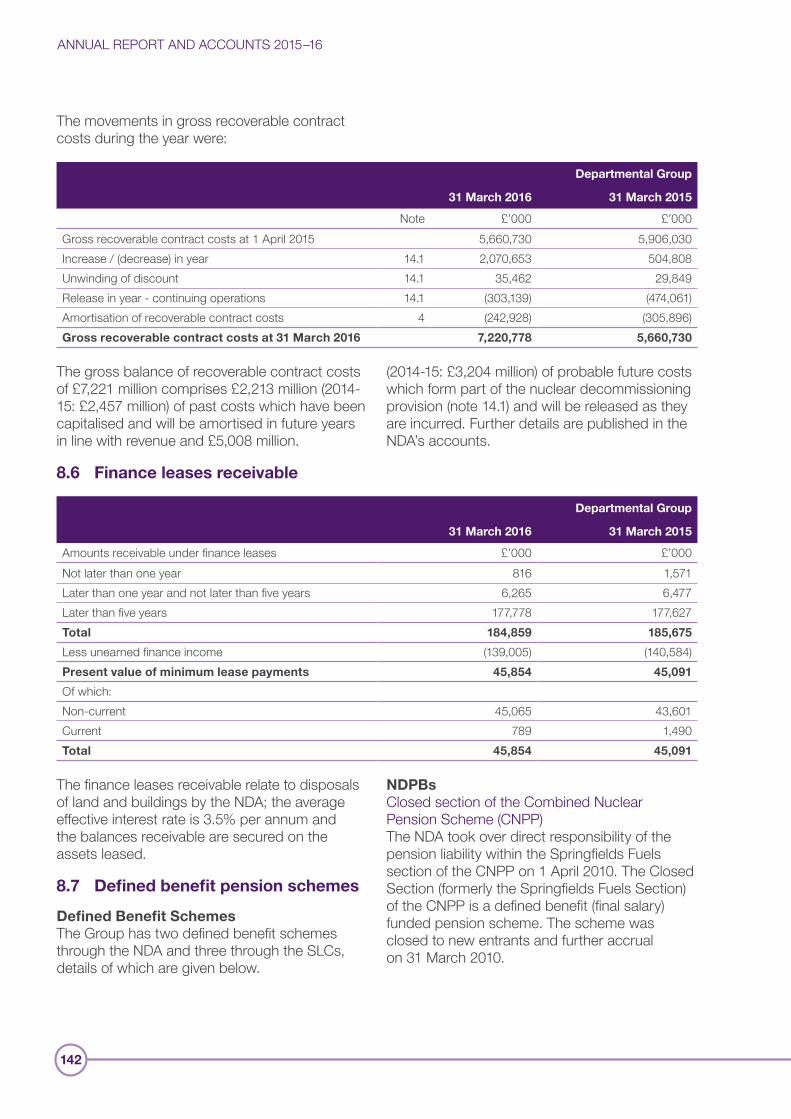
ANNUAL REPORT AND ACCOUNTS 2015–16
142
The movements in gross recoverable contract costs during the year were:
Departmental Group
31 March 2016 31 March 2015
Note £’000 £’000Gross recoverable contract costs at 1 April 2015 5,660,730 5,906,030 Increase / (decrease) in year 14.1 2,070,653 504,808 Unwinding of discount 14.1 35,462 29,849 Release in year - continuing operations 14.1 (303,139) (474,061)Amortisation of recoverable contract costs 4 (242,928) (305,896)Gross recoverable contract costs at 31 March 2016 7,220,778 5,660,730
The gross balance of recoverable contract costs of £7,221 million comprises £2,213 million (2014-15: £2,457 million) of past costs which have been capitalised and will be amortised in future years in line with revenue and £5,008 million.
(2014-15: £3,204 million) of probable future costs which form part of the nuclear decommissioning provision (note 14.1) and will be released as they are incurred. Further details are published in the NDA’s accounts.
8.6 Finance leases receivable
Departmental Group
31 March 2016 31 March 2015
Amounts receivable under finance leases £’000 £’000Not later than one year 816 1,571 Later than one year and not later than five years 6,265 6,477 Later than five years 177,778 177,627 Total 184,859 185,675
Less unearned finance income (139,005) (140,584)Present value of minimum lease payments 45,854 45,091
Of which:Non-current 45,065 43,601 Current 789 1,490 Total 45,854 45,091
The finance leases receivable relate to disposals of land and buildings by the NDA; the average effective interest rate is 3.5% per annum and the balances receivable are secured on the assets leased.
8.7 Defined benefit pension schemes
Defined Benefit SchemesThe Group has two defined benefit schemes through the NDA and three through the SLCs, details of which are given below.
NDPBsClosed section of the Combined Nuclear Pension Scheme (CNPP) The NDA took over direct responsibility of the pension liability within the Springfields Fuels section of the CNPP on 1 April 2010. The Closed Section (formerly the Springfields Fuels Section) of the CNPP is a defined benefit (final salary) funded pension scheme. The scheme was closed to new entrants and further accrual on 31 March 2010.
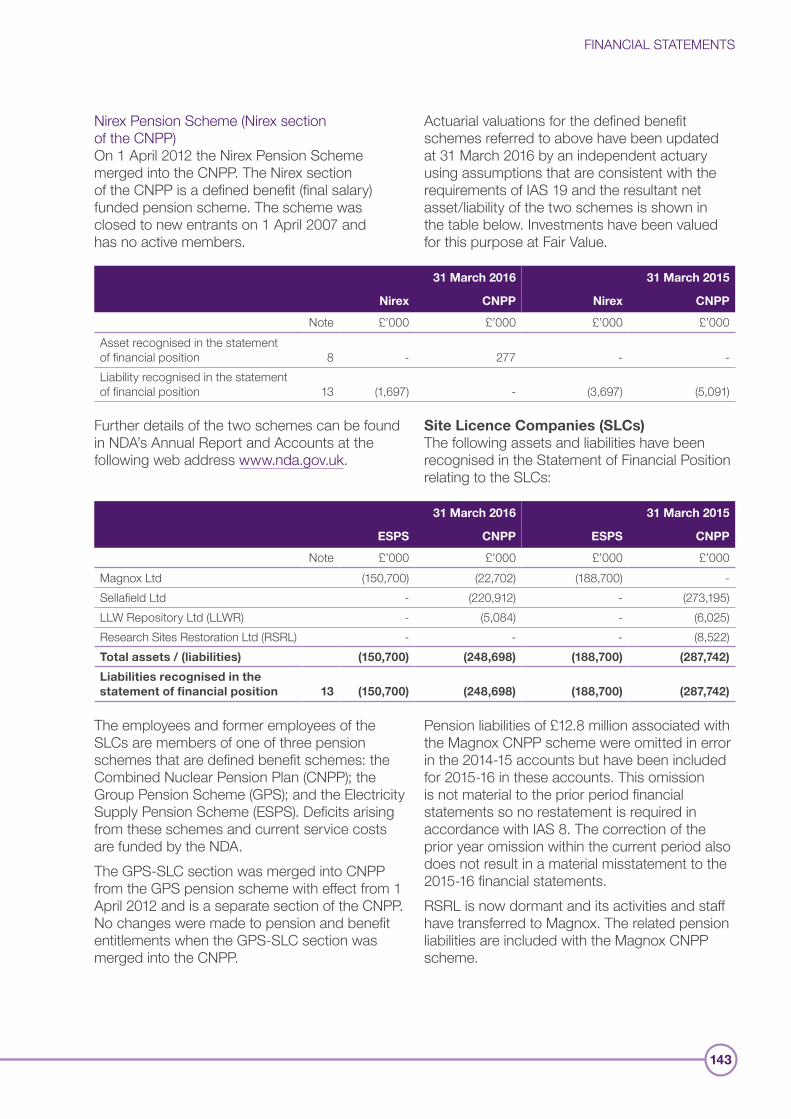
FINANCIAL STATEMENTS
143
Nirex Pension Scheme (Nirex section of the CNPP) On 1 April 2012 the Nirex Pension Scheme merged into the CNPP. The Nirex section of the CNPP is a defined benefit (final salary) funded pension scheme. The scheme was closed to new entrants on 1 April 2007 and has no active members.
Actuarial valuations for the defined benefit schemes referred to above have been updated at 31 March 2016 by an independent actuary using assumptions that are consistent with the requirements of IAS 19 and the resultant net asset/liability of the two schemes is shown in the table below. Investments have been valued for this purpose at Fair Value.
31 March 2016 31 March 2015
Nirex CNPP Nirex CNPP
Note £’000 £’000 £’000 £’000Asset recognised in the statement of financial position 8 - 277 - -Liability recognised in the statement of financial position 13 (1,697) - (3,697) (5,091)
Further details of the two schemes can be found in NDA’s Annual Report and Accounts at the following web address www.nda.gov.uk.
Site Licence Companies (SLCs)The following assets and liabilities have been recognised in the Statement of Financial Position relating to the SLCs:
31 March 2016 31 March 2015
ESPS CNPP ESPS CNPP
Note £’000 £’000 £’000 £’000Magnox Ltd (150,700) (22,702) (188,700) -Sellafield Ltd - (220,912) - (273,195)LLW Repository Ltd (LLWR) - (5,084) - (6,025)Research Sites Restoration Ltd (RSRL) - - - (8,522)Total assets / (liabilities) (150,700) (248,698) (188,700) (287,742)
Liabilities recognised in the statement of financial position 13 (150,700) (248,698) (188,700) (287,742)
The employees and former employees of the SLCs are members of one of three pension schemes that are defined benefit schemes: the Combined Nuclear Pension Plan (CNPP); the Group Pension Scheme (GPS); and the Electricity Supply Pension Scheme (ESPS). Deficits arising from these schemes and current service costs are funded by the NDA. The GPS-SLC section was merged into CNPP from the GPS pension scheme with effect from 1 April 2012 and is a separate section of the CNPP. No changes were made to pension and benefit entitlements when the GPS-SLC section was merged into the CNPP.
Pension liabilities of £12.8 million associated with the Magnox CNPP scheme were omitted in error in the 2014-15 accounts but have been included for 2015-16 in these accounts. This omission is not material to the prior period financial statements so no restatement is required in accordance with IAS 8. The correction of the prior year omission within the current period also does not result in a material misstatement to the 2015-16 financial statements.RSRL is now dormant and its activities and staff have transferred to Magnox. The related pension liabilities are included with the Magnox CNPP scheme.
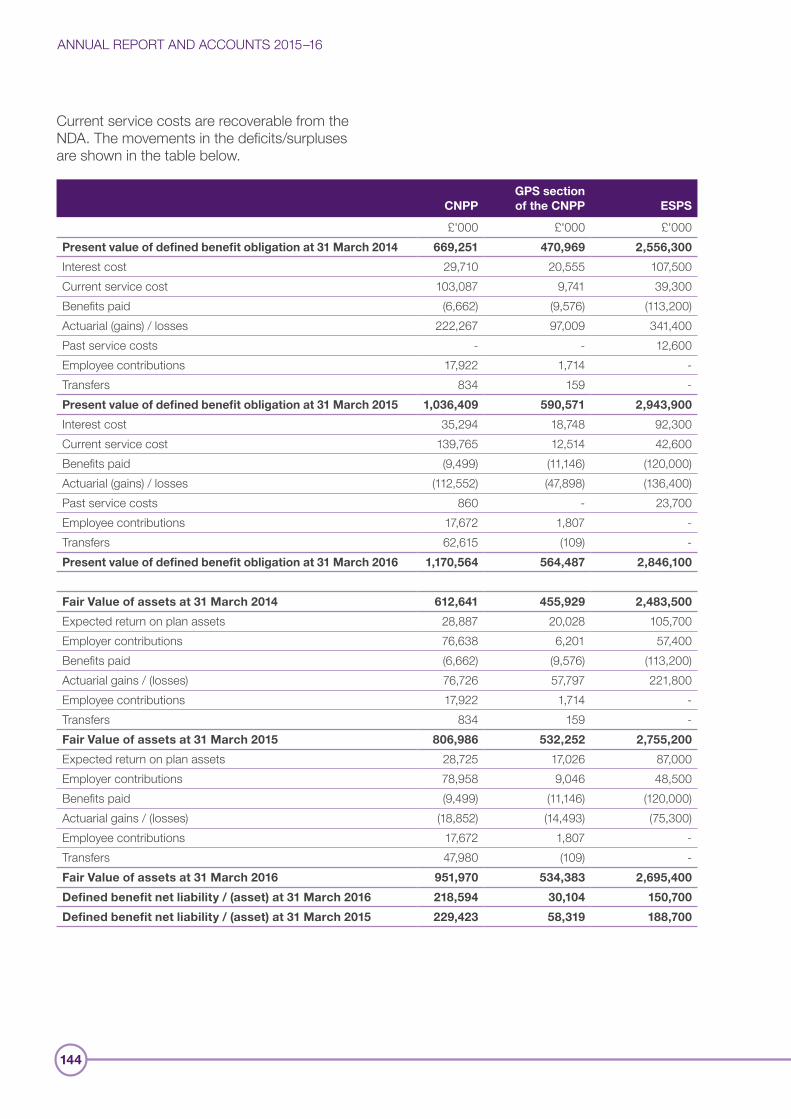
ANNUAL REPORT AND ACCOUNTS 2015–16
144
Current service costs are recoverable from the NDA. The movements in the deficits/surpluses are shown in the table below.
CNPPGPS section of the CNPP ESPS
£'000 £'000 £'000Present value of defined benefit obligation at 31 March 2014 669,251 470,969 2,556,300
Interest cost 29,710 20,555 107,500 Current service cost 103,087 9,741 39,300 Benefits paid (6,662) (9,576) (113,200)Actuarial (gains) / losses 222,267 97,009 341,400 Past service costs - - 12,600 Employee contributions 17,922 1,714 -Transfers 834 159 -Present value of defined benefit obligation at 31 March 2015 1,036,409 590,571 2,943,900
Interest cost 35,294 18,748 92,300 Current service cost 139,765 12,514 42,600 Benefits paid (9,499) (11,146) (120,000)Actuarial (gains) / losses (112,552) (47,898) (136,400)Past service costs 860 - 23,700 Employee contributions 17,672 1,807 -Transfers 62,615 (109) -Present value of defined benefit obligation at 31 March 2016 1,170,564 564,487 2,846,100
Fair Value of assets at 31 March 2014 612,641 455,929 2,483,500
Expected return on plan assets 28,887 20,028 105,700 Employer contributions 76,638 6,201 57,400 Benefits paid (6,662) (9,576) (113,200)Actuarial gains / (losses) 76,726 57,797 221,800 Employee contributions 17,922 1,714 -Transfers 834 159 -Fair Value of assets at 31 March 2015 806,986 532,252 2,755,200
Expected return on plan assets 28,725 17,026 87,000 Employer contributions 78,958 9,046 48,500 Benefits paid (9,499) (11,146) (120,000)Actuarial gains / (losses) (18,852) (14,493) (75,300)Employee contributions 17,672 1,807 -Transfers 47,980 (109) -Fair Value of assets at 31 March 2016 951,970 534,383 2,695,400
Defined benefit net liability / (asset) at 31 March 2016 218,594 30,104 150,700
Defined benefit net liability / (asset) at 31 March 2015 229,423 58,319 188,700
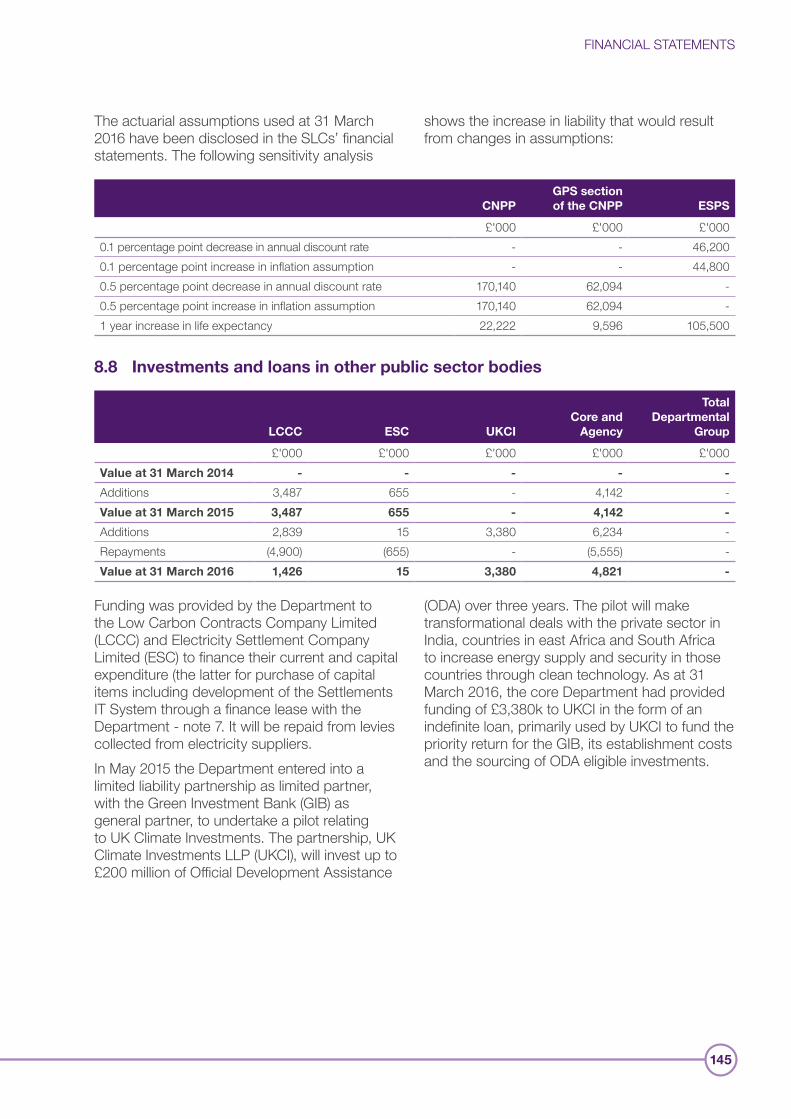
FINANCIAL STATEMENTS
145
The actuarial assumptions used at 31 March 2016 have been disclosed in the SLCs’ financial statements. The following sensitivity analysis
shows the increase in liability that would result from changes in assumptions:
CNPPGPS section of the CNPP ESPS
£'000 £'000 £'0000.1 percentage point decrease in annual discount rate - - 46,200 0.1 percentage point increase in inflation assumption - - 44,800 0.5 percentage point decrease in annual discount rate 170,140 62,094 -0.5 percentage point increase in inflation assumption 170,140 62,094 -1 year increase in life expectancy 22,222 9,596 105,500
8.8 Investments and loans in other public sector bodies
LCCC ESC UKCICore and
Agency
Total Departmental
Group
£'000 £'000 £'000 £'000 £'000Value at 31 March 2014 - - - - -
Additions 3,487 655 - 4,142 -Value at 31 March 2015 3,487 655 - 4,142 -
Additions 2,839 15 3,380 6,234 -Repayments (4,900) (655) - (5,555) -Value at 31 March 2016 1,426 15 3,380 4,821 -
Funding was provided by the Department to the Low Carbon Contracts Company Limited (LCCC) and Electricity Settlement Company Limited (ESC) to finance their current and capital expenditure (the latter for purchase of capital items including development of the Settlements IT System through a finance lease with the Department - note 7. It will be repaid from levies collected from electricity suppliers. In May 2015 the Department entered into a limited liability partnership as limited partner, with the Green Investment Bank (GIB) as general partner, to undertake a pilot relating to UK Climate Investments. The partnership, UK Climate Investments LLP (UKCI), will invest up to £200 million of Official Development Assistance
(ODA) over three years. The pilot will make transformational deals with the private sector in India, countries in east Africa and South Africa to increase energy supply and security in those countries through clean technology. As at 31 March 2016, the core Department had provided funding of £3,380k to UKCI in the form of an indefinite loan, primarily used by UKCI to fund the priority return for the GIB, its establishment costs and the sourcing of ODA eligible investments.
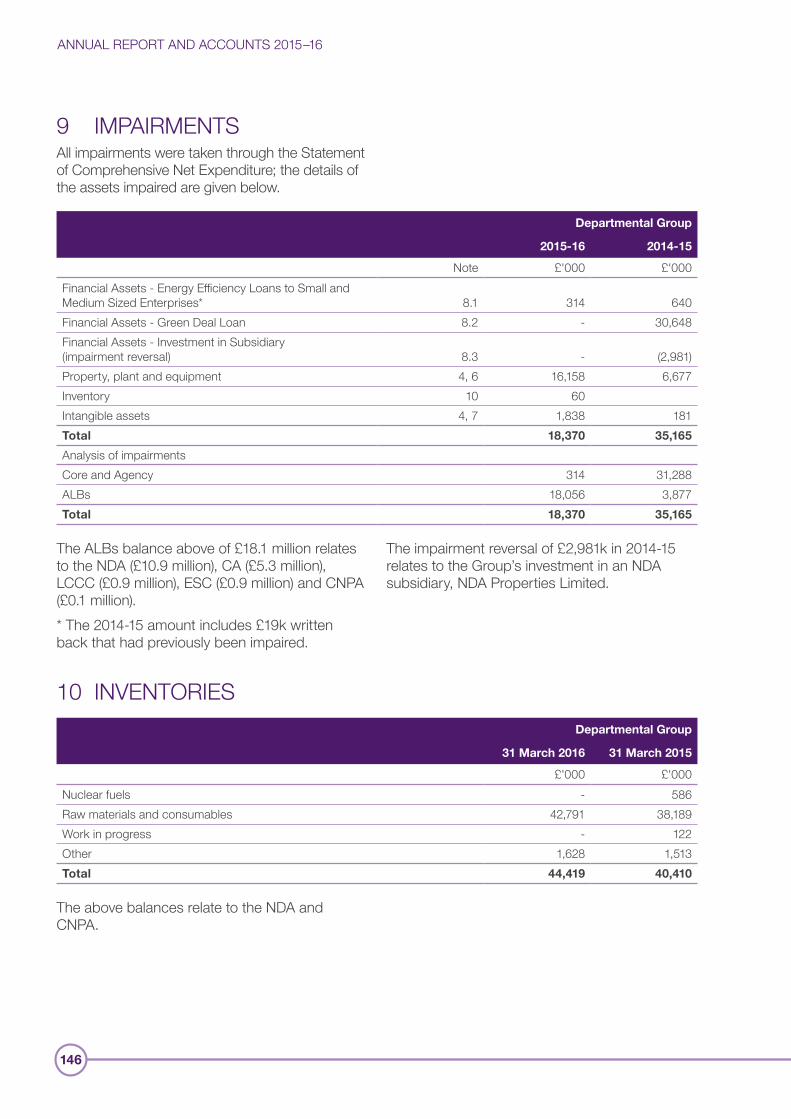
ANNUAL REPORT AND ACCOUNTS 2015–16
146
9 IMPAIRMENTSAll impairments were taken through the Statement of Comprehensive Net Expenditure; the details of the assets impaired are given below.
Departmental Group
2015-16 2014-15
Note £'000 £'000Financial Assets - Energy Efficiency Loans to Small and Medium Sized Enterprises* 8.1 314 640 Financial Assets - Green Deal Loan 8.2 - 30,648 Financial Assets - Investment in Subsidiary (impairment reversal) 8.3 - (2,981)Property, plant and equipment 4, 6 16,158 6,677 Inventory 10 60 Intangible assets 4, 7 1,838 181 Total 18,370 35,165
Analysis of impairmentsCore and Agency 314 31,288 ALBs 18,056 3,877 Total 18,370 35,165
The ALBs balance above of £18.1 million relates to the NDA (£10.9 million), CA (£5.3 million), LCCC (£0.9 million), ESC (£0.9 million) and CNPA (£0.1 million).* The 2014-15 amount includes £19k written back that had previously been impaired.
The impairment reversal of £2,981k in 2014-15 relates to the Group’s investment in an NDA subsidiary, NDA Properties Limited.
10 INVENTORIESDepartmental Group
31 March 2016 31 March 2015
£'000 £'000Nuclear fuels - 586 Raw materials and consumables 42,791 38,189 Work in progress - 122 Other 1,628 1,513 Total 44,419 40,410
The above balances relate to the NDA and CNPA.
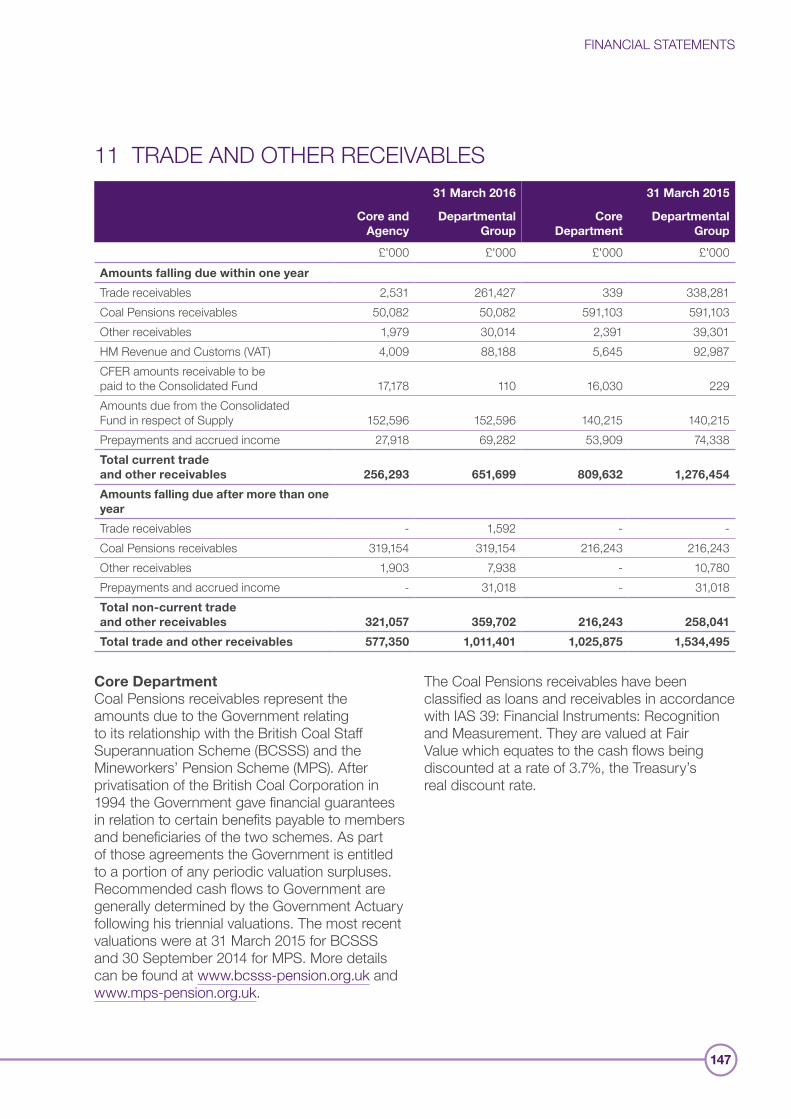
FINANCIAL STATEMENTS
147
11 TRADE AND OTHER RECEIVABLES31 March 2016 31 March 2015
Core and Agency
Departmental Group
Core Department
Departmental Group
£'000 £'000 £'000 £'000Amounts falling due within one year
Trade receivables 2,531 261,427 339 338,281 Coal Pensions receivables 50,082 50,082 591,103 591,103 Other receivables 1,979 30,014 2,391 39,301HM Revenue and Customs (VAT) 4,009 88,188 5,645 92,987 CFER amounts receivable to be paid to the Consolidated Fund 17,178 110 16,030 229Amounts due from the Consolidated Fund in respect of Supply 152,596 152,596 140,215 140,215 Prepayments and accrued income 27,918 69,282 53,909 74,338 Total current trade and other receivables 256,293 651,699 809,632 1,276,454
Amounts falling due after more than one year
Trade receivables - 1,592 - -Coal Pensions receivables 319,154 319,154 216,243 216,243 Other receivables 1,903 7,938 - 10,780 Prepayments and accrued income - 31,018 - 31,018 Total non-current trade and other receivables 321,057 359,702 216,243 258,041
Total trade and other receivables 577,350 1,011,401 1,025,875 1,534,495
Core DepartmentCoal Pensions receivables represent the amounts due to the Government relating to its relationship with the British Coal Staff Superannuation Scheme (BCSSS) and the Mineworkers’ Pension Scheme (MPS). After privatisation of the British Coal Corporation in 1994 the Government gave financial guarantees in relation to certain benefits payable to members and beneficiaries of the two schemes. As part of those agreements the Government is entitled to a portion of any periodic valuation surpluses. Recommended cash flows to Government are generally determined by the Government Actuary following his triennial valuations. The most recent valuations were at 31 March 2015 for BCSSS and 30 September 2014 for MPS. More details can be found at www.bcsss-pension.org.uk and www.mps-pension.org.uk.
The Coal Pensions receivables have been classified as loans and receivables in accordance with IAS 39: Financial Instruments: Recognition and Measurement. They are valued at Fair Value which equates to the cash flows being discounted at a rate of 3.7%, the Treasury’s real discount rate.
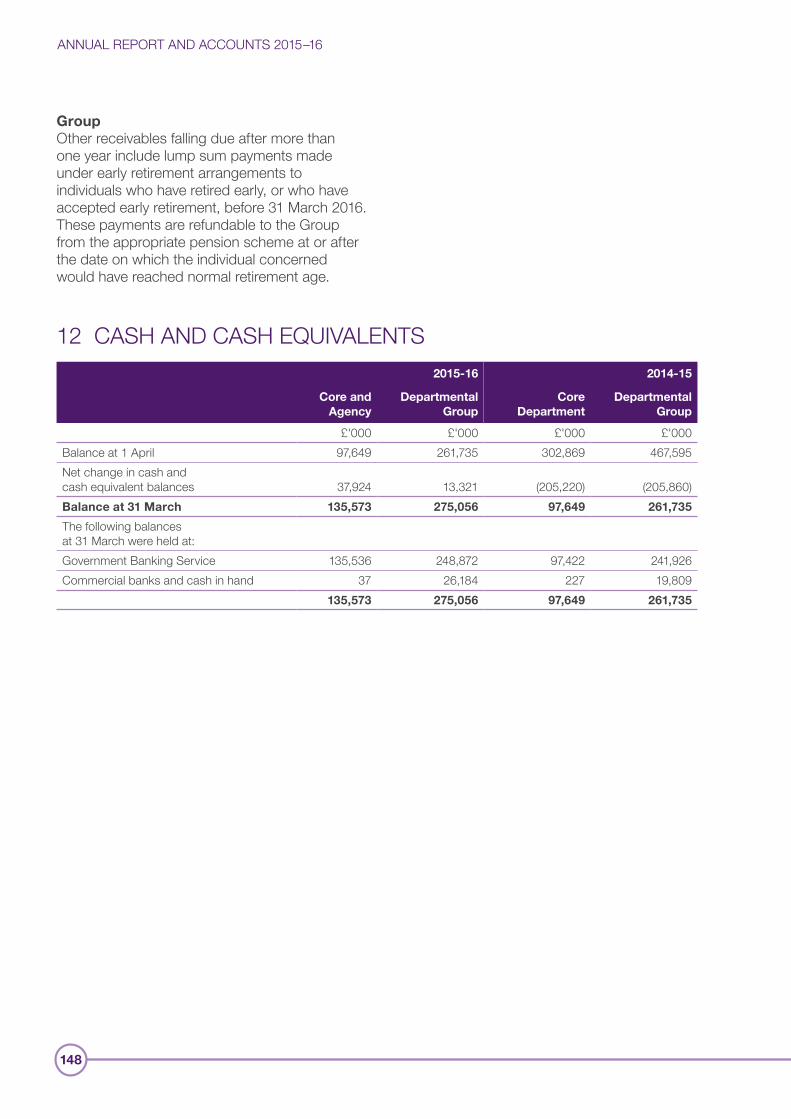
ANNUAL REPORT AND ACCOUNTS 2015–16
148
GroupOther receivables falling due after more than one year include lump sum payments made under early retirement arrangements to individuals who have retired early, or who have accepted early retirement, before 31 March 2016. These payments are refundable to the Group from the appropriate pension scheme at or after the date on which the individual concerned would have reached normal retirement age.
12 CASH AND CASH EQUIVALENTS2015-16 2014-15
Core and Agency
Departmental Group
Core Department
Departmental Group
£'000 £'000 £'000 £'000Balance at 1 April 97,649 261,735 302,869 467,595 Net change in cash and cash equivalent balances 37,924 13,321 (205,220) (205,860)Balance at 31 March 135,573 275,056 97,649 261,735
The following balances at 31 March were held at:Government Banking Service 135,536 248,872 97,422 241,926 Commercial banks and cash in hand 37 26,184 227 19,809
135,573 275,056 97,649 261,735
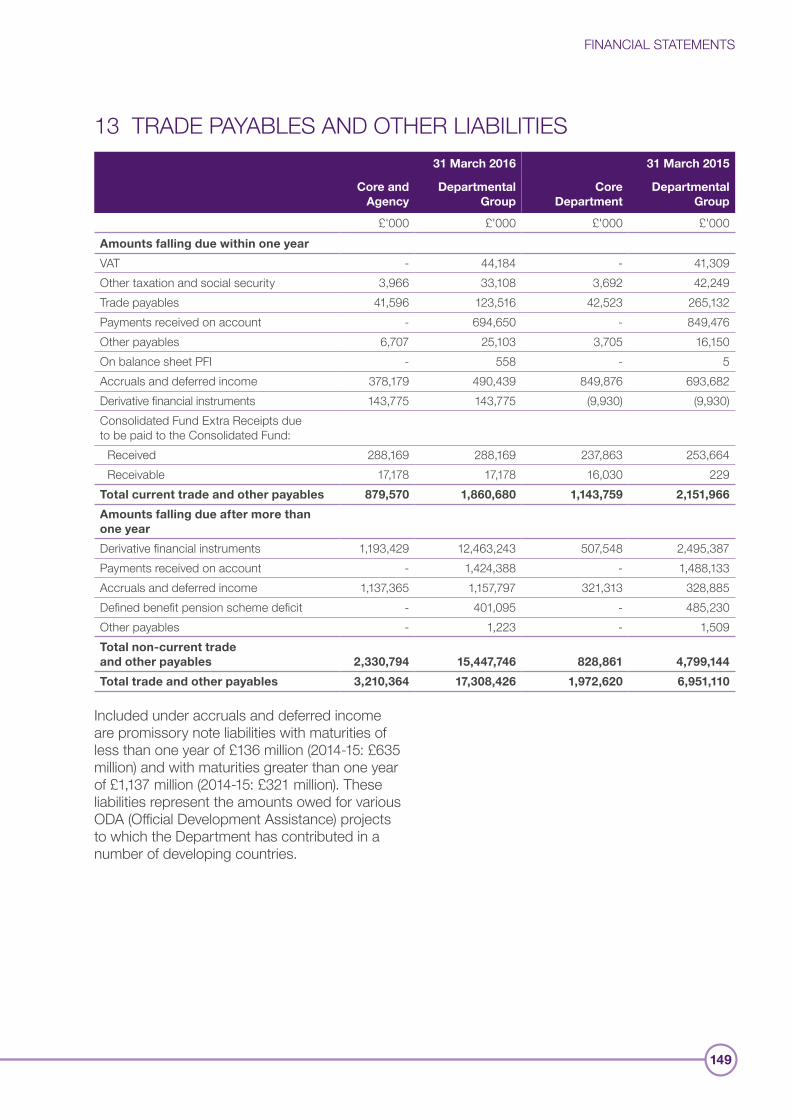
FINANCIAL STATEMENTS
149
13 TRADE PAYABLES AND OTHER LIABILITIES31 March 2016 31 March 2015
Core and Agency
Departmental Group
Core Department
Departmental Group
£'000 £'000 £'000 £'000Amounts falling due within one year
VAT - 44,184 - 41,309 Other taxation and social security 3,966 33,108 3,692 42,249 Trade payables 41,596 123,516 42,523 265,132 Payments received on account - 694,650 - 849,476 Other payables 6,707 25,103 3,705 16,150 On balance sheet PFI - 558 - 5 Accruals and deferred income 378,179 490,439 849,876 693,682 Derivative financial instruments 143,775 143,775 (9,930) (9,930)Consolidated Fund Extra Receipts due to be paid to the Consolidated Fund: Received 288,169 288,169 237,863 253,664 Receivable 17,178 17,178 16,030 229 Total current trade and other payables 879,570 1,860,680 1,143,759 2,151,966
Amounts falling due after more than one year
Derivative financial instruments 1,193,429 12,463,243 507,548 2,495,387 Payments received on account - 1,424,388 - 1,488,133 Accruals and deferred income 1,137,365 1,157,797 321,313 328,885 Defined benefit pension scheme deficit - 401,095 - 485,230 Other payables - 1,223 - 1,509 Total non-current trade and other payables 2,330,794 15,447,746 828,861 4,799,144
Total trade and other payables 3,210,364 17,308,426 1,972,620 6,951,110
Included under accruals and deferred income are promissory note liabilities with maturities of less than one year of £136 million (2014-15: £635 million) and with maturities greater than one year of £1,137 million (2014-15: £321 million). These liabilities represent the amounts owed for various ODA (Official Development Assistance) projects to which the Department has contributed in a number of developing countries.
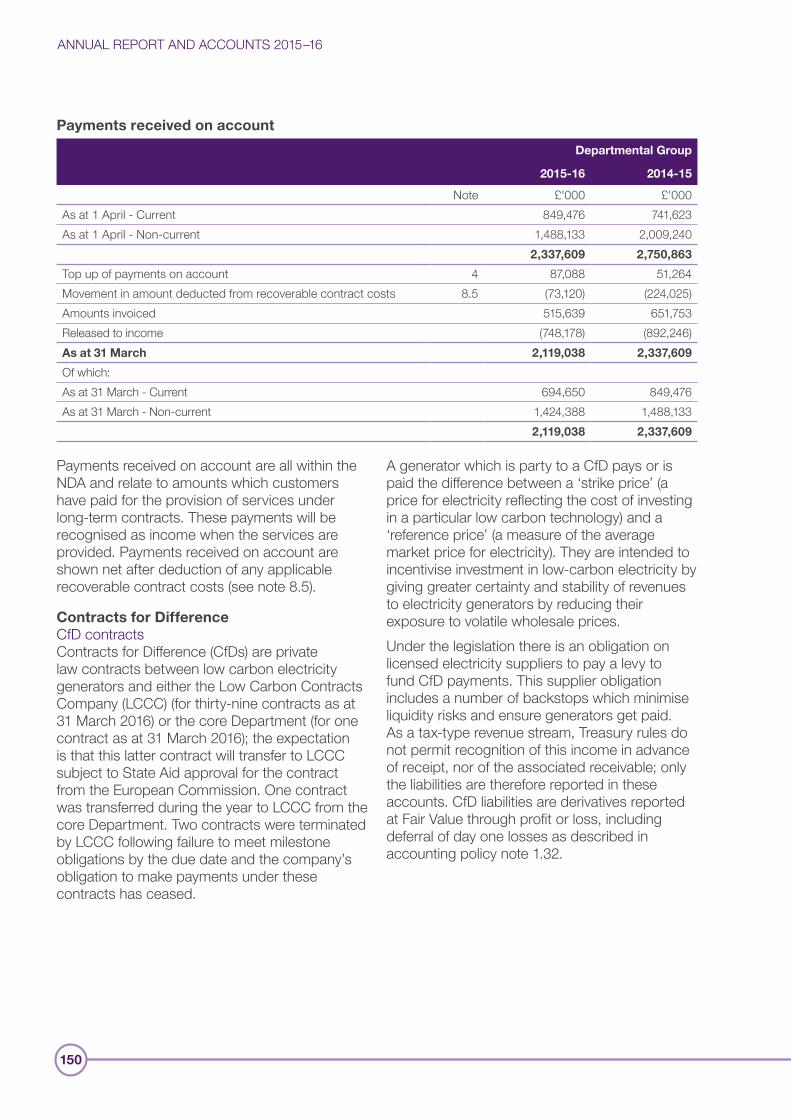
ANNUAL REPORT AND ACCOUNTS 2015–16
150
Payments received on account
Departmental Group
2015-16 2014-15
Note £'000 £'000As at 1 April - Current 849,476 741,623 As at 1 April - Non-current 1,488,133 2,009,240
2,337,609 2,750,863
Top up of payments on account 4 87,088 51,264 Movement in amount deducted from recoverable contract costs 8.5 (73,120) (224,025)Amounts invoiced 515,639 651,753 Released to income (748,178) (892,246)As at 31 March 2,119,038 2,337,609
Of which:As at 31 March - Current 694,650 849,476 As at 31 March - Non-current 1,424,388 1,488,133
2,119,038 2,337,609
Payments received on account are all within the NDA and relate to amounts which customers have paid for the provision of services under long-term contracts. These payments will be recognised as income when the services are provided. Payments received on account are shown net after deduction of any applicable recoverable contract costs (see note 8.5).
Contracts for DifferenceCfD contracts Contracts for Difference (CfDs) are private law contracts between low carbon electricity generators and either the Low Carbon Contracts Company (LCCC) (for thirty-nine contracts as at 31 March 2016) or the core Department (for one contract as at 31 March 2016); the expectation is that this latter contract will transfer to LCCC subject to State Aid approval for the contract from the European Commission. One contract was transferred during the year to LCCC from the core Department. Two contracts were terminated by LCCC following failure to meet milestone obligations by the due date and the company’s obligation to make payments under these contracts has ceased.
A generator which is party to a CfD pays or is paid the difference between a ‘strike price’ (a price for electricity reflecting the cost of investing in a particular low carbon technology) and a ‘reference price’ (a measure of the average market price for electricity). They are intended to incentivise investment in low-carbon electricity by giving greater certainty and stability of revenues to electricity generators by reducing their exposure to volatile wholesale prices.Under the legislation there is an obligation on licensed electricity suppliers to pay a levy to fund CfD payments. This supplier obligation includes a number of backstops which minimise liquidity risks and ensure generators get paid. As a tax-type revenue stream, Treasury rules do not permit recognition of this income in advance of receipt, nor of the associated receivable; only the liabilities are therefore reported in these accounts. CfD liabilities are derivatives reported at Fair Value through profit or loss, including deferral of day one losses as described in accounting policy note 1.32.
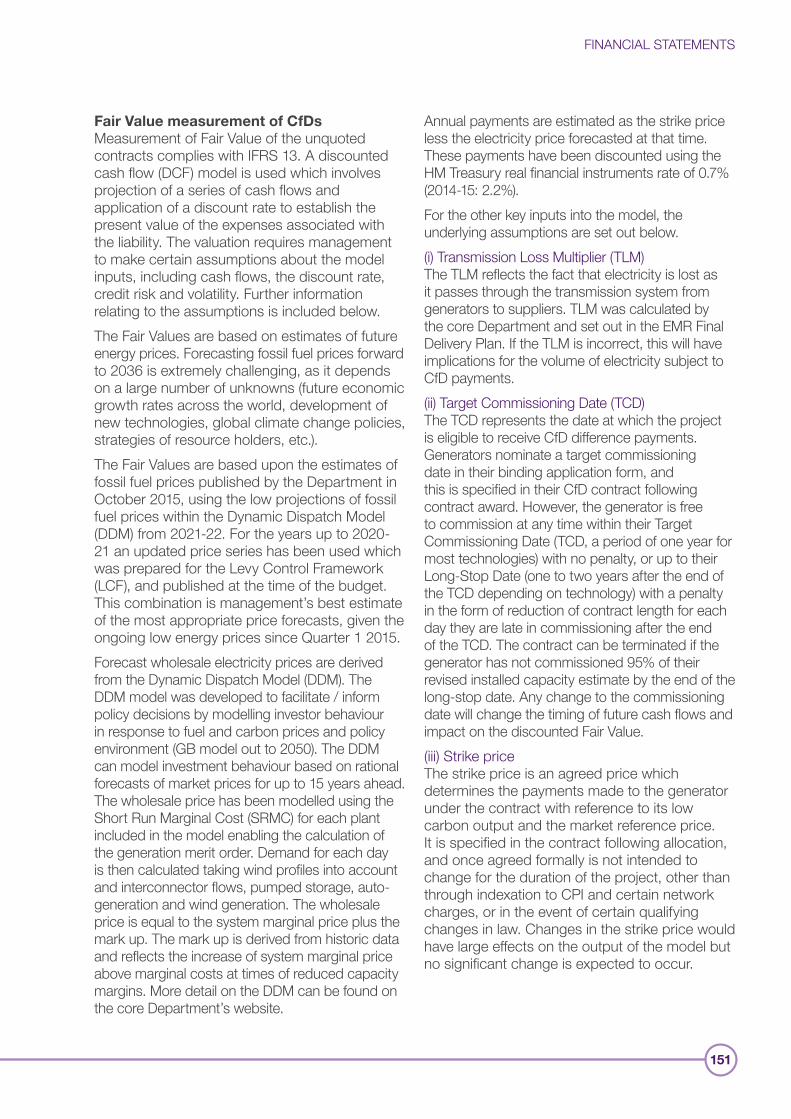
FINANCIAL STATEMENTS
151
Fair Value measurement of CfDsMeasurement of Fair Value of the unquoted contracts complies with IFRS 13. A discounted cash flow (DCF) model is used which involves projection of a series of cash flows and application of a discount rate to establish the present value of the expenses associated with the liability. The valuation requires management to make certain assumptions about the model inputs, including cash flows, the discount rate, credit risk and volatility. Further information relating to the assumptions is included below.The Fair Values are based on estimates of future energy prices. Forecasting fossil fuel prices forward to 2036 is extremely challenging, as it depends on a large number of unknowns (future economic growth rates across the world, development of new technologies, global climate change policies, strategies of resource holders, etc.). The Fair Values are based upon the estimates of fossil fuel prices published by the Department in October 2015, using the low projections of fossil fuel prices within the Dynamic Dispatch Model (DDM) from 2021-22. For the years up to 2020-21 an updated price series has been used which was prepared for the Levy Control Framework (LCF), and published at the time of the budget. This combination is management’s best estimate of the most appropriate price forecasts, given the ongoing low energy prices since Quarter 1 2015. Forecast wholesale electricity prices are derived from the Dynamic Dispatch Model (DDM). The DDM model was developed to facilitate / inform policy decisions by modelling investor behaviour in response to fuel and carbon prices and policy environment (GB model out to 2050). The DDM can model investment behaviour based on rational forecasts of market prices for up to 15 years ahead. The wholesale price has been modelled using the Short Run Marginal Cost (SRMC) for each plant included in the model enabling the calculation of the generation merit order. Demand for each day is then calculated taking wind profiles into account and interconnector flows, pumped storage, auto-generation and wind generation. The wholesale price is equal to the system marginal price plus the mark up. The mark up is derived from historic data and reflects the increase of system marginal price above marginal costs at times of reduced capacity margins. More detail on the DDM can be found on the core Department’s website.
Annual payments are estimated as the strike price less the electricity price forecasted at that time. These payments have been discounted using the HM Treasury real financial instruments rate of 0.7% (2014-15: 2.2%).For the other key inputs into the model, the underlying assumptions are set out below.(i) Transmission Loss Multiplier (TLM) The TLM reflects the fact that electricity is lost as it passes through the transmission system from generators to suppliers. TLM was calculated by the core Department and set out in the EMR Final Delivery Plan. If the TLM is incorrect, this will have implications for the volume of electricity subject to CfD payments. (ii) Target Commissioning Date (TCD) The TCD represents the date at which the project is eligible to receive CfD difference payments. Generators nominate a target commissioning date in their binding application form, and this is specified in their CfD contract following contract award. However, the generator is free to commission at any time within their Target Commissioning Date (TCD, a period of one year for most technologies) with no penalty, or up to their Long-Stop Date (one to two years after the end of the TCD depending on technology) with a penalty in the form of reduction of contract length for each day they are late in commissioning after the end of the TCD. The contract can be terminated if the generator has not commissioned 95% of their revised installed capacity estimate by the end of the long-stop date. Any change to the commissioning date will change the timing of future cash flows and impact on the discounted Fair Value.(iii) Strike price The strike price is an agreed price which determines the payments made to the generator under the contract with reference to its low carbon output and the market reference price. It is specified in the contract following allocation, and once agreed formally is not intended to change for the duration of the project, other than through indexation to CPI and certain network charges, or in the event of certain qualifying changes in law. Changes in the strike price would have large effects on the output of the model but no significant change is expected to occur.
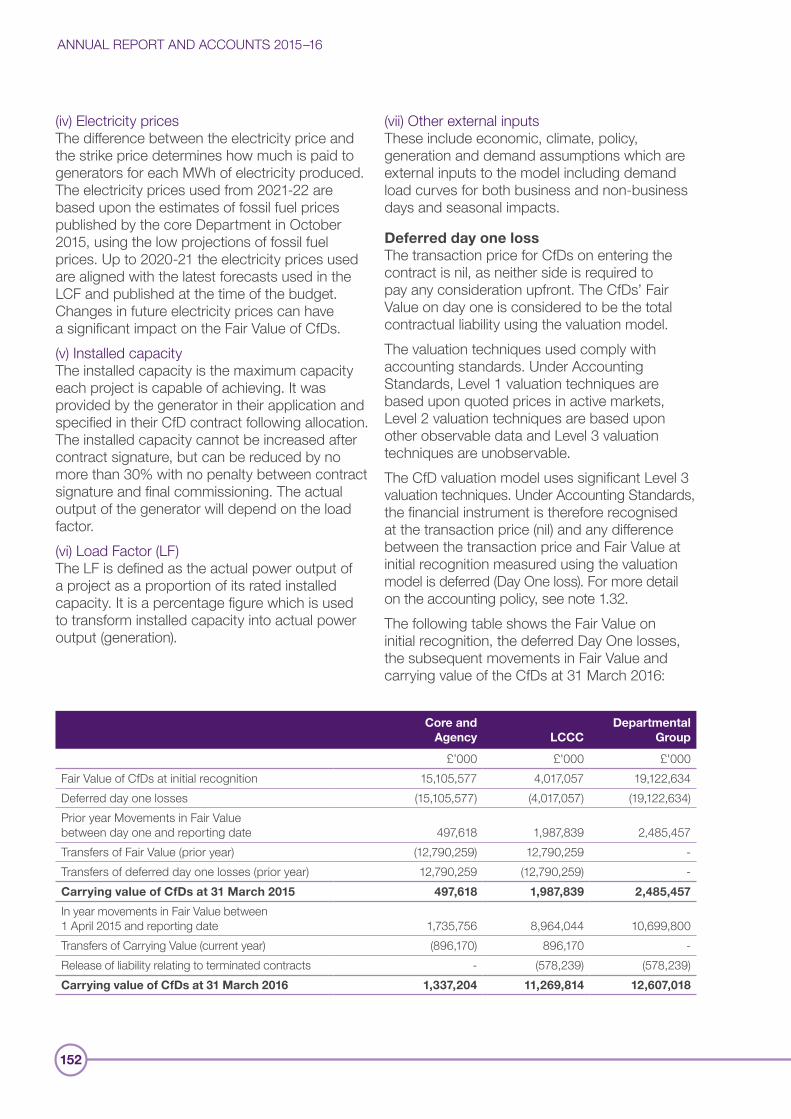
ANNUAL REPORT AND ACCOUNTS 2015–16
152
(iv) Electricity prices The difference between the electricity price and the strike price determines how much is paid to generators for each MWh of electricity produced. The electricity prices used from 2021-22 are based upon the estimates of fossil fuel prices published by the core Department in October 2015, using the low projections of fossil fuel prices. Up to 2020-21 the electricity prices used are aligned with the latest forecasts used in the LCF and published at the time of the budget. Changes in future electricity prices can have a significant impact on the Fair Value of CfDs.(v) Installed capacity The installed capacity is the maximum capacity each project is capable of achieving. It was provided by the generator in their application and specified in their CfD contract following allocation. The installed capacity cannot be increased after contract signature, but can be reduced by no more than 30% with no penalty between contract signature and final commissioning. The actual output of the generator will depend on the load factor.(vi) Load Factor (LF) The LF is defined as the actual power output of a project as a proportion of its rated installed capacity. It is a percentage figure which is used to transform installed capacity into actual power output (generation).
(vii) Other external inputs These include economic, climate, policy, generation and demand assumptions which are external inputs to the model including demand load curves for both business and non-business days and seasonal impacts.
Deferred day one lossThe transaction price for CfDs on entering the contract is nil, as neither side is required to pay any consideration upfront. The CfDs’ Fair Value on day one is considered to be the total contractual liability using the valuation model. The valuation techniques used comply with accounting standards. Under Accounting Standards, Level 1 valuation techniques are based upon quoted prices in active markets, Level 2 valuation techniques are based upon other observable data and Level 3 valuation techniques are unobservable.The CfD valuation model uses significant Level 3 valuation techniques. Under Accounting Standards, the financial instrument is therefore recognised at the transaction price (nil) and any difference between the transaction price and Fair Value at initial recognition measured using the valuation model is deferred (Day One loss). For more detail on the accounting policy, see note 1.32.The following table shows the Fair Value on initial recognition, the deferred Day One losses, the subsequent movements in Fair Value and carrying value of the CfDs at 31 March 2016:
Core and Agency LCCC
Departmental Group
£’000 £'000 £'000Fair Value of CfDs at initial recognition 15,105,577 4,017,057 19,122,634 Deferred day one losses (15,105,577) (4,017,057) (19,122,634)Prior year Movements in Fair Value between day one and reporting date 497,618 1,987,839 2,485,457 Transfers of Fair Value (prior year) (12,790,259) 12,790,259 -Transfers of deferred day one losses (prior year) 12,790,259 (12,790,259) -Carrying value of CfDs at 31 March 2015 497,618 1,987,839 2,485,457
In year movements in Fair Value between 1 April 2015 and reporting date 1,735,756 8,964,044 10,699,800 Transfers of Carrying Value (current year) (896,170) 896,170 -Release of liability relating to terminated contracts - (578,239) (578,239)Carrying value of CfDs at 31 March 2016 1,337,204 11,269,814 12,607,018
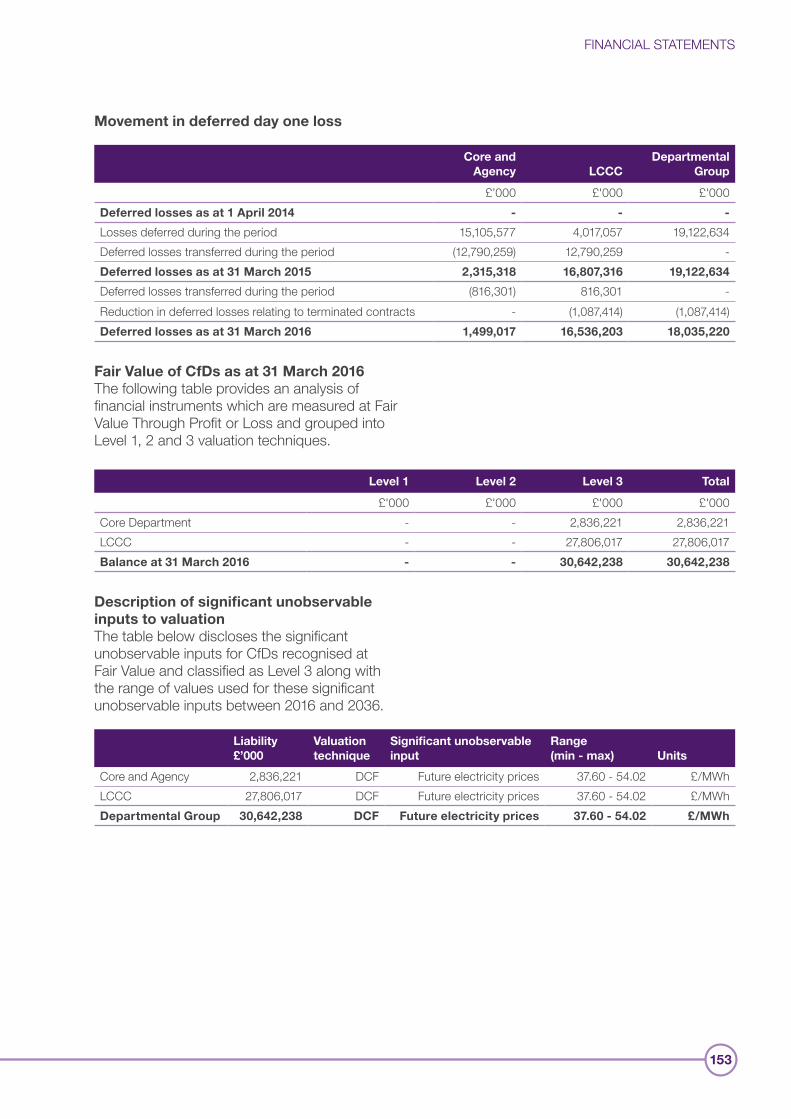
FINANCIAL STATEMENTS
153
Movement in deferred day one loss
Core and Agency LCCC
Departmental Group
£’000 £'000 £'000Deferred losses as at 1 April 2014 - - -
Losses deferred during the period 15,105,577 4,017,057 19,122,634 Deferred losses transferred during the period (12,790,259) 12,790,259 -Deferred losses as at 31 March 2015 2,315,318 16,807,316 19,122,634
Deferred losses transferred during the period (816,301) 816,301 -Reduction in deferred losses relating to terminated contracts - (1,087,414) (1,087,414)Deferred losses as at 31 March 2016 1,499,017 16,536,203 18,035,220
Fair Value of CfDs as at 31 March 2016The following table provides an analysis of financial instruments which are measured at Fair Value Through Profit or Loss and grouped into Level 1, 2 and 3 valuation techniques.
Level 1 Level 2 Level 3 Total
£'000 £'000 £'000 £'000Core Department - - 2,836,221 2,836,221 LCCC - - 27,806,017 27,806,017 Balance at 31 March 2016 - - 30,642,238 30,642,238
Description of significant unobservable inputs to valuation The table below discloses the significant unobservable inputs for CfDs recognised at Fair Value and classified as Level 3 along with the range of values used for these significant unobservable inputs between 2016 and 2036.
Liability £’000
Valuation technique
Significant unobservable input
Range (min - max) Units
Core and Agency 2,836,221 DCF Future electricity prices 37.60 - 54.02 £/MWhLCCC 27,806,017 DCF Future electricity prices 37.60 - 54.02 £/MWhDepartmental Group 30,642,238 DCF Future electricity prices 37.60 - 54.02 £/MWh
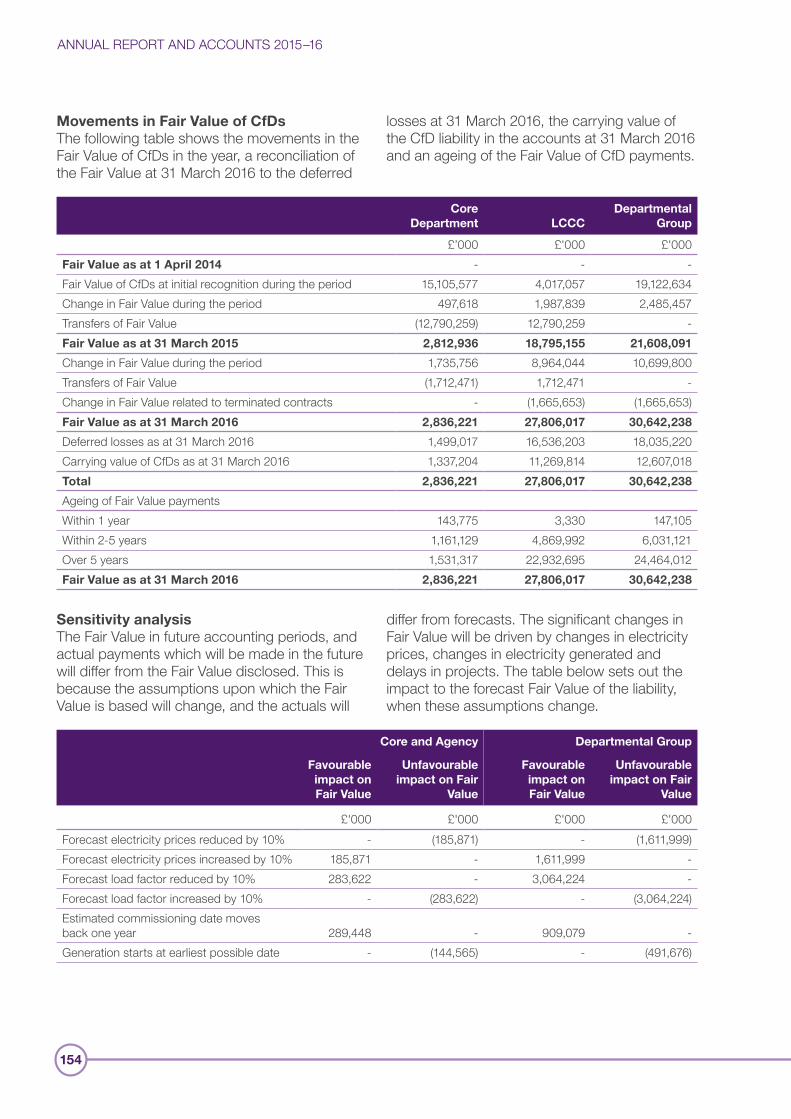
ANNUAL REPORT AND ACCOUNTS 2015–16
154
Movements in Fair Value of CfDsThe following table shows the movements in the Fair Value of CfDs in the year, a reconciliation of the Fair Value at 31 March 2016 to the deferred
losses at 31 March 2016, the carrying value of the CfD liability in the accounts at 31 March 2016 and an ageing of the Fair Value of CfD payments.
Core Department LCCC
Departmental Group
£’000 £'000 £'000Fair Value as at 1 April 2014 - - -Fair Value of CfDs at initial recognition during the period 15,105,577 4,017,057 19,122,634 Change in Fair Value during the period 497,618 1,987,839 2,485,457 Transfers of Fair Value (12,790,259) 12,790,259 -Fair Value as at 31 March 2015 2,812,936 18,795,155 21,608,091
Change in Fair Value during the period 1,735,756 8,964,044 10,699,800 Transfers of Fair Value (1,712,471) 1,712,471 -Change in Fair Value related to terminated contracts - (1,665,653) (1,665,653)Fair Value as at 31 March 2016 2,836,221 27,806,017 30,642,238
Deferred losses as at 31 March 2016 1,499,017 16,536,203 18,035,220 Carrying value of CfDs as at 31 March 2016 1,337,204 11,269,814 12,607,018 Total 2,836,221 27,806,017 30,642,238
Ageing of Fair Value paymentsWithin 1 year 143,775 3,330 147,105 Within 2-5 years 1,161,129 4,869,992 6,031,121 Over 5 years 1,531,317 22,932,695 24,464,012 Fair Value as at 31 March 2016 2,836,221 27,806,017 30,642,238
Sensitivity analysis The Fair Value in future accounting periods, and actual payments which will be made in the future will differ from the Fair Value disclosed. This is because the assumptions upon which the Fair Value is based will change, and the actuals will
differ from forecasts. The significant changes in Fair Value will be driven by changes in electricity prices, changes in electricity generated and delays in projects. The table below sets out the impact to the forecast Fair Value of the liability, when these assumptions change.
Core and Agency Departmental Group
Favourable impact on Fair Value
Unfavourable impact on Fair
Value
Favourable impact on Fair Value
Unfavourable impact on Fair
Value
£'000 £'000 £'000 £'000Forecast electricity prices reduced by 10% - (185,871) - (1,611,999)Forecast electricity prices increased by 10% 185,871 - 1,611,999 -Forecast load factor reduced by 10% 283,622 - 3,064,224 -Forecast load factor increased by 10% - (283,622) - (3,064,224)Estimated commissioning date moves back one year 289,448 - 909,079 -Generation starts at earliest possible date - (144,565) - (491,676)
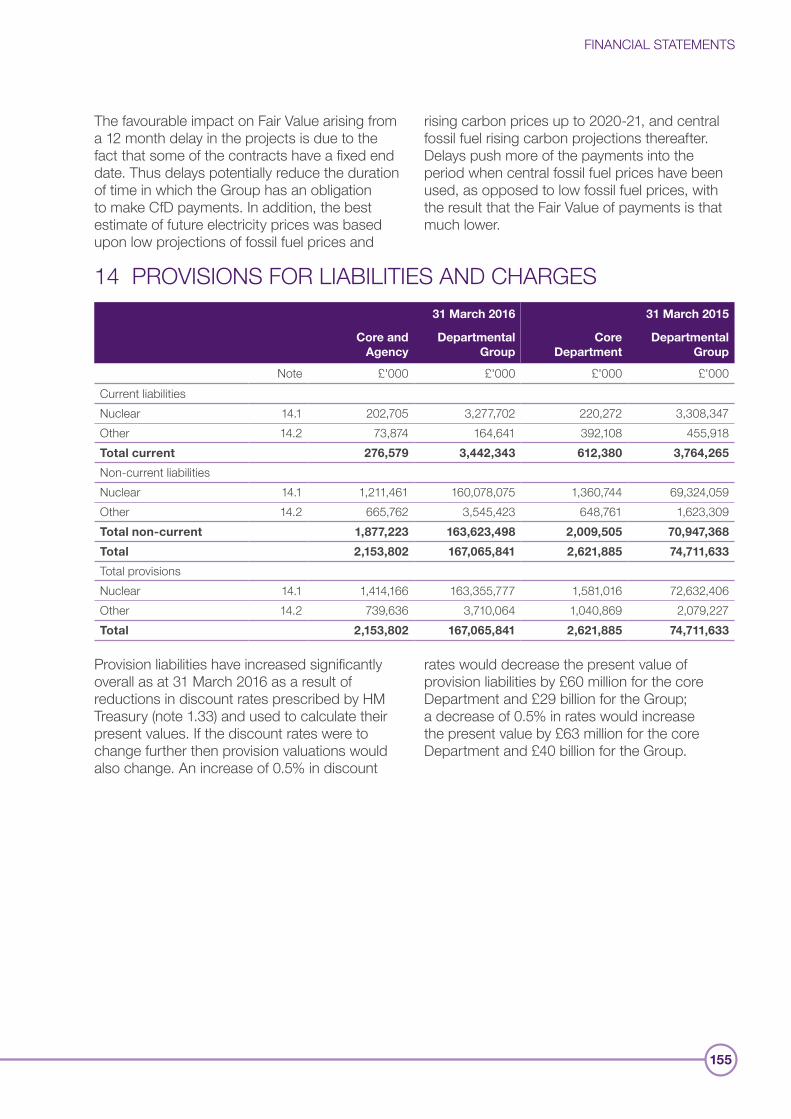
FINANCIAL STATEMENTS
155
The favourable impact on Fair Value arising from a 12 month delay in the projects is due to the fact that some of the contracts have a fixed end date. Thus delays potentially reduce the duration of time in which the Group has an obligation to make CfD payments. In addition, the best estimate of future electricity prices was based upon low projections of fossil fuel prices and
rising carbon prices up to 2020-21, and central fossil fuel rising carbon projections thereafter. Delays push more of the payments into the period when central fossil fuel prices have been used, as opposed to low fossil fuel prices, with the result that the Fair Value of payments is that much lower.
14 PROVISIONS FOR LIABILITIES AND CHARGES31 March 2016 31 March 2015
Core and Agency
Departmental Group
Core Department
Departmental Group
Note £'000 £'000 £'000 £'000Current liabilitiesNuclear 14.1 202,705 3,277,702 220,272 3,308,347 Other 14.2 73,874 164,641 392,108 455,918 Total current 276,579 3,442,343 612,380 3,764,265
Non-current liabilitiesNuclear 14.1 1,211,461 160,078,075 1,360,744 69,324,059 Other 14.2 665,762 3,545,423 648,761 1,623,309 Total non-current 1,877,223 163,623,498 2,009,505 70,947,368
Total 2,153,802 167,065,841 2,621,885 74,711,633
Total provisionsNuclear 14.1 1,414,166 163,355,777 1,581,016 72,632,406 Other 14.2 739,636 3,710,064 1,040,869 2,079,227 Total 2,153,802 167,065,841 2,621,885 74,711,633
Provision liabilities have increased significantly overall as at 31 March 2016 as a result of reductions in discount rates prescribed by HM Treasury (note 1.33) and used to calculate their present values. If the discount rates were to change further then provision valuations would also change. An increase of 0.5% in discount
rates would decrease the present value of provision liabilities by £60 million for the core Department and £29 billion for the Group; a decrease of 0.5% in rates would increase the present value by £63 million for the core Department and £40 billion for the Group.
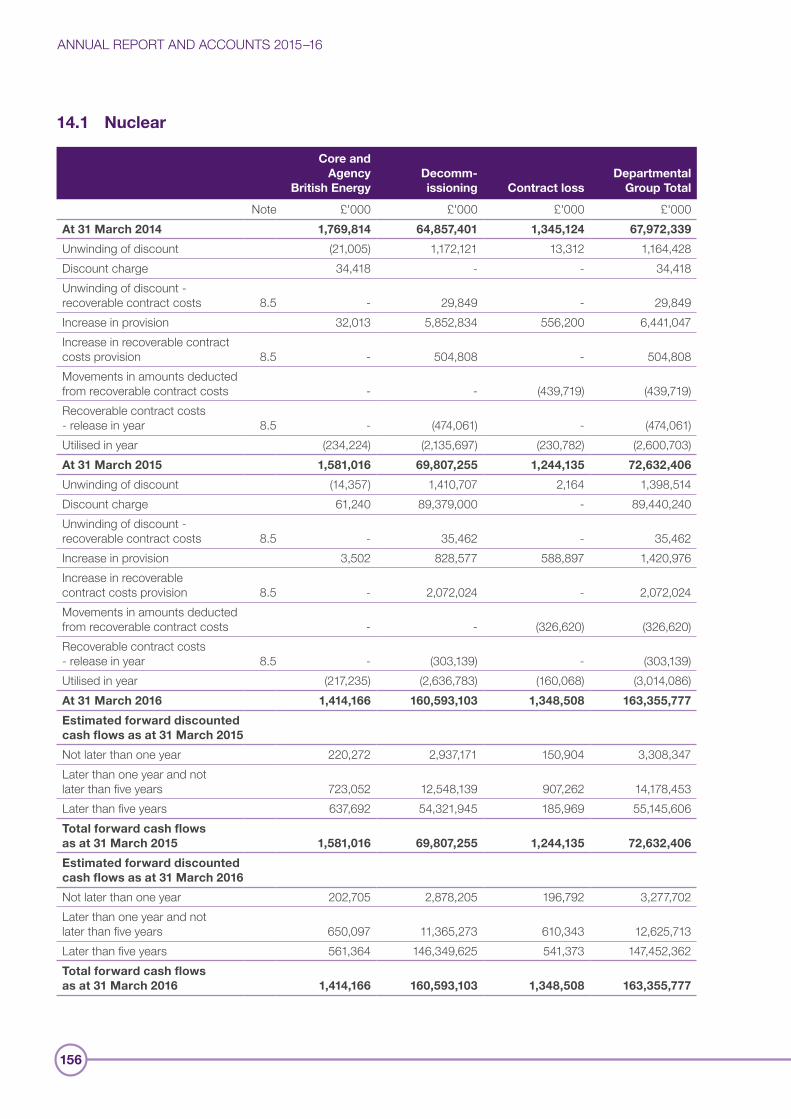
ANNUAL REPORT AND ACCOUNTS 2015–16
156
14.1 Nuclear
Core and Agency
British EnergyDecomm- issioning Contract loss
Departmental Group Total
Note £'000 £'000 £'000 £'000At 31 March 2014 1,769,814 64,857,401 1,345,124 67,972,339
Unwinding of discount (21,005) 1,172,121 13,312 1,164,428 Discount charge 34,418 - - 34,418 Unwinding of discount - recoverable contract costs 8.5 - 29,849 - 29,849 Increase in provision 32,013 5,852,834 556,200 6,441,047 Increase in recoverable contract costs provision 8.5 - 504,808 - 504,808 Movements in amounts deducted from recoverable contract costs - - (439,719) (439,719)Recoverable contract costs - release in year 8.5 - (474,061) - (474,061)Utilised in year (234,224) (2,135,697) (230,782) (2,600,703)At 31 March 2015 1,581,016 69,807,255 1,244,135 72,632,406
Unwinding of discount (14,357) 1,410,707 2,164 1,398,514 Discount charge 61,240 89,379,000 - 89,440,240 Unwinding of discount - recoverable contract costs 8.5 - 35,462 - 35,462 Increase in provision 3,502 828,577 588,897 1,420,976 Increase in recoverable contract costs provision 8.5 - 2,072,024 - 2,072,024 Movements in amounts deducted from recoverable contract costs - - (326,620) (326,620)Recoverable contract costs - release in year 8.5 - (303,139) - (303,139)Utilised in year (217,235) (2,636,783) (160,068) (3,014,086)At 31 March 2016 1,414,166 160,593,103 1,348,508 163,355,777
Estimated forward discounted cash flows as at 31 March 2015
Not later than one year 220,272 2,937,171 150,904 3,308,347 Later than one year and not later than five years 723,052 12,548,139 907,262 14,178,453 Later than five years 637,692 54,321,945 185,969 55,145,606 Total forward cash flows as at 31 March 2015 1,581,016 69,807,255 1,244,135 72,632,406
Estimated forward discounted cash flows as at 31 March 2016
Not later than one year 202,705 2,878,205 196,792 3,277,702 Later than one year and not later than five years 650,097 11,365,273 610,343 12,625,713 Later than five years 561,364 146,349,625 541,373 147,452,362 Total forward cash flows as at 31 March 2016 1,414,166 160,593,103 1,348,508 163,355,777
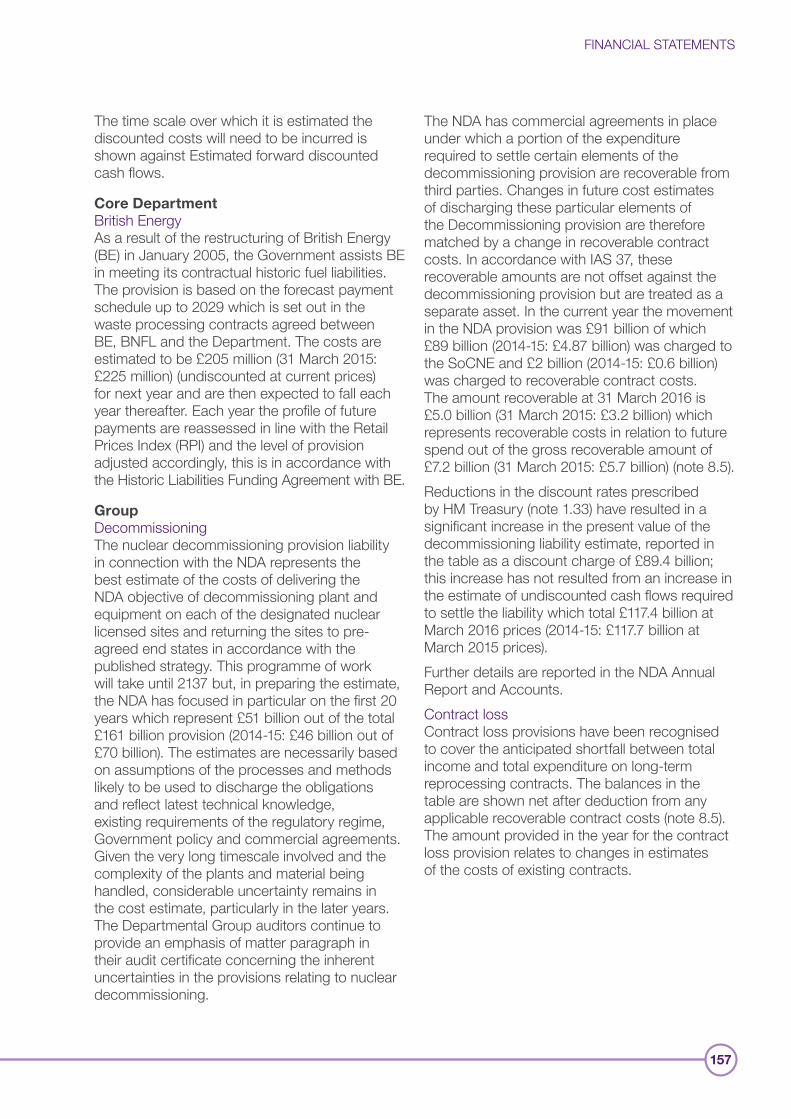
FINANCIAL STATEMENTS
157
The time scale over which it is estimated the discounted costs will need to be incurred is shown against Estimated forward discounted cash flows.
Core DepartmentBritish Energy As a result of the restructuring of British Energy (BE) in January 2005, the Government assists BE in meeting its contractual historic fuel liabilities. The provision is based on the forecast payment schedule up to 2029 which is set out in the waste processing contracts agreed between BE, BNFL and the Department. The costs are estimated to be £205 million (31 March 2015: £225 million) (undiscounted at current prices) for next year and are then expected to fall each year thereafter. Each year the profile of future payments are reassessed in line with the Retail Prices Index (RPI) and the level of provision adjusted accordingly, this is in accordance with the Historic Liabilities Funding Agreement with BE.
GroupDecommissioning The nuclear decommissioning provision liability in connection with the NDA represents the best estimate of the costs of delivering the NDA objective of decommissioning plant and equipment on each of the designated nuclear licensed sites and returning the sites to pre-agreed end states in accordance with the published strategy. This programme of work will take until 2137 but, in preparing the estimate, the NDA has focused in particular on the first 20 years which represent £51 billion out of the total £161 billion provision (2014-15: £46 billion out of £70 billion). The estimates are necessarily based on assumptions of the processes and methods likely to be used to discharge the obligations and reflect latest technical knowledge, existing requirements of the regulatory regime, Government policy and commercial agreements. Given the very long timescale involved and the complexity of the plants and material being handled, considerable uncertainty remains in the cost estimate, particularly in the later years. The Departmental Group auditors continue to provide an emphasis of matter paragraph in their audit certificate concerning the inherent uncertainties in the provisions relating to nuclear decommissioning.
The NDA has commercial agreements in place under which a portion of the expenditure required to settle certain elements of the decommissioning provision are recoverable from third parties. Changes in future cost estimates of discharging these particular elements of the Decommissioning provision are therefore matched by a change in recoverable contract costs. In accordance with IAS 37, these recoverable amounts are not offset against the decommissioning provision but are treated as a separate asset. In the current year the movement in the NDA provision was £91 billion of which £89 billion (2014-15: £4.87 billion) was charged to the SoCNE and £2 billion (2014-15: £0.6 billion) was charged to recoverable contract costs. The amount recoverable at 31 March 2016 is £5.0 billion (31 March 2015: £3.2 billion) which represents recoverable costs in relation to future spend out of the gross recoverable amount of £7.2 billion (31 March 2015: £5.7 billion) (note 8.5).Reductions in the discount rates prescribed by HM Treasury (note 1.33) have resulted in a significant increase in the present value of the decommissioning liability estimate, reported in the table as a discount charge of £89.4 billion; this increase has not resulted from an increase in the estimate of undiscounted cash flows required to settle the liability which total £117.4 billion at March 2016 prices (2014-15: £117.7 billion at March 2015 prices). Further details are reported in the NDA Annual Report and Accounts.Contract loss Contract loss provisions have been recognised to cover the anticipated shortfall between total income and total expenditure on long-term reprocessing contracts. The balances in the table are shown net after deduction from any applicable recoverable contract costs (note 8.5). The amount provided in the year for the contract loss provision relates to changes in estimates of the costs of existing contracts.
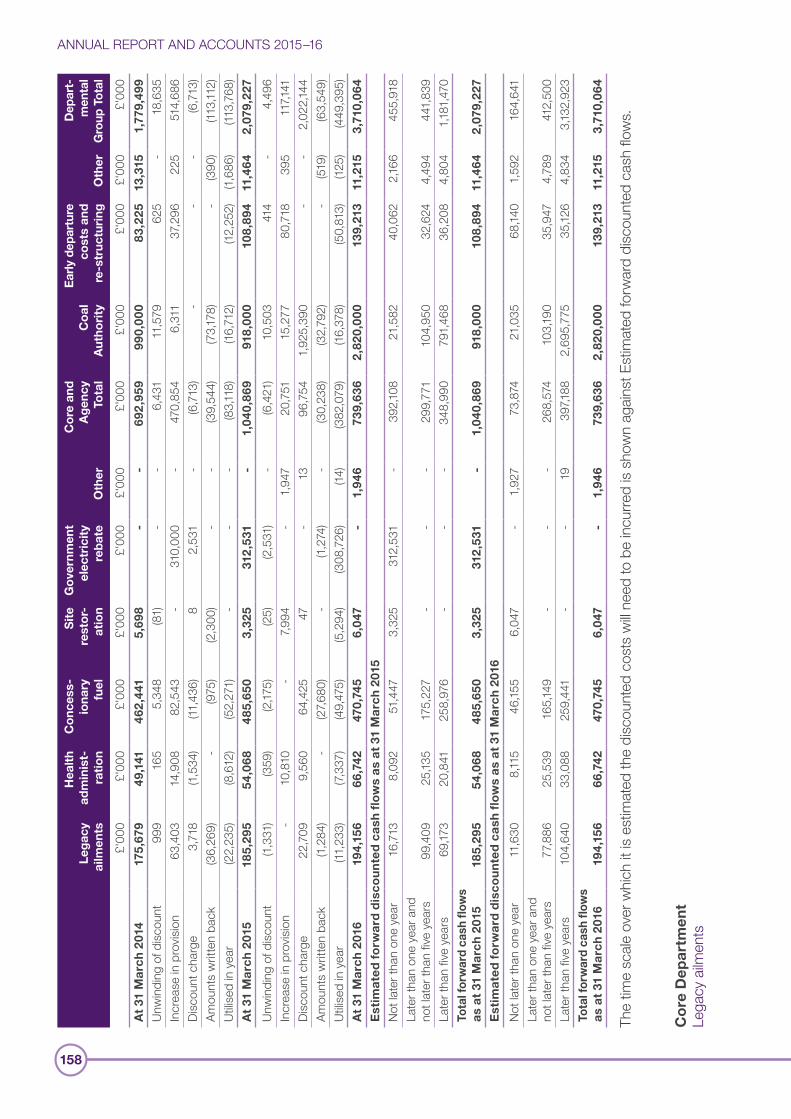
ANNUAL REPORT AND ACCOUNTS 2015–16
158
Leg
acy
ailm
ents
Hea
lth
adm
inis
t-ra
tio
n
Co
nces
s-
iona
ry
fuel
Sit
e re
sto
r-
atio
n
Go
vern
men
t el
ectr
icit
y re
bat
eO
ther
Co
re a
nd
Ag
ency
To
tal
Co
al
Aut
hori
ty
Ear
ly d
epar
ture
co
sts
and
re
-str
uctu
ring
Oth
er
Dep
art-
m
enta
l G
roup
Tot
al
£'00
0£'
000
£'00
0£'
000
£'00
0£'
000
£'00
0£'
000
£'00
0£'
000
£'00
0A
t 31
Mar
ch 2
014
175,
679
49,1
41
462
,441
5,
698
--
692
,959
99
0,0
00
83,2
25
13,3
15
1,77
9,49
9
Unw
indi
ng o
f disc
ount
999
165
5,34
8 (8
1)-
-6,
431
11,5
79
625
-18
,635
In
crea
se in
pro
visio
n63
,403
14
,908
82
,543
-
310,
000
-47
0,85
4 6,
311
37,2
96
225
514,
686
Disc
ount
cha
rge
3,71
8 (1,
534)
(11,4
36)
8 2,
531
-(6
,713
)-
--
(6,7
13)
Amou
nts
writ
ten
back
(36,
269)
-(9
75)
(2,3
00)
--
(39,
544)
(73,
178)
-(3
90)
(113,
112)
Utilis
ed in
yea
r(2
2,23
5)(8
,612
)(5
2,27
1)-
--
(83,
118)
(16,7
12)
(12,2
52)
(1,68
6)(11
3,76
8)A
t 31
Mar
ch 2
015
185,
295
54,0
68
485,
650
3,32
5 31
2,5
31
-1,
040,
869
918,
00
0 10
8,89
4 11
,464
2
,079
,227
Unw
indi
ng o
f disc
ount
(1,33
1)(3
59)
(2,17
5)(2
5)(2
,531
)-
(6,4
21)
10,5
03
414
-4,
496
Incr
ease
in p
rovis
ion
-10
,810
-
7,994
-
1,94
7 20
,751
15
,277
80
,718
39
5 11
7,141
Di
scou
nt c
harg
e22
,709
9,
560
64,4
25
47
-13
96
,754
1,
925,
390
--
2,02
2,144
Am
ount
s w
ritte
n ba
ck(1,
284)
-(2
7,680
)-
(1,27
4)-
(30,
238)
(32,
792)
-(5
19)
(63,
549)
Utilis
ed in
yea
r(11
,233
)(7,
337)
(49,
475)
(5,2
94)
(308
,726
)(14
)(3
82,0
79)
(16,3
78)
(50,
813)
(125)
(449
,395
)A
t 31
Mar
ch 2
016
194,
156
66,7
42
470,
745
6,04
7 -
1,94
6 73
9,63
6 2
,820
,00
0 13
9,21
3 11
,215
3,
710,
064
Est
imat
ed f
orw
ard
dis
cou
nte
d c
ash
flo
ws
as a
t 31
Mar
ch 2
015
Not
late
r tha
n on
e ye
ar16
,713
8,
092
51,4
47
3,32
5 31
2,53
1 -
392,1
08
21,5
82
40,0
62
2,166
45
5,91
8 La
ter t
han
one
year
and
no
t lat
er th
an fi
ve y
ears
99,4
09
25,13
5 17
5,22
7 -
--
299,
771
104,
950
32,6
24
4,49
4 44
1,83
9 La
ter t
han
five
year
s69
,173
20,8
41
258,
976
--
-34
8,99
0 79
1,46
8 36
,208
4,
804
1,181
,470
To
tal f
orw
ard
cash
flow
s as
at
31 M
arch
201
518
5,29
5 54
,068
48
5,65
0 3,
325
312
,531
-
1,04
0,86
9 91
8,0
00
108,
894
11,4
64
2,0
79,2
27
Est
imat
ed f
orw
ard
dis
cou
nte
d c
ash
flo
ws
as a
t 31
Mar
ch 2
016
Not
late
r tha
n on
e ye
ar11
,630
8,
115
46,15
5 6,
047
-1,
927
73,8
74
21,0
35
68,14
0 1,
592
164,
641
Late
r tha
n on
e ye
ar a
nd
not l
ater
than
five
yea
rs77
,886
25
,539
16
5,14
9 -
--
268,
574
103,
190
35,9
47
4,78
9 41
2,50
0 La
ter t
han
five
year
s10
4,64
0 33
,088
25
9,44
1 -
-19
39
7,188
2,
695,
775
35,12
6 4,
834
3,13
2,92
3 To
tal f
orw
ard
cash
flow
s as
at
31 M
arch
201
619
4,15
6 66
,742
47
0,74
5 6,
047
-1,
946
739,
636
2,8
20,0
00
139,
213
11,2
15
3,71
0,06
4
The
time
scale
ove
r whi
ch it
is e
stim
ated
the
disc
ount
ed c
osts
will
need
to b
e in
curre
d is
show
n ag
ainst
Est
imat
ed fo
rwar
d di
scou
nted
cas
h flo
ws.
nt
e m st
t nr eap ilme a
D yce ao
r geC L
FINANCIAL STATEMENTS
159
Responsibility for the compensation claims relating to personal injuries and ailments suffered by former British Coal mineworkers transferred to the Department on 1 January 1998 by a restructuring scheme under the Coal Industry Act 1994.The liabilities concern compensation claims relating to personal injuries. Over £6.3 billion has been paid out since privatisation and there are future liabilities such as induced hearing loss (£61 million), miscellaneous disease claims (including phurnacite, mesothelioma , pneumoconiosis, pleural thickening, asbestos related conditions, vibration white finger, chronic obstructive pulmonary disease, cancer, pleural plaques, other minor benefits schemes) (£89 million) and recently commenced litigation by former British Coal Coke Oven Workers (£32 million). The provisions are based on the forecasts of the settlements of future claims, taking into account discussion with our legal advisors, claim handlers and recent actuarial estimates. Forecasts beyond 2022, when the current contract with our legal advisors is due to end, are subject to considerable uncertainty in estimates of the number of cases and the levels of damages and costs. Health administration The health administration costs to date have been £714 million. These costs relate to the handling of the claims noted above. The projection of administrative costs going forward is based on the resources required to deal with established liabilities and the extent to which further litigation might be pursued against the Department and the resources needed to defend this potential liability.The future cash flows in relation to administrative expenditure are based upon best estimates according to the existing contractual arrangements with legal advisors (including claim handlers) and records management contractors.
Concessionary fuel The provision has previously covered the cost of the Department’s responsibility to provide either solid fuel or a cash alternative to ex-miners and their dependants formerly employed by British Coal, including the administration of the scheme. On the 15 November 2013, the Chancellor of the Exchequer announced that the government would additionally guarantee the concessionary fuel allowance of those who lost their entitlement as a consequence of the restructuring of UK Coal in July 2013. This resulted in a further cohort of approximately 1,500 beneficiaries added to the Department’s Scheme. On 4 March 2015, the Minister of State for Energy further announced that the government would ensure that the current UK Coal miners, approximately 700 beneficiaries, would continue to receive their concessionary fuel benefits upon closure of the companies’ remaining deep mines. The estimated future cost is also included in the provision. Of the total 54,907 current beneficiaries (including ex UK Coal beneficiaries) at 31 March 2016, 45,905 have opted for the cash alternative at an average of around £692 per annum; for the remainder, the average annual solid fuel cost to the Department is around £1,557 per beneficiary (this includes the cost of fuel, distribution and VAT). The provision is based on standard female mortality rates and includes an assumption of beneficiaries continuing to switch their entitlement from solid fuel to cash, in line with rates observed in the recent past and allowing for the fact that the ex UK Coal beneficiaries have greater restrictions in this regard. Government Electricity Rebate Government Electricity Rebate (GER) was launched in October 2014 as part of 2013’s Autumn Statement. It is part of a wider package of measures to reduce household energy bills. In 2015 GER reimbursed customers £12 which approximately represents one week’s electricity. The total cost per year was approximately £309 million which represents the amount reimbursed to suppliers for the rebate.
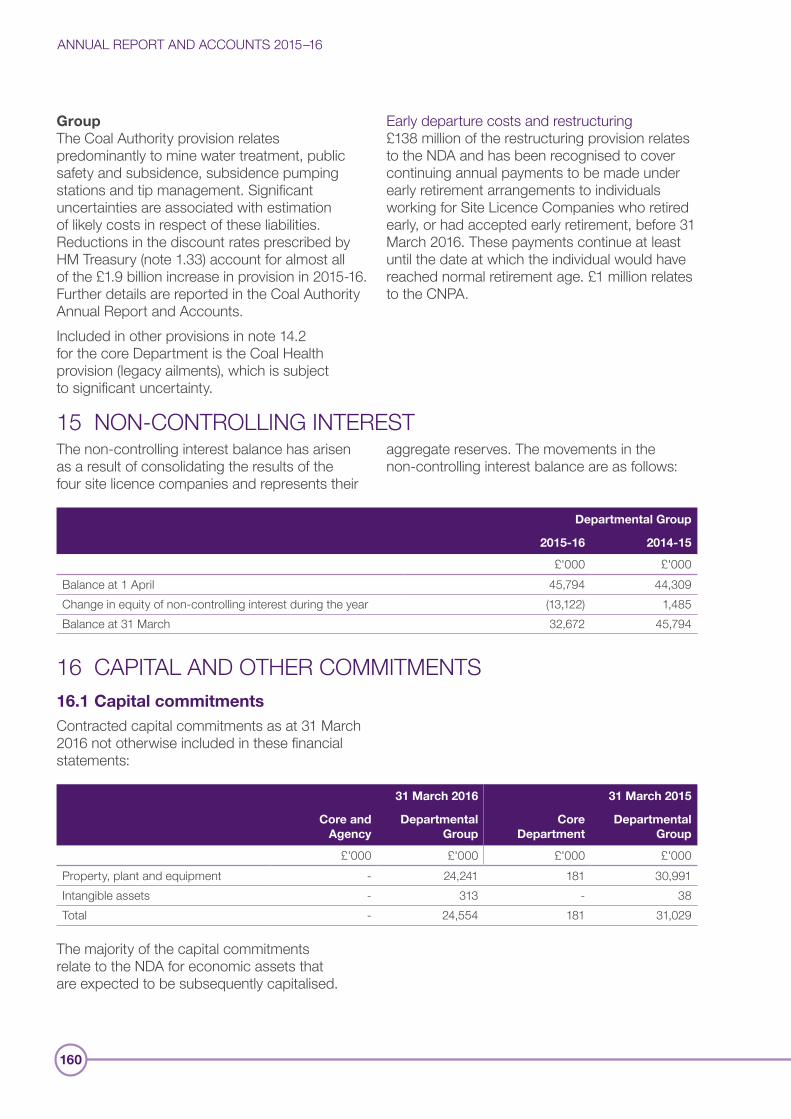
ANNUAL REPORT AND ACCOUNTS 2015–16
160
GroupThe Coal Authority provision relates predominantly to mine water treatment, public safety and subsidence, subsidence pumping stations and tip management. Significant uncertainties are associated with estimation of likely costs in respect of these liabilities. Reductions in the discount rates prescribed by HM Treasury (note 1.33) account for almost all of the £1.9 billion increase in provision in 2015-16. Further details are reported in the Coal Authority Annual Report and Accounts.Included in other provisions in note 14.2 for the core Department is the Coal Health provision (legacy ailments), which is subject to significant uncertainty.
Early departure costs and restructuring £138 million of the restructuring provision relates to the NDA and has been recognised to cover continuing annual payments to be made under early retirement arrangements to individuals working for Site Licence Companies who retired early, or had accepted early retirement, before 31 March 2016. These payments continue at least until the date at which the individual would have reached normal retirement age. £1 million relates to the CNPA.
15 NON-CONTROLLING INTERESTThe non-controlling interest balance has arisen as a result of consolidating the results of the four site licence companies and represents their
aggregate reserves. The movements in the non-controlling interest balance are as follows:
Departmental Group
2015-16 2014-15
£'000 £'000Balance at 1 April 45,794 44,309 Change in equity of non-controlling interest during the year (13,122) 1,485 Balance at 31 March 32,672 45,794
16 CAPITAL AND OTHER COMMITMENTS16.1 Capital commitmentsContracted capital commitments as at 31 March 2016 not otherwise included in these financial statements:
31 March 2016 31 March 2015
Core and Agency
Departmental Group
Core Department
Departmental Group
£'000 £'000 £'000 £'000Property, plant and equipment - 24,241 181 30,991 Intangible assets - 313 - 38 Total - 24,554 181 31,029
The majority of the capital commitments relate to the NDA for economic assets that are expected to be subsequently capitalised.
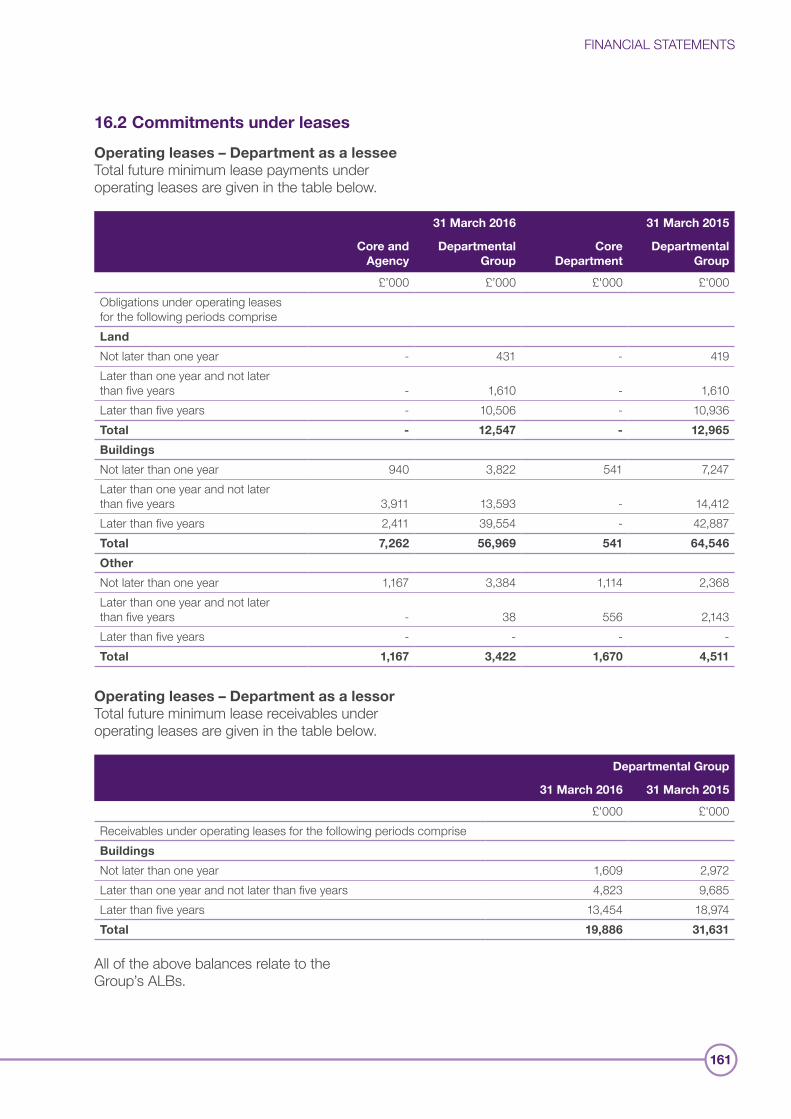
FINANCIAL STATEMENTS
161
16.2 Commitments under leases
Operating leases – Department as a lessee Total future minimum lease payments under operating leases are given in the table below.
31 March 2016 31 March 2015
Core and Agency
Departmental Group
Core Department
Departmental Group
£’000 £’000 £'000 £'000Obligations under operating leases for the following periods compriseLand
Not later than one year - 431 - 419 Later than one year and not later than five years - 1,610 - 1,610 Later than five years - 10,506 - 10,936 Total - 12,547 - 12,965
Buildings
Not later than one year 940 3,822 541 7,247 Later than one year and not later than five years 3,911 13,593 - 14,412 Later than five years 2,411 39,554 - 42,887 Total 7,262 56,969 541 64,546
Other
Not later than one year 1,167 3,384 1,114 2,368 Later than one year and not later than five years - 38 556 2,143 Later than five years - - - -Total 1,167 3,422 1,670 4,511
Operating leases – Department as a lessorTotal future minimum lease receivables under operating leases are given in the table below.
Departmental Group
31 March 2016 31 March 2015
£'000 £'000Receivables under operating leases for the following periods compriseBuildings
Not later than one year 1,609 2,972 Later than one year and not later than five years 4,823 9,685 Later than five years 13,454 18,974 Total 19,886 31,631
All of the above balances relate to the Group’s ALBs.
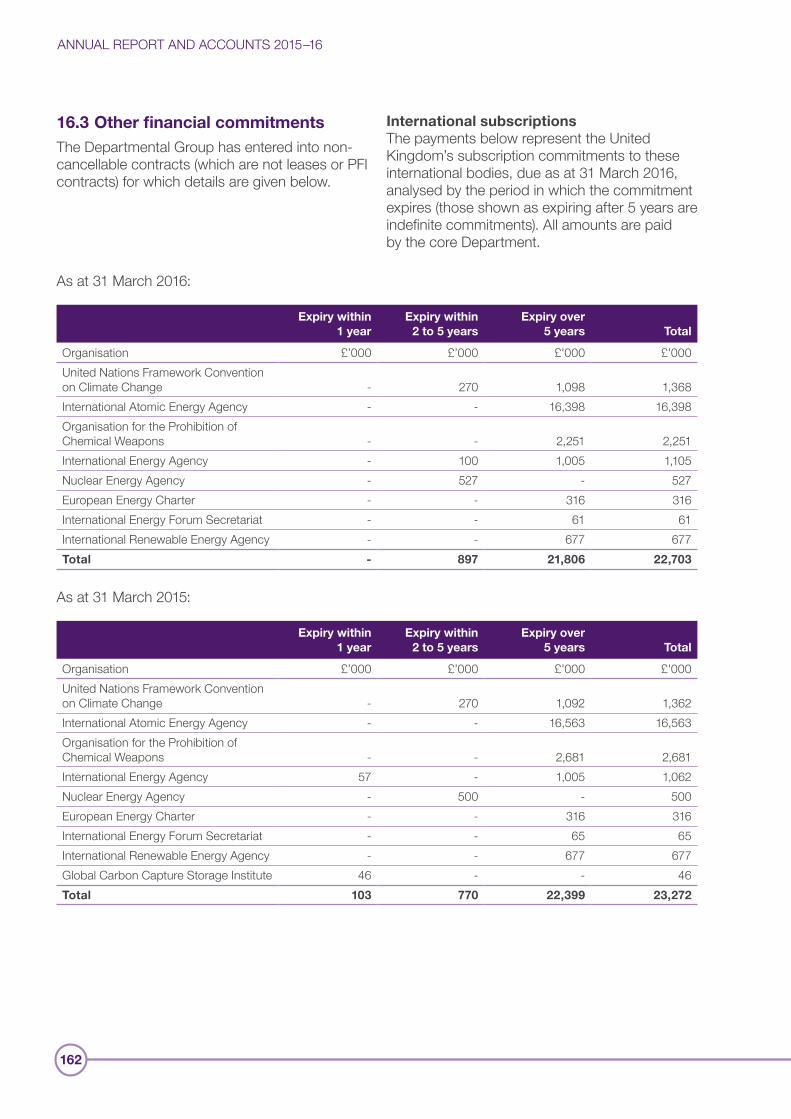
ANNUAL REPORT AND ACCOUNTS 2015–16
162
16.3 Other financial commitmentsThe Departmental Group has entered into non-cancellable contracts (which are not leases or PFI contracts) for which details are given below.
International subscriptionsThe payments below represent the United Kingdom’s subscription commitments to these international bodies, due as at 31 March 2016, analysed by the period in which the commitment expires (those shown as expiring after 5 years are indefinite commitments). All amounts are paid by the core Department.
As at 31 March 2016:
Expiry within 1 year
Expiry within 2 to 5 years
Expiry over 5 years Total
Organisation £’000 £’000 £'000 £'000United Nations Framework Convention on Climate Change - 270 1,098 1,368 International Atomic Energy Agency - - 16,398 16,398 Organisation for the Prohibition of Chemical Weapons - - 2,251 2,251 International Energy Agency - 100 1,005 1,105 Nuclear Energy Agency - 527 - 527 European Energy Charter - - 316 316 International Energy Forum Secretariat - - 61 61 International Renewable Energy Agency - - 677 677 Total - 897 21,806 22,703
As at 31 March 2015:
Expiry within 1 year
Expiry within 2 to 5 years
Expiry over 5 years Total
Organisation £’000 £’000 £'000 £'000United Nations Framework Convention on Climate Change - 270 1,092 1,362 International Atomic Energy Agency - - 16,563 16,563 Organisation for the Prohibition of Chemical Weapons - - 2,681 2,681 International Energy Agency 57 - 1,005 1,062 Nuclear Energy Agency - 500 - 500 European Energy Charter - - 316 316 International Energy Forum Secretariat - - 65 65 International Renewable Energy Agency - - 677 677 Global Carbon Capture Storage Institute 46 - - 46 Total 103 770 22,399 23,272
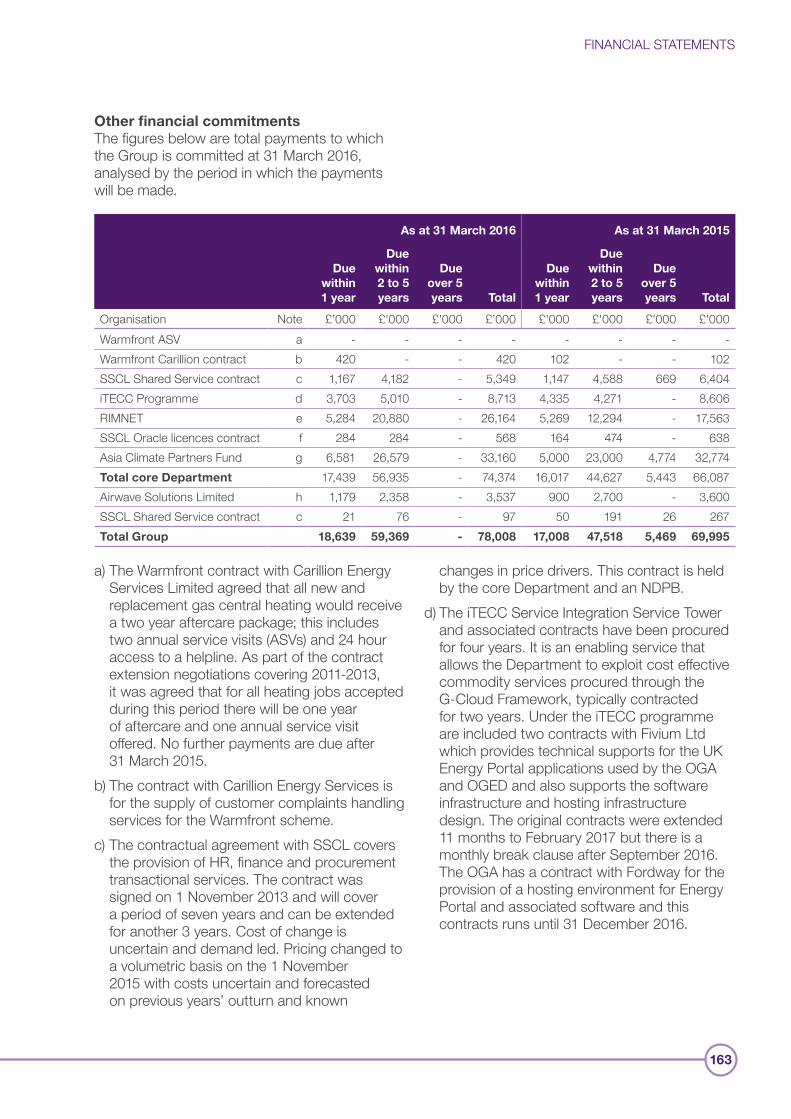
FINANCIAL STATEMENTS
163
Other financial commitmentsThe figures below are total payments to which the Group is committed at 31 March 2016, analysed by the period in which the payments will be made.
As at 31 March 2016 As at 31 March 2015
Due within 1 year
Due within 2 to 5 years
Due over 5 years Total
Due within 1 year
Due within 2 to 5 years
Due over 5 years Total
Organisation Note £’000 £'000 £'000 £’000 £'000 £'000 £'000 £'000Warmfront ASV a - - - - - - - -Warmfront Carillion contract b 420 - - 420 102 - - 102 SSCL Shared Service contract c 1,167 4,182 - 5,349 1,147 4,588 669 6,404 iTECC Programme d 3,703 5,010 - 8,713 4,335 4,271 - 8,606 RIMNET e 5,284 20,880 - 26,164 5,269 12,294 - 17,563 SSCL Oracle licences contract f 284 284 - 568 164 474 - 638 Asia Climate Partners Fund g 6,581 26,579 - 33,160 5,000 23,000 4,774 32,774 Total core Department 17,439 56,935 - 74,374 16,017 44,627 5,443 66,087 Airwave Solutions Limited h 1,179 2,358 - 3,537 900 2,700 - 3,600 SSCL Shared Service contract c 21 76 - 97 50 191 26 267 Total Group 18,639 59,369 - 78,008 17,008 47,518 5,469 69,995
a) The Warmfront contract with Carillion Energy Services Limited agreed that all new and replacement gas central heating would receive a two year aftercare package; this includes two annual service visits (ASVs) and 24 hour access to a helpline. As part of the contract extension negotiations covering 2011-2013, it was agreed that for all heating jobs accepted during this period there will be one year of aftercare and one annual service visit offered. No further payments are due after 31 March 2015.
b) The contract with Carillion Energy Services is for the supply of customer complaints handling services for the Warmfront scheme.
c) The contractual agreement with SSCL covers the provision of HR, finance and procurement transactional services. The contract was signed on 1 November 2013 and will cover a period of seven years and can be extended for another 3 years. Cost of change is uncertain and demand led. Pricing changed to a volumetric basis on the 1 November 2015 with costs uncertain and forecasted on previous years’ outturn and known
changes in price drivers. This contract is held by the core Department and an NDPB.
d) The iTECC Service Integration Service Tower and associated contracts have been procured for four years. It is an enabling service that allows the Department to exploit cost effective commodity services procured through the G-Cloud Framework, typically contracted for two years. Under the iTECC programme are included two contracts with Fivium Ltd which provides technical supports for the UK Energy Portal applications used by the OGA and OGED and also supports the software infrastructure and hosting infrastructure design. The original contracts were extended 11 months to February 2017 but there is a monthly break clause after September 2016. The OGA has a contract with Fordway for the provision of a hosting environment for Energy Portal and associated software and this contracts runs until 31 December 2016.
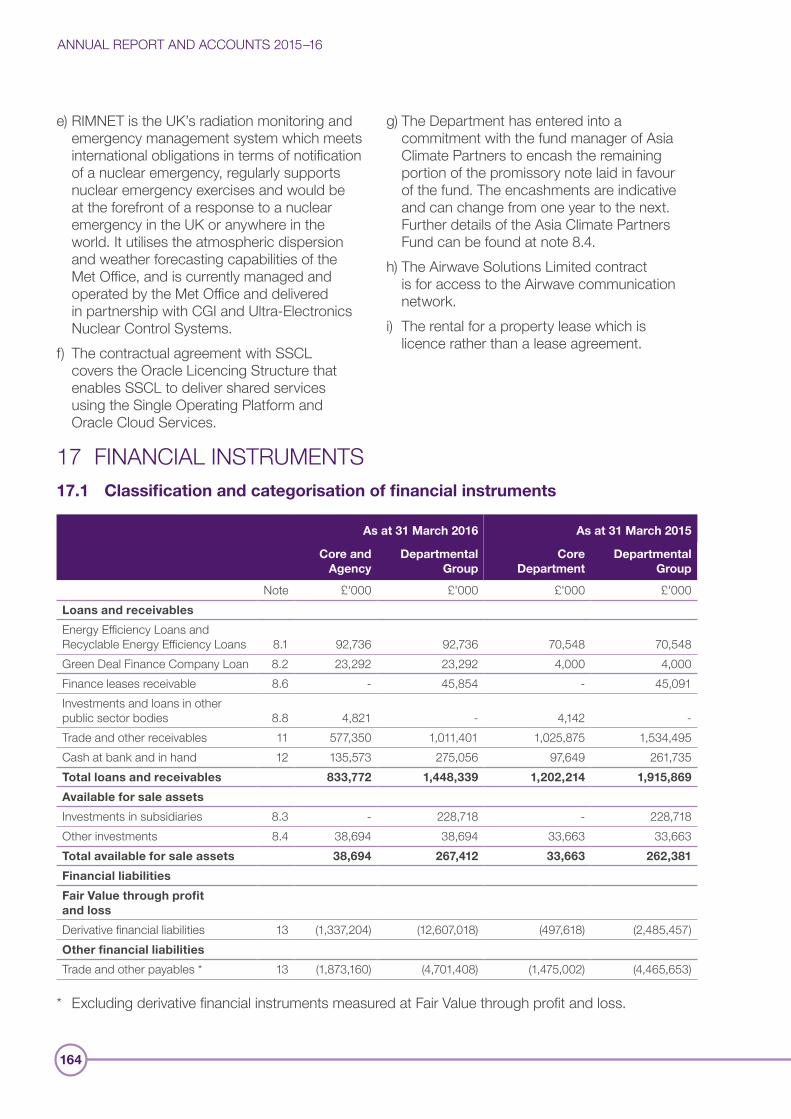
ANNUAL REPORT AND ACCOUNTS 2015–16
164
e) RIMNET is the UK’s radiation monitoring and emergency management system which meets international obligations in terms of notification of a nuclear emergency, regularly supports nuclear emergency exercises and would be at the forefront of a response to a nuclear emergency in the UK or anywhere in the world. It utilises the atmospheric dispersion and weather forecasting capabilities of the Met Office, and is currently managed and operated by the Met Office and delivered in partnership with CGI and Ultra-Electronics Nuclear Control Systems.
f) The contractual agreement with SSCL covers the Oracle Licencing Structure that enables SSCL to deliver shared services using the Single Operating Platform and Oracle Cloud Services.
g) The Department has entered into a commitment with the fund manager of Asia Climate Partners to encash the remaining portion of the promissory note laid in favour of the fund. The encashments are indicative and can change from one year to the next. Further details of the Asia Climate Partners Fund can be found at note 8.4.
h) The Airwave Solutions Limited contract is for access to the Airwave communication network.
i) The rental for a property lease which is licence rather than a lease agreement.
17 FINANCIAL INSTRUMENTS17.1 Classification and categorisation of financial instruments
As at 31 March 2016 As at 31 March 2015
Core and Agency
Departmental Group
Core Department
Departmental Group
Note £'000 £'000 £'000 £'000Loans and receivables
Energy Efficiency Loans and Recyclable Energy Efficiency Loans 8.1 92,736 92,736 70,548 70,548 Green Deal Finance Company Loan 8.2 23,292 23,292 4,000 4,000 Finance leases receivable 8.6 - 45,854 - 45,091 Investments and loans in other public sector bodies 8.8 4,821 - 4,142 -Trade and other receivables 11 577,350 1,011,401 1,025,875 1,534,495 Cash at bank and in hand 12 135,573 275,056 97,649 261,735 Total loans and receivables 833,772 1,448,339 1,202,214 1,915,869
Available for sale assets
Investments in subsidiaries 8.3 - 228,718 - 228,718 Other investments 8.4 38,694 38,694 33,663 33,663 Total available for sale assets 38,694 267,412 33,663 262,381
Financial liabilities
Fair Value through profit and loss
Derivative financial liabilities 13 (1,337,204) (12,607,018) (497,618) (2,485,457)Other financial liabilities
Trade and other payables * 13 (1,873,160) (4,701,408) (1,475,002) (4,465,653)
* Excluding derivative financial instruments measured at Fair Value through profit and loss.
FINANCIAL STATEMENTS
165
17.2 Measurement of financial instrumentsFinancial instruments are carried on the Statement of Financial Position at their Fair Value or amortised cost. Fair Value is the amount for which a financial asset could be exchanged or a financial liability settled between knowledgeable, willing parties in an arms-length transaction. This is market value where an active market exists. Where an active market does not exist generally accepted estimation and valuation techniques are used, including the discounted cash flow method. Further detail on the valuation of derivative financial liabilities is disclosed in note 13.The carrying values of other financial assets and financial liabilities do not differ from Fair Values in these accounts at either 31 March 2016 or 31 March 2015.
17.3 Significance of financial instruments to financial performance and positionIFRS 7: Financial Instruments: Disclosures requires the Group to disclose information which will allow users of these financial statements to evaluate the significance of financial instruments on the Group’s financial performance and position and the nature and extent of the Group’s exposure to risks arising from financial instruments.Given its largely non-trading nature and that the Group is financed through the Estimates process, financial instruments play a much more limited role in creating or changing risk than would apply to a non-public sector body of a similar size. Derivative financial liabilities in the 2015-16 accounts comprise CfD contracts in the core Department of £1,337 million (2014-15: £497.6 million) and in the Low Carbon Contracts Company Limited (LCCC) of £11,270 million (2014-15: £1,987.8 million), totalling £12,607 million in the group accounts (2014-15: £2,485.4 million). The initial day one cost of the Fair Value of the liability for the CfD contracts has been deferred in accordance with the provisions of IAS 39. The costs disclosed above represent the movements in Fair Value between initial recognition and the reporting date.
Information about the Group’s objectives, policies and processes for managing and measuring risk can be found in the Financial Overview.
17.4 Risk exposure from financial instruments The Group is financed by a combination of Government funding and commercial activities, and as at the reporting date was not exposed to the degree of financial risk faced by other business entities. It does however experience some degree of risk due to the variability of commercial income.The primary financial risks faced by the Group at the reporting date were commodity price risk and credit risk. Foreign currency risk, liquidity risk and interest rate risk are not considered to be significant risks for the Group.
Commodity price riskCommodity price risk is the risk or uncertainty arising from possible price movements and their impact on the commercial income and therefore ultimately on the funding requirements of the Group. The primary risk is that electricity prices will move adversely, which will affect commercial income between the time that the Group’s funding requirements are set and the time when revenues are recognised. Details are shown in note 13.The amounts payable under the CfD contracts are exposed to price risk through the fluctuations in future wholesale electricity prices, specifically, on how they will in the future differ from the prices used in the low fossil fuel rising carbon (to 2020-21) and central fossil fuel rising carbon scenarios (from 2021-22) to calculate the Fair Value of the liability. However the LCCC and the Department are not financially exposed to this risk because the liability is funded through a levy on suppliers.
ANNUAL REPORT AND ACCOUNTS 2015–16
166
Credit riskCredit risk for loans is described in notes 8.1 and 8.2. Credit risk is the risk that a counterparty will default on its contractual obligations resulting in financial loss to the Group.As at the reporting date, the Group’s exposure for other trade receivables was concentrated among a small number of customers. No collateral or other credit enhancements are held as security over the recoverability of these balances. The Group expects its receivable balances to be recovered in full due to its customers’ past payment histories and high credit ratings.Under the legislation there is an obligation placed on licensed suppliers to fund the CfD liabilities as they crystallise through a levy. In accordance with IAS 32, paragraph 12, the Group’s rights to the future reimbursement of these costs will not be recognised as financial assets when the financial liability is recognised, but will be recognised later when the electricity suppliers reimburse the Group. This means that although the liability is funded by a levy on suppliers, the asset matching the liability cannot be recorded in the Group Statement of Financial Position. The future levy amounts which will be received from the licensed suppliers will be accounted for by the Group when the event which triggers the recovery of the CfD costs from the licensed supplier occurs, the event being the supply of low carbon electricity triggering payment under the CfD contracts. The statutory accounts of the LCCC, prepared under IFRS, will recognise future reimbursement, to the extent that they have losses for reimbursement.The existence of this obligation ensures that credit and liquidity risks are minimal.
Foreign currency riskThe Group is exposed to foreign currency risk through its operations as certain transactions are denominated in foreign currencies, primarily Euros or US dollars. The Group manages the exposure by implementing a policy of selling or purchasing forward foreign currency.
Interest rate riskThe Group does not invest or access funds from commercial sources and so is not exposed to significant interest rate risks.The impact of interest rates affects the discount rate used to arrive at the Fair Value of the CfD liability. Changes in interest rates which affect the discount rate would therefore affect the Statement of Financial Position valuation. However the Group is not financially exposed to this risk because the liability is funded through a levy on suppliers.
Inflation riskThe CfD valuation is based on models which use assumptions about future prices. The amounts payable under the CfD contracts will be affected by the indexation of strike prices to reflect actual inflation and an inflation risk arises from the possibility of differences between the assumed inflation in the model and in the actual contracts. Inflation rates may not continue at the relatively low levels experienced in recent years; the Group is not financially exposed to this risk because the liability is funded through a levy on suppliers.
Liquidity riskResources are voted annually by Parliament to finance the Group’s net revenue resource requirements and its capital expenditure. The Group is therefore not exposed to significant liquidity risks.
FINANCIAL STATEMENTS
167
18 CONTINGENT LIABILITIES AND ASSETS DISCLOSED UNDER IAS 37: PROVISIONS, CONTINGENT LIABILITIES AND CONTINGENT ASSETS 18.1 Core Department
Basis of recognition Description
Coal Industry Act 1994 Responsibility for compensation claims relating to personal injuries suffered by former British Coal mineworkers between 1947 and 31 December 1994 transferred to the Department on 1 January 1998 by a restructuring scheme under the Coal Industry Act 1994. The timing and amounts of any future liabilities are uncertain except where provision has been made in the accounts. The future liabilities will depend on the nature of any injury and whether the courts decide that compensation is due.
Deed Relating to the British Coal Staff Superannuation Scheme (BCSSS) under Paragraph 2(9) of Schedule 5 to the Coal Industry Act 1994
Deed Relating to the Mineworkers’ Pension Scheme (MPS) under Paragraph 2(9) of Schedule 5 to the Coal Industry Act 1994
Government Guarantees were put in place on 31 October 1994, the day the Schemes were changed to reflect the impact of the privatisation of the coal industry. They are legally binding contracts between the Trustees and the Secretary of State for Energy & Climate Change.
The Guarantees ensure that the benefits earned by Scheme members during their employment with British Coal, and any benefit improvements from surpluses which were awarded prior to 31 October 1994, will always be paid and will be increased each year in line with the Retail Prices Index. If at any periodic valuation the assets of the Guaranteed Fund were to be insufficient to meet its liabilities, the assets must be increased to bring the Fund back into balance. This is a long-term contingent liability dependent on the performance of the schemes’ investments and their mortality experience. Further details regarding the Schemes and the notional sub-funds can be found in note 11.
Site restoration liabilities inherited from British Coal
The Department has inherited liabilities from British Coal to reimburse certain third parties with the costs necessary to meet statutory environmental standards in the restoration of particular coal-related sites. In addition to specific claims provided for (see note 14.2) it remains possible that the Department will be held responsible for further environmental liabilities. The timing and amounts of any liability are uncertain.
Feed in Tariffs The Department faces claims for damages from solar energy and construction companies affected by changes to Feed in Tariffs in 2011. A number of companies from the solar industry initiated legal proceedings in 2012, claiming damages for interference with property rights. Following determination of the legal principles by the Court of Appeal, the Department is preparing for a full trial on the facts of the case, probably in autumn 2017. At present, £189 million damages are claimed by the remaining 15 litigants (others having discontinued). The Department has been ordered to pay 80% and 50% of the claimants’ legal costs relating to preliminary hearings in the High Court and Court of Appeal respectively; the Department bears its own legal costs. The claimants and the Department are likely to incur substantial further legal costs (the Department’s costs being estimated at £3.1 million) and the losing party is likely to be ordered to pay the costs of the winning party.
EU Emissions Trading Scheme (ETS)
The Department awaits judgement, expected around September 2016, by the Court of Justice of the European Union (CJEU) concerning treatment of airlines flying to and from Switzerland under the aviation ETS. An unsuccessful outcome for the Government may result in claims for compensation plus costs but the Department considers the risk to be low.
A separate set of claims concerning allocation of carbon allowances in relation to stationary ETS are being considered together; domestic proceedings were stayed pending a decision from the CJEU on similar claims in other member states. Following ruling by the CJEU which in effect dismissed the claims, the case will now revert to the domestic courts but, as a result of the CJEU ruling, the Department expects to face neither liability for compensation nor legal costs.
Other There are a number of potential liabilities for the Department in respect of claims from suppliers, employees and third parties which depend on actual or potential proceedings. The timing and amounts of any liabilities are uncertain.
ANNUAL REPORT AND ACCOUNTS 2015–16
168
18.2 Departmental NDPBs
Category Description
Inventories At 31 March 2016 the NDA held inventories of reprocessed uranic material. These materials are currently held at nil value, due to uncertainty over their future use.
Pension Schemes - Deficits Whilst not the lead employer, the NDA is the lead organisation and has ultimate responsibility for certain nuclear industry pension schemes, including the Combined Nuclear Pension Plan, the Magnox section of the ESPS and the GPS pension scheme. Provisions for known deficits are included within nuclear decommissioning provisions (note 14). However, movements in financial markets may adversely impact the actuarial valuations of the schemes, resulting in an increase in scheme deficits and consequent increase in nuclear decommissioning provision.
Subsidence damage and public safety liabilities
Licensees of mining operations are required to provide security to the Coal Authority to cover anticipated future costs of settling subsidence damage liabilities within their Areas of Responsibility. Outside the Areas of Responsibility of the holders of licences under Part II of the 1994 Act, the Authority is responsible for making good subsidence damage. Where an Area of Responsibility is extinguished, this would transfer to the Authority who would become responsible for the discharge of outstanding subsidence liabilities. The Authority also has an ongoing liability to secure and keep secured most abandoned coal mines. (In all cases the liability for operating collieries is the responsibility of the licensees/lessees and security is held to address those liabilities.)
Both of the above liabilities have been provided for within the Coal Authority provision (note 14.2) based on analysis of trends and claims experience. However it is possible that significant, unexpected events outside of this provision may materialise.
In addition to the general contingent liabilities outlined above, damage notices have been submitted to the Coal Authority in respect of subsidence damage “in excess of £100 million” to Wentworth Woodhouse, a Grade I listed country house. The Coal Authority has rejected these notices; proceedings in the Upper Tribunal (Lands Chamber) are ongoing and the Coal Authority will continue to strongly defend its case.
Restructuring Scheme Where liabilities transferred under the various Coal Authority Restructuring Schemes (CARS) have crystallised due to planning conditions, agreements, claims etc, provision has been made in these financial statements. It has not however been possible to quantify contingent liabilities that may arise out of indemnities or warranties that may materialise in the future.
Legal claims The Coal Authority is subject to various claims and legal actions in the ordinary course of its activities for which provision is made in the accounts where appropriate on the basis of information available. The Authority does not expect that the outcome of the above issues will materially affect its financial position.
The CNPA has a number of potential liabilities in respect of claims from employees which depend on actual or potential proceedings. The timing and amounts of any payments are uncertain. These liabilities have not been provided for as CNPA believes the claims are unlikely to be successful or to lead to a transfer of economic benefit.
The NDA considers the likelihood of liabilities arising from a legal case which is ongoing at the reporting date to be remote. Any liabilities that do result from this case are expected to be immaterial to these financial statements.
FINANCIAL STATEMENTS
169
18.3 Contingent Assets
Departmental ALBs
Basis of recognition Description
Coal Authority Restructuring Schemes
By virtue of the seventh and ninth Coal Authority Restructuring Schemes (CARS 7 and 9) the Authority is the beneficiary of restrictive covenants and clawback provisions relating to land and properties sold by British Coal Corporation. In the event that the purchasers of the land / properties are able to retrospectively secure added value by obtaining planning consent for alternative uses, the Authority will receive a share of the added value. Quantification of this asset is not possible.
Deed Relating to the British Coal Staff Superannuation Scheme (BCSSS) under Paragraph 2(9) of Schedule 5 to the Coal Industry Act 1994
On 13 February 2015 an agreement was signed between the Trustee and “the Guarantor” (the Department) to amend the Scheme structure of the BCSSS which was designed to provide certainty to members over increases to their pensions in the future. Under the provisions of the agreement, within 12 months of 31 March 2033 the trustee shall pay to the Guarantor any surplus remaining on the scheme net of any amount retained for the obligation.
At the last valuation, the Government Actuary’s Department had valued the surplus at £1.707 million. The value of this surplus is subject to change depending on performance of future investments and changes to underlying valuation assumptions. Therefore the amount receivable by the Department is not certain and is dependent on a surplus being available on the scheme in 2033. Based on the sizeable current surplus, the Department considers a receipt from the scheme in 2033 to be probable.
Other contingent liabilities (for which the possibility of an outflow of economic benefits in settlement is remote) are not required to be disclosed under IAS 37 but are reported for Parliamentary reporting and accountability purposes in the Accountability Report.
19 RELATED-PARTY TRANSACTIONSThe core Department is the parent of the bodies listed in note 22 – these bodies are regarded as related parties and various material transactions have taken place during the reporting period between members of the Group. The related parties of the consolidating bodies are disclosed in their respective accounts.The Group has had various material transactions with other government departments, government bodies and devolved administrations comprising the Northern Ireland Executive, Scottish Government and the Welsh Government. The most significant of these transactions have been with HM Treasury, the Department for Environment, Food and Rural Affairs (Defra), the Department for Communities and Local Government, Office of Gas and Electricity Markets (Ofgem), the Met Office and Environment Agency.
No Department Ministers, Department senior management or the senior management of the Group have undertaken any material transaction with the Group during the year. Details of the Department’s Ministers and senior management and their remuneration are shown in the Remuneration Report.
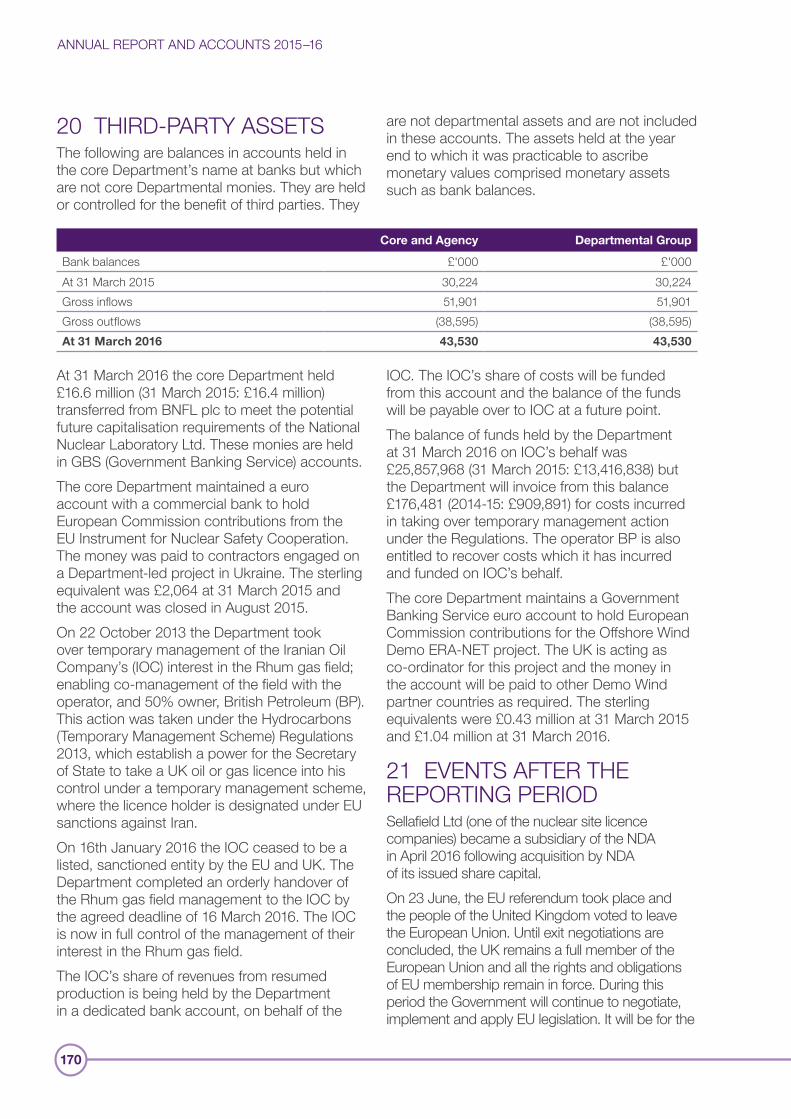
ANNUAL REPORT AND ACCOUNTS 2015–16
170
20 THIRD-PARTY ASSETS The following are balances in accounts held in the core Department’s name at banks but which are not core Departmental monies. They are held or controlled for the benefit of third parties. They
are not departmental assets and are not included in these accounts. The assets held at the year end to which it was practicable to ascribe monetary values comprised monetary assets such as bank balances.
Core and Agency Departmental Group
Bank balances £'000 £'000At 31 March 2015 30,224 30,224 Gross inflows 51,901 51,901Gross outflows (38,595) (38,595)At 31 March 2016 43,530 43,530
At 31 March 2016 the core Department held £16.6 million (31 March 2015: £16.4 million) transferred from BNFL plc to meet the potential future capitalisation requirements of the National Nuclear Laboratory Ltd. These monies are held in GBS (Government Banking Service) accounts.The core Department maintained a euro account with a commercial bank to hold European Commission contributions from the EU Instrument for Nuclear Safety Cooperation. The money was paid to contractors engaged on a Department-led project in Ukraine. The sterling equivalent was £2,064 at 31 March 2015 and the account was closed in August 2015.On 22 October 2013 the Department took over temporary management of the Iranian Oil Company’s (IOC) interest in the Rhum gas field; enabling co-management of the field with the operator, and 50% owner, British Petroleum (BP). This action was taken under the Hydrocarbons (Temporary Management Scheme) Regulations 2013, which establish a power for the Secretary of State to take a UK oil or gas licence into his control under a temporary management scheme, where the licence holder is designated under EU sanctions against Iran.On 16th January 2016 the IOC ceased to be a listed, sanctioned entity by the EU and UK. The Department completed an orderly handover of the Rhum gas field management to the IOC by the agreed deadline of 16 March 2016. The IOC is now in full control of the management of their interest in the Rhum gas field.The IOC’s share of revenues from resumed production is being held by the Department in a dedicated bank account, on behalf of the
IOC. The IOC’s share of costs will be funded from this account and the balance of the funds will be payable over to IOC at a future point. The balance of funds held by the Department at 31 March 2016 on IOC’s behalf was £25,857,968 (31 March 2015: £13,416,838) but the Department will invoice from this balance £176,481 (2014-15: £909,891) for costs incurred in taking over temporary management action under the Regulations. The operator BP is also entitled to recover costs which it has incurred and funded on IOC’s behalf.The core Department maintains a Government Banking Service euro account to hold European Commission contributions for the Offshore Wind Demo ERA-NET project. The UK is acting as co-ordinator for this project and the money in the account will be paid to other Demo Wind partner countries as required. The sterling equivalents were £0.43 million at 31 March 2015 and £1.04 million at 31 March 2016.
21 EVENTS AFTER THE REPORTING PERIODSellafield Ltd (one of the nuclear site licence companies) became a subsidiary of the NDA in April 2016 following acquisition by NDA of its issued share capital.On 23 June, the EU referendum took place and the people of the United Kingdom voted to leave the European Union. Until exit negotiations are concluded, the UK remains a full member of the European Union and all the rights and obligations of EU membership remain in force. During this period the Government will continue to negotiate, implement and apply EU legislation. It will be for the
FINANCIAL STATEMENTS
171
Government, under the new Prime Minister to begin negotiations to exit the EU. The outcome of these negotiations will determine what arrangements apply in relation to EU legislation and funding in future once the UK has left the EU. This is therefore a non-adjusting event for which no estimate of its financial effect on the reporting entity can be made.
Dates accounts authorised for issueIn accordance with IAS 10: Events After the Reporting Period, the Accounting Officer duly authorised the issue of these financial statements on the date of the Comptroller and Auditor General’s audit certificate.
22 ENTITIES WITHIN THE DEPARTMENTAL BOUNDARYThe entities within the boundary during 2015-16 comprise a supply financed agency and those entities listed in the Designation and Amendment Orders presented to Parliament. They are:• core Department;
Supply financed agency• Oil and Gas Authority;
Executive NDPBs and subsidiaries• Nuclear Decommissioning Authority (NDA),
excluding its subsidiary undertakings listed in note 8.3, and including the following subsidiaries classified as central government:• NDA Archives Limited (company number:
9109416); and• Radioactive Waste Management Limited
(company number: 8920190).• Coal Authority (CA);• Civil Nuclear Police Authority (CNPA); and• Committee on Climate Change (CCC).
Site Licence Companies (SLCs)• Sellafield Limited (company registered
number: 1002607);• Magnox Limited (company registered
number: 2264251);• Dounreay Site Restoration Limited (DSRL)
(company registered number: SC307493); and• LLW Repository Limited (LLWR) (company
registered number: 5608448).Research Sites Restoration Limited (company number 5915837) was consolidated within the Departmental Group in 2014-15 but is now dormant; action will be taken in 2016-17 to strike it from the Companies House register. Its activities on the Harwell and Winfrith sites and accounting balances were transferred to Magnox Limited as at 1 April 2015.These are private companies which operate sites on behalf of, and under contract from, the NDA.
Electricity Market Reform companies• Low Carbon Contracts Company Limited
(company registered number: 8818711); and• Electricity Settlements Company Limited
(company registered number: 8961281).These are private companies responsible for the management of Contracts for Difference and the Capacity Market settlement process respectively.
Limited liability partnership with Green Investment Bank
• UK Climate Investments LLP (registered number: OC399662).
The Annual Report and Accounts for each of the above are published separately; they can be found on GOV.UK1.The following Advisory NDPBs are listed in the Designation and Amendment Orders, but separate accounts are not produced as costs are included in the core Department’s expenditure:• Committee on Radioactive Waste
Management;• Fuel Poverty Advisory Group; and• Nuclear Liabilities Financing Assurance Board.
1 https://www.gov.uk/ for the Oil and Gas Authority and executive NDPBs and https://www.gov.uk/government/organisations/companies-house for limited companies

TRUSTSTATEMENT
TRUST STATEMENT
173
ACCOUNTING OFFICER’S FOREWORD TO THE TRUST STATEMENTScopeThe Department of Energy & Climate Change (the Department) is responsible for collection and allocation of receipts from the EU Emissions Trading Scheme (EU ETS), the Carbon Reduction Commitment (CRC) Scheme and the Climate Change Agreements (CCA) Scheme. The Department is also responsible for expenses incurred in the collection of these receipts; the revenue and expenditure; and the cash flows. The Oil and Gas Authority (OGA), which became an Executive Agency of the Department on 1 April 2015, is responsible for collection and allocation of the receipts from the Petroleum Licensing Regime. Whilst the OGA remains an Executive Agency, it has been agreed with HMT in the interests of efficiency that the Petroleum Licence fees collected by the OGA and paid over to the Consolidated Fund will be included in the Departmental Trust Statement.The Trust Statement reports the:• revenues, expenditure, assets and liabilities
relating to proceeds received from the UK auctions of European Allowances under Phase III of the EU ETS and Aviation allowances of the EU ETS for the financial year 2015-16. These amounts are collected by the Department for payment into the Consolidated Fund;
• revenues, expenditure, assets and liabilities relating to the receipts of Petroleum Licences under The Petroleum Act 1998 for the financial year 2015-16. These amounts are collected by the OGA for payment to the Consolidated Fund;
• revenues and assets relating to the receipts of CRC Allowances under the CRC Energy Efficiency Scheme Order (2010) as amended by CRC Energy Efficiency Scheme Order (2013) for the financial year 2015-16. These
amounts are collected by the Department for payment to the Consolidated Fund;
• revenues and assets relating to the receipts of CCA Buy-out payments for Target 1 reporting period; and
• civil penalties levied against participants in the EU ETS, CRC, ESOS and CCA Schemes. These amounts are collected by the Department for payment to the Consolidated Fund.
This statement is also prepared to provide disclosure of any material expenditure or income that has not been applied to the purposes intended by Parliament or material transactions that have not conformed to the authorities which govern them.
Background
EU ETSThe EU Emissions Trading Scheme is designed to reduce greenhouse gas (GHG) emissions at the lowest cost to the European economy. It also aims to provide greater certainty that the UK and the EU will meet emission reduction targets.The EU ETS includes approximately 11,000 power stations and industrial plants across the EU. Around 1,000 of these are sited in the UK and comprise power stations, oil refineries, offshore platforms and industries that produce iron and steel, cement and lime, paper, glass, ceramics and chemicals.Other organisations may also be covered by the EU ETS, including universities and aviation operators, although there is an opt-out for hospitals and small emitters.The EU ETS works on a ‘cap and trade’ basis: there is a ‘cap’ or limit set on the total greenhouse gas emissions allowed by all participants covered by the Scheme. This cap is converted into tradable emission allowances.Tradable emission allowances are allocated to participants in the market; in the EU ETS this is done via a mixture of free allocation and auctions. One allowance gives the holder the
ANNUAL REPORT AND ACCOUNTS 2015–16
174
right to emit one tonne of CO2 (or its equivalent). Participants covered by the EU ETS must monitor and report their emissions each year and surrender enough allowances to cover their annual emissions. Participants who are likely to emit more than their allocation have a choice between taking measures to reduce their emissions or buying additional allowances, either from companies who will emit less, from the secondary carbon market or from Member State held auctions.The carbon price signifies the amount participants in the EU ETS are willing to pay per EU allowance (EUA) which is based on demand and supply. In addition, EU Aviation Allowances (EUAAs) have been created to be used for compliance by airline operators. There were two EUAA auctions held in 2015-16. The first, on the 8 April 2015 of 1,681,500 allowances, this covered the 2013 and 2014 compliance years. The second auction, held on 18 November 2015, covered the 2015 compliance year and 839,000 allowances were auctioned. Both auctions cleared successfully.The first phase of the EU ETS ran from 2005 to 2007 and the second phase ran from 2008 to 2012 to coincide with the first Kyoto Commitment Period. The current phase of the EU ETS, which runs from 2013 to 2020 (subject to UK’s EU membership negotiations), builds upon the previous two phases and is significantly revised to make a greater contribution to tackling climate change.In the current phase (Phase III) there is a single EU-wide cap. Each Member State was required to submit a list (called the NIMs) of all the participants that will be included in Phase III, setting out its proposed levels of free allocation in accordance with the revised ETS Directive. For Phase III at least 50% of allowances will be auctioned across the EU, a far greater percentage than in the previous phases. This includes full auctioning for the power generation sector in the UK (subject to UK’s EU membership negotiations) and most Member States and for all Member States by 2020.
The UK appointed ICE Futures Europe to conduct auctions of EU ETS Phase III EUAs and EUAAs on behalf of the Department from November 2012. The Department has extended the contract with ICE by a further two years, until November 2017, the maximum allowed for in the EU Auctioning Regulation. The full schedule for Phase III auctions is available on the ICE emissions auctions web pages at www.theice.com/emissions/auctions. The UK has recently issued a prior information notice in the Official Journal of the European Union to signal its intent to re-procure the UK’s auction platform upon expiry of the current contract in November 2017.
Petroleum LicencesThe Petroleum Act 1998 vests in the Crown all rights to the nation’s petroleum resources. The Act gives the Secretary of State powers to grant licences that confer exclusive rights to “search and bore for and get” petroleum. Each of these licences confers such rights over a limited area and for a limited period. Following the creation of the OGA as an executive agency of the Department, the OGA is responsible for issuing and administering these licences. This process is carried out with a view to realising the full benefit to the UK of its petroleum resources in a way which balances the interests of potential developers with the interests of the nation as the owner of the resource.Licences are awarded in periodic “rounds” subject to a requirement that the holder will make annual payments (known as ‘Licence Rental Fees’) to the Department, which remits them to the Consolidated Fund. These payments are calculated on the basis of the area under licence, and incorporate an escalating scale of pre-determined rates per square kilometre. This is to encourage licensee companies to relinquish acreage not undergoing productive activity, thus making it available for relicensing to other potential interested applicants.The amount collected in respect of licence rental fees was £70 million in 2015-16 and £69 million in 2014-15. The vast majority of this comes from offshore licensing.
TRUST STATEMENT
175
CRC The CRC Energy Efficiency Scheme (CRC) is a mandatory UK-wide trading scheme that was brought into law via the CRC Energy Efficiency Scheme Order 2010 (SI 2010/768) (the ‘CRC Order’) and simplified via the CRC Energy Efficiency Scheme Order 2013 (SI 2013/1119). The scheme is designed to incentivise large public and private sector organisations to take up cost-effective energy efficiency opportunities through the application of a range of drivers and thereby drive down the carbon emissions throughout the UK. The CRC Scheme is designed to tackle the four main barriers to the take up of energy efficiency highlighted by the Carbon Trust report in 2005, namely insufficient financial incentives to reduce emissions, uncertain reputational benefits of demonstrating leadership, split incentives between landlord and tenants and organisational inertia. The CRC is designed to improve energy efficiency and thereby reduce emissions primarily from large non-energy intensive organisations in the private and public sectors. The sectors being targeted include large retail organisations, banks, large offices, universities, large hospitals, large local authorities and central government departments. The Environment Agency, in its role of UK Scheme Administrator, administers the scheme’s registry on behalf of the Department and the Devolved Administrations. Participants use it to report annually their energy supply data and purchase and surrender allowances as required each compliance year. The Environment Agency along with the devolved scheme regulators, namely Scottish Environment Protection Agency, Northern Ireland Environment Agency and Natural Resources Wales, are responsible for the audit and enforcement of the scheme, including the issue of Civil Penalties as required. The Environment Agency report to the Department who are responsible for the overall monitoring and reporting of CRC, ensuring that the figures recorded in the Trust Statement are complete and correct.
The scheme started in April 2010 with a four year introductory phase. The second phase of the scheme commenced in 2014 and will run until 2019. There are around 2000 participants in the scheme for the second phase. The CRC tackles the barriers to energy efficiency in three ways. Firstly, the CRC has standardised and structured reporting requirements which require participants to monitor and report their emissions; secondly it has a reputational driver through the publication of data, and thirdly its financial element which requires participants to buy allowances for the carbon they emit. This brings the cost-benefits of energy efficiency to the attention of Finance Directors and aims to make it a boardroom issue. 2015-16 saw the second forecast sale for Phase 2 of the scheme. In Phase 2 there are two allowance sales each year, a forecast sale and a compliance sale. The forecast sale is set at a lower price than the later equivalent compliance year’s buy-to-comply sale price. This is to incentivise participants to better forecast their energy use in order that they can, if they wish, make use of the cheaper forecast sale price. In addition there is a special allocation sale that runs from November to the following April. The special allocation allows participants to purchase allowances where they have been found to have failed to comply with the CRC Order and been issued with an Enforcement Notice. The special allocation allowance price would be the same as the equivalent compliance buy to comply price.
Climate Change Agreements (CCAs)Climate Change Agreements (CCAs) are voluntary agreements that allow eligible energy-intensive sectors to receive up to 90% reduction in the Climate Change Levy (CCL) if they sign up to stretching energy efficiency targets agreed with Government. The new CCA scheme was launched on 1 April 2013 and contains 53 industrial sectors across more than 8,000 sites. The scheme runs until 2023 and if all sectors meet their targets from 2013 to 2020 against agreed baselines, the scheme is estimated to deliver an overall 11%
ANNUAL REPORT AND ACCOUNTS 2015–16
176
energy efficiency improvement and savings to participants on the CCL of around £300 million each year. A number of simplifications were made to the scheme when it was launched in 2013. These include:• the Environment Agency administering the
new scheme on a cost-recovery basis, providing a simplified and streamlined approach to administration for both Government and Industry;
• participants being able meet their targets either by direct action, or by using a buy-out mechanism for any shortfall against targets. Any over-achievement by a target unit may be banked and used by that target unit against future targets without having to be verified by a third party; and
• the introduction of civil penalties for minor infractions not warranting decertification or termination.
These simplifications mean that there are 3 potential money streams:1. Charging Income – Paid by CCA participants
to the Administrator on an annual basis, in accordance with a charging scheme established under paragraph 52C Finance Act 2000, Schedule 6 (as amended by Finance Act 2012). These monies are retained by the Environment Agency and will not feature in the Trust Statement.
2. Civil Penalties – Payments received by the Administrator for minor infractions, passed by the Department to the Consolidated Fund in accordance with powers given in 52F Finance Act 2000, Schedule 6 (as amended by Finance Act 2012). The amounts are specified in The Climate Change Agreements (Administration) Regulations 2012.
3. Buy-out Payments – Payments made by participants at the end of each 2-year target period in cases where CCA targets are not met. Payments are calculated on the basis of £12 per tonne of CO2 by which
the target is exceeded. The powers are given in 52F Finance Act 2000, Schedule 6 (as amended by Finance Act 2012). The amount is specified in The Climate Change Agreements (Administration) Regulations 2012.
In 2015-16, collection of buy-out payment income commenced raising £22.5 million. This will continue for both buy-out payments and civil penalties, until the scheme ends in 2023.
Future developments
EU ETS The Department has agreed a schedule of Phase III general allowance auctions through to December 2016 and will announce further auctions in due course.
Petroleum LicencesA second tranche of licences have been offered in 2015-16 as part of the 28th Offshore Licensing Round. Some 100 or so (part-)blocks were on offer. These award of these licences is conditional on compliance with the Offshore Safety Directive Regulations. These licences all had a start date of 1st September 2015 and most licences had been issued (awarded) by 31st March 2016. Eight licences are still yet to be awarded, so will not be invoiced until the 2016-17 accounting period.The final decision on the award of licences in the 14th Onshore Licensing Round has been further deferred to the 2016-17 accounting period. The OGA is finalising the individual licences with a view to awarding them in 2016-17. The conditions set out in the Surface Development Restrictions for Hydraulic Fracturing will be included in these finalised licences, once the results of the current consultation exercise are known.The Oil and Gas Authority (OGA), having formally started operation on 1 April 2015, is expected to become a Government-Owned Company (GovCo) in the summer of 2016, subject to the current Government’s legislative programme and the approval of Parliament. In the interim it is intended that the OGA will operate and act as closely as possible to its final form as
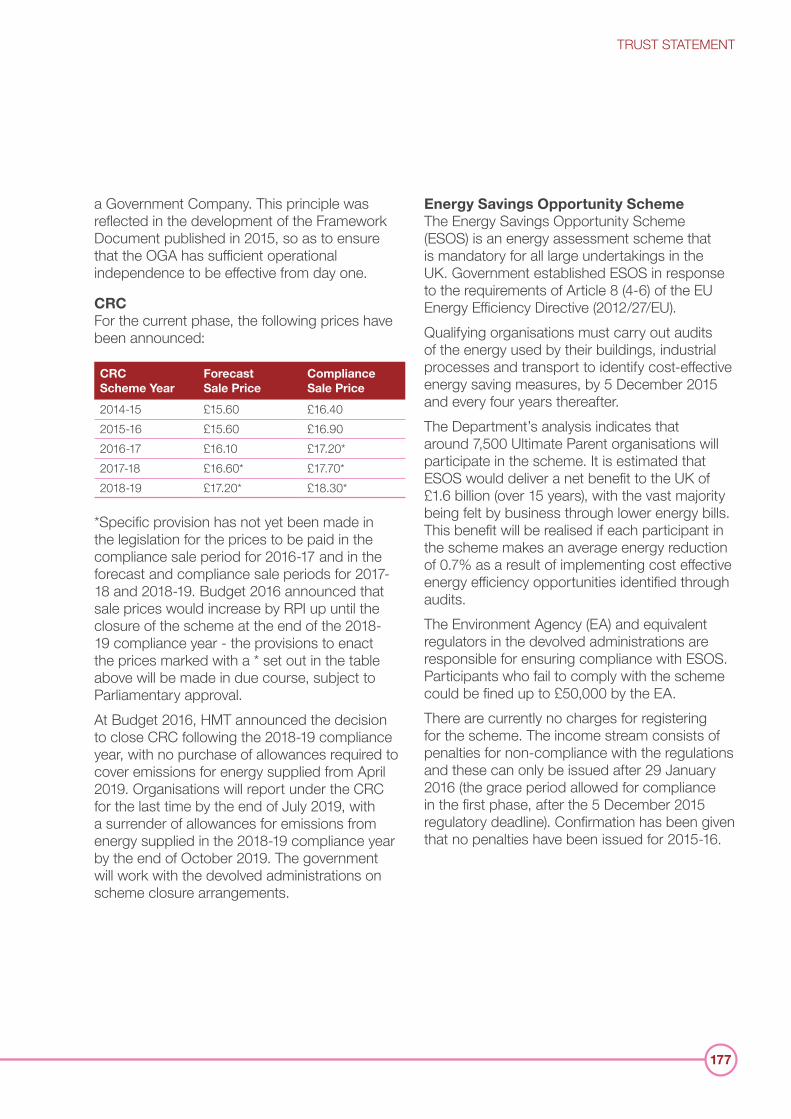
TRUST STATEMENT
177
a Government Company. This principle was reflected in the development of the Framework Document published in 2015, so as to ensure that the OGA has sufficient operational independence to be effective from day one.
CRC For the current phase, the following prices have been announced:
CRC Scheme Year
Forecast Sale Price
Compliance Sale Price
2014-15 £15.60 £16.402015-16 £15.60 £16.902016-17 £16.10 £17.20*2017-18 £16.60* £17.70*2018-19 £17.20* £18.30*
*Specific provision has not yet been made in the legislation for the prices to be paid in the compliance sale period for 2016-17 and in the forecast and compliance sale periods for 2017-18 and 2018-19. Budget 2016 announced that sale prices would increase by RPI up until the closure of the scheme at the end of the 2018-19 compliance year - the provisions to enact the prices marked with a * set out in the table above will be made in due course, subject to Parliamentary approval. At Budget 2016, HMT announced the decision to close CRC following the 2018-19 compliance year, with no purchase of allowances required to cover emissions for energy supplied from April 2019. Organisations will report under the CRC for the last time by the end of July 2019, with a surrender of allowances for emissions from energy supplied in the 2018-19 compliance year by the end of October 2019. The government will work with the devolved administrations on scheme closure arrangements.
Energy Savings Opportunity SchemeThe Energy Savings Opportunity Scheme (ESOS) is an energy assessment scheme that is mandatory for all large undertakings in the UK. Government established ESOS in response to the requirements of Article 8 (4-6) of the EU Energy Efficiency Directive (2012/27/EU).Qualifying organisations must carry out audits of the energy used by their buildings, industrial processes and transport to identify cost-effective energy saving measures, by 5 December 2015 and every four years thereafter.The Department’s analysis indicates that around 7,500 Ultimate Parent organisations will participate in the scheme. It is estimated that ESOS would deliver a net benefit to the UK of £1.6 billion (over 15 years), with the vast majority being felt by business through lower energy bills. This benefit will be realised if each participant in the scheme makes an average energy reduction of 0.7% as a result of implementing cost effective energy efficiency opportunities identified through audits.The Environment Agency (EA) and equivalent regulators in the devolved administrations are responsible for ensuring compliance with ESOS. Participants who fail to comply with the scheme could be fined up to £50,000 by the EA.There are currently no charges for registering for the scheme. The income stream consists of penalties for non-compliance with the regulations and these can only be issued after 29 January 2016 (the grace period allowed for compliance in the first phase, after the 5 December 2015 regulatory deadline). Confirmation has been given that no penalties have been issued for 2015-16.
ANNUAL REPORT AND ACCOUNTS 2015–16
178
Financial review
EU ETS The UK has held 25 EUA and two EUAA auctions between 1 April and 31 March 2016 that yielded income of £415 million (whereas the same period in 2014-15 yielded £308 million) as shown in Note 2.2 of the Trust Statement. All the auctions were wholly competitive auctions. For each auction the total amount received was passed to the Consolidated Fund within a few days of the auction. The timing of the revenues in euros and onward transfer in sterling gave rise to exchange differences in the case of each auction totalling £432,000 (2014-15: £407,000). These exchange differences are recognised in the Statement of Revenue, Other Income and Expenditure. There were 242 civil penalties totalling £4.9 million levied under the EU ETS scheme for the year under review (2014-15: 6 penalties totalling £256,000). The variance in receipts is explained by the following information.Most of the penalties relate to non-compliance with targets for installations in the UK small emitter opt-out scheme, who have opted out of the main requirements of the ETS. The opt-out requires that installations have to keep their emissions below a set target; for every tonne of CO2 emitted above their target, a penalty is charged, which is not subject to appeal. The penalties for the calendar year 2013 were late in the financial year 2014-15 and thus did not fall due until 2015-16. The penalties for the calendar year 2014 were imposed during FY 2015-16. In total these add up to over 200 penalties. There was also a backlog of penalties for reporting errors which were addressed during FY 2015-16. The backlog occurred due to delay in the amended legislation to allow discretion to be applied. Penalties were also issued for failure to surrender allowances or late surrender to 25 aviation operators relating to the 2012 scheme year.
The delays occurred because the processes, consultation and publication of penalties (as per enforcement and sanctions guidance) were under development by the administrator. The EA has now established these, and expects penalties to be progressed more quickly.The EA expects less penalties in the future but these are expected to be in excess of 100 per year due to the opt out scheme which requires to recover the payment for excess emissions via a civil penalty.The costs associated with administering the scheme were borne by the Department as shown in Note 4 and included within the Department’s accounts.
Petroleum LicencesFees received in respect of Petroleum licences amounted to £70 million in 2015-16 (2014-15: £69 million). Under Section 2 of the Miscellaneous Financial Provisions Act 1968, the Northern Ireland Government is entitled to a share of the proceeds received under the regime, totalling £1.6 million (2014-15: £1.85 million). These payments are recognised in the Statement of Revenue, Other Income and Expenditure.The costs associated with administering the licensing regime were borne by the OGA and are reported in Note 4 and included within the Agency’s accounts.
TRUST STATEMENT
179
CRCAllowance sales under the CRC Scheme generated £755 million (2014-15: £874 million). The significant decrease in income in 2015-16 is connected to the introduction of phase 2 of the scheme in 2014-15. This resulted in two allowance sales a year. The forecast auction allowed participants to purchase allowances in advance at a lower price. This increased revenue collected in 2014-15 because some participants purchased allowances in 2014-15 for subsequent years of phase 2. Revenue collected in the June 2015 auction was also inflated because of incorrect prices, 50p higher per allowance were used, whereby the original published price was £16.10 per allowance, rather than £15.60 per allowance as per the regulations in force. This was identified, and all participants affected were informed and refunds were paid.There were 12 civil penalties levied against companies participating in the CRC Scheme in the financial year under review. The civil penalties amounted to £110,000 (2014-15: nil).The costs incurred in administering the CRC Scheme were borne by the Department as shown in Note 4 and included within the Department’s accounts.
CCABuy-out payments income generated from the Phase 1 reporting cycle of the CCA generated £22.5 million in 2015-16. This is the first year of reporting for this income stream.
AuditorsThese financial statements have been audited, under the Government Resources and Accounts Act 2000, by the Comptroller and Auditor General (C&AG), who is appointed under statute and reports to Parliament. The audit opinion is on 182 to 183. The auditor’s notional remuneration is included within the Department’s accounts. There were no fees in respect of non-audit work.
Basis for preparationThe HM Treasury Accounts Direction, issued under section 7(2) of the Government Resources and Accounts Act 2000, requires the Department to prepare the Trust Statement to give a true and fair view of the state of affairs relating to the collection and allocation of the carbon allowance auction receipts for the EU Emissions Trading Schemes, the receipts from the Petroleum Licences regime collected by the OGA (together with the revenue, expenditure and cash flows for the financial year), the allowances sales from the CRC scheme, buy-out payments from the CCA Scheme and civil penalties receivable under the EU ETS, CRC and CCA schemes. Regard is given to all relevant accounting and disclosure requirements given in Managing Public Money and other guidance issued by HM Treasury.
Accounting judgements As the Accounting Officer, it is my responsibility to apply suitable accounting policies in the preparation of the Trust Statement. These are all detailed in Note 1 to the Trust Statement.All the transactions within the Trust Statement reflect transactions that have taken place in the financial year and consequently do not require accounting judgements to be made.
Events after the reporting periodDetails of events after the reporting period are given in Note 11 to the Trust Statement.
ANNUAL REPORT AND ACCOUNTS 2015–16
180
STATEMENT OF THE ACCOUNTING OFFICER’S RESPONSIBILITIES IN RESPECT OF THE TRUST STATEMENTUnder section 7 of the Government Resources and Accounts Act 2000, HM Treasury has directed the Department of Energy & Climate Change to prepare for each financial year a Trust Statement in the form and on the basis set out in the Accounts Direction.HM Treasury has appointed the Permanent Secretary as Accounting Officer of the Department of Energy & Climate Change with overall responsibility for preparing the Trust Statement and for transmitting it to the Comptroller and Auditor General.The Accounting Officer is responsible for ensuring that there is a high standard of financial management, including a sound system of internal control; that financial systems and procedures promote the efficient and economical conduct of business and safeguard financial propriety and regularity; that financial considerations are fully taken into account in decisions on policy proposals; and that risk is considered in relation to assessing value for money.
The Accounting Officer is responsible for the fair and efficient administration of the EU Emissions Trading Scheme (EU ETS) including conducting the auction of EU Allowances in the UK for Phase III of the Scheme and Aviation allowances of the EU ETS, collection of the proceeds and onward transmission of the funds in their entirety to the Consolidated Fund. The Accounting Officer is also responsible for the collection of CRC Allowances and CCA buy-out payments for onward transmission to the Consolidated Fund and, the collection of civil penalties levied under the CCA, CRC, ESOS and EU ETS schemes for onward transmission to the Consolidated Fund.The Accounting Officer of the OGA is responsible for the collection of Petroleum Licences receipts and their onward transmission to the Consolidated Fund.The responsibilities of the Accounting Officer, including responsibility for the propriety and regularity of the public finances for which an Accounting Officer is answerable, for keeping proper records and for safeguarding the Department’s assets, are set out in Managing Public Money published by HM Treasury.The Trust Statement must give a true and fair view of: • the state of affairs of the EU ETS Scheme and
Petroleum Licensing regime, and penalties issued under the EU ETS, ESOS, CCA and CRC Schemes. These streams of income are recognised on an accruals basis;
• the state of affairs of the CRC Allowance Scheme sales which are recognised on a cash received basis; and
• the revenue collected and expenditure incurred together with the net amounts surrendered to the Consolidated Fund.
TRUST STATEMENT
181
In preparing the Trust Statement, the Accounting Officer is required to comply with the requirements of the Government Financial Reporting Manual and in particular to:• observe the Accounts Direction issued by HM
Treasury, including the relevant accounting and disclosure requirements, and apply suitable accounting policies on a consistent basis;
• make judgements and estimates on a reasonable basis;
• state whether applicable accounting standards as set out in the Government Financial Reporting Manual have been followed, and disclose and explain any material departures in the accounts; and
• prepare the Trust Statement on a going concern basis.
Governance StatementThe Department’s Governance Statement, covering both the accounts and the Trust Statement, is included in Governance section of this Report.
Jeremy PocklingtonPrincipal Accounting Officer and Acting Permanent Secretary1 July 2016
ANNUAL REPORT AND ACCOUNTS 2015–16
182
THE CERTIFICATE AND REPORT OF THE COMPTROLLER AND AUDITOR GENERAL TO THE HOUSE OF COMMONS I certify that I have audited the financial statements of the Department of Energy & Climate Change Trust Statement for the year ended 31 March 2016 under the Government Resources and Accounts Act 2000. The financial statements comprise the Statement of Revenue, Other Income and Expenditure; the Statement of Financial Position; the Statement of Cash Flows and the related notes. These financial statements have been prepared under the accounting policies set out within them.
Respective responsibilities of the Accounting Officer and auditorAs explained more fully in the Statement of Accounting Officer’s Responsibilities, the Accounting Officer is responsible for the preparation of the financial statements and for being satisfied that they give a true and fair view. My responsibility is to audit, certify and report on the financial statements in accordance with the Government Resources and Accounts Act 2000. I conducted my audit in accordance with International Standards on Auditing (UK and Ireland). Those standards require me and my staff to comply with the Auditing Practices Board’s Ethical Standards for Auditors.
Scope of the audit of the financial statementsAn audit involves obtaining evidence about the amounts and disclosures in the financial statements sufficient to give reasonable assurance that the financial statements are free from material misstatement, whether caused by fraud or error. This includes an assessment of: whether the accounting policies are appropriate to the circumstances of the Department of Energy & Climate Change Trust Statement and have been consistently applied and adequately disclosed; the reasonableness of significant accounting estimates made by the Department; and the overall presentation of the financial statements. In addition I read all the financial and non-financial information in the Accounting Officer’s Forward to the Trust Statement, to identify material inconsistencies with the audited financial statements and to identify any information that is apparently materially incorrect based on, or materially inconsistent with, the knowledge acquired by me in the course of performing the audit. If I become aware of any apparent material misstatements or inconsistencies I consider the implications for my certificate. I am required to obtain evidence sufficient to give reasonable assurance that the expenditure and income recorded in the financial statements have been applied to the purposes intended by Parliament and the financial transactions recorded in the financial statements conform to the authorities which govern them.
Opinion on regularityIn my opinion, in all material respects the expenditure and income recorded in the financial statements have been applied to the purposes intended by Parliament and the financial transactions recorded in the financial statements conform to the authorities which govern them.
TRUST STATEMENT
183
Opinion on financial statements In my opinion:• the Department of Energy & Climate Change
Trust Statement gives a true and fair view of the state of affairs of balances stemming from the collection of EU Emissions Trading Scheme (ETS) auction receipts; Carbon Reduction Commitments (CRC) allowance sales; Climate Change Agreements (CCA) receipts; Petroleum Licences receipts; and EU ETS, CRC, CCA and Energy Savings Opportunity Scheme (ESOS) civil penalties as at 31 March 2016 and of the net revenue for the year then ended; and
• the financial statements have been properly prepared in accordance with the Government Resources and Accounts Act 2000 and HM Treasury directions issued thereunder.
Opinion on other mattersIn my opinion:• the information given in Accounting Officer’s
Forward for the financial year for which the financial statements are prepared is consistent with the financial statements.
Matters on which I report by exceptionI have nothing to report in respect of the following matters which I report to you if, in my opinion:• adequate accounting records have not been
kept or returns adequate for my audit have not been received from branches not visited by my staff; or
• the financial statements are not in agreement with the accounting records and returns; or
• I have not received all of the information and explanations I require for my audit; or
• the Governance Statement does not reflect compliance with HM Treasury’s guidance.
ReportI have no observations to make on these financial statements.
Sir Amyas C E MorseComptroller and Auditor General National Audit Office 157-197 Buckingham Palace Road Victoria, London SW1W 9SP 6 July 2016
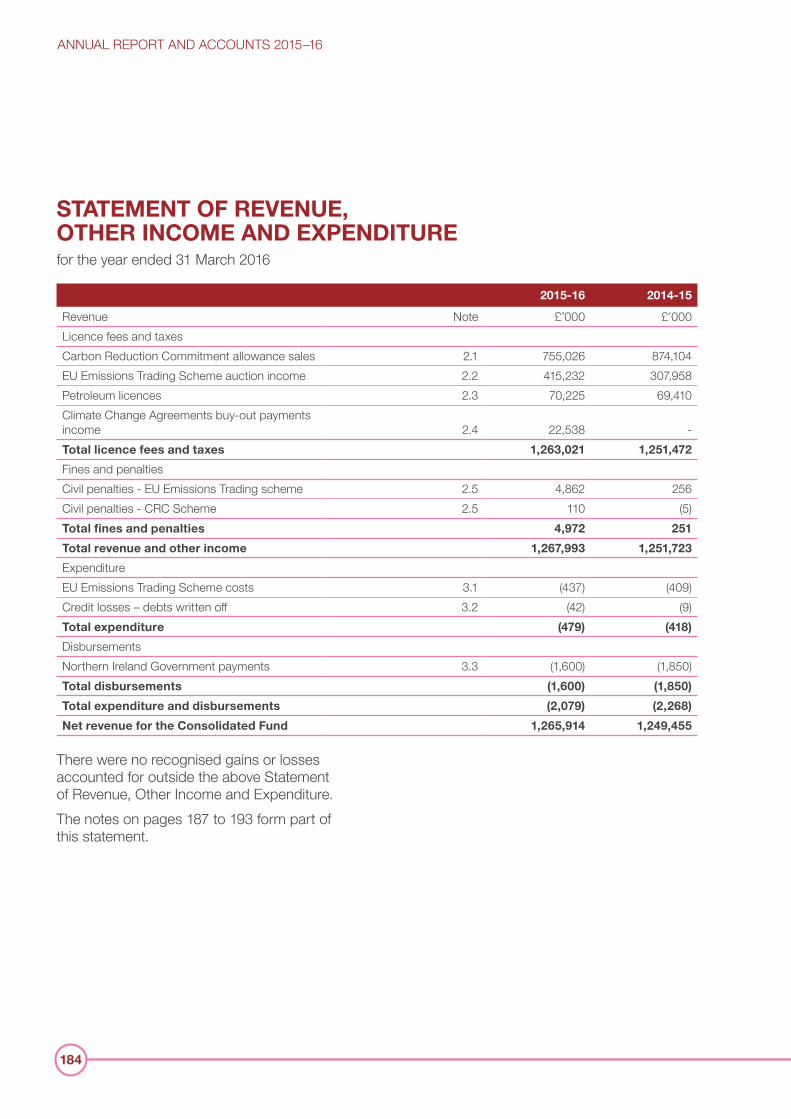
ANNUAL REPORT AND ACCOUNTS 2015–16
184
STATEMENT OF REVENUE, OTHER INCOME AND EXPENDITUREfor the year ended 31 March 2016
2015-16 2014-15
Revenue Note £’000 £’000Licence fees and taxesCarbon Reduction Commitment allowance sales 2.1 755,026 874,104EU Emissions Trading Scheme auction income 2.2 415,232 307,958Petroleum licences 2.3 70,225 69,410Climate Change Agreements buy-out payments income 2.4 22,538 -Total licence fees and taxes 1,263,021 1,251,472
Fines and penaltiesCivil penalties - EU Emissions Trading scheme 2.5 4,862 256Civil penalties - CRC Scheme 2.5 110 (5)Total fines and penalties 4,972 251
Total revenue and other income 1,267,993 1,251,723
ExpenditureEU Emissions Trading Scheme costs 3.1 (437) (409)Credit losses – debts written off 3.2 (42) (9)Total expenditure (479) (418)
DisbursementsNorthern Ireland Government payments 3.3 (1,600) (1,850)Total disbursements (1,600) (1,850)
Total expenditure and disbursements (2,079) (2,268)
Net revenue for the Consolidated Fund 1,265,914 1,249,455
There were no recognised gains or losses accounted for outside the above Statement of Revenue, Other Income and Expenditure.The notes on pages 187 to 193 form part of this statement.
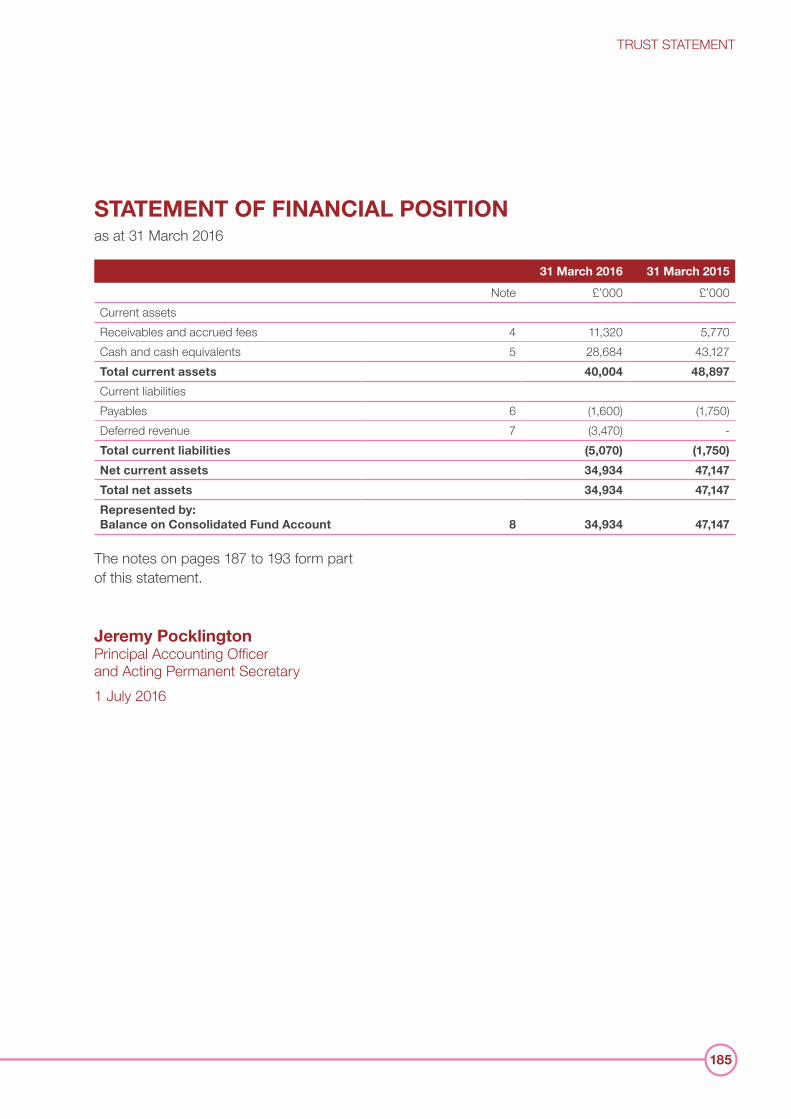
TRUST STATEMENT
185
STATEMENT OF FINANCIAL POSITIONas at 31 March 2016
31 March 2016 31 March 2015
Note £’000 £’000Current assetsReceivables and accrued fees 4 11,320 5,770Cash and cash equivalents 5 28,684 43,127Total current assets 40,004 48,897
Current liabilitiesPayables 6 (1,600) (1,750)Deferred revenue 7 (3,470) -Total current liabilities (5,070) (1,750)
Net current assets 34,934 47,147
Total net assets 34,934 47,147
Represented by: Balance on Consolidated Fund Account 8 34,934 47,147
The notes on pages 187 to 193 form part of this statement.
Jeremy PocklingtonPrincipal Accounting Officer and Acting Permanent Secretary1 July 2016
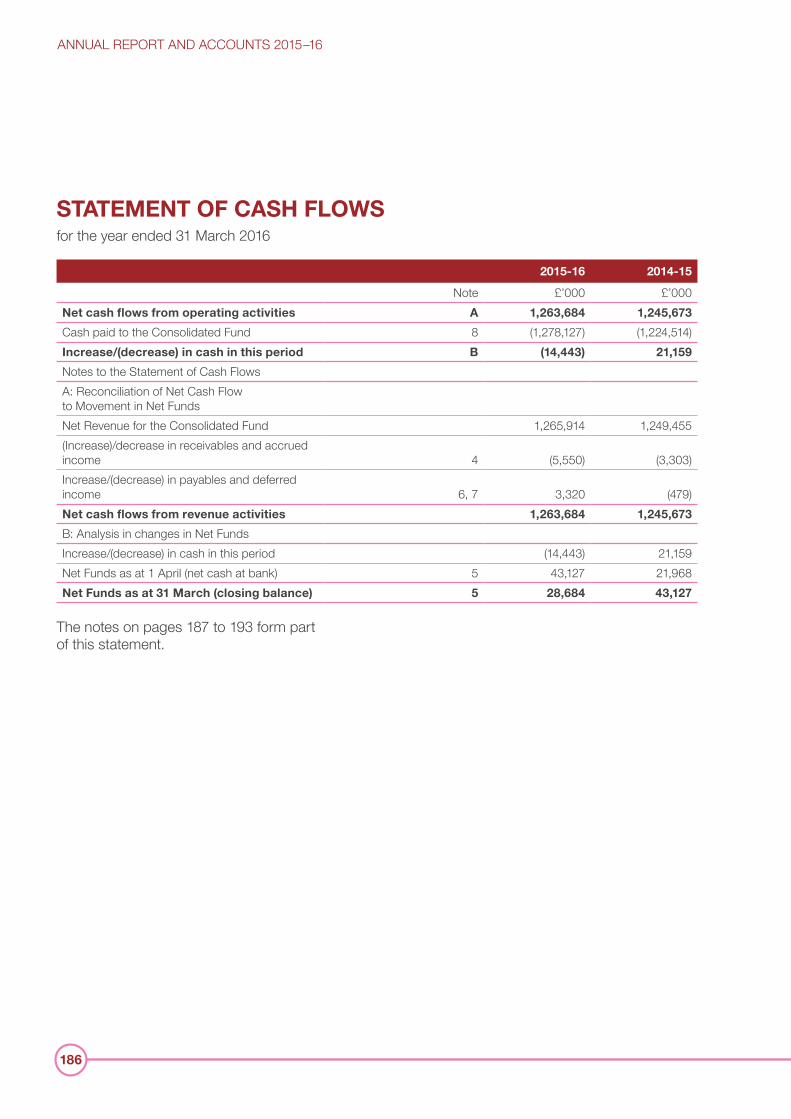
ANNUAL REPORT AND ACCOUNTS 2015–16
186
STATEMENT OF CASH FLOWS for the year ended 31 March 2016
2015-16 2014-15
Note £’000 £’000Net cash flows from operating activities A 1,263,684 1,245,673
Cash paid to the Consolidated Fund 8 (1,278,127) (1,224,514)Increase/(decrease) in cash in this period B (14,443) 21,159
Notes to the Statement of Cash FlowsA: Reconciliation of Net Cash Flow to Movement in Net FundsNet Revenue for the Consolidated Fund 1,265,914 1,249,455(Increase)/decrease in receivables and accrued income 4 (5,550) (3,303)Increase/(decrease) in payables and deferred income 6, 7 3,320 (479)Net cash flows from revenue activities 1,263,684 1,245,673
B: Analysis in changes in Net FundsIncrease/(decrease) in cash in this period (14,443) 21,159Net Funds as at 1 April (net cash at bank) 5 43,127 21,968Net Funds as at 31 March (closing balance) 5 28,684 43,127
The notes on pages 187 to 193 form part of this statement.
TRUST STATEMENT
187
NOTES TO THE TRUST STATEMENT
1 STATEMENT OF ACCOUNTING POLICIES
1.1 Basis of accountingThe Trust Statement is prepared in accordance with the Accounts Direction issued by HM Treasury under section 7(2) of the Government Resources and Accounts Act 2000. The Trust Statement is prepared in accordance with the accounting policies detailed below. These have been agreed between the Department of Energy & Climate Change (the Department) and HM Treasury and have been developed in accordance with International Financial Reporting Standards (IFRS) and other relevant guidance. The accounting policies have been applied consistently in dealing with items considered material in relation to the accounts.The income and associated expenditure contained in the Trust Statement are those flows of funds which the Department and the OGA administer on behalf of the Consolidated Fund.The financial information in the Trust Statement is rounded to the nearest £’000.The Trust Statement is presented in pounds sterling, which is the functional currency of the Department.
1.2 Accounting conventionThe Trust Statement has been prepared in accordance with the historical cost convention.
1.3 Revenue recognitionRevenue is recognised when it can be measured reliably and it is probable that the economic benefits will flow to the Exchequer. It is measured at the Fair Value of amounts received or receivable, net of repayments.EU Emissions Trading Scheme receipts represent proceeds from the auction of carbon allowances under Phase III and aviation allowances of the EU Emissions Trading Scheme. Revenue is recognised at the close of each competitive auction, when the revenue can be measured reliably. Revenue in respect of petroleum licence fees is recognised when it falls due, which is on the anniversary date of each existing licence.Revenue in respect of CRC allowance sales is recognised on a cash received basis.Revenue in respect of CCA buy-out payments is recognised on an accruals basis. The recognition point is when the income is received.Revenue in respect of civil penalties is recognised when the penalty is imposed.CRC participants may request refunds for over-surrendered allowances (Note 10 Contingent Liabilities refers). These are accounted for in the period in which the refund request is authorised and processed.
1.4 Financial instrumentsA financial instrument is any contract that gives rise to a financial asset of one entity and a financial liability or equity instrument of another entity. Financial assets and financial liabilities are recognised in the Statement of Financial Position when the Department becomes a party to the contractual provisions of an instrument.
ANNUAL REPORT AND ACCOUNTS 2015–16
188
1.5 Financial assetsThe Department classifies financial assets into the following categories:• loans and receivables; and• cash and cash equivalents.Loans and receivables comprise:• for EU ETS the amounts due from
Primary Participants in respect of established auction liabilities for which, at the financial year end, payments had not been received. The amounts due are measured at Fair Value calculated at the close of each auction and have a maturity of less than three months;
• for Petroleum licences the amounts due from companies for the licence fees invoiced which have not been received at the financial year end together with accrued amounts receivable which have not been invoiced at the year-end; and
• civil penalties levied against participants in the EU ETS, CCA and CRC Schemes, amounts for which have not been received at the financial year end.
The carrying amount of these assets approximates to their Fair Value.Cash and cash equivalents comprises current balances with banks and other financial institutions, which are readily convertible to known amounts of cash and which are subject to insignificant risk of changes in value and have an original maturity of three months or less. The carrying amount of these assets approximates to their Fair Value.
1.6 Financial liabilitiesThe Department classifies financial liabilities into the following two categories:• financial liabilities at Fair Value through
profit or loss; and• other financial liabilities.The categorisation depends on the purpose for which the financial liability is held or acquired. Management determines the categorisation of financial liabilities at initial recognition and re-evaluates this designation at each reporting date.For the purposes of this Trust Statement the Department holds financial liabilities in the following category:• other financial liabilities.Other financial liabilities comprise:• payables in the Statement of Financial
Position. Payables are amounts established as due at the reporting date, but where payment is made subsequently; and
• deferred revenue which represents petroleum licence income invoiced and received in advance relating to a future financial year.
Since these balances are expected to be settled within twelve months of the reporting date there is no material difference between Fair Value, amortised cost and historical cost.
1.7 Foreign currencyTransactions that are denominated in a foreign currency are translated into sterling at the rate of exchange ruling on the date of each transaction. Monetary assets and liabilities denominated in foreign currency at the year-end are translated at the rates ruling at that date unless a forward rate has been fixed with the Bank of England. All translation differences are included in the Statement of Revenue, Other Income and Expenditure for the period.
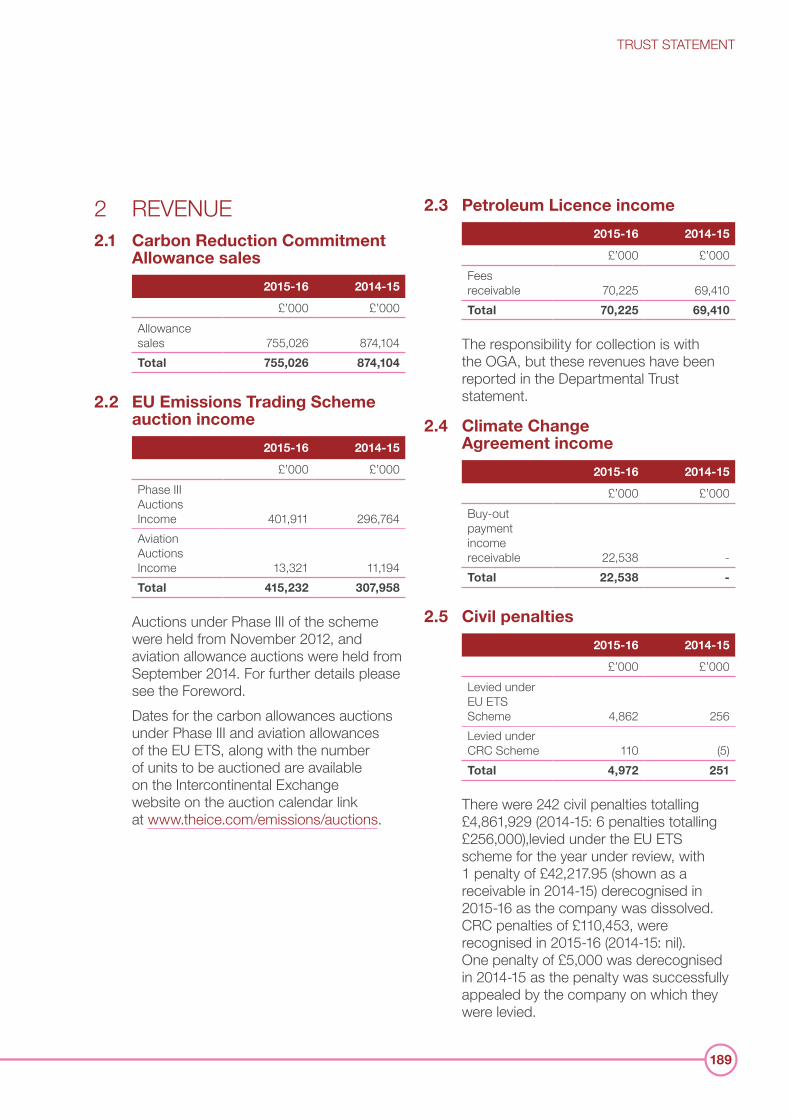
TRUST STATEMENT
189
2 REVENUE 2.1 Carbon Reduction Commitment
Allowance sales
2015-16 2014-15
£’000 £’000Allowance sales 755,026 874,104Total 755,026 874,104
2.2 EU Emissions Trading Scheme auction income
2015-16 2014-15
£’000 £’000Phase III Auctions Income 401,911 296,764Aviation Auctions Income 13,321 11,194Total 415,232 307,958
Auctions under Phase III of the scheme were held from November 2012, and aviation allowance auctions were held from September 2014. For further details please see the Foreword. Dates for the carbon allowances auctions under Phase III and aviation allowances of the EU ETS, along with the number of units to be auctioned are available on the Intercontinental Exchange website on the auction calendar link at www.theice.com/emissions/auctions.
2.3 Petroleum Licence income
2015-16 2014-15
£’000 £’000Fees receivable 70,225 69,410Total 70,225 69,410
The responsibility for collection is with the OGA, but these revenues have been reported in the Departmental Trust statement.
2.4 Climate Change Agreement income
2015-16 2014-15
£’000 £’000Buy-out payment income receivable 22,538 -Total 22,538 -
2.5 Civil penalties
2015-16 2014-15
£’000 £’000Levied under EU ETS Scheme 4,862 256Levied under CRC Scheme 110 (5)Total 4,972 251
There were 242 civil penalties totalling £4,861,929 (2014-15: 6 penalties totalling £256,000),levied under the EU ETS scheme for the year under review, with 1 penalty of £42,217.95 (shown as a receivable in 2014-15) derecognised in 2015-16 as the company was dissolved. CRC penalties of £110,453, were recognised in 2015-16 (2014-15: nil). One penalty of £5,000 was derecognised in 2014-15 as the penalty was successfully appealed by the company on which they were levied.
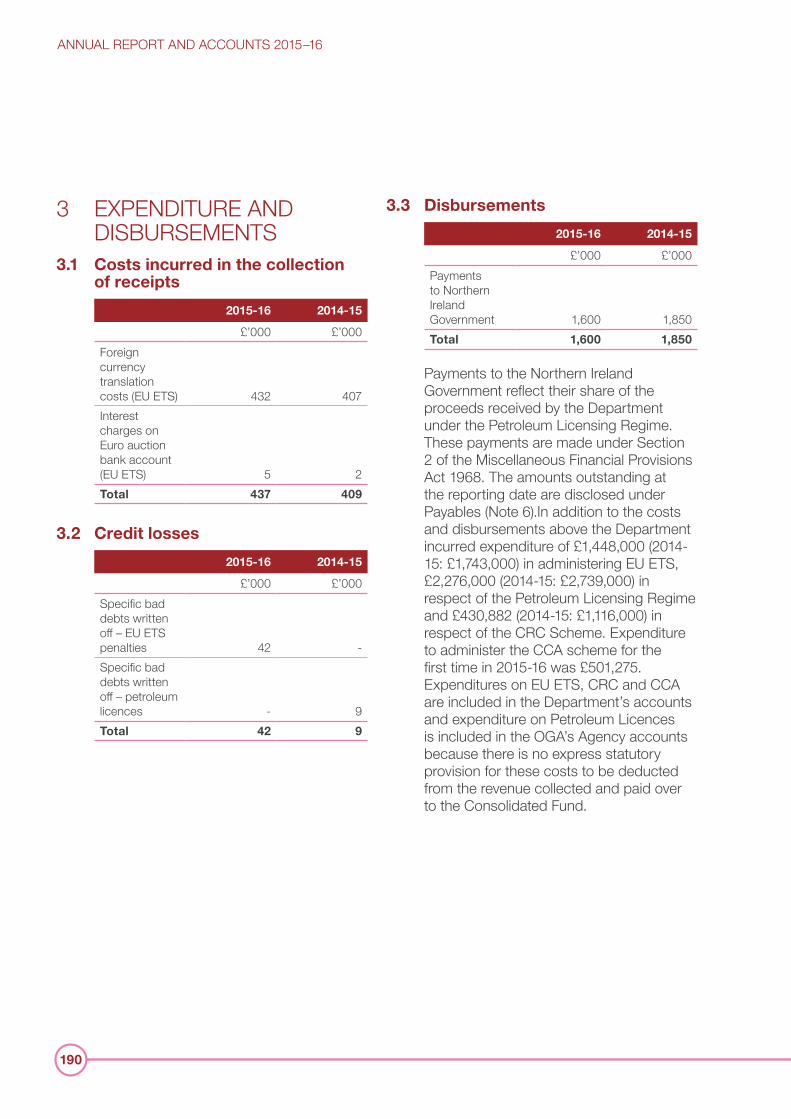
ANNUAL REPORT AND ACCOUNTS 2015–16
190
3 EXPENDITURE AND DISBURSEMENTS
3.1 Costs incurred in the collection of receipts
2015-16 2014-15
£’000 £’000Foreign currency translation costs (EU ETS) 432 407Interest charges on Euro auction bank account (EU ETS) 5 2Total 437 409
3.2 Credit losses
2015-16 2014-15
£’000 £’000Specific bad debts written off – EU ETS penalties 42 -Specific bad debts written off – petroleum licences - 9Total 42 9
3.3 Disbursements
2015-16 2014-15
£’000 £’000Payments to Northern Ireland Government 1,600 1,850Total 1,600 1,850
Payments to the Northern Ireland Government reflect their share of the proceeds received by the Department under the Petroleum Licensing Regime. These payments are made under Section 2 of the Miscellaneous Financial Provisions Act 1968. The amounts outstanding at the reporting date are disclosed under Payables (Note 6).In addition to the costs and disbursements above the Department incurred expenditure of £1,448,000 (2014-15: £1,743,000) in administering EU ETS, £2,276,000 (2014-15: £2,739,000) in respect of the Petroleum Licensing Regime and £430,882 (2014-15: £1,116,000) in respect of the CRC Scheme. Expenditure to administer the CCA scheme for the first time in 2015-16 was £501,275. Expenditures on EU ETS, CRC and CCA are included in the Department’s accounts and expenditure on Petroleum Licences is included in the OGA’s Agency accounts because there is no express statutory provision for these costs to be deducted from the revenue collected and paid over to the Consolidated Fund.
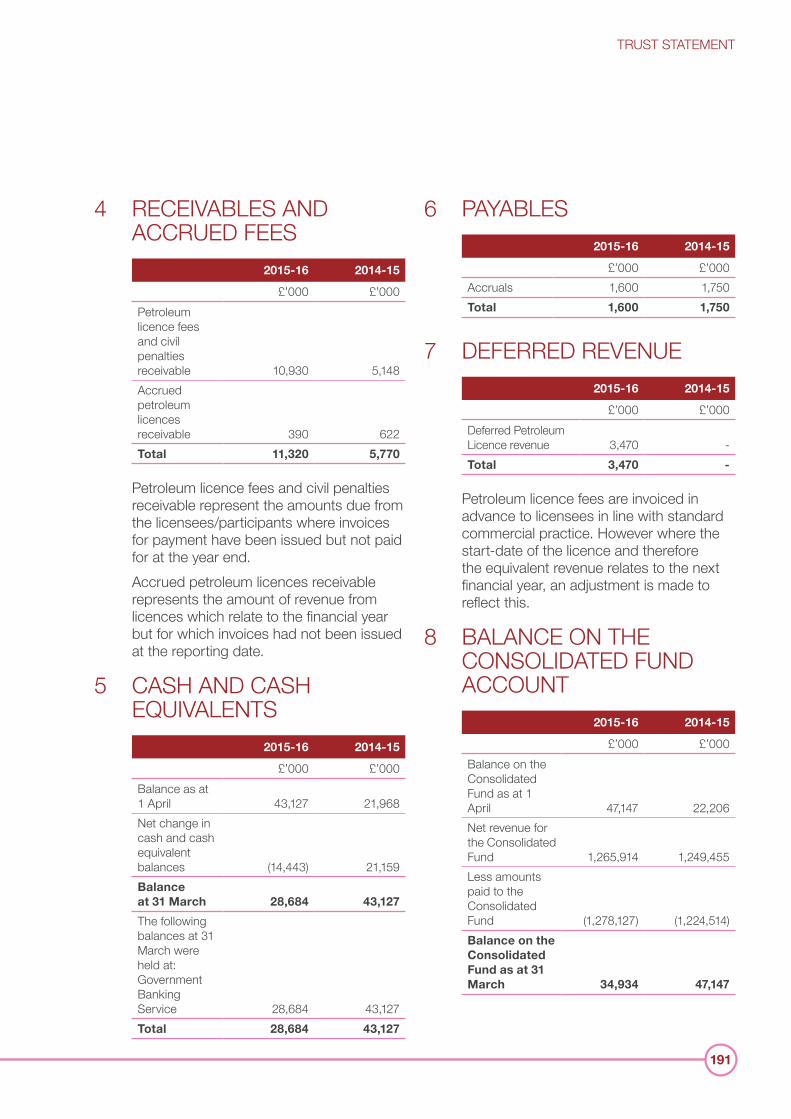
TRUST STATEMENT
191
4 RECEIVABLES AND ACCRUED FEES
2015-16 2014-15
£’000 £’000Petroleum licence fees and civil penalties receivable 10,930 5,148Accrued petroleum licences receivable 390 622Total 11,320 5,770
Petroleum licence fees and civil penalties receivable represent the amounts due from the licensees/participants where invoices for payment have been issued but not paid for at the year end. Accrued petroleum licences receivable represents the amount of revenue from licences which relate to the financial year but for which invoices had not been issued at the reporting date.
5 CASH AND CASH EQUIVALENTS
2015-16 2014-15
£’000 £’000Balance as at 1 April 43,127 21,968Net change in cash and cash equivalent balances (14,443) 21,159Balance at 31 March 28,684 43,127
The following balances at 31 March were held at: Government Banking Service 28,684 43,127Total 28,684 43,127
6 PAYABLES2015-16 2014-15
£’000 £’000Accruals 1,600 1,750Total 1,600 1,750
7 DEFERRED REVENUE2015-16 2014-15
£’000 £’000Deferred Petroleum Licence revenue 3,470 -Total 3,470 -
Petroleum licence fees are invoiced in advance to licensees in line with standard commercial practice. However where the start-date of the licence and therefore the equivalent revenue relates to the next financial year, an adjustment is made to reflect this.
8 BALANCE ON THE CONSOLIDATED FUND ACCOUNT
2015-16 2014-15
£’000 £’000Balance on the Consolidated Fund as at 1 April 47,147 22,206Net revenue for the Consolidated Fund 1,265,914 1,249,455Less amounts paid to the Consolidated Fund (1,278,127) (1,224,514)Balance on the Consolidated Fund as at 31 March 34,934 47,147
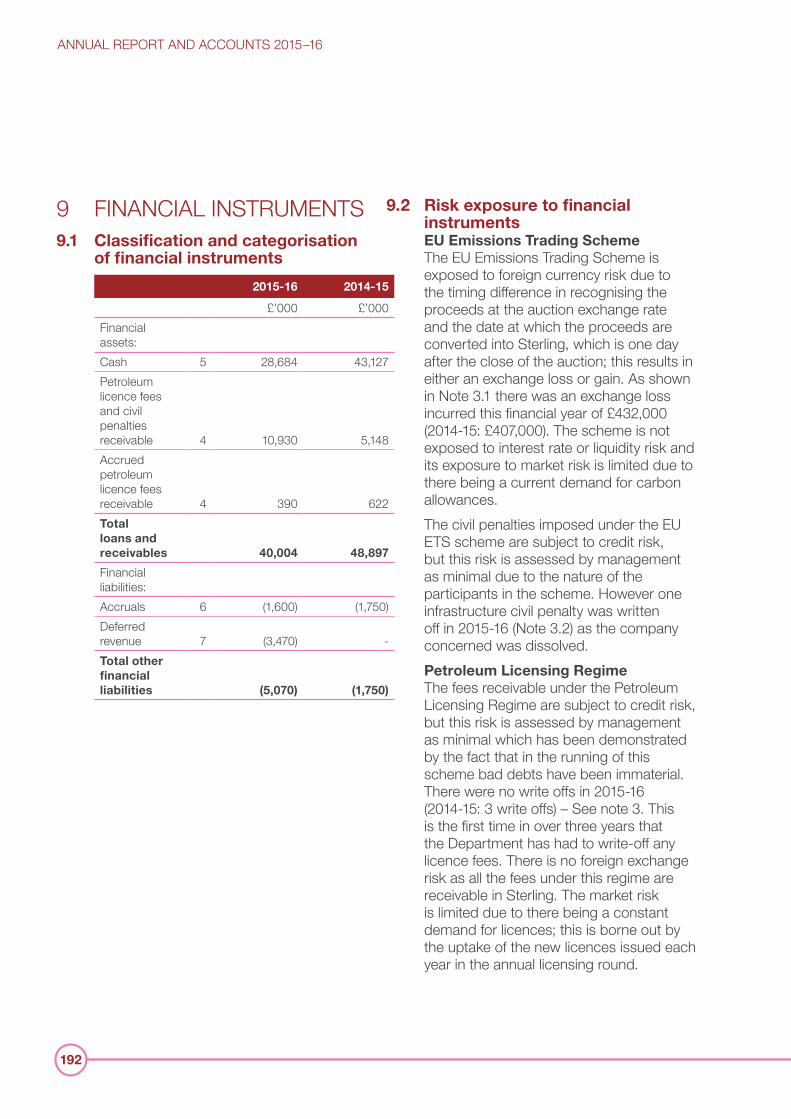
ANNUAL REPORT AND ACCOUNTS 2015–16
192
9 FINANCIAL INSTRUMENTS9.1 Classification and categorisation
of financial instruments
2015-16 2014-15
£’000 £’000Financial assets:Cash 5 28,684 43,127Petroleum licence fees and civil penalties receivable 4 10,930 5,148Accrued petroleum licence fees receivable 4 390 622Total loans and receivables 40,004 48,897
Financial liabilities:Accruals 6 (1,600) (1,750)Deferred revenue 7 (3,470) -Total other financial liabilities (5,070) (1,750)
9.2 Risk exposure to financial instrumentsEU Emissions Trading SchemeThe EU Emissions Trading Scheme is exposed to foreign currency risk due to the timing difference in recognising the proceeds at the auction exchange rate and the date at which the proceeds are converted into Sterling, which is one day after the close of the auction; this results in either an exchange loss or gain. As shown in Note 3.1 there was an exchange loss incurred this financial year of £432,000 (2014-15: £407,000). The scheme is not exposed to interest rate or liquidity risk and its exposure to market risk is limited due to there being a current demand for carbon allowances. The civil penalties imposed under the EU ETS scheme are subject to credit risk, but this risk is assessed by management as minimal due to the nature of the participants in the scheme. However one infrastructure civil penalty was written off in 2015-16 (Note 3.2) as the company concerned was dissolved.Petroleum Licensing RegimeThe fees receivable under the Petroleum Licensing Regime are subject to credit risk, but this risk is assessed by management as minimal which has been demonstrated by the fact that in the running of this scheme bad debts have been immaterial. There were no write offs in 2015-16 (2014-15: 3 write offs) – See note 3. This is the first time in over three years that the Department has had to write-off any licence fees. There is no foreign exchange risk as all the fees under this regime are receivable in Sterling. The market risk is limited due to there being a constant demand for licences; this is borne out by the uptake of the new licences issued each year in the annual licensing round.
TRUST STATEMENT
193
CRC SchemeThe allowance sales under the Carbon Reduction Commitment are subject to credit risk, but this risk is assessed by management as low. This is borne out in the results from previous years of the scheme.The civil penalties imposed under the CRC scheme are subject to credit risk, but this risk is assessed by management as minimal due to the nature of the participants in the scheme.CCA SchemeThe buy-out payment revenue collected under the CCA scheme is subject to credit risk, but this risk is assessed by management as low, due to the nature of participants in the scheme. All fees under the regime are received in sterling minimising any other risks.Information which will allow Trust Statement users to evaluate the significance of financial instruments on the Department’s financial performance and position and the nature and extent of the Department’s exposure to other risks arising from financial instruments can be found in Note 17 to the Department’s accounts.
10 CONTINGENT LIABILITYA contingent liability exists for refunds the Department may have to pay to participants in the CRC Energy Efficiency Scheme who have over-surrendered allowances. This is as a result of legislation included in the CRC Order 2013, which came into force in May 2013. The refunds are contingent upon participants being able to prove that the over-surrender was due to a reporting error and must be agreed by the Secretary of State. The Department is unable to quantify the amount of future refunds, but based on the most recent information available from the scheme administrators, the refunds are not
expected to be significant. Future refunds will be paid as and when they fall due out of future scheme receipts.The Department has issued guidance to participants detailing the refund process.
11 EVENTS AFTER THE REPORTING PERIODOn 23 June, the EU referendum took place and the people of the United Kingdom voted to leave the European Union. Until exit negotiations are concluded, the UK remains a full member of the European Union and all the rights and obligations of EU membership remain in force. During this period the Government will continue to negotiate, implement and apply EU legislation. It will be for the Government, under the new Prime Minister to begin negotiations to exit the EU. The outcome of these negotiations will determine what arrangements apply in relation to EU legislation and funding in future once the UK has left the EU. This is therefore a non-adjusting event for which no estimate of its financial effect on the reporting entity can be made.The Accounting Officer has duly authorised the issue of the Trust Statement on the date of the Comptroller and Auditor General’s audit certificate.
ANNUAL REPORT AND ACCOUNTS 2015–16
194
ANNEX TO THE TRUST STATEMENTAccounts Direction given by HM Treasury in accordance with section 7(2) of the Government Resources and Accounts Act 20001. This direction applies to the government
department listed in appendix 2.2. The Department shall prepare a Trust
Statement (“the Statement”) for the financial year ended 31 March 2016 for the revenue and other income, as directed by the Treasury, collected by the Department as an agent for others, in compliance with the accounting principles and disclosure requirements of the edition of the Government Financial Reporting Manual by HM Treasury (“FReM”) which is in force for 2015-16.
3. The Statement shall be prepared, as prescribed in appendix 1, so as to give a true and fair view of (a) the state of affairs relating to the collection and allocation of taxes, licence fees, fines and penalties and other income by the Department as agent and of the expenses incurred in the collection of those taxes, licence fees, fines and penalties insofar as they can properly be met from that revenue and other income; (b) the revenue and expenditure; and (c) the cash flows for the year then ended.
4. The Statement shall also be prepared so as to provide disclosure of any material expenditure or income that has not been applied to the purposes intended by Parliament or material transactions that have not conformed to the authorities which govern them.
5. When preparing the Statement, the Department shall comply with the guidance given in the FReM (Chapter 8). The Department shall also agree with HM Treasury the format of the Principal Accounting Officer’s Foreword to the Statement, and the supporting notes, and the accounting policies to be adopted, particularly in relation to revenue recognition. Regard shall also be given to all relevant accounting and disclosure requirements in Managing Public Money and other guidance issued by HM Treasury, and to the principles underlying International Financial Reporting Standards.
6. Compliance with the requirements of the FReM will, in all but exceptional circumstances, be necessary for the accounts to give a true and fair view. If, in these exceptional circumstances, compliance with the requirements of the FReM is inconsistent with the requirement to give a true and fair view, the requirements of the FReM should be departed from only to the extent necessary to give a true and fair view. In such cases, informed and unbiased judgement should be used to devise an appropriate alternative treatment which should be consistent with both the economic characteristics of the circumstances concerned and the spirit of the FReM. Any material departure from the FReM should be discussed in the first instance with HM Treasury.
7. The Statement shall be transmitted to the Comptroller and Auditor General for the purpose of his examination and report by a date agreed with the Comptroller and Auditor General and HM Treasury to enable compliance with the administrative deadline for laying the audited accounts before Parliament before the Summer Recess.
TRUST STATEMENT
195
8. The Trust Statement, together with this direction (but with the exception of the related appendices) and the Report produced by the Comptroller and Auditor General under section 7(2) of the Government Resources and Accounts Act 2000 shall be laid before Parliament at the same time as the Department’s Resource Accounts for the year unless the Treasury have agreed that the Trust Statement may be laid at a later date.
9. This direction supersedes the Accounts Direction issued to the Department (listed in appendix 2) on the 18 December 2015 in relation to preparing a Trust Statement for the financial year ended 31 March 2016.
Michael SunderlandActing Deputy Director, Government Financial Reporting Her Majesty’s Treasury29 February 2016
Appendix 1 Trust Statement for the year ended 31 March 2016 1. The Trust Statement shall include:
• a Foreword by the Principal Accounting Officer;
• a Statement of the Principal Accounting Officer’s Responsibilities;
• a Governance Statement; • a Statement of Revenue, Other Income
and Expenditure; • a Statement of Financial Position; • a Cash Flow Statement; and • such notes as may be necessary to
present a true and fair view.
2. The Notes shall include among other items: • the accounting policies, including the
policy for revenue recognition and estimation techniques and forecasting techniques together with statements explaining any significant uncertainty surrounding estimates and forecasts;
• a breakdown of material items within the accounts;
• any assets, including intangible assets and contingent liabilities;
• summaries of losses, write-offs and remissions;
• post balance sheet events; and • any other notes agreed with HM
Treasury and the National Audit Office.
Appendix 2
Sponsoring Department
Income Stream
Responsible Entity
Department of Energy & Climate Change
Petroleum Licences
OGA
Department of Energy & Climate Change
EU Emissions Allowances
Core
Department of Energy & Climate Change
Fines and Penalties
Core
Department of Energy & Climate Change
CRC Allowances
Core
Department of Energy & Climate Change
CCA Buy-Out Payments
Core

ANNEXES
ANNEXES
197
ANNEX A: OUR DELIVERY PARTNERS
Executive agenciesAn executive agency is a body that carries out executive functions on behalf of government. It is independent of its parent department, having responsibility for its overall management and budget.
Oil and Gas Authority (OGA)www.gov.uk/government/organisations/oil-and-gas-authorityThe OGA works with Government and industry to make sure that the UK gets the maximum economic benefit from its oil and gas reserves. It was established on 1 April 2015 and will become a Government-owned company in summer 2016.The OGA is responsible for regulating offshore and onshore oil and gas operations in the UK. This includes:• oil and gas licensing;• oil and gas exploration and production;• oil and gas fields and wells;• oil and gas infrastructure; and• carbon capture and storage (CCS) licensing.
Non-departmental public bodiesEach non-departmental public body (NDPB) is overseen by a sponsor team, which agrees the body’s remit, works with the NDPB to support its high-level aims and monitors performance. Sponsor teams also challenge NDPBs to ensure rules of regularity and propriety are adhered to, and to provide budgetary control.Public appointments to the boards of the NDPBs are made by ministers on merit and in accordance with the Code of Practice of the Office of the Commissioner for Public Appointments.
Executive non-departmental public bodiesExecutive NDPBs publish their own Annual Reports and Accounts (available from their websites or from The Stationery Office). The Department’s accounts are prepared on a group basis which fully consolidates the core Department and the four executive NDPBs as well as our other arms length bodies.
Civil Nuclear Police Authoritywww.cnpa.police.ukThe Civil Nuclear Police Authority is responsible for maintaining an efficient and effective Civil Nuclear Constabulary (CNC) to protect civil nuclear material on licensed nuclear sites not wholly or mainly used for defence purposes.CNC provides international maritime escort operations for shipments of nuclear materials and a permanent armed response presence at 11 UK nuclear sites.
Coal Authoritywww.coal.gov.ukThe Coal Authority resolves the impacts of past coal mining, promotes public safety and safeguards our landscape. It is pursuing a strategy to realise value from its information and people.
Nuclear Decommissioning Authority (NDA)www.nda.gov.ukThe NDA ensures that the UK’s 17 nuclear legacy sites are decommissioned safely, securely, cost-effectively, and in ways that protect the environment. The NDA is subject to the same review arrangements as other bodies, but on a five-year basis, instead of three. The Department is currently considering the next review date for the NDA under the Transformational Review system for Arm’s-Length Bodies’ Reviews introduced by the Cabinet Office in 2015.
ANNUAL REPORT AND ACCOUNTS 2015–16
198
Committee on Climate Changewww.theccc.org.uk The Committee on Climate Change provides independent, evidence-based advice on climate change. In particular, it advises on transition to a low carbon economy and future carbon budgets, and reports on the UK’s preparedness to adapt to climate change.
Advisory non-departmental public bodiesAdvisory NDPBs advise ministers on specific matters. They do not publish separate Annual Report and Accounts, as they are paid for by the Department.
Committee on Radioactive Waste Management (CoRWM)www.corwm.org.ukCoRWM provides independent advice, based on informed scrutiny of the available evidence, to UK Government and Devolved Administration Ministers on the long-term management of radioactive waste, including geological disposal.The Triennial Review of the Committee was published in January 2016 and concluded that CoRWM should remain as an advisory NDPB.
Committee on Fuel Poverty (CFP) www.gov.uk/government/organisations/committee-on-fuel-povertyThe CFP advises on the effectiveness of policies aimed at reducing fuel poverty in England and encourages greater coordination across the organisations working to reduce fuel poverty.The CFP was formerly named the Fuel Poverty Advisory Group (FPAG). FPAG was the subject of a triennial review which reported in 2014. The review made a number of recommendations to improve its operation and enhance its ability to provide independent expert advice. The Department reformed FPAG during 2015, transitioning its composition from representatives of organisations to a smaller number of independent expert members. Following the reform, the CFP was launched in January 2015.
Nuclear Liabilities Financing Assurance Board (NLFAB)www.gov.uk/government/organisations/nuclear-liabilities-financing-assurance-boardThe Nuclear Liabilities Financing Assurance Board (NLFAB) is a small advisory body set up in 2009 to provide independent scrutiny and advice on the financing arrangements for the funded decommissioning programme (FDP), which prospective operators of new nuclear power stations must submit to the Secretary of State for approval before they can begin nuclear-related construction. NLFAB provided advice to the Secretary of State on EDF Energy’s FDP financing arrangements for the Hinkley Point C nuclear power station in October 2015.
Non-ministerial departmentsNon-ministerial departments generally cover matters for which direct political oversight is judged unnecessary or inappropriate. They are headed by senior civil servants. Some fulfil a regulatory or inspection function.
Gas and Electricity Market Authority (Ofgem)www.ofgem.gov.ukOfgem is an independent economic regulator established in statute, a national competition authority and a national regulatory authority under EU directives.As well as regulating the gas and electricity market, Ofgem administers these schemes on behalf of the Department: • the Renewables Obligation;• the Feed in Tariffs scheme;• the Renewable Heat Incentive scheme; and • the Energy Companies Obligation. Key work currently being undertaken by Ofgem includes the smart meter roll-out and the development of plans to move towards more principles-based regulation in retail markets.
ANNEXES
199
Public corporationsPublic corporations are industrial or commercial enterprises under direct government control. All or most of their Board members are appointed by ministers and meet at least four times a year. Public corporations manage their own staff and have their own budgets.
National Nuclear Laboratorywww.nnl.co.ukThe National Nuclear Laboratory is a commercial provider of nuclear research and technical services, with a specific remit to provide independent advice to the Government. It works with other national laboratories worldwide and has capabilities that support the full nuclear fuel cycle.
Nuclear Liabilities Fundwww.nlf.uk.netThe Nuclear Liabilities Fund provides funding to meet certain decommissioning liabilities and nuclear waste management costs of eight nuclear power stations owned by EDF Energy Nuclear Generation Group Limited.
Government-owned companiesGovernment-owned companies are set up under the Companies Act and are solely owned by the Secretary of State for Energy & Climate Change (‘the Shareholder’). They are overseen by a shareholder team within the Department, which represents the Secretary of State’s shareholding interest in the companies. The relationship between these companies and the Shareholder is principally set out in a Shareholder Framework Document, available on each company’s website. These companies’ accounts are consolidated into the Department’s accounts as per the requirements set out in HM Treasury’s Financial Reporting Manual.
Low Carbon Contracts Company (LCCC) www.lowcarboncontracts.ukThe LCCC was established to deliver key elements of the Government’s Electricity Market Reform (EMR) programme. It became operational on 1 August 2014.The LCCC has been responsible for determining minor and necessary modifications to Contracts for Difference (CfDs), setting the CfD Supplier Obligation (to fund payments under CfDs) and developing the processes and systems required to sign, manage, and pay for CfDs over their lifetime.
Electricity Settlements Company (ESC)www.electricitysettlementscompany.ukLike the LCCC, the ESC also supports EMR and became operational on 1 August 2014. The ESC has been responsible for managing credit cover for Capacity Market participants.
Contracted servicesThe Department also contracts with other bodies for some policies and services. For example:• the Environment Agency administers the
Carbon Reduction Commitment Energy Efficiency Scheme; and
• the Office of Nuclear Regulation provides expertise in relation to nuclear regulatory matters such as approvals and decommissioning.
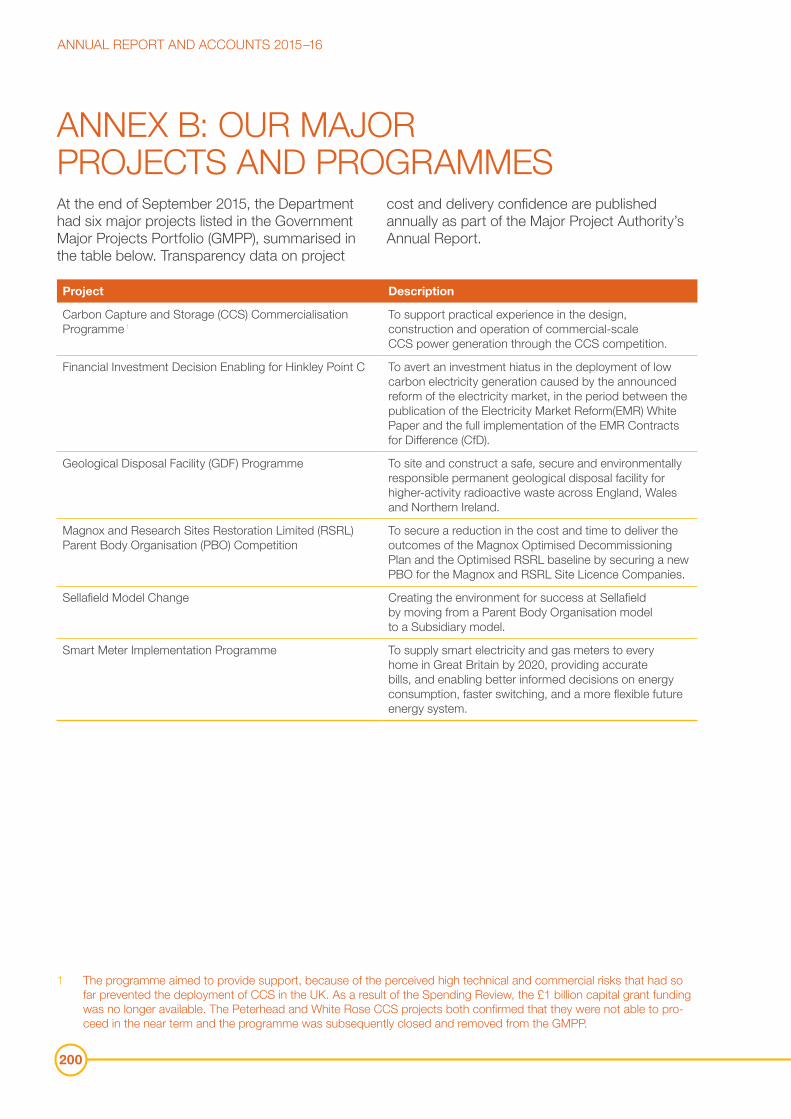
ANNUAL REPORT AND ACCOUNTS 2015–16
200
ANNEX B: OUR MAJOR PROJECTS AND PROGRAMMESAt the end of September 2015, the Department had six major projects listed in the Government Major Projects Portfolio (GMPP), summarised in the table below. Transparency data on project
cost and delivery confidence are published annually as part of the Major Project Authority’s Annual Report.
Project Description
Carbon Capture and Storage (CCS) Commercialisation Programme 1
To support practical experience in the design, construction and operation of commercial-scale CCS power generation through the CCS competition.
Financial Investment Decision Enabling for Hinkley Point C To avert an investment hiatus in the deployment of low carbon electricity generation caused by the announced reform of the electricity market, in the period between the publication of the Electricity Market Reform(EMR) White Paper and the full implementation of the EMR Contracts for Difference (CfD).
Geological Disposal Facility (GDF) Programme To site and construct a safe, secure and environmentally responsible permanent geological disposal facility for higher-activity radioactive waste across England, Wales and Northern Ireland.
Magnox and Research Sites Restoration Limited (RSRL) Parent Body Organisation (PBO) Competition
To secure a reduction in the cost and time to deliver the outcomes of the Magnox Optimised Decommissioning Plan and the Optimised RSRL baseline by securing a new PBO for the Magnox and RSRL Site Licence Companies.
Sellafield Model Change Creating the environment for success at Sellafield by moving from a Parent Body Organisation model to a Subsidiary model.
Smart Meter Implementation Programme To supply smart electricity and gas meters to every home in Great Britain by 2020, providing accurate bills, and enabling better informed decisions on energy consumption, faster switching, and a more flexible future energy system.
1 The programme aimed to provide support, because of the perceived high technical and commercial risks that had so far prevented the deployment of CCS in the UK. As a result of the Spending Review, the £1 billion capital grant funding was no longer available. The Peterhead and White Rose CCS projects both confirmed that they were not able to pro-ceed in the near term and the programme was subsequently closed and removed from the GMPP.
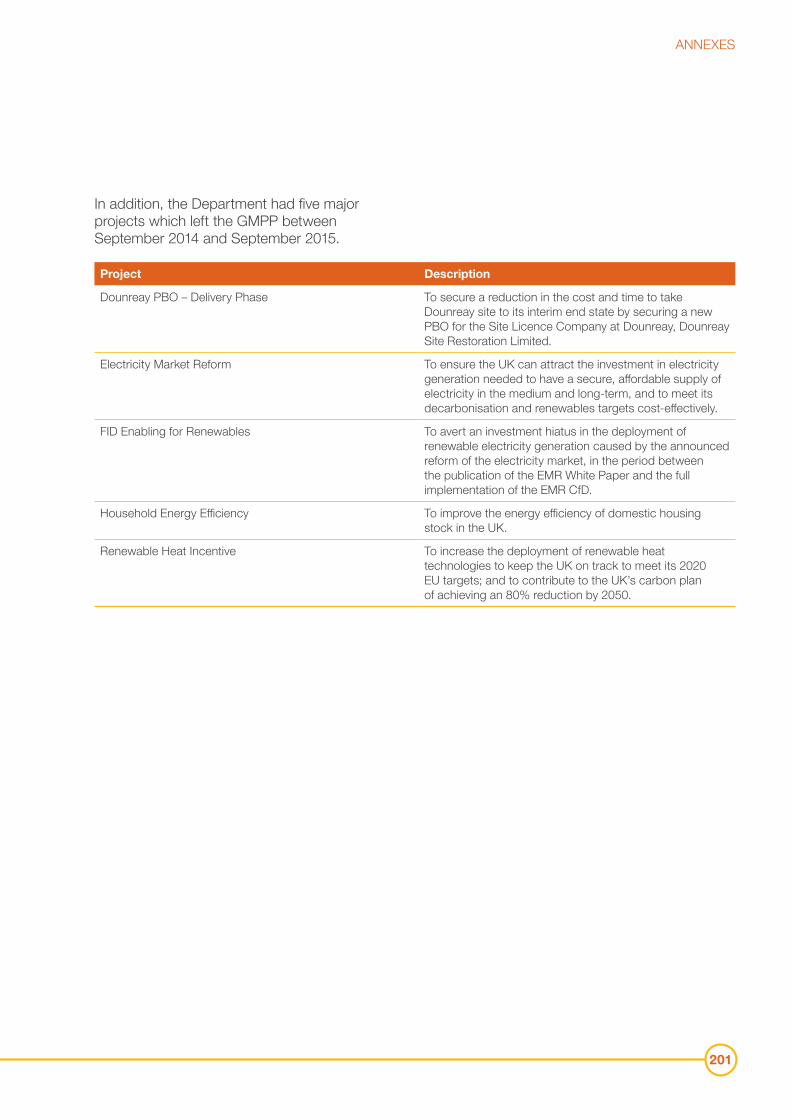
ANNEXES
201
In addition, the Department had five major projects which left the GMPP between September 2014 and September 2015.
Project Description
Dounreay PBO – Delivery Phase To secure a reduction in the cost and time to take Dounreay site to its interim end state by securing a new PBO for the Site Licence Company at Dounreay, Dounreay Site Restoration Limited.
Electricity Market Reform To ensure the UK can attract the investment in electricity generation needed to have a secure, affordable supply of electricity in the medium and long-term, and to meet its decarbonisation and renewables targets cost-effectively.
FID Enabling for Renewables To avert an investment hiatus in the deployment of renewable electricity generation caused by the announced reform of the electricity market, in the period between the publication of the EMR White Paper and the full implementation of the EMR CfD.
Household Energy Efficiency To improve the energy efficiency of domestic housing stock in the UK.
Renewable Heat Incentive To increase the deployment of renewable heat technologies to keep the UK on track to meet its 2020 EU targets; and to contribute to the UK’s carbon plan of achieving an 80% reduction by 2050.
ANNUAL REPORT AND ACCOUNTS 2015–16
202
ANNEX C: SUSTAINABILITY REPORT
StrategySustainability is at the heart of the Department’s mission. We run our own estate and operations as sustainably as possible and promote sustainable development through our policies; benefiting: • the environment, through decarbonisation; • the economy, by ensuring a secure and
affordable supply of energy; and• people, including through targeted
interventions on fuel poverty.The core Department’s approach to environmental, energy and carbon management, including risks and opportunities as well as governance arrangements, is set out in our Environmental and Energy Management Systems which are certified to ISO 14001 and 500001 respectively. The Nuclear Decommissioning Authority (NDA) has produced a delivery plan of action to reduce emissions and meet other Greening Government Commitments (GGCs). This flows from the continuous improvement obligation required by the NDA’s ISO 14001 certificated EMS.
Scope
The reporting boundary includes the core Department and one of its NDPBs, the NDA, but not its subsidiaries and Site Licensed Companies that work under contract. This is consistent with our GGCs scope. The Mainstreaming section refers to the core Department alone.
Governance and data validation The Department for Education’s Property Asset Management Unit (PAMU) manages sustainable operations for the Department as part of a property shared service. PAMU’s responsibilities, those of the Department and associated governance arrangements are clearly laid out in a Memorandum of Understanding. Overall responsibility for sustainable operations lies with the Department’s People and Operations Director, who in turn, reports to the Executive Committee. Internal data validation checks are carried out by PAMU’s Sustainable Operations team and external validation audits of GGCs data are carried out by Carbon Smart.
Summary of 2015-16 GGCs performanceThe Department has significantly improved on its 2014-15 performance in all GGCs target areas. It exceeded three of the GGCs targets for 2015-16, demonstrating considerable reductions against greenhouse gas emissions and domestic flights as well as reducing associated financial costs. Overall performance is set out in the tables below.
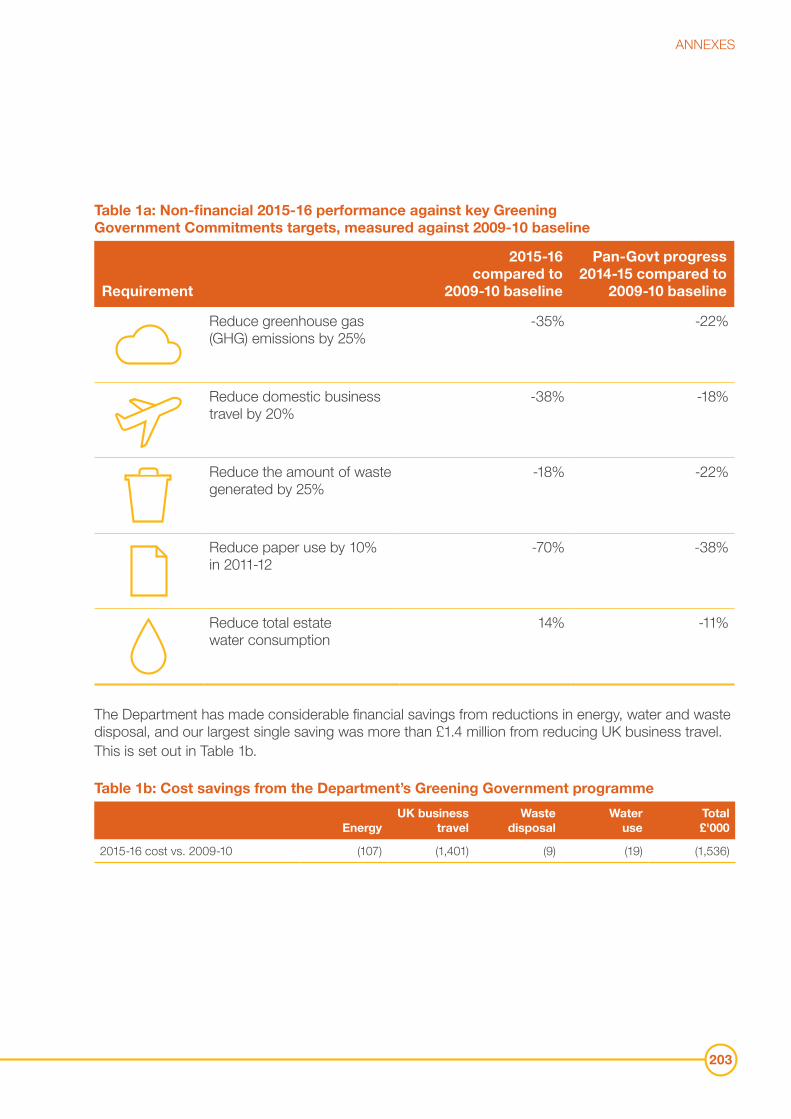
ANNEXES
203
Table 1a: Non-financial 2015-16 performance against key Greening Government Commitments targets, measured against 2009-10 baseline
Requirement
2015-16 compared to
2009-10 baseline
Pan-Govt progress 2014-15 compared to
2009-10 baseline
Reduce greenhouse gas (GHG) emissions by 25%
-35% -22%
Reduce domestic business travel by 20%
-38% -18%
Reduce the amount of waste generated by 25%
-18% -22%
Reduce paper use by 10% in 2011-12
-70% -38%
Reduce total estate water consumption
14% -11%
The Department has made considerable financial savings from reductions in energy, water and waste disposal, and our largest single saving was more than £1.4 million from reducing UK business travel. This is set out in Table 1b.
Table 1b: Cost savings from the Department’s Greening Government programme
EnergyUK business
travel Waste
disposalWater
useTotal £'000
2015-16 cost vs. 2009-10 (107) (1,401) (9) (19) (1,536)
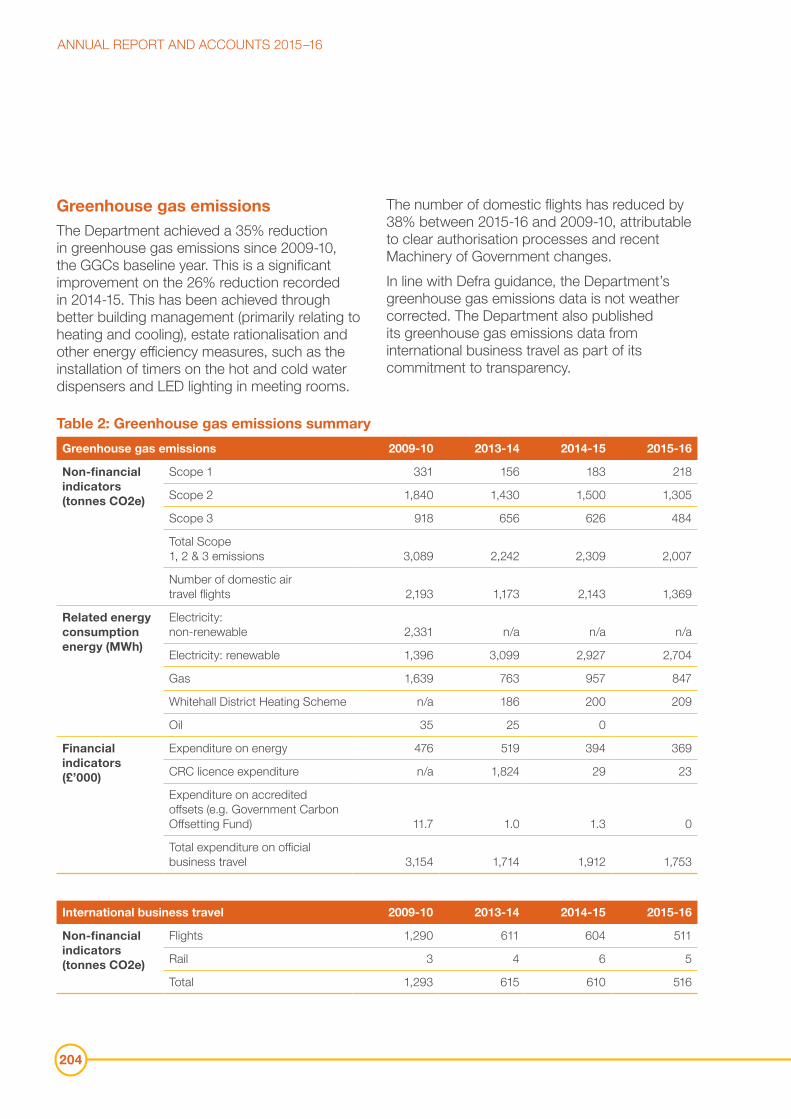
ANNUAL REPORT AND ACCOUNTS 2015–16
204
Greenhouse gas emissionsThe Department achieved a 35% reduction in greenhouse gas emissions since 2009-10, the GGCs baseline year. This is a significant improvement on the 26% reduction recorded in 2014-15. This has been achieved through better building management (primarily relating to heating and cooling), estate rationalisation and other energy efficiency measures, such as the installation of timers on the hot and cold water dispensers and LED lighting in meeting rooms.
The number of domestic flights has reduced by 38% between 2015-16 and 2009-10, attributable to clear authorisation processes and recent Machinery of Government changes. In line with Defra guidance, the Department’s greenhouse gas emissions data is not weather corrected. The Department also published its greenhouse gas emissions data from international business travel as part of its commitment to transparency.
Table 2: Greenhouse gas emissions summary
Greenhouse gas emissions 2009-10 2013-14 2014-15 2015-16
Non-financial indicators (tonnes CO2e)
Scope 1 331 156 183 218
Scope 2 1,840 1,430 1,500 1,305
Scope 3 918 656 626 484
Total Scope 1, 2 & 3 emissions 3,089 2,242 2,309 2,007
Number of domestic air travel flights 2,193 1,173 2,143 1,369
Related energy consumption energy (MWh)
Electricity: non-renewable 2,331 n/a n/a n/a
Electricity: renewable 1,396 3,099 2,927 2,704
Gas 1,639 763 957 847
Whitehall District Heating Scheme n/a 186 200 209
Oil 35 25 0
Financial indicators (£’000)
Expenditure on energy 476 519 394 369
CRC licence expenditure n/a 1,824 29 23
Expenditure on accredited offsets (e.g. Government Carbon Offsetting Fund) 11.7 1.0 1.3 0
Total expenditure on official business travel 3,154 1,714 1,912 1,753
International business travel 2009-10 2013-14 2014-15 2015-16
Non-financial indicators (tonnes CO2e)
Flights 1,290 611 604 511
Rail 3 4 6 5
Total 1,293 615 610 516
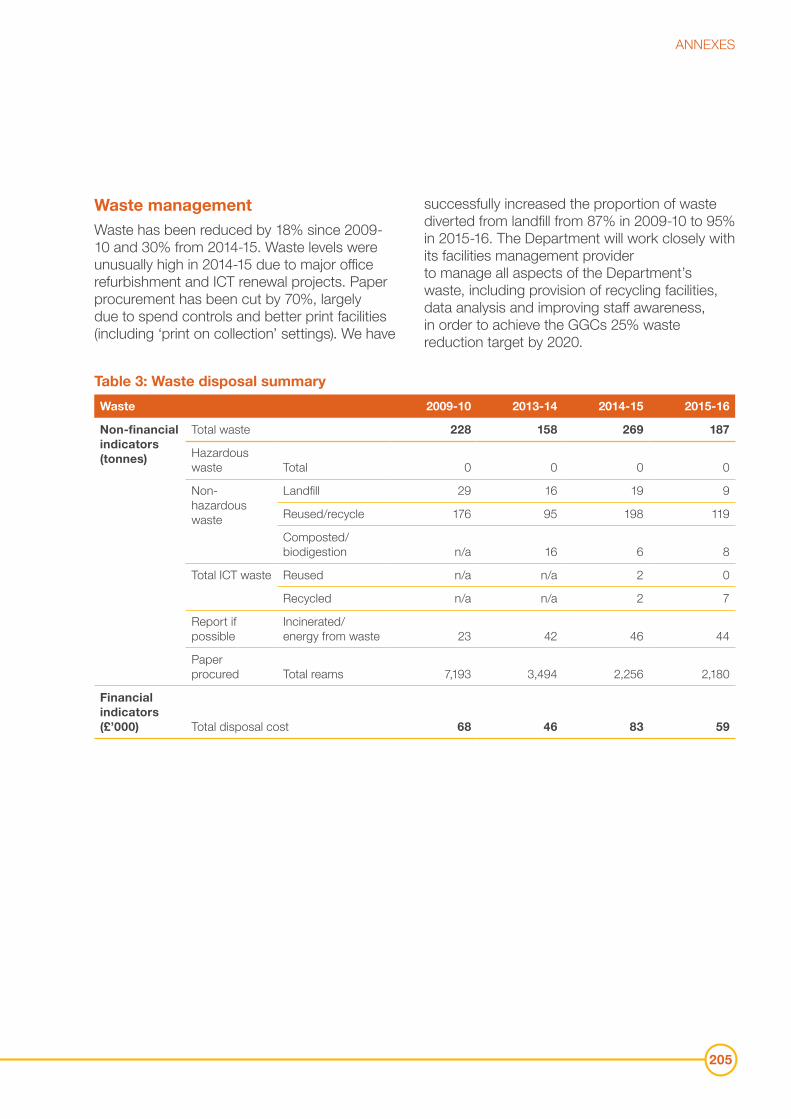
ANNEXES
205
Waste management Waste has been reduced by 18% since 2009-10 and 30% from 2014-15. Waste levels were unusually high in 2014-15 due to major office refurbishment and ICT renewal projects. Paper procurement has been cut by 70%, largely due to spend controls and better print facilities (including ‘print on collection’ settings). We have
successfully increased the proportion of waste diverted from landfill from 87% in 2009-10 to 95% in 2015-16. The Department will work closely with its facilities management provider to manage all aspects of the Department’s waste, including provision of recycling facilities, data analysis and improving staff awareness, in order to achieve the GGCs 25% waste reduction target by 2020.
Table 3: Waste disposal summary
Waste 2009-10 2013-14 2014-15 2015-16
Non-financial indicators (tonnes)
Total waste 228 158 269 187
Hazardous waste Total 0 0 0 0
Non-hazardous waste
Landfill 29 16 19 9
Reused/recycle 176 95 198 119
Composted/ biodigestion n/a 16 6 8
Total ICT waste Reused n/a n/a 2 0
Recycled n/a n/a 2 7
Report if possible
Incinerated/ energy from waste 23 42 46 44
Paper procured Total reams 7,193 3,494 2,256 2,180
Financial indicators (£’000) Total disposal cost 68 46 83 59
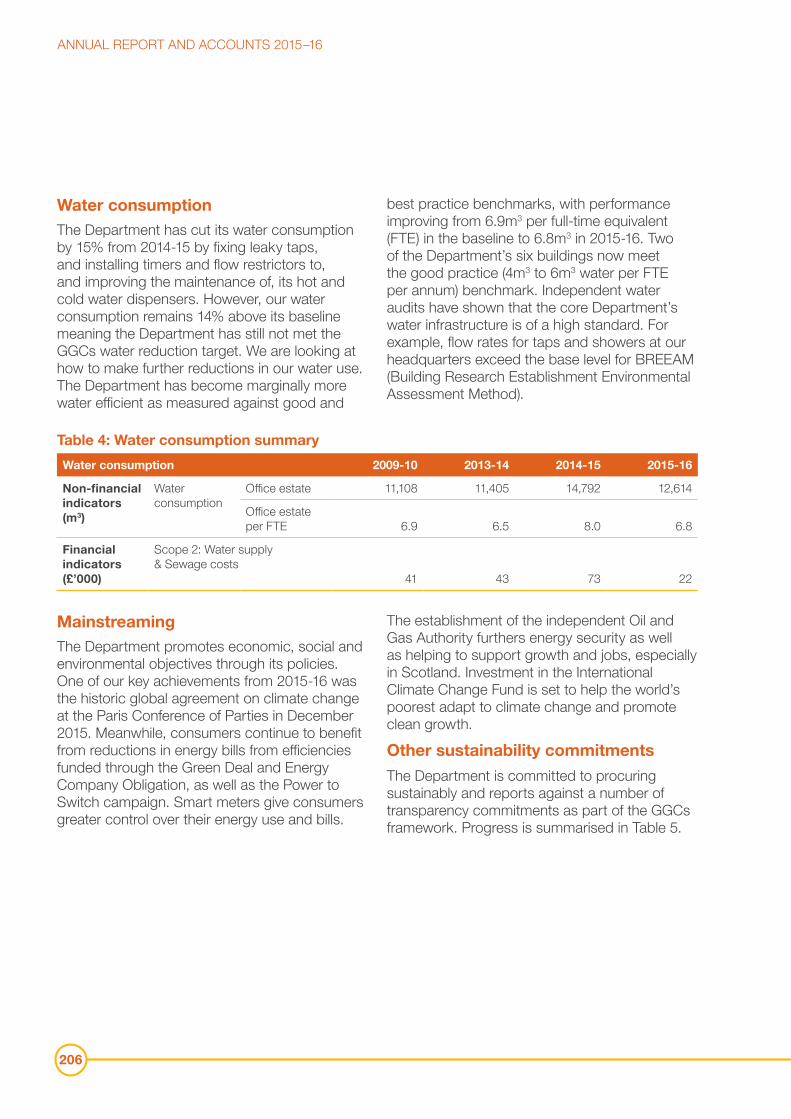
ANNUAL REPORT AND ACCOUNTS 2015–16
206
Water consumption The Department has cut its water consumption by 15% from 2014-15 by fixing leaky taps, and installing timers and flow restrictors to, and improving the maintenance of, its hot and cold water dispensers. However, our water consumption remains 14% above its baseline meaning the Department has still not met the GGCs water reduction target. We are looking at how to make further reductions in our water use. The Department has become marginally more water efficient as measured against good and
best practice benchmarks, with performance improving from 6.9m3 per full-time equivalent (FTE) in the baseline to 6.8m3 in 2015-16. Two of the Department’s six buildings now meet the good practice (4m3 to 6m3 water per FTE per annum) benchmark. Independent water audits have shown that the core Department’s water infrastructure is of a high standard. For example, flow rates for taps and showers at our headquarters exceed the base level for BREEAM (Building Research Establishment Environmental Assessment Method).
Table 4: Water consumption summary
Water consumption 2009-10 2013-14 2014-15 2015-16
Non-financial indicators (m3)
Water consumption
Office estate 11,108 11,405 14,792 12,614
Office estate per FTE 6.9 6.5 8.0 6.8
Financial indicators (£’000)
Scope 2: Water supply & Sewage costs
41 43 73 22
Mainstreaming The Department promotes economic, social and environmental objectives through its policies. One of our key achievements from 2015-16 was the historic global agreement on climate change at the Paris Conference of Parties in December 2015. Meanwhile, consumers continue to benefit from reductions in energy bills from efficiencies funded through the Green Deal and Energy Company Obligation, as well as the Power to Switch campaign. Smart meters give consumers greater control over their energy use and bills.
The establishment of the independent Oil and Gas Authority furthers energy security as well as helping to support growth and jobs, especially in Scotland. Investment in the International Climate Change Fund is set to help the world’s poorest adapt to climate change and promote clean growth.
Other sustainability commitments
The Department is committed to procuring sustainably and reports against a number of transparency commitments as part of the GGCs framework. Progress is summarised in Table 5.
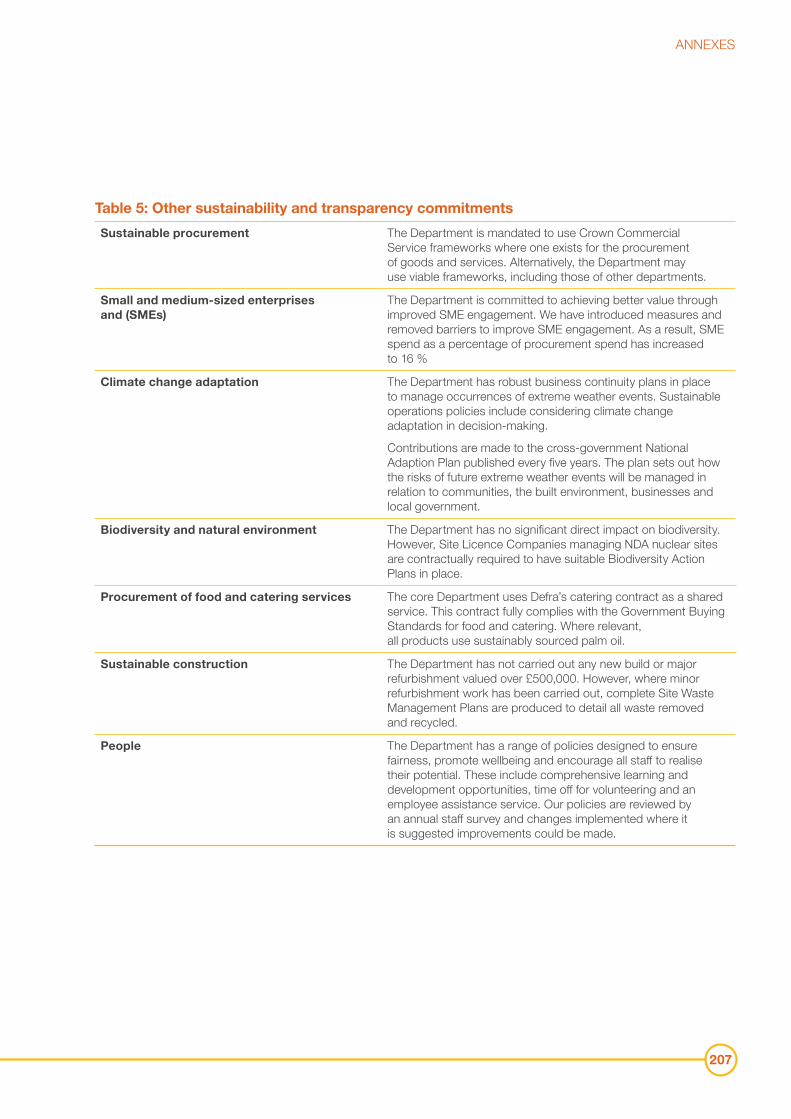
ANNEXES
207
Table 5: Other sustainability and transparency commitments
Sustainable procurement The Department is mandated to use Crown Commercial Service frameworks where one exists for the procurement of goods and services. Alternatively, the Department may use viable frameworks, including those of other departments.
Small and medium-sized enterprises and (SMEs)
The Department is committed to achieving better value through improved SME engagement. We have introduced measures and removed barriers to improve SME engagement. As a result, SME spend as a percentage of procurement spend has increased to 16 %
Climate change adaptation The Department has robust business continuity plans in place to manage occurrences of extreme weather events. Sustainable operations policies include considering climate change adaptation in decision-making.
Contributions are made to the cross-government National Adaption Plan published every five years. The plan sets out how the risks of future extreme weather events will be managed in relation to communities, the built environment, businesses and local government.
Biodiversity and natural environment The Department has no significant direct impact on biodiversity. However, Site Licence Companies managing NDA nuclear sites are contractually required to have suitable Biodiversity Action Plans in place.
Procurement of food and catering services The core Department uses Defra’s catering contract as a shared service. This contract fully complies with the Government Buying Standards for food and catering. Where relevant, all products use sustainably sourced palm oil.
Sustainable construction The Department has not carried out any new build or major refurbishment valued over £500,000. However, where minor refurbishment work has been carried out, complete Site Waste Management Plans are produced to detail all waste removed and recycled.
People The Department has a range of policies designed to ensure fairness, promote wellbeing and encourage all staff to realise their potential. These include comprehensive learning and development opportunities, time off for volunteering and an employee assistance service. Our policies are reviewed by an annual staff survey and changes implemented where it is suggested improvements could be made.
ANNUAL REPORT AND ACCOUNTS 2015–16
Reporting on better regulationThe Department employs principles in line with the Government’s Better Regulation Framework, Green, and Magenta books, to design effective regulations to achieve our policy aims. Since the Department’s last report the Better Regulation Framework has changed its reporting mechanism from our published Statement of New Regulation (SNR) to a centrally published report by the Better Regulation Executive (BRE), the ‘BRE Annual Report’. Details of departmental regulation will now be found in this centrally produced report.New policies were explored and developed in 2015-16 to minimise the regulatory burden for businesses as part of the cross-departmental Cutting Red Tape initiative. A review of the energy sector was carried out,1 and taking on board the points raised by businesses as part of this review, the Government and Ofgem have committed to a number of actions to reduce the burdens imposed on the energy industry.The Department has performed excellently over the past 12 months. The Department produces Impact Assessments reviewed by the independent Regulatory Policy Committee and given a RAG rating (red, amber or green) where green is ‘fit for purpose’. The Department has a target of 80% fit for purpose ratings on first submission and significantly exceeded it between 1 April 2015 and 31 March 2016 with 93.33%. This is an increase from the strong 85% figure from last Parliament.
Complaints to the Parliamentary OmbudsmanIn 2015-16, one new complaint about the Department was accepted for investigation by the Parliamentary and Health Service Ombudsman (PHSO). The complaint relates to the Warm Front Scheme and is currently on-going.The PHSO also concluded and reported on three investigations about the Department in financial year 2015-16. These cases were accepted for investigation by the PHSO in the previous financial year 2014-15. Two out of the three cases were upheld in full; the other case was not upheld. The Department complied with the PHSO’s recommendations in both upheld cases.
TransparencyIn keeping with the rules on transparency, details of expenses, overseas travel and gifts and hospitality in respect of ministers, the Permanent Secretary and Directors General are published quarterly. The Department holds an internal register of interests that is reviewed and updated on a six monthly basis.
Core TablesHM Treasury has specified a range of common core tables to provide further analysis of departmental expenditure, staff numbers and capital employed. The Department’s core tables can be found at: https://www.gov.uk/government/publications/annual-report-and-accounts-2015-to-2016
ANNEX D: REGULATION, PARLIAMENT AND THE PUBLIC
1 Available online at: https://cutting-red-tape.cabinetoffice.gov.uk/energy/
208

Department of Energy & Clim
ate Change ANNUAL REPORT AND ACCO
UNTS 2015–16