Embed Size (px)
Citation preview
Incorporated in Luxembourg as an open-ended investment company with variable capital organised
as a Société d’Investissement à Capital Variable (SICAV) qualifying as an Undertakings for Collective
Investment in Transferable Securities (UCITS).
No subscriptions can be received solely on the basis of this report. Subscriptions are only valid if made
on the basis of the current prospectus, supplemented by the latest audited annual report and the latest
unaudited interim report, if published thereafter and of the relevant Key Investor Information Document.
Janus Henderson Fund
2 Rue de Bitbourg
L-1273 Luxembourg
Grand Duchy of Luxembourg
RCS: Luxembourg B 77.949
For the year from 1 October 2020 to 30 September 2021
(audited)
ANNUAL REPORT& ACCOUNTS

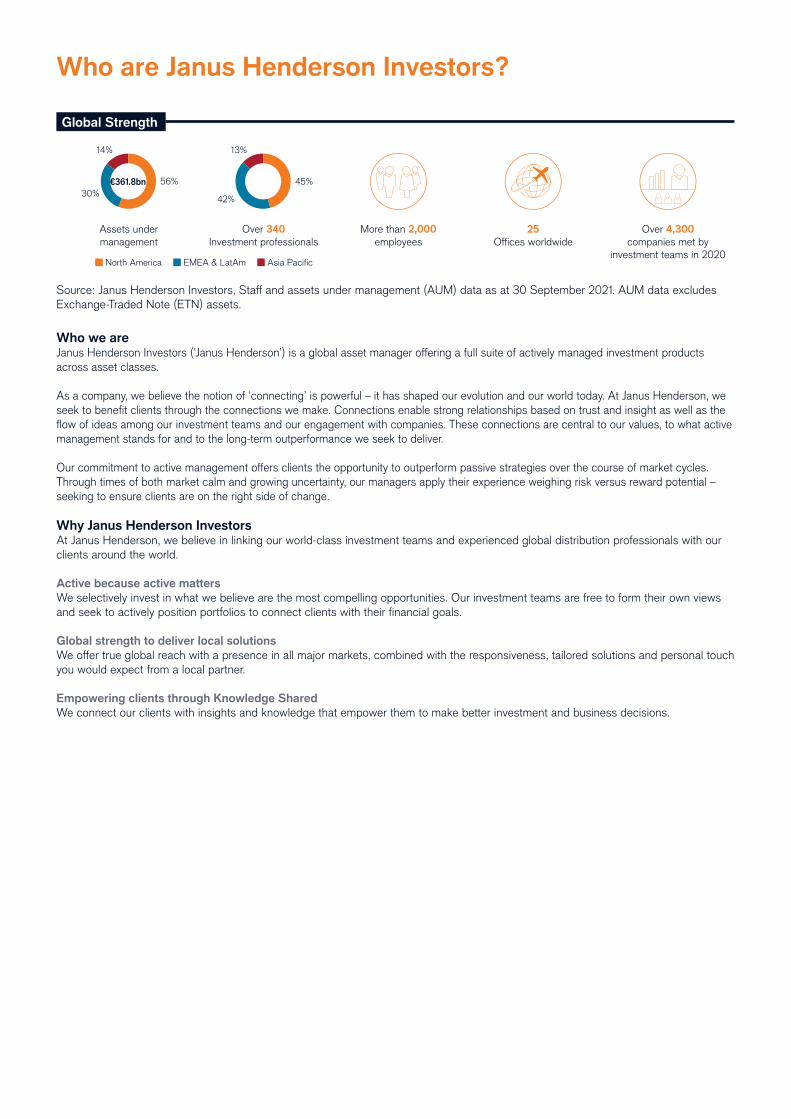
Who are Janus Henderson Investors?
Who we areJanus Henderson Investors (‘Janus Henderson’) is a global asset manager off ering a full suite of actively managed investment products
across asset classes.
As a company, we believe the notion of ‘connecting’ is powerful – it has shaped our evolution and our world today. At Janus Henderson, we
seek to benefi t clients through the connections we make. Connections enable strong relationships based on trust and insight as well as the
fl ow of ideas among our investment teams and our engagement with companies. These connections are central to our values, to what active
management stands for and to the long-term outperformance we seek to deliver.
Our commitment to active management off ers clients the opportunity to outperform passive strategies over the course of market cycles.
Through times of both market calm and growing uncertainty, our managers apply their experience weighing risk versus reward potential –
seeking to ensure clients are on the right side of change.
Why Janus Henderson InvestorsAt Janus Henderson, we believe in linking our world-class investment teams and experienced global distribution professionals with our
clients around the world.
Active because active matters
We selectively invest in what we believe are the most compelling opportunities. Our investment teams are free to form their own views
and seek to actively position portfolios to connect clients with their fi nancial goals.
Global strength to deliver local solutions
We off er true global reach with a presence in all major markets, combined with the responsiveness, tailored solutions and personal touch
you would expect from a local partner.
Empowering clients through Knowledge Shared
We connect our clients with insights and knowledge that empower them to make better investment and business decisions.
Source: Janus Henderson Investors, Staff and assets under management (AUM) data as at 30 September 2021. AUM data excludes
Exchange-Traded Note (ETN) assets.
Global Strength
13%
45%
42%
14%
56%
30%
€361.8bn
Assets under
management
Over 4,300
companies met by
investment teams in 2020
25
Offi ces worldwide
More than 2,000
employees
Over 340
Investment professionals
North America EMEA & LatAm Asia Pacifi c
Management and Administration Page 1
Directors’ Report Page 2
Market review Page 3
Ten Year Highest and Lowest Net Asset Value Per Share (unaudited) Page 5
Combined Statements Page 10
Equity Funds
Continental European Fund Page 13
Emerging Markets Fund Page 21
Global Equity Fund Page 28
Latin American Fund Page 34
Pan European Fund Page 40
Pan European Smaller Companies Fund Page 48
Alternate Solutions Funds
Absolute Return Fund (formerly United Kingdom Absolute Return Fund) Page 55
Global Equity Market Neutral Fund Page 70
Global Multi-Strategy Fund Page 79
Notes to the Financial Statements Page 99
Audit report Page 119
Appendix - additional information (unaudited)
Securities fi nancing transactions Page 122
Risk policies Page 126
Remuneration policy Page 128
General information Page 131
Contents

1
Management and Administration
* c/o registered offi ce
** RBC Investor Services Bank S.A. was replaced by International Financial Data Services (Luxembourg) S.A. from 6 April 2021
Chairman:
Kevin Adams*
Independent Non-Executive Director
Directors:
Les Aitkenhead* - Resigned 31 May 2021
Mattteo Candolfi ni*
Head of Offi ce, Luxembourg
Henderson Management S.A.
Joanna Dentskevich*
Independent Non-Executive Director
Cliodhna Duggan* - Appointed 31 May 2021
Head of Operation & Distribution
Oversight - Luxembourg
Henderson Management S.A.
Ian Dyble
Head of Product Development
Henderson Global Investors Limited
201 Bishopsgate
London EC2M 3AE
United Kingdom
Jean-Claude Wolter - Resigned 31 May 2021
The Company:
Janus Henderson Fund
2 Rue de Bitbourg
L-1273 Luxembourg
Grand Duchy of Luxembourg
Registered Offi ce:
2 Rue de Bitbourg
L-1273 Luxembourg
Grand Duchy of Luxembourg
Management Company:
Henderson Management S.A.
2 Rue de Bitbourg
L-1273 Luxembourg
Grand Duchy of Luxembourg
Investment Manager:
Henderson Global Investors Limited
201 Bishopsgate
London EC2M 3AE
United Kingdom
Principal Distributors:
Henderson Global Investors Limited
201 Bishopsgate
London EC2M 3AE
United Kingdom
Henderson Management S.A.
2 Rue de Bitbourg
L-1273 Luxembourg
Grand Duchy of Luxembourg
Sub-Investment Managers:
Janus Capital Management LLC
151 Detroit Street
Denver, Colorado, 80206
United States of America
Janus Henderson Investors (Australia)
Institutional Funds Management Limited
Level 47, Gateway
1 Macquarie Place
Sydney NSW 2000
Australia
Janus Henderson Investors (Singapore)
Limited
138 Market Street
#34-03/04 CapitaGreen
Singapore
048946
Administrator:
BNP Paribas Securities Services,
Luxembourg Branch
60, Avenue John F. Kennedy
L-1855 Luxembourg
Grand Duchy of Luxembourg
Domiciliary and Corporate Agent:
Henderson Management S.A.
2 Rue de Bitbourg
L-1273 Luxembourg
Grand Duchy of Luxembourg
Auditors:
PricewaterhouseCoopers,
Société coopérative
2 rue Gerhard Mercator
B.P. 1443
L-1014 Luxembourg
Grand Duchy of Luxembourg
Registrar and Transfer Agent:
International Financial Data
Services (Luxembourg) S.A.**
47, Avenue John F. Kennedy
L-1855 Luxembourg
Grand Duchy of Luxembourg
Correspondence Address:
Bishops Square
Redmond's Hill
Dublin 2
Legal Advisors in Luxembourg:
Linklaters LLP
35 Avenue John F. Kennedy
P.O. Box 1107
L-1011 Luxembourg
Grand Duchy of Luxembourg
Depositary:
BNP Paribas Securities Services,
Luxembourg Branch
60, Avenue John F. Kennedy
L-1855 Luxembourg
Grand Duchy of Luxembourg
Switzerland Representative:
BNP Paribas Securities Services,
Paris,
succursale de Zurich
Selnaustrasse 16,
8002 Zürich,
Switzerland
DocuSign Envelope ID: 54D9C307-6E25-4A68-8FDA-46B28E6F1AE5
Directors' Report
Introduction Janus Henderson Fund (the 'Company') is an open-ended investment company incorporated under the laws of the Grand Duchy of Luxembourg in the form of a societe anonyme and qualifies as a SICAV. The Company was incorporated in Luxembourg on 26 September 2000 and is qualified as a UCITS under Part 1 of the Luxembourg law of 17 December 2010 relating to undertakings for investment, as amended (the 'Law').
The Company is structured as an umbrella company which has the ability to issue various classes of shares. Each sub-fund w ith in the umbrella is treated as an independent entity, with its own portfolio of investments, objective and investment policy.
Shareholders of each sub-fund are entitled only to the wealth and yie ld of the sub-fund to which they have subscribed. Each sub-fund bears the appropriate amount of liabi lities attributable to it and the commitments entered into in the name of one sub-fund covered solely by the assets of that sub-fund. The Company wi ll not be liable as a whole to third parties. Separate accounts and records are maintained for each sub-fund.
Financial Statements The board of Directors of the Company (the 'Board ') presents its report and the audited annual financial statements for the year ended 30 September 2021.
A copy of the latest annual and interim reports may be obtained upon req uest from either the offices of the companies registered as Distributors or from the Registered Office of the Company and at www.janushenderson.com.
The Net Assets at 30 September 2021 amounted to EUR 7.8 bil lion .
At the year end , the Company consisted of 9 active sub-funds.
Fund Changes • Details of share class launches, closures and share class name changes can be found on page 99 to 101. • JPMorgan Bank Luxembourg S.A. was appointed as the Securit ies Lend ing Agent of the Company w ith effect from 16 Apri l 2021,
in replacement of BNP Paribas Securit ies Services , London B ranch . • United Ki ngdom A bsolute Return Fund changed its name to Absolute Retu rn Fund on 6 April 2021. • Appoin tment of a new Registrar and Transfer Agent on 6 Apri l 2021 from RBC Investor Services Bank S.A. to International
Financial Data Services (Luxembourg) S.A. ('IFDS ').
The Directors may from time to time close or merge sub-funds as well as add further sub-funds with different investment object ives, subject to the approval of the Commission de Surveillance du Secteur Financier (CSSF). Notifications will be provided to shareholders on closure and merger of sub-funds, which are also subject to review by the CSS F.
Brexit update The United Kingdom (UK) left the European Union (EU) on 31 January 2020, a transition period was in place until 31 December 2020, during which all EU ru les and laws continued to apply to the UK. On 1 January 2021, the transition period came to an end , and the new rules entered into force. The way in which Janus Henderson Investors operates through its Luxembourg operation will not be impacted by this change.
The EU and the UK have agreed to establ ish a structured regulatory co-operation on financial services, with the aim of establishing a durable and stable re lationship between autonomous jurisdictions. A Memorandum of Understanding, establishing the framework for the co-operation, allows the Company to continue to delegate investment management to a UK based f irm .
Corporate Governance Statement The board adheres to the Association of the Luxembourg Fund Industry (ALFI) code of conduct for Luxembourg investment funds. The code of conduct sets a framework of high-level principles and best pract ice recommendations for the governance of Luxembourg investment funds.
On behalf of the Janus Henderson Fund board, I would like to thank you for your continued support.
Kevin Adams Chairman 10 January 2022
The information stated in the report is historical and is not representative of future results .
2
3
Overview
Global equity markets rose strongly during the year to 30 September 2021, with the MSCI World Index up 29.4% in US Dollar terms, on
the development and roll-out of COVID-19 vaccines, fi scal and monetary policy support, and further signs of economic recovery. Concerns
about infl ation – and signals from major central banks that they were preparing to tighten monetary policy – caused unease, however, as did
worries about the spread of the Delta variant of COVID-19.
Equities
Continental Europe
European stocks moved higher, FTSE World Europe ex UK Index +28.5% in Euro terms, as vaccine-led optimism about a global economic
recovery spurred sharp rises. The rally was supported by news of the UK/EU trade agreement and an expansion of the European Central
Bank’s (ECB) asset-purchasing programme. The slow pace of vaccinations in the EU unnerved investors in early 2021, as did a tightening
of COVID-19 restrictions in March as the region endured a third wave of infections. A rise in global bond yields – because of concerns
about infl ation – caused further unease, although a relaxation in COVID-19 curbs helped investors to look past these worries. The ECB
said in September that it would reduce the pace of emergency asset purchases over the rest of 2021 but insisted it was too soon to tighten
policy. The Eurozone economy emerged from recession in the second quarter of 2021, growing by 2.2% from the previous quarter, while the
annual infl ation rate leapt to a 13-year high of 3.4% in September, from 3.0% in August.
UK
In the UK, the FTSE All Share Index was up by 27.9% in Sterling terms, buoyed by progress in the roll-out of COVID-19 vaccinations,
loosening lockdown restrictions and economic improvement. Development of the vaccines triggered a rally towards the end of 2020,
supported by the announcement that the UK and the EU had agreed a trade deal. Shares came under pressure in early 2021 as the
strictest lockdown curbs were imposed across most of the UK, although they recovered as the government later eased restrictions.
Concerns about rising prices caused unease – the annual infl ation rate surged to a more than nine-year high of 3.2% in August 2021. Rising
energy prices, supply chain problems and anxiety about a slowing global economy also weighed on sentiment. In response to the pricing
pressures, the Bank of England said it was likely to bring forward planned interest rate rises. The UK economy returned to growth in the
second quarter of 2021, expanding by 5.5%, which followed a 1.4% contraction in the fi rst quarter.
US
US equities, as measured by the S&P 500 Index, increased by 30.0% in US Dollar terms, after making gains in most months of the
reporting year. The market made a weak start as surging new COVID-19 cases in the US and elsewhere, and uncertainty about the
outcome of the US presidential vote, weighed on sentiment. The vaccine breakthroughs and confi rmation of Joe Biden’s win in the election
helped stocks recover, as did two more stimulus packages totalling US$2.8trn. However, worries about infl ation created volatility in 2021,
while concerns about a slowing economy exerted downward pressure, particularly towards the end of the reporting year. In September,
the US Federal Reserve (Fed) indicated that it might need to raise interest rates in 2022 and that it was preparing to ‘taper’ its asset
purchasing programme. US GDP expanded by an annualised 6.7% in the second quarter, up from 6.3% growth in the fi rst quarter. Infl ation
hit a near 13-year high of 5.4% year on year in June and July, although it dipped to 5.3% in August.
Japan
In Japan, the TOPIX rose by 27.5% in Yen terms, as Japanese shares participated in the global rally from November, which was supported
in December by the government’s third economic stimulus package of 2020. In 2021, optimism about an economic rebound – as COVID-19
curbs were loosened in some areas and the economic outlook brightened – helped the TOPIX hit 30-year highs in March. Increases in
COVID-19 infections and the return of restrictions subsequently pushed the market into retreat. Stocks fi nished the period strongly, however,
as the resignation of Prime Minister Yoshihide Suga fuelled hopes that his successor would announce new measures to boost the economy.
The roll-out of COVID-19 vaccinations and hopes that the worst of the pandemic was behind the country underpinned the gains, which
helped the TOPIX to again reach multi-decade highs. The economy grew by an annualised 1.9% in the second quarter, following a 4.2%
contraction in the fi rst quarter. Defl ationary pressures remained, with the core infl ation rate, which excludes fresh food prices, negative in 11
out of the 12 months of the reporting year.
Asia
In Asia, the MSCI AC Asia Pacifi c ex Japan Index climbed by 16.9% in US Dollar terms, largely because of the vaccine-led global rally
and on continued signs of economic improvement. Chinese equities fell materially. The market made a strong start as economic growth
accelerated. However, equities sold off thereafter on concerns about a wider regulatory crackdown, signs of slowing growth, electricity
rationing and debt problems at property giant China Evergrande. South Korean shares were higher, although they came under pressure
towards the end of the reporting year as COVID-19 infections hit record levels in the country and some technology stocks slumped.
Taiwanese equities surged as they benefi ted from strength in the technology sector. Economic optimism fuelled increases in Australia’s
market, although it fi nished weakly as COVID-19 infections remained stubbornly high.
Market review
For the year 1 October 2020 to 30 September 2021
4
Emerging Markets
The MSCI Emerging Markets Index gained 18.6% in US Dollar terms, with optimism about a global economic rebound underpinning large
increases in equities. India’s market was sharply higher, as the economy continued to recover – GDP grew by a record 20.1% year on year
in the second quarter. Stimulus measures, the positive vaccine news and easing COVID-19 restrictions also boosted equities. Brazilian
shares moved higher, helped by signs of economic improvement, although equities sold off towards the end of the reporting year on
growing discontent over the leadership of President Jair Bolsonaro. Mexican equities surged, helped by gains in oil prices and economic
improvement in Mexico’s neighbour, the US. Higher oil prices also strongly boosted stocks in Russia, along with a recovering economy.
South African equities advanced as GDP rebounded from a prolonged slump, although the market came under pressure in July after the
imprisonment of former president Jacob Zuma sparked violent protests.
Fixed Income
Within fi xed income, the JPM Global Government Bond Index dropped by 3.5% in US Dollar terms. Yields on core government bond
markets – including the US, UK and Germany – moved higher, spiking in February as investors grew increasingly concerned about infl ation.
Bond yields moved higher again in September as major central banks, including the Fed, signalled that they were preparing to tighten
monetary policy. The US benchmark 10-year Treasury yield more than doubled during the reporting year to end at almost 1.5%. There were
also notable upward moves in UK benchmark 10-year gilt and German benchmark 10-year bund yields, although the latter remained in
negative territory. In corporate debt markets, it emerged that companies had issued almost US$4trn in bonds globally in 2021 so far, as they
sought to benefi t from the favourable conditions before major central banks start to tighten monetary policy.
Commodities
In commodity markets, oil prices were sharply higher, as producers cut output and as the vaccine breakthroughs spurred hopes of a revival
in demand. Tightening supplies helped global benchmark Brent Crude to fi nish near a three-year high of almost US$80 per barrel, up by
more than 80% over the reporting year. Spot gold prices were about 7% lower overall, as vaccine-led optimism about a global economic
recovery reduced the precious metal’s appeal, while the strength of the US Dollar added further pressure towards the end of the reporting
year. Copper prices rallied to record highs – futures prices in the US increased by more than 30% over the year – on strong demand,
particularly from China. However, prices came under pressure in the closing months as Chinese demand waned.
Market review (continued)
For the year 1 October 2020 to 30 September 2021
5
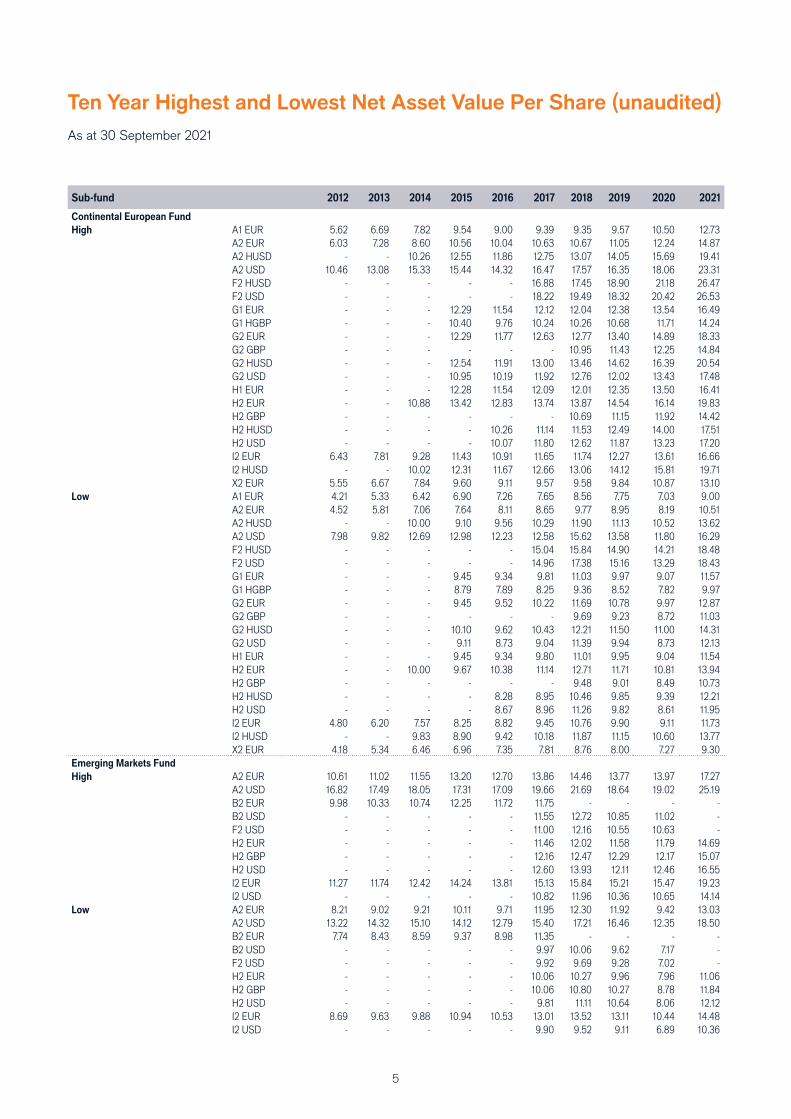
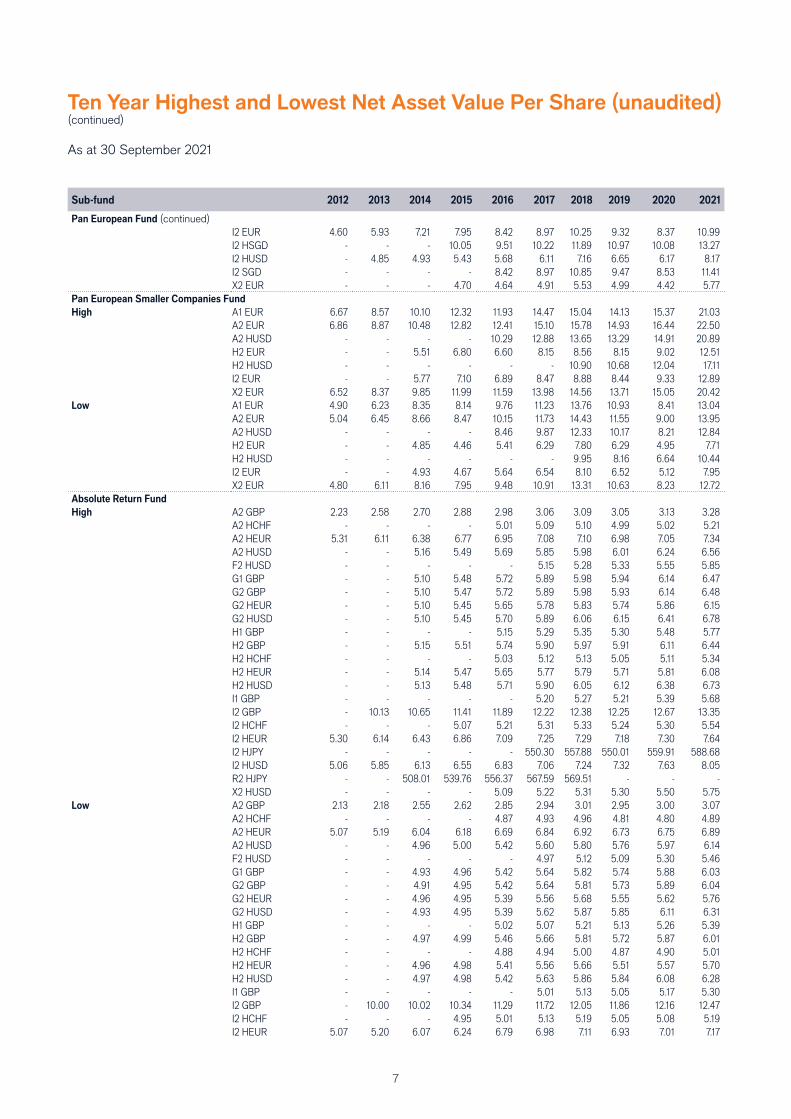
Sub-fund 2012 2013 2014 2015 2016 2017 2018 2019 2020 2021
Continental European Fund
High A1 EUR 5.62 6.69 7.82 9.54 9.00 9.39 9.35 9.57 10.50 12.73A2 EUR 6.03 7.28 8.60 10.56 10.04 10.63 10.67 11.05 12.24 14.87A2 HUSD - - 10.26 12.55 11.86 12.75 13.07 14.05 15.69 19.41A2 USD 10.46 13.08 15.33 15.44 14.32 16.47 17.57 16.35 18.06 23.31F2 HUSD - - - - - 16.88 17.45 18.90 21.18 26.47F2 USD - - - - - 18.22 19.49 18.32 20.42 26.53G1 EUR - - - 12.29 11.54 12.12 12.04 12.38 13.54 16.49G1 HGBP - - - 10.40 9.76 10.24 10.26 10.68 11.71 14.24G2 EUR - - - 12.29 11.77 12.63 12.77 13.40 14.89 18.33G2 GBP - - - - - - 10.95 11.43 12.25 14.84G2 HUSD - - - 12.54 11.91 13.00 13.46 14.62 16.39 20.54G2 USD - - - 10.95 10.19 11.92 12.76 12.02 13.43 17.48H1 EUR - - - 12.28 11.54 12.09 12.01 12.35 13.50 16.41H2 EUR - - 10.88 13.42 12.83 13.74 13.87 14.54 16.14 19.83H2 GBP - - - - - - 10.69 11.15 11.92 14.42H2 HUSD - - - - 10.26 11.14 11.53 12.49 14.00 17.51H2 USD - - - - 10.07 11.80 12.62 11.87 13.23 17.20I2 EUR 6.43 7.81 9.28 11.43 10.91 11.65 11.74 12.27 13.61 16.66I2 HUSD - - 10.02 12.31 11.67 12.66 13.06 14.12 15.81 19.71X2 EUR 5.55 6.67 7.84 9.60 9.11 9.57 9.58 9.84 10.87 13.10
Low A1 EUR 4.21 5.33 6.42 6.90 7.26 7.65 8.56 7.75 7.03 9.00A2 EUR 4.52 5.81 7.06 7.64 8.11 8.65 9.77 8.95 8.19 10.51A2 HUSD - - 10.00 9.10 9.56 10.29 11.90 11.13 10.52 13.62A2 USD 7.98 9.82 12.69 12.98 12.23 12.58 15.62 13.58 11.80 16.29F2 HUSD - - - - - 15.04 15.84 14.90 14.21 18.48F2 USD - - - - - 14.96 17.38 15.16 13.29 18.43G1 EUR - - - 9.45 9.34 9.81 11.03 9.97 9.07 11.57G1 HGBP - - - 8.79 7.89 8.25 9.36 8.52 7.82 9.97G2 EUR - - - 9.45 9.52 10.22 11.69 10.78 9.97 12.87G2 GBP - - - - - - 9.69 9.23 8.72 11.03G2 HUSD - - - 10.10 9.62 10.43 12.21 11.50 11.00 14.31G2 USD - - - 9.11 8.73 9.04 11.39 9.94 8.73 12.13H1 EUR - - - 9.45 9.34 9.80 11.01 9.95 9.04 11.54H2 EUR - - 10.00 9.67 10.38 11.14 12.71 11.71 10.81 13.94H2 GBP - - - - - - 9.48 9.01 8.49 10.73H2 HUSD - - - - 8.28 8.95 10.46 9.85 9.39 12.21H2 USD - - - - 8.67 8.96 11.26 9.82 8.61 11.95I2 EUR 4.80 6.20 7.57 8.25 8.82 9.45 10.76 9.90 9.11 11.73I2 HUSD - - 9.83 8.90 9.42 10.18 11.87 11.15 10.60 13.77X2 EUR 4.18 5.34 6.46 6.96 7.35 7.81 8.76 8.00 7.27 9.30
Emerging Markets Fund
High A2 EUR 10.61 11.02 11.55 13.20 12.70 13.86 14.46 13.77 13.97 17.27A2 USD 16.82 17.49 18.05 17.31 17.09 19.66 21.69 18.64 19.02 25.19B2 EUR 9.98 10.33 10.74 12.25 11.72 11.75 - - - -B2 USD - - - - - 11.55 12.72 10.85 11.02 -F2 USD - - - - - 11.00 12.16 10.55 10.63 -H2 EUR - - - - - 11.46 12.02 11.58 11.79 14.69H2 GBP - - - - - 12.16 12.47 12.29 12.17 15.07H2 USD - - - - - 12.60 13.93 12.11 12.46 16.55I2 EUR 11.27 11.74 12.42 14.24 13.81 15.13 15.84 15.21 15.47 19.23I2 USD - - - - - 10.82 11.96 10.36 10.65 14.14
Low A2 EUR 8.21 9.02 9.21 10.11 9.71 11.95 12.30 11.92 9.42 13.03A2 USD 13.22 14.32 15.10 14.12 12.79 15.40 17.21 16.46 12.35 18.50B2 EUR 7.74 8.43 8.59 9.37 8.98 11.35 - - - -B2 USD - - - - - 9.97 10.06 9.62 7.17 -F2 USD - - - - - 9.92 9.69 9.28 7.02 -H2 EUR - - - - - 10.06 10.27 9.96 7.96 11.06H2 GBP - - - - - 10.06 10.80 10.27 8.78 11.84H2 USD - - - - - 9.81 11.11 10.64 8.06 12.12I2 EUR 8.69 9.63 9.88 10.94 10.53 13.01 13.52 13.11 10.44 14.48I2 USD - - - - - 9.90 9.52 9.11 6.89 10.36
Ten Year Highest and Lowest Net Asset Value Per Share (unaudited)
As at 30 September 2021
6
Ten Year Highest and Lowest Net Asset Value Per Share (unaudited)(continued)
As at 30 September 2021
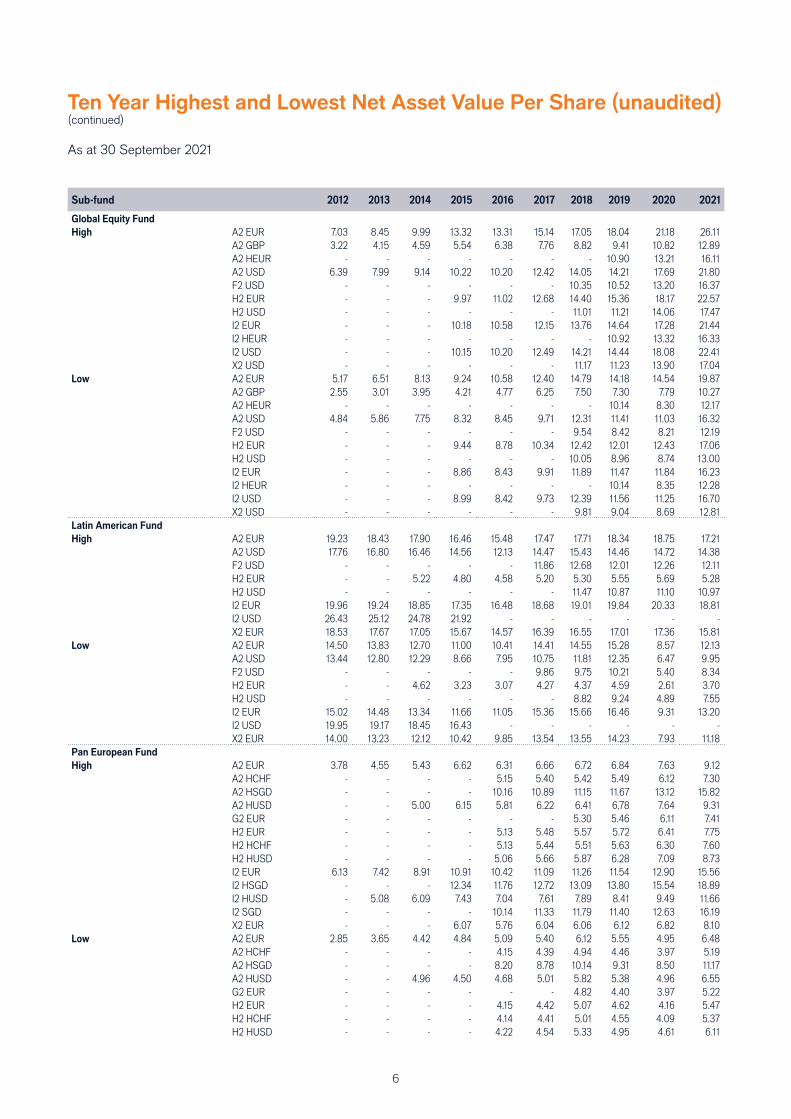
Sub-fund 2012 2013 2014 2015 2016 2017 2018 2019 2020 2021
Global Equity Fund
High A2 EUR 7.03 8.45 9.99 13.32 13.31 15.14 17.05 18.04 21.18 26.11A2 GBP 3.22 4.15 4.59 5.54 6.38 7.76 8.82 9.41 10.82 12.89A2 HEUR - - - - - - - 10.90 13.21 16.11A2 USD 6.39 7.99 9.14 10.22 10.20 12.42 14.05 14.21 17.69 21.80F2 USD - - - - - - 10.35 10.52 13.20 16.37H2 EUR - - - 9.97 11.02 12.68 14.40 15.36 18.17 22.57H2 USD - - - - - - 11.01 11.21 14.06 17.47I2 EUR - - - 10.18 10.58 12.15 13.76 14.64 17.28 21.44I2 HEUR - - - - - - - 10.92 13.32 16.33I2 USD - - - 10.15 10.20 12.49 14.21 14.44 18.08 22.41X2 USD - - - - - - 11.17 11.23 13.90 17.04
Low A2 EUR 5.17 6.51 8.13 9.24 10.58 12.40 14.79 14.18 14.54 19.87A2 GBP 2.55 3.01 3.95 4.21 4.77 6.25 7.50 7.30 7.79 10.27A2 HEUR - - - - - - - 10.14 8.30 12.17A2 USD 4.84 5.86 7.75 8.32 8.45 9.71 12.31 11.41 11.03 16.32F2 USD - - - - - - 9.54 8.42 8.21 12.19H2 EUR - - - 9.44 8.78 10.34 12.42 12.01 12.43 17.06H2 USD - - - - - - 10.05 8.96 8.74 13.00I2 EUR - - - 8.86 8.43 9.91 11.89 11.47 11.84 16.23I2 HEUR - - - - - - - 10.14 8.35 12.28I2 USD - - - 8.99 8.42 9.73 12.39 11.56 11.25 16.70X2 USD - - - - - - 9.81 9.04 8.69 12.81
Latin American Fund
High A2 EUR 19.23 18.43 17.90 16.46 15.48 17.47 17.71 18.34 18.75 17.21A2 USD 17.76 16.80 16.46 14.56 12.13 14.47 15.43 14.46 14.72 14.38F2 USD - - - - - 11.86 12.68 12.01 12.26 12.11H2 EUR - - 5.22 4.80 4.58 5.20 5.30 5.55 5.69 5.28H2 USD - - - - - - 11.47 10.87 11.10 10.97I2 EUR 19.96 19.24 18.85 17.35 16.48 18.68 19.01 19.84 20.33 18.81I2 USD 26.43 25.12 24.78 21.92 - - - - - -X2 EUR 18.53 17.67 17.05 15.67 14.57 16.39 16.55 17.01 17.36 15.81
Low A2 EUR 14.50 13.83 12.70 11.00 10.41 14.41 14.55 15.28 8.57 12.13A2 USD 13.44 12.80 12.29 8.66 7.95 10.75 11.81 12.35 6.47 9.95F2 USD - - - - - 9.86 9.75 10.21 5.40 8.34H2 EUR - - 4.62 3.23 3.07 4.27 4.37 4.59 2.61 3.70H2 USD - - - - - - 8.82 9.24 4.89 7.55I2 EUR 15.02 14.48 13.34 11.66 11.05 15.36 15.66 16.46 9.31 13.20I2 USD 19.95 19.17 18.45 16.43 - - - - - -X2 EUR 14.00 13.23 12.12 10.42 9.85 13.54 13.55 14.23 7.93 11.18
Pan European Fund
High A2 EUR 3.78 4.55 5.43 6.62 6.31 6.66 6.72 6.84 7.63 9.12A2 HCHF - - - - 5.15 5.40 5.42 5.49 6.12 7.30A2 HSGD - - - - 10.16 10.89 11.15 11.67 13.12 15.82A2 HUSD - - 5.00 6.15 5.81 6.22 6.41 6.78 7.64 9.31G2 EUR - - - - - - 5.30 5.46 6.11 7.41H2 EUR - - - - 5.13 5.48 5.57 5.72 6.41 7.75H2 HCHF - - - - 5.13 5.44 5.51 5.63 6.30 7.60H2 HUSD - - - - 5.06 5.66 5.87 6.28 7.09 8.73I2 EUR 6.13 7.42 8.91 10.91 10.42 11.09 11.26 11.54 12.90 15.56I2 HSGD - - - 12.34 11.76 12.72 13.09 13.80 15.54 18.89I2 HUSD - 5.08 6.09 7.43 7.04 7.61 7.89 8.41 9.49 11.66I2 SGD - - - - 10.14 11.33 11.79 11.40 12.63 16.19X2 EUR - - - 6.07 5.76 6.04 6.06 6.12 6.82 8.10
Low A2 EUR 2.85 3.65 4.42 4.84 5.09 5.40 6.12 5.55 4.95 6.48A2 HCHF - - - - 4.15 4.39 4.94 4.46 3.97 5.19A2 HSGD - - - - 8.20 8.78 10.14 9.31 8.50 11.17A2 HUSD - - 4.96 4.50 4.68 5.01 5.82 5.38 4.96 6.55G2 EUR - - - - - - 4.82 4.40 3.97 5.22H2 EUR - - - - 4.15 4.42 5.07 4.62 4.16 5.47H2 HCHF - - - - 4.14 4.41 5.01 4.55 4.09 5.37H2 HUSD - - - - 4.22 4.54 5.33 4.95 4.61 6.11
7
Ten Year Highest and Lowest Net Asset Value Per Share (unaudited)(continued)
As at 30 September 2021
Sub-fund 2012 2013 2014 2015 2016 2017 2018 2019 2020 2021
Pan European Fund (continued)
I2 EUR 4.60 5.93 7.21 7.95 8.42 8.97 10.25 9.32 8.37 10.99I2 HSGD - - - 10.05 9.51 10.22 11.89 10.97 10.08 13.27I2 HUSD - 4.85 4.93 5.43 5.68 6.11 7.16 6.65 6.17 8.17I2 SGD - - - - 8.42 8.97 10.85 9.47 8.53 11.41X2 EUR - - - 4.70 4.64 4.91 5.53 4.99 4.42 5.77
Pan European Smaller Companies Fund
High A1 EUR 6.67 8.57 10.10 12.32 11.93 14.47 15.04 14.13 15.37 21.03A2 EUR 6.86 8.87 10.48 12.82 12.41 15.10 15.78 14.93 16.44 22.50A2 HUSD - - - - 10.29 12.88 13.65 13.29 14.91 20.89H2 EUR - - 5.51 6.80 6.60 8.15 8.56 8.15 9.02 12.51H2 HUSD - - - - - - 10.90 10.68 12.04 17.11I2 EUR - - 5.77 7.10 6.89 8.47 8.88 8.44 9.33 12.89X2 EUR 6.52 8.37 9.85 11.99 11.59 13.98 14.56 13.71 15.05 20.42
Low A1 EUR 4.90 6.23 8.35 8.14 9.76 11.23 13.76 10.93 8.41 13.04A2 EUR 5.04 6.45 8.66 8.47 10.15 11.73 14.43 11.55 9.00 13.95A2 HUSD - - - - 8.46 9.87 12.33 10.17 8.21 12.84H2 EUR - - 4.85 4.46 5.41 6.29 7.80 6.29 4.95 7.71H2 HUSD - - - - - - 9.95 8.16 6.64 10.44I2 EUR - - 4.93 4.67 5.64 6.54 8.10 6.52 5.12 7.95X2 EUR 4.80 6.11 8.16 7.95 9.48 10.91 13.31 10.63 8.23 12.72
Absolute Return Fund
High A2 GBP 2.23 2.58 2.70 2.88 2.98 3.06 3.09 3.05 3.13 3.28A2 HCHF - - - - 5.01 5.09 5.10 4.99 5.02 5.21A2 HEUR 5.31 6.11 6.38 6.77 6.95 7.08 7.10 6.98 7.05 7.34A2 HUSD - - 5.16 5.49 5.69 5.85 5.98 6.01 6.24 6.56F2 HUSD - - - - - 5.15 5.28 5.33 5.55 5.85G1 GBP - - 5.10 5.48 5.72 5.89 5.98 5.94 6.14 6.47G2 GBP - - 5.10 5.47 5.72 5.89 5.98 5.93 6.14 6.48G2 HEUR - - 5.10 5.45 5.65 5.78 5.83 5.74 5.86 6.15G2 HUSD - - 5.10 5.45 5.70 5.89 6.06 6.15 6.41 6.78H1 GBP - - - - 5.15 5.29 5.35 5.30 5.48 5.77H2 GBP - - 5.15 5.51 5.74 5.90 5.97 5.91 6.11 6.44H2 HCHF - - - - 5.03 5.12 5.13 5.05 5.11 5.34H2 HEUR - - 5.14 5.47 5.65 5.77 5.79 5.71 5.81 6.08H2 HUSD - - 5.13 5.48 5.71 5.90 6.05 6.12 6.38 6.73I1 GBP - - - - - 5.20 5.27 5.21 5.39 5.68I2 GBP - 10.13 10.65 11.41 11.89 12.22 12.38 12.25 12.67 13.35I2 HCHF - - - 5.07 5.21 5.31 5.33 5.24 5.30 5.54I2 HEUR 5.30 6.14 6.43 6.86 7.09 7.25 7.29 7.18 7.30 7.64I2 HJPY - - - - - 550.30 557.88 550.01 559.91 588.68I2 HUSD 5.06 5.85 6.13 6.55 6.83 7.06 7.24 7.32 7.63 8.05R2 HJPY - - 508.01 539.76 556.37 567.59 569.51 - - -X2 HUSD - - - - 5.09 5.22 5.31 5.30 5.50 5.75
Low A2 GBP 2.13 2.18 2.55 2.62 2.85 2.94 3.01 2.95 3.00 3.07A2 HCHF - - - - 4.87 4.93 4.96 4.81 4.80 4.89A2 HEUR 5.07 5.19 6.04 6.18 6.69 6.84 6.92 6.73 6.75 6.89A2 HUSD - - 4.96 5.00 5.42 5.60 5.80 5.76 5.97 6.14F2 HUSD - - - - - 4.97 5.12 5.09 5.30 5.46G1 GBP - - 4.93 4.96 5.42 5.64 5.82 5.74 5.88 6.03G2 GBP - - 4.91 4.95 5.42 5.64 5.81 5.73 5.89 6.04G2 HEUR - - 4.96 4.95 5.39 5.56 5.68 5.55 5.62 5.76G2 HUSD - - 4.93 4.95 5.39 5.62 5.87 5.85 6.11 6.31H1 GBP - - - - 5.02 5.07 5.21 5.13 5.26 5.39H2 GBP - - 4.97 4.99 5.46 5.66 5.81 5.72 5.87 6.01H2 HCHF - - - - 4.88 4.94 5.00 4.87 4.90 5.01H2 HEUR - - 4.96 4.98 5.41 5.56 5.66 5.51 5.57 5.70H2 HUSD - - 4.97 4.98 5.42 5.63 5.86 5.84 6.08 6.28I1 GBP - - - - - 5.01 5.13 5.05 5.17 5.30I2 GBP - 10.00 10.02 10.34 11.29 11.72 12.05 11.86 12.16 12.47I2 HCHF - - - 4.95 5.01 5.13 5.19 5.05 5.08 5.19I2 HEUR 5.07 5.20 6.07 6.24 6.79 6.98 7.11 6.93 7.01 7.17
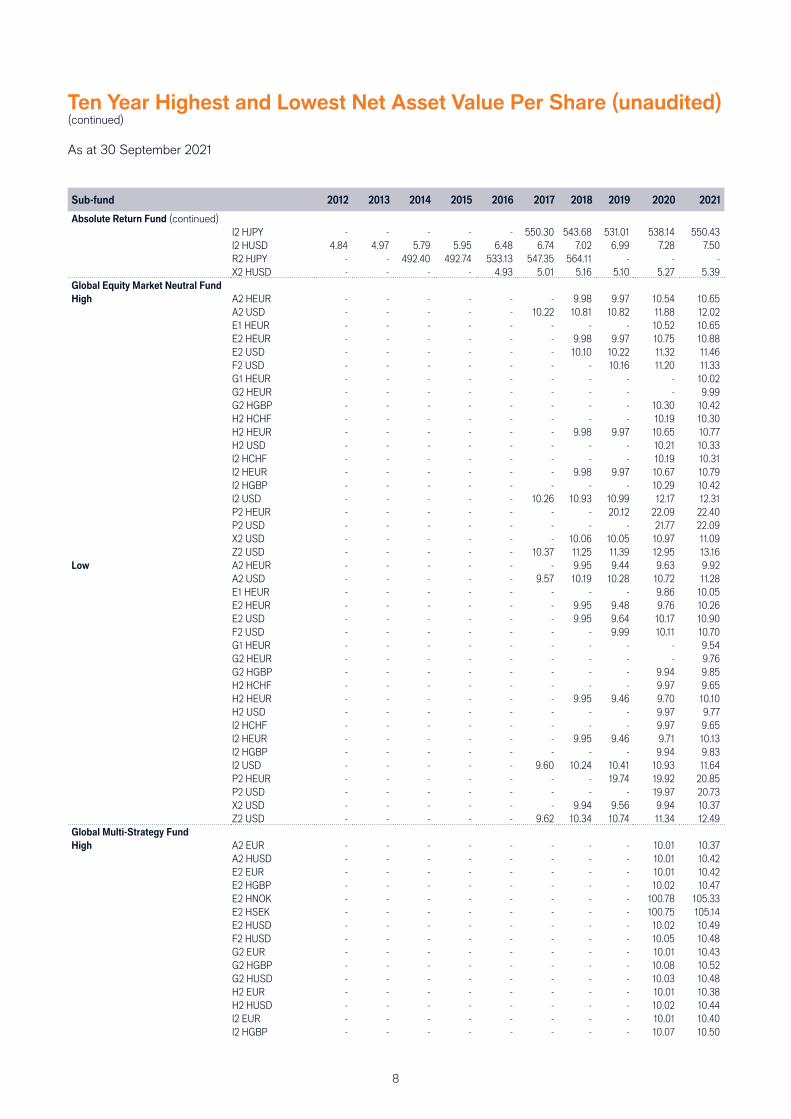
8
Ten Year Highest and Lowest Net Asset Value Per Share (unaudited)(continued)
As at 30 September 2021
Sub-fund 2012 2013 2014 2015 2016 2017 2018 2019 2020 2021
Absolute Return Fund (continued)
I2 HJPY - - - - - 550.30 543.68 531.01 538.14 550.43I2 HUSD 4.84 4.97 5.79 5.95 6.48 6.74 7.02 6.99 7.28 7.50R2 HJPY - - 492.40 492.74 533.13 547.35 564.11 - - -X2 HUSD - - - - 4.93 5.01 5.16 5.10 5.27 5.39
Global Equity Market Neutral Fund
High A2 HEUR - - - - - - 9.98 9.97 10.54 10.65A2 USD - - - - - 10.22 10.81 10.82 11.88 12.02E1 HEUR - - - - - - - - 10.52 10.65E2 HEUR - - - - - - 9.98 9.97 10.75 10.88E2 USD - - - - - - 10.10 10.22 11.32 11.46F2 USD - - - - - - - 10.16 11.20 11.33G1 HEUR - - - - - - - - - 10.02G2 HEUR - - - - - - - - - 9.99G2 HGBP - - - - - - - - 10.30 10.42H2 HCHF - - - - - - - - 10.19 10.30H2 HEUR - - - - - - 9.98 9.97 10.65 10.77H2 USD - - - - - - - - 10.21 10.33I2 HCHF - - - - - - - - 10.19 10.31I2 HEUR - - - - - - 9.98 9.97 10.67 10.79I2 HGBP - - - - - - - - 10.29 10.42I2 USD - - - - - 10.26 10.93 10.99 12.17 12.31P2 HEUR - - - - - - - 20.12 22.09 22.40P2 USD - - - - - - - - 21.77 22.09X2 USD - - - - - - 10.06 10.05 10.97 11.09Z2 USD - - - - - 10.37 11.25 11.39 12.95 13.16
Low A2 HEUR - - - - - - 9.95 9.44 9.63 9.92A2 USD - - - - - 9.57 10.19 10.28 10.72 11.28E1 HEUR - - - - - - - - 9.86 10.05E2 HEUR - - - - - - 9.95 9.48 9.76 10.26E2 USD - - - - - - 9.95 9.64 10.17 10.90F2 USD - - - - - - - 9.99 10.11 10.70G1 HEUR - - - - - - - - - 9.54G2 HEUR - - - - - - - - - 9.76G2 HGBP - - - - - - - - 9.94 9.85H2 HCHF - - - - - - - - 9.97 9.65H2 HEUR - - - - - - 9.95 9.46 9.70 10.10H2 USD - - - - - - - - 9.97 9.77I2 HCHF - - - - - - - - 9.97 9.65I2 HEUR - - - - - - 9.95 9.46 9.71 10.13I2 HGBP - - - - - - - - 9.94 9.83I2 USD - - - - - 9.60 10.24 10.41 10.93 11.64P2 HEUR - - - - - - - 19.74 19.92 20.85P2 USD - - - - - - - - 19.97 20.73X2 USD - - - - - - 9.94 9.56 9.94 10.37Z2 USD - - - - - 9.62 10.34 10.74 11.34 12.49
Global Multi-Strategy Fund
High A2 EUR - - - - - - - - 10.01 10.37A2 HUSD - - - - - - - - 10.01 10.42E2 EUR - - - - - - - - 10.01 10.42E2 HGBP - - - - - - - - 10.02 10.47E2 HNOK - - - - - - - - 100.78 105.33E2 HSEK - - - - - - - - 100.75 105.14E2 HUSD - - - - - - - - 10.02 10.49F2 HUSD - - - - - - - - 10.05 10.48G2 EUR - - - - - - - - 10.01 10.43G2 HGBP - - - - - - - - 10.08 10.52G2 HUSD - - - - - - - - 10.03 10.48H2 EUR - - - - - - - - 10.01 10.38H2 HUSD - - - - - - - - 10.02 10.44I2 EUR - - - - - - - - 10.01 10.40I2 HGBP - - - - - - - - 10.07 10.50
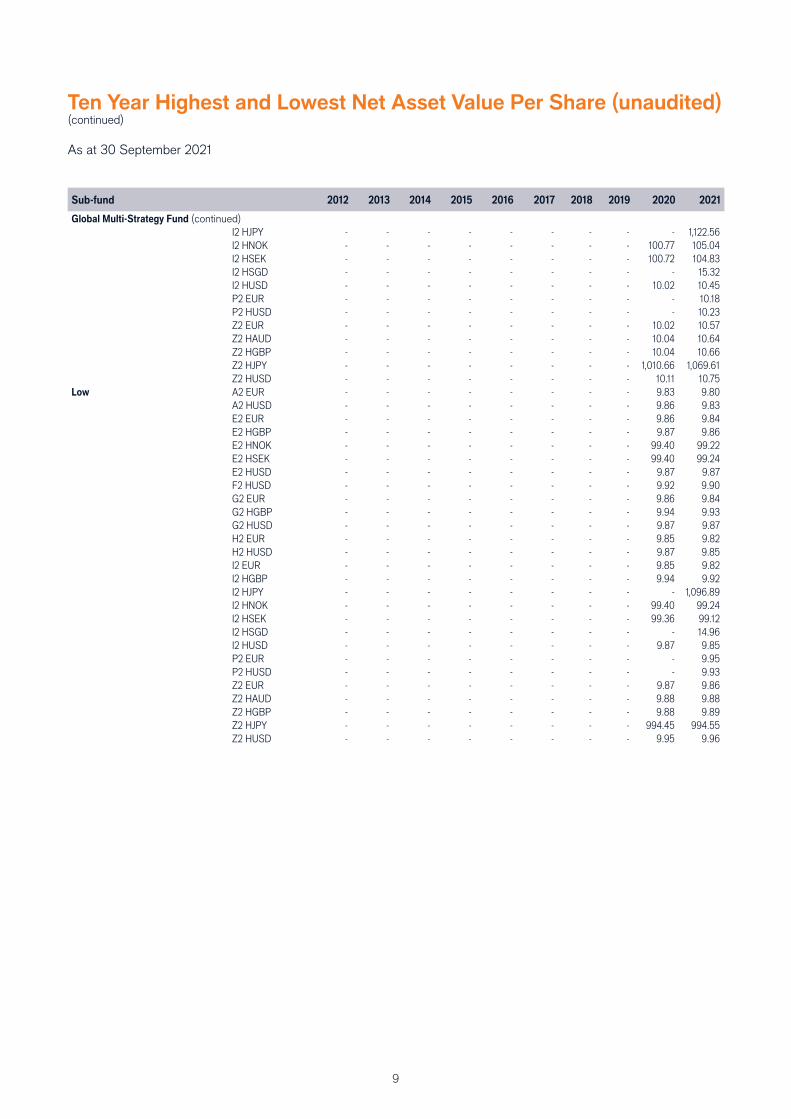
9
Ten Year Highest and Lowest Net Asset Value Per Share (unaudited)(continued)
As at 30 September 2021
Sub-fund 2012 2013 2014 2015 2016 2017 2018 2019 2020 2021
Global Multi-Strategy Fund (continued)
I2 HJPY - - - - - - - - - 1,122.56I2 HNOK - - - - - - - - 100.77 105.04I2 HSEK - - - - - - - - 100.72 104.83I2 HSGD - - - - - - - - - 15.32I2 HUSD - - - - - - - - 10.02 10.45P2 EUR - - - - - - - - - 10.18P2 HUSD - - - - - - - - - 10.23Z2 EUR - - - - - - - - 10.02 10.57Z2 HAUD - - - - - - - - 10.04 10.64Z2 HGBP - - - - - - - - 10.04 10.66Z2 HJPY - - - - - - - - 1,010.66 1,069.61Z2 HUSD - - - - - - - - 10.11 10.75
Low A2 EUR - - - - - - - - 9.83 9.80A2 HUSD - - - - - - - - 9.86 9.83E2 EUR - - - - - - - - 9.86 9.84E2 HGBP - - - - - - - - 9.87 9.86E2 HNOK - - - - - - - - 99.40 99.22E2 HSEK - - - - - - - - 99.40 99.24E2 HUSD - - - - - - - - 9.87 9.87F2 HUSD - - - - - - - - 9.92 9.90G2 EUR - - - - - - - - 9.86 9.84G2 HGBP - - - - - - - - 9.94 9.93G2 HUSD - - - - - - - - 9.87 9.87H2 EUR - - - - - - - - 9.85 9.82H2 HUSD - - - - - - - - 9.87 9.85I2 EUR - - - - - - - - 9.85 9.82I2 HGBP - - - - - - - - 9.94 9.92I2 HJPY - - - - - - - - - 1,096.89I2 HNOK - - - - - - - - 99.40 99.24I2 HSEK - - - - - - - - 99.36 99.12I2 HSGD - - - - - - - - - 14.96I2 HUSD - - - - - - - - 9.87 9.85P2 EUR - - - - - - - - - 9.95P2 HUSD - - - - - - - - - 9.93Z2 EUR - - - - - - - - 9.87 9.86Z2 HAUD - - - - - - - - 9.88 9.88Z2 HGBP - - - - - - - - 9.88 9.89Z2 HJPY - - - - - - - - 994.45 994.55Z2 HUSD - - - - - - - - 9.95 9.96
10
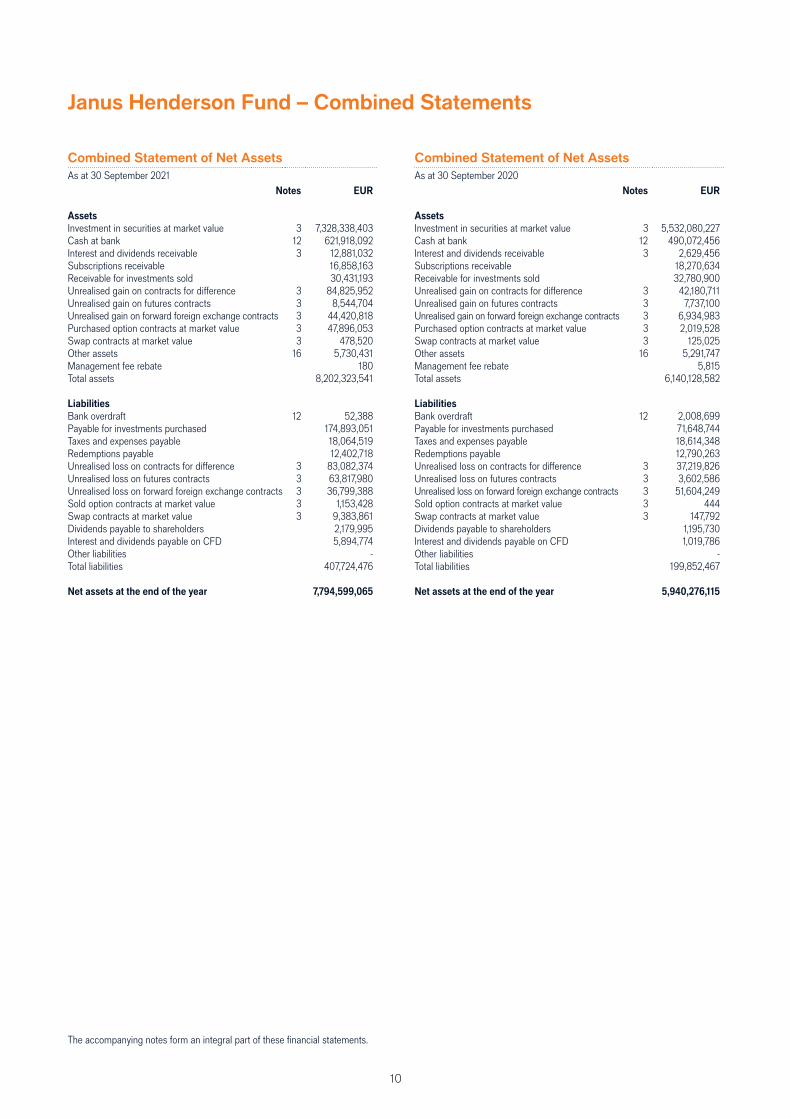
Janus Henderson Fund – Combined Statements
Combined Statement of Net Assets
As at 30 September 2021Notes EUR
Assets
Investment in securities at market value 3 7,328,338,403 Cash at bank 12 621,918,092 Interest and dividends receivable 3 12,881,032 Subscriptions receivable 16,858,163 Receivable for investments sold 30,431,193 Unrealised gain on contracts for diff erence 3 84,825,952 Unrealised gain on futures contracts 3 8,544,704 Unrealised gain on forward foreign exchange contracts 3 44,420,818 Purchased option contracts at market value 3 47,896,053 Swap contracts at market value 3 478,520 Other assets 16 5,730,431 Management fee rebate 180Total assets 8,202,323,541
Liabilities
Bank overdraft 12 52,388 Payable for investments purchased 174,893,051 Taxes and expenses payable 18,064,519 Redemptions payable 12,402,718 Unrealised loss on contracts for diff erence 3 83,082,374 Unrealised loss on futures contracts 3 63,817,980 Unrealised loss on forward foreign exchange contracts 3 36,799,388 Sold option contracts at market value 3 1,153,428 Swap contracts at market value 3 9,383,861 Dividends payable to shareholders 2,179,995 Interest and dividends payable on CFD 5,894,774 Other liabilities -Total liabilities 407,724,476
Net assets at the end of the year 7,794,599,065
Combined Statement of Net Assets
As at 30 September 2020Notes EUR
Assets
Investment in securities at market value 3 5,532,080,227 Cash at bank 12 490,072,456 Interest and dividends receivable 3 2,629,456 Subscriptions receivable 18,270,634 Receivable for investments sold 32,780,900 Unrealised gain on contracts for diff erence 3 42,180,711 Unrealised gain on futures contracts 3 7,737,100 Unrealised gain on forward foreign exchange contracts 3 6,934,983 Purchased option contracts at market value 3 2,019,528 Swap contracts at market value 3 125,025 Other assets 16 5,291,747 Management fee rebate 5,815 Total assets 6,140,128,582
Liabilities
Bank overdraft 12 2,008,699 Payable for investments purchased 71,648,744 Taxes and expenses payable 18,614,348 Redemptions payable 12,790,263 Unrealised loss on contracts for diff erence 3 37,219,826 Unrealised loss on futures contracts 3 3,602,586 Unrealised loss on forward foreign exchange contracts 3 51,604,249 Sold option contracts at market value 3 444 Swap contracts at market value 3 147,792 Dividends payable to shareholders 1,195,730 Interest and dividends payable on CFD 1,019,786 Other liabilities -Total liabilities 199,852,467 Net assets at the end of the year 5,940,276,115
The accompanying notes form an integral part of these fi nancial statements.
11
Janus Henderson Fund – Combined Statements
Combined Statement of OperationsFor the year from 1 October 2020 to 30 September 2021
Notes EUR
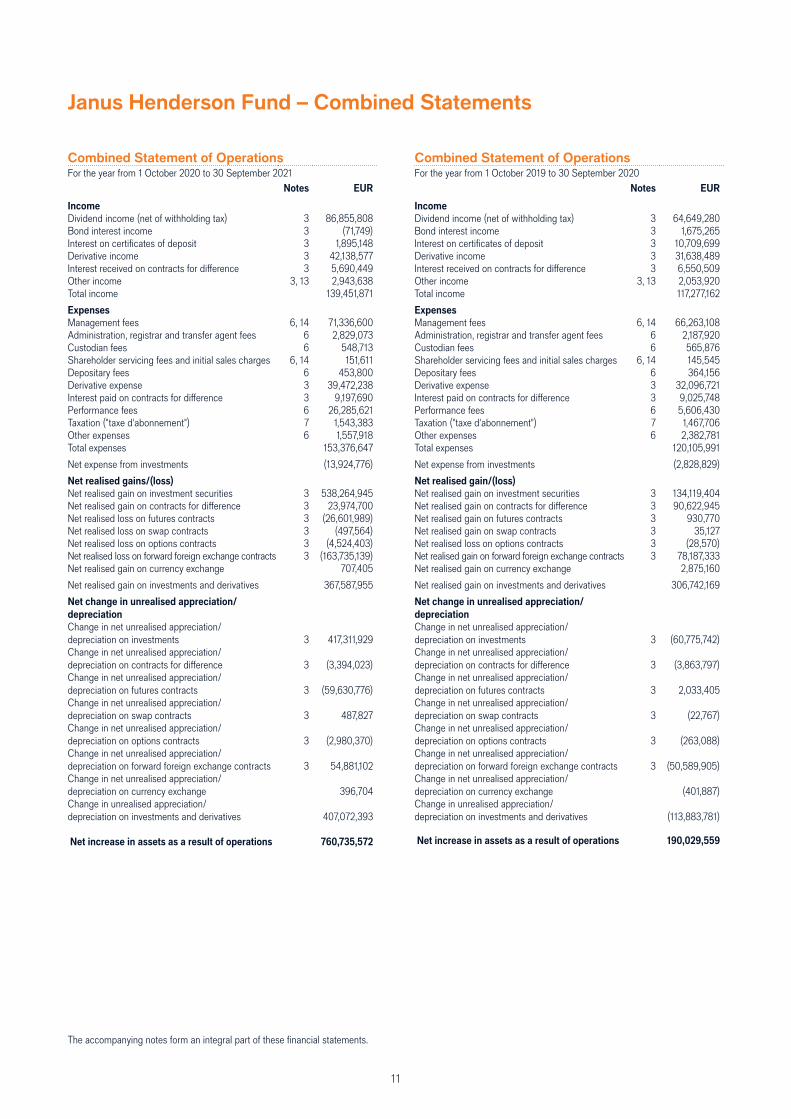
Income
Dividend income (net of withholding tax) 3 86,855,808 Bond interest income 3 (71,749) Interest on certifi cates of deposit 3 1,895,148 Derivative income 3 42,138,577 Interest received on contracts for diff erence 3 5,690,449 Other income 3, 13 2,943,638 Total income 139,451,871
Expenses
Management fees 6, 14 71,336,600 Administration, registrar and transfer agent fees 6 2,829,073 Custodian fees 6 548,713 Shareholder servicing fees and initial sales charges 6, 14 151,611 Depositary fees 6 453,800 Derivative expense 3 39,472,238 Interest paid on contracts for diff erence 3 9,197,690 Performance fees 6 26,285,621 Taxation ("taxe d'abonnement") 7 1,543,383 Other expenses 6 1,557,918 Total expenses 153,376,647
Net expense from investments (13,924,776)
Net realised gains/(loss)
Net realised gain on investment securities 3 538,264,945 Net realised gain on contracts for diff erence 3 23,974,700 Net realised loss on futures contracts 3 (26,601,989) Net realised loss on swap contracts 3 (497,564) Net realised loss on options contracts 3 (4,524,403) Net realised loss on forward foreign exchange contracts 3 (163,735,139) Net realised gain on currency exchange 707,405
Net realised gain on investments and derivatives 367,587,955
Net change in unrealised appreciation/
depreciation
Change in net unrealised appreciation/depreciation on investments 3 417,311,929 Change in net unrealised appreciation/depreciation on contracts for diff erence 3 (3,394,023) Change in net unrealised appreciation/depreciation on futures contracts 3 (59,630,776) Change in net unrealised appreciation/depreciation on swap contracts 3 487,827 Change in net unrealised appreciation/depreciation on options contracts 3 (2,980,370) Change in net unrealised appreciation/depreciation on forward foreign exchange contracts 3 54,881,102 Change in net unrealised appreciation/depreciation on currency exchange 396,704 Change in unrealised appreciation/depreciation on investments and derivatives 407,072,393
Net increase in assets as a result of operations 760,735,572
Combined Statement of OperationsFor the year from 1 October 2019 to 30 September 2020
Notes EUR
Income
Dividend income (net of withholding tax) 3 64,649,280 Bond interest income 3 1,675,265 Interest on certifi cates of deposit 3 10,709,699 Derivative income 3 31,638,489 Interest received on contracts for diff erence 3 6,550,509 Other income 3, 13 2,053,920 Total income 117,277,162
Expenses
Management fees 6, 14 66,263,108 Administration, registrar and transfer agent fees 6 2,187,920 Custodian fees 6 565,876 Shareholder servicing fees and initial sales charges 6, 14 145,545 Depositary fees 6 364,156 Derivative expense 3 32,096,721 Interest paid on contracts for diff erence 3 9,025,748 Performance fees 6 5,606,430 Taxation ("taxe d'abonnement") 7 1,467,706 Other expenses 6 2,382,781 Total expenses 120,105,991
Net expense from investments (2,828,829)
Net realised gain/(loss)
Net realised gain on investment securities 3 134,119,404 Net realised gain on contracts for diff erence 3 90,622,945 Net realised gain on futures contracts 3 930,770 Net realised gain on swap contracts 3 35,127 Net realised loss on options contracts 3 (28,570) Net realised gain on forward foreign exchange contracts 3 78,187,333 Net realised gain on currency exchange 2,875,160
Net realised gain on investments and derivatives 306,742,169
Net change in unrealised appreciation/
depreciation
Change in net unrealised appreciation/depreciation on investments 3 (60,775,742) Change in net unrealised appreciation/depreciation on contracts for diff erence 3 (3,863,797) Change in net unrealised appreciation/depreciation on futures contracts 3 2,033,405 Change in net unrealised appreciation/depreciation on swap contracts 3 (22,767) Change in net unrealised appreciation/depreciation on options contracts 3 (263,088) Change in net unrealised appreciation/depreciation on forward foreign exchange contracts 3 (50,589,905) Change in net unrealised appreciation/depreciation on currency exchange (401,887) Change in unrealised appreciation/depreciation on investments and derivatives (113,883,781)
Net increase in assets as a result of operations 190,029,559
The accompanying notes form an integral part of these fi nancial statements.
12
Janus Henderson Fund – Combined Statements
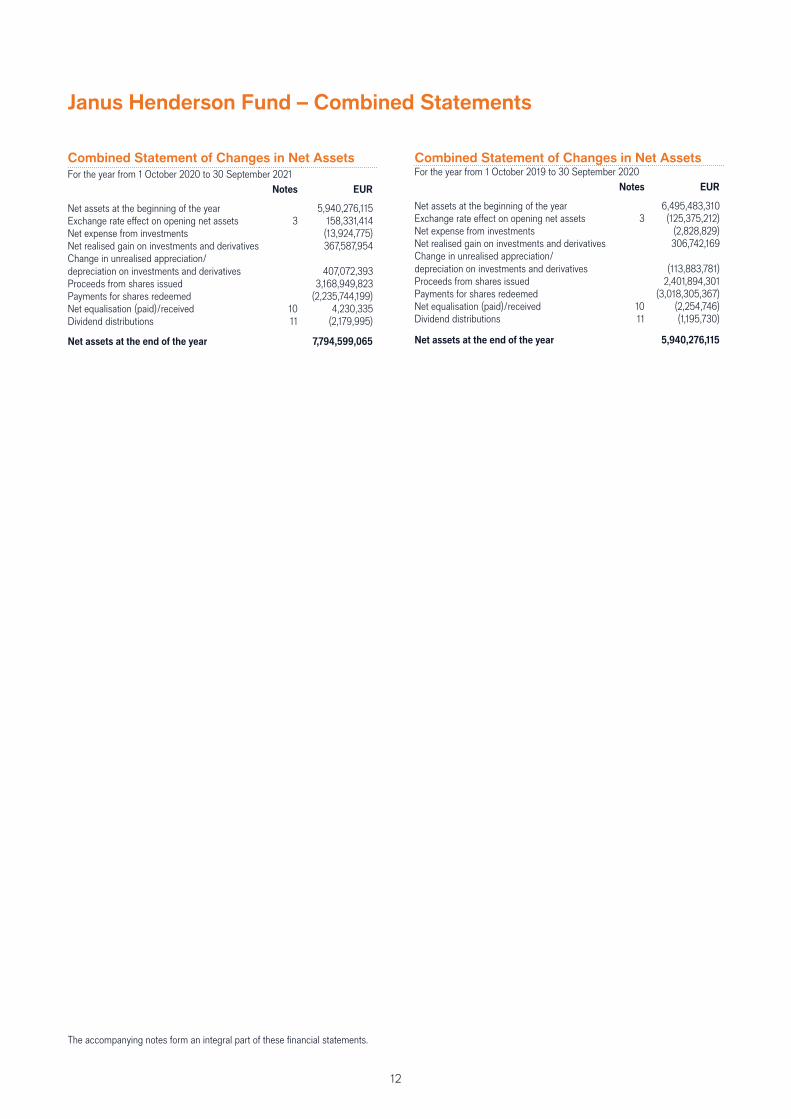
Combined Statement of Changes in Net Assets
For the year from 1 October 2020 to 30 September 2021 Notes EUR
Net assets at the beginning of the year 5,940,276,115 Exchange rate eff ect on opening net assets 3 158,331,414 Net expense from investments (13,924,775) Net realised gain on investments and derivatives 367,587,954 Change in unrealised appreciation/depreciation on investments and derivatives 407,072,393 Proceeds from shares issued 3,168,949,823 Payments for shares redeemed (2,235,744,199) Net equalisation (paid)/received 10 4,230,335 Dividend distributions 11 (2,179,995)
Net assets at the end of the year 7,794,599,065
Combined Statement of Changes in Net Assets For the year from 1 October 2019 to 30 September 2020
Notes EUR
Net assets at the beginning of the year 6,495,483,310 Exchange rate eff ect on opening net assets 3 (125,375,212) Net expense from investments (2,828,829) Net realised gain on investments and derivatives 306,742,169 Change in unrealised appreciation/depreciation on investments and derivatives (113,883,781) Proceeds from shares issued 2,401,894,301 Payments for shares redeemed (3,018,305,367) Net equalisation (paid)/received 10 (2,254,746) Dividend distributions 11 (1,195,730)
Net assets at the end of the year 5,940,276,115
The accompanying notes form an integral part of these fi nancial statements.
13
Continental European Fund
Investment report for the year from 1 October 2020 to 30 September 2021
Investment Fund Managers
John Bennett and Tom O’Hara
The fund returned 28.1% (Net) based on Class H2 in Euro terms over the year under review, compared with a return of 27.6% in the MSCI
Europe (ex UK) Index, Euro terms.
As the 2020 calendar year drew to a close, and Europe was suff ering from a second wave of COVID-19 infections, we drew succour
from the unequivocally excellent vaccine data. This encouraged us to strengthen our view that a second ‘V-shape’ recovery (following
the industrial recovery of mid-2020) was likely: this time in the consumer sphere. This saw us shift the portfolio towards the consumer
discretionary sector. Notwithstanding, at times, hysterical media and political rhetoric, concerning vaccine roll-outs, vaccine effi cacy and
even vaccine nationalism, we resolutely trusted the data. Thus, we were not swayed in building the fund’s positions in stocks we considered
strong reopening benefi ciaries. Prime examples included Airbus (aerospace), BMW (automotive), Daimler (automotive), EssilorLuxottica
(eyewear), Inditex (apparel), Mowi (fi sh farming), Pandora (jewellery), Ryanair (airline) and Stellantis (automotive).
This evolving outlook goes a long way to explaining the returns over the reporting year. The biggest contributor at the sector level was an
overweight exposure to the consumer discretionary sector as well as underweight positions in the more defensive areas of healthcare,
communication services and consumer staples. The fund’s underweight position in the fi nancials sector was the biggest drag. While an
improving infl ation outlook has caused us to narrow the underweight position versus the benchmark, the lack of a broader fundamental
driver for the banking sector has limited the amount of client capital we are willing to deploy.
At the stock level, some of the biggest contributions came from Daimler and ASML. Daimler’s new management team is leading the
biggest cost-cutting and refocusing project in the company’s modern history to lower breakeven points and successfully transition to the
electric vehicle world. ASML continued to benefi t from its monopolistic position in semiconductor manufacturing equipment. It should be
noted, however, that we took profi ts in the semiconductor sector more broadly, following strong share price performance and early signs the
cycle may be starting a down swing. Elsewhere, building materials company Compagnie de St Gobain added to returns. The management
team has done a good job at improving cash conversion and corporate governance, and the company is well positioned for the green
stimulus that will be put to work in the coming year.
At the time of writing, the world economy is facing the stiff challenge presented by what could be termed ‘a shortage of everything’. If we
dwell on energy, here is a sector where supply shortages have been exacerbated by the ‘gold rush’ known as environmental, social and
governance investing. Politicians, protesters and investors are seemingly uniting to ‘cancel’ certain corporates and/or industries. This, in
turn, has led to something of a starvation of capital committed to the likes of oil exploration and carbon energy infrastructure. We are now
faced with the harsh realities of such cancellation as the world is brought to a shuddering reality: that the energy transition has to take
time and it cannot be rushed. As unfashionable as this view may seem, it is also unfashionable, to some, to hold oil stocks in investment
portfolios. Here we see opportunity: to invest in seriously undervalued stocks and, via engagement, to demonstrate that those companies
are part of the solution. Therefore, the most recent activity has been to increase the fund’s exposure to the oil sector. We also believe that
the ‘shape’ of the market has thrown up further opportunity, one that can be described as the style discrepancy. With growth stocks once
again in the ascendancy over the summer months, a number of value names were left in their wake. Thus, we added selectively to holdings
in the automotive and banking sectors. Other additions included Danone, where management change has led to meaningful selling, general
and administrative expenses reduction as well as portfolio reshaping toward plant-based growth products. Pandora fi ts into our reopening
theme but is also under new leadership. The company has undertaken a comprehensive restructuring of the entire top team and has been
positioned for a more environmentally aware consumer with investment in its lab-grown diamond products. We also boosted the fund’s
exposure to big pharmaceutical companies, following a period of chronic underperformance.
14
Continental European Fund
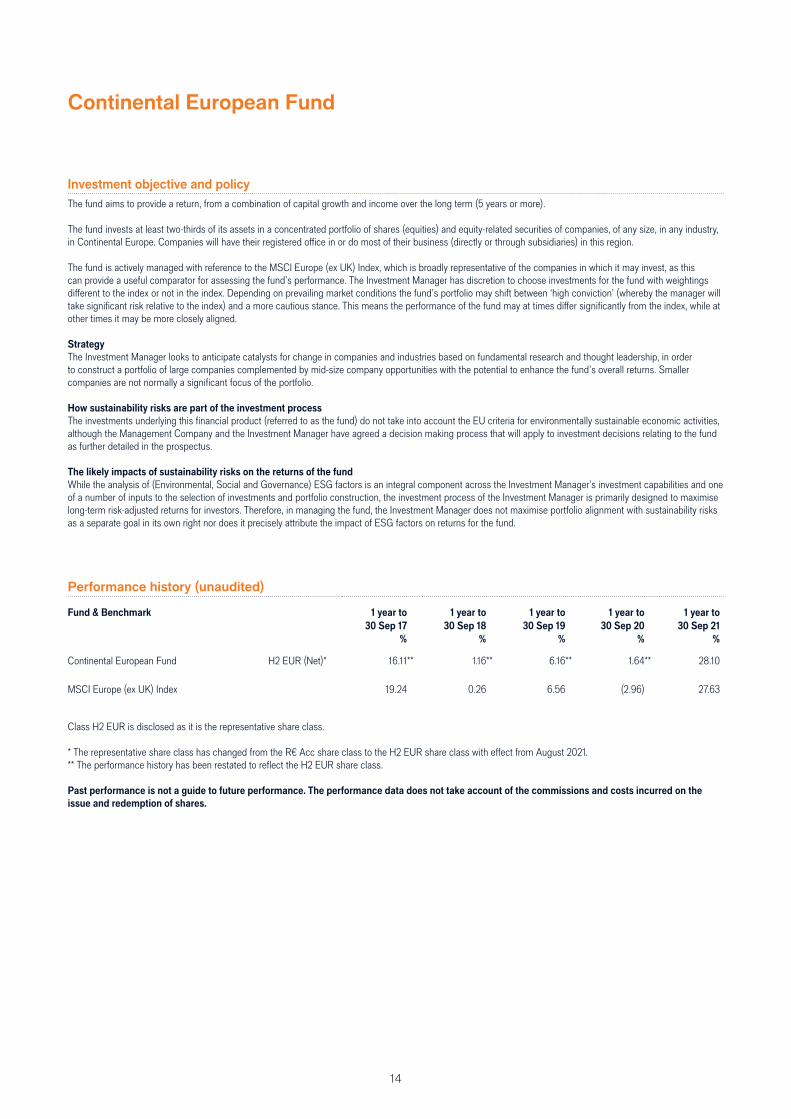
Performance history (unaudited)
Fund & Benchmark 1 year to 1 year to 1 year to 1 year to 1 year to
30 Sep 17 30 Sep 18 30 Sep 19 30 Sep 20 30 Sep 21
% % % % %
Continental European Fund H2 EUR (Net)* 16.11** 1.16** 6.16** 1.64** 28.10 MSCI Europe (ex UK) Index 19.24 0.26 6.56 (2.96) 27.63
Class H2 EUR is disclosed as it is the representative share class.
* The representative share class has changed from the R€ Acc share class to the H2 EUR share class with eff ect from August 2021.** The performance history has been restated to refl ect the H2 EUR share class. Past performance is not a guide to future performance. The performance data does not take account of the commissions and costs incurred on the
issue and redemption of shares.
Investment objective and policy
The fund aims to provide a return, from a combination of capital growth and income over the long term (5 years or more).
The fund invests at least two-thirds of its assets in a concentrated portfolio of shares (equities) and equity-related securities of companies, of any size, in any industry, in Continental Europe. Companies will have their registered offi ce in or do most of their business (directly or through subsidiaries) in this region.
The fund is actively managed with reference to the MSCI Europe (ex UK) Index, which is broadly representative of the companies in which it may invest, as this can provide a useful comparator for assessing the fund’s performance. The Investment Manager has discretion to choose investments for the fund with weightings diff erent to the index or not in the index. Depending on prevailing market conditions the fund’s portfolio may shift between ‘high conviction’ (whereby the manager will take signifi cant risk relative to the index) and a more cautious stance. This means the performance of the fund may at times diff er signifi cantly from the index, while at other times it may be more closely aligned.
Strategy
The Investment Manager looks to anticipate catalysts for change in companies and industries based on fundamental research and thought leadership, in order to construct a portfolio of large companies complemented by mid-size company opportunities with the potential to enhance the fund’s overall returns. Smaller companies are not normally a signifi cant focus of the portfolio.
How sustainability risks are part of the investment process
The investments underlying this fi nancial product (referred to as the fund) do not take into account the EU criteria for environmentally sustainable economic activities, although the Management Company and the Investment Manager have agreed a decision making process that will apply to investment decisions relating to the fund as further detailed in the prospectus.
The likely impacts of sustainability risks on the returns of the fund
While the analysis of (Environmental, Social and Governance) ESG factors is an integral component across the Investment Manager’s investment capabilities and one of a number of inputs to the selection of investments and portfolio construction, the investment process of the Investment Manager is primarily designed to maximise long-term risk-adjusted returns for investors. Therefore, in managing the fund, the Investment Manager does not maximise portfolio alignment with sustainability risks as a separate goal in its own right nor does it precisely attribute the impact of ESG factors on returns for the fund.
15
Continental European Fund
Statement of Net Assets
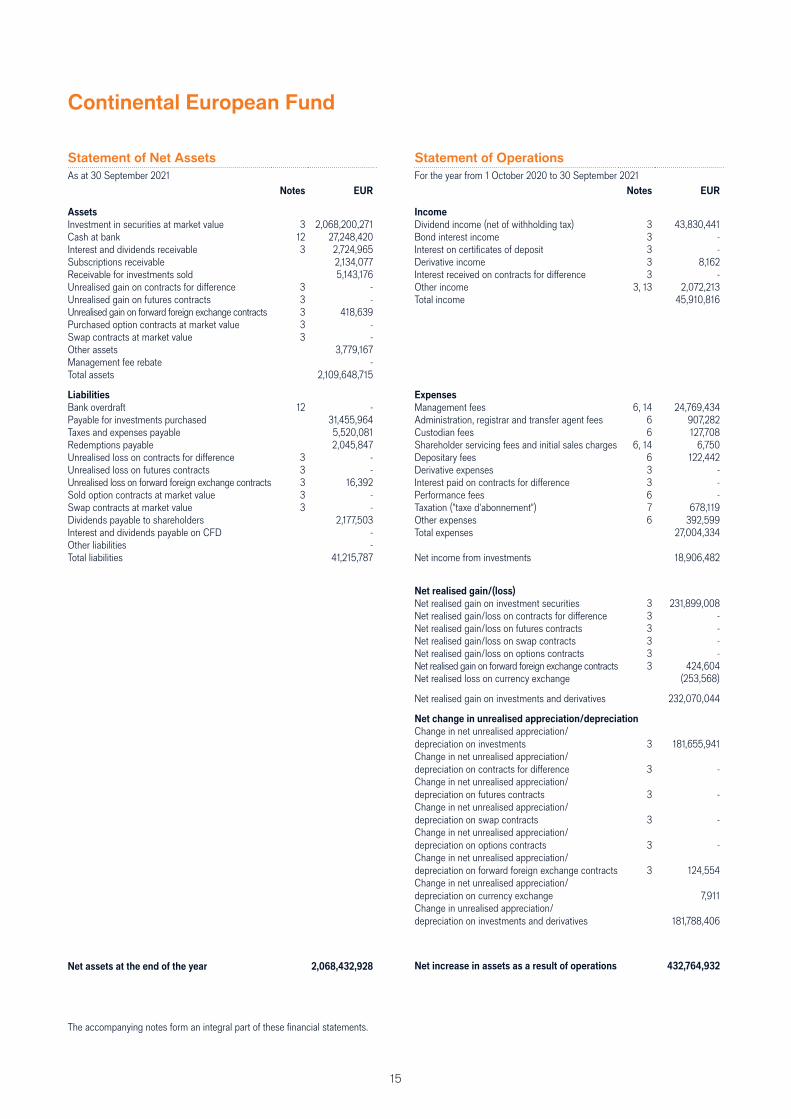
As at 30 September 2021Notes EUR
Assets
Investment in securities at market value 3 2,068,200,271 Cash at bank 12 27,248,420 Interest and dividends receivable 3 2,724,965 Subscriptions receivable 2,134,077 Receivable for investments sold 5,143,176 Unrealised gain on contracts for diff erence 3 -Unrealised gain on futures contracts 3 -Unrealised gain on forward foreign exchange contracts 3 418,639 Purchased option contracts at market value 3 -Swap contracts at market value 3 -Other assets 3,779,167 Management fee rebate -Total assets 2,109,648,715
Liabilities
Bank overdraft 12 -Payable for investments purchased 31,455,964 Taxes and expenses payable 5,520,081 Redemptions payable 2,045,847 Unrealised loss on contracts for diff erence 3 -Unrealised loss on futures contracts 3 -Unrealised loss on forward foreign exchange contracts 3 16,392 Sold option contracts at market value 3 -Swap contracts at market value 3 -Dividends payable to shareholders 2,177,503 Interest and dividends payable on CFD -Other liabilities -Total liabilities 41,215,787
Net assets at the end of the year 2,068,432,928
Statement of Operations
For the year from 1 October 2020 to 30 September 2021Notes EUR
Income
Dividend income (net of withholding tax) 3 43,830,441 Bond interest income 3 -Interest on certifi cates of deposit 3 -Derivative income 3 8,162 Interest received on contracts for diff erence 3 -Other income 3, 13 2,072,213 Total income 45,910,816
Expenses
Management fees 6, 14 24,769,434 Administration, registrar and transfer agent fees 6 907,282 Custodian fees 6 127,708 Shareholder servicing fees and initial sales charges 6, 14 6,750 Depositary fees 6 122,442 Derivative expenses 3 -Interest paid on contracts for diff erence 3 -Performance fees 6 -Taxation ("taxe d'abonnement") 7 678,119 Other expenses 6 392,599 Total expenses 27,004,334
Net income from investments 18,906,482
Net realised gain/(loss)
Net realised gain on investment securities 3 231,899,008 Net realised gain/loss on contracts for diff erence 3 -Net realised gain/loss on futures contracts 3 -Net realised gain/loss on swap contracts 3 -Net realised gain/loss on options contracts 3 -Net realised gain on forward foreign exchange contracts 3 424,604 Net realised loss on currency exchange (253,568)
Net realised gain on investments and derivatives 232,070,044
Net change in unrealised appreciation/depreciation
Change in net unrealised appreciation/depreciation on investments 3 181,655,941 Change in net unrealised appreciation/depreciation on contracts for diff erence 3 -Change in net unrealised appreciation/depreciation on futures contracts 3 -Change in net unrealised appreciation/depreciation on swap contracts 3 -Change in net unrealised appreciation/depreciation on options contracts 3 -Change in net unrealised appreciation/depreciation on forward foreign exchange contracts 3 124,554 Change in net unrealised appreciation/depreciation on currency exchange 7,911 Change in unrealised appreciation/depreciation on investments and derivatives 181,788,406
Net increase in assets as a result of operations 432,764,932
The accompanying notes form an integral part of these fi nancial statements.
16
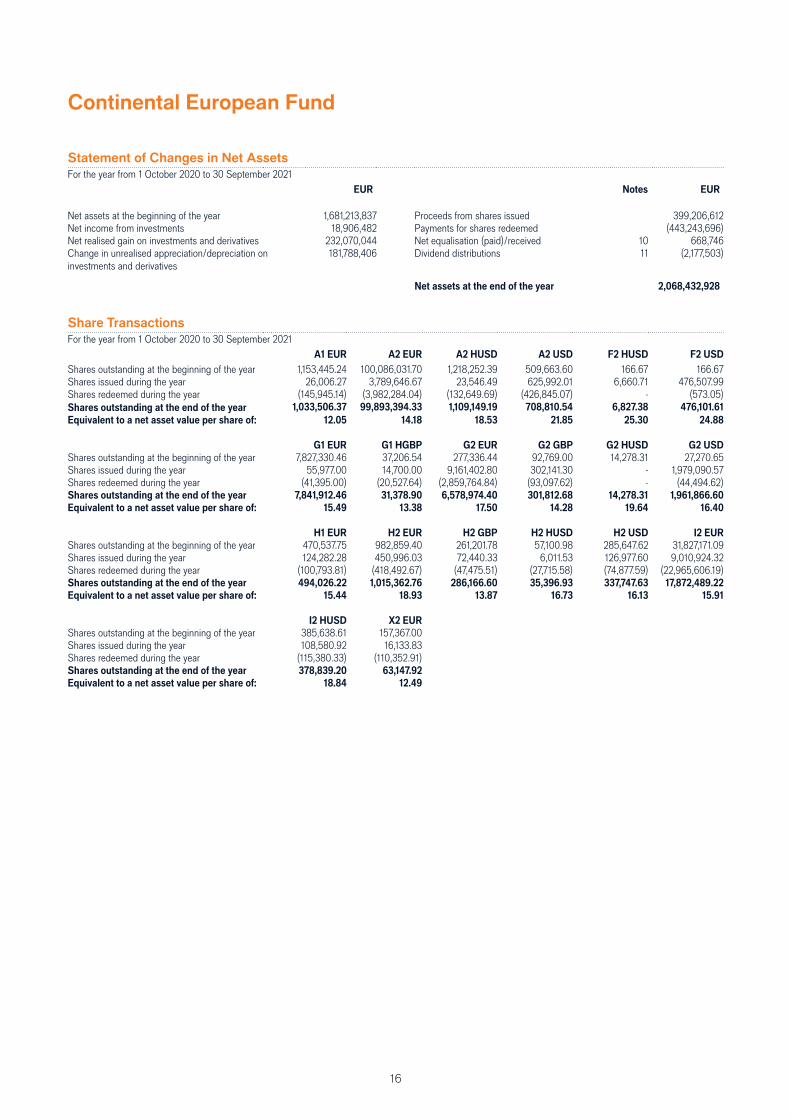
Continental European Fund
Share Transactions
For the year from 1 October 2020 to 30 September 2021A1 EUR A2 EUR A2 HUSD A2 USD F2 HUSD F2 USD
Shares outstanding at the beginning of the year 1,153,445.24 100,086,031.70 1,218,252.39 509,663.60 166.67 166.67Shares issued during the year 26,006.27 3,789,646.67 23,546.49 625,992.01 6,660.71 476,507.99Shares redeemed during the year (145,945.14) (3,982,284.04) (132,649.69) (426,845.07) - (573.05)Shares outstanding at the end of the year 1,033,506.37 99,893,394.33 1,109,149.19 708,810.54 6,827.38 476,101.61
Equivalent to a net asset value per share of: 12.05 14.18 18.53 21.85 25.30 24.88
G1 EUR G1 HGBP G2 EUR G2 GBP G2 HUSD G2 USD
Shares outstanding at the beginning of the year 7,827,330.46 37,206.54 277,336.44 92,769.00 14,278.31 27,270.65Shares issued during the year 55,977.00 14,700.00 9,161,402.80 302,141.30 - 1,979,090.57Shares redeemed during the year (41,395.00) (20,527.64) (2,859,764.84) (93,097.62) - (44,494.62)Shares outstanding at the end of the year 7,841,912.46 31,378.90 6,578,974.40 301,812.68 14,278.31 1,961,866.60
Equivalent to a net asset value per share of: 15.49 13.38 17.50 14.28 19.64 16.40
H1 EUR H2 EUR H2 GBP H2 HUSD H2 USD I2 EUR
Shares outstanding at the beginning of the year 470,537.75 982,859.40 261,201.78 57,100.98 285,647.62 31,827,171.09Shares issued during the year 124,282.28 450,996.03 72,440.33 6,011.53 126,977.60 9,010,924.32Shares redeemed during the year (100,793.81) (418,492.67) (47,475.51) (27,715.58) (74,877.59) (22,965,606.19)Shares outstanding at the end of the year 494,026.22 1,015,362.76 286,166.60 35,396.93 337,747.63 17,872,489.22
Equivalent to a net asset value per share of: 15.44 18.93 13.87 16.73 16.13 15.91
I2 HUSD X2 EUR
Shares outstanding at the beginning of the year 385,638.61 157,367.00Shares issued during the year 108,580.92 16,133.83Shares redeemed during the year (115,380.33) (110,352.91)Shares outstanding at the end of the year 378,839.20 63,147.92
Equivalent to a net asset value per share of: 18.84 12.49
Statement of Changes in Net Assets
For the year from 1 October 2020 to 30 September 2021EUR Notes EUR
Net assets at the beginning of the year 1,681,213,837 Proceeds from shares issued 399,206,612 Net income from investments 18,906,482 Payments for shares redeemed (443,243,696) Net realised gain on investments and derivatives 232,070,044 Net equalisation (paid)/received 10 668,746 Change in unrealised appreciation/depreciation on investments and derivatives
181,788,406 Dividend distributions 11 (2,177,503)
Net assets at the end of the year 2,068,432,928
17
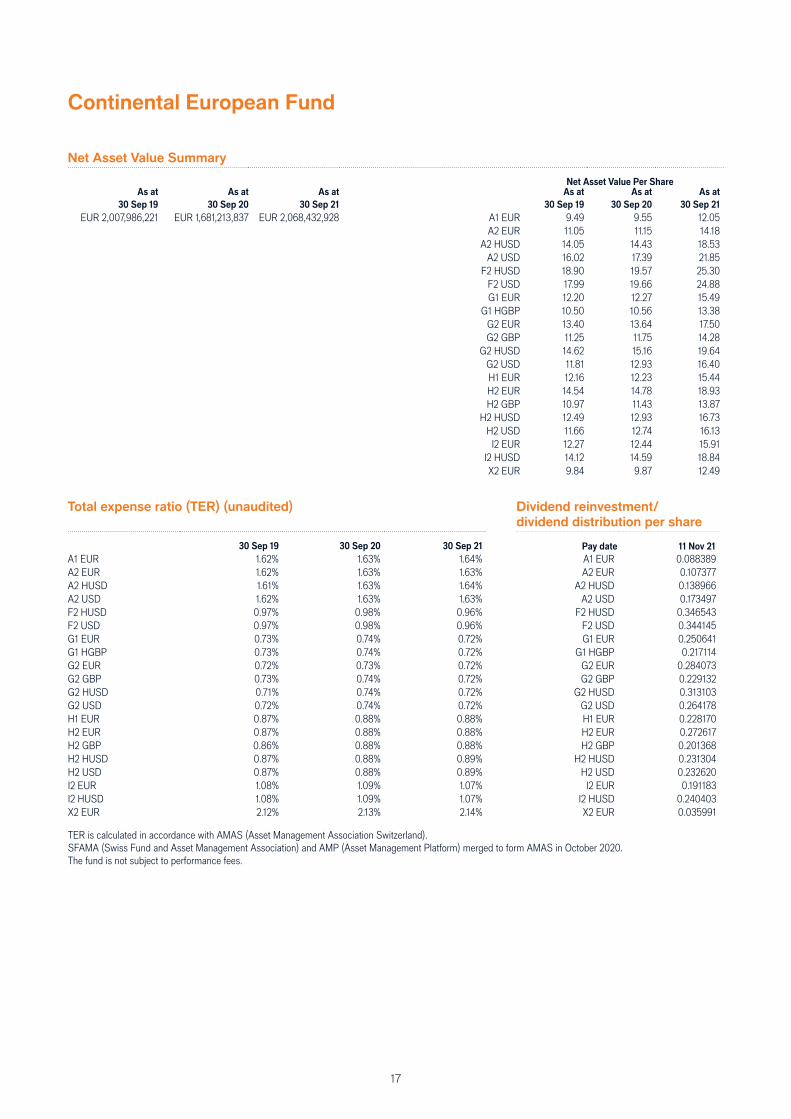
Net Asset Value Summary
Net Asset Value Per ShareAs at As at As at As at As at As at
30 Sep 19 30 Sep 20 30 Sep 21 30 Sep 19 30 Sep 20 30 Sep 21
EUR 2,007,986,221 EUR 1,681,213,837 EUR 2,068,432,928 A1 EUR 9.49 9.55 12.05A2 EUR 11.05 11.15 14.18
A2 HUSD 14.05 14.43 18.53A2 USD 16.02 17.39 21.85
F2 HUSD 18.90 19.57 25.30F2 USD 17.99 19.66 24.88G1 EUR 12.20 12.27 15.49
G1 HGBP 10.50 10.56 13.38G2 EUR 13.40 13.64 17.50G2 GBP 11.25 11.75 14.28
G2 HUSD 14.62 15.16 19.64G2 USD 11.81 12.93 16.40H1 EUR 12.16 12.23 15.44H2 EUR 14.54 14.78 18.93H2 GBP 10.97 11.43 13.87
H2 HUSD 12.49 12.93 16.73H2 USD 11.66 12.74 16.13
I2 EUR 12.27 12.44 15.91I2 HUSD 14.12 14.59 18.84X2 EUR 9.84 9.87 12.49
Total expense ratio (TER) (unaudited) Dividend reinvestment/
dividend distribution per share
30 Sep 19 30 Sep 20 30 Sep 21 Pay date 11 Nov 21
A1 EUR 1.62% 1.63% 1.64% A1 EUR 0.088389 A2 EUR 1.62% 1.63% 1.63% A2 EUR 0.107377 A2 HUSD 1.61% 1.63% 1.64% A2 HUSD 0.138966 A2 USD 1.62% 1.63% 1.63% A2 USD 0.173497 F2 HUSD 0.97% 0.98% 0.96% F2 HUSD 0.346543 F2 USD 0.97% 0.98% 0.96% F2 USD 0.344145 G1 EUR 0.73% 0.74% 0.72% G1 EUR 0.250641 G1 HGBP 0.73% 0.74% 0.72% G1 HGBP 0.217114 G2 EUR 0.72% 0.73% 0.72% G2 EUR 0.284073 G2 GBP 0.73% 0.74% 0.72% G2 GBP 0.229132 G2 HUSD 0.71% 0.74% 0.72% G2 HUSD 0.313103 G2 USD 0.72% 0.74% 0.72% G2 USD 0.264178 H1 EUR 0.87% 0.88% 0.88% H1 EUR 0.228170 H2 EUR 0.87% 0.88% 0.88% H2 EUR 0.272617 H2 GBP 0.86% 0.88% 0.88% H2 GBP 0.201368 H2 HUSD 0.87% 0.88% 0.89% H2 HUSD 0.231304 H2 USD 0.87% 0.88% 0.89% H2 USD 0.232620 I2 EUR 1.08% 1.09% 1.07% I2 EUR 0.191183 I2 HUSD 1.08% 1.09% 1.07% I2 HUSD 0.240403 X2 EUR 2.12% 2.13% 2.14% X2 EUR 0.035991
TER is calculated in accordance with AMAS (Asset Management Association Switzerland).SFAMA (Swiss Fund and Asset Management Association) and AMP (Asset Management Platform) merged to form AMAS in October 2020.The fund is not subject to performance fees.
Continental European Fund
18
Continental European Fund
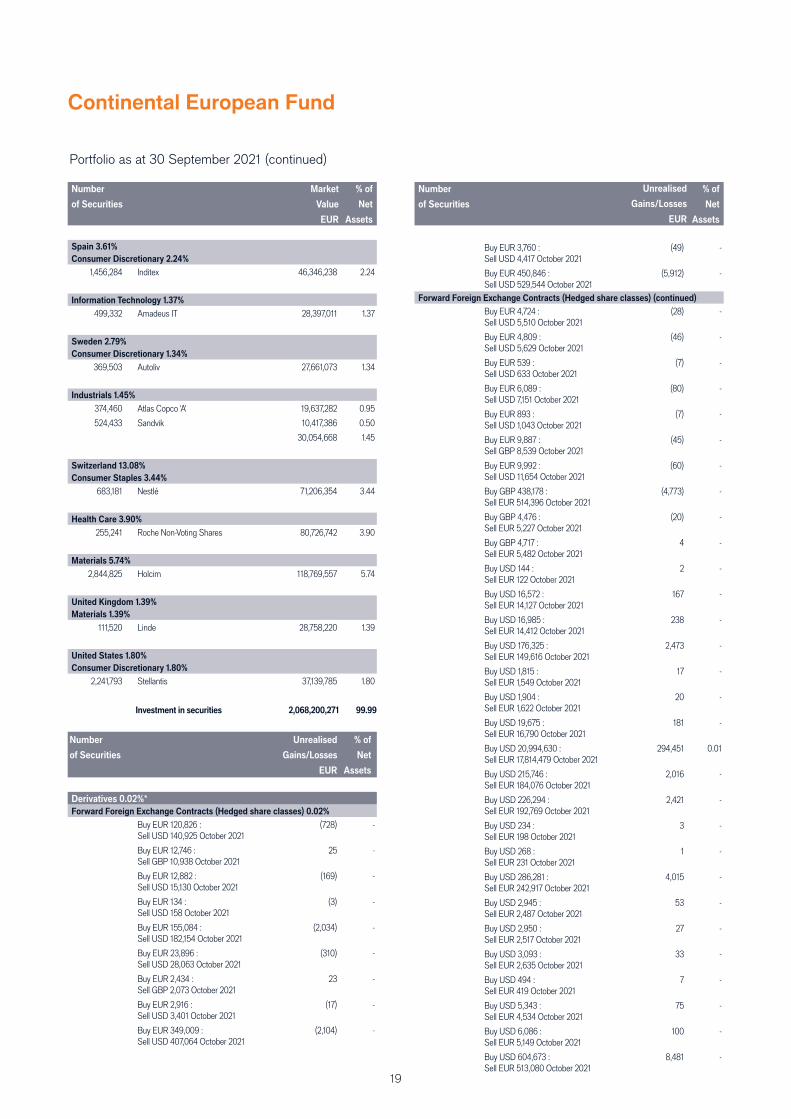
Portfolio as at 30 September 2021 (continued)
Number
of Securities
Market
Value
EUR
% of
Net
Assets
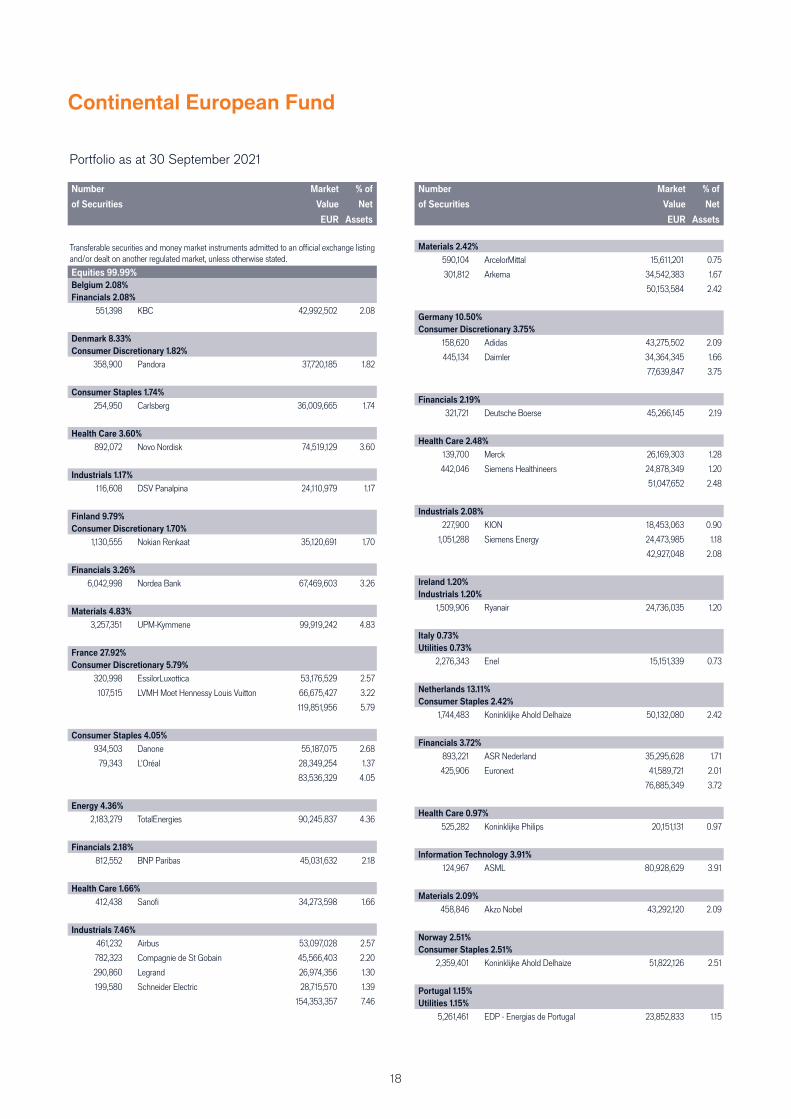
Transferable securities and money market instruments admitted to an offi cial exchange listing and/or dealt on another regulated market, unless otherwise stated.
Equities 99.99%
Belgium 2.08%
Financials 2.08%
551,398 KBC 42,992,502 2.08
Denmark 8.33%
Consumer Discretionary 1.82%
358,900 Pandora 37,720,185 1.82
Consumer Staples 1.74%
254,950 Carlsberg 36,009,665 1.74
Health Care 3.60%
892,072 Novo Nordisk 74,519,129 3.60
Industrials 1.17%
116,608 DSV Panalpina 24,110,979 1.17
Finland 9.79%
Consumer Discretionary 1.70%
1,130,555 Nokian Renkaat 35,120,691 1.70
Financials 3.26%
6,042,998 Nordea Bank 67,469,603 3.26
Materials 4.83%
3,257,351 UPM-Kymmene 99,919,242 4.83
France 27.92%
Consumer Discretionary 5.79%
320,998 EssilorLuxottica 53,176,529 2.57
107,515 LVMH Moet Hennessy Louis Vuitton 66,675,427 3.22
119,851,956 5.79
Consumer Staples 4.05%
934,503 Danone 55,187,075 2.68
79,343 L'Oréal 28,349,254 1.37
83,536,329 4.05
Energy 4.36%
2,183,279 TotalEnergies 90,245,837 4.36
Financials 2.18%
812,552 BNP Paribas 45,031,632 2.18
Health Care 1.66%
412,438 Sanofi 34,273,598 1.66
Industrials 7.46%
461,232 Airbus 53,097,028 2.57
782,323 Compagnie de St Gobain 45,566,403 2.20
290,860 Legrand 26,974,356 1.30
199,580 Schneider Electric 28,715,570 1.39
154,353,357 7.46
Portfolio as at 30 September 2021 (continued)
Number
of Securities
Market
Value
EUR
% of
Net
Assets
Materials 2.42%
590,104 ArcelorMittal 15,611,201 0.75
301,812 Arkema 34,542,383 1.67
50,153,584 2.42
Germany 10.50%
Consumer Discretionary 3.75%
158,620 Adidas 43,275,502 2.09
445,134 Daimler 34,364,345 1.66
77,639,847 3.75
Financials 2.19%
321,721 Deutsche Boerse 45,266,145 2.19
Health Care 2.48%
139,700 Merck 26,169,303 1.28
442,046 Siemens Healthineers 24,878,349 1.20
51,047,652 2.48
Industrials 2.08%
227,900 KION 18,453,063 0.90
1,051,288 Siemens Energy 24,473,985 1.18
42,927,048 2.08
Ireland 1.20%
Industrials 1.20%
1,509,906 Ryanair 24,736,035 1.20
Italy 0.73%
Utilities 0.73%
2,276,343 Enel 15,151,339 0.73
Netherlands 13.11%
Consumer Staples 2.42%
1,744,483 Koninklijke Ahold Delhaize 50,132,080 2.42
Financials 3.72%
893,221 ASR Nederland 35,295,628 1.71
425,906 Euronext 41,589,721 2.01
76,885,349 3.72
Health Care 0.97%
525,282 Koninklijke Philips 20,151,131 0.97
Information Technology 3.91%
124,967 ASML 80,928,629 3.91
Materials 2.09%
458,846 Akzo Nobel 43,292,120 2.09
Norway 2.51%
Consumer Staples 2.51%
2,359,401 Koninklijke Ahold Delhaize 51,822,126 2.51
Portugal 1.15%
Utilities 1.15%
5,261,461 EDP - Energias de Portugal 23,852,833 1.15
19
Continental European Fund
Portfolio as at 30 September 2021 (continued)
Number
of Securities
Market
Value
EUR
% of
Net
Assets
Spain 3.61%
Consumer Discretionary 2.24%
1,456,284 Inditex 46,346,238 2.24
Information Technology 1.37%
499,332 Amadeus IT 28,397,011 1.37
Sweden 2.79%
Consumer Discretionary 1.34%
369,503 Autoliv 27,661,073 1.34
Industrials 1.45%
374,460 Atlas Copco 'A' 19,637,282 0.95
524,433 Sandvik 10,417,386 0.50
30,054,668 1.45
Switzerland 13.08%
Consumer Staples 3.44%
683,181 Nestlé 71,206,354 3.44
Health Care 3.90%
255,241 Roche Non-Voting Shares 80,726,742 3.90
Materials 5.74%
2,844,825 Holcim 118,769,557 5.74
United Kingdom 1.39%
Materials 1.39%
111,520 Linde 28,758,220 1.39
United States 1.80%
Consumer Discretionary 1.80%
2,241,793 Stellantis 37,139,785 1.80
Investment in securities 2,068,200,271 99.99
Number
of Securities
Unrealised
Gains/Losses
EUR
% of
Net
Assets
Derivatives 0.02%*
Forward Foreign Exchange Contracts (Hedged share classes) 0.02%
Buy EUR 120,826 : Sell USD 140,925 October 2021
(728) -
Buy EUR 12,746 : Sell GBP 10,938 October 2021
25 -
Buy EUR 12,882 : Sell USD 15,130 October 2021
(169) -
Buy EUR 134 : Sell USD 158 October 2021
(3) -
Buy EUR 155,084 : Sell USD 182,154 October 2021
(2,034) -
Buy EUR 23,896 : Sell USD 28,063 October 2021
(310) -
Buy EUR 2,434 : Sell GBP 2,073 October 2021
23 -
Buy EUR 2,916 : Sell USD 3,401 October 2021
(17) -
Buy EUR 349,009 : Sell USD 407,064 October 2021
(2,104) -
Portfolio as at 30 September 2021 (continued)
Number
of Securities
Market
Value
EUR
% of
Net
Assets
Buy EUR 3,760 : Sell USD 4,417 October 2021
(49) -
Buy EUR 450,846 : Sell USD 529,544 October 2021
(5,912) -
Forward Foreign Exchange Contracts (Hedged share classes) (continued)
Buy EUR 4,724 : Sell USD 5,510 October 2021
(28) -
Buy EUR 4,809 : Sell USD 5,629 October 2021
(46) -
Buy EUR 539 : Sell USD 633 October 2021
(7) -
Buy EUR 6,089 : Sell USD 7,151 October 2021
(80) -
Buy EUR 893 : Sell USD 1,043 October 2021
(7) -
Buy EUR 9,887 : Sell GBP 8,539 October 2021
(45) -
Buy EUR 9,992 : Sell USD 11,654 October 2021
(60) -
Buy GBP 438,178 : Sell EUR 514,396 October 2021
(4,773) -
Buy GBP 4,476 : Sell EUR 5,227 October 2021
(20) -
Buy GBP 4,717 : Sell EUR 5,482 October 2021
4 -
Buy USD 144 : Sell EUR 122 October 2021
2 -
Buy USD 16,572 : Sell EUR 14,127 October 2021
167 -
Buy USD 16,985 : Sell EUR 14,412 October 2021
238 -
Buy USD 176,325 : Sell EUR 149,616 October 2021
2,473 -
Buy USD 1,815 : Sell EUR 1,549 October 2021
17 -
Buy USD 1,904 : Sell EUR 1,622 October 2021
20 -
Buy USD 19,675 : Sell EUR 16,790 October 2021
181 -
Buy USD 20,994,630 : Sell EUR 17,814,479 October 2021
294,451 0.01
Buy USD 215,746 : Sell EUR 184,076 October 2021
2,016 -
Buy USD 226,294 : Sell EUR 192,769 October 2021
2,421 -
Buy USD 234 : Sell EUR 198 October 2021
3 -
Buy USD 268 : Sell EUR 231 October 2021
1 -
Buy USD 286,281 : Sell EUR 242,917 October 2021
4,015 -
Buy USD 2,945 : Sell EUR 2,487 October 2021
53 -
Buy USD 2,950 : Sell EUR 2,517 October 2021
27 -
Buy USD 3,093 : Sell EUR 2,635 October 2021
33 -
Buy USD 494 : Sell EUR 419 October 2021
7 -
Buy USD 5,343 : Sell EUR 4,534 October 2021
75 -
Buy USD 6,086 : Sell EUR 5,149 October 2021
100 -
Buy USD 604,673 : Sell EUR 513,080 October 2021
8,481 -
Unrealised
Gains/Losses
EUR
20
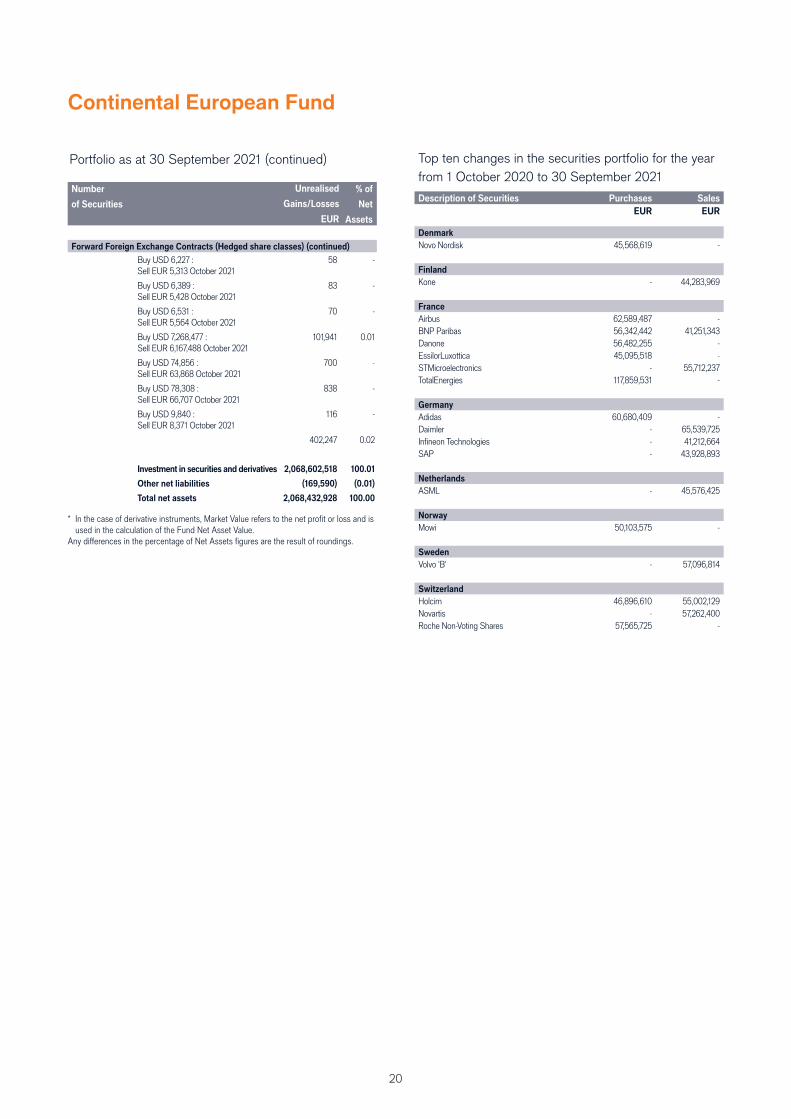
Continental European Fund
Top ten changes in the securities portfolio for the year
from 1 October 2020 to 30 September 2021
Description of Securities Purchases Sales
EUR EUR
Denmark
Novo Nordisk 45,568,619 -
Finland
Kone - 44,283,969
France
Airbus 62,589,487 - BNP Paribas 56,342,442 41,251,343 Danone 56,482,255 - EssilorLuxottica 45,095,518 - STMicroelectronics - 55,712,237 TotalEnergies 117,859,531 -
Germany
Adidas 60,680,409 - Daimler - 65,539,725 Infi neon Technologies - 41,212,664 SAP - 43,928,893
Netherlands
ASML - 45,576,425
Norway
Mowi 50,103,575 -
Sweden
Volvo 'B' - 57,096,814
Switzerland
Holcim 46,896,610 55,002,129 Novartis - 57,262,400 Roche Non-Voting Shares 57,565,725 -
Portfolio as at 30 September 2021 (continued)
Number
of Securities
Market
Value
EUR
% of
Net
Assets
Forward Foreign Exchange Contracts (Hedged share classes) (continued)
Buy USD 6,227 : Sell EUR 5,313 October 2021
58 -
Buy USD 6,389 : Sell EUR 5,428 October 2021
83 -
Buy USD 6,531 : Sell EUR 5,564 October 2021
70 -
Buy USD 7,268,477 : Sell EUR 6,167,488 October 2021
101,941 0.01
Buy USD 74,856 : Sell EUR 63,868 October 2021
700 -
Buy USD 78,308 : Sell EUR 66,707 October 2021
838 -
Buy USD 9,840 : Sell EUR 8,371 October 2021
116 -
402,247 0.02
Investment in securities and derivatives 2,068,602,518 100.01
Other net liabilities (169,590) (0.01)
Total net assets 2,068,432,928 100.00
* In the case of derivative instruments, Market Value refers to the net profi t or loss and is used in the calculation of the Fund Net Asset Value.
Any diff erences in the percentage of Net Assets fi gures are the result of roundings.
Unrealised
Gains/Losses
EUR
21
Emerging Markets Fund
Investment report for the year from 1 October 2020 to 30 September 2021
Investment Fund Manager
Daniel J. Graña
The fund returned 23.4% (Net), 24.7% (Gross) based on Class H2 in Euro terms over the year under review, compared with a return of
19.6% in the MSCI Emerging Markets Index and a return of 22.0% in the Target Index + 2%, Euro terms.
Emerging market stocks performed strongly over the reporting year. The roll-out of COVID-19 vaccines accelerated in a number of
countries, leading to stronger global economic growth, especially in the fi rst half of 2021. Emerging market stocks suff ered downward
volatility in the third quarter of 2021, as new COVID-19 variants, infl ation pressures, supply chain disruptions and regulatory uncertainty in
China raised concerns about the strength of the economic recovery. The outlook for less accommodative monetary policy also led to higher
interest rates, which triggered a rotation away from growth-oriented investments in the third quarter of 2021.
Stock selection was a notable contributor to the fund’s relative performance, as we continued to follow several global trends that we believe
are creating attractive long-term investment opportunities. These include the move towards decarbonisation, especially in China where
President Xi Jinping has laid out ambitious plans to reach carbon neutrality by 2060. This aggressive timeline will necessitate signifi cant
investment in renewables and electric vehicles, and we identifi ed a number of well-managed, well-positioned companies that we believed
would benefi t from Beijing’s plans. These included Yunnan Energy New Material, a producer of separators for lithium batteries that are a key
component in many green energy applications. Its businesses continued to grow rapidly on the back of accelerating electric vehicle demand
and market share gains. The construction of electric vehicles and solar panel arrays also requires large amounts of copper. This led us to
invest in Ivanhoe Mines, a well-managed company that is ramping up to become a major global copper producer. The stock was another
solid performer, supported by strong copper demand in the fi rst half of 2021, as well as progress in commissioning its key Kamoa-Kakula
mine.
While we continued to see positive trends for e-commerce in Latin America, Brazilian online retailer Lojas Americanas – previously known
as B2W Cia Digital before it merged with parent company Americanas earlier in 2021 – was a notable detractor. We invested in B2W Cia
Digital because of its eff orts to improve its capital structure and enhance its service off erings. Its commitment to this strategy has recently
appeared less certain, however, especially following its acquisition of an offl ine retailer. We were also less comfortable with its competitive
positioning, especially given our broader concerns about the macroeconomic outlook for Brazil. As a result, we sold the stock as we chose
to focus on other Brazilian online retailers.
Afya, another detractor, is a medical education company leveraging technology to benefi t from consolidation in Brazil’s medical education
sector. Afya is using its strategic acquisition strategy to improve the quality of medical education in Brazil while standardising the curriculum.
It is also looking to benefi t from its connections with students through an end-to-end digital e-commerce platform that physicians can use
after graduation. While Afya’s recent earnings performance exceeded market expectations, its guidance for the second half of 2021 was not
as strong as investors had hoped. Its digital business is a longer duration opportunity that was viewed less favorably by investors in a higher
interest rate environment. As a result, the stock declined. We saw this as a short-term setback, and we continued to own the stock.
Our investment strategy remains guided by our multi-lens approach that considers company fundamentals and governance as well as the
macro and policy landscape. On the macro side, we have become more cautious about the global economic outlook given uncertainties
about the pandemic and crosscurrents for commodity markets and global supply chains. These crosscurrents have led to slower growth
and higher infl ation – a challenging landscape for policy makers and companies to navigate. We will continue to monitor macro risks,
including policy decisions from the US Federal Reserve and other central banks that may have reverberations for emerging markets.
We have also become more cautious about the economic outlook for Brazil, in particular, given uncertainties about the pandemic and
crosscurrents for commodity markets and global supply chains.
We are also keeping a close eye on developments in China. We recognise the potential for slowing economic growth as the country faces
new COVID-19 outbreaks, higher raw material costs and supply shortages. In the short term, government eff orts to reduce emissions may
also depress electricity generation and broader economic growth. While we believe these pressures may lead to near-term market volatility,
we also believe that China’s policy makers have the necessary tools to balance their goals of decarbonisation, deleveraging and regulation
while maintaining a satisfactory pace of economic growth. We continue to take a long-term view that seeks to benefi t from long-term trends
such as digital innovation, improving living standards and credit availability, expanded access to healthcare, and investment to address
global challenges such as the climate crisis. As we look to benefi t from these opportunities, we remain committed to seeking a combination
of good companies, good governance and good countries. We believe this strategy may lead to favourable investment outcomes over the
longer term.
22
Emerging Markets Fund
Investment objective and policy
The fund aims to provide a return, from a combination of capital growth and income over the long term.
Performance target: To outperform the MSCI Emerging Markets Index by 2% per annum, before the deduction of charges, over any 5 year period.
The fund invests at least two-thirds of its assets in shares (equities) and equity-related securities of companies, of any size, in any industry, in emerging markets. Companies will have their registered offi ce in or do most of their business (directly or through subsidiaries) in emerging markets. ‘Emerging markets’ may be countries in the MSCI Emerging Markets Index, those included in the World Bank defi nition of developing (low and lower middle income) economies, or which are, in the Investment Manager’s opinion, developing.
The fund is actively managed with reference to the MSCI Emerging Markets Index, which is broadly representative of the companies in which it may invest, as this forms the basis of the fund’s performance target. The Investment Manager has discretion to choose investments for the fund with weightings diff erent to the index or not in the index, but at times the fund may hold investments similar to the index.
Strategy
The Investment Manager seeks consistent risk-adjusted returns (an expression of an investment’s return through how much risk is involved in producing that return) by looking to identify the most attractive opportunities within countries across various stages of economic and political development. This diverse landscape requires the Investment Manager to utilise an array of perspectives to fully evaluate these opportunities. By combining fundamental company research, market and economic analysis, a keen focus on governance and quantitative input, the portfolio attempts to capture price ineffi ciencies across the market-cap spectrum.
How sustainability risks are part of the investment process
The investments underlying this fi nancial product (referred to as the fund) do not take into account the EU criteria for environmentally sustainable economic activities, although the Management Company and the Investment Manager have agreed a decision making process that will apply to investment decisions relating to the fund as further detailed in the prospectus.
The likely impacts of sustainability risks on the returns of the fund
While the analysis of (Environmental, Social and Governance) ESG factors is an integral component across the Investment Manager’s investment capabilities and one of a number of inputs to the selection of investments and portfolio construction, the investment process of the Investment Manager is primarily designed to maximise long-term risk-adjusted returns for investors. Therefore, in managing the fund, the Investment Manager does not maximise portfolio alignment with sustainability risks as a separate goal in its own right nor does it precisely attribute the impact of ESG factors on returns for the fund.
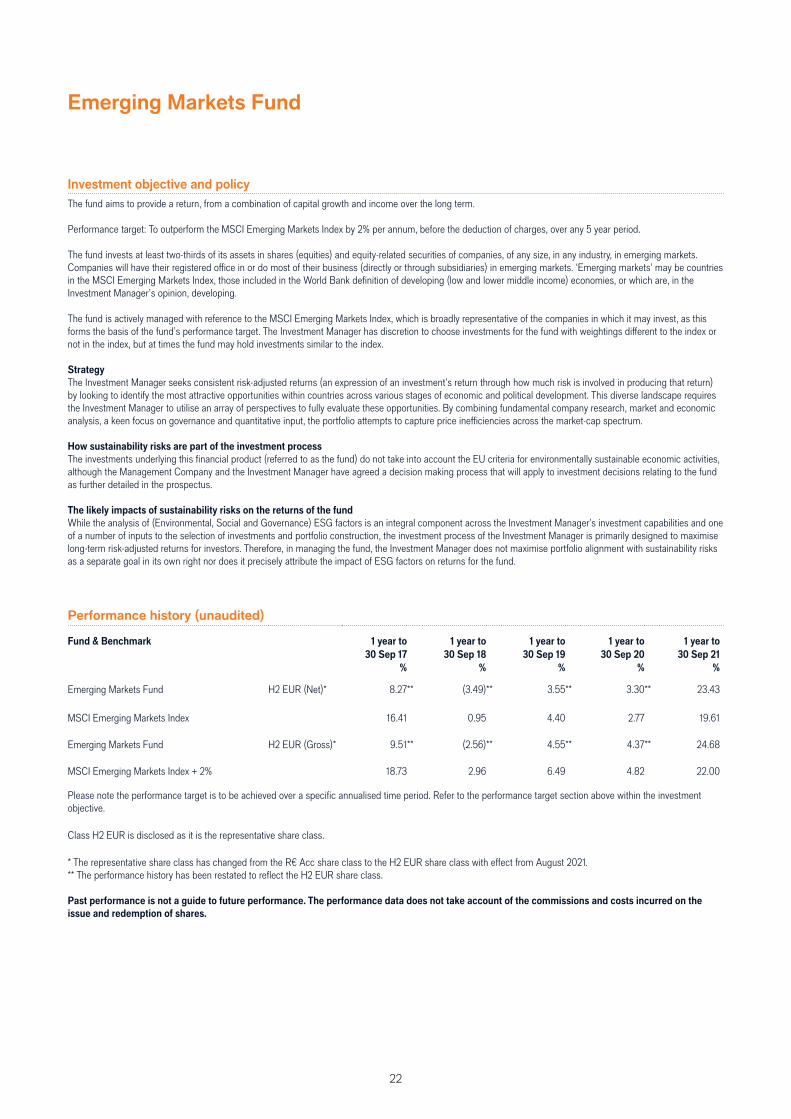
Performance history (unaudited)
Fund & Benchmark 1 year to 1 year to 1 year to 1 year to 1 year to
30 Sep 17 30 Sep 18 30 Sep 19 30 Sep 20 30 Sep 21
% % % % %
Emerging Markets Fund H2 EUR (Net)* 8.27** (3.49)** 3.55** 3.30** 23.43 MSCI Emerging Markets Index 16.41 0.95 4.40 2.77 19.61
Emerging Markets Fund H2 EUR (Gross)* 9.51** (2.56)** 4.55** 4.37** 24.68
MSCI Emerging Markets Index + 2% 18.73 2.96 6.49 4.82 22.00
Please note the performance target is to be achieved over a specifi c annualised time period. Refer to the performance target section above within the investment objective. Class H2 EUR is disclosed as it is the representative share class. * The representative share class has changed from the R€ Acc share class to the H2 EUR share class with eff ect from August 2021. ** The performance history has been restated to refl ect the H2 EUR share class.
Past performance is not a guide to future performance. The performance data does not take account of the commissions and costs incurred on the
issue and redemption of shares.
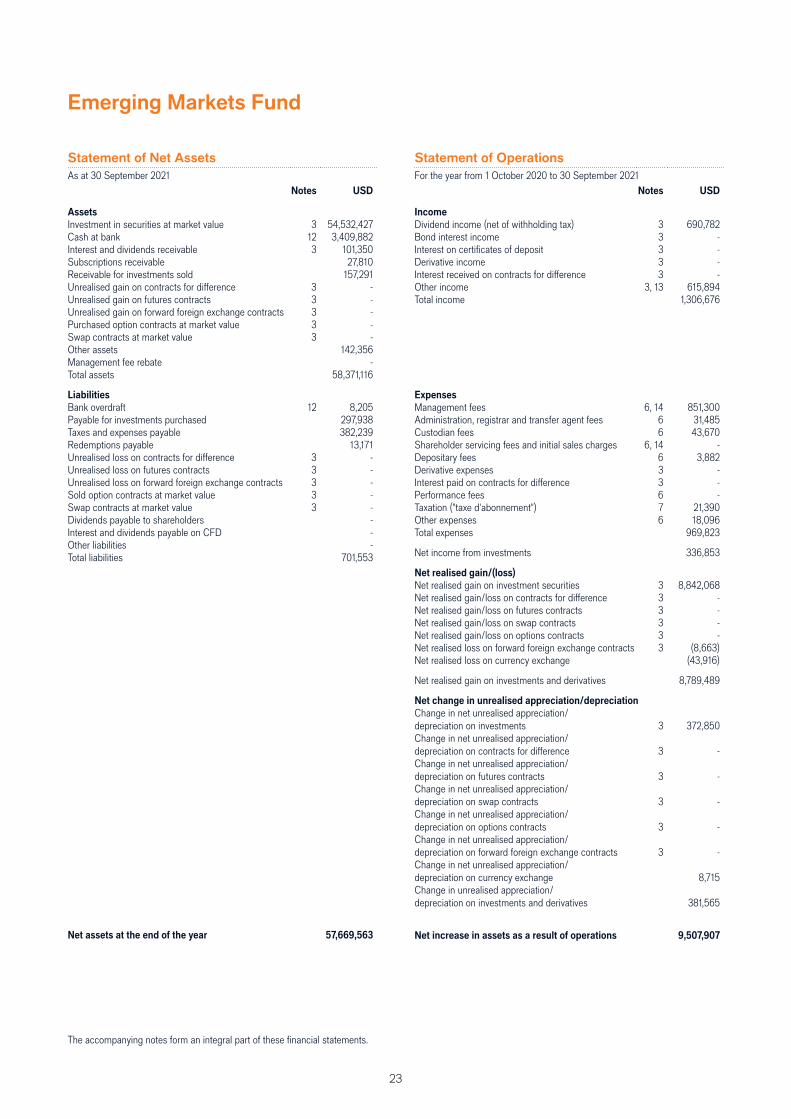
23
Emerging Markets Fund
Statement of Net Assets
As at 30 September 2021Notes USD
Assets
Investment in securities at market value 3 54,532,427 Cash at bank 12 3,409,882 Interest and dividends receivable 3 101,350 Subscriptions receivable 27,810 Receivable for investments sold 157,291 Unrealised gain on contracts for diff erence 3 -Unrealised gain on futures contracts 3 -Unrealised gain on forward foreign exchange contracts 3 -Purchased option contracts at market value 3 -Swap contracts at market value 3 -Other assets 142,356 Management fee rebate -Total assets 58,371,116
Liabilities
Bank overdraft 12 8,205 Payable for investments purchased 297,938 Taxes and expenses payable 382,239 Redemptions payable 13,171 Unrealised loss on contracts for diff erence 3 -Unrealised loss on futures contracts 3 -Unrealised loss on forward foreign exchange contracts 3 -Sold option contracts at market value 3 -Swap contracts at market value 3 -Dividends payable to shareholders -Interest and dividends payable on CFD -Other liabilities -Total liabilities 701,553
Net assets at the end of the year 57,669,563
Statement of Operations
For the year from 1 October 2020 to 30 September 2021Notes USD
Income
Dividend income (net of withholding tax) 3 690,782 Bond interest income 3 -Interest on certifi cates of deposit 3 -Derivative income 3 -Interest received on contracts for diff erence 3 -Other income 3, 13 615,894 Total income 1,306,676
Expenses
Management fees 6, 14 851,300 Administration, registrar and transfer agent fees 6 31,485 Custodian fees 6 43,670 Shareholder servicing fees and initial sales charges 6, 14 -Depositary fees 6 3,882 Derivative expenses 3 -Interest paid on contracts for diff erence 3 -Performance fees 6 -Taxation ("taxe d'abonnement") 7 21,390 Other expenses 6 18,096 Total expenses 969,823
Net income from investments 336,853
Net realised gain/(loss)
Net realised gain on investment securities 3 8,842,068 Net realised gain/loss on contracts for diff erence 3 -Net realised gain/loss on futures contracts 3 -Net realised gain/loss on swap contracts 3 -Net realised gain/loss on options contracts 3 -Net realised loss on forward foreign exchange contracts 3 (8,663) Net realised loss on currency exchange (43,916)
Net realised gain on investments and derivatives 8,789,489
Net change in unrealised appreciation/depreciation
Change in net unrealised appreciation/depreciation on investments 3 372,850 Change in net unrealised appreciation/depreciation on contracts for diff erence 3 -Change in net unrealised appreciation/depreciation on futures contracts 3 -Change in net unrealised appreciation/depreciation on swap contracts 3 -Change in net unrealised appreciation/depreciation on options contracts 3 -Change in net unrealised appreciation/depreciation on forward foreign exchange contracts 3 -Change in net unrealised appreciation/depreciation on currency exchange 8,715 Change in unrealised appreciation/depreciation on investments and derivatives 381,565
Net increase in assets as a result of operations 9,507,907
The accompanying notes form an integral part of these fi nancial statements.
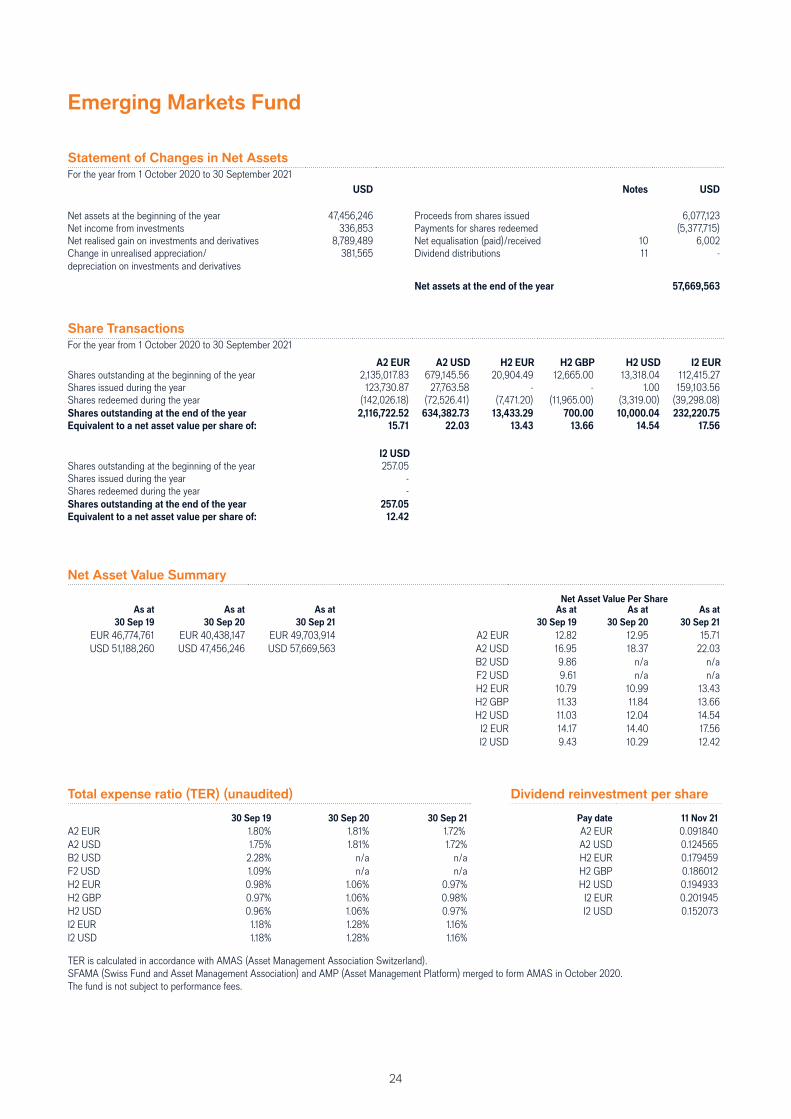
24
Emerging Markets Fund
Share Transactions
For the year from 1 October 2020 to 30 September 2021
A2 EUR A2 USD H2 EUR H2 GBP H2 USD I2 EUR
Shares outstanding at the beginning of the year 2,135,017.83 679,145.56 20,904.49 12,665.00 13,318.04 112,415.27Shares issued during the year 123,730.87 27,763.58 - - 1.00 159,103.56Shares redeemed during the year (142,026.18) (72,526.41) (7,471.20) (11,965.00) (3,319.00) (39,298.08)Shares outstanding at the end of the year 2,116,722.52 634,382.73 13,433.29 700.00 10,000.04 232,220.75
Equivalent to a net asset value per share of: 15.71 22.03 13.43 13.66 14.54 17.56
I2 USD
Shares outstanding at the beginning of the year 257.05Shares issued during the year -Shares redeemed during the year -Shares outstanding at the end of the year 257.05
Equivalent to a net asset value per share of: 12.42
Net Asset Value Summary
Net Asset Value Per ShareAs at As at As at As at As at As at
30 Sep 19 30 Sep 20 30 Sep 21 30 Sep 19 30 Sep 20 30 Sep 21
EUR 46,774,761 EUR 40,438,147 EUR 49,703,914 A2 EUR 12.82 12.95 15.71USD 51,188,260 USD 47,456,246 USD 57,669,563 A2 USD 16.95 18.37 22.03
B2 USD 9.86 n/a n/aF2 USD 9.61 n/a n/aH2 EUR 10.79 10.99 13.43H2 GBP 11.33 11.84 13.66H2 USD 11.03 12.04 14.54
I2 EUR 14.17 14.40 17.56I2 USD 9.43 10.29 12.42
Statement of Changes in Net Assets
For the year from 1 October 2020 to 30 September 2021USD Notes USD
Net assets at the beginning of the year 47,456,246 Proceeds from shares issued 6,077,123 Net income from investments 336,853 Payments for shares redeemed (5,377,715) Net realised gain on investments and derivatives 8,789,489 Net equalisation (paid)/received 10 6,002 Change in unrealised appreciation/depreciation on investments and derivatives
381,565 Dividend distributions 11 -
Net assets at the end of the year 57,669,563
Total expense ratio (TER) (unaudited) Dividend reinvestment per share
30 Sep 19 30 Sep 20 30 Sep 21 Pay date 11 Nov 21
A2 EUR 1.80% 1.81% 1.72% A2 EUR 0.091840A2 USD 1.75% 1.81% 1.72% A2 USD 0.124565B2 USD 2.28% n/a n/a H2 EUR 0.179459F2 USD 1.09% n/a n/a H2 GBP 0.186012H2 EUR 0.98% 1.06% 0.97% H2 USD 0.194933H2 GBP 0.97% 1.06% 0.98% I2 EUR 0.201945H2 USD 0.96% 1.06% 0.97% I2 USD 0.152073I2 EUR 1.18% 1.28% 1.16%I2 USD 1.18% 1.28% 1.16%
TER is calculated in accordance with AMAS (Asset Management Association Switzerland).SFAMA (Swiss Fund and Asset Management Association) and AMP (Asset Management Platform) merged to form AMAS in October 2020.The fund is not subject to performance fees.
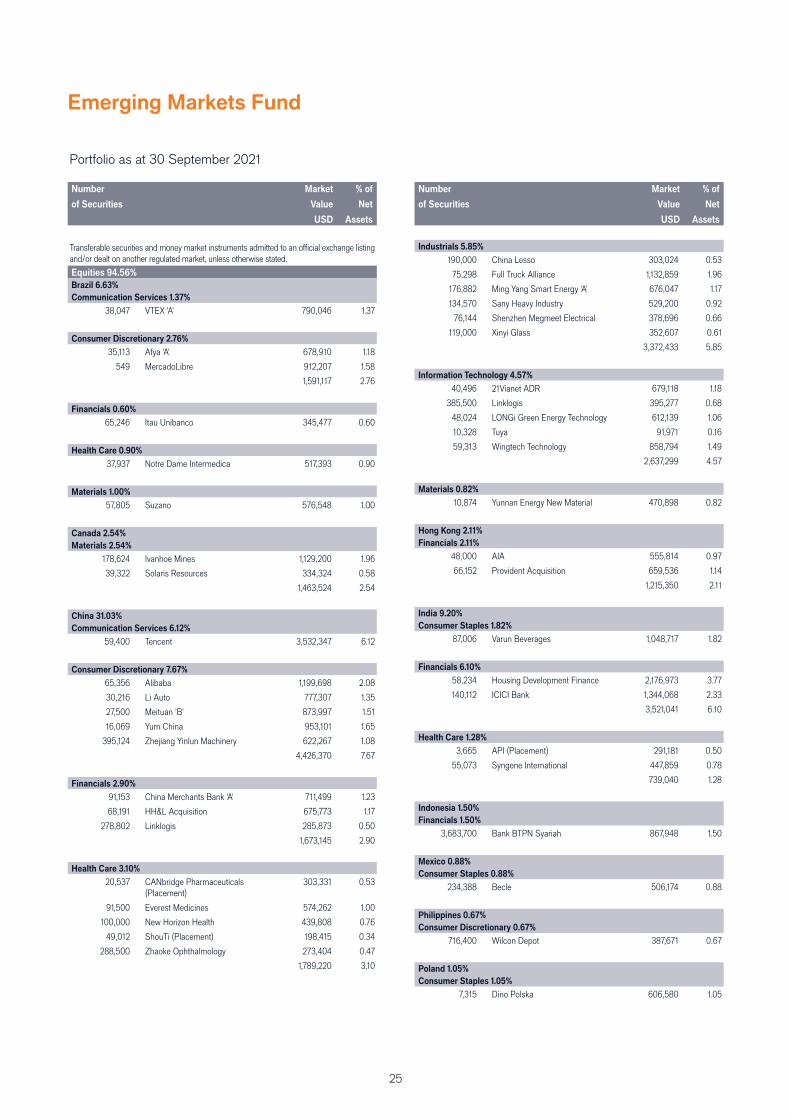
25
Emerging Markets Fund
Portfolio as at 30 September 2021 (continued)
Number
of Securities
Market
Value
USD
% of
Net
Assets
Transferable securities and money market instruments admitted to an offi cial exchange listing and/or dealt on another regulated market, unless otherwise stated.
Equities 94.56%
Brazil 6.63%
Communication Services 1.37%
38,047 VTEX 'A' 790,046 1.37
Consumer Discretionary 2.76%
35,113 Afya 'A' 678,910 1.18
549 MercadoLibre 912,207 1.58
1,591,117 2.76
Financials 0.60%
65,246 Itau Unibanco 345,477 0.60
Health Care 0.90%
37,937 Notre Dame Intermedica 517,393 0.90
Materials 1.00%
57,805 Suzano 576,548 1.00
Canada 2.54%
Materials 2.54%
178,624 Ivanhoe Mines 1,129,200 1.96
39,322 Solaris Resources 334,324 0.58
1,463,524 2.54
China 31.03%
Communication Services 6.12%
59,400 Tencent 3,532,347 6.12
Consumer Discretionary 7.67%
65,356 Alibaba 1,199,698 2.08
30,216 Li Auto 777,307 1.35
27,500 Meituan 'B' 873,997 1.51
16,069 Yum China 953,101 1.65
395,124 Zhejiang Yinlun Machinery 622,267 1.08
4,426,370 7.67
Financials 2.90%
91,153 China Merchants Bank 'A' 711,499 1.23
68,191 HH&L Acquisition 675,773 1.17
278,802 Linklogis 285,873 0.50
1,673,145 2.90
Health Care 3.10%
20,537 CANbridge Pharmaceuticals (Placement)
303,331 0.53
91,500 Everest Medicines 574,262 1.00
100,000 New Horizon Health 439,808 0.76
49,012 ShouTi (Placement) 198,415 0.34
288,500 Zhaoke Ophthalmology 273,404 0.47
1,789,220 3.10
Portfolio as at 30 September 2021 (continued)
Number
of Securities
Market
Value
USD
% of
Net
Assets
Industrials 5.85%
190,000 China Lesso 303,024 0.53
75,298 Full Truck Alliance 1,132,859 1.96
176,882 Ming Yang Smart Energy 'A' 676,047 1.17
134,570 Sany Heavy Industry 529,200 0.92
76,144 Shenzhen Megmeet Electrical 378,696 0.66
119,000 Xinyi Glass 352,607 0.61
3,372,433 5.85
Information Technology 4.57%
40,496 21Vianet ADR 679,118 1.18
385,500 Linklogis 395,277 0.68
48,024 LONGi Green Energy Technology 612,139 1.06
10,328 Tuya 91,971 0.16
59,313 Wingtech Technology 858,794 1.49
2,637,299 4.57
Materials 0.82%
10,874 Yunnan Energy New Material 470,898 0.82
Hong Kong 2.11%
Financials 2.11%
48,000 AIA 555,814 0.97
66,152 Provident Acquisition 659,536 1.14
1,215,350 2.11
India 9.20%
Consumer Staples 1.82%
87,006 Varun Beverages 1,048,717 1.82
Financials 6.10%
58,234 Housing Development Finance 2,176,973 3.77
140,112 ICICI Bank 1,344,068 2.33
3,521,041 6.10
Health Care 1.28%
3,665 API (Placement) 291,181 0.50
55,073 Syngene International 447,859 0.78
739,040 1.28
Indonesia 1.50%
Financials 1.50%
3,683,700 Bank BTPN Syariah 867,948 1.50
Mexico 0.88%
Consumer Staples 0.88%
234,388 Becle 506,174 0.88
Philippines 0.67%
Consumer Discretionary 0.67%
716,400 Wilcon Depot 387,671 0.67
Poland 1.05%
Consumer Staples 1.05%
7,315 Dino Polska 606,580 1.05
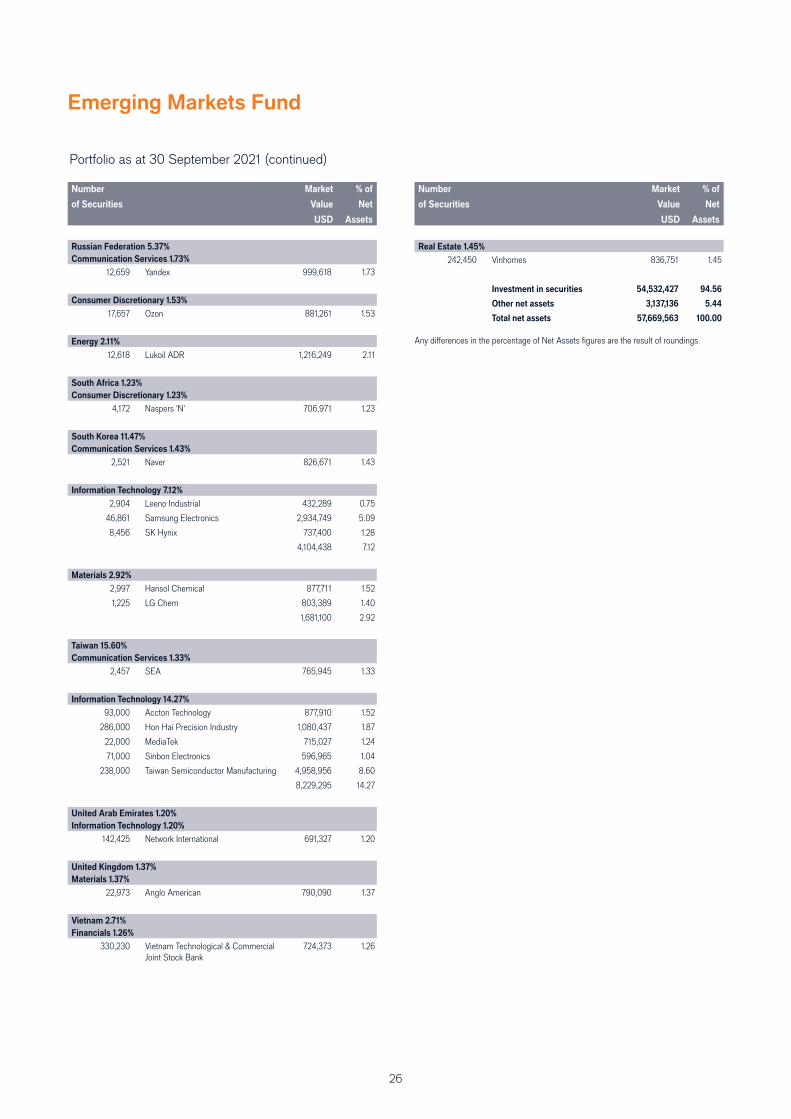
26
Emerging Markets Fund
Portfolio as at 30 September 2021 (continued)
Number
of Securities
Market
Value
USD
% of
Net
Assets
Russian Federation 5.37%
Communication Services 1.73%
12,659 Yandex 999,618 1.73
Consumer Discretionary 1.53%
17,657 Ozon 881,261 1.53
Energy 2.11%
12,618 Lukoil ADR 1,216,249 2.11
South Africa 1.23%
Consumer Discretionary 1.23%
4,172 Naspers 'N' 706,971 1.23
South Korea 11.47%
Communication Services 1.43%
2,521 Naver 826,671 1.43
Information Technology 7.12%
2,904 Leeno Industrial 432,289 0.75
46,861 Samsung Electronics 2,934,749 5.09
8,456 SK Hynix 737,400 1.28
4,104,438 7.12
Materials 2.92%
2,997 Hansol Chemical 877,711 1.52
1,225 LG Chem 803,389 1.40
1,681,100 2.92
Taiwan 15.60%
Communication Services 1.33%
2,457 SEA 765,945 1.33
Information Technology 14.27%
93,000 Accton Technology 877,910 1.52
286,000 Hon Hai Precision Industry 1,080,437 1.87
22,000 MediaTek 715,027 1.24
71,000 Sinbon Electronics 596,965 1.04
238,000 Taiwan Semiconductor Manufacturing 4,958,956 8.60
8,229,295 14.27
United Arab Emirates 1.20%
Information Technology 1.20%
142,425 Network International 691,327 1.20
United Kingdom 1.37%
Materials 1.37%
22,973 Anglo American 790,090 1.37
Vietnam 2.71%
Financials 1.26%
330,230 Vietnam Technological & Commercial Joint Stock Bank
724,373 1.26
Portfolio as at 30 September 2021 (continued)
Number
of Securities
Market
Value
USD
% of
Net
Assets
Real Estate 1.45%
242,450 Vinhomes 836,751 1.45
Investment in securities 54,532,427 94.56
Other net assets 3,137,136 5.44
Total net assets 57,669,563 100.00
Any diff erences in the percentage of Net Assets fi gures are the result of roundings.
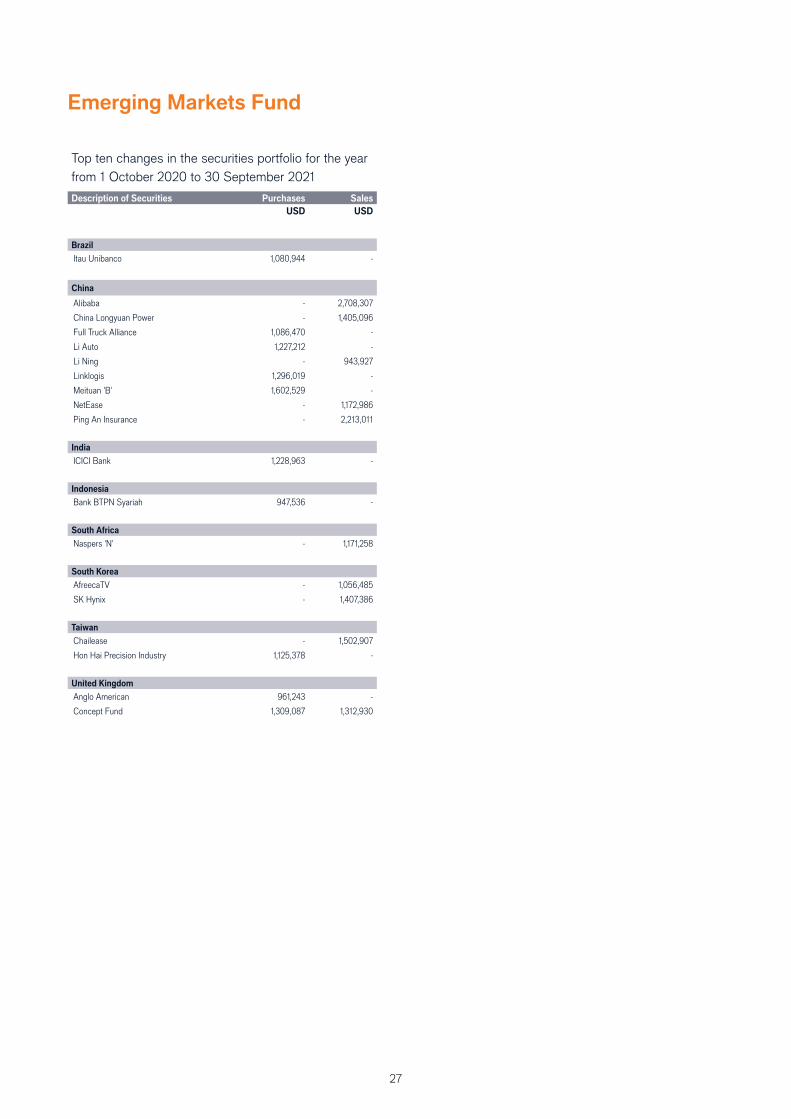
27
Emerging Markets Fund
Top ten changes in the securities portfolio for the year
from 1 October 2020 to 30 September 2021
Description of Securities Purchases Sales
USD USD
Brazil
Itau Unibanco 1,080,944 -
China
Alibaba - 2,708,307
China Longyuan Power - 1,405,096
Full Truck Alliance 1,086,470 -
Li Auto 1,227,212 -
Li Ning - 943,927
Linklogis 1,296,019 -
Meituan 'B' 1,602,529 -
NetEase - 1,172,986
Ping An Insurance - 2,213,011
India
ICICI Bank 1,228,963 -
Indonesia
Bank BTPN Syariah 947,536 -
South Africa
Naspers 'N' - 1,171,258
South Korea
AfreecaTV - 1,056,485
SK Hynix - 1,407,386
Taiwan
Chailease - 1,502,907
Hon Hai Precision Industry 1,125,378 -
United Kingdom
Anglo American 961,243 -
Concept Fund 1,309,087 1,312,930
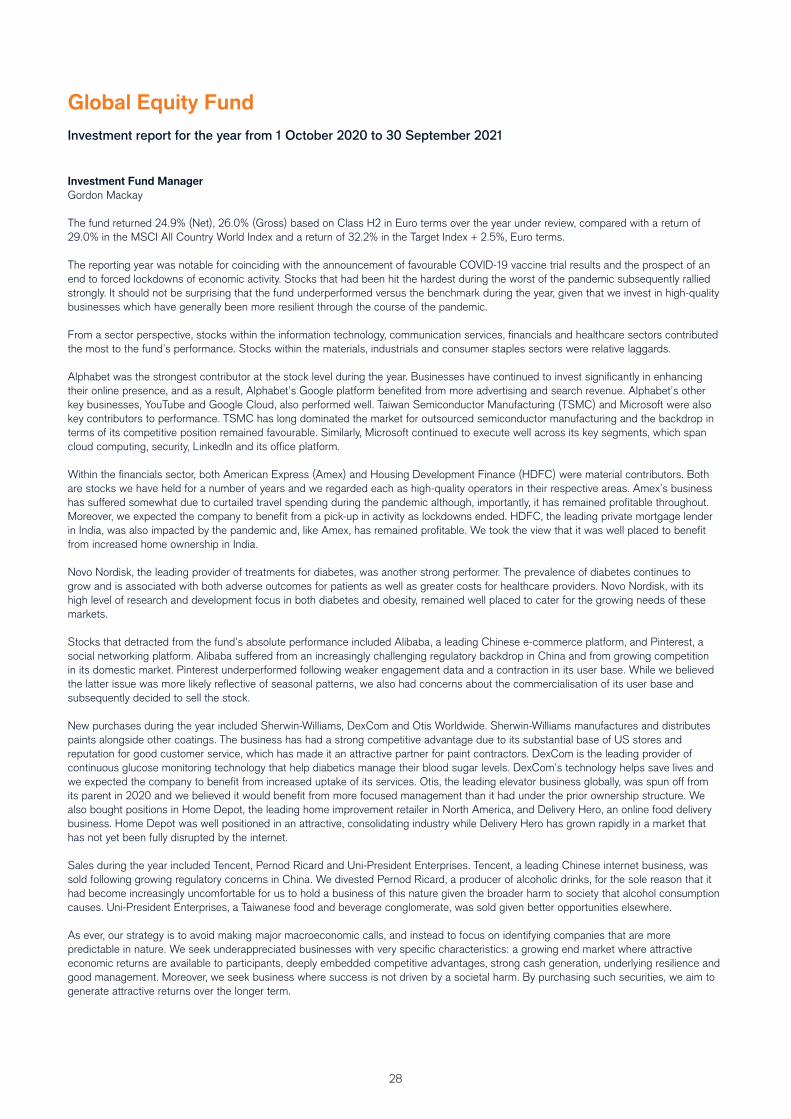
28
Global Equity Fund
Investment report for the year from 1 October 2020 to 30 September 2021
Investment Fund Manager
Gordon Mackay
The fund returned 24.9% (Net), 26.0% (Gross) based on Class H2 in Euro terms over the year under review, compared with a return of
29.0% in the MSCI All Country World Index and a return of 32.2% in the Target Index + 2.5%, Euro terms.
The reporting year was notable for coinciding with the announcement of favourable COVID-19 vaccine trial results and the prospect of an
end to forced lockdowns of economic activity. Stocks that had been hit the hardest during the worst of the pandemic subsequently rallied
strongly. It should not be surprising that the fund underperformed versus the benchmark during the year, given that we invest in high-quality
businesses which have generally been more resilient through the course of the pandemic.
From a sector perspective, stocks within the information technology, communication services, fi nancials and healthcare sectors contributed
the most to the fund’s performance. Stocks within the materials, industrials and consumer staples sectors were relative laggards.
Alphabet was the strongest contributor at the stock level during the year. Businesses have continued to invest signifi cantly in enhancing
their online presence, and as a result, Alphabet’s Google platform benefi ted from more advertising and search revenue. Alphabet’s other
key businesses, YouTube and Google Cloud, also performed well. Taiwan Semiconductor Manufacturing (TSMC) and Microsoft were also
key contributors to performance. TSMC has long dominated the market for outsourced semiconductor manufacturing and the backdrop in
terms of its competitive position remained favourable. Similarly, Microsoft continued to execute well across its key segments, which span
cloud computing, security, LinkedIn and its offi ce platform.
Within the fi nancials sector, both American Express (Amex) and Housing Development Finance (HDFC) were material contributors. Both
are stocks we have held for a number of years and we regarded each as high-quality operators in their respective areas. Amex’s business
has suff ered somewhat due to curtailed travel spending during the pandemic although, importantly, it has remained profi table throughout.
Moreover, we expected the company to benefi t from a pick-up in activity as lockdowns ended. HDFC, the leading private mortgage lender
in India, was also impacted by the pandemic and, like Amex, has remained profi table. We took the view that it was well placed to benefi t
from increased home ownership in India.
Novo Nordisk, the leading provider of treatments for diabetes, was another strong performer. The prevalence of diabetes continues to
grow and is associated with both adverse outcomes for patients as well as greater costs for healthcare providers. Novo Nordisk, with its
high level of research and development focus in both diabetes and obesity, remained well placed to cater for the growing needs of these
markets.
Stocks that detracted from the fund’s absolute performance included Alibaba, a leading Chinese e-commerce platform, and Pinterest, a
social networking platform. Alibaba suff ered from an increasingly challenging regulatory backdrop in China and from growing competition
in its domestic market. Pinterest underperformed following weaker engagement data and a contraction in its user base. While we believed
the latter issue was more likely refl ective of seasonal patterns, we also had concerns about the commercialisation of its user base and
subsequently decided to sell the stock.
New purchases during the year included Sherwin-Williams, DexCom and Otis Worldwide. Sherwin-Williams manufactures and distributes
paints alongside other coatings. The business has had a strong competitive advantage due to its substantial base of US stores and
reputation for good customer service, which has made it an attractive partner for paint contractors. DexCom is the leading provider of
continuous glucose monitoring technology that help diabetics manage their blood sugar levels. DexCom’s technology helps save lives and
we expected the company to benefi t from increased uptake of its services. Otis, the leading elevator business globally, was spun off from
its parent in 2020 and we believed it would benefi t from more focused management than it had under the prior ownership structure. We
also bought positions in Home Depot, the leading home improvement retailer in North America, and Delivery Hero, an online food delivery
business. Home Depot was well positioned in an attractive, consolidating industry while Delivery Hero has grown rapidly in a market that
has not yet been fully disrupted by the internet.
Sales during the year included Tencent, Pernod Ricard and Uni-President Enterprises. Tencent, a leading Chinese internet business, was
sold following growing regulatory concerns in China. We divested Pernod Ricard, a producer of alcoholic drinks, for the sole reason that it
had become increasingly uncomfortable for us to hold a business of this nature given the broader harm to society that alcohol consumption
causes. Uni-President Enterprises, a Taiwanese food and beverage conglomerate, was sold given better opportunities elsewhere.
As ever, our strategy is to avoid making major macroeconomic calls, and instead to focus on identifying companies that are more
predictable in nature. We seek underappreciated businesses with very specifi c characteristics: a growing end market where attractive
economic returns are available to participants, deeply embedded competitive advantages, strong cash generation, underlying resilience and
good management. Moreover, we seek business where success is not driven by a societal harm. By purchasing such securities, we aim to
generate attractive returns over the longer term.
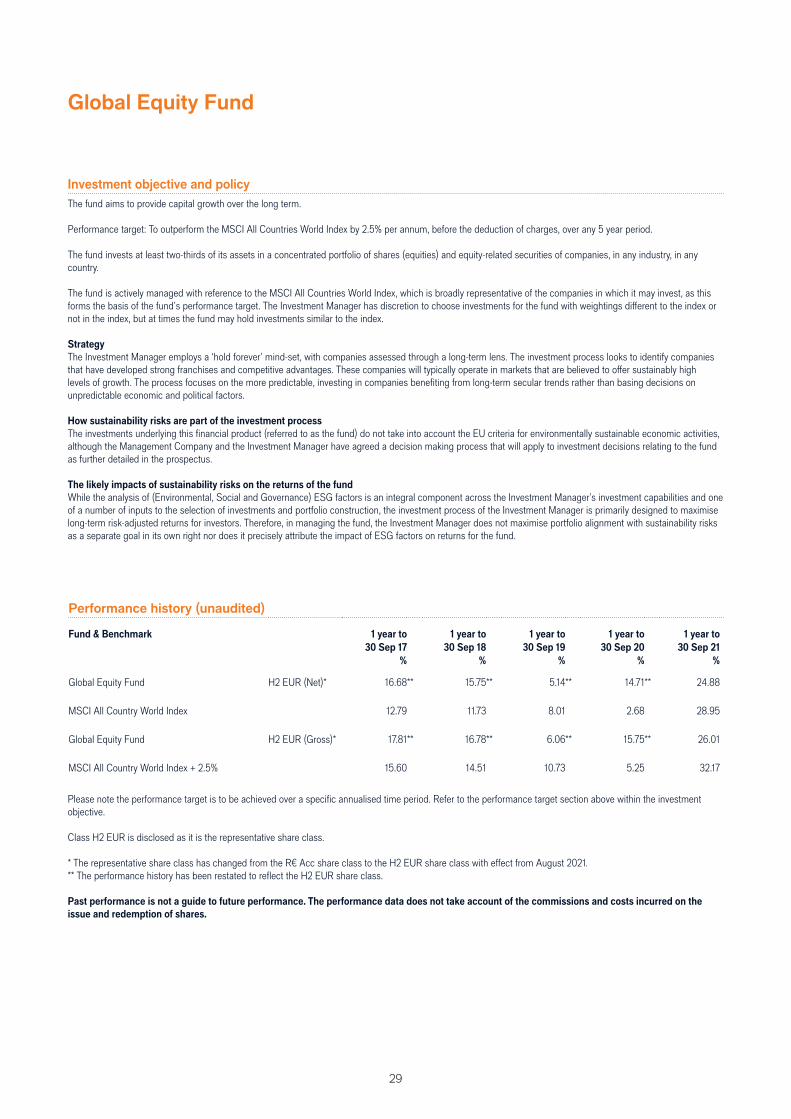
29
Global Equity Fund
Investment objective and policy
The fund aims to provide capital growth over the long term.
Performance target: To outperform the MSCI All Countries World Index by 2.5% per annum, before the deduction of charges, over any 5 year period.
The fund invests at least two-thirds of its assets in a concentrated portfolio of shares (equities) and equity-related securities of companies, in any industry, in any country.
The fund is actively managed with reference to the MSCI All Countries World Index, which is broadly representative of the companies in which it may invest, as this forms the basis of the fund’s performance target. The Investment Manager has discretion to choose investments for the fund with weightings diff erent to the index or not in the index, but at times the fund may hold investments similar to the index.
Strategy
The Investment Manager employs a ‘hold forever’ mind-set, with companies assessed through a long-term lens. The investment process looks to identify companies that have developed strong franchises and competitive advantages. These companies will typically operate in markets that are believed to off er sustainably high levels of growth. The process focuses on the more predictable, investing in companies benefi ting from long-term secular trends rather than basing decisions on unpredictable economic and political factors.
How sustainability risks are part of the investment process
The investments underlying this fi nancial product (referred to as the fund) do not take into account the EU criteria for environmentally sustainable economic activities, although the Management Company and the Investment Manager have agreed a decision making process that will apply to investment decisions relating to the fund as further detailed in the prospectus.
The likely impacts of sustainability risks on the returns of the fund
While the analysis of (Environmental, Social and Governance) ESG factors is an integral component across the Investment Manager’s investment capabilities and one of a number of inputs to the selection of investments and portfolio construction, the investment process of the Investment Manager is primarily designed to maximise long-term risk-adjusted returns for investors. Therefore, in managing the fund, the Investment Manager does not maximise portfolio alignment with sustainability risks as a separate goal in its own right nor does it precisely attribute the impact of ESG factors on returns for the fund.
Performance history (unaudited)
Fund & Benchmark 1 year to 1 year to 1 year to 1 year to 1 year to
30 Sep 17 30 Sep 18 30 Sep 19 30 Sep 20 30 Sep 21
% % % % %
Global Equity Fund H2 EUR (Net)* 16.68** 15.75** 5.14** 14.71** 24.88
MSCI All Country World Index 12.79 11.73 8.01 2.68 28.95
Global Equity Fund H2 EUR (Gross)* 17.81** 16.78** 6.06** 15.75** 26.01
MSCI All Country World Index + 2.5% 15.60 14.51 10.73 5.25 32.17
Please note the performance target is to be achieved over a specifi c annualised time period. Refer to the performance target section above within the investment objective.
Class H2 EUR is disclosed as it is the representative share class.
* The representative share class has changed from the R€ Acc share class to the H2 EUR share class with eff ect from August 2021.** The performance history has been restated to refl ect the H2 EUR share class. Past performance is not a guide to future performance. The performance data does not take account of the commissions and costs incurred on the
issue and redemption of shares.
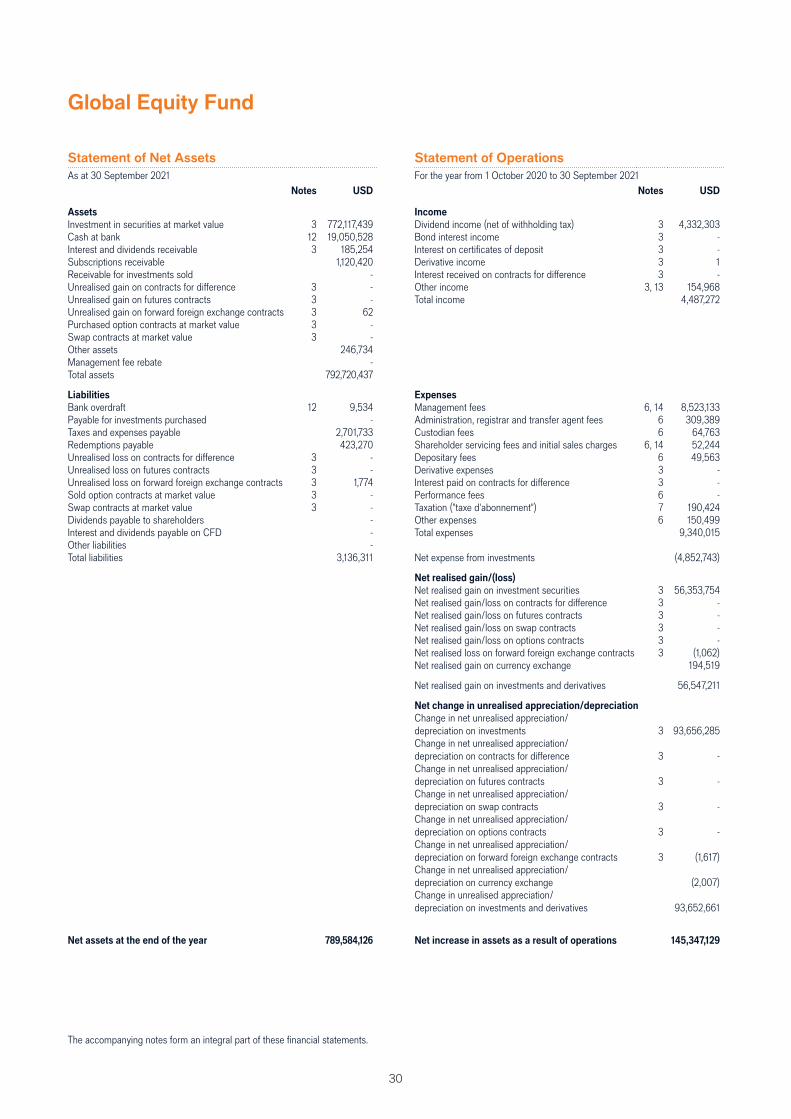
30
Global Equity Fund
Statement of Net Assets
As at 30 September 2021Notes USD
Assets
Investment in securities at market value 3 772,117,439 Cash at bank 12 19,050,528 Interest and dividends receivable 3 185,254 Subscriptions receivable 1,120,420 Receivable for investments sold -Unrealised gain on contracts for diff erence 3 -Unrealised gain on futures contracts 3 -Unrealised gain on forward foreign exchange contracts 3 62 Purchased option contracts at market value 3 -Swap contracts at market value 3 -Other assets 246,734 Management fee rebate -Total assets 792,720,437
Liabilities
Bank overdraft 12 9,534 Payable for investments purchased -Taxes and expenses payable 2,701,733 Redemptions payable 423,270 Unrealised loss on contracts for diff erence 3 -Unrealised loss on futures contracts 3 -Unrealised loss on forward foreign exchange contracts 3 1,774 Sold option contracts at market value 3 -Swap contracts at market value 3 -Dividends payable to shareholders -Interest and dividends payable on CFD -Other liabilities -Total liabilities 3,136,311
Net assets at the end of the year 789,584,126
Statement of Operations
For the year from 1 October 2020 to 30 September 2021Notes USD
Income
Dividend income (net of withholding tax) 3 4,332,303 Bond interest income 3 -Interest on certifi cates of deposit 3 -Derivative income 3 1 Interest received on contracts for diff erence 3 -Other income 3, 13 154,968 Total income 4,487,272
Expenses
Management fees 6, 14 8,523,133 Administration, registrar and transfer agent fees 6 309,389 Custodian fees 6 64,763 Shareholder servicing fees and initial sales charges 6, 14 52,244 Depositary fees 6 49,563 Derivative expenses 3 -Interest paid on contracts for diff erence 3 -Performance fees 6 -Taxation ("taxe d'abonnement") 7 190,424 Other expenses 6 150,499 Total expenses 9,340,015
Net expense from investments (4,852,743)
Net realised gain/(loss)
Net realised gain on investment securities 3 56,353,754 Net realised gain/loss on contracts for diff erence 3 -Net realised gain/loss on futures contracts 3 -Net realised gain/loss on swap contracts 3 -Net realised gain/loss on options contracts 3 -Net realised loss on forward foreign exchange contracts 3 (1,062) Net realised gain on currency exchange 194,519
Net realised gain on investments and derivatives 56,547,211
Net change in unrealised appreciation/depreciation
Change in net unrealised appreciation/depreciation on investments 3 93,656,285 Change in net unrealised appreciation/depreciation on contracts for diff erence 3 -Change in net unrealised appreciation/depreciation on futures contracts 3 -Change in net unrealised appreciation/depreciation on swap contracts 3 -Change in net unrealised appreciation/depreciation on options contracts 3 -Change in net unrealised appreciation/depreciation on forward foreign exchange contracts 3 (1,617) Change in net unrealised appreciation/depreciation on currency exchange (2,007) Change in unrealised appreciation/depreciation on investments and derivatives 93,652,661
Net increase in assets as a result of operations 145,347,129
The accompanying notes form an integral part of these fi nancial statements.
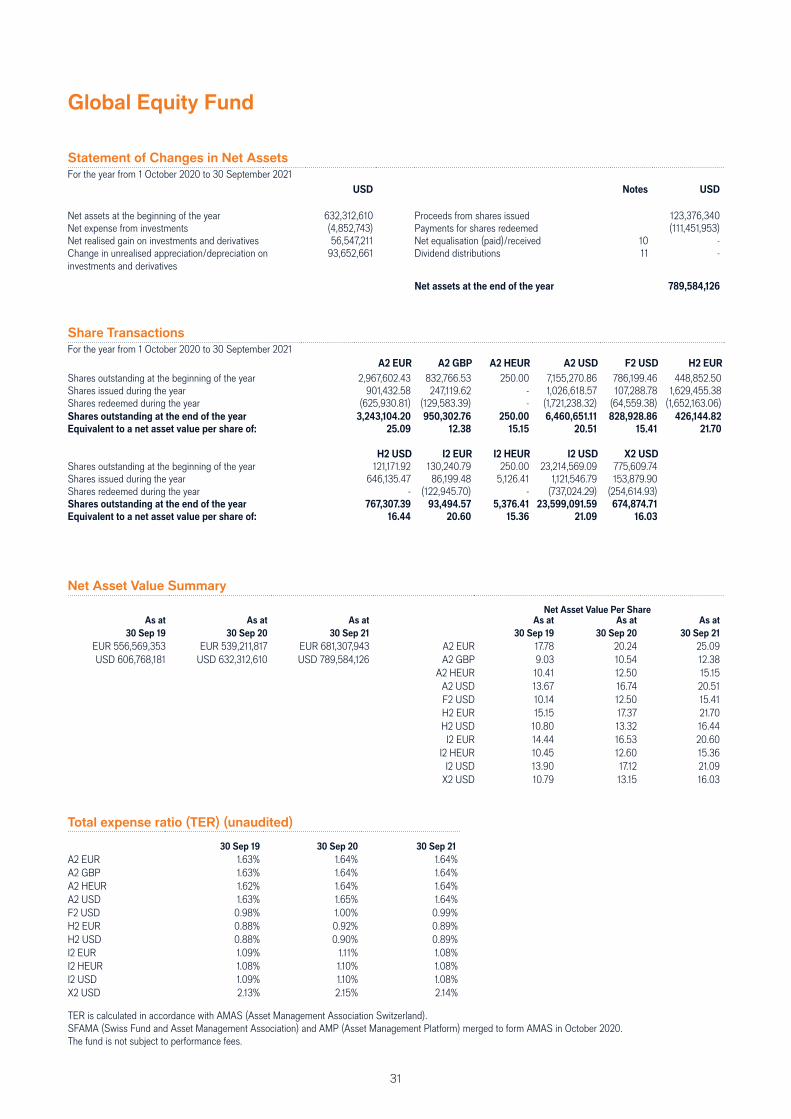
31
Global Equity Fund
Net Asset Value Summary
Net Asset Value Per ShareAs at As at As at As at As at As at
30 Sep 19 30 Sep 20 30 Sep 21 30 Sep 19 30 Sep 20 30 Sep 21
EUR 556,569,353 EUR 539,211,817 EUR 681,307,943 A2 EUR 17.78 20.24 25.09USD 606,768,181 USD 632,312,610 USD 789,584,126 A2 GBP 9.03 10.54 12.38
A2 HEUR 10.41 12.50 15.15A2 USD 13.67 16.74 20.51F2 USD 10.14 12.50 15.41H2 EUR 15.15 17.37 21.70H2 USD 10.80 13.32 16.44
I2 EUR 14.44 16.53 20.60I2 HEUR 10.45 12.60 15.36
I2 USD 13.90 17.12 21.09X2 USD 10.79 13.15 16.03
Statement of Changes in Net Assets
For the year from 1 October 2020 to 30 September 2021USD Notes USD
Net assets at the beginning of the year 632,312,610 Proceeds from shares issued 123,376,340 Net expense from investments (4,852,743) Payments for shares redeemed (111,451,953) Net realised gain on investments and derivatives 56,547,211 Net equalisation (paid)/received 10 -Change in unrealised appreciation/depreciation on investments and derivatives
93,652,661 Dividend distributions 11 -
Net assets at the end of the year 789,584,126
Share Transactions
For the year from 1 October 2020 to 30 September 2021A2 EUR A2 GBP A2 HEUR A2 USD F2 USD H2 EUR
Shares outstanding at the beginning of the year 2,967,602.43 832,766.53 250.00 7,155,270.86 786,199.46 448,852.50Shares issued during the year 901,432.58 247,119.62 - 1,026,618.57 107,288.78 1,629,455.38Shares redeemed during the year (625,930.81) (129,583.39) - (1,721,238.32) (64,559.38) (1,652,163.06)Shares outstanding at the end of the year 3,243,104.20 950,302.76 250.00 6,460,651.11 828,928.86 426,144.82
Equivalent to a net asset value per share of: 25.09 12.38 15.15 20.51 15.41 21.70
H2 USD I2 EUR I2 HEUR I2 USD X2 USD
Shares outstanding at the beginning of the year 121,171.92 130,240.79 250.00 23,214,569.09 775,609.74Shares issued during the year 646,135.47 86,199.48 5,126.41 1,121,546.79 153,879.90Shares redeemed during the year - (122,945.70) - (737,024.29) (254,614.93)Shares outstanding at the end of the year 767,307.39 93,494.57 5,376.41 23,599,091.59 674,874.71
Equivalent to a net asset value per share of: 16.44 20.60 15.36 21.09 16.03
Total expense ratio (TER) (unaudited)
30 Sep 19 30 Sep 20 30 Sep 21
A2 EUR 1.63% 1.64% 1.64%A2 GBP 1.63% 1.64% 1.64%A2 HEUR 1.62% 1.64% 1.64%A2 USD 1.63% 1.65% 1.64%F2 USD 0.98% 1.00% 0.99%H2 EUR 0.88% 0.92% 0.89%H2 USD 0.88% 0.90% 0.89%I2 EUR 1.09% 1.11% 1.08%I2 HEUR 1.08% 1.10% 1.08%I2 USD 1.09% 1.10% 1.08%X2 USD 2.13% 2.15% 2.14%
TER is calculated in accordance with AMAS (Asset Management Association Switzerland).SFAMA (Swiss Fund and Asset Management Association) and AMP (Asset Management Platform) merged to form AMAS in October 2020.The fund is not subject to performance fees.
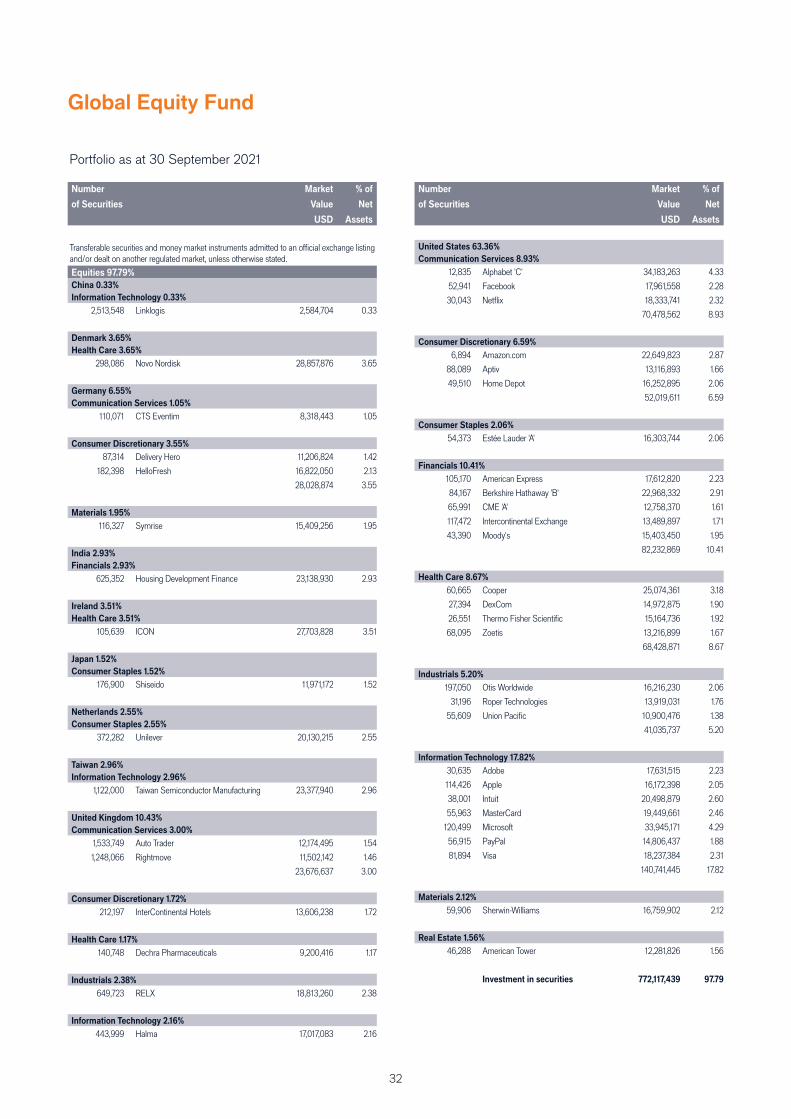
32
Global Equity Fund
Portfolio as at 30 September 2021 (continued)
Number
of Securities
Market
Value
USD
% of
Net
Assets
Transferable securities and money market instruments admitted to an offi cial exchange listing and/or dealt on another regulated market, unless otherwise stated.
Equities 97.79%
China 0.33%
Information Technology 0.33%
2,513,548 Linklogis 2,584,704 0.33
Denmark 3.65%
Health Care 3.65%
298,086 Novo Nordisk 28,857,876 3.65
Germany 6.55%
Communication Services 1.05%
110,071 CTS Eventim 8,318,443 1.05
Consumer Discretionary 3.55%
87,314 Delivery Hero 11,206,824 1.42
182,398 HelloFresh 16,822,050 2.13
28,028,874 3.55
Materials 1.95%
116,327 Symrise 15,409,256 1.95
India 2.93%
Financials 2.93%
625,352 Housing Development Finance 23,138,930 2.93
Ireland 3.51%
Health Care 3.51%
105,639 ICON 27,703,828 3.51
Japan 1.52%
Consumer Staples 1.52%
176,900 Shiseido 11,971,172 1.52
Netherlands 2.55%
Consumer Staples 2.55%
372,282 Unilever 20,130,215 2.55
Taiwan 2.96%
Information Technology 2.96%
1,122,000 Taiwan Semiconductor Manufacturing 23,377,940 2.96
United Kingdom 10.43%
Communication Services 3.00%
1,533,749 Auto Trader 12,174,495 1.54
1,248,066 Rightmove 11,502,142 1.46
23,676,637 3.00
Consumer Discretionary 1.72%
212,197 InterContinental Hotels 13,606,238 1.72
Health Care 1.17%
140,748 Dechra Pharmaceuticals 9,200,416 1.17
Industrials 2.38%
649,723 RELX 18,813,260 2.38
Information Technology 2.16%
443,999 Halma 17,017,083 2.16
Portfolio as at 30 September 2021 (continued)
Number
of Securities
Market
Value
USD
% of
Net
Assets
United States 63.36%
Communication Services 8.93%
12,835 Alphabet 'C' 34,183,263 4.33
52,941 Facebook 17,961,558 2.28
30,043 Netfl ix 18,333,741 2.32
70,478,562 8.93
Consumer Discretionary 6.59%
6,894 Amazon.com 22,649,823 2.87
88,089 Aptiv 13,116,893 1.66
49,510 Home Depot 16,252,895 2.06
52,019,611 6.59
Consumer Staples 2.06%
54,373 Estée Lauder 'A' 16,303,744 2.06
Financials 10.41%
105,170 American Express 17,612,820 2.23
84,167 Berkshire Hathaway 'B' 22,968,332 2.91
65,991 CME 'A' 12,758,370 1.61
117,472 Intercontinental Exchange 13,489,897 1.71
43,390 Moody's 15,403,450 1.95
82,232,869 10.41
Health Care 8.67%
60,665 Cooper 25,074,361 3.18
27,394 DexCom 14,972,875 1.90
26,551 Thermo Fisher Scientifi c 15,164,736 1.92
68,095 Zoetis 13,216,899 1.67
68,428,871 8.67
Industrials 5.20%
197,050 Otis Worldwide 16,216,230 2.06
31,196 Roper Technologies 13,919,031 1.76
55,609 Union Pacifi c 10,900,476 1.38
41,035,737 5.20
Information Technology 17.82%
30,635 Adobe 17,631,515 2.23
114,426 Apple 16,172,398 2.05
38,001 Intuit 20,498,879 2.60
55,963 MasterCard 19,449,661 2.46
120,499 Microsoft 33,945,171 4.29
56,915 PayPal 14,806,437 1.88
81,894 Visa 18,237,384 2.31
140,741,445 17.82
Materials 2.12%
59,906 Sherwin-Williams 16,759,902 2.12
Real Estate 1.56%
46,288 American Tower 12,281,826 1.56
Investment in securities 772,117,439 97.79
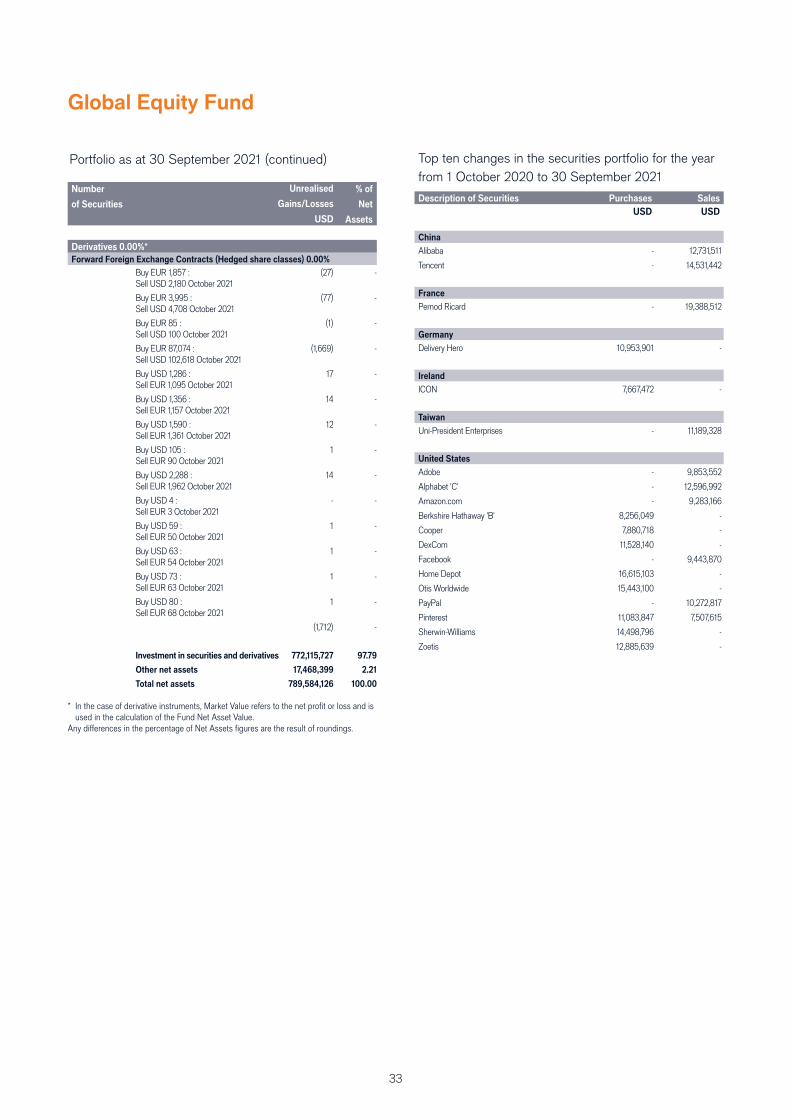
33
Top ten changes in the securities portfolio for the year
from 1 October 2020 to 30 September 2021
Description of Securities Purchases Sales
USD USD
China
Alibaba - 12,731,511
Tencent - 14,531,442
France
Pernod Ricard - 19,388,512
Germany
Delivery Hero 10,953,901 -
Ireland
ICON 7,667,472 -
Taiwan
Uni-President Enterprises - 11,189,328
United States
Adobe - 9,853,552
Alphabet 'C' - 12,596,992
Amazon.com - 9,283,166
Berkshire Hathaway 'B' 8,256,049 -
Cooper 7,880,718 -
DexCom 11,528,140 -
Facebook - 9,443,870
Home Depot 16,615,103 -
Otis Worldwide 15,443,100 -
PayPal - 10,272,817
Pinterest 11,083,847 7,507,615
Sherwin-Williams 14,498,796 -
Zoetis 12,885,639 -
Global Equity Fund
Portfolio as at 30 September 2021 (continued)
Number
of Securities
Market
Value
USD
% of
Net
Assets
Derivatives 0.00%*
Forward Foreign Exchange Contracts (Hedged share classes) 0.00%
Buy EUR 1,857 : Sell USD 2,180 October 2021
(27) -
Buy EUR 3,995 : Sell USD 4,708 October 2021
(77) -
Buy EUR 85 : Sell USD 100 October 2021
(1) -
Buy EUR 87,074 : Sell USD 102,618 October 2021
(1,669) -
Buy USD 1,286 : Sell EUR 1,095 October 2021
17 -
Buy USD 1,356 : Sell EUR 1,157 October 2021
14 -
Buy USD 1,590 : Sell EUR 1,361 October 2021
12 -
Buy USD 105 : Sell EUR 90 October 2021
1 -
Buy USD 2,288 : Sell EUR 1,962 October 2021
14 -
Buy USD 4 : Sell EUR 3 October 2021
- -
Buy USD 59 : Sell EUR 50 October 2021
1 -
Buy USD 63 : Sell EUR 54 October 2021
1 -
Buy USD 73 : Sell EUR 63 October 2021
1 -
Buy USD 80 : Sell EUR 68 October 2021
1 -
(1,712) -
Investment in securities and derivatives 772,115,727 97.79
Other net assets 17,468,399 2.21
Total net assets 789,584,126 100.00
* In the case of derivative instruments, Market Value refers to the net profi t or loss and is used in the calculation of the Fund Net Asset Value.
Any diff erences in the percentage of Net Assets fi gures are the result of roundings.
Unrealised
Gains/Losses
USD
34
Latin American Fund
Investment report for the year from 1 October 2020 to 30 September 2021
Investment Fund Manager
Daniel J. Graña
The fund returned 23.9% (Net), 25.2% (Gross) based on Class H2 in Euro terms over the year under review, compared with a return of
28.8% in the MSCI Emerging Markets Latin America Index and a return of 31.4% in the Target Index + 2%, Euro terms.
Latin America stocks performed strongly during the reporting year. The roll-out of COVID-19 vaccines accelerated in a number of countries
globally, leading to stronger economic growth in the fi rst half of 2021. This fuelled higher demand and prices for raw materials, which
benefi ted Latin American economies. Stocks suff ered downward volatility in the third quarter of 2021, however, as new COVID-19 variants,
infl ation pressures, supply chain disruptions and regulatory uncertainty in China raised concerns about the strength of the global economic
recovery. This dampened the near-term outlook for commodity demand and contributed to downward volatility in Latin American equity
markets. The outlook for less accommodative monetary policy also led to higher interest rates. In addition, uncertainty about the fi scal policy
outlook, especially in Brazil, contributed to market turbulence.
Our focus remained on a 3-5 year time horizon as we sought investments we believed may benefi t from powerful trends in the global
economy. While we continued to see developments supporting these long-term trends, several investments were negatively impacted by
near-term macro uncertainty. This was especially the case in Brazil, where risk premiums rose early in 2021 after President Jair Bolsonaro
replaced the pro-free market CEO of state-owned energy company Petroleo Brasileiro with an ex-military offi cer. President Bolsonaro, who
faces a diffi cult re-election bid next year, has signalled that he may abandon fi scal discipline and embrace more populist spending plans
to win votes. Brazil’s economy continued to struggle with elevated COVID-19 death and infection rates, and economic pressures were
compounded in the third quarter of 2021 by global economic headwinds and weaker commodity demand. Brazilian policy makers are trying
to manage slower growth and rising infl ation, which pushed the central bank to raise interest rates sooner than expected. These pressures
led to a sell-off in Brazil’s equity market, hurting a number of the fund’s investments.
Afya, a notable detractor, is a medical education company leveraging technology to capitalise on consolidation in Brazil’s medical education
sector. Afya uses its strategic acquisition strategy to improve the quality of medical education while standardising the curriculum. It is also
looking to benefi t from its connections with students through an end-to-end digital e-commerce platform that physicians can use after
graduation. While Afya’s recent earnings performance exceeded market expectations, its guidance for the second half of 2021 was not as
strong as investors had hoped. Its digital business was a longer duration opportunity that was viewed less favorably by investors in a higher
interest rate environment. We saw this as a short-term setback, and we continued to own the stock.
Brazilian online retailer Lojas Americanas – previously B2W Cia Digital before its merger with parent company Americanas – was another
detractor. We invested in B2W Cia Digital because of its eff orts to improve its capital structure and enhance its service off erings. Its
commitment to this strategy has recently appeared less certain, however, especially following its acquisition of an offl ine retailer. We were
also less comfortable with its competitive positioning, given broader concerns about the macroeconomic outlook for Brazil. As a result, we
sold the stock.
Despite the underperformance of Americanas, we continued to see positive trends around the expansion of e-commerce in Latin America.
The pandemic accelerated adoption of online shopping, and revenue trends have remained strong even as lockdowns eased. In our view,
online shopping has become habitual, as consumers have come to appreciate its convenience and wider selection. This has fuelled robust
business trends for MercadoLibre, a leading e-commerce and digital payments company in Brazil. The stock was a strong contributor to
relative performance.
We continued to benefi t from our interest in decarbonisation, as countries worldwide invest in green energy infrastructure. We expect this
to drive long-term demand for copper, a major commodity in Latin America and a key component used in electric vehicles and solar power
panels. Our interest in quality mine assets and strong corporate governance led us to Ivanhoe Mines, a well-managed company that is
ramping up its copper production. The stock was another notable performer, supported by strong copper demand and price gains in the
fi rst half of 2021.
Our investment strategy remains guided by our multi-lens approach that considers company fundamentals and governance as well as the
macro and policy landscape. On the macro side, we have become more cautious about the economic outlook for Brazil, in particular, given
uncertainties about the pandemic and crosscurrents for commodity markets and global supply chains. These crosscurrents have led to
slower growth and higher infl ation – a challenging landscape for policy makers and companies to navigate. We are also keeping an eye on
fi scal policy and currency pressures, especially in Brazil, where we have scaled back some investments that we believe may be more at risk
in the near-term environment.
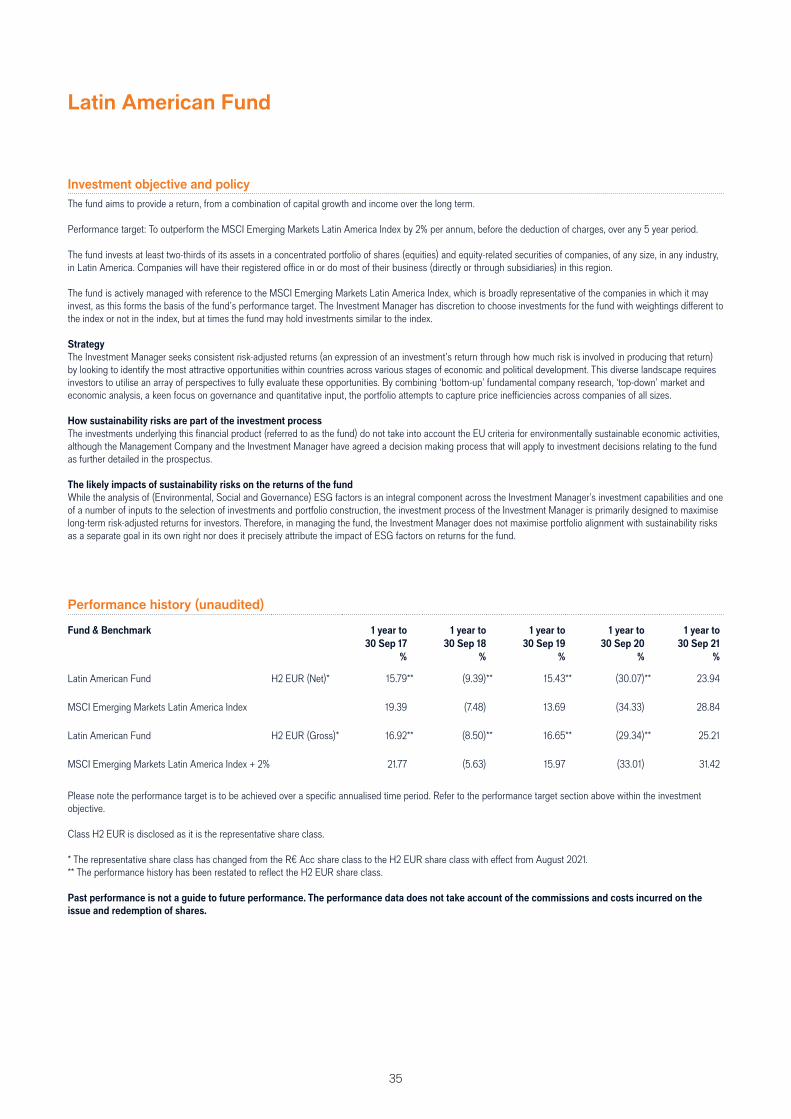
35
Latin American Fund
Investment objective and policy
The fund aims to provide a return, from a combination of capital growth and income over the long term.
Performance target: To outperform the MSCI Emerging Markets Latin America Index by 2% per annum, before the deduction of charges, over any 5 year period.
The fund invests at least two-thirds of its assets in a concentrated portfolio of shares (equities) and equity-related securities of companies, of any size, in any industry, in Latin America. Companies will have their registered offi ce in or do most of their business (directly or through subsidiaries) in this region.
The fund is actively managed with reference to the MSCI Emerging Markets Latin America Index, which is broadly representative of the companies in which it may invest, as this forms the basis of the fund’s performance target. The Investment Manager has discretion to choose investments for the fund with weightings diff erent to the index or not in the index, but at times the fund may hold investments similar to the index.
Strategy
The Investment Manager seeks consistent risk-adjusted returns (an expression of an investment’s return through how much risk is involved in producing that return) by looking to identify the most attractive opportunities within countries across various stages of economic and political development. This diverse landscape requires investors to utilise an array of perspectives to fully evaluate these opportunities. By combining ‘bottom-up’ fundamental company research, ‘top-down’ market and economic analysis, a keen focus on governance and quantitative input, the portfolio attempts to capture price ineffi ciencies across companies of all sizes.
How sustainability risks are part of the investment process
The investments underlying this fi nancial product (referred to as the fund) do not take into account the EU criteria for environmentally sustainable economic activities, although the Management Company and the Investment Manager have agreed a decision making process that will apply to investment decisions relating to the fund as further detailed in the prospectus.
The likely impacts of sustainability risks on the returns of the fund
While the analysis of (Environmental, Social and Governance) ESG factors is an integral component across the Investment Manager’s investment capabilities and one of a number of inputs to the selection of investments and portfolio construction, the investment process of the Investment Manager is primarily designed to maximise long-term risk-adjusted returns for investors. Therefore, in managing the fund, the Investment Manager does not maximise portfolio alignment with sustainability risks as a separate goal in its own right nor does it precisely attribute the impact of ESG factors on returns for the fund.
Performance history (unaudited)
Fund & Benchmark 1 year to 1 year to 1 year to 1 year to 1 year to
30 Sep 17 30 Sep 18 30 Sep 19 30 Sep 20 30 Sep 21
% % % % %
Latin American Fund H2 EUR (Net)* 15.79** (9.39)** 15.43** (30.07)** 23.94 MSCI Emerging Markets Latin America Index 19.39 (7.48) 13.69 (34.33) 28.84
Latin American Fund H2 EUR (Gross)* 16.92** (8.50)** 16.65** (29.34)** 25.21
MSCI Emerging Markets Latin America Index + 2% 21.77 (5.63) 15.97 (33.01) 31.42
Please note the performance target is to be achieved over a specifi c annualised time period. Refer to the performance target section above within the investment objective. Class H2 EUR is disclosed as it is the representative share class.
* The representative share class has changed from the R€ Acc share class to the H2 EUR share class with eff ect from August 2021.** The performance history has been restated to refl ect the H2 EUR share class. Past performance is not a guide to future performance. The performance data does not take account of the commissions and costs incurred on the
issue and redemption of shares.
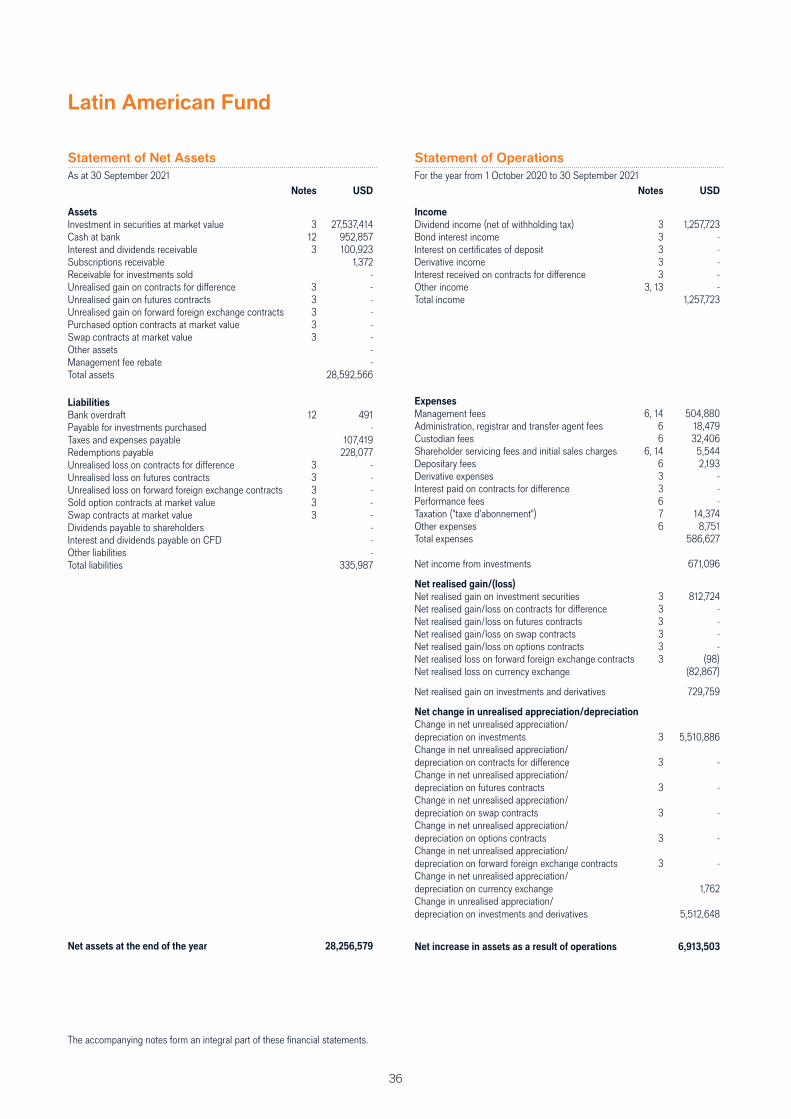
36
Latin American Fund
Statement of Net Assets
As at 30 September 2021Notes USD
Assets
Investment in securities at market value 3 27,537,414 Cash at bank 12 952,857 Interest and dividends receivable 3 100,923 Subscriptions receivable 1,372 Receivable for investments sold -Unrealised gain on contracts for diff erence 3 -Unrealised gain on futures contracts 3 -Unrealised gain on forward foreign exchange contracts 3 -Purchased option contracts at market value 3 -Swap contracts at market value 3 -Other assets -Management fee rebate -Total assets 28,592,566
Liabilities
Bank overdraft 12 491 Payable for investments purchased -Taxes and expenses payable 107,419 Redemptions payable 228,077 Unrealised loss on contracts for diff erence 3 -Unrealised loss on futures contracts 3 -Unrealised loss on forward foreign exchange contracts 3 -Sold option contracts at market value 3 -Swap contracts at market value 3 -Dividends payable to shareholders -Interest and dividends payable on CFD -Other liabilities -Total liabilities 335,987
Net assets at the end of the year 28,256,579
Statement of Operations
For the year from 1 October 2020 to 30 September 2021Notes USD
Income
Dividend income (net of withholding tax) 3 1,257,723 Bond interest income 3 -Interest on certifi cates of deposit 3 -Derivative income 3 -Interest received on contracts for diff erence 3 -Other income 3, 13 -Total income 1,257,723
Expenses
Management fees 6, 14 504,880 Administration, registrar and transfer agent fees 6 18,479 Custodian fees 6 32,406 Shareholder servicing fees and initial sales charges 6, 14 5,544 Depositary fees 6 2,193 Derivative expenses 3 -Interest paid on contracts for diff erence 3 -Performance fees 6 -Taxation ("taxe d'abonnement") 7 14,374 Other expenses 6 8,751 Total expenses 586,627
Net income from investments 671,096
Net realised gain/(loss)
Net realised gain on investment securities 3 812,724 Net realised gain/loss on contracts for diff erence 3 -Net realised gain/loss on futures contracts 3 -Net realised gain/loss on swap contracts 3 -Net realised gain/loss on options contracts 3 -Net realised loss on forward foreign exchange contracts 3 (98) Net realised loss on currency exchange (82,867)
Net realised gain on investments and derivatives 729,759
Net change in unrealised appreciation/depreciation
Change in net unrealised appreciation/depreciation on investments 3 5,510,886 Change in net unrealised appreciation/depreciation on contracts for diff erence 3 -Change in net unrealised appreciation/depreciation on futures contracts 3 -Change in net unrealised appreciation/depreciation on swap contracts 3 -Change in net unrealised appreciation/depreciation on options contracts 3 -Change in net unrealised appreciation/depreciation on forward foreign exchange contracts 3 -Change in net unrealised appreciation/depreciation on currency exchange 1,762 Change in unrealised appreciation/depreciation on investments and derivatives 5,512,648
Net increase in assets as a result of operations 6,913,503
The accompanying notes form an integral part of these fi nancial statements.
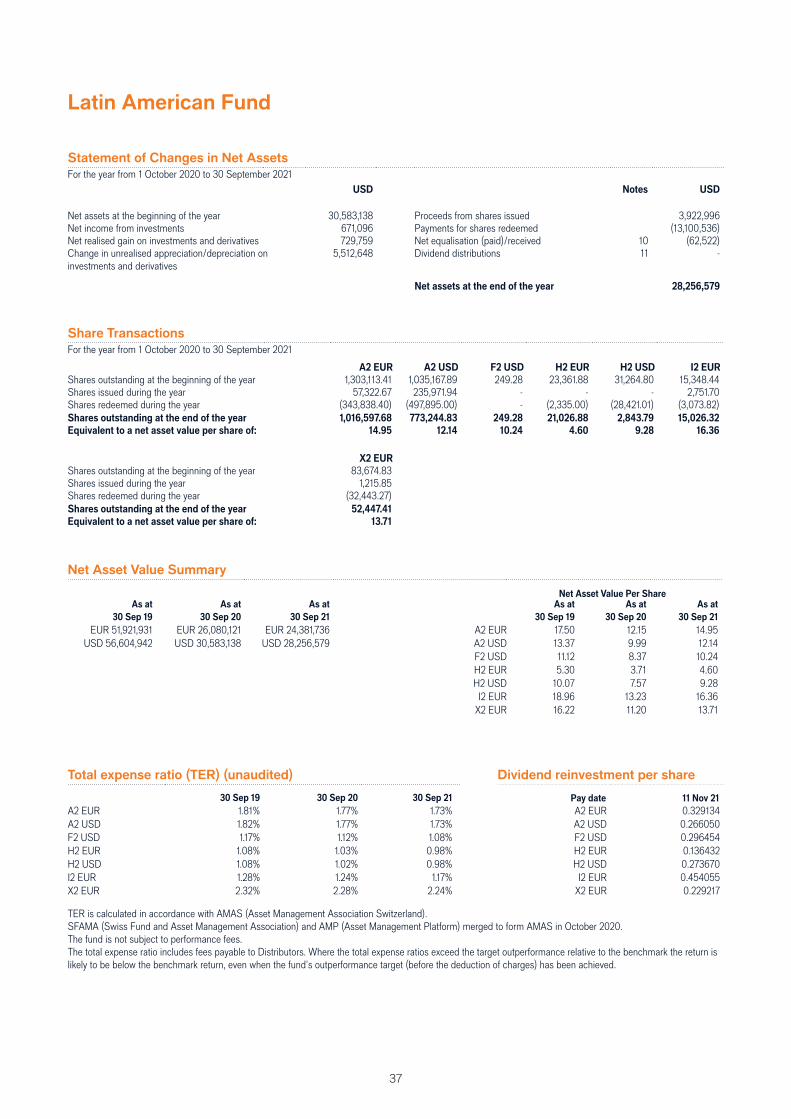
37
Latin American Fund
Share Transactions
For the year from 1 October 2020 to 30 September 2021
A2 EUR A2 USD F2 USD H2 EUR H2 USD I2 EUR
Shares outstanding at the beginning of the year 1,303,113.41 1,035,167.89 249.28 23,361.88 31,264.80 15,348.44Shares issued during the year 57,322.67 235,971.94 - - - 2,751.70Shares redeemed during the year (343,838.40) (497,895.00) - (2,335.00) (28,421.01) (3,073.82)Shares outstanding at the end of the year 1,016,597.68 773,244.83 249.28 21,026.88 2,843.79 15,026.32
Equivalent to a net asset value per share of: 14.95 12.14 10.24 4.60 9.28 16.36
X2 EUR
Shares outstanding at the beginning of the year 83,674.83Shares issued during the year 1,215.85Shares redeemed during the year (32,443.27)Shares outstanding at the end of the year 52,447.41
Equivalent to a net asset value per share of: 13.71
Net Asset Value Summary
Net Asset Value Per ShareAs at As at As at As at As at As at
30 Sep 19 30 Sep 20 30 Sep 21 30 Sep 19 30 Sep 20 30 Sep 21
EUR 51,921,931 EUR 26,080,121 EUR 24,381,736 A2 EUR 17.50 12.15 14.95USD 56,604,942 USD 30,583,138 USD 28,256,579 A2 USD 13.37 9.99 12.14
F2 USD 11.12 8.37 10.24H2 EUR 5.30 3.71 4.60H2 USD 10.07 7.57 9.28
I2 EUR 18.96 13.23 16.36X2 EUR 16.22 11.20 13.71
Statement of Changes in Net Assets
For the year from 1 October 2020 to 30 September 2021USD Notes USD
Net assets at the beginning of the year 30,583,138 Proceeds from shares issued 3,922,996 Net income from investments 671,096 Payments for shares redeemed (13,100,536) Net realised gain on investments and derivatives 729,759 Net equalisation (paid)/received 10 (62,522) Change in unrealised appreciation/depreciation on investments and derivatives
5,512,648 Dividend distributions 11 -
Net assets at the end of the year 28,256,579
Total expense ratio (TER) (unaudited) Dividend reinvestment per share
30 Sep 19 30 Sep 20 30 Sep 21 Pay date 11 Nov 21
A2 EUR 1.81% 1.77% 1.73% A2 EUR 0.329134 A2 USD 1.82% 1.77% 1.73% A2 USD 0.266050 F2 USD 1.17% 1.12% 1.08% F2 USD 0.296454 H2 EUR 1.08% 1.03% 0.98% H2 EUR 0.136432 H2 USD 1.08% 1.02% 0.98% H2 USD 0.273670 I2 EUR 1.28% 1.24% 1.17% I2 EUR 0.454055 X2 EUR 2.32% 2.28% 2.24% X2 EUR 0.229217
TER is calculated in accordance with AMAS (Asset Management Association Switzerland). SFAMA (Swiss Fund and Asset Management Association) and AMP (Asset Management Platform) merged to form AMAS in October 2020.The fund is not subject to performance fees. The total expense ratio includes fees payable to Distributors. Where the total expense ratios exceed the target outperformance relative to the benchmark the return is likely to be below the benchmark return, even when the fund’s outperformance target (before the deduction of charges) has been achieved.
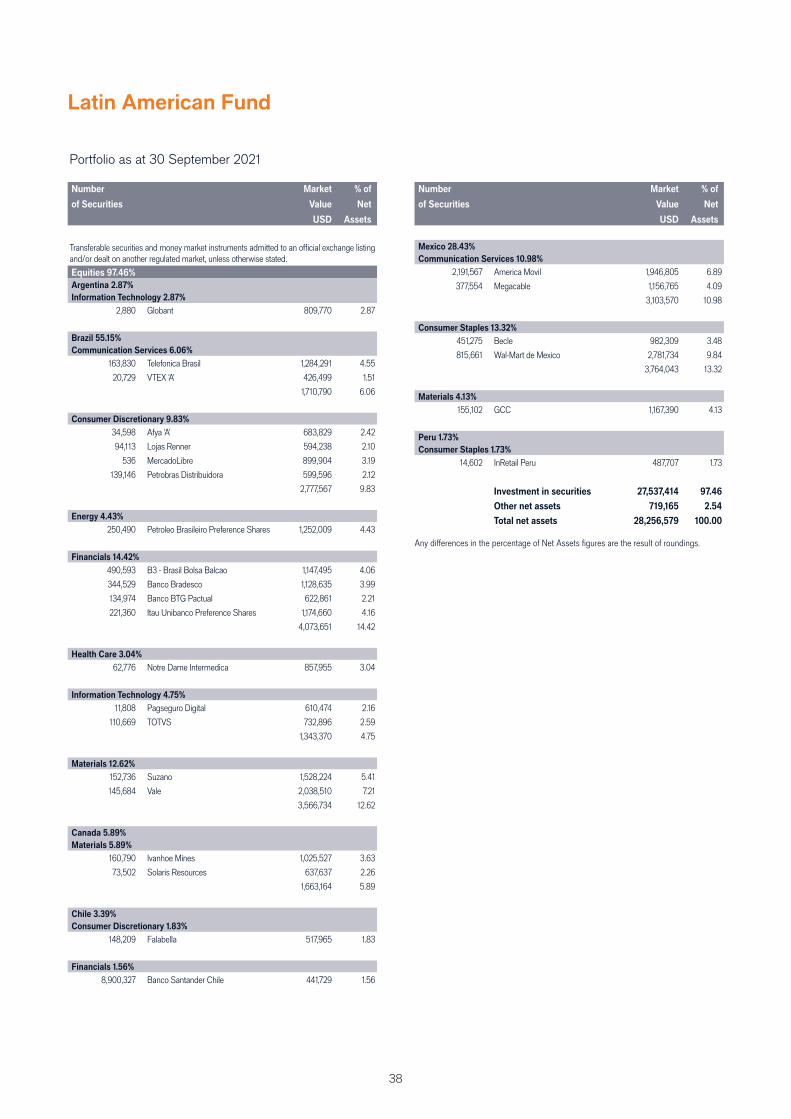
38
Latin American Fund
Portfolio as at 30 September 2021 (continued)
Number
of Securities
Market
Value
USD
% of
Net
Assets
Transferable securities and money market instruments admitted to an offi cial exchange listing and/or dealt on another regulated market, unless otherwise stated.
Equities 97.46%
Argentina 2.87%
Information Technology 2.87%
2,880 Globant 809,770 2.87
Brazil 55.15%
Communication Services 6.06%
163,830 Telefonica Brasil 1,284,291 4.55
20,729 VTEX 'A' 426,499 1.51
1,710,790 6.06
Consumer Discretionary 9.83%
34,598 Afya 'A' 683,829 2.42
94,113 Lojas Renner 594,238 2.10
536 MercadoLibre 899,904 3.19
139,146 Petrobras Distribuidora 599,596 2.12
2,777,567 9.83
Energy 4.43%
250,490 Petroleo Brasileiro Preference Shares 1,252,009 4.43
Financials 14.42%
490,593 B3 - Brasil Bolsa Balcao 1,147,495 4.06
344,529 Banco Bradesco 1,128,635 3.99
134,974 Banco BTG Pactual 622,861 2.21
221,360 Itau Unibanco Preference Shares 1,174,660 4.16
4,073,651 14.42
Health Care 3.04%
62,776 Notre Dame Intermedica 857,955 3.04
Information Technology 4.75%
11,808 Pagseguro Digital 610,474 2.16
110,669 TOTVS 732,896 2.59
1,343,370 4.75
Materials 12.62%
152,736 Suzano 1,528,224 5.41
145,684 Vale 2,038,510 7.21
3,566,734 12.62
Canada 5.89%
Materials 5.89%
160,790 Ivanhoe Mines 1,025,527 3.63
73,502 Solaris Resources 637,637 2.26
1,663,164 5.89
Chile 3.39%
Consumer Discretionary 1.83%
148,209 Falabella 517,965 1.83
Financials 1.56%
8,900,327 Banco Santander Chile 441,729 1.56
Portfolio as at 30 September 2021 (continued)
Number
of Securities
Market
Value
USD
% of
Net
Assets
Mexico 28.43%
Communication Services 10.98%
2,191,567 America Movil 1,946,805 6.89
377,554 Megacable 1,156,765 4.09
3,103,570 10.98
Consumer Staples 13.32%
451,275 Becle 982,309 3.48
815,661 Wal-Mart de Mexico 2,781,734 9.84
3,764,043 13.32
Materials 4.13%
155,102 GCC 1,167,390 4.13
Peru 1.73%
Consumer Staples 1.73%
14,602 InRetail Peru 487,707 1.73
Investment in securities 27,537,414 97.46
Other net assets 719,165 2.54
Total net assets 28,256,579 100.00
Any diff erences in the percentage of Net Assets fi gures are the result of roundings.
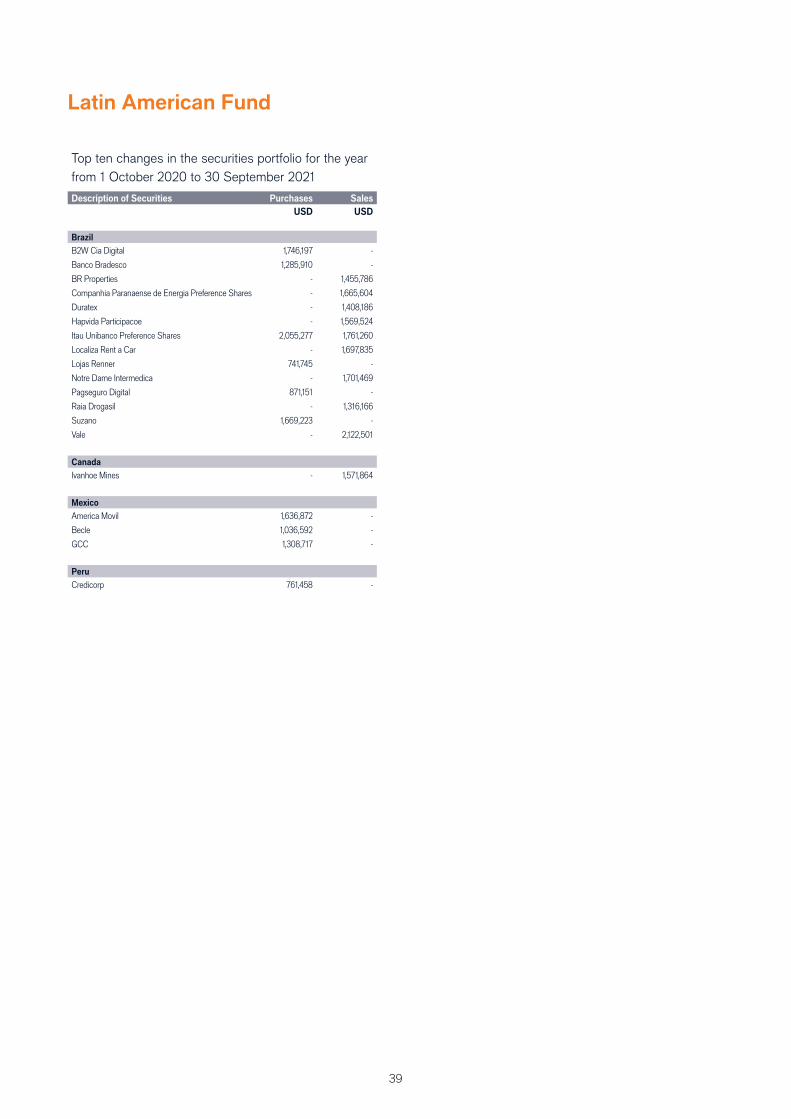
39
Latin American Fund
Top ten changes in the securities portfolio for the year
from 1 October 2020 to 30 September 2021
Description of Securities Purchases Sales
USD USD
Brazil
B2W Cia Digital 1,746,197 -
Banco Bradesco 1,285,910 -
BR Properties - 1,455,786
Companhia Paranaense de Energia Preference Shares - 1,665,604
Duratex - 1,408,186
Hapvida Participacoe - 1,569,524
Itau Unibanco Preference Shares 2,055,277 1,761,260
Localiza Rent a Car - 1,697,835
Lojas Renner 741,745 -
Notre Dame Intermedica - 1,701,469
Pagseguro Digital 871,151 -
Raia Drogasil - 1,316,166
Suzano 1,669,223 -
Vale - 2,122,501
Canada
Ivanhoe Mines - 1,571,864
Mexico
America Movil 1,636,872 -
Becle 1,036,592 -
GCC 1,308,717 -
Peru
Credicorp 761,458 -
40
Pan European Fund
Investment report for the year from 1 October 2020 to 30 September 2021
Investment Fund Managers
John Bennett and Tom O’Hara
The fund returned 28.5% (Net) based on Class H2 in Euro terms over the year under review, compared with a return of 28.8% in the MSCI
Europe Index, Euro terms.
As the 2020 calendar year drew to a close, and Europe was suff ering from a second wave of COVID-19 infections, we drew succour
from the unequivocally excellent vaccine data. This encouraged us to strengthen our view that a second ‘V-shape’ recovery (following
the industrial recovery of mid-2020) was likely: this time in the consumer sphere. This saw us shift the portfolio towards the consumer
discretionary sector. Notwithstanding, at times, hysterical media and political rhetoric, concerning vaccine roll-outs, vaccine effi cacy and
even vaccine nationalism, we resolutely trusted the data. Thus, we were not swayed in building the fund’s positions in stocks we considered
strong reopening benefi ciaries. Prime examples included Airbus (aerospace), BMW (automotive), Daimler (automotive), EssilorLuxottica
(eyewear), Inditex (apparel), Mowi (fi sh farming), Pandora (jewellery), Ryanair (airline) and Stellantis (automotive).
This evolving outlook goes a long way to explaining the returns over the reporting year. The biggest contributor at the sector level was an
overweight exposure to the consumer discretionary sector as well as underweight positions in the more defensive areas of healthcare,
communication services and consumer staples. The fund’s underweight position in the fi nancials sector was the biggest drag. While an
improving infl ation outlook has caused us to narrow the underweight position versus the benchmark, the lack of a broader fundamental
driver for the banking sector has limited the amount of client capital we have been willing to deploy.
At the stock level, some of the biggest contributions came from Daimler and ASML. Daimler’s new management team is leading the
biggest cost-cutting and refocusing project in the company’s modern history to lower breakeven points and successfully transition to the
electric vehicle world. ASML continued to benefi t from its monopolistic position in semiconductor manufacturing equipment. It should be
noted, however, that we took profi ts in the semiconductor sector more broadly, following strong share price performance and early signs
that the cycle may be starting a down swing. Elsewhere, building materials company Compagnie de St Gobain added to returns. The
management team has done a good job at improving cash conversion and corporate governance, and the company is well positioned for
the green stimulus that will be put to work in the coming year.
At the time of writing, the world economy is facing the stiff challenge presented by what could be termed ‘a shortage of everything’. If we
dwell on energy, here is a sector where supply shortages have been exacerbated by the ‘gold rush’ known as environmental, social and
governance investing. Politicians, protesters and investors are seemingly uniting to ‘cancel’ certain corporates and/or industries. This, in
turn, has led to something of a starvation of capital committed to the likes of oil exploration and carbon energy infrastructure. We are now
faced with the harsh realities of such cancellation as the world is brought to a shuddering reality: that the energy transition has to take
time and it cannot be rushed. As unfashionable as this view may seem, it is also unfashionable, to some, to hold oil stocks in investment
portfolios. Here we see opportunity: to invest in seriously undervalued stocks and, via engagement, to demonstrate that those companies
are part of the solution. Therefore, the most recent activity was to increase the fund’s exposure to the oil sector. We also believe that the
‘shape’ of the market has thrown up further opportunity, one that can be described as the style discrepancy. With growth stocks once again
in the ascendancy over the summer months, a number of value names were left in their wake. Thus, we added selectively to holdings in
the automotive and banking sectors. Other additions included Danone, where management change has led to meaningful selling, general
and administrative expenses reduction as well as portfolio reshaping towards plant-based growth products. Pandora fi ts into our reopening
theme but is also under new leadership. The company has undertaken a comprehensive restructuring of the entire top team and has been
positioned for a more environmentally aware consumer with investment in its lab-grown diamond products. We also boosted the fund’s
exposure to big pharmaceutical companies, following a period of chronic underperformance. Finally, we initiated a position in food retailer
J Sainsbury, as we believed cheap, asset-backed UK companies with strong cash-fl ow profi les would continue to attract the attention of
private investors.
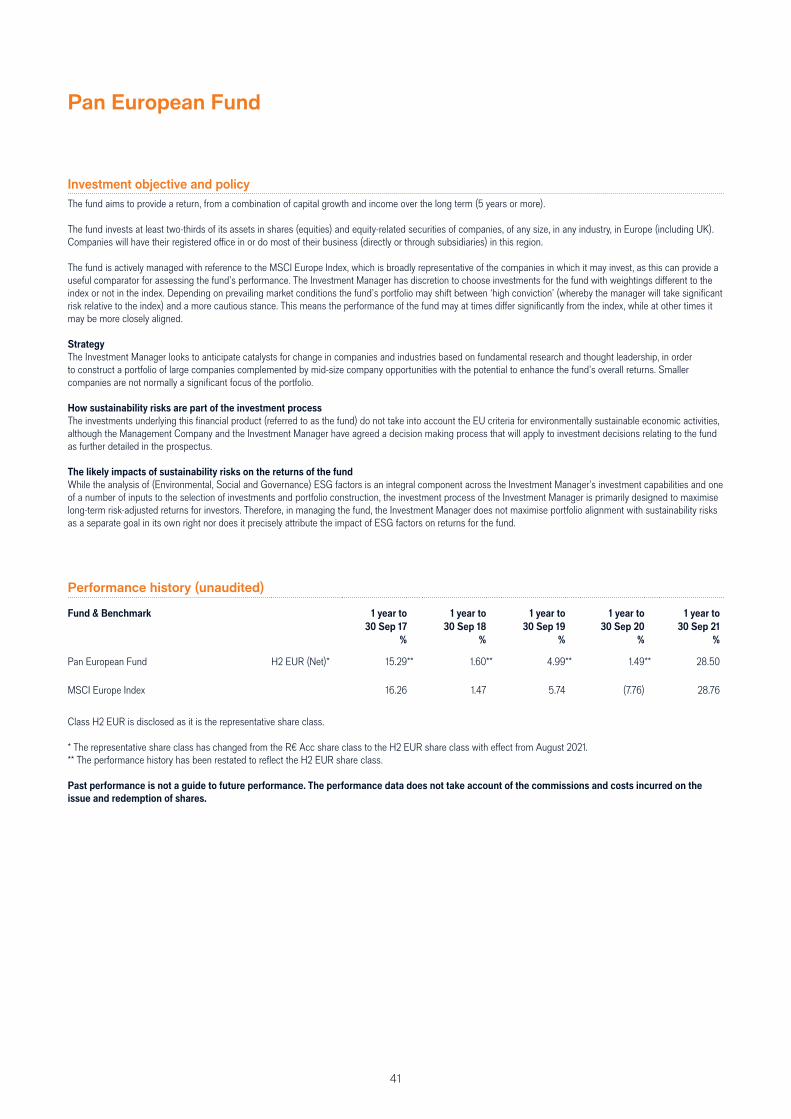
41
Pan European Fund
Investment objective and policy
The fund aims to provide a return, from a combination of capital growth and income over the long term (5 years or more).
The fund invests at least two-thirds of its assets in shares (equities) and equity-related securities of companies, of any size, in any industry, in Europe (including UK). Companies will have their registered offi ce in or do most of their business (directly or through subsidiaries) in this region.
The fund is actively managed with reference to the MSCI Europe Index, which is broadly representative of the companies in which it may invest, as this can provide a useful comparator for assessing the fund’s performance. The Investment Manager has discretion to choose investments for the fund with weightings diff erent to the index or not in the index. Depending on prevailing market conditions the fund’s portfolio may shift between ‘high conviction’ (whereby the manager will take signifi cant risk relative to the index) and a more cautious stance. This means the performance of the fund may at times diff er signifi cantly from the index, while at other times it may be more closely aligned.
Strategy
The Investment Manager looks to anticipate catalysts for change in companies and industries based on fundamental research and thought leadership, in order to construct a portfolio of large companies complemented by mid-size company opportunities with the potential to enhance the fund’s overall returns. Smaller companies are not normally a signifi cant focus of the portfolio.
How sustainability risks are part of the investment process
The investments underlying this fi nancial product (referred to as the fund) do not take into account the EU criteria for environmentally sustainable economic activities, although the Management Company and the Investment Manager have agreed a decision making process that will apply to investment decisions relating to the fund as further detailed in the prospectus.
The likely impacts of sustainability risks on the returns of the fund
While the analysis of (Environmental, Social and Governance) ESG factors is an integral component across the Investment Manager’s investment capabilities and one of a number of inputs to the selection of investments and portfolio construction, the investment process of the Investment Manager is primarily designed to maximise long-term risk-adjusted returns for investors. Therefore, in managing the fund, the Investment Manager does not maximise portfolio alignment with sustainability risks as a separate goal in its own right nor does it precisely attribute the impact of ESG factors on returns for the fund.
Performance history (unaudited)
Fund & Benchmark 1 year to 1 year to 1 year to 1 year to 1 year to
30 Sep 17 30 Sep 18 30 Sep 19 30 Sep 20 30 Sep 21
% % % % %
Pan European Fund H2 EUR (Net)* 15.29** 1.60** 4.99** 1.49** 28.50 MSCI Europe Index 16.26 1.47 5.74 (7.76) 28.76
Class H2 EUR is disclosed as it is the representative share class.
* The representative share class has changed from the R€ Acc share class to the H2 EUR share class with eff ect from August 2021.** The performance history has been restated to refl ect the H2 EUR share class. Past performance is not a guide to future performance. The performance data does not take account of the commissions and costs incurred on the
issue and redemption of shares.

42
Pan European Fund
Statement of Net Assets
As at 30 September 2021Notes EUR
Assets
Investment in securities at market value 3 1,116,913,344 Cash at bank 12 4,887,394 Interest and dividends receivable 3 808,863 Subscriptions receivable 1,178,932 Receivable for investments sold 2,572,472 Unrealised gain on contracts for diff erence 3 -Unrealised gain on futures contracts 3 -Unrealised gain on forward foreign exchange contracts 3 2,068,252 Purchased option contracts at market value 3 -Swap contracts at market value 3 -Other assets 1,269,275 Management fee rebate -Total assets 1,129,698,532
Liabilities
Bank overdraft 12 -Payable for investments purchased 6,174,643 Taxes and expenses payable 1,998,285 Redemptions payable 1,139,152 Unrealised loss on contracts for diff erence 3 -Unrealised loss on futures contracts 3 -Unrealised loss on forward foreign exchange contracts 3 87,924 Sold option contracts at market value 3 -Swap contracts at market value 3 -Dividends payable to shareholders -Interest and dividends payable on CFD -Other liabilities -Total liabilities 9,400,004
Net assets at the end of the year 1,120,298,528
Statement of Operations
For the year from 1 October 2020 to 30 September 2021Notes EUR
Income
Dividend income (net of withholding tax) 3 20,548,722 Bond interest income 3 -Interest on certifi cates of deposit 3 -Derivative income 3 77,541 Interest received on contracts for diff erence 3 -Other income 3, 13 46,263 Total income 20,672,526
Expenses
Management fees 6, 14 7,548,135 Administration, registrar and transfer agent fees 6 312,150 Custodian fees 6 64,278 Shareholder servicing fees and initial sales charges 6, 14 239 Depositary fees 6 54,235 Derivative expenses 3 -Interest paid on contracts for diff erence 3 -Performance fees 6 -Taxation ("taxe d'abonnement") 7 124,950 Other expenses 6 221,284 Total expenses 8,325,271
Net income from investments 12,347,255
Net realised gain/(loss)
Net realised gain on investment securities 3 100,852,456 Net realised gain/loss on contracts for diff erence 3 -Net realised gain/loss on futures contracts 3 -Net realised gain/loss on swap contracts 3 -Net realised gain/loss on options contracts 3 -Net realised gain on forward foreign exchange contracts 3 7,500,172 Net realised loss on currency exchange (102,104)
Net realised gain on investments and derivatives 108,250,524
Net change in unrealised appreciation/depreciation
Change in net unrealised appreciation/depreciation on investments 3 70,438,987 Change in net unrealised appreciation/depreciation on contracts for diff erence 3 -Change in net unrealised appreciation/depreciation on futures contracts 3 -Change in net unrealised appreciation/depreciation on swap contracts 3 -Change in net unrealised appreciation/depreciation on options contracts 3 -Change in net unrealised appreciation/depreciation on forward foreign exchange contracts 3 (757,269) Change in net unrealised appreciation/depreciation on currency exchange 759 Change in unrealised appreciation/depreciation on investments and derivatives 69,682,477
Net increase in assets as a result of operations 190,280,256
The accompanying notes form an integral part of these fi nancial statements.
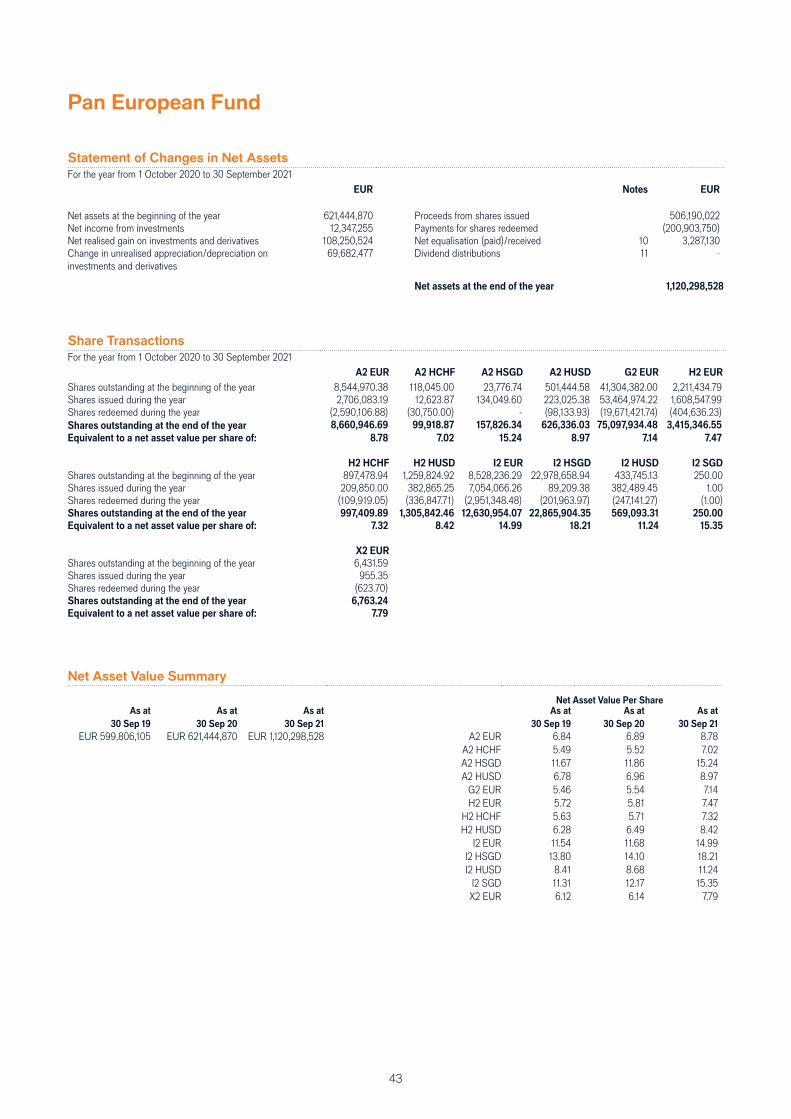
43
Pan European Fund
Share Transactions
For the year from 1 October 2020 to 30 September 2021A2 EUR A2 HCHF A2 HSGD A2 HUSD G2 EUR H2 EUR
Shares outstanding at the beginning of the year 8,544,970.38 118,045.00 23,776.74 501,444.58 41,304,382.00 2,211,434.79Shares issued during the year 2,706,083.19 12,623.87 134,049.60 223,025.38 53,464,974.22 1,608,547.99Shares redeemed during the year (2,590,106.88) (30,750.00) - (98,133.93) (19,671,421.74) (404,636.23)Shares outstanding at the end of the year 8,660,946.69 99,918.87 157,826.34 626,336.03 75,097,934.48 3,415,346.55
Equivalent to a net asset value per share of: 8.78 7.02 15.24 8.97 7.14 7.47
H2 HCHF H2 HUSD I2 EUR I2 HSGD I2 HUSD I2 SGD
Shares outstanding at the beginning of the year 897,478.94 1,259,824.92 8,528,236.29 22,978,658.94 433,745.13 250.00Shares issued during the year 209,850.00 382,865.25 7,054,066.26 89,209.38 382,489.45 1.00Shares redeemed during the year (109,919.05) (336,847.71) (2,951,348.48) (201,963.97) (247,141.27) (1.00)Shares outstanding at the end of the year 997,409.89 1,305,842.46 12,630,954.07 22,865,904.35 569,093.31 250.00
Equivalent to a net asset value per share of: 7.32 8.42 14.99 18.21 11.24 15.35
X2 EUR
Shares outstanding at the beginning of the year 6,431.59Shares issued during the year 955.35Shares redeemed during the year (623.70)Shares outstanding at the end of the year 6,763.24
Equivalent to a net asset value per share of: 7.79
Net Asset Value Summary
Net Asset Value Per ShareAs at As at As at As at As at As at
30 Sep 19 30 Sep 20 30 Sep 21 30 Sep 19 30 Sep 20 30 Sep 21
EUR 599,806,105 EUR 621,444,870 EUR 1,120,298,528 A2 EUR 6.84 6.89 8.78A2 HCHF 5.49 5.52 7.02A2 HSGD 11.67 11.86 15.24A2 HUSD 6.78 6.96 8.97
G2 EUR 5.46 5.54 7.14H2 EUR 5.72 5.81 7.47
H2 HCHF 5.63 5.71 7.32H2 HUSD 6.28 6.49 8.42
I2 EUR 11.54 11.68 14.99I2 HSGD 13.80 14.10 18.21I2 HUSD 8.41 8.68 11.24
I2 SGD 11.31 12.17 15.35X2 EUR 6.12 6.14 7.79
Statement of Changes in Net Assets
For the year from 1 October 2020 to 30 September 2021EUR Notes EUR
Net assets at the beginning of the year 621,444,870 Proceeds from shares issued 506,190,022 Net income from investments 12,347,255 Payments for shares redeemed (200,903,750) Net realised gain on investments and derivatives 108,250,524 Net equalisation (paid)/received 10 3,287,130 Change in unrealised appreciation/depreciation on investments and derivatives
69,682,477 Dividend distributions 11 -
Net assets at the end of the year 1,120,298,528
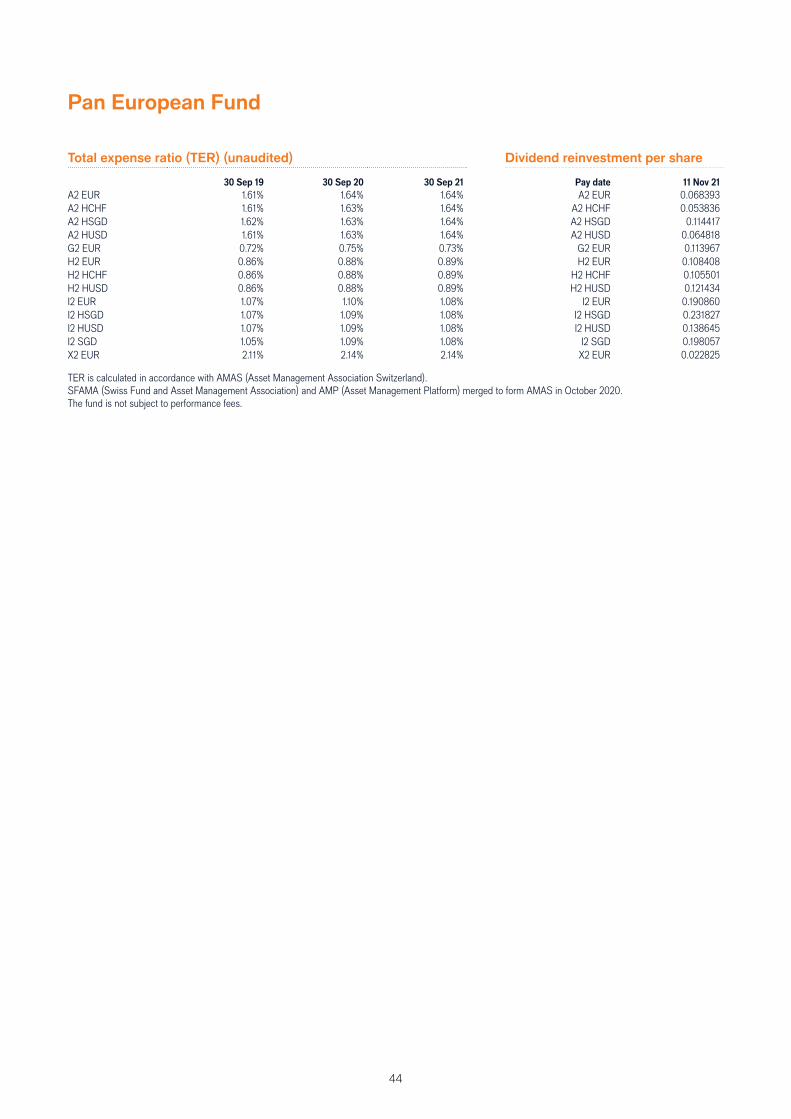
44
Pan European Fund
Total expense ratio (TER) (unaudited) Dividend reinvestment per share
30 Sep 19 30 Sep 20 30 Sep 21 Pay date 11 Nov 21
A2 EUR 1.61% 1.64% 1.64% A2 EUR 0.068393 A2 HCHF 1.61% 1.63% 1.64% A2 HCHF 0.053836 A2 HSGD 1.62% 1.63% 1.64% A2 HSGD 0.114417 A2 HUSD 1.61% 1.63% 1.64% A2 HUSD 0.064818 G2 EUR 0.72% 0.75% 0.73% G2 EUR 0.113967 H2 EUR 0.86% 0.88% 0.89% H2 EUR 0.108408 H2 HCHF 0.86% 0.88% 0.89% H2 HCHF 0.105501 H2 HUSD 0.86% 0.88% 0.89% H2 HUSD 0.121434 I2 EUR 1.07% 1.10% 1.08% I2 EUR 0.190860 I2 HSGD 1.07% 1.09% 1.08% I2 HSGD 0.231827 I2 HUSD 1.07% 1.09% 1.08% I2 HUSD 0.138645 I2 SGD 1.05% 1.09% 1.08% I2 SGD 0.198057 X2 EUR 2.11% 2.14% 2.14% X2 EUR 0.022825
TER is calculated in accordance with AMAS (Asset Management Association Switzerland).SFAMA (Swiss Fund and Asset Management Association) and AMP (Asset Management Platform) merged to form AMAS in October 2020.The fund is not subject to performance fees.
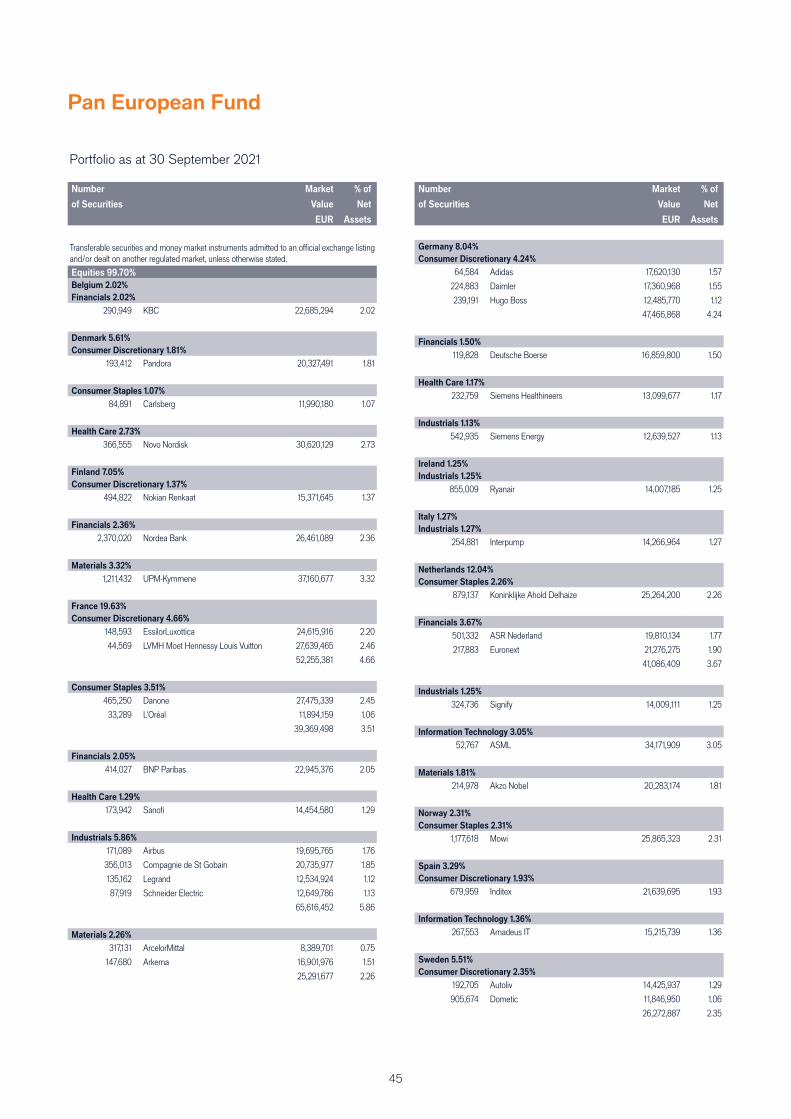
45
Pan European Fund
Portfolio as at 30 September 2021 (continued)
Number
of Securities
Market
Value
EUR
% of
Net
Assets
Transferable securities and money market instruments admitted to an offi cial exchange listing and/or dealt on another regulated market, unless otherwise stated.
Equities 99.70%
Belgium 2.02%
Financials 2.02%
290,949 KBC 22,685,294 2.02
Denmark 5.61%
Consumer Discretionary 1.81%
193,412 Pandora 20,327,491 1.81
Consumer Staples 1.07%
84,891 Carlsberg 11,990,180 1.07
Health Care 2.73%
366,555 Novo Nordisk 30,620,129 2.73
Finland 7.05%
Consumer Discretionary 1.37%
494,822 Nokian Renkaat 15,371,645 1.37
Financials 2.36%
2,370,020 Nordea Bank 26,461,089 2.36
Materials 3.32%
1,211,432 UPM-Kymmene 37,160,677 3.32
France 19.63%
Consumer Discretionary 4.66%
148,593 EssilorLuxottica 24,615,916 2.20
44,569 LVMH Moet Hennessy Louis Vuitton 27,639,465 2.46
52,255,381 4.66
Consumer Staples 3.51%
465,250 Danone 27,475,339 2.45
33,289 L'Oréal 11,894,159 1.06
39,369,498 3.51
Financials 2.05%
414,027 BNP Paribas 22,945,376 2.05
Health Care 1.29%
173,942 Sanofi 14,454,580 1.29
Industrials 5.86%
171,089 Airbus 19,695,765 1.76
356,013 Compagnie de St Gobain 20,735,977 1.85
135,162 Legrand 12,534,924 1.12
87,919 Schneider Electric 12,649,786 1.13
65,616,452 5.86
Materials 2.26%
317,131 ArcelorMittal 8,389,701 0.75
147,680 Arkema 16,901,976 1.51
25,291,677 2.26
Portfolio as at 30 September 2021 (continued)
Number
of Securities
Market
Value
EUR
% of
Net
Assets
Germany 8.04%
Consumer Discretionary 4.24%
64,584 Adidas 17,620,130 1.57
224,883 Daimler 17,360,968 1.55
239,191 Hugo Boss 12,485,770 1.12
47,466,868 4.24
Financials 1.50%
119,828 Deutsche Boerse 16,859,800 1.50
Health Care 1.17%
232,759 Siemens Healthineers 13,099,677 1.17
Industrials 1.13%
542,935 Siemens Energy 12,639,527 1.13
Ireland 1.25%
Industrials 1.25%
855,009 Ryanair 14,007,185 1.25
Italy 1.27%
Industrials 1.27%
254,881 Interpump 14,266,964 1.27
Netherlands 12.04%
Consumer Staples 2.26%
879,137 Koninklijke Ahold Delhaize 25,264,200 2.26
Financials 3.67%
501,332 ASR Nederland 19,810,134 1.77
217,883 Euronext 21,276,275 1.90
41,086,409 3.67
Industrials 1.25%
324,736 Signify 14,009,111 1.25
Information Technology 3.05%
52,767 ASML 34,171,909 3.05
Materials 1.81%
214,978 Akzo Nobel 20,283,174 1.81
Norway 2.31%
Consumer Staples 2.31%
1,177,618 Mowi 25,865,323 2.31
Spain 3.29%
Consumer Discretionary 1.93%
679,959 Inditex 21,639,695 1.93
Information Technology 1.36%
267,553 Amadeus IT 15,215,739 1.36
Sweden 5.51%
Consumer Discretionary 2.35%
192,705 Autoliv 14,425,937 1.29
905,674 Dometic 11,846,950 1.06
26,272,887 2.35
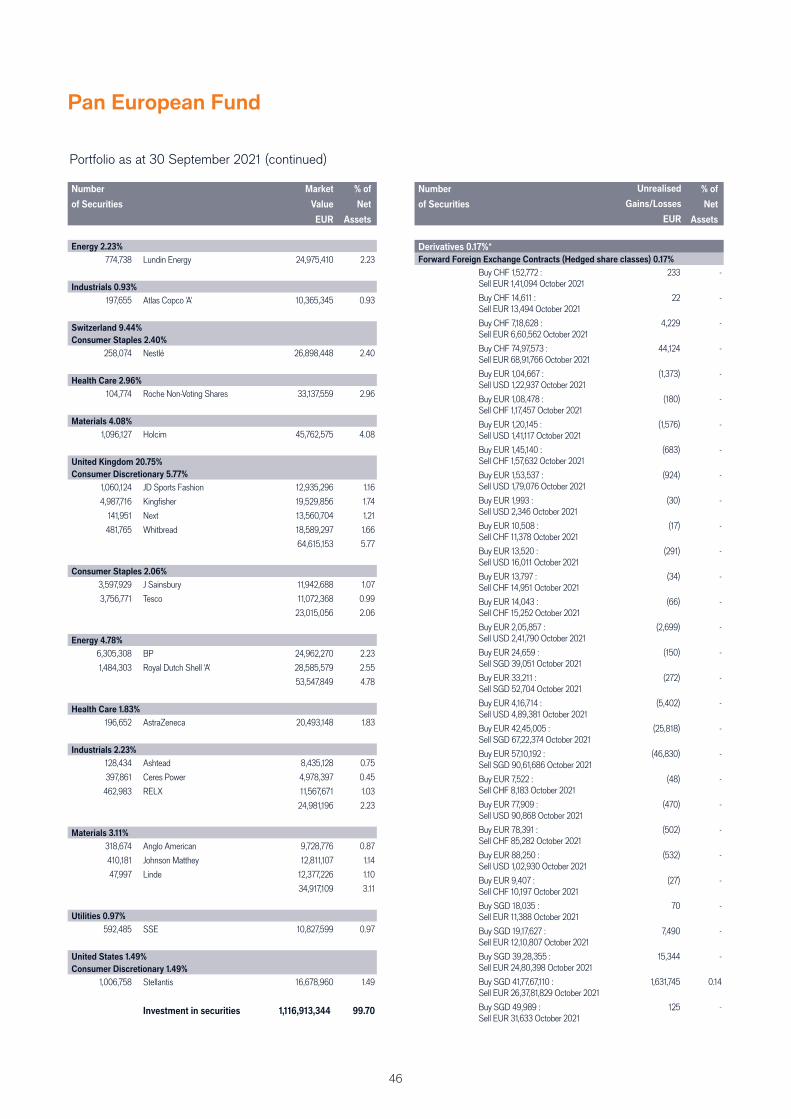
46
Pan European Fund
Portfolio as at 30 September 2021 (continued)
Number
of Securities
Market
Value
EUR
% of
Net
Assets
Energy 2.23%
774,738 Lundin Energy 24,975,410 2.23
Industrials 0.93%
197,655 Atlas Copco 'A' 10,365,345 0.93
Switzerland 9.44%
Consumer Staples 2.40%
258,074 Nestlé 26,898,448 2.40
Health Care 2.96%
104,774 Roche Non-Voting Shares 33,137,559 2.96
Materials 4.08%
1,096,127 Holcim 45,762,575 4.08
United Kingdom 20.75%
Consumer Discretionary 5.77%
1,060,124 JD Sports Fashion 12,935,296 1.16
4,987,716 Kingfi sher 19,529,856 1.74
141,951 Next 13,560,704 1.21
481,765 Whitbread 18,589,297 1.66
64,615,153 5.77
Consumer Staples 2.06%
3,597,929 J Sainsbury 11,942,688 1.07
3,756,771 Tesco 11,072,368 0.99
23,015,056 2.06
Energy 4.78%
6,305,308 BP 24,962,270 2.23
1,484,303 Royal Dutch Shell 'A' 28,585,579 2.55
53,547,849 4.78
Health Care 1.83%
196,652 AstraZeneca 20,493,148 1.83
Industrials 2.23%
128,434 Ashtead 8,435,128 0.75
397,861 Ceres Power 4,978,397 0.45
462,983 RELX 11,567,671 1.03
24,981,196 2.23
Materials 3.11%
318,674 Anglo American 9,728,776 0.87
410,181 Johnson Matthey 12,811,107 1.14
47,997 Linde 12,377,226 1.10
34,917,109 3.11
Utilities 0.97%
592,485 SSE 10,827,599 0.97
United States 1.49%
Consumer Discretionary 1.49%
1,006,758 Stellantis 16,678,960 1.49
Investment in securities 1,116,913,344 99.70
Portfolio as at 30 September 2021 (continued)
Number
of Securities
Market
Value
EUR
% of
Net
Assets
Derivatives 0.17%*
Forward Foreign Exchange Contracts (Hedged share classes) 0.17%
Buy CHF 1,52,772 : Sell EUR 1,41,094 October 2021
233 -
Buy CHF 14,611 : Sell EUR 13,494 October 2021
22 -
Buy CHF 7,18,628 : Sell EUR 6,60,562 October 2021
4,229 -
Buy CHF 74,97,573 : Sell EUR 68,91,766 October 2021
44,124 -
Buy EUR 1,04,667 : Sell USD 1,22,937 October 2021
(1,373) -
Buy EUR 1,08,478 : Sell CHF 1,17,457 October 2021
(180) -
Buy EUR 1,20,145 : Sell USD 1,41,117 October 2021
(1,576) -
Buy EUR 1,45,140 : Sell CHF 1,57,632 October 2021
(683) -
Buy EUR 1,53,537 : Sell USD 1,79,076 October 2021
(924) -
Buy EUR 1,993 : Sell USD 2,346 October 2021
(30) -
Buy EUR 10,508 : Sell CHF 11,378 October 2021
(17) -
Buy EUR 13,520 : Sell USD 16,011 October 2021
(291) -
Buy EUR 13,797 : Sell CHF 14,951 October 2021
(34) -
Buy EUR 14,043 : Sell CHF 15,252 October 2021
(66) -
Buy EUR 2,05,857 : Sell USD 2,41,790 October 2021
(2,699) -
Buy EUR 24,659 : Sell SGD 39,051 October 2021
(150) -
Buy EUR 33,211 : Sell SGD 52,704 October 2021
(272) -
Buy EUR 4,16,714 : Sell USD 4,89,381 October 2021
(5,402) -
Buy EUR 42,45,005 : Sell SGD 67,22,374 October 2021
(25,818) -
Buy EUR 57,10,192 : Sell SGD 90,61,686 October 2021
(46,830) -
Buy EUR 7,522 : Sell CHF 8,183 October 2021
(48) -
Buy EUR 77,909 : Sell USD 90,868 October 2021
(470) -
Buy EUR 78,391 : Sell CHF 85,282 October 2021
(502) -
Buy EUR 88,250 : Sell USD 1,02,930 October 2021
(532) -
Buy EUR 9,407 : Sell CHF 10,197 October 2021
(27) -
Buy SGD 18,035 : Sell EUR 11,388 October 2021
70 -
Buy SGD 19,17,627 : Sell EUR 12,10,807 October 2021
7,490 -
Buy SGD 39,28,355 : Sell EUR 24,80,398 October 2021
15,344 -
Buy SGD 41,77,67,110 : Sell EUR 26,37,81,829 October 2021
1,631,745 0.14
Buy SGD 49,989 : Sell EUR 31,633 October 2021
125 -
Unrealised
Gains/Losses
EUR
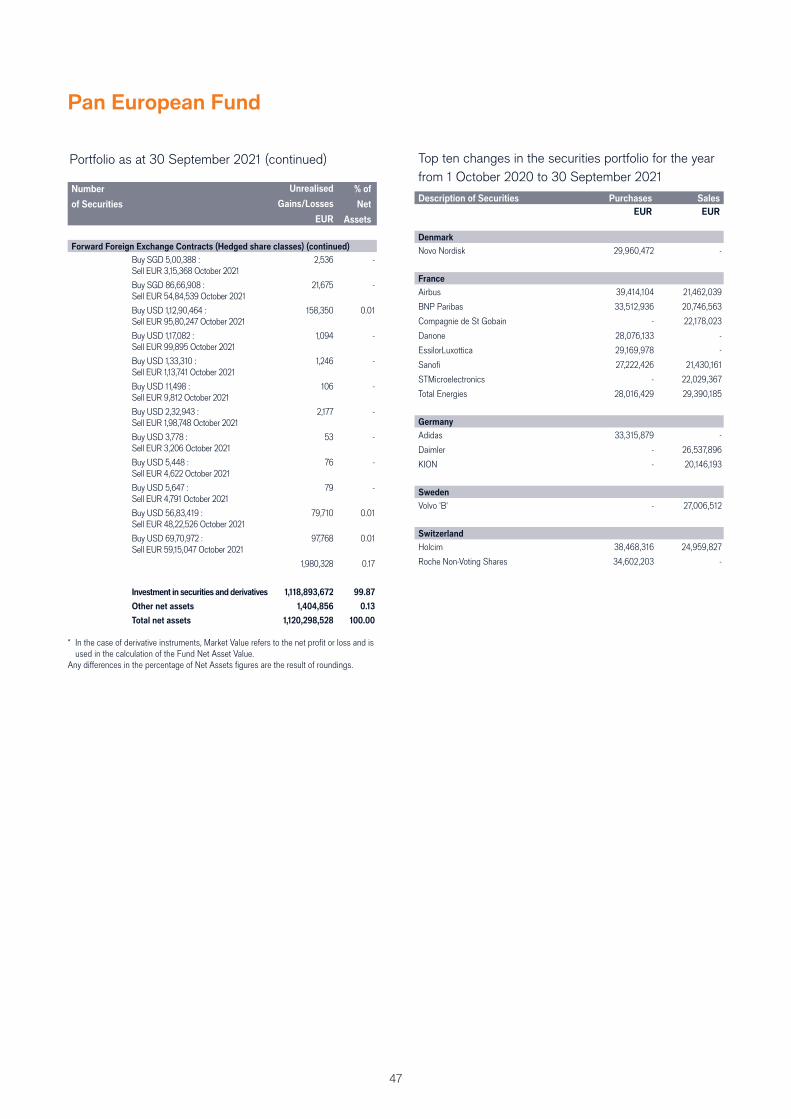
47
Pan European Fund
Top ten changes in the securities portfolio for the year
from 1 October 2020 to 30 September 2021
Description of Securities Purchases Sales
EUR EUR
Denmark
Novo Nordisk 29,960,472 -
France
Airbus 39,414,104 21,462,039
BNP Paribas 33,512,936 20,746,563
Compagnie de St Gobain - 22,178,023
Danone 28,076,133 -
EssilorLuxottica 29,169,978 -
Sanofi 27,222,426 21,430,161
STMicroelectronics - 22,029,367
Total Energies 28,016,429 29,390,185
Germany
Adidas 33,315,879 -
Daimler - 26,537,896
KION - 20,146,193
Sweden
Volvo 'B' - 27,006,512
Switzerland
Holcim 38,468,316 24,959,827
Roche Non-Voting Shares 34,602,203 -
Portfolio as at 30 September 2021 (continued)
Number
of Securities
Market
Value
EUR
% of
Net
Assets
Forward Foreign Exchange Contracts (Hedged share classes) (continued)
Buy SGD 5,00,388 : Sell EUR 3,15,368 October 2021
2,536 -
Buy SGD 86,66,908 : Sell EUR 54,84,539 October 2021
21,675 -
Buy USD 1,12,90,464 : Sell EUR 95,80,247 October 2021
158,350 0.01
Buy USD 1,17,082 : Sell EUR 99,895 October 2021
1,094 -
Buy USD 1,33,310 : Sell EUR 1,13,741 October 2021
1,246 -
Buy USD 11,498 : Sell EUR 9,812 October 2021
106 -
Buy USD 2,32,943 : Sell EUR 1,98,748 October 2021
2,177 -
Buy USD 3,778 : Sell EUR 3,206 October 2021
53 -
Buy USD 5,448 : Sell EUR 4,622 October 2021
76 -
Buy USD 5,647 : Sell EUR 4,791 October 2021
79 -
Buy USD 56,83,419 : Sell EUR 48,22,526 October 2021
79,710 0.01
Buy USD 69,70,972 : Sell EUR 59,15,047 October 2021
97,768 0.01
1,980,328 0.17
Investment in securities and derivatives 1,118,893,672 99.87
Other net assets 1,404,856 0.13
Total net assets 1,120,298,528 100.00
* In the case of derivative instruments, Market Value refers to the net profi t or loss and is used in the calculation of the Fund Net Asset Value.
Any diff erences in the percentage of Net Assets fi gures are the result of roundings.
Unrealised
Gains/Losses
EUR
48
Pan European Smaller Companies Fund
Investment report for the year from 1 October 2020 to 30 September 2021
Investment Fund Managers
Ollie Beckett and Rory Stokes
The fund returned 49.0% (Net) based on Class H2 in Euro terms over the year under review, compared with a return of 39.9% in the
Euromoney Europe Smaller Companies Index, Euro terms.
European small-cap markets were strong over the reporting year, supported by positive COVID-19 vaccine results and the reopening of
economies. At year end, we witnessed weaker equity performance and a number of sharp style reversals. The market volatility was caused
by investors grappling with the idea of slowing economic growth and rising infl ation.
Having added a number of value stocks during the second half of 2020, activity has been more balanced from a style perspective in 2021.
This has resulted in a broadly balanced portfolio, causing the fund to perform poorly in the summer of 2021 as the growth style heavily
outperformed the value style. Overall, this stock-picking approach led to strong absolute and relative returns over the reporting year.
The biggest contribution came from advertising technology company Criteo ADS, which did well following the news that Google would
delay the phase-out of third-party cookies for its Chrome web browser. While off ering an immediate boost to forecasts, part of the reason
we owned the shares was that we believed it could be more resilient in a ‘post-cookie’ world. The company’s opportunity to prove this has
been delayed further. We also had good returns from Dutch wealth manager Van Lanschot Kempen after European regulators allowed
well-capitalised fi nancial fi rms to pay dividends once again, resulting in a high yield for investors. UK house builder Crest Nicholson was
aided by a strongly recovering UK housing market, thanks to eff ective government support during the COVID-19 crisis. Sweden-listed
online gaming company Kindred posted strong results due to US gambling market deregulation, although it gave back some ground at year
end following a more punitive than expected move by Dutch regulators. Befesa (waste recycling services) announced strong third-quarter
results. It also benefi ted from rising zinc prices and a re-rating as the market began to understand the incredibly strong environmental story
underpinning the investment case.
Gaming company Stillfront was the fund’s biggest detractor, as the company’s results showed a meaningful impact of Apple’s privacy rule
changes. Apple is seeking to improve app tracking transparency by allowing users the option of not sharing their personal data and Stillfront
had forecast a smaller impact on its revenues. We added to the fund’s position during the latter part of the year, as the challenges the
company faces seemed better understood by the market. Other detractors at the stock level included Clinigen (due to a profi t warning) and
Plastic Omnium, which suff ered due to global semiconductor shortages.
New purchases included stainless steel producer Acerinox, which we bought in the market before topping up the position in a share
placement. Tariff s on Chinese steel have seen the market remain tight and the sell-down from Nippon Steel benefi ted the stock. We also
bought ASR Nederland, a Dutch mid-cap insurance company. Aside from the valuation, we liked its lower-than-average leverage and
the potential for market consolidation. We added French bottle manufacturer Verallia, UK energy utility company Centrica and UK food
ingredient company Tate & Lyle. We invested in Germany’s Friedrich Vorwerk, which provides services to the gas, electricity and nascent
hydrogen infrastructure industries. Other new purchases included C&C, a cider and beer manufacturer with exposure to a UK consumer
boasting record high savings ratios, and Biff a, a waste recycling company where we liked its green initiatives, especially its state-of-the-art
polyethylene terephthalate (PET) plastic bottle recycling facility in the UK’s County Durham. The plant processes PET plastic into high-
purity plastic pellets that can be used for a range of applications, ranging from food and beverage packaging to clothing. We took profi ts in
Switzerland-listed Comet due to fears about the maturity of the semiconductor cycle, UK-listed Grafton, which has benefi ted from the home
improvement trend, and UK bus operator National Express, after a dramatic recovery in its share price. We also sold Signify, as we were
concerned about component shortages and its susceptibility to profi t-taking after a very strong run. We also sold Avast, after it announced a
large merger.
While we will not have fi rm conclusions on the infl ation debate for some time, we are increasingly of the view that rising prices are here to
stay. With that in mind, we expect bond yields to trend higher (bond prices will trend lower), likely in a volatile manner, and remain wary of
long duration growth stocks trading on high valuations. We also expect the remainder of this year to be volatile for equities before a stronger
2022, when we expect GDP growth expectations to settle at a level above the average of the past decade.
49
Pan European Smaller Companies Fund
Investment objective and policy
The fund aims to provide a return, from a combination of capital growth and income over the long term (5 years or more).
The fund invests at least two-thirds of its assets in shares (equities) and equity-related securities of smaller companies, in any industry, in Europe (including UK). Companies will have their registered offi ce in or do most of their business (directly or through subsidiaries) in this region.
The fund is actively managed with reference to the Euromoney Europe Smaller Companies Index, which is broadly representative of the companies in which it may invest, as this can provide a useful comparator for assessing the fund’s performance. The Investment Manager has discretion to choose investments for the fund with weightings diff erent to the index or not in the index, but at times the fund may hold investments similar to the index.
Strategy
The Investment Manager focuses on meetings and calls with company management, along with the use of quantitative fi lters, to identify potential companies for investment. Emphasis is placed on the robustness of a company’s business model, an analysis of what drives the business, what its competitive advantage is, and the sustainability of returns. The fund maintains a well-diversifi ed portfolio of smaller companies but will also hold some companies regarded as medium sized. The liquidity of the company (the degree to which shares can be quickly bought or sold in the market at a price refl ecting its intrinsic value) is important in determining whether to invest and the size of the holding for the fund.
How sustainability risks are part of the investment process
The investments underlying this fi nancial product (referred to as the fund) do not take into account the EU criteria for environmentally sustainable economic activities, although the Management Company and the Investment Manager have agreed a decision making process that will apply to investment decisions relating to the fund as further detailed in the prospectus.
The likely impacts of sustainability risks on the returns of the fund
While the analysis of (Environmental, Social and Governance) ESG factors is an integral component across the Investment Manager’s investment capabilities and one of a number of inputs to the selection of investments and portfolio construction, the investment process of the Investment Manager is primarily designed to maximise long-term risk-adjusted returns for investors. Therefore, in managing the fund, the Investment Manager does not maximise portfolio alignment with sustainability risks as a separate goal in its own right nor does it precisely attribute the impact of ESG factors on returns for the fund.
Performance history (unaudited)
Fund & Benchmark 1 year to 1 year to 1 year to 1 year to 1 year to
30 Sep 17 30 Sep 18 30 Sep 19 30 Sep 20 30 Sep 21
% % % % %
Pan European Smaller Companies Fund H2 EUR (Net)* 26.09** (3.54)** (0.27)** 1.35** 49.02 Euromoney Europe Smaller Companies Index 20.29 2.17 (1.76) 0.89 39.87
Class H2 EUR is disclosed as it is the representative share class.
* The representative share class has changed from the R€ Acc share class to the H2 EUR share class with eff ect from August 2021.** The performance history has been restated to refl ect the H2 EUR share class. Past performance is not a guide to future performance. The performance data does not take account of the commissions and costs incurred on the
issue and redemption of shares.
50
Pan European Smaller Companies Fund
Statement of Net Assets
As at 30 September 2021Notes EUR
Assets
Investment in securities at market value 3 97,306,248 Cash at bank 12 340,005 Interest and dividends receivable 3 80,012 Subscriptions receivable 59,102 Receivable for investments sold 5,703 Unrealised gain on contracts for diff erence 3 -Unrealised gain on futures contracts 3 -Unrealised gain on forward foreign exchange contracts 3 80,880 Purchased option contracts at market value 3 -Swap contracts at market value 3 -Other assets 192,796 Management fee rebate -Total assets 98,064,746
Liabilities
Bank overdraft 12 -Payable for investments purchased 97,228 Taxes and expenses payable 294,534 Redemptions payable 28,137 Unrealised loss on contracts for diff erence 3 -Unrealised loss on futures contracts 3 -Unrealised loss on forward foreign exchange contracts 3 2,676 Sold option contracts at market value 3 -Swap contracts at market value 3 -Dividends payable to shareholders 2,492 Interest and dividends payable on CFD -Other liabilities -Total liabilities 425,067
Net assets at the end of the year 97,639,679
Statement of Operations
For the year from 1 October 2020 to 30 September 2021Notes EUR
Income
Dividend income (net of withholding tax) 3 1,788,505 Bond interest income 3 -Interest on certifi cates of deposit 3 -Derivative income 3 398 Interest received on contracts for diff erence 3 -Other income 3, 13 15,890 Total income 1,804,793
Expenses
Management fees 6, 14 1,284,742 Administration, registrar and transfer agent fees 6 49,631 Custodian fees 6 23,623 Shareholder servicing fees and initial sales charges 6, 14 16,348 Depositary fees 6 6,181 Derivative expenses 3 -Interest paid on contracts for diff erence 3 -Performance fees 6 -Taxation ("taxe d'abonnement") 7 39,162 Other expenses 6 18,098 Total expenses 1,437,785
Net income from investments 367,008
Net realised gain/(loss)
Net realised gain on investment securities 3 17,854,682 Net realised gain/loss on contracts for diff erence 3 -Net realised gain/loss on futures contracts 3 -Net realised gain/loss on swap contracts 3 -Net realised gain/loss on options contracts 3 -Net realised gain on forward foreign exchange contracts 3 86,326 Net realised gain on currency exchange 72,147
Net realised gain on investments and derivatives 18,013,155
Net change in unrealised appreciation/depreciation
Change in net unrealised appreciation/depreciation on investments 3 12,875,914 Change in net unrealised appreciation/depreciation on contracts for diff erence 3 -Change in net unrealised appreciation/depreciation on futures contracts 3 -Change in net unrealised appreciation/depreciation on swap contracts 3 -Change in net unrealised appreciation/depreciation on options contracts 3 -Change in net unrealised appreciation/depreciation on forward foreign exchange contracts 3 42,533 Change in net unrealised appreciation/depreciation on currency exchange (56) Change in unrealised appreciation/depreciation on investments and derivatives 12,918,391
Net increase in assets as a result of operations 31,298,554
The accompanying notes form an integral part of these fi nancial statements.
51
Pan European Smaller Companies Fund
Share Transactions
For the year from 1 October 2020 to 30 September 2021A1 EUR A2 EUR A2 HUSD H2 EUR H2 HUSD I2 EUR
Shares outstanding at the beginning of the year 96,392.69 3,053,311.30 238,295.04 1,291,359.13 250.00 366,714.91Shares issued during the year 59,120.97 967,587.85 69,122.53 521,031.94 - 3,225,975.85Shares redeemed during the year (17,509.52) (1,204,480.99) (30,753.77) (1,282,203.14) - (1,970,224.24)Shares outstanding at the end of the year 138,004.14 2,816,418.16 276,663.80 530,187.93 250.00 1,622,466.52
Equivalent to a net asset value per share of: 19.88 21.30 19.78 11.84 16.21 12.20
X2 EUR
Shares outstanding at the beginning of the year 172,978.77Shares issued during the year 88,548.24Shares redeemed during the year (48,486.11)Shares outstanding at the end of the year 213,040.90
Equivalent to a net asset value per share of: 19.32
Net Asset Value Summary
Net Asset Value Per ShareAs at As at As at As at As at As at
30 Sep 19 30 Sep 20 30 Sep 21 30 Sep 19 30 Sep 20 30 Sep 21
EUR 121,339,905 EUR 63,497,191 EUR 97,639,679 A1 EUR 13.38 13.46 19.88A2 EUR 14.31 14.40 21.30
A2 HUSD 12.89 13.24 19.78H2 EUR 7.84 7.95 11.84
H2 HUSD 10.40 10.75 16.21I2 EUR 8.11 8.20 12.20
X2 EUR 13.12 13.13 19.32
Statement of Changes in Net Assets
For the year from 1 October 2020 to 30 September 2021EUR Notes EUR
Net assets at the beginning of the year 63,497,191 Proceeds from shares issued 68,376,258 Net income from investments 367,008 Payments for shares redeemed (65,386,227) Net realised gain on investments and derivatives 18,013,155 Net equalisation (paid)/received 10 (143,605) Change in unrealised appreciation/depreciation on investments and derivatives
12,918,391 Dividend distributions 11 (2,492)
Net assets at the end of the year 97,639,679
Total expense ratio (TER) (unaudited)
Dividend reinvestment /dividend
distribution per share
30 Sep 19 30 Sep 20 30 Sep 21 Pay date 11 Nov 21
A1 EUR 1.66% 1.70% 1.65% A1 EUR 0.018057 A2 EUR 1.65% 1.70% 1.65% A2 EUR 0.020281 A2 HUSD 1.66% 1.71% 1.65% A2 HUSD 0.015011 H2 EUR 0.91% 0.95% 0.91% H2 EUR 0.089627 H2 HUSD 0.91% 0.95% 0.91% H2 HUSD 0.125766 I2 EUR 1.12% 1.14% 1.09% I2 EUR 0.088881 X2 EUR 2.15% 2.21% 2.15% X2 EUR n/a
TER is calculated in accordance with AMAS (Asset Management Association Switzerland).SFAMA (Swiss Fund and Asset Management Association) and AMP (Asset Management Platform) merged to form AMAS in October 2020.The fund is not subject to performance fees.
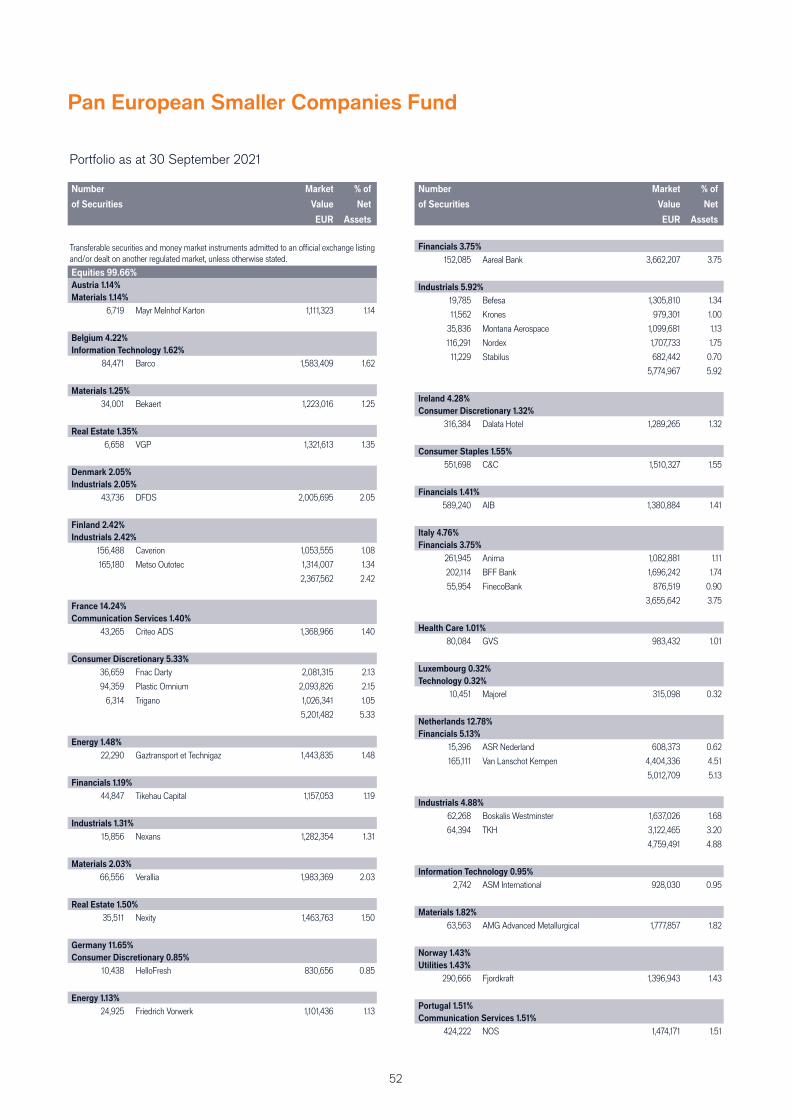
52
Pan European Smaller Companies Fund
Portfolio as at 30 September 2021 (continued)
Number
of Securities
Market
Value
EUR
% of
Net
Assets
Transferable securities and money market instruments admitted to an offi cial exchange listing and/or dealt on another regulated market, unless otherwise stated.
Equities 99.66%
Austria 1.14%
Materials 1.14%
6,719 Mayr Melnhof Karton 1,111,323 1.14
Belgium 4.22%
Information Technology 1.62%
84,471 Barco 1,583,409 1.62
Materials 1.25%
34,001 Bekaert 1,223,016 1.25
Real Estate 1.35%
6,658 VGP 1,321,613 1.35
Denmark 2.05%
Industrials 2.05%
43,736 DFDS 2,005,695 2.05
Finland 2.42%
Industrials 2.42%
156,488 Caverion 1,053,555 1.08
165,180 Metso Outotec 1,314,007 1.34
2,367,562 2.42
France 14.24%
Communication Services 1.40%
43,265 Criteo ADS 1,368,966 1.40
Consumer Discretionary 5.33%
36,659 Fnac Darty 2,081,315 2.13
94,359 Plastic Omnium 2,093,826 2.15
6,314 Trigano 1,026,341 1.05
5,201,482 5.33
Energy 1.48%
22,290 Gaztransport et Technigaz 1,443,835 1.48
Financials 1.19%
44,847 Tikehau Capital 1,157,053 1.19
Industrials 1.31%
15,856 Nexans 1,282,354 1.31
Materials 2.03%
66,556 Verallia 1,983,369 2.03
Real Estate 1.50%
35,511 Nexity 1,463,763 1.50
Germany 11.65%
Consumer Discretionary 0.85%
10,438 HelloFresh 830,656 0.85
Energy 1.13%
24,925 Friedrich Vorwerk 1,101,436 1.13
Portfolio as at 30 September 2021 (continued)
Number
of Securities
Market
Value
EUR
% of
Net
Assets
Financials 3.75%
152,085 Aareal Bank 3,662,207 3.75
Industrials 5.92%
19,785 Befesa 1,305,810 1.34
11,562 Krones 979,301 1.00
35,836 Montana Aerospace 1,099,681 1.13
116,291 Nordex 1,707,733 1.75
11,229 Stabilus 682,442 0.70
5,774,967 5.92
Ireland 4.28%
Consumer Discretionary 1.32%
316,384 Dalata Hotel 1,289,265 1.32
Consumer Staples 1.55%
551,698 C&C 1,510,327 1.55
Financials 1.41%
589,240 AIB 1,380,884 1.41
Italy 4.76%
Financials 3.75%
261,945 Anima 1,082,881 1.11
202,114 BFF Bank 1,696,242 1.74
55,954 FinecoBank 876,519 0.90
3,655,642 3.75
Health Care 1.01%
80,084 GVS 983,432 1.01
Luxembourg 0.32%
Technology 0.32%
10,451 Majorel 315,098 0.32
Netherlands 12.78%
Financials 5.13%
15,396 ASR Nederland 608,373 0.62
165,111 Van Lanschot Kempen 4,404,336 4.51
5,012,709 5.13
Industrials 4.88%
62,268 Boskalis Westminster 1,637,026 1.68
64,394 TKH 3,122,465 3.20
4,759,491 4.88
Information Technology 0.95%
2,742 ASM International 928,030 0.95
Materials 1.82%
63,563 AMG Advanced Metallurgical 1,777,857 1.82
Norway 1.43%
Utilities 1.43%
290,666 Fjordkraft 1,396,943 1.43
Portugal 1.51%
Communication Services 1.51%
424,222 NOS 1,474,171 1.51
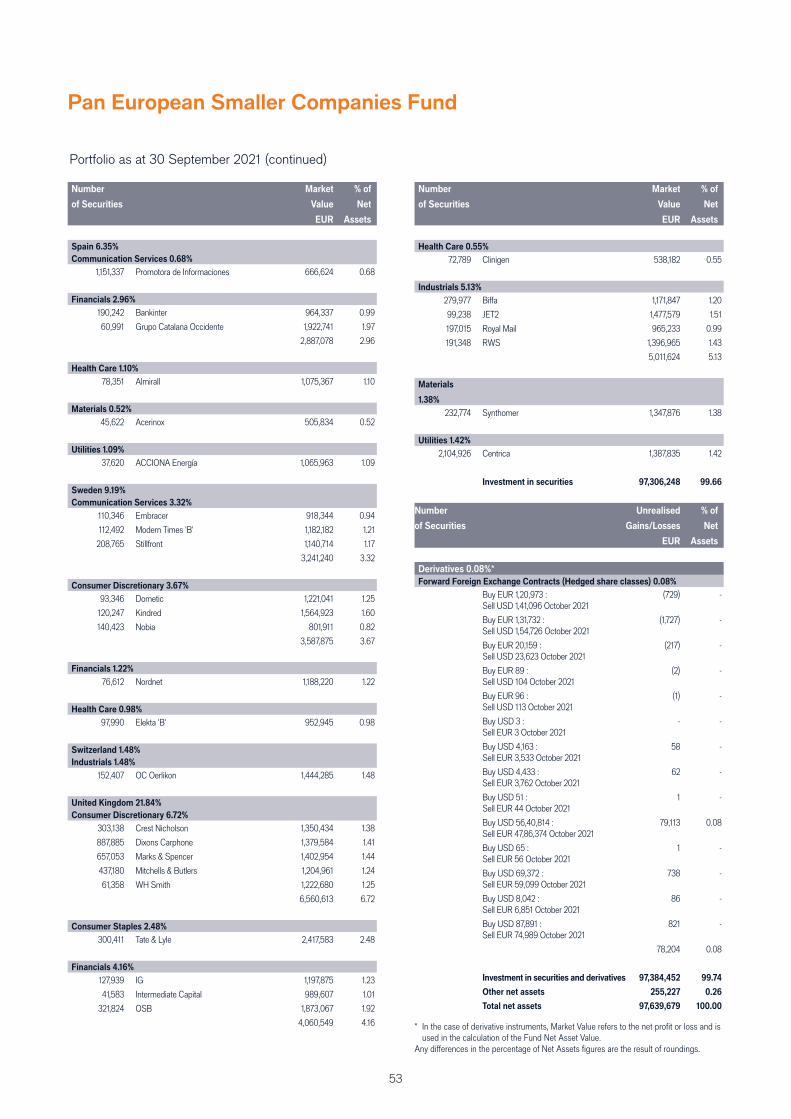
53
Pan European Smaller Companies Fund
Portfolio as at 30 September 2021 (continued)
Number
of Securities
Market
Value
EUR
% of
Net
Assets
Spain 6.35%
Communication Services 0.68%
1,151,337 Promotora de Informaciones 666,624 0.68
Financials 2.96%
190,242 Bankinter 964,337 0.99
60,991 Grupo Catalana Occidente 1,922,741 1.97
2,887,078 2.96
Health Care 1.10%
78,351 Almirall 1,075,367 1.10
Materials 0.52%
45,622 Acerinox 505,834 0.52
Utilities 1.09%
37,620 ACCIONA Energía 1,065,963 1.09
Sweden 9.19%
Communication Services 3.32%
110,346 Embracer 918,344 0.94
112,492 Modern Times 'B' 1,182,182 1.21
208,765 Stillfront 1,140,714 1.17
3,241,240 3.32
Consumer Discretionary 3.67%
93,346 Dometic 1,221,041 1.25
120,247 Kindred 1,564,923 1.60
140,423 Nobia 801,911 0.82
3,587,875 3.67
Financials 1.22%
76,612 Nordnet 1,188,220 1.22
Health Care 0.98%
97,990 Elekta 'B' 952,945 0.98
Switzerland 1.48%
Industrials 1.48%
152,407 OC Oerlikon 1,444,285 1.48
United Kingdom 21.84%
Consumer Discretionary 6.72%
303,138 Crest Nicholson 1,350,434 1.38
887,885 Dixons Carphone 1,379,584 1.41
657,053 Marks & Spencer 1,402,954 1.44
437,180 Mitchells & Butlers 1,204,961 1.24
61,358 WH Smith 1,222,680 1.25
6,560,613 6.72
Consumer Staples 2.48%
300,411 Tate & Lyle 2,417,583 2.48
Financials 4.16%
127,939 IG 1,197,875 1.23
41,583 Intermediate Capital 989,607 1.01
321,824 OSB 1,873,067 1.92
4,060,549 4.16
Portfolio as at 30 September 2021 (continued)
Number
of Securities
Market
Value
EUR
% of
Net
Assets
Health Care 0.55%
72,789 Clinigen 538,182 0.55
Industrials 5.13%
279,977 Biff a 1,171,847 1.20
99,238 JET2 1,477,579 1.51
197,015 Royal Mail 965,233 0.99
191,348 RWS 1,396,965 1.43
5,011,624 5.13
Materials
1.38%
232,774 Synthomer 1,347,876 1.38
Utilities 1.42%
2,104,926 Centrica 1,387,835 1.42
Investment in securities 97,306,248 99.66
Number
of Securities
Unrealised
Gains/Losses
EUR
% of
Net
Assets
Derivatives 0.08%*
Forward Foreign Exchange Contracts (Hedged share classes) 0.08%
Buy EUR 1,20,973 : Sell USD 1,41,096 October 2021
(729) -
Buy EUR 1,31,732 : Sell USD 1,54,726 October 2021
(1,727) -
Buy EUR 20,159 : Sell USD 23,623 October 2021
(217) -
Buy EUR 89 : Sell USD 104 October 2021
(2) -
Buy EUR 96 : Sell USD 113 October 2021
(1) -
Buy USD 3 : Sell EUR 3 October 2021
- -
Buy USD 4,163 : Sell EUR 3,533 October 2021
58 -
Buy USD 4,433 : Sell EUR 3,762 October 2021
62 -
Buy USD 51 : Sell EUR 44 October 2021
1 -
Buy USD 56,40,814 : Sell EUR 47,86,374 October 2021
79,113 0.08
Buy USD 65 : Sell EUR 56 October 2021
1 -
Buy USD 69,372 : Sell EUR 59,099 October 2021
738 -
Buy USD 8,042 : Sell EUR 6,851 October 2021
86 -
Buy USD 87,891 : Sell EUR 74,989 October 2021
821 -
78,204 0.08
Investment in securities and derivatives 97,384,452 99.74
Other net assets 255,227 0.26
Total net assets 97,639,679 100.00
* In the case of derivative instruments, Market Value refers to the net profi t or loss and is used in the calculation of the Fund Net Asset Value.
Any diff erences in the percentage of Net Assets fi gures are the result of roundings.
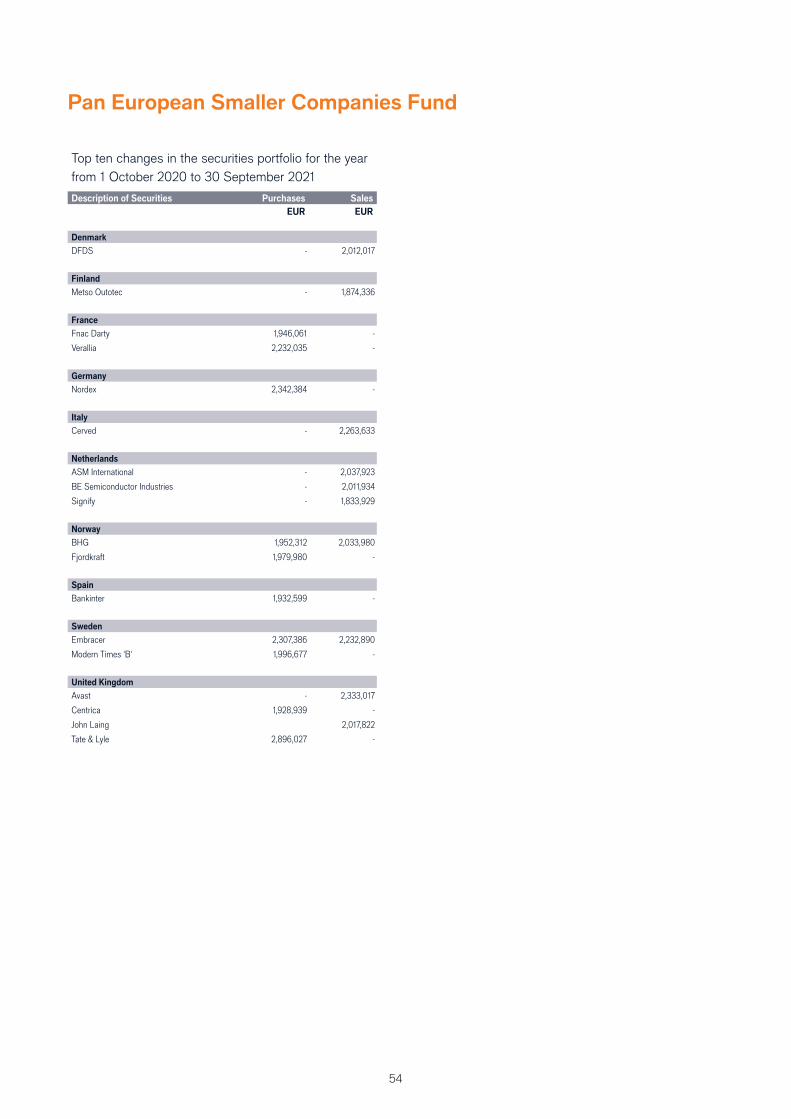
54
Pan European Smaller Companies Fund
Top ten changes in the securities portfolio for the year
from 1 October 2020 to 30 September 2021
Description of Securities Purchases Sales
EUR EUR
Denmark
DFDS - 2,012,017
Finland
Metso Outotec - 1,874,336
France
Fnac Darty 1,946,061 -
Verallia 2,232,035 -
Germany
Nordex 2,342,384 -
Italy
Cerved - 2,263,633
Netherlands
ASM International - 2,037,923
BE Semiconductor Industries - 2,011,934
Signify - 1,833,929
Norway
BHG 1,952,312 2,033,980
Fjordkraft 1,979,980 -
Spain
Bankinter 1,932,599 -
Sweden
Embracer 2,307,386 2,232,890
Modern Times 'B' 1,996,677 -
United Kingdom
Avast - 2,333,017
Centrica 1,928,939 -
John Laing 2,017,822
Tate & Lyle 2,896,027 -
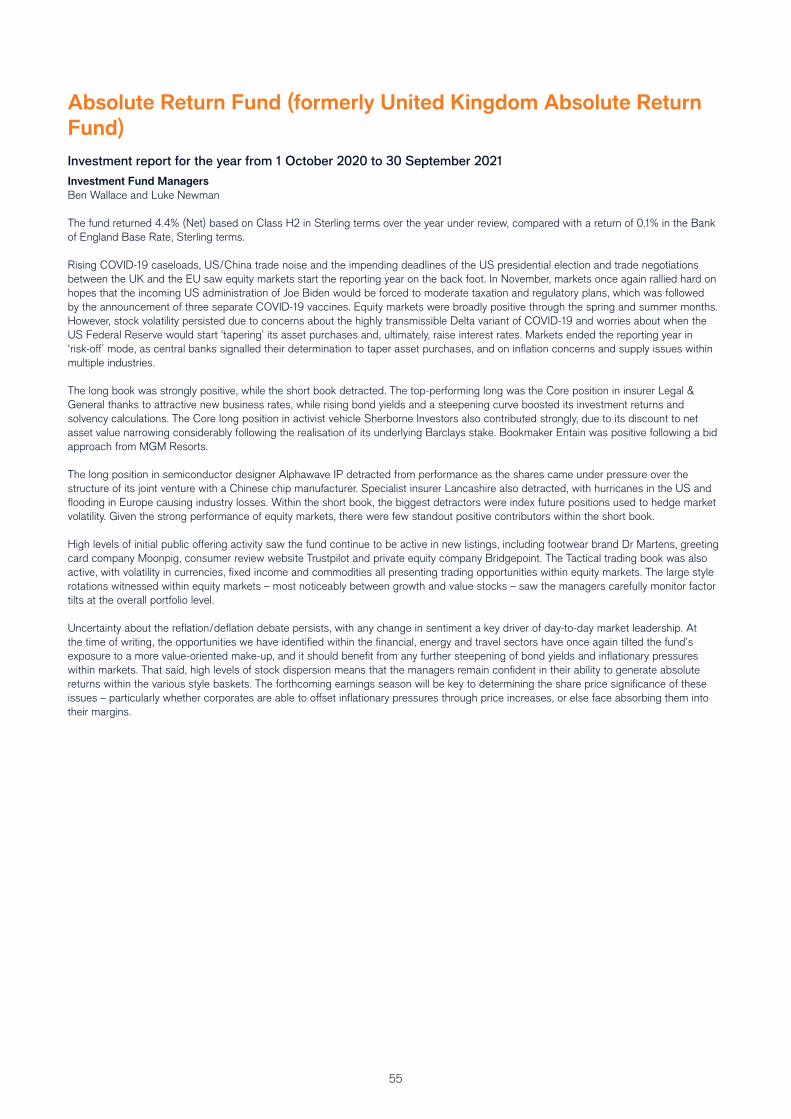
55
Absolute Return Fund (formerly United Kingdom Absolute Return
Fund)
Investment report for the year from 1 October 2020 to 30 September 2021
Investment Fund Managers
Ben Wallace and Luke Newman
The fund returned 4.4% (Net) based on Class H2 in Sterling terms over the year under review, compared with a return of 0.1% in the Bank
of England Base Rate, Sterling terms.
Rising COVID-19 caseloads, US/China trade noise and the impending deadlines of the US presidential election and trade negotiations
between the UK and the EU saw equity markets start the reporting year on the back foot. In November, markets once again rallied hard on
hopes that the incoming US administration of Joe Biden would be forced to moderate taxation and regulatory plans, which was followed
by the announcement of three separate COVID-19 vaccines. Equity markets were broadly positive through the spring and summer months.
However, stock volatility persisted due to concerns about the highly transmissible Delta variant of COVID-19 and worries about when the
US Federal Reserve would start ‘tapering’ its asset purchases and, ultimately, raise interest rates. Markets ended the reporting year in
‘risk-off ’ mode, as central banks signalled their determination to taper asset purchases, and on infl ation concerns and supply issues within
multiple industries.
The long book was strongly positive, while the short book detracted. The top-performing long was the Core position in insurer Legal &
General thanks to attractive new business rates, while rising bond yields and a steepening curve boosted its investment returns and
solvency calculations. The Core long position in activist vehicle Sherborne Investors also contributed strongly, due to its discount to net
asset value narrowing considerably following the realisation of its underlying Barclays stake. Bookmaker Entain was positive following a bid
approach from MGM Resorts.
The long position in semiconductor designer Alphawave IP detracted from performance as the shares came under pressure over the
structure of its joint venture with a Chinese chip manufacturer. Specialist insurer Lancashire also detracted, with hurricanes in the US and
fl ooding in Europe causing industry losses. Within the short book, the biggest detractors were index future positions used to hedge market
volatility. Given the strong performance of equity markets, there were few standout positive contributors within the short book.
High levels of initial public off ering activity saw the fund continue to be active in new listings, including footwear brand Dr Martens, greeting
card company Moonpig, consumer review website Trustpilot and private equity company Bridgepoint. The Tactical trading book was also
active, with volatility in currencies, fi xed income and commodities all presenting trading opportunities within equity markets. The large style
rotations witnessed within equity markets – most noticeably between growth and value stocks – saw the managers carefully monitor factor
tilts at the overall portfolio level.
Uncertainty about the refl ation/defl ation debate persists, with any change in sentiment a key driver of day-to-day market leadership. At
the time of writing, the opportunities we have identifi ed within the fi nancial, energy and travel sectors have once again tilted the fund’s
exposure to a more value-oriented make-up, and it should benefi t from any further steepening of bond yields and infl ationary pressures
within markets. That said, high levels of stock dispersion means that the managers remain confi dent in their ability to generate absolute
returns within the various style baskets. The forthcoming earnings season will be key to determining the share price signifi cance of these
issues – particularly whether corporates are able to off set infl ationary pressures through price increases, or else face absorbing them into
their margins.
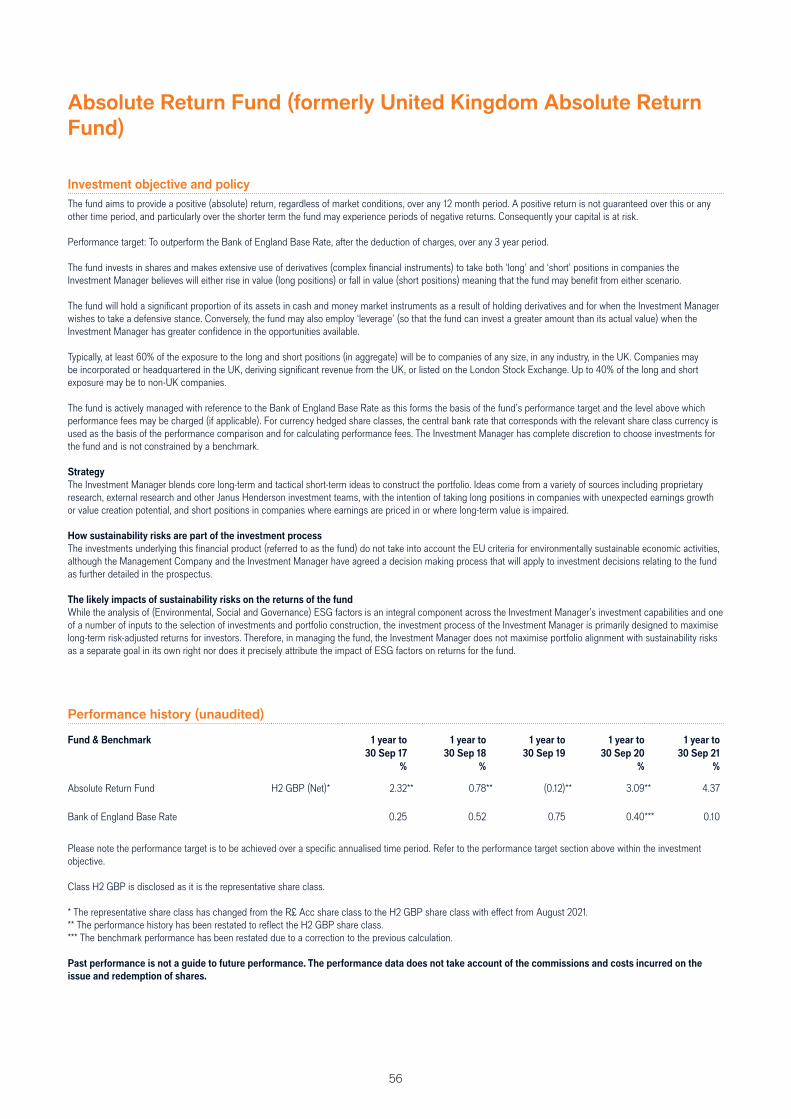
56
Absolute Return Fund (formerly United Kingdom Absolute Return
Fund)
Investment objective and policy
The fund aims to provide a positive (absolute) return, regardless of market conditions, over any 12 month period. A positive return is not guaranteed over this or any other time period, and particularly over the shorter term the fund may experience periods of negative returns. Consequently your capital is at risk.
Performance target: To outperform the Bank of England Base Rate, after the deduction of charges, over any 3 year period.
The fund invests in shares and makes extensive use of derivatives (complex fi nancial instruments) to take both ‘long’ and ‘short’ positions in companies the Investment Manager believes will either rise in value (long positions) or fall in value (short positions) meaning that the fund may benefi t from either scenario.
The fund will hold a signifi cant proportion of its assets in cash and money market instruments as a result of holding derivatives and for when the Investment Manager wishes to take a defensive stance. Conversely, the fund may also employ ‘leverage’ (so that the fund can invest a greater amount than its actual value) when the Investment Manager has greater confi dence in the opportunities available.
Typically, at least 60% of the exposure to the long and short positions (in aggregate) will be to companies of any size, in any industry, in the UK. Companies may be incorporated or headquartered in the UK, deriving signifi cant revenue from the UK, or listed on the London Stock Exchange. Up to 40% of the long and short exposure may be to non-UK companies.
The fund is actively managed with reference to the Bank of England Base Rate as this forms the basis of the fund’s performance target and the level above which performance fees may be charged (if applicable). For currency hedged share classes, the central bank rate that corresponds with the relevant share class currency is used as the basis of the performance comparison and for calculating performance fees. The Investment Manager has complete discretion to choose investments for the fund and is not constrained by a benchmark.
Strategy
The Investment Manager blends core long-term and tactical short-term ideas to construct the portfolio. Ideas come from a variety of sources including proprietary research, external research and other Janus Henderson investment teams, with the intention of taking long positions in companies with unexpected earnings growth or value creation potential, and short positions in companies where earnings are priced in or where long-term value is impaired.
How sustainability risks are part of the investment process
The investments underlying this fi nancial product (referred to as the fund) do not take into account the EU criteria for environmentally sustainable economic activities, although the Management Company and the Investment Manager have agreed a decision making process that will apply to investment decisions relating to the fund as further detailed in the prospectus.
The likely impacts of sustainability risks on the returns of the fund
While the analysis of (Environmental, Social and Governance) ESG factors is an integral component across the Investment Manager’s investment capabilities and one of a number of inputs to the selection of investments and portfolio construction, the investment process of the Investment Manager is primarily designed to maximise long-term risk-adjusted returns for investors. Therefore, in managing the fund, the Investment Manager does not maximise portfolio alignment with sustainability risks as a separate goal in its own right nor does it precisely attribute the impact of ESG factors on returns for the fund.
Performance history (unaudited)
Fund & Benchmark 1 year to 1 year to 1 year to 1 year to 1 year to
30 Sep 17 30 Sep 18 30 Sep 19 30 Sep 20 30 Sep 21
% % % %
Absolute Return Fund H2 GBP (Net)* 2.32** 0.78** (0.12)** 3.09** 4.37 Bank of England Base Rate 0.25 0.52 0.75 0.40*** 0.10
Please note the performance target is to be achieved over a specifi c annualised time period. Refer to the performance target section above within the investment objective.
Class H2 GBP is disclosed as it is the representative share class. * The representative share class has changed from the R£ Acc share class to the H2 GBP share class with eff ect from August 2021.** The performance history has been restated to refl ect the H2 GBP share class.*** The benchmark performance has been restated due to a correction to the previous calculation.
Past performance is not a guide to future performance. The performance data does not take account of the commissions and costs incurred on the
issue and redemption of shares.
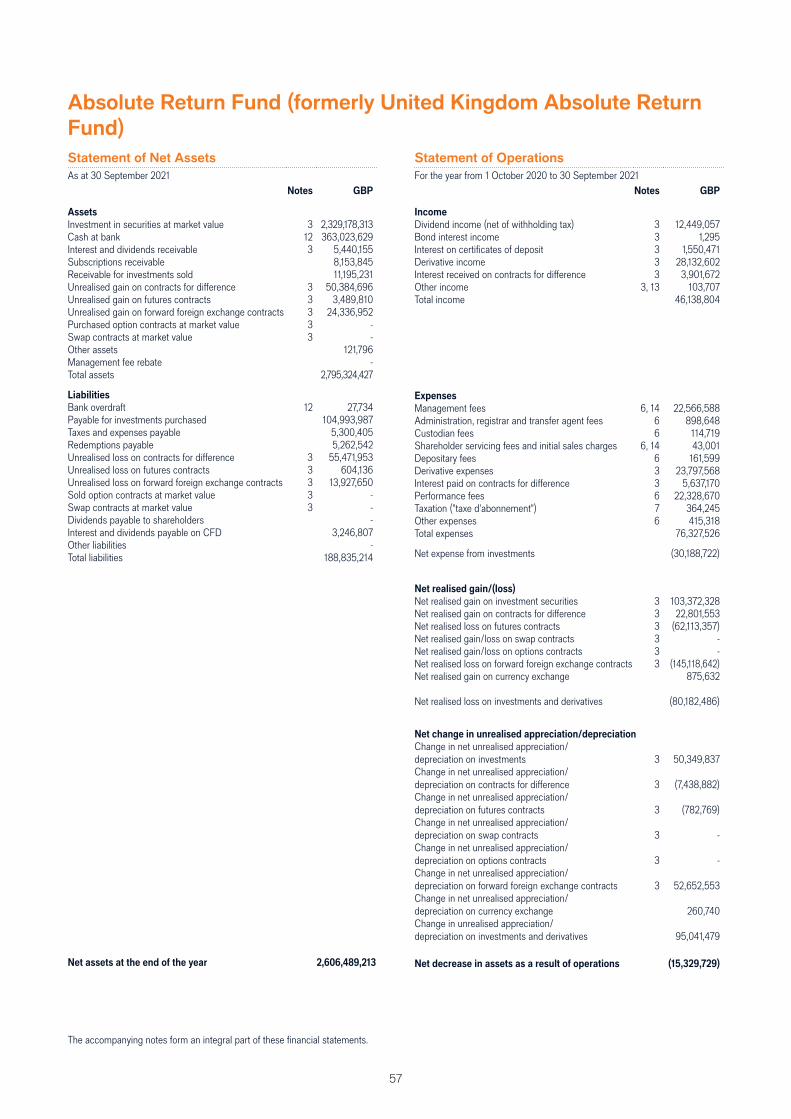
57
Absolute Return Fund (formerly United Kingdom Absolute Return
Fund)
Statement of Net Assets
As at 30 September 2021Notes GBP
Assets
Investment in securities at market value 3 2,329,178,313 Cash at bank 12 363,023,629 Interest and dividends receivable 3 5,440,155 Subscriptions receivable 8,153,845 Receivable for investments sold 11,195,231Unrealised gain on contracts for diff erence 3 50,384,696 Unrealised gain on futures contracts 3 3,489,810 Unrealised gain on forward foreign exchange contracts 3 24,336,952 Purchased option contracts at market value 3 -Swap contracts at market value 3 -Other assets 121,796 Management fee rebate -Total assets 2,795,324,427
Liabilities
Bank overdraft 12 27,734 Payable for investments purchased 104,993,987Taxes and expenses payable 5,300,405 Redemptions payable 5,262,542 Unrealised loss on contracts for diff erence 3 55,471,953 Unrealised loss on futures contracts 3 604,136 Unrealised loss on forward foreign exchange contracts 3 13,927,650 Sold option contracts at market value 3 -Swap contracts at market value 3 -Dividends payable to shareholders -Interest and dividends payable on CFD 3,246,807 Other liabilities -Total liabilities 188,835,214
Net assets at the end of the year 2,606,489,213
Statement of Operations
For the year from 1 October 2020 to 30 September 2021Notes GBP
Income
Dividend income (net of withholding tax) 3 12,449,057 Bond interest income 3 1,295 Interest on certifi cates of deposit 3 1,550,471 Derivative income 3 28,132,602 Interest received on contracts for diff erence 3 3,901,672 Other income 3, 13 103,707 Total income 46,138,804
Expenses
Management fees 6, 14 22,566,588 Administration, registrar and transfer agent fees 6 898,648 Custodian fees 6 114,719 Shareholder servicing fees and initial sales charges 6, 14 43,001 Depositary fees 6 161,599 Derivative expenses 3 23,797,568 Interest paid on contracts for diff erence 3 5,637,170 Performance fees 6 22,328,670 Taxation ("taxe d'abonnement") 7 364,245 Other expenses 6 415,318 Total expenses 76,327,526
Net expense from investments (30,188,722)
Net realised gain/(loss)
Net realised gain on investment securities 3 103,372,328 Net realised gain on contracts for diff erence 3 22,801,553 Net realised loss on futures contracts 3 (62,113,357) Net realised gain/loss on swap contracts 3 -Net realised gain/loss on options contracts 3 -Net realised loss on forward foreign exchange contracts 3 (145,118,642) Net realised gain on currency exchange 875,632
Net realised loss on investments and derivatives (80,182,486)
Net change in unrealised appreciation/depreciation
Change in net unrealised appreciation/depreciation on investments 3 50,349,837 Change in net unrealised appreciation/depreciation on contracts for diff erence 3 (7,438,882) Change in net unrealised appreciation/depreciation on futures contracts 3 (782,769) Change in net unrealised appreciation/depreciation on swap contracts 3 -Change in net unrealised appreciation/depreciation on options contracts 3 -Change in net unrealised appreciation/depreciation on forward foreign exchange contracts 3 52,652,553 Change in net unrealised appreciation/depreciation on currency exchange 260,740 Change in unrealised appreciation/depreciation on investments and derivatives 95,041,479
Net decrease in assets as a result of operations (15,329,729)
The accompanying notes form an integral part of these fi nancial statements.
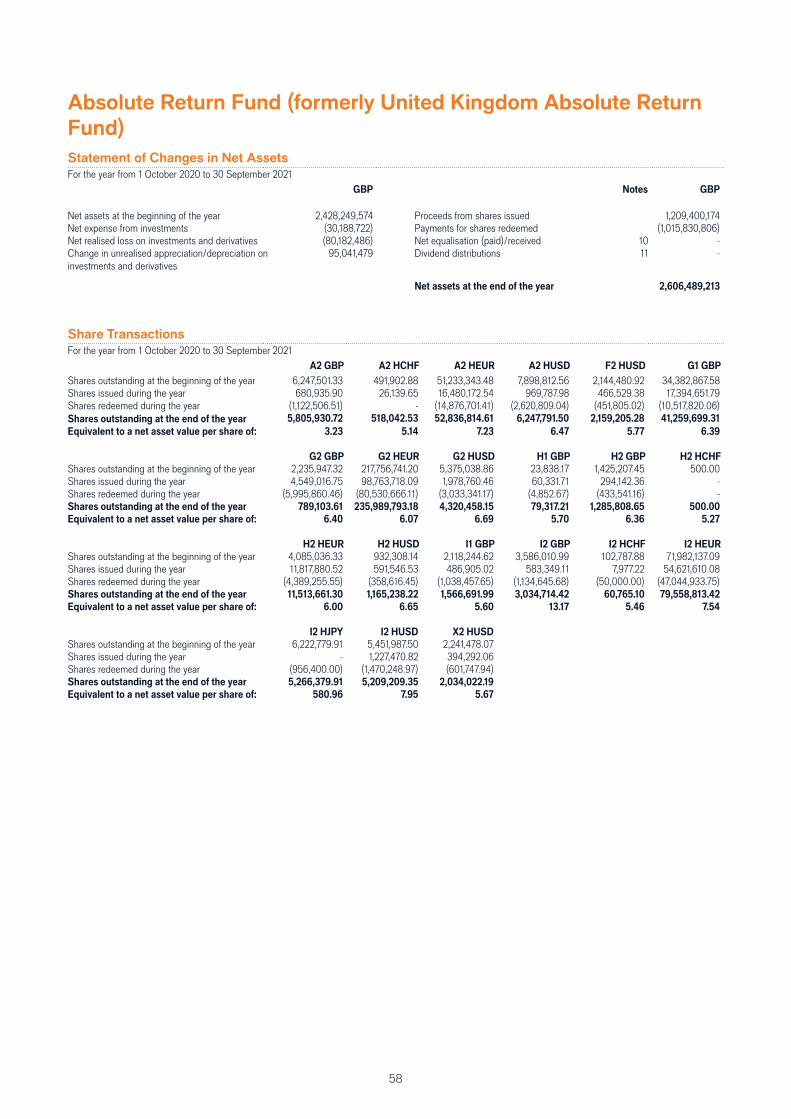
58
Absolute Return Fund (formerly United Kingdom Absolute Return
Fund)
Share Transactions
For the year from 1 October 2020 to 30 September 2021A2 GBP A2 HCHF A2 HEUR A2 HUSD F2 HUSD G1 GBP
Shares outstanding at the beginning of the year 6,247,501.33 491,902.88 51,233,343.48 7,898,812.56 2,144,480.92 34,382,867.58Shares issued during the year 680,935.90 26,139.65 16,480,172.54 969,787.98 466,529.38 17,394,651.79Shares redeemed during the year (1,122,506.51) - (14,876,701.41) (2,620,809.04) (451,805.02) (10,517,820.06)Shares outstanding at the end of the year 5,805,930.72 518,042.53 52,836,814.61 6,247,791.50 2,159,205.28 41,259,699.31
Equivalent to a net asset value per share of: 3.23 5.14 7.23 6.47 5.77 6.39
G2 GBP G2 HEUR G2 HUSD H1 GBP H2 GBP H2 HCHF
Shares outstanding at the beginning of the year 2,235,947.32 217,756,741.20 5,375,038.86 23,838.17 1,425,207.45 500.00Shares issued during the year 4,549,016.75 98,763,718.09 1,978,760.46 60,331.71 294,142.36 -Shares redeemed during the year (5,995,860.46) (80,530,666.11) (3,033,341.17) (4,852.67) (433,541.16) -Shares outstanding at the end of the year 789,103.61 235,989,793.18 4,320,458.15 79,317.21 1,285,808.65 500.00
Equivalent to a net asset value per share of: 6.40 6.07 6.69 5.70 6.36 5.27
H2 HEUR H2 HUSD I1 GBP I2 GBP I2 HCHF I2 HEUR
Shares outstanding at the beginning of the year 4,085,036.33 932,308.14 2,118,244.62 3,586,010.99 102,787.88 71,982,137.09Shares issued during the year 11,817,880.52 591,546.53 486,905.02 583,349.11 7,977.22 54,621,610.08Shares redeemed during the year (4,389,255.55) (358,616.45) (1,038,457.65) (1,134,645.68) (50,000.00) (47,044,933.75)Shares outstanding at the end of the year 11,513,661.30 1,165,238.22 1,566,691.99 3,034,714.42 60,765.10 79,558,813.42
Equivalent to a net asset value per share of: 6.00 6.65 5.60 13.17 5.46 7.54
I2 HJPY I2 HUSD X2 HUSD
Shares outstanding at the beginning of the year 6,222,779.91 5,451,987.50 2,241,478.07Shares issued during the year - 1,227,470.82 394,292.06Shares redeemed during the year (956,400.00) (1,470,248.97) (601,747.94)Shares outstanding at the end of the year 5,266,379.91 5,209,209.35 2,034,022.19
Equivalent to a net asset value per share of: 580.96 7.95 5.67
Statement of Changes in Net Assets
For the year from 1 October 2020 to 30 September 2021GBP Notes GBP
Net assets at the beginning of the year 2,428,249,574 Proceeds from shares issued 1,209,400,174 Net expense from investments (30,188,722) Payments for shares redeemed (1,015,830,806) Net realised loss on investments and derivatives (80,182,486) Net equalisation (paid)/received 10 -Change in unrealised appreciation/depreciation on investments and derivatives
95,041,479 Dividend distributions 11 -
Net assets at the end of the year 2,606,489,213
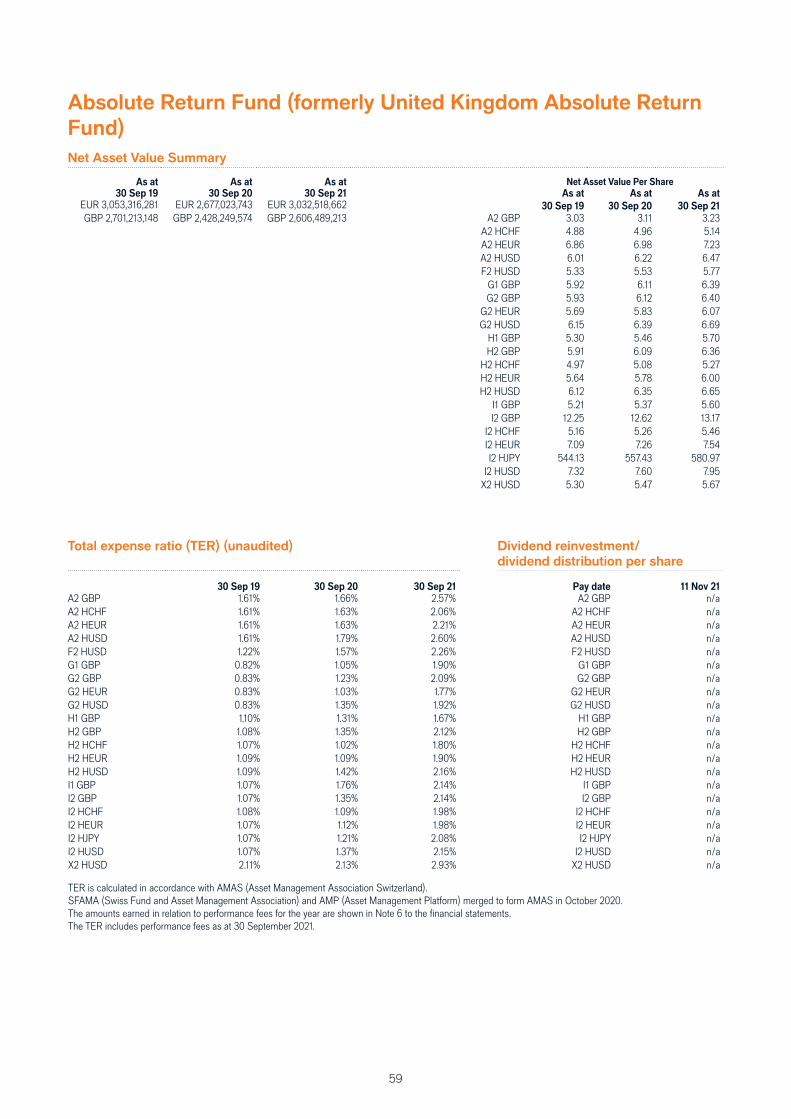
59
Total expense ratio (TER) (unaudited) Dividend reinvestment/
dividend distribution per share
30 Sep 19 30 Sep 20 30 Sep 21 Pay date 11 Nov 21
A2 GBP 1.61% 1.66% 2.57% A2 GBP n/aA2 HCHF 1.61% 1.63% 2.06% A2 HCHF n/aA2 HEUR 1.61% 1.63% 2.21% A2 HEUR n/aA2 HUSD 1.61% 1.79% 2.60% A2 HUSD n/aF2 HUSD 1.22% 1.57% 2.26% F2 HUSD n/aG1 GBP 0.82% 1.05% 1.90% G1 GBP n/aG2 GBP 0.83% 1.23% 2.09% G2 GBP n/aG2 HEUR 0.83% 1.03% 1.77% G2 HEUR n/aG2 HUSD 0.83% 1.35% 1.92% G2 HUSD n/aH1 GBP 1.10% 1.31% 1.67% H1 GBP n/aH2 GBP 1.08% 1.35% 2.12% H2 GBP n/aH2 HCHF 1.07% 1.02% 1.80% H2 HCHF n/aH2 HEUR 1.09% 1.09% 1.90% H2 HEUR n/aH2 HUSD 1.09% 1.42% 2.16% H2 HUSD n/aI1 GBP 1.07% 1.76% 2.14% I1 GBP n/aI2 GBP 1.07% 1.35% 2.14% I2 GBP n/aI2 HCHF 1.08% 1.09% 1.98% I2 HCHF n/aI2 HEUR 1.07% 1.12% 1.98% I2 HEUR n/aI2 HJPY 1.07% 1.21% 2.08% I2 HJPY n/aI2 HUSD 1.07% 1.37% 2.15% I2 HUSD n/aX2 HUSD 2.11% 2.13% 2.93% X2 HUSD n/a
TER is calculated in accordance with AMAS (Asset Management Association Switzerland).SFAMA (Swiss Fund and Asset Management Association) and AMP (Asset Management Platform) merged to form AMAS in October 2020.The amounts earned in relation to performance fees for the year are shown in Note 6 to the fi nancial statements.The TER includes performance fees as at 30 September 2021.
Absolute Return Fund (formerly United Kingdom Absolute Return
Fund)
Net Asset Value Summary
As at As at As at Net Asset Value Per Share
30 Sep 19 30 Sep 20 30 Sep 21 As at As at As at EUR 3,053,316,281 EUR 2,677,023,743 EUR 3,032,518,662 30 Sep 19 30 Sep 20 30 Sep 21
GBP 2,701,213,148 GBP 2,428,249,574 GBP 2,606,489,213 A2 GBP 3.03 3.11 3.23A2 HCHF 4.88 4.96 5.14A2 HEUR 6.86 6.98 7.23A2 HUSD 6.01 6.22 6.47F2 HUSD 5.33 5.53 5.77
G1 GBP 5.92 6.11 6.39G2 GBP 5.93 6.12 6.40
G2 HEUR 5.69 5.83 6.07G2 HUSD 6.15 6.39 6.69
H1 GBP 5.30 5.46 5.70H2 GBP 5.91 6.09 6.36
H2 HCHF 4.97 5.08 5.27H2 HEUR 5.64 5.78 6.00H2 HUSD 6.12 6.35 6.65
I1 GBP 5.21 5.37 5.60I2 GBP 12.25 12.62 13.17
I2 HCHF 5.16 5.26 5.46I2 HEUR 7.09 7.26 7.54I2 HJPY 544.13 557.43 580.97
I2 HUSD 7.32 7.60 7.95X2 HUSD 5.30 5.47 5.67
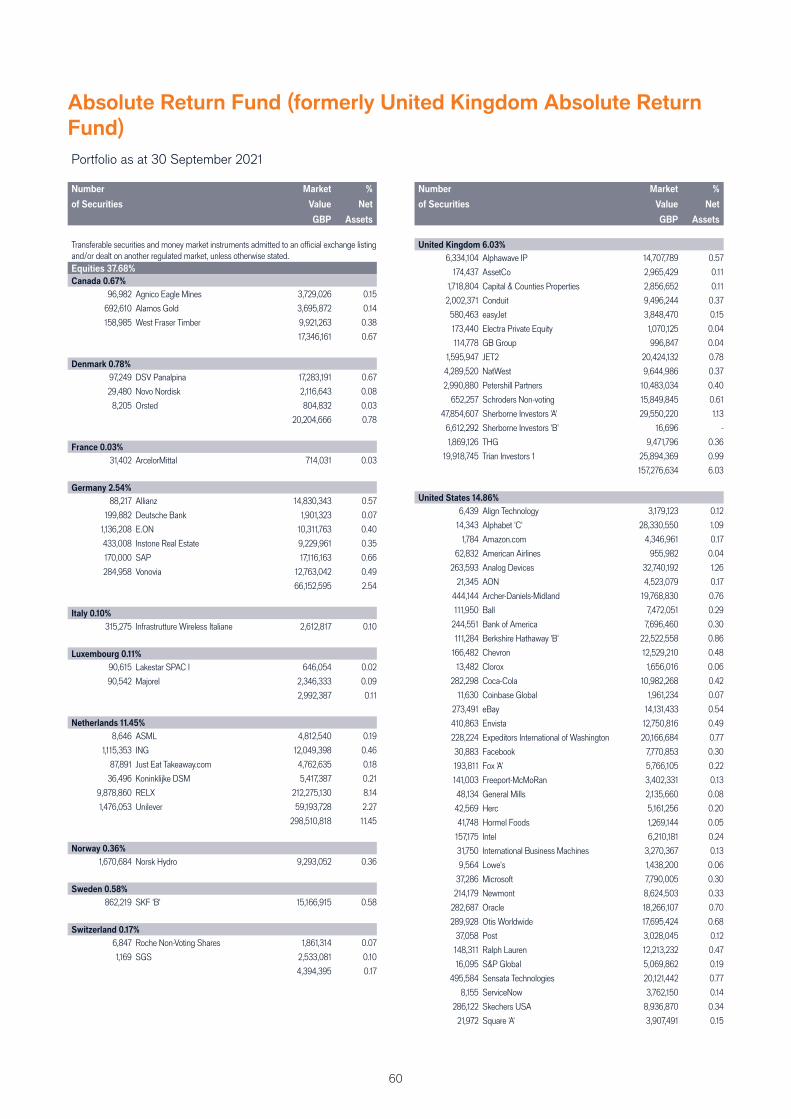
60
Absolute Return Fund (formerly United Kingdom Absolute Return
Fund)
Portfolio as at 30 September 2021 (continued)
Number
of Securities
Market
Value
GBP
%
Net
Assets
Transferable securities and money market instruments admitted to an offi cial exchange listing and/or dealt on another regulated market, unless otherwise stated.Equities 37.68%
Canada 0.67%
96,982 Agnico Eagle Mines 3,729,026 0.15
692,610 Alamos Gold 3,695,872 0.14
158,985 West Fraser Timber 9,921,263 0.38
17,346,161 0.67
Denmark 0.78%
97,249 DSV Panalpina 17,283,191 0.67
29,480 Novo Nordisk 2,116,643 0.08
8,205 Orsted 804,832 0.03
20,204,666 0.78
France 0.03%
31,402 ArcelorMittal 714,031 0.03
Germany 2.54%
88,217 Allianz 14,830,343 0.57
199,882 Deutsche Bank 1,901,323 0.07
1,136,208 E.ON 10,311,763 0.40
433,008 Instone Real Estate 9,229,961 0.35
170,000 SAP 17,116,163 0.66
284,958 Vonovia 12,763,042 0.49
66,152,595 2.54
Italy 0.10%
315,275 Infrastrutture Wireless Italiane 2,612,817 0.10
Luxembourg 0.11%
90,615 Lakestar SPAC I 646,054 0.02
90,542 Majorel 2,346,333 0.09
2,992,387 0.11
Netherlands 11.45%
8,646 ASML 4,812,540 0.19
1,115,353 ING 12,049,398 0.46
87,891 Just Eat Takeaway.com 4,762,635 0.18
36,496 Koninklijke DSM 5,417,387 0.21
9,878,860 RELX 212,275,130 8.14
1,476,053 Unilever 59,193,728 2.27
298,510,818 11.45
Norway 0.36%
1,670,684 Norsk Hydro 9,293,052 0.36
Sweden 0.58%
862,219 SKF 'B' 15,166,915 0.58
Switzerland 0.17%
6,847 Roche Non-Voting Shares 1,861,314 0.07
1,169 SGS 2,533,081 0.10
4,394,395 0.17
Portfolio as at 30 September 2021 (continued)
Number
of Securities
Market
Value
GBP
%
Net
Assets
United Kingdom 6.03%
6,334,104 Alphawave IP 14,707,789 0.57
174,437 AssetCo 2,965,429 0.11
1,718,804 Capital & Counties Properties 2,856,652 0.11
2,002,371 Conduit 9,496,244 0.37
580,463 easyJet 3,848,470 0.15
173,440 Electra Private Equity 1,070,125 0.04
114,778 GB Group 996,847 0.04
1,595,947 JET2 20,424,132 0.78
4,289,520 NatWest 9,644,986 0.37
2,990,880 Petershill Partners 10,483,034 0.40
652,257 Schroders Non-voting 15,849,845 0.61
47,854,607 Sherborne Investors 'A' 29,550,220 1.13
6,612,292 Sherborne Investors 'B' 16,696 -
1,869,126 THG 9,471,796 0.36
19,918,745 Trian Investors 1 25,894,369 0.99
157,276,634 6.03
United States 14.86%
6,439 Align Technology 3,179,123 0.12
14,343 Alphabet 'C' 28,330,550 1.09
1,784 Amazon.com 4,346,961 0.17
62,832 American Airlines 955,982 0.04
263,593 Analog Devices 32,740,192 1.26
21,345 AON 4,523,079 0.17
444,144 Archer-Daniels-Midland 19,768,830 0.76
111,950 Ball 7,472,051 0.29
244,551 Bank of America 7,696,460 0.30
111,284 Berkshire Hathaway 'B' 22,522,558 0.86
166,482 Chevron 12,529,210 0.48
13,482 Clorox 1,656,016 0.06
282,298 Coca-Cola 10,982,268 0.42
11,630 Coinbase Global 1,961,234 0.07
273,491 eBay 14,131,433 0.54
410,863 Envista 12,750,816 0.49
228,224 Expeditors International of Washington 20,166,684 0.77
30,883 Facebook 7,770,853 0.30
193,811 Fox 'A' 5,766,105 0.22
141,003 Freeport-McMoRan 3,402,331 0.13
48,134 General Mills 2,135,660 0.08
42,569 Herc 5,161,256 0.20
41,748 Hormel Foods 1,269,144 0.05
157,175 Intel 6,210,181 0.24
31,750 International Business Machines 3,270,367 0.13
9,564 Lowe's 1,438,200 0.06
37,286 Microsoft 7,790,005 0.30
214,179 Newmont 8,624,503 0.33
282,687 Oracle 18,266,107 0.70
289,928 Otis Worldwide 17,695,424 0.68
37,058 Post 3,028,045 0.12
148,311 Ralph Lauren 12,213,232 0.47
16,095 S&P Global 5,069,862 0.19
495,584 Sensata Technologies 20,121,442 0.77
8,155 ServiceNow 3,762,150 0.14
286,122 Skechers USA 8,936,870 0.34
21,972 Square 'A' 3,907,491 0.15
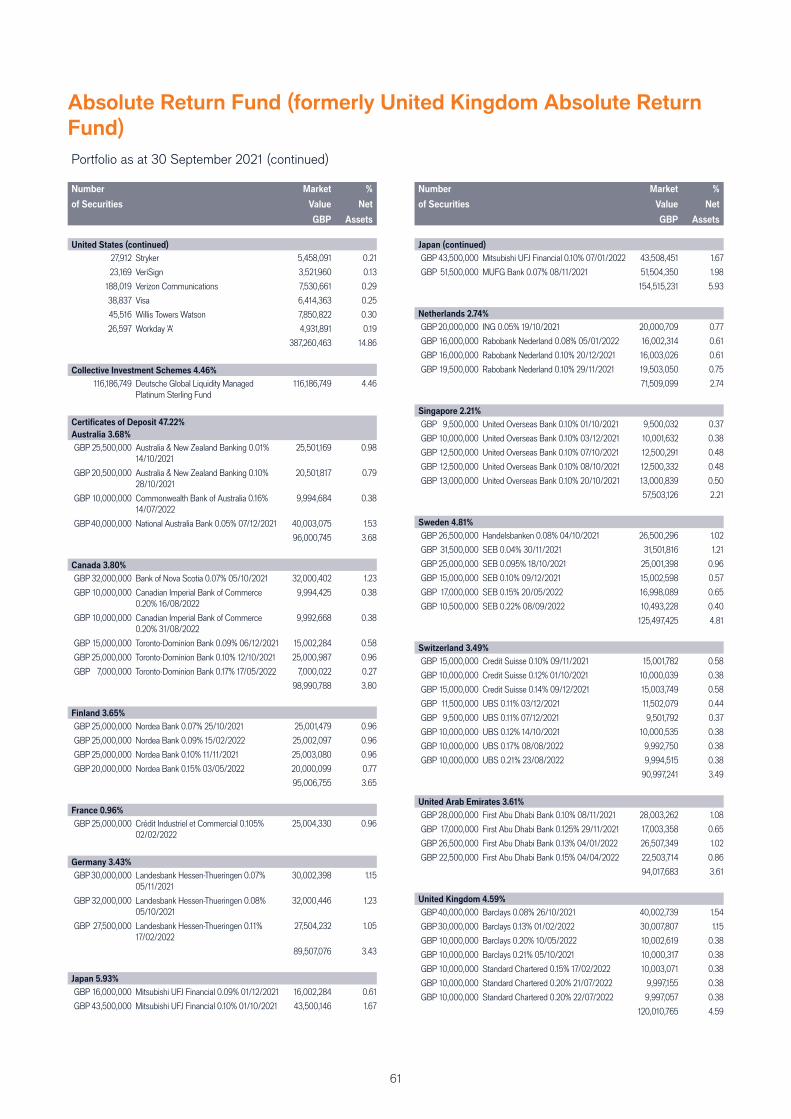
61
Absolute Return Fund (formerly United Kingdom Absolute Return
Fund)
Portfolio as at 30 September 2021 (continued)
Number
of Securities
Market
Value
GBP
%
Net
Assets
United States (continued)
27,912 Stryker 5,458,091 0.21
23,169 VeriSign 3,521,960 0.13
188,019 Verizon Communications 7,530,661 0.29
38,837 Visa 6,414,363 0.25
45,516 Willis Towers Watson 7,850,822 0.30
26,597 Workday 'A' 4,931,891 0.19
387,260,463 14.86
Collective Investment Schemes 4.46%
116,186,749 Deutsche Global Liquidity Managed Platinum Sterling Fund
116,186,749 4.46
Certifi cates of Deposit 47.22%
Australia 3.68%
GBP 25,500,000 Australia & New Zealand Banking 0.01% 14/10/2021
25,501,169 0.98
GBP 20,500,000 Australia & New Zealand Banking 0.10% 28/10/2021
20,501,817 0.79
GBP 10,000,000 Commonwealth Bank of Australia 0.16% 14/07/2022
9,994,684 0.38
GBP40,000,000 National Australia Bank 0.05% 07/12/2021 40,003,075 1.53
96,000,745 3.68
Canada 3.80%
GBP 32,000,000 Bank of Nova Scotia 0.07% 05/10/2021 32,000,402 1.23
GBP 10,000,000 Canadian Imperial Bank of Commerce 0.20% 16/08/2022
9,994,425 0.38
GBP 10,000,000 Canadian Imperial Bank of Commerce 0.20% 31/08/2022
9,992,668 0.38
GBP 15,000,000 Toronto-Dominion Bank 0.09% 06/12/2021 15,002,284 0.58
GBP 25,000,000 Toronto-Dominion Bank 0.10% 12/10/2021 25,000,987 0.96
GBP 7,000,000 Toronto-Dominion Bank 0.17% 17/05/2022 7,000,022 0.27
98,990,788 3.80
Finland 3.65%
GBP 25,000,000 Nordea Bank 0.07% 25/10/2021 25,001,479 0.96
GBP 25,000,000 Nordea Bank 0.09% 15/02/2022 25,002,097 0.96
GBP 25,000,000 Nordea Bank 0.10% 11/11/2021 25,003,080 0.96
GBP20,000,000 Nordea Bank 0.15% 03/05/2022 20,000,099 0.77
95,006,755 3.65
France 0.96%
GBP 25,000,000 Crédit Industriel et Commercial 0.105% 02/02/2022
25,004,330 0.96
Germany 3.43%
GBP30,000,000 Landesbank Hessen-Thueringen 0.07% 05/11/2021
30,002,398 1.15
GBP 32,000,000 Landesbank Hessen-Thueringen 0.08% 05/10/2021
32,000,446 1.23
GBP 27,500,000 Landesbank Hessen-Thueringen 0.11% 17/02/2022
27,504,232 1.05
89,507,076 3.43
Japan 5.93%
GBP 16,000,000 Mitsubishi UFJ Financial 0.09% 01/12/2021 16,002,284 0.61
GBP 43,500,000 Mitsubishi UFJ Financial 0.10% 01/10/2021 43,500,146 1.67
Portfolio as at 30 September 2021 (continued)
Number
of Securities
Market
Value
GBP
%
Net
Assets
Japan (continued)
GBP 43,500,000 Mitsubishi UFJ Financial 0.10% 07/01/2022 43,508,451 1.67
GBP 51,500,000 MUFG Bank 0.07% 08/11/2021 51,504,350 1.98
154,515,231 5.93
Netherlands 2.74%
GBP20,000,000 ING 0.05% 19/10/2021 20,000,709 0.77
GBP 16,000,000 Rabobank Nederland 0.08% 05/01/2022 16,002,314 0.61
GBP 16,000,000 Rabobank Nederland 0.10% 20/12/2021 16,003,026 0.61
GBP 19,500,000 Rabobank Nederland 0.10% 29/11/2021 19,503,050 0.75
71,509,099 2.74
Singapore 2.21%
GBP 9,500,000 United Overseas Bank 0.10% 01/10/2021 9,500,032 0.37
GBP 10,000,000 United Overseas Bank 0.10% 03/12/2021 10,001,632 0.38
GBP 12,500,000 United Overseas Bank 0.10% 07/10/2021 12,500,291 0.48
GBP 12,500,000 United Overseas Bank 0.10% 08/10/2021 12,500,332 0.48
GBP 13,000,000 United Overseas Bank 0.10% 20/10/2021 13,000,839 0.50
57,503,126 2.21
Sweden 4.81%
GBP 26,500,000 Handelsbanken 0.08% 04/10/2021 26,500,296 1.02
GBP 31,500,000 SEB 0.04% 30/11/2021 31,501,816 1.21
GBP 25,000,000 SEB 0.095% 18/10/2021 25,001,398 0.96
GBP 15,000,000 SEB 0.10% 09/12/2021 15,002,598 0.57
GBP 17,000,000 SEB 0.15% 20/05/2022 16,998,089 0.65
GBP 10,500,000 SEB 0.22% 08/09/2022 10,493,228 0.40
125,497,425 4.81
Switzerland 3.49%
GBP 15,000,000 Credit Suisse 0.10% 09/11/2021 15,001,782 0.58
GBP 10,000,000 Credit Suisse 0.12% 01/10/2021 10,000,039 0.38
GBP 15,000,000 Credit Suisse 0.14% 09/12/2021 15,003,749 0.58
GBP 11,500,000 UBS 0.11% 03/12/2021 11,502,079 0.44
GBP 9,500,000 UBS 0.11% 07/12/2021 9,501,792 0.37
GBP 10,000,000 UBS 0.12% 14/10/2021 10,000,535 0.38
GBP 10,000,000 UBS 0.17% 08/08/2022 9,992,750 0.38
GBP 10,000,000 UBS 0.21% 23/08/2022 9,994,515 0.38
90,997,241 3.49
United Arab Emirates 3.61%
GBP 28,000,000 First Abu Dhabi Bank 0.10% 08/11/2021 28,003,262 1.08
GBP 17,000,000 First Abu Dhabi Bank 0.125% 29/11/2021 17,003,358 0.65
GBP 26,500,000 First Abu Dhabi Bank 0.13% 04/01/2022 26,507,349 1.02
GBP 22,500,000 First Abu Dhabi Bank 0.15% 04/04/2022 22,503,714 0.86
94,017,683 3.61
United Kingdom 4.59%
GBP40,000,000 Barclays 0.08% 26/10/2021 40,002,739 1.54
GBP30,000,000 Barclays 0.13% 01/02/2022 30,007,807 1.15
GBP 10,000,000 Barclays 0.20% 10/05/2022 10,002,619 0.38
GBP 10,000,000 Barclays 0.21% 05/10/2021 10,000,317 0.38
GBP 10,000,000 Standard Chartered 0.15% 17/02/2022 10,003,071 0.38
GBP 10,000,000 Standard Chartered 0.20% 21/07/2022 9,997,155 0.38
GBP 10,000,000 Standard Chartered 0.20% 22/07/2022 9,997,057 0.38
120,010,765 4.59
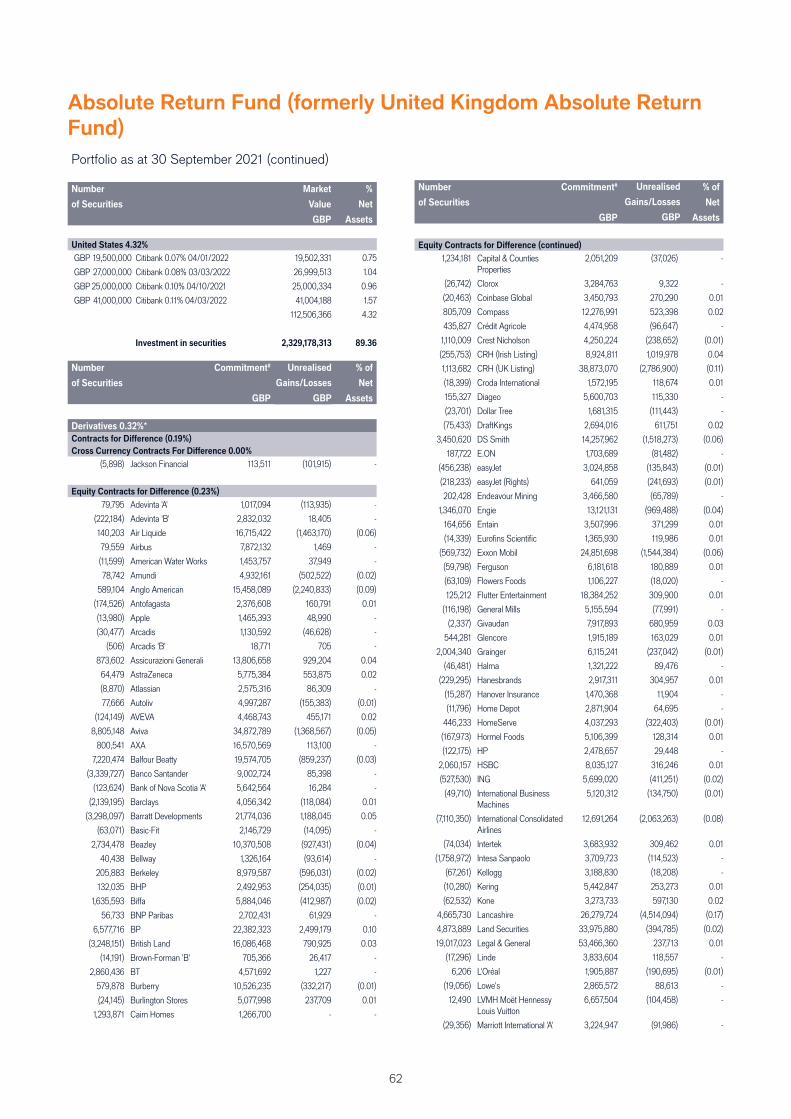
62
Absolute Return Fund (formerly United Kingdom Absolute Return
Fund)
Portfolio as at 30 September 2021 (continued)
Number
of Securities
Market
Value
GBP
%
Net
Assets
United States 4.32%
GBP 19,500,000 Citibank 0.07% 04/01/2022 19,502,331 0.75
GBP 27,000,000 Citibank 0.08% 03/03/2022 26,999,513 1.04
GBP 25,000,000 Citibank 0.10% 04/10/2021 25,000,334 0.96
GBP 41,000,000 Citibank 0.11% 04/03/2022 41,004,188 1.57
112,506,366 4.32
Investment in securities 2,329,178,313 89.36
Number
of Securities
Commitment#
GBP
Market
Value
GBP
% of
Net
Assets
Derivatives 0.32%*
Contracts for Diff erence (0.19%)
Cross Currency Contracts For Diff erence 0.00%
(5,898) Jackson Financial 113,511 (101,915) -
Equity Contracts for Diff erence (0.23%)
79,795 Adevinta 'A' 1,017,094 (113,935) -
(222,184) Adevinta 'B' 2,832,032 18,405 -
140,203 Air Liquide 16,715,422 (1,463,170) (0.06)
79,559 Airbus 7,872,132 1,469 -
(11,599) American Water Works 1,453,757 37,949 -
78,742 Amundi 4,932,161 (502,522) (0.02)
589,104 Anglo American 15,458,089 (2,240,833) (0.09)
(174,526) Antofagasta 2,376,608 160,791 0.01
(13,980) Apple 1,465,393 48,990 -
(30,477) Arcadis 1,130,592 (46,628) -
(506) Arcadis 'B' 18,771 705 -
873,602 Assicurazioni Generali 13,806,658 929,204 0.04
64,479 AstraZeneca 5,775,384 553,875 0.02
(8,870) Atlassian 2,575,316 86,309 -
77,666 Autoliv 4,997,287 (155,383) (0.01)
(124,149) AVEVA 4,468,743 455,171 0.02
8,805,148 Aviva 34,872,789 (1,368,567) (0.05)
800,541 AXA 16,570,569 113,100 -
7,220,474 Balfour Beatty 19,574,705 (859,237) (0.03)
(3,339,727) Banco Santander 9,002,724 85,398 -
(123,624) Bank of Nova Scotia 'A' 5,642,564 16,284 -
(2,139,195) Barclays 4,056,342 (118,084) 0.01
(3,298,097) Barratt Developments 21,774,036 1,188,045 0.05
(63,071) Basic-Fit 2,146,729 (14,095) -
2,734,478 Beazley 10,370,508 (927,431) (0.04)
40,438 Bellway 1,326,164 (93,614) -
205,883 Berkeley 8,979,587 (596,031) (0.02)
132,035 BHP 2,492,953 (254,035) (0.01)
1,635,593 Biff a 5,884,046 (412,987) (0.02)
56,733 BNP Paribas 2,702,431 61,929 -
6,577,716 BP 22,382,323 2,499,179 0.10
(3,248,151) British Land 16,086,468 790,925 0.03
(14,191) Brown-Forman 'B' 705,366 26,417 -
2,860,436 BT 4,571,692 1,227 -
579,878 Burberry 10,526,235 (332,217) (0.01)
(24,145) Burlington Stores 5,077,998 237,709 0.01
1,293,871 Cairn Homes 1,266,700 - -
Number
of Securities
Commitment#
GBP
Market
Value
GBP
% of
Net
Assets
Equity Contracts for Diff erence (continued)
1,234,181 Capital & Counties Properties
2,051,209 (37,026) -
(26,742) Clorox 3,284,763 9,322 -
(20,463) Coinbase Global 3,450,793 270,290 0.01
805,709 Compass 12,276,991 523,398 0.02
435,827 Crédit Agricole 4,474,958 (96,647) -
1,110,009 Crest Nicholson 4,250,224 (238,652) (0.01)
(255,753) CRH (Irish Listing) 8,924,811 1,019,978 0.04
1,113,682 CRH (UK Listing) 38,873,070 (2,786,900) (0.11)
(18,399) Croda International 1,572,195 118,674 0.01
155,327 Diageo 5,600,703 115,330 -
(23,701) Dollar Tree 1,681,315 (111,443) -
(75,433) DraftKings 2,694,016 611,751 0.02
3,450,620 DS Smith 14,257,962 (1,518,273) (0.06)
187,722 E.ON 1,703,689 (81,482) -
(456,238) easyJet 3,024,858 (135,843) (0.01)
(218,233) easyJet (Rights) 641,059 (241,693) (0.01)
202,428 Endeavour Mining 3,466,580 (65,789) -
1,346,070 Engie 13,121,131 (969,488) (0.04)
164,656 Entain 3,507,996 371,299 0.01
(14,339) Eurofi ns Scientifi c 1,365,930 119,986 0.01
(569,732) Exxon Mobil 24,851,698 (1,544,384) (0.06)
(59,798) Ferguson 6,181,618 180,889 0.01
(63,109) Flowers Foods 1,106,227 (18,020) -
125,212 Flutter Entertainment 18,384,252 309,900 0.01
(116,198) General Mills 5,155,594 (77,991) -
(2,337) Givaudan 7,917,893 680,959 0.03
544,281 Glencore 1,915,189 163,029 0.01
2,004,340 Grainger 6,115,241 (237,042) (0.01)
(46,481) Halma 1,321,222 89,476 -
(229,295) Hanesbrands 2,917,311 304,957 0.01
(15,287) Hanover Insurance 1,470,368 11,904 -
(11,796) Home Depot 2,871,904 64,695 -
446,233 HomeServe 4,037,293 (322,403) (0.01)
(167,973) Hormel Foods 5,106,399 128,314 0.01
(122,175) HP 2,478,657 29,448 -
2,060,157 HSBC 8,035,127 316,246 0.01
(527,530) ING 5,699,020 (411,251) (0.02)
(49,710) International Business Machines
5,120,312 (134,750) (0.01)
(7,110,350) International Consolidated Airlines
12,691,264 (2,063,263) (0.08)
(74,034) Intertek 3,683,932 309,462 0.01
(1,758,972) Intesa Sanpaolo 3,709,723 (114,523) -
(67,261) Kellogg 3,188,830 (18,208) -
(10,280) Kering 5,442,847 253,273 0.01
(62,532) Kone 3,273,733 597,130 0.02
4,665,730 Lancashire 26,279,724 (4,514,094) (0.17)
4,873,889 Land Securities 33,975,880 (394,785) (0.02)
19,017,023 Legal & General 53,466,360 237,713 0.01
(17,296) Linde 3,833,604 118,557 -
6,206 L'Oréal 1,905,887 (190,695) (0.01)
(19,056) Lowe's 2,865,572 88,613 -
12,490 LVMH Moët Hennessy Louis Vuitton
6,657,504 (104,458) -
(29,356) Marriott International 'A' 3,224,947 (91,986) -
Unrealised
Gains/Losses
GBP
Unrealised
Gains/Losses
GBP
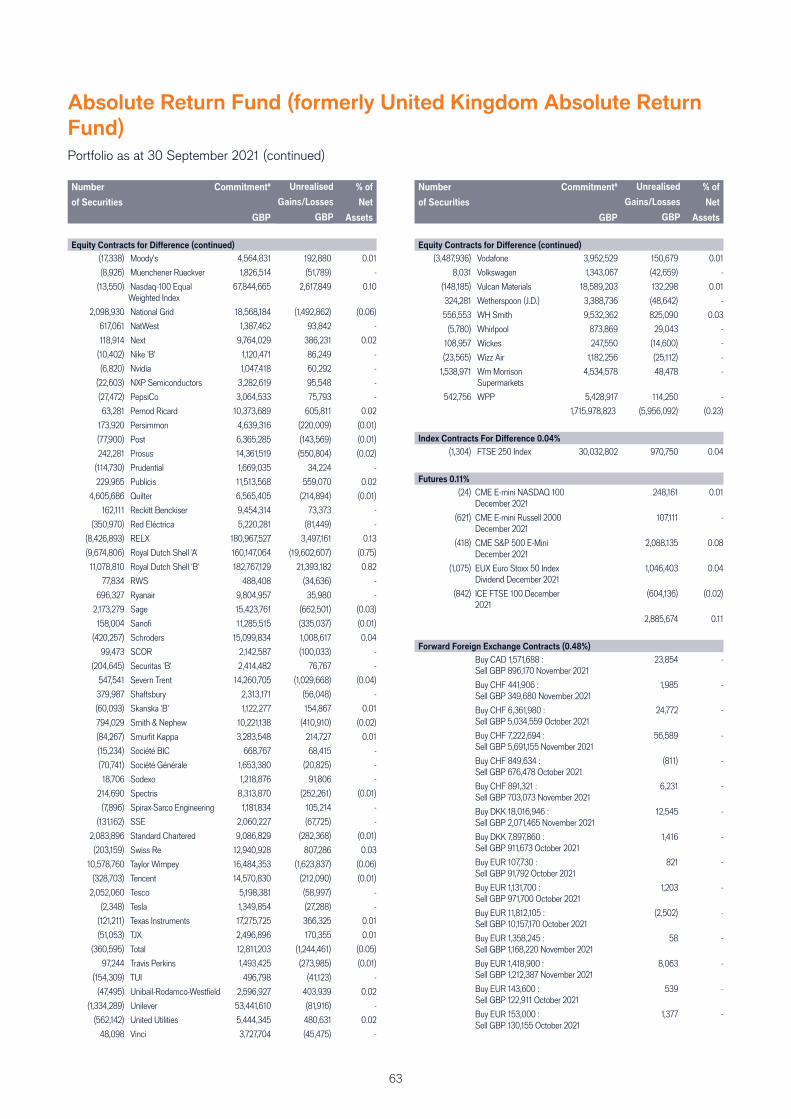
63
Absolute Return Fund (formerly United Kingdom Absolute Return
Fund)
Number
of Securities
Commitment#
GBP
Market
Value
GBP
% of
Net
Assets
Equity Contracts for Diff erence (continued)
(17,338) Moody's 4,564,831 192,880 0.01
(8,926) Muenchener Rueckver 1,826,514 (51,789) -
(13,550) Nasdaq-100 Equal Weighted Index
67,844,665 2,617,849 0.10
2,098,930 National Grid 18,568,184 (1,492,862) (0.06)
617,061 NatWest 1,387,462 93,842 -
118,914 Next 9,764,029 386,231 0.02
(10,402) Nike 'B' 1,120,471 86,249 -
(6,820) Nvidia 1,047,418 60,292 -
(22,603) NXP Semiconductors 3,282,619 95,548 -
(27,472) PepsiCo 3,064,533 75,793 -
63,281 Pernod Ricard 10,373,689 605,811 0.02
173,920 Persimmon 4,639,316 (220,009) (0.01)
(77,900) Post 6,365,285 (143,569) (0.01)
242,281 Prosus 14,361,519 (550,804) (0.02)
(114,730) Prudential 1,669,035 34,224 -
229,965 Publicis 11,513,568 559,070 0.02
4,605,686 Quilter 6,565,405 (214,894) (0.01)
162,111 Reckitt Benckiser 9,454,314 73,373 -
(350,970) Red Eléctrica 5,220,281 (81,449) -
(8,426,893) RELX 180,967,527 3,497,161 0.13
(9,674,806) Royal Dutch Shell 'A' 160,147,064 (19,602,607) (0.75)
11,078,810 Royal Dutch Shell 'B' 182,767,129 21,393,182 0.82
77,834 RWS 488,408 (34,636) -
696,327 Ryanair 9,804,957 35,980 -
2,173,279 Sage 15,423,761 (662,501) (0.03)
158,004 Sanofi 11,285,515 (335,037) (0.01)
(420,257) Schroders 15,099,834 1,008,617 0.04
99,473 SCOR 2,142,587 (100,033) -
(204,645) Securitas 'B' 2,414,482 76,767 -
547,541 Severn Trent 14,260,705 (1,029,668) (0.04)
379,987 Shaftsbury 2,313,171 (56,048) -
(60,093) Skanska 'B' 1,122,277 154,867 0.01
794,029 Smith & Nephew 10,221,138 (410,910) (0.02)
(84,267) Smurfi t Kappa 3,283,548 214,727 0.01
(15,234) Société BIC 668,767 68,415 -
(70,741) Société Générale 1,653,380 (20,825) -
18,706 Sodexo 1,218,876 91,806 -
214,690 Spectris 8,313,870 (252,261) (0.01)
(7,896) Spirax-Sarco Engineering 1,181,834 105,214 -
(131,162) SSE 2,060,227 (67,725) -
2,083,896 Standard Chartered 9,086,829 (282,368) (0.01)
(203,159) Swiss Re 12,940,928 807,286 0.03
10,578,760 Taylor Wimpey 16,484,353 (1,623,837) (0.06)
(328,703) Tencent 14,570,830 (212,090) (0.01)
2,052,060 Tesco 5,198,381 (58,997) -
(2,348) Tesla 1,349,854 (27,288) -
(121,211) Texas Instruments 17,275,725 366,325 0.01
(51,053) TJX 2,496,896 170,355 0.01
(360,595) Total 12,811,203 (1,244,461) (0.05)
97,244 Travis Perkins 1,493,425 (273,985) (0.01)
(154,309) TUI 496,798 (41,123) -
(47,495) Unibail-Rodamco-Westfi eld 2,596,927 403,939 0.02
(1,334,289) Unilever 53,441,610 (81,916) -
(562,142) United Utilities 5,444,345 480,631 0.02
48,098 Vinci 3,727,704 (45,475) -
Number
of Securities
Commitment#
GBP
Market
Value
GBP
% of
Net
Assets
Equity Contracts for Diff erence (continued)
(3,487,936) Vodafone 3,952,529 150,679 0.01
8,031 Volkswagen 1,343,067 (42,659) -
(148,185) Vulcan Materials 18,589,203 132,298 0.01
324,281 Wetherspoon (J.D.) 3,388,736 (48,642) -
556,553 WH Smith 9,532,362 825,090 0.03
(5,780) Whirlpool 873,869 29,043 -
108,957 Wickes 247,550 (14,600) -
(23,565) Wizz Air 1,182,256 (25,112) -
1,538,971 Wm Morrison Supermarkets
4,534,578 48,478 -
542,756 WPP 5,428,917 114,250 -
1,715,978,823 (5,956,092) (0.23)
Index Contracts For Diff erence 0.04%
(1,304) FTSE 250 Index 30,032,802 970,750 0.04
Futures 0.11%
(24) CME E-mini NASDAQ 100 December 2021
248,161 0.01
(621) CME E-mini Russell 2000 December 2021
107,111 -
(418) CME S&P 500 E-Mini December 2021
2,088,135 0.08
(1,075) EUX Euro Stoxx 50 Index Dividend December 2021
1,046,403 0.04
(842) ICE FTSE 100 December 2021
(604,136) (0.02)
2,885,674 0.11
Forward Foreign Exchange Contracts (0.48%)
Buy CAD 1,571,688 : Sell GBP 896,170 November 2021
23,854 -
Buy CHF 441,906 : Sell GBP 349,680 November 2021
1,985 -
Buy CHF 6,361,980 : Sell GBP 5,034,559 October 2021
24,772 -
Buy CHF 7,222,694 : Sell GBP 5,691,155 November 2021
56,589 -
Buy CHF 849,634 : Sell GBP 676,478 October 2021
(811) -
Buy CHF 891,321 : Sell GBP 703,073 November 2021
6,231 -
Buy DKK 18,016,946 : Sell GBP 2,071,465 November 2021
12,545 -
Buy DKK 7,897,860 : Sell GBP 911,673 October 2021
1,416 -
Buy EUR 107,730 : Sell GBP 91,792 October 2021
821 -
Buy EUR 1,131,700 : Sell GBP 971,700 October 2021
1,203 -
Buy EUR 11,812,105 : Sell GBP 10,157,170 October 2021
(2,502) -
Buy EUR 1,358,245 : Sell GBP 1,168,220 November 2021
58 -
Buy EUR 1,418,900 : Sell GBP 1,212,387 November 2021
8,063 -
Buy EUR 143,600 : Sell GBP 122,911 October 2021
539 -
Buy EUR 153,000 : Sell GBP 130,155 October 2021
1,377 -
Portfolio as at 30 September 2021 (continued)
Unrealised
Gains/Losses
GBP
Unrealised
Gains/Losses
GBP
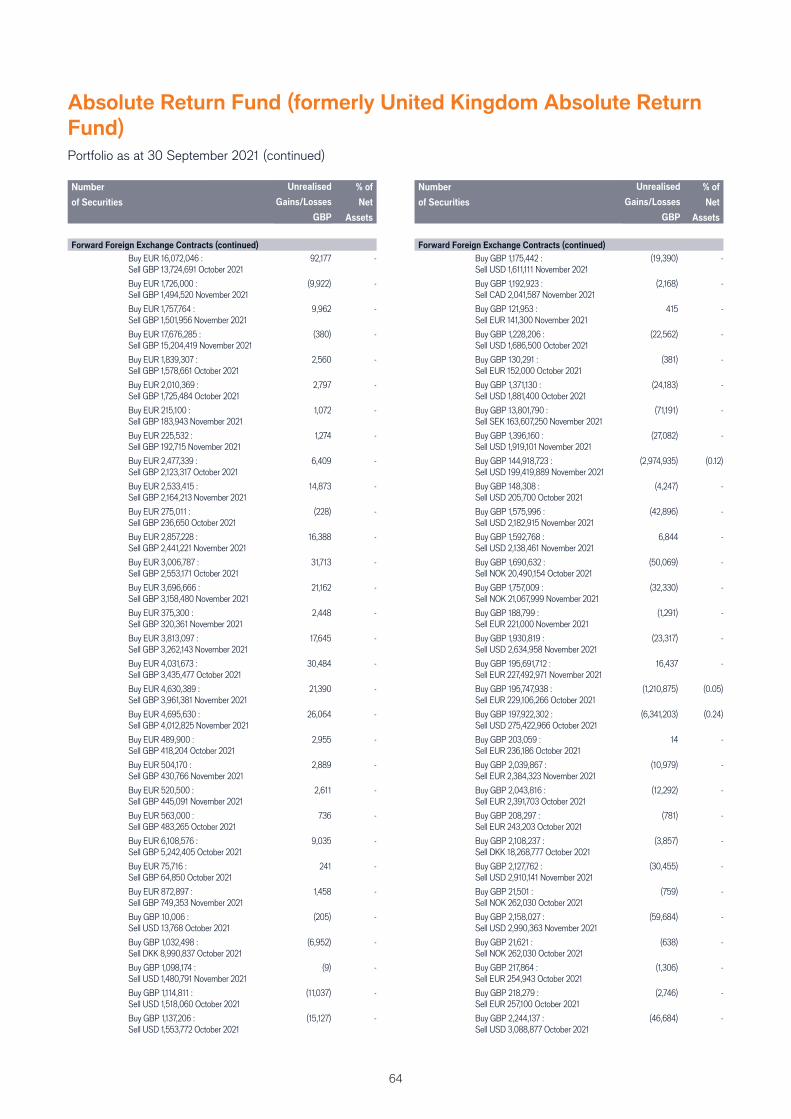
64
Absolute Return Fund (formerly United Kingdom Absolute Return
Fund)
Portfolio as at 30 September 2021 (continued)
Number
of Securities
Commitment#
GBP
Market
Value
GBP
% of
Net
Assets
Forward Foreign Exchange Contracts (continued)
Buy EUR 16,072,046 : Sell GBP 13,724,691 October 2021
92,177 -
Buy EUR 1,726,000 : Sell GBP 1,494,520 November 2021
(9,922) -
Buy EUR 1,757,764 : Sell GBP 1,501,956 November 2021
9,962 -
Buy EUR 17,676,285 : Sell GBP 15,204,419 November 2021
(380) -
Buy EUR 1,839,307 : Sell GBP 1,578,661 October 2021
2,560 -
Buy EUR 2,010,369 : Sell GBP 1,725,484 October 2021
2,797 -
Buy EUR 215,100 : Sell GBP 183,943 November 2021
1,072 -
Buy EUR 225,532 : Sell GBP 192,715 November 2021
1,274 -
Buy EUR 2,477,339 : Sell GBP 2,123,317 October 2021
6,409 -
Buy EUR 2,533,415 : Sell GBP 2,164,213 November 2021
14,873 -
Buy EUR 275,011 : Sell GBP 236,650 October 2021
(228) -
Buy EUR 2,857,228 : Sell GBP 2,441,221 November 2021
16,388 -
Buy EUR 3,006,787 : Sell GBP 2,553,171 October 2021
31,713 -
Buy EUR 3,696,666 : Sell GBP 3,158,480 November 2021
21,162 -
Buy EUR 375,300 : Sell GBP 320,361 November 2021
2,448 -
Buy EUR 3,813,097 : Sell GBP 3,262,143 November 2021
17,645 -
Buy EUR 4,031,673 : Sell GBP 3,435,477 October 2021
30,484 -
Buy EUR 4,630,389 : Sell GBP 3,961,381 November 2021
21,390 -
Buy EUR 4,695,630 : Sell GBP 4,012,825 November 2021
26,064 -
Buy EUR 489,900 : Sell GBP 418,204 October 2021
2,955 -
Buy EUR 504,170 : Sell GBP 430,766 November 2021
2,889 -
Buy EUR 520,500 : Sell GBP 445,091 November 2021
2,611 -
Buy EUR 563,000 : Sell GBP 483,265 October 2021
736 -
Buy EUR 6,108,576 : Sell GBP 5,242,405 October 2021
9,035 -
Buy EUR 75,716 : Sell GBP 64,850 October 2021
241 -
Buy EUR 872,897 : Sell GBP 749,353 November 2021
1,458 -
Buy GBP 10,006 : Sell USD 13,768 October 2021
(205) -
Buy GBP 1,032,498 : Sell DKK 8,990,837 October 2021
(6,952) -
Buy GBP 1,098,174 : Sell USD 1,480,791 November 2021
(9) -
Buy GBP 1,114,811 : Sell USD 1,518,060 October 2021
(11,037) -
Buy GBP 1,137,206 : Sell USD 1,553,772 October 2021
(15,127) -
Number
of Securities
Commitment#
GBP
Market
Value
GBP
% of
Net
Assets
Forward Foreign Exchange Contracts (continued)
Buy GBP 1,175,442 : Sell USD 1,611,111 November 2021
(19,390) -
Buy GBP 1,192,923 : Sell CAD 2,041,587 November 2021
(2,168) -
Buy GBP 121,953 : Sell EUR 141,300 November 2021
415 -
Buy GBP 1,228,206 : Sell USD 1,686,500 October 2021
(22,562) -
Buy GBP 130,291 : Sell EUR 152,000 October 2021
(381) -
Buy GBP 1,371,130 : Sell USD 1,881,400 October 2021
(24,183) -
Buy GBP 13,801,790 : Sell SEK 163,607,250 November 2021
(71,191) -
Buy GBP 1,396,160 : Sell USD 1,919,101 November 2021
(27,082) -
Buy GBP 144,918,723 : Sell USD 199,419,889 November 2021
(2,974,935) (0.12)
Buy GBP 148,308 : Sell USD 205,700 October 2021
(4,247) -
Buy GBP 1,575,996 : Sell USD 2,182,915 November 2021
(42,896) -
Buy GBP 1,592,768 : Sell USD 2,138,461 November 2021
6,844 -
Buy GBP 1,690,632 : Sell NOK 20,490,154 October 2021
(50,069) -
Buy GBP 1,757,009 : Sell NOK 21,067,999 November 2021
(32,330) -
Buy GBP 188,799 : Sell EUR 221,000 November 2021
(1,291) -
Buy GBP 1,930,819 : Sell USD 2,634,958 November 2021
(23,317) -
Buy GBP 195,691,712 : Sell EUR 227,492,971 November 2021
16,437 -
Buy GBP 195,747,938 : Sell EUR 229,106,266 October 2021
(1,210,875) (0.05)
Buy GBP 197,922,302 : Sell USD 275,422,966 October 2021
(6,341,203) (0.24)
Buy GBP 203,059 : Sell EUR 236,186 October 2021
14 -
Buy GBP 2,039,867 : Sell EUR 2,384,323 November 2021
(10,979) -
Buy GBP 2,043,816 : Sell EUR 2,391,703 October 2021
(12,292) -
Buy GBP 208,297 : Sell EUR 243,203 October 2021
(781) -
Buy GBP 2,108,237 : Sell DKK 18,268,777 October 2021
(3,857) -
Buy GBP 2,127,762 : Sell USD 2,910,141 November 2021
(30,455) -
Buy GBP 21,501 : Sell NOK 262,030 October 2021
(759) -
Buy GBP 2,158,027 : Sell USD 2,990,363 November 2021
(59,684) -
Buy GBP 21,621 : Sell NOK 262,030 October 2021
(638) -
Buy GBP 217,864 : Sell EUR 254,943 October 2021
(1,306) -
Buy GBP 218,279 : Sell EUR 257,100 October 2021
(2,746) -
Buy GBP 2,244,137 : Sell USD 3,088,877 October 2021
(46,684) -
Unrealised
Gains/Losses
GBP
Unrealised
Gains/Losses
GBP
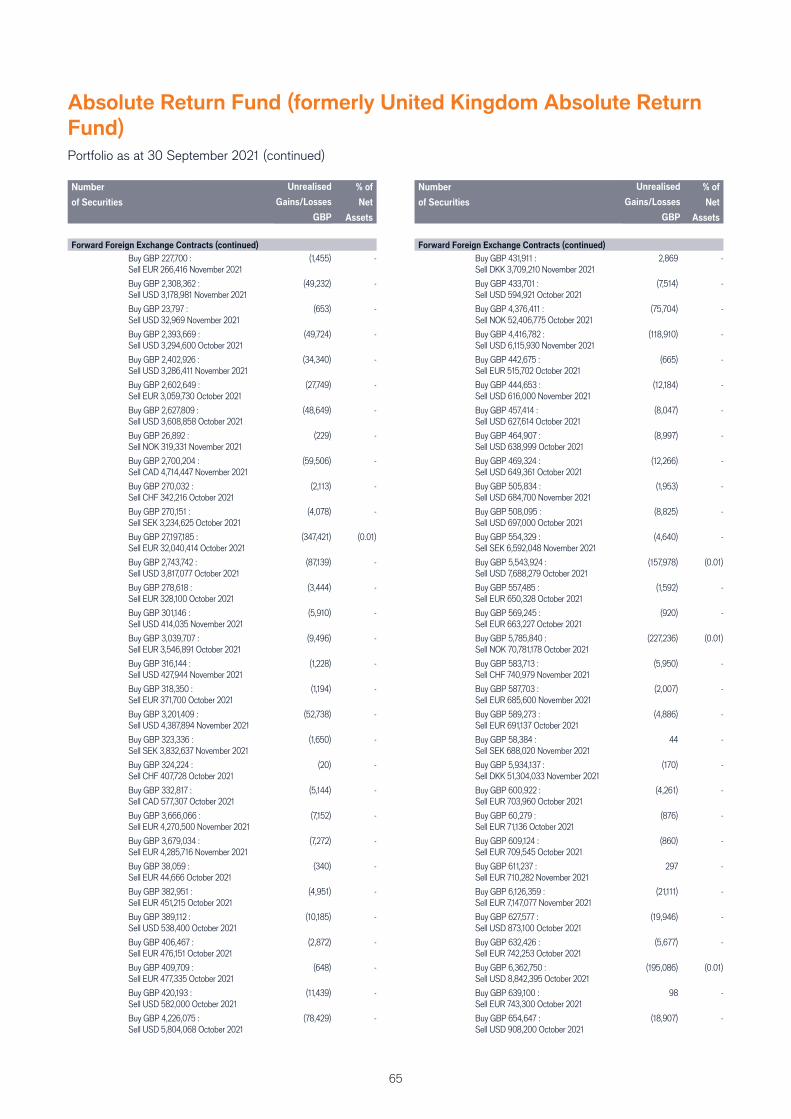
65
Absolute Return Fund (formerly United Kingdom Absolute Return
Fund)
Portfolio as at 30 September 2021 (continued)
Number
of Securities
Commitment#
GBP
Market
Value
GBP
% of
Net
Assets
Forward Foreign Exchange Contracts (continued)
Buy GBP 227,700 : Sell EUR 266,416 November 2021
(1,455) -
Buy GBP 2,308,362 : Sell USD 3,178,981 November 2021
(49,232) -
Buy GBP 23,797 : Sell USD 32,969 November 2021
(653) -
Buy GBP 2,393,669 : Sell USD 3,294,600 October 2021
(49,724) -
Buy GBP 2,402,926 : Sell USD 3,286,411 November 2021
(34,340) -
Buy GBP 2,602,649 : Sell EUR 3,059,730 October 2021
(27,749) -
Buy GBP 2,627,809 : Sell USD 3,608,858 October 2021
(48,649) -
Buy GBP 26,892 : Sell NOK 319,331 November 2021
(229) -
Buy GBP 2,700,204 : Sell CAD 4,714,447 November 2021
(59,506) -
Buy GBP 270,032 : Sell CHF 342,216 October 2021
(2,113) -
Buy GBP 270,151 : Sell SEK 3,234,625 October 2021
(4,078) -
Buy GBP 27,197,185 : Sell EUR 32,040,414 October 2021
(347,421) (0.01)
Buy GBP 2,743,742 : Sell USD 3,817,077 October 2021
(87,139) -
Buy GBP 278,618 : Sell EUR 328,100 October 2021
(3,444) -
Buy GBP 301,146 : Sell USD 414,035 November 2021
(5,910) -
Buy GBP 3,039,707 : Sell EUR 3,546,891 October 2021
(9,496) -
Buy GBP 316,144 : Sell USD 427,944 November 2021
(1,228) -
Buy GBP 318,350 : Sell EUR 371,700 October 2021
(1,194) -
Buy GBP 3,201,409 : Sell USD 4,387,894 November 2021
(52,738) -
Buy GBP 323,336 : Sell SEK 3,832,637 November 2021
(1,650) -
Buy GBP 324,224 : Sell CHF 407,728 October 2021
(20) -
Buy GBP 332,817 : Sell CAD 577,307 October 2021
(5,144) -
Buy GBP 3,666,066 : Sell EUR 4,270,500 November 2021
(7,152) -
Buy GBP 3,679,034 : Sell EUR 4,285,716 November 2021
(7,272) -
Buy GBP 38,059 : Sell EUR 44,666 October 2021
(340) -
Buy GBP 382,951 : Sell EUR 451,215 October 2021
(4,951) -
Buy GBP 389,112 : Sell USD 538,400 October 2021
(10,185) -
Buy GBP 406,467 : Sell EUR 476,151 October 2021
(2,872) -
Buy GBP 409,709 : Sell EUR 477,335 October 2021
(648) -
Buy GBP 420,193 : Sell USD 582,000 October 2021
(11,439) -
Buy GBP 4,226,075 : Sell USD 5,804,068 October 2021
(78,429) -
Number
of Securities
Commitment#
GBP
Market
Value
GBP
% of
Net
Assets
Forward Foreign Exchange Contracts (continued)
Buy GBP 431,911 : Sell DKK 3,709,210 November 2021
2,869 -
Buy GBP 433,701 : Sell USD 594,921 October 2021
(7,514) -
Buy GBP 4,376,411 : Sell NOK 52,406,775 October 2021
(75,704) -
Buy GBP 4,416,782 : Sell USD 6,115,930 November 2021
(118,910) -
Buy GBP 442,675 : Sell EUR 515,702 October 2021
(665) -
Buy GBP 444,653 : Sell USD 616,000 November 2021
(12,184) -
Buy GBP 457,414 : Sell USD 627,614 October 2021
(8,047) -
Buy GBP 464,907 : Sell USD 638,999 October 2021
(8,997) -
Buy GBP 469,324 : Sell USD 649,361 October 2021
(12,266) -
Buy GBP 505,834 : Sell USD 684,700 November 2021
(1,953) -
Buy GBP 508,095 : Sell USD 697,000 October 2021
(8,825) -
Buy GBP 554,329 : Sell SEK 6,592,048 November 2021
(4,640) -
Buy GBP 5,543,924 : Sell USD 7,688,279 October 2021
(157,978) (0.01)
Buy GBP 557,485 : Sell EUR 650,328 October 2021
(1,592) -
Buy GBP 569,245 : Sell EUR 663,227 October 2021
(920) -
Buy GBP 5,785,840 : Sell NOK 70,781,178 October 2021
(227,236) (0.01)
Buy GBP 583,713 : Sell CHF 740,979 November 2021
(5,950) -
Buy GBP 587,703 : Sell EUR 685,600 November 2021
(2,007) -
Buy GBP 589,273 : Sell EUR 691,137 October 2021
(4,886) -
Buy GBP 58,384 : Sell SEK 688,020 November 2021
44 -
Buy GBP 5,934,137 : Sell DKK 51,304,033 November 2021
(170) -
Buy GBP 600,922 : Sell EUR 703,960 October 2021
(4,261) -
Buy GBP 60,279 : Sell EUR 71,136 October 2021
(876) -
Buy GBP 609,124 : Sell EUR 709,545 October 2021
(860) -
Buy GBP 611,237 : Sell EUR 710,282 November 2021
297 -
Buy GBP 6,126,359 : Sell EUR 7,147,077 November 2021
(21,111) -
Buy GBP 627,577 : Sell USD 873,100 October 2021
(19,946) -
Buy GBP 632,426 : Sell EUR 742,253 October 2021
(5,677) -
Buy GBP 6,362,750 : Sell USD 8,842,395 October 2021
(195,086) (0.01)
Buy GBP 639,100 : Sell EUR 743,300 October 2021
98 -
Buy GBP 654,647 : Sell USD 908,200 October 2021
(18,907) -
Unrealised
Gains/Losses
GBP
Unrealised
Gains/Losses
GBP
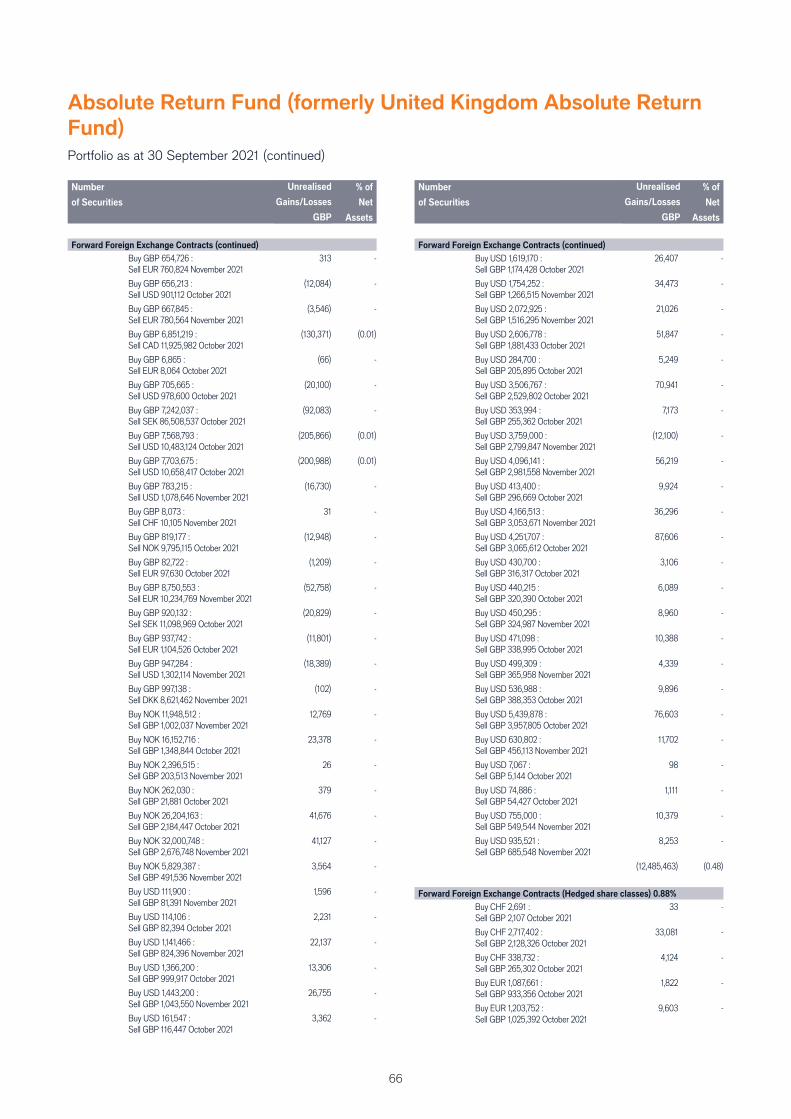
66
Absolute Return Fund (formerly United Kingdom Absolute Return
Fund)
Portfolio as at 30 September 2021 (continued)
Number
of Securities
Commitment#
GBP
Market
Value
GBP
% of
Net
Assets
Forward Foreign Exchange Contracts (continued)
Buy GBP 654,726 : Sell EUR 760,824 November 2021
313 -
Buy GBP 656,213 : Sell USD 901,112 October 2021
(12,084) -
Buy GBP 667,845 : Sell EUR 780,564 November 2021
(3,546) -
Buy GBP 6,851,219 : Sell CAD 11,925,982 October 2021
(130,371) (0.01)
Buy GBP 6,865 : Sell EUR 8,064 October 2021
(66) -
Buy GBP 705,665 : Sell USD 978,600 October 2021
(20,100) -
Buy GBP 7,242,037 : Sell SEK 86,508,537 October 2021
(92,083) -
Buy GBP 7,568,793 : Sell USD 10,483,124 October 2021
(205,866) (0.01)
Buy GBP 7,703,675 : Sell USD 10,658,417 October 2021
(200,988) (0.01)
Buy GBP 783,215 : Sell USD 1,078,646 November 2021
(16,730) -
Buy GBP 8,073 : Sell CHF 10,105 November 2021
31 -
Buy GBP 819,177 : Sell NOK 9,795,115 October 2021
(12,948) -
Buy GBP 82,722 : Sell EUR 97,630 October 2021
(1,209) -
Buy GBP 8,750,553 : Sell EUR 10,234,769 November 2021
(52,758) -
Buy GBP 920,132 : Sell SEK 11,098,969 October 2021
(20,829) -
Buy GBP 937,742 : Sell EUR 1,104,526 October 2021
(11,801) -
Buy GBP 947,284 : Sell USD 1,302,114 November 2021
(18,389) -
Buy GBP 997,138 : Sell DKK 8,621,462 November 2021
(102) -
Buy NOK 11,948,512 : Sell GBP 1,002,037 November 2021
12,769 -
Buy NOK 16,152,716 : Sell GBP 1,348,844 October 2021
23,378 -
Buy NOK 2,396,515 : Sell GBP 203,513 November 2021
26 -
Buy NOK 262,030 : Sell GBP 21,881 October 2021
379 -
Buy NOK 26,204,163 : Sell GBP 2,184,447 October 2021
41,676 -
Buy NOK 32,000,748 : Sell GBP 2,676,748 November 2021
41,127 -
Buy NOK 5,829,387 : Sell GBP 491,536 November 2021
3,564 -
Buy USD 111,900 : Sell GBP 81,391 November 2021
1,596 -
Buy USD 114,106 : Sell GBP 82,394 October 2021
2,231 -
Buy USD 1,141,466 : Sell GBP 824,396 November 2021
22,137 -
Buy USD 1,366,200 : Sell GBP 999,917 October 2021
13,306 -
Buy USD 1,443,200 : Sell GBP 1,043,550 November 2021
26,755 -
Buy USD 161,547 : Sell GBP 116,447 October 2021
3,362 -
Number
of Securities
Commitment#
GBP
Market
Value
GBP
% of
Net
Assets
Forward Foreign Exchange Contracts (continued)
Buy USD 1,619,170 : Sell GBP 1,174,428 October 2021
26,407 -
Buy USD 1,754,252 : Sell GBP 1,266,515 November 2021
34,473 -
Buy USD 2,072,925 : Sell GBP 1,516,295 November 2021
21,026 -
Buy USD 2,606,778 : Sell GBP 1,881,433 October 2021
51,847 -
Buy USD 284,700 : Sell GBP 205,895 October 2021
5,249 -
Buy USD 3,506,767 : Sell GBP 2,529,802 October 2021
70,941 -
Buy USD 353,994 : Sell GBP 255,362 October 2021
7,173 -
Buy USD 3,759,000 : Sell GBP 2,799,847 November 2021
(12,100) -
Buy USD 4,096,141 : Sell GBP 2,981,558 November 2021
56,219 -
Buy USD 413,400 : Sell GBP 296,669 October 2021
9,924 -
Buy USD 4,166,513 : Sell GBP 3,053,671 November 2021
36,296 -
Buy USD 4,251,707 : Sell GBP 3,065,612 October 2021
87,606 -
Buy USD 430,700 : Sell GBP 316,317 October 2021
3,106 -
Buy USD 440,215 : Sell GBP 320,390 October 2021
6,089 -
Buy USD 450,295 : Sell GBP 324,987 November 2021
8,960 -
Buy USD 471,098 : Sell GBP 338,995 October 2021
10,388 -
Buy USD 499,309 : Sell GBP 365,958 November 2021
4,339 -
Buy USD 536,988 : Sell GBP 388,353 October 2021
9,896 -
Buy USD 5,439,878 : Sell GBP 3,957,805 October 2021
76,603 -
Buy USD 630,802 : Sell GBP 456,113 November 2021
11,702 -
Buy USD 7,067 : Sell GBP 5,144 October 2021
98 -
Buy USD 74,886 : Sell GBP 54,427 October 2021
1,111 -
Buy USD 755,000 : Sell GBP 549,544 November 2021
10,379 -
Buy USD 935,521 : Sell GBP 685,548 November 2021
8,253 -
(12,485,463) (0.48)
Forward Foreign Exchange Contracts (Hedged share classes) 0.88%
Buy CHF 2,691 : Sell GBP 2,107 October 2021
33 -
Buy CHF 2,717,402 : Sell GBP 2,128,326 October 2021
33,081 -
Buy CHF 338,732 : Sell GBP 265,302 October 2021
4,124 -
Buy EUR 1,087,661 : Sell GBP 933,356 October 2021
1,822 -
Buy EUR 1,203,752 : Sell GBP 1,025,392 October 2021
9,603 -
Unrealised
Gains/Losses
GBP
Unrealised
Gains/Losses
GBP

67
Absolute Return Fund (formerly United Kingdom Absolute Return
Fund)
Portfolio as at 30 September 2021 (continued)
Number
of Securities
Commitment#
GBP
Market
Value
GBP
% of
Net
Assets
Forward Foreign Exchange Contracts (Hedged share classes) (continued)
Buy EUR 1,206,153 : Sell GBP 1,031,495 October 2021
5,564 -
Buy EUR 1,231,048 : Sell GBP 1,051,401 October 2021
7,063 -
Buy EUR 1,460,022,297 : Sell GBP 1,243,690,794 October 2021
11,647,063 0.45
Buy EUR 1,490,125 : Sell GBP 1,272,443 October 2021
8,777 -
Buy EUR 150,666 : Sell GBP 128,849 October 2021
695 -
Buy EUR 1,508,173 : Sell GBP 1,301,260 October 2021
(4,521) -
Buy EUR 1,548,017 : Sell GBP 1,323,101 October 2021
7,895 -
Buy EUR 1,597,645 : Sell GBP 1,364,500 October 2021
9,166 -
Buy EUR 1,614,596 : Sell GBP 1,383,513 October 2021
4,728 -
Buy EUR 1,640,278 : Sell GBP 1,402,756 October 2021
7,567 -
Buy EUR 176,456 : Sell GBP 152,248 October 2021
(529) -
Buy EUR 186,240 : Sell GBP 159,062 October 2021
1,069 -
Buy EUR 2,129,100 : Sell GBP 1,830,517 October 2021
99 -
Buy EUR 221,995 : Sell GBP 190,223 October 2021
650 -
Buy EUR 250,915 : Sell GBP 214,343 October 2021
1,395 -
Buy EUR 252,331 : Sell GBP 215,666 October 2021
1,290 -
Buy EUR 287,362 : Sell GBP 245,200 October 2021
1,876 -
Buy EUR 290,135 : Sell GBP 247,145 October 2021
2,315 -
Buy EUR 291,326 : Sell GBP 248,813 October 2021
1,671 -
Buy EUR 306,179 : Sell GBP 261,451 October 2021
1,804 -
Buy EUR 356,286 : Sell GBP 304,693 October 2021
1,644 -
Buy EUR 3,590,328 : Sell GBP 3,088,630 October 2021
(1,640) -
Buy EUR 364,138 : Sell GBP 311,231 October 2021
1,857 -
Buy EUR 367,417 : Sell GBP 315,891 October 2021
17 -
Buy EUR 381,666,402 : Sell GBP 325,114,891 October 2021
3,044,675 0.12
Buy EUR 391,145 : Sell GBP 335,164 October 2021
1,145 -
Buy EUR 41,484 : Sell GBP 35,337 October 2021
331 -
Buy EUR 425,847 : Sell GBP 362,749 October 2021
3,397 -
Buy EUR 442,880 : Sell GBP 377,900 October 2021
2,892 -
Buy EUR 442,968 : Sell GBP 382,195 October 2021
(1,328) -
Buy EUR 541,391 : Sell GBP 464,585 October 2021
907 -
Number
of Securities
Commitment#
GBP
Market
Value
GBP
% of
Net
Assets
Forward Foreign Exchange Contracts (Hedged share classes) (continued)
Buy EUR 544,069 : Sell GBP 467,769 October 2021
25 -
Buy EUR 558,718 : Sell GBP 477,775 October 2021
2,614 -
Buy EUR 5,704,119 : Sell GBP 4,907,048 October 2021
(2,605) -
Buy EUR 597,253,483 : Sell GBP 508,758,435 October 2021
4,764,481 0.18
Buy EUR 630,359 : Sell GBP 543,877 October 2021
(1,890) -
Buy EUR 63,055,733 : Sell GBP 53,712,765 October 2021
503,016 0.02
Buy EUR 65,727 : Sell GBP 56,205 October 2021
308 -
Buy EUR 694,286 : Sell GBP 600,872 October 2021
(3,920) -
Buy EUR 708,203 : Sell GBP 609,242 October 2021
(323) -
Buy EUR 760,386 : Sell GBP 649,557 October 2021
4,228 -
Buy EUR 78,015 : Sell GBP 67,113 October 2021
(36) -
Buy EUR 787,599 : Sell GBP 672,041 October 2021
5,143 -
Buy EUR 812,736 : Sell GBP 696,416 October 2021
2,380 -
Buy EUR 83,456 : Sell GBP 72,228 October 2021
(471) -
Buy EUR 833,675 : Sell GBP 715,403 October 2021
1,397 -
Buy EUR 841,038 : Sell GBP 727,879 October 2021
(4,748) -
Buy EUR 871,752 : Sell GBP 745,081 October 2021
4,458 -
Buy EUR 919,783 : Sell GBP 785,419 October 2021
5,418 -
Buy GBP 11,178 : Sell USD 15,281 October 2021
(155) -
Buy GBP 114,594 : Sell JPY 17,451,365 October 2021
(1,419) -
Buy GBP 12,623,441 : Sell EUR 14,657,085 October 2021
21,172 -
Buy GBP 12,688,919 : Sell EUR 14,845,929 October 2021
(75,719) -
Buy GBP 1,308,990 : Sell EUR 1,534,072 October 2021
(10,016) -
Buy GBP 148,714 : Sell EUR 173,997 October 2021
(890) -
Buy GBP 1,528 : Sell USD 2,084 October 2021
(18) -
Buy GBP 16,185 : Sell USD 22,251 October 2021
(317) -
Buy GBP 162,125 : Sell USD 222,842 October 2021
(3,141) -
Buy GBP 180,178 : Sell USD 249,555 October 2021
(4,899) -
Buy GBP 1,911,721 :Sell EUR 2,208,925 October 2021
12,471 -
Buy GBP 2,052,247 : Sell EUR 2,391,529 October 2021
(4,007) -
Buy GBP 208,572 : Sell JPY 31,402,770 October 2021
(187) -
Unrealised
Gains/Losses
GBP
Unrealised
Gains/Losses
GBP
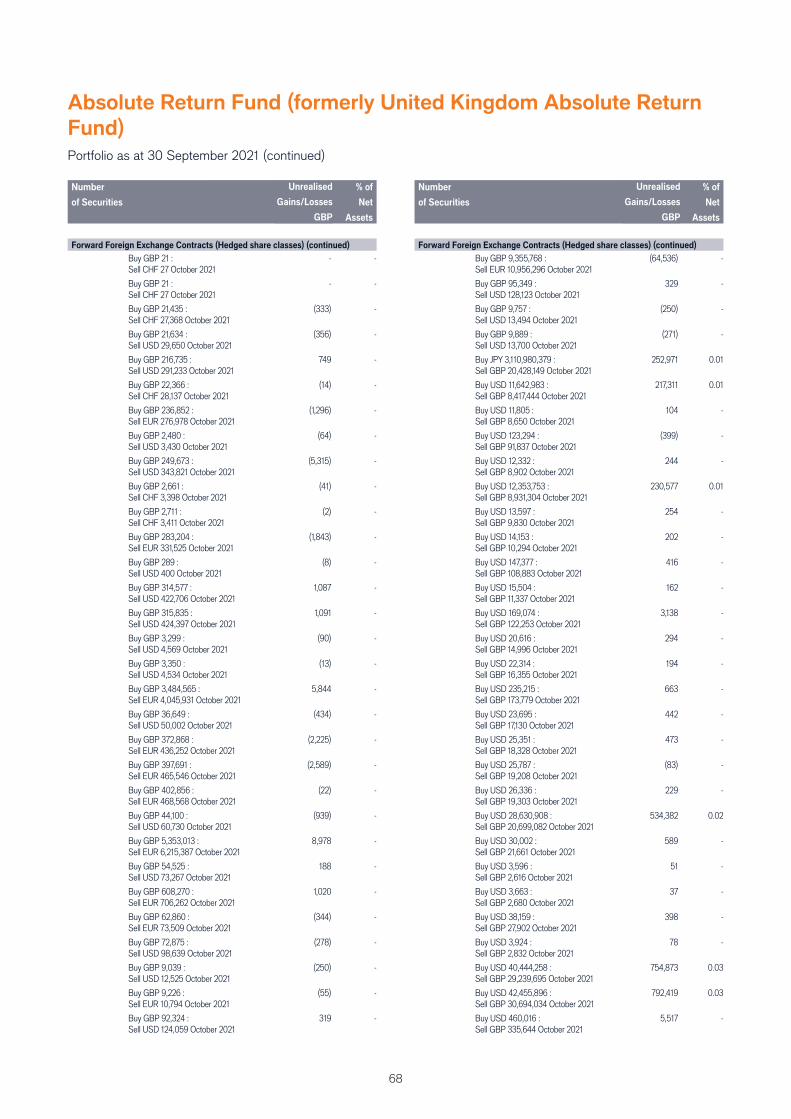
68
Absolute Return Fund (formerly United Kingdom Absolute Return
Fund)
Portfolio as at 30 September 2021 (continued)
Number
of Securities
Commitment#
GBP
Market
Value
GBP
% of
Net
Assets
Forward Foreign Exchange Contracts (Hedged share classes) (continued)
Buy GBP 21 : Sell CHF 27 October 2021
- -
Buy GBP 21 : Sell CHF 27 October 2021
- -
Buy GBP 21,435 : Sell CHF 27,368 October 2021
(333) -
Buy GBP 21,634 : Sell USD 29,650 October 2021
(356) -
Buy GBP 216,735 : Sell USD 291,233 October 2021
749 -
Buy GBP 22,366 : Sell CHF 28,137 October 2021
(14) -
Buy GBP 236,852 : Sell EUR 276,978 October 2021
(1,296) -
Buy GBP 2,480 : Sell USD 3,430 October 2021
(64) -
Buy GBP 249,673 : Sell USD 343,821 October 2021
(5,315) -
Buy GBP 2,661 : Sell CHF 3,398 October 2021
(41) -
Buy GBP 2,711 : Sell CHF 3,411 October 2021
(2) -
Buy GBP 283,204 : Sell EUR 331,525 October 2021
(1,843) -
Buy GBP 289 : Sell USD 400 October 2021
(8) -
Buy GBP 314,577 : Sell USD 422,706 October 2021
1,087 -
Buy GBP 315,835 : Sell USD 424,397 October 2021
1,091 -
Buy GBP 3,299 : Sell USD 4,569 October 2021
(90) -
Buy GBP 3,350 : Sell USD 4,534 October 2021
(13) -
Buy GBP 3,484,565 : Sell EUR 4,045,931 October 2021
5,844 -
Buy GBP 36,649 : Sell USD 50,002 October 2021
(434) -
Buy GBP 372,868 : Sell EUR 436,252 October 2021
(2,225) -
Buy GBP 397,691 : Sell EUR 465,546 October 2021
(2,589) -
Buy GBP 402,856 : Sell EUR 468,568 October 2021
(22) -
Buy GBP 44,100 : Sell USD 60,730 October 2021
(939) -
Buy GBP 5,353,013 : Sell EUR 6,215,387 October 2021
8,978 -
Buy GBP 54,525 : Sell USD 73,267 October 2021
188 -
Buy GBP 608,270 : Sell EUR 706,262 October 2021
1,020 -
Buy GBP 62,860 : Sell EUR 73,509 October 2021
(344) -
Buy GBP 72,875 : Sell USD 98,639 October 2021
(278) -
Buy GBP 9,039 : Sell USD 12,525 October 2021
(250) -
Buy GBP 9,226 : Sell EUR 10,794 October 2021
(55) -
Buy GBP 92,324 : Sell USD 124,059 October 2021
319 -
Number
of Securities
Commitment#
GBP
Market
Value
GBP
% of
Net
Assets
Forward Foreign Exchange Contracts (Hedged share classes) (continued)
Buy GBP 9,355,768 : Sell EUR 10,956,296 October 2021
(64,536) -
Buy GBP 95,349 : Sell USD 128,123 October 2021
329 -
Buy GBP 9,757 : Sell USD 13,494 October 2021
(250) -
Buy GBP 9,889 : Sell USD 13,700 October 2021
(271) -
Buy JPY 3,110,980,379 : Sell GBP 20,428,149 October 2021
252,971 0.01
Buy USD 11,642,983 : Sell GBP 8,417,444 October 2021
217,311 0.01
Buy USD 11,805 : Sell GBP 8,650 October 2021
104 -
Buy USD 123,294 : Sell GBP 91,837 October 2021
(399) -
Buy USD 12,332 : Sell GBP 8,902 October 2021
244 -
Buy USD 12,353,753 : Sell GBP 8,931,304 October 2021
230,577 0.01
Buy USD 13,597 : Sell GBP 9,830 October 2021
254 -
Buy USD 14,153 : Sell GBP 10,294 October 2021
202 -
Buy USD 147,377 : Sell GBP 108,883 October 2021
416 -
Buy USD 15,504 : Sell GBP 11,337 October 2021
162 -
Buy USD 169,074 : Sell GBP 122,253 October 2021
3,138 -
Buy USD 20,616 : Sell GBP 14,996 October 2021
294 -
Buy USD 22,314 : Sell GBP 16,355 October 2021
194 -
Buy USD 235,215 : Sell GBP 173,779 October 2021
663 -
Buy USD 23,695 : Sell GBP 17,130 October 2021
442 -
Buy USD 25,351 : Sell GBP 18,328 October 2021
473 -
Buy USD 25,787 : Sell GBP 19,208 October 2021
(83) -
Buy USD 26,336 : Sell GBP 19,303 October 2021
229 -
Buy USD 28,630,908 : Sell GBP 20,699,082 October 2021
534,382 0.02
Buy USD 30,002 : Sell GBP 21,661 October 2021
589 -
Buy USD 3,596 : Sell GBP 2,616 October 2021
51 -
Buy USD 3,663 : Sell GBP 2,680 October 2021
37 -
Buy USD 38,159 : Sell GBP 27,902 October 2021
398 -
Buy USD 3,924 : Sell GBP 2,832 October 2021
78 -
Buy USD 40,444,258 : Sell GBP 29,239,695 October 2021
754,873 0.03
Buy USD 42,455,896 : Sell GBP 30,694,034 October 2021
792,419 0.03
Buy USD 460,016 : Sell GBP 335,644 October 2021
5,517 -
Unrealised
Gains/Losses
GBP
Unrealised
Gains/Losses
GBP
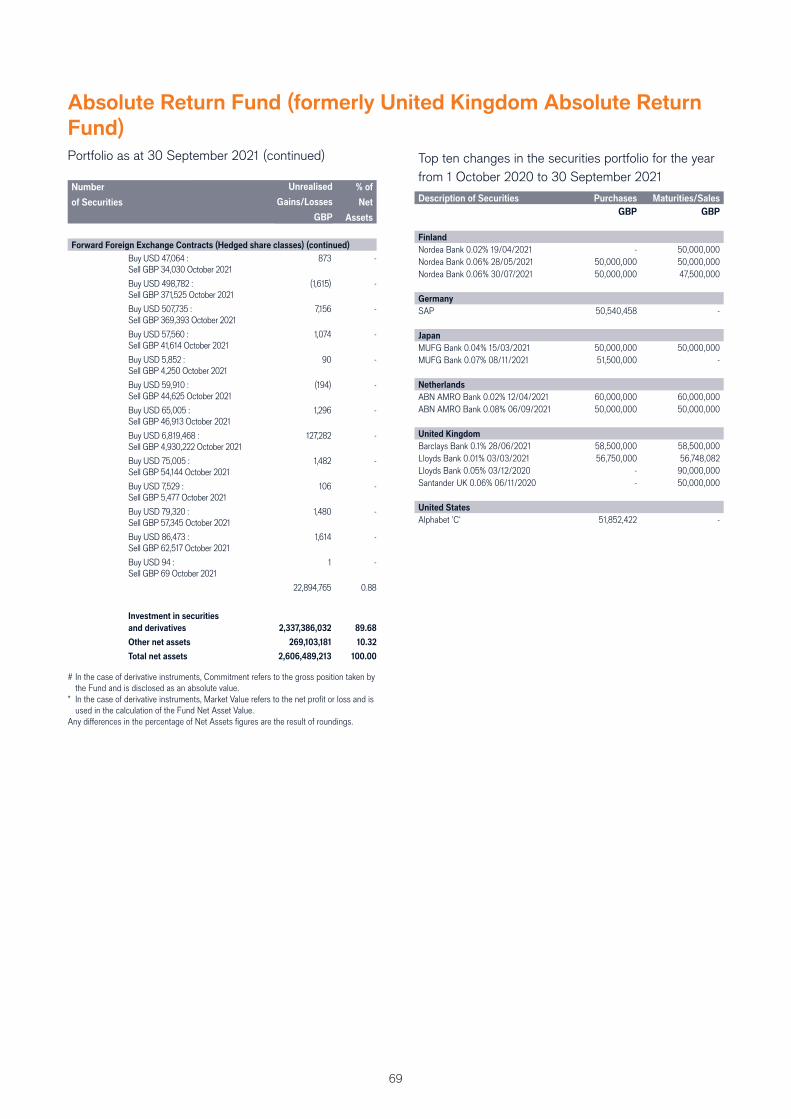
69
Absolute Return Fund (formerly United Kingdom Absolute Return
Fund)
Top ten changes in the securities portfolio for the year
from 1 October 2020 to 30 September 2021
Description of Securities Purchases Maturities/Sales
GBP GBP
Finland
Nordea Bank 0.02% 19/04/2021 - 50,000,000 Nordea Bank 0.06% 28/05/2021 50,000,000 50,000,000 Nordea Bank 0.06% 30/07/2021 50,000,000 47,500,000
Germany
SAP 50,540,458 -
Japan
MUFG Bank 0.04% 15/03/2021 50,000,000 50,000,000 MUFG Bank 0.07% 08/11/2021 51,500,000 -
Netherlands
ABN AMRO Bank 0.02% 12/04/2021 60,000,000 60,000,000 ABN AMRO Bank 0.08% 06/09/2021 50,000,000 50,000,000
United Kingdom
Barclays Bank 0.1% 28/06/2021 58,500,000 58,500,000 Lloyds Bank 0.01% 03/03/2021 56,750,000 56,748,082 Lloyds Bank 0.05% 03/12/2020 - 90,000,000 Santander UK 0.06% 06/11/2020 - 50,000,000
United States
Alphabet 'C' 51,852,422 -
Number
of Securities
Commitment#
GBP
Market
Value
GBP
% of
Net
Assets
Forward Foreign Exchange Contracts (Hedged share classes) (continued)
Buy USD 47,064 : Sell GBP 34,030 October 2021
873 -
Buy USD 498,782 : Sell GBP 371,525 October 2021
(1,615) -
Buy USD 507,735 : Sell GBP 369,393 October 2021
7,156 -
Buy USD 57,560 : Sell GBP 41,614 October 2021
1,074 -
Buy USD 5,852 : Sell GBP 4,250 October 2021
90 -
Buy USD 59,910 : Sell GBP 44,625 October 2021
(194) -
Buy USD 65,005 : Sell GBP 46,913 October 2021
1,296 -
Buy USD 6,819,468 : Sell GBP 4,930,222 October 2021
127,282 -
Buy USD 75,005 : Sell GBP 54,144 October 2021
1,482 -
Buy USD 7,529 : Sell GBP 5,477 October 2021
106 -
Buy USD 79,320 : Sell GBP 57,345 October 2021
1,480 -
Buy USD 86,473 : Sell GBP 62,517 October 2021
1,614 -
Buy USD 94 : Sell GBP 69 October 2021
1 -
22,894,765 0.88
Investment in securities
and derivatives 2,337,386,032 89.68
Other net assets 269,103,181 10.32
Total net assets 2,606,489,213 100.00
# In the case of derivative instruments, Commitment refers to the gross position taken by the Fund and is disclosed as an absolute value.
* In the case of derivative instruments, Market Value refers to the net profi t or loss and is used in the calculation of the Fund Net Asset Value.
Any diff erences in the percentage of Net Assets fi gures are the result of roundings.
Portfolio as at 30 September 2021 (continued)
Unrealised
Gains/Losses
GBP
70
Global Equity Market Neutral Fund
Investment report for the year from 1 October 2020 to 30 September 2021
Investment Fund Manager
Steve Johnstone
The fund fell 3.9% (Net) based on Class H2 in US Dollar terms over the year under review, compared with a return of 0.1% in the US
Federal Funds Rate, US Dollar terms.
The fund started well, posting a positive return in October when global markets sold off following a resurgence of COVID-19 cases
alongside fears of a contested US presidential election result. The fund struggled in November, with news of a positive COVID-19 vaccine
trial triggering a signifi cant factor rotation into value-based stocks, leading to a sharp reversal on the short side of ideas where we had a
negative value and long momentum tilt. This was particularly noticeable in the Property strategy, where the lower-quality, higher-yielding
names in the short book – which had been strong contributors earlier in the year – surged following the news. The fund used this as an
opportunity to introduce more cyclicality to the portfolio. It started 2021 strongly, as the global refl ation thesis gained traction. However, the
fund faced headwinds, including the ‘short squeeze’ in January and a fl urry of acquisition activity in February. It weathered the short squeeze
and subsequent deleveraging well, fi nishing January positively, although speculative takeover attempts aff ected some areas of the short
book in February, which weighed on performance.
The fund had some wins during the April/May earnings season, although the stock reaction to some forecast-beating earnings was
subdued. June was particularly challenging, with peaking macro concerns and rising cases of the Delta variant of COVID-19 leading to a
slowdown in momentum for the reopening theme amid stalling bond yields. This led to some weakness in areas of the book exposed to
this theme. The fund enjoyed some positive earnings announcements in July, although the continued unwinding of the refl ation trade and a
regulatory crackdown in China weighed on some areas of the book. Our portfolio construction approach ensures that we hold a balanced
and diversifi ed portfolio, and the overall eff ect from the China-induced sell-off was fairly contained. We had some solid US earnings gains
in August, although the month was characterised by the strong performance of defensive and growth names, which hurt some areas of the
short book. In September, Evergrande’s debt crisis and ongoing regulatory action in China was a headwind for some Asian ideas. However,
the hawkish tilt from the US Federal Reserve meant that some of the more yield-sensitive ideas/reopening plays started to perform into
month end and September’s performance was fl at overall.
A US software idea was the top performer. The cybersecurity company on the long side rallied in November after reporting earnings and
an outlook that beat estimates. The idea performed well in February, when the long side benefi ted after US President Joe Biden made
cybersecurity spending a top priority. In addition, a research note highlighted that cybersecurity spending would benefi t from continued
working-from-home trends. The short side of the idea fell after it announced weak guidance. The fund locked in profi ts on the idea in
February, after switching the short side of the idea into a new position. The second-highest contributor was an Asian food and restaurants
idea. The milk producer on the short side performed well in December, when the stock fell sharply after the company cut its revenue and
margin guidance. The stock continued to drift lower in the months ahead and fell sharply again in May after cutting its full-year outlook as
sales of infant formula to China continued to falter. We closed out the idea later in the year, locking in a strong gain.
The largest detractor was a Japanese automotive idea. The carmaker on the long side lowered its guidance while shares in the automotive
parts manufacturer on the short side were lifted alongside other value stocks in response to the positive vaccine news. Several detractors
fell in February, when the fund had three opportunistic takeover attempts on positions held in the short book – two in the UK mid-cap space
and the other in Europe. All the ideas were closed following the announcements to mitigate any further potential drawdown. While we
expect negative hits from time to time, this was on the extreme side of what we generally expect from stock-specifi c events and we worked
with our managers to retest our short book convictions, given the increased merger and acquisition activity. Another detractor was an
Asian idea, with the household appliances company on the short side squeezed by retail speculation. We closed out the idea given that the
position was being dominated by sentiment-driven moves rather than fundamentals.
Moving forward, we would expect factor and thematic dispersions to narrow, with fundamentals coming back into focus. While factor
contribution remains higher than stock-specifi c contribution, a potentially improving environment for stock pickers could be benefi cial in
future earnings seasons, if positive (or negative) corporate fundamentals feed through to results. Not only have markets been more heavily
dominated by factor risk, we have found that thematic buckets (for example, COVID-19 winners) have played a key role in determining
market movements. Risk models can be very good at analysing volatility and correlation, but it is a more challenging issue to account for
thematic risk. This is why we do not tie ourselves to a purely quantitative risk management approach, monitor factor and thematic risk
closely, and keep in close contact with our idea contributors to discuss these risks.
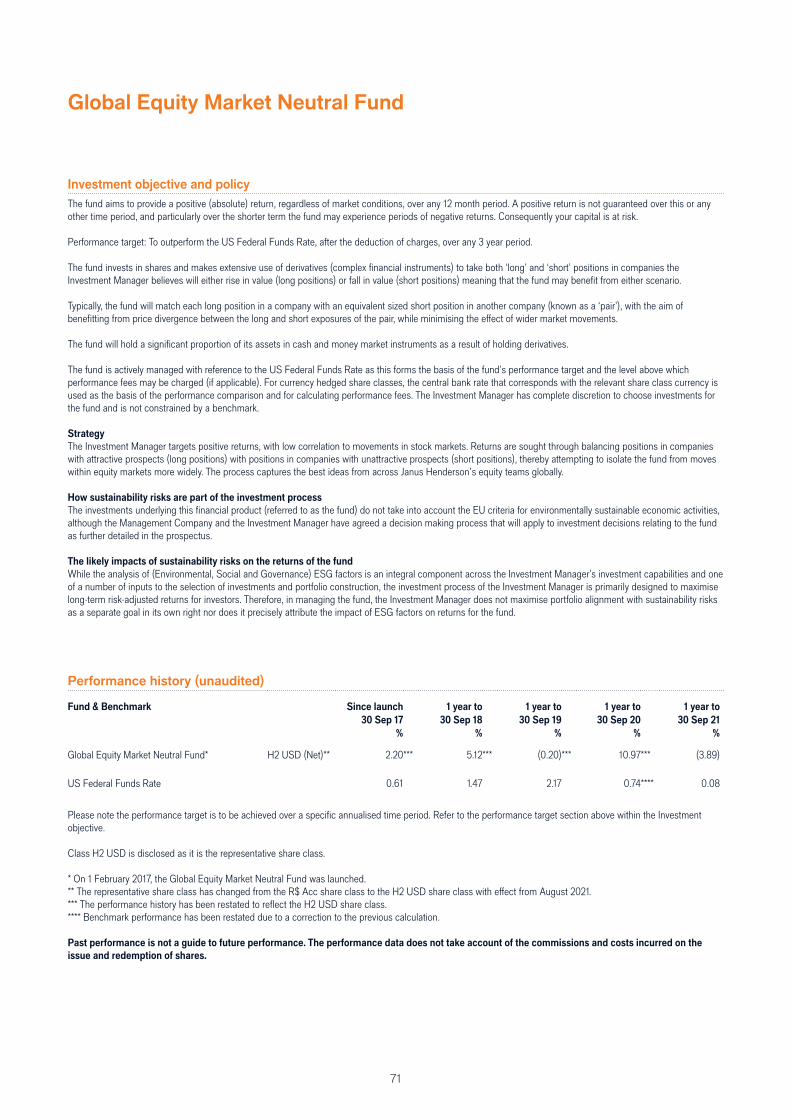
71
Global Equity Market Neutral Fund
Investment objective and policy
The fund aims to provide a positive (absolute) return, regardless of market conditions, over any 12 month period. A positive return is not guaranteed over this or any other time period, and particularly over the shorter term the fund may experience periods of negative returns. Consequently your capital is at risk.
Performance target: To outperform the US Federal Funds Rate, after the deduction of charges, over any 3 year period.
The fund invests in shares and makes extensive use of derivatives (complex fi nancial instruments) to take both ‘long’ and ‘short’ positions in companies the Investment Manager believes will either rise in value (long positions) or fall in value (short positions) meaning that the fund may benefi t from either scenario.
Typically, the fund will match each long position in a company with an equivalent sized short position in another company (known as a ‘pair’), with the aim of benefi tting from price divergence between the long and short exposures of the pair, while minimising the eff ect of wider market movements.
The fund will hold a signifi cant proportion of its assets in cash and money market instruments as a result of holding derivatives.
The fund is actively managed with reference to the US Federal Funds Rate as this forms the basis of the fund’s performance target and the level above which performance fees may be charged (if applicable). For currency hedged share classes, the central bank rate that corresponds with the relevant share class currency is used as the basis of the performance comparison and for calculating performance fees. The Investment Manager has complete discretion to choose investments for the fund and is not constrained by a benchmark.
Strategy
The Investment Manager targets positive returns, with low correlation to movements in stock markets. Returns are sought through balancing positions in companies with attractive prospects (long positions) with positions in companies with unattractive prospects (short positions), thereby attempting to isolate the fund from moves within equity markets more widely. The process captures the best ideas from across Janus Henderson’s equity teams globally.
How sustainability risks are part of the investment process
The investments underlying this fi nancial product (referred to as the fund) do not take into account the EU criteria for environmentally sustainable economic activities, although the Management Company and the Investment Manager have agreed a decision making process that will apply to investment decisions relating to the fund as further detailed in the prospectus.
The likely impacts of sustainability risks on the returns of the fund
While the analysis of (Environmental, Social and Governance) ESG factors is an integral component across the Investment Manager’s investment capabilities and one of a number of inputs to the selection of investments and portfolio construction, the investment process of the Investment Manager is primarily designed to maximise long-term risk-adjusted returns for investors. Therefore, in managing the fund, the Investment Manager does not maximise portfolio alignment with sustainability risks as a separate goal in its own right nor does it precisely attribute the impact of ESG factors on returns for the fund.
Performance history (unaudited)
Fund & Benchmark Since launch 1 year to 1 year to 1 year to 1 year to
30 Sep 17 30 Sep 18 30 Sep 19 30 Sep 20 30 Sep 21
% % % % %
Global Equity Market Neutral Fund* H2 USD (Net)** 2.20*** 5.12*** (0.20)*** 10.97*** (3.89) US Federal Funds Rate 0.61 1.47 2.17 0.74**** 0.08
Please note the performance target is to be achieved over a specifi c annualised time period. Refer to the performance target section above within the Investment objective. Class H2 USD is disclosed as it is the representative share class.
* On 1 February 2017, the Global Equity Market Neutral Fund was launched. ** The representative share class has changed from the R$ Acc share class to the H2 USD share class with eff ect from August 2021. *** The performance history has been restated to refl ect the H2 USD share class. **** Benchmark performance has been restated due to a correction to the previous calculation. Past performance is not a guide to future performance. The performance data does not take account of the commissions and costs incurred on the
issue and redemption of shares.
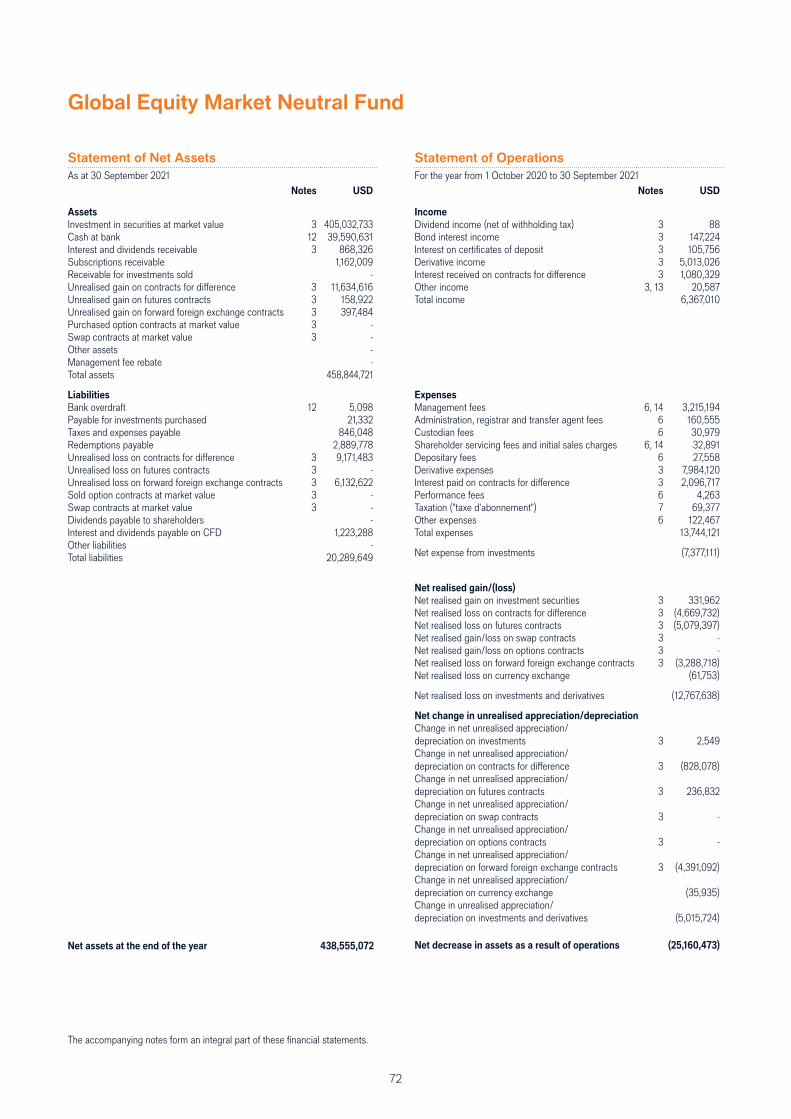
72
Global Equity Market Neutral Fund
Statement of Net Assets
As at 30 September 2021Notes USD
Assets
Investment in securities at market value 3 405,032,733 Cash at bank 12 39,590,631 Interest and dividends receivable 3 868,326 Subscriptions receivable 1,162,009 Receivable for investments sold -Unrealised gain on contracts for diff erence 3 11,634,616 Unrealised gain on futures contracts 3 158,922 Unrealised gain on forward foreign exchange contracts 3 397,484 Purchased option contracts at market value 3 -Swap contracts at market value 3 -Other assets -Management fee rebate -Total assets 458,844,721
Liabilities
Bank overdraft 12 5,098 Payable for investments purchased 21,332 Taxes and expenses payable 846,048 Redemptions payable 2,889,778 Unrealised loss on contracts for diff erence 3 9,171,483 Unrealised loss on futures contracts 3 -Unrealised loss on forward foreign exchange contracts 3 6,132,622 Sold option contracts at market value 3 -Swap contracts at market value 3 -Dividends payable to shareholders -Interest and dividends payable on CFD 1,223,288 Other liabilities -Total liabilities 20,289,649
Net assets at the end of the year 438,555,072
Statement of Operations
For the year from 1 October 2020 to 30 September 2021Notes USD
Income
Dividend income (net of withholding tax) 3 88 Bond interest income 3 147,224 Interest on certifi cates of deposit 3 105,756 Derivative income 3 5,013,026 Interest received on contracts for diff erence 3 1,080,329 Other income 3, 13 20,587 Total income 6,367,010
Expenses
Management fees 6, 14 3,215,194 Administration, registrar and transfer agent fees 6 160,555 Custodian fees 6 30,979 Shareholder servicing fees and initial sales charges 6, 14 32,891 Depositary fees 6 27,558 Derivative expenses 3 7,984,120 Interest paid on contracts for diff erence 3 2,096,717 Performance fees 6 4,263 Taxation ("taxe d'abonnement") 7 69,377 Other expenses 6 122,467 Total expenses 13,744,121
Net expense from investments (7,377,111)
Net realised gain/(loss)
Net realised gain on investment securities 3 331,962 Net realised loss on contracts for diff erence 3 (4,669,732) Net realised loss on futures contracts 3 (5,079,397) Net realised gain/loss on swap contracts 3 -Net realised gain/loss on options contracts 3 -Net realised loss on forward foreign exchange contracts 3 (3,288,718) Net realised loss on currency exchange (61,753)
Net realised loss on investments and derivatives (12,767,638)
Net change in unrealised appreciation/depreciation
Change in net unrealised appreciation/depreciation on investments 3 2,549 Change in net unrealised appreciation/depreciation on contracts for diff erence 3 (828,078) Change in net unrealised appreciation/depreciation on futures contracts 3 236,832 Change in net unrealised appreciation/depreciation on swap contracts 3 -Change in net unrealised appreciation/depreciation on options contracts 3 -Change in net unrealised appreciation/depreciation on forward foreign exchange contracts 3 (4,391,092) Change in net unrealised appreciation/depreciation on currency exchange (35,935) Change in unrealised appreciation/depreciation on investments and derivatives (5,015,724)
Net decrease in assets as a result of operations (25,160,473)
The accompanying notes form an integral part of these fi nancial statements.
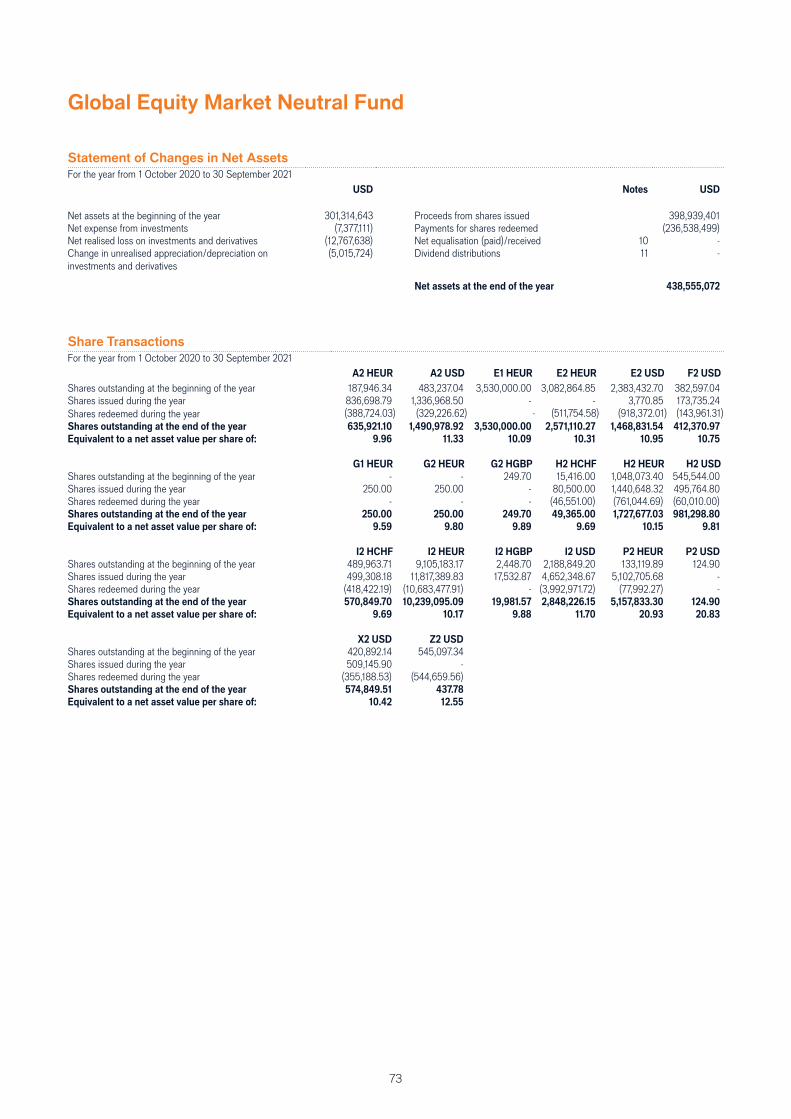
73
Global Equity Market Neutral Fund
Statement of Changes in Net Assets
For the year from 1 October 2020 to 30 September 2021USD Notes USD
Net assets at the beginning of the year 301,314,643 Proceeds from shares issued 398,939,401 Net expense from investments (7,377,111) Payments for shares redeemed (236,538,499) Net realised loss on investments and derivatives (12,767,638) Net equalisation (paid)/received 10 -Change in unrealised appreciation/depreciation on investments and derivatives
(5,015,724) Dividend distributions 11 -
Net assets at the end of the year 438,555,072
Share Transactions
For the year from 1 October 2020 to 30 September 2021A2 HEUR A2 USD E1 HEUR E2 HEUR E2 USD F2 USD
Shares outstanding at the beginning of the year 187,946.34 483,237.04 3,530,000.00 3,082,864.85 2,383,432.70 382,597.04Shares issued during the year 836,698.79 1,336,968.50 - - 3,770.85 173,735.24Shares redeemed during the year (388,724.03) (329,226.62) - (511,754.58) (918,372.01) (143,961.31)Shares outstanding at the end of the year 635,921.10 1,490,978.92 3,530,000.00 2,571,110.27 1,468,831.54 412,370.97
Equivalent to a net asset value per share of: 9.96 11.33 10.09 10.31 10.95 10.75
G1 HEUR G2 HEUR G2 HGBP H2 HCHF H2 HEUR H2 USD
Shares outstanding at the beginning of the year - - 249.70 15,416.00 1,048,073.40 545,544.00Shares issued during the year 250.00 250.00 - 80,500.00 1,440,648.32 495,764.80Shares redeemed during the year - - - (46,551.00) (761,044.69) (60,010.00)Shares outstanding at the end of the year 250.00 250.00 249.70 49,365.00 1,727,677.03 981,298.80
Equivalent to a net asset value per share of: 9.59 9.80 9.89 9.69 10.15 9.81
I2 HCHF I2 HEUR I2 HGBP I2 USD P2 HEUR P2 USD
Shares outstanding at the beginning of the year 489,963.71 9,105,183.17 2,448.70 2,188,849.20 133,119.89 124.90Shares issued during the year 499,308.18 11,817,389.83 17,532.87 4,652,348.67 5,102,705.68 -Shares redeemed during the year (418,422.19) (10,683,477.91) - (3,992,971.72) (77,992.27) -Shares outstanding at the end of the year 570,849.70 10,239,095.09 19,981.57 2,848,226.15 5,157,833.30 124.90
Equivalent to a net asset value per share of: 9.69 10.17 9.88 11.70 20.93 20.83
X2 USD Z2 USD
Shares outstanding at the beginning of the year 420,892.14 545,097.34Shares issued during the year 509,145.90 -Shares redeemed during the year (355,188.53) (544,659.56)Shares outstanding at the end of the year 574,849.51 437.78
Equivalent to a net asset value per share of: 10.42 12.55
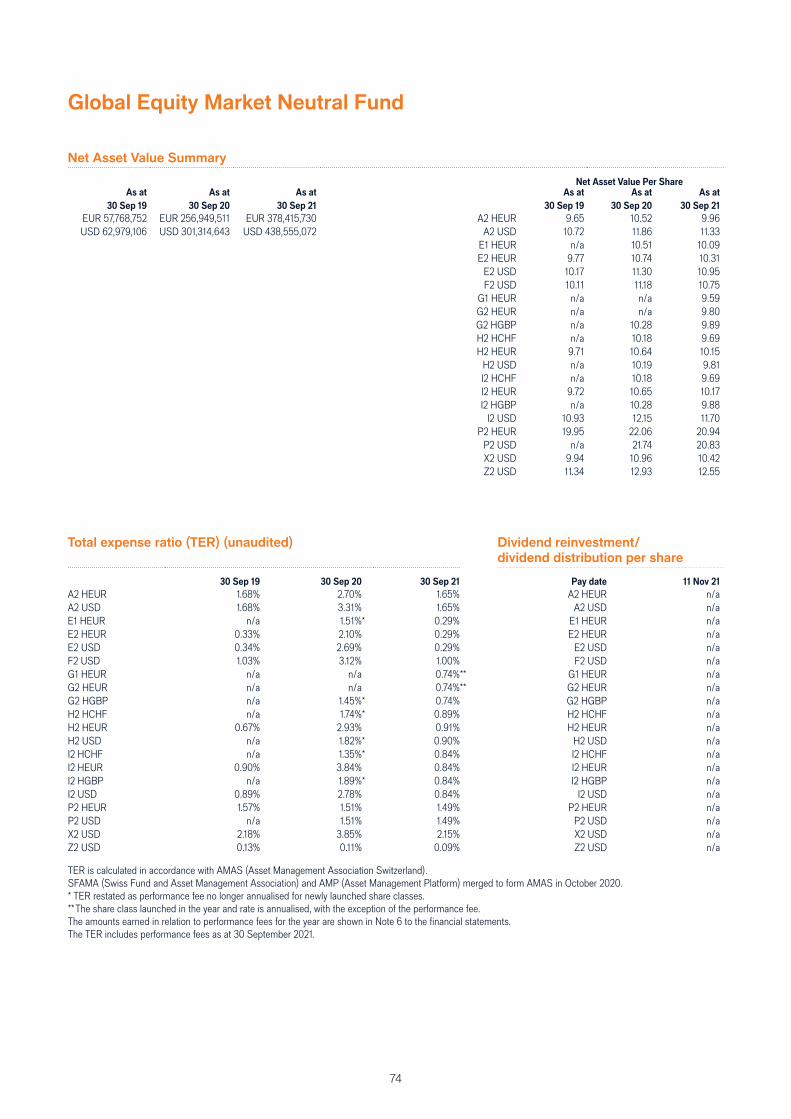
74
Net Asset Value Summary
Net Asset Value Per ShareAs at As at As at As at As at As at
30 Sep 19 30 Sep 20 30 Sep 21 30 Sep 19 30 Sep 20 30 Sep 21
EUR 57,768,752 EUR 256,949,511 EUR 378,415,730 A2 HEUR 9.65 10.52 9.96USD 62,979,106 USD 301,314,643 USD 438,555,072 A2 USD 10.72 11.86 11.33
E1 HEUR n/a 10.51 10.09E2 HEUR 9.77 10.74 10.31
E2 USD 10.17 11.30 10.95F2 USD 10.11 11.18 10.75
G1 HEUR n/a n/a 9.59G2 HEUR n/a n/a 9.80G2 HGBP n/a 10.28 9.89H2 HCHF n/a 10.18 9.69H2 HEUR 9.71 10.64 10.15
H2 USD n/a 10.19 9.81I2 HCHF n/a 10.18 9.69I2 HEUR 9.72 10.65 10.17I2 HGBP n/a 10.28 9.88
I2 USD 10.93 12.15 11.70P2 HEUR 19.95 22.06 20.94
P2 USD n/a 21.74 20.83X2 USD 9.94 10.96 10.42Z2 USD 11.34 12.93 12.55
Total expense ratio (TER) (unaudited) Dividend reinvestment/
dividend distribution per share
30 Sep 19 30 Sep 20 30 Sep 21 Pay date 11 Nov 21
A2 HEUR 1.68% 2.70% 1.65% A2 HEUR n/aA2 USD 1.68% 3.31% 1.65% A2 USD n/aE1 HEUR n/a 1.51%* 0.29% E1 HEUR n/aE2 HEUR 0.33% 2.10% 0.29% E2 HEUR n/aE2 USD 0.34% 2.69% 0.29% E2 USD n/aF2 USD 1.03% 3.12% 1.00% F2 USD n/aG1 HEUR n/a n/a 0.74%** G1 HEUR n/aG2 HEUR n/a n/a 0.74%** G2 HEUR n/aG2 HGBP n/a 1.45%* 0.74% G2 HGBP n/aH2 HCHF n/a 1.74%* 0.89% H2 HCHF n/aH2 HEUR 0.67% 2.93% 0.91% H2 HEUR n/aH2 USD n/a 1.82%* 0.90% H2 USD n/aI2 HCHF n/a 1.35%* 0.84% I2 HCHF n/aI2 HEUR 0.90% 3.84% 0.84% I2 HEUR n/aI2 HGBP n/a 1.89%* 0.84% I2 HGBP n/aI2 USD 0.89% 2.78% 0.84% I2 USD n/aP2 HEUR 1.57% 1.51% 1.49% P2 HEUR n/aP2 USD n/a 1.51% 1.49% P2 USD n/aX2 USD 2.18% 3.85% 2.15% X2 USD n/aZ2 USD 0.13% 0.11% 0.09% Z2 USD n/a
TER is calculated in accordance with AMAS (Asset Management Association Switzerland).SFAMA (Swiss Fund and Asset Management Association) and AMP (Asset Management Platform) merged to form AMAS in October 2020.* TER restated as performance fee no longer annualised for newly launched share classes.** The share class launched in the year and rate is annualised, with the exception of the performance fee.The amounts earned in relation to performance fees for the year are shown in Note 6 to the fi nancial statements.The TER includes performance fees as at 30 September 2021.
Global Equity Market Neutral Fund
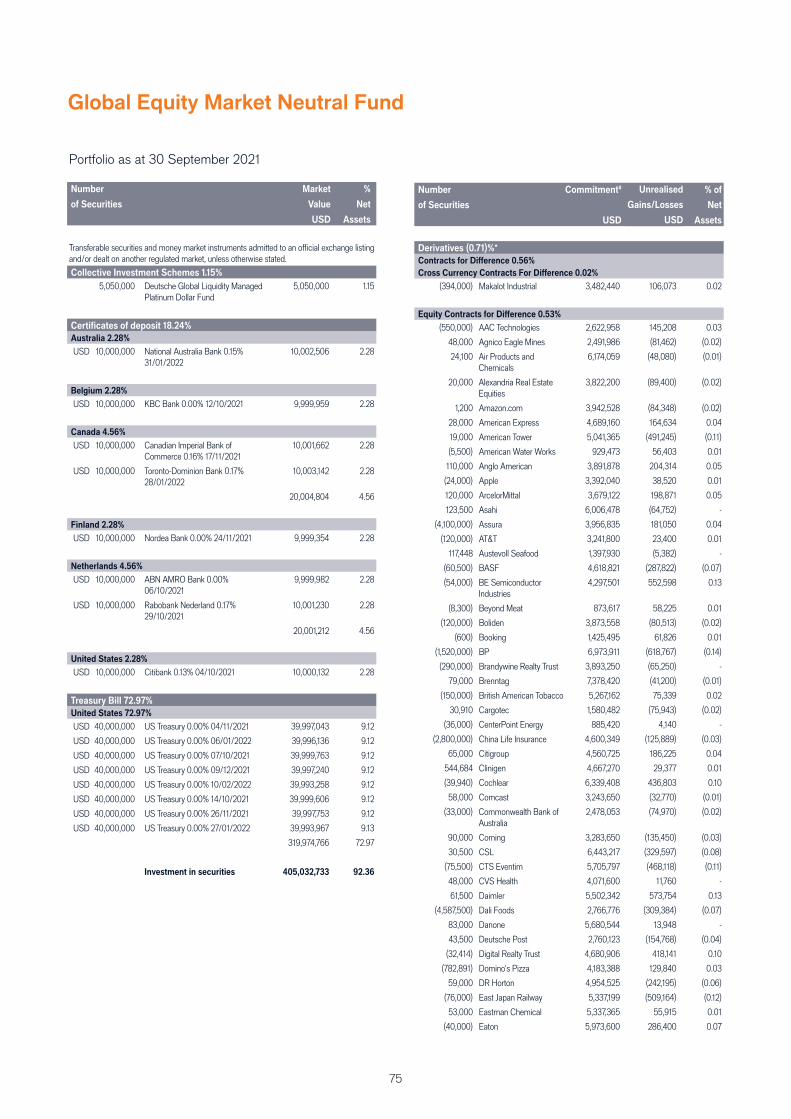
75
Global Equity Market Neutral Fund
Number
of Securities
Commitment#
USD
Market
Value
USD
% of
Net
Assets
Derivatives (0.71)%*
Contracts for Diff erence 0.56%
Cross Currency Contracts For Diff erence 0.02%
(394,000) Makalot Industrial 3,482,440 106,073 0.02
Equity Contracts for Diff erence 0.53%
(550,000) AAC Technologies 2,622,958 145,208 0.03
48,000 Agnico Eagle Mines 2,491,986 (81,462) (0.02)
24,100 Air Products and Chemicals
6,174,059 (48,080) (0.01)
20,000 Alexandria Real Estate Equities
3,822,200 (89,400) (0.02)
1,200 Amazon.com 3,942,528 (84,348) (0.02)
28,000 American Express 4,689,160 164,634 0.04
19,000 American Tower 5,041,365 (491,245) (0.11)
(5,500) American Water Works 929,473 56,403 0.01
110,000 Anglo American 3,891,878 204,314 0.05
(24,000) Apple 3,392,040 38,520 0.01
120,000 ArcelorMittal 3,679,122 198,871 0.05
123,500 Asahi 6,006,478 (64,752) -
(4,100,000) Assura 3,956,835 181,050 0.04
(120,000) AT&T 3,241,800 23,400 0.01
117,448 Austevoll Seafood 1,397,930 (5,382) -
(60,500) BASF 4,618,821 (287,822) (0.07)
(54,000) BE Semiconductor Industries
4,297,501 552,598 0.13
(8,300) Beyond Meat 873,617 58,225 0.01
(120,000) Boliden 3,873,558 (80,513) (0.02)
(600) Booking 1,425,495 61,826 0.01
(1,520,000) BP 6,973,911 (618,767) (0.14)
(290,000) Brandywine Realty Trust 3,893,250 (65,250) -
79,000 Brenntag 7,378,420 (41,200) (0.01)
(150,000) British American Tobacco 5,267,162 75,339 0.02
30,910 Cargotec 1,580,482 (75,943) (0.02)
(36,000) CenterPoint Energy 885,420 4,140 -
(2,800,000) China Life Insurance 4,600,349 (125,889) (0.03)
65,000 Citigroup 4,560,725 186,225 0.04
544,684 Clinigen 4,667,270 29,377 0.01
(39,940) Cochlear 6,339,408 436,803 0.10
58,000 Comcast 3,243,650 (32,770) (0.01)
(33,000) Commonwealth Bank of Australia
2,478,053 (74,970) (0.02)
90,000 Corning 3,283,650 (135,450) (0.03)
30,500 CSL 6,443,217 (329,597) (0.08)
(75,500) CTS Eventim 5,705,797 (468,118) (0.11)
48,000 CVS Health 4,071,600 11,760 -
61,500 Daimler 5,502,342 573,754 0.13
(4,587,500) Dali Foods 2,766,776 (309,384) (0.07)
83,000 Danone 5,680,544 13,948 -
43,500 Deutsche Post 2,760,123 (154,768) (0.04)
(32,414) Digital Realty Trust 4,680,906 418,141 0.10
(782,891) Domino's Pizza 4,183,388 129,840 0.03
59,000 DR Horton 4,954,525 (242,195) (0.06)
(76,000) East Japan Railway 5,337,199 (509,164) (0.12)
53,000 Eastman Chemical 5,337,365 55,915 0.01
(40,000) Eaton 5,973,600 286,400 0.07
Portfolio as at 30 September 2021 (continued)
Number
of Securities
Market
Value
USD
%
Net
Assets
Transferable securities and money market instruments admitted to an offi cial exchange listing and/or dealt on another regulated market, unless otherwise stated.
Collective Investment Schemes 1.15%
5,050,000 Deutsche Global Liquidity Managed Platinum Dollar Fund
5,050,000 1.15
Certifi cates of deposit 18.24%
Australia 2.28%
USD 10,000,000 National Australia Bank 0.15% 31/01/2022
10,002,506 2.28
Belgium 2.28%
USD 10,000,000 KBC Bank 0.00% 12/10/2021 9,999,959 2.28
Canada 4.56%
USD 10,000,000 Canadian Imperial Bank of Commerce 0.16% 17/11/2021
10,001,662 2.28
USD 10,000,000 Toronto-Dominion Bank 0.17% 28/01/2022
10,003,142 2.28
20,004,804 4.56
Finland 2.28%
USD 10,000,000 Nordea Bank 0.00% 24/11/2021 9,999,354 2.28
Netherlands 4.56%
USD 10,000,000 ABN AMRO Bank 0.00% 06/10/2021
9,999,982 2.28
USD 10,000,000 Rabobank Nederland 0.17% 29/10/2021
10,001,230 2.28
20,001,212 4.56
United States 2.28%
USD 10,000,000 Citibank 0.13% 04/10/2021 10,000,132 2.28
Treasury Bill 72.97%
United States 72.97%
USD 40,000,000 US Treasury 0.00% 04/11/2021 39,997,043 9.12
USD 40,000,000 US Treasury 0.00% 06/01/2022 39,996,136 9.12
USD 40,000,000 US Treasury 0.00% 07/10/2021 39,999,763 9.12
USD 40,000,000 US Treasury 0.00% 09/12/2021 39,997,240 9.12
USD 40,000,000 US Treasury 0.00% 10/02/2022 39,993,258 9.12
USD 40,000,000 US Treasury 0.00% 14/10/2021 39,999,606 9.12
USD 40,000,000 US Treasury 0.00% 26/11/2021 39,997,753 9.12
USD 40,000,000 US Treasury 0.00% 27/01/2022 39,993,967 9.13
319,974,766 72.97
Investment in securities 405,032,733 92.36
Unrealised
Gains/Losses
USD
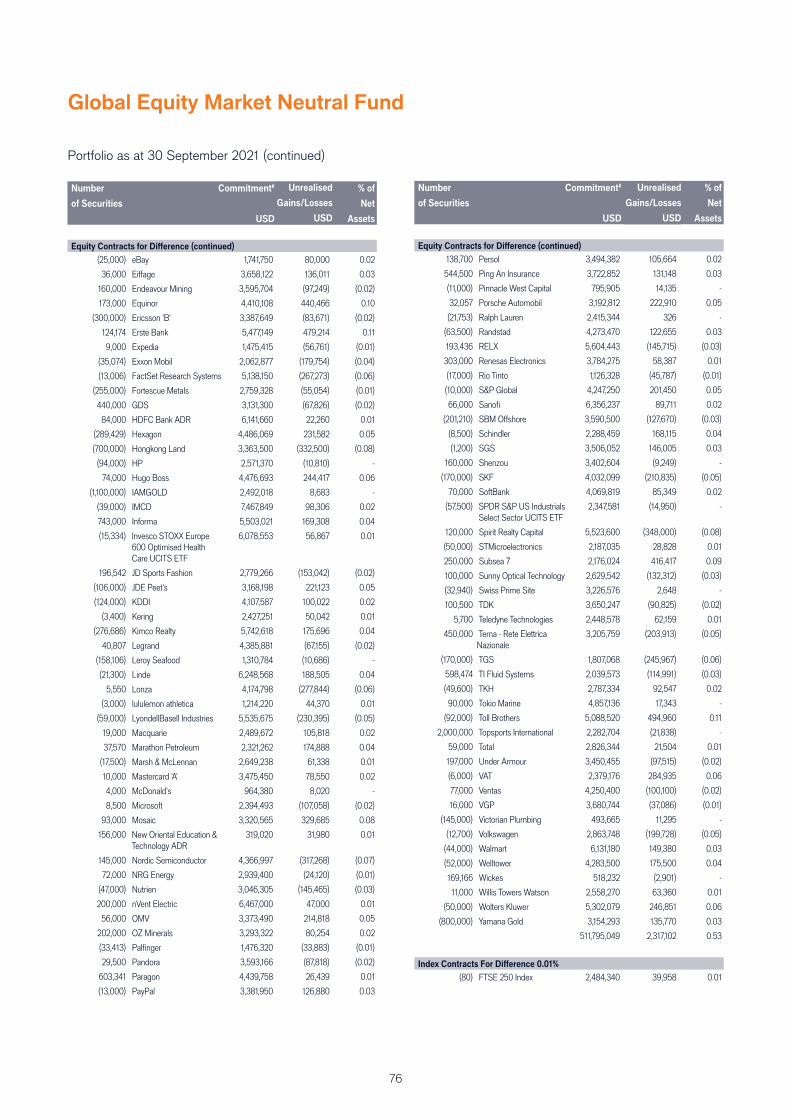
76
Global Equity Market Neutral Fund
Number
of Securities
Commitment#
USD
Market
Value
USD
% of
Net
Assets
Equity Contracts for Diff erence (continued)
(25,000) eBay 1,741,750 80,000 0.02
36,000 Eiff age 3,658,122 136,011 0.03
160,000 Endeavour Mining 3,595,704 (97,249) (0.02)
173,000 Equinor 4,410,108 440,466 0.10
(300,000) Ericsson 'B' 3,387,649 (83,671) (0.02)
124,174 Erste Bank 5,477,149 479,214 0.11
9,000 Expedia 1,475,415 (56,761) (0.01)
(35,074) Exxon Mobil 2,062,877 (179,754) (0.04)
(13,006) FactSet Research Systems 5,138,150 (267,273) (0.06)
(255,000) Fortescue Metals 2,759,328 (55,054) (0.01)
440,000 GDS 3,131,300 (67,826) (0.02)
84,000 HDFC Bank ADR 6,141,660 22,260 0.01
(289,429) Hexagon 4,486,069 231,582 0.05
(700,000) Hongkong Land 3,363,500 (332,500) (0.08)
(94,000) HP 2,571,370 (10,810) -
74,000 Hugo Boss 4,476,693 244,417 0.06
(1,100,000) IAMGOLD 2,492,018 8,683 -
(39,000) IMCD 7,467,849 98,306 0.02
743,000 Informa 5,503,021 169,308 0.04
(15,334) Invesco STOXX Europe 600 Optimised Health Care UCITS ETF
6,078,553 56,867 0.01
196,542 JD Sports Fashion 2,779,266 (153,042) (0.02)
(106,000) JDE Peet's 3,168,198 221,123 0.05
(124,000) KDDI 4,107,587 100,022 0.02
(3,400) Kering 2,427,251 50,042 0.01
(276,686) Kimco Realty 5,742,618 175,696 0.04
40,807 Legrand 4,385,881 (67,155) (0.02)
(158,106) Leroy Seafood 1,310,784 (10,686) -
(21,300) Linde 6,248,568 188,505 0.04
5,550 Lonza 4,174,798 (277,844) (0.06)
(3,000) lululemon athletica 1,214,220 44,370 0.01
(59,000) LyondellBasell Industries 5,535,675 (230,395) (0.05)
19,000 Macquarie 2,489,672 105,818 0.02
37,570 Marathon Petroleum 2,321,262 174,888 0.04
(17,500) Marsh & McLennan 2,649,238 61,338 0.01
10,000 Mastercard 'A' 3,475,450 78,550 0.02
4,000 McDonald's 964,380 8,020 -
8,500 Microsoft 2,394,493 (107,058) (0.02)
93,000 Mosaic 3,320,565 329,685 0.08
156,000 New Oriental Education & Technology ADR
319,020 31,980 0.01
145,000 Nordic Semiconductor 4,366,997 (317,268) (0.07)
72,000 NRG Energy 2,939,400 (24,120) (0.01)
(47,000) Nutrien 3,046,305 (145,465) (0.03)
200,000 nVent Electric 6,467,000 47,000 0.01
56,000 OMV 3,373,490 214,818 0.05
202,000 OZ Minerals 3,293,322 80,254 0.02
(33,413) Palfi nger 1,476,320 (33,883) (0.01)
29,500 Pandora 3,593,166 (87,818) (0.02)
603,341 Paragon 4,439,758 26,439 0.01
(13,000) PayPal 3,381,950 126,880 0.03
Number
of Securities
Commitment#
USD
Market
Value
USD
% of
Net
Assets
Equity Contracts for Diff erence (continued)
138,700 Persol 3,494,382 105,664 0.02
544,500 Ping An Insurance 3,722,852 131,148 0.03
(11,000) Pinnacle West Capital 795,905 14,135 -
32,057 Porsche Automobil 3,192,812 222,910 0.05
(21,753) Ralph Lauren 2,415,344 326 -
(63,500) Randstad 4,273,470 122,655 0.03
193,436 RELX 5,604,443 (145,715) (0.03)
303,000 Renesas Electronics 3,784,275 58,387 0.01
(17,000) Rio Tinto 1,126,328 (45,787) (0.01)
(10,000) S&P Global 4,247,250 201,450 0.05
66,000 Sanofi 6,356,237 89,711 0.02
(201,210) SBM Off shore 3,590,500 (127,670) (0.03)
(8,500) Schindler 2,288,459 168,115 0.04
(1,200) SGS 3,506,052 146,005 0.03
160,000 Shenzou 3,402,604 (9,249) -
(170,000) SKF 4,032,099 (210,835) (0.05)
70,000 SoftBank 4,069,819 85,349 0.02
(57,500) SPDR S&P US Industrials Select Sector UCITS ETF
2,347,581 (14,950) -
120,000 Spirit Realty Capital 5,523,600 (348,000) (0.08)
(50,000) STMicroelectronics 2,187,035 28,828 0.01
250,000 Subsea 7 2,176,024 416,417 0.09
100,000 Sunny Optical Technology 2,629,542 (132,312) (0.03)
(32,940) Swiss Prime Site 3,226,576 2,648 -
100,500 TDK 3,650,247 (90,825) (0.02)
5,700 Teledyne Technologies 2,448,578 62,159 0.01
450,000 Terna - Rete Elettrica Nazionale
3,205,759 (203,913) (0.05)
(170,000) TGS 1,807,068 (245,967) (0.06)
598,474 TI Fluid Systems 2,039,573 (114,991) (0.03)
(49,600) TKH 2,787,334 92,547 0.02
90,000 Tokio Marine 4,857,136 17,343 -
(92,000) Toll Brothers 5,088,520 494,960 0.11
2,000,000 Topsports International 2,282,704 (21,838) -
59,000 Total 2,826,344 21,504 0.01
197,000 Under Armour 3,450,455 (97,515) (0.02)
(6,000) VAT 2,379,176 284,935 0.06
77,000 Ventas 4,250,400 (100,100) (0.02)
16,000 VGP 3,680,744 (37,086) (0.01)
(145,000) Victorian Plumbing 493,665 11,295 -
(12,700) Volkswagen 2,863,748 (199,728) (0.05)
(44,000) Walmart 6,131,180 149,380 0.03
(52,000) Welltower 4,283,500 175,500 0.04
169,166 Wickes 518,232 (2,901) -
11,000 Willis Towers Watson 2,558,270 63,360 0.01
(50,000) Wolters Kluwer 5,302,079 246,851 0.06
(800,000) Yamana Gold 3,154,293 135,770 0.03
511,795,049 2,317,102 0.53
Index Contracts For Diff erence 0.01%
(80) FTSE 250 Index 2,484,340 39,958 0.01
Portfolio as at 30 September 2021 (continued)
Unrealised
Gains/Losses
USD
Unrealised
Gains/Losses
USD
77
Global Equity Market Neutral Fund
Number
of Securities
Commitment#
USD
Market
Value
USD
% of
Net
Assets
Futures 0.04%
(92) OSE TOPIX Index December 2021 107,192 0.03
(187) SGX S&P Nifty Index October 2021 51,730 0.01
158,922 0.04 Forward Foreign Exchange Contracts 0.03%
Buy AUD 12,03,143 : Sell USD 8,71,560 October 2021
(2,366) -
Buy CAD 24,25,959 : Sell USD 18,94,744 October 2021
20,147 -
Buy CZK 55,79,430 : Sell USD 2,57,158 October 2021
(2,228) -
Buy EUR 8,30,824 : Sell USD 9,75,188 October 2021
(11,858) -
Buy HKD 1,32,08,940 : Sell USD 16,96,811 October 2021
121 -
Buy JPY 2,02,40,000 : Sell USD 1,83,821 October 2021
(2,386) -
Buy JPY 2,48,40,000 : Sell USD 2,26,639 October 2021
(3,969) -
Buy JPY 2,77,27,200 : Sell USD 2,48,872 October 2021
(321) -
Buy JPY 3,12,80,000 : Sell USD 2,80,403 October 2021
(4) -
Buy SEK 95,14,405 : Sell USD 10,95,872 October 2021
(8,136) -
Buy USD 20,76,314 : Sell CHF 19,15,138 October 2021
22,023 0.01
Buy USD 4,061 : Sell EUR 3,459 October 2021
51 -
Buy USD 5,77,368 : Sell JPY 6,40,67,200 October 2021
3,058 -
Buy USD 50,16,203 : Sell JPY 54,89,97,986 October 2021
94,900 0.02
Buy USD 8,27,433 : Sell GBP 6,06,627 October 2021
9,459 -
118,491 0.03
Forward Foreign Exchange Contracts (Hedged share classes) (1.34%)
Buy CHF 4,87,301 : Sell USD 5,27,898 October 2021
(5,269) -
Buy CHF 56,30,822 : Sell USD 60,99,931 October 2021
(60,880) (0.01)
Buy EUR 1,25,018 : Sell USD 1,47,852 October 2021
(2,911) -
Buy EUR 1,29,658 : Sell USD 1,50,652 October 2021
(332) -
Buy EUR 1,77,67,209 : Sell USD 2,09,38,922 October 2021
(340,469) (0.08)
Buy EUR 10,84,62,936 : Sell USD 12,78,25,197 October 2021
(2,078,450) (0.47)
Buy EUR 11,67,04,909 : Sell USD 13,75,38,486 October 2021
(2,236,389) (0.51)
Buy EUR 178 : Sell USD 211 October 2021
(4) -
Buy EUR 2,409 : Sell USD 2,838 October 2021
(46) -
Buy EUR 2,463 : Sell USD 2,902 October 2021
(47) -
Buy EUR 2,86,62,672 : Sell USD 3,37,79,389 October 2021
(549,256) (0.13)
Buy EUR 21,785 : Sell USD 25,770 October 2021
(514) -
Number
of Securities
Commitment#
USD
Market
Value
USD
% of
Net
Assets
Forward Foreign Exchange Contracts (Hedged share classes) (continued)
Buy EUR 23,460 : Sell USD 27,613 October 2021
(414) -
Buy EUR 28,430 : Sell USD 33,387 October 2021
(427) -
Buy EUR 3,57,96,735 : Sell USD 4,21,86,989 October 2021
(685,965) (0.16)
Buy EUR 32,632 : Sell USD 38,283 October 2021
(450) -
Buy EUR 46,174 : Sell USD 54,048 October 2021
(516) -
Buy EUR 51,979 : Sell USD 60,843 October 2021
(581) -
Buy EUR 62,111 : Sell USD 72,860 October 2021
(852) -
Buy EUR 67,19,800 : Sell USD 79,19,385 October 2021
(128,770) (0.03)
Buy EUR 72,427 : Sell USD 85,774 October 2021
(1,806) -
Buy GBP 1,98,755 : Sell USD 2,74,918 October 2021
(6,919) -
Buy GBP 2,487 : Sell USD 3,439 October 2021
(87) -
Buy USD 1,00,330 : Sell EUR 84,895 October 2021
1,907 -
Buy USD 1,00,899 : Sell EUR 85,917 October 2021
1,291 -
Buy USD 1,01,399 : Sell EUR 85,620 October 2021
2,135 -
Buy USD 1,01,42,978 : Sell EUR 86,40,411 October 2021
125,699 0.03
Buy USD 1,03,387 : Sell EUR 87,481 October 2021
1,965 -
Buy USD 1,058 : Sell EUR 902 October 2021
12 -
Buy USD 1,476 : Sell EUR 1,256 October 2021
20 -
Buy USD 1,69,323 : Sell EUR 1,43,137 October 2021
3,377 -
Buy USD 1,85,455 : Sell EUR 1,58,259 October 2021
1,977 -
Buy USD 13,045 : Sell EUR 11,113 October 2021
162 -
Buy USD 15,067 : Sell EUR 12,784 October 2021
245 -
Buy USD 15,24,322 : Sell EUR 12,88,583 October 2021
30,400 0.01
Buy USD 165 : Sell EUR 141 October 2021
2 -
Buy USD 17,566 : Sell EUR 14,832 October 2021
370 -
Buy USD 19,26,244 : Sell EUR 16,49,479 October 2021
13,916 -
Buy USD 2 : Sell EUR 2 October 2021
- -
Buy USD 2 : Sell EUR 2 October 2021
- -
Buy USD 2,13,536 : Sell EUR 1,82,032 October 2021
2,496 -
Buy USD 20,71,495 : Sell EUR 17,62,268 October 2021
28,406 0.01
Buy USD 23,324 : Sell EUR 19,791 October 2021
379 -
Portfolio as at 30 September 2021 (continued)
Unrealised
Gains/Losses
USD
Unrealised
Gains/Losses
USD
78
Global Equity Market Neutral Fund
Number
of Securities
Commitment#
USD
Market
Value
USD
% of
Net
Assets
Forward Foreign Exchange Contracts (Hedged share classes) (continued)
Buy USD 26,892 : Sell EUR 22,908 October 2021
333 -
Buy USD 27,276 : Sell EUR 23,226 October 2021
349 -
Buy USD 28,248 : Sell EUR 24,079 October 2021
332 -
Buy USD 30,583 : Sell EUR 25,951 October 2021
497 -
Buy USD 402 : Sell EUR 341 October 2021
6 -
Buy USD 5,46,082 : Sell EUR 4,61,749 October 2021
10,753 -
Buy USD 5,67,494 : Sell EUR 4,79,854 October 2021
11,174 -
Buy USD 5,960 : Sell EUR 5,057 October 2021
97 -
Buy USD 55,838 : Sell EUR 47,597 October 2021
657 -
Buy USD 56,428 : Sell EUR 47,942 October 2021
846 -
Buy USD 591 : Sell GBP 427 October 2021
15 -
Buy USD 65,660 : Sell EUR 55,969 October 2021
772 -
Buy USD 7 : Sell GBP 5 October 2021
- -
Buy USD 7,420 : Sell CHF 6,849 October 2021
74 -
Buy USD 75,049 : Sell EUR 63,846 October 2021
1,029 -
Buy USD 79,986 : Sell CHF 73,835 October 2021
798 -
Buy USD 8,653 : Sell EUR 7,384 October 2021
92 -
Buy USD 8,854 : Sell EUR 7,487 October 2021
174 -
Buy USD 86,780 : Sell EUR 73,359 October 2021
1,731 -
Buy USD 89,345 : Sell EUR 75,812 October 2021
1,453 -
Buy USD 9,464 : Sell EUR 8,104 October 2021
68 -
Buy USD 9,888 : Sell EUR 8,367 October 2021
188 -
Buy USD 93,962 : Sell EUR 79,729 October 2021
1,528 -
(5,853,629) (1.34)
Investment in securities and derivatives 401,919,650 91.65
Other net assets 36,635,422 8.35
Total net assets 438,555,072 100.00
# In the case of derivative instruments, Commitment refers to the gross position taken by the Fund and is disclosed as an absolute value.
* In the case of derivative instruments, Market Value refers to the net profi t or loss and is used in the calculation of the Fund Net Asset Value.
Any diff erences in the percentage of Net Assets fi gures are the result of roundings.
Portfolio as at 30 September 2021 (continued) Top ten changes in the securities portfolio for the year
from 1 October 2020 to 30 September 2021
Description of Securities Purchases Maturities/Sales
USD USD
United States
US Treasury 0.00% 11/02/2021 - 30,000,000
US Treasury 0.00% 06/05/2021 - 30,000,000
US Treasury 0.00% 20/05/2021 - 30,000,000
US Treasury 0.00% 17/06/2021 - 30,000,000
US Treasury 0.00% 08/07/2021 39,999,584 40,000,000
US Treasury 0.00% 15/07/2021 39,998,693 40,000,000
US Treasury 0.00% 29/07/2021 39,998,628 40,000,000
US Treasury 0.00% 05/08/2021 39,997,889 40,000,000
US Treasury 0.00% 19/08/2021 39,998,938 40,000,000
US Treasury 0.00% 26/08/2021 39,997,783 40,000,000
US Treasury 0.00% 07/10/2021 39,995,917 -
US Treasury 0.00% 14/10/2021 39,995,886 -
US Treasury 0.00% 04/11/2021 39,994,828 -
US Treasury 0.00% 26/11/2021 39,994,150 -
Unrealised
Gains/Losses
USD
79
Global Multi-Strategy Fund
Investment report for the year from 1 October 2020 to 30 September 2021
Investment Fund Managers
David Elms and Steve Cain
The fund returned 4.5% (Net), 6.6% (Gross) based on Class H2 in Euro terms over the year under review, compared with a return of 0.0%
in the Euro Main Refi nancing Rate and a return of 7.0% in the Target Index + 7%, Euro terms.
The fund’s performance benefi ted from the COVID-19 vaccine announcements in November and high levels of capital market activity, which
more than off set a negative contribution from hedges. All the ‘risk-on’ strategies added value, with Risk Transfer and Price Pressure the
most positive. Within Portfolio Protection, macro hedges were a negative contributor.
The main contribution came from participating in new issuance within the convertibles market. Companies that felt the worst impact of the
pandemic used convertibles to raise capital, and the vaccine news led to a rally in these names. The sector continued to rally in the early
part of 2021 and we used the strength to reduce positions. However, the strategy was down marginally during the second quarter of 2021
as this strong primary issuance started to dry up and the terms were signifi cantly less attractive. Within ‘vanilla’ positions (types of call
or put options), selling pressure on technology names by long-only holders weighed on returns, as did credit hedges. However, the third
quarter was more positive. The standout performer was the position in the bonds of Australian payment service provider Afterpay, which
received a bid from US company Square. We also saw reasonable primary market activity return in September, which was profi table for the
fund.
Both merger and acquisition (M&A) and capital structure positions were positive. Within M&A, several positions closed after clearing all
required conditions. The position in GrandVision, which ended its drawn-out process of being acquired by EssilorLuxottica, was the most
positive. Within capital structure positions, the largest contribution came from the share class sub-strategy, where BHP’s announcement
on the unifi cation of its dual listings in the UK and Australia caused the spread to collapse from a premium of 25% to 5%. The fund also
benefi ted from the spread between the UK and Dutch lines of Unilever converging to zero with the simplifi cation in its capital structure.
Participation in special-purpose acquisition company new issuance also added value.
The Price Pressure strategy was positive. Within equities, deal activity remained strong. Initial public off erings (IPOs) and secondary trades
added the most value. Successful IPOs included Uruguayan payment solutions provider dLocal, customer engagement software platform
EngageSmart, European fund platform Allfunds and UK private equity fi rm Bridgepoint. However, UK-based Alphawave IP, which provides
telecommunication equipment to enable 5G, fell sharply on its debut. The fi xed income sub-strategy was broadly fl at, with generally small
positive returns, benefi ting from governments looking to raise funds for COVID-19 spending packages.
The Risk Transfer strategy was positive, with European dividends and repo adding the most value. Dividend yields reached multiyear lows
in the third quarter of 2020 and saw a strong reversal as the positive vaccine news emerged. The strong performance continued into 2021,
with both repo and dividends adding value. However, large issuance of structured products from investment banks in March led to hedging
activity by these banks, weighing on equity repo. Performance recovered as the European Central Bank announced in July that it would not
extend the limits that it had placed on bank dividend payments. We closed the long position and in September tilted towards a slightly short
position, as we believed the risk of some of the bank payouts coming as buybacks was not captured in the price. Dividend volatility also
continued to normalise, and this benefi ted the fund’s short dividend volatility versus long index volatility relative value positions.
The Equity Market Neutral strategy was positive. The vaccine news was the catalyst for a recovery in cyclical but solid companies, while
shares were also big benefi ciaries of the UK/EU trade deal. Renewed optimism led to a rotation away from growth into value stocks. The
prospect of a continued economic recovery as the vaccine roll-out progressed was positive for the strategy moving into 2021. We reduced
risk, taking the opportunity to increase positions in more defensive stocks. Positive performance continued into June, although worries about
the Delta variant of COVID-19 weakened growth expectations and infl ationary concerns abated somewhat. This weighed on performance
as bond yields declined and growth companies were once again favoured over value. However, this headwind trend reversed sharply in
September.
Macro hedges were the main negative impact, with trend following fl at and systematic long volatility a small positive. As equity markets
moved higher, asset class volatility generally moved lower and credit tightened further, which weighed on hedging positions. Markets rallied
on the vaccine news, and equity hedges detracted sharply. Credit market tightening also weighed on credit hedges implemented during the
fi rst quarter of 2021. Additionally, currency volatility positions detracted.
Activity has picked up sharply, as anticipated, following the usual summer lull. We saw robust supply across equity and debt markets
as issuers took advantage of broadly favourable economic conditions. M&A hit record levels and corporates continued to pursue spin-
off s, asset sales, buybacks and other actions. Volatility has also picked up as energy prices have spiked worldwide, while infl ation has
potentially proved more than just transient. This combination of high activity and rising uncertainty tends to create short and medium-term
opportunities for many of the fund’s strategies. Thus, we are constructive as we head into the fi nal quarter of 2021.
80
Global Multi-Strategy Fund
Investment objective and policy
The fund aims to provide a positive (absolute) return, regardless of market conditions, over any 12 month period. A positive return is not guaranteed over this or any other time period, and particularly over the shorter term the fund may experience periods of negative returns. Consequently your capital is at risk.
Performance target: To outperform the Euro Main Refi nancing Rate by 7% per annum, before the deduction of charges, over any 3 year period.
The fund invests in a global portfolio of assets including shares of companies, investment grade and non-investment grade bonds issued by governments and companies (including convertible bonds, contingent convertible bonds and distressed securities), and makes extensive use of derivatives (complex fi nancial instruments), including total return swaps, to take both ‘long’ and ‘short’ positions in companies and bonds that the Investment Manager believes will either rise in value (long positions) or fall in value (short positions) meaning that the fund may benefi t from either scenario.
The fund will hold a signifi cant proportion of its assets in cash and money market instruments as a result of holding derivatives or for asset allocation purposes.
The fund may also take long or short exposures to other asset classes such as commodities and may hold other funds (such as collective investment schemes (CIS) and exchange traded funds).
The fund is actively managed and makes reference to the Euro Main Refi nancing Rate, as this forms the basis of the fund’s performance target and the level above which performance fees may be charged (if applicable). For currency hedged share classes, the rate that corresponds with the relevant share class currency is used as the basis of the performance comparison and for calculating performance fees. The Investment Manager has complete discretion to choose investments for the fund and is not constrained by a benchmark.
Strategy
The Investment Manager adopts a multi-strategy approach, utilising a diverse range of investment styles, techniques, assets, company sizes, time horizons and markets with the aim of providing a positive return.
Long positions may be held through a combination of direct investment and/or derivative instruments, whilst the short positions are achieved entirely through derivative instruments.
The use of derivatives is extensive and forms an important part of the investment strategy.
How sustainability risks are part of the investment process
The investments underlying this fi nancial product (referred to as the fund) do not take into account the EU criteria for environmentally sustainable economic activities, although the Management Company and the Investment Manager have agreed a decision making process that will apply to investment decisions relating to the fund as further detailed in the prospectus.
The likely impacts of sustainability risks on the returns of the fund
While the analysis of (Environmental, Social and Governance) ESG factors is an integral component across the Investment Manager’s investment capabilities and one of a number of inputs to the selection of investments and portfolio construction, the investment process of the Investment Manager is primarily designed to maximise long-term risk-adjusted returns for investors. Therefore, in managing the fund, the Investment Manager does not maximise portfolio alignment with sustainability risks as a separate goal in its own right nor does it precisely attribute the impact of ESG factors on returns for the fund.
Performance history (unaudited)
Fund & Benchmark Since launch to
30 Sep 20
1 year to
30 Sep 21
% %
Global Multi-Strategy Fund* H2 EUR (Net)** (1.32)*** 4.54 Euro Main Refi nancing Rate 0.00 0.00
Global Multi-Strategy Fund* H2 EUR (Gross)** (0.93)*** 6.60
Euro Main Refi nancing Rate + 7% 2.23 7.00
Please note the performance target is to be achieved over a specifi c annualised time period. Refer to the performance target wording within the investment objective above. Class H2 EUR is disclosed as it is the representative share class. * On 3 June 2020, the Global Multi-Strategy Fund was launched. ** The representative share class has changed from the R€ Acc share class to the H2 EUR share class with eff ect from August 2021.*** The performance history has been restated to refl ect the H2 EUR share class. Past performance is not a guide to future performance. The performance data does not take account of the commissions and costs incurred on the
issue and redemption of shares.
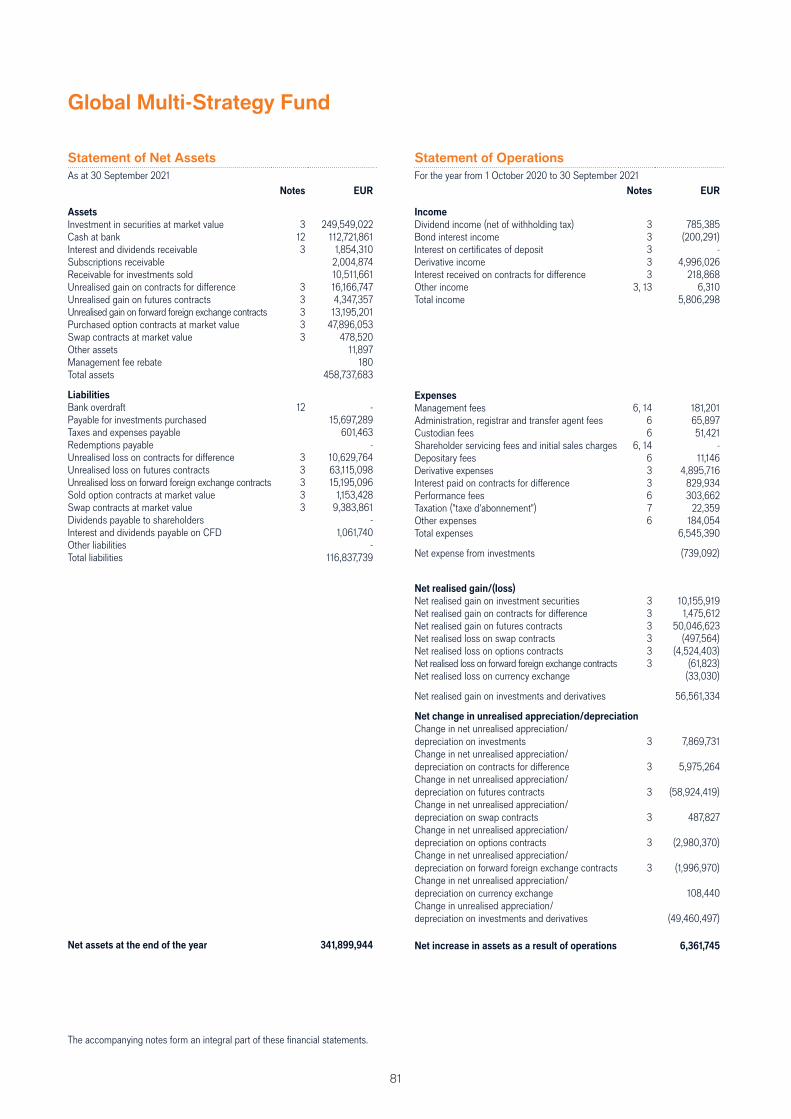
81
Global Multi-Strategy Fund
Statement of Net Assets
As at 30 September 2021Notes EUR
Assets
Investment in securities at market value 3 249,549,022 Cash at bank 12 112,721,861 Interest and dividends receivable 3 1,854,310 Subscriptions receivable 2,004,874 Receivable for investments sold 10,511,661 Unrealised gain on contracts for diff erence 3 16,166,747 Unrealised gain on futures contracts 3 4,347,357 Unrealised gain on forward foreign exchange contracts 3 13,195,201 Purchased option contracts at market value 3 47,896,053 Swap contracts at market value 3 478,520 Other assets 11,897 Management fee rebate 180 Total assets 458,737,683
Liabilities
Bank overdraft 12 -Payable for investments purchased 15,697,289 Taxes and expenses payable 601,463 Redemptions payable -Unrealised loss on contracts for diff erence 3 10,629,764 Unrealised loss on futures contracts 3 63,115,098 Unrealised loss on forward foreign exchange contracts 3 15,195,096 Sold option contracts at market value 3 1,153,428 Swap contracts at market value 3 9,383,861 Dividends payable to shareholders -Interest and dividends payable on CFD 1,061,740 Other liabilities -Total liabilities 116,837,739
Net assets at the end of the year 341,899,944
Statement of Operations
For the year from 1 October 2020 to 30 September 2021Notes EUR
Income
Dividend income (net of withholding tax) 3 785,385 Bond interest income 3 (200,291) Interest on certifi cates of deposit 3 -Derivative income 3 4,996,026 Interest received on contracts for diff erence 3 218,868 Other income 3, 13 6,310 Total income 5,806,298
Expenses
Management fees 6, 14 181,201 Administration, registrar and transfer agent fees 6 65,897 Custodian fees 6 51,421 Shareholder servicing fees and initial sales charges 6, 14 -Depositary fees 6 11,146 Derivative expenses 3 4,895,716 Interest paid on contracts for diff erence 3 829,934 Performance fees 6 303,662 Taxation ("taxe d'abonnement") 7 22,359 Other expenses 6 184,054 Total expenses 6,545,390
Net expense from investments (739,092)
Net realised gain/(loss)
Net realised gain on investment securities 3 10,155,919 Net realised gain on contracts for diff erence 3 1,475,612 Net realised gain on futures contracts 3 50,046,623 Net realised loss on swap contracts 3 (497,564) Net realised loss on options contracts 3 (4,524,403) Net realised loss on forward foreign exchange contracts 3 (61,823) Net realised loss on currency exchange (33,030)
Net realised gain on investments and derivatives 56,561,334
Net change in unrealised appreciation/depreciation
Change in net unrealised appreciation/depreciation on investments 3 7,869,731 Change in net unrealised appreciation/depreciation on contracts for diff erence 3 5,975,264 Change in net unrealised appreciation/depreciation on futures contracts 3 (58,924,419) Change in net unrealised appreciation/depreciation on swap contracts 3 487,827 Change in net unrealised appreciation/depreciation on options contracts 3 (2,980,370) Change in net unrealised appreciation/depreciation on forward foreign exchange contracts 3 (1,996,970) Change in net unrealised appreciation/depreciation on currency exchange 108,440 Change in unrealised appreciation/depreciation on investments and derivatives (49,460,497)
Net increase in assets as a result of operations 6,361,745
The accompanying notes form an integral part of these fi nancial statements.
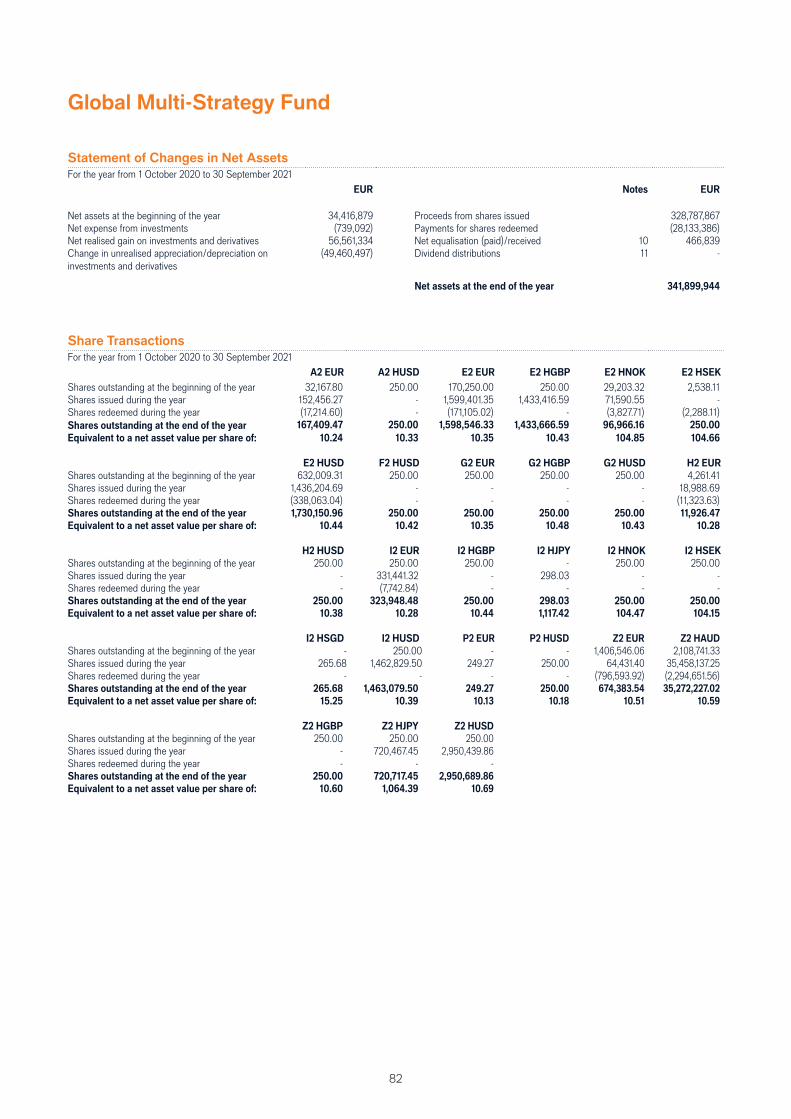
82
Global Multi-Strategy Fund
Share Transactions
For the year from 1 October 2020 to 30 September 2021A2 EUR A2 HUSD E2 EUR E2 HGBP E2 HNOK E2 HSEK
Shares outstanding at the beginning of the year 32,167.80 250.00 170,250.00 250.00 29,203.32 2,538.11Shares issued during the year 152,456.27 - 1,599,401.35 1,433,416.59 71,590.55 -Shares redeemed during the year (17,214.60) - (171,105.02) - (3,827.71) (2,288.11)Shares outstanding at the end of the year 167,409.47 250.00 1,598,546.33 1,433,666.59 96,966.16 250.00
Equivalent to a net asset value per share of: 10.24 10.33 10.35 10.43 104.85 104.66
E2 HUSD F2 HUSD G2 EUR G2 HGBP G2 HUSD H2 EUR
Shares outstanding at the beginning of the year 632,009.31 250.00 250.00 250.00 250.00 4,261.41Shares issued during the year 1,436,204.69 - - - - 18,988.69Shares redeemed during the year (338,063.04) - - - - (11,323.63)Shares outstanding at the end of the year 1,730,150.96 250.00 250.00 250.00 250.00 11,926.47
Equivalent to a net asset value per share of: 10.44 10.42 10.35 10.48 10.43 10.28
H2 HUSD I2 EUR I2 HGBP I2 HJPY I2 HNOK I2 HSEK
Shares outstanding at the beginning of the year 250.00 250.00 250.00 - 250.00 250.00Shares issued during the year - 331,441.32 - 298.03 - -Shares redeemed during the year - (7,742.84) - - - -Shares outstanding at the end of the year 250.00 323,948.48 250.00 298.03 250.00 250.00
Equivalent to a net asset value per share of: 10.38 10.28 10.44 1,117.42 104.47 104.15
I2 HSGD I2 HUSD P2 EUR P2 HUSD Z2 EUR Z2 HAUD
Shares outstanding at the beginning of the year - 250.00 - - 1,406,546.06 2,108,741.33Shares issued during the year 265.68 1,462,829.50 249.27 250.00 64,431.40 35,458,137.25Shares redeemed during the year - - - - (796,593.92) (2,294,651.56)Shares outstanding at the end of the year 265.68 1,463,079.50 249.27 250.00 674,383.54 35,272,227.02
Equivalent to a net asset value per share of: 15.25 10.39 10.13 10.18 10.51 10.59
Z2 HGBP Z2 HJPY Z2 HUSD
Shares outstanding at the beginning of the year 250.00 250.00 250.00Shares issued during the year - 720,467.45 2,950,439.86Shares redeemed during the year - - -Shares outstanding at the end of the year 250.00 720,717.45 2,950,689.86
Equivalent to a net asset value per share of: 10.60 1,064.39 10.69
Statement of Changes in Net Assets
For the year from 1 October 2020 to 30 September 2021EUR Notes EUR
Net assets at the beginning of the year 34,416,879 Proceeds from shares issued 328,787,867 Net expense from investments (739,092) Payments for shares redeemed (28,133,386) Net realised gain on investments and derivatives 56,561,334 Net equalisation (paid)/received 10 466,839 Change in unrealised appreciation/depreciation on investments and derivatives
(49,460,497) Dividend distributions 11 -
Net assets at the end of the year 341,899,944
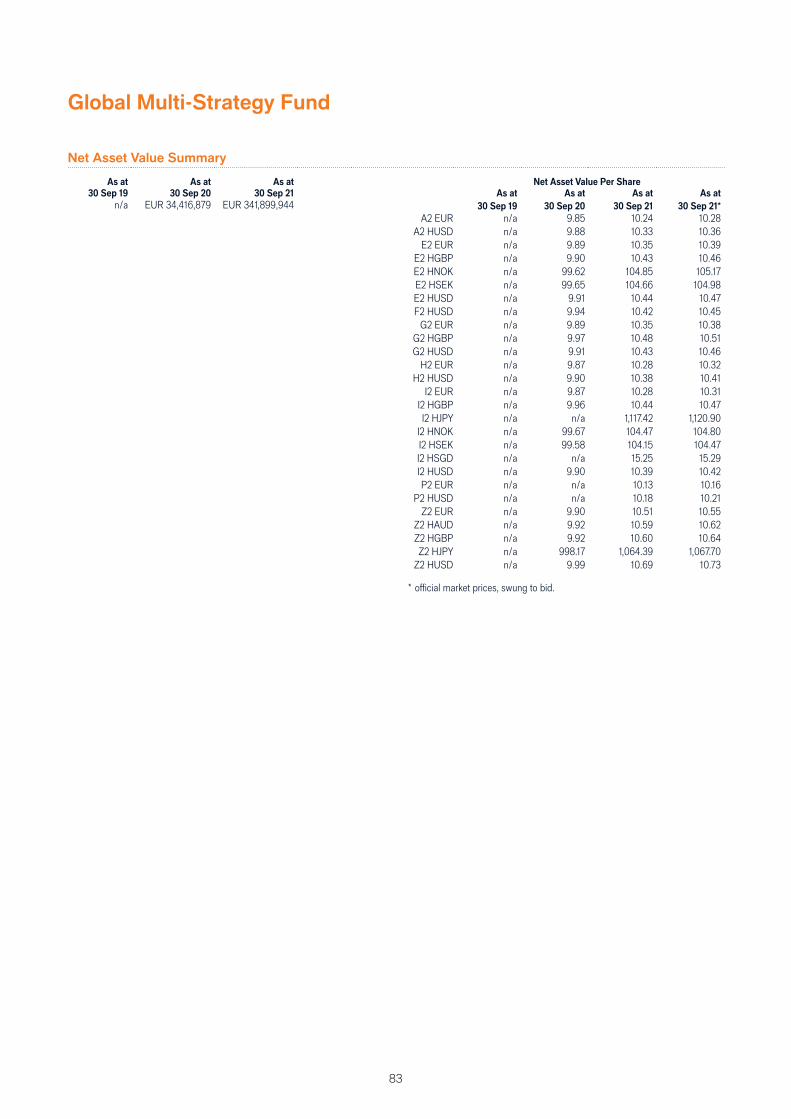
83
Global Multi-Strategy Fund
Net Asset Value Summary
As at As at As at Net Asset Value Per Share
30 Sep 19 30 Sep 20 30 Sep 21 As at As at As at As at
n/a EUR 34,416,879 EUR 341,899,944 30 Sep 19 30 Sep 20 30 Sep 21 30 Sep 21*
A2 EUR n/a 9.85 10.24 10.28A2 HUSD n/a 9.88 10.33 10.36
E2 EUR n/a 9.89 10.35 10.39E2 HGBP n/a 9.90 10.43 10.46E2 HNOK n/a 99.62 104.85 105.17E2 HSEK n/a 99.65 104.66 104.98E2 HUSD n/a 9.91 10.44 10.47F2 HUSD n/a 9.94 10.42 10.45
G2 EUR n/a 9.89 10.35 10.38G2 HGBP n/a 9.97 10.48 10.51G2 HUSD n/a 9.91 10.43 10.46
H2 EUR n/a 9.87 10.28 10.32H2 HUSD n/a 9.90 10.38 10.41
I2 EUR n/a 9.87 10.28 10.31I2 HGBP n/a 9.96 10.44 10.47I2 HJPY n/a n/a 1,117.42 1,120.90
I2 HNOK n/a 99.67 104.47 104.80I2 HSEK n/a 99.58 104.15 104.47I2 HSGD n/a n/a 15.25 15.29I2 HUSD n/a 9.90 10.39 10.42P2 EUR n/a n/a 10.13 10.16
P2 HUSD n/a n/a 10.18 10.21Z2 EUR n/a 9.90 10.51 10.55
Z2 HAUD n/a 9.92 10.59 10.62Z2 HGBP n/a 9.92 10.60 10.64Z2 HJPY n/a 998.17 1,064.39 1,067.70
Z2 HUSD n/a 9.99 10.69 10.73
* offi cial market prices, swung to bid.
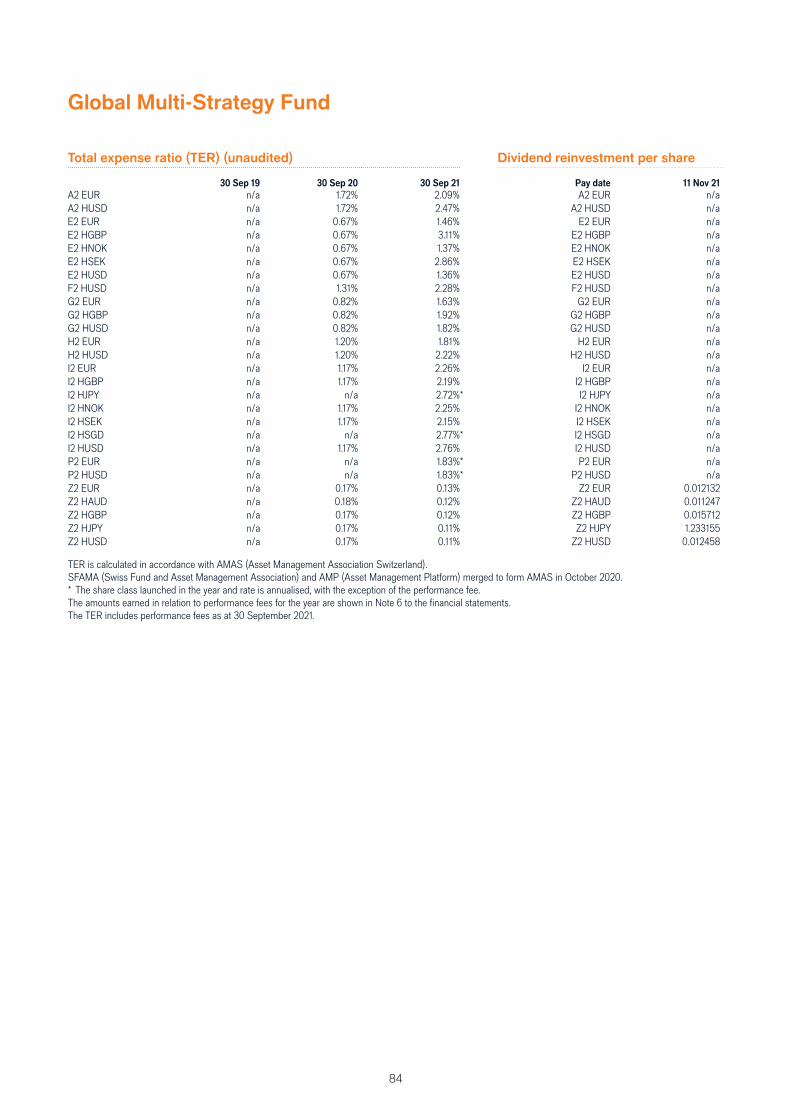
84
Global Multi-Strategy Fund
Total expense ratio (TER) (unaudited) Dividend reinvestment per share
30 Sep 19 30 Sep 20 30 Sep 21 Pay date 11 Nov 21
A2 EUR n/a 1.72% 2.09% A2 EUR n/aA2 HUSD n/a 1.72% 2.47% A2 HUSD n/aE2 EUR n/a 0.67% 1.46% E2 EUR n/aE2 HGBP n/a 0.67% 3.11% E2 HGBP n/aE2 HNOK n/a 0.67% 1.37% E2 HNOK n/aE2 HSEK n/a 0.67% 2.86% E2 HSEK n/aE2 HUSD n/a 0.67% 1.36% E2 HUSD n/aF2 HUSD n/a 1.31% 2.28% F2 HUSD n/aG2 EUR n/a 0.82% 1.63% G2 EUR n/aG2 HGBP n/a 0.82% 1.92% G2 HGBP n/aG2 HUSD n/a 0.82% 1.82% G2 HUSD n/aH2 EUR n/a 1.20% 1.81% H2 EUR n/aH2 HUSD n/a 1.20% 2.22% H2 HUSD n/aI2 EUR n/a 1.17% 2.26% I2 EUR n/aI2 HGBP n/a 1.17% 2.19% I2 HGBP n/aI2 HJPY n/a n/a 2.72%* I2 HJPY n/aI2 HNOK n/a 1.17% 2.25% I2 HNOK n/aI2 HSEK n/a 1.17% 2.15% I2 HSEK n/aI2 HSGD n/a n/a 2.77%* I2 HSGD n/aI2 HUSD n/a 1.17% 2.76% I2 HUSD n/aP2 EUR n/a n/a 1.83%* P2 EUR n/aP2 HUSD n/a n/a 1.83%* P2 HUSD n/aZ2 EUR n/a 0.17% 0.13% Z2 EUR 0.012132 Z2 HAUD n/a 0.18% 0.12% Z2 HAUD 0.011247 Z2 HGBP n/a 0.17% 0.12% Z2 HGBP 0.015712 Z2 HJPY n/a 0.17% 0.11% Z2 HJPY 1.233155 Z2 HUSD n/a 0.17% 0.11% Z2 HUSD 0.012458
TER is calculated in accordance with AMAS (Asset Management Association Switzerland).SFAMA (Swiss Fund and Asset Management Association) and AMP (Asset Management Platform) merged to form AMAS in October 2020.* The share class launched in the year and rate is annualised, with the exception of the performance fee.The amounts earned in relation to performance fees for the year are shown in Note 6 to the fi nancial statements.The TER includes performance fees as at 30 September 2021.
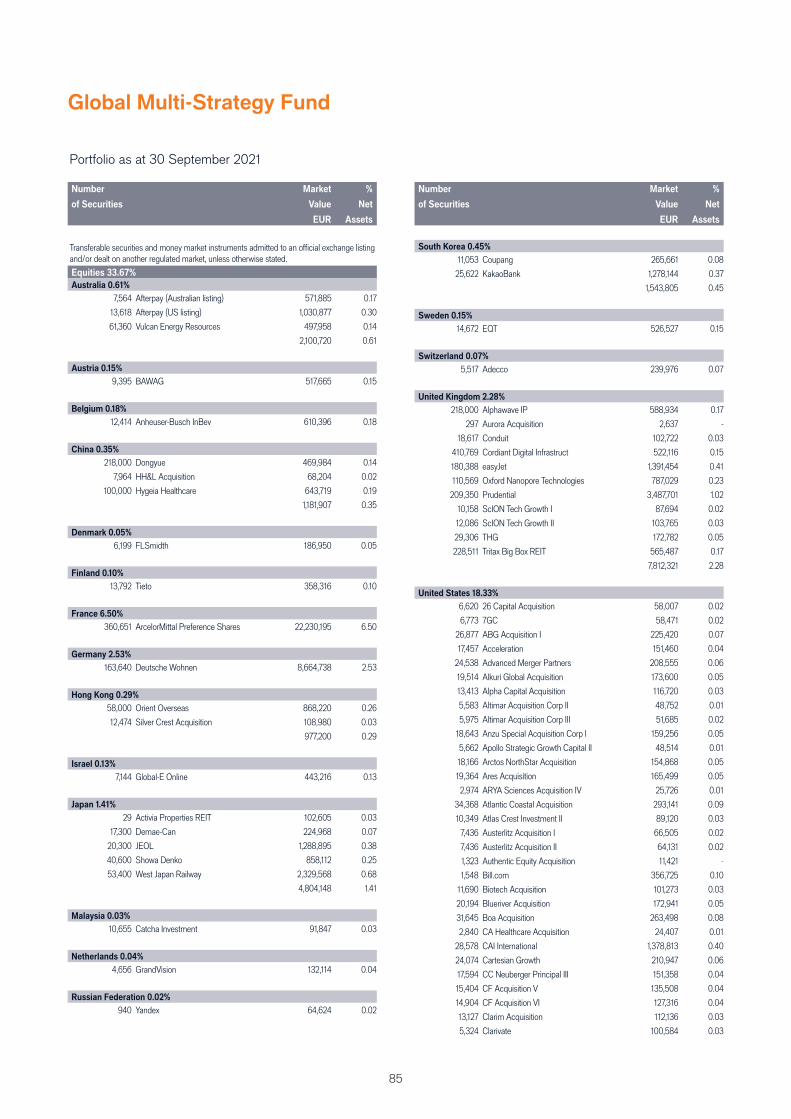
85
Global Multi-Strategy Fund
Portfolio as at 30 September 2021 (continued)
Number
of Securities
Market
Value
EUR
%
Net
Assets
Transferable securities and money market instruments admitted to an offi cial exchange listing and/or dealt on another regulated market, unless otherwise stated.
Equities 33.67%
Australia 0.61%
7,564 Afterpay (Australian listing) 571,885 0.17
13,618 Afterpay (US listing) 1,030,877 0.30
61,360 Vulcan Energy Resources 497,958 0.14
2,100,720 0.61
Austria 0.15%
9,395 BAWAG 517,665 0.15
Belgium 0.18%
12,414 Anheuser-Busch InBev 610,396 0.18
China 0.35%
218,000 Dongyue 469,984 0.14
7,964 HH&L Acquisition 68,204 0.02
100,000 Hygeia Healthcare 643,719 0.19
1,181,907 0.35
Denmark 0.05%
6,199 FLSmidth 186,950 0.05
Finland 0.10%
13,792 Tieto 358,316 0.10
France 6.50%
360,651 ArcelorMittal Preference Shares 22,230,195 6.50
Germany 2.53%
163,640 Deutsche Wohnen 8,664,738 2.53
Hong Kong 0.29%
58,000 Orient Overseas 868,220 0.26
12,474 Silver Crest Acquisition 108,980 0.03
977,200 0.29
Israel 0.13%
7,144 Global-E Online 443,216 0.13
Japan 1.41%
29 Activia Properties REIT 102,605 0.03
17,300 Demae-Can 224,968 0.07
20,300 JEOL 1,288,895 0.38
40,600 Showa Denko 858,112 0.25
53,400 West Japan Railway 2,329,568 0.68
4,804,148 1.41
Malaysia 0.03%
10,655 Catcha Investment 91,847 0.03
Netherlands 0.04%
4,656 GrandVision 132,114 0.04
Russian Federation 0.02%
940 Yandex 64,624 0.02
Portfolio as at 30 September 2021 (continued)
Number
of Securities
Market
Value
EUR
%
Net
Assets
South Korea 0.45%
11,053 Coupang 265,661 0.08
25,622 KakaoBank 1,278,144 0.37
1,543,805 0.45
Sweden 0.15%
14,672 EQT 526,527 0.15
Switzerland 0.07%
5,517 Adecco 239,976 0.07
United Kingdom 2.28%
218,000 Alphawave IP 588,934 0.17
297 Aurora Acquisition 2,637 -
18,617 Conduit 102,722 0.03
410,769 Cordiant Digital Infrastruct 522,116 0.15
180,388 easyJet 1,391,454 0.41
110,569 Oxford Nanopore Technologies 787,029 0.23
209,350 Prudential 3,487,701 1.02
10,158 ScION Tech Growth I 87,694 0.02
12,086 ScION Tech Growth II 103,765 0.03
29,306 THG 172,782 0.05
228,511 Tritax Big Box REIT 565,487 0.17
7,812,321 2.28
United States 18.33%
6,620 26 Capital Acquisition 58,007 0.02
6,773 7GC 58,471 0.02
26,877 ABG Acquisition I 225,420 0.07
17,457 Acceleration 151,460 0.04
24,538 Advanced Merger Partners 208,555 0.06
19,514 Alkuri Global Acquisition 173,600 0.05
13,413 Alpha Capital Acquisition 116,720 0.03
5,583 Altimar Acquisition Corp II 48,752 0.01
5,975 Altimar Acquisition Corp III 51,685 0.02
18,643 Anzu Special Acquisition Corp I 159,256 0.05
5,662 Apollo Strategic Growth Capital II 48,514 0.01
18,166 Arctos NorthStar Acquisition 154,868 0.05
19,364 Ares Acquisition 165,499 0.05
2,974 ARYA Sciences Acquisition IV 25,726 0.01
34,368 Atlantic Coastal Acquisition 293,141 0.09
10,349 Atlas Crest Investment II 89,120 0.03
7,436 Austerlitz Acquisition I 66,505 0.02
7,436 Austerlitz Acquisition II 64,131 0.02
1,323 Authentic Equity Acquisition 11,421 -
1,548 Bill.com 356,725 0.10
11,690 Biotech Acquisition 101,273 0.03
20,194 Blueriver Acquisition 172,941 0.05
31,645 Boa Acquisition 263,498 0.08
2,840 CA Healthcare Acquisition 24,407 0.01
28,578 CAI International 1,378,813 0.40
24,074 Cartesian Growth 210,947 0.06
17,594 CC Neuberger Principal III 151,358 0.04
15,404 CF Acquisition V 135,508 0.04
14,904 CF Acquisition VI 127,316 0.04
13,127 Clarim Acquisition 112,136 0.03
5,324 Clarivate 100,584 0.03
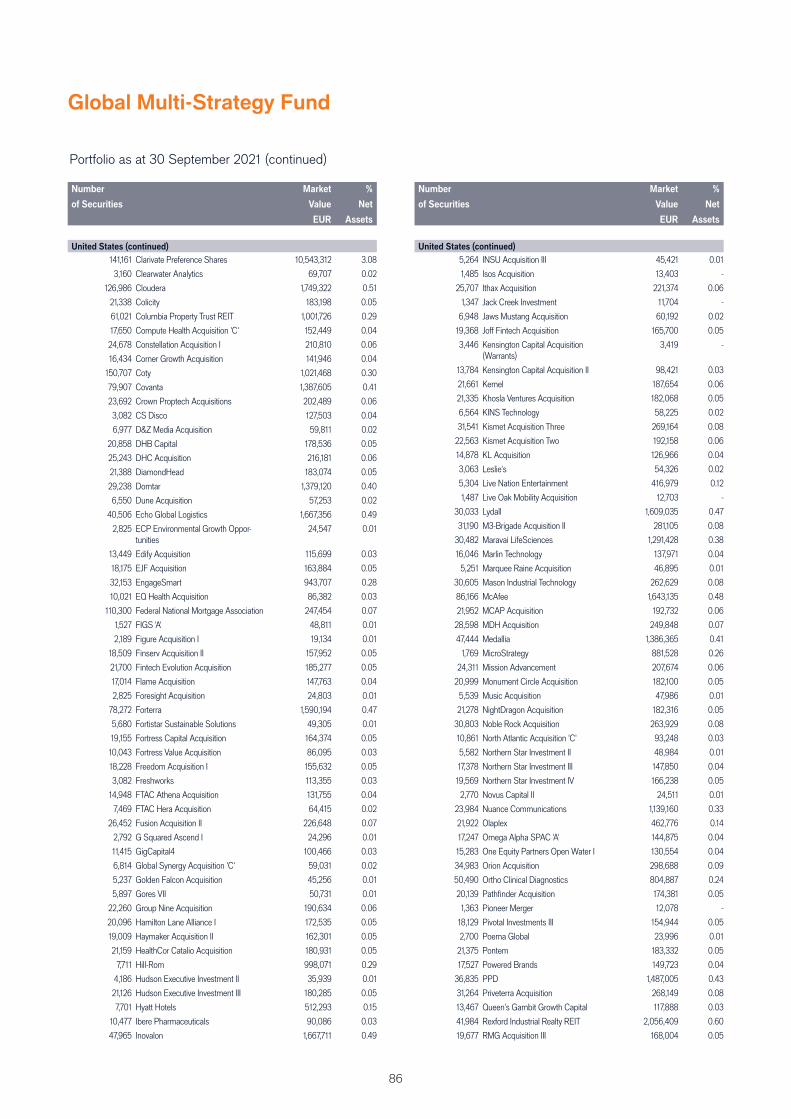
86
Global Multi-Strategy Fund
Portfolio as at 30 September 2021 (continued)
Number
of Securities
Market
Value
EUR
%
Net
Assets
United States (continued)
141,161 Clarivate Preference Shares 10,543,312 3.08
3,160 Clearwater Analytics 69,707 0.02
126,986 Cloudera 1,749,322 0.51
21,338 Colicity 183,198 0.05
61,021 Columbia Property Trust REIT 1,001,726 0.29
17,650 Compute Health Acquisition 'C' 152,449 0.04
24,678 Constellation Acquisition I 210,810 0.06
16,434 Corner Growth Acquisition 141,946 0.04
150,707 Coty 1,021,468 0.30
79,907 Covanta 1,387,605 0.41
23,692 Crown Proptech Acquisitions 202,489 0.06
3,082 CS Disco 127,503 0.04
6,977 D&Z Media Acquisition 59,811 0.02
20,858 DHB Capital 178,536 0.05
25,243 DHC Acquisition 216,181 0.06
21,388 DiamondHead 183,074 0.05
29,238 Domtar 1,379,120 0.40
6,550 Dune Acquisition 57,253 0.02
40,506 Echo Global Logistics 1,667,356 0.49
2,825 ECP Environmental Growth Oppor-tunities
24,547 0.01
13,449 Edify Acquisition 115,699 0.03
18,175 EJF Acquisition 163,884 0.05
32,153 EngageSmart 943,707 0.28
10,021 EQ Health Acquisition 86,382 0.03
110,300 Federal National Mortgage Association 247,454 0.07
1,527 FIGS 'A' 48,811 0.01
2,189 Figure Acquisition I 19,134 0.01
18,509 Finserv Acquisition II 157,952 0.05
21,700 Fintech Evolution Acquisition 185,277 0.05
17,014 Flame Acquisition 147,763 0.04
2,825 Foresight Acquisition 24,803 0.01
78,272 Forterra 1,590,194 0.47
5,680 Fortistar Sustainable Solutions 49,305 0.01
19,155 Fortress Capital Acquisition 164,374 0.05
10,043 Fortress Value Acquisition 86,095 0.03
18,228 Freedom Acquisition I 155,632 0.05
3,082 Freshworks 113,355 0.03
14,948 FTAC Athena Acquisition 131,755 0.04
7,469 FTAC Hera Acquisition 64,415 0.02
26,452 Fusion Acquisition II 226,648 0.07
2,792 G Squared Ascend I 24,296 0.01
11,415 GigCapital4 100,466 0.03
6,814 Global Synergy Acquisition 'C' 59,031 0.02
5,237 Golden Falcon Acquisition 45,256 0.01
5,897 Gores VII 50,731 0.01
22,260 Group Nine Acquisition 190,634 0.06
20,096 Hamilton Lane Alliance I 172,535 0.05
19,009 Haymaker Acquisition II 162,301 0.05
21,159 HealthCor Catalio Acquisition 180,931 0.05
7,711 Hill-Rom 998,071 0.29
4,186 Hudson Executive Investment II 35,939 0.01
21,126 Hudson Executive Investment III 180,285 0.05
7,701 Hyatt Hotels 512,293 0.15
10,477 Ibere Pharmaceuticals 90,086 0.03
47,965 Inovalon 1,667,711 0.49
Portfolio as at 30 September 2021 (continued)
Number
of Securities
Market
Value
EUR
%
Net
Assets
United States (continued)
5,264 INSU Acquisition III 45,421 0.01
1,485 Isos Acquisition 13,403 -
25,707 Ithax Acquisition 221,374 0.06
1,347 Jack Creek Investment 11,704 -
6,948 Jaws Mustang Acquisition 60,192 0.02
19,368 Joff Fintech Acquisition 165,700 0.05
3,446 Kensington Capital Acquisition (Warrants)
3,419 -
13,784 Kensington Capital Acquisition II 98,421 0.03
21,661 Kernel 187,654 0.06
21,335 Khosla Ventures Acquisition 182,068 0.05
6,564 KINS Technology 58,225 0.02
31,541 Kismet Acquisition Three 269,164 0.08
22,563 Kismet Acquisition Two 192,158 0.06
14,878 KL Acquisition 126,966 0.04
3,063 Leslie's 54,326 0.02
5,304 Live Nation Entertainment 416,979 0.12
1,487 Live Oak Mobility Acquisition 12,703 -
30,033 Lydall 1,609,035 0.47
31,190 M3-Brigade Acquisition II 281,105 0.08
30,482 Maravai LifeSciences 1,291,428 0.38
16,046 Marlin Technology 137,971 0.04
5,251 Marquee Raine Acquisition 46,895 0.01
30,605 Mason Industrial Technology 262,629 0.08
86,166 McAfee 1,643,135 0.48
21,952 MCAP Acquisition 192,732 0.06
28,598 MDH Acquisition 249,848 0.07
47,444 Medallia 1,386,365 0.41
1,769 MicroStrategy 881,528 0.26
24,311 Mission Advancement 207,674 0.06
20,999 Monument Circle Acquisition 182,100 0.05
5,539 Music Acquisition 47,986 0.01
21,278 NightDragon Acquisition 182,316 0.05
30,803 Noble Rock Acquisition 263,929 0.08
10,861 North Atlantic Acquisition 'C' 93,248 0.03
5,582 Northern Star Investment II 48,984 0.01
17,378 Northern Star Investment III 147,850 0.04
19,569 Northern Star Investment IV 166,238 0.05
2,770 Novus Capital II 24,511 0.01
23,984 Nuance Communications 1,139,160 0.33
21,922 Olaplex 462,776 0.14
17,247 Omega Alpha SPAC 'A' 144,875 0.04
15,283 One Equity Partners Open Water I 130,554 0.04
34,983 Orion Acquisition 298,688 0.09
50,490 Ortho Clinical Diagnostics 804,887 0.24
20,139 Pathfi nder Acquisition 174,381 0.05
1,363 Pioneer Merger 12,078 -
18,129 Pivotal Investments III 154,944 0.05
2,700 Poema Global 23,996 0.01
21,375 Pontem 183,332 0.05
17,527 Powered Brands 149,723 0.04
36,835 PPD 1,487,005 0.43
31,264 Priveterra Acquisition 268,149 0.08
13,467 Queen's Gambit Growth Capital 117,888 0.03
41,984 Rexford Industrial Realty REIT 2,056,409 0.60
19,677 RMG Acquisition III 168,004 0.05
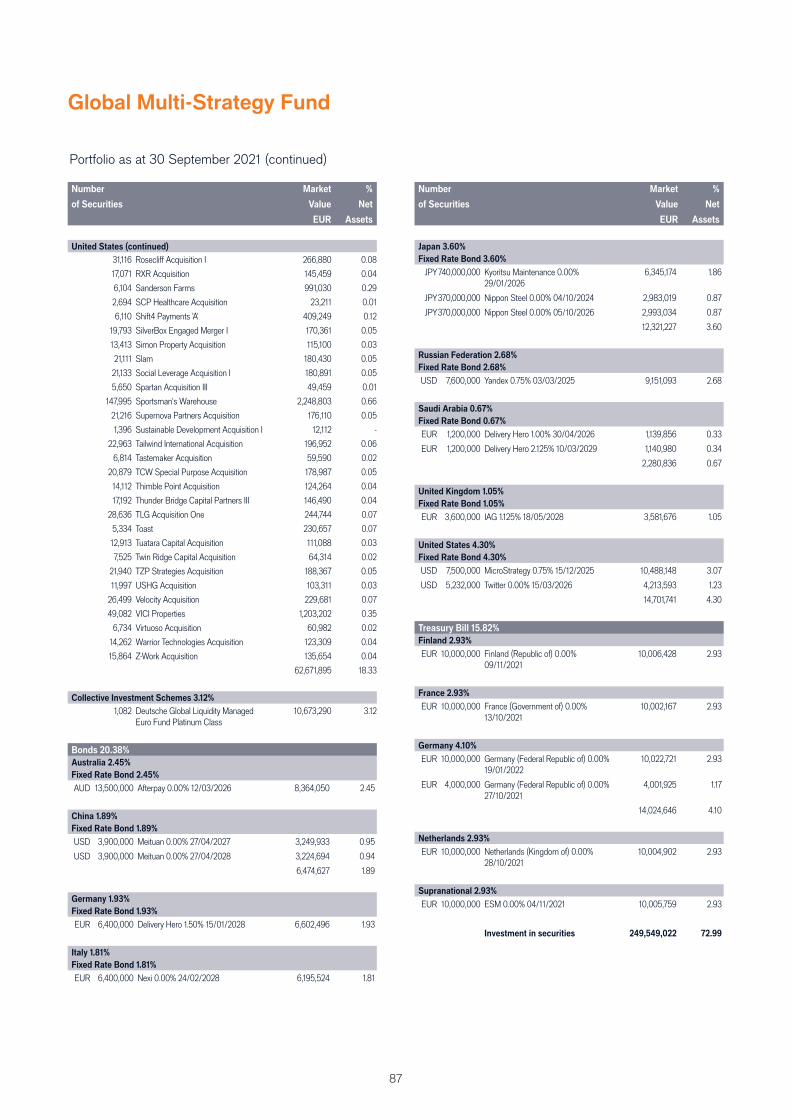
87
Portfolio as at 30 September 2021 (continued)
Number
of Securities
Market
Value
EUR
%
Net
Assets
United States (continued)
31,116 Rosecliff Acquisition I 266,880 0.08
17,071 RXR Acquisition 145,459 0.04
6,104 Sanderson Farms 991,030 0.29
2,694 SCP Healthcare Acquisition 23,211 0.01
6,110 Shift4 Payments 'A' 409,249 0.12
19,793 SilverBox Engaged Merger I 170,361 0.05
13,413 Simon Property Acquisition 115,100 0.03
21,111 Slam 180,430 0.05
21,133 Social Leverage Acquisition I 180,891 0.05
5,650 Spartan Acquisition III 49,459 0.01
147,995 Sportsman's Warehouse 2,248,803 0.66
21,216 Supernova Partners Acquisition 176,110 0.05
1,396 Sustainable Development Acquisition I 12,112 -
22,963 Tailwind International Acquisition 196,952 0.06
6,814 Tastemaker Acquisition 59,590 0.02
20,879 TCW Special Purpose Acquisition 178,987 0.05
14,112 Thimble Point Acquisition 124,264 0.04
17,192 Thunder Bridge Capital Partners III 146,490 0.04
28,636 TLG Acquisition One 244,744 0.07
5,334 Toast 230,657 0.07
12,913 Tuatara Capital Acquisition 111,088 0.03
7,525 Twin Ridge Capital Acquisition 64,314 0.02
21,940 TZP Strategies Acquisition 188,367 0.05
11,997 USHG Acquisition 103,311 0.03
26,499 Velocity Acquisition 229,681 0.07
49,082 VICI Properties 1,203,202 0.35
6,734 Virtuoso Acquisition 60,982 0.02
14,262 Warrior Technologies Acquisition 123,309 0.04
15,864 Z-Work Acquisition 135,654 0.04
62,671,895 18.33
Collective Investment Schemes 3.12%
1,082 Deutsche Global Liquidity Managed Euro Fund Platinum Class
10,673,290 3.12
Bonds 20.38%
Australia 2.45%
Fixed Rate Bond 2.45%
AUD 13,500,000 Afterpay 0.00% 12/03/2026 8,364,050 2.45
China 1.89%
Fixed Rate Bond 1.89%
USD 3,900,000 Meituan 0.00% 27/04/2027 3,249,933 0.95
USD 3,900,000 Meituan 0.00% 27/04/2028 3,224,694 0.94
6,474,627 1.89
Germany 1.93%
Fixed Rate Bond 1.93%
EUR 6,400,000 Delivery Hero 1.50% 15/01/2028 6,602,496 1.93
Italy 1.81%
Fixed Rate Bond 1.81%
EUR 6,400,000 Nexi 0.00% 24/02/2028 6,195,524 1.81
Global Multi-Strategy Fund
Portfolio as at 30 September 2021 (continued)
Number
of Securities
Market
Value
EUR
%
Net
Assets
Japan 3.60%
Fixed Rate Bond 3.60%
JPY740,000,000 Kyoritsu Maintenance 0.00% 29/01/2026
6,345,174 1.86
JPY370,000,000 Nippon Steel 0.00% 04/10/2024 2,983,019 0.87
JPY370,000,000 Nippon Steel 0.00% 05/10/2026 2,993,034 0.87
12,321,227 3.60
Russian Federation 2.68%
Fixed Rate Bond 2.68%
USD 7,600,000 Yandex 0.75% 03/03/2025 9,151,093 2.68
Saudi Arabia 0.67%
Fixed Rate Bond 0.67%
EUR 1,200,000 Delivery Hero 1.00% 30/04/2026 1,139,856 0.33
EUR 1,200,000 Delivery Hero 2.125% 10/03/2029 1,140,980 0.34
2,280,836 0.67
United Kingdom 1.05%
Fixed Rate Bond 1.05%
EUR 3,600,000 IAG 1.125% 18/05/2028 3,581,676 1.05
United States 4.30%
Fixed Rate Bond 4.30%
USD 7,500,000 MicroStrategy 0.75% 15/12/2025 10,488,148 3.07
USD 5,232,000 Twitter 0.00% 15/03/2026 4,213,593 1.23
14,701,741 4.30
Treasury Bill 15.82%
Finland 2.93%
EUR 10,000,000 Finland (Republic of) 0.00% 09/11/2021
10,006,428 2.93
France 2.93%
EUR 10,000,000 France (Government of) 0.00% 13/10/2021
10,002,167 2.93
Germany 4.10%
EUR 10,000,000 Germany (Federal Republic of) 0.00% 19/01/2022
10,022,721 2.93
EUR 4,000,000 Germany (Federal Republic of) 0.00% 27/10/2021
4,001,925 1.17
14,024,646 4.10
Netherlands 2.93%
EUR 10,000,000 Netherlands (Kingdom of) 0.00% 28/10/2021
10,004,902 2.93
Supranational 2.93%
EUR 10,000,000 ESM 0.00% 04/11/2021 10,005,759 2.93
Investment in securities 249,549,022 72.99
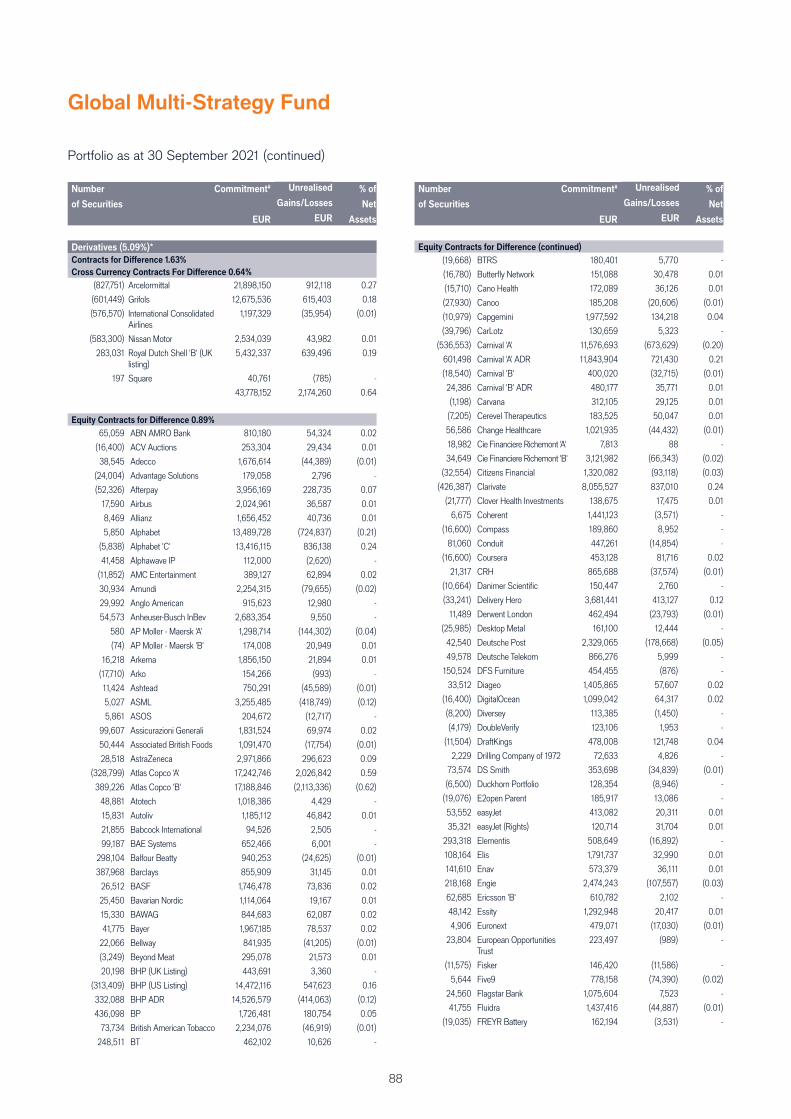
88
Global Multi-Strategy Fund
Number
of Securities
Commitment#
EUR
Market
Value
EUR
% of
Net
Assets
Derivatives (5.09%)*
Contracts for Diff erence 1.63%
Cross Currency Contracts For Diff erence 0.64%
(827,751) Arcelormittal 21,898,150 912,118 0.27
(601,449) Grifols 12,675,536 615,403 0.18
(576,570) International Consolidated Airlines
1,197,329 (35,954) (0.01)
(583,300) Nissan Motor 2,534,039 43,982 0.01
283,031 Royal Dutch Shell 'B' (UK listing)
5,432,337 639,496 0.19
197 Square 40,761 (785) -
43,778,152 2,174,260 0.64
Equity Contracts for Diff erence 0.89%
65,059 ABN AMRO Bank 810,180 54,324 0.02
(16,400) ACV Auctions 253,304 29,434 0.01
38,545 Adecco 1,676,614 (44,389) (0.01)
(24,004) Advantage Solutions 179,058 2,796 -
(52,326) Afterpay 3,956,169 228,735 0.07
17,590 Airbus 2,024,961 36,587 0.01
8,469 Allianz 1,656,452 40,736 0.01
5,850 Alphabet 13,489,728 (724,837) (0.21)
(5,838) Alphabet 'C' 13,416,115 836,138 0.24
41,458 Alphawave IP 112,000 (2,620) -
(11,852) AMC Entertainment 389,127 62,894 0.02
30,934 Amundi 2,254,315 (79,655) (0.02)
29,992 Anglo American 915,623 12,980 -
54,573 Anheuser-Busch InBev 2,683,354 9,550 -
580 AP Moller - Maersk 'A' 1,298,714 (144,302) (0.04)
(74) AP Moller - Maersk 'B' 174,008 20,949 0.01
16,218 Arkema 1,856,150 21,894 0.01
(17,710) Arko 154,266 (993) -
11,424 Ashtead 750,291 (45,589) (0.01)
5,027 ASML 3,255,485 (418,749) (0.12)
5,861 ASOS 204,672 (12,717) -
99,607 Assicurazioni Generali 1,831,524 69,974 0.02
50,444 Associated British Foods 1,091,470 (17,754) (0.01)
28,518 AstraZeneca 2,971,866 296,623 0.09
(328,799) Atlas Copco 'A' 17,242,746 2,026,842 0.59
389,226 Atlas Copco 'B' 17,188,846 (2,113,336) (0.62)
48,881 Atotech 1,018,386 4,429 -
15,831 Autoliv 1,185,112 46,842 0.01
21,855 Babcock International 94,526 2,505 -
99,187 BAE Systems 652,466 6,001 -
298,104 Balfour Beatty 940,253 (24,625) (0.01)
387,968 Barclays 855,909 31,145 0.01
26,512 BASF 1,746,478 73,836 0.02
25,450 Bavarian Nordic 1,114,064 19,167 0.01
15,330 BAWAG 844,683 62,087 0.02
41,775 Bayer 1,967,185 78,537 0.02
22,066 Bellway 841,935 (41,205) (0.01)
(3,249) Beyond Meat 295,078 21,573 0.01
20,198 BHP (UK Listing) 443,691 3,360 -
(313,409) BHP (US Listing) 14,472,116 547,623 0.16
332,088 BHP ADR 14,526,579 (414,063) (0.12)
436,098 BP 1,726,481 180,754 0.05
73,734 British American Tobacco 2,234,076 (46,919) (0.01)
248,511 BT 462,102 10,626 -
Number
of Securities
Commitment#
EUR
Market
Value
EUR
% of
Net
Assets
Equity Contracts for Diff erence (continued)
(19,668) BTRS 180,401 5,770 -
(16,780) Butterfl y Network 151,088 30,478 0.01
(15,710) Cano Health 172,089 36,126 0.01
(27,930) Canoo 185,208 (20,606) (0.01)
(10,979) Capgemini 1,977,592 134,218 0.04
(39,796) CarLotz 130,659 5,323 -
(536,553) Carnival 'A' 11,576,693 (673,629) (0.20)
601,498 Carnival 'A' ADR 11,843,904 721,430 0.21
(18,540) Carnival 'B' 400,020 (32,715) (0.01)
24,386 Carnival 'B' ADR 480,177 35,771 0.01
(1,198) Carvana 312,105 29,125 0.01
(7,205) Cerevel Therapeutics 183,525 50,047 0.01
56,586 Change Healthcare 1,021,935 (44,432) (0.01)
18,982 Cie Financiere Richemont 'A' 7,813 88 -
34,649 Cie Financiere Richemont 'B' 3,121,982 (66,343) (0.02)
(32,554) Citizens Financial 1,320,082 (93,118) (0.03)
(426,387) Clarivate 8,055,527 837,010 0.24
(21,777) Clover Health Investments 138,675 17,475 0.01
6,675 Coherent 1,441,123 (3,571) -
(16,600) Compass 189,860 8,952 -
81,060 Conduit 447,261 (14,854) -
(16,600) Coursera 453,128 81,716 0.02
21,317 CRH 865,688 (37,574) (0.01)
(10,664) Danimer Scientifi c 150,447 2,760 -
(33,241) Delivery Hero 3,681,441 413,127 0.12
11,489 Derwent London 462,494 (23,793) (0.01)
(25,985) Desktop Metal 161,100 12,444 -
42,540 Deutsche Post 2,329,065 (178,668) (0.05)
49,578 Deutsche Telekom 866,276 5,999 -
150,524 DFS Furniture 454,455 (876) -
33,512 Diageo 1,405,865 57,607 0.02
(16,400) DigitalOcean 1,099,042 64,317 0.02
(8,200) Diversey 113,385 (1,450) -
(4,179) DoubleVerify 123,106 1,953 -
(11,504) DraftKings 478,008 121,748 0.04
2,229 Drilling Company of 1972 72,633 4,826 -
73,574 DS Smith 353,698 (34,839) (0.01)
(6,500) Duckhorn Portfolio 128,354 (8,946) -
(19,076) E2open Parent 185,917 13,086 -
53,552 easyJet 413,082 20,311 0.01
35,321 easyJet (Rights) 120,714 31,704 0.01
293,318 Elementis 508,649 (16,892) -
108,164 Elis 1,791,737 32,990 0.01
141,610 Enav 573,379 36,111 0.01
218,168 Engie 2,474,243 (107,557) (0.03)
62,685 Ericsson 'B' 610,782 2,102 -
48,142 Essity 1,292,948 20,417 0.01
4,906 Euronext 479,071 (17,030) (0.01)
23,804 European Opportunities Trust
223,497 (989) -
(11,575) Fisker 146,420 (11,586) -
5,644 Five9 778,158 (74,390) (0.02)
24,560 Flagstar Bank 1,075,604 7,523 -
41,755 Fluidra 1,437,416 (44,887) (0.01)
(19,035) FREYR Battery 162,194 (3,531) -
Portfolio as at 30 September 2021 (continued)
Unrealised
Gains/Losses
EUR
Unrealised
Gains/Losses
EUR
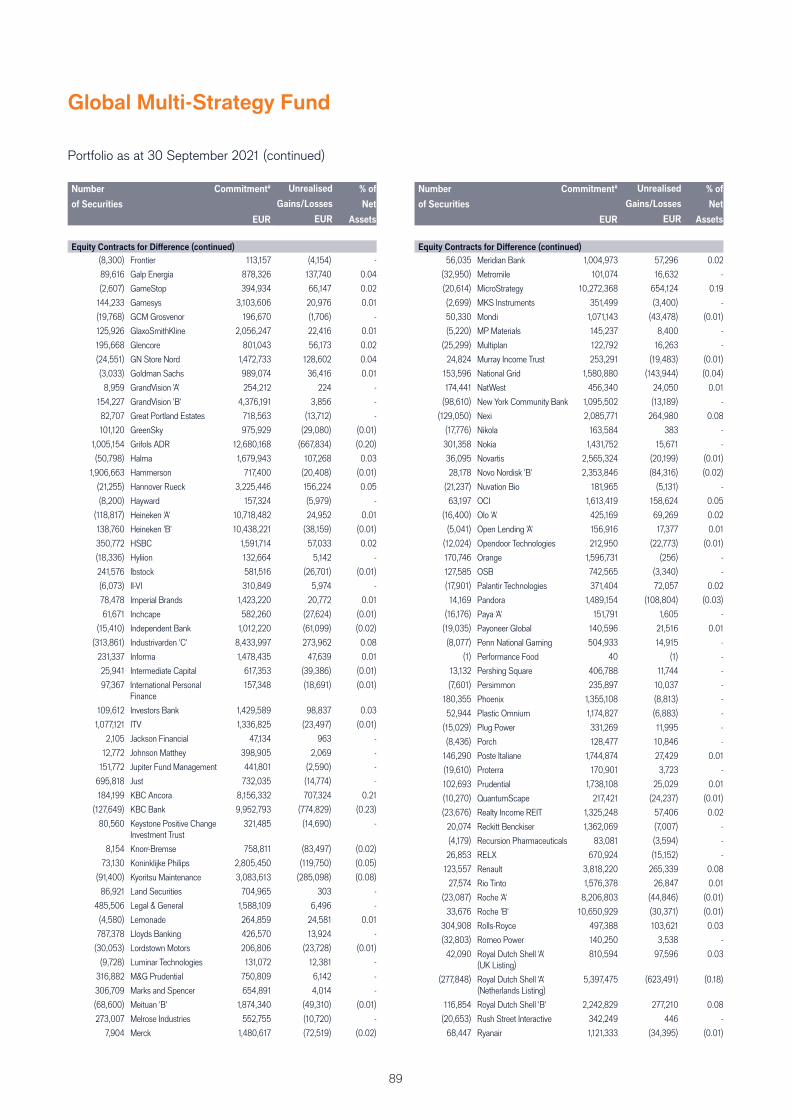
89
Global Multi-Strategy Fund
Number
of Securities
Commitment#
EUR
Market
Value
EUR
% of
Net
Assets
Equity Contracts for Diff erence (continued)
(8,300) Frontier 113,157 (4,154) -
89,616 Galp Energia 878,326 137,740 0.04
(2,607) GameStop 394,934 66,147 0.02
144,233 Gamesys 3,103,606 20,976 0.01
(19,768) GCM Grosvenor 196,670 (1,706) -
125,926 GlaxoSmithKline 2,056,247 22,416 0.01
195,668 Glencore 801,043 56,173 0.02
(24,551) GN Store Nord 1,472,733 128,602 0.04
(3,033) Goldman Sachs 989,074 36,416 0.01
8,959 GrandVision 'A' 254,212 224 -
154,227 GrandVision 'B' 4,376,191 3,856 -
82,707 Great Portland Estates 718,563 (13,712) -
101,120 GreenSky 975,929 (29,080) (0.01)
1,005,154 Grifols ADR 12,680,168 (667,834) (0.20)
(50,798) Halma 1,679,943 107,268 0.03
1,906,663 Hammerson 717,400 (20,408) (0.01)
(21,255) Hannover Rueck 3,225,446 156,224 0.05
(8,200) Hayward 157,324 (5,979) -
(118,817) Heineken 'A' 10,718,482 24,952 0.01
138,760 Heineken 'B' 10,438,221 (38,159) (0.01)
350,772 HSBC 1,591,714 57,033 0.02
(18,336) Hyliion 132,664 5,142 -
241,576 Ibstock 581,516 (26,701) (0.01)
(6,073) II-VI 310,849 5,974 -
78,478 Imperial Brands 1,423,220 20,772 0.01
61,671 Inchcape 582,260 (27,624) (0.01)
(15,410) Independent Bank 1,012,220 (61,099) (0.02)
(313,861) Industrivarden 'C' 8,433,997 273,962 0.08
231,337 Informa 1,478,435 47,639 0.01
25,941 Intermediate Capital 617,353 (39,386) (0.01)
97,367 International Personal Finance
157,348 (18,691) (0.01)
109,612 Investors Bank 1,429,589 98,837 0.03
1,077,121 ITV 1,336,825 (23,497) (0.01)
2,105 Jackson Financial 47,134 963 -
12,772 Johnson Matthey 398,905 2,069 -
151,772 Jupiter Fund Management 441,801 (2,590) -
695,818 Just 732,035 (14,774) -
184,199 KBC Ancora 8,156,332 707,324 0.21
(127,649) KBC Bank 9,952,793 (774,829) (0.23)
80,560 Keystone Positive Change Investment Trust
321,485 (14,690) -
8,154 Knorr-Bremse 758,811 (83,497) (0.02)
73,130 Koninklijke Philips 2,805,450 (119,750) (0.05)
(91,400) Kyoritsu Maintenance 3,083,613 (285,098) (0.08)
86,921 Land Securities 704,965 303 -
485,506 Legal & General 1,588,109 6,496 -
(4,580) Lemonade 264,859 24,581 0.01
787,378 Lloyds Banking 426,570 13,924 -
(30,053) Lordstown Motors 206,806 (23,728) (0.01)
(9,728) Luminar Technologies 131,072 12,381 -
316,882 M&G Prudential 750,809 6,142 -
306,709 Marks and Spencer 654,891 4,014 -
(68,600) Meituan 'B' 1,874,340 (49,310) (0.01)
273,007 Melrose Industries 552,755 (10,720) -
7,904 Merck 1,480,617 (72,519) (0.02)
Portfolio as at 30 September 2021 (continued)
Number
of Securities
Commitment#
EUR
Market
Value
EUR
% of
Net
Assets
Equity Contracts for Diff erence (continued)
56,035 Meridian Bank 1,004,973 57,296 0.02
(32,950) Metromile 101,074 16,632 -
(20,614) MicroStrategy 10,272,368 654,124 0.19
(2,699) MKS Instruments 351,499 (3,400) -
50,330 Mondi 1,071,143 (43,478) (0.01)
(5,220) MP Materials 145,237 8,400 -
(25,299) Multiplan 122,792 16,263 -
24,824 Murray Income Trust 253,291 (19,483) (0.01)
153,596 National Grid 1,580,880 (143,944) (0.04)
174,441 NatWest 456,340 24,050 0.01
(98,610) New York Community Bank 1,095,502 (13,189) -
(129,050) Nexi 2,085,771 264,980 0.08
(17,776) Nikola 163,584 383 -
301,358 Nokia 1,431,752 15,671 -
36,095 Novartis 2,565,324 (20,199) (0.01)
28,178 Novo Nordisk 'B' 2,353,846 (84,316) (0.02)
(21,237) Nuvation Bio 181,965 (5,131) -
63,197 OCI 1,613,419 158,624 0.05
(16,400) Olo 'A' 425,169 69,269 0.02
(5,041) Open Lending 'A' 156,916 17,377 0.01
(12,024) Opendoor Technologies 212,950 (22,773) (0.01)
170,746 Orange 1,596,731 (256) -
127,585 OSB 742,565 (3,340) -
(17,901) Palantir Technologies 371,404 72,057 0.02
14,169 Pandora 1,489,154 (108,804) (0.03)
(16,176) Paya 'A' 151,791 1,605 -
(19,035) Payoneer Global 140,596 21,516 0.01
(8,077) Penn National Gaming 504,933 14,915 -
(1) Performance Food 40 (1) -
13,132 Pershing Square 406,788 11,744 -
(7,601) Persimmon 235,897 10,037 -
180,355 Phoenix 1,355,108 (8,813) -
52,944 Plastic Omnium 1,174,827 (6,883) -
(15,029) Plug Power 331,269 11,995 -
(8,436) Porch 128,477 10,846 -
146,290 Poste Italiane 1,744,874 27,429 0.01
(19,610) Proterra 170,901 3,723 -
102,693 Prudential 1,738,108 25,029 0.01
(10,270) QuantumScape 217,421 (24,237) (0.01)
(23,676) Realty Income REIT 1,325,248 57,406 0.02
20,074 Reckitt Benckiser 1,362,069 (7,007) -
(4,179) Recursion Pharmaceuticals 83,081 (3,594) -
26,853 RELX 670,924 (15,152) -
123,557 Renault 3,818,220 265,339 0.08
27,574 Rio Tinto 1,576,378 26,847 0.01
(23,087) Roche 'A' 8,206,803 (44,846) (0.01)
33,676 Roche 'B' 10,650,929 (30,371) (0.01)
304,908 Rolls-Royce 497,388 103,621 0.03
(32,803) Romeo Power 140,250 3,538 -
42,090 Royal Dutch Shell 'A' (UK Listing)
810,594 97,596 0.03
(277,848) Royal Dutch Shell 'A' (Netherlands Listing)
5,397,475 (623,491) (0.18)
116,854 Royal Dutch Shell 'B' 2,242,829 277,210 0.08
(20,653) Rush Street Interactive 342,249 446 -
68,447 Ryanair 1,121,333 (34,395) (0.01)
Unrealised
Gains/Losses
EUR
Unrealised
Gains/Losses
EUR
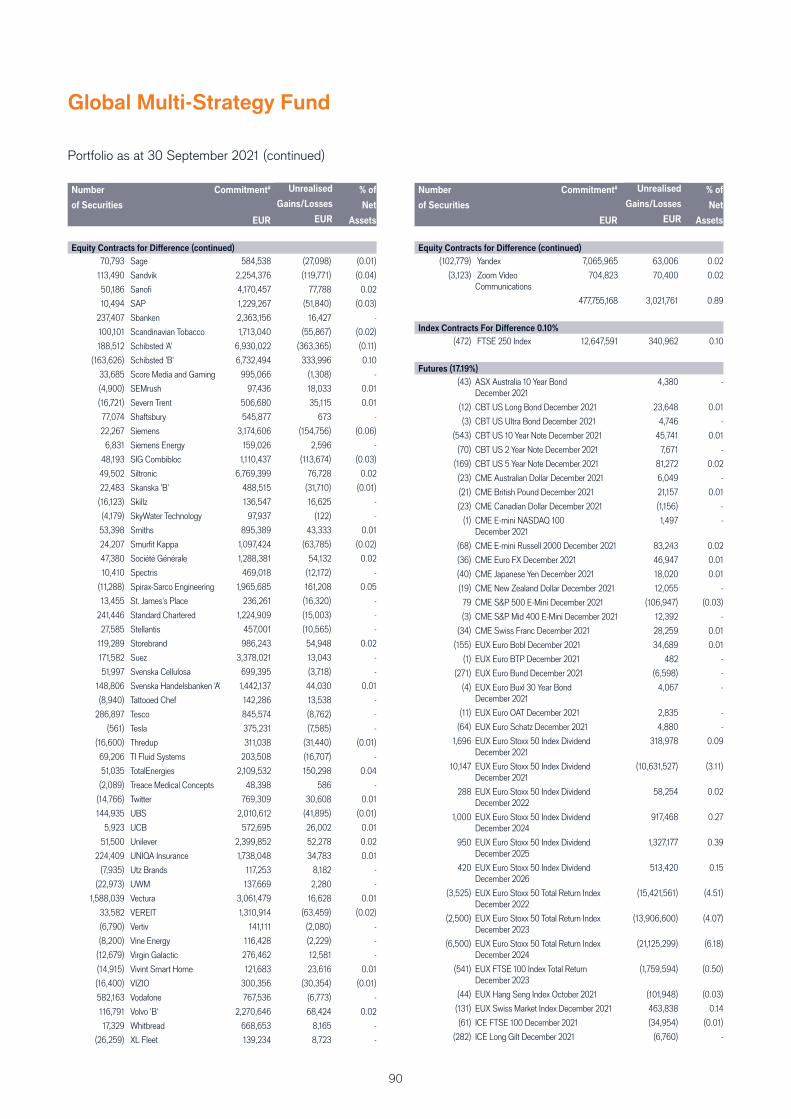
90
Portfolio as at 30 September 2021 (continued)
Global Multi-Strategy Fund
Number
of Securities
Commitment#
EUR
Market
Value
EUR
% of
Net
Assets
Equity Contracts for Diff erence (continued)
70,793 Sage 584,538 (27,098) (0.01)
113,490 Sandvik 2,254,376 (119,771) (0.04)
50,186 Sanofi 4,170,457 77,788 0.02
10,494 SAP 1,229,267 (51,840) (0.03)
237,407 Sbanken 2,363,156 16,427 -
100,101 Scandinavian Tobacco 1,713,040 (55,867) (0.02)
188,512 Schibsted 'A' 6,930,022 (363,365) (0.11)
(163,626) Schibsted 'B' 6,732,494 333,996 0.10
33,685 Score Media and Gaming 995,066 (1,308) -
(4,900) SEMrush 97,436 18,033 0.01
(16,721) Severn Trent 506,680 35,115 0.01
77,074 Shaftsbury 545,877 673 -
22,267 Siemens 3,174,606 (154,756) (0.06)
6,831 Siemens Energy 159,026 2,596 -
48,193 SIG Combibloc 1,110,437 (113,674) (0.03)
49,502 Siltronic 6,769,399 76,728 0.02
22,483 Skanska 'B' 488,515 (31,710) (0.01)
(16,123) Skillz 136,547 16,625 -
(4,179) SkyWater Technology 97,937 (122) -
53,398 Smiths 895,389 43,333 0.01
24,207 Smurfi t Kappa 1,097,424 (63,785) (0.02)
47,380 Société Générale 1,288,381 54,132 0.02
10,410 Spectris 469,018 (12,172) -
(11,288) Spirax-Sarco Engineering 1,965,685 161,208 0.05
13,455 St. James's Place 236,261 (16,320) -
241,446 Standard Chartered 1,224,909 (15,003) -
27,585 Stellantis 457,001 (10,565) -
119,289 Storebrand 986,243 54,948 0.02
171,582 Suez 3,378,021 13,043 -
51,997 Svenska Cellulosa 699,395 (3,718) -
148,806 Svenska Handelsbanken 'A' 1,442,137 44,030 0.01
(8,940) Tattooed Chef 142,286 13,538 -
286,897 Tesco 845,574 (8,762) -
(561) Tesla 375,231 (7,585) -
(16,600) Thredup 311,038 (31,440) (0.01)
69,206 TI Fluid Systems 203,508 (16,707) -
51,035 TotalEnergies 2,109,532 150,298 0.04
(2,089) Treace Medical Concepts 48,398 586 -
(14,766) Twitter 769,309 30,608 0.01
144,935 UBS 2,010,612 (41,895) (0.01)
5,923 UCB 572,695 26,002 0.01
51,500 Unilever 2,399,852 52,278 0.02
224,409 UNIQA Insurance 1,738,048 34,783 0.01
(7,935) Utz Brands 117,253 8,182 -
(22,973) UWM 137,669 2,280 -
1,588,039 Vectura 3,061,479 16,628 0.01
33,582 VEREIT 1,310,914 (63,459) (0.02)
(6,790) Vertiv 141,111 (2,080) -
(8,200) Vine Energy 116,428 (2,229) -
(12,679) Virgin Galactic 276,462 12,581 -
(14,915) Vivint Smart Home 121,683 23,616 0.01
(16,400) VIZIO 300,356 (30,354) (0.01)
582,163 Vodafone 767,536 (6,773) -
116,791 Volvo 'B' 2,270,646 68,424 0.02
17,329 Whitbread 668,653 8,165 -
(26,259) XL Fleet 139,234 8,723 -
Number
of Securities
Commitment#
EUR
Market
Value
EUR
% of
Net
Assets
Equity Contracts for Diff erence (continued)
(102,779) Yandex 7,065,965 63,006 0.02
(3,123) Zoom Video Communications
704,823 70,400 0.02
477,755,168 3,021,761 0.89
Index Contracts For Diff erence 0.10%
(472) FTSE 250 Index 12,647,591 340,962 0.10
Futures (17.19%)
(43) ASX Australia 10 Year Bond December 2021
4,380 -
(12) CBT US Long Bond December 2021 23,648 0.01
(3) CBT US Ultra Bond December 2021 4,746 -
(543) CBT US 10 Year Note December 2021 45,741 0.01
(70) CBT US 2 Year Note December 2021 7,671 -
(169) CBT US 5 Year Note December 2021 81,272 0.02
(23) CME Australian Dollar December 2021 6,049 -
(21) CME British Pound December 2021 21,157 0.01
(23) CME Canadian Dollar December 2021 (1,156) -
(1) CME E-mini NASDAQ 100 December 2021
1,497 -
(68) CME E-mini Russell 2000 December 2021 83,243 0.02
(36) CME Euro FX December 2021 46,947 0.01
(40) CME Japanese Yen December 2021 18,020 0.01
(19) CME New Zealand Dollar December 2021 12,055 -
79 CME S&P 500 E-Mini December 2021 (106,947) (0.03)
(3) CME S&P Mid 400 E-Mini December 2021 12,392 -
(34) CME Swiss Franc December 2021 28,259 0.01
(155) EUX Euro Bobl December 2021 34,689 0.01
(1) EUX Euro BTP December 2021 482 -
(271) EUX Euro Bund December 2021 (6,598) -
(4) EUX Euro Buxl 30 Year Bond December 2021
4,067 -
(11) EUX Euro OAT December 2021 2,835 -
(64) EUX Euro Schatz December 2021 4,880 -
1,696 EUX Euro Stoxx 50 Index Dividend December 2021
318,978 0.09
10,147 EUX Euro Stoxx 50 Index Dividend December 2021
(10,631,527) (3.11)
288 EUX Euro Stoxx 50 Index Dividend December 2022
58,254 0.02
1,000 EUX Euro Stoxx 50 Index Dividend December 2024
917,468 0.27
950 EUX Euro Stoxx 50 Index Dividend December 2025
1,327,177 0.39
420 EUX Euro Stoxx 50 Index Dividend December 2026
513,420 0.15
(3,525) EUX Euro Stoxx 50 Total Return Index December 2022
(15,421,561) (4.51)
(2,500) EUX Euro Stoxx 50 Total Return Index December 2023
(13,906,600) (4.07)
(6,500) EUX Euro Stoxx 50 Total Return Index December 2024
(21,125,299) (6.18)
(541) EUX FTSE 100 Index Total Return December 2023
(1,759,594) (0.50)
(44) EUX Hang Seng Index October 2021 (101,948) (0.03)
(131) EUX Swiss Market Index December 2021 463,838 0.14
(61) ICE FTSE 100 December 2021 (34,954) (0.01)
(282) ICE Long Gilt December 2021 (6,760) -
Unrealised
Gains/Losses
EUR
Unrealised
Gains/Losses
EUR
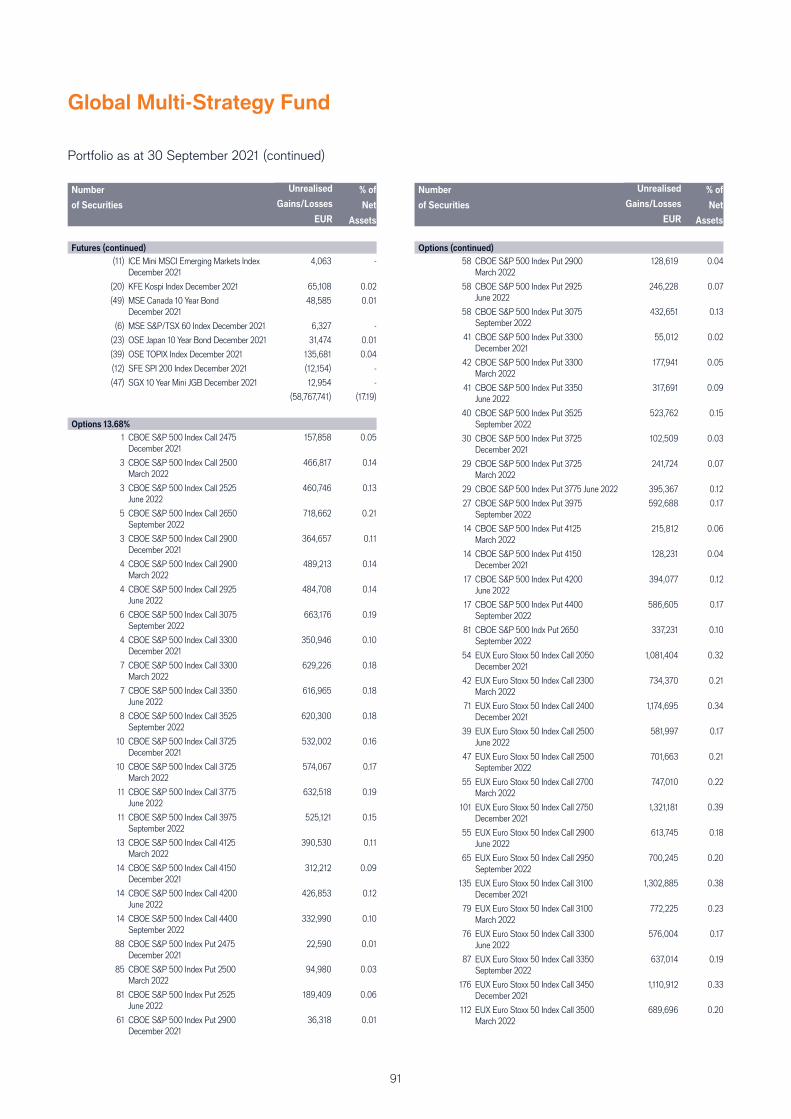
91
Global Multi-Strategy Fund
Portfolio as at 30 September 2021 (continued)
Number
of Securities
Commitment#
EUR
Market
Value
EUR
% of
Net
Assets
Futures (continued)
(11) ICE Mini MSCI Emerging Markets Index December 2021
4,063 -
(20) KFE Kospi Index December 2021 65,108 0.02
(49) MSE Canada 10 Year Bond December 2021
48,585 0.01
(6) MSE S&P/TSX 60 Index December 2021 6,327 -
(23) OSE Japan 10 Year Bond December 2021 31,474 0.01
(39) OSE TOPIX Index December 2021 135,681 0.04
(12) SFE SPI 200 Index December 2021 (12,154) -
(47) SGX 10 Year Mini JGB December 2021 12,954 -
(58,767,741) (17.19)
Options 13.68%
1 CBOE S&P 500 Index Call 2475 December 2021
157,858 0.05
3 CBOE S&P 500 Index Call 2500 March 2022
466,817 0.14
3 CBOE S&P 500 Index Call 2525 June 2022
460,746 0.13
5 CBOE S&P 500 Index Call 2650 September 2022
718,662 0.21
3 CBOE S&P 500 Index Call 2900 December 2021
364,657 0.11
4 CBOE S&P 500 Index Call 2900 March 2022
489,213 0.14
4 CBOE S&P 500 Index Call 2925 June 2022
484,708 0.14
6 CBOE S&P 500 Index Call 3075 September 2022
663,176 0.19
4 CBOE S&P 500 Index Call 3300 December 2021
350,946 0.10
7 CBOE S&P 500 Index Call 3300 March 2022
629,226 0.18
7 CBOE S&P 500 Index Call 3350 June 2022
616,965 0.18
8 CBOE S&P 500 Index Call 3525 September 2022
620,300 0.18
10 CBOE S&P 500 Index Call 3725 December 2021
532,002 0.16
10 CBOE S&P 500 Index Call 3725 March 2022
574,067 0.17
11 CBOE S&P 500 Index Call 3775 June 2022
632,518 0.19
11 CBOE S&P 500 Index Call 3975 September 2022
525,121 0.15
13 CBOE S&P 500 Index Call 4125 March 2022
390,530 0.11
14 CBOE S&P 500 Index Call 4150 December 2021
312,212 0.09
14 CBOE S&P 500 Index Call 4200 June 2022
426,853 0.12
14 CBOE S&P 500 Index Call 4400 September 2022
332,990 0.10
88 CBOE S&P 500 Index Put 2475 December 2021
22,590 0.01
85 CBOE S&P 500 Index Put 2500 March 2022
94,980 0.03
81 CBOE S&P 500 Index Put 2525 June 2022
189,409 0.06
61 CBOE S&P 500 Index Put 2900 December 2021
36,318 0.01
Number
of Securities
Commitment#
EUR
Market
Value
EUR
% of
Net
Assets
Options (continued)
58 CBOE S&P 500 Index Put 2900 March 2022
128,619 0.04
58 CBOE S&P 500 Index Put 2925 June 2022
246,228 0.07
58 CBOE S&P 500 Index Put 3075 September 2022
432,651 0.13
41 CBOE S&P 500 Index Put 3300 December 2021
55,012 0.02
42 CBOE S&P 500 Index Put 3300 March 2022
177,941 0.05
41 CBOE S&P 500 Index Put 3350 June 2022
317,691 0.09
40 CBOE S&P 500 Index Put 3525 September 2022
523,762 0.15
30 CBOE S&P 500 Index Put 3725 December 2021
102,509 0.03
29 CBOE S&P 500 Index Put 3725 March 2022
241,724 0.07
29 CBOE S&P 500 Index Put 3775 June 2022 395,367 0.12
27 CBOE S&P 500 Index Put 3975 September 2022
592,688 0.17
14 CBOE S&P 500 Index Put 4125 March 2022
215,812 0.06
14 CBOE S&P 500 Index Put 4150 December 2021
128,231 0.04
17 CBOE S&P 500 Index Put 4200 June 2022
394,077 0.12
17 CBOE S&P 500 Index Put 4400 September 2022
586,605 0.17
81 CBOE S&P 500 Indx Put 2650 September 2022
337,231 0.10
54 EUX Euro Stoxx 50 Index Call 2050 December 2021
1,081,404 0.32
42 EUX Euro Stoxx 50 Index Call 2300 March 2022
734,370 0.21
71 EUX Euro Stoxx 50 Index Call 2400 December 2021
1,174,695 0.34
39 EUX Euro Stoxx 50 Index Call 2500 June 2022
581,997 0.17
47 EUX Euro Stoxx 50 Index Call 2500 September 2022
701,663 0.21
55 EUX Euro Stoxx 50 Index Call 2700 March 2022
747,010 0.22
101 EUX Euro Stoxx 50 Index Call 2750 December 2021
1,321,181 0.39
55 EUX Euro Stoxx 50 Index Call 2900 June 2022
613,745 0.18
65 EUX Euro Stoxx 50 Index Call 2950 September 2022
700,245 0.20
135 EUX Euro Stoxx 50 Index Call 3100 December 2021
1,302,885 0.38
79 EUX Euro Stoxx 50 Index Call 3100 March 2022
772,225 0.23
76 EUX Euro Stoxx 50 Index Call 3300 June 2022
576,004 0.17
87 EUX Euro Stoxx 50 Index Call 3350 September 2022
637,014 0.19
176 EUX Euro Stoxx 50 Index Call 3450 December 2021
1,110,912 0.33
112 EUX Euro Stoxx 50 Index Call 3500 March 2022
689,696 0.20
Unrealised
Gains/Losses
EUR
Unrealised
Gains/Losses
EUR
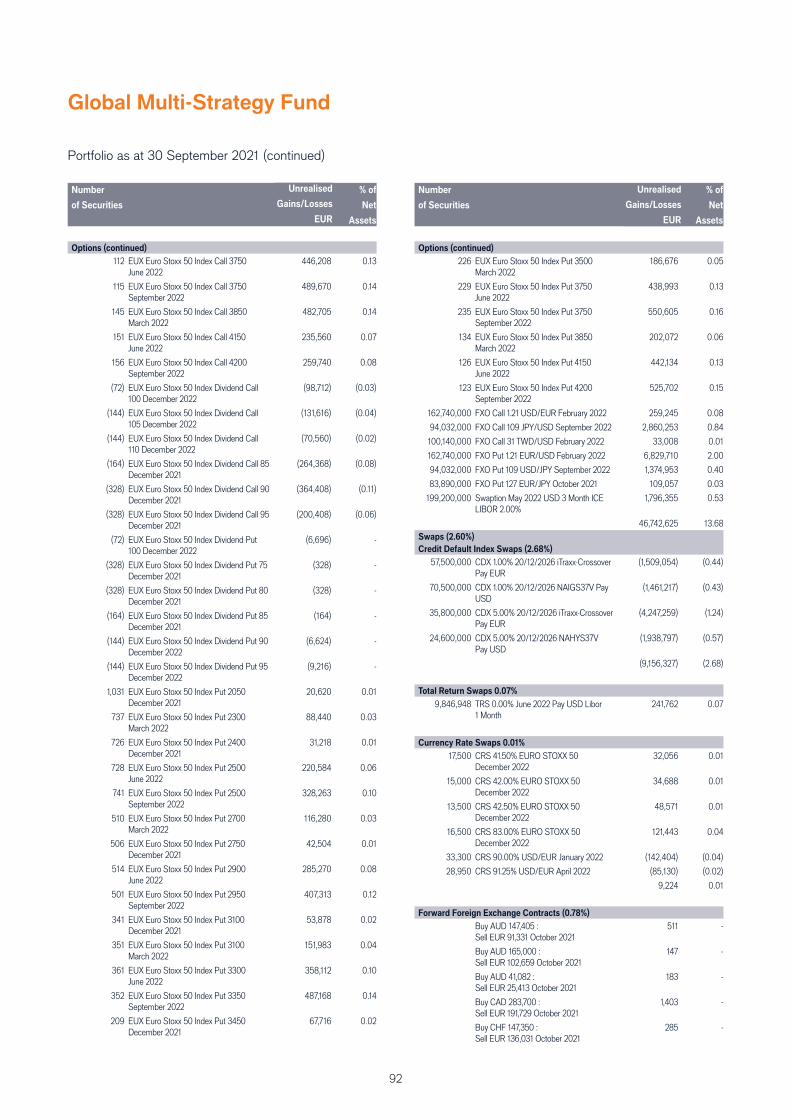
92
Global Multi-Strategy Fund
Portfolio as at 30 September 2021 (continued)
Number
of Securities
Commitment#
EUR
Market
Value
EUR
% of
Net
Assets
Options (continued)
112 EUX Euro Stoxx 50 Index Call 3750 June 2022
446,208 0.13
115 EUX Euro Stoxx 50 Index Call 3750 September 2022
489,670 0.14
145 EUX Euro Stoxx 50 Index Call 3850 March 2022
482,705 0.14
151 EUX Euro Stoxx 50 Index Call 4150 June 2022
235,560 0.07
156 EUX Euro Stoxx 50 Index Call 4200 September 2022
259,740 0.08
(72) EUX Euro Stoxx 50 Index Dividend Call 100 December 2022
(98,712) (0.03)
(144) EUX Euro Stoxx 50 Index Dividend Call 105 December 2022
(131,616) (0.04)
(144) EUX Euro Stoxx 50 Index Dividend Call 110 December 2022
(70,560) (0.02)
(164) EUX Euro Stoxx 50 Index Dividend Call 85 December 2021
(264,368) (0.08)
(328) EUX Euro Stoxx 50 Index Dividend Call 90 December 2021
(364,408) (0.11)
(328) EUX Euro Stoxx 50 Index Dividend Call 95 December 2021
(200,408) (0.06)
(72) EUX Euro Stoxx 50 Index Dividend Put 100 December 2022
(6,696) -
(328) EUX Euro Stoxx 50 Index Dividend Put 75 December 2021
(328) -
(328) EUX Euro Stoxx 50 Index Dividend Put 80 December 2021
(328) -
(164) EUX Euro Stoxx 50 Index Dividend Put 85 December 2021
(164) -
(144) EUX Euro Stoxx 50 Index Dividend Put 90 December 2022
(6,624) -
(144) EUX Euro Stoxx 50 Index Dividend Put 95 December 2022
(9,216) -
1,031 EUX Euro Stoxx 50 Index Put 2050 December 2021
20,620 0.01
737 EUX Euro Stoxx 50 Index Put 2300 March 2022
88,440 0.03
726 EUX Euro Stoxx 50 Index Put 2400 December 2021
31,218 0.01
728 EUX Euro Stoxx 50 Index Put 2500 June 2022
220,584 0.06
741 EUX Euro Stoxx 50 Index Put 2500 September 2022
328,263 0.10
510 EUX Euro Stoxx 50 Index Put 2700 March 2022
116,280 0.03
506 EUX Euro Stoxx 50 Index Put 2750 December 2021
42,504 0.01
514 EUX Euro Stoxx 50 Index Put 2900 June 2022
285,270 0.08
501 EUX Euro Stoxx 50 Index Put 2950 September 2022
407,313 0.12
341 EUX Euro Stoxx 50 Index Put 3100 December 2021
53,878 0.02
351 EUX Euro Stoxx 50 Index Put 3100 March 2022
151,983 0.04
361 EUX Euro Stoxx 50 Index Put 3300 June 2022
358,112 0.10
352 EUX Euro Stoxx 50 Index Put 3350 September 2022
487,168 0.14
209 EUX Euro Stoxx 50 Index Put 3450 December 2021
67,716 0.02
Number
of Securities
Commitment#
EUR
Market
Value
EUR
% of
Net
Assets
Options (continued)
226 EUX Euro Stoxx 50 Index Put 3500 March 2022
186,676 0.05
229 EUX Euro Stoxx 50 Index Put 3750 June 2022
438,993 0.13
235 EUX Euro Stoxx 50 Index Put 3750 September 2022
550,605 0.16
134 EUX Euro Stoxx 50 Index Put 3850 March 2022
202,072 0.06
126 EUX Euro Stoxx 50 Index Put 4150 June 2022
442,134 0.13
123 EUX Euro Stoxx 50 Index Put 4200 September 2022
525,702 0.15
162,740,000 FXO Call 1.21 USD/EUR February 2022 259,245 0.08
94,032,000 FXO Call 109 JPY/USD September 2022 2,860,253 0.84
100,140,000 FXO Call 31 TWD/USD February 2022 33,008 0.01
162,740,000 FXO Put 1.21 EUR/USD February 2022 6,829,710 2.00
94,032,000 FXO Put 109 USD/JPY September 2022 1,374,953 0.40
83,890,000 FXO Put 127 EUR/JPY October 2021 109,057 0.03
199,200,000 Swaption May 2022 USD 3 Month ICE LIBOR 2.00%
1,796,355 0.53
46,742,625 13.68Swaps (2.60%)
Credit Default Index Swaps (2.68%)
57,500,000 CDX 1.00% 20/12/2026 iTraxx-Crossover Pay EUR
(1,509,054) (0.44)
70,500,000 CDX 1.00% 20/12/2026 NAIGS37V Pay USD
(1,461,217) (0.43)
35,800,000 CDX 5.00% 20/12/2026 iTraxx-Crossover Pay EUR
(4,247,259) (1.24)
24,600,000 CDX 5.00% 20/12/2026 NAHYS37V Pay USD
(1,938,797) (0.57)
(9,156,327) (2.68)
Total Return Swaps 0.07%
9,846,948 TRS 0.00% June 2022 Pay USD Libor 1 Month
241,762 0.07
Currency Rate Swaps 0.01%
17,500 CRS 41.50% EURO STOXX 50 December 2022
32,056 0.01
15,000 CRS 42.00% EURO STOXX 50 December 2022
34,688 0.01
13,500 CRS 42.50% EURO STOXX 50 December 2022
48,571 0.01
16,500 CRS 83.00% EURO STOXX 50 December 2022
121,443 0.04
33,300 CRS 90.00% USD/EUR January 2022 (142,404) (0.04)
28,950 CRS 91.25% USD/EUR April 2022 (85,130) (0.02)
9,224 0.01
Forward Foreign Exchange Contracts (0.78%)
Buy AUD 147,405 : Sell EUR 91,331 October 2021
511 -
Buy AUD 165,000 : Sell EUR 102,659 October 2021
147 -
Buy AUD 41,082 : Sell EUR 25,413 October 2021
183 -
Buy CAD 283,700 : Sell EUR 191,729 October 2021
1,403 -
Buy CHF 147,350 : Sell EUR 136,031 October 2021
285 -
Unrealised
Gains/Losses
EUR
Unrealised
Gains/Losses
EUR
93
Global Multi-Strategy Fund
Portfolio as at 30 September 2021 (continued)
Number
of Securities
Commitment#
EUR
Market
Value
EUR
% of
Net
Assets
Forward Foreign Exchange Contracts (continued)
Buy CHF 220,347 : Sell EUR 203,534 October 2021
313 -
Buy CHF 246,777 : Sell EUR 227,843 October 2021
455 -
Buy CHF 284,712 : Sell EUR 262,668 October 2021
723 -
Buy CHF 73,080 : Sell EUR 67,608 October 2021
(1) -
Buy CHF 76,250 : Sell EUR 70,373 October 2021
167 -
Buy DKK 132,881 : Sell EUR 17,869 October 2021
- -
Buy DKK 3,058,036 : Sell EUR 411,218 October 2021
26 -
Buy DKK 531,258 : Sell EUR 71,442 October 2021
2 -
Buy EUR 10,370,000 : Sell USD 12,183,941 February 2022
(112,594) (0.03)
Buy EUR 10,370,000 : Sell USD 12,217,934 February 2022
(141,841) (0.04)
Buy EUR 10,370,000 : Sell USD 12,233,116 February 2022
(154,902) (0.05)
Buy EUR 10,370,000 : Sell USD 12,261,540 February 2022
(179,357) (0.05)
Buy EUR 10,370,000 : Sell USD 12,281,855 February 2022
(196,835) (0.06)
Buy EUR 10,370,000 : Sell USD 12,307,064 February 2022
(218,525) (0.06)
Buy EUR 10,370,000 : Sell USD 12,339,792 February 2022
(246,682) (0.07)
Buy EUR 10,833,539 : Sell JPY 1,391,003,432 October 2021
79,505 0.02
Buy EUR 11,070,000 : ell USD 12,839,894 February 2022
23,050 0.01
Buy EUR 11,070,000 : Sell USD 12,898,321 February 2022
(27,220) (0.01)
Buy EUR 11,070,000 : Sell USD 12,956,516 February 2022
(77,288) (0.02)
Buy EUR 11,070,000 : Sell USD 12,998,859 February 2022
(113,718) (0.03)
Buy EUR 11,070,000 : Sell USD 13,007,372 February 2022
(121,042) (0.04)
Buy EUR 11,070,000 : Sell USD 13,055,781 February 2022
(162,692) (0.05)
Buy EUR 11,070,000 : Sell USD 13,093,806 February 2022
(195,407) (0.06)
Buy EUR 11,070,000 : Sell USD 13,094,559 February 2022
(196,055) (0.06)
Buy EUR 11,070,000 : Sell USD 13,137,898 February 2022
(233,342) (0.07)
Buy EUR 115,933 : Sell NOK 1,172,689 October 2021
93 -
Buy EUR 1,261,888 : Sell GBP 1,085,700 October 2021
(700) -
Buy EUR 143,583,941 : Sell USD 168,533,076 October 2021
(1,767,393) (0.52)
Buy EUR 145,319 : Sell HKD 1,320,867 October 2021
(1,030) -
Buy EUR 1,671,890 : Sell SEK 16,935,793 October 2021
2,025 -
Buy EUR 1,689,671 : Sell USD 1,980,385 October 2021
(18,312) (0.01)
Number
of Securities
Commitment#
EUR
Market
Value
EUR
% of
Net
Assets
Forward Foreign Exchange Contracts (continued)
Buy EUR 171,983 : Sell JPY 22,380,100 October 2021
(1,041) -
Buy EUR 173,968 : Sell USD 203,914 October 2021
(1,898) -
Buy EUR 177,743 : Sell AUD 287,311 October 2021
(1,271) -
Buy EUR 187,267 : Sell DKK 1,392,688 October 2021
(21) -
Buy EUR 2,170,000 : Sell USD 2,595,359 February 2022
(62,947) (0.02)
Buy EUR 2,175,768 : Sell USD 2,554,706 October 2021
(27,537) (0.01)
Buy EUR 221,000 : Sell USD 265,421 February 2022
(7,358) -
Buy EUR 231,523 : Sell JPY 30,032,800 October 2021
(665) -
Buy EUR 242,489 : Sell JPY 31,554,280 October 2021
(1,462) -
Buy EUR 2,494,721 : Sell GBP 2,130,964 October 2021
16,570 -
Buy EUR 2,670,514 : Sell GBP 2,297,973 October 2021
(1,857) -
Buy EUR 288,725 : Sell GBP 248,276 October 2021
(1) -
Buy EUR 3,240,000 : Sell USD 3,856,572 February 2022
(78,046) (0.02)
Buy EUR 331,691 : Sell CAD 498,388 October 2021
(7,592) -
Buy EUR 3,341,833 : Sell HKD 30,447,029 October 2021
(31,626) (0.01)
Buy EUR 381,000 : Sell USD 466,763 February 2022
(20,585) (0.01)
Buy EUR 3,800,000 : Sell USD 4,611,642 February 2022
(167,679) (0.05)
Buy EUR 3,800,000 : Sell USD 4,613,181 February 2022
(169,003) (0.05)
Buy EUR 3,800,000 : Sell USD 4,635,810 February 2022
(188,473) (0.06)
Buy EUR 3,800,000 : Sell USD 4,639,116 February 2022
(191,317) (0.06)
Buy EUR 3,800,000 : Sell USD 4,664,215 February 2022
(212,911) (0.06)
Buy EUR 4,080,000 : Sell USD 4,873,193 February 2022
(112,708) (0.03)
Buy EUR 4,080,000 : Sell USD 4,899,631 February 2022
(135,454) (0.03)
Buy EUR 4,080,000 : Sell USD 4,900,774 February 2022
(136,437) (0.03)
Buy EUR 4,080,000 : Sell USD 4,900,814 February 2022
(136,472) (0.03)
Buy EUR 4,080,000 : Sell USD 4,926,192 February 2022
(158,306) (0.05)
Buy EUR 4,080,000 : Sell USD 4,951,855 February 2022
(180,386) (0.05)
Buy EUR 410,600 : Sell CHF 444,536 October 2021
(648) -
Buy EUR 449,289 : Sell HKD 4,099,117 October 2021
(4,884) -
Buy EUR 4,510,000 : Sell USD 5,381,467 February 2022
(120,007) (0.04)
Buy EUR 4,530,000 : Sell USD 5,414,981 February 2022
(128,841) (0.04)
Unrealised
Gains/Losses
EUR
Unrealised
Gains/Losses
EUR
94
Global Multi-Strategy Fund
Portfolio as at 30 September 2021 (continued)
Number
of Securities
Commitment#
EUR
Market
Value
EUR
% of
Net
Assets
Forward Foreign Exchange Contracts (continued)
Buy EUR 4,810,000 : Sell USD 5,689,109 February 2022
(84,691) (0.02)
Buy EUR 4,810,000 : Sell USD 5,718,898 February 2022
(110,319) (0.03)
Buy EUR 485,148 : Sell GBP 415,000 October 2021
2,534 -
Buy EUR 488,001 : Sell USD 573,725 October 2021
(6,807) -
Buy EUR 5,000,000 : Sell USD 5,916,100 February 2022
(89,985) (0.03)
Buy EUR 50,507 : Sell CAD 74,200 October 2021
(6) -
Buy EUR 50,933 : Sell AUD 82,200 October 2021
(283) -
Buy EUR 51,861 : Sell PLN 240,182 October 2021
(297) -
Buy EUR 522,271 : Sell HKD 4,747,100 October 2021
(3,697) -
Buy EUR 591,844 : Sell AUD 956,301 October 2021
(4,218) -
Buy EUR 5,839,193 : Sell JPY 758,500,000 October 2021
(24,873) (0.01)
Buy EUR 6,190,000 : Sell USD 7,401,532 February 2022
(177,993) (0.05)
Buy EUR 650,000 : Sell USD 774,794 February 2022
(16,603) -
Buy EUR 6,800,000 : Sell USD 8,207,416 February 2022
(261,345) (0.08)
Buy EUR 6,800,000 : Sell USD 8,245,775 February 2022
(294,348) (0.09)
Buy EUR 727,272 : Sell USD 855,070 October 2021
(10,182) -
Buy EUR 7,300,000 : Sell USD 8,853,754 February 2022
(317,429) (0.09)
Buy EUR 7,300,000 : Sell USD 8,892,853 February 2022
(351,068) (0.10)
Buy EUR 7,830,000 : Sell USD 9,537,057 February 2022
(375,317) (0.11)
Buy EUR 7,830,000 : Sell USD 9,579,723 February 2022
(412,025) (0.12)
Buy EUR 7,860,000 : Sell USD 9,617,630 February 2022
(414,638) (0.12)
Buy EUR 7,860,000 : Sell USD 9,618,471 February 2022
(415,362) (0.12)
Buy EUR 7,860,000 : Sell USD 9,621,198 February 2022
(417,709) (0.12)
Buy EUR 8,300,000 : Sell USD 10,025,794 February 2022
(325,808) (0.10)
Buy EUR 8,300,000 : Sell USD 10,065,128 February 2022
(359,649) (0.11)
Buy EUR 8,300,000 : Sell USD 10,104,769 February 2022
(393,754) (0.12)
Buy EUR 8,300,000 : Sell USD 10,147,613 February 2022
(430,616) (0.13)
Buy EUR 8,300,000 : Sell USD 9,907,420 February 2022
(223,963) (0.07)
Buy EUR 8,300,000 : Sell USD 9,913,860 February 2022
(229,504) (0.07)
Buy EUR 8,300,000 : Sell USD 9,946,147 February 2022
(257,282) (0.08)
Buy EUR 8,300,000 : Sell USD 9,951,941 February 2022
(262,267) (0.08)
Number
of Securities
Commitment#
EUR
Market
Value
EUR
% of
Net
Assets
Forward Foreign Exchange Contracts (continued)
Buy EUR 8,300,000 : Sell USD 9,987,274 February 2022
(292,666) (0.09)
Buy EUR 836,508 : Sell GBP 721,800 October 2021
(2,892) -
Buy EUR 868,238 : Sell HKD 7,932,191 October 2021
(10,630) -
Buy EUR 962,426 : Sell CHF 1,043,195 October 2021
(2,650) -
Buy EUR 963,332 : Sell SEK 9,812,899 October 2021
(4,217) -
Buy EUR 9,100,000 : Sell USD 10,786,330 February 2022
(180,143) (0.05)
Buy EUR 9,100,000 : Sell USD 10,788,523 February 2022
(182,030) (0.05)
Buy EUR 9,100,000 : Sell USD 10,789,388 February 2022
(182,774) (0.05)
Buy EUR 9,100,000 : Sell USD 10,823,449 February 2022
(212,079) (0.06)
Buy EUR 9,100,000 : Sell USD 10,831,475 February 2022
(218,985) (0.06)
Buy EUR 9,120,000 : Sell USD 10,769,252 February 2022
(145,450) (0.04)
Buy EUR 9,120,000 : Sell USD 10,775,654 February 2022
(150,958) (0.04)
Buy EUR 9,120,000 : Sell USD 10,863,352 February 2022
(226,410) (0.07)
Buy EUR 9,602,803 : Sell AUD 15,550,216 October 2021
(85,992) (0.03)
Buy GBP 137,651 : Sell EUR 159,007 October 2021
1,071 -
Buy GBP 21,051 : Sell EUR 24,319 October 2021
162 -
Buy GBP 22,749 : Sell EUR 26,442 October 2021
13 -
Buy GBP 299,103 : Sell EUR 347,824 October 2021
10 -
Buy GBP 547,700 : Sell EUR 639,046 October 2021
(2,112) -
Buy HKD 30,447,029 : Sell EUR 3,343,182 October 2021
31,651 0.01
Buy HKD 540,200 : Sell EUR 59,102 October 2021
750 -
Buy HKD 76,357 : Sell EUR 8,381 October 2021
80 -
Buy JPY 14,863,000 : Sell EUR 114,813 October 2021
95 -
Buy JPY 26,901,400 : Sell EUR 207,978 October 2021
- -
Buy JPY 30,032,800 : Sell EUR 231,602 October 2021
657 -
Buy JPY 34,593,934 : Sell EUR 265,853 October 2021
1,597 -
Buy JPY 35,388,789 : Sell EUR 272,165 October 2021
1,431 -
Buy JPY 409,873,780 : Sell USD 3,761,000 September 2022
(63,101) (0.02)
Buy JPY 576,417,100 : Sell USD 5,260,000 September 2022
(63,740) (0.02)
Buy JPY 579,010,280 : Sell USD 5,260,000 September 2022
(43,766) (0.01)
Buy JPY 581,619,240 : Sell USD 5,260,000 September 2022
(23,671) (0.01)
Unrealised
Gains/Losses
EUR
Unrealised
Gains/Losses
EUR
95
Global Multi-Strategy Fund
Portfolio as at 30 September 2021 (continued)
Number
of Securities
Commitment#
EUR
Market
Value
EUR
% of
Net
Assets
Forward Foreign Exchange Contracts (continued)
Buy JPY 584,283,430 : Sell USD 5,260,000 September 2022
(3,150) -
Buy JPY 587,352,640 : Sell USD 5,260,000 September 2022
20,491 0.01
Buy JPY 758,500,000 : Sell EUR 5,840,996 October 2021
24,893 0.01
Buy NOK 1,021,061 : Sell EUR 100,391 October 2021
471 -
Buy SEK 170,217 : Sell EUR 16,773 October 2021
10 -
Buy SEK 351,335 : Sell EUR 34,404 October 2021
238 -
Buy SEK 4,049,027 : Sell EUR 399,206 October 2021
27 -
Buy SEK 581,598 : Sell EUR 57,009 October 2021
336 -
Buy SEK 6,722,713 : Sell EUR 658,291 October 2021
4,567 -
Buy SEK 728,221 : Sell EUR 71,379 October 2021
423 -
Buy USD 10,190,840 : Sell EUR 8,300,000 February 2022
467,806 0.14
Buy USD 10,811,660 : Sell EUR 9,120,000 February 2022
181,936 0.05
Buy USD 10,816,995 : Sell EUR 9,120,000 February 2022
186,526 0.05
Buy USD 10,828,490 : Sell EUR 9,100,000 February 2022
216,417 0.06
Buy USD 10,828,936 : Sell EUR 9,100,000 February 2022
216,800 0.06
Buy USD 10,858,591 : Sell EUR 9,120,000 February 2022
222,314 0.07
Buy USD 10,863,944 : Sell EUR 9,100,000 February 2022
246,919 0.07
Buy USD 10,896,731 : Sell EUR 9,120,000 February 2022
255,128 0.07
Buy USD 120,610 : Sell EUR 100,000 February 2022
3,768 -
Buy USD 12,224,633 : Sell EUR 10,370,000 February 2022
147,604 0.04
Buy USD 12,264,226 : Sell EUR 10,370,000 February 2022
181,668 0.05
Buy USD 12,269,701 : Sell EUR 10,370,000 February 2022
186,379 0.05
Buy USD 12,323,065 : Sell EUR 10,370,000 February 2022
232,291 0.07
Buy USD 12,330,646 : Sell EUR 10,370,000 February 2022
238,813 0.07
Buy USD 12,368,818 : Sell EUR 10,370,000 February 2022
271,655 0.08
Buy USD 13,047,279 : Sell EUR 11,070,000 February 2022
155,377 0.05
Buy USD 13,136,359 : Sell EUR 11,070,000 February 2022
232,018 0.07
Buy USD 133,923 : Sell EUR 113,911 October 2021
1,591 -
Buy USD 1,240,611 : Sell EUR 1,062,205 October 2021
7,760 -
Buy USD 1,317,306 : Sell HKD 10,250,000 November 2021
370 -
Buy USD 1,472,626 : Sell EUR 1,254,257 October 2021
15,810 -
Number
of Securities
Commitment#
EUR
Market
Value
EUR
% of
Net
Assets
Forward Foreign Exchange Contracts (continued)
Buy USD 1,569,230 : Sell EUR 1,300,000 February 2022
50,105 0.01
Buy USD 1,888,433 : Sell EUR 1,613,077 October 2021
15,602 -
Buy USD 1,937,121 : Sell EUR 1,584,000 February 2022
82,624 0.02
Buy USD 196,121 : Sell EUR 168,755 October 2021
389 -
Buy USD 2,077,230 : Sell EUR 1,700,000 February 2022
87,169 0.03
Buy USD 2,373,939 : Sell EUR 1,940,000 February 2022
102,446 0.03
Buy USD 352,818 : Sell EUR 302,072 October 2021
2,215 -
Buy USD 4,355,496 : Sell EUR 3,590,000 February 2022
157,301 0.05
Buy USD 4,377,897 : Sell EUR 3,590,000 February 2022
176,575 0.05
Buy USD 4,634,598 : Sell EUR 3,800,000 February 2022
187,430 0.05
Buy USD 4,636,760 : Sell EUR 3,800,000 February 2022
189,290 0.06
Buy USD 4,657,888 : Sell EUR 3,800,000 February 2022
207,468 0.06
Buy USD 4,660,092 : Sell EUR 3,800,000 February 2022
209,364 0.06
Buy USD 4,685,780 : Sell EUR 3,800,000 February 2022
231,465 0.07
Buy USD 4,898,774 : Sell EUR 4,080,000 February 2022
134,717 0.04
Buy USD 4,924,132 : Sell EUR 4,080,000 February 2022
156,533 0.05
Buy USD 4,925,131 : Sell EUR 4,080,000 February 2022
157,393 0.05
Buy USD 5,260,000 : Sell JPY 584,567,996 September 2022
958 -
Buy USD 542,478 : Sell EUR 467,847 October 2021
13 -
Buy USD 610,185 : Sell EUR 500,000 February 2022
24,980 0.01
Buy USD 69,566 : Sell EUR 59,424 October 2021
573 -
Buy USD 731,100 : Sell EUR 600,000 February 2022
29,010 0.01
Buy USD 7,359,576 : Sell EUR 6,190,000 February 2022
141,896 0.04
Buy USD 7,399,396 : Sell EUR 6,190,000 February 2022
176,156 0.05
Buy USD 7,434,537 : Sell EUR 6,190,000 February 2022
206,389 0.06
Buy USD 7,435,812 : Sell EUR 6,190,000 February 2022
207,486 0.06
Buy USD 744,841 : Sell EUR 640,929 October 2021
1,459 -
Buy USD 7,471,423 : Sell EUR 6,190,000 February 2022
238,125 0.07
Buy USD 812,597 : Sell EUR 700,828 October 2021
(4) -
Buy USD 8,243,953 : Sell EUR 6,800,000 February 2022
292,780 0.09
Buy USD 8,247,652 : Sell EUR 6,800,000 February 2022
295,963 0.09
Unrealised
Gains/Losses
EUR
Unrealised
Gains/Losses
EUR
96
Global Multi-Strategy Fund
Portfolio as at 30 September 2021 (continued)
Number
of Securities
Commitment#
EUR
Market
Value
EUR
% of
Net
Assets
Forward Foreign Exchange Contracts (continued)
Buy USD 8,279,578 : Sell EUR 6,800,000 February 2022
323,430 0.09
Buy USD 8,285,222 : Sell EUR 6,800,000 February 2022
328,286 0.10
Buy USD 8,322,819 : Sell EUR 6,800,000 February 2022
360,634 0.11
Buy USD 8,894,685 : Sell EUR 7,300,000 February 2022
352,645 0.10
Buy USD 9,577,351 : Sell EUR 7,830,000 February 2022
409,984 0.12
Buy USD 9,618,872 : Sell EUR 7,860,000 February 2022
415,707 0.12
Buy USD 9,660,490 : Sell EUR 7,860,000 February 2022
451,514 0.13
Buy USD 9,663,854 : Sell EUR 7,860,000 February 2022
454,409 0.13
Buy USD 9,664,742 : Sell EUR 7,860,000 February 2022
455,173 0.13
Buy USD 9,666,212 : Sell EUR 7,860,000 February 2022
456,437 0.13
Buy USD 9,946,961 : Sell EUR 8,300,000 February 2022
257,982 0.08
Buy USD 9,985,481 : Sell EUR 8,300,000 February 2022
291,124 0.09
Buy ZAR 381,348 : Sell EUR 21,894 October 2021
(109) -
(2,614,822) (0.78)
Forward Foreign Exchange Contracts (Hedged share classes) 0.18%
Buy AUD 1,036,453 : Sell EUR 640,908 October 2021
4,928 -
Buy AUD 1,052,925 : Sell EUR 654,645 October 2021
1,455 -
Buy AUD 1,235,988 : Sell EUR 764,204 October 2021
5,967 -
Buy AUD 1,756,567 : Sell EUR 1,095,983 October 2021
(1,428) -
Buy AUD 2,050,302 : Sell EUR 1,270,332 October 2021
7,254 -
Buy AUD 2,063,350 : Sell EUR 1,278,100 October 2021
7,617 -
Buy AUD 353,146,215 : Sell EUR 220,256,461 October 2021
(203,585) (0.06)
Buy AUD 4,079,004 : Sell EUR 2,529,775 October 2021
11,939 0.01
Buy AUD 494,969 : Sell EUR 308,339 October 2021
86 -
Buy AUD 496,959 :Sell EUR 307,978 October 2021
1,688 -
Buy AUD 660,725 : Sell EUR 411,105 October 2021
607 -
Buy AUD 695,434 : Sell EUR 430,091 October 2021
3,249 -
Buy AUD 717,779 : Sell EUR 442,075 October 2021
5,188 -
Buy AUD 789,266 : Sell EUR 488,005 October 2021
3,804 -
Buy AUD 938,948 : Sell EUR 585,620 October 2021
(541) -
Buy AUD 956,517 : Sell EUR 591,844 October 2021
4,182 -
Number
of Securities
Commitment#
EUR
Market
Value
EUR
% of
Net
Assets
Forward Foreign Exchange Contracts (Hedged share classes) (continued)
Buy EUR 14,494 : Sell GBP 12,347 October 2021
134 -
Buy EUR 17 : Sell JPY 2,161 October 2021
- -
Buy EUR 3 : Sell GBP 2 October 2021
- -
Buy EUR 3 : Sell GBP 2 October 2021
- -
Buy EUR 3 : Sell GBP 2 October 2021
- -
Buy EUR 34,674 : Sell USD 41,017 October 2021
(705) -
Buy EUR 37,756 : Sell JPY 4,898,916 October 2021
(121) -
Buy EUR 985,475 : Sell AUD 1,590,031 October 2021
(5,307) -
Buy GBP 14,797,102 : Sell EUR 17,370,957 October 2021
(161,170) (0.05)
Buy GBP 166,842 : Sell EUR 194,248 October 2021
(201) -
Buy GBP 2,600 : Sell EUR 3,053 October 2021
(28) -
Buy GBP 2,611 : Sell EUR 3,066 October 2021
(28) -
Buy GBP 2,613 : Sell EUR 3,068 October 2021
(28) -
Buy GBP 29 : Sell EUR 33 October 2021
- -
Buy GBP 29 : Sell EUR 34 October 2021
- -
Buy GBP 30 : Sell EUR 35 October 2021
- -
Buy JPY 331,589 : Sell EUR 2,556 October 2021
8 -
Buy JPY 3,640 : Sell EUR 28 October 2021
- -
Buy JPY 760,354,019 : Sell EUR 5,860,002 October 2021
18,836 0.01
Buy JPY 8,713,621 : Sell EUR 66,940 October 2021
432 -
Buy NOK 110,370 : Sell EUR 10,923 October 2021
(18) -
Buy NOK 207,974 : Sell EUR 20,395 October 2021
152 -
Buy NOK 25,456 : Sell EUR 2,496 October 2021
19 -
Buy NOK 268,521 : Sell EUR 26,322 October 2021
207 -
Buy NOK 284 : Sell EUR 28 October 2021
- -
Buy NOK 566 : Sell EUR 56 October 2021
- -
Buy NOK 9,591,168 : Sell EUR 940,554 October 2021
7,031 -
Buy SEK 25,838 : Sell EUR 2,537 October 2021
11 -
Buy SEK 25,984 : Sell EUR 2,551 October 2021
11 -
Buy SEK 285 : Sell EUR 28 October 2021
- -
Buy SEK 293 : Sell EUR 29 October 2021
- -
Unrealised
Gains/Losses
EUR
Unrealised
Gains/Losses
EUR
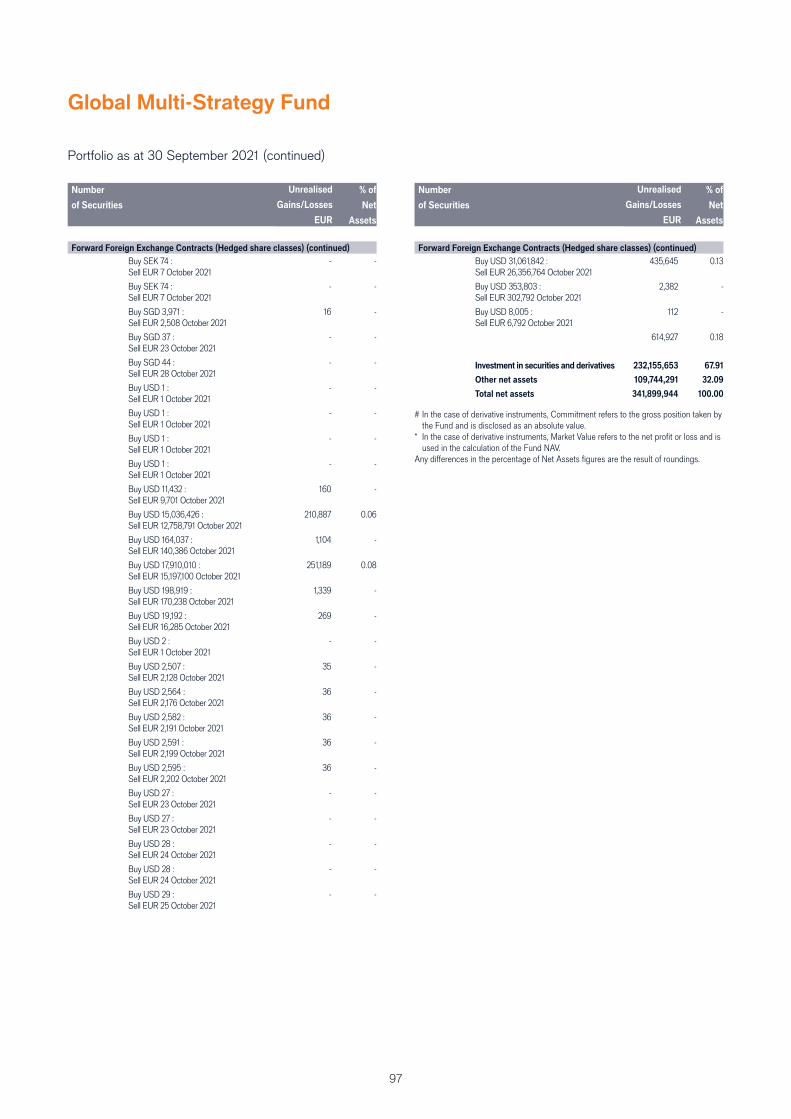
97
Global Multi-Strategy Fund
Portfolio as at 30 September 2021 (continued)
Number
of Securities
Commitment#
EUR
Market
Value
EUR
% of
Net
Assets
Forward Foreign Exchange Contracts (Hedged share classes) (continued)
Buy SEK 74 : Sell EUR 7 October 2021
- -
Buy SEK 74 : Sell EUR 7 October 2021
- -
Buy SGD 3,971 : Sell EUR 2,508 October 2021
16 -
Buy SGD 37 : Sell EUR 23 October 2021
- -
Buy SGD 44 : Sell EUR 28 October 2021
- -
Buy USD 1 : Sell EUR 1 October 2021
- -
Buy USD 1 : Sell EUR 1 October 2021
- -
Buy USD 1 : Sell EUR 1 October 2021
- -
Buy USD 1 : Sell EUR 1 October 2021
- -
Buy USD 11,432 : Sell EUR 9,701 October 2021
160 -
Buy USD 15,036,426 : Sell EUR 12,758,791 October 2021
210,887 0.06
Buy USD 164,037 : Sell EUR 140,386 October 2021
1,104 -
Buy USD 17,910,010 : Sell EUR 15,197,100 October 2021
251,189 0.08
Buy USD 198,919 : Sell EUR 170,238 October 2021
1,339 -
Buy USD 19,192 : Sell EUR 16,285 October 2021
269 -
Buy USD 2 : Sell EUR 1 October 2021
- -
Buy USD 2,507 : Sell EUR 2,128 October 2021
35 -
Buy USD 2,564 : Sell EUR 2,176 October 2021
36 -
Buy USD 2,582 : Sell EUR 2,191 October 2021
36 -
Buy USD 2,591 : Sell EUR 2,199 October 2021
36 -
Buy USD 2,595 : Sell EUR 2,202 October 2021
36 -
Buy USD 27 : Sell EUR 23 October 2021
- -
Buy USD 27 : Sell EUR 23 October 2021
- -
Buy USD 28 : Sell EUR 24 October 2021
- -
Buy USD 28 : Sell EUR 24 October 2021
- -
Buy USD 29 : Sell EUR 25 October 2021
- -
Number
of Securities
Commitment#
EUR
Market
Value
EUR
% of
Net
Assets
Forward Foreign Exchange Contracts (Hedged share classes) (continued)
Buy USD 31,061,842 : Sell EUR 26,356,764 October 2021
435,645 0.13
Buy USD 353,803 : Sell EUR 302,792 October 2021
2,382 -
Buy USD 8,005 : Sell EUR 6,792 October 2021
112 -
614,927 0.18
Investment in securities and derivatives 232,155,653 67.91
Other net assets 109,744,291 32.09
Total net assets 341,899,944 100.00
# In the case of derivative instruments, Commitment refers to the gross position taken by the Fund and is disclosed as an absolute value.
* In the case of derivative instruments, Market Value refers to the net profi t or loss and is used in the calculation of the Fund NAV.
Any diff erences in the percentage of Net Assets fi gures are the result of roundings.
Unrealised
Gains/Losses
EUR
Unrealised
Gains/Losses
EUR
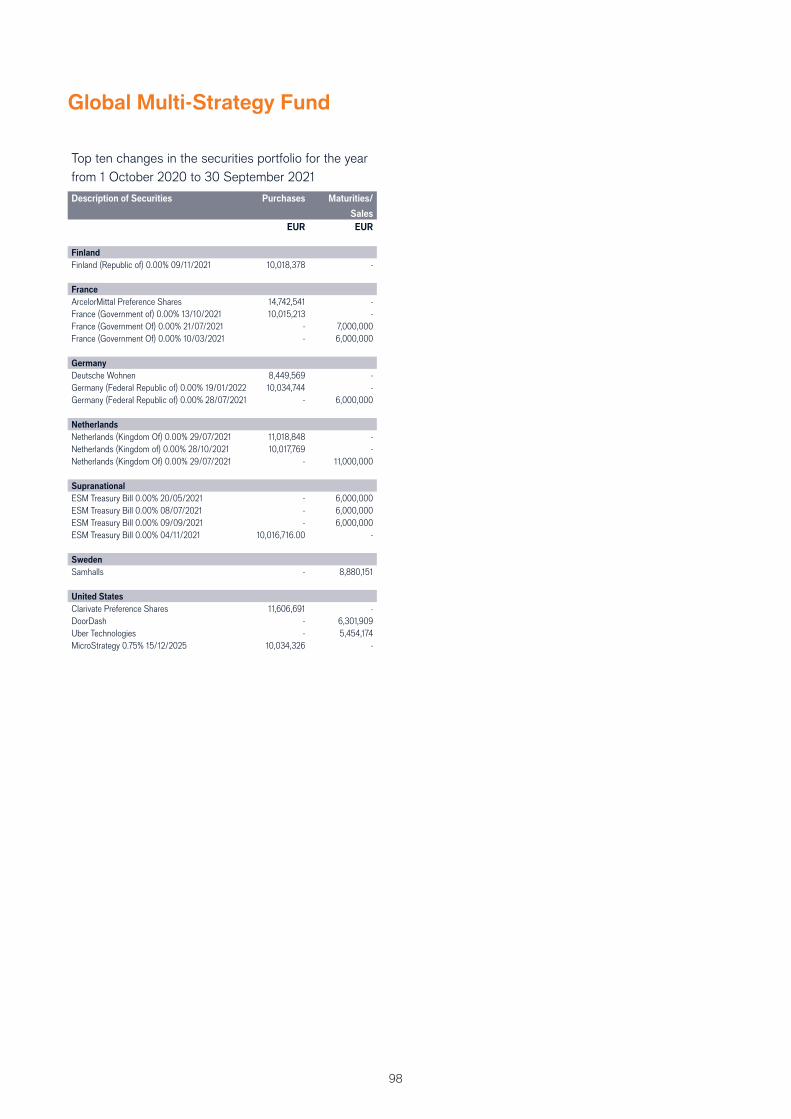
98
Top ten changes in the securities portfolio for the year
from 1 October 2020 to 30 September 2021
Description of Securities Purchases Maturities/
Sales
EUR EUR
Finland
Finland (Republic of) 0.00% 09/11/2021 10,018,378 -
France
ArcelorMittal Preference Shares 14,742,541 - France (Government of) 0.00% 13/10/2021 10,015,213 - France (Government Of) 0.00% 21/07/2021 - 7,000,000 France (Government Of) 0.00% 10/03/2021 - 6,000,000
Germany
Deutsche Wohnen 8,449,569 - Germany (Federal Republic of) 0.00% 19/01/2022 10,034,744 - Germany (Federal Republic of) 0.00% 28/07/2021 - 6,000,000
Netherlands
Netherlands (Kingdom Of) 0.00% 29/07/2021 11,018,848 - Netherlands (Kingdom of) 0.00% 28/10/2021 10,017,769 - Netherlands (Kingdom Of) 0.00% 29/07/2021 - 11,000,000
Supranational
ESM Treasury Bill 0.00% 20/05/2021 - 6,000,000 ESM Treasury Bill 0.00% 08/07/2021 - 6,000,000 ESM Treasury Bill 0.00% 09/09/2021 - 6,000,000 ESM Treasury Bill 0.00% 04/11/2021 10,016,716.00 -
Sweden
Samhalls - 8,880,151
United States
Clarivate Preference Shares 11,606,691 - DoorDash - 6,301,909 Uber Technologies - 5,454,174 MicroStrategy 0.75% 15/12/2025 10,034,326 -
Global Multi-Strategy Fund
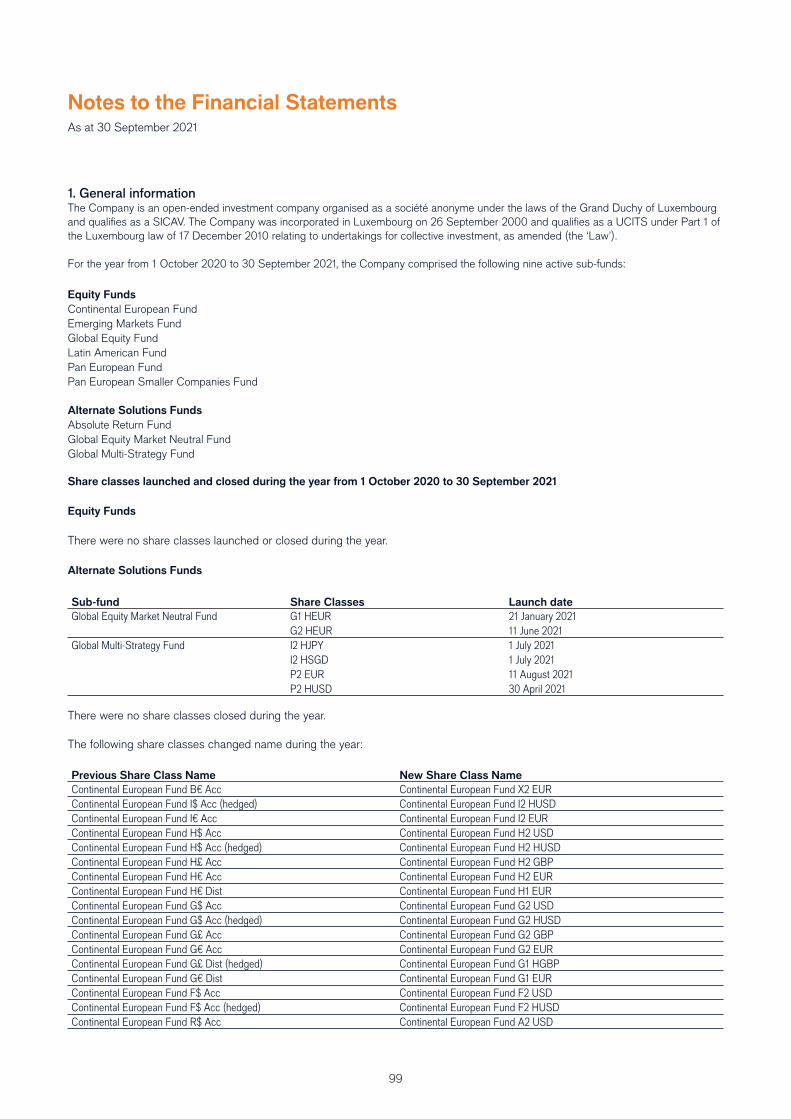
99
1. General informationThe Company is an open-ended investment company organised as a société anonyme under the laws of the Grand Duchy of Luxembourg
and qualifi es as a SICAV. The Company was incorporated in Luxembourg on 26 September 2000 and qualifi es as a UCITS under Part 1 of
the Luxembourg law of 17 December 2010 relating to undertakings for collective investment, as amended (the ‘Law’).
For the year from 1 October 2020 to 30 September 2021, the Company comprised the following nine active sub-funds:
Equity Funds
Continental European Fund
Emerging Markets Fund
Global Equity Fund
Latin American Fund
Pan European Fund
Pan European Smaller Companies Fund
Alternate Solutions Funds
Absolute Return Fund
Global Equity Market Neutral Fund
Global Multi-Strategy Fund
Share classes launched and closed during the year from 1 October 2020 to 30 September 2021
Equity Funds
There were no share classes launched or closed during the year.
Alternate Solutions Funds
Sub-fund Share Classes Launch date
Global Equity Market Neutral Fund G1 HEUR 21 January 2021G2 HEUR 11 June 2021
Global Multi-Strategy Fund I2 HJPY 1 July 2021I2 HSGD 1 July 2021P2 EUR 11 August 2021P2 HUSD 30 April 2021
There were no share classes closed during the year.
The following share classes changed name during the year:
Previous Share Class Name New Share Class Name
Continental European Fund B€ Acc Continental European Fund X2 EURContinental European Fund I$ Acc (hedged) Continental European Fund I2 HUSDContinental European Fund I€ Acc Continental European Fund I2 EURContinental European Fund H$ Acc Continental European Fund H2 USDContinental European Fund H$ Acc (hedged) Continental European Fund H2 HUSDContinental European Fund H£ Acc Continental European Fund H2 GBPContinental European Fund H€ Acc Continental European Fund H2 EURContinental European Fund H€ Dist Continental European Fund H1 EURContinental European Fund G$ Acc Continental European Fund G2 USDContinental European Fund G$ Acc (hedged) Continental European Fund G2 HUSDContinental European Fund G£ Acc Continental European Fund G2 GBPContinental European Fund G€ Acc Continental European Fund G2 EURContinental European Fund G£ Dist (hedged) Continental European Fund G1 HGBPContinental European Fund G€ Dist Continental European Fund G1 EURContinental European Fund F$ Acc Continental European Fund F2 USDContinental European Fund F$ Acc (hedged) Continental European Fund F2 HUSDContinental European Fund R$ Acc Continental European Fund A2 USD
Notes to the Financial Statements As at 30 September 2021
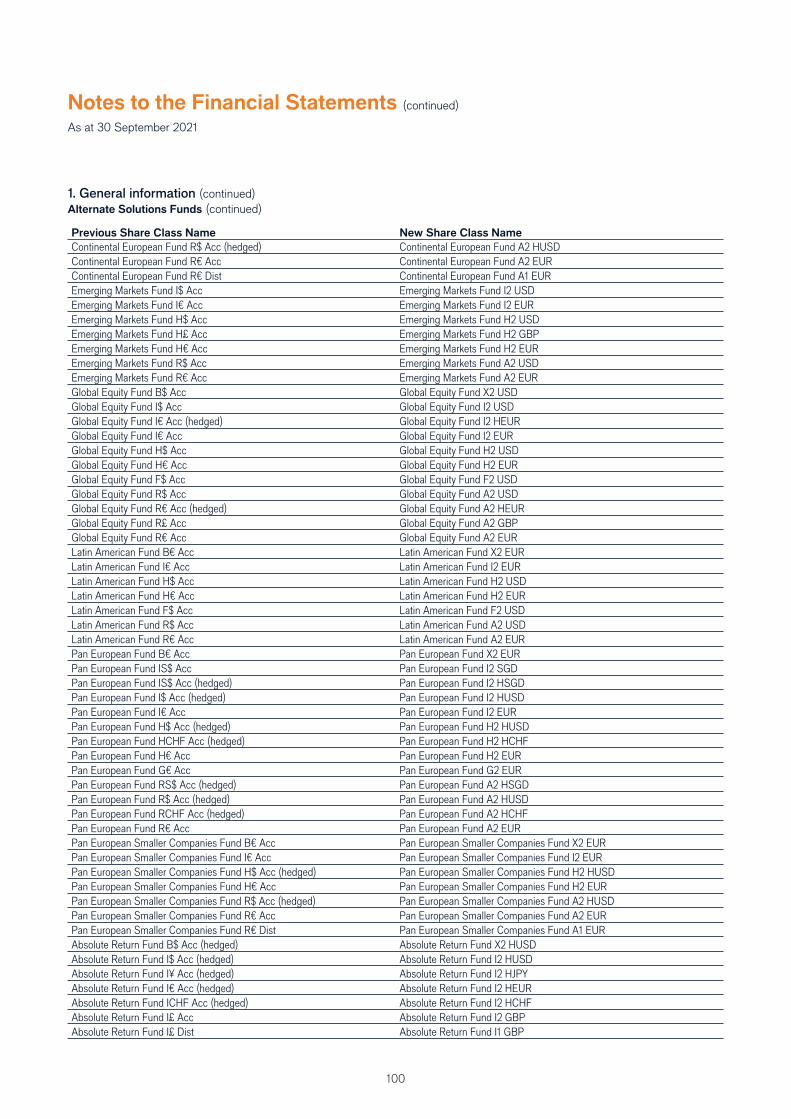
100
Previous Share Class Name New Share Class Name
Continental European Fund R$ Acc (hedged) Continental European Fund A2 HUSDContinental European Fund R€ Acc Continental European Fund A2 EURContinental European Fund R€ Dist Continental European Fund A1 EUREmerging Markets Fund I$ Acc Emerging Markets Fund I2 USDEmerging Markets Fund I€ Acc Emerging Markets Fund I2 EUREmerging Markets Fund H$ Acc Emerging Markets Fund H2 USDEmerging Markets Fund H£ Acc Emerging Markets Fund H2 GBPEmerging Markets Fund H€ Acc Emerging Markets Fund H2 EUREmerging Markets Fund R$ Acc Emerging Markets Fund A2 USDEmerging Markets Fund R€ Acc Emerging Markets Fund A2 EURGlobal Equity Fund B$ Acc Global Equity Fund X2 USDGlobal Equity Fund I$ Acc Global Equity Fund I2 USDGlobal Equity Fund I€ Acc (hedged) Global Equity Fund I2 HEURGlobal Equity Fund I€ Acc Global Equity Fund I2 EURGlobal Equity Fund H$ Acc Global Equity Fund H2 USDGlobal Equity Fund H€ Acc Global Equity Fund H2 EURGlobal Equity Fund F$ Acc Global Equity Fund F2 USDGlobal Equity Fund R$ Acc Global Equity Fund A2 USDGlobal Equity Fund R€ Acc (hedged) Global Equity Fund A2 HEURGlobal Equity Fund R£ Acc Global Equity Fund A2 GBPGlobal Equity Fund R€ Acc Global Equity Fund A2 EURLatin American Fund B€ Acc Latin American Fund X2 EURLatin American Fund I€ Acc Latin American Fund I2 EURLatin American Fund H$ Acc Latin American Fund H2 USDLatin American Fund H€ Acc Latin American Fund H2 EURLatin American Fund F$ Acc Latin American Fund F2 USDLatin American Fund R$ Acc Latin American Fund A2 USDLatin American Fund R€ Acc Latin American Fund A2 EURPan European Fund B€ Acc Pan European Fund X2 EURPan European Fund IS$ Acc Pan European Fund I2 SGDPan European Fund IS$ Acc (hedged) Pan European Fund I2 HSGDPan European Fund I$ Acc (hedged) Pan European Fund I2 HUSDPan European Fund I€ Acc Pan European Fund I2 EURPan European Fund H$ Acc (hedged) Pan European Fund H2 HUSDPan European Fund HCHF Acc (hedged) Pan European Fund H2 HCHFPan European Fund H€ Acc Pan European Fund H2 EURPan European Fund G€ Acc Pan European Fund G2 EURPan European Fund RS$ Acc (hedged) Pan European Fund A2 HSGDPan European Fund R$ Acc (hedged) Pan European Fund A2 HUSDPan European Fund RCHF Acc (hedged) Pan European Fund A2 HCHFPan European Fund R€ Acc Pan European Fund A2 EURPan European Smaller Companies Fund B€ Acc Pan European Smaller Companies Fund X2 EURPan European Smaller Companies Fund I€ Acc Pan European Smaller Companies Fund I2 EURPan European Smaller Companies Fund H$ Acc (hedged) Pan European Smaller Companies Fund H2 HUSDPan European Smaller Companies Fund H€ Acc Pan European Smaller Companies Fund H2 EURPan European Smaller Companies Fund R$ Acc (hedged) Pan European Smaller Companies Fund A2 HUSDPan European Smaller Companies Fund R€ Acc Pan European Smaller Companies Fund A2 EURPan European Smaller Companies Fund R€ Dist Pan European Smaller Companies Fund A1 EURAbsolute Return Fund B$ Acc (hedged) Absolute Return Fund X2 HUSDAbsolute Return Fund I$ Acc (hedged) Absolute Return Fund I2 HUSDAbsolute Return Fund I¥ Acc (hedged) Absolute Return Fund I2 HJPYAbsolute Return Fund I€ Acc (hedged) Absolute Return Fund I2 HEURAbsolute Return Fund ICHF Acc (hedged) Absolute Return Fund I2 HCHFAbsolute Return Fund I£ Acc Absolute Return Fund I2 GBPAbsolute Return Fund I£ Dist Absolute Return Fund I1 GBP
Notes to the Financial Statements (continued)
As at 30 September 2021
1. General information (continued)
Alternate Solutions Funds (continued)
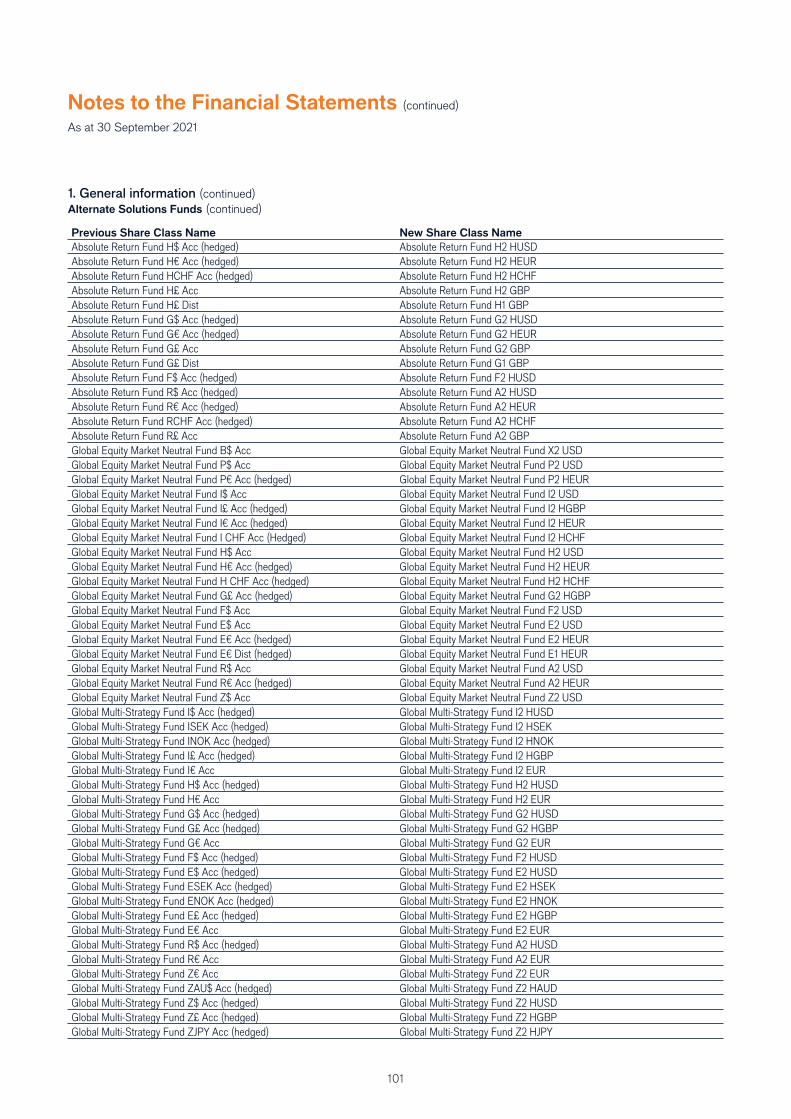
101
Previous Share Class Name New Share Class Name
Absolute Return Fund H$ Acc (hedged) Absolute Return Fund H2 HUSDAbsolute Return Fund H€ Acc (hedged) Absolute Return Fund H2 HEURAbsolute Return Fund HCHF Acc (hedged) Absolute Return Fund H2 HCHFAbsolute Return Fund H£ Acc Absolute Return Fund H2 GBPAbsolute Return Fund H£ Dist Absolute Return Fund H1 GBPAbsolute Return Fund G$ Acc (hedged) Absolute Return Fund G2 HUSDAbsolute Return Fund G€ Acc (hedged) Absolute Return Fund G2 HEURAbsolute Return Fund G£ Acc Absolute Return Fund G2 GBPAbsolute Return Fund G£ Dist Absolute Return Fund G1 GBPAbsolute Return Fund F$ Acc (hedged) Absolute Return Fund F2 HUSDAbsolute Return Fund R$ Acc (hedged) Absolute Return Fund A2 HUSDAbsolute Return Fund R€ Acc (hedged) Absolute Return Fund A2 HEURAbsolute Return Fund RCHF Acc (hedged) Absolute Return Fund A2 HCHFAbsolute Return Fund R£ Acc Absolute Return Fund A2 GBPGlobal Equity Market Neutral Fund B$ Acc Global Equity Market Neutral Fund X2 USDGlobal Equity Market Neutral Fund P$ Acc Global Equity Market Neutral Fund P2 USDGlobal Equity Market Neutral Fund P€ Acc (hedged) Global Equity Market Neutral Fund P2 HEURGlobal Equity Market Neutral Fund I$ Acc Global Equity Market Neutral Fund I2 USDGlobal Equity Market Neutral Fund I£ Acc (hedged) Global Equity Market Neutral Fund I2 HGBPGlobal Equity Market Neutral Fund I€ Acc (hedged) Global Equity Market Neutral Fund I2 HEURGlobal Equity Market Neutral Fund I CHF Acc (Hedged) Global Equity Market Neutral Fund I2 HCHFGlobal Equity Market Neutral Fund H$ Acc Global Equity Market Neutral Fund H2 USDGlobal Equity Market Neutral Fund H€ Acc (hedged) Global Equity Market Neutral Fund H2 HEURGlobal Equity Market Neutral Fund H CHF Acc (hedged) Global Equity Market Neutral Fund H2 HCHFGlobal Equity Market Neutral Fund G£ Acc (hedged) Global Equity Market Neutral Fund G2 HGBPGlobal Equity Market Neutral Fund F$ Acc Global Equity Market Neutral Fund F2 USDGlobal Equity Market Neutral Fund E$ Acc Global Equity Market Neutral Fund E2 USDGlobal Equity Market Neutral Fund E€ Acc (hedged) Global Equity Market Neutral Fund E2 HEURGlobal Equity Market Neutral Fund E€ Dist (hedged) Global Equity Market Neutral Fund E1 HEURGlobal Equity Market Neutral Fund R$ Acc Global Equity Market Neutral Fund A2 USDGlobal Equity Market Neutral Fund R€ Acc (hedged) Global Equity Market Neutral Fund A2 HEURGlobal Equity Market Neutral Fund Z$ Acc Global Equity Market Neutral Fund Z2 USDGlobal Multi-Strategy Fund I$ Acc (hedged) Global Multi-Strategy Fund I2 HUSDGlobal Multi-Strategy Fund ISEK Acc (hedged) Global Multi-Strategy Fund I2 HSEKGlobal Multi-Strategy Fund INOK Acc (hedged) Global Multi-Strategy Fund I2 HNOKGlobal Multi-Strategy Fund I£ Acc (hedged) Global Multi-Strategy Fund I2 HGBPGlobal Multi-Strategy Fund I€ Acc Global Multi-Strategy Fund I2 EURGlobal Multi-Strategy Fund H$ Acc (hedged) Global Multi-Strategy Fund H2 HUSDGlobal Multi-Strategy Fund H€ Acc Global Multi-Strategy Fund H2 EURGlobal Multi-Strategy Fund G$ Acc (hedged) Global Multi-Strategy Fund G2 HUSDGlobal Multi-Strategy Fund G£ Acc (hedged) Global Multi-Strategy Fund G2 HGBPGlobal Multi-Strategy Fund G€ Acc Global Multi-Strategy Fund G2 EURGlobal Multi-Strategy Fund F$ Acc (hedged) Global Multi-Strategy Fund F2 HUSDGlobal Multi-Strategy Fund E$ Acc (hedged) Global Multi-Strategy Fund E2 HUSDGlobal Multi-Strategy Fund ESEK Acc (hedged) Global Multi-Strategy Fund E2 HSEKGlobal Multi-Strategy Fund ENOK Acc (hedged) Global Multi-Strategy Fund E2 HNOKGlobal Multi-Strategy Fund E£ Acc (hedged) Global Multi-Strategy Fund E2 HGBPGlobal Multi-Strategy Fund E€ Acc Global Multi-Strategy Fund E2 EURGlobal Multi-Strategy Fund R$ Acc (hedged) Global Multi-Strategy Fund A2 HUSDGlobal Multi-Strategy Fund R€ Acc Global Multi-Strategy Fund A2 EURGlobal Multi-Strategy Fund Z€ Acc Global Multi-Strategy Fund Z2 EURGlobal Multi-Strategy Fund ZAU$ Acc (hedged) Global Multi-Strategy Fund Z2 HAUDGlobal Multi-Strategy Fund Z$ Acc (hedged) Global Multi-Strategy Fund Z2 HUSDGlobal Multi-Strategy Fund Z£ Acc (hedged) Global Multi-Strategy Fund Z2 HGBPGlobal Multi-Strategy Fund ZJPY Acc (hedged) Global Multi-Strategy Fund Z2 HJPY
Notes to the Financial Statements (continued)
As at 30 September 2021
1. General information (continued)
Alternate Solutions Funds (continued)
102
1. General information (continued)
Equity Funds
The Equity funds aim to achieve a long-term return, in excess of the long-term return that is typically achieved from the relevant equity
markets, through investment of each sub-fund’s assets in a diversifi ed range of transferable securities. Each Equity fund listed above will
invest at least two thirds of its net assets in equity and/or equity related transferable securities and their derivatives, such as common
stock, American Depository Receipts (ADRs), European Depositary Receipts (EDRs) and Global Depositary Receipts (GDRs), preferred
stock, warrants on equity and other rights to acquire stock. Within the remaining third each Equity fund may invest in convertible bonds and
other debt securities (with or without warrants on transferable securities attached) or hold Money Market Instruments which are regularly
negotiated and have a residual maturity which does not exceed 12 months.
Each Equity fund may use options, futures and other derivative instruments.
Alternate Solutions Funds
The Alternate Solutions funds may invest extensively in derivatives providing both long and synthetic short positions (short positions through
the use of derivatives). As a result, as well as holding assets that may rise or fall with market values, an Alternate Solutions fund may also
hold positions that may rise as the market value falls and fall as the market value rises. However, if the value of the underlying security
increases, it will have a negative eff ect on the sub-fund’s value. In a rising market, leverage can enhance returns to investors but if the
market falls, losses may be greater.
The Alternate Solutions funds may employ leverage as part of their investment strategy when using derivatives. Derivatives may contain a
leverage component and consequently any adverse changes in the value or level of the underlying asset, rate or index can result in a loss
greater than the amount invested in the derivative itself.
Each Alternate Solutions fund (except for the Global Multi-Strategy Fund) may use options, futures and swaps (excluding total return swaps)
as well as other types of derivative instruments for hedging and investment purposes. The Global Multi-Strategy Fund may use options,
futures and swaps (including total return swaps) as well as other types of derivative instruments for hedging and investment purposes.
The Investment Manager may use one or more separate counterparties to undertake derivative transactions. As with all counterparty
agreements, there is a risk to each party of a contract that the counterparty will not meet its contractual obligations. The Investment
Manager assesses the creditworthiness of counterparties as part of the risk management process.
The Alternate Solutions funds may use forward foreign exchange transactions, to hedge, as far as is reasonably practicable, the currency
exposure of the underlying assets as against the base currency of the relevant sub-fund. However, this will not eliminate a sub-fund’s
currency risk.
The Alternate Solutions funds aim to achieve positive returns through investments in equity securities, fi xed interest and their derivatives
but a substantial proportion of the assets of the sub-fund may at any time consist of cash, near cash, deposits and/or money market
instruments.
Cross sub-fund investments
As at 30 September 2021 there were no cross sub-fund investments.
2. Presentation of fi nancial statements The accompanying fi nancial statements present the fi nancial position including the assets and liabilities of the Company and each sub-fund
in accordance with Luxembourg legal and regulatory requirements relating to the preparation and presentation of the fi nancial statements. They
are prepared in the designated currency of each sub-fund as stated in the prospectus. The combined statements of the Company are prepared in
Euros.
The fi nancial statements are prepared on a going concern basis of accounting.
3. Signifi cant accounting policiesThe following is a summary of the signifi cant accounting policies followed by the Company:
Valuation of investment securities
The valuation of investments within the portfolio, listed securities and securities dealt on any stock exchange will be valued based on the
last traded price on the stock exchange at the net asset value (NAV) calculation date. The stock exchange is normally the principal market
for such assets. The value of assets dealt on any other regulated market is based on the last available price at 23:59 Luxembourg time,
except the Emerging Markets Fund which is based on the price at 09:00 Luxembourg time on the last valuation day of the accounting
year (30 September 2021) and in accordance with the rules set out in the prospectus. For the purposes of the fi nancial statements, the
investments have been valued on the relevant market or traded price as at 30 September 2021.
The exchange rates used to value the investments of each sub-fund are as the valuation point on or after the dealing cut off on the dealing
day concerned.
Notes to the Financial Statements (continued)
As at 30 September 2021
103
3. Signifi cant accounting policies (continued)
Valuation of investment securities (continued)All other assets, including restricted and not readily marketable securities, will be valued in such manner as the Directors consider
appropriate to refl ect their fair value. The Company reserves the right to utilise fair value techniques where the underlying markets are
closed for trading at the sub-fund’s valuation point and where the latest available market prices may not accurately represent the fair value
of the sub-fund’s holdings due to prevailing market conditions.
Units or shares of CIS are valued at their last determined and available NAV or, if such price is not representative of the fair market value of
such assets, then the price as determined by the Directors on a fair and equitable basis. Units or shares of a listed closed-ended CIS are
valued at their last available stock market value.
In the case of short term instruments, the value of the instrument based on the net acquisition cost, is gradually adjusted to the par value
price thereof. In the event of material changes in market conditions, the valuation basis is adjusted to the new market yields.
As a result of time variations in certain markets the prices applied to some investments do not necessarily refl ect the closing market prices
for the same calendar day as the relevant dealing day.
Any diff erence arising between the cost of securities held at the reporting date and their market value at that date is recognised in the
Statement of Operations and Statement of Net Assets.
Realised gains or losses resulting from investments are recognised in the Statement of Operations and Statement of Changes in Net Assets.
Private placement investments
A private placement is a private alternative to issuing a publicly off ered security as a means for raising capital. In a private placement the
sale of securities is made directly by the issuer to a select number of investors without public off ering through an investment bank.
Typically, when the sub-fund invests through a private placement, the sub-fund makes a commitment to invest a specifi ed amount of capital
in the investee private company in a series of tranches. The capital commitment for the initial and any future closings are triggered following
the completion of defi ned conditions or events.
The sub-fund recognises investment purchases in the fi nancial statements for tranches that completed or became binding transactions prior
to the end of the fi nancial reporting period. These are then included in the year end investment portfolio as an investment holding.
Future tranches that have not completed before the year end and are dependent on future events are unfunded commitments and not
recognised in the fi nancial statements. These future commitments are disclosed in Note 20.
Special Purpose Acquisition Companies
The sub-funds may invest in stock, warrants, and other securities of special purpose acquisition companies (SPACs) or similar entities
that pool funds to seek potential acquisition opportunities. Unless and until an acquisition is completed, a SPAC typically invests its assets
(less a portion retained to cover expenses) in U.S. Government securities, money market fund securities, and cash. If an acquisition that
meets the requirements for the SPAC is not completed within a pre-established period of time (typically two years), the invested funds are
returned to the SPAC’s shareholders. Because SPACs and similar entities are in essence blank check companies without an operating
history or ongoing business other than seeking acquisitions, the value of a SPAC’s securities is particularly dependent on the ability of the
SPAC’s management to timely identify and complete a profi table acquisition. Some SPACs may pursue acquisitions only within certain
industries or regions, which may increase the volatility of their prices. To the extent the SPAC is invested in cash or similar securities while
awaiting an acquisition opportunity, a sub-fund’s ability to meet its investment objective may be negatively impacted. In addition, some
SPACs may be traded in the over-the-counter market and may be considered illiquid and/or be subject to restrictions on resale.
Forward foreign exchange contracts
Forward foreign exchange contracts are valued at the forward rate applicable at the Statement of Net Assets date for the year until maturity.
Gains or losses resulting from forward foreign exchange contracts are recognised in the Statement of Operations and Statement of
Changes in Net Assets. Open forward foreign exchange contracts are shown in the portfolio statement at fair value.
Unrealised gains or losses resulting from forward foreign exchange contracts are recognised in the Statement of Operations and Statement
of Net Assets.
Forward foreign currency contracts on hedged share classes
Open forward currency contracts on hedged share classes are shown in the portfolio statement at fair value. The net gains/(losses) on
forward currency contracts on hedged share classes are apportioned between hedged income on forward currency contracts in the revenue
account and forward currency contracts on hedged share classes in the Statement of Operations and Statement of Changes in Net Assets,
refl ecting the income and capital elements of the hedged share classes.
Unrealised gains or losses resulting from forward foreign exchange contracts on hedged share classes are recognised in the Statement of
Net Assets.
Notes to the Financial Statements (continued)
As at 30 September 2021
104
3. Signifi cant accounting policies (continued)Financial futures contracts
Financial future contracts are valued at the exchange quoted price at the valuation point at the Statement of Net Assets date of
30 September 2021. Initial margin deposits are made in cash upon entering into fi nancial futures contracts. During the year when the
fi nancial future contract is open, changes in the value of the contract are recognised as unrealised gains and losses in the Statement of Net
Assets by marking to market on a daily basis to refl ect the market value of the contract at the end of each day’s trading. Variation margin
payments are made or received, depending upon whether unrealised losses or gains are incurred. Variation margin payments are recorded
in the futures margin account in the Statement of Net Assets. When the contract is closed, the sub-fund records a realised gain or loss in
the Statement of Operations and Statement of Changes in Net Assets equal to the diff erence between the proceeds from (or cost of) the
closing transaction and the opening transaction.
Open fi nancial future contracts are shown in the portfolio statement at fair value.
Contracts for diff erence
Changes in the value of contracts for diff erence are recognised as unrealised gains or losses in the Statement of Net Assets by ‘marking-
to-market’ the value at the balance sheet date, using prices supplied by independent pricing services that are based on the closing prices
of the underlying securities on the recognised exchanges. When a contract is closed, the diff erence between the proceeds from (or cost of)
the closing transaction and the original transaction is recorded as a realised gain or loss in the Statement of Operations and Statement of
Change in Net Assets.
Open contracts for diff erence are shown in the portfolio statement at fair value.
Options
When a sub-fund purchases an option, it pays a premium and an amount equal to that premium is recorded as an investment. When a
sub-fund sells an option, it receives a premium and an amount equal to that premium is recorded as a liability. The investment or liability is
adjusted daily to refl ect the current market value of the option. If an option expires unexercised, the sub-fund realises a gain or loss to the
extent of the premium received or paid.
Swap contracts
Each Alternate Solutions Fund may invest in swaps, with the exception of total return swaps which are only invested in by the Global Multi-
Strategy Fund. Gains or losses resulting from swap contracts are recognised in the Statement of Operations and Statement of Changes
in Net Assets. The premiums resulting from credit default swaps are recognised under Derivative income/expense in the Statement of
Operations. Swaps are over-the-counter (OTC) investments valued at fair market value, as determined in good faith pursuant to procedures
established by the Management Company and ratifi ed by the Directors.
Realised gains & losses on sale of investments
The computation of realised gains and losses on sales of investments is made on the basis of average cost.
Income
Distributions from CIS and dividends receivable from quoted equity and non equity shares are credited to revenue, when the security is
quoted ex-dividend. Dividends on unquoted stocks are credited to revenue when the dividend is announced.
Bank interest and margin interest earned on derivative positions are recognised on an accruals basis. Positive margin interest is disclosed
under the caption ‘Derivative income’ and any negative margin interest is disclosed under ‘Derivative expense’ in the Statement of
Operations.
Bond interest and interest from certifi cates of deposit are accrued on a daily basis.
Long positions held on contracts for diff erence are subject to fi nancing costs. Interest is calculated and charged on a daily basis on the contract value. Similarly if short positions are held, interest will be paid or received and recorded as ‘Interest received/paid on contracts for diff erence’ within the Statement of Operations, depending on it’s nature and may be further infl uenced by the monetary policy adopted in each jurisdiction.
Special dividends are recognised as either revenue or capital depending on the nature and circumstances of the dividends receivable.
Dividend, Real Estate Investment Trust (REIT) and interest income is disclosed net of withholding tax where applicable.
Dividend charges or credits are used to ensure that the contracts for diff erence mirror the value of the underlying stock when a dividend is announced. If a long position is held, a payment will be received on the ex-dividend date and is refl ected within ‘Derivative income’ in the Statement of Operations. If a short position is held, a charge is deducted on ex-dividend date and is refl ected within ‘Derivative expenses’ in the Statement of Operations.
Where the sub-fund invests into a CIS, management fee rebates may be received from Investment Managers and are recognised when the entitlement arises, as either income or capital in accordance with the treatment of the management fee charged on the underlying CIS. Capital management fee rebates are refl ected in the Statement of Operations under ‘Net realised gain on investment securities’ and income management fee rebates under ‘Other income’.
Notes to the Financial Statements (continued)
As at 30 September 2021
105
3. Signifi cant accounting policies (continued)Income (continued)Revenue derived from the realised and unrealised gains/losses on hedged class forward currency contracts is allocated to both the capital and revenue of the share class based upon the prior day capital/revenue split.
Securities lending
The Company has entered into a securities lending programme with JPMorgan Bank Luxembourg S.A. acting as the Securities LendingAgent, replacing BNP Paribas Securities Services UK Limited (BP2S UK) on 16 April 2021, for the purposes of effi cient portfolio management and in order to generate additional revenue.
The Securities Lending Agent shall ensure that suffi cient value and quality of collateral is received before or simultaneously with the movement of loaned collateral. This will then be held throughout the duration of the loan transaction and only returned once the lent asset has been received or returned back to the relevant sub-fund. The Securities Lending Agent will also monitor and maintain all operational aspects of the assets while they are on loan.
Securities lending revenue is accounted for in the Statement of Operations within ‘Other income’.
Designated currencies
As permitted by Luxembourg Law, the accounts and records of the Company are maintained in Euros, with the exception of the Emerging Markets Fund, the Global Equity Fund, the Global Equity Market Neutral Fund and the Latin American Fund which are kept in US Dollars and the Absolute Return Fund which is kept in Sterling.
Transactions carried out in any other currency other than Euros, which is the designated currency of the Company, are translated at the exchange rates ruling at the transaction date. Assets and liabilities are translated at the exchange rates ruling at the Statement of Net Assets date.
When the designated currency of a sub-fund is not Euros, the diff erence between the opening net assets converted at exchange rates ruling at the beginning of the year, and closing net assets converted at exchange rates ruling at the end of the fi nancial accounting year are disclosed in the combined statement of change in net assets as ‘exchange rate eff ect on opening net assets’.
Hedged share classes
Any gains or losses that are incurred as a result of the hedging transactions will accrue to the relevant share class only.
The value of the share class to be hedged will be made up of both capital and income elements and the Investment Manager intends to hedge between 95-105% of the value of each hedged share class. Adjustments to any hedge to keep within this target range will only be made when the required adjustment is material. As such the hedged class shares will not be completely protected from all currency fl uctuations.
4. Swing pricing adjustmentThe Company operates a swing pricing policy, the threshold of which is determined by the Directors.
The Directors have implemented a swing pricing policy to protect existing shareholders from the dilution eff ects they may suff er as a result of dealing activity by other Investors in a particular sub-fund. The swing pricing policy gives the Directors the power to apply a swing price adjustment to the NAV per share to cover dealing costs and to preserve the value of the underlying assets of a particular sub-fund.
The sub-funds in scope operate a partial swing pricing mechanism, where the NAV per share will only swing when a predetermined threshold (the swing threshold) is exceeded at each dealing day. The swing threshold level is approved by the Directors at their discretion to ensure that those fl ows that would represent a signifi cant amount of dilution in a particular sub-fund are captured. The Directors may decide to adjust the swing pricing mechanism in exceptional circumstances to protect the interests of remaining shareholders.
If the net dealing on any Dealing Day is greater than the swing threshold, the NAV per share will be adjusted up or down dependent on
aggregate net transactions on any given Dealing Day. It will increase the NAV per share when there are net infl ows into the sub-fund and
decrease the NAV per share when there are net outfl ows from the sub-fund. The same swing price adjustment will be applied to all share
classes within the relevant sub-fund, therefore all transacting investors in the relevant sub-fund, whether subscribing or redeeming, will be
aff ected by the swing price adjustment. It is not possible to accurately predict whether a swing price adjustment will occur at any future
point in time and consequently how frequently it will need to be made.
The Directors may also make a discretionary dilution adjustment if the threshold is not met if, in their opinion, it is in the interest of existing
shareholders to do so.
During the year under review, swing pricing mechanism has been applied for all sub-funds.
On 30 September 2021, the last working day of the year under review Global Multi-Strategy Fund adjusted the NAV per share, as per
the swing pricing policy. The net assets as at 30 September 2021, as disclosed in the statement of net assets, exclude the swing price
adjustment. The NAV per share as at 30 September 2021 as disclosed in the NAV summary, includes the swing price adjustment.
Notes to the Financial Statements (continued)
As at 30 September 2021
106
5. Exchange ratesThe exchange rates used for the conversion into Euros of assets and liabilities of each sub-fund denominated in other currencies and with
respect to sub-funds whose investments are valued at 09:00 Luxembourg time as detailed in Note 3 to the fi nancial statements as at
30 September 2021 are as follows:
EUR 1=ARS 114.433217 EUR 1=IDR 16619.59684 EUR 1=PLN 4.619485
EUR 1=AUD 1.611377 EUR 1=ILS 3.729245 EUR 1=QAR 4.225256
EUR 1=BRL 6.282313 EUR 1=INR 86.162591 EUR 1=SAR 4.351792
EUR 1=CAD 1.47656 EUR 1=JPY 129.949368 EUR 1=SEK 10.204856
EUR 1=CHF 1.083797 EUR 1=KES 128.15099 EUR 1=SGD 1.579635
EUR 1=CLP 939.812438 EUR 1=KRW 1373.750679 EUR 1=THB 39.373528
EUR 1=CNH 7.507353 EUR 1=MXN 23.749989 EUR 1=TRY 10.308319
EUR 1=COP 4450.766378 EUR 1=MYR 4.859749 EUR 1=TWD 32.325484
EUR 1=CZK 25.51076 EUR 1=NGN 480.058567 EUR 1=USD 1.160262
EUR 1=DKK 7.43615 EUR 1=NOK 10.177858 EUR 1=VND 26407.57019
EUR 1=GBP 0.862552 EUR 1=NZD 1.686074 EUR 1=ZAR 17.521413
EUR 1=HKD 9.035537 EUR 1=PEN 4.793677
EUR 1=HUF 359.958899 EUR 1=PHP 59.124078
With respect to sub-funds which are valued at 23:59 Luxembourg time as detailed in Note 3 to the fi nancial statements the rates of
exchange as at 30 September 2021 are as follows:
EUR 1=ARS 114.438137 EUR 1=IDR 16587.09872 EUR 1=PLN 4.602432
EUR 1=AUD 1.604366 EUR 1=ILS 3.73888 EUR 1=QAR 4.219648
EUR 1=BRL 6.314882 EUR 1=INR 86.024023 EUR 1=SAR 4.34677
EUR 1=CAD 1.468177 EUR 1=JPY 129.306932 EUR 1=SEK 10.138897
EUR 1=CHF 1.081095 EUR 1=KES 128.061111 EUR 1=SGD 1.573381
EUR 1=CLP 941.278095 EUR 1=KRW 1372.166101 EUR 1=THB 39.212214
EUR 1=CNH 7.479694 EUR 1=MXN 23.809489 EUR 1=TRY 10.296145
EUR 1=COP 4417.737247 EUR 1=MYR 4.85182 EUR 1=TWD 32.288195
EUR 1=CZK 25.34243 EUR 1=NGN 479.504835 EUR 1=USD 1.158924
EUR 1=DKK 7.435816 EUR 1=NOK 10.116507 EUR 1=VND 26377.10989
EUR 1=GBP 0.859513 EUR 1=NZD 1.67996 EUR 1=ZAR 17.436031
EUR 1=HKD 9.021789 EUR 1=PEN 4.791697
EUR 1=HUF 359.206971 EUR 1=PHP 59.116722
6. Fees and operational expensesAllocation of charges and expenses
Each share class of each sub-fund is charged with all costs and expenses attributable to it. Costs and expenses not attributable to a
particular class or sub-fund are allocated between all of the classes of shares pro rata to their respective NAVs.
In the case of amortised costs allocated pro rata, the Directors reserve the right to recalculate such allocation over the course of the
amortisation period if they believe that such is fair and equitable in the light of the changes in sub-funds’ respective NAVs.
Annual Management ChargeThe Annual Management Charge (AMC), is payable out of the assets of the sub-fund in respect of all share classes and will cover annual servicing and management fees for such share classes. The AMC shall be payable in arrears at the end of each calendar month, calculated and accrued at each valuation point at the appropriate rate for the share class concerned. This fee shall be equal to a percentage of the average NAV per share of the share class concerned.
Notes to the Financial Statements (continued)
As at 30 September 2021
107
6. Fees and operational expenses (continued)
Annual Management Charge (continued)For the year ended 30 September 2021 the maximum management fees that can be charged as a percentage per annum on the total netassets of the relevant sub-funds were as follows:
Type of Fund
Class
A1 EUR,
A2 EUR,
A2 GBP,
A2 USD,
A2 HCHF,
A2 HEUR,
A2 HSGD,
A2 HUSD,
X2 EUR,
X2 USD
Class
I2 EUR,
I2 SGD,
I2 USD,
I2 HEUR,
I2 HSGD,
I2 HUSD
Class
H1 EUR,
H2 EUR,
H2 GBP,
H2 USD,
H2 HCHF,
H2 HUSD
Class
F2 USD,
F2 HUSD
Class
G1 EUR,
G1 HEUR,
G1 HGBP,
G2 EUR,
G2 GBP,
G2 USD,
G2 HUSD
Equity Funds
Continental European Fund 1.50% 1.00% 0.75% Up to 2.0% 0.65%
Emerging Markets Fund 1.50% 1.00% 0.75%
Global Equity Fund 1.50% 1.00% 0.75% Up to 2.0%
Latin American Fund 1.50% 1.00% 0.75% Up to 2.0%
Pan European Fund 1.50% 1.00% 0.75% 0.65%
Pan European Smaller Companies Fund 1.50% 1.00% 0.75%
Class
A2 EUR,
A2 GBP,
A2 USD,
A2 HCHF,
A2 HEUR,
A2 HUSD,
X2 USD,
X2 HUSD
Class
H1 GBP,
H2 EUR,
H2 GBP,
H2 USD,
H2 HCHF,
H2 HEUR,
H2 HUSD
Class
I1 GBP,
I2 EUR,
I2 GBP,
I2 USD,
I2 HCHF,
I2 HEUR,
I2 HGBP,
I2 HJPY,
I2 HNOK,
I2 HSEK,
I2 HSGD,
I2 HUSD
Class
G1 GBP,
G1 HEUR,
G2 EUR,
G2 GBP,
G2 HEUR,
G2 HGBP,
G2 HUSD
Class
F2 USD,
F2 HUSD
Class
E1 HEUR,
E2 EUR,
E2 USD,
E2 HEUR,
E2 HGBP,
E2 HNOK,
E2 HSEK,
E2 HUSD
Class
P2 EUR,
P2 USD,
P2 HEUR,
P2 HUSD
Alternate Solutions Funds
Absolute Return Fund 1.50% 0.90% 1.00% 0.75% Up to 2.0%
Global Equity Market Neutral Fund 1.50% 0.75% 0.75% 0.65% Up to 2.0% Up to 0.65% 1.40%
Global Multi-Strategy Fund 1.50% 1.00% 1.00% 0.65% Up to 2.0% Up to 0.65% Up to 2.0%
The AMC for Class Z shares is agreed between the investor and the Company and is not payable out of the assets of the fund.
Performance feesThe Investment Manager is also entitled to performance fees on the Alternate Solutions Funds as detailed within the prospectus.
At 30 September 2021 the amount charged for performance fees was: Absolute Return Fund GBP 22,328,670, Global Equity Market
Neutral Fund USD 4,263 and Global Multi-Strategy Fund EUR 303,662.
Administration, Registrar and Transfer Agent fees
BNP Paribas Securities Services, Luxembourg Branch has been appointed by the Management Company as Administrator under a fund
administration agreement (the ‘Fund Administration Service Agreement’).
The Administrator will receive fees calculated on the basis of the net assets of the Company. Such fees will be payable monthly in arrears
out of the assets of the Company.
Notes to the Financial Statements (continued)
As at 30 September 2021
108
6. Fees and operational expenses (continued)
Administration, Registrar and Transfer Agent fees (continued)International Financial Data Services (Luxembourg) S.A., was appointed by the Management Company as Registrar and Transfer Agent
under a registrar and transfer agent agreement (the ‘Registrar and Transfer Agent Agreement’). The Registrar Agent is responsible for
processing the issue, redemption and transfer of shares as well as the keeping of the register of shareholders.
The Registrar and Transfer Agent will receive fees in respect of services provided and reasonable out of pocket expenses. Such fees will be
payable monthly in arrears out of the assets of the Company.
Depositary and Custody fees
BNP Paribas Securities Services, Luxembourg Branch has been appointed as Depositary for the Company in order to comply with the
UCITS V Directive.
The Depositary is entitled to receive out of the assets of each sub-fund, fees in consideration for providing services to it, along with such out-
of-pocket expenses and disbursements as are deemed reasonable and customary by the Directors. The Company will pay to the Depositary a
fee for fi duciary services, which is set at a rate of 0.006% per annum of the total net assets of the relevant sub-fund (subject to a minimum fee
of GBP 1,200 (EUR 1,400) per sub-fund).
BNP Paribas Securities Services, Luxembourg Branch has been appointed by the Company under an agreement (the ‘Custodian
Agreement’) to assure the safe custody of the Company’s assets.
The Depositary is also entitled to receive out of the assets of each sub-fund, custody fees comprising asset-based fees and transaction-
based fees that vary depending on the market in which a particular sub-fund invests; these fees will not exceed GBP 120 (EUR 180) per
transaction respectively.
Both the Depositary fee and Custodian fee are accrued daily and paid monthly in arrears.
Directors’ fees
Those Directors who are not employees of Janus Henderson Group plc and its affi liates may each receive an annual fee out of the assets of
each fund, which shall be approved by the shareholders.
Other expenses
The Company will also pay, as far is as allowable under applicable regulations, all other operating expenses which include, without limitation,
taxes, expenses for legal and auditing services, printing shareholders’ reports, prospectuses, all reasonable out-of-pocket expenses incurred
by the Directors, registration fees and other expenses payable to supervisory authorities and local, regulatory and tax representatives
appointed in various jurisdictions, insurance, interest costs, brokerage fees and costs. The Company will also pay fees or other charges
levied in respect of the provision and use of benchmarks, dividend and redemption payment costs and the costs of publication of the NAV
or other sub-fund information, including, but not limited to, that required to be published by any regulatory authority.
Collective Investment Schemes
Where a sub-fund may invest all or substantially all of its assets in CIS, there may be additional costs of investing in the underlying
sub-funds (underlying sub-funds’ TERs) which could increase the TER and the Ongoing Charges of the sub-fund. Accordingly,
the sub-funds TER will include a synthetic element refl ecting these underlying sub-funds’ TERs.
When investing into other collective investment funds managed by a Janus Henderson group company, there will be no double charging of
management fees.
Annual expenses
The Management Company has undertaken to limit the annual expenses (other than the AMC, performance fee, dilution levy if applicable,
the service fee in respect of the X share class, the expenses related to the purchase and sale of investments and the cost of hedging)
borne by each share class of the Company to a maximum of 0.50% of the average NAV per share of such share class. Any other expenses
of the Company in excess of the maximum will be borne by the Investment Manager, and will be settled following the accounting period end
of the Company.
There were no expenses that exceeded the maximum of 0.50% for the year ended 30 September 2021.
Notes to the Financial Statements (continued)
As at 30 September 2021
109
6. Fees and operational expenses (continued)
Share class service fee
In relation to the X share class, the Sub-Distributors appointed by the Principal Distributor shall be entitled to receive a service fee paid
by the Company as compensation for services provided and expenses incurred by the Sub-Distributors in promoting the sale of Class X
shares for the Company, including assistance to the investors in handling orders for subscriptions, redemptions and conversions of shares,
providing and interpreting current information about the Company, and other information or assistance as may be requested. The service
fee which the Sub-Distributors are entitled to receive will be 0.50% per annum of the NAV per share of the X share class.
In respect of A, F, H and S share classes, no service fee will be applicable.
No redemption charge will be applicable to subscribers in classes A, F, H, S and X.
Initial sales charge
As Principal Distributor, Henderson Global Investors Limited is entitled to receive in respect of Classes A, F, H, S and X of the Equity Funds
and Classes A, E, F, G, H, I, P and X of the Alternate Solutions Funds, the initial sales charge paid by the investor, as specifi ed for the share
class. The initial sales charge shall be expressed as a percentage of the NAV per share and shall in no case exceed the maximum permitted
by the laws and regulations of any country where the shares are authorised for public sale. The Principal Distributor may in conjunction with
each Sub-Distributor agree the proportion of the initial sales charge to be retained by the Sub-Distributor.
Type of fund Maximum Initial Charge
Equity funds
Share classes A1 EUR, A2 EUR, A2 GBP, A2 HCHF, A2 HEUR, A2 HSGD, A2 HUSD, A2 USD, F2 HUSD,
F2 USD, H1 EUR, H2 EUR, H2 GBP, H2 HCHF, H2 HUSD, H2 USD, X2 EUR, X2 USD 5%
Alternate Solutions funds
Share classes A2 EUR, A2 GBP, A2 HCHF, A2 HEUR, A2 HUSD, A2 USD, E1 HEUR, E2 EUR, E2 HEUR,
E2 HGBP, E2 HNOK, E2 HSEK, E2 HUSD, E2 USD, F2 HUSD, F2 USD, G1 GBP, G1 HEUR, G2 EUR,
G2 GBP, G2 HEUR, G2 HGBP, G2 HUSD, H1 GBP, H2 EUR, H2 GBP, H2 HCHF, H2 HEUR, H2 HUSD,
H2 USD, I1 GBP, I2 EUR, I2 GBP, I2 HCHF, I2 HEUR, I2 HGBP, I2 HJPY, I2 HNOK, I2 HSEK, I2 HSGD,
I2 HUSD, I2 USD, P2 EUR, P2 HEUR, P2 HUSD, P2 USD, X2 HUSD, X2 USD 5%
Formation costs
There were no formation expenses charged in the year.
7. TaxationUnder Luxembourg tax law, there are no Luxembourg income, withholding or capital gains taxes payable by the Company. The Company
will, however, be subject to the tax on Luxembourg undertakings for collective investment (Taxe d’abonnement).
Share classes A, F, H, S and X of the Company which are off ered in the sub-funds will be subject to the Taxe d’abonnement at the rate of
0.05% per annum of the value of the total net assets of such share class on the last day of each calendar quarter, whereas share classes E,
G, I, P and Z of the Company in the sub-funds (reserved to Institutional Investors within the meaning of the 2010 Law) will be subject to the
Taxe d’abonnement at the rate of 0.01% per annum of the value of the total net assets of such share class on the last day of each calendar
quarter.
No stamp duty or other tax is payable in Luxembourg on the issue of shares.
Capital gains, dividends and interest on securities issued in other countries may be subject to withholding and capital gains taxes imposed
by such countries.
India operates a taxation regime for the short-term and long-term capital gains. As a result of this, the Emerging Markets Fund and the
Global Equity Fund recorded an accrual for Indian capital gains tax payable on Indian securities.
8. Share class detailsShares of each class in the Company have no par value, are freely transferable and, within each share class, are entitled to participate
equally in the profi ts arising in respect of, and in the proceeds of a liquidation of the sub-fund to which they are attributable. All classes of
shares are issued in registered form.
The number and type of classes of shares available in each sub-fund are detailed in the prospectus. The diff erences between share classes
relate to the minimum investment, currency of denomination, dividend policy, the type of investor who is eligible to invest, the hedging
strategy and the charging structure applicable to each of them.
Notes to the Financial Statements (continued)
As at 30 September 2021
110
8. Share class details (continued)Hedged share classes
The sub-funds may off er hedged share classes in order to mitigate the currency risk between the base currency of the sub-fund and the
currency of the hedged share class. Where a hedged share class is available it will be expressed with the pre-fi x ‘H’ immediately before
the currency denomination and described for instance as Class A2 HEUR, Class A2 HGBP, Class A2 HUSD, Class A2 HAUD, Class A2
HSEK, Class A2 HCHF etc. The Company’s Investment Manager will employ fi nancial instruments, such as foreign exchange forward
contracts, as a hedge.
The other characteristics of the hedged share class (e.g. dividend policy, minimum investment, management fee etc) remain the same as
those above but their cost is higher due to the cost of the currency hedging.
An up-to-date list of the share classes available for the sub-funds is available at the registered offi ce of the Company.
9. Net asset valueThe NAV per share of each sub-fund will be expressed in the base currency of the sub-fund, calculated by the administrator on each
business day in Luxembourg at each valuation point and on other days as approved by the board.
The NAV for each share of each sub-fund is calculated by determining the value of the assets of the relevant sub-fund applicable to that
class, including accrued income, and deducting all liabilities (including all fees and charges) of that class, and dividing the resultant sum
by the total number of shares of that class in the relevant sub-fund in issue or allotted at that time, (the resulting amount being rounded
to the nearest two decimal places) to give the NAV per share class of the sub-fund. The NAV per share of each share class within each
sub-fund may, at the discretion of the Directors, be rounded up or down to the nearest ten-thousandth of a EUR, USD, GBP, SGD, NOK,
SEK, AUD or CHF in the case of each share class denominated in EUR, USD, GBP, SGD, NOK, SEK, AUD or CHF respectively and may
be rounded up or down to the nearest hundredth of a YEN in the case of each share class denominated in YEN. Any other currency share
class that becomes available will be rounded up or down using similar principles as the above mentioned currencies (at the discretion of the
Directors).
Further details on rules that apply in valuing the total assets can be found in the current prospectus.
If the Company had calculated the NAV’s solely with a view to publication, the market prices used to value investments would have been
the closing prices on 30 September 2021. However, using these prices would not have caused the NAVs to signifi cantly diff er from those
shown in the fi nancial statements. The diff erence in NAV was lower than 0.50% for all funds within the umbrella.
10. EqualisationThe Company will maintain equalisation accounts in relation to the shares with a view to ensuring that the levels of distribution payable
to investors in the shares are not aff ected by the issue and redemption of, or the switch from or into, shares of those funds during an
accounting period. The price at which shares are bought by an investor will therefore be deemed to include an equalisation payment (which
will be credited to the relevant equalisation account) calculated by reference to the net income attributed to the share class, net of fees,
charges and expenses where applicable. The fi rst distribution which an investor receives in respect of such shares following the purchase
may include a repayment of capital.
11. Dividend distributions
Sub-fund Share class Accounting
date
Pay date Rate per
share in class
currency
Shares Ccy Amount
paid in class
currency
Continental European Fund
Dividend paid A1 EUR 30/09/2021 11/11/2021 0.088389 1,033,506.37 EUR 91,351
G1 EUR 30/09/2021 11/11/2021 0.250641 7,841,912.46 EUR 1,965,505
G1 HGBP 30/09/2021 11/11/2021 0.217114 31,378.90 GBP 6,813
H1 EUR 30/09/2021 11/11/2021 0.228170 494,026.22 EUR 112,722
Dividend reinvested A2 EUR 30/09/2021 11/11/2021 0.107377 99,893,394.33 EUR 10,726,253
A2 HUSD 30/09/2021 11/11/2021 0.138966 1,109,149.19 USD 154,134
A2 USD 30/09/2021 11/11/2021 0.173497 708,810.54 USD 122,977
F2 HUSD 30/09/2021 11/11/2021 0.346543 6,827.38 USD 2,366
F2 USD 30/09/2021 11/11/2021 0.344145 476,101.61 USD 163,848
G2 EUR 30/09/2021 11/11/2021 0.284073 6,578,974.40 EUR 1,868,909
G2 GBP 30/09/2021 11/11/2021 0.229132 301,812.68 GBP 69,155
G2 HUSD 30/09/2021 11/11/2021 0.313103 14,278.31 USD 4,471
G2 USD 30/09/2021 11/11/2021 0.264178 1,961,866.60 USD 518,282
H2 EUR 30/09/2021 11/11/2021 0.272617 1,015,362.76 EUR 276,805
Notes to the Financial Statements (continued)
As at 30 September 2021
111
Sub-fund Share class Accounting
date
Pay date Rate per
share in class
currency
Shares Ccy Amount
paid in class
currency
Continental European Fund (continued)
H2 GBP 30/09/2021 11/11/2021 0.201368 286,166.60 GBP 57,625
H2 HUSD 30/09/2021 11/11/2021 0.231304 35,396.93 USD 8,187
H2 USD 30/09/2021 11/11/2021 0.232620 337,747.63 USD 78,567
I2 EUR 30/09/2021 11/11/2021 0.191183 17,872,489.22 EUR 3,416,916
I2 HUSD 30/09/2021 11/11/2021 0.240403 378,839.20 USD 91,074
X2 EUR 30/09/2021 11/11/2021 0.035991 63,147.92 EUR 2,273
Emerging Markets Fund
Dividend reinvested A2 EUR 30/09/2021 11/11/2021 0.091840 2,116,722.52 EUR 194,400
A2 USD 30/09/2021 11/11/2021 0.124565 634,382.73 USD 79,022
H2 EUR 30/09/2021 11/11/2021 0.179459 13,433.29 EUR 2,411
H2 GBP 30/09/2021 11/11/2021 0.186012 700.00 GBP 130
H2 USD 30/09/2021 11/11/2021 0.194933 10,000.04 USD 1,949
I2 EUR 30/09/2021 11/11/2021 0.201945 232,220.75 EUR 46,896
I2 USD 30/09/2021 11/11/2021 0.152073 257.05 USD 39
Latin American Fund
Dividend reinvested A2 EUR 30/09/2021 11/11/2021 0.329134 1,016,597.68 EUR 334,597
A2 USD 30/09/2021 11/11/2021 0.266050 773,244.83 USD 205,722
F2 USD 30/09/2021 11/11/2021 0.296454 249.28 USD 74
H2 EUR 30/09/2021 11/11/2021 0.136432 21,026.88 EUR 2,869
H2 USD 30/09/2021 11/11/2021 0.273670 2,843.79 USD 778
I2 EUR 30/09/2021 11/11/2021 0.454055 15,026.32 EUR 6,823
X2 EUR 30/09/2021 11/11/2021 0.229217 52,447.41 EUR 12,022
Pan European Fund
Dividend reinvested A2 EUR 30/09/2021 11/11/2021 0.068393 8,660,946.69 EUR 592,348
A2 HCHF 30/09/2021 11/11/2021 0.053836 99,918.87 CHF 5,379
A2 HSGD 30/09/2021 11/11/2021 0.114417 157,826.34 SGD 18,058
A2 HUSD 30/09/2021 11/11/2021 0.064818 626,336.03 USD 40,598
G2 EUR 30/09/2021 11/11/2021 0.113967 75,097,934.48 EUR 8,558,686
H2 EUR 30/09/2021 11/11/2021 0.108408 3,415,346.55 EUR 370,251
H2 HCHF 30/09/2021 11/11/2021 0.105501 997,409.89 CHF 105,228
H2 HUSD 30/09/2021 11/11/2021 0.121434 1,305,842.46 USD 158,574
I2 EUR 30/09/2021 11/11/2021 0.190860 12,630,954.07 EUR 2,410,744
I2 HSGD 30/09/2021 11/11/2021 0.231827 22,865,904.35 SGD 5,300,934
I2 HUSD 30/09/2021 11/11/2021 0.138645 569,093.31 USD 78,902
I2 SGD 30/09/2021 11/11/2021 0.198057 250.00 SGD 50
X2 EUR 30/09/2021 11/11/2021 0.022825 6,763.24 EUR 154
Pan European Smaller Companies Fund
Dividend paid A1 EUR 30/09/2021 11/11/2021 0.018057 138,004.14 EUR 2,492
Dividend reinvested A2 EUR 30/09/2021 11/11/2021 0.020281 2,816,418.16 EUR 57,120
A2 HUSD 30/09/2021 11/11/2021 0.015011 276,663.80 USD 4,153
H2 EUR 30/09/2021 11/11/2021 0.089627 530,187.93 EUR 47,519
H2 HUSD 30/09/2021 11/11/2021 0.125766 250.00 USD 31
I2 EUR 30/09/2021 11/11/2021 0.088881 1,622,466.52 EUR 144,206
Notes to the Financial Statements (continued)
As at 30 September 2021
11. Dividend distributions (continued)
112
Sub-fund Share class Accounting
date
Pay date Rate per
share in class
currency
Shares Ccy Amount
paid in class
currency
Global Multi-Strategy Fund
Dividend reinvested Z2 EUR 30/09/2021 11/11/2021 0.012132 674,383.54 EUR 8,182
Z2 HAUD 30/09/2021 11/11/2021 0.011247 35,272,227.02 AUD 396,707
Z2 HGBP 30/09/2021 11/11/2021 0.015712 250.00 GBP 4
Z2 HJPY 30/09/2021 11/11/2021 1.233155 720,717.45 JPY 888,756
Z2 HUSD 30/09/2021 11/11/2021 0.012458 2,950,689.86 USD 36,760
12. Cash, cash equivalents and bank overdraftsCash, cash equivalents and bank overdrafts as at 30 September 2021 comprised:
Sub-fund Amount in
Sub-fund Currency
Sub-fund Amount in
Sub-fund Currency
Continental European Fund EUR Pan European Smaller Companies Fund EUR
Cash at bank 27,248,420 Cash at bank 340,005
27,248,420 340,005
Emerging Markets Fund USD Absolute Return Fund GBP
Cash at bank 3,409,882 Cash at bank 242,013,937
Bank overdraft (8,205) Bank overdraft (27,734)
3,401,677 Margin accounts 25,664,790
Term deposits 95,344,902
Global Equity Fund USD 362,995,895
Cash at bank 19,050,528
Bank overdraft (9,534) Global Equity Market Neutral Fund USD
19,040,994 Cash at bank 23,351,731
Bank overdraft (5,098)
Latin American Fund USD Margin accounts 558,900
Cash at bank 952,857 Collateral 15,680,000
Bank overdraft (491) 39,585,533
952,366
Global Multi-Strategy Fund EUR
Pan European Fund EUR Cash at bank 21,168,294
Cash at bank 4,887,394 Margin accounts 80,553,567
4,887,394 Collateral 11,000,000
112,721,861
13. Securities lending activitiesThe Company has entered into securities lending agreements for a number of equity and bond funds. In return for making securities
available for loan throughout the year, the funds that have participated in the program received revenue which is refl ected in the Financial
Statements of each participating sub-fund under the ‘Other income’ caption. The Company has appointed JPMorgan Bank Luxembourg S.A.,
as agent for the securities lending program, replacing BNP Paribas Securities Services UK Limited (BP2S UK) on 16 April 2021. As
remuneration for this agency role, JPMorgan Bank Luxembourg S.A. receives a maximum of 8% of the variable fees from the associated
program. All securities are fully collateralised.
As at 30 September 2021, the market value of the securities lent is as follows:
Sub-fund Counterparty Ccy Total market
value of
securities on
loan
Amount of
collateral
received
Type of collateral
Continental European Fund
UBS EUR - 483,7311 Government Bond
Total - 483,731
Notes to the Financial Statements (continued)
As at 30 September 2021
11. Dividend distributions (continued)
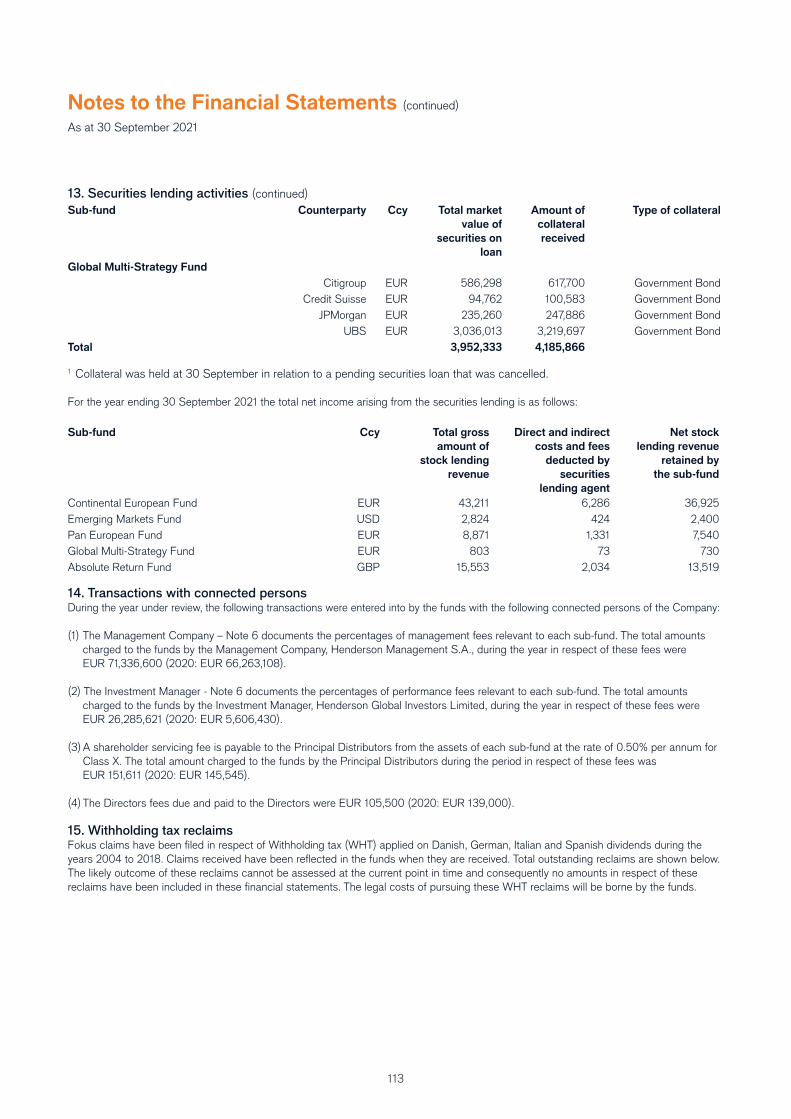
113
Sub-fund Counterparty Ccy Total market
value of
securities on
loan
Amount of
collateral
received
Type of collateral
Global Multi-Strategy Fund
Citigroup EUR 586,298 617,700 Government Bond
Credit Suisse EUR 94,762 100,583 Government Bond
JPMorgan EUR 235,260 247,886 Government Bond
UBS EUR 3,036,013 3,219,697 Government Bond
Total 3,952,333 4,185,866
1 Collateral was held at 30 September in relation to a pending securities loan that was cancelled.
For the year ending 30 September 2021 the total net income arising from the securities lending is as follows:
Sub-fund Ccy Total gross
amount of
stock lending
revenue
Direct and indirect
costs and fees
deducted by
securities
lending agent
Net stock
lending revenue
retained by
the sub-fund
Continental European Fund EUR 43,211 6,286 36,925
Emerging Markets Fund USD 2,824 424 2,400
Pan European Fund EUR 8,871 1,331 7,540
Global Multi-Strategy Fund EUR 803 73 730
Absolute Return Fund GBP 15,553 2,034 13,519
14. Transactions with connected personsDuring the year under review, the following transactions were entered into by the funds with the following connected persons of the Company:
(1) The Management Company – Note 6 documents the percentages of management fees relevant to each sub-fund. The total amounts
charged to the funds by the Management Company, Henderson Management S.A., during the year in respect of these fees were
EUR 71,336,600 (2020: EUR 66,263,108).
(2) The Investment Manager - Note 6 documents the percentages of performance fees relevant to each sub-fund. The total amounts
charged to the funds by the Investment Manager, Henderson Global Investors Limited, during the year in respect of these fees were
EUR 26,285,621 (2020: EUR 5,606,430).
(3) A shareholder servicing fee is payable to the Principal Distributors from the assets of each sub-fund at the rate of 0.50% per annum for
Class X. The total amount charged to the funds by the Principal Distributors during the period in respect of these fees was
EUR 151,611 (2020: EUR 145,545).
(4) The Directors fees due and paid to the Directors were EUR 105,500 (2020: EUR 139,000).
15. Withholding tax reclaimsFokus claims have been fi led in respect of Withholding tax (WHT) applied on Danish, German, Italian and Spanish dividends during the
years 2004 to 2018. Claims received have been refl ected in the funds when they are received. Total outstanding reclaims are shown below.
The likely outcome of these reclaims cannot be assessed at the current point in time and consequently no amounts in respect of these
reclaims have been included in these fi nancial statements. The legal costs of pursuing these WHT reclaims will be borne by the funds.
Notes to the Financial Statements (continued)
As at 30 September 2021
13. Securities lending activities (continued)
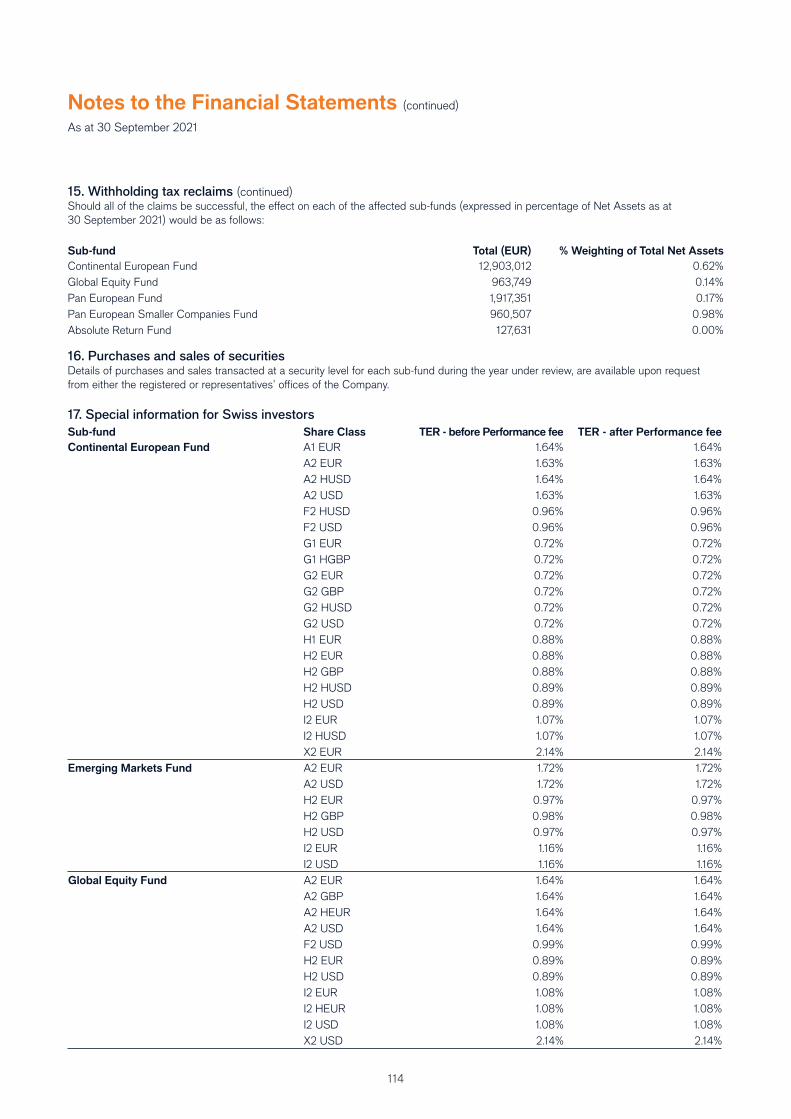
114
15. Withholding tax reclaims (continued)Should all of the claims be successful, the eff ect on each of the aff ected sub-funds (expressed in percentage of Net Assets as at
30 September 2021) would be as follows:
Sub-fund Total (EUR) % Weighting of Total Net Assets
Continental European Fund 12,903,012 0.62%
Global Equity Fund 963,749 0.14%
Pan European Fund 1,917,351 0.17%
Pan European Smaller Companies Fund 960,507 0.98%
Absolute Return Fund 127,631 0.00%
16. Purchases and sales of securitiesDetails of purchases and sales transacted at a security level for each sub-fund during the year under review, are available upon request
from either the registered or representatives’ offi ces of the Company.
17. Special information for Swiss investors
Sub-fund Share Class TER - before Performance fee TER - after Performance fee
Continental European Fund A1 EUR 1.64% 1.64%
A2 EUR 1.63% 1.63%
A2 HUSD 1.64% 1.64%
A2 USD 1.63% 1.63%
F2 HUSD 0.96% 0.96%
F2 USD 0.96% 0.96%
G1 EUR 0.72% 0.72%
G1 HGBP 0.72% 0.72%
G2 EUR 0.72% 0.72%
G2 GBP 0.72% 0.72%
G2 HUSD 0.72% 0.72%
G2 USD 0.72% 0.72%
H1 EUR 0.88% 0.88%
H2 EUR 0.88% 0.88%
H2 GBP 0.88% 0.88%
H2 HUSD 0.89% 0.89%
H2 USD 0.89% 0.89%
I2 EUR 1.07% 1.07%
I2 HUSD 1.07% 1.07%
X2 EUR 2.14% 2.14%
Emerging Markets Fund A2 EUR 1.72% 1.72%
A2 USD 1.72% 1.72%
H2 EUR 0.97% 0.97%
H2 GBP 0.98% 0.98%
H2 USD 0.97% 0.97%
I2 EUR 1.16% 1.16%
I2 USD 1.16% 1.16%
Global Equity Fund A2 EUR 1.64% 1.64%
A2 GBP 1.64% 1.64%
A2 HEUR 1.64% 1.64%
A2 USD 1.64% 1.64%
F2 USD 0.99% 0.99%
H2 EUR 0.89% 0.89%
H2 USD 0.89% 0.89%
I2 EUR 1.08% 1.08%
I2 HEUR 1.08% 1.08%
I2 USD 1.08% 1.08%
X2 USD 2.14% 2.14%
Notes to the Financial Statements (continued)
As at 30 September 2021
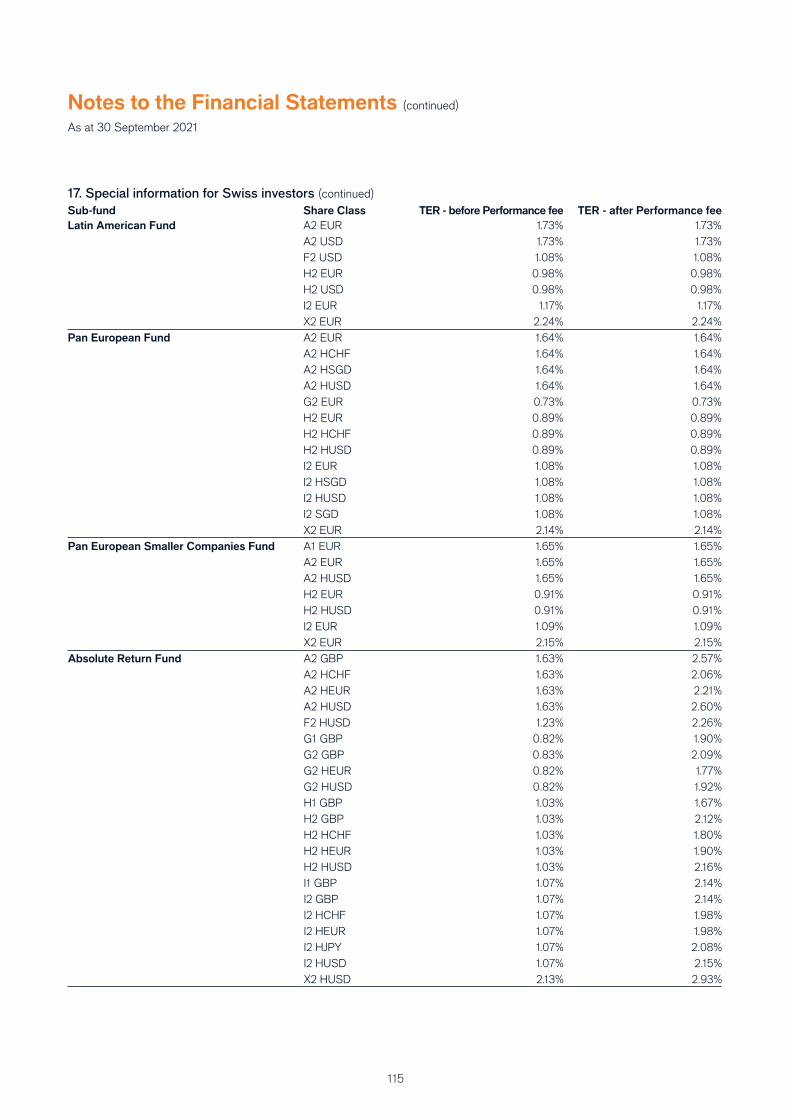
115
Sub-fund Share Class TER - before Performance fee TER - after Performance fee
Latin American Fund A2 EUR 1.73% 1.73%
A2 USD 1.73% 1.73%
F2 USD 1.08% 1.08%
H2 EUR 0.98% 0.98%
H2 USD 0.98% 0.98%
I2 EUR 1.17% 1.17%
X2 EUR 2.24% 2.24%
Pan European Fund A2 EUR 1.64% 1.64%
A2 HCHF 1.64% 1.64%
A2 HSGD 1.64% 1.64%
A2 HUSD 1.64% 1.64%
G2 EUR 0.73% 0.73%
H2 EUR 0.89% 0.89%
H2 HCHF 0.89% 0.89%
H2 HUSD 0.89% 0.89%
I2 EUR 1.08% 1.08%
I2 HSGD 1.08% 1.08%
I2 HUSD 1.08% 1.08%
I2 SGD 1.08% 1.08%
X2 EUR 2.14% 2.14%
Pan European Smaller Companies Fund A1 EUR 1.65% 1.65%
A2 EUR 1.65% 1.65%
A2 HUSD 1.65% 1.65%
H2 EUR 0.91% 0.91%
H2 HUSD 0.91% 0.91%
I2 EUR 1.09% 1.09%
X2 EUR 2.15% 2.15%
Absolute Return Fund A2 GBP 1.63% 2.57%
A2 HCHF 1.63% 2.06%
A2 HEUR 1.63% 2.21%
A2 HUSD 1.63% 2.60%
F2 HUSD 1.23% 2.26%
G1 GBP 0.82% 1.90%
G2 GBP 0.83% 2.09%
G2 HEUR 0.82% 1.77%
G2 HUSD 0.82% 1.92%
H1 GBP 1.03% 1.67%
H2 GBP 1.03% 2.12%
H2 HCHF 1.03% 1.80%
H2 HEUR 1.03% 1.90%
H2 HUSD 1.03% 2.16%
I1 GBP 1.07% 2.14%
I2 GBP 1.07% 2.14%
I2 HCHF 1.07% 1.98%
I2 HEUR 1.07% 1.98%
I2 HJPY 1.07% 2.08%
I2 HUSD 1.07% 2.15%
X2 HUSD 2.13% 2.93%
Notes to the Financial Statements (continued)
As at 30 September 2021
17. Special information for Swiss investors (continued)
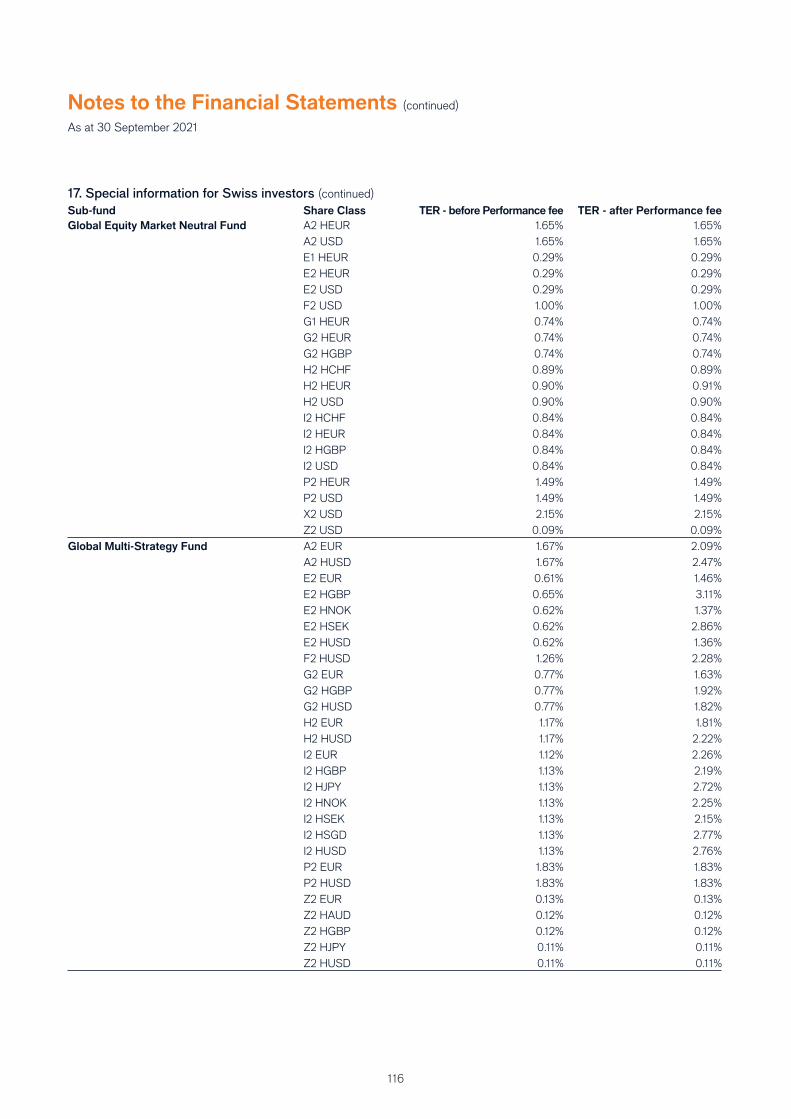
116
Sub-fund Share Class TER - before Performance fee TER - after Performance fee
Global Equity Market Neutral Fund A2 HEUR 1.65% 1.65%
A2 USD 1.65% 1.65%
E1 HEUR 0.29% 0.29%
E2 HEUR 0.29% 0.29%
E2 USD 0.29% 0.29%
F2 USD 1.00% 1.00%
G1 HEUR 0.74% 0.74%
G2 HEUR 0.74% 0.74%
G2 HGBP 0.74% 0.74%
H2 HCHF 0.89% 0.89%
H2 HEUR 0.90% 0.91%
H2 USD 0.90% 0.90%
I2 HCHF 0.84% 0.84%
I2 HEUR 0.84% 0.84%
I2 HGBP 0.84% 0.84%
I2 USD 0.84% 0.84%
P2 HEUR 1.49% 1.49%
P2 USD 1.49% 1.49%
X2 USD 2.15% 2.15%
Z2 USD 0.09% 0.09%
Global Multi-Strategy Fund A2 EUR 1.67% 2.09%
A2 HUSD 1.67% 2.47%
E2 EUR 0.61% 1.46%
E2 HGBP 0.65% 3.11%
E2 HNOK 0.62% 1.37%
E2 HSEK 0.62% 2.86%
E2 HUSD 0.62% 1.36%
F2 HUSD 1.26% 2.28%
G2 EUR 0.77% 1.63%
G2 HGBP 0.77% 1.92%
G2 HUSD 0.77% 1.82%
H2 EUR 1.17% 1.81%
H2 HUSD 1.17% 2.22%
I2 EUR 1.12% 2.26%
I2 HGBP 1.13% 2.19%
I2 HJPY 1.13% 2.72%
I2 HNOK 1.13% 2.25%
I2 HSEK 1.13% 2.15%
I2 HSGD 1.13% 2.77%
I2 HUSD 1.13% 2.76%
P2 EUR 1.83% 1.83%
P2 HUSD 1.83% 1.83%
Z2 EUR 0.13% 0.13%
Z2 HAUD 0.12% 0.12%
Z2 HGBP 0.12% 0.12%
Z2 HJPY 0.11% 0.11%
Z2 HUSD 0.11% 0.11%
Notes to the Financial Statements (continued)
As at 30 September 2021
17. Special information for Swiss investors (continued)
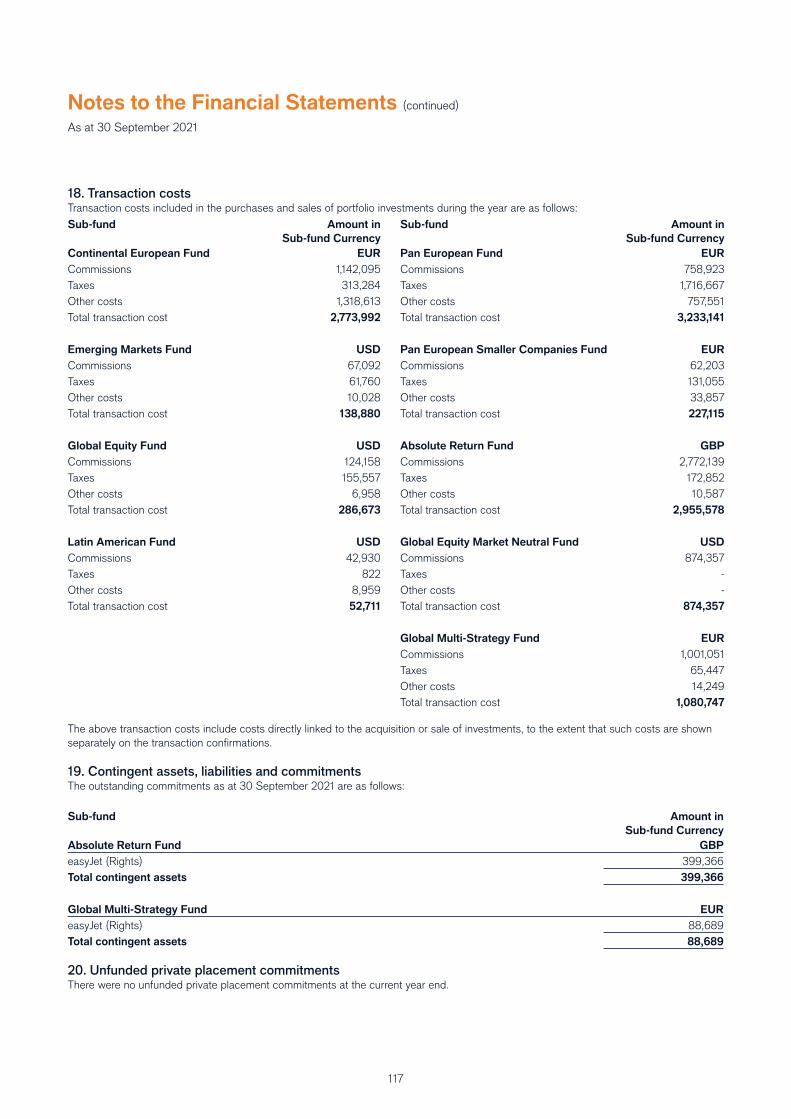
117
18. Transaction costs Transaction costs included in the purchases and sales of portfolio investments during the year are as follows:
Sub-fund Amount in
Sub-fund Currency
Sub-fund Amount in
Sub-fund Currency
Continental European Fund EUR Pan European Fund EUR
Commissions 1,142,095 Commissions 758,923
Taxes 313,284 Taxes 1,716,667
Other costs 1,318,613 Other costs 757,551
Total transaction cost 2,773,992 Total transaction cost 3,233,141
Emerging Markets Fund USD Pan European Smaller Companies Fund EUR
Commissions 67,092 Commissions 62,203
Taxes 61,760 Taxes 131,055
Other costs 10,028 Other costs 33,857
Total transaction cost 138,880 Total transaction cost 227,115
Global Equity Fund USD Absolute Return Fund GBP
Commissions 124,158 Commissions 2,772,139
Taxes 155,557 Taxes 172,852
Other costs 6,958 Other costs 10,587
Total transaction cost 286,673 Total transaction cost 2,955,578
Latin American Fund USD Global Equity Market Neutral Fund USD
Commissions 42,930 Commissions 874,357
Taxes 822 Taxes -
Other costs 8,959 Other costs -
Total transaction cost 52,711 Total transaction cost 874,357
Global Multi-Strategy Fund EUR
Commissions 1,001,051
Taxes 65,447
Other costs 14,249
Total transaction cost 1,080,747
The above transaction costs include costs directly linked to the acquisition or sale of investments, to the extent that such costs are shown
separately on the transaction confi rmations.
19. Contingent assets, liabilities and commitmentsThe outstanding commitments as at 30 September 2021 are as follows:
Sub-fund Amount in
Sub-fund Currency
Absolute Return Fund GBP
easyJet (Rights) 399,366
Total contingent assets 399,366
Global Multi-Strategy Fund EUR
easyJet (Rights) 88,689
Total contingent assets 88,689
20. Unfunded private placement commitmentsThere were no unfunded private placement commitments at the current year end.
Notes to the Financial Statements (continued)
As at 30 September 2021
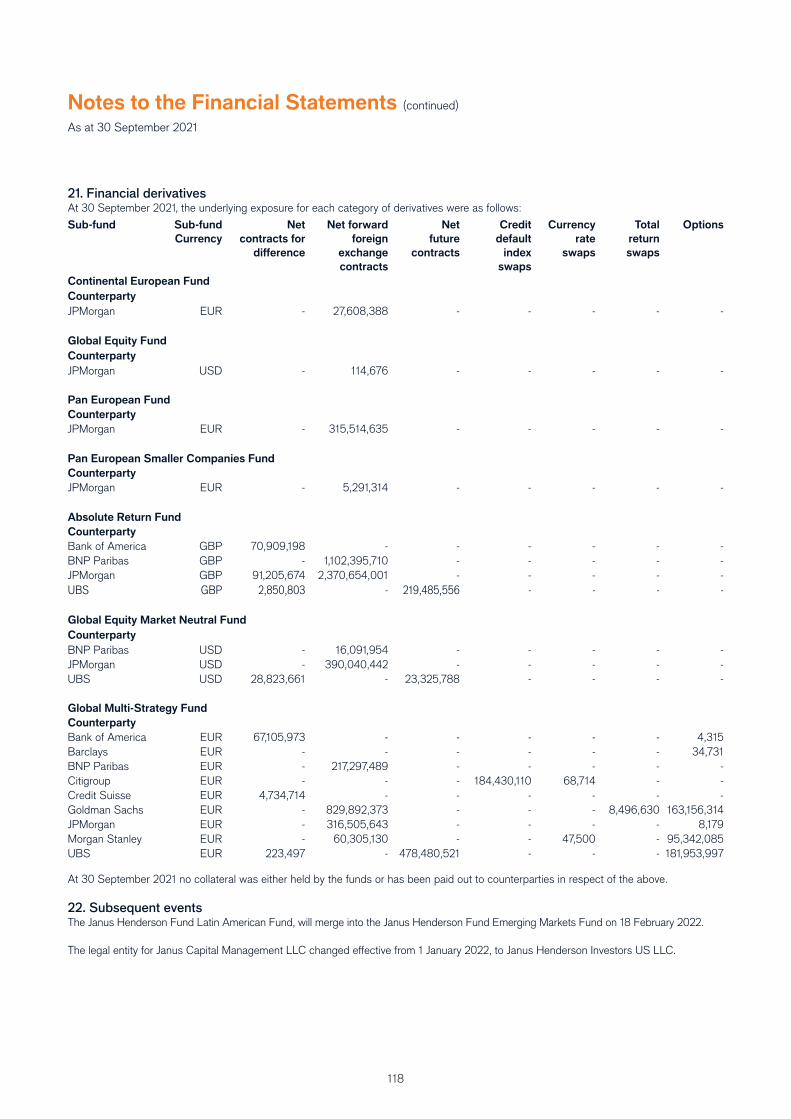
118
21. Financial derivativesAt 30 September 2021, the underlying exposure for each category of derivatives were as follows:
Sub-fund Sub-fund
Currency
Net
contracts for
diff erence
Net forward
foreign
exchange
contracts
Net
future
contracts
Credit
default
index
swaps
Currency
rate
swaps
Total
return
swaps
Options
Continental European Fund
Counterparty
JPMorgan EUR - 27,608,388 - - - - -
Global Equity Fund
Counterparty
JPMorgan USD - 114,676 - - - - -
Pan European Fund
Counterparty
JPMorgan EUR - 315,514,635 - - - - -
Pan European Smaller Companies Fund
Counterparty
JPMorgan EUR - 5,291,314 - - - - -
Absolute Return Fund
Counterparty
Bank of America GBP 70,909,198 - - - - - -
BNP Paribas GBP - 1,102,395,710 - - - - -
JPMorgan GBP 91,205,674 2,370,654,001 - - - - -
UBS GBP 2,850,803 - 219,485,556 - - - -
Global Equity Market Neutral Fund
Counterparty
BNP Paribas USD - 16,091,954 - - - - -
JPMorgan USD - 390,040,442 - - - - -
UBS USD 28,823,661 - 23,325,788 - - - -
Global Multi-Strategy Fund
Counterparty
Bank of America EUR 67,105,973 - - - - - 4,315
Barclays EUR - - - - - - 34,731
BNP Paribas EUR - 217,297,489 - - - - -
Citigroup EUR - - - 184,430,110 68,714 - -
Credit Suisse EUR 4,734,714 - - - - - -
Goldman Sachs EUR - 829,892,373 - - - 8,496,630 163,156,314
JPMorgan EUR - 316,505,643 - - - - 8,179
Morgan Stanley EUR - 60,305,130 - - 47,500 - 95,342,085
UBS EUR 223,497 - 478,480,521 - - - 181,953,997
At 30 September 2021 no collateral was either held by the funds or has been paid out to counterparties in respect of the above.
22. Subsequent eventsThe Janus Henderson Fund Latin American Fund, will merge into the Janus Henderson Fund Emerging Markets Fund on 18 February 2022.
The legal entity for Janus Capital Management LLC changed eff ective from 1 January 2022, to Janus Henderson Investors US LLC.
Notes to the Financial Statements (continued)
As at 30 September 2021
PricewaterhouseCoopers, Société coopérative, 2 rue Gerhard Mercator, B.P. 1443, L-1014 LuxembourgT : +352 494848 1, F : +352 494848 2900, www.pwc.lu
Cabinet de révision agréé. Expert-comptable (autorisation gouvernementale n°10028256)R.C.S. Luxembourg B 65 477 - TVA LU25482518
Audit report
To the Shareholders ofJanus Henderson Fund
Our opinion
In our opinion, the accompanying financial statements give a true and fair view of the financial position of Janus Henderson Fund (the “Fund”) and of each of its sub-funds as at 30 September 2021, and of the results of their operations and changes in their net assets for the year then ended in accordance with Luxembourg legal and regulatory requirements relating to the preparation and presentation of the financial statements.
What we have audited
The Fund’s financial statements comprise:
the combined statement of net assets for the Fund and the statement of net assets for each of the sub-funds as at 30 September 2021;
the combined statement of operations for the Fund and the statement of operations for each of the sub-funds for the year then ended;
the combined statement of changes in net assets for the Fund and the statement of changes in net assets for each of the sub-funds for the year then ended;
the Portfolios as at 30 September 2021; and the notes to the financial statements, which include a summary of significant accounting policies.
Basis for opinion
We conducted our audit in accordance with the Law of 23 July 2016 on the audit profession (Law of 23 July 2016) and with International Standards on Auditing (ISAs) as adopted for Luxembourg by the “Commission de Surveillance du Secteur Financier” (CSSF). Our responsibilities under the Law of 23 July 2016 and ISAs as adopted for Luxembourg by the CSSF are further described in the “Responsibilities of the “Réviseur d’entreprises agréé” for the audit of the financial statements” section of our report.
We believe that the audit evidence we have obtained is sufficient and appropriate to provide a basis for our opinion.
We are independent of the Fund in accordance with the International Code of Ethics for Professional Accountants, including International Independence Standards, issued by the International Ethics Standards Board for Accountants (IESBA Code) as adopted for Luxembourg by the CSSF together with the ethical requirements that are relevant to our audit of the financial statements. We have fulfilled our other ethical responsibilities under those ethical requirements.
Other information
The Board of Directors is responsible for the other information. The other information comprises the information stated in the annual report but does not include the financial statements and our audit report thereon.
120
Our opinion on the financial statements does not cover the other information and we do not express any form of assurance conclusion thereon.
In connection with our audit of the financial statements, our responsibility is to read the other information identified above and, in doing so, consider whether the other information is materially inconsistent with the financial statements or our knowledge obtained in the audit, or otherwise appears to be materially misstated. If, based on the work we have performed, we conclude that there is a material misstatement of this other information, we are required to report that fact. We have nothing to report in this regard.
Responsibilities of the Board of Directors for the financial statements
The Board of Directors is responsible for the preparation and fair presentation of the financial statements in accordance with Luxembourg legal and regulatory requirements relating to the preparation and presentation of the financial statements, and for such internal control as the Board of Directors determines is necessary to enable the preparation of financial statements that are free from material misstatement, whether due to fraud or error.
In preparing the financial statements, the Board of Directors is responsible for assessing the Fund’s and each of its sub-funds' ability to continue as a going concern, disclosing, as applicable, matters related to going concern and using the going concern basis of accounting unless the Board of Directors either intends to liquidate the Fund or close any of its sub-funds or to cease operations, or has no realistic alternative but to do so.
Responsibilities of the “Réviseur d’entreprises agréé” for the audit of the financial statements
The objectives of our audit are to obtain reasonable assurance about whether the financial statements as a whole are free from material misstatement, whether due to fraud or error, and to issue an audit report that includes our opinion. Reasonable assurance is a high level of assurance, but is not a guarantee that an audit conducted in accordance with the Law of 23 July 2016 and with ISAs as adopted for Luxembourg by the CSSF will always detect a material misstatement when it exists. Misstatements can arise from fraud or error and are considered material if, individually or in the aggregate, they could reasonably be expected to influence the economic decisions of users taken on the basis of these financial statements.
As part of an audit in accordance with the Law of 23 July 2016 and with ISAs as adopted for Luxembourg by the CSSF, we exercise professional judgment and maintain professional scepticism throughout the audit. We also:
identify and assess the risks of material misstatement of the financial statements, whether due to fraud or error, design and perform audit procedures responsive to those risks, and obtain audit evidence that is sufficient and appropriate to provide a basis for our opinion. The risk of not detecting a material misstatement resulting from fraud is higher than for one resulting from error, as fraud may involve collusion, forgery, intentional omissions, misrepresentations, or the override of internal control;
obtain an understanding of internal control relevant to the audit in order to design audit procedures that are appropriate in the circumstances, but not for the purpose of expressing an opinion on the effectiveness of the Fund’s internal control;
121
evaluate the appropriateness of accounting policies used and the reasonableness of accounting estimates and related disclosures made by the Board of Directors;
conclude on the appropriateness of the Board of Directors’ use of the going concern basis of accounting and, based on the audit evidence obtained, whether a material uncertainty exists related to events or conditions that may cast significant doubt on the Fund’s or any of its sub-funds' ability to continue as a going concern. If we conclude that a material uncertainty exists, we are required to draw attention in our audit report to the related disclosures in the financial statements or, if such disclosures are inadequate, to modify our opinion. Our conclusions are based on the audit evidence obtained up to the date of our audit report. However, future events or conditions may cause the Fund or any of its sub-funds to cease to continue as a going concern;
evaluate the overall presentation, structure and content of the financial statements, including the disclosures, and whether the financial statements represent the underlying transactions and events in a manner that achieves fair presentation.
We communicate with those charged with governance regarding, among other matters, the planned scope and timing of the audit and significant audit findings, including any significant deficiencies in internal control that we identify during our audit.
PricewaterhouseCoopers, Société coopérativeRepresented by@esig
@esigKarim Bara
Luxembourg, 11 January 2022
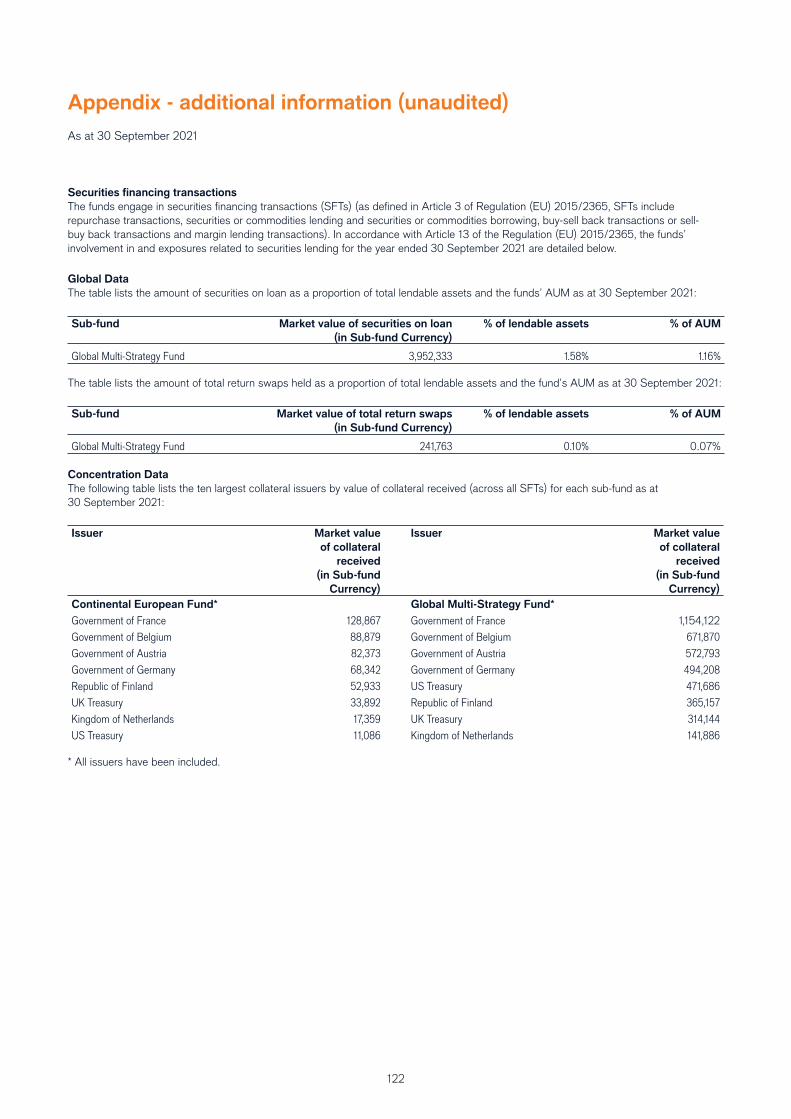
122
Appendix - additional information (unaudited)
As at 30 September 2021
Securities fi nancing transactions
The funds engage in securities fi nancing transactions (SFTs) (as defi ned in Article 3 of Regulation (EU) 2015/2365, SFTs include
repurchase transactions, securities or commodities lending and securities or commodities borrowing, buy-sell back transactions or sell-
buy back transactions and margin lending transactions). In accordance with Article 13 of the Regulation (EU) 2015/2365, the funds’
involvement in and exposures related to securities lending for the year ended 30 September 2021 are detailed below.
Global Data
The table lists the amount of securities on loan as a proportion of total lendable assets and the funds’ AUM as at 30 September 2021:
Sub-fund Market value of securities on loan
(in Sub-fund Currency)
% of lendable assets % of AUM
Global Multi-Strategy Fund 3,952,333 1.58% 1.16%
The table lists the amount of total return swaps held as a proportion of total lendable assets and the fund’s AUM as at 30 September 2021:
Sub-fund Market value of total return swaps
(in Sub-fund Currency)
% of lendable assets % of AUM
Global Multi-Strategy Fund 241,763 0.10% 0.07%
Concentration Data
The following table lists the ten largest collateral issuers by value of collateral received (across all SFTs) for each sub-fund as at
30 September 2021:
Issuer Market value
of collateral
received
(in Sub-fund
Currency)
Issuer Market value
of collateral
received
(in Sub-fund
Currency)
Continental European Fund* Global Multi-Strategy Fund*
Government of France 128,867 Government of France 1,154,122
Government of Belgium 88,879 Government of Belgium 671,870Government of Austria 82,373 Government of Austria 572,793Government of Germany 68,342 Government of Germany 494,208Republic of Finland 52,933 US Treasury 471,686UK Treasury 33,892 Republic of Finland 365,157Kingdom of Netherlands 17,359 UK Treasury 314,144US Treasury 11,086 Kingdom of Netherlands 141,886
* All issuers have been included.
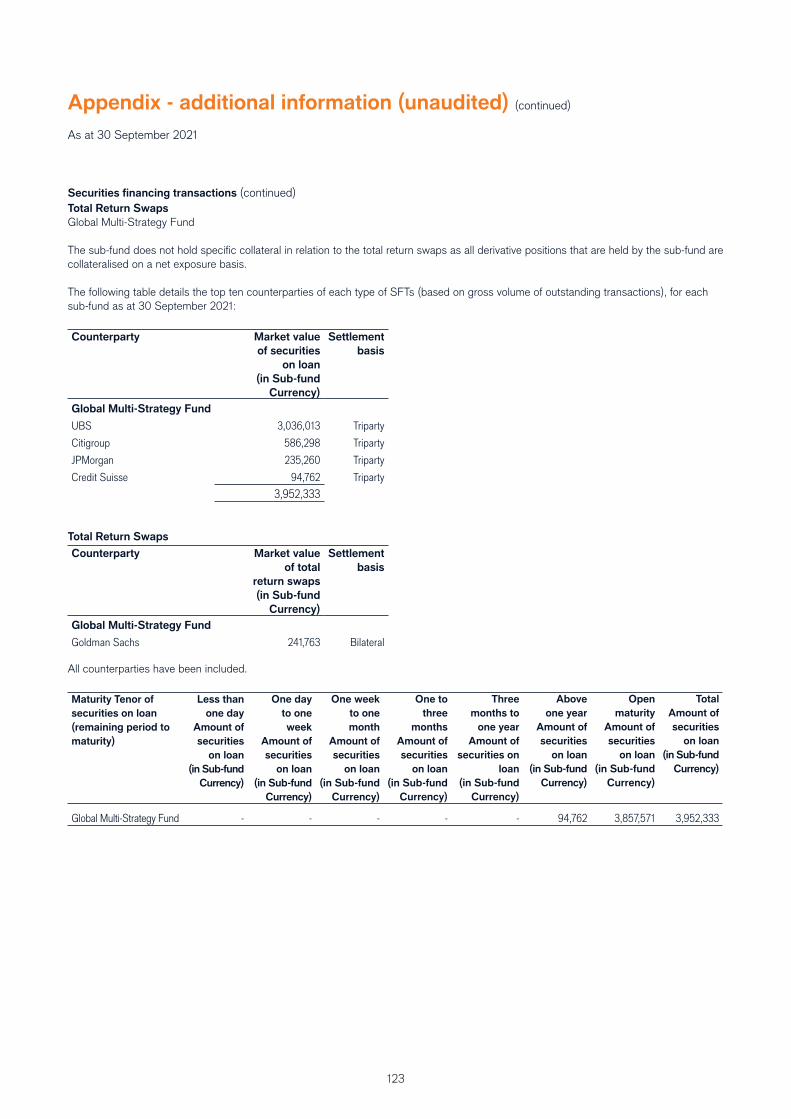
123
Appendix - additional information (unaudited) (continued)
As at 30 September 2021
Securities fi nancing transactions (continued)
Total Return Swaps
Global Multi-Strategy Fund
The sub-fund does not hold specifi c collateral in relation to the total return swaps as all derivative positions that are held by the sub-fund are
collateralised on a net exposure basis.
The following table details the top ten counterparties of each type of SFTs (based on gross volume of outstanding transactions), for each
sub-fund as at 30 September 2021:
Counterparty Market value
of securities
on loan
(in Sub-fund
Currency)
Settlement
basis
Global Multi-Strategy Fund
UBS 3,036,013 Triparty
Citigroup 586,298 Triparty
JPMorgan 235,260 Triparty
Credit Suisse 94,762 Triparty
3,952,333
Total Return Swaps
Counterparty Market value
of total
return swaps
(in Sub-fund
Currency)
Settlement
basis
Global Multi-Strategy Fund
Goldman Sachs 241,763 Bilateral
All counterparties have been included.
Maturity Tenor of
securities on loan
(remaining period to
maturity)
Less than
one day
Amount of
securities
on loan
(in Sub-fund
Currency)
One day
to one
week
Amount of
securities
on loan
(in Sub-fund
Currency)
One week
to one
month
Amount of
securities
on loan
(in Sub-fund
Currency)
One to
three
months
Amount of
securities
on loan
(in Sub-fund
Currency)
Three
months to
one year
Amount of
securities on
loan
(in Sub-fund
Currency)
Above
one year
Amount of
securities
on loan
(in Sub-fund
Currency)
Open
maturity
Amount of
securities
on loan
(in Sub-fund
Currency)
Total
Amount of
securities
on loan
(in Sub-fund
Currency)
Global Multi-Strategy Fund - - - - - 94,762 3,857,571 3,952,333
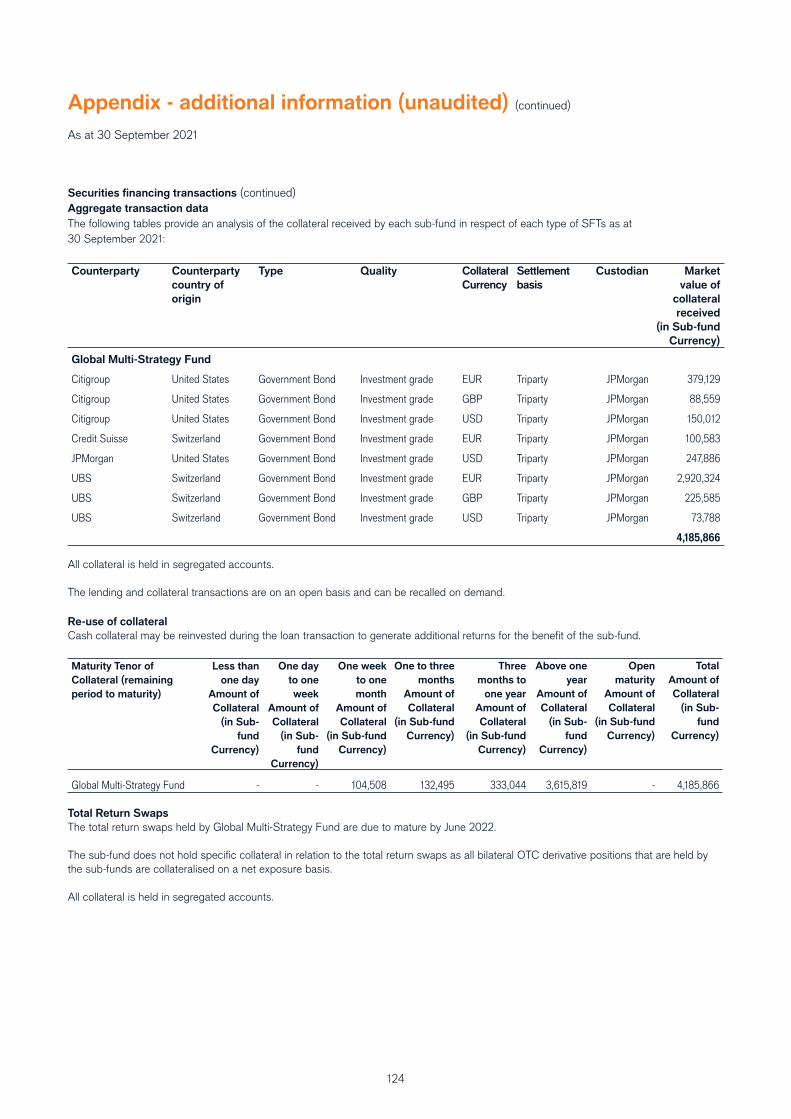
124
Securities fi nancing transactions (continued)
Aggregate transaction data
The following tables provide an analysis of the collateral received by each sub-fund in respect of each type of SFTs as at
30 September 2021:
Counterparty Counterparty
country of
origin
Type Quality Collateral
Currency
Settlement
basis
Custodian Market
value of
collateral
received
(in Sub-fund
Currency)
Global Multi-Strategy Fund
Citigroup United States Government Bond Investment grade EUR Triparty JPMorgan 379,129
Citigroup United States Government Bond Investment grade GBP Triparty JPMorgan 88,559
Citigroup United States Government Bond Investment grade USD Triparty JPMorgan 150,012
Credit Suisse Switzerland Government Bond Investment grade EUR Triparty JPMorgan 100,583
JPMorgan United States Government Bond Investment grade USD Triparty JPMorgan 247,886
UBS Switzerland Government Bond Investment grade EUR Triparty JPMorgan 2,920,324
UBS Switzerland Government Bond Investment grade GBP Triparty JPMorgan 225,585
UBS Switzerland Government Bond Investment grade USD Triparty JPMorgan 73,788
4,185,866
All collateral is held in segregated accounts.
The lending and collateral transactions are on an open basis and can be recalled on demand.
Re-use of collateral
Cash collateral may be reinvested during the loan transaction to generate additional returns for the benefi t of the sub-fund.
Maturity Tenor of
Collateral (remaining
period to maturity)
Less than
one day
Amount of
Collateral
(in Sub-
fund
Currency)
One day
to one
week
Amount of
Collateral
(in Sub-
fund
Currency)
One week
to one
month
Amount of
Collateral
(in Sub-fund
Currency)
One to three
months
Amount of
Collateral
(in Sub-fund
Currency)
Three
months to
one year
Amount of
Collateral
(in Sub-fund
Currency)
Above one
year
Amount of
Collateral
(in Sub-
fund
Currency)
Open
maturity
Amount of
Collateral
(in Sub-fund
Currency)
Total
Amount of
Collateral
(in Sub-
fund
Currency)
Global Multi-Strategy Fund - - 104,508 132,495 333,044 3,615,819 - 4,185,866
Total Return Swaps
The total return swaps held by Global Multi-Strategy Fund are due to mature by June 2022.
The sub-fund does not hold specifi c collateral in relation to the total return swaps as all bilateral OTC derivative positions that are held by
the sub-funds are collateralised on a net exposure basis.
All collateral is held in segregated accounts.
Appendix - additional information (unaudited) (continued)
As at 30 September 2021
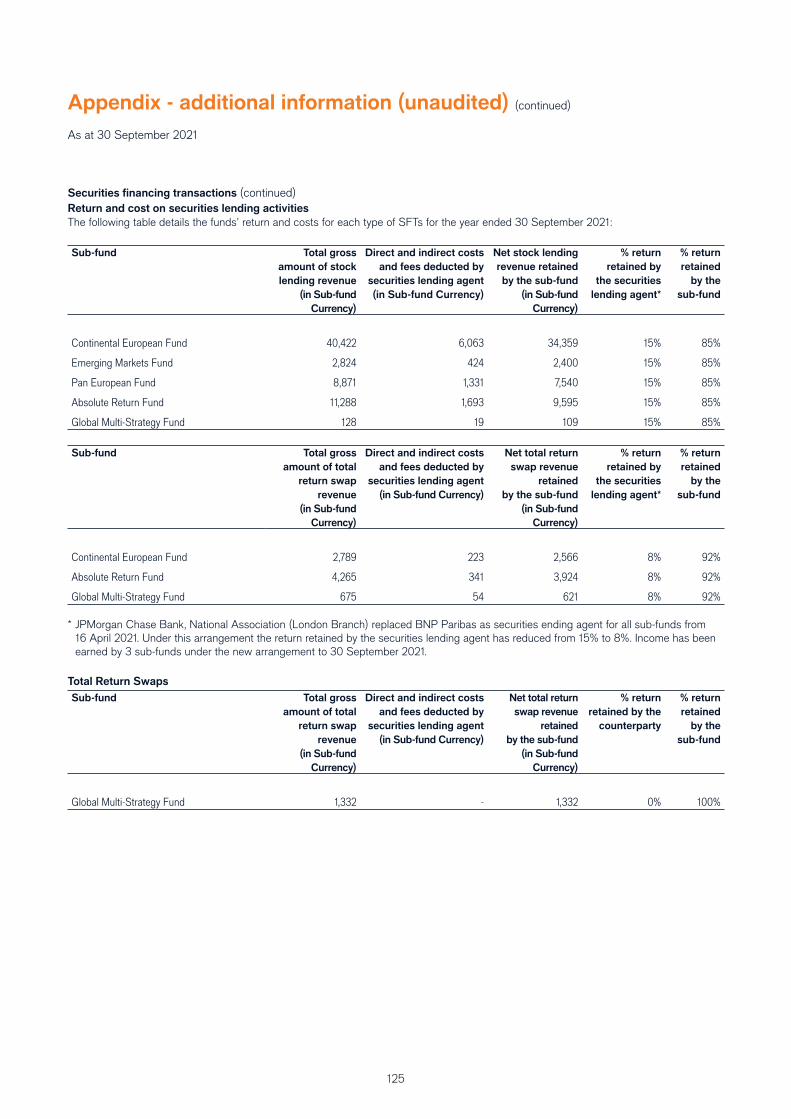
125
Securities fi nancing transactions (continued)
Return and cost on securities lending activities
The following table details the funds’ return and costs for each type of SFTs for the year ended 30 September 2021:
Sub-fund Total gross
amount of stock
lending revenue
(in Sub-fund
Currency)
Direct and indirect costs
and fees deducted by
securities lending agent
(in Sub-fund Currency)
Net stock lending
revenue retained
by the sub-fund
(in Sub-fund
Currency)
% return
retained by
the securities
lending agent*
% return
retained
by the
sub-fund
Continental European Fund 40,422 6,063 34,359 15% 85%
Emerging Markets Fund 2,824 424 2,400 15% 85%
Pan European Fund 8,871 1,331 7,540 15% 85%
Absolute Return Fund 11,288 1,693 9,595 15% 85%
Global Multi-Strategy Fund 128 19 109 15% 85%
Sub-fund Total gross
amount of total
return swap
revenue
(in Sub-fund
Currency)
Direct and indirect costs
and fees deducted by
securities lending agent
(in Sub-fund Currency)
Net total return
swap revenue
retained
by the sub-fund
(in Sub-fund
Currency)
% return
retained by
the securities
lending agent*
% return
retained
by the
sub-fund
Continental European Fund 2,789 223 2,566 8% 92%
Absolute Return Fund 4,265 341 3,924 8% 92%
Global Multi-Strategy Fund 675 54 621 8% 92%
* JPMorgan Chase Bank, National Association (London Branch) replaced BNP Paribas as securities ending agent for all sub-funds from
16 April 2021. Under this arrangement the return retained by the securities lending agent has reduced from 15% to 8%. Income has been
earned by 3 sub-funds under the new arrangement to 30 September 2021.
Total Return Swaps
Sub-fund Total gross
amount of total
return swap
revenue
(in Sub-fund
Currency)
Direct and indirect costs
and fees deducted by
securities lending agent
(in Sub-fund Currency)
Net total return
swap revenue
retained
by the sub-fund
(in Sub-fund
Currency)
% return
retained by the
counterparty
% return
retained
by the
sub-fund
Global Multi-Strategy Fund 1,332 - 1,332 0% 100%
Appendix - additional information (unaudited) (continued)
As at 30 September 2021
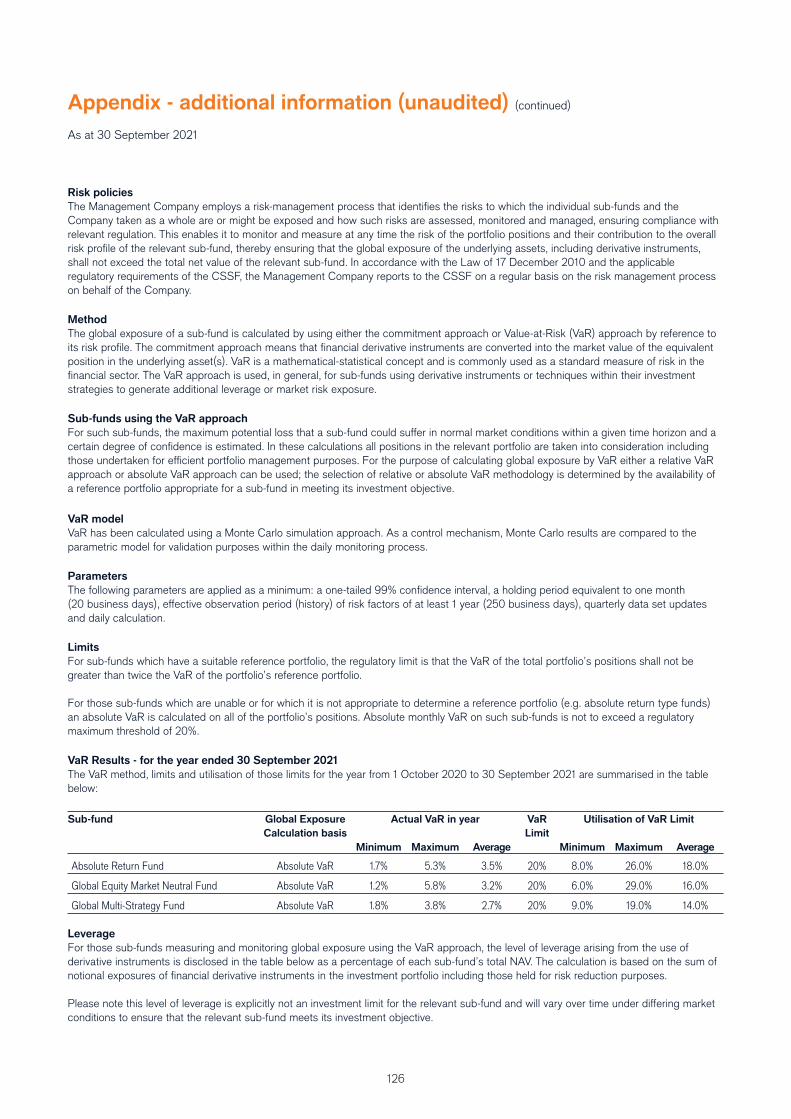
126
Risk policies
The Management Company employs a risk-management process that identifi es the risks to which the individual sub-funds and the
Company taken as a whole are or might be exposed and how such risks are assessed, monitored and managed, ensuring compliance with
relevant regulation. This enables it to monitor and measure at any time the risk of the portfolio positions and their contribution to the overall
risk profi le of the relevant sub-fund, thereby ensuring that the global exposure of the underlying assets, including derivative instruments,
shall not exceed the total net value of the relevant sub-fund. In accordance with the Law of 17 December 2010 and the applicable
regulatory requirements of the CSSF, the Management Company reports to the CSSF on a regular basis on the risk management process
on behalf of the Company.
Method
The global exposure of a sub-fund is calculated by using either the commitment approach or Value-at-Risk (VaR) approach by reference to
its risk profi le. The commitment approach means that fi nancial derivative instruments are converted into the market value of the equivalent
position in the underlying asset(s). VaR is a mathematical-statistical concept and is commonly used as a standard measure of risk in the
fi nancial sector. The VaR approach is used, in general, for sub-funds using derivative instruments or techniques within their investment
strategies to generate additional leverage or market risk exposure.
Sub-funds using the VaR approach
For such sub-funds, the maximum potential loss that a sub-fund could suff er in normal market conditions within a given time horizon and a
certain degree of confi dence is estimated. In these calculations all positions in the relevant portfolio are taken into consideration including
those undertaken for effi cient portfolio management purposes. For the purpose of calculating global exposure by VaR either a relative VaR
approach or absolute VaR approach can be used; the selection of relative or absolute VaR methodology is determined by the availability of
a reference portfolio appropriate for a sub-fund in meeting its investment objective.
VaR model
VaR has been calculated using a Monte Carlo simulation approach. As a control mechanism, Monte Carlo results are compared to the
parametric model for validation purposes within the daily monitoring process.
Parameters
The following parameters are applied as a minimum: a one-tailed 99% confi dence interval, a holding period equivalent to one month
(20 business days), eff ective observation period (history) of risk factors of at least 1 year (250 business days), quarterly data set updates
and daily calculation.
Limits
For sub-funds which have a suitable reference portfolio, the regulatory limit is that the VaR of the total portfolio’s positions shall not be
greater than twice the VaR of the portfolio’s reference portfolio.
For those sub-funds which are unable or for which it is not appropriate to determine a reference portfolio (e.g. absolute return type funds)
an absolute VaR is calculated on all of the portfolio’s positions. Absolute monthly VaR on such sub-funds is not to exceed a regulatory
maximum threshold of 20%.
VaR Results - for the year ended 30 September 2021
The VaR method, limits and utilisation of those limits for the year from 1 October 2020 to 30 September 2021 are summarised in the table
below:
Sub-fund Global Exposure
Calculation basis
Actual VaR in year VaR
Limit
Utilisation of VaR Limit
Minimum Maximum Average Minimum Maximum Average
Absolute Return Fund Absolute VaR 1.7% 5.3% 3.5% 20% 8.0% 26.0% 18.0%
Global Equity Market Neutral Fund Absolute VaR 1.2% 5.8% 3.2% 20% 6.0% 29.0% 16.0%
Global Multi-Strategy Fund Absolute VaR 1.8% 3.8% 2.7% 20% 9.0% 19.0% 14.0%
Leverage
For those sub-funds measuring and monitoring global exposure using the VaR approach, the level of leverage arising from the use of
derivative instruments is disclosed in the table below as a percentage of each sub-fund’s total NAV. The calculation is based on the sum of
notional exposures of fi nancial derivative instruments in the investment portfolio including those held for risk reduction purposes.
Please note this level of leverage is explicitly not an investment limit for the relevant sub-fund and will vary over time under diff ering market
conditions to ensure that the relevant sub-fund meets its investment objective.
Appendix - additional information (unaudited) (continued)
As at 30 September 2021
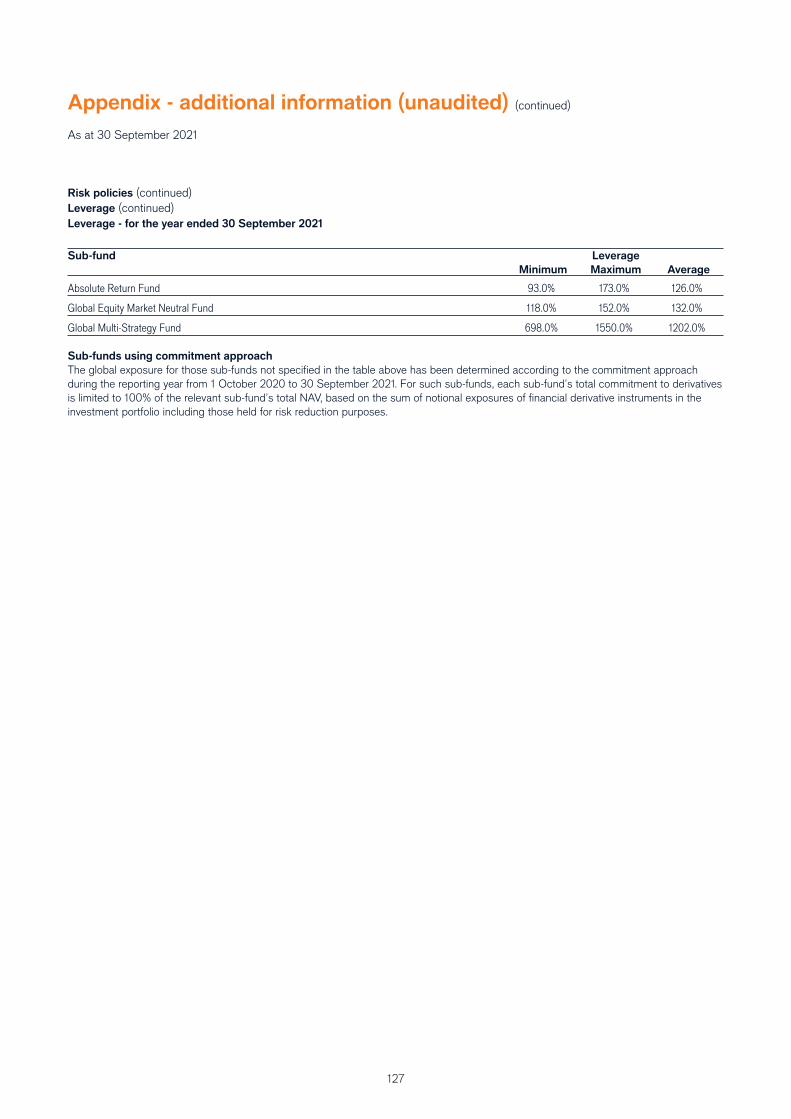
127
Risk policies (continued)
Leverage (continued)
Leverage - for the year ended 30 September 2021
Sub-fund
Minimum
Leverage
Maximum Average
Absolute Return Fund 93.0% 173.0% 126.0%
Global Equity Market Neutral Fund 118.0% 152.0% 132.0%
Global Multi-Strategy Fund 698.0% 1550.0% 1202.0%
Sub-funds using commitment approach
The global exposure for those sub-funds not specifi ed in the table above has been determined according to the commitment approach
during the reporting year from 1 October 2020 to 30 September 2021. For such sub-funds, each sub-fund’s total commitment to derivatives
is limited to 100% of the relevant sub-fund’s total NAV, based on the sum of notional exposures of fi nancial derivative instruments in the
investment portfolio including those held for risk reduction purposes.
Appendix - additional information (unaudited) (continued)
As at 30 September 2021
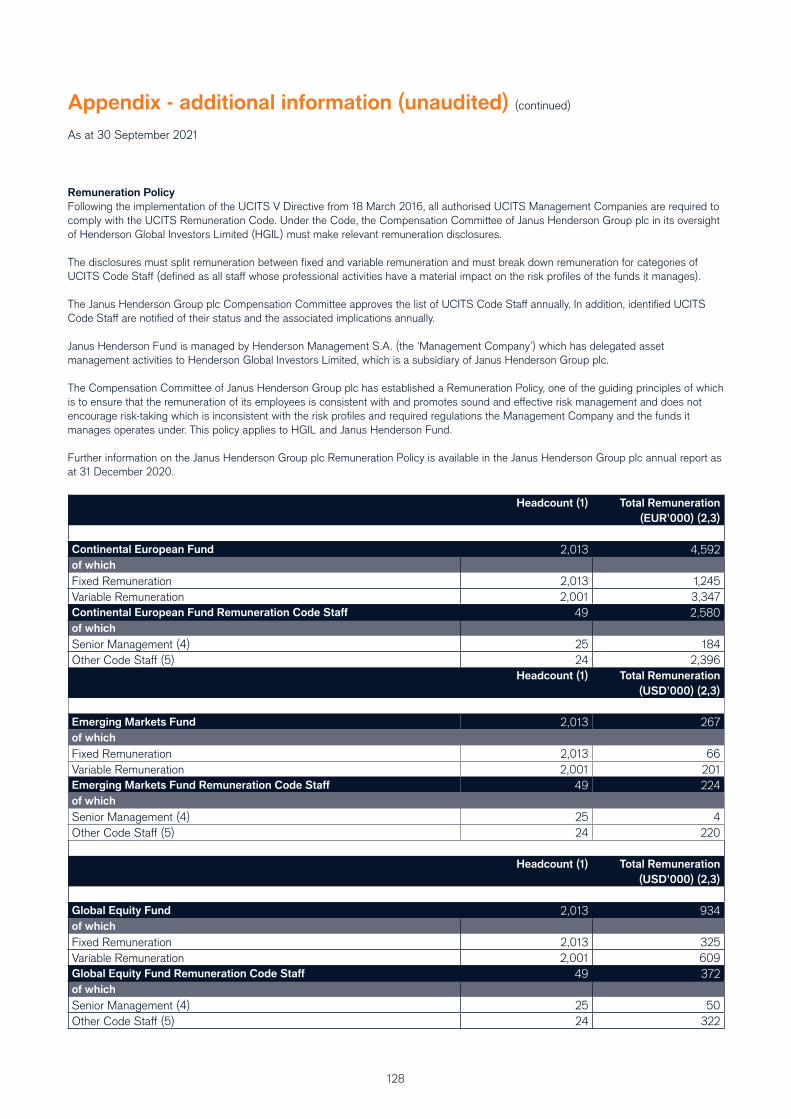
128
Remuneration Policy
Following the implementation of the UCITS V Directive from 18 March 2016, all authorised UCITS Management Companies are required to
comply with the UCITS Remuneration Code. Under the Code, the Compensation Committee of Janus Henderson Group plc in its oversight
of Henderson Global Investors Limited (HGIL) must make relevant remuneration disclosures.
The disclosures must split remuneration between fi xed and variable remuneration and must break down remuneration for categories of
UCITS Code Staff (defi ned as all staff whose professional activities have a material impact on the risk profi les of the funds it manages).
The Janus Henderson Group plc Compensation Committee approves the list of UCITS Code Staff annually. In addition, identifi ed UCITS
Code Staff are notifi ed of their status and the associated implications annually.
Janus Henderson Fund is managed by Henderson Management S.A. (the ‘Management Company’) which has delegated asset
management activities to Henderson Global Investors Limited, which is a subsidiary of Janus Henderson Group plc.
The Compensation Committee of Janus Henderson Group plc has established a Remuneration Policy, one of the guiding principles of which
is to ensure that the remuneration of its employees is consistent with and promotes sound and eff ective risk management and does not
encourage risk-taking which is inconsistent with the risk profi les and required regulations the Management Company and the funds it
manages operates under. This policy applies to HGIL and Janus Henderson Fund.
Further information on the Janus Henderson Group plc Remuneration Policy is available in the Janus Henderson Group plc annual report as
at 31 December 2020.
Headcount (1) Total Remuneration
(EUR’000) (2,3)
Continental European Fund 2,013 4,592
of which
Fixed Remuneration 2,013 1,245
Variable Remuneration 2,001 3,347
Continental European Fund Remuneration Code Staff 49 2,580
of which
Senior Management (4) 25 184
Other Code Staff (5) 24 2,396
Headcount (1) Total Remuneration
(USD’000) (2,3)
Emerging Markets Fund 2,013 267
of which
Fixed Remuneration 2,013 66
Variable Remuneration 2,001 201
Emerging Markets Fund Remuneration Code Staff 49 224
of which
Senior Management (4) 25 4
Other Code Staff (5) 24 220
Headcount (1) Total Remuneration
(USD’000) (2,3)
Global Equity Fund 2,013 934
of which
Fixed Remuneration 2,013 325
Variable Remuneration 2,001 609
Global Equity Fund Remuneration Code Staff 49 372
of which
Senior Management (4) 25 50
Other Code Staff (5) 24 322
Appendix - additional information (unaudited) (continued)
As at 30 September 2021
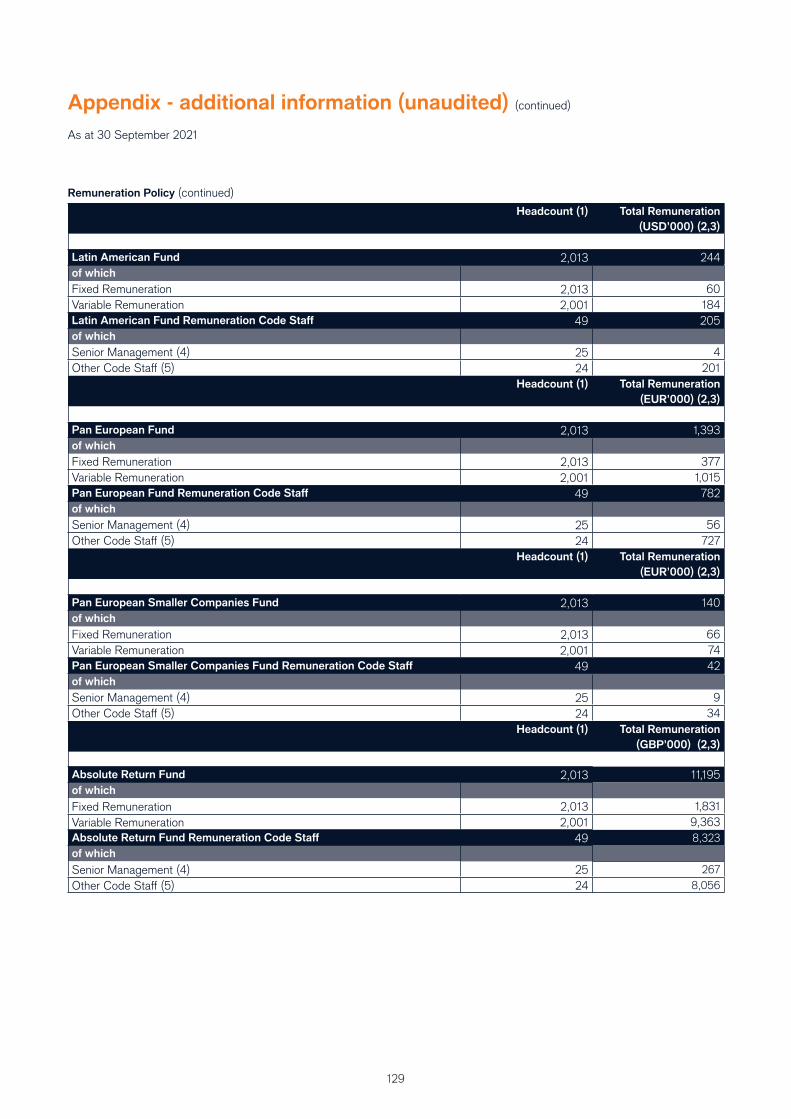
129
Headcount (1) Total Remuneration
(USD’000) (2,3)
Latin American Fund 2,013 244
of which
Fixed Remuneration 2,013 60
Variable Remuneration 2,001 184
Latin American Fund Remuneration Code Staff 49 205
of which
Senior Management (4) 25 4
Other Code Staff (5) 24 201
Headcount (1) Total Remuneration
(EUR’000) (2,3)
Pan European Fund 2,013 1,393
of which
Fixed Remuneration 2,013 377
Variable Remuneration 2,001 1,015
Pan European Fund Remuneration Code Staff 49 782
of which
Senior Management (4) 25 56
Other Code Staff (5) 24 727
Headcount (1) Total Remuneration
(EUR’000) (2,3)
Pan European Smaller Companies Fund 2,013 140
of which
Fixed Remuneration 2,013 66
Variable Remuneration 2,001 74
Pan European Smaller Companies Fund Remuneration Code Staff 49 42
of which
Senior Management (4) 25 9
Other Code Staff (5) 24 34
Headcount (1) Total Remuneration
(GBP’000) (2,3)
Absolute Return Fund 2,013 11,195
of which
Fixed Remuneration 2,013 1,831
Variable Remuneration 2,001 9,363
Absolute Return Fund Remuneration Code Staff 49 8,323
of which
Senior Management (4) 25 267
Other Code Staff (5) 24 8,056
Appendix - additional information (unaudited) (continued)
As at 30 September 2021
Remuneration Policy (continued)
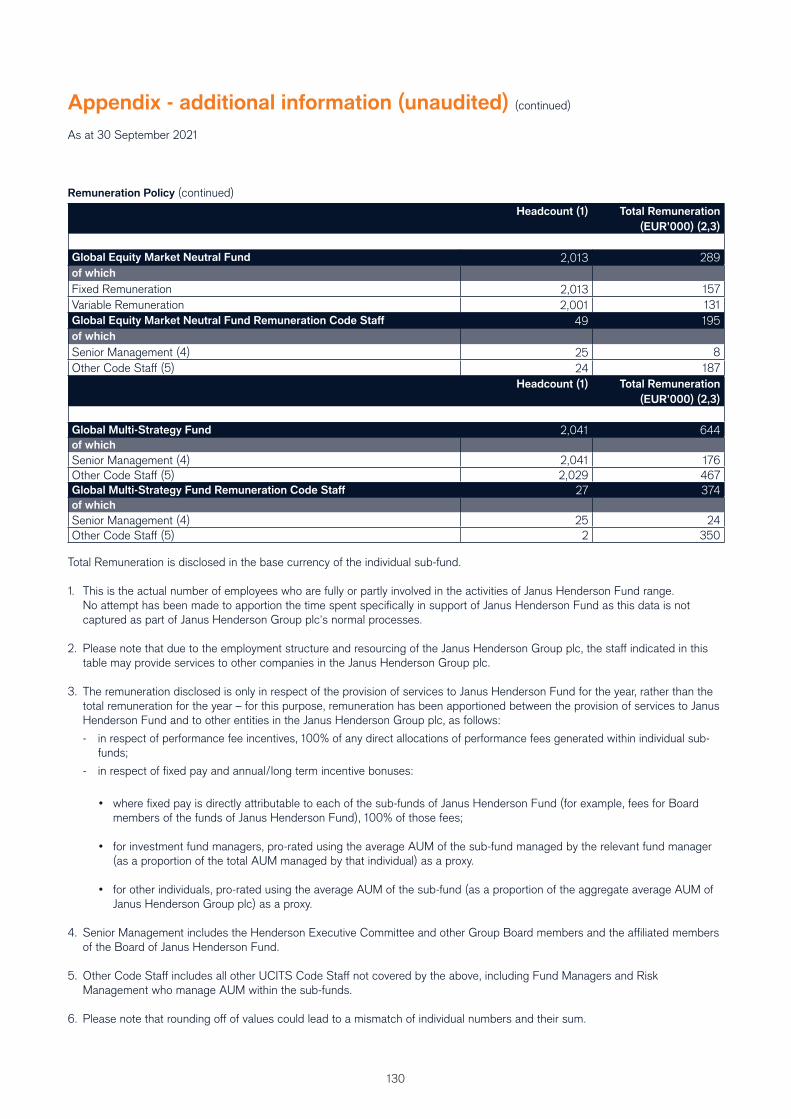
130
Headcount (1) Total Remuneration
(EUR’000) (2,3)
Global Equity Market Neutral Fund 2,013 289
of which
Fixed Remuneration 2,013 157
Variable Remuneration 2,001 131
Global Equity Market Neutral Fund Remuneration Code Staff 49 195
of which
Senior Management (4) 25 8
Other Code Staff (5) 24 187
Headcount (1) Total Remuneration
(EUR’000) (2,3)
Global Multi-Strategy Fund 2,041 644
of which
Senior Management (4) 2,041 176
Other Code Staff (5) 2,029 467
Global Multi-Strategy Fund Remuneration Code Staff 27 374
of which
Senior Management (4) 25 24
Other Code Staff (5) 2 350
Total Remuneration is disclosed in the base currency of the individual sub-fund.
1. This is the actual number of employees who are fully or partly involved in the activities of Janus Henderson Fund range.
No attempt has been made to apportion the time spent specifi cally in support of Janus Henderson Fund as this data is not
captured as part of Janus Henderson Group plc’s normal processes.
2. Please note that due to the employment structure and resourcing of the Janus Henderson Group plc, the staff indicated in this
table may provide services to other companies in the Janus Henderson Group plc.
3. The remuneration disclosed is only in respect of the provision of services to Janus Henderson Fund for the year, rather than the
total remuneration for the year – for this purpose, remuneration has been apportioned between the provision of services to Janus
Henderson Fund and to other entities in the Janus Henderson Group plc, as follows:
- in respect of performance fee incentives, 100% of any direct allocations of performance fees generated within individual sub-
funds;
- in respect of fi xed pay and annual/long term incentive bonuses:
• where fi xed pay is directly attributable to each of the sub-funds of Janus Henderson Fund (for example, fees for Board
members of the funds of Janus Henderson Fund), 100% of those fees;
• for investment fund managers, pro-rated using the average AUM of the sub-fund managed by the relevant fund manager
(as a proportion of the total AUM managed by that individual) as a proxy.
• for other individuals, pro-rated using the average AUM of the sub-fund (as a proportion of the aggregate average AUM of
Janus Henderson Group plc) as a proxy.
4. Senior Management includes the Henderson Executive Committee and other Group Board members and the affi liated members
of the Board of Janus Henderson Fund.
5. Other Code Staff includes all other UCITS Code Staff not covered by the above, including Fund Managers and Risk
Management who manage AUM within the sub-funds.
6. Please note that rounding off of values could lead to a mismatch of individual numbers and their sum.
Appendix - additional information (unaudited) (continued)
As at 30 September 2021
Remuneration Policy (continued)
131
General information
The Company is an open-ended investment company with variable capital incorporated in Luxembourg as a SICAV on
26 September 2000 and is a recognised UCITS scheme for the purposes of Section 76 of the United Kingdom Financial Services
Act 1986. Potential investors in the UK are advised that the protections aff orded by the UK regulatory system will not apply to an
investment in the Company and that compensation will not be available under the Financial Services Compensation Scheme.
The Company provides a simple cost eff ective way of investing in the world equity and alternate solution markets and through its nine sub-
funds, provides investors with access to six equity sub-funds and three alternate solution sub-funds.
Applications for shares may be made on any business day in Luxembourg to the Registrar and Transfer Agent between 9.00 a.m. and
6.00 p.m. (local time), or to the Principal Distributor in London between 9.00 a.m. and 5.00 p.m. (local time). Applications should be made
on the application form circulated with the prospectus or by fax, telephone or in writing and may be made in any major currency. If you are
sending applications by fax, you should also subsequently send the original form by post. Applications are accepted by telephone only from
existing investors who have previously been issued with a Personal Service Number.
For full information, including a copy of the prospectus and the Key Investor Information Document (KIID), please write to the Registrar and
Transfer Agent or Distributor at the addresses shown on page 1. Alternatively visit the Janus Henderson website: www.janushenderson.com.
Please remember that past performance is not necessarily a guide to the future performance. The value of investment and the income
from it can fall as well as rise as a result of market and currency fl uctuations and you may not get back the amount originally invested. Tax
assumptions may change if the law changes and the value of the tax relief will depend upon individual circumstances. Please refer to the
prospectus for information on the Janus Henderson Fund.

Past performance may not be a reliable guide to future performance. The value of an investment and the income from it can fall as well as rise significantly.
Tax assumptions and reliefs depend upon an investor’s particular circumstances and may change if those circumstances or the law change. Please refer to the
prospectus and the key investor information document for further information on the Janus Henderson Fund.
Issued by Janus Henderson Investors. Janus Henderson Investors is the name under which investment products and services are provided by Janus Capital International Limited
(reg no. 3594615), Henderson Global Investors Limited (reg. no. 906355), Henderson Investment Funds Limited (reg. no. 2678531), AlphaGen Capital Limited (reg. no. 962757),
Henderson Equity Partners Limited (reg. no.2606646), (each registered in England and Wales at 201 Bishopsgate, London EC2M 3AE and regulated by the Financial Conduct
Authority) and Henderson Management S.A. (reg no. B22848 at 2 Rue de Bitbourg, L-1273, Luxembourg and regulated by the Commission de Surveillance du Secteur Financier).
A copy of the fund’s prospectus, key investor information document, articles of incorporation, annual and semi-annual reports can be obtained free of cost from the local
offices of Janus Henderson Investors: 201 Bishopsgate, London, EC2M 3AE for UK, Swedish and Scandinavian investors; Via Dante 14, 20121 Milan, Italy, for Italian investors
and Roemer Visscherstraat 43-45, 1054 EW Amsterdam, The Netherlands for Dutch investors; and the fund’s: Austrian Paying Agent Raiffeisen Bank International AG,
Am Stadtpark 9, A-1030 Vienna; French Paying Agent BNP Paribas Securities Services, 3, rue d’Antin, F-75002 Paris; German Information Agent Marcard, Stein & Co,
Ballindamm 36, 20095 Hamburg; Belgian Financial Service Provider CACEIS Belgium S.A., Avenue du Port 86 C b320, B-1000 Brussels; Spanish Representative Allfunds
Bank S.A. Estafeta, 6 Complejo Plaza de la Fuente, La Moraleja, Alcobendas 28109 Madrid; In Singapore: Janus Henderson Investors (Singapore) Limited, 138 Market Street,
#34-03/04 CapitaGreen, Singapore 048946; or Swiss Representative BNP Paribas Securities Services, Paris, succursale de Zurich, Selnaustrasse 16, 8002 Zurich who are
also the Swiss Paying Agent. RBC Investor Services Trust Hong Kong Limited, a subsidiary of the joint venture UK holding company RBC Investor Services Limited, 51/F Central
Plaza, 18 Harbour Road, Wanchai, Hong Kong, Tel: +852 2978 5656 is the fund’s Representative in Hong Kong.
Janus Henderson, Janus, Henderson, Perkins, Intech, Alphagen, VelocityShares, Knowledge. Shared and Knowledge Labs are trademarks of Janus Henderson Group plc or one
of its subsidiaries. © Janus Henderson Group plc.


![Luther Henderson Papers [finding aid]. Music Division, Library](https://img.dokumen.tips/doc/110x75/63253ee0e491bcb36c0a3545/luther-henderson-papers-finding-aid-music-division-library-.jpg)


