Embed Size (px)
Citation preview

Table of Contents
UNITED STATES
SECURITIES AND EXCHANGE COMMISSIONWashington, D.C. 20549
FORM 20-F
☐ REGISTRATION STATEMENT PURSUANT TO SECTION 12(b) OR (g) OF THE SECURITIES EXCHANGE ACTOF 1934
OR
☒ ANNUAL REPORT PURSUANT TO SECTION 13 OR 15(d) OF THE SECURITIES EXCHANGE ACT OF 1934For the fiscal year ended December 31, 2015
OR
☐ TRANSITION REPORT PURSUANT TO SECTION 13 OR 15(d) OF THE SECURITIES EXCHANGE ACT OF1934
OR
☐ SHELL COMPANY REPORT PURSUANT TO SECTION 13 OR 15(d) OF THE SECURITIES EXCHANGE ACTOF 1934
Date of event requiring this shell company report: N/AFor the transition period from to
Commission file number: 000-51380
Silicon Motion Technology Corporation(Exact name of Registrant as specified in its charter)
Cayman Islands
(Jurisdiction of incorporation or organization)8F-1, No. 36, Taiyuan St.,
Jhubei City, Hsinchu County 302Taiwan
Tel: +886 3 552 6888Fax: + 886 3 560 0336
(Address of principal executive offices)
Securities registered or to be registered pursuant to Section 12(b) of the Act:
Title of each class Name of each exchange on which registeredOrdinary shares, par value US$0.01 per share*American Depositary Shares, each representing
four ordinary shares
Nasdaq Global Select Market
* Not for trading, but only in connection with the listing on the Nasdaq Global Select Market of American Depositary Shares, or ADSs, each representing fourordinary shares.
Securities registered or to be registered pursuant to Section 12(g) of the Act:None
Securities registered or to be registered pursuant to Section 15(d) of the Act:None
Indicate the number of outstanding shares of each of the issuer’s classes of capital or common stock as of the close of the period covered by the annual report: 139,521,260 ordinary shares as of
December 31, 2015, US$0.01 par value per share.Indicate by check mark if the registrant is a well-known seasoned issuer, as defined in Rule 405 of the Securities Act. Yes ☐ No ☒If this report is an annual or transition report, indicate by check mark if the registrant is not required to file reports pursuant to Section 13 or Section 15(d) of the Act. Yes ☐ No ☒

Indicate by check mark whether the registrant (1) has filed all reports required to be filed by Sections 13 or 15(d) of the Securities Exchange Act of 1934 during the preceding 12 months (or for suchshorter period that the registrant was required to file such reports), and (2) has been subject to such filing requirements for the past 90 days. Yes ☒ No ☐
Indicate by check mark whether the registrant has submitted electronically and posted on its corporate Web site, if any, every Interactive Data File required to be submitted and posted pursuant to Rule 405of Regulation S-T (§232.405 of this chapter) during the preceding 12 months (or for such shorter period that the registrant was required to submit and post such files). Yes ☒ No ☐
Indicate by check mark whether the registrant is a large accelerated filer, an accelerated filer, or a non-accelerated filed. See definition of “accelerated filer and large accelerated filer” in Rule 12b-2 of theExchange Act. (Check one):
Large accelerated filer ☐ Accelerated filer ☒ Non-accelerated filer ☐Indicate by check mark which basis of accounting the registrant has used to prepare the financial statements included in this filing:
U.S. GAAP ☒
International Financial Reporting Standards as issuedby the International Accounting Standards Board ☐
Other ☐
If “Other” has been checked in response to the previous question, indicate by check mark which financial statement item the registrant has elected tofollow. ☐ Item 17 ☐ Item 18
If this is an annual report, indicate by check mark whether the registrant is a shell company (as defined in Rule 12b-2 of the Act): Yes ☐ No ☒
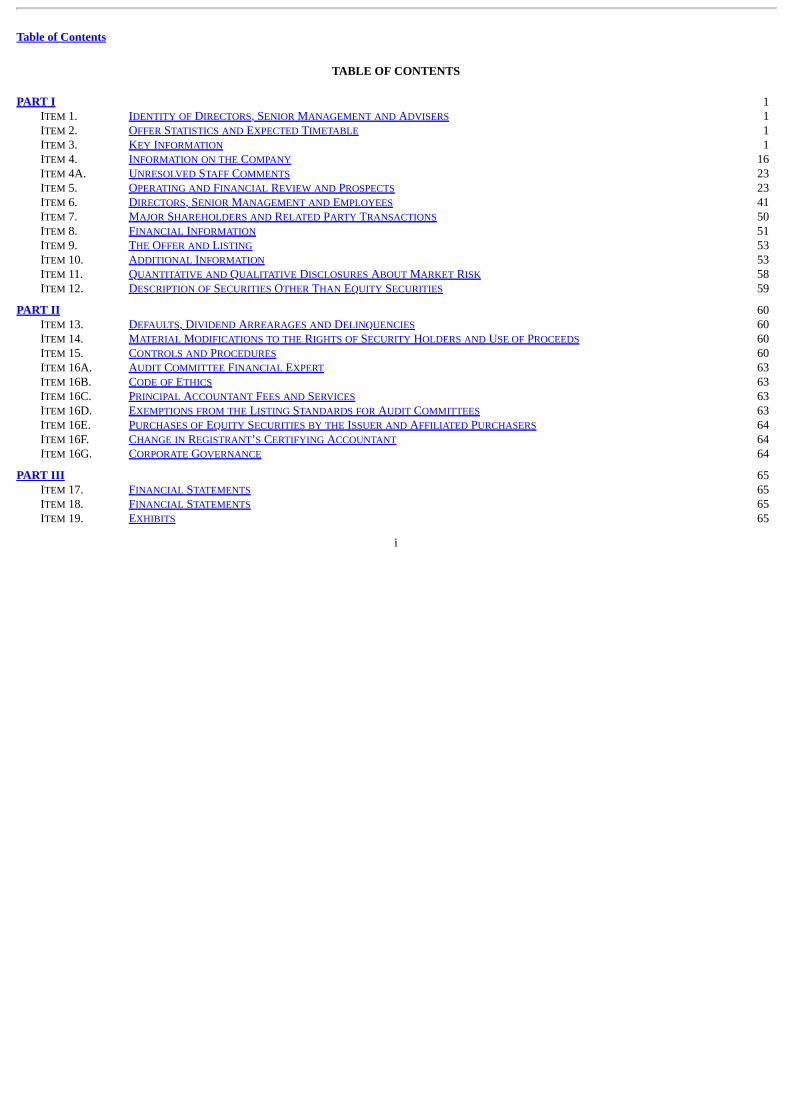
Table of Contents
TABLE OF CONTENTS PART I 1
ITEM 1. IDENTITY OF DIRECTORS, SENIOR MANAGEMENT AND ADVISERS 1 ITEM 2. OFFER STATISTICS AND EXPECTED TIMETABLE 1 ITEM 3. KEY INFORMATION 1 ITEM 4. INFORMATION ON THE COMPANY 16 ITEM 4A. UNRESOLVED STAFF COMMENTS 23 ITEM 5. OPERATING AND FINANCIAL REVIEW AND PROSPECTS 23 ITEM 6. DIRECTORS, SENIOR MANAGEMENT AND EMPLOYEES 41 ITEM 7. MAJOR SHAREHOLDERS AND RELATED PARTY TRANSACTIONS 50 ITEM 8. FINANCIAL INFORMATION 51 ITEM 9. THE OFFER AND LISTING 53 ITEM 10. ADDITIONAL INFORMATION 53 ITEM 11. QUANTITATIVE AND QUALITATIVE DISCLOSURES ABOUT MARKET RISK 58 ITEM 12. DESCRIPTION OF SECURITIES OTHER THAN EQUITY SECURITIES 59
PART II 60 ITEM 13. DEFAULTS, DIVIDEND ARREARAGES AND DELINQUENCIES 60 ITEM 14. MATERIAL MODIFICATIONS TO THE RIGHTS OF SECURITY HOLDERS AND USE OF PROCEEDS 60 ITEM 15. CONTROLS AND PROCEDURES 60 ITEM 16A. AUDIT COMMITTEE FINANCIAL EXPERT 63 ITEM 16B. CODE OF ETHICS 63 ITEM 16C. PRINCIPAL ACCOUNTANT FEES AND SERVICES 63 ITEM 16D. EXEMPTIONS FROM THE LISTING STANDARDS FOR AUDIT COMMITTEES 63 ITEM 16E. PURCHASES OF EQUITY SECURITIES BY THE ISSUER AND AFFILIATED PURCHASERS 64 ITEM 16F. CHANGE IN REGISTRANT’S CERTIFYING ACCOUNTANT 64 ITEM 16G. CORPORATE GOVERNANCE 64
PART III 65 ITEM 17. FINANCIAL STATEMENTS 65 ITEM 18. FINANCIAL STATEMENTS 65 ITEM 19. EXHIBITS 65
i
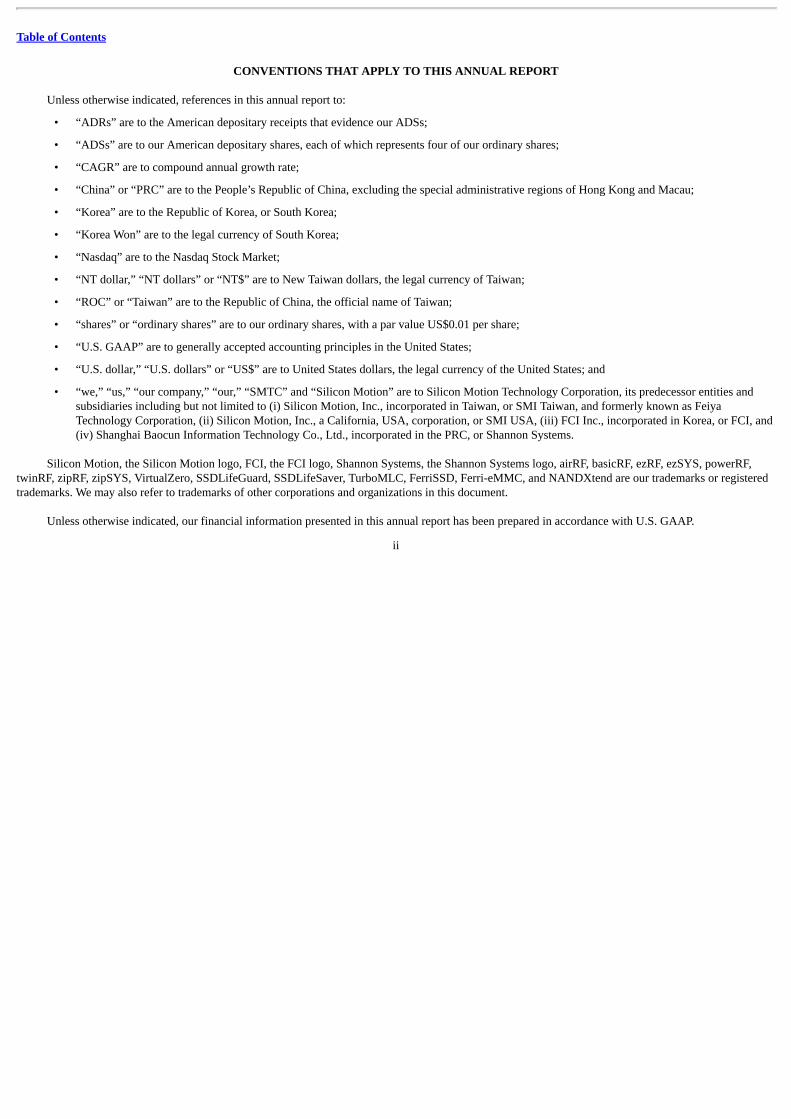
Table of Contents
CONVENTIONS THAT APPLY TO THIS ANNUAL REPORT
Unless otherwise indicated, references in this annual report to:
• “ADRs” are to the American depositary receipts that evidence our ADSs;
• “ADSs” are to our American depositary shares, each of which represents four of our ordinary shares;
• “CAGR” are to compound annual growth rate;
• “China” or “PRC” are to the People’s Republic of China, excluding the special administrative regions of Hong Kong and Macau;
• “Korea” are to the Republic of Korea, or South Korea;
• “Korea Won” are to the legal currency of South Korea;
• “Nasdaq” are to the Nasdaq Stock Market;
• “NT dollar,” “NT dollars” or “NT$” are to New Taiwan dollars, the legal currency of Taiwan;
• “ROC” or “Taiwan” are to the Republic of China, the official name of Taiwan;
• “shares” or “ordinary shares” are to our ordinary shares, with a par value US$0.01 per share;
• “U.S. GAAP” are to generally accepted accounting principles in the United States;
• “U.S. dollar,” “U.S. dollars” or “US$” are to United States dollars, the legal currency of the United States; and
• “we,” “us,” “our company,” “our,” “SMTC” and “Silicon Motion” are to Silicon Motion Technology Corporation, its predecessor entities andsubsidiaries including but not limited to (i) Silicon Motion, Inc., incorporated in Taiwan, or SMI Taiwan, and formerly known as FeiyaTechnology Corporation, (ii) Silicon Motion, Inc., a California, USA, corporation, or SMI USA, (iii) FCI Inc., incorporated in Korea, or FCI, and(iv) Shanghai Baocun Information Technology Co., Ltd., incorporated in the PRC, or Shannon Systems.
Silicon Motion, the Silicon Motion logo, FCI, the FCI logo, Shannon Systems, the Shannon Systems logo, airRF, basicRF, ezRF, ezSYS, powerRF,twinRF, zipRF, zipSYS, VirtualZero, SSDLifeGuard, SSDLifeSaver, TurboMLC, FerriSSD, Ferri-eMMC, and NANDXtend are our trademarks or registeredtrademarks. We may also refer to trademarks of other corporations and organizations in this document.
Unless otherwise indicated, our financial information presented in this annual report has been prepared in accordance with U.S. GAAP.
ii
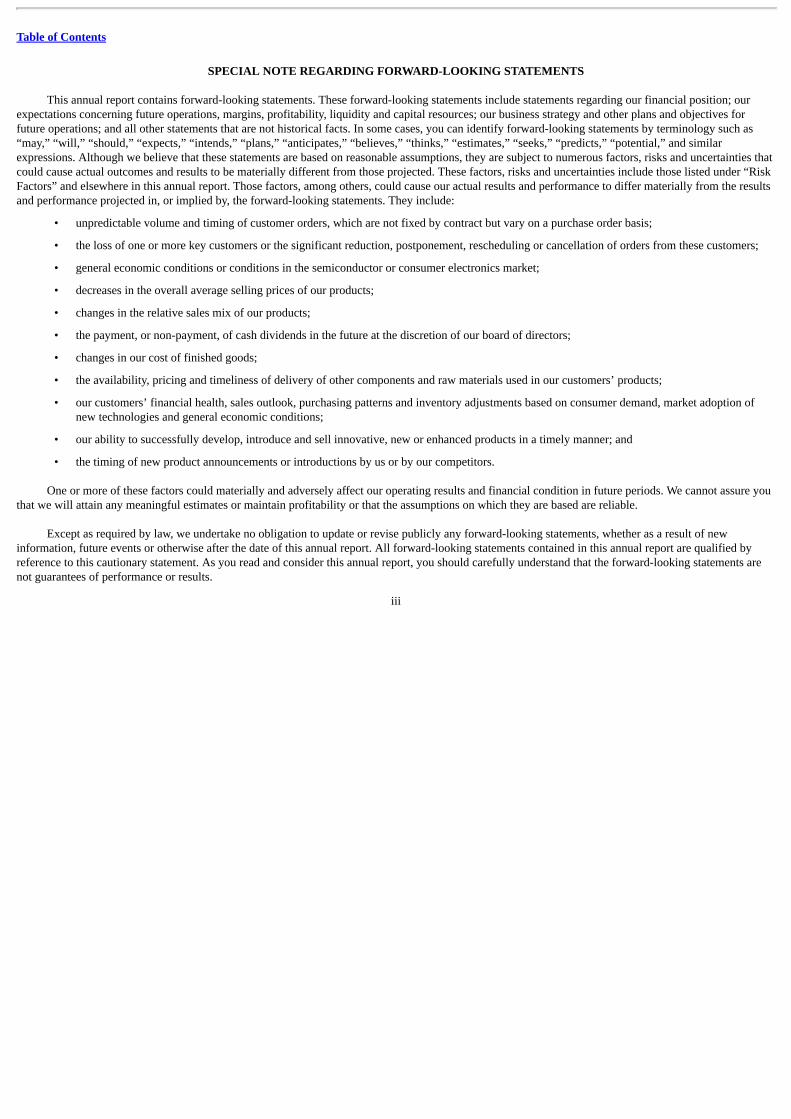
Table of Contents
SPECIAL NOTE REGARDING FORWARD-LOOKING STATEMENTS
This annual report contains forward-looking statements. These forward-looking statements include statements regarding our financial position; ourexpectations concerning future operations, margins, profitability, liquidity and capital resources; our business strategy and other plans and objectives forfuture operations; and all other statements that are not historical facts. In some cases, you can identify forward-looking statements by terminology such as“may,” “will,” “should,” “expects,” “intends,” “plans,” “anticipates,” “believes,” “thinks,” “estimates,” “seeks,” “predicts,” “potential,” and similarexpressions. Although we believe that these statements are based on reasonable assumptions, they are subject to numerous factors, risks and uncertainties thatcould cause actual outcomes and results to be materially different from those projected. These factors, risks and uncertainties include those listed under “RiskFactors” and elsewhere in this annual report. Those factors, among others, could cause our actual results and performance to differ materially from the resultsand performance projected in, or implied by, the forward-looking statements. They include:
• unpredictable volume and timing of customer orders, which are not fixed by contract but vary on a purchase order basis;
• the loss of one or more key customers or the significant reduction, postponement, rescheduling or cancellation of orders from these customers;
• general economic conditions or conditions in the semiconductor or consumer electronics market;
• decreases in the overall average selling prices of our products;
• changes in the relative sales mix of our products;
• the payment, or non-payment, of cash dividends in the future at the discretion of our board of directors;
• changes in our cost of finished goods;
• the availability, pricing and timeliness of delivery of other components and raw materials used in our customers’ products;
• our customers’ financial health, sales outlook, purchasing patterns and inventory adjustments based on consumer demand, market adoption ofnew technologies and general economic conditions;
• our ability to successfully develop, introduce and sell innovative, new or enhanced products in a timely manner; and
• the timing of new product announcements or introductions by us or by our competitors.
One or more of these factors could materially and adversely affect our operating results and financial condition in future periods. We cannot assure youthat we will attain any meaningful estimates or maintain profitability or that the assumptions on which they are based are reliable.
Except as required by law, we undertake no obligation to update or revise publicly any forward-looking statements, whether as a result of newinformation, future events or otherwise after the date of this annual report. All forward-looking statements contained in this annual report are qualified byreference to this cautionary statement. As you read and consider this annual report, you should carefully understand that the forward-looking statements arenot guarantees of performance or results.
iii
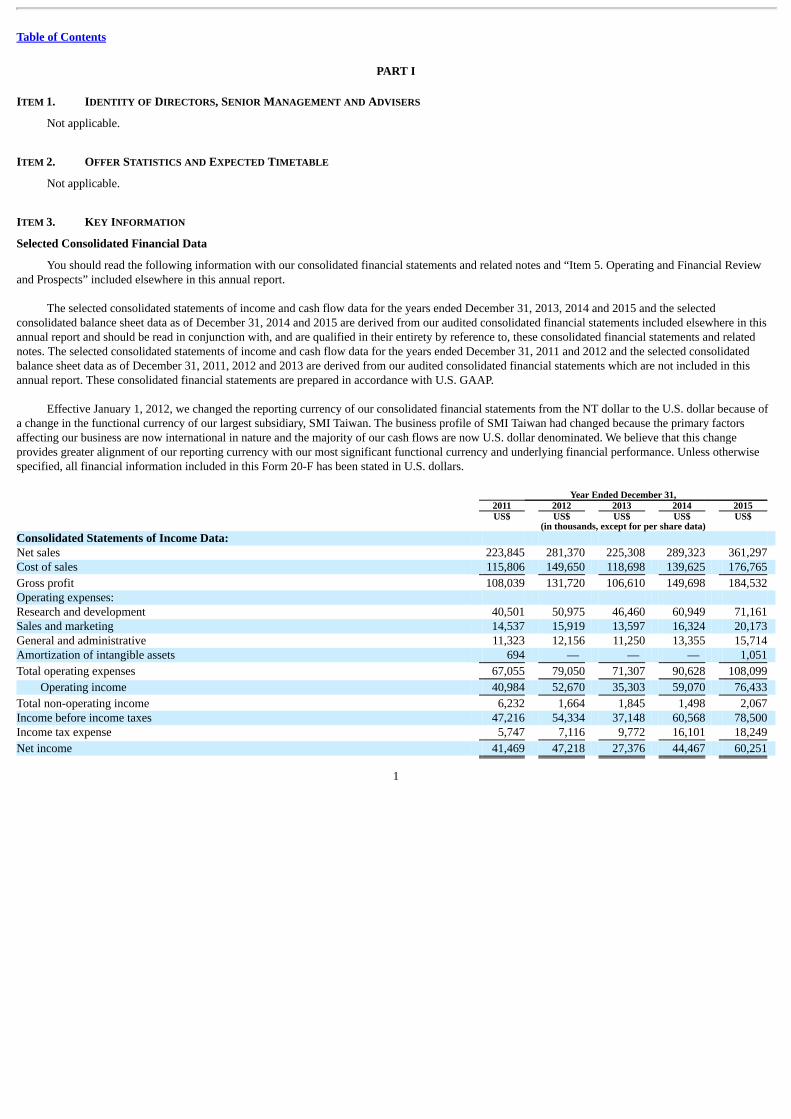
Table of Contents
PART I ITEM 1. IDENTITY OF DIRECTORS, SENIOR MANAGEMENT AND ADVISERS
Not applicable.
ITEM 2. OFFER STATISTICS AND EXPECTED TIMETABLE
Not applicable.
ITEM 3. KEY INFORMATION
Selected Consolidated Financial Data
You should read the following information with our consolidated financial statements and related notes and “Item 5. Operating and Financial Reviewand Prospects” included elsewhere in this annual report.
The selected consolidated statements of income and cash flow data for the years ended December 31, 2013, 2014 and 2015 and the selectedconsolidated balance sheet data as of December 31, 2014 and 2015 are derived from our audited consolidated financial statements included elsewhere in thisannual report and should be read in conjunction with, and are qualified in their entirety by reference to, these consolidated financial statements and relatednotes. The selected consolidated statements of income and cash flow data for the years ended December 31, 2011 and 2012 and the selected consolidatedbalance sheet data as of December 31, 2011, 2012 and 2013 are derived from our audited consolidated financial statements which are not included in thisannual report. These consolidated financial statements are prepared in accordance with U.S. GAAP.
Effective January 1, 2012, we changed the reporting currency of our consolidated financial statements from the NT dollar to the U.S. dollar because ofa change in the functional currency of our largest subsidiary, SMI Taiwan. The business profile of SMI Taiwan had changed because the primary factorsaffecting our business are now international in nature and the majority of our cash flows are now U.S. dollar denominated. We believe that this changeprovides greater alignment of our reporting currency with our most significant functional currency and underlying financial performance. Unless otherwisespecified, all financial information included in this Form 20-F has been stated in U.S. dollars. Year Ended December 31, 2011 2012 2013 2014 2015 US$ US$ US$ US$ US$ (in thousands, except for per share data) Consolidated Statements of Income Data: Net sales 223,845 281,370 225,308 289,323 361,297 Cost of sales 115,806 149,650 118,698 139,625 176,765
Gross profit 108,039 131,720 106,610 149,698 184,532 Operating expenses: Research and development 40,501 50,975 46,460 60,949 71,161 Sales and marketing 14,537 15,919 13,597 16,324 20,173 General and administrative 11,323 12,156 11,250 13,355 15,714 Amortization of intangible assets 694 — — — 1,051
Total operating expenses 67,055 79,050 71,307 90,628 108,099
Operating income 40,984 52,670 35,303 59,070 76,433
Total non-operating income 6,232 1,664 1,845 1,498 2,067 Income before income taxes 47,216 54,334 37,148 60,568 78,500 Income tax expense 5,747 7,116 9,772 16,101 18,249
Net income 41,469 47,218 27,376 44,467 60,251
1
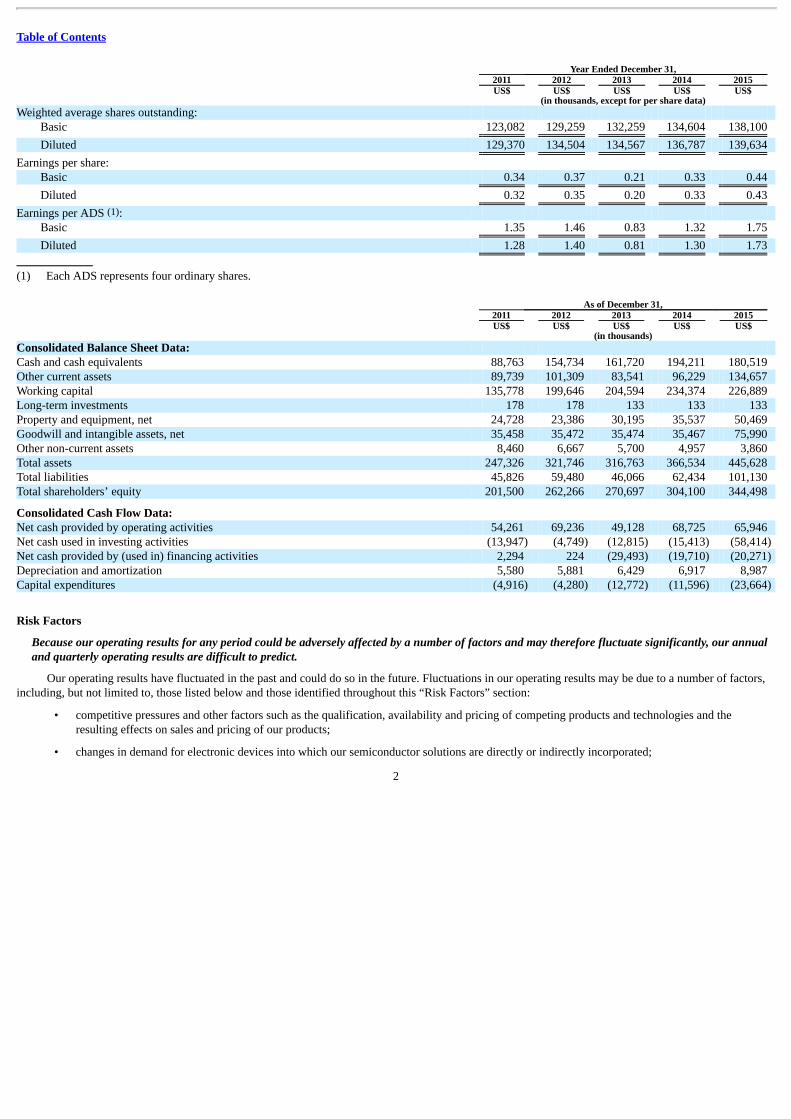
Table of Contents
Year Ended December 31, 2011 2012 2013 2014 2015 US$ US$ US$ US$ US$ (in thousands, except for per share data) Weighted average shares outstanding:
Basic 123,082 129,259 132,259 134,604 138,100
Diluted 129,370 134,504 134,567 136,787 139,634
Earnings per share: Basic 0.34 0.37 0.21 0.33 0.44
Diluted 0.32 0.35 0.20 0.33 0.43
Earnings per ADS (1): Basic 1.35 1.46 0.83 1.32 1.75
Diluted 1.28 1.40 0.81 1.30 1.73
(1) Each ADS represents four ordinary shares. As of December 31, 2011 2012 2013 2014 2015 US$ US$ US$ US$ US$ (in thousands) Consolidated Balance Sheet Data: Cash and cash equivalents 88,763 154,734 161,720 194,211 180,519 Other current assets 89,739 101,309 83,541 96,229 134,657 Working capital 135,778 199,646 204,594 234,374 226,889 Long-term investments 178 178 133 133 133 Property and equipment, net 24,728 23,386 30,195 35,537 50,469 Goodwill and intangible assets, net 35,458 35,472 35,474 35,467 75,990 Other non-current assets 8,460 6,667 5,700 4,957 3,860 Total assets 247,326 321,746 316,763 366,534 445,628 Total liabilities 45,826 59,480 46,066 62,434 101,130 Total shareholders’ equity 201,500 262,266 270,697 304,100 344,498
Consolidated Cash Flow Data: Net cash provided by operating activities 54,261 69,236 49,128 68,725 65,946 Net cash used in investing activities (13,947) (4,749) (12,815) (15,413) (58,414) Net cash provided by (used in) financing activities 2,294 224 (29,493) (19,710) (20,271) Depreciation and amortization 5,580 5,881 6,429 6,917 8,987 Capital expenditures (4,916) (4,280) (12,772) (11,596) (23,664)
Risk Factors
Because our operating results for any period could be adversely affected by a number of factors and may therefore fluctuate significantly, our annualand quarterly operating results are difficult to predict.
Our operating results have fluctuated in the past and could do so in the future. Fluctuations in our operating results may be due to a number of factors,including, but not limited to, those listed below and those identified throughout this “Risk Factors” section:
• competitive pressures and other factors such as the qualification, availability and pricing of competing products and technologies and theresulting effects on sales and pricing of our products;
• changes in demand for electronic devices into which our semiconductor solutions are directly or indirectly incorporated;
2
Table of Contents
• our customers’ sales outlook, purchasing patterns and inventory adjustments based on market demand, adoption of new technologies and generaleconomic conditions;
• the loss of one or more key customers or the significant reduction, timing or cancellation of orders from these customers;
• seasonality or cyclical fluctuations in our markets;
• our ability to develop or acquire, introduce, market and transition to volume production new or enhanced products and technologies in a cost-effective and timely manner;
• changes in supply and availability of flash memory components used in our customer’s products;
• changes in our product mix or customer mix and their effect on our gross margin;
• changes in foreign currency exchange rates;
• the availability and pricing of third party semiconductor foundry services;
• unpredictable volume and timing of customer orders, which are not fixed by contract but vary on an order-to-order basis;
• deferrals or reductions of customer orders in anticipation of new products or product enhancements from us or our competitors or other providersof integrated circuits, or ICs;
• our ability to timely and accurately predict market requirements and evolving industry trends and to identify and capitalize upon opportunities innew markets; and
• the overall cyclicality of, and changing economic and market conditions in, the semiconductor industry.
These and other factors make it difficult for us to assess our future performance. Our sales and operating results are difficult to predict and have in thepast, and will likely in the future, fluctuate from period to period. We could fail to achieve the operating targets that we have announced, such as revenuegrowth, gross margin, and operating expense. In addition, our operating results in the future may be below the expectations of securities analysts or investors,which would likely cause the market price of our ADSs to decline. Any variations in our period-to-period performance may also cause the market price of ourADSs to fluctuate. Accordingly, you should not rely on the results of any prior periods as a reliable indicator of our future operating performance.
Our operating results and stock price may be adversely affected by worldwide economic uncertainties including political and social instability andindustry-specific conditions in the markets we operate.
Disruptions or uncertainties in the economy, including any political and social instability may lead consumers and business to postpone spending. Thisin turn may cause our customers to cancel, decrease or delay their existing and future orders with us. Furthermore, we operate primarily in the semiconductorindustry, which is cyclical in nature and subject to evolving industry standards. In the past, the semiconductor industry has experienced significant downturnscharacterized by decreases in product demand, excess customer inventories and accelerated erosion of prices. The semiconductor industry also periodicallyexperiences increased demand and production capacity constraints, which may affect our ability to deliver products to our customers. Economic volatility cancause extreme difficulties for our customers and vendors in accurately forecasting and planning future business activities. This unpredictability could causeour customers to reduce spending on our products and services, which would delay and lengthen sales cycles. Furthermore, during challenging economictimes our customers and vendors may face challenges in gaining timely access to sufficient credit, which could impact their ability to make timely paymentsto us. The accurate forecasting and planning for our operations heavily rely on these worldwide economic and industry-specific conditions, and the volatilityand uncertainties associated with these factors may adversely affect our results of operation in a material manner.
3
Table of Contents
Since we have limited visibility as to the sales volume by our customers of devices using our products, our ability to accurately forecast future demandfor and sales of our products is limited.
The majority of our products are integrated into devices that are sold directly or indirectly into consumer electronics markets which are difficult for usand our customers to accurately forecast as consumer electronics demand is subject to significant seasonality, with higher net sales generally in the secondhalf of each year, when our customers place orders to meet increased demand during year-end holiday seasons, and other fluctuations. Also, as a significantportion of our quarterly sales are from orders received and fulfilled in that quarter, our visibility as to expected orders from our customers in subsequentperiods and for any extended period of time is limited. Additionally, we depend upon our customers’ procurement forecasts in order to forecast demand forour products, and our customers’ procurement forecast may be subject to change. Our failure to accurately forecast demand for our products may result in lostsales or excess inventory and associated reserves or write-downs for our operations. Any of the aforementioned factors could affect sales of our products andthereby harm our business, financial condition and operating results.
If demand for our products declines in the major end-markets that we serve, our sales, net revenue and earnings will decrease.
Demand for our products is affected by a number of factors, including the general demand for the products in the end-markets that we serve and priceattractiveness of the devices incorporating our products that our customers and vendors offer to end-markets. A significant amount of our sales revenue isderived from customers who use our controllers in expandable and embedded solid state storage solutions used in consumer electronics, such as smartphones,tablets, digital cameras, and notebook and desktop PCs. Any significant decrease in the demand for these devices in the end-market may decrease the demandfor our semiconductor solutions and may result in a significant decrease in our revenues and earnings. Consumer electronic devices that use our componentsrapidly change as product capabilities are upgraded or new classes of products are introduced, and these changes may result in a significant reduction indemand for our products. We cannot give any assurance that there will not be any downturn in the future or that any future downturn will not affect our resultsof operations. Any significant decrease in demand for end-user applications of semiconductors will negatively affect our sales, net revenue and earnings.
We may make acquisitions that are dilutive to existing shareholders, resulting in unanticipated one-time charges or that may otherwise adversely affectour results of operations, and which may result in difficulties in assimilating and integrating the operations, personnel, technologies, products andinformation systems of acquired companies or businesses.
We continually evaluate and explore strategic opportunities as they arise, including business combinations and capital investments. If we issue equitysecurities in connection with an acquisition, the issuance may be dilutive to our existing shareholders. Alternatively, acquisitions made entirely or partially forcash would reduce our cash reserves.
Mergers and acquisitions of high-technology companies are inherently risky and subject to many factors outside of our control and no assurance can begiven that our previous or future acquisitions will be successful and will not materially adversely affect our business, operating results, or financial condition.Failure to manage and successfully integrate acquisitions could materially harm our business and operating results. Even when an acquired company hasalready developed and marketed products, there can be no assurance that such products will be successful after our acquisition, will not cannibalize sales ofour existing products, that product enhancements will be made in a timely fashion or that pre-acquisition due diligence will have identified all possible issues.
In April 2007 we completed the acquisition of FCI, a privately-held Korea-based fabless IC company focused on mobile TV and wirelesscommunications radio frequency, or RF, applications; in November 2007, we
4
Table of Contents
acquired select parts of the Centronix mobile TV business of Korea Information Engineering Services Co., Ltd. (“Centronix”) and in October 2011 weacquired select assets of BTL Systems, Inc. (“BTL”). The products from our FCI, Centronix and BTL acquisitions are for the mobile communications market.In the fourth quarter of 2009, we determined that goodwill and certain long-lived assets relating to these products were impaired and recorded an impairmentcharge of US$37.4 million. In July 2015 we completed the acquisition of Shannon Systems, a privately-held China-based supplier of enterprise-class PCIeSSD solutions to China’s internet and other industries.
See “We are exposed to potential impairment charges on intangible assets relating to recent acquisitions and on investments if business conditionsdeteriorate” below. Risks arising from these or other future acquisitions could include among other things:
• our ability to accurately assess the business and prospects of an acquisition or the anticipated benefits of an acquisition;
• delays in or failure to complete the development and application of the acquired technologies or products;
• timing of the rollout and adoption of new applications and technology standards;
• our ability to successfully integrate acquired technologies, operations and personnel;
• failure to achieve projected results of an acquisition or inability to realize the anticipated benefits of an acquisition;
• disruption of our ongoing business;
• diversion of management and employees’ attention from other business activities;
• risks associated with entering into a geographic region or business market in which we have little or no prior experience and specificallymanaging personnel in these regions;
• difficulties in establishing and maintaining uniform standards, controls, policies and procedures;
• deficiencies in the internal control of any acquired company resulting in a material weakness in our overall internal control;
• our ability to recover costs of the acquisition or investment;
• amortization expenses and large and immediate write-offs;
• impairment charges related to goodwill or other assets;
• negative impact on our relationships with customers, vendors, suppliers or contractors;
• inability to retain key employees of an acquired business; and
• potentially dilutive issuance of equity securities.
In addition, future acquisitions could result in the incurrence of debt or contingent liabilities, adverse tax consequences, deferred compensation charges,dilution to future earnings, and large fees for professional advisor services, any of which could negatively impact our financial conditions or results ofoperations and could cause our stock price to decline. We may be unable to identify suitable acquisition candidates or investment opportunities orconsummate any such transactions on terms and conditions that are acceptable to us, if at all.
We depend on a small number of customers for a significant portion of our revenues and a loss of some of these customers would result in the loss of asignificant portion of our revenues.
We derived a substantial portion of our revenue from sales to a relatively small number of customers. As a result, the loss of any significant customercould materially and adversely affect our financial condition and results of operations. Sales to our five largest customers represented approximately 65%,64% and 54% of our
5
Table of Contents
net revenue in 2013, 2014 and 2015, respectively. Sales to two customers in 2013 and 2014, and one customer in 2015 accounted for 10% or more of our netrevenue, representing 46%, 47% and 30% of our net revenue in 2013, 2014 and 2015, respectively. In 2013 and 2014, the significant customers wereSamsung and SK Hynix and in 2015, SK Hynix. The identities of our largest customers and their respective contributions to our net revenue have varied andwill likely continue to vary from period to period.
We expect that we will continue to depend on a relatively limited number of customers for a substantial portion of our net sales and our ability tomaintain good relationships with these customers will be important to the ongoing success of our business. We cannot assure you that the revenue generatedfrom these customers, individually or in the aggregate, will reach or exceed historical levels in any future period. Our failure to meet the demands of thesecustomers could lead to a cancellation or reduction of business from these customers. In addition, loss, cancellation or reduction of business from, significantchanges in scheduled deliveries to, or decreases in the prices of products sold to any of these customers could significantly reduce our revenues and adverselyaffect our financial condition and operating results. Moreover, any difficulty in collecting outstanding amounts due from our customers particularly customerswho place large orders, would harm our financial performance. In addition, if our relationships with our largest customers are disrupted for any reason, itcould have a significant impact on our business.
If the semiconductor industry suffers a shortage of flash memory, which is a key component in many of our customers’ end products, our revenuescould be adversely affected.
During many periods in past years, some of our customers have indicated that they were unable to acquire enough NAND flash memory to meet all ofthe anticipated demand for their products. Several manufacturers of flash memory have increased or are planning to increase manufacturing capacity for flashmemory. However, we cannot assure you that there will continue to be enough additional capacity to satisfy worldwide demand for flash memory. Becauseflash memory is a key component in many of the products manufactured by our customers, if any shortage in the supply of flash memory occurs and is notremedied, our customers may not be able to purchase enough flash memory to manufacture their products and may therefore purchase fewer controllers fromus than they would have otherwise purchased. Our ability to increase revenues and grow our profits could be materially and adversely affected as a result ofany shortage or decrease in the supply of flash memory.
We operate in a rapidly changing industry where a significant majority of our sales are controllers used in NAND flash memory storage devices, andour failure to anticipate and respond quickly to changing industry trends relating to technology, standards, and consumer demand could adverselyaffect our growth and profitability.
We operate in an intensely competitive industry that experiences rapid technological developments, changes in industry standards, changes in customerrequirements, and frequent new product introductions and improvements. If we are unable to respond quickly and successfully to these developments, wemay lose our competitive position, and our products or technologies may become uncompetitive. To compete successfully, we must maintain a successfulR&D effort, develop new products and production processes, and improve our existing products and processes at the same pace or ahead of our competitors.Many types of events could have a variety of negative effects on our overall competitive position and our financial results, such as reducing our revenue,increasing our costs, lowering our gross margin percentage, lowering our operating profitability and requiring us to recognize impairments on our assets. Wemay not be able to develop and market new products successfully, new markets at which our products target may not grow as expected, the products we investin and develop may not be well received by customers, and products developed and new technologies offered by others may affect demand for our products.
Currently, a significant majority of our sales are controllers used in NAND flash memory storage devices. If new technologies for storing digital mediaare developed that compete with flash memory technology or render it obsolete and if we are not able to shift our product offerings accordingly, demand forour products would likely decline and our business would be materially and adversely affected.
6
Table of Contents
In addition, we may not have sufficient management resources to manage, R&D capabilities to address, and financial resources to fund all of therequired research to develop future innovations and meet changing industry standards. Moreover, even if we have adequate management resources, R&Dcapabilities, and financial resources, our future innovations may be outpaced by competing innovations. As a result, we may lose customers and significantsales, and our business and operating results may be materially and adversely affected.
We may be unsuccessful in developing and selling new products or in penetrating new markets required to maintain our competitiveness or expandour business.
We expect that a high percentage of our future sales will come from sales of new products. We sell products in markets that are characterized by rapidtechnological change, evolving industry standards, frequent new product introductions and products with short life cycles. The markets for some of theseproducts are extremely competitive and may entail technologies that are new, immature and/or unpredictable to us. These markets and our endeavors to meetthe markets may not develop into profitable opportunities and we have in the past invested substantial resources in emerging technologies that did not achievethe market acceptance and generate returns that we had expected. Recently, we have made significant investments in embedded storage controllertechnologies, especially those relating to SSD. Failure to grow our embedded storage products or to recoup on our investments in these and other technologiescould materially adversely affect our results of operations and future business outlook. As a result, it is difficult to anticipate our future revenue streams from,or provide assurances on the success and the sustainability of, our new products.
The average selling prices of our mobile storage products have historically decreased rapidly and will likely do so in the future, which could harm ourrevenue and profitability.
The products we develop and sell, especially those for expandable and embedded storage solutions, are used for high volume applications and many ofthem are subject to rapid declines in average selling prices. Our average selling prices have historically decreased significantly, and we believe that it ispossible they may also fall in the future. We may experience period-to-period fluctuations in future operating results if our average selling prices decline. Wemay be forced to reduce the average unit price of our products in response to new product introductions by our competitors, competitive pricing pressures andother factors. The consumer electronics market is extremely cost sensitive, which may result in rapidly declining average selling prices of electronic devicesand components, such as those made by us, used in devices and create downward pressure on our average selling prices and operating results. To maintainacceptable operating results, we will need to develop and introduce new products and product enhancements on a timely basis and continue to reduce ourcosts. We have also introduced products for the embedded storage market that typically experiences less intense competition. If we are unable to offset anyreductions in our average selling prices by increasing our sales volumes or reducing corresponding production costs, or if we fail to gain more successes withembedded products or if we fail to develop and introduce new products and enhancements on a timely basis, our sales and operating results will be materiallyand adversely affected.
If we are unable to accurately predict our future sales and to appropriately budget for our expenses, our results of operations could suffer.
The rapidly changing nature of the global economy and the markets in which we sell our products limits our ability to accurately forecast quarterly andannual sales. Because many of our expenses are fixed in the short term or are incurred in advance of anticipated sales, we may not be able to decrease ourexpenses in a timely manner to offset any shortfall of sales, or expand our R&D and other operating infrastructure in a timely manner to capture anticipatedbusiness opportunities. If we expand our business operations and demand for our products does not increase as we may have projected, our operating resultscould be affected by our higher operating expense levels. Conversely, if we maintain or reduce our business operations and related expenses in accordancewith our projections and demand for our products increases more than expected, our operating results could be affected by lost business opportunity, lesscompetitive economies of scale, and damaged relationships with our customers.
7
Table of Contents
A failure to accurately forecast customer demand may result in excess or insufficient inventory, which may increase our operating costs and harm ourbusiness.
To ensure the availability of our products for our customers, in some cases we cause our manufacturers to begin manufacturing our products based onforecasts provided by these customers in advance of receiving purchase orders. However, these forecasts do not represent binding purchase commitments, andwe do not recognize revenue from these products until they are shipped to the customer. As a result, we incur inventory and manufacturing costs in advanceof anticipated revenue. Because demand for our products may not materialize, manufacturing based on forecasts subjects us to risks of high inventorycarrying costs and increased obsolescence and may increase our costs. If we overestimate customer demand for our products or if purchase orders arecancelled or shipments delayed, we may end up with excess inventory that we cannot sell, which could have a material and adverse effect on our financialresults. Conversely, if we underestimate demand, we may not have sufficient product inventory and may lose market share and damage customerrelationships, which could also harm our business.
The loss of any of our key personnel or the failure to attract or retain specialized technical and management personnel could impair our ability togrow our business.
We rely heavily on the services of our key employees, including Wallace C. Kou, our President and Chief Executive Officer. In addition, our engineersand other key technical personnel are a significant asset and are the source of our technological and product innovations. We believe our future success willdepend upon our ability to retain these key employees and our ability to attract and retain other skilled managerial, engineering, technical and sales andmarketing personnel. The competition for such personnel, particularly technical personnel, is intense in our industry. We may not be successful in attractingand retaining sufficient numbers of technical personnel to support our anticipated growth. These technical personnel are required to design and developintegrated circuits, including firmware, and to introduce product enhancements for use in future applications. Despite the incentives we provide, our currentemployees may not continue to work for us, and if additional personnel were required for our operations, we may not be able to obtain the services ofadditional personnel necessary for our growth. In addition, we do not maintain “key person” life insurance for any of our senior management or other keyemployees. The loss of any of our key employees or our inability to attract or retain qualified personnel, including engineers, could delay the developmentand introduction of, and have an adverse effect on our ability to sell, our products as well as have an adverse effect on our overall growth. In addition, if anyother members of our senior management or any of our other key personnel join a competitor or form a competing company, we may not be able to replacethem easily and we may lose customers, business partners, key professionals and staff members. Substantially all of our senior executives and key personnelhave entered into confidentiality and non-disclosure agreements. In the event of a dispute between any of our senior executives or key personnel and ouroperating companies in Taiwan, China or Korea, we cannot assure you the extent, if any, to which these provisions may be enforceable in Taiwan, China, orKorea due to the constantly evolving nature of the Taiwanese, Chinese, and Korean legal systems.
We may not be able to deliver our products on a timely basis if our relationships with our suppliers, our semiconductor foundries or our assembly andtest subcontractors are disrupted or terminated.
We do not own or operate semiconductor fabrication facilities. Instead, we rely on third parties to manufacture our semiconductors. Two outsidefoundries, Taiwan Semiconductor Manufacturing Company (“TSMC”) and Semiconductor Manufacturing International Corporation (“SMIC”), with fabs inTaiwan, Singapore, and China currently manufacture the majority of our semiconductors. As a result, we face several significant risks, including higher waferprices, availability of wafers and other raw materials, lack of manufacturing capacity, quality assurance, manufacturing yields and production costs, limitedcontrol over delivery schedules and product quality, increased exposure to potential misappropriation of our intellectual property, labor shortages or strikesand actions taken by third party contractors that breach our agreements.
8

Table of Contents
The ability of each foundry to provide us with semiconductors is limited by its available capacity and access to wafers. We do not have long-termagreements with any of these foundries and we place orders on a purchase order basis. We place our orders based on our customers’ purchase orders and salesforecasts. However, the foundries can allocate capacity to the production of the products of their other customers and reduce deliveries to us on short notice orincrease the price they charge us. It is possible that other foundry customers that are larger and better financed than we are, or have long-term agreements withthese foundries, may induce these foundries to reallocate capacity to them. Any reallocation could impair our ability to secure manufacturing capacity that weneed for our products. In addition, interruptions to the wafer manufacturing processes caused by a natural disaster or human error could result in partial orcomplete disruption in supply until manufacturing is re-started or we are able to shift manufacturing to another fabrication facility. It may not be possible toobtain sufficient capacity or comparable production costs at another foundry. Migrating our design methodology to a new third-party foundry could involveincreased costs, resources and development time comparable to a new product development effort. Any reduction in the supply of semiconductors for ourproducts could significantly delay our ability to ship our products and potentially have negative effects on our relationships with existing customers and ourresults of operations. In addition, if our subcontractors terminate their relationships with us, we would be required to qualify new subcontractors, which couldtake at least six months, resulting in unforeseen operating problems, and our operating results may be materially and adversely affected.
If the foundries that provide us with the products for our operations do not achieve satisfactory yield or quality, or if the assembly and testing servicesfail us in the quality of their output, then our revenue, operating results and customer relationships will be affected.
The manufacture of semiconductors is a highly complex process. Minor deviations in the manufacturing process can cause substantial decreases inyield. In some situations, such deviations may cause production to be suspended. The foundries that manufacture our semiconductors have from time to timeexperienced lower than anticipated manufacturing yields, including yields for our semiconductors, typically during the production of new products orarchitectures or during the installation and start-up and ramp-up of new process technologies or equipment. If the foundries that manufacture oursemiconductors do not achieve planned yields, our product costs could increase and product availability would decrease.
After the wafer fabrication processes, our wafers are shipped to our assembly and testing subcontractors. We have a system to maximize consistentproduct quality, reliability and yield that involves our quality assurance team working closely with subcontractors in the various phases of the assembly andtesting processes. Our supplier quality management includes procedures such as processes to pre-qualify our manufacturing suppliers and subcontractors.However, despite our efforts to strengthen supplier quality management, if our foundries fail to deliver fabricated silicon wafers of satisfactory quality in thevolume and at the price we require, or if our assembly and testing subcontractors fail to efficiently and accurately assemble and test our products, we will beunable to meet our customers’ demand for our products or to sell those products at an acceptable profit margin, which would have a material and adverseeffect on our sales and margins and damage our customer relationships.
Failure to protect our proprietary technologies or maintain the right to certain technologies may negatively affect our ability to compete.
We believe that the protection of our intellectual property rights is and will continue to be important to the success of our business. We rely on acombination of patent, copyright, trademark and trade secret laws and restrictions on disclosure to protect our intellectual property rights. We also enter intoconfidentiality or license agreements with our employees, business partners and other third parties, and have implemented procedures to control access to anddistribution of our documentation and other proprietary information. Despite these efforts, we cannot assure you that these measures will provide meaningfulprotection of our intellectual property rights. Further, these agreements do not prevent others from independently developing technologies that are equivalentto or superior to our technology. In addition, unauthorized parties may attempt to copy or otherwise obtain and use our proprietary technology. Monitoringunauthorized use of our technology is difficult and we cannot be
9
Table of Contents
certain that the steps we have taken will prevent unauthorized use of our technology, particularly in foreign countries such as Taiwan, Korea, and China wherethe laws may not protect our proprietary rights as fully as do the laws of the United States. In addition, if the foundries that manufacture our semiconductorslose control of our intellectual property, it could be more difficult for us to take remedial measures because our foundries are located in countries that do nothave the same protection for intellectual property that is provided in the United States. Also, some of our contracts, including license agreements, are subjectto termination upon certain types of change-of-control transactions.
As of March 31, 2016, we had 692 patents and have 774 pending applications worldwide. We cannot be certain that patents will be issued as a result ofour pending applications nor can we be certain that any issued patents would protect or benefit us or give us adequate protection from competing products.For example, issued patents may be circumvented or challenged and declared invalid or unenforceable or provide only limited protection for our technologies.We also cannot be certain that others will not design around our patented technology, independently develop our unpatented proprietary technology ordevelop effective competing technologies on their own.
Failure to successfully defend against intellectual property lawsuits brought against us may adversely affect our business.
Companies in and related to the semiconductor industry often aggressively protect and pursue their intellectual property rights. From time to time, wehave received, and may continue to receive, notices that claim we have infringed upon, misappropriated or misused other parties’ proprietary rights.Moreover, in the past we have been engaged in litigation with parties that claim that we infringed their patents or misappropriated or misused their tradesecrets. In addition, we or our customers may be sued by other parties that claim that our products have infringed their patents or misappropriated or misusedtheir trade secrets, or that may seek to invalidate one or more of our patents. An adverse determination in any of these types of disputes could prevent us frommanufacturing or selling some of our products, increase our costs of revenue and expose us to significant liability. Any of these claims may materially andadversely affect our business, financial condition and results of operations. For example, in a patent or trade secret action, a court could issue a preliminary orpermanent injunction that would require us or our customer(s) to withdraw or recall certain products from the market or redesign certain products offered forsales or under development. We may also be liable for damages for past infringement and royalties for future use of certain technologies. See “LegalProceedings” below.
In addition, any litigation to defend ourselves against claims that we have infringed the intellectual property rights of others, could, regardless of theultimate outcome, materially and adversely affect our operating results by requiring us to incur significant legal expenses and diverting the resources of thecompany and the attention of our management team.
Because the markets in which we compete are highly competitive and many of our competitors have greater resources than we have, we cannot becertain that our products will compete favorably in the marketplace.
We face competition from a large number of competitors in each of our target markets. Our competitors in our mobile storage market include AlcorMicro, ASolid, Marvell, and Phison. In the mobile communications market, the companies with whom we compete include Raontech and Socionext. We alsoface competition from our customers’ internal products and expect to face increased competition in the future from our current and potential competitors. Inaddition, some of our customers have developed products and technologies that could replace their need for our products or otherwise reduce their demand forour products.
Some of our current and potential competitors have longer operating histories, greater name recognition, access to larger customer bases andsignificantly greater financial, sales and marketing, manufacturing, distribution, technical and other resources than we have. As a result, they may be able torespond more quickly to changing customer demands or to devote greater resources to the development, promotion and sales of their
10
Table of Contents
products than we can. Our current and potential competitors may develop and introduce new products that will be priced lower, provide superior performanceor achieve greater market acceptance than our products. In addition, in the event of a manufacturing capacity shortage, these competitors may be able toobtain capacity when we are unable to do so.
The consumer electronics market, which is the principal end market for our products, has historically been subject to intense price competition. In manycases, low-cost, high-volume semiconductor component producers have entered markets and driven down profit margins. If a low-cost, high-volume producershould develop products that compete with our products, our sales and profit margins would suffer.
Our products must meet exacting specifications and undetected defects and failures may occur, which may cause customers to return or stop buyingour products and may expose us to product liability risk and risks of indemnification against defects in our products.
Our products are complex and may contain undetected hardware or software defects or failures, especially when first introduced or when new versionsare released. These errors could cause us to incur significant re-engineering costs, divert the attention of our engineering personnel from product developmentefforts and materially affect our customer relations and business reputation. If we deliver products with errors or defects, our credibility and the marketacceptance and sales of our products could be harmed. Defects could also lead to liability for defective products as a result of lawsuits against us or againstour customers. We have agreed to indemnify some of our customers in some circumstances against liability from defects in our products. Asuccessful warranty or product liability claim could require us to make significant payments.
Our intellectual property indemnification practices may adversely impact our business.
We may be required to indemnify our customers and our third-party intellectual property providers for certain costs and damages of intellectualproperty infringement in circumstances where our products are a factor in creating infringement exposure. In the contracts under which we sell semiconductorproducts, we may have agreed to indemnify our customers against losses arising out of claims of unauthorized use of intellectual property. In some of ourlicensing agreements, we have agreed to indemnify the licensee against losses arising out of or related to our conduct or services. We cannot assure you thatclaims for indemnification will not be made or that these claims would not have a material and adverse effect on our business, operating results or financialcondition.
We are exposed to potential impairment charges on intangible assets relating to recent acquisitions and on investments if business conditionsdeteriorate.
We are required to perform testing for impairment losses relating to long-lived assets used in operations when indicators of impairment, such asreductions in demand or significant economic slowdowns in our business, are present. Through our acquisitions of FCI and other assets, we acquired coretechnology, customer relationships, goodwill and other intangible assets. The carry value of goodwill relating to these acquisitions must be assessed forimpairment at least on an annual basis. In November 2009, we recorded US$6.6 million of impairment charges relating to our long-lived assets anddetermined that our goodwill balance was impaired, and wrote down the goodwill balance by US$30.8 million. In July 2015, we recorded US$33.2 million ofgoodwill and US$ 8.4 million of developed technology and in-process research and development from the acquisition of Shannon Systems. As ofDecember 31, 2015, we had goodwill associated with our acquisitions of US$68.7 million and intangible assets of US$ 7.3 million. Although we recorded animpairment on goodwill and other long-lived assets in 2009, we cannot be certain that these assets will not be subject to further write-downs in future periodsand may record further impairment charges if sales of our specialty RF ICs and enterprise SSDs do not grow as expected.
We have not made any passive investments in private companies since February 2007. If the companies in which we have invested in are unable toexecute their plans and succeed in their respective markets, we may not
11
Table of Contents
benefit from such investments, and we could potentially lose the amounts we invested. We evaluate our investments on a regular basis to determine ifimpairments have occurred and have recorded impairment charges in past years. These and future impairment charges could have a material and adverseimpact on our operating results. In 2013, 2014 and 2015, there were no impairments recorded.
Any failure to achieve and maintain effective internal controls could have a material adverse effect on our business, results of operations and themarket price of our ADSs.
We are subject to reporting obligations under securities laws of the United States. The Securities and Exchange Commission, or the SEC, as required bySection 404 of the Sarbanes-Oxley Act of 2002, or the Sarbanes-Oxley Act, adopted rules requiring every public company to include in its annual reportmanagement’s assessment of the effectiveness of the company’s internal controls over financial reporting. In addition, an independent registered publicaccounting firm must attest to and report on the effectiveness of the company’s internal controls over financial reporting.
Our management and independent registered public accounting firm have concluded that our internal controls as of December 31, 2015 are effective,excluding the internal control over financial reporting of Shannon Systems, because Shannon Systems was acquired on July 1, 2015 and whose financialstatements constitute 6.20% and 5.45% of net and total assets, respectively, 2.50% of net sales, and 0.70% of net income of the consolidated financialstatement amounts as of and for the year ended December 31, 2015. However, we cannot assure you that in the future we or our independent registered publicaccounting firm will not identify material weakness during the audit process or for other reasons. In addition, because of the inherent limitations of internalcontrol over financial reporting, including the possibility of collusion or improper management override of controls, material misstatements due to error orfraud may not be prevented or detected on a timely basis. As a result, if we fail to maintain effective internal controls over financial reporting or should we beunable to prevent or detect material misstatements due to error or fraud on a timely basis, investors could lose confidence in the reliability of our financialstatements, which in turn could harm our business and results of operations, negatively impact the market price of our ADSs and harm our reputation.
Laws and regulations to which we are subject, as well as customer requirements in the area of environmental protection and social responsibility,could impose substantial costs on us and may adversely affect our business.
We are subject to various state, federal and international laws and regulations governing the environment, including restricting the presence of certainsubstances in electronic products. In addition, we are also subject to various industry requirements restricting the presence of certain substances in electronicproducts. Although our management systems are designed to maintain compliance, we cannot assure you that we have been or will be at all times in completecompliance with such laws and regulations. If we violate or fail to comply with any of them, a range of consequences could result, including fines,import/export restrictions, sales limitations, criminal and civil liabilities or other sanctions.
Recently there has been increased focus on environmental protection and social responsibility initiatives. We may be required or choose to implementvarious standards or processes due to the adoption of rules or regulations that result from these initiatives, such as the recently adopted United States rules onthe disclosure of the use of “conflict minerals.” Our customers may also require us to implement environmental or social responsibility procedures orstandards before they will continue to do business with us or order new products from us. Our adoption of these procedures or standards could be costly, andour failure to adopt these standards or procedures could result in the loss of business, fines or other costs.
12
Table of Contents
Our stock price has been, and may continue to be, volatile, which could result in investors losing all or part of their investments.
Since we completed our initial public offering in June 2005, the market price of our ADSs has been and likely will continue to be highly volatile andcould be subject to wide fluctuations in response to numerous factors, including the following:
• actual or anticipated variations in our quarterly operating results or those of our competitors, customers, or NAND flash vendors;
• actual or anticipated changes in NAND flash supply-demand dynamics;
• actual or anticipated changes in our market share or the market share of our competitors;
• the commencement or results of litigation;
• announcements by us, our competitors, our customers, or their other suppliers of new products or technological innovations;
• changes in financial estimates or recommendations by securities analysts;
• the payment or non-payment of cash dividends at the discretion of our board of directors;
• the announcement and implementation of share repurchase programs;
• announcements by us or our competitors of significant acquisitions, divestitures or partnerships; and
• actual or anticipated changes in the global economic or industry outlook.
Many of these factors are beyond our control and may negatively impact the market price of our ADSs, regardless of our performance. In addition, thestock market in general, and the market for technology and semiconductor companies in particular, have been highly volatile. Our ADSs may not trade at thesame price levels as that of other semiconductor and technology companies, and shares of semiconductor and technology companies, in general, may notsustain their current market prices. These fluctuations as well as general economic, political, and market conditions may have an adverse effect on the marketprice of our ADSs.
There can be no assurance that we will continue to declare cash dividends on a quarterly basis, if at all or in any particular amounts.
Our Board of Directors declared payment of our first quarterly dividend on our common stock in January 2013 and the first dividend payment wasmade on March 4, 2013. Our Board of Directors has subsequently declared and paid dividends in each successive quarter. On November 2, 2015, our Boardof Directors, instead of declaring a quarterly dividend, declared an annual dividend payable in four quarterly installments. The continuation of declaringdividends or if at all, depends on, among other things, that the dividend payment is in the best interests of our shareholders, our results of operations, capitalavailability and future capital requirements, financial condition, statutory requirements, and other factors that the board of directors may deem relevant. Thedecision of any declaration of dividend payment, the amount and the frequency of such, if at all, is the discretion of our Board of Directors. Our dividendpayments may change from time to time, and we cannot provide assurance that we will continue to declare dividends, if at all or in any particular amounts. Areduction in or elimination of our dividend payments could have a negative effect on our share price.
If we are characterized as a passive foreign investment company, U.S. Holders may experience adverse tax consequences.
Based on the present and projected composition of our income and valuation of our assets, we believe we are not currently classified as a passiveforeign investment company (“PFIC”) for U.S. federal income tax purposes. We will generally be classified as a PFIC for any taxable year in which either(a) at least 75% of our gross income is passive income or (b) at least 50% of the value (determined on the basis of a quarterly average)
13

Table of Contents
of our assets is attributable to assets that produce or are held for the production of passive income. If we are characterized as a PFIC, U.S. Holders mayexperience adverse tax consequences. See “ ITEM 10. ADDITIONAL INFORMATION -Taxation-United States Federal Income Taxation.”
We are subject to risks associated with international operations which may harm our business.
We conduct our business worldwide. We are a Cayman Islands corporation headquartered in Taiwan and have most of our operations outside of theUnited States. We undertake our design and development activities primarily in China, Korea and Taiwan. Our integrated circuits are manufactured,assembled, tested and packaged by third-parties located primarily in China, Korea, and Taiwan. We generated 90%, 91% and 89% of our revenue in 2013,2014 and 2015, respectively, from sales to customers outside the United States, and for the year ended December 31, 2015, 81% of our revenue was fromsales in three jurisdictions — Taiwan, Korea and China. International operations are subject to many other inherent risks, including but not limited to:
• international economic and political conditions, such as political tensions between countries in which we do business (please also refer to RiskFactors relating to China, Korea, and Taiwan);
• unexpected changes in, or impositions of, legislative or regulatory requirements;
• complying with a variety of foreign laws;
• differing legal standards with respect to protection of intellectual property and employment practices;
• cultural differences in the conduct of business;
• inadequate local infrastructure that could result in business disruptions;
• exporting or importing issues related to export or import restrictions, tariffs, quotas and other trade barriers and restrictions;
• financial risks such as longer payment cycles and difficulty in collecting accounts receivable;
• adverse taxes rules, regulations and penalties; and
• other factors beyond our control such as nature disasters, terrorism, civil unrest, war and diseases such as severe acute respiratory syndrome, theAvian influenza, and the Swine influenza.
Although our reporting currency is the U.S. dollar, and the majority of our sales and cost of sales are denominated in the U.S. dollar, the majority of ouroperating expenses are denominated in the NT dollar, and to a lesser extent Korean won, Chinese yuan and U.S. dollar. The functional currencies of ourKorean operations and our Chinese operations are the Korean Won and the Chinese yuan, respectively. As a result, appreciation or depreciation of othercurrencies in relation to the U.S. dollar could result in material transaction and translation gains or losses that could adversely affect, or cause fluctuations in,our results of operations. We do not currently engage in currency hedging activities.
Parts of the world, including Taiwan, Japan, China and the United States are susceptible to earthquakes. In 1999, 2008, and 2011, Taiwan, China, andJapan respectively, experienced severe earthquakes that caused significant property damage and loss of life. Although the 1999, 2008 and 2011 earthquakesdid not have a material impact on our business, a major earthquake and consequent disruptive events could severely disrupt the normal operations of ourbusiness and have a material and adverse effect on our financial condition and operating results.
We face substantial political risks associated with doing business in Taiwan because of the tense political relationship between Taiwan and the People’sRepublic of China.
Our principal executive offices and a majority of our employees and a significant portion of our research and development and operations are based inTaiwan. In addition, most of our foundries and assembly and testing
14
Table of Contents
suppliers such as TSMC, SMIC, Advanced Semiconductor Engineering Group (“ASE”), Siliconware Precision Industries Co., Ltd. (“SPIL”), and King YuanElectronics Corp. (“KYEC”) are located in either Taiwan or China. Accordingly, our business and results of operations and the market price of our ADSs maybe affected by changes in Taiwan or China governmental policies, taxation, inflation or interest rates and by social instability and diplomatic and socialdevelopments in or affecting Taiwan that are outside of our control. Taiwan has a unique international political status. China does not recognize thesovereignty of Taiwan. Although there have been significant economic and cultural ties between Taiwan and China in recent years, the political relations haveoften been strained. The government of China has indicated that it may use military force to gain control over Taiwan, particularly under what it considers ashighly provocative circumstances, such as a declaration of independence by Taiwan or the refusal by Taiwan to accept China’s “One China” policy. OnMarch 14, 2005, the National People’s Congress of China passed what is widely referred to as the “anti-secession” law, a law authorizing the Chinese militaryto attack Taiwan in order to block moves by Taiwan toward formalizing independence.
Past and recent developments in relations between Taiwan and China have on occasion depressed the market prices of the securities of Taiwanesecompanies or companies with significant business activities in Taiwan. We cannot assure you any contentious situations between Taiwan and China willalways resolve in maintaining the current status quo or remain peaceful. Relations between Taiwan and China and other factors affecting military, political oreconomic conditions in Taiwan could have a material adverse effect on our financial condition and results of operations, as well as the market price and theliquidity of our ADSs.
We face substantial political risk associated from doing business in South Korea because of tensions in the political relationship between South Koreaand North Korea.
Relations between South Korea and North Korea have been tense over most of South Korea’s history. In recent years, there have been heightenedsecurity concerns stemming from North Korea’s nuclear weapons and ballistic missile capabilities and uncertainty regarding North Korea’s actions andpossible responses from the international community. More recent concerns over North Korea’s nuclear and ballistic missile testing programs, hostile andthreatened actions by North Korea against South Korea, North Korea’s leadership succession, and relations between the United States and North Korea, havecreated a global security issue that may adversely affect South Korean business and economic conditions. South Korea was not a signatory of the armisticeagreement that ended the Korean War, and since no peace treaty was signed between South Korea and North Korea, the two countries are technically still atwar. We cannot assure you as to whether or when this situation will be resolved or change abruptly as a result of current or future events, including, withoutlimitation, the effects, if any, of (i) the transition of the “Supreme Leader” to Kim Jong Un that began after the passing of Kim Jong Il in 2011, (ii) recentincreases to previously imposed UN sanctions on North Korea, (iii) the effects of the denial of access to South Koreans who manage jointly run factories inthe North Korean city of Kaesong and (iv) the general increase in overtures and rhetoric by the North Korean government with respect to its nuclearcapabilities and willingness to use such weapons as they see fit. We cannot give any assurance that the level of instability and tension in the Korean peninsulawill not escalate in the future, or that the political regime in North Korea may not suddenly collapse. An adverse change in economic or political conditions inSouth Korea or North Korea or in South Korea’s relations with North Korea could have a material adverse effect on our South Korean subsidiary and ourcompany.
Our business depends on the support of the Taiwanese and South Korean governments, and a decrease in this support may increase our tax liabilitiesand decrease our net income.
The Taiwanese and South Korean governments have generally been supportive of technology companies such as ours. In particular, we, like manyTaiwanese technology companies, have benefited from tax incentives provided by the Taiwanese government. For example, under the Statute for UpgradingIndustries of Taiwan, we were granted tax credits by the Taiwan Ministry of Finance for qualifying research and development costs and in qualifyingemployee training expenses. In addition, Taiwan law offers preferential tax treatments to industries
15

Table of Contents
that are encouraged by the government. In 2010, “Statute for Industries Innovation” was passed to replace the “Statute for Upgrading Industries” in taxincentives. However, we are still eligible to use certain previously granted exemptions. See “Operating and Financial Review and Prospects — PrincipalFactors Affecting Our Results of Operations — Provision for income taxes” and Note 13 to our consolidated financial statements for a more detaileddescription of our ability to enjoy these preferential tax treatments. If any of our tax credits or our ability to take advantage of these preferential tax treatmentsare curtailed or eliminated, our net income may decrease materially.
The South Korean government provides a variety of tax incentives designed to promote designated industries such as the technology industry. We, likemany Korean technology companies, have benefited from certain tax incentives, including tax credits for applicable research and development expenses andtax credit for investments made to improve business productivity. If these and other tax incentives are curtailed or eliminated, our net income may decreasematerially.
ITEM 4. INFORMATION ON THE COMPANY
History and Development of the Company
Silicon Motion Technology Corporation (“Silicon Motion”) is a corporation which was incorporated in the Cayman Islands in January 2005 andacquired Silicon Motion, Inc., a Taiwan corporation (“SMI Taiwan”), in April 2005. Originally SMI Taiwan was known as Feiya Technology Corporation(“Feiya”), a Taiwan corporation which was incorporated in April 1997 but had changed its name to SMI Taiwan after acquiring in August 2002 SiliconMotion, Inc., a California corporation (“SMI USA”), which was incorporated in November 1995. Feiya was originally a flash memory products company andSMI USA a graphics processor company. In April 2007, we acquired FCI Inc. (“FCI”), a leading designer of RF ICs for mobile TV and wirelesscommunications based in Korea. In 2011, we established Silicon Motion BV in the Netherlands with the purpose of expanding our business activities inEurope, as well as to provide supervisory, financing, legal support, accounting services and shareholding for our businesses in other parts of the world. In July2015, we acquired Shanghai Baocun Information Technology Co., Ltd (“Shannon Systems”), China’s leading enterprise-class PCIe SSD company based inShanghai, China.
Our principal executive offices are located at 8F-1, No. 36, Taiyuan St., Jhubei City, Hsinchu County 302, Taiwan. The address of our United Statessubsidiary, Silicon Motion, Inc., is 1591 McCarthy Blvd., Milpitas, CA 95035. Our ADSs have been listed and traded on Nasdaq since June 2005.
Subsidiaries of the Company
Below is a list of subsidiaries of the Company. All subsidiaries are wholly owned. Name of Entity Jurisdiction of IncorporationFCI Inc. KoreaSilicon Motion BV The NetherlandsSilicon Motion K.K. JapanSilicon Motion Korea Ltd. KoreaSilicon Motion Technology (HK) Ltd. Hong KongSilicon Motion, Inc. CaliforniaSilicon Motion, Inc. TaiwanSilicon Motion, Inc. (Beijing) ChinaSilicon Motion, Inc. (Shanghai) ChinaSilicon Motion, Inc. (Shenzhen) ChinaShannon Systems China
16
Table of Contents
Overview
We are a global leader and pioneer in developing NAND flash controller ICs for solid-state storage devices and specialty RF ICs for mobile devices.We supply more NAND flash controllers than any other company in the world and have one of the broadest portfolios of controller solutions andtechnologies. Our key products are controllers used in embedded storage products such as SSDs and eMMCs, as well as in expandable storage products suchas memory cards and USB flash drives. Our products are widely used in consumer devices such as smartphones, tablets and PCs and for industrial, enterprise,commercial and other applications. Our customers include most of the NAND flash makers, leading technology OEMs, and the majority of storage devicemodule makers. More NAND flash products, especially next-generation flash, produced by Intel, Micron, Samsung, SanDisk, SK Hynix and Toshiba aresupported by Silicon Motion controllers than any other company. We are the world’s leading merchant supplier of controllers for eMMC embedded memoryused in smartphones and tablets, and the leading merchant supplier of controllers for client SSDs used in PCs and other applications. The recent addition ofShannon Systems expands our product portfolio to now include enterprise-grade PCIe SSDs for the Chinese hyperscale data center market. For the mobilecommunications market, our key products are mobile TV SoCs and handset RF ICs. We market our controllers under the “SMI” brand, our enterprise-gradeSSDs under the “Shannon Systems” brand, our single-chip industrial-grade SSDs under the “Ferri SSD” and “Ferri-eMMC” brands, and specially RF ICsunder the “FCI” brand.
Industry Background
We operate in the semiconductor industry and primarily focus on designing, developing and marketing: (i) controllers for managing NAND flash usedin embedded storage applications such as eMMC embedded memory and SSDs and expandable storage applications such as flash memory cards and USBflash drives, (ii) specialty SSD such as customized enterprise-grade PCIe SSD solutions for the China hyperscale data center market and single-chip SSDsolutions for industrial and commercial equipment markets, and (iii) specialty RF ICs used in smartphones and tablets such as mobile TV SoCs.
Our Market and Products
Our products, primarily embedded storage products, expandable storage products and specialty radio frequency integrated circuits (RF ICs), aredesigned, developed and marketed to mobile storage and mobile communications markets. The two general types of embedded storage and expandablestorage products that we sell are (i) NAND flash controllers, such as embedded MultiMediaCard (eMMC), client solid-state drive (SSD), flash memory cardand Universal Serial Bus (USB) flash drive controllers, and (ii) specialty storage solutions, such as our customized enterprise-grade Shannon SystemsPeripheral Component Interconnect Express (PCIe) SSDs and industrial-grade and commercial-grade single-chip FerriSSDs and Ferri-eMMCs. NAND flashcontrollers account for a significant majority of sales. Our Ferri storage solutions all use our industry-proven controllers and beginning in 2016, we anticipatethat our Shannon Systems SSDs will also start using our controllers.
NAND Flash Controllers
NAND flash is a type of non-volatile digital data storage technology that does not require power to retain data and has become the primarysemiconductor technology for mass digital data storage. The benefits of NAND flash include high data storage capacity at low cost per bit, fast data read andwrite access time, low operating power requirements, and shock resistance. NAND flash is widely used for embedded and expandable data storage in mobileconsumer electronic devices such as smartphones, tablets, digital cameras, and notebook PCs and more recently is also being used in commercial-grade,industrial-grade, and enterprise-grade equipment. The NAND flash market is large and has grown rapidly, and the leading suppliers of NAND flash are Intel,Micron, Samsung, SanDisk, SK Hynix, and Toshiba.
17

Table of Contents
All NAND flash storage devices require a controller and almost all storage devices use a discrete controller IC. Key functions of a flash memorycontroller include:
• managing the interfacing of the NAND flash in the flash memory storage product with the host device;
• ensuring data reliability in NAND flash by detecting and correcting individual bit errors in the NAND flash caused by read/write disturbance andadjacent cell interference;
• ensuring data integrity in NAND flash by mapping bad blocks and preventing bad blocks from being used for storing data;
• maximizing the life of NAND flash with wear-leveling algorithms which spread out the use of the memory array and equalize the use of all thememory cells;
• enhancing the sequential and random read and write performance of NAND flash by utilizing multiple-plane architecture, interleaving, or othertechnologies;
• preventing data loss during sudden, unexpected host device power failures with advanced power cycling solutions;
• implementing security features to protect software code, personal data and multimedia digital rights; and
• ensuring that flash memory storage solutions are compatible with host devices.
We believe that our controllers are designed to meet the specifications of the majority of NAND flash components currently being produced bydifferent flash memory manufacturers, including small and big block Single-Level Cell (“SLC”) and Multi-Level Cell (“MLC”) NAND flash. Most of ourcontrollers support planar and 3D two-bits per cell MLC or three-bits per cell MLC NAND flash, which is also known as Triple-Level Cell (“TLC”) NANDflash. Our controllers also support NAND flash designed and fabricated at all the primary process geometries, including the most advanced processgeometries.
Mobile Storage Market
We provide embedded storage products and expandable storage products primarily for the mobile storage market, targeting NAND flash makers andmodule makers that develop eMMCs, client SSDs, flash memory cards and USB flash drives for mobile electronics devices, such as smartphones andnotebook and desktop PCs.
Embedded Storage Products
eMMC controllers. We supply controllers for eMMC, an industry standard high-performance, low-power single-chip embedded memory solution that iswidely used in portable consumer electronic products, including smartphones, tablets, digital cameras and smart TVs. Our customers use our eMMCcontrollers with their NAND flash components to manufacture single-chip eMMC memory modules and with their NAND flash and mobile dynamic random-access memory (DRAM) components to manufacture eMMC-based multi-chip package (eMCP) memory modules. Our eMMC controllers support all thecurrent widely used standards, including eMMC 4.5, eMMC 5.0 and eMMC 5.1. We believe we are the world’s largest merchant supplier of eMMCcontrollers. Our largest eMMC controller customer is SK Hynix; we believe SK Hynix is manufacturing eMMCs and eMCPs with our controllers and issupplying all of the global top 10 Android smartphone original equipment manufacturers (OEMs) with these solutions.
Client SSD controllers. We believe we are the world’s largest merchant supplier of client SSD controllers and provide highly customizable hardwareplus firmware turnkey SSD controller solutions to NAND flash manufacturers and module makers that manufacture and supply to PC OEMs and the channelmarkets their SSDs with our controllers for use in notebook and desktop PCs, other client devices and in high-performance, low-latency non-mission criticaldata center applications. Our client SSD controllers support interfaces that
18
Table of Contents
include Serial Advanced Technology Attachment (SATA) III and PCIe and the majority of the latest generation of NAND flash components. Our value-addedtechnologies provided to our client SSD controller customers include end-to-end data path protection, power-loss data security features, Opal-compliant AESadvanced full-disk encryption, and active operating temperature monitoring.
Embedded flash storage controllers. Our embedded flash controllers are designed to control NAND flash embedded on devices with Compact Flash,USB, and SATA interfaces. Applications using our embedded flash storage controllers include industrial-grade Compact Flash (CF) cards, industrial-gradeSecure Digital (SD) cards, disk-on-modules (DOMs), Integrated Drive Electronics (IDE) SSDs (also known as Parallel Advanced Technology Attachment(PATA) SSDs), embedded USB flash drives, industrial-grade USB flash drives and non-consumer-grade 3 Gigabit per second (Gp/s) and 6 Gb/s SATASSDs. Our embedded flash controllers are offered in commercial temperature (0 °C to 70 °C) and industrial temperature (-40 °C to +85 °C) versions andbacked by long term product support. We believe we are the world’s largest supplier of embedded flash storage controllers and supply our controllersprimarily to module makers that specialized in supplying the industrial and commercial applications markets.
Ferri storage solutions. Our FerriSSDs and Ferri-eMMCs are highly reliable, industrial-grade and commercial-grade single-chip SSDs, which aredeveloped for a wide-range of embedded applications that require high data rate, small form factor and compliance with standard PATA, SATA and eMMCprotocols. These single-chip SSDs are designed using our industry-proven PATA, SATA and eMMC controller technologies with high-quality NAND flashcomponents to simplify customers’ design work, and are offered to OEM customers that also require long supply continuity. For certain customers, we offeroptions for firmware customization to meet their unique embedded storage requirements. We believe we are the world’s largest supplier of industrial-gradeand commercial-grade single-chip SSDs.
Shannon Systems enterprise SSD solutions. In China, we provide customized, high-performance enterprise-grade PCIe SSDs to internet companies fortheir hyperscale data centers and to other corporate customers. Our PCIe SSDs are developed for customers who require the largest storage capacity, lowestlatency, fastest input/output operations per second (IOPS) data rate, lowest power and unparalleled performance stability with end-to-end data path protection.
Expandable Storage Products
Flash memory card controllers. Our controllers for flash memory card standards include microSD cards used primary with smartphones and SD and CFcards used primarily with digital cameras and camcorders. For microSD and SD cards, we offer controllers for (i) different speed class, including thesignificantly faster Secure Digital High Capacity (SDHC) and Secure Digital eXtended Capacity (SDXC) cards that use the Ultra High Speed (UHS) bus and(ii) different storage capacities, including the significantly higher capacity SDHC and SDXC cards, which also have faster speed and added capabilities.
USB flash drive controllers. USB flash drives are NAND flash storage devices integrated with a standard USB interface, either USB 2.0 or the fasterUSB 3.0. USB flash drives are popular in computing and consumer electronics markets for the portable storage of files.
Mobile Communications Market
For the mobile communications market, a market that extends from smartphones to new devices that target the internet-of-things, we provide specialtyRF ICs, primarily mobile TV system-on-chips (SoCs) and certain handset RF ICs.
Mobile TV SoCs. Our products include integrated mobile TV tuner plus demodulator SoCs for mobile phones and other portable devices. Our solutionsare designed for leading digital mobile TV broadcast standards,
19
Table of Contents
specifically Terrestrial-Digital Media Broadcast (T-DMB) for the Korean market and Integrated Services Digital Broadcasting-Terrestrial (ISDB-T) for theJapanese and certain Asian and South American markets.
Handset RF ICs. We provide multi-mode diversity fourth generation (4G) Long Term Evolution-Advanced (LTE-Advanced) transceivers that alsosupport most legacy third generation (3G) and second generation (2G) air interfaces, Code-Division Multiple Access (CDMA) transceivers and low-noiseamplifier (LNA) components.
Our Customers
We sell our semiconductor solutions to leading OEMs and module makers, worldwide. Most of our high performance flash memory storage controllersare supplied to NAND flash manufacturers. We are the leading merchant supplier of controllers used in client SSD for PCs and eMMC used in smartphonesand a leading supplier of controllers used in flash memory cards and USB flash drives. We provide our specialty RF ICs primarily to Samsung and otherOEMs.
Sales to our five largest customers represented approximately 65%, 64% and 54% of our net revenue in 2013, 2014 and 2015, respectively. Sales to twocustomers in 2013 and 2014, and one customer in 2015 accounted for 10% or more of our net revenue, representing 46%, 47% and 30% of our net revenue in2013, 2014 and 2015, respectively. In 2013 and 2014, the significant customers were Samsung and SK Hynix and in 2015, SK Hynix. The identities of ourlargest customers and their respective contributions to our net revenue have varied and will likely continue to vary from period to period.
The majority of our customers purchase our products through purchase orders, as opposed to entering into long-term contracts with us. The price forour products is typically agreed upon at the time a purchase order is placed.
Sales and Marketing
We market and sell our products worldwide through a combination of direct sales personnel and independent electronics distributors. Our direct salespersonnel are strategically located near our major OEM and modular maker customers in Taiwan, Korea, China, the United States, and Japan. Approximately83% of our sales in 2013, 81% of our sales in 2014, and 71% of our sales in 2015 were attributable to our direct sales force while the remainder wasattributable to distributors.
To supplement our direct sales, we have independent electronics distributors and sales reps with locations throughout the world. We selected thesedistributors and reps based on their ability to provide effective field sales, marketing communications and technical support for our products to our customers.
Our marketing group focuses on our product strategy, product development road maps, new product introduction process, demand assessment,competitive analysis, and product marketing. We seek to work with potential and existing customers early in their design process to best match our productsto their needs, and more broadly, to ensure that product development activities, product launches, and on-going demand and supply planning occur in a well-managed, timely basis in coordination with our research and development, operations, and sales groups, as well as our customers and distributors. We alsoattend industry tradeshows and technical conferences to promote our products and solutions, maintain close contact with our existing customers to assessdemand, and keep current with industry trends. Our participation in industry standards associations, such as JEDEC and the SD Association for our embeddedstorage and expandable storage products, helps us monitor the latest industry developments and promote our corporate profile. Our marketing group alsoworks with our sales teams to identify new business opportunities.
We also have field application engineers (FAEs), who provide technical support and assistance to existing and potential customers in designing, testingand qualifying systems that incorporate our products. Our FAE organization is segmented by product and market to support our customers.
20
Table of Contents
Research and Development
We devote a significant amount of resources to research and development for broadening and strengthening our portfolio of technology, products andsolutions. Our engineering team has expertise in NAND flash management algorithms, system architecture, digital, mixed-signal and RF IC design, andsoftware engineering. As of March 31, 2016, we had 692 patents and have 774 pending applications worldwide. We will continue to actively pursue the filingof additional patent applications in important jurisdictions.
We believe technology research and product development are essential to our growth. Our primary research and development centers are located inHsinchu and Taipei, Taiwan, Seoul, South Korea, Shanghai and Shenzhen, China and Milpitas, California. Our facilities in Milpitas focus primarily ongraphics products, our facilities in Seoul focus primarily on our specialty RF IC products, our facilities in Hsinchu and Taipei focus primarily on our NANDflash controller products, and our facilities in Shanghai and Shenzhen focus primarily on specific product requirements of our customers in China.
Our research and development expenses were approximately US$46.5 million, US$60.9 million and US$71.2 million for the years ended December 31,2013, 2014 and 2015, respectively.
Manufacturing
We design and develop our products and electronically transfer our proprietary designs to independent foundries for the manufacturing and processingof silicon wafers. Once the wafers are manufactured, they are then shipped to third-party assembly and testing subcontractors. Individual dies on each waferare assembled into finished chips and undergo several stages of testing before delivery to our customers. We also ship bare dies to our customers. We believethat our strategy of outsourcing wafer fabrication, packaging and testing enables us to benefit from the research and development efforts of leadingmanufacturers without the requirement to commit our own substantial capital investments. Our fabless business model also provides us with the flexibility toengage vendors who offer services that best complement our products and technologies.
Wafer fabrication. TSMC and SMIC are currently our primary foundries that manufacture most of our semiconductors. We use their fabs in Taiwan,Singapore, and China to fabricate our devices using mature and stable CMOS process technology, primarily with line-widths from 40 to 160 nanometers. Weregularly evaluate the benefits and feasibility, on a product-by-product basis, of migrating to more cost efficient manufacturing process technologies.
Assembly and testing. Following wafer fabrication, our wafers are shipped to our assembly and test subcontractors where they are probed, singulatedinto individual dies, assembled into packaged chips, and undergo the process of electronic final testing. In order to minimize cost and maximize turn-aroundtime, our products are designed to use low cost, industry standard packages and can be tested with widely available automatic testing equipment. We currentlyengage companies such as ASE, SPIL, and KYEC as our primary subcontractors for the assembly and testing of our products. We have dedicated teams ofmanufacturing engineers who maintain control over the process from the early stages of manufacturing. Our engineers work closely with our subcontractorsto develop product testing and packaging programs to ensure these programs meet our product specifications, thereby maintaining our ownership of thefunctional and parametric performance of our semiconductors.
Quality and reliability assurance. We have designed and implemented a quality assurance system that provides the framework for continualimprovement of products, processes and customer service. To ensure consistent product quality, reliability and yield, our quality assurance teams performreliability engineering, quality control, international organization for standardization (ISO) system development, document control, subcontractor qualitymanagement and customer engineering services to closely monitor the overall process from IC design to after-sale customer support. In particular, we rely onin-depth simulation studies, testing and
21
Table of Contents
practical application testing to validate and verify our products. We emphasize a strong supplier quality management practice in which our manufacturingsuppliers and subcontractors are pre-qualified by our quality assurance teams. Our suppliers are required to have a quality management system, certified toISO 9000 standard. Our operations have been ISO 9001 certified since 1999.
Competition
The semiconductor industry is characterized by intense competition. Our customers face supply shortages or oversupply, rapid technological changes,evolving industry standards and declining average selling prices.
Our competitors in our mobile storage market include Alcor Micro, ASolid, Marvell, and Phison. In the mobile communications market, the companieswith whom we compete include Raontech and Socionext. We also face competition from some of our customers.
Seasonality
See “Risk Factors — Because our operating results for any period could be adversely affected by a number of factors and therefore fluctuatesignificantly, our annual and quarterly operating results are difficult to predict” in Item 3 above and “Operating and Financial Review and Prospects —Principal Factors Affecting Our Results of Operations” in Item 5 below.
Intellectual Property
Our success and future revenue growth depends, in part, on our ability to protect our intellectual property. We rely on a portfolio of intellectual propertyrights, registered in the United States, Taiwan, and other countries, including patents, copyrights, trademark registrations, trade secret laws, contractualprovisions, licenses, and other methods to protect our intellectual property.
As of March 31, 2016, we held 692 patents and have 774 pending applications worldwide. There can be no assurance that patents will ever be issuedwith respect to these pending applications. Furthermore, it is possible that any patents held by us may be invalidated, circumvented, challenged or licensed toothers. In addition, there can be no assurance that such patents will provide us with competitive advantages or adequately safeguard our proprietary rights.While we continue to file new patent applications with respect to our recent developments, existing patents are granted for prescribed time periods and willexpire at various times in the future. We expect to continue to file patent applications where appropriate to protect our proprietary technologies.
Companies in the semiconductor industry have frequently demonstrated a readiness to commence litigation based on allegations of patent and otherintellectual property infringement. From time to time, third parties may assert infringement claims against us. We may not prevail in any such litigation ormay not be able to license patents from third parties on commercially reasonable terms, if at all. Litigation, regardless of the outcome, is likely to result insubstantial cost and diversion of our resources, including our management’s time. Any such litigation could materially adversely affect us. In addition, in thecontracts under which we sell semiconductor products, we may have agreed to indemnify our customers against losses arising out of claims of unauthorizeduse of intellectual property.
We intend to protect our intellectual property rights vigorously, but there can be no assurance that our efforts will be successful. In addition, the laws ofother countries in which our products are sold may not protect our products and intellectual property rights to the same extent as the laws of the United States.
While our ability to effectively compete depends in large part on our ability to protect our intellectual property, we believe that our technical expertise,customer support capabilities, and ability to introduce new products in a timely and cost effective manner will be important factors in maintaining ourcompetitive position.
22
Table of Contents
We claim copyright and trademark protection for proprietary documentation for our products and a variety of branding marks. We have registered“Silicon Motion” and its logo (a three-dimensional cube depiction of the letters “SM”), FCI, the FCI logo, Shannon Systems, the Shannon Systems logo,“airRF,” “basicRF,” “ezRF,” “ezSYS,” “powerRF,” “twinRF,” “zipRF,” “zipSYS,” “VirtualZero,” “SSDLifeGuard,” “SSDLifeSaver,” “TurboMLC,”“FerriSSD,” “Ferri-eMMC,” and “NANDXtend” as trademarks in the United States, Taiwan, and other countries.
We also attempt to protect our trade secrets and other proprietary information through agreements with our customers, suppliers, employees andconsultants, and through other customary security measures.
We have entered into license agreements with third party intellectual property vendors for wafer fabrication tool libraries, semiconductor IP core,computer aided design tools, and software.
Facilities
Our corporate headquarters is located in Hsinchu, Taiwan. As of the date of this annual report, we own this 173,900 square feet facility, which housesour management and administration, operations, and research and development departments. In Taiwan, we also lease premises in Taipei, occupyingapproximately 54,700 square feet of floor space, which houses our sales and marketing, as well as research and development departments.
In addition to these facilities in Taiwan, in 2015 we purchased a facility in Shanghai, China with an aggregate floor space of approximately 20,000square feet, which houses our research and development, sales and marketing and administrative departments. We lease facilities in Seoul, Korea; HongKong, Shenzhen, Shanghai and Beijing, China; Milpitas, California; and Yokohama, Japan for research and development, sales and marketing, andadministration. These facilities in aggregate consist of approximately 77,300 square feet of floor space with lease terms expiring at various dates between2016 and 2019. We also own other commercial property in both Taipei and Shanghai of approximately 6,200 square feet and 15,900 square feet, respectively,which we currently do not use. It is our intention to sell these properties as we currently do not use them for operating purposes.
Government Regulation
See Risk Factors — “We face substantial political risks associated with doing business in Taiwan because of the tense political relationship betweenTaiwan and the People’s Republic of China,” “Our business depends on the support of the Taiwanese and South Korean governments, and a decrease in thissupport may increase our tax liabilities and decrease our net income,” and “We face substantial political risk associated from doing business in South Koreabecause of tensions in the political relationship between South Korea and North Korea” in Item 3 above.
ITEM 4A. UNRESOLVED STAFF COMMENTS
None.
ITEM 5. OPERATING AND FINANCIAL REVIEW AND PROSPECTS
General Information
We are a global leader and pioneer in developing NAND flash controller ICs for solid-state storage devices and specialty RF ICs for mobile devices.We supply more NAND flash controllers than any other company in the world and have one of the broadest portfolios of controller solutions andtechnologies. Our key products are controllers used in embedded storage products such as SSDs and eMMCs, as well as in expandable storage products suchas memory cards and USB flash drives. Our products are widely used in consumer devices such as smartphones, tablets and PCs and for industrial, enterprise,commercial and other applications. Our customers
23
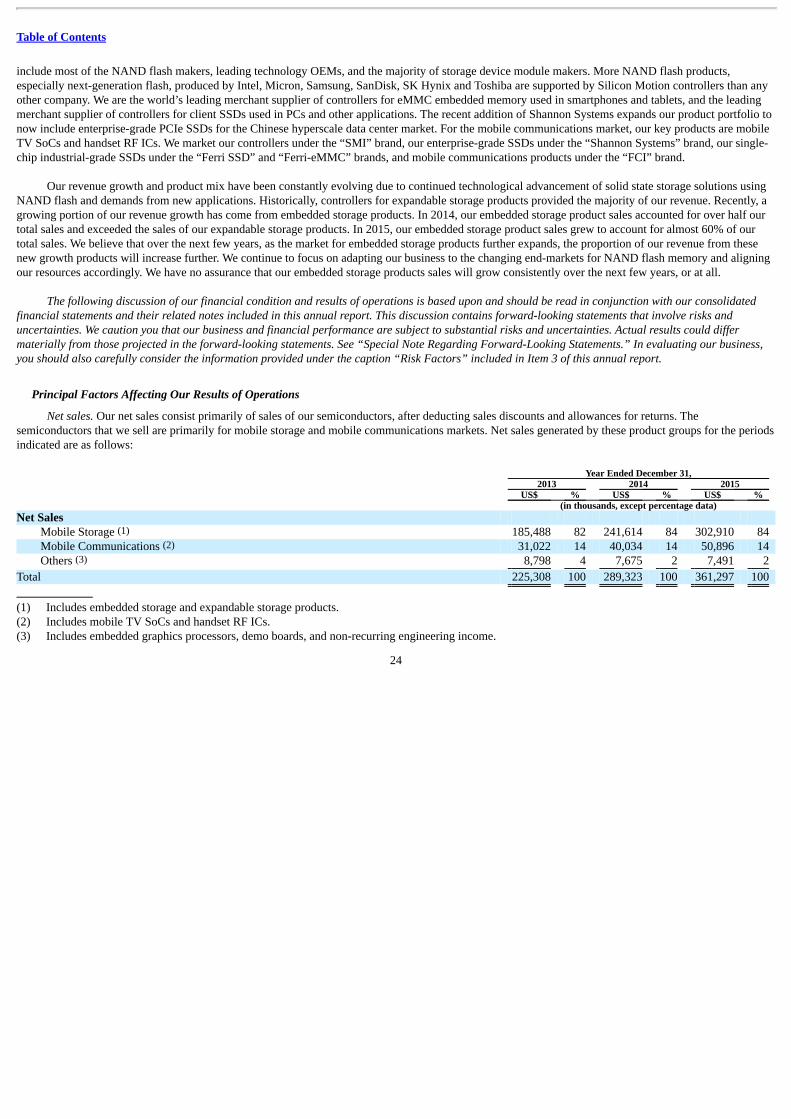
Table of Contents
include most of the NAND flash makers, leading technology OEMs, and the majority of storage device module makers. More NAND flash products,especially next-generation flash, produced by Intel, Micron, Samsung, SanDisk, SK Hynix and Toshiba are supported by Silicon Motion controllers than anyother company. We are the world’s leading merchant supplier of controllers for eMMC embedded memory used in smartphones and tablets, and the leadingmerchant supplier of controllers for client SSDs used in PCs and other applications. The recent addition of Shannon Systems expands our product portfolio tonow include enterprise-grade PCIe SSDs for the Chinese hyperscale data center market. For the mobile communications market, our key products are mobileTV SoCs and handset RF ICs. We market our controllers under the “SMI” brand, our enterprise-grade SSDs under the “Shannon Systems” brand, our single-chip industrial-grade SSDs under the “Ferri SSD” and “Ferri-eMMC” brands, and mobile communications products under the “FCI” brand.
Our revenue growth and product mix have been constantly evolving due to continued technological advancement of solid state storage solutions usingNAND flash and demands from new applications. Historically, controllers for expandable storage products provided the majority of our revenue. Recently, agrowing portion of our revenue growth has come from embedded storage products. In 2014, our embedded storage product sales accounted for over half ourtotal sales and exceeded the sales of our expandable storage products. In 2015, our embedded storage product sales grew to account for almost 60% of ourtotal sales. We believe that over the next few years, as the market for embedded storage products further expands, the proportion of our revenue from thesenew growth products will increase further. We continue to focus on adapting our business to the changing end-markets for NAND flash memory and aligningour resources accordingly. We have no assurance that our embedded storage products sales will grow consistently over the next few years, or at all.
The following discussion of our financial condition and results of operations is based upon and should be read in conjunction with our consolidatedfinancial statements and their related notes included in this annual report. This discussion contains forward-looking statements that involve risks anduncertainties. We caution you that our business and financial performance are subject to substantial risks and uncertainties. Actual results could differmaterially from those projected in the forward-looking statements. See “Special Note Regarding Forward-Looking Statements.” In evaluating our business,you should also carefully consider the information provided under the caption “Risk Factors” included in Item 3 of this annual report.
Principal Factors Affecting Our Results of Operations
Net sales. Our net sales consist primarily of sales of our semiconductors, after deducting sales discounts and allowances for returns. Thesemiconductors that we sell are primarily for mobile storage and mobile communications markets. Net sales generated by these product groups for the periodsindicated are as follows: Year Ended December 31, 2013 2014 2015 US$ % US$ % US$ % (in thousands, except percentage data) Net Sales
Mobile Storage (1) 185,488 82 241,614 84 302,910 84 Mobile Communications (2) 31,022 14 40,034 14 50,896 14 Others (3) 8,798 4 7,675 2 7,491 2
Total 225,308 100 289,323 100 361,297 100
(1) Includes embedded storage and expandable storage products.(2) Includes mobile TV SoCs and handset RF ICs.(3) Includes embedded graphics processors, demo boards, and non-recurring engineering income.
24
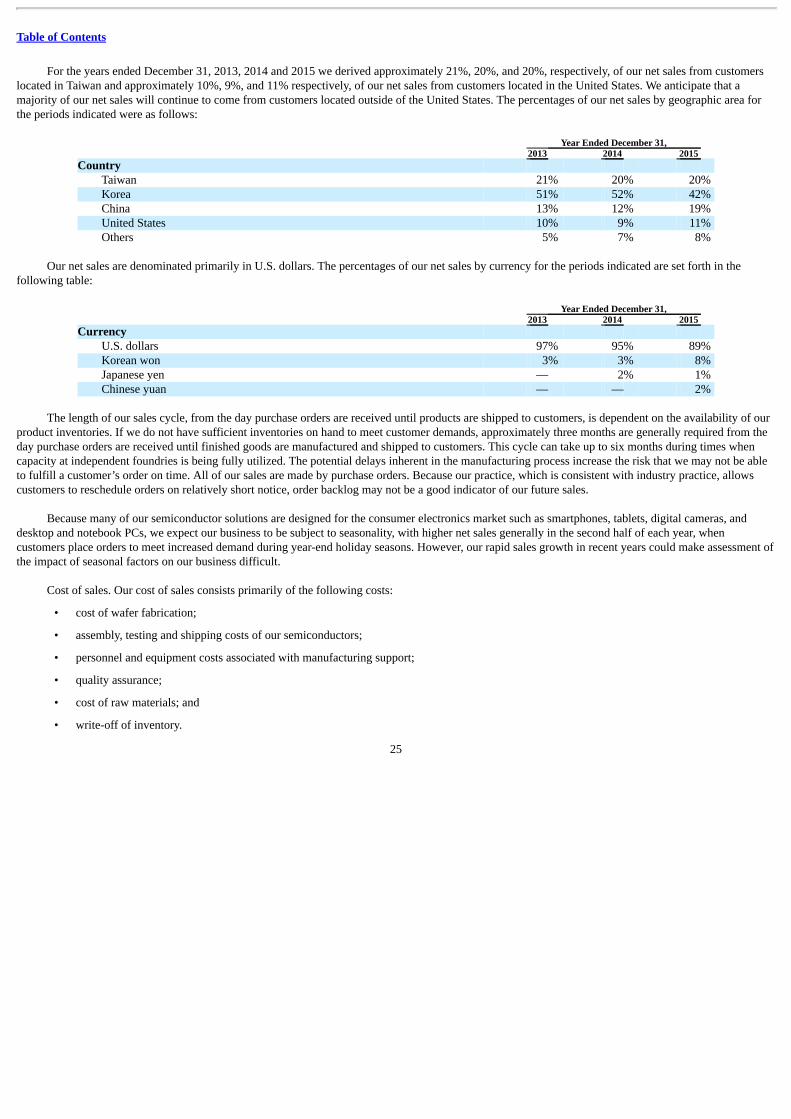
Table of Contents
For the years ended December 31, 2013, 2014 and 2015 we derived approximately 21%, 20%, and 20%, respectively, of our net sales from customerslocated in Taiwan and approximately 10%, 9%, and 11% respectively, of our net sales from customers located in the United States. We anticipate that amajority of our net sales will continue to come from customers located outside of the United States. The percentages of our net sales by geographic area forthe periods indicated were as follows:
Year Ended December 31, 2013 2014 2015 Country
Taiwan 21% 20% 20% Korea 51% 52% 42% China 13% 12% 19% United States 10% 9% 11% Others 5% 7% 8%
Our net sales are denominated primarily in U.S. dollars. The percentages of our net sales by currency for the periods indicated are set forth in thefollowing table:
Year Ended December 31, 2013 2014 2015 Currency
U.S. dollars 97% 95% 89% Korean won 3% 3% 8% Japanese yen — 2% 1% Chinese yuan — — 2%
The length of our sales cycle, from the day purchase orders are received until products are shipped to customers, is dependent on the availability of ourproduct inventories. If we do not have sufficient inventories on hand to meet customer demands, approximately three months are generally required from theday purchase orders are received until finished goods are manufactured and shipped to customers. This cycle can take up to six months during times whencapacity at independent foundries is being fully utilized. The potential delays inherent in the manufacturing process increase the risk that we may not be ableto fulfill a customer’s order on time. All of our sales are made by purchase orders. Because our practice, which is consistent with industry practice, allowscustomers to reschedule orders on relatively short notice, order backlog may not be a good indicator of our future sales.
Because many of our semiconductor solutions are designed for the consumer electronics market such as smartphones, tablets, digital cameras, anddesktop and notebook PCs, we expect our business to be subject to seasonality, with higher net sales generally in the second half of each year, whencustomers place orders to meet increased demand during year-end holiday seasons. However, our rapid sales growth in recent years could make assessment ofthe impact of seasonal factors on our business difficult.
Cost of sales. Our cost of sales consists primarily of the following costs:
• cost of wafer fabrication;
• assembly, testing and shipping costs of our semiconductors;
• personnel and equipment costs associated with manufacturing support;
• quality assurance;
• cost of raw materials; and
• write-off of inventory.
25

Table of Contents
We engage independent foundries for the manufacturing and processing of our semiconductors. Our manufacturing cost is subject to the cyclical supplyand demand conditions typical of the semiconductor industry. Our cost per wafer generally fluctuates with the availability of capacity at independentfoundries. We believe that our cost of sales is substantially variable in nature, and will likely fluctuate as our market conditions change.
Research and development expenses. Our research and development expenses consist primarily of employee salaries and related costs, stock-basedcompensation expense, fees paid for the use of intellectual properties and design tools developed by third parties, development cost of software, expenses forthe design, development and testing of system architecture, new product or product alternatives, costs for the construction of prototypes, occupancy costs anddepreciation on research and development related equipment. We expense research and development expenditures as they are incurred. We expect researchand development expenses to increase in absolute terms in future periods as our net sales increase.
Sales and marketing expenses. Our sales and marketing expenses consist primarily of employee salaries and related costs, stock-based compensationexpense, commissions paid to independent distributors and costs for our advertising and promotional activities. We expect that our sales and marketingexpenses will increase in absolute terms over the next several years as our net sales increase.
General and administrative expenses. Our general and administrative expenses consist primarily of employee salaries and related costs, stock-basedcompensation expense, insurance premiums, professional fees and allowance for doubtful accounts. We expect that general and administrative expenses willincrease in absolute terms in future periods as our net sales increase.
Amortization of acquired intangible assets. Amortization of acquired intangible assets relates to intangible assets, such as development technology, butexcluding goodwill.
Accounting for stock-based compensation. We grant both stock options and restricted stock units to our employees and members of the Board ofDirectors. The value of our restricted stock units is expensed over the vesting period and based on the grant date share price, less the present value of expecteddividends during the vesting period, discounted at a risk-free interest rate. We estimate the fair value of stock options on the date of grant using the Black-Scholes option-pricing model and recognize stock compensation expense over the requisite service period of the individual grantees, which generally equalsthe vesting period.
Non-operating income and expenses. Our non-operating income and expenses include gains or losses on the sales of investments, interest fromdeposited cash or short-term investments, gains or losses on foreign exchange rates, impairment of long-term investments, interest paid on loans and capitalleases and other non-operating income and expenses not categorized above. We conduct an assessment on the value of our long-term investments quarterlyand make corresponding write-downs as required to the value of the long-term investments.
Provision for income taxes. We must make certain estimates and judgments in determining income tax expenses for financial statement purposes. Theseestimates and judgments occur in the calculation of tax credits, benefits, deductions and allowance, and in the calculation of certain tax assets and liabilities,which arise from differences in the timing of recognition of revenue and expense for tax and financial statement purposes, as well as the interest and penaltiesrelated to uncertain tax positions. Significant changes to these estimates may result in an increase or decrease to our tax provision in a subsequent period.
We have operations in several countries and determine income taxes for each of the jurisdictions where we operate. Taiwan, China and Korea are ourprimary countries of operations.
In Taiwan, we have received tax exemptions from the government that are valid for a number of years and for certain income streams relating to theexpansion of production capacity or the development of new
26
Table of Contents
technologies. We also receive significant amounts of tax credits for applicable research and development expenses incurred in Korea. Because of these andother tax benefits, the effective tax rates of our Taiwan and Korea operations have been lower than statutory tax rates. See “Risk Factors — Our businessdepends on the support of the Taiwanese and South Korean governments, and a decrease in this support may increase our tax liabilities and decrease our netincome” for the risks relating to our ability to enjoy favorable tax policies of the Taiwanese and Korean governments.
Critical Accounting Policies and Estimates
Our discussion and analysis of our financial condition and results of operations are based upon our financial statements, which have been prepared inaccordance with accounting principles generally accepted in the United States.
The preparation of our consolidated financial statements requires us to make estimates and judgments that affect the reported amount of assets,liabilities, net sales and expenses, and related disclosure of contingent assets and liabilities. We evaluate our estimates on an on-going basis, including thoserelated to product returns and pricing allowances, allowances for doubtful accounts, inventories, business combinations, goodwill, long-lived assets, incometaxes, litigation and contingencies. We base our estimates and judgments on our historical experience, knowledge of current conditions and our beliefs ofwhat could occur in the future considering available information. Because our estimates may vary in each situation, our actual results may differ from ourestimates under different assumptions and conditions.
Our management considers the following factors in reviewing our financial statements:
• the selection of critical accounting policies; and
• the judgments and other uncertainties affecting the application of those critical accounting policies.
The selection of critical accounting policies, the judgments and other uncertainties affecting the application of those policies and the sensitivity ofreported results to changes in conditions and assumptions are factors to be considered when reviewing our financial statements. Our principal accountingpolicies are set forth in detail in Note 2 to our consolidated financial statements included elsewhere in this annual report.
We believe the following critical accounting policies affect our more significant judgments used in the preparation of our financial consolidatedstatements.
Revenue recognition. Revenue from product sales are generally recognized upon shipment to the customer provided that we have received a signedpurchase order, the price has been fixed or is determinable, transfer of title has occurred in accordance with the shipping terms specified in the arrangementwith the customer, collectability from the customer is considered reasonably assured, product returns are reasonably estimable and there are no remainingsignificant obligations or customer acceptance requirements. Revenue on development service orders is generally recognized upon completion and customeracceptance of contractually agreed milestones.
We record reserves to cover the estimated returns from our customers. Certain of our distributors have limited rights of return and price protectionrights on unsold inventory. The return rights are generally limited to five percent of the monetary value of products purchased within the preceding sixmonths, provided the distributor places a corresponding restocking order of equal or greater value. The allowance for sales returns for distributors and allcustomers is recorded at the time of sale based on historical returns information available, management’s judgment and any known factors at the time thefinancial statements are prepared that would significantly affect the allowance. However, because of the inherent nature of estimates, actual returns andallowances could be significantly different from our estimates. To the extent rates of return change, our estimates for the reserves necessary to cover suchreturns would also change which could have a negative impact on our
27

Table of Contents
recorded revenue and gross margin. We reserved approximately US$1.3 million, US$1.6 million and US$1.7 million in 2013, 2014 and 2015, respectively, forestimated sales returns and discounts, representing approximately 0.6%, 0.5% and 0.5% of our gross sales for those respective periods.
Occasionally, we have reduced our product pricing due to market conditions, competitive considerations and other factors. Price protection rights aregranted to certain distributors under our distribution agreements. When we reduce the price of our products, price protection allows the distributor to claim acredit against its outstanding accounts receivable balances based on the new price of the inventory it has on hand as of the date of the price reduction. Areserve for price adjustments is recorded at the time of sale based on our historical experience. The amount of our reserve for price adjustments to distributorsis minimal.
Allowance for doubtful accounts. We record an allowance for doubtful accounts based on our evaluation of the collectability of our accounts receivable.Normal payment terms are provided to customers and applied upon transfer of title. On an ongoing basis, we analyze the payment history of customeraccounts, including recent customer purchases. In circumstances where we are aware of a specific customer’s inability to meet its financial obligations to us,we record a specific allowance against amounts due to reduce the net recognized receivable to the amount we reasonably believe will be collected. For allother accounts receivable due from customers, we categorize accounts receivable and make provisions based on a percentage of each category. We determinethese percentages by examining our historical collection experience and current trends in the credit quality of our customers as well as our internal creditpolicies. If the financial condition of our customers or economic conditions in general were to deteriorate, additional allowances may be required in the futureand such additional allowances would increase our operating expenses and therefore reduce our operating income and net income.
Our allowance for trade-related doubtful accounts were approximately US$1.3 million, US$1.2 million and US$0.8 million as of December 31, 2013,2014 and 2015, respectively, representing approximately 3.8%, 3.7% and 1.3% of our gross accounts receivables at the end of each respective periods.
Inventory valuation. We value inventories at the lower of cost or market value. Inventories are recorded at standard cost and adjusted to theapproximate weighted-average cost at the balance sheet date. Market value represents the current replacement cost for raw materials, finished goods and workin process. We write down our inventory for estimated obsolescence or unmarketable inventory in an amount equal to the difference between the cost ofinventory and the estimated market value based upon assumptions about future demand and market conditions. If actual market conditions are less favorablethan those we projected, additional inventory write-downs may be required. Inventory impairment charges establish a new cost basis for inventory andcharges are not subsequently reversed to income even if circumstances later suggest that increased carrying amounts are recoverable. In estimating ourreserves for obsolescence, we primarily evaluate estimates based on the timing of the introduction of our new products and the quantities remaining of our oldproducts and write down the value of inventory on hand in excess of the estimated demand. We wrote down US$2.5 million, US$4.6 million and US$2.5million in 2013, 2014 and 2015, respectively, for estimated obsolete or unmarketable inventory.
Stock-based compensation. All share-based payments, including grants of stock options and restricted stock units, are recognized in our financialstatements based upon their respective grant date fair values.
Calculating the fair value of stock option awards at the date of grant requires the use of an appropriate valuation model and judgment. We use theBlack-Scholes valuation formula to estimate the fair value of employee stock options. The Black-Scholes formula requires the use of input assumptions,including expected volatility, expected term, expected dividend rate and expected risk-free rate of return. Risk-free interest rate is based on the U.S. Treasuryyield curve in effect at the time of grant. Expected volatilities are based on historical volatilities of our ADS prices. We estimated our options’ expected termsusing our best estimate of the period of time from the grant date that we expect the options to remain outstanding. If we determined that another method forestimating expected volatility or expected term is more reasonable than our current methods, or if another method for calculating these input assumptions wasprescribed by authoritative guidance, the fair value
28

Table of Contents
calculated for future stock option awards could change significantly from those used for past awards, even if the critical terms of the awards were similar.Higher volatility and expected term will result in an increase to the fair value of stock option awards at the date of grant. The expected dividend rate andexpected risk-free rate of return are not as significant to the calculation of fair value. Stock option awards are expensed over the requisite service period of theindividual grantees, which generally equals the vesting period.
Valuation of long-lived assets and intangible assets with finite useful life. We evaluate the recoverability of long-lived assets and intangible assetswhenever events or changes in circumstances indicate the carrying value may not be recoverable. The carrying value of a long-lived asset is consideredimpaired when the sum of the anticipated undiscounted cash flows from such asset is separately identifiable and is less than the carrying value. If impairmentoccurs, a loss based on the excess of carrying value over the fair market value of the long-lived asset is recognized. Fair market value is determined byreference to quoted market prices, if available, or discounted cash flows, as appropriate. The impairment evaluations and the estimate of fair market valueinvolve management estimates of assets’ useful lives and future cash flows. Actual useful lives and cash flows could be different from those estimated bymanagement. This could have a material effect on our operating results and financial condition. No impairment losses were recognized in 2013, 2014 and2015.
Business combinations. When we acquire businesses, we allocate the purchase price to tangible assets and liabilities and identifiable intangible assetsacquired. Any residual purchase price is recorded as goodwill. The allocation of the purchase price requires management to make significant estimates indetermining the fair values of assets acquired and liabilities assumed, especially with respect to intangible assets. These estimates are based on historicalexperience and information obtained from the management of the acquired companies. These estimates can include, but are not limited to, the cash flows thatan asset is expected to generate in the future, the appropriate weighted-average cost of capital, and the synergistic benefits expected to be derived from theacquired business. These estimates are inherently uncertain and unpredictable. In addition, unanticipated events and circumstances may occur which mayaffect the accuracy or validity of such estimates.
Goodwill. We record goodwill when the consideration paid for an acquisition exceeds the fair value of net tangible and intangible assets acquired.
We measure and test goodwill on an annual basis or more frequently if we believe indicators of impairment exist. Our impairment review processcompares the fair value of the reporting unit in which the goodwill resides to its carrying value. We determined that our reporting units are equivalent to ouroperating segments or components of an operating segment for the purposes of completing our impairment test. We utilize a two-step approach to testinggoodwill for impairment. The first step tests for possible impairment by applying a fair value-based test. In computing fair value of our reporting units, we useestimates of future revenues, costs and cash flows from such units. The second step, if necessary, measures the amount of such impairment by comparing theimplied fair value of goodwill to its carrying value. If the carrying amount of goodwill exceeds its implied fair value, an impairment loss is recognized equalto that excess.
In 2013, 2014 and 2015, no impairment charges were recorded. The assessment was based upon a discounted cash flow analysis and analysis of ourmarket capitalization. The estimate of cash flow was based upon, among other things, certain assumptions about expected future operating performance suchas revenue growth rates and operating margins used to calculate projected future cash flows, risk-adjusted discount rates, future economic and marketconditions, and determination of appropriate market comparables. We based our fair value estimates on assumptions we believed to be reasonable but that areunpredictable and inherently uncertain. The long-term financial forecast represented the best estimate that we had at that time and we believed that itsunderlying assumptions were reasonable. However, actual performance in the near-term and longer-term could be materially different from the forecast,which could impact future estimates of fair value of our reporting units and may result in a charge to earnings in future periods due to the potential for furtherwrite-down of goodwill in connection with future impairment tests.
29
Table of Contents
Accounting for income taxes. In preparing our consolidated financial statements, we are required to estimate our income taxes in each of thejurisdictions in which we operate. This process involves estimating our actual current tax exposure together with assessing temporary differences resultingfrom differing treatment of items for tax and accounting purposes. These differences result in deferred tax assets and liabilities, which are included within ourconsolidated balance sheet. We must then assess the likelihood that our deferred tax assets will be recovered from future taxable income within the relevantjurisdiction and, to the extent we believe that recovery is not likely, we must establish a valuation allowance. The total amount of valuation allowance as ofDecember 31, 2013, 2014 and 2015 was US$16.3 million, US$16.8 million and US$19.0 million, respectively. We provide for a valuation allowance to theextent we believe that it is more likely than not that the deferred tax assets will not be recovered from future taxable income. Realization of the future taxbenefits related to the deferred tax assets is dependent on many factors, including our ability to generate taxable income within the period during which thetemporary differences reverse, the outlook for the economic environment in which we operate, and the overall future industry outlook. Should we determinethat we would not be able to realize all or part of our net deferred tax asset in the future, an additional allowance for the deferred tax asset would be charged toincome in the period the determination was made.
We utilize a two-step approach to recognizing and measuring uncertain tax positions. The first step is to evaluate the tax position for recognition bydetermining if the weight of available evidence indicates it is more likely than not that the position will be sustained on audit, including resolution of relatedappeals or litigation processes, if any. The second step is to measure the tax benefit as the largest amount which is more than 50% likely of being realizedupon ultimate settlement. The total amount of unrecognized tax benefits as of December 31, 2013, 2014 and 2015 was US$5.8 million, US$4.7 million andUS$5.6 million, respectively. As of December 31, 2014 and 2015, US$1.7 million and US$2.0 million, respectively, of interest and penalties wereaccrued. Fiscal years 2007 through 2014 remain subject to examination by the US Internal Revenue Service. Fiscal years 2009 through 2014 remain subject toexamination by other foreign tax jurisdictions. The ultimate outcome of tax matters may differ from our estimates and assumptions. Unfavorable settlement ofany particular issue would require the use of cash and could result in increased income tax expense. Favorable resolution could result in reduced income taxexpense. Within the next 12 months, we do not expect that our unrecognized tax benefits would change significantly. See Note 13 to the ConsolidatedFinancial Statements for further information regarding changes in unrecognized tax benefits during 2015.
Litigation and contingencies. From time to time, we have been subject to legal proceedings and claims relating to intellectual property rights and otheractions arising out of the normal course of business, as well as other matters identified in “Legal Proceedings,” in Item 8 of this Annual Report. Our successand future revenue growth will depend, in part, on our ability to protect our intellectual property. We rely on a combination of patent, copyright, trademarkand trade secret laws, as well as nondisclosure agreements and other methods, to protect our proprietary technologies. We have been issued patents and mayhave additional patents in the future; however, we cannot provide assurance that any patent will be issued as a result of any applications or, if issued, that anyclaims allowed will be sufficiently broad to protect our technology. In addition, it is possible that existing or future patents may be challenged, invalidated orcircumvented. It may be possible for a third party to copy or otherwise obtain and use our products or technology without authorization, developcorresponding technology independently or design around our patents. Effective copyright, trademark and trade secret protection may be unavailable orlimited in foreign countries. These disputes may result in costly and time consuming litigation or the license of additional elements of our intellectual propertyfor free.
It is possible that other companies may pursue litigation with respect to any claims such companies purport to have against us. The results of anylitigation are inherently uncertain. In the event of an adverse result in any litigation with respect to intellectual property rights relevant to our products thatcould arise in the future, we could be required to obtain licenses to the infringed technology, pay substantial damages under applicable laws, cease the use andsale of infringing products or to expend significant resources to develop non-infringing technology. Litigation frequently involves substantial expendituresand can require significant management attention, even if we ultimately prevail.
30
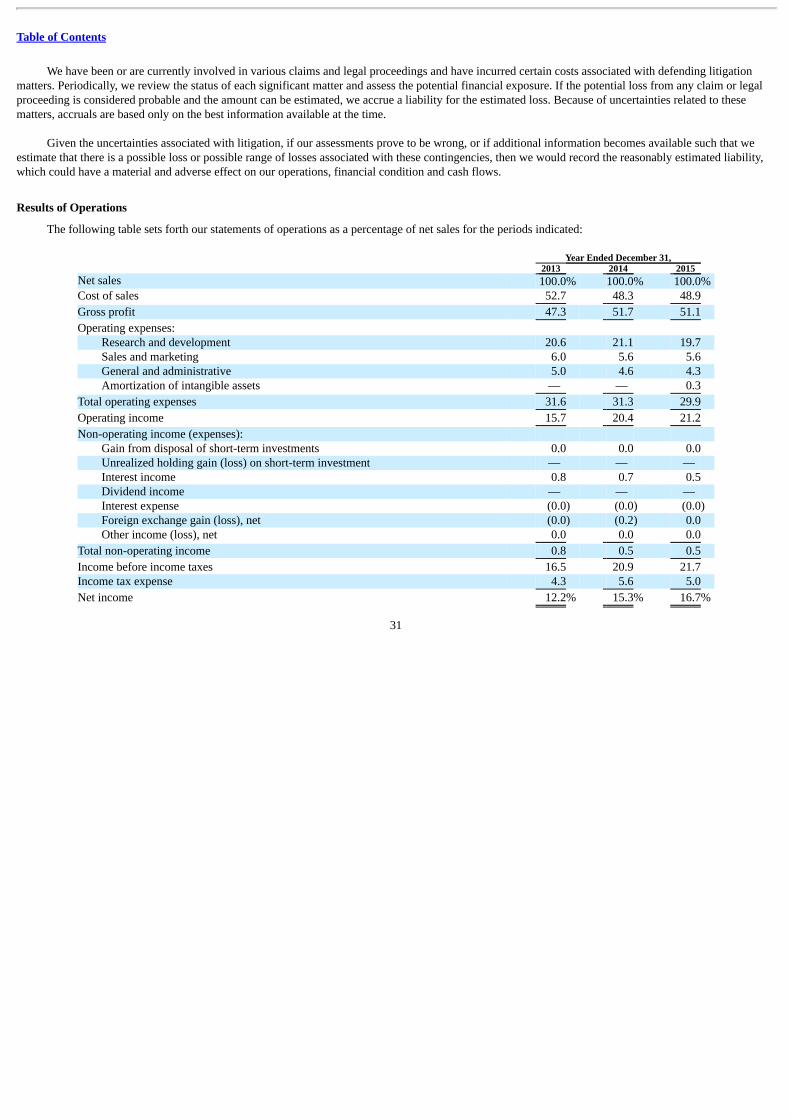
Table of Contents
We have been or are currently involved in various claims and legal proceedings and have incurred certain costs associated with defending litigationmatters. Periodically, we review the status of each significant matter and assess the potential financial exposure. If the potential loss from any claim or legalproceeding is considered probable and the amount can be estimated, we accrue a liability for the estimated loss. Because of uncertainties related to thesematters, accruals are based only on the best information available at the time.
Given the uncertainties associated with litigation, if our assessments prove to be wrong, or if additional information becomes available such that weestimate that there is a possible loss or possible range of losses associated with these contingencies, then we would record the reasonably estimated liability,which could have a material and adverse effect on our operations, financial condition and cash flows.
Results of Operations
The following table sets forth our statements of operations as a percentage of net sales for the periods indicated:
Year Ended December 31, 2013 2014 2015 Net sales 100.0% 100.0% 100.0% Cost of sales 52.7 48.3 48.9
Gross profit 47.3 51.7 51.1
Operating expenses: Research and development 20.6 21.1 19.7 Sales and marketing 6.0 5.6 5.6 General and administrative 5.0 4.6 4.3 Amortization of intangible assets — — 0.3
Total operating expenses 31.6 31.3 29.9
Operating income 15.7 20.4 21.2
Non-operating income (expenses): Gain from disposal of short-term investments 0.0 0.0 0.0 Unrealized holding gain (loss) on short-term investment — — — Interest income 0.8 0.7 0.5 Dividend income — — — Interest expense (0.0) (0.0) (0.0) Foreign exchange gain (loss), net (0.0) (0.2) 0.0 Other income (loss), net 0.0 0.0 0.0
Total non-operating income 0.8 0.5 0.5
Income before income taxes 16.5 20.9 21.7 Income tax expense 4.3 5.6 5.0
Net income 12.2% 15.3% 16.7%
31
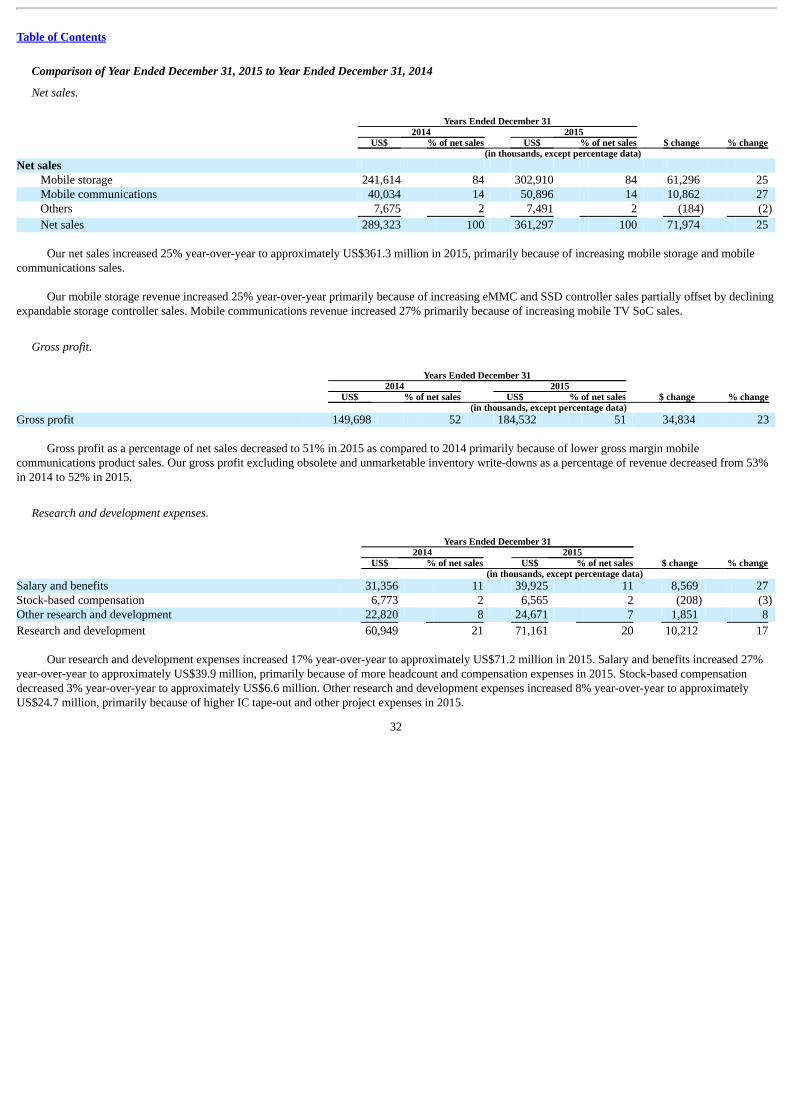
Table of Contents
Comparison of Year Ended December 31, 2015 to Year Ended December 31, 2014
Net sales. Years Ended December 31 2014 2015 US$ % of net sales US$ % of net sales $ change % change (in thousands, except percentage data) Net sales
Mobile storage 241,614 84 302,910 84 61,296 25 Mobile communications 40,034 14 50,896 14 10,862 27 Others 7,675 2 7,491 2 (184) (2)
Net sales 289,323 100 361,297 100 71,974 25
Our net sales increased 25% year-over-year to approximately US$361.3 million in 2015, primarily because of increasing mobile storage and mobilecommunications sales.
Our mobile storage revenue increased 25% year-over-year primarily because of increasing eMMC and SSD controller sales partially offset by decliningexpandable storage controller sales. Mobile communications revenue increased 27% primarily because of increasing mobile TV SoC sales.
Gross profit. Years Ended December 31 2014 2015 US$ % of net sales US$ % of net sales $ change % change (in thousands, except percentage data) Gross profit 149,698 52 184,532 51 34,834 23
Gross profit as a percentage of net sales decreased to 51% in 2015 as compared to 2014 primarily because of lower gross margin mobilecommunications product sales. Our gross profit excluding obsolete and unmarketable inventory write-downs as a percentage of revenue decreased from 53%in 2014 to 52% in 2015.
Research and development expenses. Years Ended December 31 2014 2015 US$ % of net sales US$ % of net sales $ change % change (in thousands, except percentage data) Salary and benefits 31,356 11 39,925 11 8,569 27 Stock-based compensation 6,773 2 6,565 2 (208) (3) Other research and development 22,820 8 24,671 7 1,851 8
Research and development 60,949 21 71,161 20 10,212 17
Our research and development expenses increased 17% year-over-year to approximately US$71.2 million in 2015. Salary and benefits increased 27%year-over-year to approximately US$39.9 million, primarily because of more headcount and compensation expenses in 2015. Stock-based compensationdecreased 3% year-over-year to approximately US$6.6 million. Other research and development expenses increased 8% year-over-year to approximatelyUS$24.7 million, primarily because of higher IC tape-out and other project expenses in 2015.
32
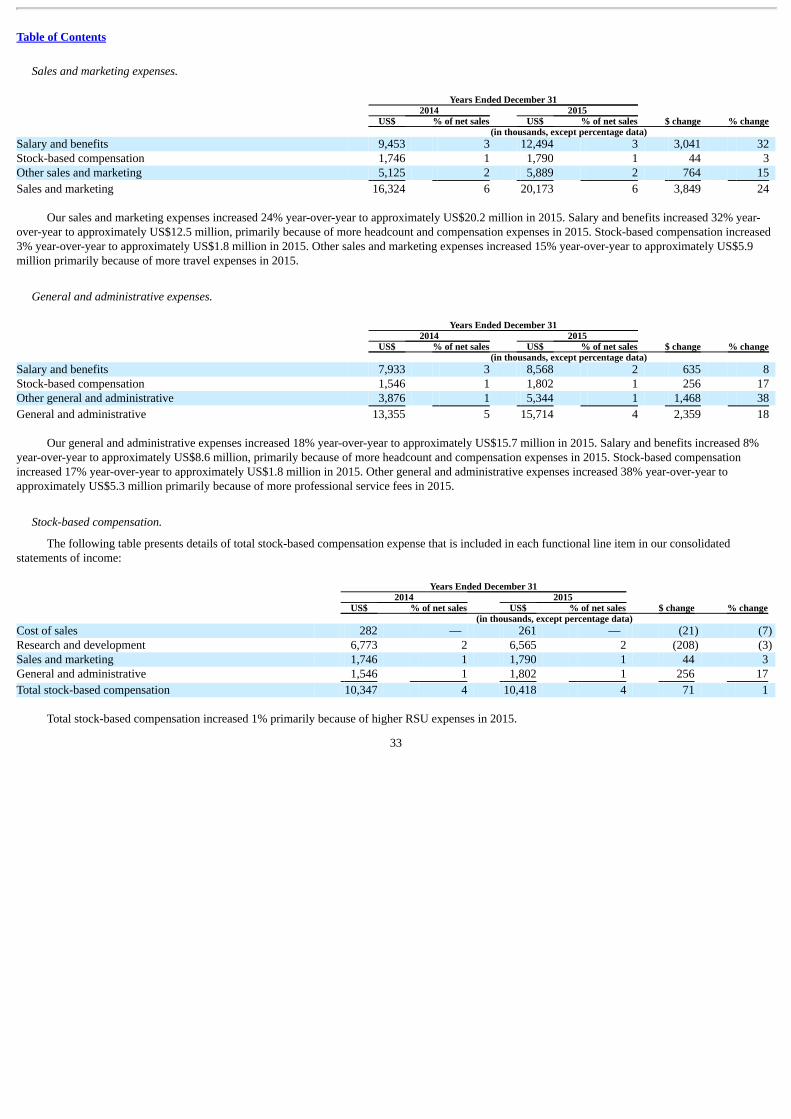
Table of Contents
Sales and marketing expenses. Years Ended December 31 2014 2015 US$ % of net sales US$ % of net sales $ change % change (in thousands, except percentage data) Salary and benefits 9,453 3 12,494 3 3,041 32 Stock-based compensation 1,746 1 1,790 1 44 3 Other sales and marketing 5,125 2 5,889 2 764 15
Sales and marketing 16,324 6 20,173 6 3,849 24
Our sales and marketing expenses increased 24% year-over-year to approximately US$20.2 million in 2015. Salary and benefits increased 32% year-over-year to approximately US$12.5 million, primarily because of more headcount and compensation expenses in 2015. Stock-based compensation increased3% year-over-year to approximately US$1.8 million in 2015. Other sales and marketing expenses increased 15% year-over-year to approximately US$5.9million primarily because of more travel expenses in 2015.
General and administrative expenses. Years Ended December 31 2014 2015 US$ % of net sales US$ % of net sales $ change % change (in thousands, except percentage data) Salary and benefits 7,933 3 8,568 2 635 8 Stock-based compensation 1,546 1 1,802 1 256 17 Other general and administrative 3,876 1 5,344 1 1,468 38
General and administrative 13,355 5 15,714 4 2,359 18
Our general and administrative expenses increased 18% year-over-year to approximately US$15.7 million in 2015. Salary and benefits increased 8%year-over-year to approximately US$8.6 million, primarily because of more headcount and compensation expenses in 2015. Stock-based compensationincreased 17% year-over-year to approximately US$1.8 million in 2015. Other general and administrative expenses increased 38% year-over-year toapproximately US$5.3 million primarily because of more professional service fees in 2015.
Stock-based compensation.
The following table presents details of total stock-based compensation expense that is included in each functional line item in our consolidatedstatements of income: Years Ended December 31 2014 2015 US$ % of net sales US$ % of net sales $ change % change (in thousands, except percentage data) Cost of sales 282 — 261 — (21) (7) Research and development 6,773 2 6,565 2 (208) (3) Sales and marketing 1,746 1 1,790 1 44 3 General and administrative 1,546 1 1,802 1 256 17
Total stock-based compensation 10,347 4 10,418 4 71 1
Total stock-based compensation increased 1% primarily because of higher RSU expenses in 2015.
33
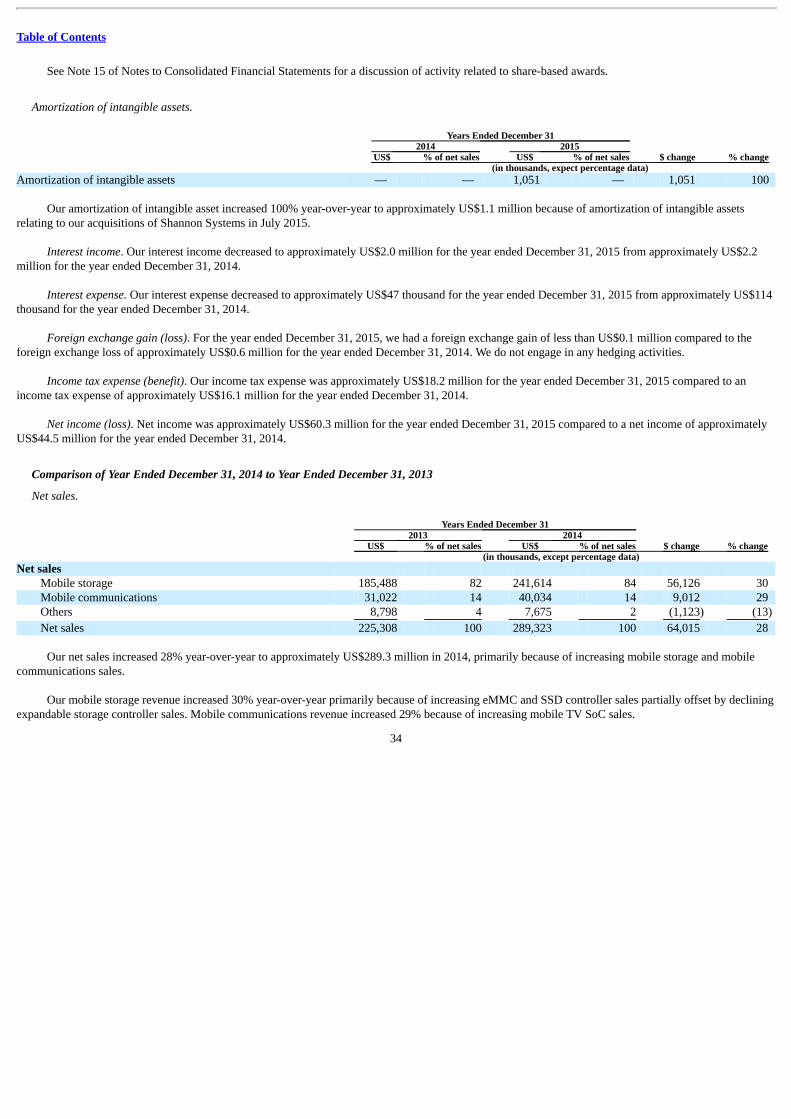
Table of Contents
See Note 15 of Notes to Consolidated Financial Statements for a discussion of activity related to share-based awards.
Amortization of intangible assets. Years Ended December 31 2014 2015 US$ % of net sales US$ % of net sales $ change % change (in thousands, expect percentage data) Amortization of intangible assets — — 1,051 — 1,051 100
Our amortization of intangible asset increased 100% year-over-year to approximately US$1.1 million because of amortization of intangible assetsrelating to our acquisitions of Shannon Systems in July 2015.
Interest income. Our interest income decreased to approximately US$2.0 million for the year ended December 31, 2015 from approximately US$2.2million for the year ended December 31, 2014.
Interest expense. Our interest expense decreased to approximately US$47 thousand for the year ended December 31, 2015 from approximately US$114thousand for the year ended December 31, 2014.
Foreign exchange gain (loss). For the year ended December 31, 2015, we had a foreign exchange gain of less than US$0.1 million compared to theforeign exchange loss of approximately US$0.6 million for the year ended December 31, 2014. We do not engage in any hedging activities.
Income tax expense (benefit). Our income tax expense was approximately US$18.2 million for the year ended December 31, 2015 compared to anincome tax expense of approximately US$16.1 million for the year ended December 31, 2014.
Net income (loss). Net income was approximately US$60.3 million for the year ended December 31, 2015 compared to a net income of approximatelyUS$44.5 million for the year ended December 31, 2014.
Comparison of Year Ended December 31, 2014 to Year Ended December 31, 2013
Net sales. Years Ended December 31 2013 2014 US$ % of net sales US$ % of net sales $ change % change (in thousands, except percentage data) Net sales
Mobile storage 185,488 82 241,614 84 56,126 30 Mobile communications 31,022 14 40,034 14 9,012 29 Others 8,798 4 7,675 2 (1,123) (13)
Net sales 225,308 100 289,323 100 64,015 28
Our net sales increased 28% year-over-year to approximately US$289.3 million in 2014, primarily because of increasing mobile storage and mobilecommunications sales.
Our mobile storage revenue increased 30% year-over-year primarily because of increasing eMMC and SSD controller sales partially offset by decliningexpandable storage controller sales. Mobile communications revenue increased 29% because of increasing mobile TV SoC sales.
34
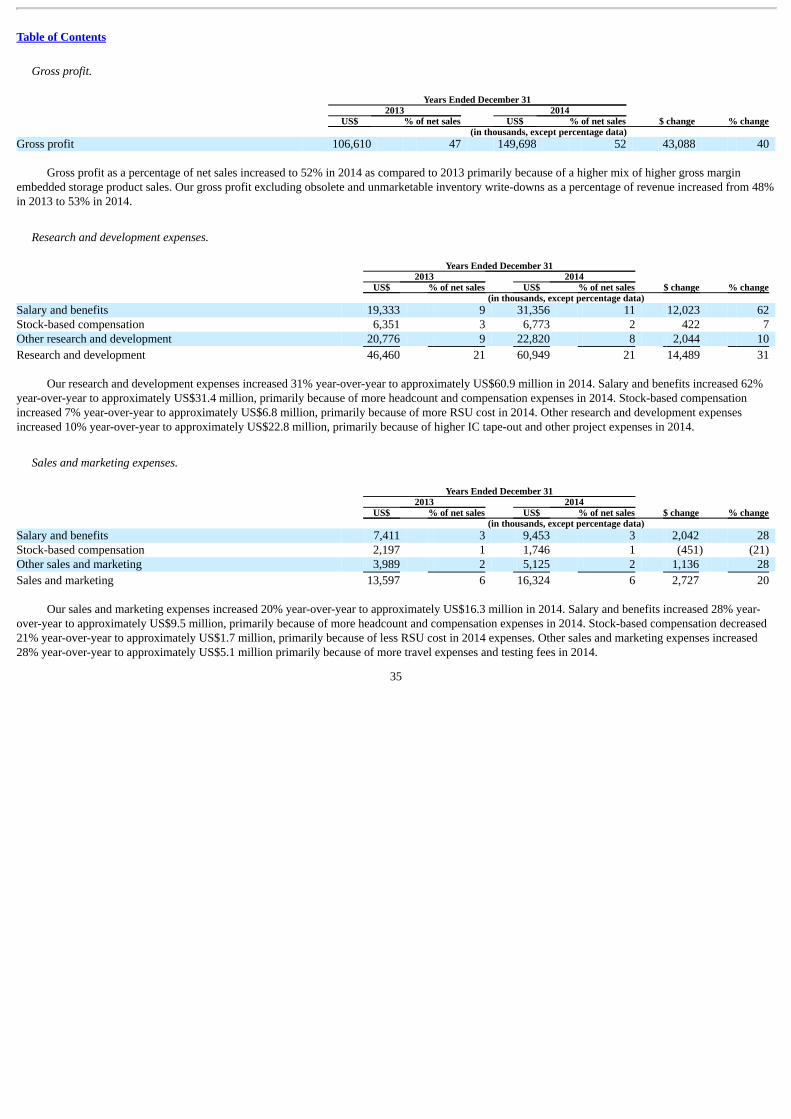
Table of Contents
Gross profit. Years Ended December 31 2013 2014 US$ % of net sales US$ % of net sales $ change % change (in thousands, except percentage data) Gross profit 106,610 47 149,698 52 43,088 40
Gross profit as a percentage of net sales increased to 52% in 2014 as compared to 2013 primarily because of a higher mix of higher gross marginembedded storage product sales. Our gross profit excluding obsolete and unmarketable inventory write-downs as a percentage of revenue increased from 48%in 2013 to 53% in 2014.
Research and development expenses. Years Ended December 31 2013 2014 US$ % of net sales US$ % of net sales $ change % change (in thousands, except percentage data) Salary and benefits 19,333 9 31,356 11 12,023 62 Stock-based compensation 6,351 3 6,773 2 422 7 Other research and development 20,776 9 22,820 8 2,044 10
Research and development 46,460 21 60,949 21 14,489 31
Our research and development expenses increased 31% year-over-year to approximately US$60.9 million in 2014. Salary and benefits increased 62%year-over-year to approximately US$31.4 million, primarily because of more headcount and compensation expenses in 2014. Stock-based compensationincreased 7% year-over-year to approximately US$6.8 million, primarily because of more RSU cost in 2014. Other research and development expensesincreased 10% year-over-year to approximately US$22.8 million, primarily because of higher IC tape-out and other project expenses in 2014.
Sales and marketing expenses. Years Ended December 31 2013 2014 US$ % of net sales US$ % of net sales $ change % change (in thousands, except percentage data) Salary and benefits 7,411 3 9,453 3 2,042 28 Stock-based compensation 2,197 1 1,746 1 (451) (21) Other sales and marketing 3,989 2 5,125 2 1,136 28
Sales and marketing 13,597 6 16,324 6 2,727 20
Our sales and marketing expenses increased 20% year-over-year to approximately US$16.3 million in 2014. Salary and benefits increased 28% year-over-year to approximately US$9.5 million, primarily because of more headcount and compensation expenses in 2014. Stock-based compensation decreased21% year-over-year to approximately US$1.7 million, primarily because of less RSU cost in 2014 expenses. Other sales and marketing expenses increased28% year-over-year to approximately US$5.1 million primarily because of more travel expenses and testing fees in 2014.
35
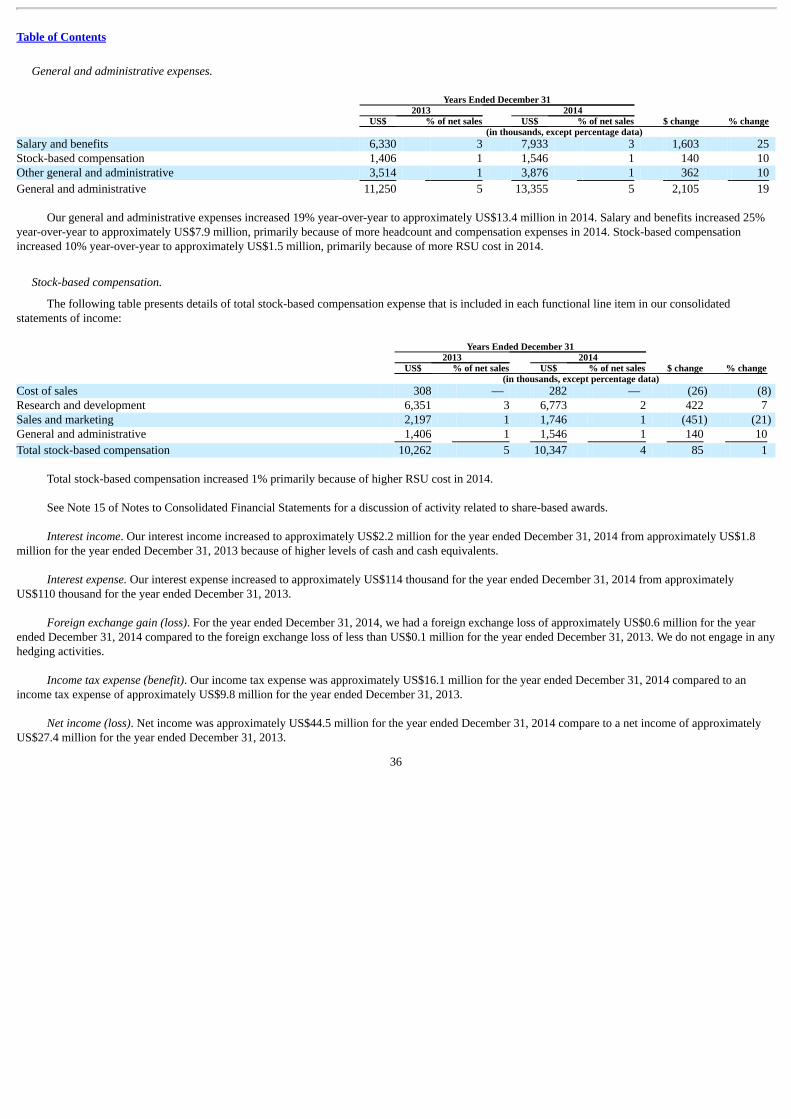
Table of Contents
General and administrative expenses. Years Ended December 31 2013 2014 US$ % of net sales US$ % of net sales $ change % change (in thousands, except percentage data) Salary and benefits 6,330 3 7,933 3 1,603 25 Stock-based compensation 1,406 1 1,546 1 140 10 Other general and administrative 3,514 1 3,876 1 362 10
General and administrative 11,250 5 13,355 5 2,105 19
Our general and administrative expenses increased 19% year-over-year to approximately US$13.4 million in 2014. Salary and benefits increased 25%year-over-year to approximately US$7.9 million, primarily because of more headcount and compensation expenses in 2014. Stock-based compensationincreased 10% year-over-year to approximately US$1.5 million, primarily because of more RSU cost in 2014.
Stock-based compensation.
The following table presents details of total stock-based compensation expense that is included in each functional line item in our consolidatedstatements of income: Years Ended December 31 2013 2014 US$ % of net sales US$ % of net sales $ change % change (in thousands, except percentage data) Cost of sales 308 — 282 — (26) (8) Research and development 6,351 3 6,773 2 422 7 Sales and marketing 2,197 1 1,746 1 (451) (21) General and administrative 1,406 1 1,546 1 140 10
Total stock-based compensation 10,262 5 10,347 4 85 1
Total stock-based compensation increased 1% primarily because of higher RSU cost in 2014.
See Note 15 of Notes to Consolidated Financial Statements for a discussion of activity related to share-based awards.
Interest income. Our interest income increased to approximately US$2.2 million for the year ended December 31, 2014 from approximately US$1.8million for the year ended December 31, 2013 because of higher levels of cash and cash equivalents.
Interest expense. Our interest expense increased to approximately US$114 thousand for the year ended December 31, 2014 from approximatelyUS$110 thousand for the year ended December 31, 2013.
Foreign exchange gain (loss). For the year ended December 31, 2014, we had a foreign exchange loss of approximately US$0.6 million for the yearended December 31, 2014 compared to the foreign exchange loss of less than US$0.1 million for the year ended December 31, 2013. We do not engage in anyhedging activities.
Income tax expense (benefit). Our income tax expense was approximately US$16.1 million for the year ended December 31, 2014 compared to anincome tax expense of approximately US$9.8 million for the year ended December 31, 2013.
Net income (loss). Net income was approximately US$44.5 million for the year ended December 31, 2014 compare to a net income of approximatelyUS$27.4 million for the year ended December 31, 2013.
36
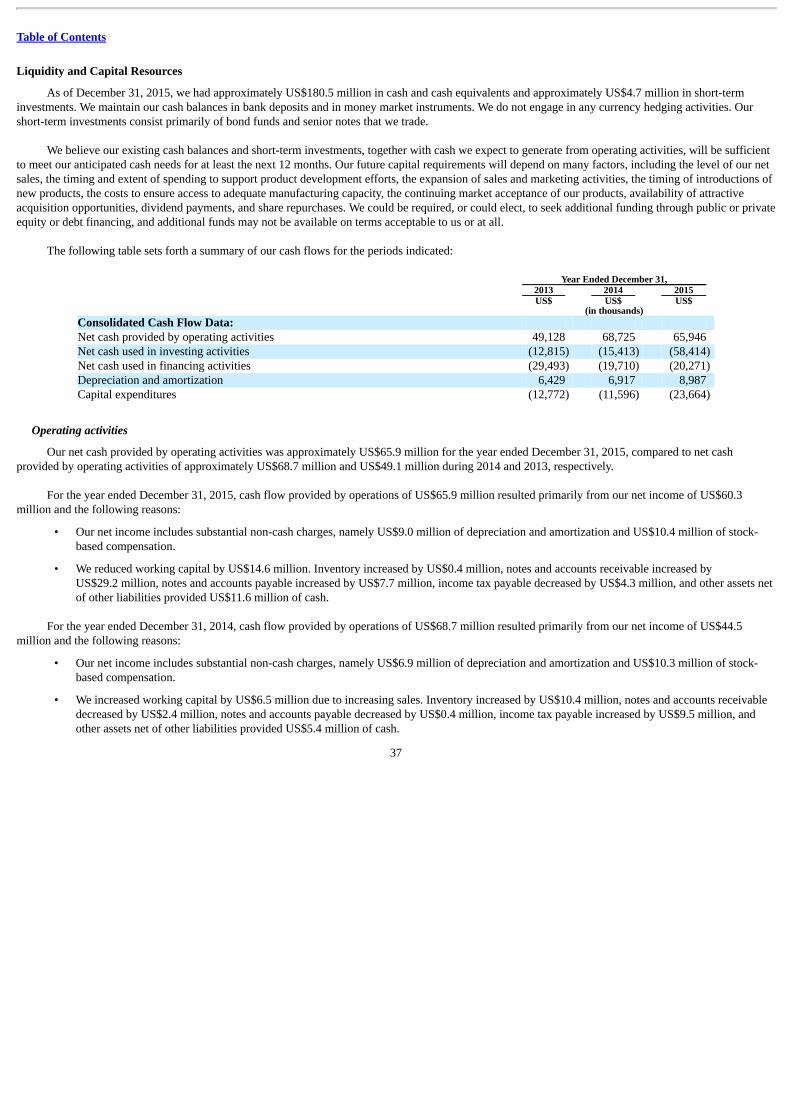
Table of Contents
Liquidity and Capital Resources
As of December 31, 2015, we had approximately US$180.5 million in cash and cash equivalents and approximately US$4.7 million in short-terminvestments. We maintain our cash balances in bank deposits and in money market instruments. We do not engage in any currency hedging activities. Ourshort-term investments consist primarily of bond funds and senior notes that we trade.
We believe our existing cash balances and short-term investments, together with cash we expect to generate from operating activities, will be sufficientto meet our anticipated cash needs for at least the next 12 months. Our future capital requirements will depend on many factors, including the level of our netsales, the timing and extent of spending to support product development efforts, the expansion of sales and marketing activities, the timing of introductions ofnew products, the costs to ensure access to adequate manufacturing capacity, the continuing market acceptance of our products, availability of attractiveacquisition opportunities, dividend payments, and share repurchases. We could be required, or could elect, to seek additional funding through public or privateequity or debt financing, and additional funds may not be available on terms acceptable to us or at all.
The following table sets forth a summary of our cash flows for the periods indicated:
Year Ended December 31, 2013 2014 2015 US$ US$ US$ (in thousands) Consolidated Cash Flow Data: Net cash provided by operating activities 49,128 68,725 65,946 Net cash used in investing activities (12,815) (15,413) (58,414) Net cash used in financing activities (29,493) (19,710) (20,271) Depreciation and amortization 6,429 6,917 8,987 Capital expenditures (12,772) (11,596) (23,664)
Operating activities
Our net cash provided by operating activities was approximately US$65.9 million for the year ended December 31, 2015, compared to net cashprovided by operating activities of approximately US$68.7 million and US$49.1 million during 2014 and 2013, respectively.
For the year ended December 31, 2015, cash flow provided by operations of US$65.9 million resulted primarily from our net income of US$60.3million and the following reasons:
• Our net income includes substantial non-cash charges, namely US$9.0 million of depreciation and amortization and US$10.4 million of stock-based compensation.
• We reduced working capital by US$14.6 million. Inventory increased by US$0.4 million, notes and accounts receivable increased by
US$29.2 million, notes and accounts payable increased by US$7.7 million, income tax payable decreased by US$4.3 million, and other assets netof other liabilities provided US$11.6 million of cash.
For the year ended December 31, 2014, cash flow provided by operations of US$68.7 million resulted primarily from our net income of US$44.5million and the following reasons:
• Our net income includes substantial non-cash charges, namely US$6.9 million of depreciation and amortization and US$10.3 million of stock-based compensation.
• We increased working capital by US$6.5 million due to increasing sales. Inventory increased by US$10.4 million, notes and accounts receivable
decreased by US$2.4 million, notes and accounts payable decreased by US$0.4 million, income tax payable increased by US$9.5 million, andother assets net of other liabilities provided US$5.4 million of cash.
37
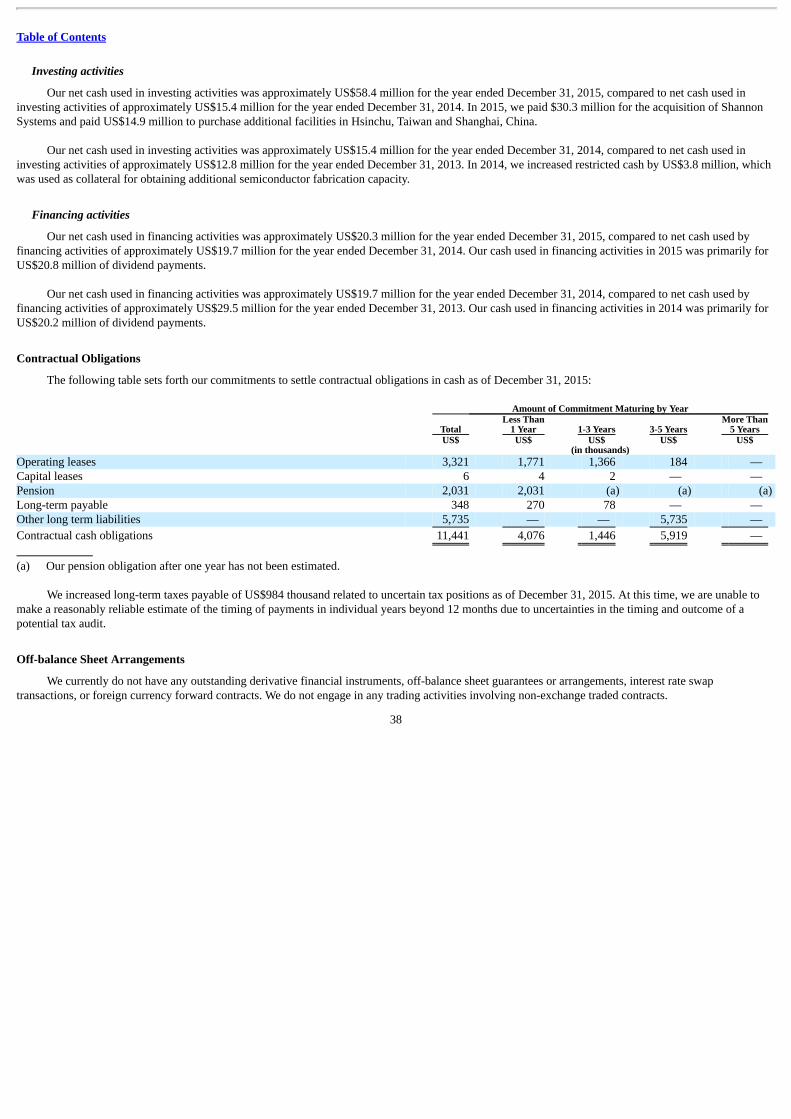
Table of Contents
Investing activities
Our net cash used in investing activities was approximately US$58.4 million for the year ended December 31, 2015, compared to net cash used ininvesting activities of approximately US$15.4 million for the year ended December 31, 2014. In 2015, we paid $30.3 million for the acquisition of ShannonSystems and paid US$14.9 million to purchase additional facilities in Hsinchu, Taiwan and Shanghai, China.
Our net cash used in investing activities was approximately US$15.4 million for the year ended December 31, 2014, compared to net cash used ininvesting activities of approximately US$12.8 million for the year ended December 31, 2013. In 2014, we increased restricted cash by US$3.8 million, whichwas used as collateral for obtaining additional semiconductor fabrication capacity.
Financing activities
Our net cash used in financing activities was approximately US$20.3 million for the year ended December 31, 2015, compared to net cash used byfinancing activities of approximately US$19.7 million for the year ended December 31, 2014. Our cash used in financing activities in 2015 was primarily forUS$20.8 million of dividend payments.
Our net cash used in financing activities was approximately US$19.7 million for the year ended December 31, 2014, compared to net cash used byfinancing activities of approximately US$29.5 million for the year ended December 31, 2013. Our cash used in financing activities in 2014 was primarily forUS$20.2 million of dividend payments.
Contractual Obligations
The following table sets forth our commitments to settle contractual obligations in cash as of December 31, 2015: Amount of Commitment Maturing by Year
Total Less Than
1 Year 1-3 Years 3-5 Years More Than
5 Years US$ US$ US$ US$ US$ (in thousands) Operating leases 3,321 1,771 1,366 184 — Capital leases 6 4 2 — — Pension 2,031 2,031 (a) (a) (a) Long-term payable 348 270 78 — — Other long term liabilities 5,735 — — 5,735 —
Contractual cash obligations 11,441 4,076 1,446 5,919 —
(a) Our pension obligation after one year has not been estimated.
We increased long-term taxes payable of US$984 thousand related to uncertain tax positions as of December 31, 2015. At this time, we are unable tomake a reasonably reliable estimate of the timing of payments in individual years beyond 12 months due to uncertainties in the timing and outcome of apotential tax audit.
Off-balance Sheet Arrangements
We currently do not have any outstanding derivative financial instruments, off-balance sheet guarantees or arrangements, interest rate swaptransactions, or foreign currency forward contracts. We do not engage in any trading activities involving non-exchange traded contracts.
38
Table of Contents
Recent Accounting Pronouncements
In April 10, 2014, the FASB issued an accounting update, which changes the criteria for reporting discontinued operations for all public and nonpublicentities. The guidance requires only disposals that represent a strategic shift that has (or will have) a major effect on the entity’s results and operations wouldqualify as discontinued operations. The guidance also requires entities 1) to expand their disclosures about discontinued operations to include moreinformation about assets, liabilities, income, and expenses and 2) to disclose the pre-tax income attributable to a disposal of “of an individually significantcomponent of an entity that does not qualify for discontinued operations presentation in the financial statements.” The guidance is effective for fiscal yearsbeginning after December 15, 2014 and early adoption is prohibited. The adoption of this guidance did not have a material impact on the Company’s resultsof operations, financial position or cash flow.
In May 2014, the FASB issued a new standard related to revenue recognition. Under the new standard, recognition of revenue occurs when a customerobtains control of promised goods or services in an amount that reflects the consideration to which the entity expects to be entitled in exchange for thosegoods or services. In addition, the new standard requires disclosure of the nature, amount, timing, and uncertainty of revenue and cash flows arising fromcontracts with customers. In August 2015, the FASB issued an amendment to defer the effective date. The new standard is effective for fiscal years beginningafter December 15, 2017 and early adoption is permitted for annual reporting periods beginning after December 15, 2016. In March and April 2016, theFASB issued two accounting updates to clarify the implementation guidance on principal versus agent considerations, performance obligations and thelicensing. The new guidance is required to be applied retrospectively to each prior reporting period presented or retrospectively with the cumulative effect ofinitially applying it recognized at the date of initial application. The Company is in the process of evaluating this guidance to determine the impact it will haveon the consolidated financial statements.
In June 2014, the FASB issued an accounting update, which clarifies the accounting for share-based payments. The guidance requires that aperformance target that affects vesting and that could be achieved after the requisite service period is treated as a performance condition. The guidance iseffective for fiscal years beginning after December 15, 2015 and early adoption is permitted. The adoption of this guidance is not expected to have a materialimpact on the Company’s results of operations, financial position or cash flow.
In August 2014, the FASB issued new standard related to the presentation of financial statements when there may be conditions or events that raisesubstantial doubt about the entity’s ability to continue as a going concern. This standard sets forth management’s responsibility to evaluate, each reportingperiod, whether there is substantial doubt about our ability to continue as a going concern, and if so, to provide related footnote disclosures. The standard iseffective for fiscal years beginning after December 15, 2016 and early adoption is permitted. The adoption of this guidance is not expected to have a materialimpact on the Company’s results of operations, financial position or cash flow.
In February 2015, the FASB issued an accounting update to amend the consolidation analysis. All legal entities are subject to reevaluation under therevised consolidation model. The amendment is effective for fiscal years beginning after December 15, 2015 and early adoption is permitted. The adoption ofthis amendment is not expected to have a material impact on the Company’s results of operations, financial position or cash flow.
In April 2015, the FASB issued an accounting update regarding the measurement date of a defined benefit obligation and plan assets. The amendmentpermits the entity with a fiscal year-end that does not coincide with a month-end to measure defined benefit plan assets and obligations using the month-endthat is closest to the entity’s fiscal year-end. If a contribution or significant event (such as a plan amendment, settlement, or curtailment that calls for aremeasurement in accordance with existing requirements) occurs between the month-end date used to measure defined benefit plan assets and obligations andan entity’s fiscal year-end, the entity should adjust the measurement of defined benefit plan assets and obligations to reflect the effects of those contributionsor significant events. This amendment is effective for fiscal years beginning after December 15,
39
Table of Contents
2016 and early application is permitted. The adoption of this amendment is not expected to have a material impact on the Company’s results of operations,financial position or cash flow.
In May 2015, the FASB issued an accounting update regarding disclosures for investments that calculate net asset value per share. The amendmentremoves the requirement to categorize within the fair value hierarchy all investments for which fair value is measured using the net asset value per sharepractical expedient. Instead, an entity is required to include those investments as a reconciling line item so that the total fair value amount of investments inthe disclosure is consistent with the amount on the balance sheet. Further, the amendment removes the requirement to make certain disclosures for allinvestments that are eligible to be measured at fair value using the net asset value per share practical expedient. Rather, those disclosures are limited toinvestments for which the entity has elected to measure the fair value using the practical expedient. The amendment is effective for fiscal years beginningafter December 15, 2015. The amendment must be applied retrospectively and early adoption is permitted. The adoption of this amendment is not expected tohave a material impact on the Company’s financial statement disclosure.
In July 2015, the FASB issued an accounting update to simplify the measurement of inventory. The amendment requires the measurement of inventoryat the lower of cost and net realizable value. Net realizable value is the estimated selling prices in the ordinary course of business, less reasonably predictablecosts of completion, disposal, and transportation. The amendment applies to inventories for which cost is determined by methods other than the last-in first-out and the retail inventory methods. This amendment is effective prospectively for annual periods beginning after December 15, 2016 and early applicationis permitted. The adoption of this amendment is not expected to have a material impact on the Company’s results of operations, financial position or cashflow.
In September 2015, the FASB issued an accounting update regarding simplifying the accounting for measurement period adjustments attributable to anacquisition. The amendment requires an acquirer must recognize adjustments to provisional amounts that are identified during the measurement period in thereporting period in which the adjustment amounts are determined. The adjustments should reflect the impact on earnings of changes in depreciation,amortization, or other income effects, if any, as if the accounting had been completed as of the acquisition date. Additionally, amounts recorded in the currentperiod that would have been reflected in prior reporting periods if the adjustments had been recognized as of the acquisition date must be disclosed either onthe face of the income statement or in the notes to financial statements. This amendment is effective prospectively for annual periods beginning afterDecember 15, 2015 and early application is permitted. The adoption of this guidance is not expected to have a material effect on the Company’s financialcondition, results of operations, cash flow and financial statement disclosures.
In November 2015, the FASB issued an accounting update to simplify the presentation of deferred income taxes. The amendment requires that deferredtax liabilities and assets be classified as noncurrent in a classified statement of financial position. The current requirement that deferred tax liabilities andassets of a tax-paying component of an entity be offset and presented as a single amount is not affected by the amendments in this guidance. This amendmentis effective prospectively or retrospectively for annual periods beginning after December 15, 2016 and early application is permitted. The Company haselected to adopt the amendment as of December 31, 2015, and the retrospective adoption is applied to prior reporting period presented. The adoption of thisamendment did not have a material impact on the Company’s financial position.
Prior to the adoption, noncurrent deferred income tax assets and current deferred income tax liabilities for the year ended December 31, 2014 areUS$1,909 thousand and US$388 thousand, respectively. To early adopt ASU 2015-17, the Company has reclassified current deferred income tax liabilities ofUS$388 thousand to noncurrent deferred tax liabilities by presenting against the noncurrent deferred income tax assets of US$1,909 thousand. After theadjustment, the noncurrent deferred income tax assets are US$1,521 thousand as of December 31, 2014.
40
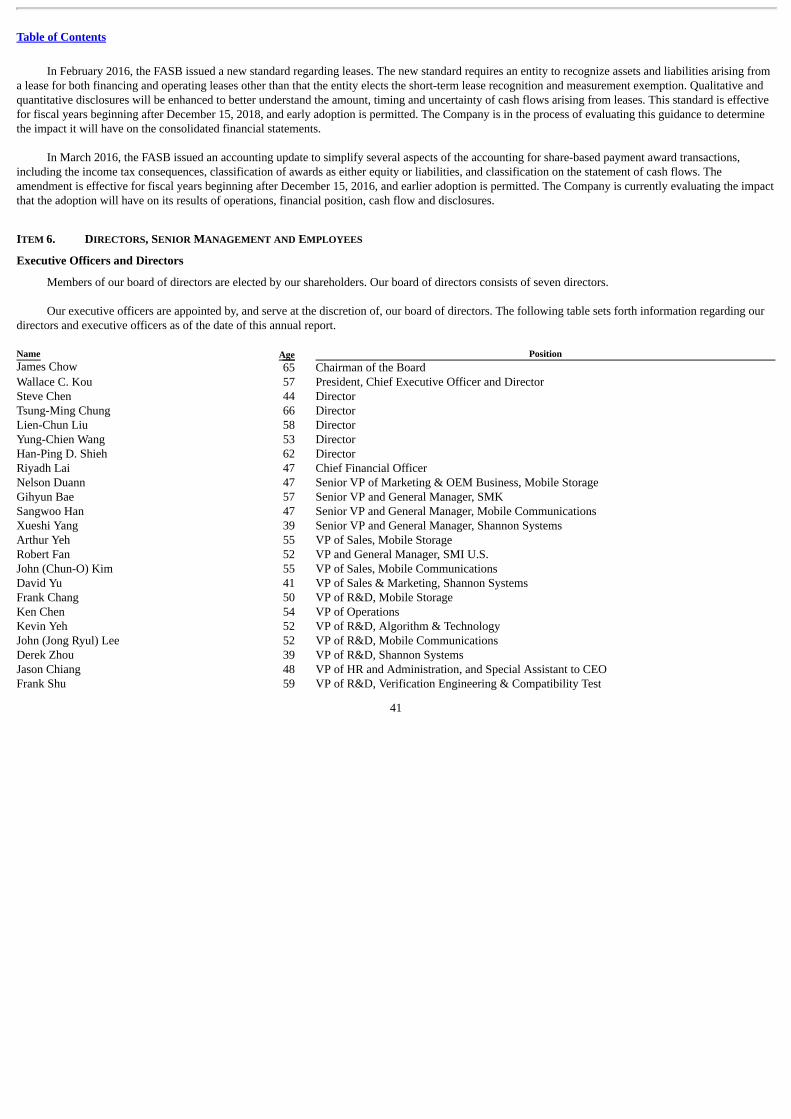
Table of Contents
In February 2016, the FASB issued a new standard regarding leases. The new standard requires an entity to recognize assets and liabilities arising froma lease for both financing and operating leases other than that the entity elects the short-term lease recognition and measurement exemption. Qualitative andquantitative disclosures will be enhanced to better understand the amount, timing and uncertainty of cash flows arising from leases. This standard is effectivefor fiscal years beginning after December 15, 2018, and early adoption is permitted. The Company is in the process of evaluating this guidance to determinethe impact it will have on the consolidated financial statements.
In March 2016, the FASB issued an accounting update to simplify several aspects of the accounting for share-based payment award transactions,including the income tax consequences, classification of awards as either equity or liabilities, and classification on the statement of cash flows. Theamendment is effective for fiscal years beginning after December 15, 2016, and earlier adoption is permitted. The Company is currently evaluating the impactthat the adoption will have on its results of operations, financial position, cash flow and disclosures.
ITEM 6. DIRECTORS, SENIOR MANAGEMENT AND EMPLOYEES
Executive Officers and Directors
Members of our board of directors are elected by our shareholders. Our board of directors consists of seven directors.
Our executive officers are appointed by, and serve at the discretion of, our board of directors. The following table sets forth information regarding ourdirectors and executive officers as of the date of this annual report. Name Age PositionJames Chow 65 Chairman of the BoardWallace C. Kou 57 President, Chief Executive Officer and DirectorSteve Chen 44 DirectorTsung-Ming Chung 66 DirectorLien-Chun Liu 58 DirectorYung-Chien Wang 53 DirectorHan-Ping D. Shieh 62 DirectorRiyadh Lai 47 Chief Financial OfficerNelson Duann 47 Senior VP of Marketing & OEM Business, Mobile StorageGihyun Bae 57 Senior VP and General Manager, SMKSangwoo Han 47 Senior VP and General Manager, Mobile CommunicationsXueshi Yang 39 Senior VP and General Manager, Shannon SystemsArthur Yeh 55 VP of Sales, Mobile StorageRobert Fan 52 VP and General Manager, SMI U.S.John (Chun-O) Kim 55 VP of Sales, Mobile CommunicationsDavid Yu 41 VP of Sales & Marketing, Shannon SystemsFrank Chang 50 VP of R&D, Mobile StorageKen Chen 54 VP of OperationsKevin Yeh 52 VP of R&D, Algorithm & TechnologyJohn (Jong Ryul) Lee 52 VP of R&D, Mobile CommunicationsDerek Zhou 39 VP of R&D, Shannon SystemsJason Chiang 48 VP of HR and Administration, and Special Assistant to CEOFrank Shu 59 VP of R&D, Verification Engineering & Compatibility Test
41
Table of Contents
Executive Officers and Directors
James Chow, Chairman of the Board of Directors
Mr. Chow has served as the Chairman of our board of directors since April 2005. Mr. Chow has been the Chairman of Concord Financial Co., Ltd.since 1993. Concord Financial Co., Ltd. is an investment holding company and was one of our significant shareholders. Mr. Chow has an MBA fromColumbia University.
Wallace C. Kou, President, Chief Executive Officer, Director
Mr. Kou founded Silicon Motion in 1995 and has been our President and Chief Executive Officer since our founding. Prior to founding Silicon Motion,Mr. Kou was the Vice President and Chief Architect at the Multimedia Products Division of Western Digital Corporation, which developed graphicsprocessors for notebook PCs and was sold to Philips Semiconductor in 1995. Before Western Digital, Mr. Kou worked for Wyse Technology. Mr. Kou has aBS in Electrical & Control Engineering from the National Chiao Tung University in Taiwan and an MS in Electrical & Computer Engineering from theUniversity of California at Santa Barbara.
Steve Chen, Director
Mr. Chen joined our board of directors in 2012. Mr. Chen is the chairman of Mercuries Co., Ltd.. Mr. Chen has two Master of Engineering degreesfrom Cornell University.
Tsung-Ming Chung, Director
Mr. Chung joined our board of directors in June 2005. Mr. Chung is the Chairman of Dynapack International Technology Corp, a leading provider ofbattery packs for notebook PCs and tablets. From 1985 to 2000, Mr. Chung was an audit partner at Arthur Andersen. He is also a director at Far EastInternational Bank and Taiwan Mobile Corporation. Mr. Chung has a BA in Business Administration from the National Taiwan University and an MBA fromthe National Cheng-chi University in Taiwan.
Lien-Chun Liu, Director
Ms. Liu joined our board of directors in June 2005. Ms. Liu is a research fellow at the Taiwan Research Institute. She also currently serves on the boardof supervisors of Concord VIII Venture Capital Co., Ltd, the board of directors of New Tamsui Golf Course, and the international Council of Women. From2000 to 2004, she also served on the board of supervisors of China Television Corp. Ms. Liu has a BA from Wellesley College and a JD from Boston CollegeLaw School.
Yung-Chien Wang, Director
Mr. Wang joined our board of directors in June 2005. Mr. Wang has over 20 years of working experience in the human resource and legal servicesindustries. Mr. Wang has been a consultant of Professional Trust Co., Ltd., a human resource consulting firm in Taiwan since August 1998 and is currently itsVice President. Mr. Wang has a law degree from Fu Jen Catholic University in Taiwan.
Han-Ping D. Shieh, Director
Mr. Shieh is currently a National Chiao Tung University Chair professor and teaches at the Display Institute and Department of Photronics, NationalChiao Tung University, Taiwan. He also serves as a Vice Chancellor of the University System of Taiwan. Mr. Shieh was a Changjiang Scholar at ShanghaiJiao Tong University in 2010, Senior Vice President from 2011 to 2013 and Dean of the College of Electrical & Computer Engineering from 2006 to 2010 atNational Chiao Tung University, and was a Research Staff Member at IBM Thomas J. Watson Research Center from 1988 to 1992. He is currently on theBoard of Directors at Young Optics, Jia-
42
Table of Contents
Chang Co., First Panel Co., and Tianma Microelectronics and is a Fellow of the Institute of Electrical and Electronics Engineers (IEEE), Optical Society ofAmerica, and Society for Information Display. Mr. Shieh received his PhD in Electrical & Computer Engineering from Carnegie Mellon University.
Riyadh Lai, Chief Financial Officer
Mr. Lai joined us in April 2007 from ING Corporate Finance, Asia, where he was the Head of the Technology Group. Previously, he was also aninvestment banker at Morgan Stanley and ABN AMRO and finance manager at PepsiCo in Hong Kong and New York. Mr. Lai has over two decades offinance and financial management experience. He has a BA in Economics from Georgetown University and an MBA from New York University.
Nelson Duann, Senior VP of Marketing & OEM Business, Mobile Storage
Mr. Duann became our Senior Vice President in charge of our mobile storage marketing and OEM business in July 2015. He joined Silicon Motion inAugust 2007 as a product marketing director and R&D team leader. Mr. Duann has almost 15 years of experience in the semiconductor industry in productdesign, development and marketing. Prior to Silicon Motion, he worked for Sun Microsystems Inc., focusing on UltraSPARC micro Processor projects. Hehas an MS in Communications Engineering from National Chiao Tung University in Taiwan and an MS in Electrical Engineering from Stanford University.
Gihyun Bae, Senior VP and General Manager, SMK
Mr. Bae became our Senior Vice President of Silicon Motion Korea in Jan 2016. He Joined Silicon Motion in January 2015 as a Senior Vice Presidentfor Product Planning and Strategic Business Development. Mr. Bae has 30 years of memory semiconductor experience, including 15 years in the NAND flashindustry. Before joining Silicon Motion, he served as Senior Vice President at SK Hynix in charge of its Flash Solution Development division andspearheaded SK Hynix’s very successful eMMC/eMCP sales growth and market share expansion. Prior to this role, Mr. Bae was Senior Vice President of SKHynix’s Flash Development division, responsible for directing the engineering of several generations of NAND flash technology. Mr. Bae was previously thePresident of the Korean operations of Anobit, the Israeli controller company. Mr. Bae has a BS in Electronic Material Engineering from Kyungpook NationalUniversity.
Sangwoo Han, Senior VP and General Manager, Mobile Communications
Mr. Han became the General Manager of our Mobile Communications product line in July 2008. He was formerly the Chief Technology Officer at FCI,a company that we acquired in April 2007. Mr. Han joined FCI in 2003 and had been in charge of product design, development, production and marketing. In1997, he co-founded RF Solutions Inc. in Atlanta, Georgia, which became the Anadigics Wireless LAN Center of Excellence. Mr. Han has a BS in ElectricalEngineering from Carnegie-Mellon University, an MS in Electrical Engineering from the University of Pennsylvania, and a PhD in Electrical Engineeringfrom the Georgia Institute of Technology.
Xueshi Yang, Senior VP and General Manager, Shannon Systems
Dr. Yang joined us in July 2015 as General Manager of Shannon Systems, our enterprise SSD product line, following our acquisition of thisbusiness. He co-founded Shannon Systems in 2011 and as CEO, led the development and commercialization of enterprise-grade PCIe SSDs that were theindustry’s first in terms of storage capacity and scalability, ultra-low latency and low-power envelope. Prior to Shannon, Dr. Yang was the chief architect atMarvell of its first generations of SSD controllers, a research staff at Seagate and postdoctoral researcher at Princeton University. He holds a PhD in ElectricalEngineering from Drexel University and a BS in Electrical Engineering from Tsinghua University in China. Dr. Yang has more than 100 US patents grantedor pending relating to SSDs.
43
Table of Contents
Arthur Yeh, VP of Sales, Mobile Storage
Mr. Yeh has served as our Vice President in charge of our mobile storage sales since November 2004. Mr. Yeh has over 15 years of sales experiencemanaging marketing strategies, including product promotions and sales activities for semiconductor products. Mr. Yeh previously served in managementpositions at VIA Technologies for 10 years and joined us in 2004. Mr. Yeh holds an MS degree in Management Business Administration from the NationalChung Hsing University, Taiwan.
Robert Fan, VP and General Manager, SMI U.S.
Mr. Fan has served as our Vice President and General Manager of SMI U.S. since May 2013. He manages Silicon Motion’s business operations in theU.S. and Europe and has over 20 years of sales and marketing experience. Prior to Silicon Motion, Mr. Fan served in executive management roles atSpansion, Entorian, Berkana Wireless (acquired by Qualcomm) and Resonext (acquired by RF Micro Devices). He also spent over nine years at Intel in sales,marketing and management positions. Mr. Fan holds a BS in Electrical Engineering from the University of California, Berkeley and MSEE from Santa ClaraUniversity, and completed the General Management Executive Program at McCombs School of Business, University of Texas.
John (Chun-O) Kim, VP of Sales, Mobile Communications
Mr. Kim became the Vice President of our Mobile Communications product line in July 2008. He was formerly the Vice President of Sales at FCI, acompany that we acquired in April 2007. Mr. Kim joined FCI in 2006 and had previously served in management positions at Hewlett-Packard’ssemiconductor division (now Avago Technologies) and as a CEO of a private company. Mr. Kim has over 16 years of semiconductor sales leadershipexperience, including managing marketing strategies, product promotions and sales activities. He has an MS in Electrical Engineering from Ajou Universityin Korea.
David Yu, VP of Sales & Marketing, Shannon Systems
Mr. Yu joined us in July 2015 as VP of Sales & Marketing of Shannon Systems, our enterprise SSD product line, following our acquisition of thisbusiness. He joined Shannon Systems in 2014 and has been instrumental in managing its rapid sales growth. Previously and for over 10 years, he held salesleadership positions at Infineon and RF Micro Devices in China. He holds an MS in Management from the University of Ottawa and a BS in ElectricalEngineering from Tsinghua University in China.
Frank Chang, VP of R&D, Mobile Storage
Mr. Chang has served as our Vice President of research and development since 2008. Mr. Chang is head of research and development for our mobilestorage products and has around 20 years of experience in the integrated circuit design industry. He was previously a project manager of firmwaredevelopment at Holtek Semiconductors. Mr. Chang has a BS in Electrical Engineering from the National Changhua University of Education in Taiwan.
Ken Chen, VP of Operations
Mr. Chen has served as our Vice President in charge of operations since November 2003. Mr. Chen has over 20 years of manufacturing and operationsexperience in the semiconductor industry, managing supply chain and virtual manufacturing systems including wafer fabrication, mask tooling, as well asassembly and testing. Mr. Chen previously served in management positions at Faraday Technology and UMC, and joined us in 2003. Mr. Chen has a BS inIndustrial Engineering from Chung Yuan Christian University in Taiwan and an MS in Industrial Engineering and Engineering Management from theNational Tsing Hua University, Taiwan.
44

Table of Contents
Kevin Yeh, VP of R&D, Algorithm & Technology
Mr. Yeh became our Vice President of research and development in August 2012. He joined Silicon Motion in September 2003 as a product marketingdirector and then he led the Algorithm and Technology R&D team. Mr. Yeh has more than 20 years of experience in semiconductor product design,development and marketing. Prior to Silicon Motion, Mr. Yeh worked in Taiwan Semiconductor Manufacturing Company, Neo Magic, VLSI Technology andLSI. Mr. Yeh holds a BS degree in Control Engineering from National Chiao Tung University in Taiwan and an MS degree in Electronic Engineering fromSyracuse University.
John (Jong Ryul) Lee, VP of R&D, Mobile Communications
Mr. Lee became the Vice President of our Mobile Communications product line in July 2008. He was formerly the Vice President of R&D at FCI, acompany that we acquired in April 2007. Mr. Lee joined FCI in 2000 and had been in charge of product design, development, production and quality systems.In 2013, he became a director of the Semiconductor & Device Society of The Institute of Electronics Engineers of Korean (IEEK). He was previously a seniorengineer at the Electronics and Telecommunications Research Institute (ETRI) in Korea. Mr. Lee has a BS and an MS in Electronics Engineering from ChungAng University in Korea.
Derek Zhou, VP of R&D, Shannon Systems
Mr. Zhou joined us in July 2015 as VP of R&D of Shannon Systems, our enterprise SSD product line, following our acquisition of this business. He co-founded Shannon Systems in 2011 with Dr. Yang and as CTO, managed the development of enterprise-grade PCIe SSDs that were the industry’s first in termsof storage capacity and scalability, ultra-low latency and low-power envelope. Prior to Shannon, he was a senior ASIC design engineer with 10 years ofexperience at Nvidia and Chrontel. He holds an MS in Electrical Engineering from Binghamton University and a BS in Electrical Engineering from TsinghuaUniversity in China.
Jason Chiang, VP of HR and Administration and Special Assistant to CEO
Mr. Chiang joined Silicon Motion in 2002 and has been serving as our Vice President of HR and Administration and Special Assistant to our CEOsince 2005. Mr. Chiang has more than 18 years of finance and business administration experience. Prior to joining Silicon Motion, Mr. Chiang was a Directorat Concord Venture Capital. Mr. Chiang has a BS in Economics from the National Taiwan University and an MS degree in Business Administration fromRochester University.
Frank Shu, VP of R&D, Verification Engineering & Compatibility Test
Mr. Shu has served as our Vice President of SSD System Technology since July 2012. Mr. Shu has more than 20 years of experience in the storage andPC system industry. Before joining Silicon Motion, Mr. Shu was the VP of R&D in charge of SSD testing at Allion Test Lab Inc. Mr. Shu also worked forMicrosoft and played a key role in defining and developing the software storage stack for the Windows operating system. Prior to Microsoft, Mr. Shu workedfor Fujitsu, Seagate and Everex. Mr. Shu has a BS in Electronic Engineering from Nanjing Aeronautical Institute in China and an MS degree in ComputerScience from the Oregon Graduate Institution of Science & Technology.
There is no arrangement or understanding with major shareholders, customers, suppliers or others pursuant to which any person referred to above wasselected as a director or member of senior management.
Board Practices
Board Committees
Our board of directors has established an audit committee, a compensation committee, and a nominating and corporate governance committee.
45
Table of Contents
Audit Committee. The audit committee is responsible for reviewing the financial information that will be provided to shareholders and others,reviewing the systems of internal controls that management and the board of directors have established, appointing, retaining and overseeing the performanceof the independent registered public accounting firm, overseeing our accounting and financial reporting processes and the audits of our financial statements,and pre-approving audit and permissible non-audit services provided by the independent registered public accounting firm. Tsung-Ming Chung, Lien-ChunLiu, and Yung-Chien Wang are members of our audit committee. Our board of directors has determined that Mr. Chung, the Chairman of the audit committee,is the committee’s “Audit Committee Financial Expert” as required by Nasdaq and U.S. Securities and Exchange Commission (“SEC”) rules.
Compensation Committee. The compensation committee’s basic responsibility is to review the performance and development of management inachieving corporate goals and objectives and to assure that our senior executives are compensated effectively in a manner consistent with our strategy,competitive practice and the requirements of the appropriate regulatory bodies. Toward that end, this committee oversees, reviews and administers all of ourcompensation, equity and employee benefit plans and programs. Lien-Chun Liu, Steve Chen, and Yung-Chien Wang are members of our compensationcommittee, with Mr. Chen serving as the Chairman of the committee.
Nominating and Corporate Governance Committee. The nominating and corporate governance committee is responsible for overseeing, reviewing andmaking periodic recommendations concerning our corporate governance policies, and for recommending to the full board of directors candidates for electionto the board of directors. Lien-Chun Liu, Steve Chen, and Yung-Chien Wang are members of our nominating and corporate governance committee, withMs. Liu serving as the Chairman of the committee.
Our board of directors has adopted a code of ethics, which is applicable to all of our employees. Our Code of Ethics is posted on our website atwww.siliconmotion.com.
Duties of Directors
Under Cayman Islands law, our directors have a duty to act honestly, in good faith and with a view to the best interests of our company. Our directorsalso have a duty to exercise the care, diligence and skills that a reasonably prudent person would exercise in comparable circumstances. In fulfilling their dutyof care to our company, our directors must ensure compliance with our memorandum and articles of association. The functions and powers of our board ofdirectors include, among others:
• convening shareholders’ meetings and reporting its work to shareholders at such meetings;
• implementing shareholders’ resolutions;
• determining our business plans and investment proposals;
• formulating our profit distribution plans and loss recovery plans;
• determining our debt and finance policies and proposals for the increase or decrease in our registered capital and the issuance of debentures;
• formulating our major acquisition and disposition plans, and plans for merger, division or dissolution;
• proposing amendments to our amended and restated memorandum and articles of association; and
• exercising any other powers conferred by the shareholders’ meetings or under our amended and restated memorandum and articles of association.
Terms of Directors and Officers
Under Cayman Islands law and our articles of association, our directors hold office until a successor has been duly elected and qualified. Our articles ofassociation provide that our directors serve for a term of three
46
Table of Contents
years, with one-third of the directors (or, if their number is not a multiple of three, the number nearest to but not greater than one-third) subject to re-electionat each annual general meeting of shareholders (chairman and managing director not subject to retirement by rotation nor to be taken into account indetermining the number of directors to retire), unless the director was appointed by the board of directors, in which case such director holds office until thenext annual meeting of shareholders at which time such director is eligible for re-election. One of our seven directors is currently subject to re-election at ournext annual general meeting of shareholders. All of our executive officers are appointed by and serve at the discretion of our board of directors.
Limitation on Liability and Other Indemnification Matters
Cayman Islands law and our articles of association allow us to indemnify our directors, secretary and other officers acting in relation to any of ouraffairs against actions, costs, charges, losses, damages and expenses incurred by reason of any act done or omitted in the execution of their duties as ourdirectors, secretary and other officers. Under our memorandum and articles of association, indemnification is not available to any matter in respect of anyfraud, dishonesty, willful misconduct or bad faith which may attach to any of them.
Compensation of Directors and Executive Officers
For the year ended December 31, 2015, the aggregate compensation to our directors and senior executive officers was approximately US$4.53 million.In 2015, we granted options and restricted stock units to our executive officers as a group to acquire an aggregate of 312,600 ordinary shares. The options andrestricted stock units granted to our executive officers and non-executive directors are subject to the same vesting conditions as those of our employees.
Service Contracts
We currently do not have service contracts with our directors.
Share-Based Compensation Plans and Option Grants
In April 2005, our board of directors and shareholders adopted our 2005 Incentive Plan. Our shareholders approved our Amended and Restated 2005Incentive Plan (referred to in this report as the “2005 Plan”) at our Annual General Meeting in August 2006, including an amendment to increase theauthorized number of shares available for issuance under the plan from 10,000,000 shares to 25,000,000 shares. In 2009, the board of directors amended the2005 Plan to increase the authorized shares available for issuance under the 2005 Plan to 40,000,000 shares. The 2005 Plan expired by its terms on April 22,2015. On June 3, 2015, the board of directors adopted the 2015 Incentive Plan (the “2015 Plan” and together with the 2005 Plan, the “Plans”). The 2015 Planreserved 20,000,000 shares of ordinary shares for issuance upon exercise of stock options and restricted stock units. The Plans provide for the grant of stockoptions, stock bonuses, restricted stock awards, restricted stock units and stock appreciation rights, which may be granted to our employees (includingofficers), directors and consultants.
Share Reserve. The aggregate number of ordinary shares that may be issued pursuant to awards granted under the 2005 Plan could not exceed40,000,000 shares and the aggregate number of ordinary shares that may be issued pursuant to awards granted under the 2015 Plan will not exceed20,000,000, inclusive of ordinary shares issuable upon exercise of awards previously granted under the Silicon Motion, Inc. Guidelines for Issuance andSubscription of Employee Stock Option, which options we have, subject to the consent of the respective option-holders, agreed to assume in the shareexchange.
The following types of shares issued under the Plans may again become available for the grant of new awards under the Plans: restricted stock issuedunder the Plans that is forfeited or repurchased by us prior to it becoming fully vested; shares withheld for taxes; shares tendered to us to pay the exerciseprice of an option; and shares subject to awards issued under the Plans that have expired or otherwise terminated without having been exercised in full.
47
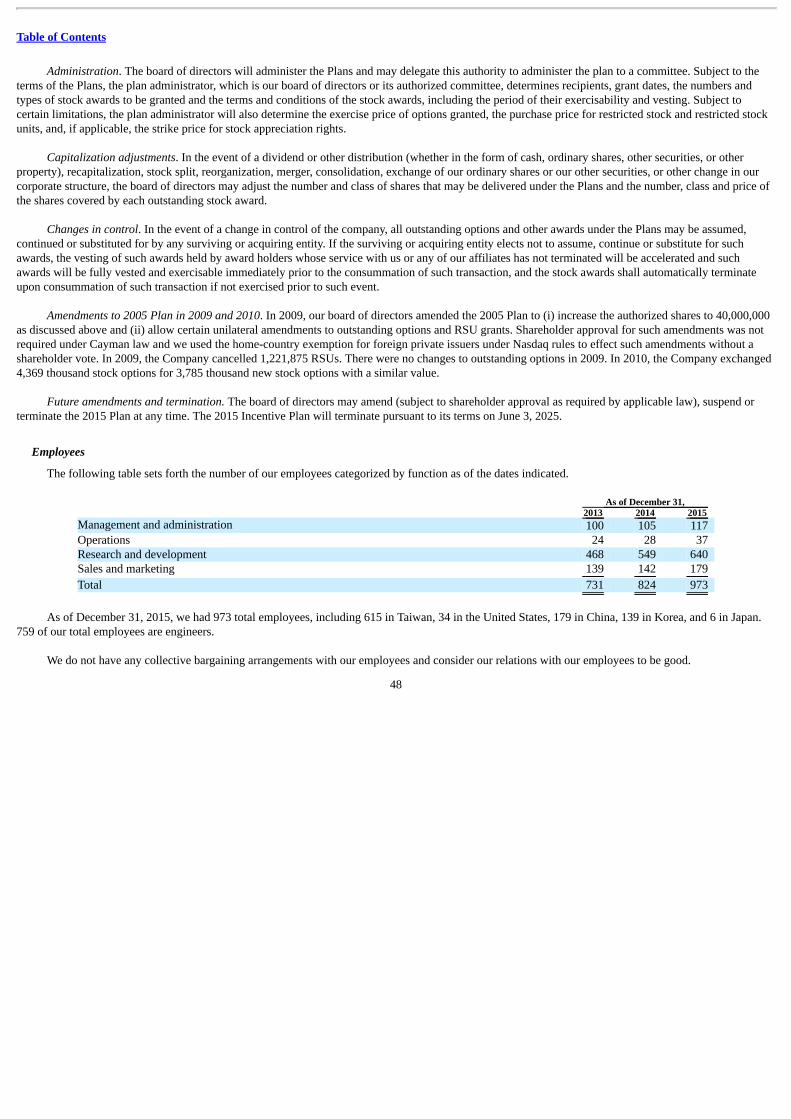
Table of Contents
Administration. The board of directors will administer the Plans and may delegate this authority to administer the plan to a committee. Subject to theterms of the Plans, the plan administrator, which is our board of directors or its authorized committee, determines recipients, grant dates, the numbers andtypes of stock awards to be granted and the terms and conditions of the stock awards, including the period of their exercisability and vesting. Subject tocertain limitations, the plan administrator will also determine the exercise price of options granted, the purchase price for restricted stock and restricted stockunits, and, if applicable, the strike price for stock appreciation rights.
Capitalization adjustments. In the event of a dividend or other distribution (whether in the form of cash, ordinary shares, other securities, or otherproperty), recapitalization, stock split, reorganization, merger, consolidation, exchange of our ordinary shares or our other securities, or other change in ourcorporate structure, the board of directors may adjust the number and class of shares that may be delivered under the Plans and the number, class and price ofthe shares covered by each outstanding stock award.
Changes in control. In the event of a change in control of the company, all outstanding options and other awards under the Plans may be assumed,continued or substituted for by any surviving or acquiring entity. If the surviving or acquiring entity elects not to assume, continue or substitute for suchawards, the vesting of such awards held by award holders whose service with us or any of our affiliates has not terminated will be accelerated and suchawards will be fully vested and exercisable immediately prior to the consummation of such transaction, and the stock awards shall automatically terminateupon consummation of such transaction if not exercised prior to such event.
Amendments to 2005 Plan in 2009 and 2010. In 2009, our board of directors amended the 2005 Plan to (i) increase the authorized shares to 40,000,000as discussed above and (ii) allow certain unilateral amendments to outstanding options and RSU grants. Shareholder approval for such amendments was notrequired under Cayman law and we used the home-country exemption for foreign private issuers under Nasdaq rules to effect such amendments without ashareholder vote. In 2009, the Company cancelled 1,221,875 RSUs. There were no changes to outstanding options in 2009. In 2010, the Company exchanged4,369 thousand stock options for 3,785 thousand new stock options with a similar value.
Future amendments and termination. The board of directors may amend (subject to shareholder approval as required by applicable law), suspend orterminate the 2015 Plan at any time. The 2015 Incentive Plan will terminate pursuant to its terms on June 3, 2025.
Employees
The following table sets forth the number of our employees categorized by function as of the dates indicated.
As of December 31, 2013 2014 2015 Management and administration 100 105 117 Operations 24 28 37 Research and development 468 549 640 Sales and marketing 139 142 179
Total 731 824 973
As of December 31, 2015, we had 973 total employees, including 615 in Taiwan, 34 in the United States, 179 in China, 139 in Korea, and 6 in Japan.759 of our total employees are engineers.
We do not have any collective bargaining arrangements with our employees and consider our relations with our employees to be good.
48

Table of Contents
Share Ownership
Under U.S. securities law, a person is deemed to be a “beneficial owner” of a security if that person has or shares “voting power,” which includes thepower to vote or to direct the voting of such security, or “investment power,” which includes the power to dispose of or to direct the disposition of suchsecurity. A person is also deemed to be the beneficial owner of any securities of which that person has a right to acquire beneficial ownership within 60 days.Under these rules, more than one person may be deemed a beneficial owner of securities as to which such person has no economic interest.
There were 141,061,384 of our ordinary shares outstanding as of March 31, 2016. The following table sets forth information with respect to thebeneficial ownership of our ordinary shares as of March 31, 2016, less otherwise indicated in the footnotes, by each of our directors and officers:
Shares Beneficially
Owned Number % Executive Officers and Directors: James Chow (1) 2,427,546 1.72 Wallace C. Kou (2) 3,442,994 2.44 Steve Chen (3) 10,000 * Tsung-Ming Chung (4) 94,280 * Lien-Chun Liu (5) 194,280 * Yung-Chien Wang (6) 808,674 * Han-Ping D. Shieh (7) 22,120 * Riyadh Lai (8) 1,750,380 1.24 Nelson Duann (9) 50,000 * Gihyun Bae (10) 16,000 * Sangwoo Han (11) 181,808 * Xueshi Yang (12) 987,732 * Arthur Yeh (13) 305,628 * Robert Fan (14) 52,000 * John (Chun-O) Kim (15) 100,400 * David Yu — * Frank Chang (16) 165,040 * Ken Chen (17) 292,869 * Kevin Yeh (18) 219,000 * John (Jong Ryul) Lee (19) 65,704 * Derek Zhou (20) 571,844 * Jason Chiang (21) 490,060 * Frank Shu (22) 36,000 *
* Less than one percent(1) Represents 2,427,546 shares owned by Mr. Chow. Mr. Chow is the chairman of Concord Consulting Inc. and Concord Financial Co. Ltd. which owned
42,445 and 196,491 shares, respectively. Mr. Chow disclaims any beneficial ownership of these shares.(2) Represents 3,150,500 shares owned by Mr. Kou, 35,094 shares owned by his spouse and 257,400 shares that Mr. Kou has the right to acquire within the
next 60 days upon the exercise of RSUs or options.(3) Represents 10,000 shares owned by Mr. Chen.(4) Represents 94,280 shares owned by Mr. Chung.(5) Represents 194,280 shares owned by Ms. Liu.(6) Represents 808,674 shares owned by Mr. Wang.(7) Represents 22,120 shares owned by Mr. Shieh.(8) Represents 688,400 shares owned by Mr. Lai, 819,880 shares owned by his spouse, 242,100 shares that Mr. Lai has the right to acquire within the next
60 days upon the exercise of options or RSUs.
49
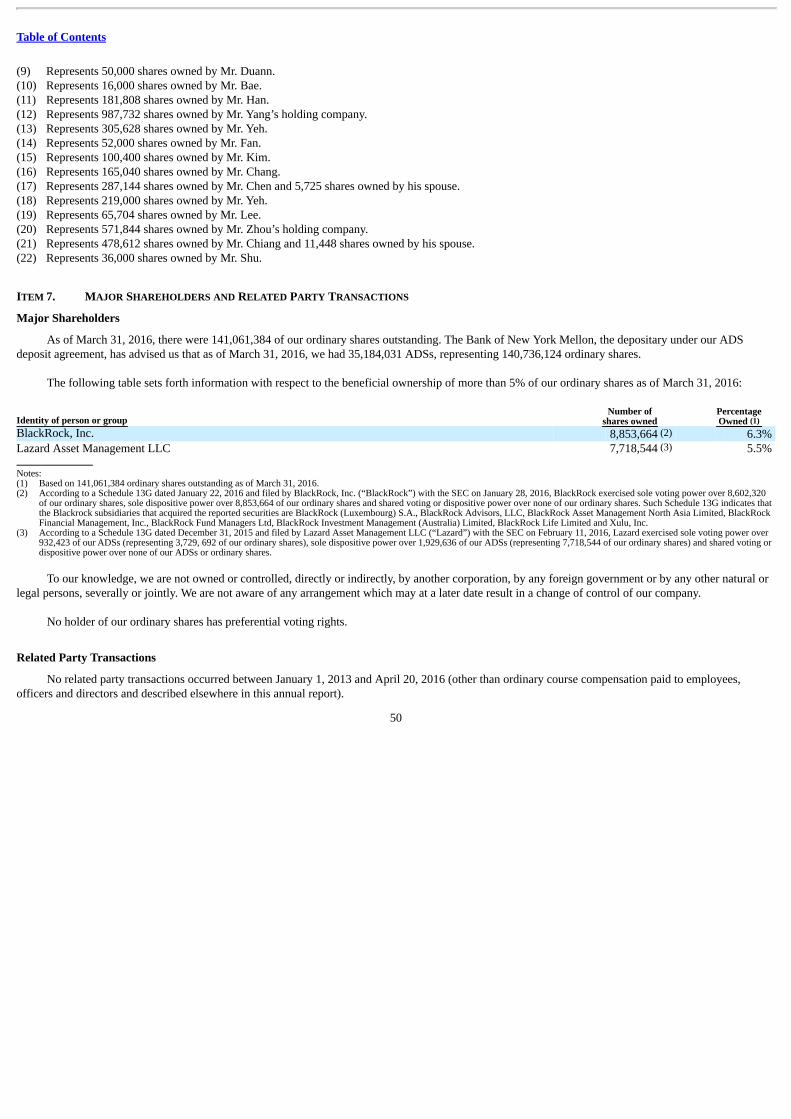
Table of Contents
(9) Represents 50,000 shares owned by Mr. Duann.(10) Represents 16,000 shares owned by Mr. Bae.(11) Represents 181,808 shares owned by Mr. Han.(12) Represents 987,732 shares owned by Mr. Yang’s holding company.(13) Represents 305,628 shares owned by Mr. Yeh.(14) Represents 52,000 shares owned by Mr. Fan.(15) Represents 100,400 shares owned by Mr. Kim.(16) Represents 165,040 shares owned by Mr. Chang.(17) Represents 287,144 shares owned by Mr. Chen and 5,725 shares owned by his spouse.(18) Represents 219,000 shares owned by Mr. Yeh.(19) Represents 65,704 shares owned by Mr. Lee.(20) Represents 571,844 shares owned by Mr. Zhou’s holding company.(21) Represents 478,612 shares owned by Mr. Chiang and 11,448 shares owned by his spouse.(22) Represents 36,000 shares owned by Mr. Shu.
ITEM 7. MAJOR SHAREHOLDERS AND RELATED PARTY TRANSACTIONS
Major Shareholders
As of March 31, 2016, there were 141,061,384 of our ordinary shares outstanding. The Bank of New York Mellon, the depositary under our ADSdeposit agreement, has advised us that as of March 31, 2016, we had 35,184,031 ADSs, representing 140,736,124 ordinary shares.
The following table sets forth information with respect to the beneficial ownership of more than 5% of our ordinary shares as of March 31, 2016: Identity of person or group
Number ofshares owned
PercentageOwned (1)
BlackRock, Inc. 8,853,664 (2) 6.3% Lazard Asset Management LLC 7,718,544 (3) 5.5% Notes:(1) Based on 141,061,384 ordinary shares outstanding as of March 31, 2016.(2) According to a Schedule 13G dated January 22, 2016 and filed by BlackRock, Inc. (“BlackRock”) with the SEC on January 28, 2016, BlackRock exercised sole voting power over 8,602,320
of our ordinary shares, sole dispositive power over 8,853,664 of our ordinary shares and shared voting or dispositive power over none of our ordinary shares. Such Schedule 13G indicates thatthe Blackrock subsidiaries that acquired the reported securities are BlackRock (Luxembourg) S.A., BlackRock Advisors, LLC, BlackRock Asset Management North Asia Limited, BlackRockFinancial Management, Inc., BlackRock Fund Managers Ltd, BlackRock Investment Management (Australia) Limited, BlackRock Life Limited and Xulu, Inc.
(3) According to a Schedule 13G dated December 31, 2015 and filed by Lazard Asset Management LLC (“Lazard”) with the SEC on February 11, 2016, Lazard exercised sole voting power over932,423 of our ADSs (representing 3,729, 692 of our ordinary shares), sole dispositive power over 1,929,636 of our ADSs (representing 7,718,544 of our ordinary shares) and shared voting ordispositive power over none of our ADSs or ordinary shares.
To our knowledge, we are not owned or controlled, directly or indirectly, by another corporation, by any foreign government or by any other natural orlegal persons, severally or jointly. We are not aware of any arrangement which may at a later date result in a change of control of our company.
No holder of our ordinary shares has preferential voting rights.
Related Party Transactions
No related party transactions occurred between January 1, 2013 and April 20, 2016 (other than ordinary course compensation paid to employees,officers and directors and described elsewhere in this annual report).
50
Table of Contents
ITEM 8. FINANCIAL INFORMATION
Consolidated Financial Statements
See “Item 18. Financial Statements” and pages F-1 through F-35 of this annual report.
Legal Proceedings
As an operating active company, we are subject to legal proceedings and claims, either asserted or unasserted, which arise in the ordinary course ofbusiness. Although the outcome of such proceedings and claims cannot be predicted with certainty, management does not believe that the outcome of any ofthese matters will have a material adverse effect on our business, results of operations, financial position or cash flows. Any litigation, however, involvespotential risk and potentially significant litigation costs, and therefore there can be no assurance that any litigation which is now pending or which may arisein the future would not have such material adverse effect on our business, financial position, results of operations or cash flows.
All American Semiconductor, Inc. (“All American” or “AASI”) was a former distributor for the Company. On April 25, 2007, All American filed forChapter 11 bankruptcy protection. At the time of the filing, we had US$256 thousand of unpaid accounts receivable from All American. On April 17, 2009,SMI USA and related entities were named as defendants in an adversary proceeding filed by the AASI Creditor Liquidating Trust (“CLT”) in the bankruptcycase pending in the U.S. Bankruptcy Court for the Southern District of Florida. The CLT was seeking the return of allegedly avoidable transfers in the amountof US$854 thousand. SMI USA filed an answer and affirmative defenses. In March 2010, SMI USA settled with the CLT by paying the amount of US$220thousand and on April 1, 2010, the Bankruptcy Court granted the motion to approve stipulations to compromise controversy. On August 23, 2010, the Courtentered an order dismissing the adversary proceeding. In June 2011, Liquidating Trustee for the CLT filed the AASI Creditor Liquidating Trustee’sSeventeenth Omnibus Objection to Claims but in August 2011, withdrew it with respect to SMI USA’s proof of claim. According to the CLT’s letter datedSeptember 9, 2011, it is currently finalizing its claims review process and preparing for distribution to beneficiaries who are holders of allowed claims andhave rights to a distribution pursuant to the bankruptcy plan. In January 2012, January 2014, December 2014, July 2015 and October 2015, we receiveddistributions of US$21 thousand, US$36 thousand, US$12 thousand, US$51 thousand and US$31 thousand, respectively. On March 29, 2016, we received afinal distribution of US$112 thousand.
In 2006, FCI joined with other technology companies and invested in the Pangyo Silicon Park Construction Project Cooperative (“PangyoCooperative”) in Korea. In July 2010, FCI, TLi Inc. (“TLI”), OCI Materials Co., Ltd (“OCI”) and other companies withdrew from the Pangyo Cooperativeand forfeited 10% of their total investment. FCI believes its loss was caused by bad will actions taken by TLI. In December 2011, FCI and OCI together fileda complaint against TLI at the Suwon District Court in Korea. In April 2013, the court dismissed the plaintiffs’ complaints. The plaintiffs have decided not toappeal the court’s decision.
Policy on Dividend Distributions
Pursuant to the laws and regulations of the ROC and the Articles of Incorporation of SMI Taiwan, our subsidiary in Taiwan must make appropriationsfrom annual earnings to a non-distributable reserve which could affect our ability to pay cash or stock dividends, if any. The Taiwan subsidiary may onlydistribute dividends after it has made allowances as determined under ROC GAAP at each year-end for:
a. Payment of taxes;
b. Recovery of prior years’ deficits, if any;
c. 10% of remaining balance after deduction for a and b as legal reserve;
d. Special reserve based on relevant laws or regulations or 10% of remaining balance for deduction from above a to c as special reserve whennecessary;
51
Table of Contents
e. Cash or stock bonus to employees at 0.01% of any remaining earnings after the above reserves have been appropriated, based on a resolution of
the board of directors. If bonus to employees is in the form of stock, the bonus may also be appropriated to employees of subsidiaries under theboard of directors’ approval.
The existing Articles of Incorporation of SMI Taiwan stipulates to distribute bonus to employees at 0.01% of net income (net of the bonus andremuneration). In accordance with the amendments to the Company Act in May 2015, the recipients of dividends and bonuses are limited to shareholders anddo not include employees. The consequential amendments to the Articles of Incorporation of SMI Taiwan will be approved by the SMI Taiwan’s board ofdirectors by June 30, 2016. The proposed amended Articles of Incorporation of SMI Taiwan will stipulate to distribute employees’ compensation andremuneration to directors and supervisors at rates no less than certain percentage or amount and no higher than certain percentage or amount, respectively, ofnet profit before income tax, employees’ compensation, and remuneration to directors and supervisors.
Dividends
We announced a total of $20.3 million and $36.5 million in dividends during 2014 and 2015, respectively. On November 2, 2015, our Board ofDirectors, instead of declaring a quarterly dividend, declared an annual dividend payable in four quarterly installments. Future dividends, if any, on ouroutstanding ADSs and ordinary shares will be declared by and subject to the discretion of our board of directors. If our board of directors decides to distributedividends, the form, frequency and amount of such dividends will depend upon our future operations and earnings, capital requirements and surplus, generalfinancial condition, contractual restrictions and other factors our board of directors may deem relevant.
Any future dividend we declare will be paid to the holders of ADSs, subject to the terms of the deposit agreement, to the same extent as holders of ourordinary shares, to the extent permitted by applicable laws and regulations, less the fees and expenses payable under the deposit agreement. Any dividend wedeclare will be distributed by the depositary bank to the holders of our ADSs. Cash dividends on our ordinary shares, if any, will be paid in U.S. dollars.
Significant Changes
No significant changes have occurred since the date of our audited consolidated financial statements.
52
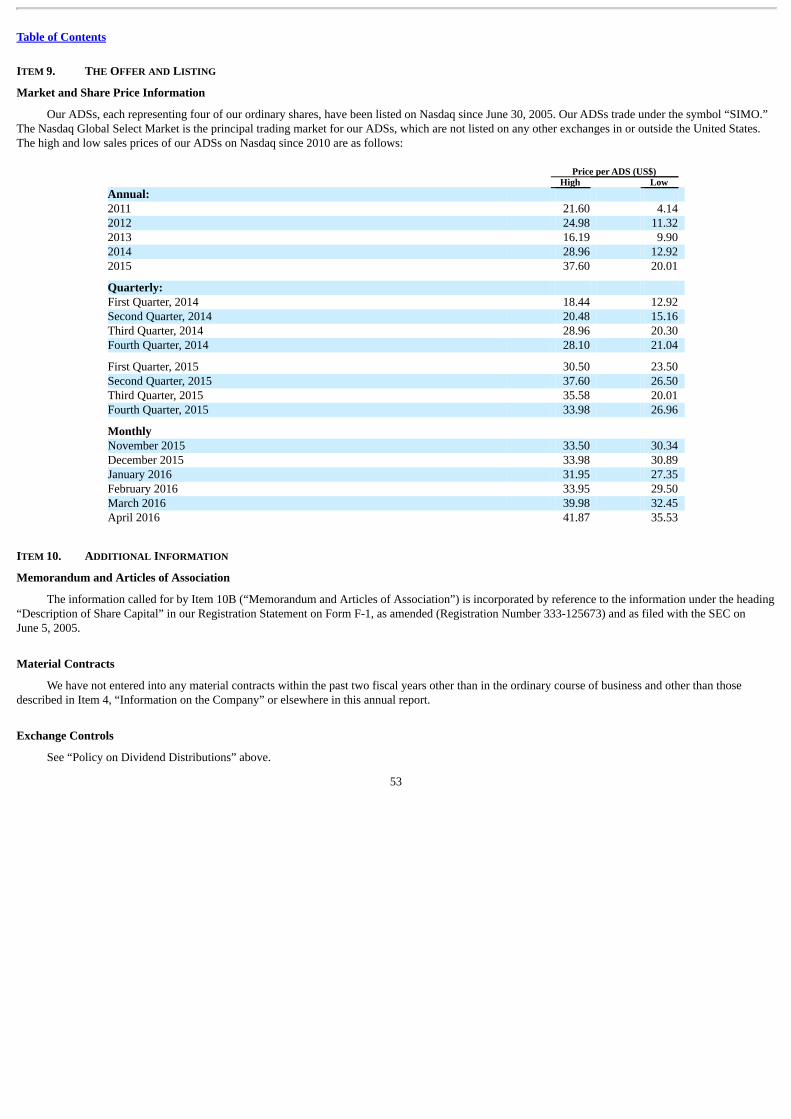
Table of Contents
ITEM 9. THE OFFER AND LISTING
Market and Share Price Information
Our ADSs, each representing four of our ordinary shares, have been listed on Nasdaq since June 30, 2005. Our ADSs trade under the symbol “SIMO.”The Nasdaq Global Select Market is the principal trading market for our ADSs, which are not listed on any other exchanges in or outside the United States.The high and low sales prices of our ADSs on Nasdaq since 2010 are as follows:
Price per ADS (US$) High Low Annual: 2011 21.60 4.14 2012 24.98 11.32 2013 16.19 9.90 2014 28.96 12.92 2015 37.60 20.01
Quarterly: First Quarter, 2014 18.44 12.92 Second Quarter, 2014 20.48 15.16 Third Quarter, 2014 28.96 20.30 Fourth Quarter, 2014 28.10 21.04
First Quarter, 2015 30.50 23.50 Second Quarter, 2015 37.60 26.50 Third Quarter, 2015 35.58 20.01 Fourth Quarter, 2015 33.98 26.96
Monthly November 2015 33.50 30.34 December 2015 33.98 30.89 January 2016 31.95 27.35 February 2016 33.95 29.50 March 2016 39.98 32.45 April 2016 41.87 35.53
ITEM 10. ADDITIONAL INFORMATION
Memorandum and Articles of Association
The information called for by Item 10B (“Memorandum and Articles of Association”) is incorporated by reference to the information under the heading“Description of Share Capital” in our Registration Statement on Form F-1, as amended (Registration Number 333-125673) and as filed with the SEC onJune 5, 2005.
Material Contracts
We have not entered into any material contracts within the past two fiscal years other than in the ordinary course of business and other than thosedescribed in Item 4, “Information on the Company” or elsewhere in this annual report.
Exchange Controls
See “Policy on Dividend Distributions” above.
53

Table of Contents
Taxation
United States Federal Income Taxation
The following discussion summarizes certain U.S. federal income tax consequences to a U.S. Holder, as defined below, who purchases our ADSs andordinary shares. This discussion assumes that investors will hold their ADSs or ordinary shares as capital assets (generally, property held for investment). Thisdiscussion does not discuss all aspects of U.S. federal income taxation which may be important to particular investors in light of their individualcircumstances, including investors subject to special taxation, such as:
• banks and financial institutions;
• brokers and dealers in securities or currencies;
• insurance companies;
• tax-exempt organizations and retirement plans;
• grantor trusts;
• S corporations;
• persons holding ADSs or ordinary shares as part of hedging, conversion, constructive sale, straddle or other integrated transactions;
• persons who acquired their ordinary shares upon the exercise of employee stock options or otherwise as compensation;
• persons who have elected the mark-to-market method of accounting;
• persons who own 10% or more of our ADSs or shares;
• real estate investment trusts or regulated investment companies;
• U.S. persons whose “functional currency” is not the U.S. dollar;
• certain former citizens or long-term residents of the United States; and
• Non-U.S. Holders (as defined below).
This discussion is based in part on representations by the depositary and assumes that each obligation under the deposit agreement and any relatedagreement will be performed in accordance with its terms. Furthermore, the discussion below is based upon the provisions of the Internal Revenue Code of1986, as amended (the “Code”), and U.S. Treasury regulations, rulings and judicial decisions hereunder as of the date hereof. Such authorities are subject tochange, possibly on a retroactive basis, which may result in U.S. federal income tax consequences different from those discussed below.
A person considering an investment in our ADSs or ordinary shares is urged to consult its tax advisor concerning U.S. federal, state, local andnon-U.S. income and other tax consequences.
A U.S. Holder is a beneficial owner of ADSs or ordinary shares that is for U.S. federal income tax purposes:
• a citizen or resident individual of the United States;
• a corporation or other entity taxable as a corporation created or organized in or under the laws of the United States, any state thereof, or theDistrict of Columbia;
• an estate the income of which is subject to U.S. federal income taxation, regardless of its source; or
• a trust if it is subject to the primary supervision of a court within the United States and one or more U.S. persons have the authority to control allsubstantial decisions of the trust or has a valid election in effect under applicable U.S. Treasury regulations to be treated as a U.S. person.
54
Table of Contents
A beneficial owner of ADSs or ordinary shares that is not a U.S. Holder is referred to herein as a “Non-U.S. Holder.”
If a partnership or limited liability company treated as a partnership for U.S. federal income tax purposes holds ADSs or ordinary shares, the taxtreatment of a partner or member will generally depend on the status of the partner or member and the activities of the partnership or such limited liabilitycompany. A partner of a partnership or a member of such a limited liability company holding ADSs or ordinary shares is urged to consult its tax advisorsregarding an investment in our ADSs or ordinary shares.
ADSs. In general, for U.S. federal income tax purposes, a U.S. Holder of ADSs will be treated as the owner of the underlying ordinary shares that arerepresented by such ADSs. Deposits and withdrawals of ordinary shares in exchange for ADSs will not be subject to U.S. federal income taxation.
Distributions on ADSs or ordinary shares. Unless the passive foreign investment company rules, as discussed below, apply, the gross amount of thedistributions in respect of the ADSs or ordinary shares will be subject to tax as dividend income to the extent of our current and accumulated earnings andprofits, as determined under U.S. federal income tax principles. Subject to certain limitations, dividends paid to non-corporate U.S. Holders, includingindividuals, may be eligible for a reduced rate of taxation if we are deemed to be a “qualified foreign corporation” for U.S. federal income tax purposes,provided that such holder satisfies certain holding period requirements with respect to the ownership of our ADSs or ordinary shares. Subject to theexceptions discussed below, a corporation is a qualified foreign corporation if it is:
• a foreign corporation that is eligible for the benefits of a comprehensive income tax treaty with the United States that includes an exchange ofinformation program; or
• a foreign corporation if its stock with respect to which a dividend is paid or its ADSs backed by such stock are readily tradable on an establishedsecurities market within the United States.
The Cayman Islands does not currently have a comprehensive income tax treaty with the United States. A foreign corporation (even if it is describedabove) does not constitute a qualified foreign corporation if, for the taxable year in which the dividend is paid or the preceding taxable year, the foreigncorporation is or was a passive foreign investment company. Although we believe that we are a qualified foreign corporation because the ADSs will be tradedon an established U.S. securities market and, as discussed below, we believe that we were not a passive foreign investment company for our 2015 tax year, noassurance can be given in this regard. In addition, our status as a qualified foreign corporation may change. A U.S. Holder that exchanges its ADSs forordinary shares may not be eligible for the reduced rate of taxation on dividends if the ordinary shares are not deemed to be readily tradable on an establishedsecurities market within the United States.
Dividends will be includable in a U.S. Holder’s gross income on the date actually or constructively received by the depositary, in the case of ADSs or,in the case of ordinary shares, by such U.S. Holder. These dividends will not be eligible for the dividends-received deduction generally allowed to U.S.corporations in respect of dividends received from other U.S. corporations.
To the extent we pay dividends on the ADSs or ordinary shares in a currency other than the U.S. dollar, the U.S. dollar value of such dividends shouldbe calculated by reference to the exchange rate prevailing on the date of actual or constructive receipt of the dividend, regardless of whether the foreigncurrency is converted into U.S. dollars at that time. If the foreign currency is converted into U.S. dollars on the date of actual or constructive receipt of suchdividends, the tax basis of the U.S. Holder in such foreign currency will be equal to its U.S. dollar value on that date and, as a result, the U.S. Holdergenerally should not be required to recognize any foreign currency exchange gain or loss. Dividends paid in respect of the ADSs or ordinary shares generallywill be treated as income from sources outside the United States.
55

Table of Contents
To the extent that the amount of any distribution exceeds our current and accumulated earnings and profits, the distribution will first be treated as a tax-free return of capital, causing a reduction in the adjusted basis of the ADSs or ordinary shares, and the balance in excess of adjusted basis will be taxed ascapital gain.
Sale, exchange or other disposition of ADSs or ordinary shares. Unless the passive foreign investment company rules, as discussed below, apply, uponthe sale, exchange or other disposition of ADSs or ordinary shares a U.S. Holder generally will recognize capital gain or loss equal to the difference betweenthe amount realized upon the sale, exchange or other disposition and the adjusted tax basis of the U.S. Holder in the ADSs or ordinary shares. The capital gainor loss generally will be long-term capital gain or loss if, at the time of sale, exchange or other disposition, the U.S. Holder has held the ADS or ordinaryshare for more than one year. Net long-term capital gains of non-corporate U.S. Holders, including individuals, are eligible for reduced rates of taxation. Thedeductibility of capital losses is subject to limitations. Any gain or loss that a U.S. Holder recognizes generally will be treated as gain or loss from sourceswithin the United States for U.S. foreign tax credit limitation purposes.
Additional tax on net investment income. An additional 3.8% federal income tax may be assessed on net investment income (including dividends, otherdistributions, and gain realized on the sale of ADSs or ordinary shares) earned by certain U.S. Holders. This tax does not apply to U.S. Holders who holdADSs or ordinary shares in the ordinary course of certain trades or businesses.
Passive foreign investment company rules. In general, we will be classified as a passive foreign investment company for any taxable year in whicheither (a) at least 75% of our gross income is passive income or (b) at least 50% of the value (determined on the basis of a quarterly average) of our assets isattributable to assets that produce or are held for the production of passive income. For this purpose, passive income generally includes dividends, interest,royalties, rents (other than rents and royalties derived in the active conduct of a trade or business and not derived from a related person), annuities and gainsfrom assets that produce passive income. If we own directly or indirectly at least 25% by value of the equity shares of another corporation, we will be treatedfor purposes of the passive foreign investment company tests as owning a proportionate share of the assets of the other corporation, and as receiving directly aproportionate share of the other corporation’s income.
We believe, based on our present and projected composition of our income and valuation of our assets, we were not classified as a passive foreigninvestment company for U.S. federal income tax purposes for our 2015 tax year, although no assurance can be given in this regard. Whether we are a passiveforeign investment company for any particular taxable year is determined on an annual basis and will depend on the composition of our income and assets,including goodwill. The calculation of goodwill will be based, in part, on the then market value of our capital stock, which is subject to fluctuation.Accordingly, there can be no assurance that we will not be classified as a passive foreign investment company in the current or any future taxable year.
If we are a passive foreign investment company for any taxable year during which a U.S. Holder has an equity interest in our company, unless the U.S.Holder makes a mark-to-market election as discussed below, such U.S. Holder will be subject to special tax rules in any future taxable year regardless ofwhether we are classified as a passive foreign investment company in such future years with respect to (a) “excess distributions” and (b) gain from thedisposition of stock. Excess distributions are defined generally as the excess of the amount received with respect to the equity interests in the taxable yearover 125% of the average annual distributions received in the shorter of either the three previous years or a U.S. Holder’s holding period before the taxableyear and must be allocated ratably to each day of the U.S. Holder’s holding period. The amount allocated to the current taxable year or any year before webecame a passive foreign investment company will be included as ordinary income in a U.S. Holder’s gross income for that year. The amount allocated toother prior taxable years will be taxed as ordinary income at the highest rate in effect for a U.S. Holder in that prior year and the tax is subject to an interestcharge at the rate applicable to deficiencies in income taxes. The entire amount of any gain realized upon the sale or other disposition of the equity interestswill be treated as an excess distribution made in the year of sale or other disposition and as a consequence will be treated as ordinary income and, to the extent
56
Table of Contents
allocated to years prior to the year of sale or disposition with respect to which we were a passive foreign investment company, will be subject to the interestcharge described above.
In certain circumstances, instead of being subject to the excess distribution rules discussed above, a U.S. Holder may make an election to include gainon the ADSs or ordinary shares of a passive foreign investment company as ordinary income under a mark-to-market method, provided that the ADSs orordinary shares are regularly traded on a qualified exchange. Under current law, the mark-to-market election is only available for ADSs or ordinary sharesthat are regularly traded within the meaning of U.S. Treasury regulations on certain designated U.S. exchanges and foreign exchanges that meet trading,listing, financial disclosure and other requirements to be treated as a qualified exchange under applicable U.S. Treasury regulations. The Nasdaq StockMarket is a qualified exchange. The ordinary shares may not be eligible for mark-to-market treatment under the foregoing rule even if the ADSs otherwisesatisfy the applicable requirement.
If a U.S. Holder makes a mark-to-market election, the U.S. Holder will include each year as ordinary income, rather than capital gain, the excess, if any,of the fair market value of the U.S. Holder’s ADSs or ordinary shares at the end of the taxable year over such U.S. Holder’s adjusted basis in the ADSs (orordinary shares, if applicable) and will be permitted an ordinary loss in respect of the excess, if any, of the adjusted basis of these ADSs or ordinary sharesover their fair market value at the end of the taxable year, but only to the extent of the net amount previously included in income as a result of the mark-to-market election. A U.S. Holder’s basis in the ADSs or ordinary shares will be adjusted to reflect any such income or loss amounts. Any gain or loss on thesale of the ADSs or ordinary shares will be ordinary income or loss, except that this loss will be ordinary loss only to the extent of the previously included netmark-to-market gain.
If we are a passive foreign investment company, then under certain circumstances a U.S. Holder must file Internal Revenue Service Form 8621.
Information Reporting and Back-up Withholding. The Foreign Account Tax Compliance Act (“FATCA”) generally requires that individuals that holdcertain specified foreign financial assets worth in excess of certain thresholds of $50,000 or more, depending on the individual’s circumstances, report suchownership to the IRS using IRS Form 8938. The definition of specified foreign financial assets includes not only financial accounts maintained in foreignfinancial institutions, but also, unless held in accounts maintained by a financial institution, any stock or security issued by a non-U.S. person, any financialinstrument or contract held for investment that has an issuer or counterparty other than a U.S. person and any interest in a foreign entity. A U.S. Holder maybe subject to this reporting requirement unless such holder’s ADSs or ordinary shares are held in an account at a domestic financial institution. The penaltyfor failing to file Form 8938 is substantial.
U.S. holders generally are subject to information reporting requirements with respect to dividends on, or proceeds from the disposition of, our ordinaryshares. In addition, a U.S. holder may be subject, under certain circumstances, to backup withholding at a rate of up to 28% with respect to dividends paid on,or proceeds from the disposition of, our ordinary shares unless the U.S. holder provides proof of an applicable exemption or correct taxpayer identificationnumber, and otherwise complies with the applicable requirements of the backup withholding rules. A U.S. holder of our ordinary shares who provides anincorrect taxpayer identification number may be subject to penalties imposed by the IRS. Amounts withheld under the backup withholding rules are not anadditional tax and may be refunded or credited against the U.S. holder’s U.S. federal income tax liability, provided the required information is furnished to theIRS.
A U.S. Holder is urged to consult its tax advisor concerning the U.S. federal income tax consequences of an investment in our ADSs or ordinary sharesif we are or become a passive foreign investment company, including the possibility of making a mark-to-market election.
57

Table of Contents
Cayman Islands Taxation
The Cayman Islands currently levy no taxes on individuals or corporations based upon profits, income, gains or appreciation and there is no taxation inthe nature of inheritance tax or estate duty. There are no other taxes likely to be material to our company levied by the Government of the Cayman Islandsexcept for stamp duties that may be applicable on instruments executed in, or after execution brought within the jurisdiction of, the Cayman Islands. TheCayman Islands are not party to any double taxation treaties. There are no exchange control regulations or currency restrictions in the Cayman Islands.
We have, pursuant to Section 6 of the Tax Concessions Law (1999 Revision) of the Cayman Islands, obtained an undertaking from the Governor-in-Council that:
• no law which is enacted in the Cayman Islands imposing any tax to be levied on profits or income or gains or appreciation applies to us or ouroperations; and
• the aforesaid tax or any tax in the nature of estate duty or inheritance tax are not payable on our ordinary shares, debentures or other obligations.
The undertaking that we have obtained is for a period of 20 years from March 1, 2005.
Documents on Display
We have previously filed with the SEC our registration statement on Form F-6 under the Securities Act of 1933, as amended (the “Securities Act”) withrespect to our ADSs.
We are subject to the periodic reporting and other informational requirements of the U.S. Securities Exchange Act of 1934, as amended (the “ExchangeAct”). Under the Exchange Act, we are required to file reports and other information with the SEC. Specifically, we are required to file annually a Form 20-Fno later than four months after the close of each fiscal year, which is December 31. As a foreign private issuer, we are exempt from the rules under theExchange Act prescribing the furnishing and content of quarterly reports and proxy statements, and our officers, directors, and principal shareholders areexempt from the reporting and short-swing profit recovery provisions of Section 16 of the Exchange Act.
Copies of reports and other information, when so filed, may be inspected without charge and may be obtained at prescribed rates at the public referencefacilities maintained by the Securities and Exchange Commission at the SEC’s public reference room in Washington D.C. at 100 F Street, N.E., Room 1580,Washington D.C. 20549. You can request copies of these documents upon payment of a duplicating fee, by writing to the SEC. Please call the SEC at 1-800-SEC-0330 for further information on the operation of the public reference rooms. The SEC also maintains a Website at www.sec.gov that contains reports,proxy and information statements, and other information regarding registrants that make electronic filings with the SEC using its EDGAR system.
ITEM 11. QUANTITATIVE AND QUALITATIVE DISCLOSURES ABOUT MARKET RISK
Interest rate risk. Our exposure to changes in interest rates is limited to interest income generated by our cash deposited with banks and short-terminvestments maintained in bond funds, structured notes and senior notes. We have not entered into any interest rate swap transactions. We do not believe thata 1% change in interest rates would have a significant impact on our operations.
Foreign currency risk. Since 2012, we consider our direct exposure to foreign exchange rate fluctuations to be minimal. Prior to 2012, we reported ourfinancial results in NT dollars and our direct exposure to foreign exchange rate fluctuations was more significant. Gains or losses from foreign currency re-measurement are included in “Non-Operating Income (Expenses)” in our Consolidated Financial Statements. The impact of
58
Table of Contents
foreign currency transaction gain or loss included in determining net income (loss) for 2013, 2014 and 2015 was nil, US$(0.6) million and US$0.1 million,respectively. Currently, the majority of our revenue, cost of sales, accounts receivable, and accounts payable are denominated in U.S. dollars. Increases in thevalue of the U.S. dollar relative to other currencies would make our products more expensive, which could negatively impact our ability to compete.Conversely, decreases in the value of the U.S. dollar relative to other currencies could result in our suppliers raising their prices in order to continue doingbusiness with us. Fluctuations in currency exchange rates could harm our business in the future. We do not utilize foreign exchange derivatives contracts toprotect against changes in foreign exchange rates.
Also refer to “Risk Factors — We are subject to risks associated with international operations which may harm our business.”
Investment Risk. Prior to March 2007, we invested in equity instruments of privately held companies. We have minority stake equity investments inCashido and Vastview Technology, private companies related to semiconductor and other technology industries. These investments are accounted for underthe cost method because our ownership is less than 20% and we do not have the ability to exercise significant influence over the operations of thesecompanies. As of December 31, 2015, the aggregate carrying value of these investments on our balance sheet was US$0.1 million. We monitor theseinvestments for impairment and make appropriate reductions in carrying value when an impairment is deemed to be other than temporary. There were noimpairments for the years ended on December 31, 2013, 2014 and 2015, respectively.
As of December 31, 2015, we also had the short-term investments of US$4.0 million in senior notes and of US$0.7 million in bond funds.
ITEM 12. DESCRIPTION OF SECURITIES OTHER THAN EQUITY SECURITIES
Depositary Fees and Charges. For the year-ended December 31, 2015, we received from our depositary bank a reimbursement of US$0.6 million, netof withholding tax, for our continuing annual stock exchange listing fees and our other expenses incurred in connection with maintaining and promoting ourADS program. In addition, the depositary bank has agreed to reimburse us annually for a fixed number of years for our continuing annual stock exchangelisting fees and our other expenses incurred in connection with maintaining and promoting our ADS program. The amount of annual reimbursements issubject to certain limits.
59
Table of Contents
PART II ITEM 13. DEFAULTS, DIVIDEND ARREARAGES AND DELINQUENCIES
Not applicable.
ITEM 14. MATERIAL MODIFICATIONS TO THE RIGHTS OF SECURITY HOLDERS AND USE OF PROCEEDS
Not applicable.
ITEM 15. CONTROLS AND PROCEDURES
Disclosure Controls and Procedures
We performed an evaluation of the effectiveness of the design and operation of our disclosure controls and procedures as of December 31, 2015.Disclosure controls and procedures are designed to ensure that the material financial and non-financial information required to be disclosed in this annualreport on Form 20-F and filed with the SEC is recorded, processed, summarized and reported within the time periods specified in the SEC’s rules and forms.The evaluation was performed with the participation of our key corporate senior management, and under the supervision of our Chief Financial Officer, orCFO, Riyadh Lai, and our President and Chief Executive Officer, or CEO, Wallace Kou. In designing and evaluating the disclosure controls and procedures,management recognized that any controls and procedures, no matter how well designed and operated, can provide only reasonable, rather than absolute,assurances of achieving the desired control objectives, and management necessarily was required to apply its judgment in evaluating the cost-benefitrelationship of possible controls and procedures. Based on the foregoing, our management, including our CEO and CFO, concluded that our disclosurecontrols and procedures were effective.
Management’s Report on Internal Control over Financial Reporting
Our management, including our CEO and CFO, is responsible for establishing and maintaining adequate internal control over financial reporting, asdefined under Exchange Act Rules 13a-15(f) and 15d-15(f). Our internal control over financial reporting is a process designed to provide reasonableassurance regarding the reliability of financial reporting and the preparation of financial statements for external purposes in accordance with accountingprinciples generally accepted in the United States. Internal control over financial reporting includes those policies and procedures that: (1) pertain to themaintenance of records that, in reasonable detail, accurately and fairly reflect the transactions and dispositions of our assets, (2) provide reasonable assurancethat transactions are recorded as necessary to permit preparation of financial statements in accordance with generally accepted accounting principles, and thatour receipts and expenditures are being made only in accordance with appropriate authorizations; and (3) provide reasonable assurance regarding preventionor timely detection of unauthorized acquisition, use, or disposition of our assets that could have a material effect on the financial statements.
Our management assessed the effectiveness of our internal control over financial reporting as of the end of the period covered by this annual reportbased on the criteria set forth in the Internal Control-Integrated Framework (2013) issued by the Committee of Sponsoring Organizations of the TreadwayCommission (“COSO”). Their assessment included an evaluation of the design of our internal control over financial reporting and testing of the operationaleffectiveness of our internal control over financial reporting. Based on that assessment, our management concluded that as of December 31, 2015 thecompany’s internal control over financial reporting was effective.
Deloitte & Touche, the independent registered public accounting firm that audited our consolidated financial statements included in this annual reporthas issued an attestation report regarding internal control over financial reporting.
60

Table of Contents
Our evaluation of the effectiveness of our internal control over financial reporting as of December 31, 2015 excluded the internal control over financialreporting of Shannon Systems, because Shannon Systems was acquired on July 1, 2015 and whose financial statements constitute 6.20% and 5.45% of netand total assets, respectively, 2.50% of net sales, and 0.70% of net income of the consolidated financial statement amounts as of and for the year endedDecember 31, 2015.
Changes in Internal Control over Financial Reporting
Other than as explained below, during 2015, no change to our internal control over financial reporting occurred that has materially affected, or isreasonably likely to materially affect, our internal control over financial reporting.
On July 1, 2015, we closed the acquisition of Shannon Systems. As a result of the timing, breadth and complexity of the transaction, we increased thelevel of resources involved in the application of our internal processes and controls to the financial closing. During 2016, we expect the following will occurwith respect to these acquired businesses: (1) they will continue the transition to our accounting and reporting policies and processes, and (2) their systemsand processes will be integrated into our framework of internal controls over financial reporting. These actions may precipitate changes in processes orcontrols.
Inherent Limitations on Effectiveness of Controls
All internal control systems no matter how well designed and implemented have inherent limitations. Even systems determined to be effective may notprevent or detect misstatements or fraud and can only provide reasonable assurance with respect to disclosure and financial statement presentation andreporting. Additionally, projections of any evaluation of effectiveness to future periods are subject to the risk that controls may become inadequate because ofchanged conditions and the degree of compliance with the policies or procedures may deteriorate.
61
Table of Contents
Attestation Report Of The Independent Registered Public Accounting Firm
REPORT OF INDEPENDENT REGISTERED PUBLIC ACCOUNTING FIRM
We have audited the internal control over financial reporting of Silicon Motion Technology Corporation and subsidiaries (the “Company”) as ofDecember 31, 2015, based on criteria established in Internal Control — Integrated Framework (2013) issued by the Committee of Sponsoring Organizationsof the Treadway Commission. As described in Management’s Report on Internal Control over Financial Reporting, management excluded from its assessmentthe internal control over financial reporting at Shannon Systems, which was acquired on July 1, 2015 and whose financial statements constitute 6.20% and5.45% of net and total assets, respectively, 2.50% of net sales, and 0.70% of net income of the consolidated financial statement amounts as of and for the yearended December 31, 2015. Accordingly, our audit did not include the internal control over financial reporting at Shannon Systems. The Company’smanagement is responsible for maintaining effective internal control over financial reporting and for its assessment of the effectiveness of internal controlover financial reporting, included in the accompanying Management’s Report on Internal Control over Financial Reporting. Our responsibility is to express anopinion on the Company’s internal control over financial reporting based on our audit.
We conducted our audit in accordance with the standards of the Public Company Accounting Oversight Board (United States). Those standards requirethat we plan and perform the audit to obtain reasonable assurance about whether effective internal control over financial reporting was maintained in allmaterial respects. Our audit included obtaining an understanding of internal control over financial reporting, assessing the risk that a material weakness exists,testing and evaluating the design and operating effectiveness of internal control based on the assessed risk, and performing such other procedures as weconsidered necessary in the circumstances. We believe that our audit provides a reasonable basis for our opinion.
A company’s internal control over financial reporting is a process designed by, or under the supervision of, the company’s principal executive andprincipal financial officers, or persons performing similar functions, and effected by the company’s board of directors, management, and other personnel toprovide reasonable assurance regarding the reliability of financial reporting and the preparation of financial statements for external purposes in accordancewith generally accepted accounting principles. A company’s internal control over financial reporting includes those policies and procedures that (1) pertain tothe maintenance of records that, in reasonable detail, accurately and fairly reflect the transactions and dispositions of the assets of the company; (2) providereasonable assurance that transactions are recorded as necessary to permit preparation of financial statements in accordance with generally acceptedaccounting principles, and that receipts and expenditures of the company are being made only in accordance with authorizations of management and directorsof the company; and (3) provide reasonable assurance regarding prevention or timely detection of unauthorized acquisition, use, or disposition of thecompany’s assets that could have a material effect on the financial statements.
Because of the inherent limitations of internal control over financial reporting, including the possibility of collusion or improper management overrideof controls, material misstatements due to error or fraud may not be prevented or detected on a timely basis. Also, projections of any evaluation of theeffectiveness of the internal control over financial reporting to future periods are subject to the risk that the controls may become inadequate because ofchanges in conditions, or that the degree of compliance with the policies or procedures may deteriorate.
In our opinion, the Company maintained, in all material respects, effective internal control over financial reporting as of December 31, 2015, based onthe criteria established in Internal Control — Integrated Framework (2013) issued by the Committee of Sponsoring Organizations of the TreadwayCommission.
We have also audited, in accordance with the standards of the Public Company Accounting Oversight Board (United States), the consolidated financialstatements as of and for the year ended December 31, 2015 of the Company and our report dated April 29, 2016 expressed an unqualified opinion on thosefinancial statements.
/s/ Deloitte & ToucheTaipei, TaiwanRepublic of ChinaApril 29, 2016
62
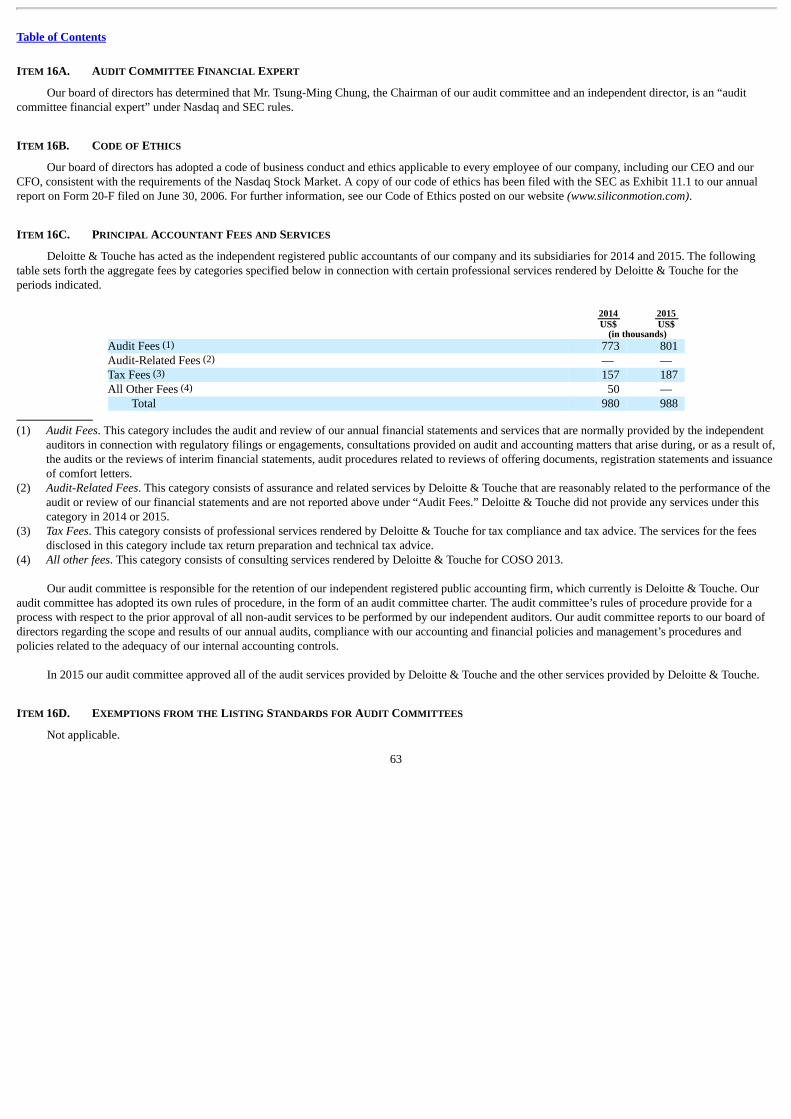
Table of Contents
ITEM 16A. AUDIT COMMITTEE FINANCIAL EXPERT
Our board of directors has determined that Mr. Tsung-Ming Chung, the Chairman of our audit committee and an independent director, is an “auditcommittee financial expert” under Nasdaq and SEC rules.
ITEM 16B. CODE OF ETHICS
Our board of directors has adopted a code of business conduct and ethics applicable to every employee of our company, including our CEO and ourCFO, consistent with the requirements of the Nasdaq Stock Market. A copy of our code of ethics has been filed with the SEC as Exhibit 11.1 to our annualreport on Form 20-F filed on June 30, 2006. For further information, see our Code of Ethics posted on our website (www.siliconmotion.com).
ITEM 16C. PRINCIPAL ACCOUNTANT FEES AND SERVICES
Deloitte & Touche has acted as the independent registered public accountants of our company and its subsidiaries for 2014 and 2015. The followingtable sets forth the aggregate fees by categories specified below in connection with certain professional services rendered by Deloitte & Touche for theperiods indicated.
2014 2015 US$ US$ (in thousands) Audit Fees (1) 773 801 Audit-Related Fees (2) — — Tax Fees (3) 157 187 All Other Fees (4) 50 —
Total 980 988 (1) Audit Fees. This category includes the audit and review of our annual financial statements and services that are normally provided by the independent
auditors in connection with regulatory filings or engagements, consultations provided on audit and accounting matters that arise during, or as a result of,the audits or the reviews of interim financial statements, audit procedures related to reviews of offering documents, registration statements and issuanceof comfort letters.
(2) Audit-Related Fees. This category consists of assurance and related services by Deloitte & Touche that are reasonably related to the performance of theaudit or review of our financial statements and are not reported above under “Audit Fees.” Deloitte & Touche did not provide any services under thiscategory in 2014 or 2015.
(3) Tax Fees. This category consists of professional services rendered by Deloitte & Touche for tax compliance and tax advice. The services for the feesdisclosed in this category include tax return preparation and technical tax advice.
(4) All other fees. This category consists of consulting services rendered by Deloitte & Touche for COSO 2013.
Our audit committee is responsible for the retention of our independent registered public accounting firm, which currently is Deloitte & Touche. Ouraudit committee has adopted its own rules of procedure, in the form of an audit committee charter. The audit committee’s rules of procedure provide for aprocess with respect to the prior approval of all non-audit services to be performed by our independent auditors. Our audit committee reports to our board ofdirectors regarding the scope and results of our annual audits, compliance with our accounting and financial policies and management’s procedures andpolicies related to the adequacy of our internal accounting controls.
In 2015 our audit committee approved all of the audit services provided by Deloitte & Touche and the other services provided by Deloitte & Touche.
ITEM 16D. EXEMPTIONS FROM THE LISTING STANDARDS FOR AUDIT COMMITTEES
Not applicable.
63

Table of Contents
ITEM 16E. PURCHASES OF EQUITY SECURITIES BY THE ISSUER AND AFFILIATED PURCHASERS
Not applicable.
ITEM 16F. CHANGE IN REGISTRANT’S CERTIFYING ACCOUNTANT
Not applicable.
ITEM 16G. CORPORATE GOVERNANCE
We are incorporated in the Cayman Islands and our corporate governance practices are governed by applicable Cayman Islands law. In addition,because our ADSs are listed on the Nasdaq Global Select Market, we are subject to Nasdaq corporate governance requirements. Nasdaq Listing Rule 5615(a)(3) permits foreign private issuers like us to follow “home country practice” with respect to certain corporate governance matters, such as, for example, ourestablishment in 2015 of our 2015 Incentive Plan. We are committed to a high standard of corporate governance. As such, we endeavor to comply with theNasdaq corporate governance practices and believe that we are currently in compliance with Nasdaq corporate governance practices that are applicable toforeign private issuers.
64
Table of Contents
PART III ITEM 17. FINANCIAL STATEMENTS
Not applicable.
ITEM 18. FINANCIAL STATEMENTS
Our consolidated financial statements are included in this annual report at pages F-1 through F-35.
ITEM 19. EXHIBITS ExhibitNumber Description
1.1
Memorandum of Association of the Registrant (incorporated by reference to Exhibit 3.1 to the company’s Registration Statement on FormF-1 (file no. 333-125673) filed with the Securities and Exchange Commission on June 9, 2005).
1.2
Articles of Association of the Registrant (incorporated by reference to Exhibit 3.2 to the company’s Registration Statement on Form F-1(file no. 333-125673) filed with the Securities and Exchange Commission on June 9, 2005).
2.1
Specimen of American Depositary Receipt (incorporated by reference to Exhibit 4.1 to the company’s Registration Statement on Form F-1(file no. 333-125673) filed with the Securities and Exchange Commission on June 9, 2005).
2.2
Form of Deposit Agreement (incorporated by reference to Exhibit 4.2 to the company’s Registration Statement on Form F-1 (file no. 333-125673) filed with the Securities and Exchange Commission on June 9, 2005).
2.3
Second Amended and Restated Silicon Motion Technology Corporation Equity Incentive Plan 2005 (incorporated by reference to Exhibit2.3 of the company’s Form 20-F for the year ended December 31, 2009, filed June 25, 2010).
2.4
Silicon Motion Technology Corporation 2015 Incentive Plan (incorporated by reference to Exhibit 4.1 of the Company’s registrationstatement on Form S-8 filed June 11, 2015).
4.1
Lease Agreement between Silicon Motion, Inc. (Taiwan) and Fang Shinn Industrial Co., Ltd. dated May 4, 2004 (incorporated byreference to Exhibit 10.1 to the company’s Registration Statement on Form F-1 (file no. 333-125673) filed with the Securities andExchange Commission on June 9, 2005).
4.2
Lease Agreement between Silicon Motion, Inc. (Taiwan) and TaiHsing Printing and Binding Co., Ltd dated February 23, 2005(incorporated by reference to Exhibit 10.2 to the company’s Registration Statement on Form F-1 (file no. 333-125673) filed with theSecurities and Exchange Commission on June 9, 2005).
4.3
Lease Agreement between Silicon Motion, Inc. (Taiwan) and Winsome Development Inc. dated November 27, 2003 (incorporated byreference to Exhibit 10.3 to the company’s Registration Statement on Form F-1 (file no. 333-125673) filed with the Securities andExchange Commission on June 9, 2005).
4.4
Lease Agreement between Silicon Motion, Inc. (Taiwan) and Richtek Technology Corp. dated February 4, 2005 (incorporated byreference to Exhibit 10.4 to the company’s Registration Statement on Form F-1 (file no. 333-125673) filed with the Securities andExchange Commission on June 9, 2005).
65
Table of Contents
ExhibitNumber Description
4.5
Lease Agreement between Silicon Motion, Inc. (California) and Orchard Investment Company Number 205 dated January 21, 2004(incorporated by reference to Exhibit 10.5 to the company’s Registration Statement on Form F-1 (file no. 333-125673) filed with theSecurities and Exchange Commission on June 9, 2005).
4.6
Bank Line of Credit Agreement between Silicon Motion, Inc. (Taiwan) and Chinatrust Commercial Bank Co., Ltd. dated November 25,2004 (incorporated by reference to Exhibit 10.6 to the company’s Registration Statement on Form F-1 (file no. 333-125673) filed with theSecurities and Exchange Commission on June 9, 2005).
4.7
Financial Transaction Agreement between Silicon Motion, Inc. (Taiwan) and Chinatrust Commercial Bank Co., Ltd. dated November 25,2004 (incorporated by reference to Exhibit 10.7 to the company’s Registration Statement on Form F-1 (file no. 333-125673) filed with theSecurities and Exchange Commission on June 9, 2005).
4.8
Specific Clause Agreement between Silicon Motion, Inc. (Taiwan) and Chinatrust Commercial Bank Co., Ltd. dated November 25, 2004(incorporated by reference to Exhibit 10.8 to the company’s Registration Statement on Form F-1 (file no. 333-125673) filed with theSecurities and Exchange Commission on June 9, 2005).
4.11
Purchase and Supply Agreement between Lexar Media, Inc. and Silicon Motion Technology Corporation, dated September 1, 2005(incorporated by reference to Exhibit 4.11 to the Company’s Annual Report on Form 20-F filed with the Securities and ExchangeCommission on June 30, 2006).
4.12
Share Purchase Agreement dated as of April 18, 2007 among Silicon Motion Technology Corporation, Lake Tahoe InvestmentCorporation, FCI Inc. and Kwang Jun Yun and the shareholders of FCI (incorporated by reference to Exhibit 4.12 to the Company’sAnnual Report on Form 20-F filed with the Securities and Exchange Commission on July 2, 2007).
4.13
Share Purchase Agreement dated as of April 24, 2015 among Silicon Motion Technology Corporation, Silicon Motion Technology (HongKong) Ltd., F-Tec Holdings International Ltd., the shareholders of F-Tec Holdings International Ltd. and Xueshi Yang, as the Sellers’Representative (incorporated by reference to Exhibit 4.13 to the Company’s Annual Report on Form 20-F filed with the Securities andExchange Commission on April 30, 2015).
8.1 * List of Subsidiaries.
11.1
Code of Ethics (incorporated by reference to Exhibit 11.1 to the company’s Annual Report on Form 20-F filed with the Securities andExchange Commission on June 30, 2006).
12.1 * Certification of Chief Executive Officer Required by Rule 13a-14(a).
12.2 * Certification of Chief Financial Officer Required by Rule 13a-14(a).
13.1 *
Certification of Chief Executive Officer and Chief Financial Officer required by Rule 13a-14(b) and Section 1350 of Chapter 63 of Title18 of the United States Code.
23.1 * Consent of Deloitte & Touche.
101.INS* XBRL Instance Document
101.SCH* XBRL Taxonomy Extension Schema Document
101.CAL* XBRL Taxonomy Extension Calculation Linkbase Document
101.DEF* XBRL Taxonomy Extension Definition Linkbase Document
101.LAB* XBRL Taxonomy Extension Label Linkbase Document
101.PRE* XBRL Taxonomy Extension Presentation Linkbase Document * Filed herewith.
66

Table of Contents
SIGNATURES
The registrant hereby certifies that it meets all the requirements for filing on Form 20-F and that it has duly caused and authorized the undersigned tosign this annual report on its behalf.
SILICON MOTION TECHNOLOGY CORPORATION
By: /s/ WALLACE C. KOU
Wallace C. Kou,
President and Chief Executive Officer
Date: April 29, 2016
67

Table of Contents
SILICON MOTION TECHNOLOGY CORPORATION AND SUBSIDIARIES
INDEX TO CONSOLIDATED FINANCIAL STATEMENTS Report of Independent Registered Public Accounting Firm F-2 Consolidated Balance Sheets as of December 31, 2014 and 2015 F-3 Consolidated Statements of Income for the Years Ended December 31, 2013, 2014 and 2015 F-4 Consolidated Statements of Comprehensive Income for the Years Ended December 31, 2013, 2014 and 2015 F-5 Consolidated Statements of Changes in Shareholders’ Equity for the Years Ended December 31, 2013, 2014 and 2015 F-6 Consolidated Statements of Cash Flows for the Years Ended December 31, 2013, 2014 and 2015 F-7 Notes to Consolidated Financial Statements F-8
F-1
Table of Contents
REPORT OF INDEPENDENT REGISTERED PUBLIC ACCOUNTING FIRM
To the Board of Directors and Shareholders ofSilicon Motion Technology Corporation
We have audited the accompanying consolidated balance sheets of Silicon Motion Technology Corporation and subsidiaries (the “Company”) as ofDecember 31, 2015 and 2014, and the related consolidated statements of income, comprehensive income, changes in shareholders’ equity and cash flows foreach of the three years in the period ended December 31, 2015, all expressed in U.S. dollars. These financial statements are the responsibility of theCompany’s management. Our responsibility is to express an opinion on these financial statements based on our audits.
We conducted our audits in accordance with the standards of the Public Company Accounting Oversight Board (United States). Those standards requirethat we plan and perform the audit to obtain reasonable assurance about whether the financial statements are free of material misstatement. An audit includesexamining, on a test basis, evidence supporting the amounts and disclosures in the financial statements. An audit also includes assessing the accountingprinciples used and significant estimates made by management, as well as evaluating the overall financial statement presentation. We believe that our auditsprovide a reasonable basis for our opinion.
In our opinion, such consolidated financial statements present fairly, in all material respects, the financial position of the Company as of December 31,2015 and 2014, and the results of their operations and their cash flows for each of the three years in the period ended December 31, 2015, in conformity withaccounting principles generally accepted in the United States of America.
We have also audited, in accordance with the standards of the Public Company Accounting Oversight Board (United States), the Company’s internalcontrol over financial reporting as of December 31, 2015, based on the criteria established in Internal Control — Integrated Framework (2013) issued by theCommittee of Sponsoring Organizations of the Treadway Commission and our report dated April 29, 2016 expressed an unqualified opinion on theCompany’s internal control over financial reporting. As described in Management’s Report on Internal Control over Financial Reporting, managementexcluded from its assessment the internal control over financial reporting at Shanghai Baocun Information Technology Co., Ltd. (“Shannon Systems”), whichwas acquired on July 1, 2015 and whose financial statements constitute 6.20 % and 5.45 % of net and total assets, respectively, 2.50 % of net sales, and0.70 % of net income of the consolidated financial statement amounts as of and for the year ended December 31, 2015. Accordingly, our audit did not includethe internal control over financial reporting at Shannon Systems.
/s/ Deloitte & ToucheTaipei, TaiwanRepublic of ChinaApril 29, 2016
F-2
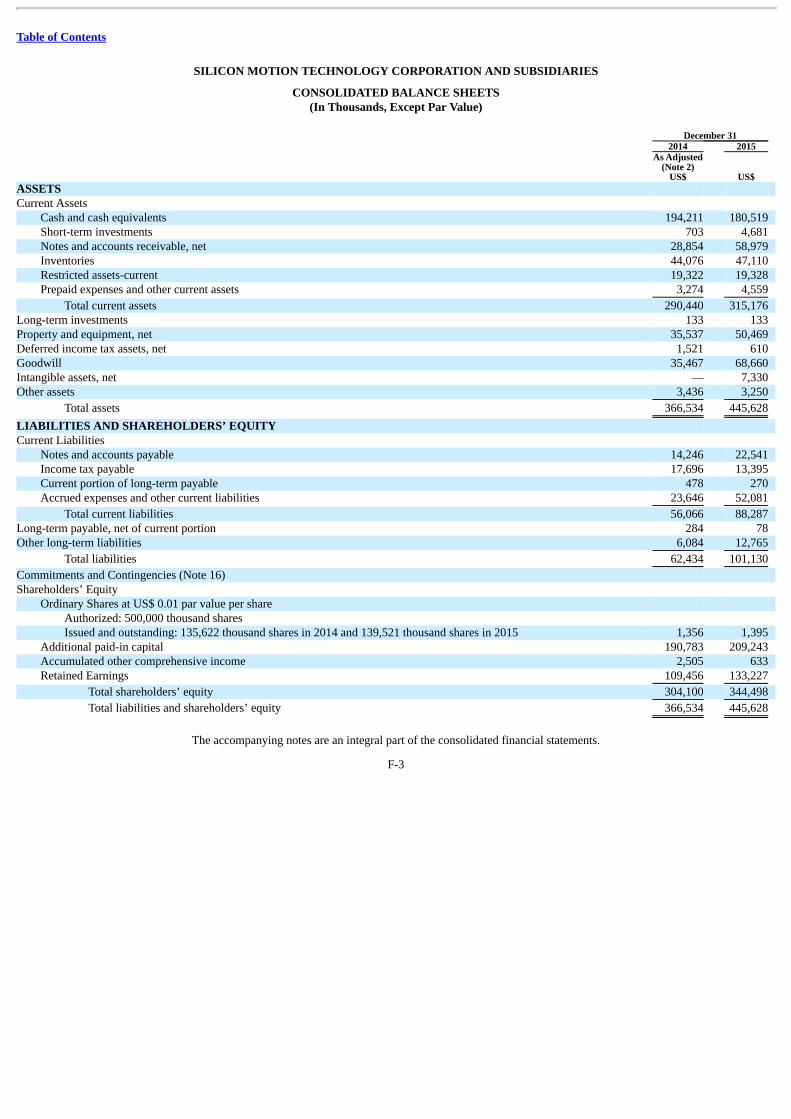
Table of Contents
SILICON MOTION TECHNOLOGY CORPORATION AND SUBSIDIARIES
CONSOLIDATED BALANCE SHEETS(In Thousands, Except Par Value)
December 31 2014 2015
As Adjusted
(Note 2) US$ US$ ASSETS Current Assets
Cash and cash equivalents 194,211 180,519 Short-term investments 703 4,681 Notes and accounts receivable, net 28,854 58,979 Inventories 44,076 47,110 Restricted assets-current 19,322 19,328 Prepaid expenses and other current assets 3,274 4,559
Total current assets 290,440 315,176 Long-term investments 133 133 Property and equipment, net 35,537 50,469 Deferred income tax assets, net 1,521 610 Goodwill 35,467 68,660 Intangible assets, net — 7,330 Other assets 3,436 3,250
Total assets 366,534 445,628
LIABILITIES AND SHAREHOLDERS’ EQUITY Current Liabilities
Notes and accounts payable 14,246 22,541 Income tax payable 17,696 13,395 Current portion of long-term payable 478 270 Accrued expenses and other current liabilities 23,646 52,081
Total current liabilities 56,066 88,287 Long-term payable, net of current portion 284 78 Other long-term liabilities 6,084 12,765
Total liabilities 62,434 101,130
Commitments and Contingencies (Note 16) Shareholders’ Equity
Ordinary Shares at US$ 0.01 par value per share Authorized: 500,000 thousand shares Issued and outstanding: 135,622 thousand shares in 2014 and 139,521 thousand shares in 2015 1,356 1,395
Additional paid-in capital 190,783 209,243 Accumulated other comprehensive income 2,505 633 Retained Earnings 109,456 133,227
Total shareholders’ equity 304,100 344,498
Total liabilities and shareholders’ equity 366,534 445,628
The accompanying notes are an integral part of the consolidated financial statements.
F-3
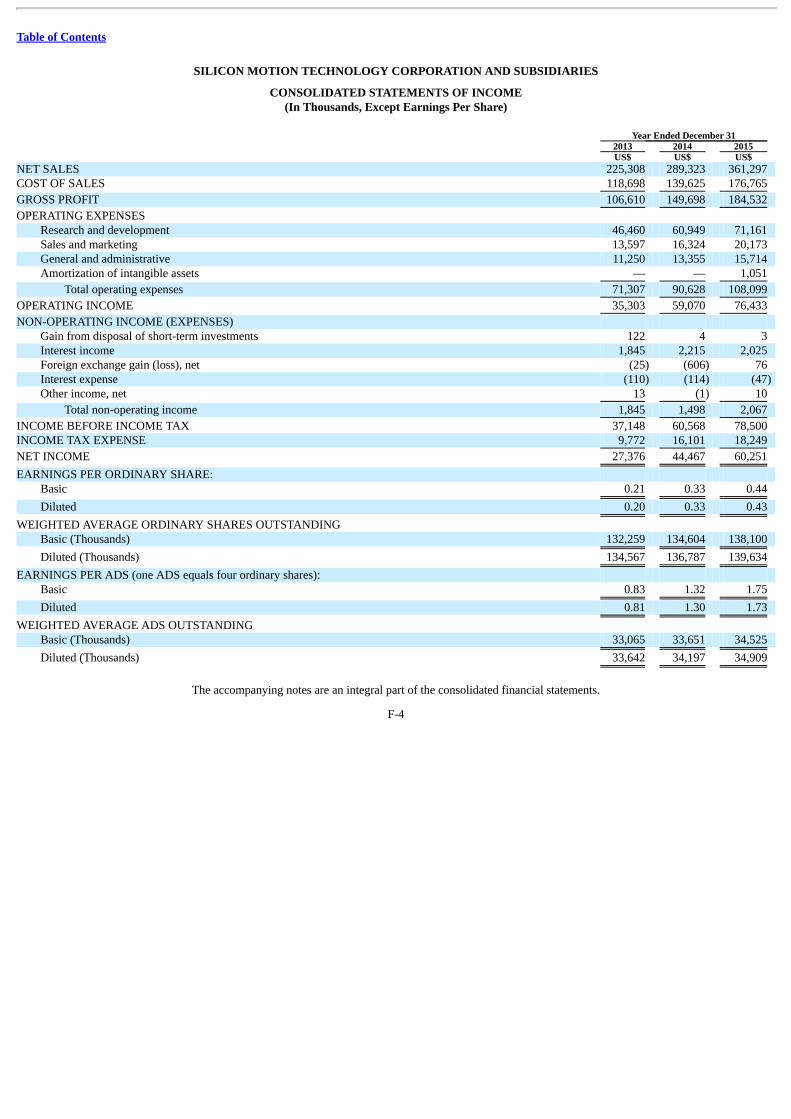
Table of Contents
SILICON MOTION TECHNOLOGY CORPORATION AND SUBSIDIARIES
CONSOLIDATED STATEMENTS OF INCOME(In Thousands, Except Earnings Per Share)
Year Ended December 31 2013 2014 2015 US$ US$ US$ NET SALES 225,308 289,323 361,297 COST OF SALES 118,698 139,625 176,765
GROSS PROFIT 106,610 149,698 184,532
OPERATING EXPENSES Research and development 46,460 60,949 71,161 Sales and marketing 13,597 16,324 20,173 General and administrative 11,250 13,355 15,714 Amortization of intangible assets — — 1,051
Total operating expenses 71,307 90,628 108,099
OPERATING INCOME 35,303 59,070 76,433
NON-OPERATING INCOME (EXPENSES) Gain from disposal of short-term investments 122 4 3 Interest income 1,845 2,215 2,025 Foreign exchange gain (loss), net (25) (606) 76 Interest expense (110) (114) (47) Other income, net 13 (1) 10
Total non-operating income 1,845 1,498 2,067
INCOME BEFORE INCOME TAX 37,148 60,568 78,500 INCOME TAX EXPENSE 9,772 16,101 18,249
NET INCOME 27,376 44,467 60,251
EARNINGS PER ORDINARY SHARE: Basic 0.21 0.33 0.44
Diluted 0.20 0.33 0.43
WEIGHTED AVERAGE ORDINARY SHARES OUTSTANDING Basic (Thousands) 132,259 134,604 138,100
Diluted (Thousands) 134,567 136,787 139,634
EARNINGS PER ADS (one ADS equals four ordinary shares): Basic 0.83 1.32 1.75
Diluted 0.81 1.30 1.73
WEIGHTED AVERAGE ADS OUTSTANDING Basic (Thousands) 33,065 33,651 34,525
Diluted (Thousands) 33,642 34,197 34,909
The accompanying notes are an integral part of the consolidated financial statements.
F-4

Table of Contents
SILICON MOTION TECHNOLOGY CORPORATION AND SUBSIDIARIES
CONSOLIDATED STATEMENTS OF COMPREHENSIVE INCOME(In Thousands)
Year Ended December 31 2013 2014 2015 US$ US$ US$ NET INCOME 27,376 44,467 60,251
OTHER COMPREHENSIVE INCOME (LOSS), NET OF TAX EFFECT OF NIL Change in net foreign currency translation adjustments 633 (1,202) (1,868) Change in deferred pension gain (loss) (203) (388) (4)
OTHER COMPREHENSIVE INCOME (LOSS) 430 (1,590) (1,872)
TOTAL COMPREHENSIVE INCOME 27,806 42,877 58,379
The accompanying notes are an integral part of the consolidated financial statements.
F-5
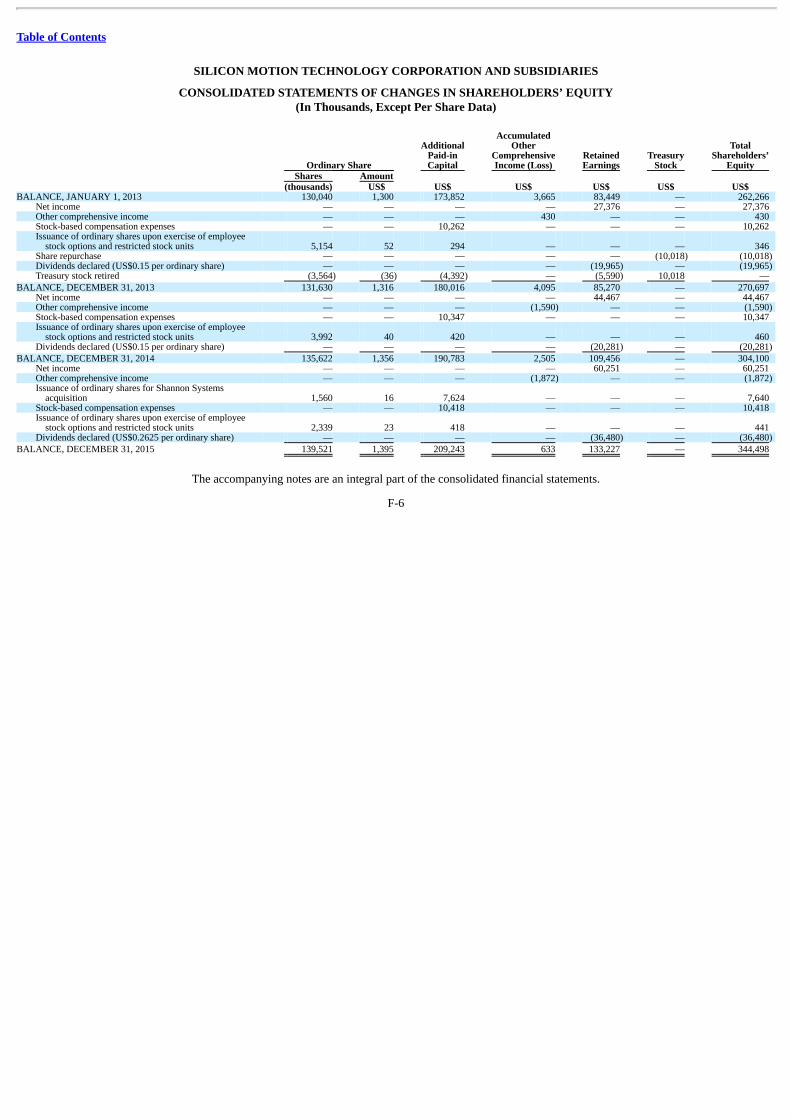
Table of Contents
SILICON MOTION TECHNOLOGY CORPORATION AND SUBSIDIARIES
CONSOLIDATED STATEMENTS OF CHANGES IN SHAREHOLDERS’ EQUITY(In Thousands, Except Per Share Data)
Ordinary Share
AdditionalPaid-inCapital
AccumulatedOther
ComprehensiveIncome (Loss)
RetainedEarnings
TreasuryStock
TotalShareholders’
Equity Shares Amount (thousands) US$ US$ US$ US$ US$ US$ BALANCE, JANUARY 1, 2013 130,040 1,300 173,852 3,665 83,449 — 262,266
Net income — — — — 27,376 — 27,376 Other comprehensive income — — — 430 — — 430 Stock-based compensation expenses — — 10,262 — — — 10,262 Issuance of ordinary shares upon exercise of employee
stock options and restricted stock units 5,154 52 294 — — — 346 Share repurchase — — — — — (10,018) (10,018) Dividends declared (US$0.15 per ordinary share) — — — — (19,965) — (19,965) Treasury stock retired (3,564) (36) (4,392) — (5,590) 10,018 —
BALANCE, DECEMBER 31, 2013 131,630 1,316 180,016 4,095 85,270 — 270,697 Net income — — — — 44,467 — 44,467 Other comprehensive income — — — (1,590) — — (1,590) Stock-based compensation expenses — — 10,347 — — — 10,347 Issuance of ordinary shares upon exercise of employee
stock options and restricted stock units 3,992 40 420 — — — 460 Dividends declared (US$0.15 per ordinary share) — — — — (20,281) — (20,281)
BALANCE, DECEMBER 31, 2014 135,622 1,356 190,783 2,505 109,456 — 304,100 Net income — — — — 60,251 — 60,251 Other comprehensive income — — — (1,872) — — (1,872) Issuance of ordinary shares for Shannon Systems
acquisition 1,560 16 7,624 — — — 7,640 Stock-based compensation expenses — — 10,418 — — — 10,418 Issuance of ordinary shares upon exercise of employee
stock options and restricted stock units 2,339 23 418 — — — 441 Dividends declared (US$0.2625 per ordinary share) — — — — (36,480) — (36,480)
BALANCE, DECEMBER 31, 2015 139,521 1,395 209,243 633 133,227 — 344,498
The accompanying notes are an integral part of the consolidated financial statements.
F-6
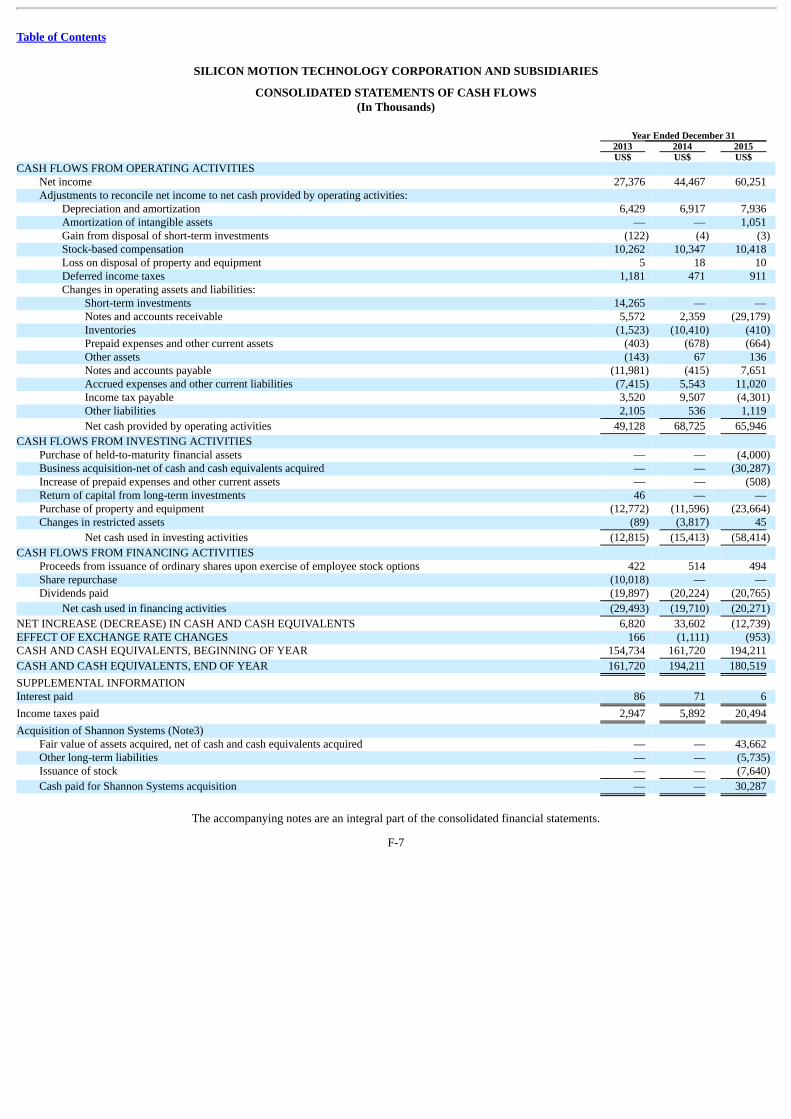
Table of Contents
SILICON MOTION TECHNOLOGY CORPORATION AND SUBSIDIARIES
CONSOLIDATED STATEMENTS OF CASH FLOWS(In Thousands)
Year Ended December 31 2013 2014 2015 US$ US$ US$ CASH FLOWS FROM OPERATING ACTIVITIES
Net income 27,376 44,467 60,251 Adjustments to reconcile net income to net cash provided by operating activities:
Depreciation and amortization 6,429 6,917 7,936 Amortization of intangible assets — — 1,051 Gain from disposal of short-term investments (122) (4) (3) Stock-based compensation 10,262 10,347 10,418 Loss on disposal of property and equipment 5 18 10 Deferred income taxes 1,181 471 911 Changes in operating assets and liabilities:
Short-term investments 14,265 — — Notes and accounts receivable 5,572 2,359 (29,179) Inventories (1,523) (10,410) (410) Prepaid expenses and other current assets (403) (678) (664) Other assets (143) 67 136 Notes and accounts payable (11,981) (415) 7,651 Accrued expenses and other current liabilities (7,415) 5,543 11,020 Income tax payable 3,520 9,507 (4,301) Other liabilities 2,105 536 1,119
Net cash provided by operating activities 49,128 68,725 65,946
CASH FLOWS FROM INVESTING ACTIVITIES Purchase of held-to-maturity financial assets — — (4,000) Business acquisition-net of cash and cash equivalents acquired — — (30,287) Increase of prepaid expenses and other current assets — — (508) Return of capital from long-term investments 46 — — Purchase of property and equipment (12,772) (11,596) (23,664) Changes in restricted assets (89) (3,817) 45
Net cash used in investing activities (12,815) (15,413) (58,414)
CASH FLOWS FROM FINANCING ACTIVITIES Proceeds from issuance of ordinary shares upon exercise of employee stock options 422 514 494 Share repurchase (10,018) — — Dividends paid (19,897) (20,224) (20,765)
Net cash used in financing activities (29,493) (19,710) (20,271)
NET INCREASE (DECREASE) IN CASH AND CASH EQUIVALENTS 6,820 33,602 (12,739) EFFECT OF EXCHANGE RATE CHANGES 166 (1,111) (953) CASH AND CASH EQUIVALENTS, BEGINNING OF YEAR 154,734 161,720 194,211
CASH AND CASH EQUIVALENTS, END OF YEAR 161,720 194,211 180,519
SUPPLEMENTAL INFORMATION Interest paid 86 71 6
Income taxes paid 2,947 5,892 20,494
Acquisition of Shannon Systems (Note3) Fair value of assets acquired, net of cash and cash equivalents acquired — — 43,662 Other long-term liabilities — — (5,735) Issuance of stock — — (7,640)
Cash paid for Shannon Systems acquisition — — 30,287
The accompanying notes are an integral part of the consolidated financial statements.
F-7
Table of Contents
SILICON MOTION TECHNOLOGY CORPORATION AND SUBSIDIARIES
NOTES TO CONSOLIDATED FINANCIAL STATEMENTS(In Thousands)
1. ORGANIZATION AND OPERATIONS
Silicon Motion Technology Corporation (“SMTC”, collectively with its subsidiaries the “Company”) was incorporated in the Cayman Islands onJanuary 27, 2005. The Company is a fabless semiconductor company that designs, develops and markets, high-performance, low-power semiconductorsolutions to OEMs and other customers in the mobile storage and mobile communications markets. In the mobile storage market, the Company’s key productsare controllers used in embedded storage products such as SSDs, and eMMCs, as well as expandable storage products such as flash memory cards and USBflash drives. For the mobile communications market, the Company’s key products are handset transceivers and mobile TV SoCs.
The Company acquired SMI Taiwan in April 2005. Originally SMI Taiwan was known as Feiya Technology Corporation (“Feiya”), a Taiwancorporation which was incorporated in April 1997 but had changed its name to SMI Taiwan after acquiring in August 2002 Silicon Motion, Inc., a Californiacorporation (“SMI USA”), which was incorporated in November 1995. Feiya was originally a flash memory products company and SMI USA a graphicsprocessor company. In April 2007, the Company acquired FCI, a leading designer of RF ICs for mobile TV and wireless communications based in SouthKorea. The Company established Silicon Motion BV in the Netherlands in 2011 with the purpose of expanding its business activities in Europe, as well asproviding supervisory, financing, legal support, accounting services and shareholding for the Company’s businesses in other parts of the world. In July 2015,the Company acquired Shanghai Baocun Information Technology Co., Ltd. (“Shannon Systems”), China’s leading enterprise-class PCIe SSD company basedin Shanghai, China.
2. SUMMARY OF SIGNIFICANT ACCOUNTING POLICIES
Basis of Presentation
The consolidated financial statements have been prepared in accordance with accounting principles generally accepted in the United States of America(U.S. GAAP). The consolidated financial statements include the accounts of SMTC and its wholly-owned subsidiaries. The Company owns 100% of theoutstanding shares in all of its subsidiaries, except for FCI which the Company owns over 99.9%. All significant intercompany balances and transactions havebeen eliminated upon consolidation.
Use of Estimates
The preparation of consolidated financial statements in conformity with U.S. GAAP requires management to make estimates and assumptions thataffect certain reported amounts and disclosures. The actual results could differ from those estimates.
Concentration of Credit Risk
Financial instruments that potentially subject the Company to a concentration of credit risk consist of cash, cash equivalents, investment in debtsecurities and accounts receivable. Cash is deposited with high credit-quality financial institutions. For accounts receivable, the Company performs ongoingcredit evaluations of its customers’ financial condition and the Company maintains an allowance for doubtful accounts receivable based upon a review of theexpected collectibility of individual accounts.
The Company sells the semiconductor solutions to leading OEMs and module makers, worldwide. Most of the Company’s solid state storagecontrollers are supplied to NAND flash manufacturers. The Company is the leading merchant supplier of controllers used in client SSD for PCs and eMMCused in smartphones and a
F-8
Table of Contents
leading supplier of controllers used in flash memory cards and USB flash drives. The Company provides the specialty RF ICs primarily to Samsung and otherOEMs. Sales to two customers in 2013 and 2014, and one customer in 2015 accounted for 10% or more of the Company’s net sales, represented 46%, 47%and 30% of the Company’s net sales in 2013, 2014 and 2015, respectively. In 2013 and 2014, the significant customers were Samsung and SK Hynix and in2015, SK Hynix. The Company’s top ten customers in 2013, 2014 and 2015 accounted for approximately 76%, 76% and 72% of net sales.
Fair Value of Financial Instruments
The carrying amount of the Company’s financial instruments, including cash and cash equivalents, notes and accounts receivable and notes andaccounts payables approximates fair value due to the short-term maturity of the instruments. Fair values of short-term investments represent quoted marketprices, if available. If no quoted market prices are available, fair values are estimated based on discounted cash flow, or other valuation techniques. Long-terminvestments are privately-held companies where there is no readily determinable market value and are recorded using the cost method, since the cost ofobtaining verifiable fair value is unreasonably high. The Company periodically evaluates these investments for impairment. If it is determined that an other-than-temporary decline has occurred in the carrying value, an impairment loss is recorded for that period. The Company’s long-term liabilities approximatetheir fair values as they contain interest rates that vary according to market interest rates.
Fair value is the price that would be received upon sale of an asset or paid upon transfer of a liability in an orderly transaction between marketparticipants at the measurement date and in the principal or most advantageous market for that assets or liability. The fair value should be calculated based onassumptions that market participants would use in pricing the asset or liability, not on assumptions specific to the Company. A three-tier fair value hierarchyis established as a basis for considering such assumptions and for inputs used in the valuation methodologies in measuring fair value. The hierarchy prioritizesthe inputs into three levels based on the extent to which inputs used in measuring fair value are observable in the market. Each fair value measurement isreported in one of the three levels which is determined by the lowest level input that is significant to the fair value measurement in its entirety. These levelsare:
Level 1 — Use unadjusted quoted prices in active markets for identical assets or liabilities.
Level 2 — Use observable inputs other than Level 1 prices such as quoted prices for identical or similar instruments in markets that are not active,quoted prices for similar instruments in active markets, and model-based valuation in which all significant inputs are observable or can be corroborated byobservable market data for substantially the full term of the assets or liabilities.
Level 3 — Use inputs that are generally unobservable and reflect the use of significant management judgments and estimates.
See Note 18, “Fair Value Measurement”, for the related disclosure.
Cash Equivalents
The Company considers all highly liquid investments to be cash equivalents.
Short-term Investments
The Company’s short-term investments are short-term income yielding investments with original maturities greater than three months from thepurchase date and remaining maturities less than one year. These short-term investments consist primarily of bond funds that are bought and held principallyfor the purpose of selling them in the near term and are classified as trading securities, structured notes designated at the fair value and senior notes classifiedas held-to-maturity investment with maturities less than one year. Trading securities and
F-9
Table of Contents
structured notes are reported at fair value with the subsequent changes in fair value recorded in earnings as unrealized gains and losses. Senior notes aremeasured at amortized cost using the effective interest method less any impairment.
Allowance for Doubtful Receivables
An allowance for doubtful receivables is provided based on a review of the collectability of accounts receivables. The Company determines the amountof allowance for doubtful receivables by examining the historical collection experience and current trends in the credit quality of its customers as well as itsinternal credit policies.
Inventories
Inventories are stated at the lower of cost or market value. Inventories are recorded at standard cost and adjusted to the approximate weighted-averagecost at the balance sheet date. Market value represents the current replacement cost for raw materials, work in process and finished goods. The Companyassesses its inventory for estimated obsolescence or unmarketable inventory based upon management’s assumptions about future demand and marketconditions. In estimating reserves for obsolescence, the Company primarily evaluates estimates based on the timing of the introduction of new products andthe quantities remaining of old products and provides reserves for inventory on hand in excess of the estimated demand. Estimated losses on slow-movingitems are recognized and included in the allowance for losses.
Long-term Investments
The Company has long-term investments in companies that it does not exercise significant influence and accounts for these investments under the costmethod. Management regularly evaluates financial information related to these investments to determine whether an other than temporary decline in theirvalue exists. Factors indicative of an other than temporary decline include recurring operating losses, credit defaults and subsequent rounds of financings at anamount below the cost basis of the investment. Management periodically weighs all quantitative and qualitative factors in determining if any impairment lossexists. When a decline in value is deemed to be other-than-temporary, the Company recognizes an impairment loss in other income and expense.
Property and Equipment
Property and equipment are stated at cost less accumulated depreciation. Significant additions, renewals and betterments are capitalized, whilemaintenance and repairs are expensed as incurred.
Depreciation is computed using the straight-line method over estimated useful lives that range as follows: buildings — 25 to 50 years; machinery andequipment — 3 to 6 years; furniture and fixtures — 3 to 8 years; software — 1 to 5 years; leasehold and buildings improvement — the shorter of theestimated useful life or lease term, which is generally 2 to 6 years. Depreciation expense recognized for the years ended December 31, 2013, 2014 and 2015was approximately US$6,429 thousand, US$6,917 thousand and US$7,936 thousand, respectively.
Upon the sale or other disposal of property and equipment, the related cost and accumulated depreciation are removed from the accounts, and any gainor loss is credited or charged to operating income.
Government Grants
Grants received by the Company from the Korean government to assist with specific research and development activities are deducted from thoseresearch and development costs incurred, in the period in which the related expenses are incurred, to the extent that they are non-refundable. Governmentgrants that were used
F-10
Table of Contents
for the acquisition of fixed assets are deducted from the acquisition costs of the acquired assets and amortized over the useful lives of the related assets. TheCompany recognizes refundable government grants as long-term payable and current portion of long-term payable on its consolidated balance sheet.
Goodwill and Intangible Assets
Goodwill is the excess of the purchase price paid over the fair value of the net tangible and intangible assets acquired in a business combination.Intangible assets, which consist primarily of development technology, are amortized over their estimated useful lives, of 3.5 to 4.5 years.
Impairment of Goodwill and Long-Lived Assets
The Company evaluates the recoverability of long-lived assets whenever events or changes in circumstances indicate the carrying value may not berecoverable. The determination of recoverability is based on an estimate of undiscounted cash flows expected to result from the use of an asset and itseventual disposition. The estimate of cash flows is based upon, among other things, certain assumptions about expected future operating performance, growthrates and other factors. Estimates of undiscounted cash flows may differ from actual cash flows due to, among other things, technological changes, economicconditions, changes to the business model or changes in operating performance. If the sum of the undiscounted cash flows is less than the carrying value, animpairment loss is recognized, measured as the amount by which the carrying value exceeds the fair value of the asset. Fair value is determined by referenceto quoted market prices, if available, or discounted cash flows, as appropriate. See Note 10, “Goodwill and Acquired Intangible Assets,” regardingimpairment testing in fiscal year 2013, 2014 and 2015.
The Company monitors the recoverability of goodwill recorded in connection with acquisitions, by reporting unit, annually, or sooner if events orchanges in circumstances indicate that the carrying amount may not be recoverable. The Company conducts its annual impairment test of goodwill onNovember 30. Reporting units may be operating segments as a whole or an operation one level below an operating segment, referred to as a component.Goodwill impairment is tested using a two-step approach. The first step compares the fair value of a reporting unit to its carrying amount, including goodwill.If the fair value of the reporting unit is greater than its carrying amount, goodwill is not considered impaired and the second step is not required. If the fairvalue of the reporting unit is less than its carrying amount, the second step of the impairment test measures the amount of the impairment loss, if any, bycomparing the implied fair value of goodwill to its carrying amount. If the carrying amount of goodwill exceeds its implied fair value, an impairment loss isrecognized equal to that excess. The implied fair value of goodwill is calculated in the same manner that goodwill is calculated in a business combination,whereby the fair value of the reporting unit is allocated to all of the assets and liabilities of that unit, with the excess purchases price over the amountsassigned to assets and liabilities. Estimating fair value is performed by utilizing various valuation approaches, such as income approach or market approach.The total of all reporting unit fair values was also compared to the Company’s market capitalization plus control premium for reasonableness. See Note 10,“Goodwill and Acquired Intangible Assets,” regarding impairment testing.
Other Assets
Other assets primarily consist of industrial property right and deposits for office leases.
Restricted Assets
Restricted assets consist of deposits required for litigation and restricted cash. Restricted cash represents cash set aside as collateral for obtainingcapacity and borrowings as well as cash received from government grants with restriction on its usage.
F-11
Table of Contents
Other long-term liabilities
Other long-term liabilities primarily consist of payable to former shareholders of Shannon Systems and unrecognized tax benefit.
Pension Costs
For employees under defined contribution pension plans, pension costs are recorded based on the actual contributions made to employees’ individualpension accounts. For employees under defined benefit pension plans, pension costs are recorded based on actuarial calculations.
Revenue Recognition
Revenue from product sales is generally recognized upon shipment to the customer provided that the Company has received a signed purchase order,the price is fixed or determinable, transfer of title has occurred in accordance with the shipping terms specified in the arrangement with the customer,collectibility from the customer is considered reasonably assured, product returns are reasonably estimable and there are no remaining significant obligationsor customer acceptance requirements. Revenue on development service orders is generally recognized upon completion and customer acceptance ofcontractually agreed milestones.
The Company grants certain distributors limited rights of return and price protection rights on unsold products. The return rights are generally limitedto five percent of the monetary value of products purchased within the preceding six months, provided that the distributor places a corresponding restockingorder of equal or greater value. An allowance for sales returns for distributors and all customers is recorded at the time of sale based on historical returnsinformation available, management’s judgment and any known factors at the time the financial statements are prepared that would significantly affect theallowance. Price protection rights are based on the inventory products the distributors have on hand at the date the price protection is offered. A reserve forprice adjustments is recorded based on the estimated products on hand at the distributors and historical experience. The Company incurred actual priceadjustments to distributors are minimal.
The Company provides a warranty period of one year for manufacturing defects of its products. Warranty returns have been infrequent and relate todefective or off-specification parts. The Company estimates a reserve for warranty based on historical experience and records this amount to cost of sales. Forthe years ended December 31, 2013, 2014 and 2015, the Company did not experience significant costs associated with warranty returns.
Research and Development
Research and development costs consist of expenditures incurred during the course of planned research and investigation aimed at the discovery of newknowledge that will be useful in developing new products or at significantly enhancing existing products as well as expenditures incurred for the design andtesting of product alternatives. All expenditures related to research and development activities of the Company are charged to operating expenses whenincurred. Third-party research and development costs are expensed when the contracted work has been performed or as milestone results have been achieved.
Income Taxes
The provision for income tax represents income tax paid and payable for the current year plus the changes in the deferred income tax assets andliabilities during the years. Deferred income tax assets are recognized for net operating loss carryforwards, research and development credits, and temporarydifferences. The Company believes that uncertainty exists regarding the realizability of certain deferred income tax assets and, accordingly, has established avaluation allowance for those deferred income tax assets to the extent the realizability is not
F-12
Table of Contents
deemed to be more likely than not. Deferred income tax assets and liabilities are measured using enacted tax rates. The Company has classified deferred taxassets and liabilities as noncurrent on the consolidated balance sheets as of December 31, 2015 and 2014 as the Company has early adopted AccountingStandards Update (“ASU”) 2015-17, Balance Sheet Classification of Deferred Taxes, on a retrospective basis.
The Company utilizes a two step approach to recognizing and measuring uncertain tax positions. The first step is to evaluate the tax position forrecognition by determining if the weight of available evidence indicates it is more likely than not that the position will be sustained in a dispute with taxingauthorities, including resolution of related appeals or litigation processes, if any. The second step is to measure the tax benefit as the largest amount which ismore than 50% likely of being realized upon ultimate settlement.
SMI Taiwan, the Company’s largest operating company is a Taiwan registered company. Under Taiwan tax regulations, the current year’s earnings, onan after tax basis, that are not distributed in the following year are subject to a 10% surtax income tax. This 10% surtax income tax is recognized in the periodduring which the related earnings are generated.
The Taiwan government enacted the Income Basic Tax Act (“the IBT Act”), which became effective on January 1, 2006. The alternative minimum tax(“AMT”) imposed under the IBT Act is a supplemental tax levied at a rate of 10% which is payable if the income tax payable determined pursuant to theIncome Tax Law is below the minimum amount prescribed under the IBT Act. The taxable income for calculating the AMT includes most of the income thatis exempted from income tax under various laws and statutes. The Company has considered the impact of the IBT Act in the determination of its taxliabilities. Under the IBT Act amended in August 2012, the standard deduction and the tax rate of AMT were amended from NT$1,000 thousand to beNT$500 thousand and from 10% to 12%, respectively. The amended IBT Act is effective on January 1, 2013.
Foreign Currency Transactions
Foreign currency transactions are recorded at the rates of exchange in effect when the transaction occurs. Gains or losses, resulting from the applicationof different foreign exchange rates when cash in foreign currency is converted into the entities’ functional currency, or when foreign currency receivables andpayables are settled, are credited or charged to income in the period of conversion or settlement. At the balance sheet date, assets and liabilities denominatedin foreign currencies are remeasured based on prevailing exchange rates and any resulting gains or losses are credited or charged to income.
Translation of Foreign Currency Financial Statements
The reporting currency of the Company is the U.S. dollars. The functional currency of some of the Company’s subsidiaries is the local currency of therespective entity. Accordingly, the financial statements of the foreign subsidiaries were translated into U.S. dollars at the following exchange rates: assets andliabilities — current rate on the balance sheet date; shareholders’ equity — historical rates; income and expenses — average rate during the period. Theresulting translation adjustment is recorded as a separate component of comprehensive income.
F-13
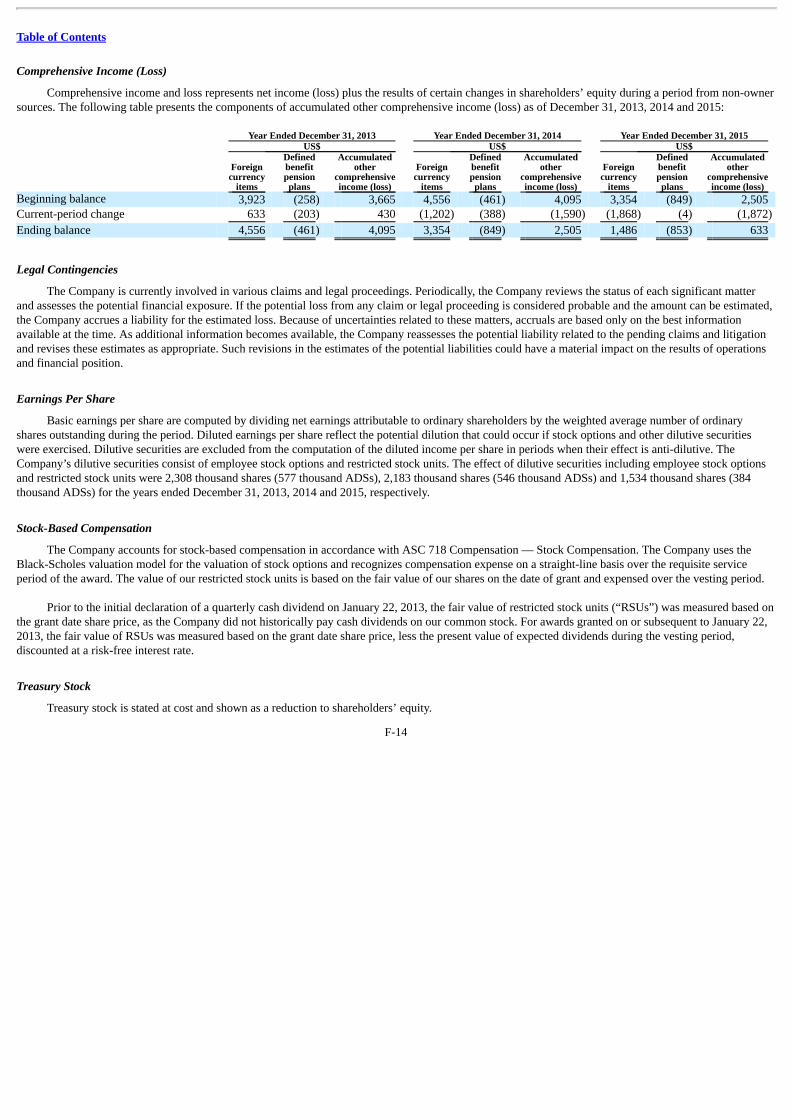
Table of Contents
Comprehensive Income (Loss)
Comprehensive income and loss represents net income (loss) plus the results of certain changes in shareholders’ equity during a period from non-ownersources. The following table presents the components of accumulated other comprehensive income (loss) as of December 31, 2013, 2014 and 2015: Year Ended December 31, 2013 Year Ended December 31, 2014 Year Ended December 31, 2015 US$ US$ US$
Foreigncurrency
items
Definedbenefitpensionplans
Accumulatedother
comprehensiveincome (loss)
Foreigncurrency
items
Definedbenefitpensionplans
Accumulatedother
comprehensiveincome (loss)
Foreigncurrency
items
Definedbenefitpensionplans
Accumulatedother
comprehensiveincome (loss)
Beginning balance 3,923 (258) 3,665 4,556 (461) 4,095 3,354 (849) 2,505 Current-period change 633 (203) 430 (1,202) (388) (1,590) (1,868) (4) (1,872)
Ending balance 4,556 (461) 4,095 3,354 (849) 2,505 1,486 (853) 633
Legal Contingencies
The Company is currently involved in various claims and legal proceedings. Periodically, the Company reviews the status of each significant matterand assesses the potential financial exposure. If the potential loss from any claim or legal proceeding is considered probable and the amount can be estimated,the Company accrues a liability for the estimated loss. Because of uncertainties related to these matters, accruals are based only on the best informationavailable at the time. As additional information becomes available, the Company reassesses the potential liability related to the pending claims and litigationand revises these estimates as appropriate. Such revisions in the estimates of the potential liabilities could have a material impact on the results of operationsand financial position.
Earnings Per Share
Basic earnings per share are computed by dividing net earnings attributable to ordinary shareholders by the weighted average number of ordinaryshares outstanding during the period. Diluted earnings per share reflect the potential dilution that could occur if stock options and other dilutive securitieswere exercised. Dilutive securities are excluded from the computation of the diluted income per share in periods when their effect is anti-dilutive. TheCompany’s dilutive securities consist of employee stock options and restricted stock units. The effect of dilutive securities including employee stock optionsand restricted stock units were 2,308 thousand shares (577 thousand ADSs), 2,183 thousand shares (546 thousand ADSs) and 1,534 thousand shares (384thousand ADSs) for the years ended December 31, 2013, 2014 and 2015, respectively.
Stock-Based Compensation
The Company accounts for stock-based compensation in accordance with ASC 718 Compensation — Stock Compensation. The Company uses theBlack-Scholes valuation model for the valuation of stock options and recognizes compensation expense on a straight-line basis over the requisite serviceperiod of the award. The value of our restricted stock units is based on the fair value of our shares on the date of grant and expensed over the vesting period.
Prior to the initial declaration of a quarterly cash dividend on January 22, 2013, the fair value of restricted stock units (“RSUs”) was measured based onthe grant date share price, as the Company did not historically pay cash dividends on our common stock. For awards granted on or subsequent to January 22,2013, the fair value of RSUs was measured based on the grant date share price, less the present value of expected dividends during the vesting period,discounted at a risk-free interest rate.
Treasury Stock
Treasury stock is stated at cost and shown as a reduction to shareholders’ equity.
F-14
Table of Contents
The Company retires ordinary shares repurchased under a share repurchase plan. Accordingly, upon retirement the excess of the purchase price over parvalue is allocated between additional paid-in capital and retained earnings based on the average issuance price of the shares repurchased. A repurchase ofADSs is recorded as treasury stock until the Company completes the withdrawal of the underlying ordinary shares from the ADS program.
Dividends
Our Board of Directors declared payment of our first quarterly dividend on our common stock in January 2013 and the first dividend payment wasmade on March 4, 2013. Our Board of Directors has subsequently declared and paid dividends in each successive quarter. On November 2, 2015, our Boardof Directors, instead of declaring a quarterly dividend, declared an annual dividend payable in four quarterly installments. The payment of future cashdividends are subject to the Board’s continuing determination that the payment of dividends are in the best interests of the Company’s shareholders and are incompliance with all laws and agreements of the Company applicable to the declaration and payment of cash dividends.
Recent Accounting Pronouncements
In April 10, 2014, the FASB issued an accounting update, which changes the criteria for reporting discontinued operations for all public and nonpublicentities. The guidance requires only disposals that represent a strategic shift that has (or will have) a major effect on the entity’s results and operations wouldqualify as discontinued operations. The guidance also requires entities 1) to expand their disclosures about discontinued operations to include moreinformation about assets, liabilities, income, and expenses and 2) to disclose the pre-tax income attributable to a disposal of “of an individually significantcomponent of an entity that does not qualify for discontinued operations presentation in the financial statements.” The guidance is effective for fiscal yearsbeginning after December 15, 2014 and early adoption is prohibited. The adoption of this guidance did not have a material impact on the Company’s resultsof operations, financial position or cash flow.
In May 2014, the FASB issued a new standard related to revenue recognition. Under the new standard, recognition of revenue occurs when a customerobtains control of promised goods or services in an amount that reflects the consideration to which the entity expects to be entitled in exchange for thosegoods or services. In addition, the new standard requires disclosure of the nature, amount, timing, and uncertainty of revenue and cash flows arising fromcontracts with customers. In August 2015, the FASB issued an amendment to defer the effective date. The new standard is effective for fiscal years beginningafter December 15, 2017 and early adoption is permitted for annual reporting periods beginning after December 15, 2016. In March and April 2016, theFASB issued two accounting updates to clarify the implementation guidance on principal versus agent considerations, performance obligations and thelicensing. The new guidance is required to be applied retrospectively to each prior reporting period presented or retrospectively with the cumulative effect ofinitially applying it recognized at the date of initial application. The Company is in the process of evaluating this guidance to determine the impact it will haveon the consolidated financial statements.
In June 2014, the FASB issued an accounting update, which clarifies the accounting for share-based payments. The guidance requires that aperformance target that affects vesting and that could be achieved after the requisite service period is treated as a performance condition. The guidance iseffective for fiscal years beginning after December 15, 2015 and early adoption is permitted. The adoption of this guidance is not expected to have a materialimpact on the Company’s results of operations, financial position or cash flow.
In August 2014, the FASB issued new standard related to the presentation of financial statements when there may be conditions or events that raisesubstantial doubt about the entity’s ability to continue as a going concern. This standard sets forth management’s responsibility to evaluate, each reportingperiod, whether there is substantial doubt about our ability to continue as a going concern, and if so, to provide related footnote disclosures. The standard iseffective for fiscal years beginning after December 15, 2016 and early adoption is permitted. The adoption of this guidance is not expected to have a materialimpact on the Company’s results of operations, financial position or cash flow.
F-15
Table of Contents
In February 2015, the FASB issued an accounting update to amend the consolidation analysis. All legal entities are subject to reevaluation under therevised consolidation model. The amendment is effective for fiscal years beginning after December 15, 2015 and early adoption is permitted. The adoption ofthis amendment is not expected to have a material impact on the Company’s results of operations, financial position or cash flow.
In April 2015, the FASB issued an accounting update regarding the measurement date of a defined benefit obligation and plan assets. The amendmentpermits the entity with a fiscal year-end that does not coincide with a month-end to measure defined benefit plan assets and obligations using the month-endthat is closest to the entity’s fiscal year-end. If a contribution or significant event (such as a plan amendment, settlement, or curtailment that calls for aremeasurement in accordance with existing requirements) occurs between the month-end date used to measure defined benefit plan assets and obligations andan entity’s fiscal year-end, the entity should adjust the measurement of defined benefit plan assets and obligations to reflect the effects of those contributionsor significant events. This amendment is effective for fiscal years beginning after December 15, 2016 and early application is permitted. The adoption of thisamendment is not expected to have a material impact on the Company’s results of operations, financial position or cash flow.
In May 2015, the FASB issued an accounting update regarding disclosures for investments that calculate net asset value per share. The amendmentremoves the requirement to categorize within the fair value hierarchy all investments for which fair value is measured using the net asset value per sharepractical expedient. Instead, an entity is required to include those investments as a reconciling line item so that the total fair value amount of investments inthe disclosure is consistent with the amount on the balance sheet. Further, the amendment removes the requirement to make certain disclosures for allinvestments that are eligible to be measured at fair value using the net asset value per share practical expedient. Rather, those disclosures are limited toinvestments for which the entity has elected to measure the fair value using the practical expedient. The amendment is effective for fiscal years beginningafter December 15, 2015. The amendment must be applied retrospectively and early adoption is permitted. The adoption of this amendment is not expected tohave a material impact on the Company’s financial statement disclosure.
In July 2015, the FASB issued an accounting update to simplify the measurement of inventory. The amendment requires the measurement of inventoryat the lower of cost and net realizable value. Net realizable value is the estimated selling prices in the ordinary course of business, less reasonably predictablecosts of completion, disposal, and transportation. The amendment applies to inventories for which cost is determined by methods other than the last-in first-out and the retail inventory methods. This amendment is effective prospectively for annual periods beginning after December 15, 2016 and early applicationis permitted. The adoption of this amendment is not expected to have a material impact on the Company’s results of operations, financial position or cashflow.
In September 2015, the FASB issued an accounting update regarding simplifying the accounting for measurement period adjustments attributable to anacquisition. The amendment requires an acquirer must recognize adjustments to provisional amounts that are identified during the measurement period in thereporting period in which the adjustment amounts are determined. The adjustments should reflect the impact on earnings of changes in depreciation,amortization, or other income effects, if any, as if the accounting had been completed as of the acquisition date. Additionally, amounts recorded in the currentperiod that would have been reflected in prior reporting periods if the adjustments had been recognized as of the acquisition date must be disclosed either onthe face of the income statement or in the notes to financial statements. This amendment is effective prospectively for annual periods beginning afterDecember 15, 2015 and early application is permitted. The adoption of this guidance is not expected to have a material effect on the Company’s financialcondition, results of operations, cash flow and financial statement disclosures.
In November 2015, the FASB issued an accounting update to simplify the presentation of deferred income taxes. The amendment requires that deferredtax liabilities and assets be classified as noncurrent in a classified statement of financial position. The current requirement that deferred tax liabilities andassets of a tax-paying component of an entity be offset and presented as a single amount is not affected by the amendments in this
F-16
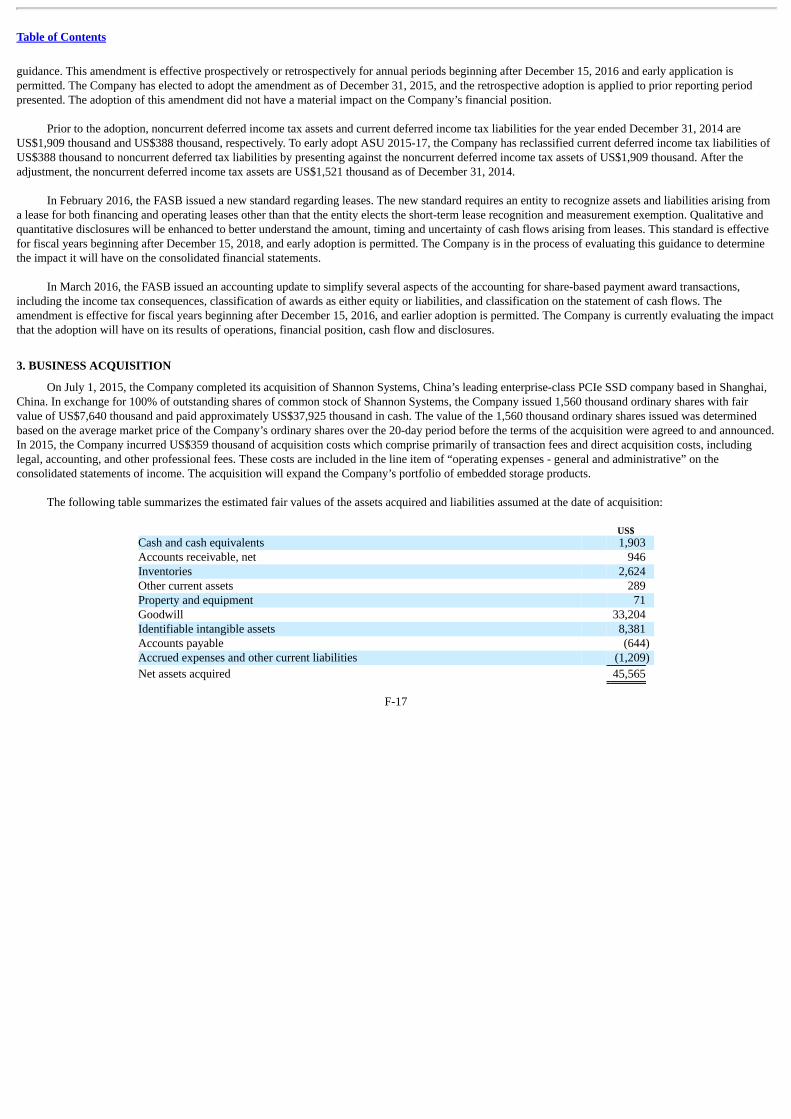
Table of Contents
guidance. This amendment is effective prospectively or retrospectively for annual periods beginning after December 15, 2016 and early application ispermitted. The Company has elected to adopt the amendment as of December 31, 2015, and the retrospective adoption is applied to prior reporting periodpresented. The adoption of this amendment did not have a material impact on the Company’s financial position.
Prior to the adoption, noncurrent deferred income tax assets and current deferred income tax liabilities for the year ended December 31, 2014 areUS$1,909 thousand and US$388 thousand, respectively. To early adopt ASU 2015-17, the Company has reclassified current deferred income tax liabilities ofUS$388 thousand to noncurrent deferred tax liabilities by presenting against the noncurrent deferred income tax assets of US$1,909 thousand. After theadjustment, the noncurrent deferred income tax assets are US$1,521 thousand as of December 31, 2014.
In February 2016, the FASB issued a new standard regarding leases. The new standard requires an entity to recognize assets and liabilities arising froma lease for both financing and operating leases other than that the entity elects the short-term lease recognition and measurement exemption. Qualitative andquantitative disclosures will be enhanced to better understand the amount, timing and uncertainty of cash flows arising from leases. This standard is effectivefor fiscal years beginning after December 15, 2018, and early adoption is permitted. The Company is in the process of evaluating this guidance to determinethe impact it will have on the consolidated financial statements.
In March 2016, the FASB issued an accounting update to simplify several aspects of the accounting for share-based payment award transactions,including the income tax consequences, classification of awards as either equity or liabilities, and classification on the statement of cash flows. Theamendment is effective for fiscal years beginning after December 15, 2016, and earlier adoption is permitted. The Company is currently evaluating the impactthat the adoption will have on its results of operations, financial position, cash flow and disclosures.
3. BUSINESS ACQUISITION
On July 1, 2015, the Company completed its acquisition of Shannon Systems, China’s leading enterprise-class PCIe SSD company based in Shanghai,China. In exchange for 100% of outstanding shares of common stock of Shannon Systems, the Company issued 1,560 thousand ordinary shares with fairvalue of US$7,640 thousand and paid approximately US$37,925 thousand in cash. The value of the 1,560 thousand ordinary shares issued was determinedbased on the average market price of the Company’s ordinary shares over the 20-day period before the terms of the acquisition were agreed to and announced.In 2015, the Company incurred US$359 thousand of acquisition costs which comprise primarily of transaction fees and direct acquisition costs, includinglegal, accounting, and other professional fees. These costs are included in the line item of “operating expenses - general and administrative” on theconsolidated statements of income. The acquisition will expand the Company’s portfolio of embedded storage products.
The following table summarizes the estimated fair values of the assets acquired and liabilities assumed at the date of acquisition:
US$ Cash and cash equivalents 1,903 Accounts receivable, net 946 Inventories 2,624 Other current assets 289 Property and equipment 71 Goodwill 33,204 Identifiable intangible assets 8,381 Accounts payable (644) Accrued expenses and other current liabilities (1,209)
Net assets acquired 45,565
F-17
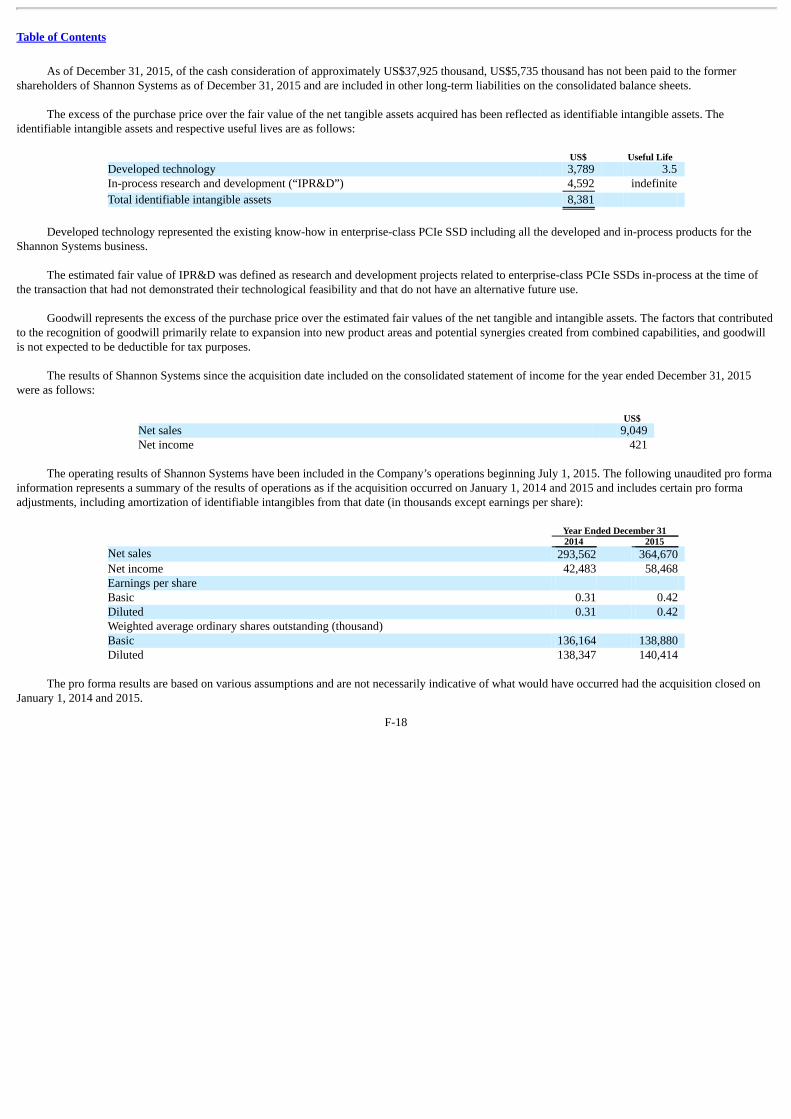
Table of Contents
As of December 31, 2015, of the cash consideration of approximately US$37,925 thousand, US$5,735 thousand has not been paid to the formershareholders of Shannon Systems as of December 31, 2015 and are included in other long-term liabilities on the consolidated balance sheets.
The excess of the purchase price over the fair value of the net tangible assets acquired has been reflected as identifiable intangible assets. Theidentifiable intangible assets and respective useful lives are as follows:
US$ Useful Life Developed technology 3,789 3.5 In-process research and development (“IPR&D”) 4,592 indefinite
Total identifiable intangible assets 8,381
Developed technology represented the existing know-how in enterprise-class PCIe SSD including all the developed and in-process products for theShannon Systems business.
The estimated fair value of IPR&D was defined as research and development projects related to enterprise-class PCIe SSDs in-process at the time ofthe transaction that had not demonstrated their technological feasibility and that do not have an alternative future use.
Goodwill represents the excess of the purchase price over the estimated fair values of the net tangible and intangible assets. The factors that contributedto the recognition of goodwill primarily relate to expansion into new product areas and potential synergies created from combined capabilities, and goodwillis not expected to be deductible for tax purposes.
The results of Shannon Systems since the acquisition date included on the consolidated statement of income for the year ended December 31, 2015were as follows:
US$ Net sales 9,049 Net income 421
The operating results of Shannon Systems have been included in the Company’s operations beginning July 1, 2015. The following unaudited pro formainformation represents a summary of the results of operations as if the acquisition occurred on January 1, 2014 and 2015 and includes certain pro formaadjustments, including amortization of identifiable intangibles from that date (in thousands except earnings per share):
Year Ended December 31 2014 2015 Net sales 293,562 364,670 Net income 42,483 58,468 Earnings per share Basic 0.31 0.42 Diluted 0.31 0.42 Weighted average ordinary shares outstanding (thousand) Basic 136,164 138,880 Diluted 138,347 140,414
The pro forma results are based on various assumptions and are not necessarily indicative of what would have occurred had the acquisition closed onJanuary 1, 2014 and 2015.
F-18
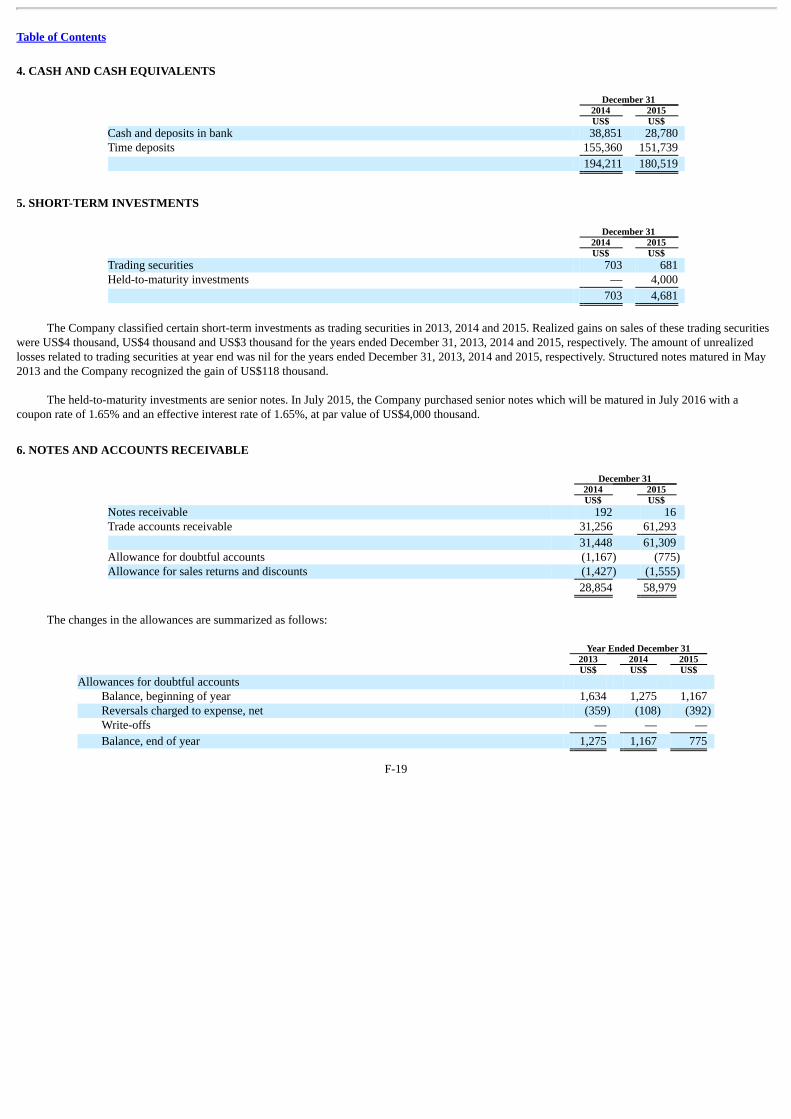
Table of Contents
4. CASH AND CASH EQUIVALENTS
December 31 2014 2015 US$ US$ Cash and deposits in bank 38,851 28,780 Time deposits 155,360 151,739
194,211 180,519
5. SHORT-TERM INVESTMENTS
December 31 2014 2015 US$ US$ Trading securities 703 681 Held-to-maturity investments — 4,000
703 4,681
The Company classified certain short-term investments as trading securities in 2013, 2014 and 2015. Realized gains on sales of these trading securitieswere US$4 thousand, US$4 thousand and US$3 thousand for the years ended December 31, 2013, 2014 and 2015, respectively. The amount of unrealizedlosses related to trading securities at year end was nil for the years ended December 31, 2013, 2014 and 2015, respectively. Structured notes matured in May2013 and the Company recognized the gain of US$118 thousand.
The held-to-maturity investments are senior notes. In July 2015, the Company purchased senior notes which will be matured in July 2016 with acoupon rate of 1.65% and an effective interest rate of 1.65%, at par value of US$4,000 thousand.
6. NOTES AND ACCOUNTS RECEIVABLE
December 31 2014 2015 US$ US$ Notes receivable 192 16 Trade accounts receivable 31,256 61,293
31,448 61,309 Allowance for doubtful accounts (1,167) (775) Allowance for sales returns and discounts (1,427) (1,555)
28,854 58,979
The changes in the allowances are summarized as follows:
Year Ended December 31 2013 2014 2015 US$ US$ US$ Allowances for doubtful accounts
Balance, beginning of year 1,634 1,275 1,167 Reversals charged to expense, net (359) (108) (392) Write-offs — — —
Balance, end of year 1,275 1,167 775
F-19
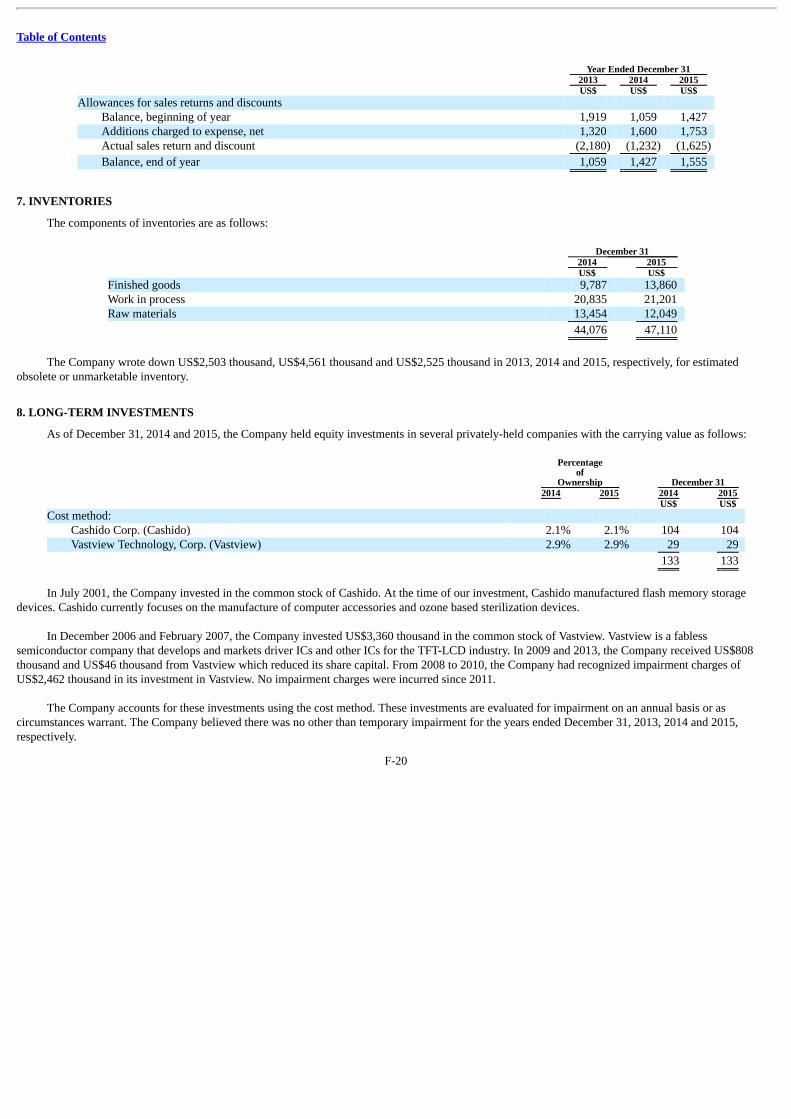
Table of Contents
Year Ended December 31 2013 2014 2015 US$ US$ US$ Allowances for sales returns and discounts
Balance, beginning of year 1,919 1,059 1,427 Additions charged to expense, net 1,320 1,600 1,753 Actual sales return and discount (2,180) (1,232) (1,625)
Balance, end of year 1,059 1,427 1,555
7. INVENTORIES
The components of inventories are as follows:
December 31 2014 2015 US$ US$ Finished goods 9,787 13,860 Work in process 20,835 21,201 Raw materials 13,454 12,049
44,076 47,110
The Company wrote down US$2,503 thousand, US$4,561 thousand and US$2,525 thousand in 2013, 2014 and 2015, respectively, for estimatedobsolete or unmarketable inventory.
8. LONG-TERM INVESTMENTS
As of December 31, 2014 and 2015, the Company held equity investments in several privately-held companies with the carrying value as follows:
Percentageof
Ownership December 31 2014 2015 2014 2015 US$ US$ Cost method:
Cashido Corp. (Cashido) 2.1% 2.1% 104 104 Vastview Technology, Corp. (Vastview) 2.9% 2.9% 29 29
133 133
In July 2001, the Company invested in the common stock of Cashido. At the time of our investment, Cashido manufactured flash memory storagedevices. Cashido currently focuses on the manufacture of computer accessories and ozone based sterilization devices.
In December 2006 and February 2007, the Company invested US$3,360 thousand in the common stock of Vastview. Vastview is a fablesssemiconductor company that develops and markets driver ICs and other ICs for the TFT-LCD industry. In 2009 and 2013, the Company received US$808thousand and US$46 thousand from Vastview which reduced its share capital. From 2008 to 2010, the Company had recognized impairment charges ofUS$2,462 thousand in its investment in Vastview. No impairment charges were incurred since 2011.
The Company accounts for these investments using the cost method. These investments are evaluated for impairment on an annual basis or ascircumstances warrant. The Company believed there was no other than temporary impairment for the years ended December 31, 2013, 2014 and 2015,respectively.
F-20
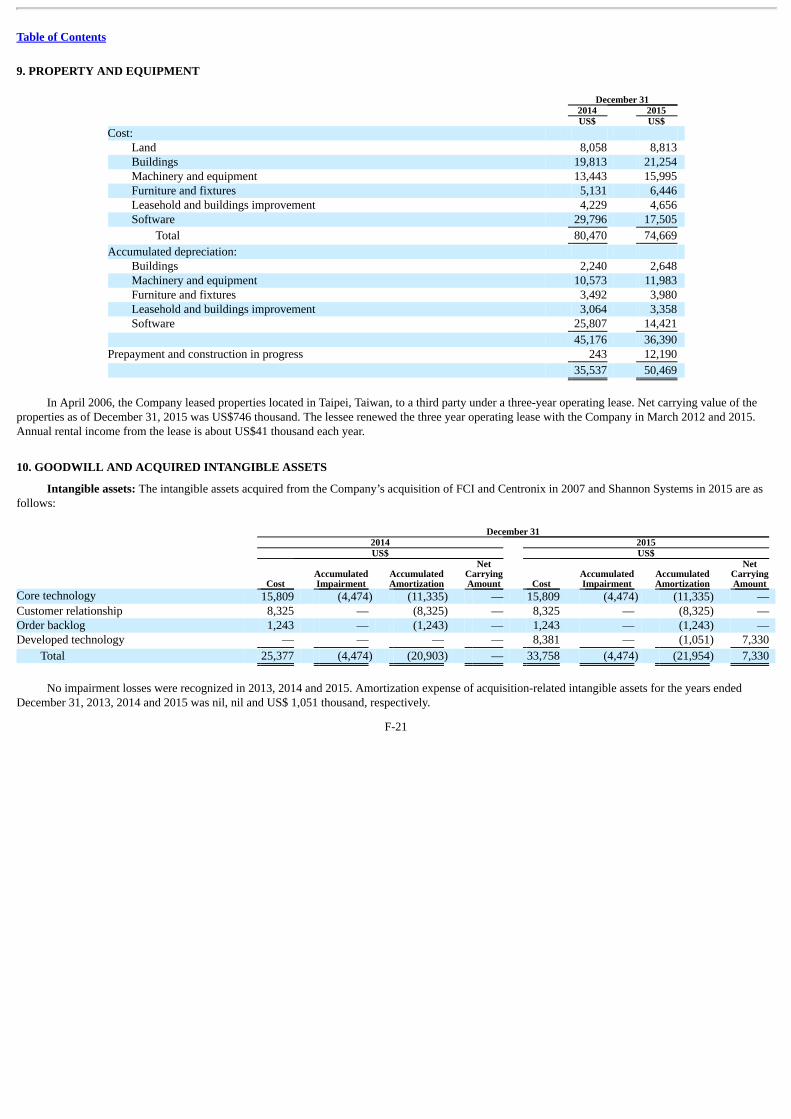
Table of Contents
9. PROPERTY AND EQUIPMENT
December 31 2014 2015 US$ US$ Cost:
Land 8,058 8,813 Buildings 19,813 21,254 Machinery and equipment 13,443 15,995 Furniture and fixtures 5,131 6,446 Leasehold and buildings improvement 4,229 4,656 Software 29,796 17,505
Total 80,470 74,669
Accumulated depreciation: Buildings 2,240 2,648 Machinery and equipment 10,573 11,983 Furniture and fixtures 3,492 3,980 Leasehold and buildings improvement 3,064 3,358 Software 25,807 14,421
45,176 36,390 Prepayment and construction in progress 243 12,190
35,537 50,469
In April 2006, the Company leased properties located in Taipei, Taiwan, to a third party under a three-year operating lease. Net carrying value of theproperties as of December 31, 2015 was US$746 thousand. The lessee renewed the three year operating lease with the Company in March 2012 and 2015.Annual rental income from the lease is about US$41 thousand each year.
10. GOODWILL AND ACQUIRED INTANGIBLE ASSETS
Intangible assets: The intangible assets acquired from the Company’s acquisition of FCI and Centronix in 2007 and Shannon Systems in 2015 are asfollows: December 31 2014 2015 US$ US$
Cost AccumulatedImpairment
AccumulatedAmortization
NetCarryingAmount Cost
AccumulatedImpairment
AccumulatedAmortization
NetCarryingAmount
Core technology 15,809 (4,474) (11,335) — 15,809 (4,474) (11,335) — Customer relationship 8,325 — (8,325) — 8,325 — (8,325) — Order backlog 1,243 — (1,243) — 1,243 — (1,243) — Developed technology — — — — 8,381 — (1,051) 7,330
Total 25,377 (4,474) (20,903) — 33,758 (4,474) (21,954) 7,330
No impairment losses were recognized in 2013, 2014 and 2015. Amortization expense of acquisition-related intangible assets for the years endedDecember 31, 2013, 2014 and 2015 was nil, nil and US$ 1,051 thousand, respectively.
F-21
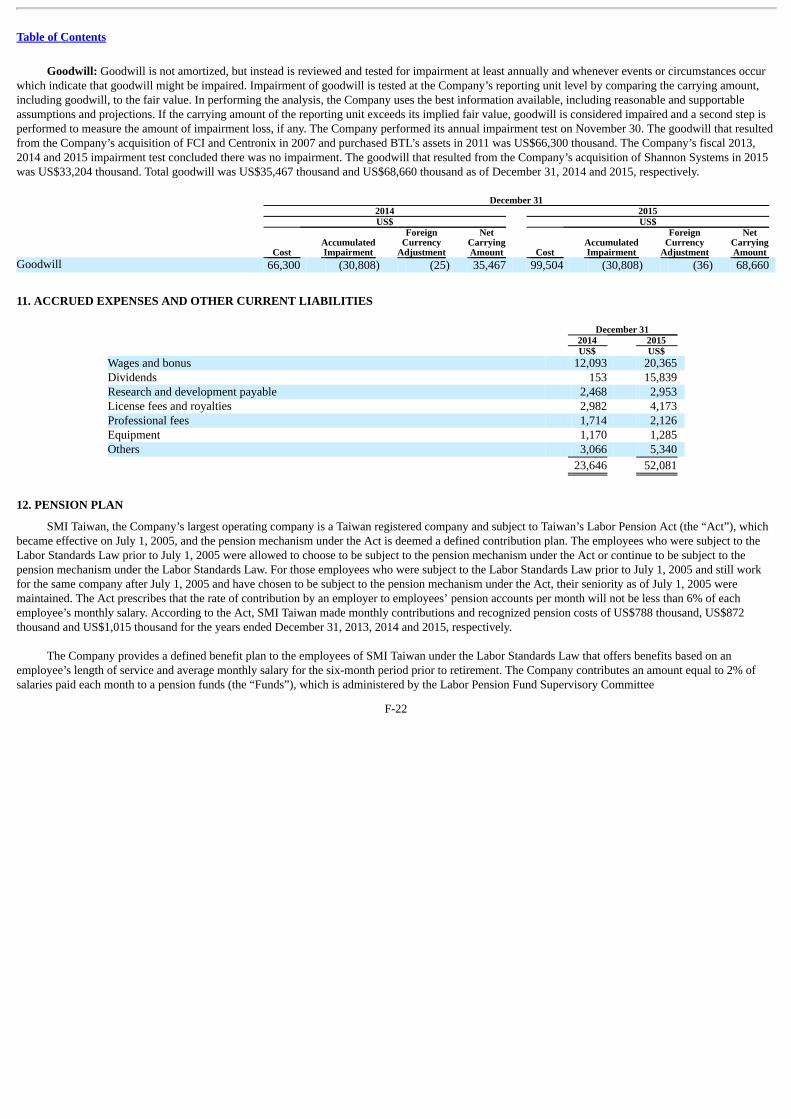
Table of Contents
Goodwill: Goodwill is not amortized, but instead is reviewed and tested for impairment at least annually and whenever events or circumstances occurwhich indicate that goodwill might be impaired. Impairment of goodwill is tested at the Company’s reporting unit level by comparing the carrying amount,including goodwill, to the fair value. In performing the analysis, the Company uses the best information available, including reasonable and supportableassumptions and projections. If the carrying amount of the reporting unit exceeds its implied fair value, goodwill is considered impaired and a second step isperformed to measure the amount of impairment loss, if any. The Company performed its annual impairment test on November 30. The goodwill that resultedfrom the Company’s acquisition of FCI and Centronix in 2007 and purchased BTL’s assets in 2011 was US$66,300 thousand. The Company’s fiscal 2013,2014 and 2015 impairment test concluded there was no impairment. The goodwill that resulted from the Company’s acquisition of Shannon Systems in 2015was US$33,204 thousand. Total goodwill was US$35,467 thousand and US$68,660 thousand as of December 31, 2014 and 2015, respectively. December 31 2014 2015 US$ US$
Cost AccumulatedImpairment
ForeignCurrency
Adjustment
NetCarryingAmount Cost
AccumulatedImpairment
ForeignCurrency
Adjustment
NetCarryingAmount
Goodwill 66,300 (30,808) (25) 35,467 99,504 (30,808) (36) 68,660
11. ACCRUED EXPENSES AND OTHER CURRENT LIABILITIES
December 31 2014 2015 US$ US$ Wages and bonus 12,093 20,365 Dividends 153 15,839 Research and development payable 2,468 2,953 License fees and royalties 2,982 4,173 Professional fees 1,714 2,126 Equipment 1,170 1,285 Others 3,066 5,340
23,646 52,081
12. PENSION PLAN
SMI Taiwan, the Company’s largest operating company is a Taiwan registered company and subject to Taiwan’s Labor Pension Act (the “Act”), whichbecame effective on July 1, 2005, and the pension mechanism under the Act is deemed a defined contribution plan. The employees who were subject to theLabor Standards Law prior to July 1, 2005 were allowed to choose to be subject to the pension mechanism under the Act or continue to be subject to thepension mechanism under the Labor Standards Law. For those employees who were subject to the Labor Standards Law prior to July 1, 2005 and still workfor the same company after July 1, 2005 and have chosen to be subject to the pension mechanism under the Act, their seniority as of July 1, 2005 weremaintained. The Act prescribes that the rate of contribution by an employer to employees’ pension accounts per month will not be less than 6% of eachemployee’s monthly salary. According to the Act, SMI Taiwan made monthly contributions and recognized pension costs of US$788 thousand, US$872thousand and US$1,015 thousand for the years ended December 31, 2013, 2014 and 2015, respectively.
The Company provides a defined benefit plan to the employees of SMI Taiwan under the Labor Standards Law that offers benefits based on anemployee’s length of service and average monthly salary for the six-month period prior to retirement. The Company contributes an amount equal to 2% ofsalaries paid each month to a pension funds (the “Funds”), which is administered by the Labor Pension Fund Supervisory Committee
F-22
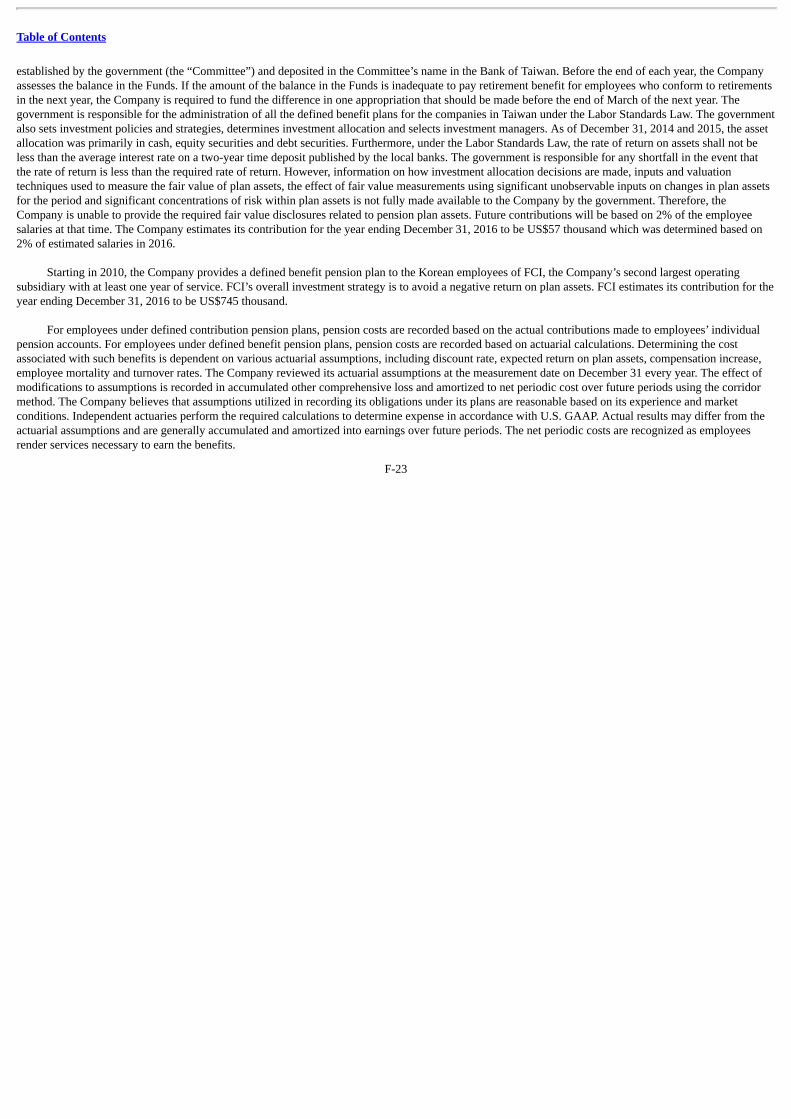
Table of Contents
established by the government (the “Committee”) and deposited in the Committee’s name in the Bank of Taiwan. Before the end of each year, the Companyassesses the balance in the Funds. If the amount of the balance in the Funds is inadequate to pay retirement benefit for employees who conform to retirementsin the next year, the Company is required to fund the difference in one appropriation that should be made before the end of March of the next year. Thegovernment is responsible for the administration of all the defined benefit plans for the companies in Taiwan under the Labor Standards Law. The governmentalso sets investment policies and strategies, determines investment allocation and selects investment managers. As of December 31, 2014 and 2015, the assetallocation was primarily in cash, equity securities and debt securities. Furthermore, under the Labor Standards Law, the rate of return on assets shall not beless than the average interest rate on a two-year time deposit published by the local banks. The government is responsible for any shortfall in the event thatthe rate of return is less than the required rate of return. However, information on how investment allocation decisions are made, inputs and valuationtechniques used to measure the fair value of plan assets, the effect of fair value measurements using significant unobservable inputs on changes in plan assetsfor the period and significant concentrations of risk within plan assets is not fully made available to the Company by the government. Therefore, theCompany is unable to provide the required fair value disclosures related to pension plan assets. Future contributions will be based on 2% of the employeesalaries at that time. The Company estimates its contribution for the year ending December 31, 2016 to be US$57 thousand which was determined based on2% of estimated salaries in 2016.
Starting in 2010, the Company provides a defined benefit pension plan to the Korean employees of FCI, the Company’s second largest operatingsubsidiary with at least one year of service. FCI’s overall investment strategy is to avoid a negative return on plan assets. FCI estimates its contribution for theyear ending December 31, 2016 to be US$745 thousand.
For employees under defined contribution pension plans, pension costs are recorded based on the actual contributions made to employees’ individualpension accounts. For employees under defined benefit pension plans, pension costs are recorded based on actuarial calculations. Determining the costassociated with such benefits is dependent on various actuarial assumptions, including discount rate, expected return on plan assets, compensation increase,employee mortality and turnover rates. The Company reviewed its actuarial assumptions at the measurement date on December 31 every year. The effect ofmodifications to assumptions is recorded in accumulated other comprehensive loss and amortized to net periodic cost over future periods using the corridormethod. The Company believes that assumptions utilized in recording its obligations under its plans are reasonable based on its experience and marketconditions. Independent actuaries perform the required calculations to determine expense in accordance with U.S. GAAP. Actual results may differ from theactuarial assumptions and are generally accumulated and amortized into earnings over future periods. The net periodic costs are recognized as employeesrender services necessary to earn the benefits.
F-23
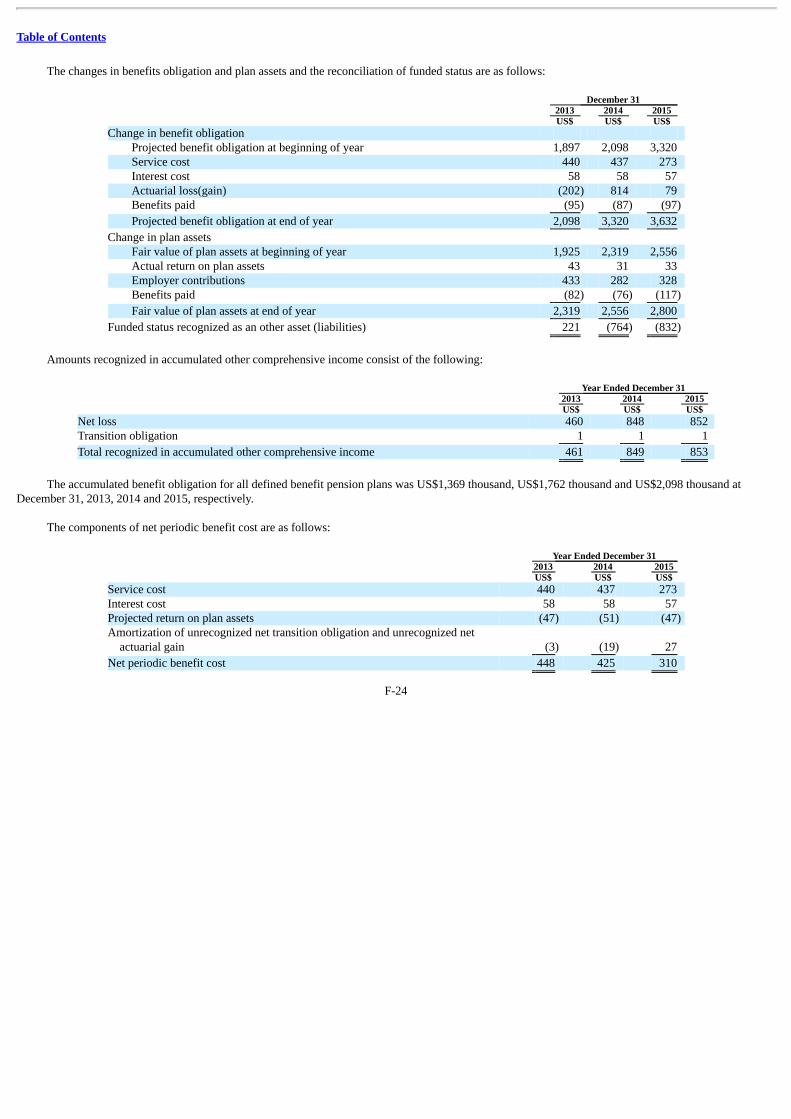
Table of Contents
The changes in benefits obligation and plan assets and the reconciliation of funded status are as follows:
December 31 2013 2014 2015 US$ US$ US$ Change in benefit obligation
Projected benefit obligation at beginning of year 1,897 2,098 3,320 Service cost 440 437 273 Interest cost 58 58 57 Actuarial loss(gain) (202) 814 79 Benefits paid (95) (87) (97)
Projected benefit obligation at end of year 2,098 3,320 3,632
Change in plan assets Fair value of plan assets at beginning of year 1,925 2,319 2,556 Actual return on plan assets 43 31 33 Employer contributions 433 282 328 Benefits paid (82) (76) (117)
Fair value of plan assets at end of year 2,319 2,556 2,800
Funded status recognized as an other asset (liabilities) 221 (764) (832)
Amounts recognized in accumulated other comprehensive income consist of the following:
Year Ended December 31 2013 2014 2015 US$ US$ US$ Net loss 460 848 852 Transition obligation 1 1 1
Total recognized in accumulated other comprehensive income 461 849 853
The accumulated benefit obligation for all defined benefit pension plans was US$1,369 thousand, US$1,762 thousand and US$2,098 thousand atDecember 31, 2013, 2014 and 2015, respectively.
The components of net periodic benefit cost are as follows:
Year Ended December 31 2013 2014 2015 US$ US$ US$ Service cost 440 437 273 Interest cost 58 58 57 Projected return on plan assets (47) (51) (47) Amortization of unrecognized net transition obligation and unrecognized net
actuarial gain (3) (19) 27
Net periodic benefit cost 448 425 310
F-24
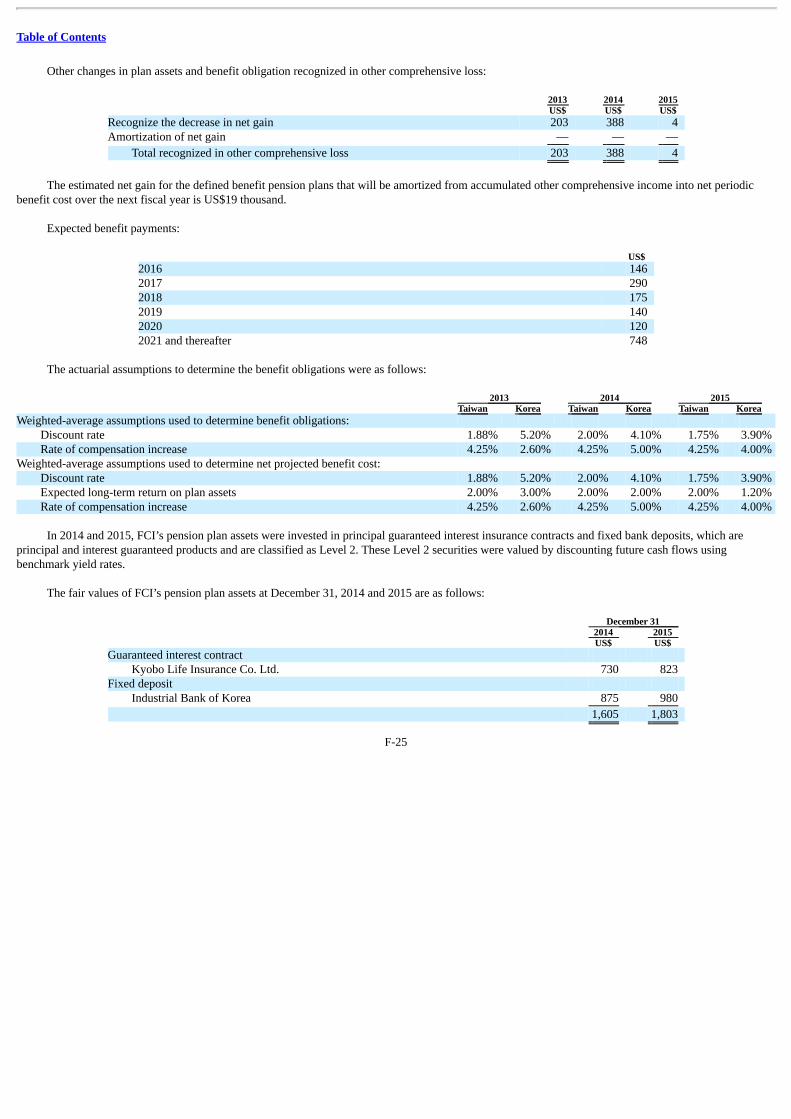
Table of Contents
Other changes in plan assets and benefit obligation recognized in other comprehensive loss:
2013 2014 2015 US$ US$ US$ Recognize the decrease in net gain 203 388 4 Amortization of net gain — — —
Total recognized in other comprehensive loss 203 388 4
The estimated net gain for the defined benefit pension plans that will be amortized from accumulated other comprehensive income into net periodicbenefit cost over the next fiscal year is US$19 thousand.
Expected benefit payments:
US$ 2016 146 2017 290 2018 175 2019 140 2020 120 2021 and thereafter 748
The actuarial assumptions to determine the benefit obligations were as follows: 2013 2014 2015 Taiwan Korea Taiwan Korea Taiwan Korea Weighted-average assumptions used to determine benefit obligations:
Discount rate 1.88% 5.20% 2.00% 4.10% 1.75% 3.90% Rate of compensation increase 4.25% 2.60% 4.25% 5.00% 4.25% 4.00%
Weighted-average assumptions used to determine net projected benefit cost: Discount rate 1.88% 5.20% 2.00% 4.10% 1.75% 3.90% Expected long-term return on plan assets 2.00% 3.00% 2.00% 2.00% 2.00% 1.20% Rate of compensation increase 4.25% 2.60% 4.25% 5.00% 4.25% 4.00%
In 2014 and 2015, FCI’s pension plan assets were invested in principal guaranteed interest insurance contracts and fixed bank deposits, which areprincipal and interest guaranteed products and are classified as Level 2. These Level 2 securities were valued by discounting future cash flows usingbenchmark yield rates.
The fair values of FCI’s pension plan assets at December 31, 2014 and 2015 are as follows:
December 31 2014 2015 US$ US$ Guaranteed interest contract
Kyobo Life Insurance Co. Ltd. 730 823 Fixed deposit
Industrial Bank of Korea 875 980
1,605 1,803
F-25

Table of Contents
13. INCOME TAXES
The components of income tax expense are as follows:
Year Ended December 31 2013 2014 2015 US$ US$ US$
Current 8,591 15,630 17,338 Deferred 1,181 471 911
Income tax expense 9,772 16,101 18,249
The income (loss) before income taxes for domestic and foreign entities is as follows:
Year Ended December 31 2013 2014 2015 US$ US$ US$ Domestic (8,080) (12,761) (12,037) Foreign 45,228 73,329 90,537
37,148 60,568 78,500
Since the Company is based in the Cayman Islands, a British overseas territory with no corporate income tax, domestic tax on pretax income iscalculated at the Cayman Islands statutory rate of zero for each year.
The Company and its subsidiaries file separate income tax returns. A reconciliation of income tax expense on pretax income at statutory rate andincome tax expense is shown below:
Year Ended December 31 2013 2014 2015 US$ US$ US$ Cayman statutory rate — — —
Tax on pretax income at statutory rate 6,788 15,727 18,765 Tax-exempt income (4,325) (2,573) (906) Permanent differences 1,730 (396) (1,065) Temporary differences 1,732 (344) (330) Alternative minimum tax 2,203 1,170 4 Income tax (10%) on undistributed earnings 3,396 2,491 2,460 Net changes in income tax credit 708 (899) (897) Net changes in valuation allowance of deferred income tax assets (2,364) 733 1,621 Net operating loss carryforwards (189) (1,298) (2,052) Liabilities related to unrealized tax benefits (39) 91 672 Adjustment of prior years’ taxes and others 132 1,399 (23)
Income tax expense 9,772 16,101 18,249
F-26
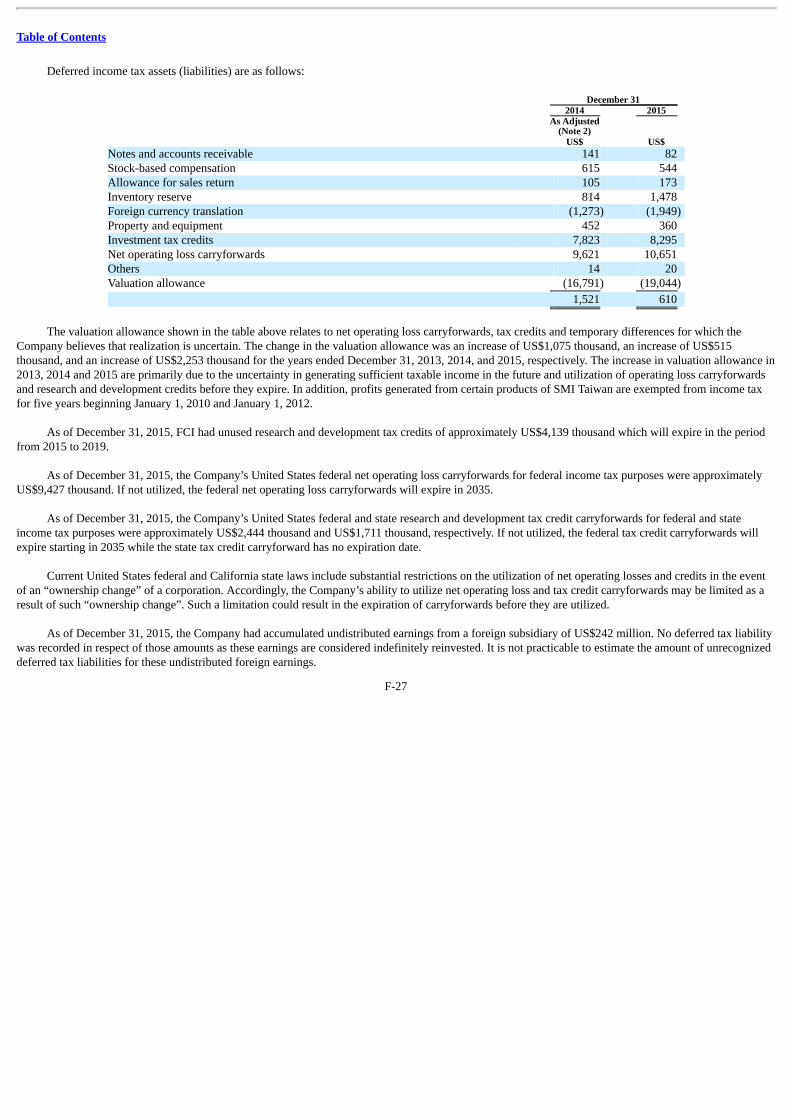
Table of Contents
Deferred income tax assets (liabilities) are as follows:
December 31 2014 2015
As Adjusted
(Note 2) US$ US$ Notes and accounts receivable 141 82 Stock-based compensation 615 544 Allowance for sales return 105 173 Inventory reserve 814 1,478 Foreign currency translation (1,273) (1,949) Property and equipment 452 360 Investment tax credits 7,823 8,295 Net operating loss carryforwards 9,621 10,651 Others 14 20 Valuation allowance (16,791) (19,044)
1,521 610
The valuation allowance shown in the table above relates to net operating loss carryforwards, tax credits and temporary differences for which theCompany believes that realization is uncertain. The change in the valuation allowance was an increase of US$1,075 thousand, an increase of US$515thousand, and an increase of US$2,253 thousand for the years ended December 31, 2013, 2014, and 2015, respectively. The increase in valuation allowance in2013, 2014 and 2015 are primarily due to the uncertainty in generating sufficient taxable income in the future and utilization of operating loss carryforwardsand research and development credits before they expire. In addition, profits generated from certain products of SMI Taiwan are exempted from income taxfor five years beginning January 1, 2010 and January 1, 2012.
As of December 31, 2015, FCI had unused research and development tax credits of approximately US$4,139 thousand which will expire in the periodfrom 2015 to 2019.
As of December 31, 2015, the Company’s United States federal net operating loss carryforwards for federal income tax purposes were approximatelyUS$9,427 thousand. If not utilized, the federal net operating loss carryforwards will expire in 2035.
As of December 31, 2015, the Company’s United States federal and state research and development tax credit carryforwards for federal and stateincome tax purposes were approximately US$2,444 thousand and US$1,711 thousand, respectively. If not utilized, the federal tax credit carryforwards willexpire starting in 2035 while the state tax credit carryforward has no expiration date.
Current United States federal and California state laws include substantial restrictions on the utilization of net operating losses and credits in the eventof an “ownership change” of a corporation. Accordingly, the Company’s ability to utilize net operating loss and tax credit carryforwards may be limited as aresult of such “ownership change”. Such a limitation could result in the expiration of carryforwards before they are utilized.
As of December 31, 2015, the Company had accumulated undistributed earnings from a foreign subsidiary of US$242 million. No deferred tax liabilitywas recorded in respect of those amounts as these earnings are considered indefinitely reinvested. It is not practicable to estimate the amount of unrecognizeddeferred tax liabilities for these undistributed foreign earnings.
F-27
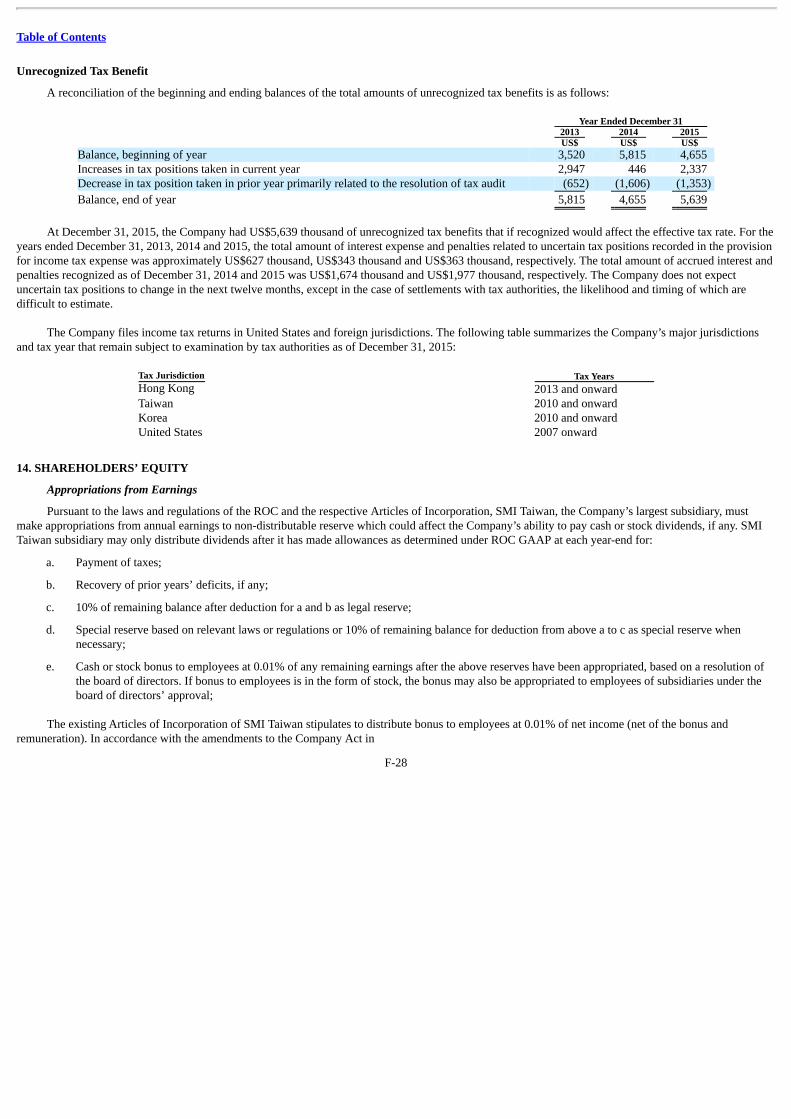
Table of Contents
Unrecognized Tax Benefit
A reconciliation of the beginning and ending balances of the total amounts of unrecognized tax benefits is as follows:
Year Ended December 31 2013 2014 2015 US$ US$ US$ Balance, beginning of year 3,520 5,815 4,655 Increases in tax positions taken in current year 2,947 446 2,337 Decrease in tax position taken in prior year primarily related to the resolution of tax audit (652) (1,606) (1,353)
Balance, end of year 5,815 4,655 5,639
At December 31, 2015, the Company had US$5,639 thousand of unrecognized tax benefits that if recognized would affect the effective tax rate. For theyears ended December 31, 2013, 2014 and 2015, the total amount of interest expense and penalties related to uncertain tax positions recorded in the provisionfor income tax expense was approximately US$627 thousand, US$343 thousand and US$363 thousand, respectively. The total amount of accrued interest andpenalties recognized as of December 31, 2014 and 2015 was US$1,674 thousand and US$1,977 thousand, respectively. The Company does not expectuncertain tax positions to change in the next twelve months, except in the case of settlements with tax authorities, the likelihood and timing of which aredifficult to estimate.
The Company files income tax returns in United States and foreign jurisdictions. The following table summarizes the Company’s major jurisdictionsand tax year that remain subject to examination by tax authorities as of December 31, 2015:
Tax Jurisdiction Tax YearsHong Kong 2013 and onwardTaiwan 2010 and onwardKorea 2010 and onwardUnited States 2007 onward
14. SHAREHOLDERS’ EQUITY
Appropriations from Earnings
Pursuant to the laws and regulations of the ROC and the respective Articles of Incorporation, SMI Taiwan, the Company’s largest subsidiary, mustmake appropriations from annual earnings to non-distributable reserve which could affect the Company’s ability to pay cash or stock dividends, if any. SMITaiwan subsidiary may only distribute dividends after it has made allowances as determined under ROC GAAP at each year-end for:
a. Payment of taxes;
b. Recovery of prior years’ deficits, if any;
c. 10% of remaining balance after deduction for a and b as legal reserve;
d. Special reserve based on relevant laws or regulations or 10% of remaining balance for deduction from above a to c as special reserve whennecessary;
e. Cash or stock bonus to employees at 0.01% of any remaining earnings after the above reserves have been appropriated, based on a resolution of
the board of directors. If bonus to employees is in the form of stock, the bonus may also be appropriated to employees of subsidiaries under theboard of directors’ approval;
The existing Articles of Incorporation of SMI Taiwan stipulates to distribute bonus to employees at 0.01% of net income (net of the bonus andremuneration). In accordance with the amendments to the Company Act in
F-28
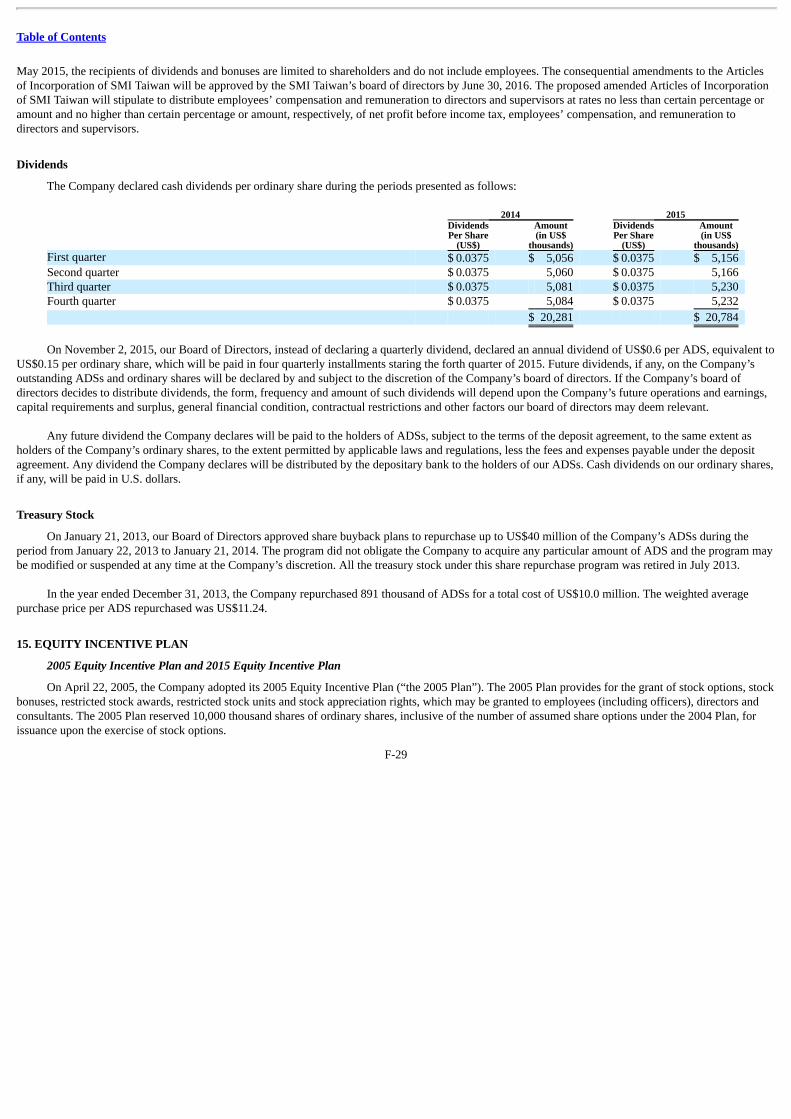
Table of Contents
May 2015, the recipients of dividends and bonuses are limited to shareholders and do not include employees. The consequential amendments to the Articlesof Incorporation of SMI Taiwan will be approved by the SMI Taiwan’s board of directors by June 30, 2016. The proposed amended Articles of Incorporationof SMI Taiwan will stipulate to distribute employees’ compensation and remuneration to directors and supervisors at rates no less than certain percentage oramount and no higher than certain percentage or amount, respectively, of net profit before income tax, employees’ compensation, and remuneration todirectors and supervisors.
Dividends
The Company declared cash dividends per ordinary share during the periods presented as follows:
2014 2015
DividendsPer Share
(US$)
Amount(in US$
thousands)
DividendsPer Share
(US$)
Amount(in US$
thousands) First quarter $ 0.0375 $ 5,056 $ 0.0375 $ 5,156 Second quarter $ 0.0375 5,060 $ 0.0375 5,166 Third quarter $ 0.0375 5,081 $ 0.0375 5,230 Fourth quarter $ 0.0375 5,084 $ 0.0375 5,232
$ 20,281 $ 20,784
On November 2, 2015, our Board of Directors, instead of declaring a quarterly dividend, declared an annual dividend of US$0.6 per ADS, equivalent toUS$0.15 per ordinary share, which will be paid in four quarterly installments staring the forth quarter of 2015. Future dividends, if any, on the Company’soutstanding ADSs and ordinary shares will be declared by and subject to the discretion of the Company’s board of directors. If the Company’s board ofdirectors decides to distribute dividends, the form, frequency and amount of such dividends will depend upon the Company’s future operations and earnings,capital requirements and surplus, general financial condition, contractual restrictions and other factors our board of directors may deem relevant.
Any future dividend the Company declares will be paid to the holders of ADSs, subject to the terms of the deposit agreement, to the same extent asholders of the Company’s ordinary shares, to the extent permitted by applicable laws and regulations, less the fees and expenses payable under the depositagreement. Any dividend the Company declares will be distributed by the depositary bank to the holders of our ADSs. Cash dividends on our ordinary shares,if any, will be paid in U.S. dollars.
Treasury Stock
On January 21, 2013, our Board of Directors approved share buyback plans to repurchase up to US$40 million of the Company’s ADSs during theperiod from January 22, 2013 to January 21, 2014. The program did not obligate the Company to acquire any particular amount of ADS and the program maybe modified or suspended at any time at the Company’s discretion. All the treasury stock under this share repurchase program was retired in July 2013.
In the year ended December 31, 2013, the Company repurchased 891 thousand of ADSs for a total cost of US$10.0 million. The weighted averagepurchase price per ADS repurchased was US$11.24.
15. EQUITY INCENTIVE PLAN
2005 Equity Incentive Plan and 2015 Equity Incentive Plan
On April 22, 2005, the Company adopted its 2005 Equity Incentive Plan (“the 2005 Plan”). The 2005 Plan provides for the grant of stock options, stockbonuses, restricted stock awards, restricted stock units and stock appreciation rights, which may be granted to employees (including officers), directors andconsultants. The 2005 Plan reserved 10,000 thousand shares of ordinary shares, inclusive of the number of assumed share options under the 2004 Plan, forissuance upon the exercise of stock options.
F-29
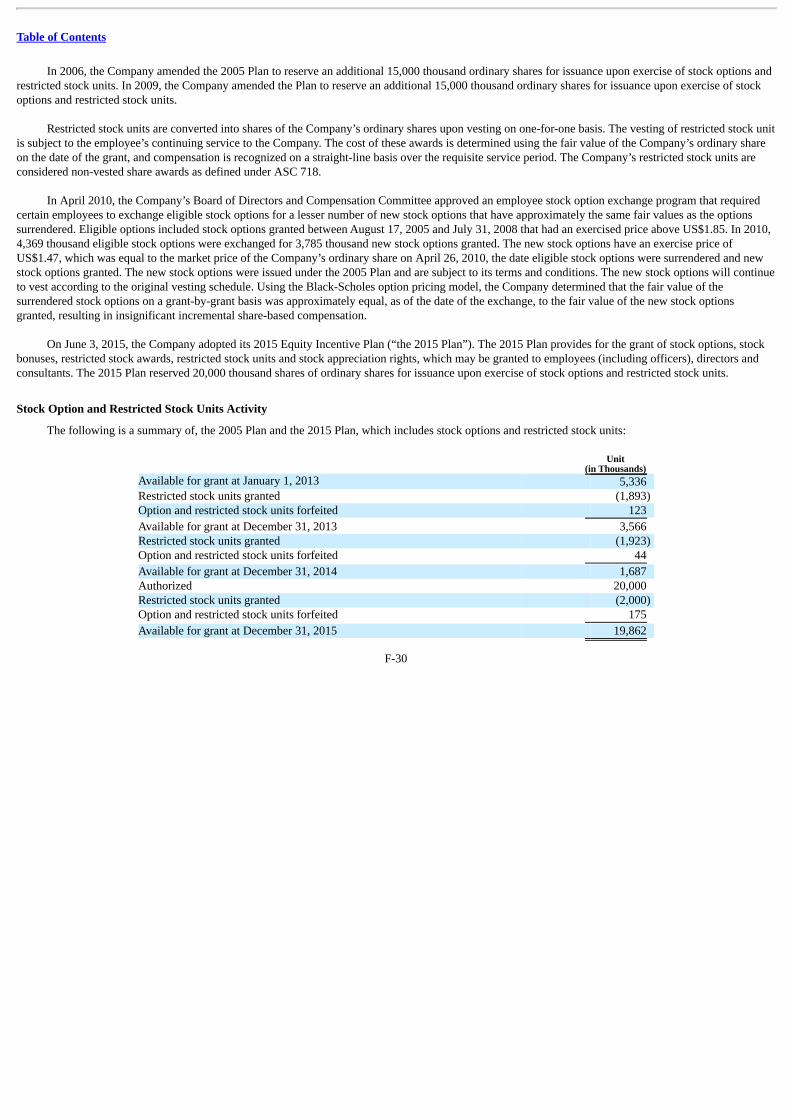
Table of Contents
In 2006, the Company amended the 2005 Plan to reserve an additional 15,000 thousand ordinary shares for issuance upon exercise of stock options andrestricted stock units. In 2009, the Company amended the Plan to reserve an additional 15,000 thousand ordinary shares for issuance upon exercise of stockoptions and restricted stock units.
Restricted stock units are converted into shares of the Company’s ordinary shares upon vesting on one-for-one basis. The vesting of restricted stock unitis subject to the employee’s continuing service to the Company. The cost of these awards is determined using the fair value of the Company’s ordinary shareon the date of the grant, and compensation is recognized on a straight-line basis over the requisite service period. The Company’s restricted stock units areconsidered non-vested share awards as defined under ASC 718.
In April 2010, the Company’s Board of Directors and Compensation Committee approved an employee stock option exchange program that requiredcertain employees to exchange eligible stock options for a lesser number of new stock options that have approximately the same fair values as the optionssurrendered. Eligible options included stock options granted between August 17, 2005 and July 31, 2008 that had an exercised price above US$1.85. In 2010,4,369 thousand eligible stock options were exchanged for 3,785 thousand new stock options granted. The new stock options have an exercise price ofUS$1.47, which was equal to the market price of the Company’s ordinary share on April 26, 2010, the date eligible stock options were surrendered and newstock options granted. The new stock options were issued under the 2005 Plan and are subject to its terms and conditions. The new stock options will continueto vest according to the original vesting schedule. Using the Black-Scholes option pricing model, the Company determined that the fair value of thesurrendered stock options on a grant-by-grant basis was approximately equal, as of the date of the exchange, to the fair value of the new stock optionsgranted, resulting in insignificant incremental share-based compensation.
On June 3, 2015, the Company adopted its 2015 Equity Incentive Plan (“the 2015 Plan”). The 2015 Plan provides for the grant of stock options, stockbonuses, restricted stock awards, restricted stock units and stock appreciation rights, which may be granted to employees (including officers), directors andconsultants. The 2015 Plan reserved 20,000 thousand shares of ordinary shares for issuance upon exercise of stock options and restricted stock units.
Stock Option and Restricted Stock Units Activity
The following is a summary of, the 2005 Plan and the 2015 Plan, which includes stock options and restricted stock units:
Unit
(in Thousands) Available for grant at January 1, 2013 5,336 Restricted stock units granted (1,893) Option and restricted stock units forfeited 123
Available for grant at December 31, 2013 3,566 Restricted stock units granted (1,923) Option and restricted stock units forfeited 44
Available for grant at December 31, 2014 1,687 Authorized 20,000 Restricted stock units granted (2,000) Option and restricted stock units forfeited 175
Available for grant at December 31, 2015 19,862
F-30
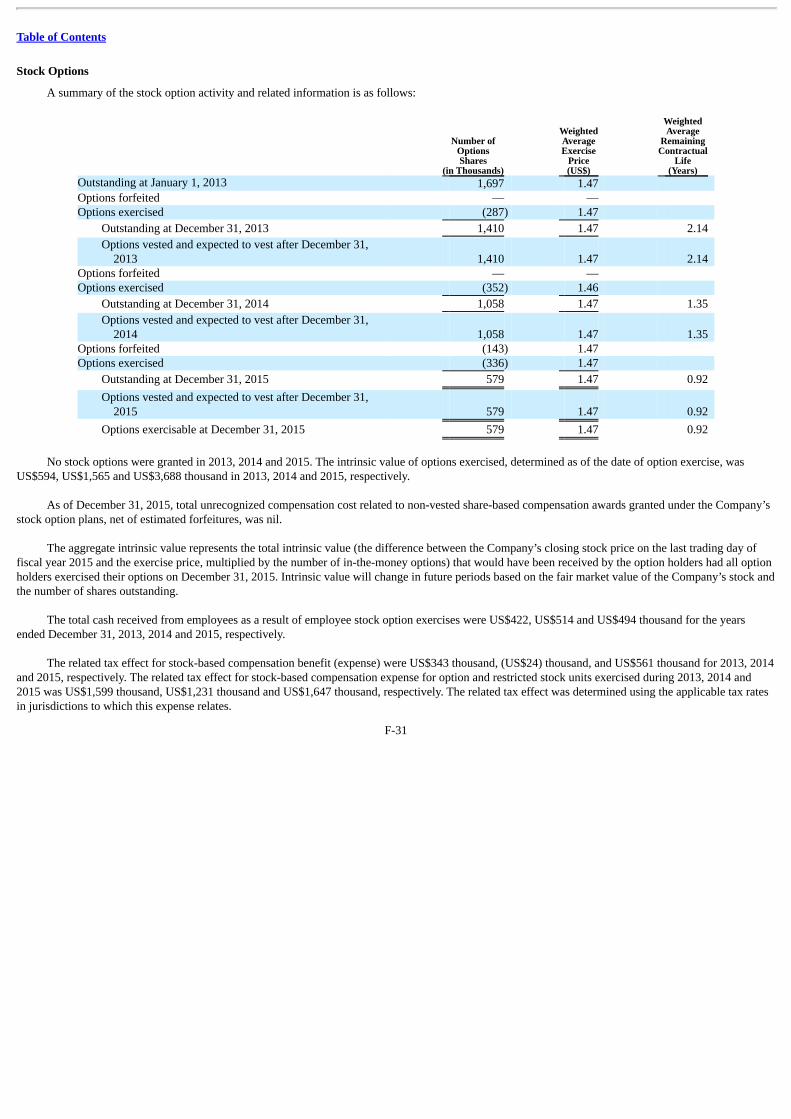
Table of Contents
Stock Options
A summary of the stock option activity and related information is as follows:
Number ofOptionsShares
(in Thousands)
WeightedAverageExercise
Price(US$)
WeightedAverage
RemainingContractual
Life(Years)
Outstanding at January 1, 2013 1,697 1.47 Options forfeited — — Options exercised (287) 1.47
Outstanding at December 31, 2013 1,410 1.47 2.14
Options vested and expected to vest after December 31,2013 1,410 1.47 2.14
Options forfeited — — Options exercised (352) 1.46
Outstanding at December 31, 2014 1,058 1.47 1.35
Options vested and expected to vest after December 31,2014 1,058 1.47 1.35
Options forfeited (143) 1.47 Options exercised (336) 1.47
Outstanding at December 31, 2015 579 1.47 0.92
Options vested and expected to vest after December 31,2015 579 1.47 0.92
Options exercisable at December 31, 2015 579 1.47 0.92
No stock options were granted in 2013, 2014 and 2015. The intrinsic value of options exercised, determined as of the date of option exercise, wasUS$594, US$1,565 and US$3,688 thousand in 2013, 2014 and 2015, respectively.
As of December 31, 2015, total unrecognized compensation cost related to non-vested share-based compensation awards granted under the Company’sstock option plans, net of estimated forfeitures, was nil.
The aggregate intrinsic value represents the total intrinsic value (the difference between the Company’s closing stock price on the last trading day offiscal year 2015 and the exercise price, multiplied by the number of in-the-money options) that would have been received by the option holders had all optionholders exercised their options on December 31, 2015. Intrinsic value will change in future periods based on the fair market value of the Company’s stock andthe number of shares outstanding.
The total cash received from employees as a result of employee stock option exercises were US$422, US$514 and US$494 thousand for the yearsended December 31, 2013, 2014 and 2015, respectively.
The related tax effect for stock-based compensation benefit (expense) were US$343 thousand, (US$24) thousand, and US$561 thousand for 2013, 2014and 2015, respectively. The related tax effect for stock-based compensation expense for option and restricted stock units exercised during 2013, 2014 and2015 was US$1,599 thousand, US$1,231 thousand and US$1,647 thousand, respectively. The related tax effect was determined using the applicable tax ratesin jurisdictions to which this expense relates.
F-31

Table of Contents
Determining Fair Value
The Company estimated the fair value of each option grant on the date of grant using the Black-Scholes option pricing model. The Black-Scholesoption valuation model was developed for estimating the fair value of traded options that have no vesting restrictions and are fully transferable. In addition,the option valuation model requires the input of highly subjective assumptions, including the expected stock price volatility.
Risk-free interest rate is based on the U.S. Treasury yield curve in effect at the time of grant. Expected volatilities are determined based on historicalvolatilities of the stock prices of the Company. Expected life represents the periods that the Company’s share-based awards are expected to be outstanding andwas determined based on historical experience regarding similar awards, giving consideration to the contractual term of the share based awards. The dividendyield is zero for the options granted prior to 2013 as the Company has never declared or paid dividends on the ordinary shares or other securities prior to2013.
Restricted Stock Units
A summary of the status of restricted stock units and changes is as follows:
Number ofNon-vestedStock Units
(in Thousands)
WeightedAverageGrantDateFair
Value(US$)
WeightAverage
RemainingRecognition
Period(Years)
Non-vested at January 1, 2013 7,018 2.68 Restricted stock units granted 1,893 3.13 Restricted stock units vested (4,867) 2.60 Restricted stock units forfeited (123) 2.60
Non-vested at December 31, 2013 3,921 2.90 0.43 Restricted stock units granted 1,923 5.13 Restricted stock units vested (3,640) 2.96 Restricted stock units forfeited (44) 4.92
Non-vested at December 31, 2014 2,160 4.90 0.31 Restricted stock units granted 2,000 6.83 Restricted stock units vested (2,003) 4.96 Restricted stock units forfeited (32) 5.85
Non-vested at December 31, 2015 2,125 6.65 0.73
As of December 31, 2015, there was US$5,112 thousand of total unrecognized compensation cost related to restricted stock units granted under the2005 Plan and the 2015 Plan.
Stock-based Compensation Expense
The following table shows total stock-based compensation expense included in the Consolidated Statements of Income for the years endedDecember 31, 2013, 2014 and 2015.
Year Ended December 31 2013 2014 2015 US$ US$ US$ Cost of sales 308 282 261 Research and development 6,351 6,773 6,565 Sales and marketing 2,197 1,746 1,790 General and administrative 1,406 1,546 1,802
10,262 10,347 10,418
F-32
Table of Contents
16. COMMITMENTS AND CONTINGENCIES
FCI provided their employees with collateral for personal loans which is deposited at a designated bank and the amount deposited was US$455thousand and US$425 thousand at December 31, 2014 and 2015, respectively. Such amounts were accounted for as restricted cash.
Operating Leases
The Company entered into various operating lease agreements for office space that expire on various dates through April 2019. The Companyrecognized rent expense for the years ended December 31, 2013, 2014 and 2015 of US$1,763 thousand, US$1,981 thousand and US$2,453 thousand,respectively. The minimum operating lease payments expected under these leases as of December 31, 2015 were US$1,771 thousand, US$786 thousand,US$580 thousand, US$184 thousand, and nil for the years ending December 31, 2016, 2017, 2018, 2019 and 2020, respectively.
Litigation
The Company is subject to legal proceedings and claims, either asserted or unasserted, which arise in the ordinary course of business. Although theoutcome of such proceedings and claims cannot be predicted with certainty, management does not believe that the outcome of any of these matters will have amaterial adverse effect on our business, results of operations, financial position or cash flows. Any litigation, however, involves potential risk and potentiallysignificant litigation costs, and therefore there can be no assurance that any litigation which is now pending or which may arise in the future would not havesuch a material adverse effect on our business, financial position, results of operations or cash flows.
All American Semiconductor, Inc. (“All American” or “AASI”) was a former distributor for the Company. On April 25, 2007, All American filed forChapter 11 bankruptcy protection. At the time of the filing, the Company had US$256 thousand of unpaid accounts receivable from All American. OnApril 17, 2009, SMI USA and related entities were named as defendants in an adversary proceeding filed by the AASI Creditor Liquidating Trust (“CLT”) inthe bankruptcy case pending in the U.S. Bankruptcy Court for the Southern District of Florida. The CLT was seeking the return of allegedly avoidabletransfers in the amount of US$854 thousand. The Company filed answer and affirmative defenses. In March 2010, SMI USA settled with the CLT by payingthe amount of US$220 thousand and on April 1, 2010, the Bankruptcy Court granted the motion to approve stipulations to compromise controversy. OnAugust 23, 2010, the Court entered an order dismissing the adversary proceeding. In June 2011, Liquidating Trustee for the CLT filed the AASI CreditorLiquidating Trustee’s Seventeenth Omnibus Objection to Claims but in August 2011, withdrew it with respect to SMI USA’s proof of claim. According to theCLT’s letter dated September 9, 2011, it was finalizing its claims review process and preparing for distribution to beneficiaries who are holders of allowedclaims and have rights to a distribution pursuant to the bankruptcy plan. In January 2012, January 2014, December 2014, July 2015 and October 2015, theCompany received distributions of US$21 thousand, US$36 thousand, US$12 thousand, US$51 thousand and US$31 thousand, respectively. On March 29,2016, we received a final distribution of US$112 thousand.
In 2006, FCI joined with other technology companies and invested in the Pangyo Silicon Park Construction Project Cooperative (“PangyoCooperative”) in Korea. In July 2010, FCI, TLi Inc. (“TLI”), OCI Materials Co., Ltd (“OCI”) and other companies withdrew from the Pangyo Cooperativeand forfeited 10% of their total investment. FCI believes its loss was caused by bad will actions taken by TLI. In December 2011, FCI and OCI together fileda complaint against TLI at the Suwon District Court in Korea. In April 2013, the court dismissed the plaintiffs’ complaints. The plaintiffs have decided not toappeal the court’s decision.
F-33
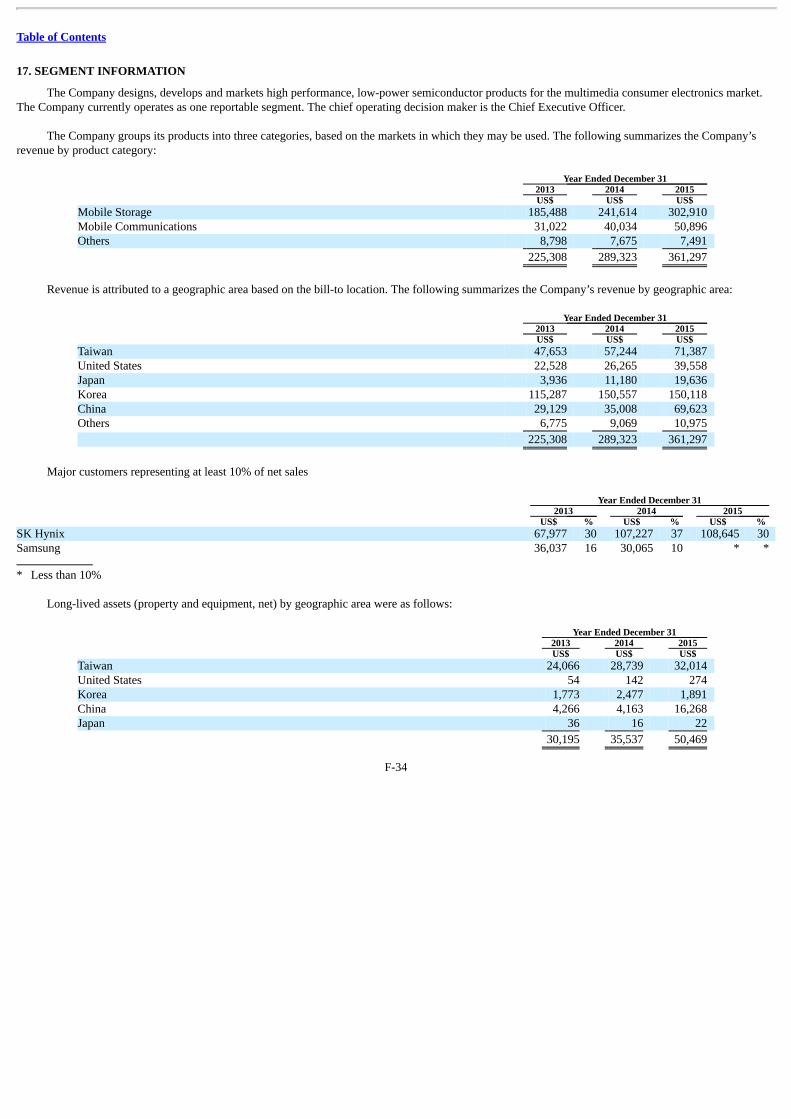
Table of Contents
17. SEGMENT INFORMATION
The Company designs, develops and markets high performance, low-power semiconductor products for the multimedia consumer electronics market.The Company currently operates as one reportable segment. The chief operating decision maker is the Chief Executive Officer.
The Company groups its products into three categories, based on the markets in which they may be used. The following summarizes the Company’srevenue by product category:
Year Ended December 31 2013 2014 2015 US$ US$ US$ Mobile Storage 185,488 241,614 302,910 Mobile Communications 31,022 40,034 50,896 Others 8,798 7,675 7,491
225,308 289,323 361,297
Revenue is attributed to a geographic area based on the bill-to location. The following summarizes the Company’s revenue by geographic area:
Year Ended December 31 2013 2014 2015 US$ US$ US$ Taiwan 47,653 57,244 71,387 United States 22,528 26,265 39,558 Japan 3,936 11,180 19,636 Korea 115,287 150,557 150,118 China 29,129 35,008 69,623 Others 6,775 9,069 10,975
225,308 289,323 361,297
Major customers representing at least 10% of net sales Year Ended December 31 2013 2014 2015 US$ % US$ % US$ % SK Hynix 67,977 30 107,227 37 108,645 30 Samsung 36,037 16 30,065 10 * * * Less than 10%
Long-lived assets (property and equipment, net) by geographic area were as follows:
Year Ended December 31 2013 2014 2015 US$ US$ US$ Taiwan 24,066 28,739 32,014 United States 54 142 274 Korea 1,773 2,477 1,891 China 4,266 4,163 16,268 Japan 36 16 22
30,195 35,537 50,469
F-34
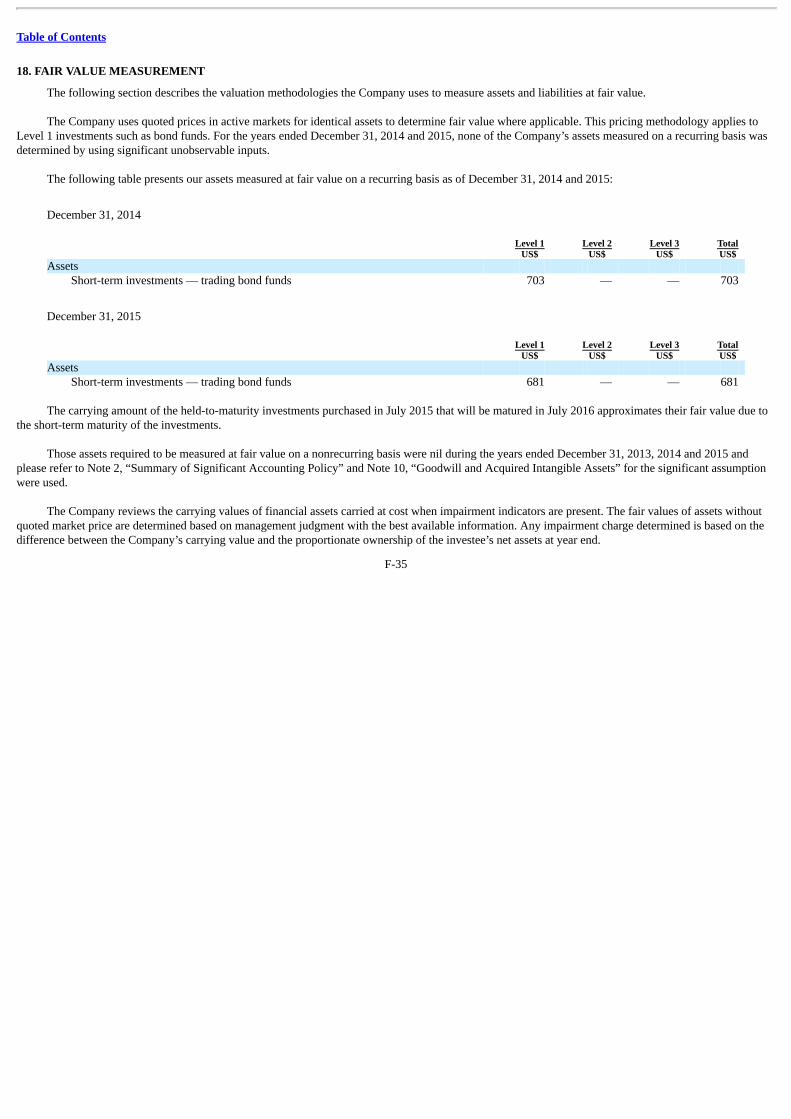
Table of Contents
18. FAIR VALUE MEASUREMENT
The following section describes the valuation methodologies the Company uses to measure assets and liabilities at fair value.
The Company uses quoted prices in active markets for identical assets to determine fair value where applicable. This pricing methodology applies toLevel 1 investments such as bond funds. For the years ended December 31, 2014 and 2015, none of the Company’s assets measured on a recurring basis wasdetermined by using significant unobservable inputs.
The following table presents our assets measured at fair value on a recurring basis as of December 31, 2014 and 2015:
December 31, 2014
Level 1 Level 2 Level 3 Total US$ US$ US$ US$ Assets
Short-term investments — trading bond funds 703 — — 703
December 31, 2015
Level 1 Level 2 Level 3 Total US$ US$ US$ US$ Assets
Short-term investments — trading bond funds 681 — — 681
The carrying amount of the held-to-maturity investments purchased in July 2015 that will be matured in July 2016 approximates their fair value due tothe short-term maturity of the investments.
Those assets required to be measured at fair value on a nonrecurring basis were nil during the years ended December 31, 2013, 2014 and 2015 andplease refer to Note 2, “Summary of Significant Accounting Policy” and Note 10, “Goodwill and Acquired Intangible Assets” for the significant assumptionwere used.
The Company reviews the carrying values of financial assets carried at cost when impairment indicators are present. The fair values of assets withoutquoted market price are determined based on management judgment with the best available information. Any impairment charge determined is based on thedifference between the Company’s carrying value and the proportionate ownership of the investee’s net assets at year end.
F-35

Exhibit 8.1
Subsidiaries of Silicon Motion Technology Corporation
Name of Entity Jurisdiction of IncorporationFCI Inc. Korea
Silicon Motion BV The Netherlands
Silicon Motion K.K. Japan
Silicon Motion Korea Ltd. Korea
Silicon Motion Technology (HK) Ltd. Hong Kong
Silicon Motion, Inc. California
Silicon Motion, Inc. Taiwan
Silicon Motion, Inc. (Beijing) China
Silicon Motion, Inc. (Shanghai) China
Silicon Motion, Inc. (Shenzhen) China
Shannon Systems China

Exhibit 12.1
Certification by the Chief Executive Officer Pursuant toSection 302 of the Sarbanes-Oxley Act of 2002
I, Wallace C. Kou, certify that:
1. I have reviewed this annual report on Form 20-F of Silicon Motion Technology Corporation;
2. Based on my knowledge, this report does not contain any untrue statement of a material fact or omit to state a material fact necessary to make thestatements made, in light of the circumstances under which such statements were made, not misleading with respect to the period covered by this report;
3. Based on my knowledge, the financial statements, and other financial information included in this report, fairly present in all material respects thefinancial condition, results of operations and cash flows of the company as of, and for, the periods presented in this report;
4. The company’s other certifying officer(s) and I are responsible for establishing and maintaining disclosure controls and procedures (as defined inExchange Act Rules 13a-15(e) and 15d-15(e)) and internal control over financial reporting (as defined in Exchange Act Rules 13a-15(f) and 15d-15(f)) forthe company and have:
(a) Designed such disclosure controls and procedures, or caused such disclosure controls and procedures to be designed under our supervision, toensure that material information relating to the company, including its consolidated subsidiaries, is made known to us by others within those entities,particularly during the period in which this report is being prepared;
(b) Designed such internal control over financial reporting, or caused such internal control over financial reporting to be designed under oursupervision, to provide reasonable assurance regarding the reliability of financial reporting and the preparation of financial statements for externalpurposes in accordance with generally accepted accounting principles;
(c) Evaluated the effectiveness of the company’s disclosure controls and procedures and presented in this report our conclusions about theeffectiveness of the disclosure controls and procedures, as of the end of the period covered by this report based on such evaluation; and
(d) Disclosed in this report any change in the company’s internal control over financial reporting that occurred during the period covered by theannual report that has materially affected, or is reasonably likely to materially affect, the company’s internal control over financial reporting; and
5. The company’s other certifying officer(s) and I have disclosed, based on our most recent evaluation of internal control over financial reporting, to thecompany’s auditors and the audit committee of company’s board of directors (or persons performing the equivalent functions):
(a) All significant deficiencies and material weaknesses in the design or operation of internal control over financial reporting which arereasonably likely to adversely affect the company’s ability to record, process, summarize and report financial information; and
(b) Any fraud, whether or not material, that involves management or other employees who have a significant role in the company’s internalcontrol over financial reporting.
Date: April 29, 2016
/s/ Wallace C. KouName: Wallace C. KouTitle: Chief Executive Officer
Exhibit 12.2
Certification by the Chief Financial Officer Pursuant toSection 302 of the Sarbanes-Oxley Act of 2002
I, Riyadh Lai, certify that:
1. I have reviewed this annual report on Form 20-F of Silicon Motion Technology Corporation;
2. Based on my knowledge, this report does not contain any untrue statement of a material fact or omit to state a material fact necessary to make thestatements made, in light of the circumstances under which such statements were made, not misleading with respect to the period covered by this report;
3. Based on my knowledge, the financial statements, and other financial information included in this report, fairly present in all material respects thefinancial condition, results of operations and cash flows of the company as of, and for, the periods presented in this report;
4. The company’s other certifying officer(s) and I are responsible for establishing and maintaining disclosure controls and procedures (as defined inExchange Act Rules 13a-15(e) and 15d-15(e)) and internal control over financial reporting (as defined in Exchange Act Rules 13a-15(f) and 15d-15(f)) forthe company and have:
(a) Designed such disclosure controls and procedures, or caused such disclosure controls and procedures to be designed under our supervision, toensure that material information relating to the company, including its consolidated subsidiaries, is made known to us by others within those entities,particularly during the period in which this report is being prepared;
(b) Designed such internal control over financial reporting, or caused such internal control over financial reporting to be designed under oursupervision, to provide reasonable assurance regarding the reliability of financial reporting and the preparation of financial statements for externalpurposes in accordance with generally accepted accounting principles;
(c) Evaluated the effectiveness of the company’s disclosure controls and procedures and presented in this report our conclusions about theeffectiveness of the disclosure controls and procedures, as of the end of the period covered by this report based on such evaluation; and
(d) Disclosed in this report any change in the company’s internal control over financial reporting that occurred during the period covered by theannual report that has materially affected, or is reasonably likely to materially affect, the company’s internal control over financial reporting; and
5. The company’s other certifying officer(s) and I have disclosed, based on our most recent evaluation of internal control over financial reporting, to thecompany’s auditors and the audit committee of company’s board of directors (or persons performing the equivalent functions):
(a) All significant deficiencies and material weaknesses in the design or operation of internal control over financial reporting which arereasonably likely to adversely affect the company’s ability to record, process, summarize and report financial information; and
(b) Any fraud, whether or not material, that involves management or other employees who have a significant role in the company’s internalcontrol over financial reporting.
Date: April 29, 2016
/s/ Riyadh LaiName: Riyadh LaiTitle: Chief Financial Officer
Exhibit 13.1
CERTIFICATION PURSUANT TO18 U.S.C. SECTION 1350,
AS ADOPTED PURSUANT TOSECTION 906 OF THE SARBANES-OXLEY ACT OF 2002
Pursuant to 18 U.S.C. Section 1350, as adopted pursuant to Section 906 of the Sarbanes-Oxley Act of 2002, the undersigned each hereby certifies that,to his knowledge, the annual report on Form 20-F of Silicon Motion Technology Corporation for the year ended December 31, 2015 fully complies with therequirements of Section 13(a) or 15(d), as applicable, of the Securities Exchange Act of 1934, and that the information contained in the periodic report fairlypresents, in all material respects, the financial condition and results of operations of Silicon Motion Technology Corporation.
The foregoing certification is being furnished pursuant to 18 U.S.C. Section 1350 solely for purposes of complying with the provisions of Section 906of the Sarbanes-Oxley Act of 2002, is not intended to be used or relied upon for any other purpose and is not being filed as part of the periodic report or as aseparate disclosure document.
Date: April 29, 2016
/s/ Wallace C. KouName: Wallace C. KouTitle: Chief Executive Officer
/s/ Riyadh LaiName: Riyadh LaiTitle: Chief Financial Officer

Exhibit 23.1
CONSENT OF INDEPENDENT REGISTERED PUBLIC ACCOUNTING FIRM
We consent to the incorporation by reference in Registration Statement Nos. 333-161599, 333-142422, 333-131219 and 333-204876 on Forms S-8 of ourreports dated April 29, 2016, relating to the consolidated financial statements of Silicon Motion Technology Corporation and subsidiaries (the “Company”)(which report expresses an unqualified opinion) and the effectiveness of the Company’s internal control over financial reporting, appearing in the AnnualReport on Form 20-F of the Company for the year ended December 31, 2015.
/s/ Deloitte & ToucheTaipei, TaiwanThe Republic of China
April 29, 2016


