Embed Size (px)
Citation preview
Single cell analysis reveals altered tumormicroenvironments of relapse- and remission-associated pediatric acute myeloid leukemiaGulay Ulukaya
A�ac Cancer and Blood Disorders Center, Children’s Healthcare of Atlanta, Atlanta, GABeena Thomas
Emory UniversitySwati Bhasin
Emory UniversityHope Mumme
Emory University https://orcid.org/0000-0002-4171-1736Bhakti Dwivedi
Emory UniversityPruthvi Perumalla
Emory UniversityDebasree Sarkar
Emory UniversityHimalee Sabnis
Emory UniversitySunita Park
Children’s Healthcare of AtlantaDeborah DeRyckere
Emory University SOMSunil RaiKar
Enory UniversityMelinda Pauly
Children’s Healthcare of AtlantaRyan Summers
Children's Healthcare of Atlanta https://orcid.org/0000-0002-3621-8664Sharon Castellino
Emory UniversityDaniel Wechsler
Emory UniversityChristopher Porter

Department of Pediatrics, Emory School of MedicineDouglas Graham
Emory UniversityManoj Bhasin ( [email protected] )
Emory University
Article
Keywords: pediatric acute myeloid leukemia, relapse, remission, tumor microenvironments
Posted Date: September 3rd, 2021
DOI: https://doi.org/10.21203/rs.3.rs-819846/v2
License: This work is licensed under a Creative Commons Attribution 4.0 International License. Read Full License
Single cell analysis reveals altered tumor microenvironments of relapse- and remission-
associated pediatric acute myeloid leukemia
Gulay B. Ulukaya1,2*, Beena E. Thomas1,2*, Swati S. Bhasin1,2,3, Hope Mumme1,2, Bhakti
Dwivedi4, Pruthvi Perumalla3, Debasree Sarkar1,3, Himalee S. Sabnis1,2, Sunita I. Park5,
Deborah DeRyckere1,2, Sunil Raikar1,2, Melinda Pauly1,2, Ryan J. Summers1,2, Sharon M.
Castellino1,2, Daniel S. Wechsler1,2, Christopher C. Porter1,2, Douglas K. Graham1,2, Manoj
Bhasin#1,2,3,4,6
1. Aflac Cancer and Blood Disorders Center, Children’s Healthcare of Atlanta, Atlanta, GA
2. Department of Pediatrics, Emory University, Atlanta, GA
3. Department of Biomedical Informatics, Emory University, Atlanta, GA
4. Winship Cancer Institute, Emory University, Atlanta, GA
5. Children’s Healthcare of Atlanta, Atlanta, GA
6. Department of Biomedical Engineering, Georgia Institute of Technology, Atlanta, GA
* Equal Contribution
#Corresponding author:
Manoj K. Bhasin, MS, PhD.
Aflac Cancer and Blood Disorders Center
Children Healthcare of Atlanta
Woodruff Memorial Research Building, Room 4107
101 Woodruff Circle, 4th Floor East
Emory School of Medicine
Atlanta, GA 30322.
Emails: [email protected]
Telephone: (404) 712-9849
One Sentence Summary: Distinctive single cell profiles of heterogenous blast and immune cells
associated with continuous complete remission and relapse in pediatric AML patients

Abstract:
Relapse- and continuous complete remission (CCR)-associated pediatric acute myeloid leukemia
(AML) patient bone marrows collected at the time of diagnosis (Dx), end of induction (EOI) and
relapse were analyzed by single cell RNA sequencing. A novel AML blasts-associated 7-genes
signature (CLEC11A, PRAME, AZU1, NREP, ARMH1, C1QBP, TRH) displayed a strong
correlation with blast percentages and overall survival in the TARGET AML dataset (HR=2.3; P-
value=.007). Distinct clusters of AML-blasts at Dx were observed for relapse- and CCR-
associated samples with differential expression of genes associated with survival. Relapse-
associated samples demonstrated enrichment of exhausted T cells and M2 macrophages as
opposed to inflammatory M1 macrophages in CCR-associated samples at Dx. EOI treatment
resistant blast cells overexpressed fatty acid oxidation, tumor growth and stemness genes. Also,
a relapse-associated EOI samples T cells subset showed downregulation of MHC Class I and
regulatory genes. Altogether, this study deeply characterizes pediatric AML relapse-/CCR-
associated tumor microenvironment transcriptome landscape.

Introduction
Acute myeloid leukemia (AML) accounts for about 20% of childhood leukemia(1). Improvements
in outcomes for children with AML, attributed to intensification of frontline therapy, hematopoietic
stem cell transplant (HSCT), and better supportive care, have not kept pace with those for children
with acute lymphoblastic leukemia (ALL). The prognosis and treatment of pediatric AML remain
challenging because of disease heterogeneity, high relapse rates, and therapy associated toxicity
(2). It is important to identify novel risk stratification strategies that can be used to guide better
therapy and improve outcomes for pediatric AML patients.
AML relapse can result from minimal residual disease (MRD) not detected/recognized by current
diagnostic techniques including bulk gene expression analysis and imaging. The Therapeutically
Applicable Research to Generate Effective Treatments (TARGET) AML initiative and large-scale
genetic profiling studies have revealed that AML is a molecularly diverse disease having various
gene mutations, insertions, and fusions associated with poor prognosis(3). Molecular
characterization of the tumor microenvironment (TME) along with identification of
biomarkers/targets that distinguish AML blasts cells (AML blasts) from non-malignant cells (non-
AML cells) are critical for defining relapse-associated cell clusters and/or changes in the
transcriptional landscape. The cellular composition of the TME and the transcriptional states
thereof may contribute to and be affected by the leukemic process at the time of diagnosis (Dx)
and the presence of residual blast cells at the end of induction (EOI) chemotherapy. Therefore,
comparative analysis between Dx and EOI samples as well as a separate analysis of Dx and EOI
samples is critical for characterizing the role of TME determinants in AML relapse/continuous
complete remission (CCR).
We evaluated TME using single cell RNA sequencing (scRNA-seq) to identify relapse- and CCR-
associated cells, gene alterations, and pathways at Dx, EOI, and relapse (Rel). Integrated scRNA-
Seq analysis of paired Dx and EOI samples identified a 7-gene signature that distinguished AML
blasts from non-transformed cells. Dx associated AML blasts demonstrated specific
transcriptomic differences associated with relapse or CCR. Furthermore, distinct baseline
characteristics of innate and adaptive immune cells at the time of diagnosis were associated with
either CCR (monocyte/macrophage enrichment) or relapse (exhausted T cell enrichment). This
study identified cell types associated with AML relapse/CCR and incidental novel genes and
pathways, thus opens up avenues for the development of novel diagnostic and therapeutic targets
in pediatric AML.
Results
Clinical samples and study design
Frozen samples obtained from the Children’s Healthcare of Atlanta Pediatric Biorepository were
viably thawed and processed using 10X genomics platform for single cell profiling. The cohort of
samples was made up of genetically and morphologically diverse cases of AML (Table S1A). A
total of 23 bone marrow (BM) samples were processed from 15 patients (nine with CCR and six
with relapse). Of the 23 BM samples, 14 were collected at Dx, five were collected at EOI, and four
were collected at relapse (Figure S1, Table S1B).
Single cell analysis identified heterogeneous patient specific AML blasts
ScRNA-seq analysis of four paired Dx and EOI samples (three from patients with relapse and one
from a patient with CCR) was carried out. After preprocessing, alignment, and quality control steps
including removal of low-quality reads and cells, the remaining 19,350 cells were analyzed using
unsupervised and supervised approaches. The unsupervised analysis on preprocessed and
normalized scRNA-seq data using Uniform Manifold Approximation and Projection (UMAP)
approach (4) identified 14 single cell clusters (Fig. 1A). Ten of these clusters were manually
annotated based on the expression of well-established gene markers as differentiated immune
and stromal cells (Fig. 1B). The remaining clusters enriched with undifferentiated cells were
putatively considered as blast cell clusters and annotated based on top cluster specific
overexpressed genes (Fig. 1B, Figure S2). The differentiated immune cells included T cells
(CD3D+, IL32+), B cells (CD19+, CD79A+, MS4A1+), monocytes (CD14+; mono), macrophages
(CD68+; macro), monocytes/macrophages (CD14+, CD68+; Mono/mac), plasmacytoid dendritic
cells (GZMB+, IL3RA+, IRF8+; pDC), and neutrophils (CD63+) (Fig. 1B). The four undifferentiated
blast cells exhibited overexpression of canonical blasts associated marker genes (MPO+, CD33+,
CD34+) and/or multiple lineage genes (CD3+, CD19+, ELANE+, etc.) (Fig. 1B, Figure S2). Three
of the four blast cell clusters, i.e., MPO+, AZU+, and CD38+ blasts, were sample specific as they
were enriched with cells from individual patients (Fig. 1C) indicating significant heterogeneity
among the blast cells. Additionally, the split UMAP analysis showed that these three canonical
blast cell clusters were over-represented in the Dx samples compared to EOI samples (Fig. 1D).
Also, these three Dx enriched blast cell clusters depicted high expression of well-established AML
blast cells associated genes, namely, MPO and CD34 (Fig. 1E). In summary, scRNA-Seq data
distinguished heterogeneous AML blast cells as well as immune cells in the Dx TME samples.
Identification of AML blasts progenitor signature
The supervised comparison of Dx enriched AML blast cell clusters and EOI enriched non-blast
cell clusters (Fig 1D), based on the Wilcoxon rank test, identified a set of 232 significantly
differentially expressed genes (DEGs) (adjusted P-value<0.01 and log FC > 1.2). To further refine
the gene list, we performed external validation analysis using the TARGET AML bulk
transcriptome data (3) that contains Dx BM samples with different proportions of blast cells and
EOI BM samples. The TARGET AML Dx samples were partitioned into 3 bins based on the extent
of disease burden (>60%, 30-60%, <30% blast cells) to determine the expression patterns of the
identified 232 blast-related genes. 44 genes were significantly overexpressed in high blasts
samples (>60%) compared to EOI samples as well as high blasts samples compared to low blast
(<30%) samples (FC >1.75 and P-value <0.05) (Figure S3, Table S2). We further evaluated the
expression patterns of these 44 genes in the blast cell clusters in scRNA-Seq data (Fig 1F, Table
S3). Of the 44 genes, 20 genes depicted pattern of specific overexpression in the blast cell

clusters suggesting the existence of a common progenitor AML blast cell signature cross
heterogeneous blast cells (Table S4). A heatmap depicting the expression pattern for these 20
blast specific genes in TARGET AML data is shown in Fig. 2A. The blast cells overexpressed
genes include genes related to anti-apoptosis (PRAME, MSLN, CITED4), growth factor for
progenitor hematopoietic cells (CLEC11A), cell proliferation (CAPRIN1), and PPARα-induced
proliferation and tumor growth (FABP5) (Fig. 2A). Feature-plot of two of the identified blast
associated genes (NREP and CLEC11) depict uniform expression in the heterogenous blast
clusters (Fig. 2B) that is equivalent to or better than some of the genes used clinically for
identifying AML blasts (CD34, MPO, CD33, and CD56/NCAM1) (Fig. 1E, Figure S4). The blast
associated genes expression exhibited correlation with the blasts percentages in the AML BM
samples (Fig. 2C). Also, majority of the blast associated genes exhibited significant association
with overall survival (OS) in the TARGET AML data set (Table S5, Fig. 2D) indicating their
possible involvement in AML progression.
To verify blast cells characterization using our 20-gene signature, we also looked at blast cell
clusters in longitudinal samples (Dx, EOI, Rel) from two patients with negative MRD at EOI. The
analysis revealed significantly fewer blast cells in the EOI samples as compared to Dx and Rel
samples; the split UMAP (Fig. 2E) and bar plot (Fig. 2F) shows the two immature blast cell
clusters (MPO+ and AZU1+) that predominate in Dx and Rel samples are minimally represented
in EOI samples. To generate a more concise AML blast specific signature and evaluate
performance in discriminating AML blast cells from other cells, we implemented supervised
machine learning approach, support vector machine (SVM), and calculated its performance using
cross-validation. SVM is a powerful supervised machine learning technique for identifying
multigene biomarker panels from complex datasets (5, 6). The analysis identified a set of 7 genes
(CLEC11A, PRAME, AZU1, NREP, ARMH1, C1QBP, TRH) that discriminated AML associated
blast cells from non-AML cells with an AUC of 0.968 (Fig. 2G, Table S6). Several of these genes,
including CLEC11A (7), PRAME (8), and AZU1 (9) have been previously associated with AML.
The analysis also identified a unique gene, ARMH1/C1orf228, that codes for a yet
uncharacterized protein and has not been previously reported to be associated with pediatric or
adult AML. NREP is also known to affect cell development (10), while PRAME may alter metabolic
and immune pathways (11). This unique set of genes overexpressed in AML blasts are therefore
associated with a myriad of cell functions that promote tumor growth and spread. The module
score based on 7-gene signatures effectively distinguished AML blast cells from non-AML cells
as only MPO+ and AZU+ blasts clusters had positive module scores (Figure S5). The clinical
significance of this 7-gene signature was tested by evaluating correlation with survival in the
TARGET AML data. Patients having high expression of the selected 7 genes had a significant
correlation with poor survival (HR=2.3 and Log Rank P-value=.007) compared to patients with
low expression of these genes (Fig. 2H, Table S7A).
Comparative analysis of Dx relapse- and CCR-associated samples
We performed a comparative analysis of 14 bone marrow samples collected at Dx, of which 6
later relapsed (1D - 6D) and 8 remained in CCR (7D - 14D) (Figure S1, Table S1). After quality
control, processing, and normalization, 28,181 cells clustered into 15 distinct clusters (Figure
S6A). Based on the 7-gene blast signature module score, 14,166 cells were classified as AML
blast cells and the remaining 14,015 cells were classified as non-AML cell clusters (Figure S6B).
The UMAP projection depicted that CCR-associated clusters 1,3,4,6,8,10,14 and relapse-
associated clusters 0,2,5,7,9,11,12,13 clustered separately, suggesting differential transcriptome
makeup of the 2 sets of blast cells (Fig. 3A). Also, we observed patient specific clusters indicative
of inter-patient variation in the blast cells profiles (Fig. 3B). Differential expression analysis of
select relapse-associated samples enriched clusters (0,2,7,13) and CCR-associated samples
enriched clusters (1,3,4) revealed significant transcriptome differences (Fig. 3C). The CCR-
associated clusters exhibited high expression of genes including MPO, IFITM3, TRH, PRTN3,
HLA-DPM1, and NPM1 while relapse-associated clusters expressed high levels of genes
including CRIP1, FLNA, and RFLNB/FAM101B (Fig. 3C). Survival analysis using the
SurvivalGeneie tool TARGET AML dataset indicated that genes like FLNA (cytoskeleton
component, signaling scaffold and Pol1 transcription regulator) and RFLNB/FAM101B (formation
of cartilaginous skeletal elements) overexpressed in relapse-associated cell clusters were
significantly associated with poor OS (Fig. 3D, supplementary table 5C). On the other hand,
genes overexpressed in the CCR-associated clusters such as MPO (microbicidal activity of
neutrophils) and TRH (controls the secretion of thyroid-stimulating hormone) were significantly
associated with better OS (Log Rank P value=0.001, 0.000396 for MPO, TRH respectively, Table
S7B, Fig. 3D). Additionally, higher expression of RFLNB/FAM101B genes showed a significant
correlation with shorter EFS while lower expression was associated with intermediate EFS (Figure
S7A). The interactive string network analysis based on known and predicted protein-protein
interactions (13) identified FLNA as a key interactant of RFLNB/FAM101B. Another identified
interactant of RFLNB/FAM101B was WDFY4, which plays a critical role in the regulation of
classical dendritic cells (cDC1) mediated cross-presentation of viral and tumor antigens (14)
(Figure S7B). The Kaplan-Meier plots showed a significant correlation of high expression of
combined RFLNB/FAM101B and WDFY4 genes with poor OS (Log Rank P-value=0.017) and
shorter EFS (Log Rank P-value=0.00094) (Figure S7C, D; Table S7A). Furthermore, pathways
analysis on relapse-associated blast cells differentially expressed genes depicted significant
activation (P-value <0.01) of multiple pathways including “RhoGDI signaling”, “eNOS signaling”,
“Androgen Signaling”, and “Protein Kinase A signaling” (Fig. 3E). These relapse-associated blast
cells also depicted significant inhibition of pathways related to JAK/STAT signaling, HIF1-α,
Interferon, and neuroinflammation signaling (Fig. 3E). Further upstream regulator-based systems
biology analysis identified activation of a highly connected cohesive network of cell growth and
proliferation related master regulators (e.g., MTA1, NKX2.3, TCF3) in relapse-associated blasts
(Fig. 3F). The analysis also depicted significant inhibition of multiple immune and metabolism
related key molecules including HIF1A, IRF7, STAT1 (Figure S7E) in relapse-associated samples
enriched AML blast cells.
Dx relapse-associated non-AML clusters depicted enrichment of exhausted T cells and
diminution of M1 macrophages
Next, we performed focused analysis on the TME non-AML cells in the 14 Dx samples
(Fig. 4A). Clusters were annotated based on the expression of specific gene markers (Fig. 4B).
CCR-associated clusters had a higher representation of monocyte/macrophages (CD14+, CD16+)
while relapse-associated clusters depicted a higher proportion of T cells (CD3+) (Fig. 4C). These
results suggest differences in the type of immune cells populating the TME at the time of Dx in
those who go on to achieve CCR as compared to those who eventually suffered relapse.
To understand if a particular subtype of T cells is associated with AML relapse/CCR, we
sub-clustered Dx T cells (cluster 0, Fig. 4A) using Monocle package (15) which revealed 11
distinct subclusters of T cells (Fig. 5A). Most of the patients showed separate subclusters for
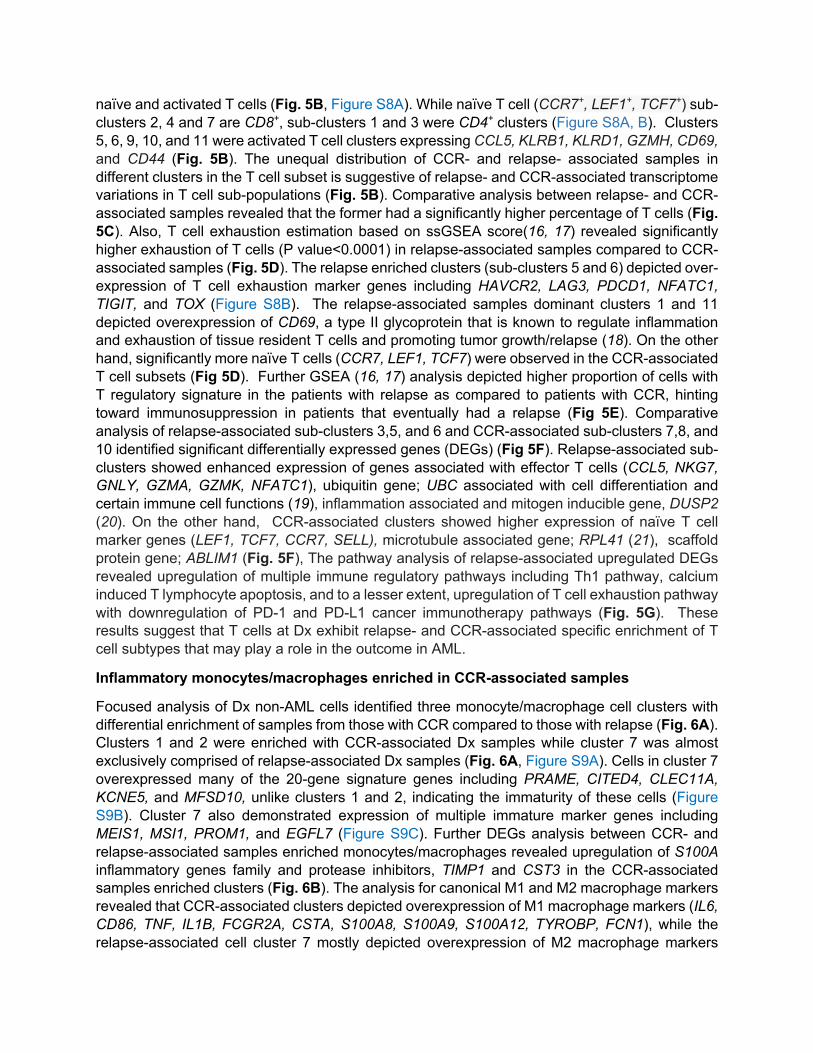
naïve and activated T cells (Fig. 5B, Figure S8A). While naïve T cell (CCR7+, LEF1+, TCF7+) sub-
clusters 2, 4 and 7 are CD8+, sub-clusters 1 and 3 were CD4+ clusters (Figure S8A, B). Clusters
5, 6, 9, 10, and 11 were activated T cell clusters expressing CCL5, KLRB1, KLRD1, GZMH, CD69,
and CD44 (Fig. 5B). The unequal distribution of CCR- and relapse- associated samples in
different clusters in the T cell subset is suggestive of relapse- and CCR-associated transcriptome
variations in T cell sub-populations (Fig. 5B). Comparative analysis between relapse- and CCR-
associated samples revealed that the former had a significantly higher percentage of T cells (Fig.
5C). Also, T cell exhaustion estimation based on ssGSEA score(16, 17) revealed significantly
higher exhaustion of T cells (P value<0.0001) in relapse-associated samples compared to CCR-
associated samples (Fig. 5D). The relapse enriched clusters (sub-clusters 5 and 6) depicted over-
expression of T cell exhaustion marker genes including HAVCR2, LAG3, PDCD1, NFATC1,
TIGIT, and TOX (Figure S8B). The relapse-associated samples dominant clusters 1 and 11
depicted overexpression of CD69, a type II glycoprotein that is known to regulate inflammation
and exhaustion of tissue resident T cells and promoting tumor growth/relapse (18). On the other
hand, significantly more naïve T cells (CCR7, LEF1, TCF7) were observed in the CCR-associated
T cell subsets (Fig 5D). Further GSEA (16, 17) analysis depicted higher proportion of cells with
T regulatory signature in the patients with relapse as compared to patients with CCR, hinting
toward immunosuppression in patients that eventually had a relapse (Fig 5E). Comparative
analysis of relapse-associated sub-clusters 3,5, and 6 and CCR-associated sub-clusters 7,8, and
10 identified significant differentially expressed genes (DEGs) (Fig 5F). Relapse-associated sub-
clusters showed enhanced expression of genes associated with effector T cells (CCL5, NKG7,
GNLY, GZMA, GZMK, NFATC1), ubiquitin gene; UBC associated with cell differentiation and
certain immune cell functions (19), inflammation associated and mitogen inducible gene, DUSP2
(20). On the other hand, CCR-associated clusters showed higher expression of naïve T cell
marker genes (LEF1, TCF7, CCR7, SELL), microtubule associated gene; RPL41 (21), scaffold
protein gene; ABLIM1 (Fig. 5F), The pathway analysis of relapse-associated upregulated DEGs
revealed upregulation of multiple immune regulatory pathways including Th1 pathway, calcium
induced T lymphocyte apoptosis, and to a lesser extent, upregulation of T cell exhaustion pathway
with downregulation of PD-1 and PD-L1 cancer immunotherapy pathways (Fig. 5G). These
results suggest that T cells at Dx exhibit relapse- and CCR-associated specific enrichment of T
cell subtypes that may play a role in the outcome in AML.
Inflammatory monocytes/macrophages enriched in CCR-associated samples
Focused analysis of Dx non-AML cells identified three monocyte/macrophage cell clusters with
differential enrichment of samples from those with CCR compared to those with relapse (Fig. 6A).
Clusters 1 and 2 were enriched with CCR-associated Dx samples while cluster 7 was almost
exclusively comprised of relapse-associated Dx samples (Fig. 6A, Figure S9A). Cells in cluster 7
overexpressed many of the 20-gene signature genes including PRAME, CITED4, CLEC11A,
KCNE5, and MFSD10, unlike clusters 1 and 2, indicating the immaturity of these cells (Figure
S9B). Cluster 7 also demonstrated expression of multiple immature marker genes including
MEIS1, MSI1, PROM1, and EGFL7 (Figure S9C). Further DEGs analysis between CCR- and
relapse-associated samples enriched monocytes/macrophages revealed upregulation of S100A
inflammatory genes family and protease inhibitors, TIMP1 and CST3 in the CCR-associated
samples enriched clusters (Fig. 6B). The analysis for canonical M1 and M2 macrophage markers
revealed that CCR-associated clusters depicted overexpression of M1 macrophage markers (IL6,
CD86, TNF, IL1B, FCGR2A, CSTA, S100A8, S100A9, S100A12, TYROBP, FCN1), while the
relapse-associated cell cluster 7 mostly depicted overexpression of M2 macrophage markers
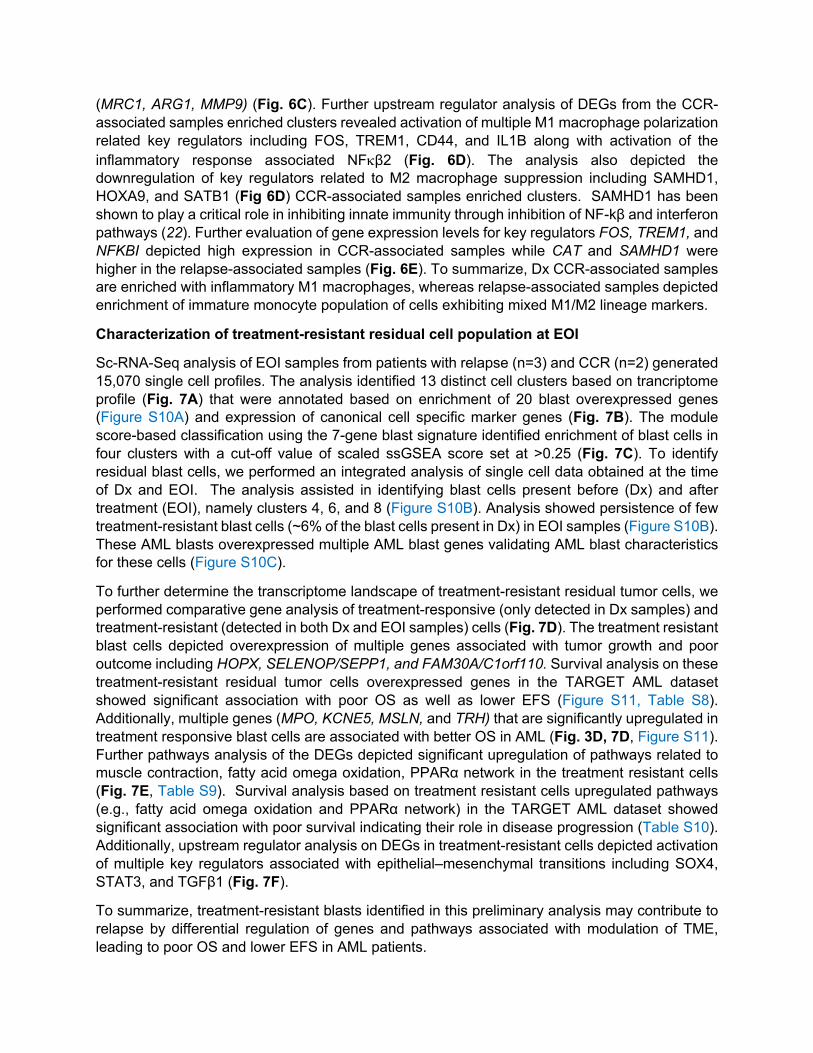
(MRC1, ARG1, MMP9) (Fig. 6C). Further upstream regulator analysis of DEGs from the CCR-
associated samples enriched clusters revealed activation of multiple M1 macrophage polarization
related key regulators including FOS, TREM1, CD44, and IL1B along with activation of the
inflammatory response associated NFkβ2 (Fig. 6D). The analysis also depicted the
downregulation of key regulators related to M2 macrophage suppression including SAMHD1,
HOXA9, and SATB1 (Fig 6D) CCR-associated samples enriched clusters. SAMHD1 has been
shown to play a critical role in inhibiting innate immunity through inhibition of NF-kβ and interferon
pathways (22). Further evaluation of gene expression levels for key regulators FOS, TREM1, and
NFKBI depicted high expression in CCR-associated samples while CAT and SAMHD1 were
higher in the relapse-associated samples (Fig. 6E). To summarize, Dx CCR-associated samples
are enriched with inflammatory M1 macrophages, whereas relapse-associated samples depicted
enrichment of immature monocyte population of cells exhibiting mixed M1/M2 lineage markers.
Characterization of treatment-resistant residual cell population at EOI
Sc-RNA-Seq analysis of EOI samples from patients with relapse (n=3) and CCR (n=2) generated
15,070 single cell profiles. The analysis identified 13 distinct cell clusters based on trancriptome
profile (Fig. 7A) that were annotated based on enrichment of 20 blast overexpressed genes
(Figure S10A) and expression of canonical cell specific marker genes (Fig. 7B). The module
score-based classification using the 7-gene blast signature identified enrichment of blast cells in
four clusters with a cut-off value of scaled ssGSEA score set at >0.25 (Fig. 7C). To identify
residual blast cells, we performed an integrated analysis of single cell data obtained at the time
of Dx and EOI. The analysis assisted in identifying blast cells present before (Dx) and after
treatment (EOI), namely clusters 4, 6, and 8 (Figure S10B). Analysis showed persistence of few
treatment-resistant blast cells (~6% of the blast cells present in Dx) in EOI samples (Figure S10B).
These AML blasts overexpressed multiple AML blast genes validating AML blast characteristics
for these cells (Figure S10C).
To further determine the transcriptome landscape of treatment-resistant residual tumor cells, we
performed comparative gene analysis of treatment-responsive (only detected in Dx samples) and
treatment-resistant (detected in both Dx and EOI samples) cells (Fig. 7D). The treatment resistant
blast cells depicted overexpression of multiple genes associated with tumor growth and poor
outcome including HOPX, SELENOP/SEPP1, and FAM30A/C1orf110. Survival analysis on these
treatment-resistant residual tumor cells overexpressed genes in the TARGET AML dataset
showed significant association with poor OS as well as lower EFS (Figure S11, Table S8).
Additionally, multiple genes (MPO, KCNE5, MSLN, and TRH) that are significantly upregulated in
treatment responsive blast cells are associated with better OS in AML (Fig. 3D, 7D, Figure S11).
Further pathways analysis of the DEGs depicted significant upregulation of pathways related to
muscle contraction, fatty acid omega oxidation, PPARα network in the treatment resistant cells
(Fig. 7E, Table S9). Survival analysis based on treatment resistant cells upregulated pathways
(e.g., fatty acid omega oxidation and PPARα network) in the TARGET AML dataset showed
significant association with poor survival indicating their role in disease progression (Table S10).
Additionally, upstream regulator analysis on DEGs in treatment-resistant cells depicted activation
of multiple key regulators associated with epithelial–mesenchymal transitions including SOX4,
STAT3, and TGFβ1 (Fig. 7F).
To summarize, treatment-resistant blasts identified in this preliminary analysis may contribute to
relapse by differential regulation of genes and pathways associated with modulation of TME,
leading to poor OS and lower EFS in AML patients.

Relapse-associated EOI samples depicted enrichment of T cells and diminution of
monocytes/macrophages
EOI samples showed a much larger proportion of non-AML immune cells since therapeutic
intervention (chemotherapy) results in the killing of tumor cells. To further characterize EOI single
cell landscape, the focused analysis on non-AML cells was performed after removing residual
blast cell clusters discussed in the previous section. The split UMAP of CCR- and relapse-
associated samples revealed the altered distribution of the transcriptionally distinct canonical
immune cells (T cells, NK cells, and macrophages/monocytes) (Fig. 8A). Analysis of relapse- and
CCR-associated non-AML clusters at EOI revealed a similar pattern to that seen at Dx, that is
higher enrichment of T cells in relapse-associated samples and a higher proportion of monocytes
and macrophages in the CCR-associated samples enriched clusters (Fig. 8B, C). Further M1 and
M2 macrophage enrichment analysis revealed a highly significant (p<0.001) inflammatory M1
macrophages predominance in CCR-associated EOI samples and significant (p<0.05) M2
macrophages enrichment in relapse-associated EOI samples (Fig. 8D). The T cells formed three
distinct clusters i.e., naïve T cell-1, naïve T cell-2, and NKT cells clusters (Fig. 8A, Figure S12A).
Naïve T cells-2 cluster depicted significantly (P value<0.05) higher enrichment in the relapse-
associated EOI samples (Figure S12B). The comparative analysis of the two naïve T cell clusters
depicted that relapse-enriched naïve T cell-2 has lower expression of MHC class I genes including
HLA-A and HLA-B (Figure S12C). Pathway analysis of naïve T cell-2 depicted downregulation of
pathways related to Th1, Th2, calcium-induced T cell apoptosis, CD28 signaling in T helper cells,
and integrin pathways (Fig. 8E).
Discussion
ScRNA-Seq has revolutionized cancer research and is especially pertinent for AML research due
to the tumor and microenvironment heterogeneity. We analyzed a heterogeneous group of AML
samples; AML with identified mutations, AML associated with myelodysplasia, AML showing
minimal differentiation, and AML NOS (Table S1). Our analysis indicated that AML blast cells are
significantly heterogeneous and patient specific (Fig 3A). Despite the heterogeneity, supervised
analysis on blast cells using a machine learning approach identified a unique 7-gene blast
progenitor signature that is overexpressed in the heterogeneous AML blast populations studied.
The expression of signature genes depicted a significant correlation with the percentage of blast
cells in external TARGET AML datasets demonstrating specific expression in AML blast cells.
The 7-gene signature included genes coding for growth factors (CLEC11A), myeloid
differentiation factor (AZU1), cell development (NREP), and transcription factors (PRAME). TRH
has been shown to have high expression in AML (24) while the function associated with
ARMH1/C1orf228 is not known yet. The functional variability of the 7-gene signature capable of
distinguishing AML blasts from non-AML cells is suggestive of multiple synergistic pathways being
modulated in these AML blast cells. Significant association of the 7-gene signature
overexpression with poor OS can be attributed to the regulation of a myriad of cell functions that
promote tumor growth, proliferation, and migration. Analysis of longitudinal samples (Dx, EOI,
and Rel) showed that blast cells identified at Dx reduced significantly at EOI and reappear in Rel
samples. The blast cells in the Rel samples display significant similarity with Dx blast cells
indicating that expansion of certain therapy resistant rare Dx blast cells clones that might be
responsible for disease relapse.
ScRNA-Seq data analysis revealed distinct gene expression profiles at Dx of blasts from patients
that are destined to relapse vs. remain in CCR. The blast cells of relapse-associated samples
even at the time of disease diagnosis depicted upregulation of multiple genes related to
cytoskeleton formation (FLNA, RFLNB/FAM101B) associated with poor clinical outcome (Table
S7B). Cytoskeleton proteins affect various tumor cell characteristics like cell survival because of
drug resistance, invasiveness, and metastasis (25). Also, actin cytoskeleton remodeling can
change physical and functional interactions at the immunological synapse (26). Microtubule
targeting or disrupting agents have been tested for a variety of therapy resistant cancers (27).
One such drug, Combretastatin A4-phosphate (CA4P) targets VCAM1, vascular cell adhesion
molecule 1, expression and resulted in AML cell line apoptosis (27). RFLNB belongs to the refilin
family, short lived F-actin regulators, that control cell fate specification and differentiation (28).
RFLNB promoter binds transcription factor PKNOX1/PREP1 that regulates embryonic
development and determines cell fate (29). RFLNB and PKNOX1 are also known to modulate
responsiveness to TGFβ and promote epithelial mesenchymal transition (30). RFLNB targets
FLNA to organize a perinuclear network and stabilize nuclear shape (31). FLNA is known to
interact with integrin, ITGB7 that interacts with VCAM1 (32). Therefore, overexpression of FLNA,
RFLNB in blasts cells may modulate the cell structure and subsequent interactions with immune
cells. These changes influence cell junction organization, cell motility and activate nuclear
transcription programs that may contribute to AML relapse. The genes overexpressed in the
relapse-associated blasts cells were found to correlate with upregulation of multiple pathways
including RhoGDI, eNOS, and protein kinase A signaling. Rho GDP-dissociation inhibitor
(RhoGDI) pathway activation has been shown to enhance progression chemoresistant cancer
cell lines and animal models (33). Studies also show that endothelial NOS (eNOS) can affect
tumor processes such as resistance, angiogenesis, invasion, and metastasis. An increase in
eNOS expression is found to have associations with poor relapse-free and overall survival as well
(34). In contrast, Dx blasts from samples with CCR showed significant upregulation of genes like
MPO and TRH that are associated with better survival outcomes. Previously TRH has been
shown to be upregulated in t(8;21) AML subtype and high expression is associated with better
clinical outcomes (35). TRH has been implicated to have a role in the immune system (36), but
its role in AML blasts is not clear. MPO is the key enzyme of myeloid lineage commitment and
associated with a favorable prognosis in AML (37). This differential expression of genes identified
in relapse- and CCR-associated blasts and subsequent differential regulation of pathways and
upstream key transcriptional regulators may contribute to differences in hematopoietic niches that
result in AML relapse/CCR.
Additionally, investigation of paired Dx and EOI samples led to the identification and
characterization of therapy resistant residual blast cells. The therapy resistant blast cells depicted
overexpression of multiple genes associated with tumor growth (SELENOP), metabolism, and
stemness (HOPX, FAM30A). The higher expression of HOPX is associated with higher platelet
counts, lower white blood cell counts, lower lactate dehydrogenase levels, lower complete
remission rates, and poor overall survival (38). SELENOP encodes for a selenoprotein that
mediates microenvironmental changes that influence tumor growth and prognosis across multiple
solid tumors such as prostate and breast cancers (39). Similarly, the FAM30A gene has been
recently shown to be associated with leukemia stemness and high-risk pediatric AML (40). The
pathways analysis of treatment resistant blast cells showed upregulation of multiple pathways
including fatty acid oxidation, and PPARα network. Fatty acid oxidation has been linked to
enrichment and survival of leukemic stem cells resulting in disease progression and relapse.
Furthermore, the resistance of AML to conventional and metabolically oriented therapies (i.e.,
Venetoclax) has also shown an association with upregulation of fatty acid oxidation in the
leukemic stem cells (LSCs) (41, 42). Therefore our preliminary data support targeting fatty acid
metabolism in AML LSCs for achieving CCR though more validation is required.
AML is mainly characterized by enrichment of immature myeloblasts, but immune cells play an
integral role in the disease progression and outcome (43). Mature myeloid lineage cells have been
implicated in altering T cell phenotypes and generating a immunosuppressive microenvironment
in AML (44, 45). Additionally, dysregulation of crosstalk between tumor and stromal cells has
been shown as key toward tumor proliferation or suppression. To explore the impact of TME at
the baseline, we performed focused analysis on immune cells collected at Dx from patients with
CCR and relapse outcomes. Overall, T cells were more abundant in relapse-associated samples
while monocyte/ macrophages were enriched in samples with CCR (Fig. 4). CCR-associated
samples depicted naïve T cells enrichment compared to relapse-associated samples, which may
contribute to effective resolution of the blast cells leading to remission. Samples from those with
relapse with enriched exhausted T cells will have an immunosuppressive TME resulting in less
effective blast cells clearance. Also, pathway analysis showed enhanced Th1 pathways and
costimulatory ICOS/ICOS-L T helper pathway indicative of a more inflammatory T-cell pattern in
samples from those with relapse. ICOSL expression in the AML cells has been shown to result in
ICOS+ Tregs expansion that promotes immune evasion as well as IL-10 secreted by ICOS+ Tregs
support AML cells proliferation (46). Further analysis of samples collected at EOI suggested a
shared pattern in immune cells enrichment at EOI and Dx; there were more T cells in samples
that relapse later and higher monocyte/macrophages in samples with sustained remission. The
transcriptionally distinct naïve T cell clusters enriched in samples from those with relapse (T cell-
2) may be influenced by the type of blasts present in these samples.
The analysis of innate immune cells depicted enrichment of inflammatory M1 macrophages in Dx
and EOI samples with CCR compared to samples with relapse, indicates that initial activation of
these adaptive immune cells may contribute to remission. Leukemia associated macrophages
(LAM) have been associated with survival and drug resistance of AML cells (47). It has been
shown that targeting IRF7/SAPK/JNK pathway can promote M1 characteristics in LAM resulting
in prolonged survival of leukemic mice. Conversely, relapsed EOI samples had more tolerant M2
macrophages that may not clear up the remaining blast cells that drive disease relapse. These
findings indicate a potential role of innate immune cells in achieving deep and sustained remission
and possible exploration for therapeutic intervention.
Conclusions
Common transcriptome and pathways present in the highly heterogenous AML sub-types enabled
the usage of novel 7-gene signature for identifying AML blast cells in the current study. At the
same time, distinct differences were identified in AML associated blasts as well as non-AML cells
that distinguished samples with relapse from samples with CCR. We uncovered the presence of
patient specific blasts at Dx, treatment-resistant blasts at EOI, and the presence/activation of
different arms of the immune system (monocyte/macrophage and T cells) in samples from those
with relapse and those with CCR at both Dx and EOI. The identification of upregulation of novel
genes like ARMH1 in AML blasts is important for diagnostic and therapeutic purposes. Using
scRNA-Seq we were able to identify unique gene signatures, characterize AML associated blasts
and delineate immune cells make-up in the TME of children with different AML outcomes.
Material and Methods
Clinical Samples
Samples were obtained as part of a precision medicine study of Aflac Cancer and Blood disorder
center that was approved by the Emory institutional review board. Bone marrow core biopsies
were obtained at the initial presentation of AML (Dx), at the time of therapy remission; the end of
induction (EOI), and at the time of relapse (Rel) as part of routine hematopathology evaluation.
The study was performed on 15 patients, out of which 9 patients remain in continuous clinical
remission, and 6 patients relapsed. To study the sequential changes in single cell landscape, we
paired samples from two patients collected at Dx, EOI, and Rel. The single cell analysis at Dx
involved 14 patients: six with relapse and eight with CCR. For EOI the analysis was performed on
five patients’ samples: three with relapse and two with CCR.
Single Cell RNA Sequencing and analysis (Details in Supplementary Methods)
We performed scRNA-Seq on viably revived bone marrow samples using the 10X Chromium 3’V3
and 5’V1 reagent kits and sequencing was performed using the massively parallel sequencing on
the Novaseq S4 platform. Raw scRNA-Seq data was demultiplexed, aligned to the human
reference genome (hg38), and processed for single cell gene counting using the Cell Ranger
Software from 10X Genomics Inc. The single cell count data was normalized using the
SCTransform function in Seurat v3.0 Bioconductor package (48) that uses regularized negative
binomial models for normalizing sparse single cell data. The normalized expression profiles of the
samples were merged, and batch corrected (if required) based on shared embedding using
harmony Bioconductor package (49). Further quality control, pre-processing, unsupervised and
supervised analysis on the data was performed using various R and Bioconductor packages. In
an unbiased approach, cell types and subtypes signatures were generated by comparing the
expression profile of target cell type with the rest of the cells using the non-parametric Wilcoxon
rank test (P-value <.01) and fold change >1.2.
To determine the cell specific gene dysregulations that are associated with relapse and CCR, we
performed comparative analysis of the transcriptome profile of each cell type between relapsed
and CCR groups. The comparative analysis of normalized data was performed using the non-
parametric Wilcoxon rank model, based on raw P values and absolute fold change. Genes were
considered significantly differentially expressed if P values were < 0.05 and FC >1.5.
Pathway and Systems Biology Analysis
To precisely characterize the AML blast cells and understand the molecular mechanism of
disease progression, we performed pathways enrichment and systems biology analysis (See
details in supplementary methods).
Gene Set Enrichment Analysis
To determine the enrichment of pre-determined gene sets, such as 7-gene signature and
canonical pathways from the molecular signature database(16), we performed single sample
gene set enrichment analysis (ssGSEA)(16) using escape package from the Bioconductor library.
SsGSEA enrichment score represents the degree to which the genes in a particular gene set are
coordinately up- or down-regulated within a cell cluster, which could serve as an indicator of gene
set activity. To interrogate the unique pathways/gene sets that are differentially enriched in one
cell type vs. other, we performed statistical analysis using student t-test or LIMMA (51) to select
significantly differentially enriched gene sets. Pathways/Gene sets with an adjusted P-value <0.01
were considered statistically significant.
Validation of scRNA-Seq blast enriched genes on external pediatric AML dataset
The preliminary comparative analysis of AML Dx specific clusters identified a long list of AML
enriched genes that are overexpressed in AML blast cells. To reduce the false positives and
identify robust AML blast associated genes, we evaluated their pattern on the external pediatric
AML dataset from TARGET initiative. The study contains bulk RNA sequencing data generated
from bone marrow samples of >300 AML subjects that include infants (<3 years old), children (3-
14 years old), and adolescents/ young adults (AYA; 15-39 years old). The raw TARGET dataset
was normalized using VOOM algorithm (52). To explore the expression pattern of single cell
profiling identified AML blast associated genes in TARGET AML dataset, we binned the Dx
datasets into different groups - based on percentages of blast cells (>60%, 60%-30%, <30%s).
We hypothesized that genes that are specifically expressed by blast cells will depict a progressive
downregulation pattern from high to low blast and EOI samples. The significance of progressive
downregulation from high to low blast/EOI groups was determined using unpaired Student t-test
(P-value). Genes with fold change >0.7 (High blast vs EOI) and P value <0.05 were considered
significantly associated with blast cells. All analysis was performed using different Bioconductor
Packages and R language including LIMMA, and gplots (53).
Survival analysis of AML blast genes
To determine the association of blast genes with clinical outcomes in AML, we performed the
survival analysis on the TARGET-AML dataset. For gene-level analysis, we used the median (50th
percentile) cut-off or an optimal cut point (cutp) estimated based on martingale residuals (54)
using the ‘survMisc’ package in Bioconductor/R to separate the patients into high and low gene
expression groups. For combined analysis, we used the non-parametric method, single sample
gene set enrichment analysis (ssGSEA) as implemented in the GSVA package (55) to obtain a
gene-set enrichment score. Overall Survival (OS) or Event-Free Survival (EFS) statistical analysis
was performed using the ‘survival’ R package (See details in supplementary methods).
Generation of AML blast associated 7-gene signature using Support Vector Machine
To identify the key genes associated with AML blast we developed classifiers using the support
vector machine technique(5, 6). The classifiers assist in identifying the genes that are most
important for identifying the pediatric AML blast cells. Each classifier was developed based on
the selected set of 20 genes that are overexpressed in blast cells at single cell level as well as in
the bulk TARGET dataset. Classifiers were trained using normalized and preprocessed single cell

data. For example, classifier for discriminating between blast and non-blast cells was trained
based on input matrix of 20 gene expression from AML blast and non-AML cells. The
performance of these classifiers in the training dataset were evaluated using Out of bag (OOB)
cross-validation. The performance of classifiers was measured using threshold-independent
receiver operating characteristic (ROC) analysis. The analysis assisted in identifying a minimal
set of genes that can distinguish blast cells from other cells with high Area Under Curve (AUC)
from ROC analysis.
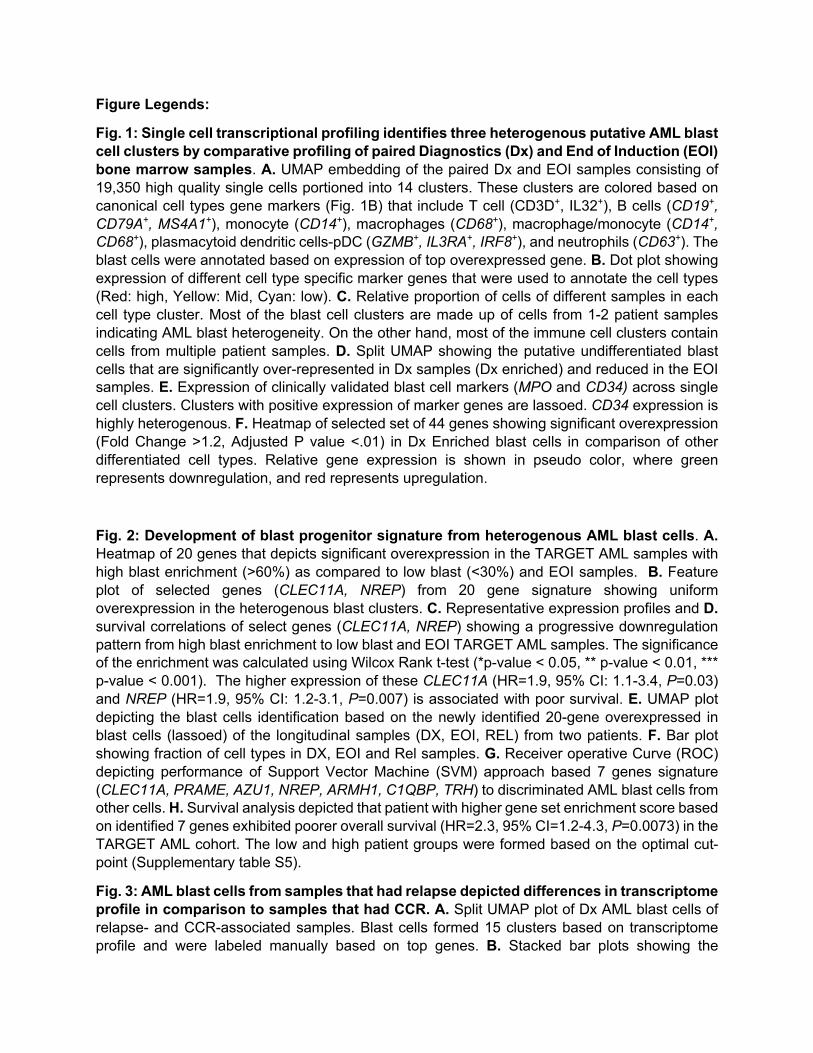
Figure Legends:
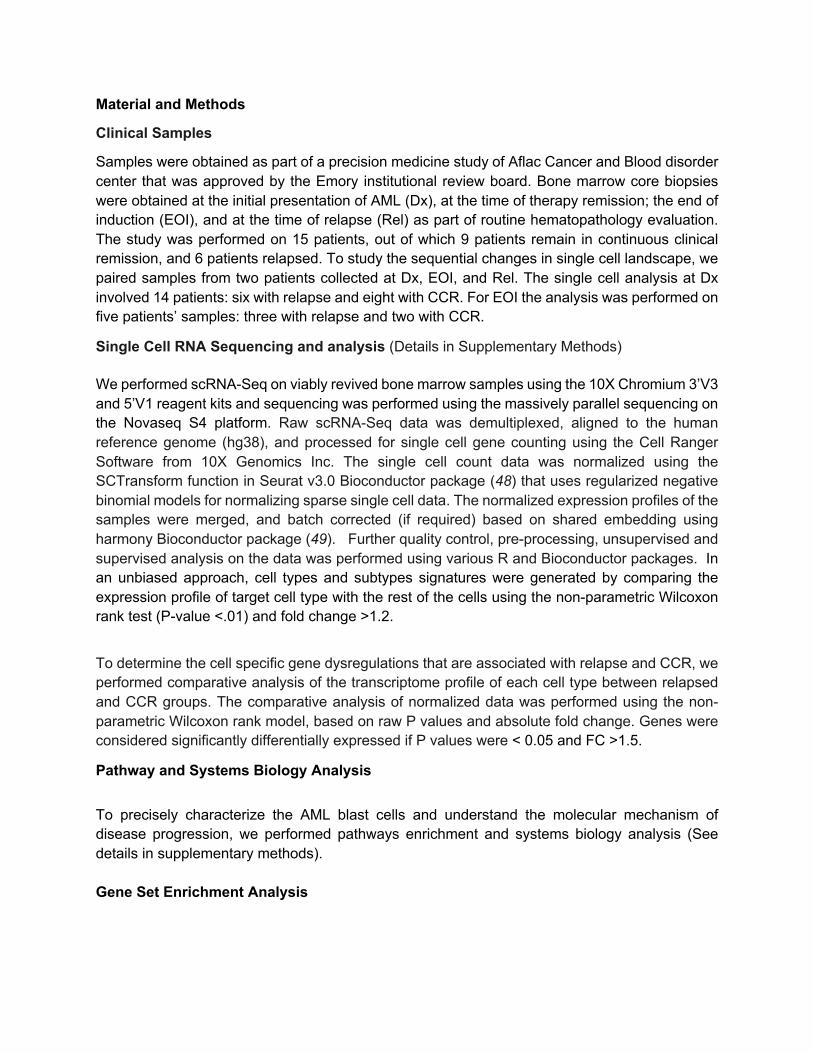
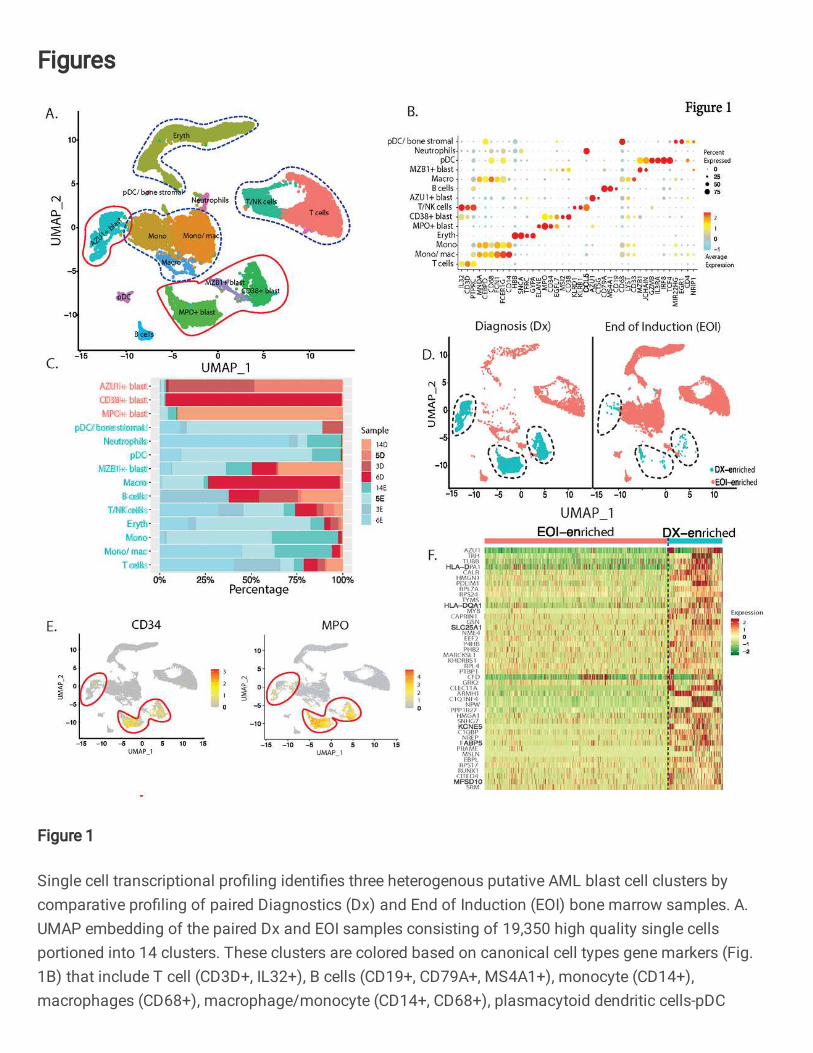
Fig. 1: Single cell transcriptional profiling identifies three heterogenous putative AML blast
cell clusters by comparative profiling of paired Diagnostics (Dx) and End of Induction (EOI)
bone marrow samples. A. UMAP embedding of the paired Dx and EOI samples consisting of
19,350 high quality single cells portioned into 14 clusters. These clusters are colored based on
canonical cell types gene markers (Fig. 1B) that include T cell (CD3D+, IL32+), B cells (CD19+,
CD79A+, MS4A1+), monocyte (CD14+), macrophages (CD68+), macrophage/monocyte (CD14+,
CD68+), plasmacytoid dendritic cells-pDC (GZMB+, IL3RA+, IRF8+), and neutrophils (CD63+). The
blast cells were annotated based on expression of top overexpressed gene. B. Dot plot showing
expression of different cell type specific marker genes that were used to annotate the cell types
(Red: high, Yellow: Mid, Cyan: low). C. Relative proportion of cells of different samples in each
cell type cluster. Most of the blast cell clusters are made up of cells from 1-2 patient samples
indicating AML blast heterogeneity. On the other hand, most of the immune cell clusters contain
cells from multiple patient samples. D. Split UMAP showing the putative undifferentiated blast
cells that are significantly over-represented in Dx samples (Dx enriched) and reduced in the EOI
samples. E. Expression of clinically validated blast cell markers (MPO and CD34) across single
cell clusters. Clusters with positive expression of marker genes are lassoed. CD34 expression is
highly heterogenous. F. Heatmap of selected set of 44 genes showing significant overexpression
(Fold Change >1.2, Adjusted P value <.01) in Dx Enriched blast cells in comparison of other
differentiated cell types. Relative gene expression is shown in pseudo color, where green
represents downregulation, and red represents upregulation.
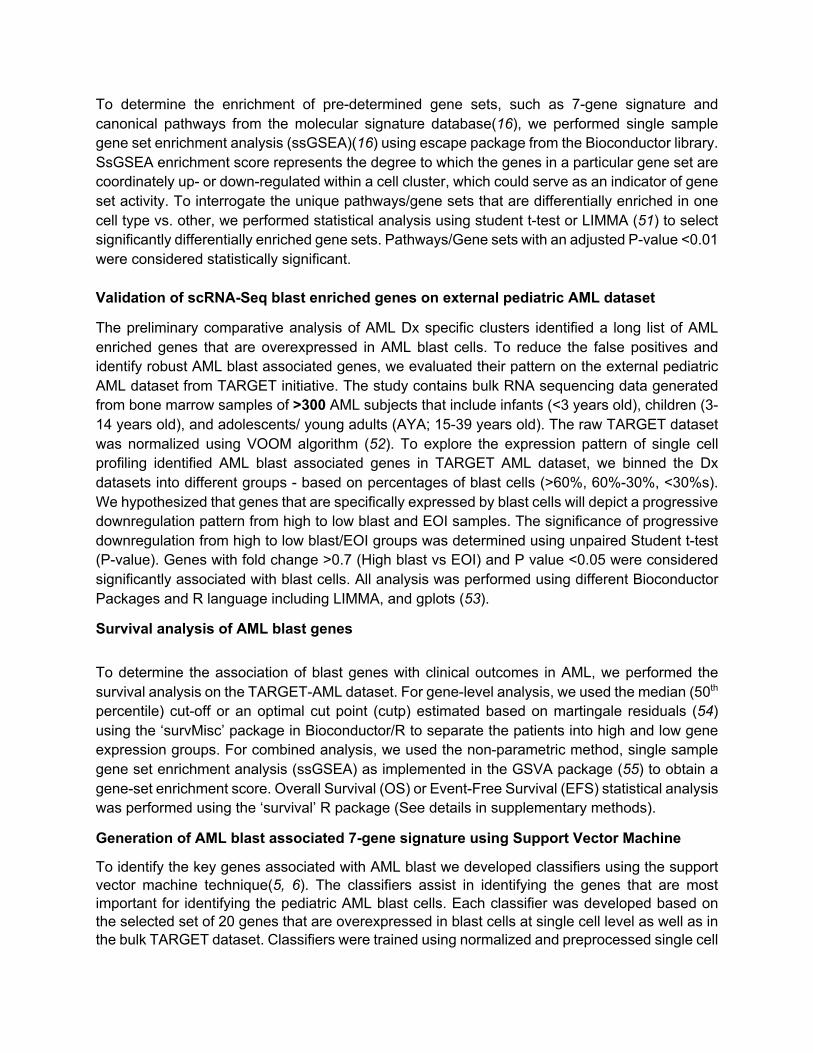
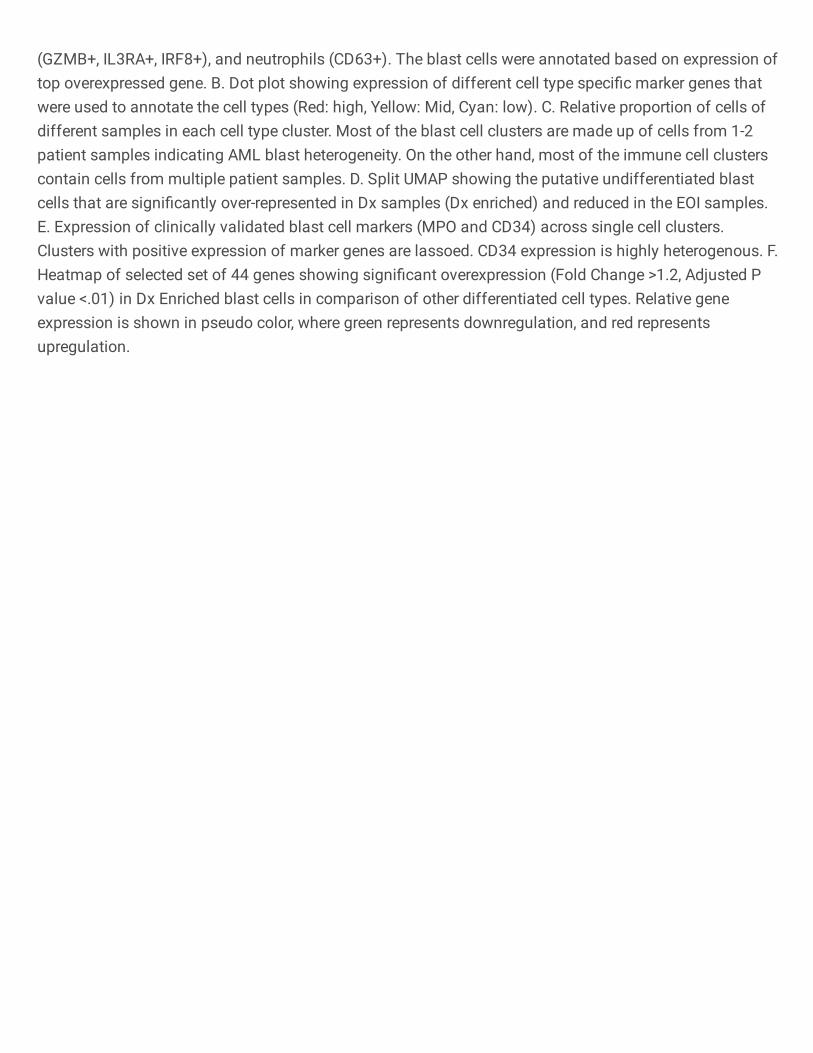
Fig. 2: Development of blast progenitor signature from heterogenous AML blast cells. A.
Heatmap of 20 genes that depicts significant overexpression in the TARGET AML samples with
high blast enrichment (>60%) as compared to low blast (<30%) and EOI samples. B. Feature
plot of selected genes (CLEC11A, NREP) from 20 gene signature showing uniform
overexpression in the heterogenous blast clusters. C. Representative expression profiles and D.
survival correlations of select genes (CLEC11A, NREP) showing a progressive downregulation
pattern from high blast enrichment to low blast and EOI TARGET AML samples. The significance
of the enrichment was calculated using Wilcox Rank t-test (*p-value < 0.05, ** p-value < 0.01, ***
p-value < 0.001). The higher expression of these CLEC11A (HR=1.9, 95% CI: 1.1-3.4, P=0.03)
and NREP (HR=1.9, 95% CI: 1.2-3.1, P=0.007) is associated with poor survival. E. UMAP plot
depicting the blast cells identification based on the newly identified 20-gene overexpressed in
blast cells (lassoed) of the longitudinal samples (DX, EOI, REL) from two patients. F. Bar plot
showing fraction of cell types in DX, EOI and Rel samples. G. Receiver operative Curve (ROC)
depicting performance of Support Vector Machine (SVM) approach based 7 genes signature
(CLEC11A, PRAME, AZU1, NREP, ARMH1, C1QBP, TRH) to discriminated AML blast cells from
other cells. H. Survival analysis depicted that patient with higher gene set enrichment score based
on identified 7 genes exhibited poorer overall survival (HR=2.3, 95% CI=1.2-4.3, P=0.0073) in the
TARGET AML cohort. The low and high patient groups were formed based on the optimal cut-
point (Supplementary table S5).
Fig. 3: AML blast cells from samples that had relapse depicted differences in transcriptome
profile in comparison to samples that had CCR. A. Split UMAP plot of Dx AML blast cells of
relapse- and CCR-associated samples. Blast cells formed 15 clusters based on transcriptome
profile and were labeled manually based on top genes. B. Stacked bar plots showing the
proportion of cells from each patient in different clusters (Red: Relapse-associated, Blue: CCR-
associated). C. Heatmap of top differentially expressed genes between relapse-associated
(clusters 0, 2, 7, 13) and CCR-associated (clusters 1, 3, 4) samples clusters. D. Kaplan Meier
plots of genes in AML blasts enriched in relapse-associated samples, such as FLNA and
RFLNB/FAM101B, were associated with poorer overall survival in TARGET AML dataset. Similar
analysis on genes (MPO, TRH) with increased expression in the CCR-associated clusters
depicted significantly better overall survival. E. Pathways that significantly (P value <.01)
activated (Z score >1.5) /inhibited (Z score <-1.5) in samples with relapse vs. samples with CCR.
F. Upstream regulatory molecules significantly activated (orange) in the relapse- vs. CCR-
associated samples.
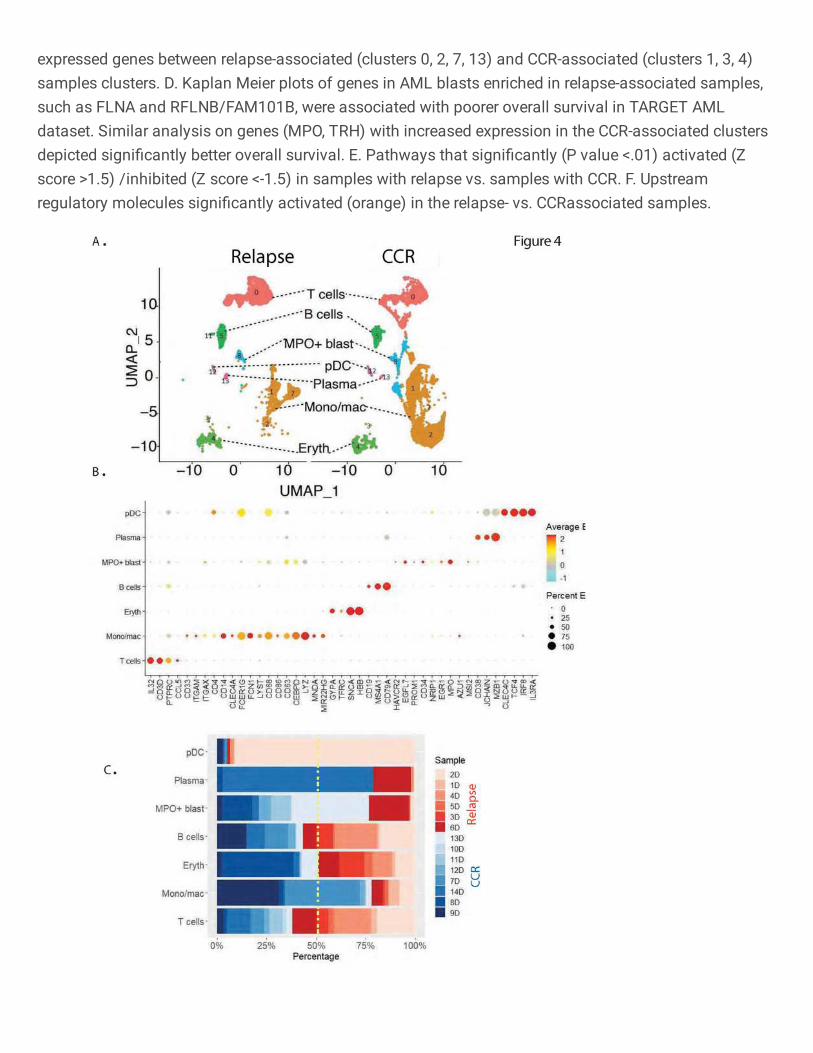
Fig. 4: Immune microenvironment analysis of samples collected at the time of diagnosis.
A. Split UMAP plot of bone marrow microenvironment cells based on relapse- and CCR-
associated status of samples. B. Expression based dot plot of canonical cell specific markers
used for the annotation of lymphoid, myeloid, and erythroid lineages. C. Stacked bar plots
showing the proportion of cells from each patient in the different clusters (Red: Relapse, Blue:
Remission).
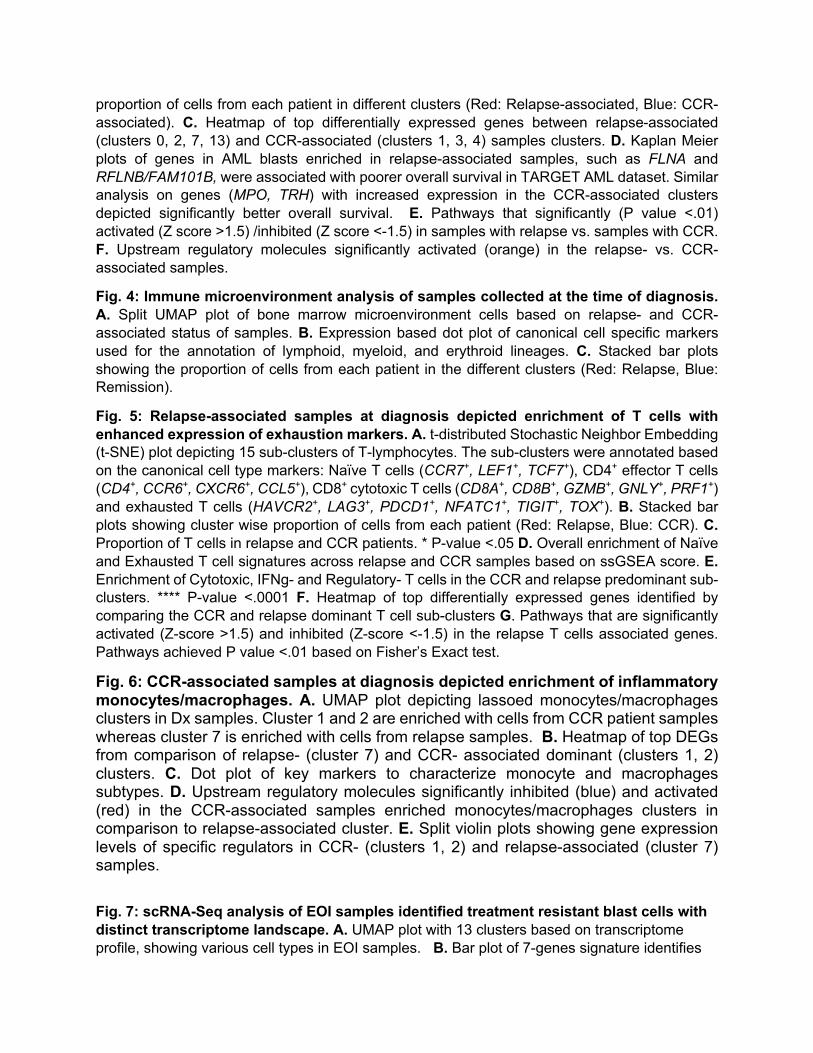
Fig. 5: Relapse-associated samples at diagnosis depicted enrichment of T cells with
enhanced expression of exhaustion markers. A. t-distributed Stochastic Neighbor Embedding
(t-SNE) plot depicting 15 sub-clusters of T-lymphocytes. The sub-clusters were annotated based
on the canonical cell type markers: Naïve T cells (CCR7+, LEF1+, TCF7+), CD4+ effector T cells
(CD4+, CCR6+, CXCR6+, CCL5+), CD8+ cytotoxic T cells (CD8A+, CD8B+, GZMB+, GNLY+, PRF1+)
and exhausted T cells (HAVCR2+, LAG3+, PDCD1+, NFATC1+, TIGIT+, TOX+). B. Stacked bar
plots showing cluster wise proportion of cells from each patient (Red: Relapse, Blue: CCR). C.
Proportion of T cells in relapse and CCR patients. * P-value <.05 D. Overall enrichment of Naïve
and Exhausted T cell signatures across relapse and CCR samples based on ssGSEA score. E.
Enrichment of Cytotoxic, IFNg- and Regulatory- T cells in the CCR and relapse predominant sub-
clusters. **** P-value <.0001 F. Heatmap of top differentially expressed genes identified by
comparing the CCR and relapse dominant T cell sub-clusters G. Pathways that are significantly
activated (Z-score >1.5) and inhibited (Z-score <-1.5) in the relapse T cells associated genes.
Pathways achieved P value <.01 based on Fisher’s Exact test.
Fig. 6: CCR-associated samples at diagnosis depicted enrichment of inflammatory monocytes/macrophages. A. UMAP plot depicting lassoed monocytes/macrophages clusters in Dx samples. Cluster 1 and 2 are enriched with cells from CCR patient samples whereas cluster 7 is enriched with cells from relapse samples. B. Heatmap of top DEGs from comparison of relapse- (cluster 7) and CCR- associated dominant (clusters 1, 2) clusters. C. Dot plot of key markers to characterize monocyte and macrophages subtypes. D. Upstream regulatory molecules significantly inhibited (blue) and activated (red) in the CCR-associated samples enriched monocytes/macrophages clusters in comparison to relapse-associated cluster. E. Split violin plots showing gene expression levels of specific regulators in CCR- (clusters 1, 2) and relapse-associated (cluster 7) samples.
Fig. 7: scRNA-Seq analysis of EOI samples identified treatment resistant blast cells with
distinct transcriptome landscape. A. UMAP plot with 13 clusters based on transcriptome
profile, showing various cell types in EOI samples. B. Bar plot of 7-genes signature identifies
clusters 6 and 9 as blast-dominant cell clusters, along with clusters 10 and 11. C. Dot plot of
canonical markers used for cluster annotation. D. Heatmap of top markers that are significantly
differently expressed between treatment-resistant (residual at EOI) and treatment-responsive
(only at Dx cells) E. Violin plots of pathways significantly enriched in treatment-resistant blast
cells compared to treatment-responsive. F. Regulators that are significantly activated (orange
color) and inhibited (blue color) in treatment-resistant blast cells compared to treatment-
responsive blast cells.
Fig. 8: EOI Non-AML cells analysis exhibits different patterns in samples from those with
relapse and those with CCR. (A) UMAP plot of annotated non-AML cell clusters split based on
relapse and CCR status. (B) Bar plot showing the proportion of cell types in relapse and CCR
samples at time of therapy induced induction. Y-axis represents fraction of each cell type. (C) Bar
plot showing sample/patient representation (Y-axis) in major cell types (X-axis). (D) Bar plot of
scaled ssGSEA scores and scatter plot of module scores of mono/mac cells from those with
relapse and those with CCR show that M1 markers are significantly more enriched in those with
CCR (p<0.001) and M2 markers are more enriched in those with relapse (p<0.05). (E) Bar plot of
significantly different pathways in T-cell 2 cluster (relapsed-enriched) compared to T-cell 1 cluster.
References
1. G. Egan, Y. Chopra, S. Mourad, K. Y. Chiang, J. Hitzler, Treatment of acute myeloid leukemia in
children: A practical perspective. Pediatr Blood Cancer 68, e28979 (2021).
2. J. Chen, C. L. Glasser, New and Emerging Targeted Therapies for Pediatric Acute Myeloid
Leukemia (AML). Children (Basel) 7, (2020).
3. H. Bolouri, J. E. Farrar, T. Triche, Jr., R. E. Ries, E. L. Lim, T. A. Alonzo, Y. Ma, R. Moore, A. J.
Mungall, M. A. Marra, J. Zhang, X. Ma, Y. Liu, Y. Liu, J. M. G. Auvil, T. M. Davidsen, P. Gesuwan, L.
C. Hermida, B. Salhia, S. Capone, G. Ramsingh, C. M. Zwaan, S. Noort, S. R. Piccolo, E. A. Kolb, A.
S. Gamis, M. A. Smith, D. S. Gerhard, S. Meshinchi, The molecular landscape of pediatric acute
myeloid leukemia reveals recurrent structural alterations and age-specific mutational
interactions. Nat Med 24, 103-112 (2018).
4. E. Becht, L. McInnes, J. Healy, C. A. Dutertre, I. W. H. Kwok, L. G. Ng, F. Ginhoux, E. W. Newell,
Dimensionality reduction for visualizing single-cell data using UMAP. Nat Biotechnol, (2018).
5. I. Khatri, M. K. Bhasin, A transcriptomics-based meta-analysis combined with machine learning
identifies a secretory biomarker panel for diagnosis of pancreatic adenocarcinoma. Frontiers in
genetics 11, (2020).
6. M. K. Bhasin, K. Ndebele, O. Bucur, E. U. Yee, H. H. Otu, J. Plati, A. Bullock, X. Gu, E. Castan, P.
Zhang, Meta-analysis of transcriptome data identifies a novel 5-gene pancreatic
adenocarcinoma classifier. Oncotarget 7, 23263 (2016).
7. M. Wang, J. Guo, L. Zhang, V. Kuek, J. Xu, J. Zou, Molecular structure, expression, and functional
role of Clec11a in skeletal biology and cancers. J Cell Physiol 235, 6357-6365 (2020).
8. G. Al-Khadairi, A. Naik, R. Thomas, B. Al-Sulaiti, S. Rizly, J. Decock, PRAME promotes epithelial-
to-mesenchymal transition in triple negative breast cancer. J Transl Med 17, 9 (2019).
9. J. Dunne, C. Cullmann, M. Ritter, N. M. Soria, B. Drescher, S. Debernardi, S. Skoulakis, O.
Hartmann, M. Krause, J. Krauter, A. Neubauer, B. D. Young, O. Heidenreich, siRNA-mediated
AML1/MTG8 depletion affects differentiation and proliferation-associated gene expression in
t(8;21)-positive cell lines and primary AML blasts. Oncogene 25, 6067-6078 (2006).
10. P. Periasamy, V. Tran, H. C. O'Neill, Identification of genes which regulate stroma-dependent in
vitro hematopoiesis. PLoS One 13, e0205583 (2018).
11. M. T. Epping, L. Wang, M. J. Edel, L. Carlee, M. Hernandez, R. Bernards, The human tumor
antigen PRAME is a dominant repressor of retinoic acid receptor signaling. Cell 122, 835-847
(2005).
12. Y. Xu, R. Zou, J. Wang, Z. W. Wang, X. Zhu, The role of the cancer testis antigen PRAME in
tumorigenesis and immunotherapy in human cancer. Cell Prolif 53, e12770 (2020).
13. D. Szklarczyk, A. L. Gable, D. Lyon, A. Junge, S. Wyder, J. Huerta-Cepas, M. Simonovic, N. T.
Doncheva, J. H. Morris, P. Bork, L. J. Jensen, C. V. Mering, STRING v11: protein-protein
association networks with increased coverage, supporting functional discovery in genome-wide
experimental datasets. Nucleic Acids Res 47, D607-D613 (2019).
14. D. J. Theisen, J. T. t. Davidson, C. G. Briseno, M. Gargaro, E. J. Lauron, Q. Wang, P. Desai, V.
Durai, P. Bagadia, J. R. Brickner, W. L. Beatty, H. W. Virgin, W. E. Gillanders, N. Mosammaparast,
M. S. Diamond, L. D. Sibley, W. Yokoyama, R. D. Schreiber, T. L. Murphy, K. M. Murphy, WDFY4 is
required for cross-presentation in response to viral and tumor antigens. Science 362, 694-699
(2018).
15. C. Trapnell, D. Cacchiarelli, J. Grimsby, P. Pokharel, S. Li, M. Morse, N. J. Lennon, K. J. Livak, T. S.
Mikkelsen, J. L. Rinn, The dynamics and regulators of cell fate decisions are revealed by
pseudotemporal ordering of single cells. Nat Biotechnol 32, 381-386 (2014).
16. A. Subramanian, P. Tamayo, V. K. Mootha, S. Mukherjee, B. L. Ebert, M. A. Gillette, A. Paulovich,
S. L. Pomeroy, T. R. Golub, E. S. Lander, J. P. Mesirov, Gene set enrichment analysis: a
knowledge-based approach for interpreting genome-wide expression profiles. Proc Natl Acad Sci
U S A 102, 15545-15550 (2005).
17. V. K. Mootha, C. M. Lindgren, K. F. Eriksson, A. Subramanian, S. Sihag, J. Lehar, P. Puigserver, E.
Carlsson, M. Ridderstrale, E. Laurila, N. Houstis, M. J. Daly, N. Patterson, J. P. Mesirov, T. R.
Golub, P. Tamayo, B. Spiegelman, E. S. Lander, J. N. Hirschhorn, D. Altshuler, L. C. Groop, PGC-
1alpha-responsive genes involved in oxidative phosphorylation are coordinately downregulated
in human diabetes. Nat Genet 34, 267-273 (2003).
18. Y. Mita, M. Y. Kimura, K. Hayashizaki, R. Koyama-Nasu, T. Ito, S. Motohashi, Y. Okamoto, T.
Nakayama, Crucial role of CD69 in anti-tumor immunity through regulating the exhaustion of
tumor-infiltrating T cells. Int Immunol 30, 559-567 (2018).
19. W. H. McBride, K. S. Iwamoto, R. Syljuasen, M. Pervan, F. Pajonk, The role of the
ubiquitin/proteasome system in cellular responses to radiation. Oncogene 22, 5755-5773
(2003).
20. O. M. Seternes, A. M. Kidger, S. M. Keyse, Dual-specificity MAP kinase phosphatases in health
and disease. Biochim Biophys Acta Mol Cell Res 1866, 124-143 (2019).
21. X. Xu, X. Xiong, Y. Sun, The role of ribosomal proteins in the regulation of cell proliferation,
tumorigenesis, and genomic integrity. Sci China Life Sci 59, 656-672 (2016).
22. S. Chen, S. Bonifati, Z. Qin, C. St Gelais, K. M. Kodigepalli, B. S. Barrett, S. H. Kim, J. M. Antonucci,
K. J. Ladner, O. Buzovetsky, K. M. Knecht, Y. Xiong, J. S. Yount, D. C. Guttridge, M. L. Santiago, L.
Wu, SAMHD1 suppresses innate immune responses to viral infections and inflammatory stimuli
by inhibiting the NF-kappaB and interferon pathways. Proc Natl Acad Sci U S A 115, E3798-E3807
(2018).
23. A. Lonetti, A. Pession, R. Masetti, Targeted Therapies for Pediatric AML: Gaps and Perspective.
Front Pediatr 7, 463 (2019).
24. D. Steinbach, A. Schramm, A. Eggert, M. Onda, K. Dawczynski, A. Rump, I. Pastan, S. Wittig, N.
Pfaffendorf, A. Voigt, F. Zintl, B. Gruhn, Identification of a set of seven genes for the monitoring
of minimal residual disease in pediatric acute myeloid leukemia. Clin Cancer Res 12, 2434-2441
(2006).
25. M. S. Ong, S. Deng, C. E. Halim, W. Cai, T. Z. Tan, R. Y. Huang, G. Sethi, S. C. Hooi, A. P. Kumar, C.
T. Yap, Cytoskeletal Proteins in Cancer and Intracellular Stress: A Therapeutic Perspective.
Cancers (Basel) 12, (2020).
26. H. Wurzer, C. Hoffmann, A. Al Absi, C. Thomas, Actin Cytoskeleton Straddling the Immunological
Synapse between Cytotoxic Lymphocytes and Cancer Cells. Cells 8, (2019).
27. D. Bates, A. Eastman, Microtubule destabilising agents: far more than just antimitotic anticancer
drugs. Br J Clin Pharmacol 83, 255-268 (2017).
28. J. Baudier, Z. A. Jenkins, S. P. Robertson, The filamin-B-refilin axis - spatiotemporal regulators of
the actin-cytoskeleton in development and disease. J Cell Sci 131, (2018).
29. K. Yoshioka, A. Oda, C. Notsu, T. Ohtsuka, Y. Kawai, S. Suzuki, T. Nakamura, Y. Mabuchi, Y.
Matsuzaki, R. Goitsuka, Loss of the Homeodomain Transcription Factor Prep1 Perturbs Adult
Hematopoiesis in the Bone Marrow. PLoS One 10, e0136107 (2015).
30. M. Risolino, N. Mandia, F. Iavarone, L. Dardaei, E. Longobardi, S. Fernandez, F. Talotta, F.
Bianchi, F. Pisati, L. Spaggiari, P. N. Harter, M. Mittelbronn, D. Schulte, M. Incoronato, P. P. Di
Fiore, F. Blasi, P. Verde, Transcription factor PREP1 induces EMT and metastasis by controlling
the TGF-beta-SMAD3 pathway in non-small cell lung adenocarcinoma. Proc Natl Acad Sci U S A
111, E3775-3784 (2014).
31. O. Gay, B. Gilquin, F. Nakamura, Z. A. Jenkins, R. McCartney, D. Krakow, A. Deshiere, N. Assard, J.
H. Hartwig, S. P. Robertson, J. Baudier, RefilinB (FAM101B) targets filamin A to organize
perinuclear actin networks and regulates nuclear shape. Proc Natl Acad Sci U S A 108, 11464-
11469 (2011).
32. S. S. Ithychanda, D. Hsu, H. Li, L. Yan, D. D. Liu, M. Das, E. F. Plow, J. Qin, Identification and
characterization of multiple similar ligand-binding repeats in filamin: implication on filamin-
mediated receptor clustering and cross-talk. J Biol Chem 284, 35113-35121 (2009).
33. Z. Wei, H. Xu, Y. Zhang, X. Yi, X. Yang, Y. Chen, N. Mao, S. Li, D. Xu, S. Li, H. Zhang, D. Li, G. Zhang,
B. Zhang, F. Jin, X. Gao, W. Cai, L. Zhang, R. Wang, F. Yang, Rho GDP dissociation inhibitor alpha
silencing attenuates silicosis by inhibiting RhoA/Rho kinase signalling. Exp Cell Res 380, 131-140
(2019).
34. J. Penarando, L. M. Lopez-Sanchez, R. Mena, S. Guil-Luna, F. Conde, V. Hernandez, M. Toledano,
V. Gudino, M. Raponi, C. Billard, C. Villar, C. Diaz, J. Gomez-Barbadillo, J. De la Haba-Rodriguez,
K. Myant, E. Aranda, A. Rodriguez-Ariza, A role for endothelial nitric oxide synthase in intestinal
stem cell proliferation and mesenchymal colorectal cancer. BMC Biol 16, 3 (2018).
35. X. Li, Y. Dai, B. Chen, J. Huang, S. Chen, L. Jiang, Clinical significance of
CD34(+)CD117(dim)/CD34(+)CD117(bri) myeloblast-associated gene expression in t(8;21) acute
myeloid leukemia. Front Med, (2021).
36. J. L. Quintanar, I. Guzman-Soto, Hypothalamic neurohormones and immune responses. Front
Integr Neurosci 7, 56 (2013).
37. H. Itonaga, D. Imanishi, Y. F. Wong, S. Sato, K. Ando, Y. Sawayama, D. Sasaki, K. Tsuruda, H.
Hasegawa, Y. Imaizumi, J. Taguchi, H. Tsushima, S. Yoshida, T. Fukushima, T. Hata, Y. Moriuchi, K.
Yanagihara, Y. Miyazaki, Expression of myeloperoxidase in acute myeloid leukemia blasts
mirrors the distinct DNA methylation pattern involving the downregulation of DNA
methyltransferase DNMT3B. Leukemia 28, 1459-1466 (2014).
38. C. C. Lin, Y. C. Hsu, Y. H. Li, Y. Y. Kuo, H. A. Hou, K. H. Lan, T. C. Chen, Y. S. Tzeng, Y. Y. Kuo, C. J.
Kao, P. H. Chuang, M. H. Tseng, Y. C. Chiu, W. C. Chou, H. F. Tien, Higher HOPX expression is
associated with distinct clinical and biological features and predicts poor prognosis in de novo
acute myeloid leukemia. Haematologica 102, 1044-1053 (2017).
39. S. P. Short, C. S. Williams, Selenoproteins in Tumorigenesis and Cancer Progression. Adv Cancer
Res 136, 49-83 (2017).
40. A. H. Elsayed, R. Rafiee, X. Cao, S. Raimondi, J. R. Downing, R. Ribeiro, Y. Fan, T. A. Gruber, S.
Baker, J. Klco, J. E. Rubnitz, S. Pounds, J. K. Lamba, A six-gene leukemic stem cell score identifies
high risk pediatric acute myeloid leukemia. Leukemia 34, 735-745 (2020).
41. B. M. Stevens, C. L. Jones, D. A. Pollyea, R. Culp-Hill, A. D'Alessandro, A. Winters, A. Krug, D.
Abbott, M. Goosman, S. Pei, H. Ye, A. E. Gillen, M. W. Becker, M. R. Savona, C. Smith, C. T.
Jordan, Fatty acid metabolism underlies venetoclax resistance in acute myeloid leukemia stem
cells. Nat Cancer 1, 1176-1187 (2020).
42. C. P. Burns, S. P. Wei, A. A. Spector, Fatty acid metabolism in L1210 murine leukemia cells:
differences in modification of fatty acids incorporated into various lipids. Lipids 13, 666-672
(1978).
43. P. van Galen, V. Hovestadt, M. H. Wadsworth Ii, T. K. Hughes, G. K. Griffin, S. Battaglia, J. A.
Verga, J. Stephansky, T. J. Pastika, J. Lombardi Story, G. S. Pinkus, O. Pozdnyakova, I. Galinsky, R.
M. Stone, T. A. Graubert, A. K. Shalek, J. C. Aster, A. A. Lane, B. E. Bernstein, Single-Cell RNA-Seq
Reveals AML Hierarchies Relevant to Disease Progression and Immunity. Cell 176, 1265-1281
e1224 (2019).
44. R. Austin, M. J. Smyth, S. W. Lane, Harnessing the immune system in acute myeloid leukaemia.
Crit Rev Oncol Hematol 103, 62-77 (2016).

45. M. Deng, X. Gui, J. Kim, L. Xie, W. Chen, Z. Li, L. He, Y. Chen, H. Chen, W. Luo, Z. Lu, J. Xie, H.
Churchill, Y. Xu, Z. Zhou, G. Wu, C. Yu, S. John, K. Hirayasu, N. Nguyen, X. Liu, F. Huang, L. Li, H.
Deng, H. Tang, A. H. Sadek, L. Zhang, T. Huang, Y. Zou, B. Chen, H. Zhu, H. Arase, N. Xia, Y. Jiang,
R. Collins, M. J. You, J. Homsi, N. Unni, C. Lewis, G. Q. Chen, Y. X. Fu, X. C. Liao, Z. An, J. Zheng, N.
Zhang, C. C. Zhang, LILRB4 signalling in leukaemia cells mediates T cell suppression and tumour
infiltration. Nature 562, 605-609 (2018).
46. Y. Han, Y. Dong, Q. Yang, W. Xu, S. Jiang, Z. Yu, K. Yu, S. Zhang, Acute Myeloid Leukemia Cells
Express ICOS Ligand to Promote the Expansion of Regulatory T Cells. Front Immunol 9, 2227
(2018).
47. Y. S. Al-Matary, L. Botezatu, B. Opalka, J. M. Hones, R. F. Lams, A. Thivakaran, J. Schutte, R.
Koster, K. Lennartz, T. Schroeder, R. Haas, U. Duhrsen, C. Khandanpour, Acute myeloid leukemia
cells polarize macrophages towards a leukemia supporting state in a Growth factor
independence 1 dependent manner. Haematologica 101, 1216-1227 (2016).
48. A. Butler, P. Hoffman, P. Smibert, E. Papalexi, R. Satija, Integrating single-cell transcriptomic data
across different conditions, technologies, and species. Nat Biotechnol 36, 411-420 (2018).
49. I. Korsunsky, N. Millard, J. Fan, K. Slowikowski, F. Zhang, K. Wei, Y. Baglaenko, M. Brenner, P. R.
Loh, S. Raychaudhuri, Fast, sensitive and accurate integration of single-cell data with Harmony.
Nat Methods 16, 1289-1296 (2019).
50. L. J. P. v. d. Maaten, G. E. Hinton, Visualizing High-Dimensional Data Using t-SNE. Journal of
Machine Learning Research, 2579-2605 (2008).
51. M. E. Ritchie, B. Phipson, D. Wu, Y. Hu, C. W. Law, W. Shi, G. K. Smyth, limma powers differential
expression analyses for RNA-sequencing and microarray studies. Nucleic Acids Res 43, e47
(2015).
52. C. W. Law, Y. Chen, W. Shi, G. K. Smyth, voom: Precision weights unlock linear model analysis
tools for RNA-seq read counts. Genome Biol 15, R29 (2014).
53. C. W. Law, M. Alhamdoosh, S. Su, X. Dong, L. Tian, G. K. Smyth, M. E. Ritchie, RNA-seq analysis is
easy as 1-2-3 with limma, Glimma and edgeR. F1000Res 5, (2016).
54. C. Contal, J. O'Quigley, An application of changepoint methods in studying the effect of age on
survival in breast cancer. Computational Statistics & Data Analysis 30, 253-270 (1999).
55. S. Hanzelmann, R. Castelo, J. Guinney, GSVA: gene set variation analysis for microarray and RNA-
seq data. BMC Bioinformatics 14, 7 (2013).
56. X. Gao, D. Hu, M. Gogol, H. Li, ClusterMap: compare multiple single cell RNA-Seq datasets across
different experimental conditions. Bioinformatics 35, 3038-3045 (2019).
Author contributions: HSS, SIP, DD, SR, MP, RJS, SMC, DSW, CCP, DKG collected bone
marrow samples and clinical data. BET, SSB and MB designed the experiments. BET, SSB
conducted the experiments. GBU, PP, BET, DS, HM, SSB, BD, KG, MB analyzed data. GBU, PP,
BET, DS, SSB, BD, RJS, SIP, CCP, DKG interpreted results and wrote manuscript. MB
supervised the study.
Acknowledgments:
The study is supported through funding from Cure Childhood Cancer Foundation (DKG) and
Emory startup funds (MKB).

Conflict of interest statement: An invention disclosure for 7-gene AML blast signature has been submitted (MKB). MKB has equity in Canomiks Inc and on its board as chief scientific advisor. The authors (DKG, DD) hold equity in Meryx incorporated. Data availability:
ScRNASeq data will be submitted to NCBI’s Gene Expression Omnibus (GEO). An interactive data resource and analytical tool developed based on this AML single cell data is available online at https://bhasinlab.bmi.emory.edu/PediatricSC/.
Figures
Figure 1
Single cell transcriptional pro�ling identi�es three heterogenous putative AML blast cell clusters bycomparative pro�ling of paired Diagnostics (Dx) and End of Induction (EOI) bone marrow samples. A.UMAP embedding of the paired Dx and EOI samples consisting of 19,350 high quality single cellsportioned into 14 clusters. These clusters are colored based on canonical cell types gene markers (Fig.1B) that include T cell (CD3D+, IL32+), B cells (CD19+, CD79A+, MS4A1+), monocyte (CD14+),macrophages (CD68+), macrophage/monocyte (CD14+, CD68+), plasmacytoid dendritic cells-pDC
(GZMB+, IL3RA+, IRF8+), and neutrophils (CD63+). The blast cells were annotated based on expression oftop overexpressed gene. B. Dot plot showing expression of different cell type speci�c marker genes thatwere used to annotate the cell types (Red: high, Yellow: Mid, Cyan: low). C. Relative proportion of cells ofdifferent samples in each cell type cluster. Most of the blast cell clusters are made up of cells from 1-2patient samples indicating AML blast heterogeneity. On the other hand, most of the immune cell clusterscontain cells from multiple patient samples. D. Split UMAP showing the putative undifferentiated blastcells that are signi�cantly over-represented in Dx samples (Dx enriched) and reduced in the EOI samples.E. Expression of clinically validated blast cell markers (MPO and CD34) across single cell clusters.Clusters with positive expression of marker genes are lassoed. CD34 expression is highly heterogenous. F.Heatmap of selected set of 44 genes showing signi�cant overexpression (Fold Change >1.2, Adjusted Pvalue <.01) in Dx Enriched blast cells in comparison of other differentiated cell types. Relative geneexpression is shown in pseudo color, where green represents downregulation, and red representsupregulation.
Figure 2
Development of blast progenitor signature from heterogenous AML blast cells. A. Heatmap of 20 genesthat depicts signi�cant overexpression in the TARGET AML samples with high blast enrichment (>60%)as compared to low blast (<30%) and EOI samples. B. Feature plot of selected genes (CLEC11A, NREP)from 20 gene signature showing uniform overexpression in the heterogenous blast clusters. C.Representative expression pro�les and D. survival correlations of select genes (CLEC11A, NREP) showing
a progressive downregulation pattern from high blast enrichment to low blast and EOI TARGET AMLsamples. The signi�cance of the enrichment was calculated using Wilcox Rank t-test (*p-value < 0.05, **p-value < 0.01, *** p-value < 0.001). The higher expression of these CLEC11A (HR=1.9, 95% CI: 1.1-3.4,P=0.03) and NREP (HR=1.9, 95% CI: 1.2-3.1, P=0.007) is associated with poor survival. E. UMAP plotdepicting the blast cells identi�cation based on the newly identi�ed 20-gene overexpressed in blast cells(lassoed) of the longitudinal samples (DX, EOI, REL) from two patients. F. Bar plot showing fraction of celltypes in DX, EOI and Rel samples. G. Receiver operative Curve (ROC) depicting performance of SupportVector Machine (SVM) approach based 7 genes signature (CLEC11A, PRAME, AZU1, NREP, ARMH1,C1QBP, TRH) to discriminated AML blast cells from other cells. H. Survival analysis depicted that patientwith higher gene set enrichment score based on identi�ed 7 genes exhibited poorer overall survival(HR=2.3, 95% CI=1.2-4.3, P=0.0073) in the TARGET AML cohort. The low and high patient groups wereformed based on the optimal cutpoint (Supplementary table S5).
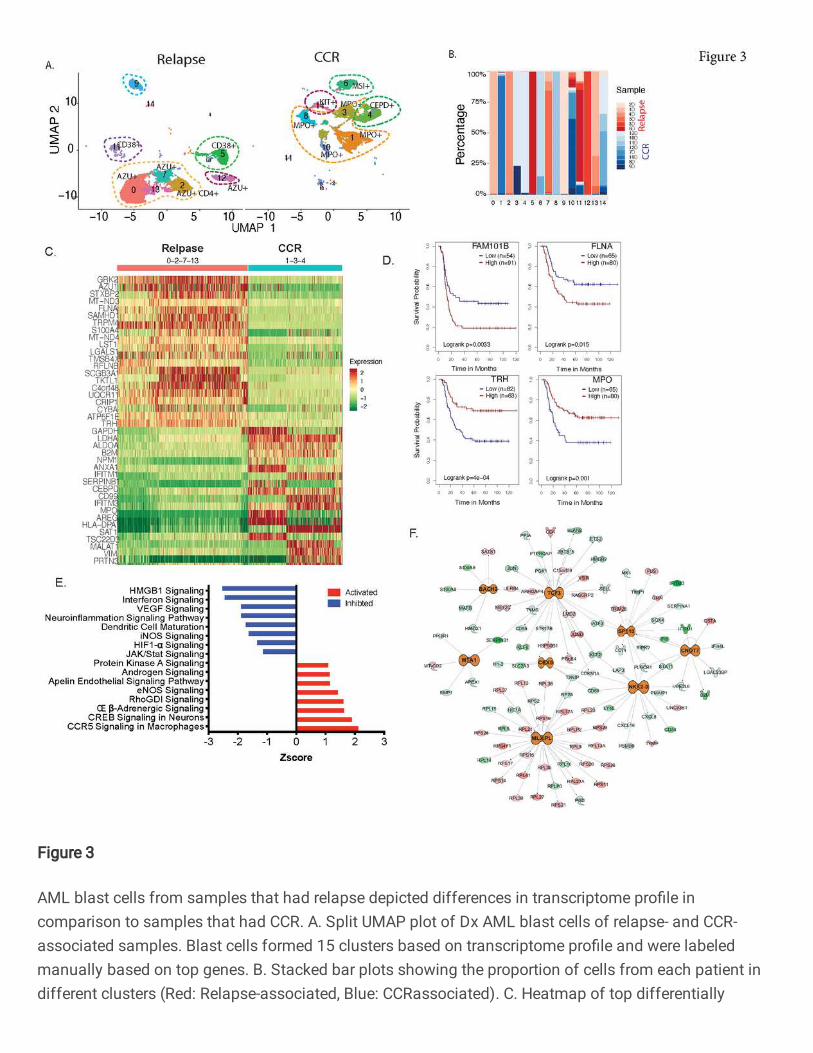
Figure 3
AML blast cells from samples that had relapse depicted differences in transcriptome pro�le incomparison to samples that had CCR. A. Split UMAP plot of Dx AML blast cells of relapse- and CCR-associated samples. Blast cells formed 15 clusters based on transcriptome pro�le and were labeledmanually based on top genes. B. Stacked bar plots showing the proportion of cells from each patient indifferent clusters (Red: Relapse-associated, Blue: CCRassociated). C. Heatmap of top differentially
expressed genes between relapse-associated (clusters 0, 2, 7, 13) and CCR-associated (clusters 1, 3, 4)samples clusters. D. Kaplan Meier plots of genes in AML blasts enriched in relapse-associated samples,such as FLNA and RFLNB/FAM101B, were associated with poorer overall survival in TARGET AMLdataset. Similar analysis on genes (MPO, TRH) with increased expression in the CCR-associated clustersdepicted signi�cantly better overall survival. E. Pathways that signi�cantly (P value <.01) activated (Zscore >1.5) /inhibited (Z score <-1.5) in samples with relapse vs. samples with CCR. F. Upstreamregulatory molecules signi�cantly activated (orange) in the relapse- vs. CCRassociated samples.
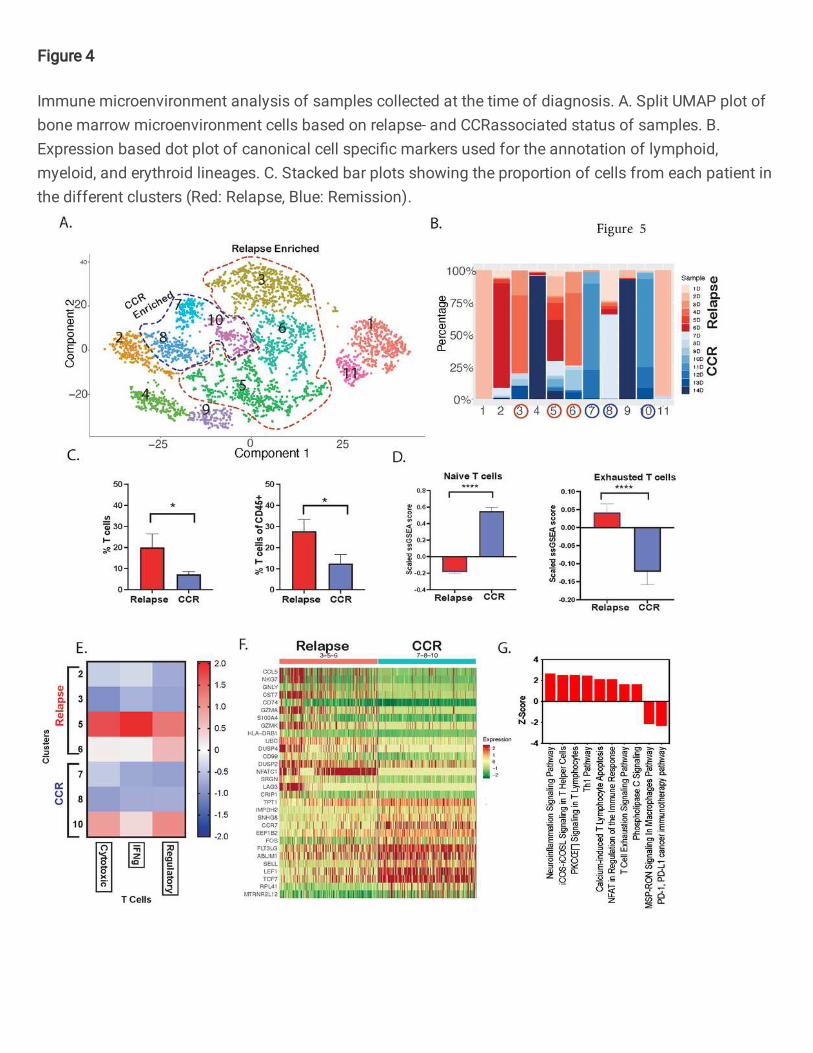
Figure 4
Immune microenvironment analysis of samples collected at the time of diagnosis. A. Split UMAP plot ofbone marrow microenvironment cells based on relapse- and CCRassociated status of samples. B.Expression based dot plot of canonical cell speci�c markers used for the annotation of lymphoid,myeloid, and erythroid lineages. C. Stacked bar plots showing the proportion of cells from each patient inthe different clusters (Red: Relapse, Blue: Remission).
Figure 5
Relapse-associated samples at diagnosis depicted enrichment of T cells with enhanced expression ofexhaustion markers. A. t-distributed Stochastic Neighbor Embedding (t-SNE) plot depicting 15 sub-clusters of T-lymphocytes. The sub-clusters were annotated based on the canonical cell type markers:Naïve T cells (CCR7+, LEF1+, TCF7+), CD4+ effector T cells (CD4+, CCR6+, CXCR6+, CCL5+), CD8+cytotoxic T cells (CD8A+, CD8B+, GZMB+, GNLY+, PRF1+) and exhausted T cells (HAVCR2+, LAG3+,PDCD1+, NFATC1+, TIGIT+, TOX+). B. Stacked bar plots showing cluster wise proportion of cells fromeach patient (Red: Relapse, Blue: CCR). C. Proportion of T cells in relapse and CCR patients. * P-value <.05D. Overall enrichment of Naïve and Exhausted T cell signatures across relapse and CCR samples basedon ssGSEA score. E. Enrichment of Cytotoxic, IFNg- and Regulatory- T cells in the CCR and relapsepredominant subclusters. **** P-value <.0001 F. Heatmap of top differentially expressed genes identi�edby comparing the CCR and relapse dominant T cell sub-clusters G. Pathways that are signi�cantlyactivated (Z-score >1.5) and inhibited (Z-score <-1.5) in the relapse T cells associated genes. Pathwaysachieved P value <.01 based on Fisher’s Exact test.
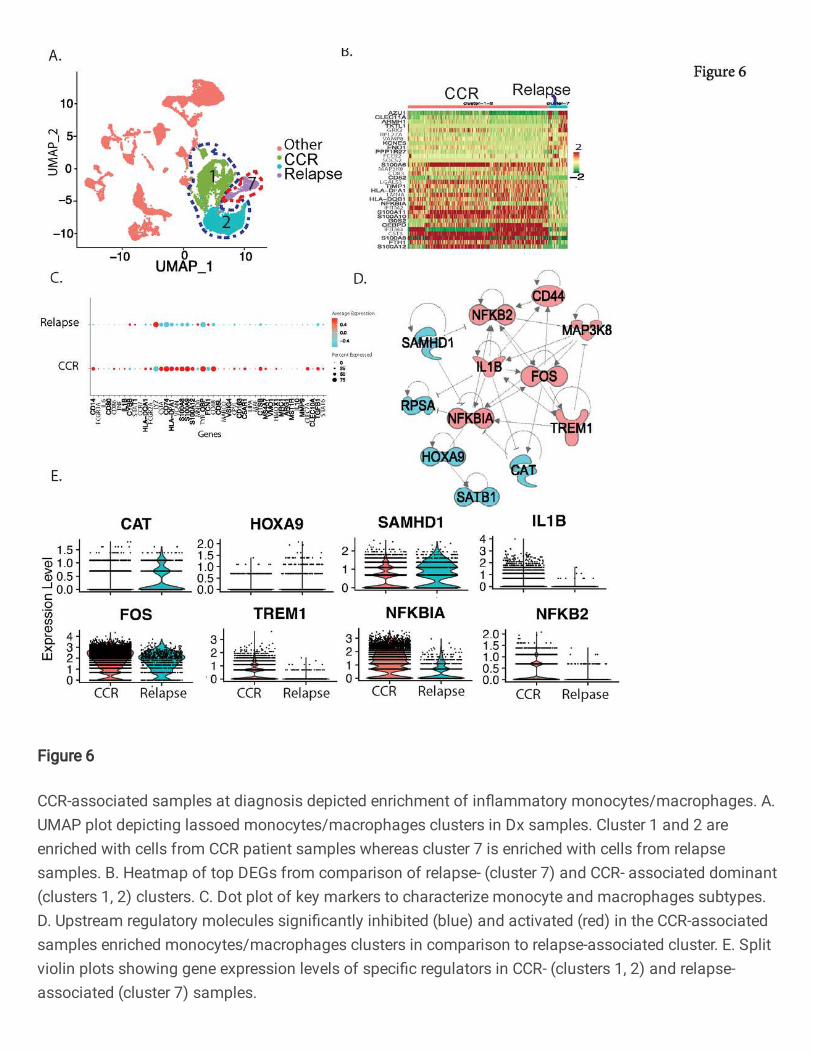
Figure 6
CCR-associated samples at diagnosis depicted enrichment of in�ammatory monocytes/macrophages. A.UMAP plot depicting lassoed monocytes/macrophages clusters in Dx samples. Cluster 1 and 2 areenriched with cells from CCR patient samples whereas cluster 7 is enriched with cells from relapsesamples. B. Heatmap of top DEGs from comparison of relapse- (cluster 7) and CCR- associated dominant(clusters 1, 2) clusters. C. Dot plot of key markers to characterize monocyte and macrophages subtypes.D. Upstream regulatory molecules signi�cantly inhibited (blue) and activated (red) in the CCR-associatedsamples enriched monocytes/macrophages clusters in comparison to relapse-associated cluster. E. Splitviolin plots showing gene expression levels of speci�c regulators in CCR- (clusters 1, 2) and relapse-associated (cluster 7) samples.

Figure 7
scRNA-Seq analysis of EOI samples identi�ed treatment resistant blast cells with distinct transcriptomelandscape. A. UMAP plot with 13 clusters based on transcriptome pro�le, showing various cell types inEOI samples. B. Bar plot of 7-genes signature identi�es clusters 6 and 9 as blast-dominant cell clusters,along with clusters 10 and 11. C. Dot plot of canonical markers used for cluster annotation. D. Heatmapof top markers that are signi�cantly differently expressed between treatment-resistant (residual at EOI)and treatment-responsive (only at Dx cells) E. Violin plots of pathways signi�cantly enriched in treatment-resistant blast cells compared to treatment-responsive. F. Regulators that are signi�cantly activated
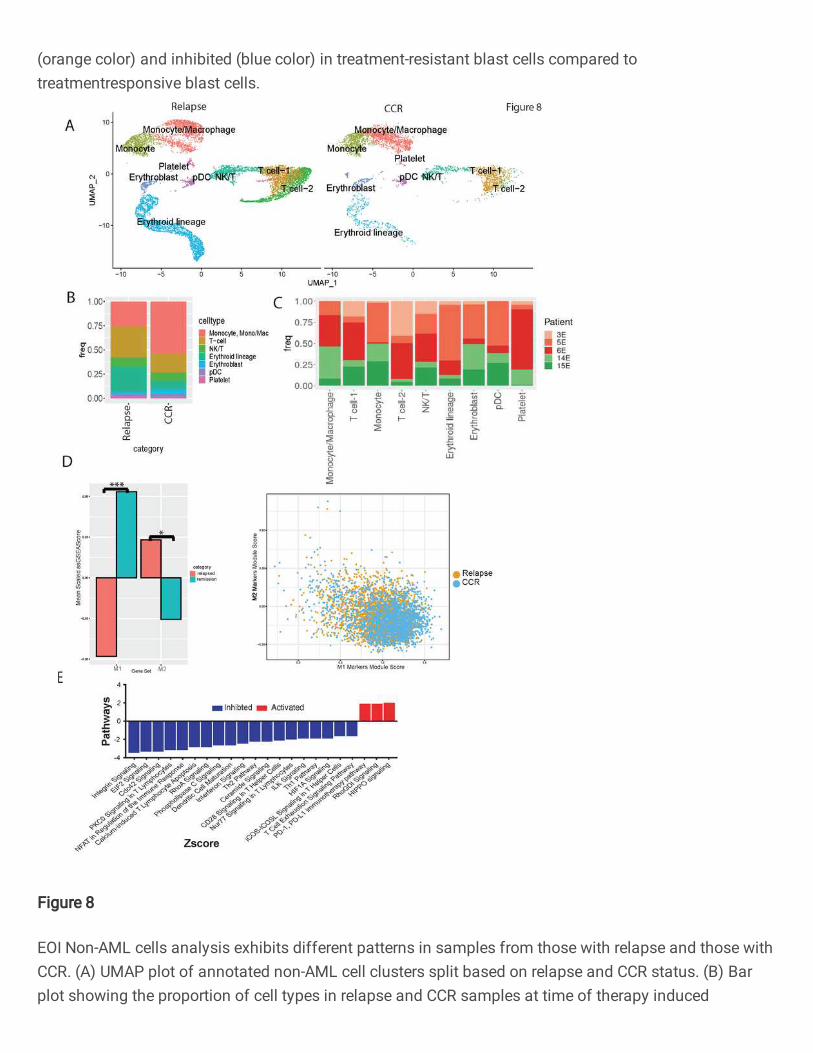
(orange color) and inhibited (blue color) in treatment-resistant blast cells compared totreatmentresponsive blast cells.
Figure 8
EOI Non-AML cells analysis exhibits different patterns in samples from those with relapse and those withCCR. (A) UMAP plot of annotated non-AML cell clusters split based on relapse and CCR status. (B) Barplot showing the proportion of cell types in relapse and CCR samples at time of therapy induced
induction. Y-axis represents fraction of each cell type. (C) Bar plot showing sample/patient representation(Y-axis) in major cell types (X-axis). (D) Bar plot of scaled ssGSEA scores and scatter plot of modulescores of mono/mac cells from those with relapse and those with CCR show that M1 markers aresigni�cantly more enriched in those with CCR (p<0.001) and M2 markers are more enriched in those withrelapse (p<0.05). (E) Bar plot of signi�cantly different pathways in T-cell 2 cluster (relapsed-enriched)compared to T-cell 1 cluster.
Supplementary Files
This is a list of supplementary �les associated with this preprint. Click to download.
SupplementaryMaterialnewReferences.pdf


