Embed Size (px)
Citation preview
PEDIATRIC MEANINGFUL ALARM MANAGEMENT APPROACH
Jessie McBride Gilmore
A project submitted to the faculty at the University of North Carolina at Chapel Hill in partial fulfillment of the requirements for the degree of Doctorate of Nursing Practice in the School of
Nursing (Health Care Systems-Informatics).
Chapel Hill 2017
Approved by:
Debbie Travers
Heidi Troxler
Jessica Zegre-Hemsey

ii
© 2017 Jessie McBride Gilmore
ALL RIGHTS RESERVED
iii
ABSTRACT
Jessie McBride Gilmore: Pediatric Meaningful Alarm Management Approach (Under the direction of Debbie Travers)
The North Carolina Children’s Hospital staff on an acute care pediatric general
medicine floor are subject to unnecessary physiological monitor alarming and are at high risk
for alarm fatigue. Pediatric clinicians are faced with the daunting task of determining
appropriate age-based vital sign parameters and often fail to order suitable vital sign parameters
or correctly program physiological monitors. This breakdown in care magnifies the importance
of implementing meaningful alarm use to reduce alarm fatigue in clinicians caring for pediatric
patients and to prevent clinically significant adverse events through early detection.
This project was a quality improvement study with the objective to improve
cardiorespiratory monitor parameter practice adherence among clinicians through education.
The first phase collected retrospective patient data to determine clinician adherence and to fully
understand the burden of alarm fatigue on an inpatient acute care unit. Clinician adherence was
measured by comparing electronic health records to physiological monitor settings and the
relevance to actual patient data. The second phase analyzed the baseline data and applied the
Institute for Healthcare Improvement’s Model for Improvement. After project completion, the
intent was to have increased alarm parameter adherence and hence decreased alarm fatigue on
the unit.
I found a significant lack of alarm parameter adherence among the nursing staff. The
alarm parameters routinely did not match the orders for each patient, and as a result, the
patients alarmed excessively or had wider alarm parameter settings than what was ordered for

iv
them. This project highlighted the need for parameter customization for every child, using the
default age groups as a guide for parameter orders. The average minimum respiratory rate value
registered lower than the default alarm settings for all age groups, which indicates a strong
association with the total number of low respiratory rate alarms.
The intervention implemented in this project included strong emphasis on staff
education for nurses and physicians. Also included were recommendations for policy and
practice changes of physiologic monitoring, which remain in process and are expected to
continue longer than the timeline of this project.

v
ACKNOWLEDGMENTS
First, I would like to express my sincere gratitude to my chair and advisor, Dr. Debbie
Travers for the continuous support of my Doctorate of Nursing Practice (DNP) study and project,
her immeasurable knowledge, guidance, and overwhelming kindness. She is the reason my DNP
project has been successful. Next I would like to acknowledge the rest of my committee
members, Dr. Jessica Zegre-Hemsey and Heidi Troxler, for their direction and expertise in
getting my DNP project off the ground.
I would also like to convey my appreciation to Dr. Celeste Mayer, the Patient Safety
Officer for the University of North Carolina Health Care. Her wisdom and continued assistance
allowed me to make substantial changes for my project intervention. Lastly, I wish to thank
Janey Barnes, PhD and Jennifer Mauney, MA, User-View, Inc. for custom data analysis tools
provided during the organization’s larger focus on improving alarm safety in the Intermediate
and Intensive Care Units.
vi
TABLE OF CONTENTS
LIST OF TABLES ......................................................................................................................... ix
LIST OF FIGURES ........................................................................................................................ x
LIST OF ABBREVIATIONS ........................................................................................................ xi
CHAPTER 1: BACKGROUND ..................................................................................................... 1
Introduction ................................................................................................................................. 1
Problem.................................................................................................................................... 2
Preliminary Data ...................................................................................................................... 3
Purpose Statement ................................................................................................................... 3
Review of Literature .................................................................................................................... 3
Search Strategy ........................................................................................................................ 3
Evidence-Alarm Fatigue .......................................................................................................... 4
Hospital Policy Implications ................................................................................................... 5
Interventions to Optimize Alarm Use ...................................................................................... 9
Technology Solutions to Alarm Fatigue ................................................................................ 10
Theoretical Framework ............................................................................................................. 11
Classical Conditioning Theory .............................................................................................. 12
AACN Synergy Model for Patient Care ................................................................................ 13
Theoretical Framework Conclusion ...................................................................................... 14
Gaps in Literature ...................................................................................................................... 14
CHAPTER 2: PROJECT METHODS AND INTERVENTION .................................................. 15
vii
Project Design ........................................................................................................................... 15
Setting and Subjects .................................................................................................................. 16
Methods ..................................................................................................................................... 16
Phase One: Baseline Data Collection .................................................................................... 16
Phase Two: Interventions ...................................................................................................... 17
Monitoring Practices and Policies: Baseline ......................................................................... 17
Tools .......................................................................................................................................... 18
Phase One: Baseline Data Collection Plan ................................................................................ 19
Phase Two: Interventions .......................................................................................................... 21
CHAPTER 3: RESULTS .............................................................................................................. 23
Phase One: Collection of Alarm Parameter Adherence Data ................................................... 23
Demographics ............................................................................................................................ 23
Alarm Parameter Results ........................................................................................................... 26
Yellow Alarms....................................................................................................................... 27
Red Alarms ............................................................................................................................ 28
Inoperable Alarms ................................................................................................................. 30
Vital Signs Results .................................................................................................................... 30
Phase Two: Development and Deployment of Alarm Parameter Adherence Educational Intervention .............................................................................. 32 The Synergy Model for Patient Care and Alarm Fatigue ...................................................... 34
CHAPTER 4: DISCUSSION ........................................................................................................ 35
CHAPTER 5: LIMITATIONS ..................................................................................................... 38
CHAPTER 6: CONCLUSION ..................................................................................................... 39
viii
APPENDIX A: PRISMA 2009 FLOW DIAGRAM OF LITERATURE SEARCH .................... 40
APPENDIX B: EXPECTED ALARM PARAMETER NURSING WORKFLOW..................... 41
APPENDIX C: EHR AND PHYSIOLOGICAL MONITOR DEFAULT ALARM PARAMETERS ............................................................................... 42 APPENDIX D: PROJECT DATA COLLECTION TOOL TEMPLATE .................................... 43
APPENDIX E: 6CH DEMOGRAPHIC REPORT ....................................................................... 44
APPENDIX F: PHASE 2 ANALYSIS PLAN FLOW CHART ................................................... 45
APPENDIX G: YELLOW ALARM BREAKDOWN ................................................................. 46
APPENDIX H: RED ALARM DATA BY AGE GROUPS ......................................................... 47
APPENDIX I: EDUCATION SENT TO STAFF BY EMAIL AND ON WEBSITE .................. 48
APPENDIX J: EDUCATIONAL POSTER.................................................................................. 49
APPENDIX K: COMPUTER REMINDER CARD ..................................................................... 50
APPENDIX L: INSERVICE TRAINING GUIDE....................................................................... 51
REFERENCES ............................................................................................................................. 52

ix
LIST OF TABLES
Table 1 – Customization percentage ..............................................................................................27
Table 2 - Comparison of red alarm generation between all patients and patients with customized orders ..................................................................................29
Table 3 - Total number of inoperable alarms by age group and type of alarm ..............................30
x
LIST OF FIGURES
Figure 1 - Age distribution within the 6 age groups ......................................................................24
Figure 2 - Average weight for each age group ..............................................................................24
Figure 3 - Diagnoses representation for project sample. ...............................................................25
Figure 4 - Total number of patients per medical team displayed as separate age groups and as a total ......................................................................................25 Figure 5 - Percentage of patients with matching EHR orders and physiological monitor settings for heart rate, respiratory rate, and pulse oximetry .................................26 Figure 6 - Percentage of patients with customized orders .............................................................27
Figure 7 - Total number of yellow alarms .....................................................................................28
Figure 8 - Total number of red alarms per alarm category ............................................................29
Figure 9 - Compilation of the average minimum and maximum vital sign compared to the default EHR order for each age group ....................................................31
xi
LIST OF ABBREVIATIONS
6CH 6 Children’s
AACN American Association of Critical Care Nursing
CCT Classical Conditioning Theory
CSE Clinically Significant Events
DNP Doctorate of Nursing Practice
ECRI Emergency Care Research Institute
FDA Food Drug Administration
HR Heart Rate
IHI Institute for Healthcare Improvement
NA Nursing Assistant
NC North Carolina
PDSA Plan Do Study Act (Cycle)
PMA Pediatric Medical Team A
PMB Pediatric Medical Team B
PMG Pediatric Medical Team Gastroenterology
RN Registered Nurse
RR Respiratory Rate
SMPC Synergy Model for Patient Care
SpO2 Pulse Oximetry
TJC The Joint Commission
UNCH University of North Carolina Healthcare
1
CHAPTER 1: BACKGROUND
Introduction
The number of alarm-equipped medical devices used to assist patient care is rising with
technological advances, contributing to an exponential growth of alarm systems. Alarms help
improve patient safety by serving as early warnings for clinicians. However, with frequent
alarms, clinicians are overwhelmed by noise stimuli, which contribute to desensitization to
alarms, known as alarm fatigue (West, Abbott, & Probst, 2014). Alarm fatigue tempts clinicians
to turn down alarm volumes, widen parameter settings, or shut off alarms entirely; this can lead
to delayed responses in care and increased risk for poor patient outcomes (The Joint Commission
[TJC], 2013a). The Joint Commission (TJC) reports that 98 of almost 4,000 reported sentinel
events occurring between 2009 and 2012 were related to alarm fatigue, with 80 of these events
ending in death and deemed avoidable if proper policies and procedures were in place (TJC,
2013a; TJC, 2016). Other poor patient outcomes stemming from alarm fatigue include permanent
loss of patient function, unexpected additional care of condition caused by a missed alarm, and
extended care with longer length of stay (TJC, 2013a). These poor patient outcomes create strong
financial burdens for hospital reimbursement and patient health care payments (TJC, 2013a).
Although alarm fatigue is considered a low volume problem, it poses high risks for patients and
clinicians and remains a tough problem to manage in the health care setting. Alarm fatigue also
influences patient satisfaction measures when it affects patient sleep and anxiety, as well as that
of family members or significant others accompanying the patient.
2
Problem
Approximately 95% of physiological alarms in pediatric patients are false positive alarms
and are classified as non-actionable, or not requiring intervention (Dandoy et al., 2014). Prior to
discussing the alarm fatigue problem, it is important to classify the four possible outcomes
related to physiological alarms. They include true positive alarms, true negative alarms, false
positive alarms, and false negative alarms. True positive alarms are alarms that signal attention
and complement clinical signs or symptoms. The goal of alarm-equipped devices is to alert
caretakers of patient deterioration, which is reflected with true positive alarms. True negative
alarms indicate no alarms present and no patient clinical signs or symptoms. False positive
alarms are represented by alarms that do not have matching clinical signs or symptoms. False
positive alarms cause caretakers to spend unnecessary time addressing alarms and contribute to
alarm fatigue. False negative alarms are when no alarm signals and the patient has clinical signs
or symptoms—which causes missed patient outcomes and potential sentinel events.
The staff of 6 Children’s (6CH), an acute care pediatric, general medicine floor within the
North Carolina (NC) Children’s Hospital, are subject to unnecessary physiological monitor
alarming and are at high risk for alarm fatigue. Six Children’s was the setting for this project. In
pediatrics, the range of developmental stages and vital sign parameters combined with young
patients actively in motion contribute to excessive alarming. Pediatric clinicians are faced with
the daunting task of determining appropriate age-based parameters and often fail to order
suitable vital sign parameters or correctly program physiological monitors. This breakdown in
care magnifies the importance of implementing meaningful alarm use to reduce alarm fatigue in
clinicians caring for pediatric patients and to prevent clinically significant adverse events through
early detection.
3
Will a data-driven alarm management intervention lead to improved meaningful alarm
use among clinicians caring for hospitalized acute care pediatric patients? A localized quality
improvement study discovered that when they implemented standardized team-collaborative
alarm management on a pediatric acute care in-patient floor, adherence with meaningful alarm
use increased (Dandoy et al., 2014). This can lead to a reduction in alarm fatigue and risk for
poor patient outcomes (Dandoy et al., 2014).
Preliminary Data
Previous work performed by a University of North Carolina School of Nursing honors
student collected alarm frequency data on all audible alarms in regards to heart rate, respiratory
rate, and pulse oximetry. The honors student identified that approximately 5 alarms are signaled
per nurse per hour on 6CH, indicating a strong alarm presence and need for practice reformation
(Fry, 2015).
Purpose Statement
The purpose of this project is to develop a standardized, team-collaborative alarm
management intervention aimed at reducing alarm fatigue, caused by false-positive physiological
alarms stemming from incorrect alarm parameter use among clinicians on a pediatric acute care
unit.
Review of Literature
A review of literature was conducted to describe the state of science on alarm fatigue and
meaningful alarm management.
Search Strategy
The literature search was done using three databases: PubMed, CINAHL, and Embase.
The mesh terms used for the search included: alarm fatigue OR alarm desensitization OR
4
cardiopulmonary monitor* OR clinical alarm* OR monitor alarm* OR alarm management OR
alarm safety. Included articles discussed cardiopulmonary alarms, adult and pediatric patients,
in-patient hospitalizations for acute and critical care, and involved nursing staff or other health
care related fields. Exclusion criteria included articles greater than 10 years old, non-
cardiopulmonary alarms such as ventilator, bed, and intravenous pump alarms, non-English
language, no discussion of alarm fatigue or desensitization, and any studies involving the
emergency room or operating room. The literature search resulted in a total of 286 articles with
40 being full-text accessible. After applying the exclusion criteria, 18 articles were used to
conduct the review of literature. The PRISMA 2009 Flow Diagram was used to summarize the
literature search and is illustrated in Appendix A.
Evidence-Alarm Fatigue
TJC reports that 85% to 99% of alarms are false positives and do not require attention or
intervention (TJC, 2013a). The most common causes of false alarms are the use of default
parameter settings; lack of patient population customization; and improper electrode placement,
maintenance, and skin preparation (American Association of Critical-Care Nurses [AACN],
2013; TJC, 2013a). One study examined the rate of clinically significant events (CSE) and false
alarms on a 20 bed Pediatric Intensive Care Unit during a 45-day time span (Talley et al., 2011).
They identified a total of 2,245 high priority alarms with only 68 (3%) of these alarms deemed
clinically significant and required interventions (Talley et al., 2011). The study results illustrate
the challenge of inpatient monitoring and emphasize the importance of the clinical judgement
that clinicians must use to properly identify the few life-saving alarms among an abundance of
false alarms.
In 2010, alarm fatigue was brought to public attention when a patient died as a result of a
5
physiological alarm being turned off at Massachusetts General Hospital (Cvach, 2012). Federal
reports indicated that nursing staff were subjected to constant beepingcausing alarm
desensitization, which contributed to the patient’s fatal outcome (Cvach, 2012).
Hospital Policy Implications
Alarm fatigue impacts every hospital-based clinician that utilizes or is exposed to alarm-
equipped devices, which led TJC to develop NPSG.06.01.01, a National Patient Safety Goal for
2014 focused on alarm fatigue prevention (TJC, 2013a). The purpose of this initiative was to
decrease wide-spread desensitization and potential for patient safety threats (TJC, 2013a). TJC
states that even though there is not a universal solution, to meet accreditation criteria, it is
requiring hospitals to internally develop policies to promote standardization and alarm
management customization for patients (TJC, 2013b).
The first phase of NPSG.06.01.01, initiated in January 2014 requires all hospitals to
identify alarm safety as a priority and categorize significant alarms based on feedback from staff,
patient risk if alarm is ignored, comparison between essential and nonessential alarms, alarm-
related incident history, and evidence based practices (TJC, 2013b). The second phase launched
in January 2016 and required hospitals to develop and implement policies and procedures that
address appropriate settings for certain patient populations, alarm signal disabling, changing
parameters, authority for alarm signal ordering and manipulation, monitoring and responding to
signal expectations, tailoring alarms to the individual patient, and discontinuation of monitoring
devices (TJC, 2013b). This phase also required hospitals to develop a clear strategy for alarm
management education for initial and ongoing education needs for all hospital employees caring
for patients (TJC, 2013b).
6
In response to TJC’s call for policy action and to develop methods in reducing alarm
fatigue, the patient safety officer at UNCH formed an alarm safety committee comprised of
critical care representatives. After meeting with the patient safety officer and attending a
committee meeting it was evident that the hospital’s primary focus is on the critical care setting.
Currently there are no plans for interventions in acute care, or more specifically acute pediatric
care.
Causes of Alarm Fatigue
The root cause of alarm fatigue is the excessive false-positive alarms generated by
physiological monitoring. Even though false-positive alarms are a multi-faceted problem,
research narrows to two main causes: inefficient alarm parameter settings and configuration and
equipment malfunction.
The Emergency Care Research Institute (ECRI) identified inadequate alarm configuration
policies and practices as the number one health technology hazard of 2015 (Emergency Care
Research Institute [ECRI], 2014). As a result, they compiled evidence on causes of alarm fatigue
and recommendations focusing on creating or reassessing policy for alarm configuration
practices (ECRI, 2014). Alarm configuration practices include using default alarm parameter and
volume settings and using the correct process to change alarm parameter settings (ECRI, 2014).
The standard process to change alarm parameter settings addresses who has the authority, what
circumstances, how to change settings, reactivation of default settings, and intermittent audits of
configuration settings (ECRI, 2014).
There is strong evidence that the primary cause of excess alarms in children are related to
incorrect alarm parameter settings (Bonafide et al., 2013; Burgess, Herdman, Berg, Feaster, &
Hebsur, 2009; Talley et al., 2011). One team of pediatric physicians concluded that 40% of
7
respiratory rate and 54% of heart rate observations fell outside textbook reference ranges for
pediatrics, which influenced the need to develop evidence-based vital sign ranges for children
(Bonafide et al., 2013). A major challenge in alarm management is delineating who has the
responsibility for changing alarm parameter settings, which indicates a need to identify who has
the authority, circumstances, knowledge and training to change settings, and reactivation of
default settings (Cvach, 2012; ECRI, 2014). Many organizations do not assign the alarm
parameter configuration responsibility to a specific profession or designee. Also, there are not
practice standards to dictate alarm management, leaving a gray area open for interpretation,
which creates poor communication and alarm management. Routine nursing practices focused on
continuous physiological monitors include checking alarm parameters and volumes at the
beginning of the shift to ensure proper patient safety, but many nurses do not complete this task.
One study observed only 61% of nurses properly checking alarm parameter orders and setup,
citing this as a low priority focus for nurses at the beginning of a shift (Gazarian, 2013).
Performing intermittent audits of configuration settings can promote accountability and increase
parameter adherence (ECRI, 2014). Developing specific protocols for alarm configuration
creates a standardized approach to managing alarm systems. These protocols define appropriate
parameters for each patient and allow caregivers to identify inappropriate alarms quickly, which
can lead to efficient, patient-centered care and reduce noise stimulation that caregivers are
exposed to (ECRI, 2014). Though specific protocols for alarm configuration contribute to patient
customization and reduction in noise stimulation, other technological nursing interventions must
be considered to address the problem of alarm fatigue related to frequent false alarms.
Another cause of false positive alarms is because of equipment malfunction or user error
(AACN, 2013). Designing equipment-related interventions is predicted to reduce false positive
8
alarm activity (AACN, 2013). Drew et al. (2014) determined that 89% of all false positives
alarms are attributed to inappropriate user settings, lack of regard to patient condition, and
equipment deficiencies. Balancing sensitivity and specificity based on the signal detection theory
can promote more ergonomic physiological alarms (Raymer, Bergstrom, & Nyce, 2013). Alarm
sensitivity is the ability of the monitoring system to detect abnormal events and has threshold
settings used to identify these events (Raymer, Bergstrom, & Nyce, 2013). The alarm specificity
of the monitoring systems ensures that no inaccurate alarms are set off and utilizes customized
delay settings that prevent nuisance alerts (Raymer, Bergstrom, & Nyce, 2013). Biomedical
technology professionals suggest policies consider customizing delay and threshold settings for
pulse oximetry, allowing sensors to self-correct when a patient is in motion and decrease the
sensitivity to prevent quick-firing alarms—a problem often seen in pediatric patients (AACN,
2013; Hu et al., 2012).
In an observational study examining alarm-related nursing interventions, 19% of all
alarms were caused by equipment failure (Gazarian, 2013). Equipment failures include dried out
electrodes, improper electrode contact with skin, or interference signals due to patient movement
or tangled wires. Proper skin preparation is critical for electrode contact, and it is recommended
that electrodes need to be assessed and changed daily or per manufacturer instructions (AACN,
2013). Pediatric patients require specific attention to proper equipment set up and maintenance
since this population is most likely to pull, tangle, or soil electrode leads and wires.
According to the literature, the major causes of alarm fatigue are attributed to incorrect
alarm parameter configuration practices across all disciplines and equipment issues related to the
balance between specificity and sensitivity, clinician error, and improper equipment use.
9
Interventions to Optimize Alarm Use
To address alarm fatigue and ensure proper alarm use, pediatric inpatient clinicians must
be presented with a standardized alarm management approach vertically by upper management
and horizontally across multiple disciplines (Cvach, 2012). Organization leadership involvement
in planning and enforcing alarm management plays a large role in success of tackling alarm
fatigue and improving patient outcomes. In response to the TJC instituting alarms as a National
Patient Safety Goal for 2014, it has been suggested that organizations focus leadership and
organizational planning for alarm management implementation (Cvach, 2012; TJC, 2013a). A
priority-setting process for technology implementation must be adopted by hospitals, instead of
buying an alarm-equipped device and tailoring the alarm management process to the device
(TJC, 2013a). The development of a reporting system that shares information regarding alarm-
related incidents, prevention strategies, and lessons learned from the experience will ensure
hospital accountability and communal knowledge (TJC, 2013a). The system would be shared
with the Association for the Advancement of Medical Instrumentation (AAMI), ECRI, Food
Drug Administration (FDA), and TJC (TJC, 2013a). Hospital leadership must also develop a
strong education program that is implemented among all staff upon initial hiring and provide
annual refresher classes to re-emphasize the alarm management intervention content (Cvach,
2012). In combination with organizational leadership, it is necessary to involve the inter-
professional team.
Using an inter-professional approach in intervention development ensures a multi-
dimensional protocol. It is recommended that hospitals form an inter-professional team to
examine alarm safety and the impact of alarm fatigue, create a process for continual optimization
of alarm system policies, review trends in alarm related events and areas of needed improvement,
10
and implement an alarm management policy (AACN, 2013; ECRI, 2014; TJC, 2013a). One
study demonstrated a reduction in false alarms by using a team-based approach (Dandoy et al.,
2014). The investigators developed an inter-professional team that created a cardiac monitor care
process focused on ordering age-appropriate parameters, daily individualized parameter settings
checks, and a method for discontinuation, which was communicated amongst team members via
a monitor log (Dandoy et al., 2014). As a result of a standardized protocol and increased
communication regarding alarm parameters, the median number of alarms decreased from 180
alarm signals a day to 40—an 80% decrease in alarms per patient per day (Dandoy et al., 2014).
Another localized, unit-driven study discovered a 43% reduction rate in alarms after
implementing an inter-professional staff retraining program, revising default settings, and
updating software (Graham & Cvach, 2010). All disciplines are affected by false alarms and
agree that it is a significant patient safety issue that is a priority to the health care team (Funk,
Clark, Bauld, Ott, & Coss, 2014). A standardized alarm management intervention that opens the
line for clear and consistent communication across the care team significantly reduces alarm
frequency and fatigue.
Technology Solutions to Alarm Fatigue
A third-party alarm notification system serves as an alternative solution to alarm fatigue.
Some hospitals choose to develop a system that removes alarms entirely from the floors and
places them in a monitoring station. These stations have traditionally been overseen by staff
members not taking care of patients. Research indicates that systems using central alarm
management data have not shown significant differences in mortality (Cvach, 2012). Technology
advancements have allowed scientists to create an electronic third-party notification system that
collects signals from devices and sends messages to the phone or pager of a clinician based on a
11
programmed escalation system (Kokani, Oakley, & Bauld, 2012). The main benefits of this
system are that it minimizes the human element of alarm manipulation and decreases clinician
exposure to alarms, which reduces alarm fatigue and increases patient safety. This technology
has the ability to utilize smart alarms, meaning the system would learn patient patterns and
operate on a feedback loop, decreasing alarm signals (Cvach, 2012). On the other hand, third-
party notification systems can create a delay in care, and the system can fail if one component
fails (Kokani, Oakley, & Bauld, 2012). There is little research to date on these types of systems,
and the FDA requires purchase approval for all hospitals since the devices are classified as Class
II risk management (Kokani, Oakley, & Bauld, 2012).
Cutting-edge technology can also improve alarm frequency with smart alarm systems that
learn from a patient’s baseline and make adjustments without human intervention and contact-
free sensors that assess a patient’s condition, shown to reduce patient influenced excess alarms
(Kokani, Oakley, & Bauld, 2012; Tahir, 2015). These new technologies are still being tested and
have not been fully studied to show high efficiency.
Theoretical Framework
Alarm fatigue is a multi-dimensional problem that requires incorporation of theories and
models to understand why it occurs and the effect it has on patient care. Ivan Pavlov’s Classical
Conditioning Theory (CCT) explains the problematic relationship between health care clinicians’
learned behavior and over-abundance of alarms generated by devices used for clinical warnings
(Braungart & Braungart, 2015). The American Association of Critical-Care Nurses (AACN)
Synergy Model for Patient Care (SMPC) framework illustrates the theory of planned intervention
to ease alarm fatigue through an alarm management approach. This theory focuses on the
relationship among patient characteristics, nurse competencies, and health care system
12
characteristics to achieve positive patient outcomes and is the driving theory for the intervention
used in this project (Walsh-Irwin & Jurgens, 2015).
Classical Conditioning Theory
Pavlov’s CCT is a behaviorist learning theory from the field of Psychology (Braungart &
Braungart, 2015). CCT explains the phenomenon of changing behavior related to simple
stimulus and response relationships (Braungart & Braungart, 2015). All living organisms start
with a naturally occurring stimulus and specific response, referred to as unconditioned stimuli
and responses (Braungart & Braungart, 2015). The theory states that when an unrelated, neutral
stimulus is introduced into the unconditioned sequence over a period of time, it promotes learned
behavior and alters the response. The resulting relationship is classified as the conditioned
stimulus and conditioned response (Braungart & Braungart, 2015).
In applying CCT to alarm fatigue, the intended relationship between clinicians and
alarms can be viewed as unconditioned, where the unconditioned stimulus is any life-threatening
patient alarm and the unconditioned response is to assess the patient and determine if their health
is at risk. Alarm desensitization develops when a neutral stimulus, such as false positive alarms
or alarms that do not have corresponding clinical symptoms, resonates excessively and the
response becomes conditioned. Clinicians learn to ignore or become less reactive to alarms,
which leads to negative patient outcomes and consequences (Braungart & Braungart, 2015).
Classical conditioning is used to explain the development of emotions such as fear and anxiety
when one is exposed to an aversive stimulus that provokes an emotional response (Braungart &
Braungart, 2015). Unnecessary alarms generate powerful workplace emotions including
increased stress, agitation, anxiety, and exhaustion, all of which contribute to alarm fatigue.
13
AACN Synergy Model for Patient Care
The SMPC is a predictive, descriptive nursing theory developed in the 1990s by the
AACN to describe nursing’s role in providing care to critically sick patients (Curley, 1998). The
model states that synergy occurs when more than one individual works towards a common goal
(Curley, 1998). More specifically, the model predicts that when patient characteristics are
accurately matched with appropriate nursing competencies, optimal patient outcomes will result
(Arashin, 2010; Curley, 1998). To understand the nurse-patient relationship, the model cites
eight patient characteristics that concern nurses and eight competencies that affect patients and
outcomes on a tiered level system. The patient characteristics include: resiliency, vulnerability,
stability, complexity, resource availability, participation in care, participation in decision
making, and predictability (Curley, 1998). The nurse competencies include: clinical judgment,
advocacy and moral agency, caring practices, collaboration, systems thinking, response to
diversity, clinical inquiry, and facilitator of learning (Curley, 1998).
Since inception, the SMPC has been clinically applied in acute and critical care. The
framework has influenced nursing management to rewrite the role of nursing and provide nurses
with measurable competencies for individual growth and development (Kaplow, 2003; Kerfoot
& Cox, 2005; Pacini, 2005). Hospitals have adopted the SMPC as their nursing conceptual
framework to provide a uniform theory of practice and policy development (Gralton & Brett,
2012; Kaplow & Reed, 2008).
The SMPC has demonstrated increased interdisciplinary communication, positive patient
outcomes, and patient and nurse satisfaction when applied to team-based interventions—a heavy
focus for this project’s intervention (Arashin, 2010; Kerfoot, Lavandero, Cox, Triola, Pacini, &
Hanson, 2006). The SMPC guides interdisciplinary teams, which enhances collaborative
14
decision-making and ability to match appropriate care to patients’ needs (Arashin, 2010). One
research group used the SMPC to examine the relationship between proper skin preparation for
electrode placement and frequency of alarms (Walsh-Irwin & Jurgens, 2015). They deduced that
when nurses practice competently by customizing patient care related to alarms, alarm frequency
and risk for poor patient outcomes are reduced (Walsh-Irwin & Jurgens, 2015).
Theoretical Framework Conclusion
The classical conditioning theory explains development of alarm fatigue in health care
clinicians as a conditioned response to excessive false positive alarms. Patient outcomes are at
stake and action must be implemented to correct learned behavior and protect patient safety. The
AACN SMPC framework demonstrates that not one characteristic or competency can be
isolated, and that everything is interconnected. Aligned patient characteristics, nurse
competencies, and health care environments ensure successful implementation of a synergized
team-based alarm management approach—the goal of this project.
Gaps in Literature
Since alarm fatigue is not widely studied in the pediatric setting, it is important for further
research to describe the problem in the pediatric population and inform pediatric-specific
interventions. Current literature only describes studies performed on pediatric intensive care
units and does not address physiological monitoring in acute pediatric care and its effect on
alarm fatigue. Also, with the lack of standardized vital signs for inpatient acute care pediatric age
groups, it is difficult to set appropriate alarm parameter guidelines.
This project intends to address these gaps in current literature. After collecting pediatric
specific alarm data and actual vital sign averages, enough evidence would exist to generate
appropriate educational material to promote the reduction of false positive alarms.
15
CHAPTER 2: PROJECT METHODS AND INTERVENTION
Project Design
This Doctorate of Nursing Practice (DNP) project was a quality improvement study with
the goal to improve physiological monitor practice adherence for pediatric patients on 6CH. The
design of this study was partitioned into two phases. In the first phase, I collected retrospective
patient data to determine clinician adherence on 6CH and fully understand the burden of alarm
fatigue on 6CH. Clinician adherence was measured by comparing orders in the EHR to settings
in the physiological monitors, and relevance to actual patient data. The second phase analyzed
baseline data and applied the Institute for Healthcare Improvement’s (IHI) Model for
Improvement (Institute for Healthcare Improvement [IHI], n.d.). The Model for Improvement
framework is a commonly used rapid cycle quality improvement strategy to achieve optimal
clinical outcomes. The purpose of using the Model for Improvement was to accelerate an alarm
parameter-centered approach that would improve the overall alarm management process among
pediatric clinicians. Within this model, the Plan-Do-Study-Act (PDSA) cycle was used, which is
a tool used to test change by creating a plan for change, testing the plan by doing, studying the
results, and then making changes to the test by acting (IHI, n.d.). The short-term goal of this
project was to increase alarm parameter adherence on 6CH, and in turn, decrease alarm fatigue
on the unit. The long-term goal was that the project’s outcome will lead to policy revision at
UNCH.
16
Setting and Subjects
The project took place on 6CH within the NC Children’s Hospital. The NC Children’s
Hospital cares for patients all over NC with a total of 150 inpatient beds and averages
approximately 6,500 inpatient admissions per year (University of North Carolina Health Care
[UNCH], 2015). Six Children’s is a 24-bed acute care unit, caring for general medicine inpatient
children ages 1 day to 18 years old. The unit employs 54 registered nurses (RN), 15 nursing
assistants (NA), and 1 health unit coordinator and operates on a four-to-one patient to RN ratio
and a twelve-to-one patient to NA ratio. Each room is a private room and includes individual
physiological monitors that patients may or may not utilize depending on their diagnosis. The
monitoring system used on 6CH is the Philips Intellivue. The physiological monitors contain
four alarm-enabled physiological alarms: heart rate, respiratory rate, pulse oximetry, and blood
pressure. Since blood pressure is only taken every 4 to 8 hours and not continuously monitored
on 6CH, it was eliminated as a measured variable for this project.
Methods
Phase One: Baseline Data Collection
Prior to data collection, the project was exempted by the UNC Internal Review Board and
accepted by the UNCH Nursing Research Council. Patients included in data collection were
between the ages of 1 day old to 18 years old, admitted to the general pediatric clinician teams,
Pediatric Medical Team A (PMA), Pediatric Medical Team B (PMB), and Pediatric Medical
Gastroenterology (PMG), who had physiological monitoring for more than 24 hours. For the first
data collection period, this project relied on chart reviews. Therefore, no patient interaction
occurred and no changes to patient care were executed. All patient data and identifiers were
protected during data collection by assigning a unique identification number to prevent subject
17
duplication. All clinicians that write orders in the EHR and translate the orders into the
physiological monitors were included in this study as subjects through their contribution to
alarms. Types of clinicians include physicians, nurse practitioners, nurses, and nursing assistants.
Data collection did not include any identifying information on clinicians.
Phase Two: Interventions
After data analysis, nursing and medical team representatives were involved to determine
the suitable intervention to address alarm parameter inefficiencies. Patients and their care were
not affected by this project’s intervention since the intervention built upon current clinician
practices and did not change practice.
Monitoring Practices and Policies: Baseline
Pre-project practices regarding alarm parameter use were as follows: patient orders were
communicated through default parameters in the EHR and assigned based on age range; the
nurse was then responsible for translating the physician orders for vital sign parameters into the
physiological monitors; and lastly if a patient’s actual vital sign was outside the defaulted
parameter range the nurse was responsible for notifying the physician to determine acceptable
values. Appendix B outlines the expected nursing workflow regarding alarm parameter
management.
Initial observations on 6CH indicated there were inconsistencies between EHR orders
and actual parameter settings in the physiological monitors, resulting in unnecessary false
alarms. Appendix C shows the default age-based pediatric parameters used in the EHR and the
‘pediatric’ default parameters used for the physiological monitors respectively. Since there was
only one setting for the physiological monitor, it was guaranteed that the nurses had to
manipulate the monitors to reflect the orders, as none of the default alarm parameters in the EHR
18
match the physiological pediatric profile. This created a workflow problem for nurses causing
false alarms because nurses did not change the physiological monitor parameters from the
pediatric default settings until after the alarm was triggered and it was noticed that the
parameters were not appropriate.
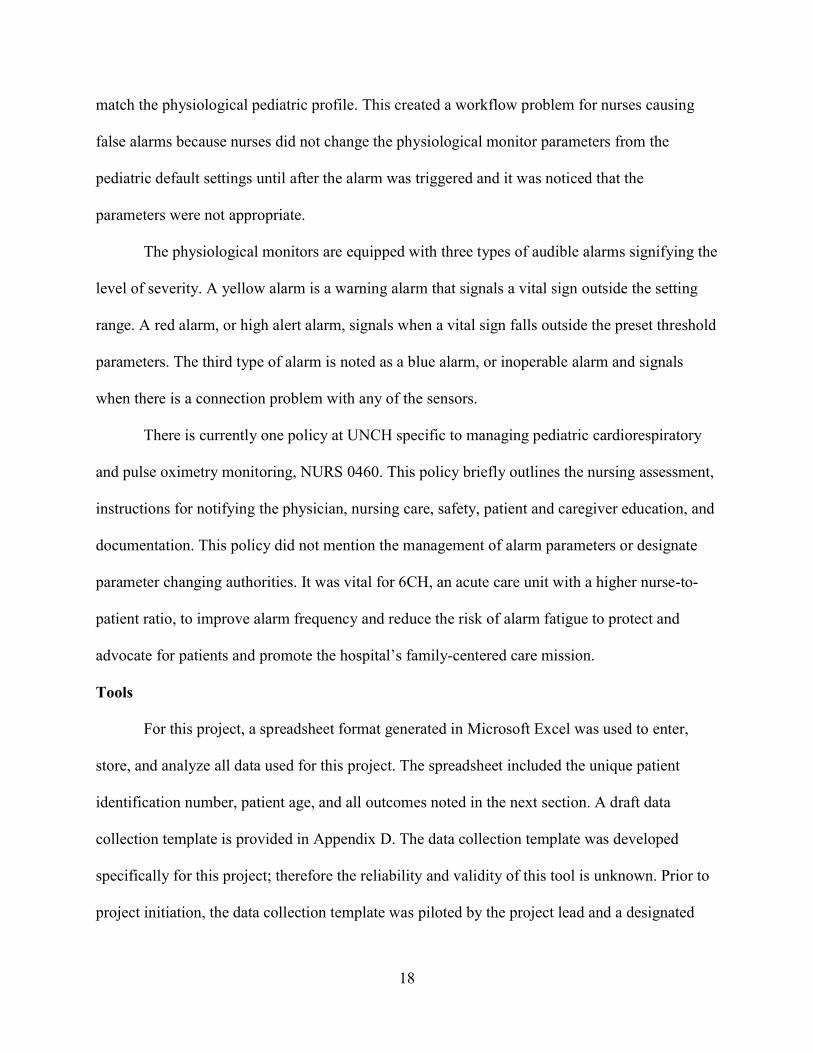
The physiological monitors are equipped with three types of audible alarms signifying the
level of severity. A yellow alarm is a warning alarm that signals a vital sign outside the setting
range. A red alarm, or high alert alarm, signals when a vital sign falls outside the preset threshold
parameters. The third type of alarm is noted as a blue alarm, or inoperable alarm and signals
when there is a connection problem with any of the sensors.
There is currently one policy at UNCH specific to managing pediatric cardiorespiratory
and pulse oximetry monitoring, NURS 0460. This policy briefly outlines the nursing assessment,
instructions for notifying the physician, nursing care, safety, patient and caregiver education, and
documentation. This policy did not mention the management of alarm parameters or designate
parameter changing authorities. It was vital for 6CH, an acute care unit with a higher nurse-to-
patient ratio, to improve alarm frequency and reduce the risk of alarm fatigue to protect and
advocate for patients and promote the hospital’s family-centered care mission.
Tools
For this project, a spreadsheet format generated in Microsoft Excel was used to enter,
store, and analyze all data used for this project. The spreadsheet included the unique patient
identification number, patient age, and all outcomes noted in the next section. A draft data
collection template is provided in Appendix D. The data collection template was developed
specifically for this project; therefore the reliability and validity of this tool is unknown. Prior to
project initiation, the data collection template was piloted by the project lead and a designated
19
representative on 6CH. Three patients were pre-selected and each person collected the template
data individually. After the pilot, the data from each person was compared via statistical analysis
to ensure template reliability and validity. No identifying information was collected about the
volunteer nurse or other clinicians involved in alarm parameter orders.
For the analysis portion of this project, a Microsoft Excel macro was utilized to quantify
and characterize alarm data retrieved from the physiological monitor. The macro was provided
by the UNCH Patient Safety Officer and used throughout the hospital for physiological monitors
alarm characterization prior to this project.
Phase One: Baseline Data Collection Plan
In this project I addressed the alarm parameter problem by collecting data to provide
baseline information regarding parameter adherence problems. The data were collected by the
project lead in a retrospective manner since the physiological monitors do not store patient data
for an extended time after patient discharge. There were six age categories used for vital sign
parameters: less than 1 month, 1-12 months, 1-3 years, 4-5 years, 6-11 years, and 12-18 years.
These correspond to the default age ranges in the EHR system at the project site. All patients
over the age of 18 were excluded from this project. Data collection plans called for a target
enrollment of 60 patients: 10 patients per age category from the general pediatrics services PMA,
PMB, and PMG. To reduce complications with the development of the intervention
implementation, it was necessary to focus data collection between these three teams as there is an
attending overlap and the patient diagnoses are similar in nature.
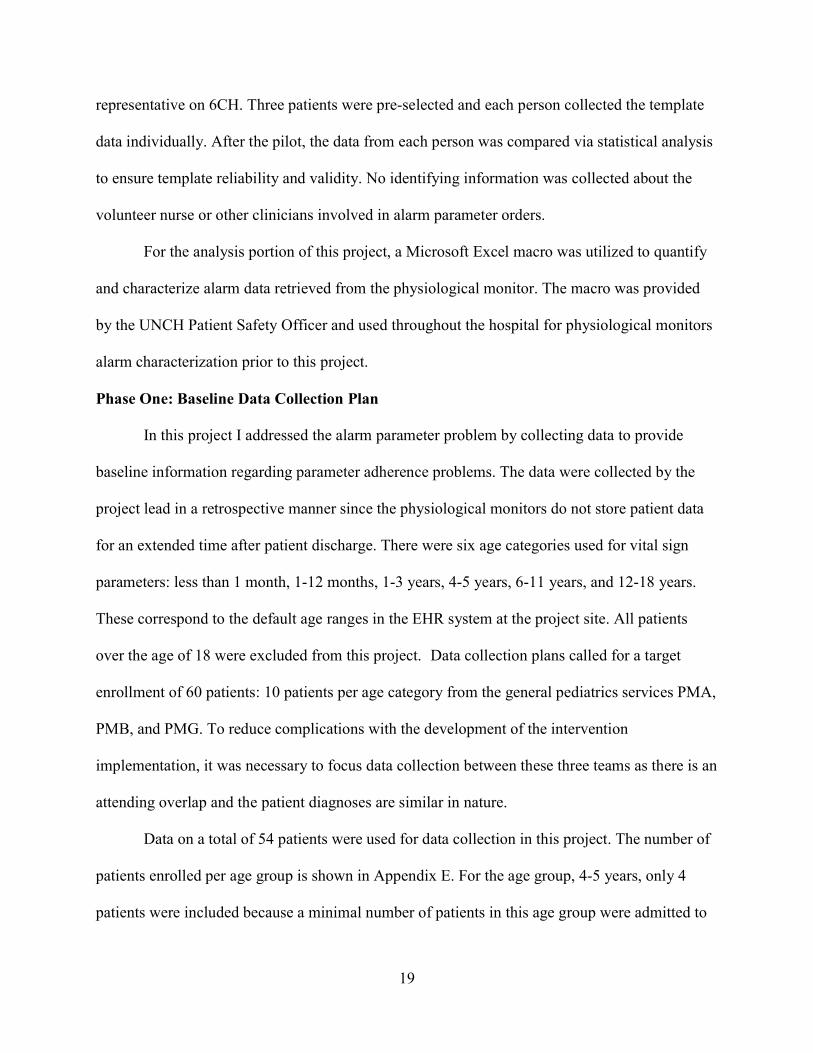
Data on a total of 54 patients were used for data collection in this project. The number of
patients enrolled per age group is shown in Appendix E. For the age group, 4-5 years, only 4
patients were included because a minimal number of patients in this age group were admitted to
20
6CH during the data collection time. To be included, patients had to have continuous
physiological monitoring for over 24 hours to capture a patient’s daily fluctuations in vital signs.
To ensure patient privacy and reduce data duplication, a digital log was created with the patient
name, data collection date, medical record number, and a randomly assigned study identification
number. The log was kept on a password encrypted flash drive in a locked cabinet within a
locked room at the project site. The data collection template only contained the randomly
assigned study identification numbers, but no identifying information of patients or clinicians.
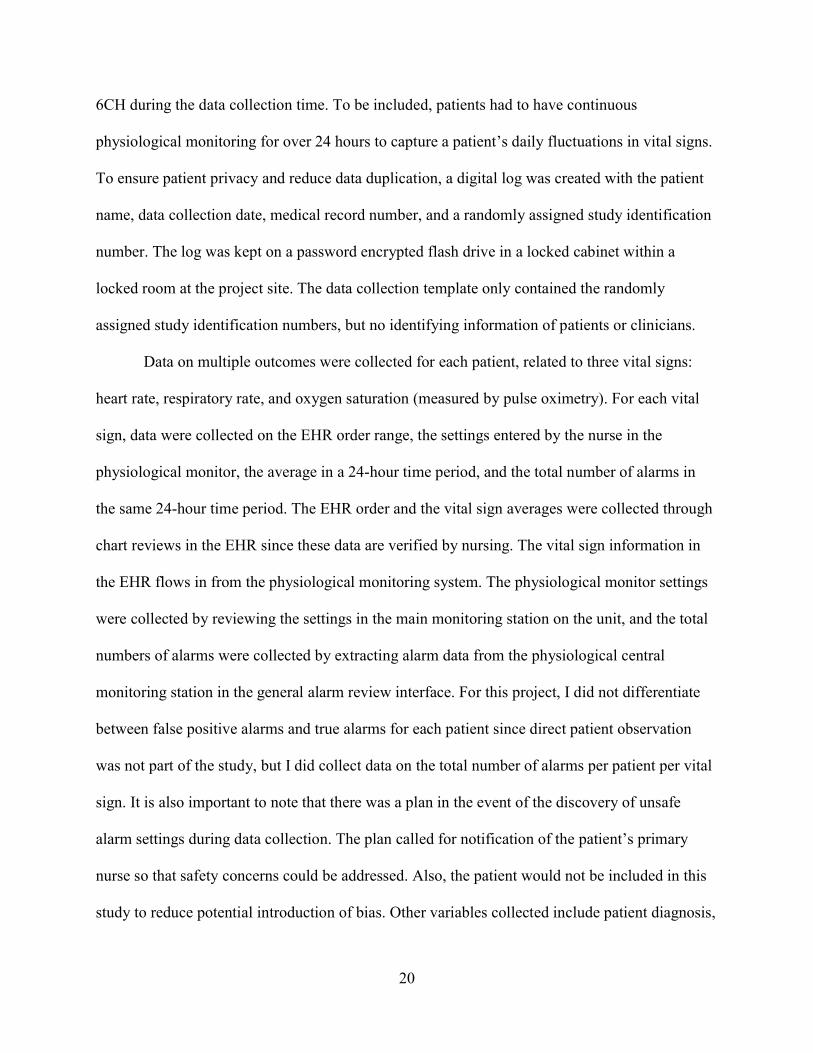
Data on multiple outcomes were collected for each patient, related to three vital signs:
heart rate, respiratory rate, and oxygen saturation (measured by pulse oximetry). For each vital
sign, data were collected on the EHR order range, the settings entered by the nurse in the
physiological monitor, the average in a 24-hour time period, and the total number of alarms in
the same 24-hour time period. The EHR order and the vital sign averages were collected through
chart reviews in the EHR since these data are verified by nursing. The vital sign information in
the EHR flows in from the physiological monitoring system. The physiological monitor settings
were collected by reviewing the settings in the main monitoring station on the unit, and the total
numbers of alarms were collected by extracting alarm data from the physiological central
monitoring station in the general alarm review interface. For this project, I did not differentiate
between false positive alarms and true alarms for each patient since direct patient observation
was not part of the study, but I did collect data on the total number of alarms per patient per vital
sign. It is also important to note that there was a plan in the event of the discovery of unsafe
alarm settings during data collection. The plan called for notification of the patient’s primary
nurse so that safety concerns could be addressed. Also, the patient would not be included in this
study to reduce potential introduction of bias. Other variables collected include patient diagnosis,
21
age at time of collection and provider service team. The data were collected retrospectively until
the target numbers of patients per age group were satisfied but not longer than 6 months.
After data collection, the project entered the data analysis phase, and the following were
determined: number of alarms per vital sign per patient, whether EHR orders and physiological
monitor settings matched, adherence rate, the average for each vital sign for each age group, and
if this average was within the EHR default parameter settings. An analysis of current hospital
policy and protocol was performed as well.
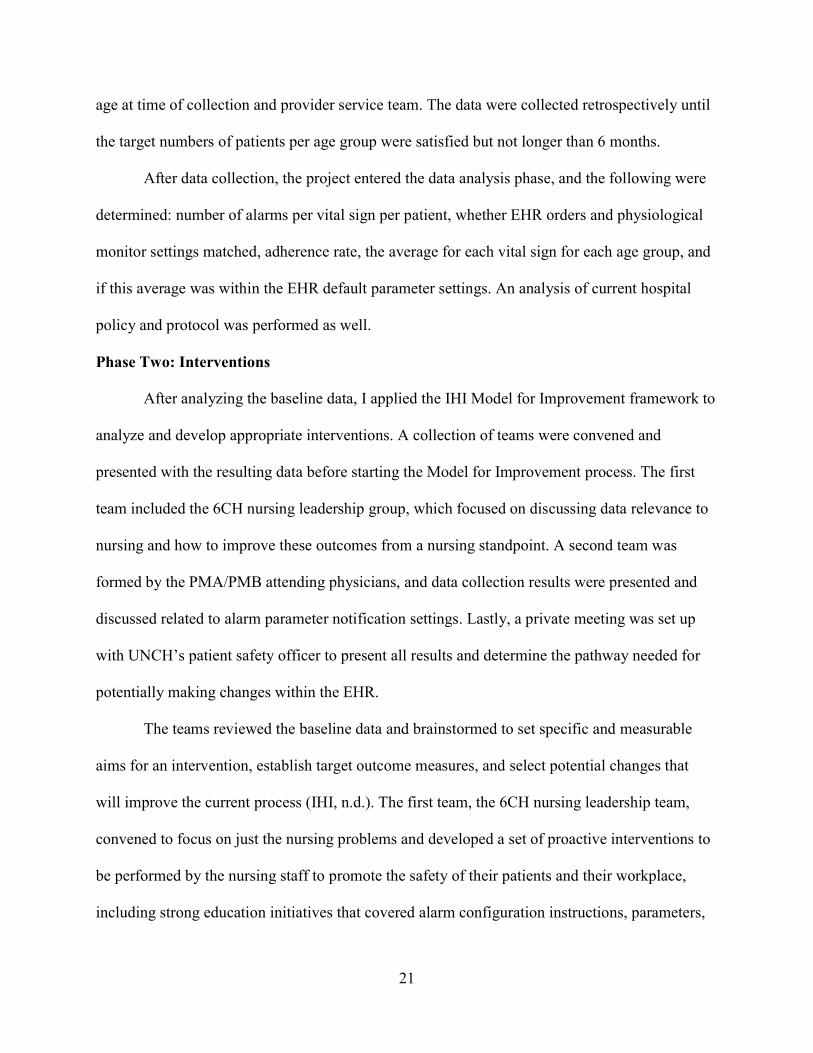
Phase Two: Interventions
After analyzing the baseline data, I applied the IHI Model for Improvement framework to
analyze and develop appropriate interventions. A collection of teams were convened and
presented with the resulting data before starting the Model for Improvement process. The first
team included the 6CH nursing leadership group, which focused on discussing data relevance to
nursing and how to improve these outcomes from a nursing standpoint. A second team was
formed by the PMA/PMB attending physicians, and data collection results were presented and
discussed related to alarm parameter notification settings. Lastly, a private meeting was set up
with UNCH’s patient safety officer to present all results and determine the pathway needed for
potentially making changes within the EHR.
The teams reviewed the baseline data and brainstormed to set specific and measurable
aims for an intervention, establish target outcome measures, and select potential changes that
will improve the current process (IHI, n.d.). The first team, the 6CH nursing leadership team,
convened to focus on just the nursing problems and developed a set of proactive interventions to
be performed by the nursing staff to promote the safety of their patients and their workplace,
including strong education initiatives that covered alarm configuration instructions, parameters,
22
and equipment guidance, with the strong utilization of cross-disciplinary teams and
organizational leaders. The second team consisted of physicians that focused on interventions
surrounding the appropriateness of the default orders in the EHR compared to the actual vital
sign data presented to them.
After these initial steps the project entered the PDSA cycle, and I developed and
deployed an intervention to address alarm parameters through education and policy reform,
perform the intervention, study how it affected alarm outcomes, and then make changes
accordingly (IHI, n.d.). In this project the intention was to complete the PDSA cycle through the
‘Do’ section as timing did not allow for recollecting data to compare to the baseline data
collection. Appendix F summarizes Phase 2 of this project.
23
CHAPTER 3: RESULTS
Phase One: Collection of Alarm Parameter Adherence Data
Data analysis focused on general demographic information to demonstrate a strong
association within each of the age groups and the main themes of the project: alarm parameter
adherence, total number of alarms, and the average vital signs for each age group.
Demographics
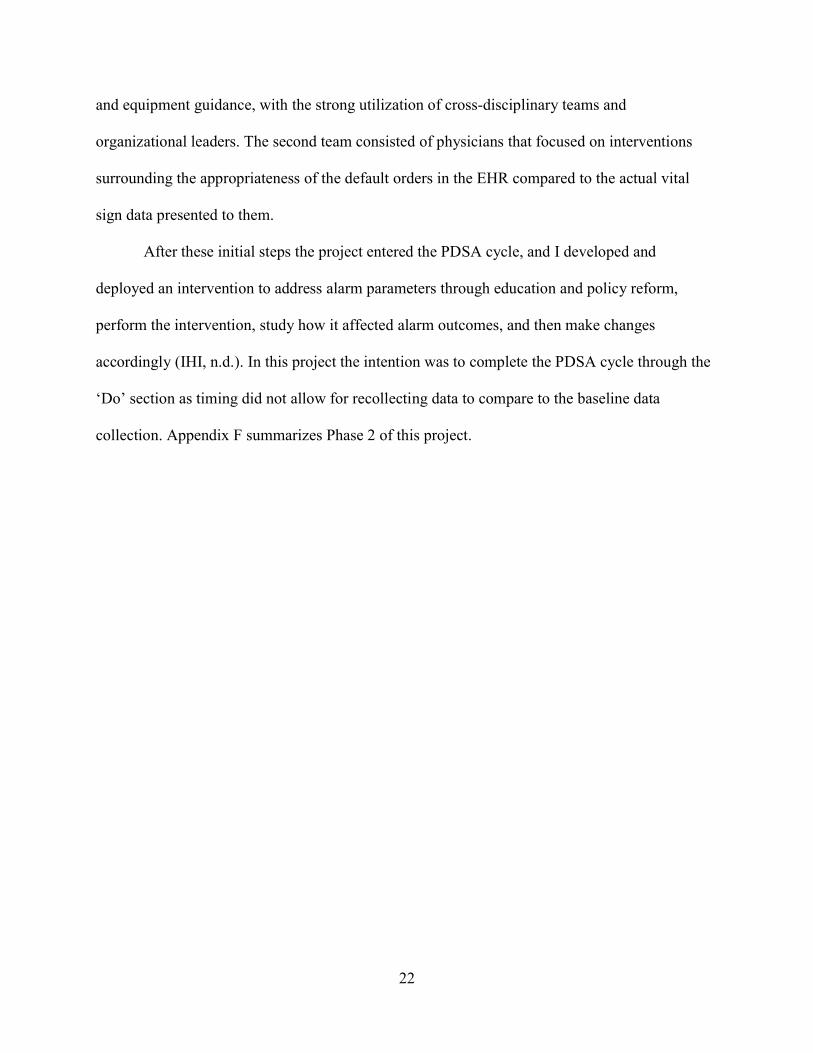
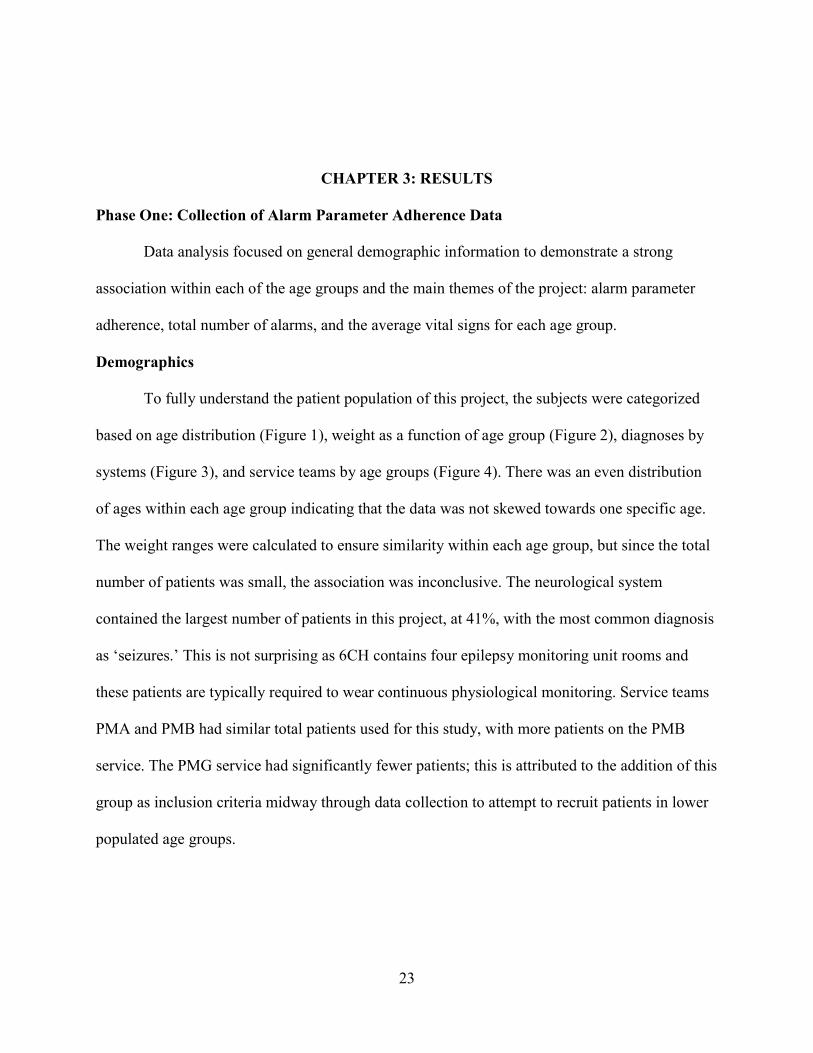
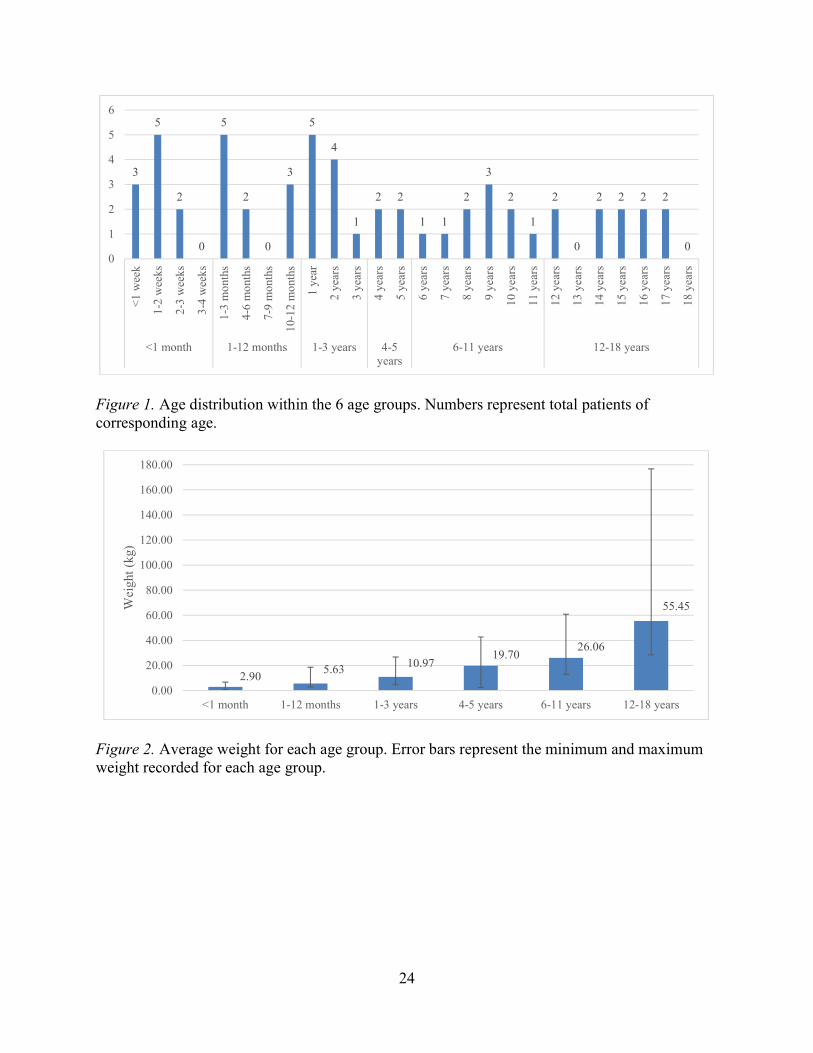
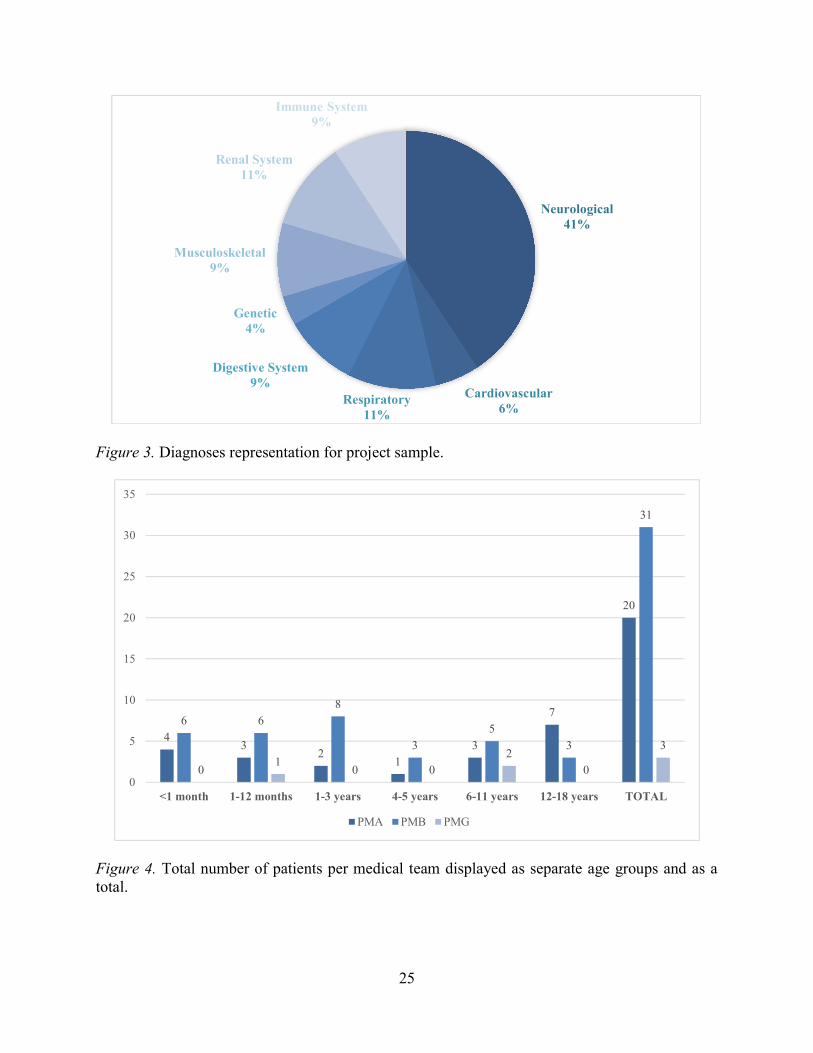
To fully understand the patient population of this project, the subjects were categorized
based on age distribution (Figure 1), weight as a function of age group (Figure 2), diagnoses by
systems (Figure 3), and service teams by age groups (Figure 4). There was an even distribution
of ages within each age group indicating that the data was not skewed towards one specific age.
The weight ranges were calculated to ensure similarity within each age group, but since the total
number of patients was small, the association was inconclusive. The neurological system
contained the largest number of patients in this project, at 41%, with the most common diagnosis
as ‘seizures.’ This is not surprising as 6CH contains four epilepsy monitoring unit rooms and
these patients are typically required to wear continuous physiological monitoring. Service teams
PMA and PMB had similar total patients used for this study, with more patients on the PMB
service. The PMG service had significantly fewer patients; this is attributed to the addition of this
group as inclusion criteria midway through data collection to attempt to recruit patients in lower
populated age groups.
24
Figure 1. Age distribution within the 6 age groups. Numbers represent total patients of corresponding age.
Figure 2. Average weight for each age group. Error bars represent the minimum and maximum weight recorded for each age group.
3
5
2
0
5
2
0
3
5
4
1
2 2
1 1
2
3
2
1
2
0
2 2 2 2
00
1
2
3
4
5
6
<1
wee
k
1-2
wee
ks
2-3
wee
ks
3-4
wee
ks
1-3
mon
ths
4-6
mon
ths
7-9
mon
ths
10-1
2 m
onth
s
1 ye
ar
2 ye
ars
3 ye
ars
4 ye
ars
5 ye
ars
6 ye
ars
7 ye
ars
8 ye
ars
9 ye
ars
10 y
ears
11 y
ears
12 y
ears
13 y
ears
14 y
ears
15 y
ears
16 y
ears
17 y
ears
18 y
ears
<1 month 1-12 months 1-3 years 4-5years
6-11 years 12-18 years
2.905.63 10.97
19.7026.06
55.45
0.00
20.00
40.00
60.00
80.00
100.00
120.00
140.00
160.00
180.00
<1 month 1-12 months 1-3 years 4-5 years 6-11 years 12-18 years
Wei
ght (
kg)
25
Figure 3. Diagnoses representation for project sample.
Figure 4. Total number of patients per medical team displayed as separate age groups and as a total.
Neurological41%
Cardiovascular6%
Respiratory11%
Digestive System9%
Genetic4%
Musculoskeletal9%
Renal System11%
Immune System9%
43
21
3
7
20
6 68
3
5
3
31
01
0 02
0
3
0
5
10
15
20
25
30
35
<1 month 1-12 months 1-3 years 4-5 years 6-11 years 12-18 years TOTAL
PMA PMB PMG
26
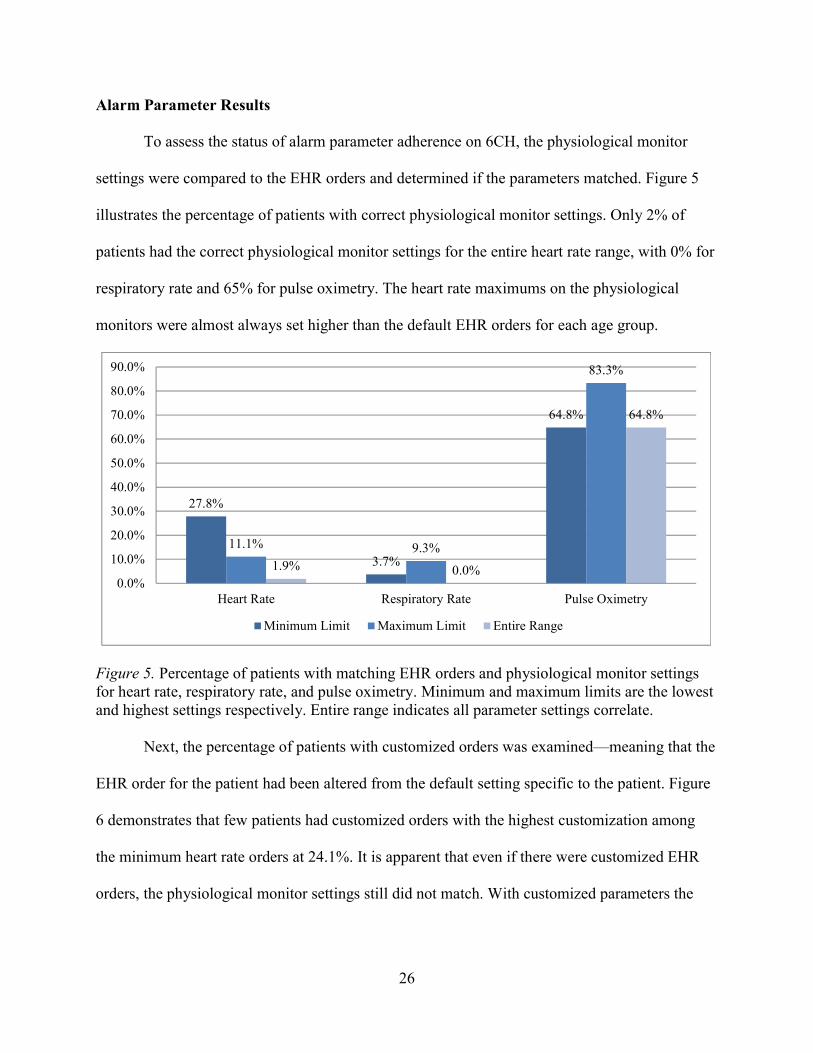
Alarm Parameter Results
To assess the status of alarm parameter adherence on 6CH, the physiological monitor
settings were compared to the EHR orders and determined if the parameters matched. Figure 5
illustrates the percentage of patients with correct physiological monitor settings. Only 2% of
patients had the correct physiological monitor settings for the entire heart rate range, with 0% for
respiratory rate and 65% for pulse oximetry. The heart rate maximums on the physiological
monitors were almost always set higher than the default EHR orders for each age group.
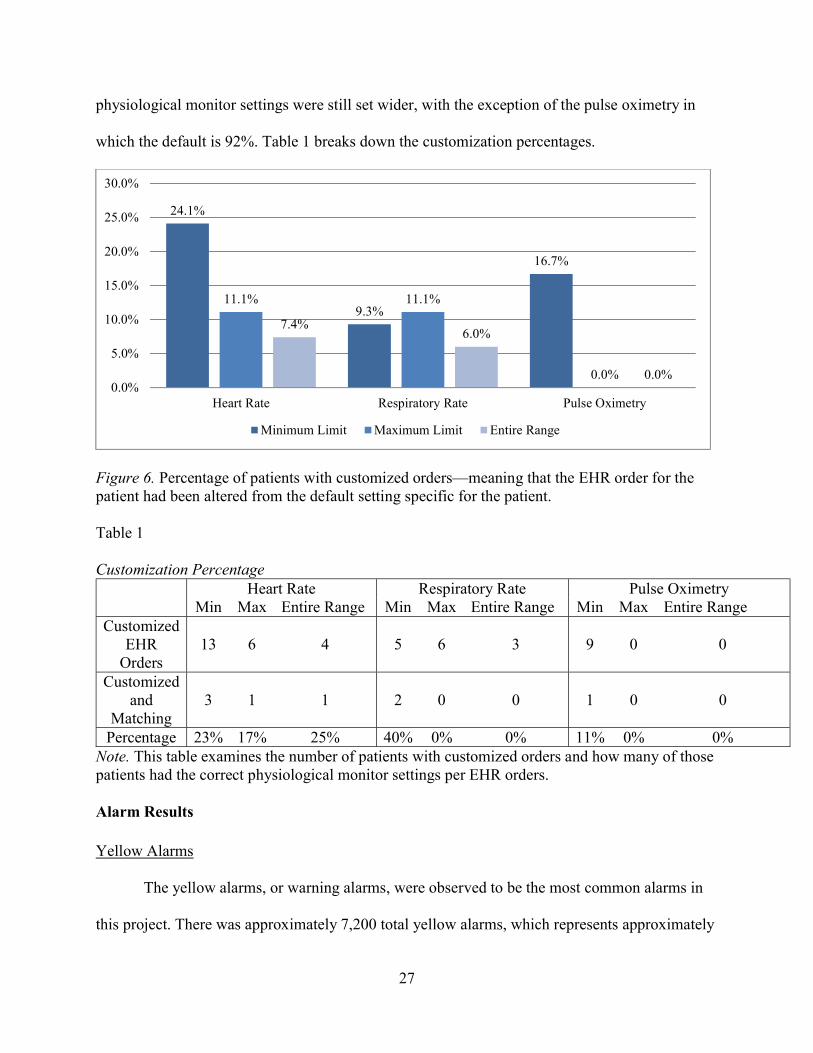
Figure 5. Percentage of patients with matching EHR orders and physiological monitor settings for heart rate, respiratory rate, and pulse oximetry. Minimum and maximum limits are the lowest and highest settings respectively. Entire range indicates all parameter settings correlate. Next, the percentage of patients with customized orders was examined—meaning that the
EHR order for the patient had been altered from the default setting specific to the patient. Figure
6 demonstrates that few patients had customized orders with the highest customization among
the minimum heart rate orders at 24.1%. It is apparent that even if there were customized EHR
orders, the physiological monitor settings still did not match. With customized parameters the
27.8%
3.7%
64.8%
11.1% 9.3%
83.3%
1.9% 0.0%
64.8%
0.0%
10.0%
20.0%
30.0%
40.0%
50.0%
60.0%
70.0%
80.0%
90.0%
Heart Rate Respiratory Rate Pulse Oximetry
Minimum Limit Maximum Limit Entire Range
27
physiological monitor settings were still set wider, with the exception of the pulse oximetry in
which the default is 92%. Table 1 breaks down the customization percentages.
Figure 6. Percentage of patients with customized orders—meaning that the EHR order for the patient had been altered from the default setting specific for the patient. Table 1
Customization Percentage
Heart Rate Respiratory Rate Pulse Oximetry
Min Max Entire Range Min Max Entire Range Min Max Entire Range Customized
EHR Orders
13 6 4 5 6 3 9 0 0
Customized and
Matching 3 1 1 2 0 0 1 0 0
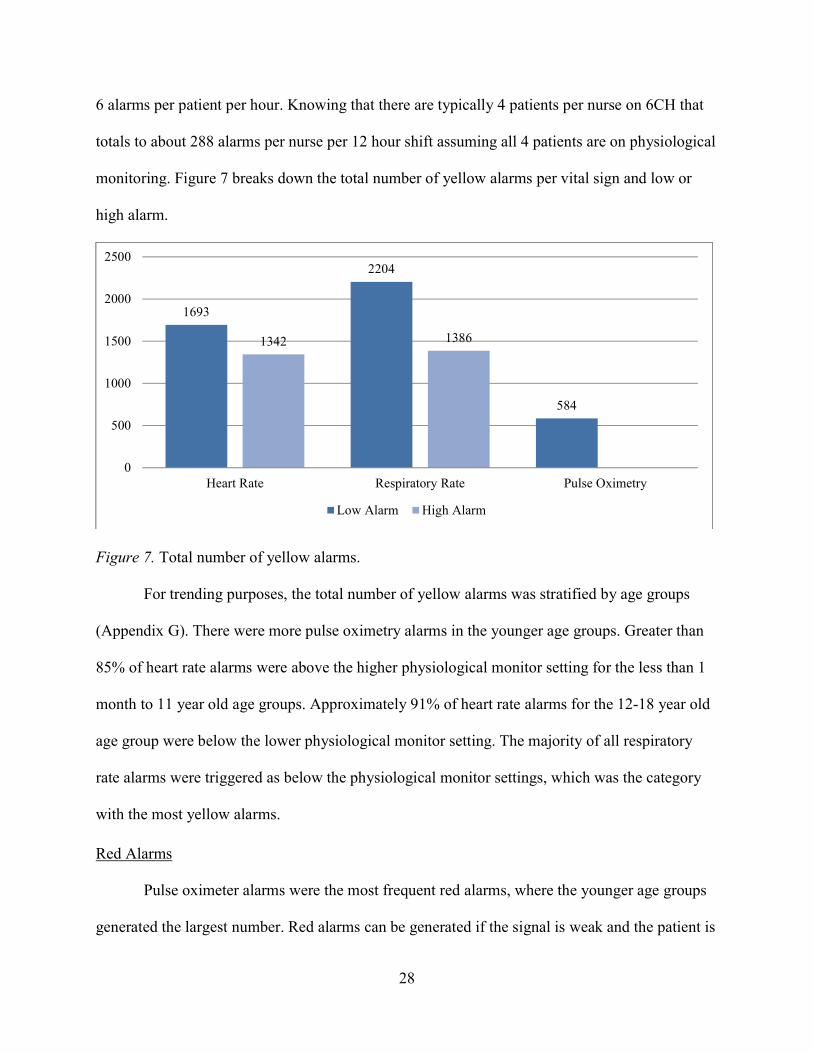
Percentage 23% 17% 25% 40% 0% 0% 11% 0% 0% Note. This table examines the number of patients with customized orders and how many of those patients had the correct physiological monitor settings per EHR orders. Alarm Results Yellow Alarms The yellow alarms, or warning alarms, were observed to be the most common alarms in
this project. There was approximately 7,200 total yellow alarms, which represents approximately
24.1%
9.3%
16.7%
11.1% 11.1%
0.0%
7.4%6.0%
0.0%0.0%
5.0%
10.0%
15.0%
20.0%
25.0%
30.0%
Heart Rate Respiratory Rate Pulse Oximetry
Minimum Limit Maximum Limit Entire Range
28
6 alarms per patient per hour. Knowing that there are typically 4 patients per nurse on 6CH that
totals to about 288 alarms per nurse per 12 hour shift assuming all 4 patients are on physiological
monitoring. Figure 7 breaks down the total number of yellow alarms per vital sign and low or
high alarm.
Figure 7. Total number of yellow alarms. For trending purposes, the total number of yellow alarms was stratified by age groups
(Appendix G). There were more pulse oximetry alarms in the younger age groups. Greater than
85% of heart rate alarms were above the higher physiological monitor setting for the less than 1
month to 11 year old age groups. Approximately 91% of heart rate alarms for the 12-18 year old
age group were below the lower physiological monitor setting. The majority of all respiratory
rate alarms were triggered as below the physiological monitor settings, which was the category
with the most yellow alarms.
Red Alarms Pulse oximeter alarms were the most frequent red alarms, where the younger age groups
generated the largest number. Red alarms can be generated if the signal is weak and the patient is
1693
2204
584
1342 1386
0
500
1000
1500
2000
2500
Heart Rate Respiratory Rate Pulse Oximetry
Low Alarm High Alarm
29
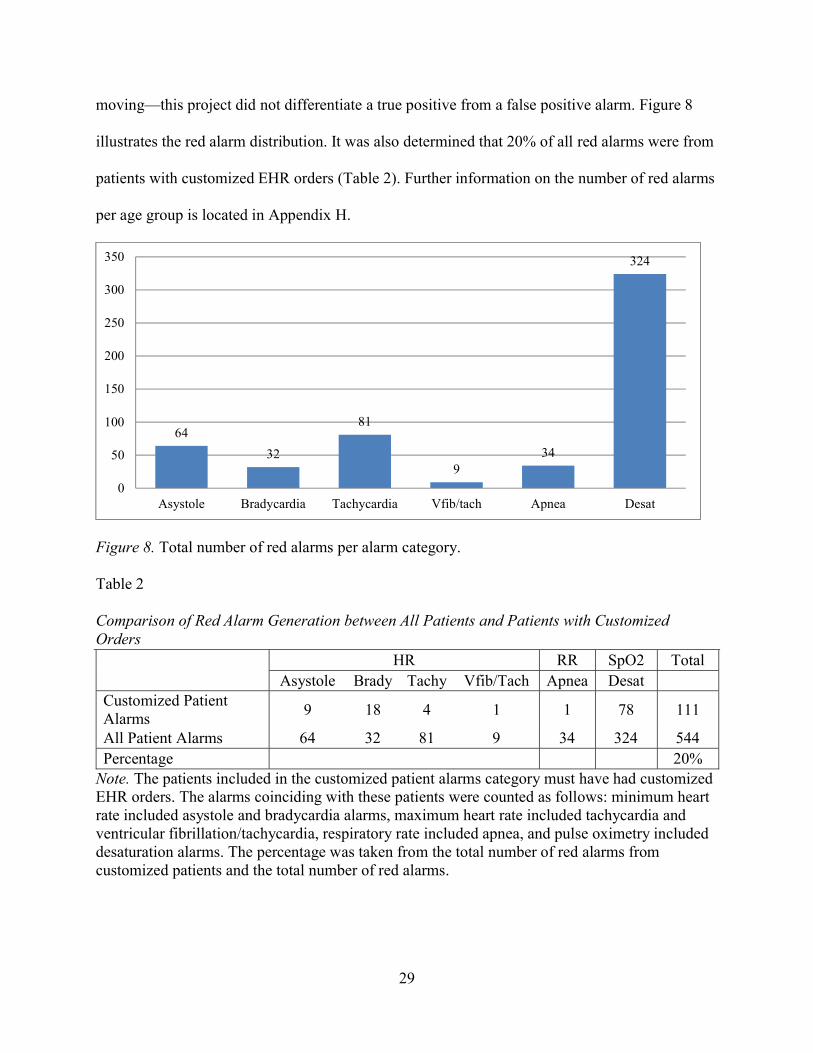
moving—this project did not differentiate a true positive from a false positive alarm. Figure 8
illustrates the red alarm distribution. It was also determined that 20% of all red alarms were from
patients with customized EHR orders (Table 2). Further information on the number of red alarms
per age group is located in Appendix H.
Figure 8. Total number of red alarms per alarm category.
Table 2
Comparison of Red Alarm Generation between All Patients and Patients with Customized Orders
HR RR SpO2 Total Asystole Brady Tachy Vfib/Tach Apnea Desat
Customized Patient Alarms
9 18 4 1 1 78 111
All Patient Alarms 64 32 81 9 34 324 544 Percentage 20%
Note. The patients included in the customized patient alarms category must have had customized EHR orders. The alarms coinciding with these patients were counted as follows: minimum heart rate included asystole and bradycardia alarms, maximum heart rate included tachycardia and ventricular fibrillation/tachycardia, respiratory rate included apnea, and pulse oximetry included desaturation alarms. The percentage was taken from the total number of red alarms from customized patients and the total number of red alarms.
64
32
81
934
324
0
50
100
150
200
250
300
350
Asystole Bradycardia Tachycardia Vfib/tach Apnea Desat
30
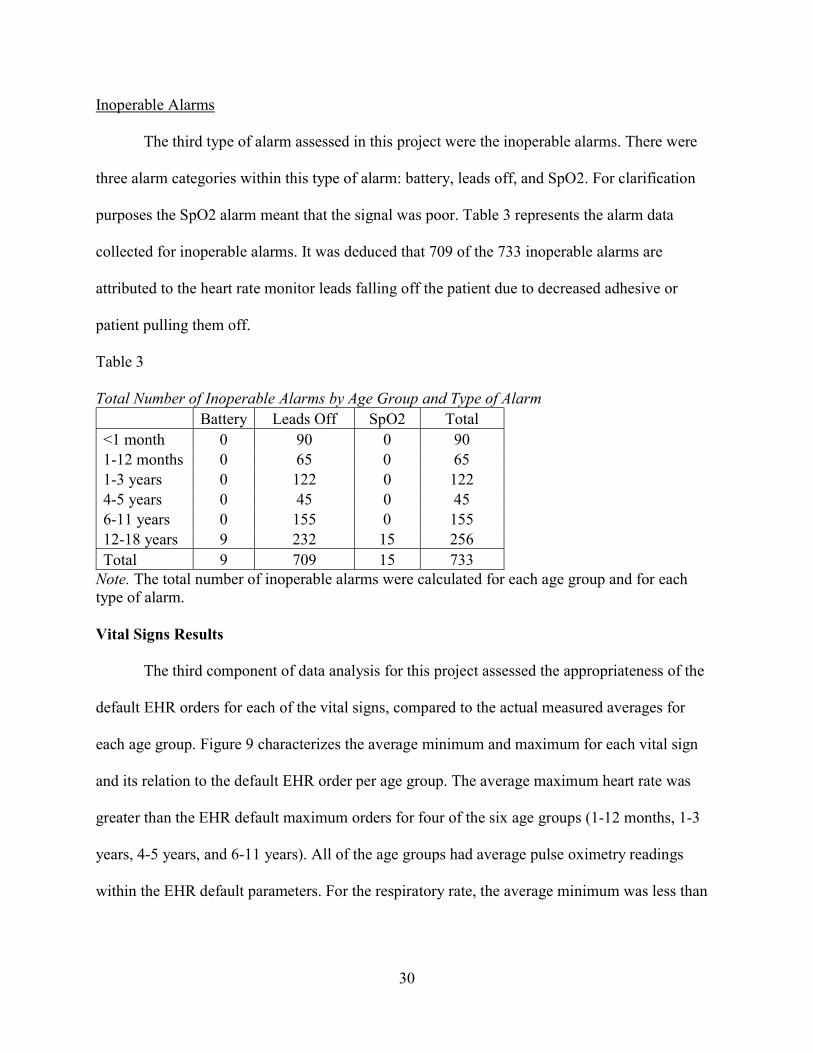
Inoperable Alarms The third type of alarm assessed in this project were the inoperable alarms. There were
three alarm categories within this type of alarm: battery, leads off, and SpO2. For clarification
purposes the SpO2 alarm meant that the signal was poor. Table 3 represents the alarm data
collected for inoperable alarms. It was deduced that 709 of the 733 inoperable alarms are
attributed to the heart rate monitor leads falling off the patient due to decreased adhesive or
patient pulling them off.
Table 3 Total Number of Inoperable Alarms by Age Group and Type of Alarm
Battery Leads Off SpO2 Total <1 month 0 90 0 90 1-12 months 0 65 0 65 1-3 years 0 122 0 122 4-5 years 0 45 0 45 6-11 years 0 155 0 155 12-18 years 9 232 15 256 Total 9 709 15 733
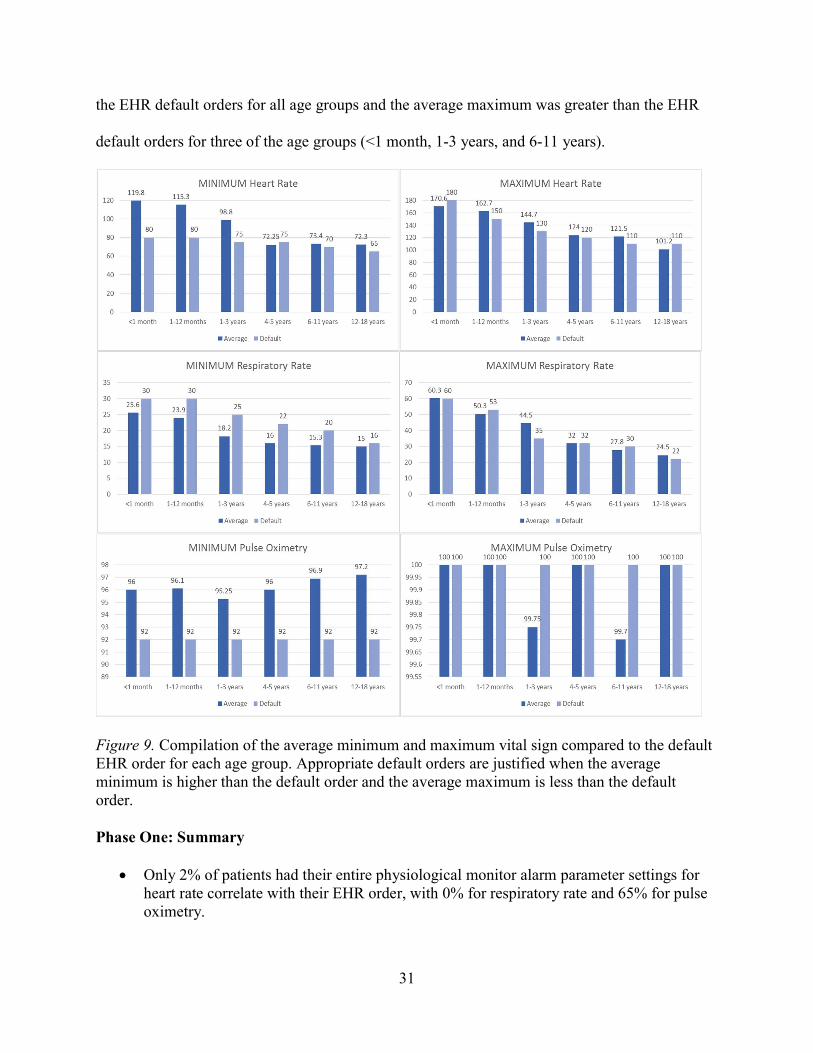
Note. The total number of inoperable alarms were calculated for each age group and for each type of alarm. Vital Signs Results
The third component of data analysis for this project assessed the appropriateness of the
default EHR orders for each of the vital signs, compared to the actual measured averages for
each age group. Figure 9 characterizes the average minimum and maximum for each vital sign
and its relation to the default EHR order per age group. The average maximum heart rate was
greater than the EHR default maximum orders for four of the six age groups (1-12 months, 1-3
years, 4-5 years, and 6-11 years). All of the age groups had average pulse oximetry readings
within the EHR default parameters. For the respiratory rate, the average minimum was less than
31
the EHR default orders for all age groups and the average maximum was greater than the EHR
default orders for three of the age groups (<1 month, 1-3 years, and 6-11 years).
Figure 9. Compilation of the average minimum and maximum vital sign compared to the default EHR order for each age group. Appropriate default orders are justified when the average minimum is higher than the default order and the average maximum is less than the default order. Phase One: Summary
Only 2% of patients had their entire physiological monitor alarm parameter settings for heart rate correlate with their EHR order, with 0% for respiratory rate and 65% for pulse oximetry.
32
Few patients had customized EHR parameter orders.
Even when patients had customized EHR parameter orders, the physiological monitor settings did not match, indicating a nursing issue.
The average maximum heart rate fell outside the EHR default orders for age groups 1-12 months, 1-3 years, 4-5 years, and 6-11 years.
The average minimum respiratory rate fell outside the EHR default orders for all age groups.
Younger age groups generated the most pulse oximetry red alarms, which were the main source for the red alarms.
20% of all red alarms were from patients with customized EHR alarm parameter orders.
The yellow alarms were the largest source of alarms, with the majority of all yellow alarms triggered from low respiratory rates.
Greater than 85% of heart rate alarms were above the high physiological monitor settings for ages less than 1 month to 11 years old.
91% of heart rate alarms for 12-18 year olds were below the low physiological monitor settings.
The majority of inoperative alarms were due to monitor leads not sticking to the patient’s skin.
The abundant information derived from the Phase 1 data collection informed the intervention in
Phase 2 of the project.
Phase Two: Development and Deployment of Alarm Parameter Adherence Educational
Intervention
The intervention implemented in this project was focused on education for improving
alarm parameter adherence by nursing staff on 6CH. The education emphasized the importance
of customizing alarm parameters for each pediatric patient, and ensuring correct parameters are
programmed in the monitoring system.
33
To accommodate most learning styles, visual, verbal, and physical education was
developed and shared with the nursing staff. An email, specifically focused on alarm parameter
adherences, was developed and sent to nursing staff. This included the alarm parameter
responsibilities for nurses and the expected alarm parameter nursing workflow stated in the
UNCH nursing policy (Appendix I). This same information was included in the 6CH weekly
update. To target visual learners, an educational poster was displayed on the unit for over 1
month that included alarm parameter adherence results from this project, steps to change
parameters in the physiological monitors in picture form, and expected workflow (Appendix J).
A reminder card was placed on the top right corner of every computer on the unit, shown in
Appendix K, to serve as a cue to nurses to check parameters while they are charting and
checking orders. Lastly, physical and verbal learners were provided with one-on-one in-services,
with the goal of educating 75% of nursing staff. Appendix L displays the prompts for the in-
service training, which includes a combination of teach-back method along with hands-on
manipulation of the physiological monitors.
It was determined that approximately 75% of nurses, received the one-on-one in-service
training. All nursing staff, including assistive personnel, received the education delivered by
email and/or weekly update. It was unknown how many people read the education piece. During
the provider team meeting, there were approximately 10 physicians and 3 nurse practitioners in
attendance, which comprises at least half of the attending faculty and all of the nurse
practitioners in pediatrics for the main pediatric medical teams.
Modifications of nursing policy and notification settings within EHR remain in process
and are expected to continue beyond this project.

34
The Synergy Model for Patient Care and Alarm Fatigue
The SMPC guided the alarm management approach for this project, with the goal of
preventing alarm fatigue by aligning nursing competencies, patient characteristic customization,
and interdisciplinary communication. The project intervention incorporated all eight nursing
competencies; eight patient characteristics of the SMPC; and evaluation of patient, nursing, and
system outcomes. By using the SMPC framework, this intervention initiated communication
among pediatric clinicians focused on the current state of the physiological monitoring system
and on developing appropriate and customizable alarm parameter configuration practices.
A comprehensive approach using the SMPC ensures nurses are provided with adequate
training and knowledge to properly grasp all scenarios and make clinical judgments and inquiries
based on experience. For example, the alarm management approach provided situational-based
guidelines prompting nurses to evaluate patient-specific care for alarm parameter
appropriateness. The goal was to integrate all patient care disciplines while enhancing
communication and individualizing patient care. The approach synergized all nursing
competencies and required strong emphases on advocacy, collaboration, systems thinking, and
response to diversity. The approach required daily interdisciplinary communication
(collaboration among clinicians) and addressed appropriate vital sign parameters and need for
physiological monitors (advocacy/clinical inquiry and judgment) for applicable patients
(diversity).
35
CHAPTER 4: DISCUSSION
I found a strong lack of alarm parameter adherence on 6CH among the nursing staff. The
alarm parameters entered into the physiological monitors were often inconsistent with the EHR
orders for each patient, and as a result, the patients alarmed excessively or had wider alarm
parameter settings than what they were ordered for. False alarms creates noisy environments that
nursing staff learns to ignore or work-around, contributing to alarm fatigue. As a result, wider
alarm parameters were used, which can cause a delay or missed signs of real distress in patients.
The evidence gathered during this project supports the strong need for nursing education and a
change in culture surrounding alarm parameter adherence.
Another nursing issue that was not the focus of this project but requires discussion, was
the large number of inoperable alarms. The greatest alarm within this category was that the leads
were off the patient. These alarms are highly preventable by nursing staff. After reviewing the
initial data, the project lead suggested this be a topic of education for a group of new graduate
nurses to perform on the unit—the education was not implemented until after data collection for
the project was over to ensure that it would not influence results.
TJC strongly suggests that patient customization is a vital component of managing patient
cardiorespiratory alarms. This project highlighted that even though there are multiple age groups
within acute pediatric care, customization still needs to be performed for each child, meaning
that the default orders in the EHR should serve as a general guide for the patient based on age.
Customization requires the nursing staff and medical team to work closely together to ensure that
the patient’s orders reflect the patient’s physiological status. It is nursing’s responsibility to
36
notify the providers when a patient alarms outside of the default orders, and it is the physician’s
responsibility to promptly change the orders within the EHR to avoid repeat pages about the
same topic. The project demonstrated fewer red alarms were generated from those patients with
customized orders, but customization did not entirely eliminate alarms. This indicates that if all
of the pediatric patients had customized alarm parameters, the number of false alarms could be
reduced drastically.
There was a strong association in this project between the sizable total number of low
respiratory rate alarms and the average minimum respiratory rate being lower than the EHR
default alarm settings. This indicated that if the EHR default settings were lowered to resemble
actual patient respiratory rates, there would be fewer generated yellow alarms for respiratory
rate. The medical teams were presented with this option, and there are initial in-process steps to
update the EHR default alarm settings for respiratory rate for all age groups.
Meeting patients’ safety needs is necessary to obtain positive clinical outcomes and must
be addressed in any intervention. The alarm management approach recommended in this project
potentially ensures patients’ vital sign parameters are safe. It allowed a level of adaptability, with
proper team collaboration to account for resiliency, stability, complexity, and predictability of
the patient and its clinical signs and symptoms. By promoting flexibility, it allows the team to
customize the patient’s alarm system, therefore decreasing alarm frequency.
Synergy of nursing competencies, patient characteristics, and system factors provide the
ability to develop an all-encompassing alarm management approach that customizes alarm
parameters for patients. An intervention aimed to reduce alarm fatigue utilizing other theories
does not promise the same interaction among the three sectors regarding alarm management.
Other theories prove difficult to align patient characteristics to nurse competencies and training,
37
and there is a breakdown in the relationship among patient customization, how nursing practices,
and resulted outcomes. A framework that holds nurses accountable for their practices ensures
competent patient care and synergism throughout the health care system. The development of a
standardized alarm management approach based on the AACN’s SMPC guarantees a
comprehensive collaborative intervention necessary to target alarm fatigue.
The inter-disciplinary approach I introduced in my educational intervention, though
challenging, opened communication regarding alarm parameters among the clinicians on 6CH.
Overall, nursing staff were receptive to education since they are impacted by the physiological
alarms the most. Many staff often stated that they knew how to change the parameters in the
monitoring system but hesitated when asked to perform it during the in-service. This reinforced
the idea that not many nurses are persistent in adhering to alarm parameter policy. My
presentation to the attending physicians generated conversation, mostly regarding the number of
alarms per nurse as they are not as exposed to alarms. The physicians also discussed the
appropriateness of the default alarm parameters compared to the actual vital signs information at
length amongst each other. It was interesting that during this discussion they were all in
agreement that some things needed to be changed but not one person decided to take the lead in
attempting to change it. This was the greatest challenge of this project—to determine the
motivation for change regarding alarm parameters adherence among the nurses and providers.
For each group, there needs to be designated champions to push for a change in culture or
practices.
38
CHAPTER 5: LIMITATIONS
Approximately two-thirds of the way through data collection it was noticed that one of
the age groups, 4-5 year olds, was not populated like the other age groups. Only 4 patients were
included for data collection due to time constraints. An admission report for 6CH was obtained
from NC Children’s Hospital administration to look at specific age demographics. As suspected,
between May 18, 2016 (data collection start date) and July 12, 2016 (data collection two-thirds
point), only 5% of all total qualified admissions were patients aged 4-5 years old. Other age
groups ranged from 12% to 28%. The report summary related specifically to this project is
located in Appendix L.
As a result of smaller samples than originally anticipated, the total sample was reduced
from 20 patients per age group to 10 patients per age group to reduce a wider gap between data
collected for each age group. Also, the PMG service team was added to provide a wider
population for data collection.
Time also was a limitation for this project as there was a 2 month gap in data collection
due to lack of access to data by the principal investigator. Also, data collection needed to be
completed before respiratory illness season began to prevent a skew in the results.
It must be noted that within this project it was noticed that there was an overlap in the
EHR default age groups. These age groups are listed in the EHR as ‘1-3 years’ and ‘3-5 years’
but for this study it was designated as ‘1-3 years’ and ‘4-5 years.’ This inconsistency within the
EHR can cause confusion for providers entering orders as they have two alarm parameter default
order sets that they could use.
39
CHAPTER 6: CONCLUSION
In this DNP project, I demonstrated that a standardized alarm management approach
focused on alarm parameters can be adopted by nurses and physicians on an inpatient pediatric
unit with a large volume of false alarms. The approach has the potential to prevent alarm fatigue
among hospital staff and reduce the risk for patient-related sentinel events. In the first phase of
this project, I collected data on alarm parameter compliance on 54 patients on 6CH. I found that
the minimum respiratory rate yellow alarm was the largest alarm contributor, which coincides
with the EHR default parameter orders for the minimum respiratory rate as too high for the
pediatric patient population. I also found that few patients had their entire range for any vital
signs programmed correctly in the monitoring system, indicating a clear nursing workflow
breakdown.
In the second phase of this project, I designed and delivered the intervention, which
included a set of proactive educational interventions addressing alarm parameter adherence and
patient customization, with the active involvement of inter-disciplinary teams and organizational
leadership. A meaningful alarm management approach that incorporates these interventions
naturally reflects the multi-faceted problem of alarm fatigue.
As a result of this project, it is clear that evidence-based data should be used to change
default alarm parameters in the EHR with the use of evidence-based data. Future research is
needed on the effectiveness of heavy educational programs targeting alarm parameter adherence,
such as the program performed in this project.
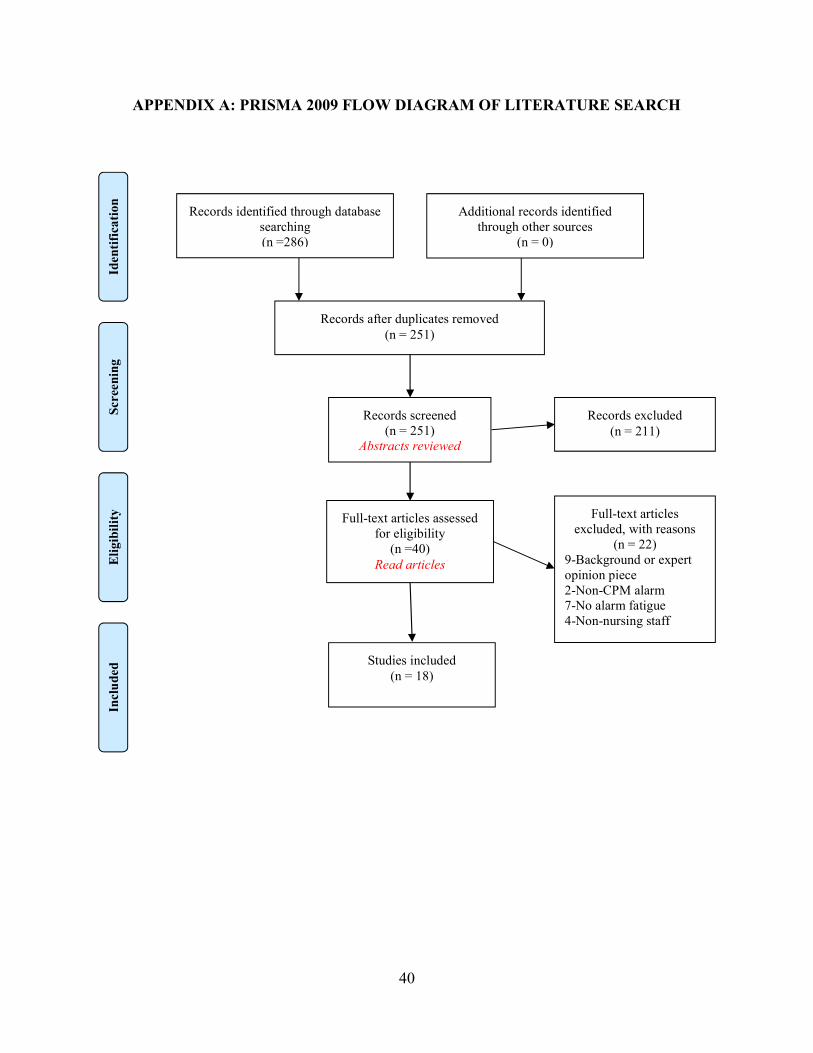
40
APPENDIX A: PRISMA 2009 FLOW DIAGRAM OF LITERATURE SEARCH
Records identified through database searching (n =286)
Scre
enin
g In
clu
ded
E
ligi
bili
ty
Iden
tifi
cati
on
Additional records identified through other sources
(n = 0)
Records after duplicates removed (n = 251)
Records screened (n = 251)
Abstracts reviewed
Records excluded (n = 211)
Full-text articles assessed for eligibility
(n =40) Read articles
Full-text articles excluded, with reasons
(n = 22) 9-Background or expert opinion piece 2-Non-CPM alarm 7-No alarm fatigue 4-Non-nursing staff
Studies included (n = 18)
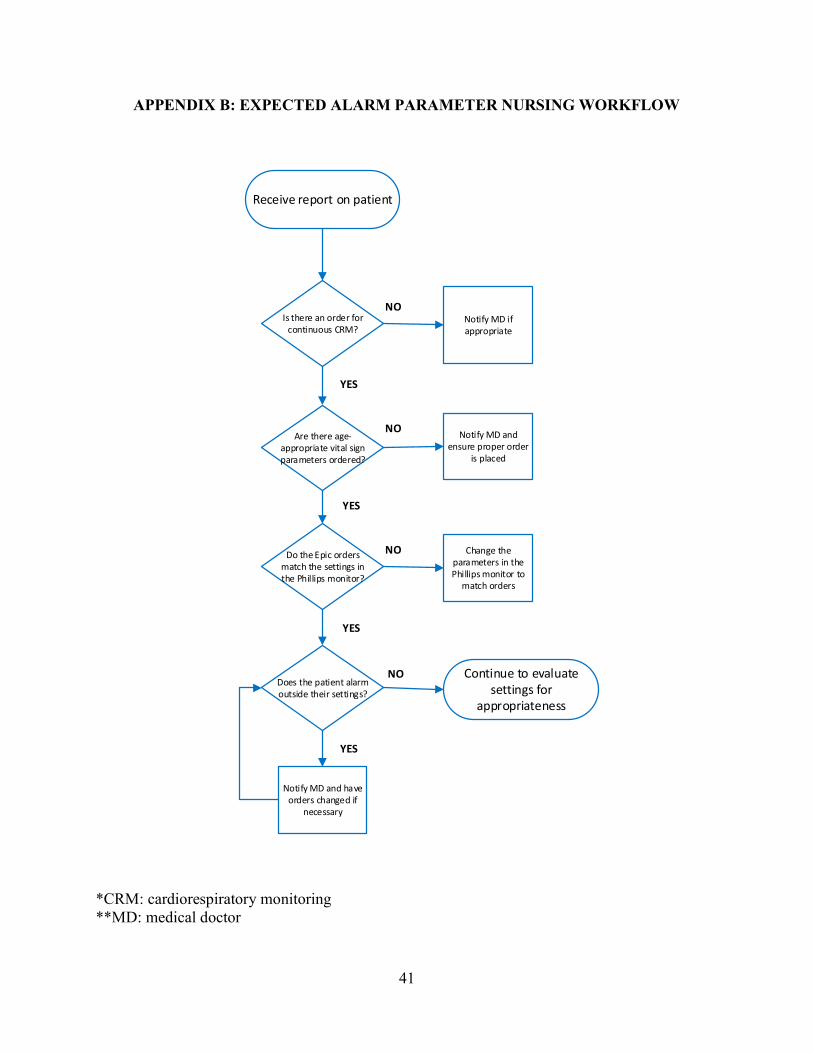
41
APPENDIX B: EXPECTED ALARM PARAMETER NURSING WORKFLOW
Receive report on patient
Is there an order for continuous CRM?
Notify MD if appropriate
Are there age-appropriate vital sign parameters ordered?
Notify MD and ensure proper order
is placed
Do the Epic orders match the settings in the Phillips monitor?
Change the parameters in the Phillips monitor to
match orders
Does the patient alarm outside their settings?
Continue to evaluate settings for
appropriateness
Notify MD and have orders changed if
necessary
YES
YES
YES
YES
NO
NO
NO
NO
*CRM: cardiorespiratory monitoring **MD: medical doctor
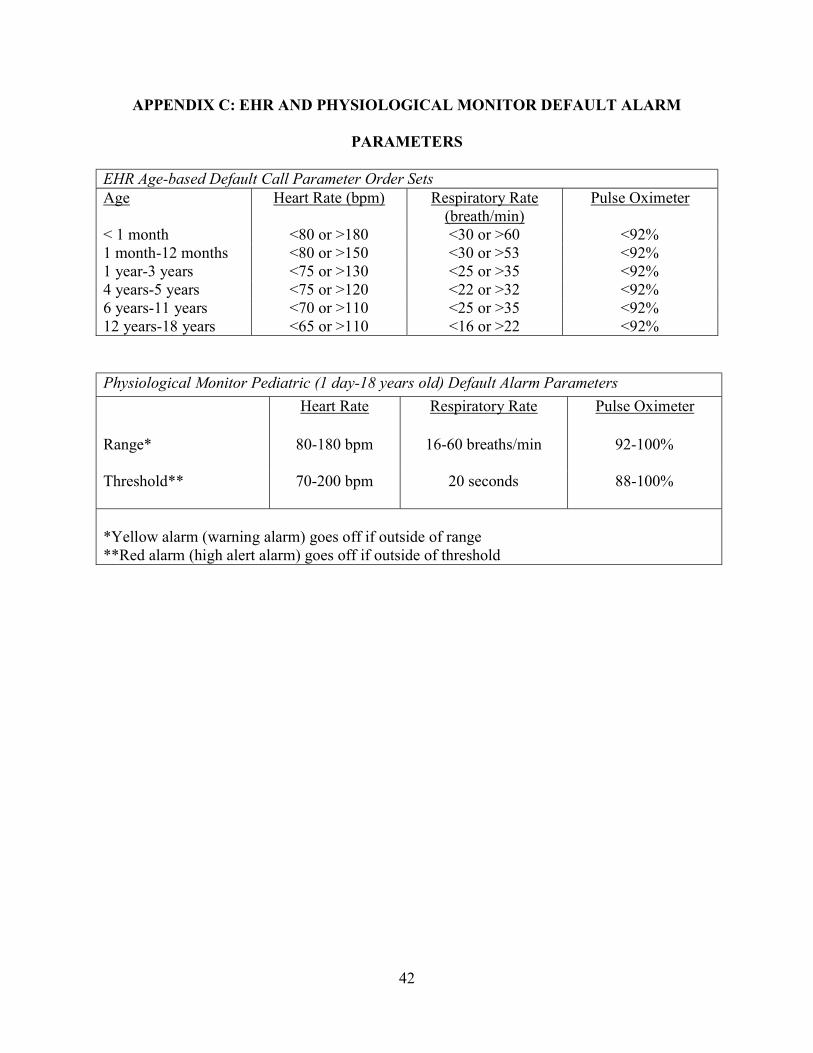
42
APPENDIX C: EHR AND PHYSIOLOGICAL MONITOR DEFAULT ALARM
PARAMETERS
EHR Age-based Default Call Parameter Order Sets Age Heart Rate (bpm) Respiratory Rate
(breath/min) Pulse Oximeter
< 1 month <80 or >180 <30 or >60 <92% 1 month-12 months <80 or >150 <30 or >53 <92% 1 year-3 years <75 or >130 <25 or >35 <92% 4 years-5 years <75 or >120 <22 or >32 <92% 6 years-11 years <70 or >110 <25 or >35 <92% 12 years-18 years <65 or >110 <16 or >22 <92%
Physiological Monitor Pediatric (1 day-18 years old) Default Alarm Parameters
Heart Rate Respiratory Rate Pulse Oximeter
Range* 80-180 bpm 16-60 breaths/min 92-100%
Threshold** 70-200 bpm 20 seconds 88-100%
*Yellow alarm (warning alarm) goes off if outside of range **Red alarm (high alert alarm) goes off if outside of threshold
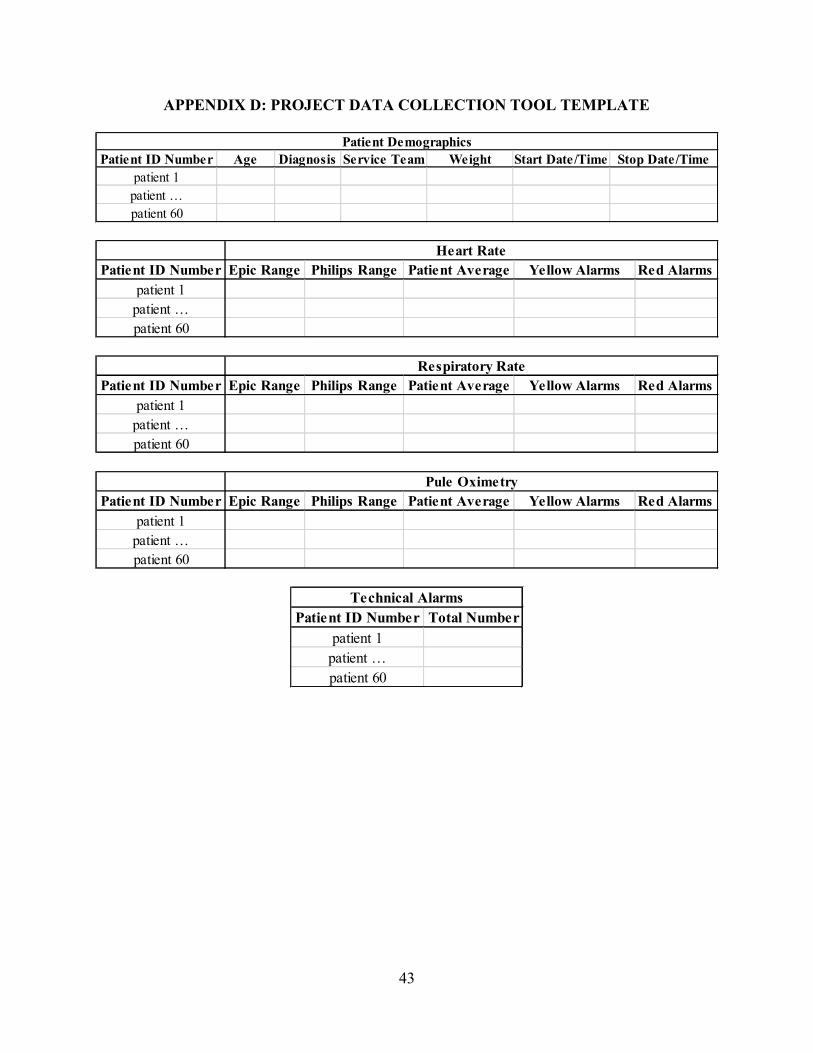
43
APPENDIX D: PROJECT DATA COLLECTION TOOL TEMPLATE
Patient ID Number Age Diagnosis Service Team Weight Start Date/Time Stop Date/Timepatient 1
patient …patient 60
Patient Demographics
Patient ID Number Epic Range Philips Range Patient Average Yellow Alarms Red Alarmspatient 1
patient …patient 60
Heart Rate
Patient ID Number Epic Range Philips Range Patient Average Yellow Alarms Red Alarmspatient 1
patient …patient 60
Respiratory Rate
Patient ID Number Epic Range Philips Range Patient Average Yellow Alarms Red Alarmspatient 1
patient …patient 60
Pule Oximetry
Patient ID Number Total Numberpatient 1
patient …patient 60
Technical Alarms
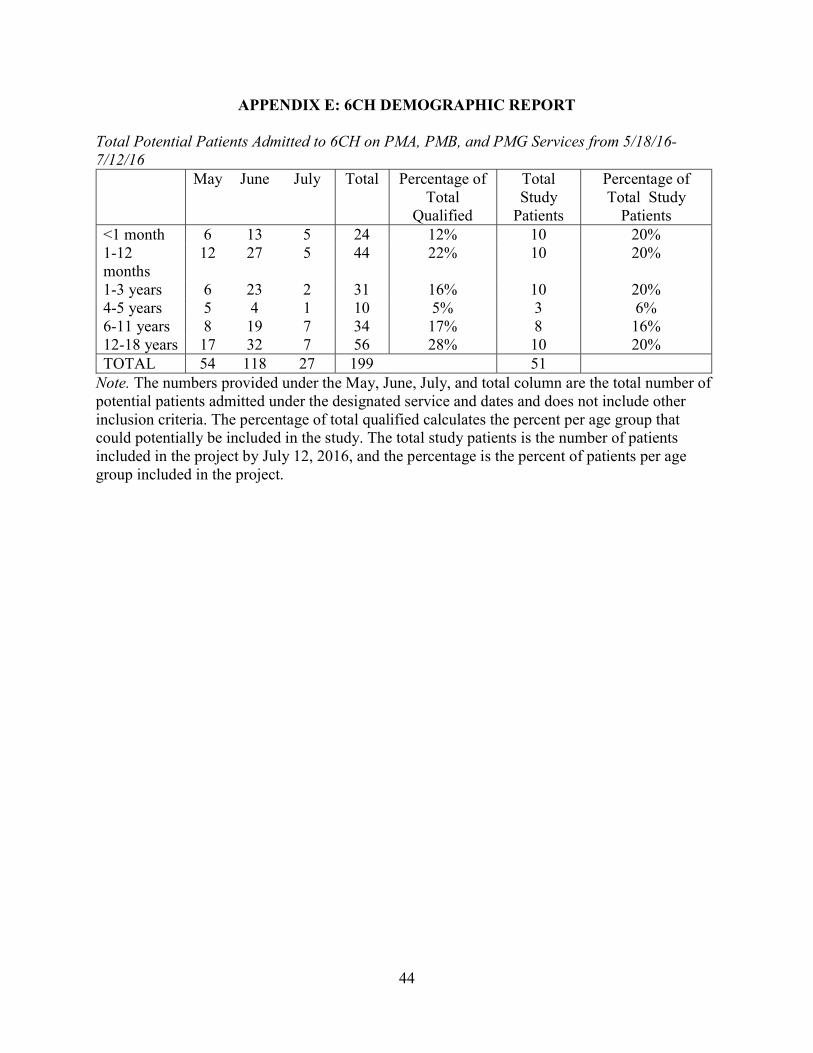
44
APPENDIX E: 6CH DEMOGRAPHIC REPORT
Total Potential Patients Admitted to 6CH on PMA, PMB, and PMG Services from 5/18/16-7/12/16 May June July Total Percentage of
Total Qualified
Total Study
Patients
Percentage of Total Study
Patients <1 month 6 13 5 24 12% 10 20% 1-12 months
12 27 5 44 22% 10 20%
1-3 years 6 23 2 31 16% 10 20% 4-5 years 5 4 1 10 5% 3 6% 6-11 years 8 19 7 34 17% 8 16% 12-18 years 17 32 7 56 28% 10 20% TOTAL 54 118 27 199
51
Note. The numbers provided under the May, June, July, and total column are the total number of potential patients admitted under the designated service and dates and does not include other inclusion criteria. The percentage of total qualified calculates the percent per age group that could potentially be included in the study. The total study patients is the number of patients included in the project by July 12, 2016, and the percentage is the percent of patients per age group included in the project.
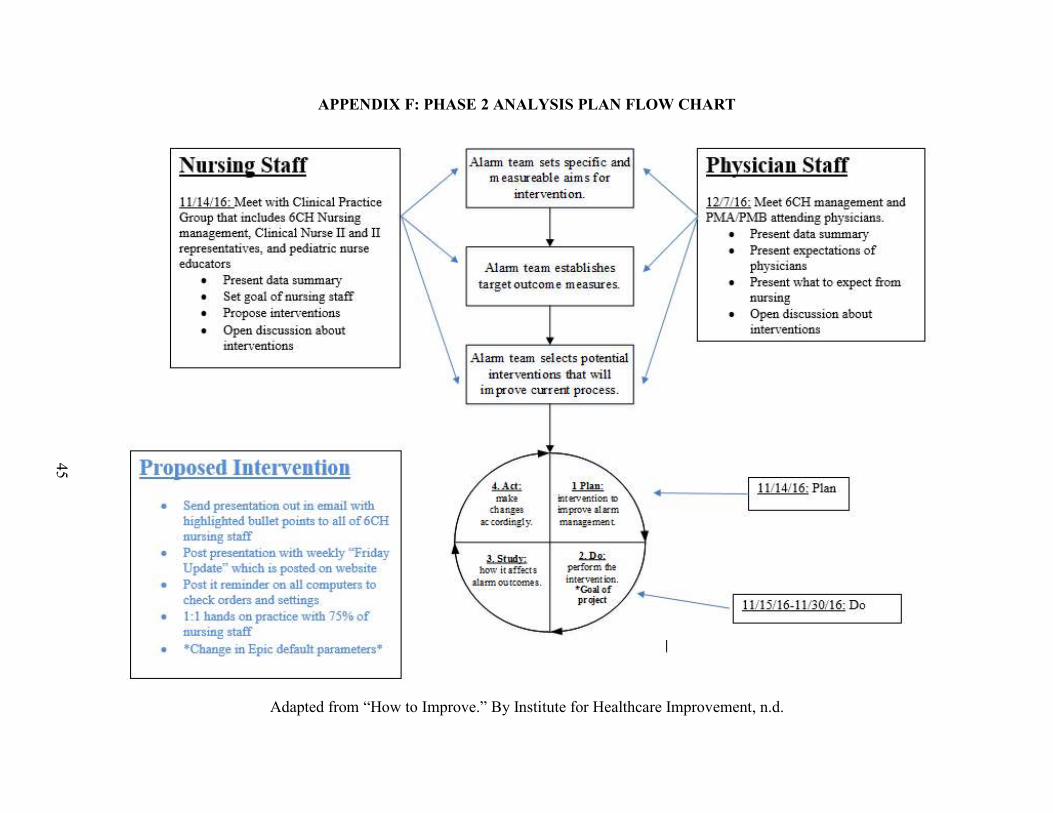
APPENDIX F: PHASE 2 ANALYSIS PLAN FLOW CHART
Adapted from “How to Improve.” By Institute for Healthcare Improvement, n.d.
45
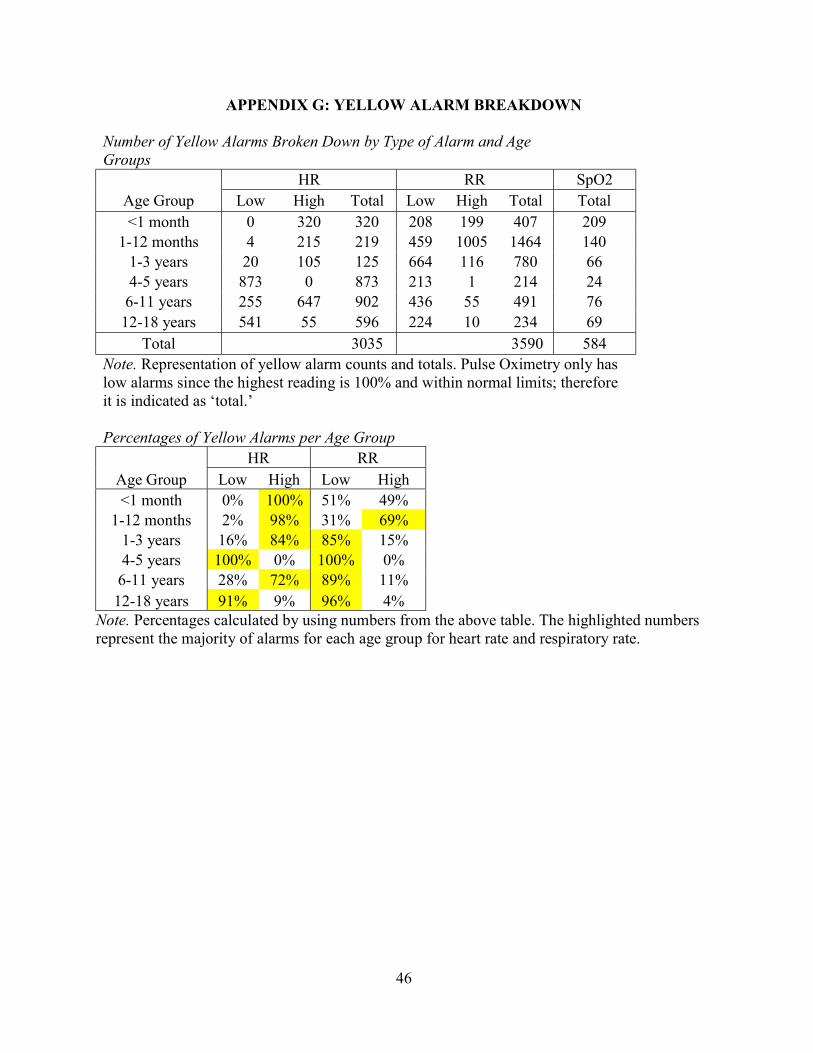
46
APPENDIX G: YELLOW ALARM BREAKDOWN
Number of Yellow Alarms Broken Down by Type of Alarm and Age Groups
HR RR SpO2 Age Group Low High Total Low High Total Total <1 month 0 320 320 208 199 407 209
1-12 months 4 215 219 459 1005 1464 140 1-3 years 20 105 125 664 116 780 66 4-5 years 873 0 873 213 1 214 24
6-11 years 255 647 902 436 55 491 76 12-18 years 541 55 596 224 10 234 69
Total 3035 3590 584 Note. Representation of yellow alarm counts and totals. Pulse Oximetry only has low alarms since the highest reading is 100% and within normal limits; therefore it is indicated as ‘total.’ Percentages of Yellow Alarms per Age Group
HR RR Age Group Low High Low High <1 month 0% 100% 51% 49%
1-12 months 2% 98% 31% 69% 1-3 years 16% 84% 85% 15% 4-5 years 100% 0% 100% 0%
6-11 years 28% 72% 89% 11% 12-18 years 91% 9% 96% 4%
Note. Percentages calculated by using numbers from the above table. The highlighted numbers represent the majority of alarms for each age group for heart rate and respiratory rate.
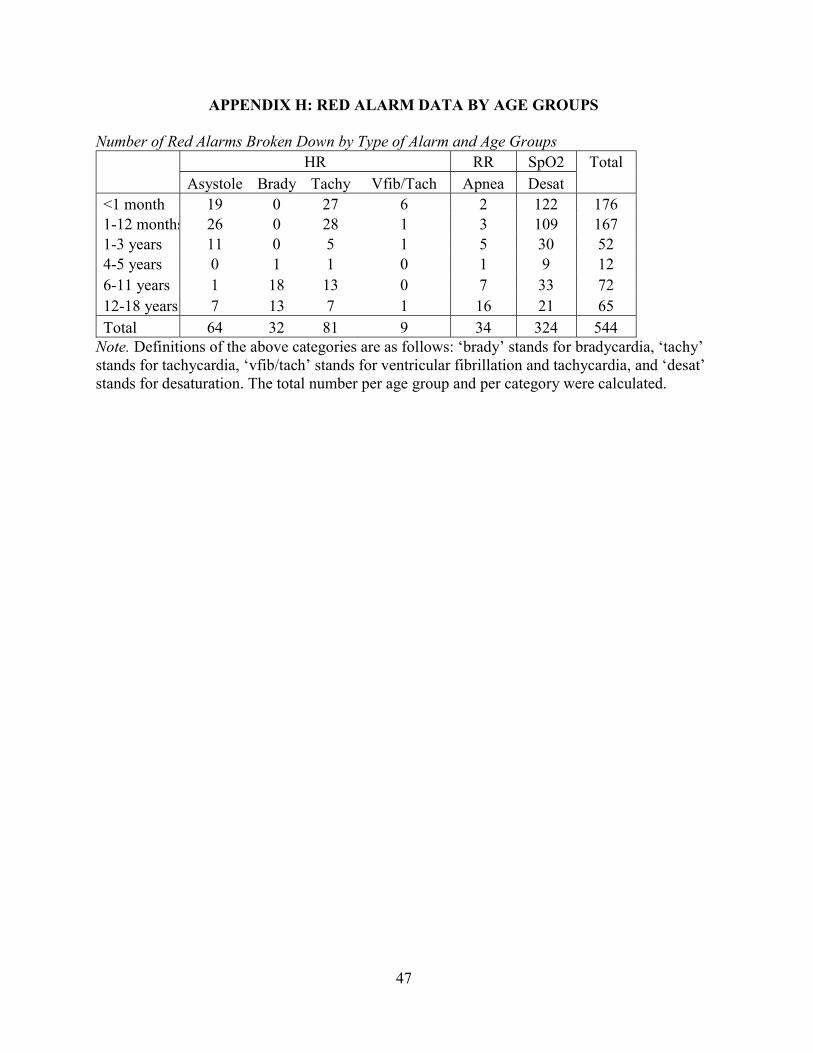
47
APPENDIX H: RED ALARM DATA BY AGE GROUPS
Number of Red Alarms Broken Down by Type of Alarm and Age Groups
HR RR SpO2 Total
Asystole Brady Tachy Vfib/Tach Apnea Desat <1 month 19 0 27 6 2 122 176 1-12 months 26 0 28 1 3 109 167 1-3 years 11 0 5 1 5 30 52 4-5 years 0 1 1 0 1 9 12 6-11 years 1 18 13 0 7 33 72 12-18 years 7 13 7 1 16 21 65 Total 64 32 81 9 34 324 544
Note. Definitions of the above categories are as follows: ‘brady’ stands for bradycardia, ‘tachy’ stands for tachycardia, ‘vfib/tach’ stands for ventricular fibrillation and tachycardia, and ‘desat’ stands for desaturation. The total number per age group and per category were calculated.
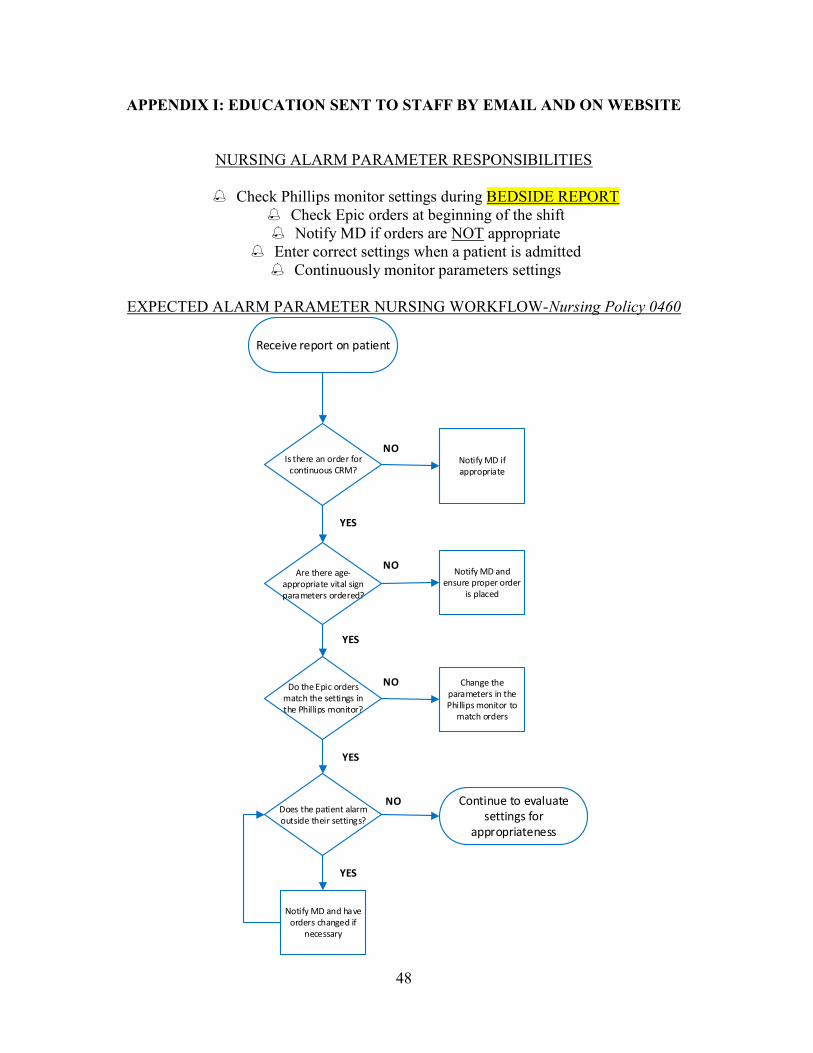
48
APPENDIX I: EDUCATION SENT TO STAFF BY EMAIL AND ON WEBSITE
NURSING ALARM PARAMETER RESPONSIBILITIES
Check Phillips monitor settings during BEDSIDE REPORT
Check Epic orders at beginning of the shift Notify MD if orders are NOT appropriate
Enter correct settings when a patient is admitted Continuously monitor parameters settings
EXPECTED ALARM PARAMETER NURSING WORKFLOW-Nursing Policy 0460
Receive report on patient
Is there an order for continuous CRM?
Notify MD if appropriate
Are there age-appropriate vital sign parameters ordered?
Notify MD and ensure proper order
is placed
Do the Epic orders match the settings in the Phillips monitor?
Change the parameters in the Phillips monitor to
match orders
Does the patient alarm outside their settings?
Continue to evaluate settings for
appropriateness
Notify MD and have orders changed if
necessary
YES
YES
YES
YES
NO
NO
NO
NO
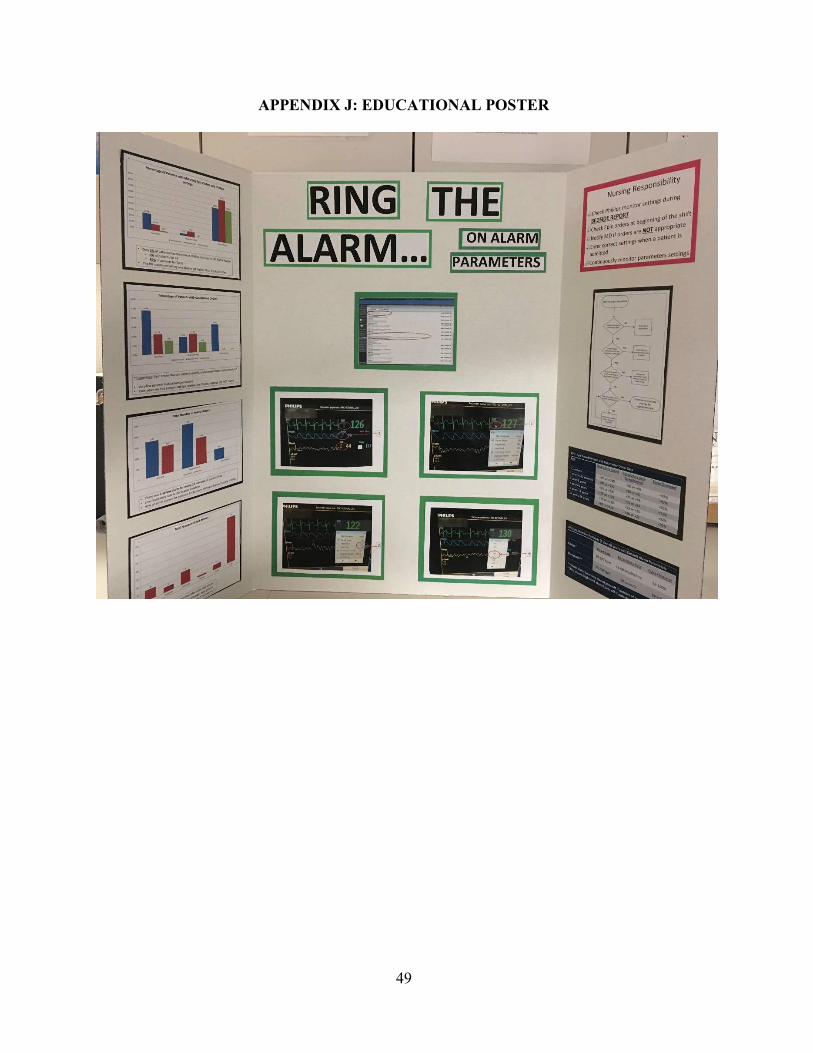
49
APPENDIX J: EDUCATIONAL POSTER

50
APPENDIX K: COMPUTER REMINDER CARD

51
APPENDIX L: INSERVICE TRAINING GUIDE
RING THE ALARM ON ALARM PARAMETERS IN-SERVICE
Demonstrate how to change parameters on central monitor Explain what yellow and red alarms are Return demonstration: program these settings:
o Heart Rate: 60-100 o Respiratory Rate: 14-25 o Pulse Oximetry: 90-100
Verbal Quiz: o When are you supposed to check call parameters? o When do you change measurements in the physiological monitor? o Where can you change the settings? o If a patient rings outside of their settings, what do you do?
52
REFERENCES
American Association of Critical-Care Nurses. (2013). Practice alert: Alarm management. Retrieved from http://www.aacn.org/wd/practice/docs/practicealerts/alarm-management- practice-alert.pdf American Association of Critical-Care Nurses Certification Corporation. (2015). The AACN synergy model for patient care. Retrieved from http://www.aacn.org.libproxy.lib.unc. edu/wd/certifications/ content/synmodel.pcms?menu=certification Arashin, K. A. (2010). Using the synergy model to guide the practice of rapid response teams. Dimensions of Critical Care Nursing, 29(3), 120-124. doi:10.1097/DCC.0b013e3181d24b76 Bonafide, C. P., Brady, P. W., Keren, R., Conway, P. H., Marsolo, K., & Daymont, C. (2013). Development of heart and respiratory rate percentile curves for hospitalized children. Pediatrics, 131(4), e1150-7. doi:10.1542/peds.2012-2443 Bonafide, C., P., Zander, M., Graham, C., Sarkis, Weirich Paine, C., M., Rock, W., Rich,
A.,…Keren, R. (2014). Video methods for evaluating physiologic monitor alarms and alarm responses. Biomedical Instrumentation & Technology, 48(3), 220-230. doi:10.2345/0899-8205-48.3.220
Burgess, L. P. A., Herdman, T. H., Berg, B. W., Feaster, W. W., & Hebsur, S. (2009). Alarm limit settings for early warning systems to identify at-risk patients. Journal of Advanced Nursing, 65(9), 1844-1852. doi: 10.1111/j.1365-2648.2009.05048.x
Braungart, M. M., & Braungart, R. G. (2015). Educational and learning theories. In J. B. Butts & K. L. Rich (Eds.), Philosophies and theories for advanced nursing practice (pp. 195- 234). Burlington, MA: Jones & Bartlett Learning, LLC, an Ascend Learning Company Curley, M. (1998). Patient-nurse synergy: Optimizing patients' outcomes. American Journal of Critical Care, 7(1), 64-72. Retrieved from https://authibuncedu.libproxy.lib.unc.edu /ezproxy_auth.php?url=http://search.ebscohost.com.libproxy.lib.unc.edu /login.aspx?direct=true&db=rzh&AN=1998007363&site=ehost-live&scope=site Cvach, M. (2012). Monitor alarm fatigue: An integrative review. Biomedical Instrumentation &
Technology, 46(4), 268-277. Retrieved from https://auth-lib-unc-edu.libproxy.lib.unc.edu /ezproxy_auth.php?url=http://search.ebscohost.com. libproxy.lib.unc.edu/login.aspx? direct=true&db= rzh&AN=2011627644&site=ehost-live&scope=site
Dandoy, C. E., Davies, S. M., Flesch, L., Hayward, M., Koons, C., Coleman, K. . . . Weiss, B. (2014). A team-based approach to reducing cardiac monitor alarms. Pediatrics, 134(6), e1686-94. doi:10.1542/peds.2014-1162
53
Drew, B. J., Harris, P., Zegre-Hemsey, J. K., Mammone, T., Schindler, D., Salas-Boni, R., . . . Hu, X. (2014). Insights into the problem of alarm fatigue with physiologic monitor devices: A comprehensive observational study of consecutive intensive care unit patients. PloS One, 9(10), e110274. doi:10.1371/journal.pone.0110274
Emergency Care Research Institute. (2014). Top 10 health technology hazards for 2015. Health Devices. Retrieved from www.ecri/org/2015hazards
Fry, C. (2015). Diagnosing alarm fatigue in a children’s hospital. University of North Carolina at Chapel Hill honors project.
Funk, M., Clark, J., T., Bauld, T., J., Ott, J., C., & Coss, P. (2014). Attitudes and practices
related to clinical alarms. American Journal of Critical Care, 23(3), e9-e18. doi:10.4037/ajcc2014315
Gazarian, P. K. (2014). Nurses' response to frequency and types of electrocardiography alarms in a non-critical care setting: A descriptive study. International Journal of Nursing Studies, 51(2), 190-197. doi:10.1016/j.ijnurstu.2013.05.014
Graham, K. C., & Cvach, M. (2010). Monitor alarm fatigue: Standardizing use of physiological monitors and decreasing nuisance alarms. American Journal of Critical Care, 19(1), 28-35. doi:10.4037/ajcc2010651
Gralton, K., S., & Brett, S., A. (2012). Integrating the synergy model for patient care at Children's Hospital of Wisconsin. Journal of Pediatric Nursing, 27(1), 74-81. doi:10.1016/j.pedn.2011.06.007 Hu, X., Sapo, M., Nenov, V., Barry, T., Kim, S., Do, D. H., . . . Martin, N. (2012). Predictive
combinations of monitor alarms preceding in-hospital code blue events. Journal of Biomedical Informatics, 45(5), 913-921. doi: 10.1016/j.jbi.2012.03.001
Institute for Health care Improvement. (n.d.) How to improve. Retrieved from
http://www.ihi.org/resources/Pages/HowtoImprove/default.aspx
Kaplow, R. (2003). AACN synergy model for patient care: A framework to optimize outcomes. Critical Care Nurse, Suppl, 27-30. Retrieved from https://authlibuncedu.libproxy.lib. unc.edu/ezproxy_auth.php ?url=http://search.ebscohost.com.libproxy.lib.unc.edu/login. aspx?direct=true&db=rzh&AN=2003053278&site=ehost-live&scope=site Kaplow, R., & Reed, K. D. (2008). The AACN synergy model for patient care: A nursing model as a force of magnetism. Nursing Economics, 26(1), 17-25. Retrieved from https://auth-lib-unc- edu.libproxy.lib.unc.edu/ezproxy_auth.php?url=http://search. ebscohost.com.libproxy.lib.unc.edu/login.aspx?direct=true&db=rzh&AN= 2009812503&site=ehost-live&scope=site
54
Kerfoot, K. M., & Cox, M. (2005). The synergy model: The ultimate mentoring model. Critical Care Nursing Clinics of North America, 17(2), 109-112. Retrieved from https://auth-lib- unc-edu.libproxy.lib.unc.edu/ezproxy_auth.php?url=http://search.ebscohost.com. libproxy.lib.unc.edu/login.aspx?direct=true&db=rzh&AN =2005115763&site=ehost- live&scope=site Kerfoot, K. M., Lavandero, R., Cox, M., Triola, N., Pacini, C., & Hanson, M. D. (2006).
Conceptual models and the nursing organization: Implementing the AACN synergy model for patient care. Nurse Leader, 4(4), 20-26. doi:http://dx.doi.org.libproxy.lib.unc.edu/ 10.1016/j.mnl.2006.05.009
Konkani, A., Oakley, B., & Bauld, T., J. (2012). Reducing hospital noise: A review of medical
device alarm management. Biomedical Instrumentation & Technology, 46(6), 478-487. doi:10.2345/0899-8205-46.6.478
Pacini, C. M. (2005). Synergy: A framework for leadership development and transformation. Critical Care Nursing Clinics of North America, 17(2), 113-119. doi:10.1016/j.ccell.2005.02.001 Raymer, K.E., Bergstrom, J., & Nyce, J.M. (2013). Anaesthesia monitor alarms: A theory-
driven approach. Ergonomics, 55(12), 1487-1501. doi: 10.1080/00140139.2012.722695
Tahir, D. (2015). Contact-free sensor cuts alarm fatigue. Modern Health care, 45(6). Retrieved from http://vb3lk7eb4t.search.serialssolutions.com.libproxy.lib.unc.edu/?genre=article &isbn=&issn=01607480&title=Modern%20Health care&volume=45&issue=6&date =201 50209&atitle=Contactfree%20sensor%20cuts%20alarm%20fatigue.&aulast =Tahir,%20D arius &spage=0027&sid=EBSCO:CINAHL%20Plus%20with %20Full%20Text&pid= Talley, L., B., Hooper, J., Jacobs, B., Guzzetta, C., McCarter, R., Sill, A., . . .Wilson, S., L.
(2011). Cardiopulmonary monitors and clinically significant events in critically ill children. Biomedical Instrumentation & Technology, 45, 38-45. doi:10.2345/0899-8205-45.s1.38
The Joint Commission. (2013a). Sentinel event alert: Medical device alarm safety in hospitals issue 50. Retrieved from http://www.jointcommission.org/assets/1/18/sea_50_alarms_4_5_13_final1.pdf The Joint Commission. (2013b). The Joint Commission announces 2014 national patient safety goal. Joint Commission Perspectives, 33(7), 1-4. Retrieved from http://www.jointcommission.org/assets/1/18/jcp0713_announce_new_nspg.pdf The Joint Commission. (2016). Summary data of sentinel events reviewed by The Joint Commission. Retrieved from http://www.jointcommission.org/assets/1/18/20042015_SE_Stats_Summary.pdf
55
University of North Carolina Health Care. (2015). About UNC Children’s. Retrieved from http://www.uncchildrens.org/uncmc/unc-childrens/about-us/ Walsh-Irwin, C., & Jurgens, C., Y. (2015). Proper skin preparation and electrode placement decreases alarms on a telemetry unit. Dimensions of Critical Care Nursing, 34(3), 134- 139. doi:10.1097/DCC.0000000000000108 West, P., Abbott, P., & Probst, P. (2014). Alarm fatigue: A concept analysis. Online Journal of Nursing Informatics, 18(2). Retrieved from http://www.himss.org/ResourceLibrary/GenResourceDetail.aspx?ItemNumber=30534


