Embed Size (px)
Citation preview
Analyst PresentationFY18 Results
28 February 2019
CIMB Group Holdings

Gross Loan (RM)
343.8bil+7.0% Y-o-Y
NetNet Profit (RM)
4,656mil+4.0% Y-o-Y
Key Financial Highlights
2
Notes: ^ Includes CSI gain of RM163mil. Excludes CPAM & CPIAM gain of RM928mil
~ Excluding bad bank
ROE
9.6%Flat Y-o-Y
Cost-to-Income
52.6%-80bps Y-o-Y
Loan Loss Charge
0.41%-28bps Y-o-Y
CET1
12.6%+40bps Y-o-Y
^^ ~
^

Consumer and Commercial Banking Did Well(RM ’mil)
Positive Provisions Trajectory(RM ’mil)
Weaker Wholesale Banking Revenue (RM ’mil)
Strict Cost ControlsOperating Costs (RM ’mil)
Key Business/Operational Highlights
3
NII NoII
+15.2% Y-o-Y
Consumer Commercial
+180.1% Y-o-YLLC
Loan
Provisions
5,958
4,836
2,2991,632
3,2043,659
-18.8% Y-o-Y
20182017
*
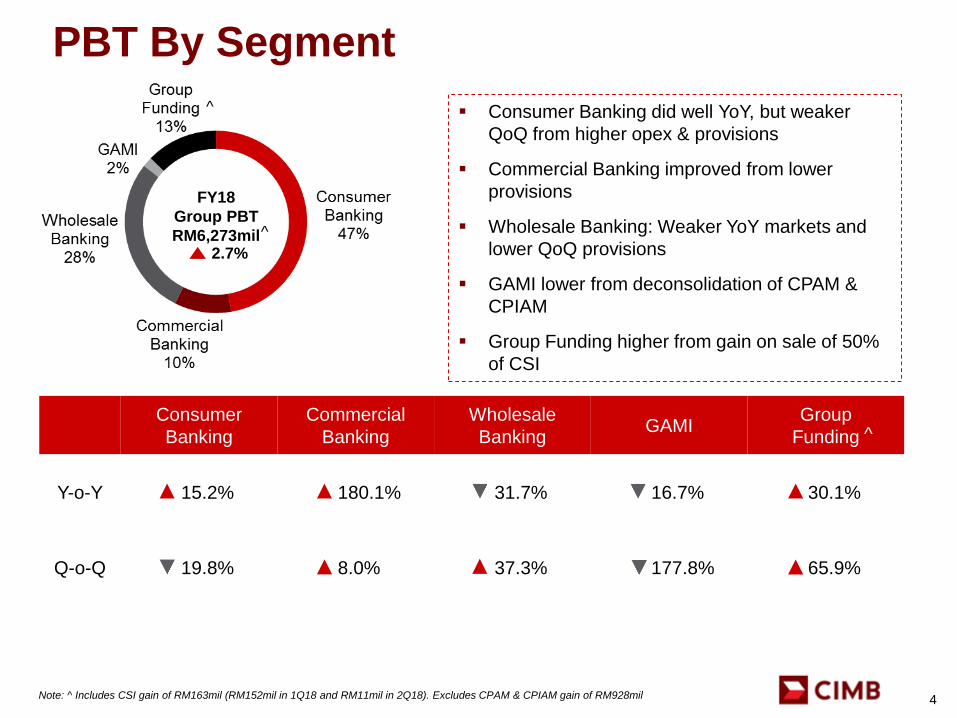
2.7%
Consumer
Banking
Commercial
Banking
Wholesale
BankingGAMI
Group
Funding
Y-o-Y 15.2% 180.1% 31.7% 16.7% 30.1%
Q-o-Q 19.8% 8.0% 37.3% 177.8% 65.9%
FY18
Group PBT
RM6,273mil
PBT By Segment
4
^
Note: ^ Includes CSI gain of RM163mil (RM152mil in 1Q18 and RM11mil in 2Q18). Excludes CPAM & CPIAM gain of RM928mil
^
^ Consumer Banking did well YoY, but weaker
QoQ from higher opex & provisions
Commercial Banking improved from lower
provisions
Wholesale Banking: Weaker YoY markets and
lower QoQ provisions
GAMI lower from deconsolidation of CPAM &
CPIAM
Group Funding higher from gain on sale of 50%
of CSI
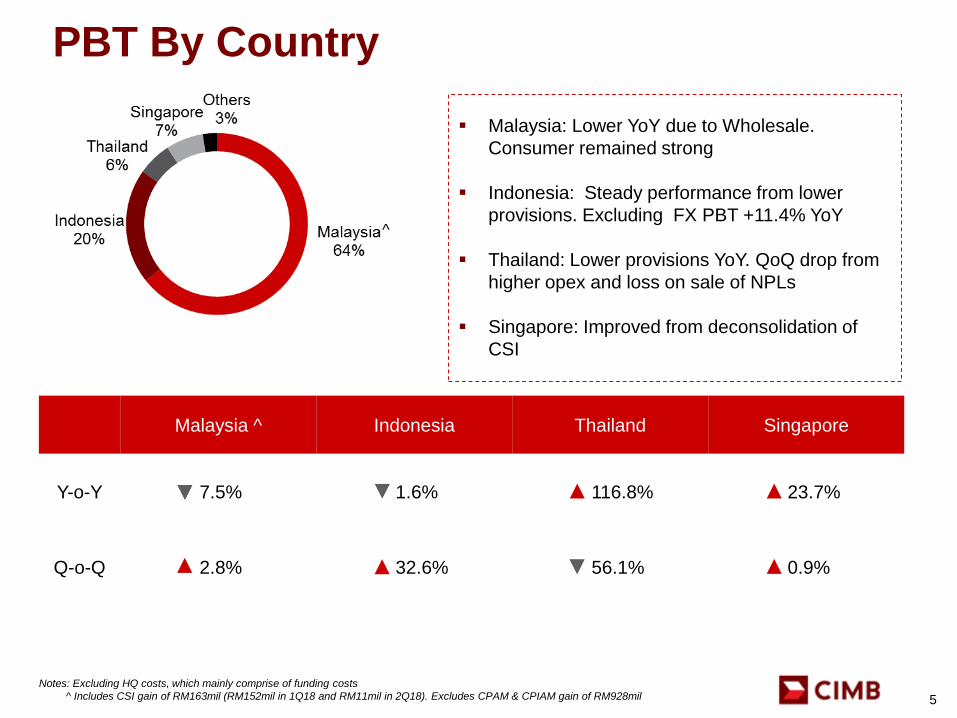
Malaysia ^ Indonesia Thailand Singapore
Y-o-Y 7.5% 1.6% 116.8% 23.7%
Q-o-Q 2.8% 32.6% 56.1% 0.9%
PBT By Country
5
Notes: Excluding HQ costs, which mainly comprise of funding costs
^ Includes CSI gain of RM163mil (RM152mil in 1Q18 and RM11mil in 2Q18). Excludes CPAM & CPIAM gain of RM928mil
^
Malaysia: Lower YoY due to Wholesale.
Consumer remained strong
Indonesia: Steady performance from lower
provisions. Excluding FX PBT +11.4% YoY
Thailand: Lower provisions YoY. QoQ drop from
higher opex and loss on sale of NPLs
Singapore: Improved from deconsolidation of
CSI
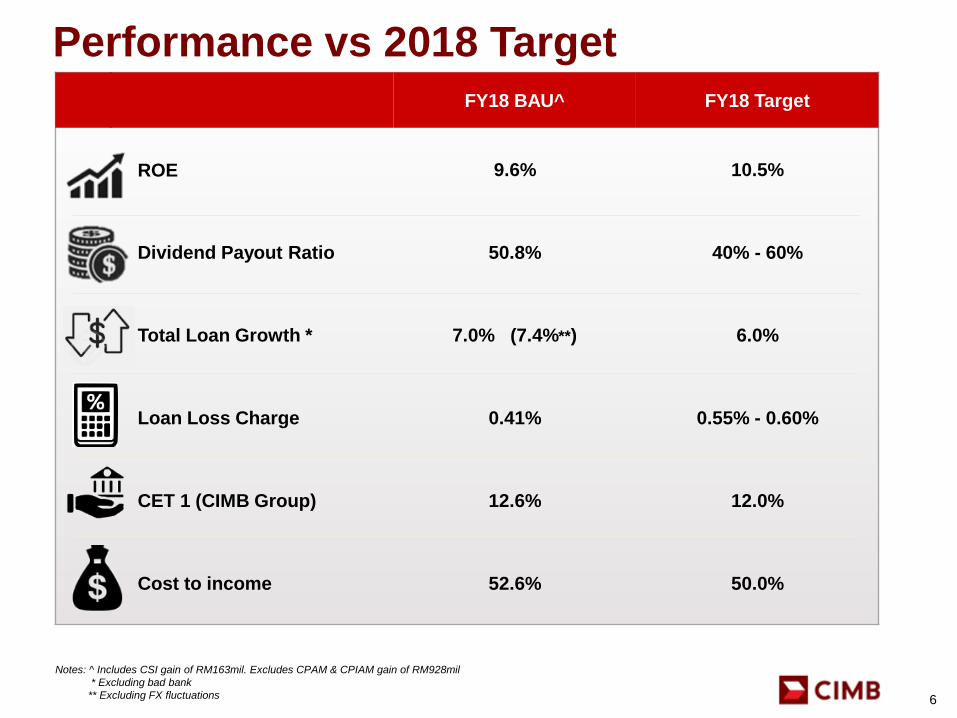
FY18 BAU^ FY18 Target
ROE 9.6% 10.5%
Dividend Payout Ratio 50.8% 40% - 60%
Total Loan Growth * 7.0% (7.4%**) 6.0%
Loan Loss Charge 0.41% 0.55% - 0.60%
CET 1 (CIMB Group) 12.6% 12.0%
Cost to income 52.6% 50.0%
Notes: ^ Includes CSI gain of RM163mil. Excludes CPAM & CPIAM gain of RM928mil
* Excluding bad bank
** Excluding FX fluctuations
Performance vs 2018 Target
6

FY18 Financials
Operating Income
8
Notes: ^ Includes CSI gain of RM163mil (RM152mil in 1Q18 and RM11mil in 2Q18). Excludes CPAM & CPIAM gain of RM928mil
* Annualised
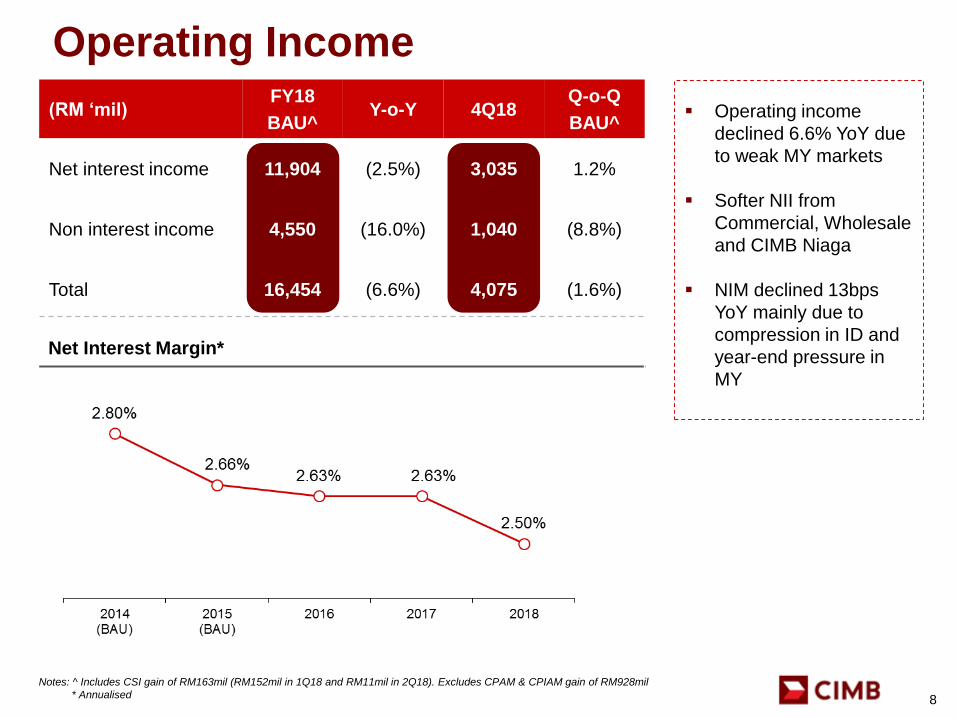
Operating income
declined 6.6% YoY due
to weak MY markets
Softer NII from
Commercial, Wholesale
and CIMB Niaga
NIM declined 13bps
YoY mainly due to
compression in ID and
year-end pressure in
MY
Net Interest Margin*
(RM ‘mil)FY18
BAU^Y-o-Y 4Q18
Q-o-Q
BAU^
Net interest income 11,904 (2.5%) 3,035 1.2%
Non interest income 4,550 (16.0%) 1,040 (8.8%)
Total 16,454 (6.6%) 4,075 (1.6%)
Cost-to-income Ratio
Operating Expenses
Note: ^ Includes CSI gain of RM163mil (RM152mil in 1Q18 and RM11mil in 2Q18). Excludes CPAM & CPIAM gain of RM928mil
^
9
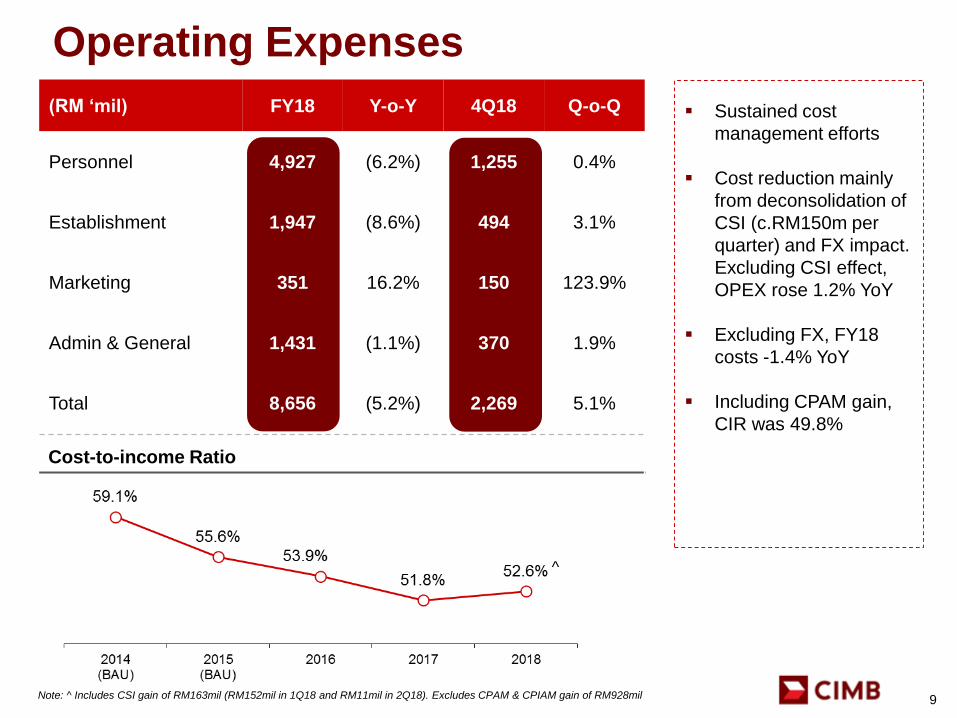
(RM ‘mil) FY18 Y-o-Y 4Q18 Q-o-Q
Personnel 4,927 (6.2%) 1,255 0.4%
Establishment 1,947 (8.6%) 494 3.1%
Marketing 351 16.2% 150 123.9%
Admin & General 1,431 (1.1%) 370 1.9%
Total 8,656 (5.2%) 2,269 5.1%
Sustained cost
management efforts
Cost reduction mainly
from deconsolidation of
CSI (c.RM150m per
quarter) and FX impact.
Excluding CSI effect,
OPEX rose 1.2% YoY
Excluding FX, FY18
costs -1.4% YoY
Including CPAM gain,
CIR was 49.8%
Allowance
Coverage (%) ^
Gross impaired
Loans Ratio (%)
Loan loss
Charge (%)
Loan Provisions
10
Notes: ^ Including regulatory reserve
~ Annualised
~
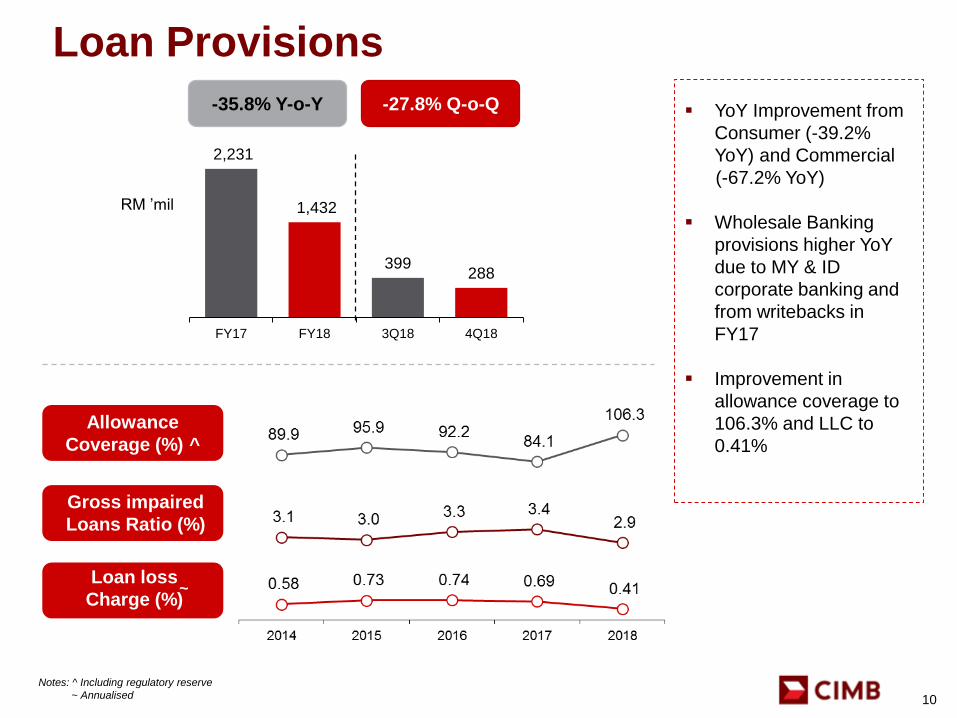
YoY Improvement from
Consumer (-39.2%
YoY) and Commercial
(-67.2% YoY)
Wholesale Banking
provisions higher YoY
due to MY & ID
corporate banking and
from writebacks in
FY17
Improvement in
allowance coverage to
106.3% and LLC to
0.41%
2,231
1,432
399288
FY17 FY18 3Q18 4Q18
RM ’mil
-27.8% Q-o-Q-35.8% Y-o-Y
Loans-to-Deposit Ratio (%)
Loan Growth by Country (Y-o-Y)
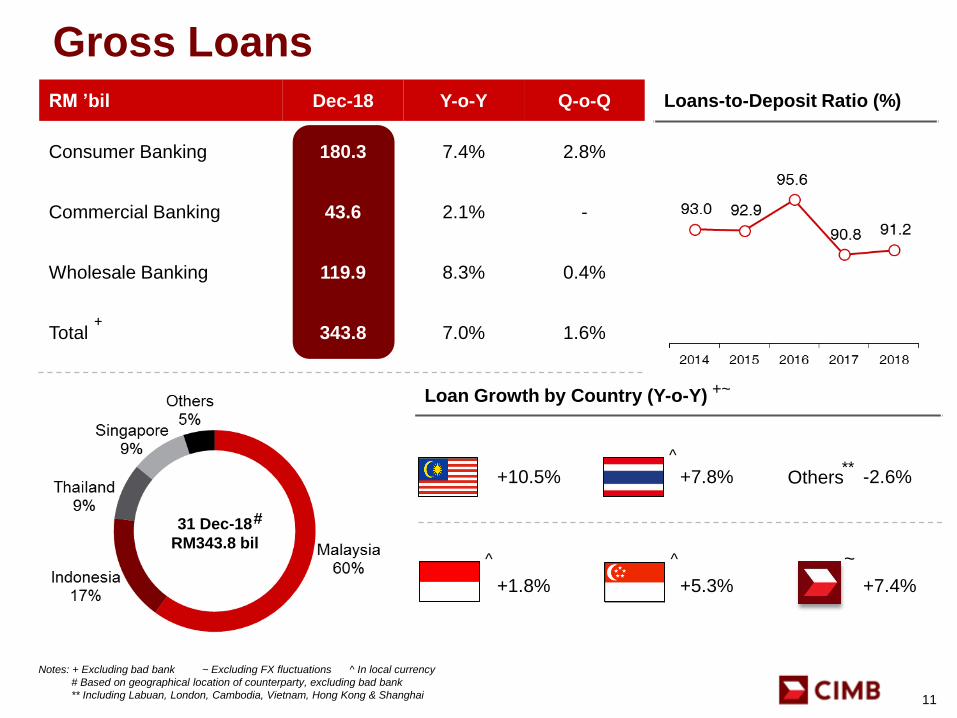
+10.5% +7.8% Others -2.6%
+1.8% +5.3% +7.4%
^ ^
^**
~
Gross Loans
11
Notes: + Excluding bad bank ~ Excluding FX fluctuations ^ In local currency
# Based on geographical location of counterparty, excluding bad bank
** Including Labuan, London, Cambodia, Vietnam, Hong Kong & Shanghai
RM ’bil Dec-18 Y-o-Y Q-o-Q
Consumer Banking 180.3 7.4% 2.8%
Commercial Banking 43.6 2.1% -
Wholesale Banking 119.9 8.3% 0.4%
Total 343.8 7.0% 1.6%+
#31 Dec-18
RM343.8 bil
+~

CASA Ratio (%)
Deposits Growth by Country (Y-o-Y)
+6.9% +4.3% Others +37.6%
+0.8% +6.5% +6.8%
Deposits
12
Notes: ~ Excluding FX fluctuations
^ In local currency
** Including Labuan, London, Cambodia, Vietnam, Hong Kong & Shanghai
RM ’bil Dec-18 Y-o-Y Q-o-Q
Consumer Banking 182.8 10.7% 7.9%
Commercial Banking 41.4 (9.8%) 2.7%
Wholesale Banking 155.4 6.4% (1.2%)
Total 379.6 6.3% 3.4%
31 Dec-18
RM379.6 bil
^**
^ ^ ~

Liquidity Coverage Ratio
CIMB Bank Global *
CIMB Islamic
CIMB Niaga
CIMB Thai
Total Capital
Capital and Liquidity Management
13
# ~^
Notes: ^ Post CIMBGH’s FY17 Second Interim Dividend of RM1,107 mil & actual corresponding DRS (81.1% take-up rate); and reinvestment of cash dividend surplus into CIMB Bank
# Post CIMBGH’s FY18 First Interim Dividend of RM1,218 mil & actual corresponding DRS (86.3% take-up rate); and reinvestment of cash dividend surplus into CIMB Bank
~ Post CIMBGH’s FY18 Second Interim Dividend of RM1,148 mil & projected corresponding DRS (80.0% take-up rate); and projected reinvestment of cash dividend surplus into CIMB Bank
* CIMB Bank + CIMB Singapore + CIMB London + CIMB Hong Kong + CIMB Shanghai + CIMB Labuan Offshore + CIMB Labuan Ltd
CET1 increased to
12.6% (+40bps YoY,
+30bps QoQ)
Surpassed CET1 target
of 12.0% for 2018
LCR remains
comfortably above
100% for all banking
entities
Proposed second
interim dividend of
12sen/share. 50.8%
payout based on BAU
net profit
14
PBT by Segments
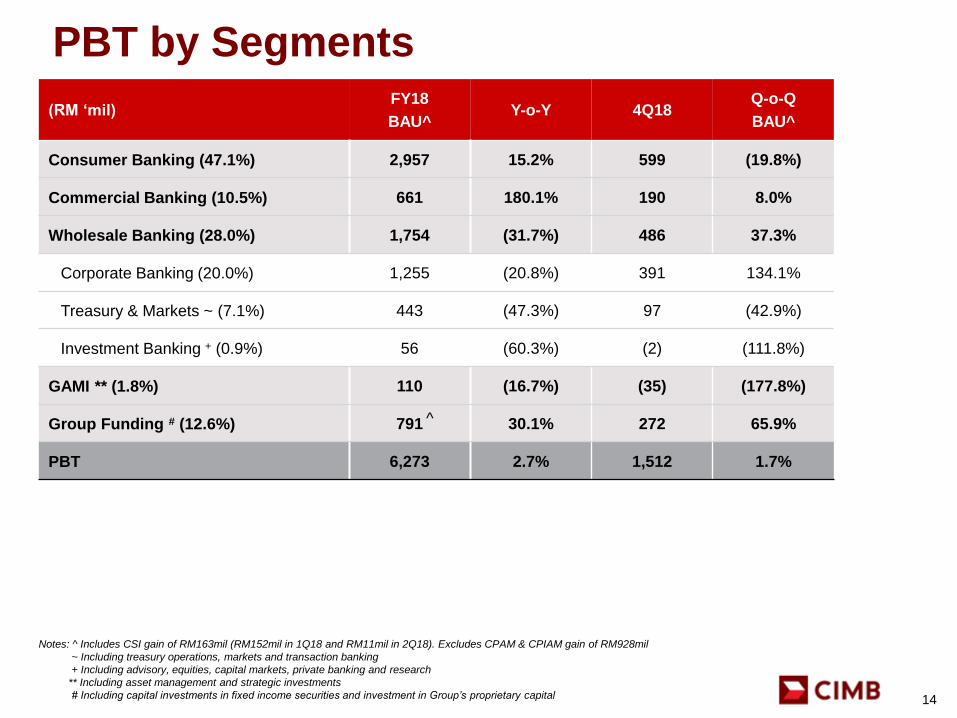
(RM ‘mil)FY18
BAU^Y-o-Y 4Q18
Q-o-Q
BAU^
Consumer Banking (47.1%) 2,957 15.2% 599 (19.8%)
Commercial Banking (10.5%) 661 180.1% 190 8.0%
Wholesale Banking (28.0%) 1,754 (31.7%) 486 37.3%
Corporate Banking (20.0%) 1,255 (20.8%) 391 134.1%
Treasury & Markets ~ (7.1%) 443 (47.3%) 97 (42.9%)
Investment Banking + (0.9%) 56 (60.3%) (2) (111.8%)
GAMI ** (1.8%) 110 (16.7%) (35) (177.8%)
Group Funding # (12.6%) 791 30.1% 272 65.9%
PBT 6,273 2.7% 1,512 1.7%
^
Notes: ^ Includes CSI gain of RM163mil (RM152mil in 1Q18 and RM11mil in 2Q18). Excludes CPAM & CPIAM gain of RM928mil
~ Including treasury operations, markets and transaction banking
+ Including advisory, equities, capital markets, private banking and research
** Including asset management and strategic investments
# Including capital investments in fixed income securities and investment in Group’s proprietary capital

Consumer Banking
15Note: * Loan base excludes bad bank
(RM ‘mil) FY18 Y-o-Y 4Q18 Q-o-Q
Net interest income 5,992 2.6% 1,487 (0.7%)
Non interest income 2,070 0.5% 528 11.2%
Operating income 8,062 2.0% 2,015 2.1%
Overhead expenses (4,532) 3.2% (1,193) 5.1%
PPOP 3,530 0.6% 822 (1.9%)
(Provisions) / Writeback (575) (39.2%) (223) 145.1%
Share of JV / Associates 2 (60.0%) - -
PBT 2,957 15.2% 599 (19.8%)
FY18 revenue growth driven by Malaysia loans, wealth
management and bancassurance
Costs remain well under control
Improved provisions YoY from comparatively higher provisions in
FY17. QoQ provisions were up from methodology refinement
Gross Loans*
RM180.3bil
7.4%
Deposits
RM182.8bil
10.7 %

Commercial Banking recalibration continues to gain traction
Overall operating expenses remain under control
Improved provisions as a result of effective control in risk and
asset quality management
Commercial Banking
16
Notes: * Loan base excludes bad bank
^ Including Labuan, London, Cambodia, Vietnam, Hong Kong & Shanghai
(RM ‘mil) FY18 Y-o-Y 4Q18 Q-o-Q
Net interest income 1,699 (3.8%) 432 0.9%
Non interest income 353 (15.1%) 68 (30.6%)
Operating income 2,052 (6.0%) 500 (4.9%)
Overhead expenses (1,131) (2.1%) (301) 7.5%
PPOP 921 (10.4%) 199 (19.1%)
(Provisions) / Writeback (260) (67.2%) (9) (87.1%)
Share of JV / Associates - - - -
PBT 661 180.1% 190 8.0%
Gross Loans*
RM43.6bil
2.1%
Deposits
RM41.4bil
9.8%
^̂
Wholesale Banking
17
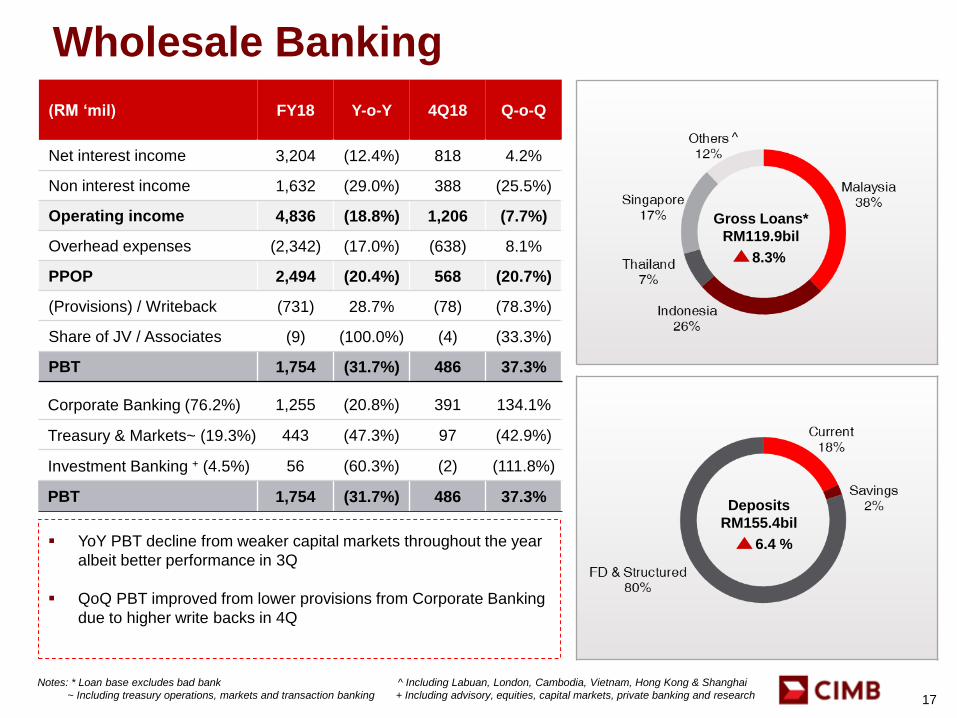
(RM ‘mil) FY18 Y-o-Y 4Q18 Q-o-Q
Net interest income 3,204 (12.4%) 818 4.2%
Non interest income 1,632 (29.0%) 388 (25.5%)
Operating income 4,836 (18.8%) 1,206 (7.7%)
Overhead expenses (2,342) (17.0%) (638) 8.1%
PPOP 2,494 (20.4%) 568 (20.7%)
(Provisions) / Writeback (731) 28.7% (78) (78.3%)
Share of JV / Associates (9) (100.0%) (4) (33.3%)
PBT 1,754 (31.7%) 486 37.3%
Corporate Banking (76.2%) 1,255 (20.8%) 391 134.1%
Treasury & Markets~ (19.3%) 443 (47.3%) 97 (42.9%)
Investment Banking + (4.5%) 56 (60.3%) (2) (111.8%)
PBT 1,754 (31.7%) 486 37.3%
YoY PBT decline from weaker capital markets throughout the year
albeit better performance in 3Q
QoQ PBT improved from lower provisions from Corporate Banking
due to higher write backs in 4Q
Gross Loans*
RM119.9bil
8.3%
Deposits
RM155.4bil
6.4 %
^
Notes: * Loan base excludes bad bank ^ Including Labuan, London, Cambodia, Vietnam, Hong Kong & Shanghai
~ Including treasury operations, markets and transaction banking + Including advisory, equities, capital markets, private banking and research
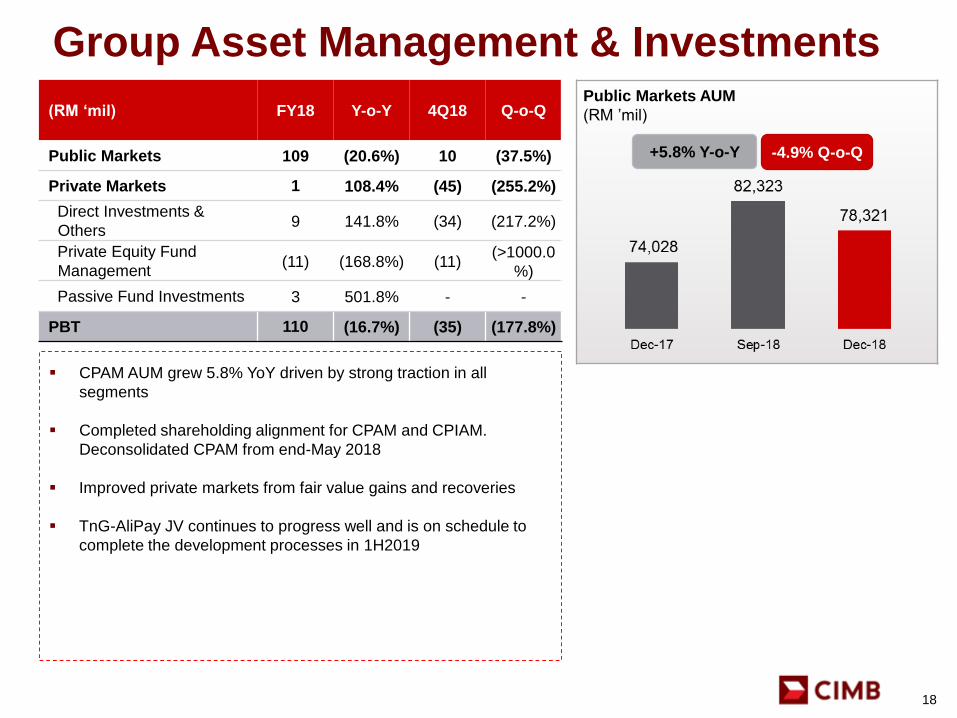
(RM ‘mil) FY18 Y-o-Y 4Q18 Q-o-Q
Public Markets 109 (20.6%) 10 (37.5%)
Private Markets 1 108.4% (45) (255.2%)
Direct Investments &
Others9 141.8% (34) (217.2%)
Private Equity Fund
Management(11) (168.8%) (11)
(>1000.0
%)
Passive Fund Investments 3 501.8% - -
PBT 110 (16.7%) (35) (177.8%)
Public Markets AUM
(RM ’mil)
CPAM AUM grew 5.8% YoY driven by strong traction in all
segments
Completed shareholding alignment for CPAM and CPIAM.
Deconsolidated CPAM from end-May 2018
Improved private markets from fair value gains and recoveries
TnG-AliPay JV continues to progress well and is on schedule to
complete the development processes in 1H2019
Group Asset Management & Investments
18
+5.8% Y-o-Y -4.9% Q-o-Q

CIMB Islamic
19
(RM ‘mil) FY18 Y-o-Y 4Q18 Q-o-Q
Net financing income 1,875 21.6% 495 2.5%
Non financing income 403 (23.1%) 83 1.2%
Operating income 2,278 10.3% 578 2.3%
Overhead expenses (716) 3.0% (181) 6.5%
PPOP 1,562 13.9% 397 0.5%
(Provisions) / Writeback (258) 50.9% (71) 54.3%
Share of JV / Associates 3 0.0% 1 100.0%
PBT 1,307 8.6% 327 (6.3%)
Islamic PBT higher YoY driven by Consumer and Corporate
segments although QoQ PBT was weaker from higher operating
expenses and provisions
Islamic Financing and Deposits grew strongly YoY at 22.8% and
18.5% respectively.
CIMB Islamic remains at #2 in Malaysia by total Islamic assets,
deposits and financing
Remain the top Global Sukuk issuer
RM ’bil
Islamic Financing^
RM ’bil
Islamic Deposits^~
Notes : ^ Numbers based on CIMB Islamic Bank Berhad
~ Including investment accounts
+18.0% CAGR +22.8% Y-o-Y
+17.2% CAGR +18.5% Y-o-Y
T18 Summary
Closing Off T18
21
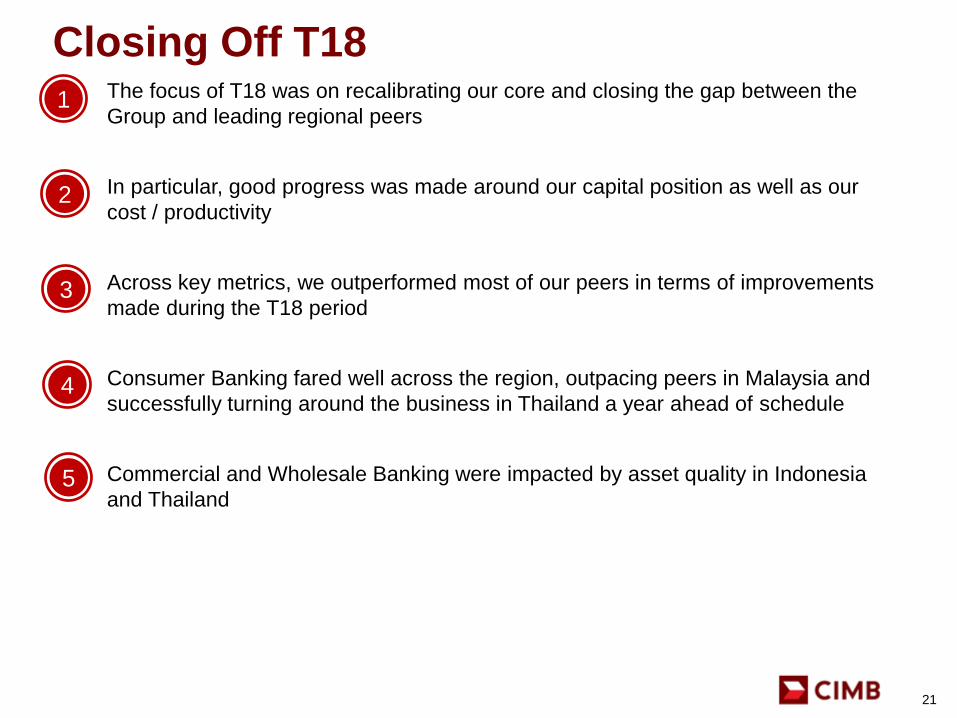
The focus of T18 was on recalibrating our core and closing the gap between the
Group and leading regional peers
In particular, good progress was made around our capital position as well as our
cost / productivity
Across key metrics, we outperformed most of our peers in terms of improvements
made during the T18 period
Consumer Banking fared well across the region, outpacing peers in Malaysia and
successfully turning around the business in Thailand a year ahead of schedule
Commercial and Wholesale Banking were impacted by asset quality in Indonesia
and Thailand
1
2
3
4
5
22
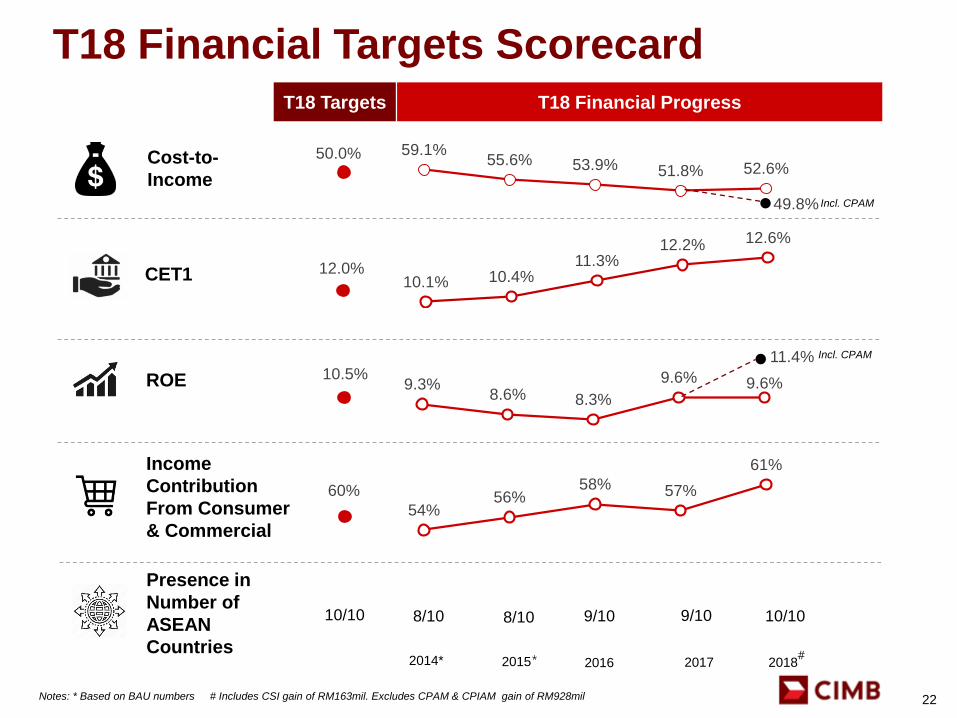
T18 Financial Targets Scorecard
50.0% 59.1%55.6% 53.9% 51.8% 52.6%
Cost-to-
Income
Income
Contribution
From Consumer
& Commercial
2015 2016 2017 2018
ROE
CET1
Notes: * Based on BAU numbers # Includes CSI gain of RM163mil. Excludes CPAM & CPIAM gain of RM928mil
* #
Presence in
Number of
ASEAN
Countries
8/10 9/10 9/10 10/10
T18 Targets
49.8%
12.0%10.1% 10.4%
11.3%12.2% 12.6%
60%
54%56%
58% 57%
61%
10.5%9.3%
8.6% 8.3%
9.6% 9.6%
11.4%
Incl. CPAM
Incl. CPAM
2014*
8/1010/10
T18 Financial Progress
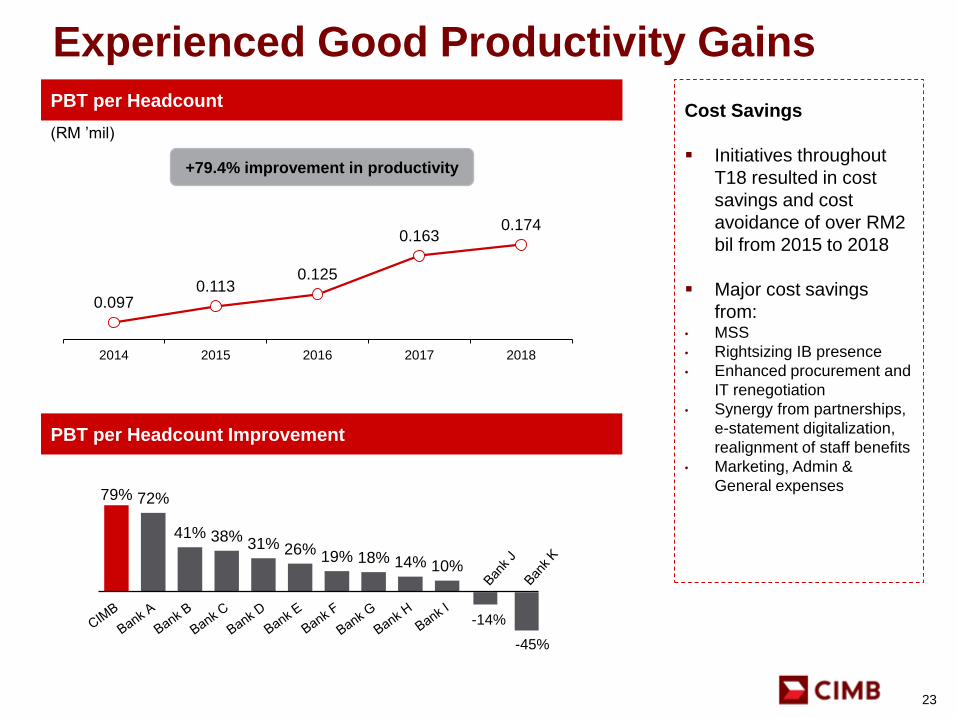
Cost Savings
Initiatives throughout
T18 resulted in cost
savings and cost
avoidance of over RM2
bil from 2015 to 2018
Major cost savings
from: • MSS
• Rightsizing IB presence
• Enhanced procurement and
IT renegotiation
• Synergy from partnerships,
e-statement digitalization,
realignment of staff benefits
• Marketing, Admin &
General expenses
Experienced Good Productivity Gains
(RM ’mil)
Source: Bloomberg data, Headcount data for competitors from publically available investor relations presentationsPBT per Headcount Improvement is the absolute percentage difference between 2014 and 2018PBT per Headcount for CIMB based on 2018 headcount, PBT per Headcount for peers based on 2017 Annual Reports
10%14%18%19%26%31%38%41%
72%79%
-14%
-45%
PBT per Headcount
PBT per Headcount Improvement
0.0970.113
0.125
0.1630.174
2014 2015 2016 2017 2018
+79.4% improvement in productivity
23
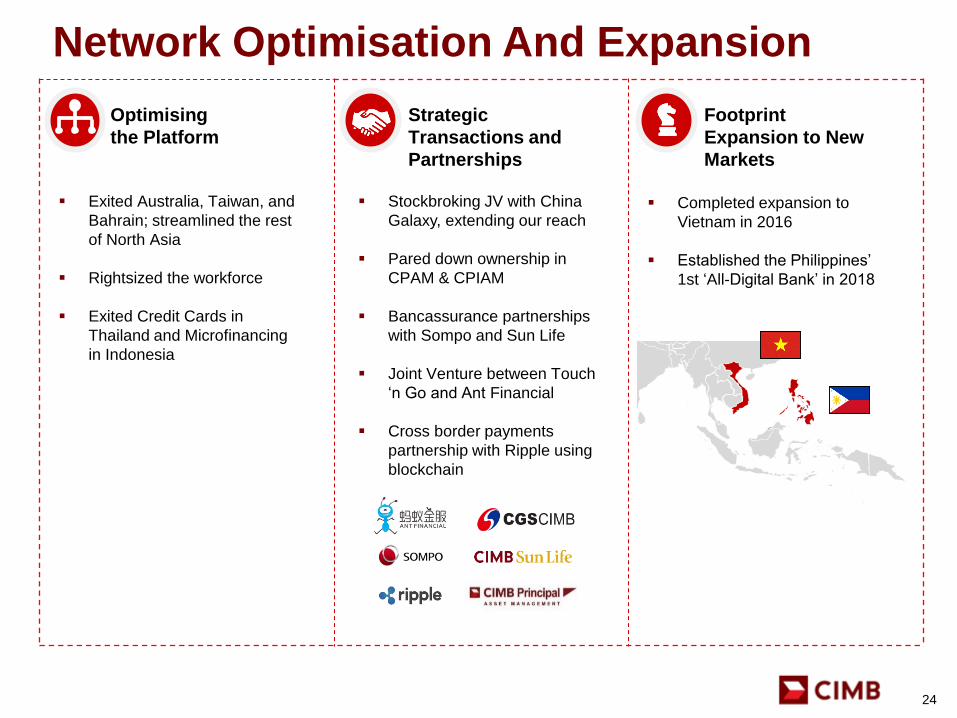
Completed expansion to
Vietnam in 2016
Established the Philippines’
1st ‘All-Digital Bank’ in 2018
Network Optimisation And Expansion
Exited Australia, Taiwan, and
Bahrain; streamlined the rest
of North Asia
Rightsized the workforce
Exited Credit Cards in
Thailand and Microfinancing
in Indonesia
Stockbroking JV with China
Galaxy, extending our reach
Pared down ownership in
CPAM & CPIAM
Bancassurance partnerships
with Sompo and Sun Life
Joint Venture between Touch
‘n Go and Ant Financial
Cross border payments
partnership with Ripple using
blockchain
Optimising
the Platform
Strategic
Transactions and
Partnerships
Footprint
Expansion to New
Markets
24
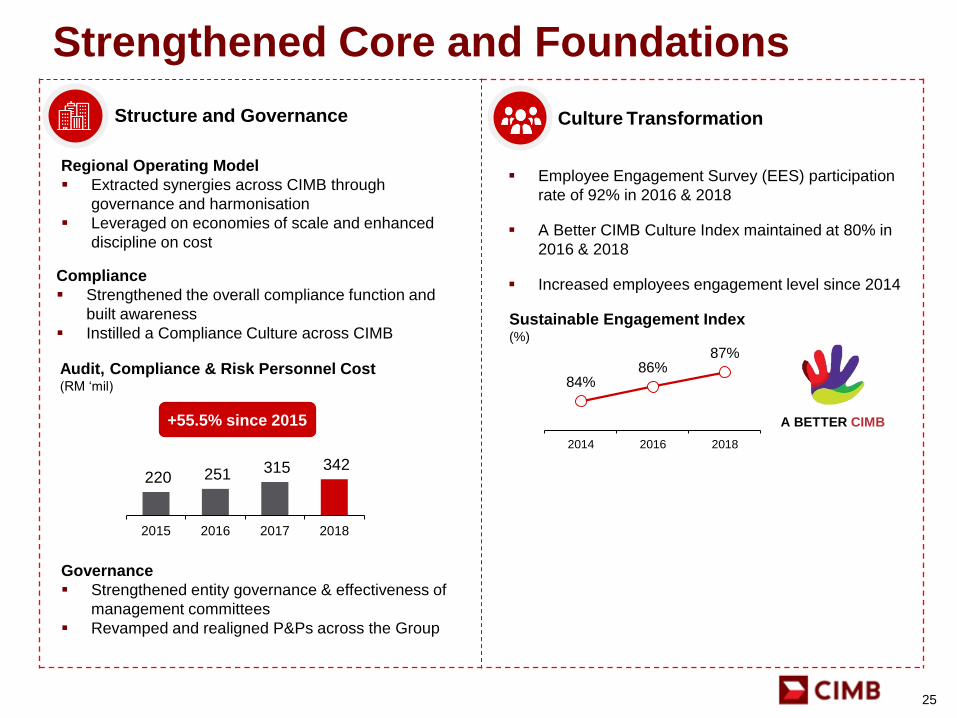
Strengthened Core and Foundations
25
Structure and Governance Culture Transformation
Regional Operating Model
Extracted synergies across CIMB through
governance and harmonisation
Leveraged on economies of scale and enhanced
discipline on cost
Employee Engagement Survey (EES) participation
rate of 92% in 2016 & 2018
A Better CIMB Culture Index maintained at 80% in
2016 & 2018
Increased employees engagement level since 2014
Audit, Compliance & Risk Personnel Cost (RM ‘mil)
Governance
Strengthened entity governance & effectiveness of
management committees
Revamped and realigned P&Ps across the Group
Compliance
Strengthened the overall compliance function and
built awareness
Instilled a Compliance Culture across CIMB
Sustainable Engagement Index
84%86%
87%
2014 2016 2018
A BETTER CIMB
Sustainable Engagement Index(%)
220 251 315 342
2015 2016 2017 2018
+55.5% since 2015

6.5
2.1
1.2
0.4
0.2
0.1
0.0
-0.7
-0.7
-0.8
-3.0
Bank C
Bank A
Bank L
Bank I
Bank J
Bank D
Bank E
Bank B
Bank F
Bank G
Bank H
Bank K
CIR Improvement
2014 – 2018 (%)
CET1 Improvement
2014 – 2018 (%)
ROE Improvement
2014 – 2018 (%)
PBT CAGR
2014 – 2018 (%)
CIMB Outperformed The Majority of Our
Regional Peers
Notes:
Source: Bloomberg data. Maybank results obtained from Macquarie Research’s report
CET1 Ratio data for Mandiri, BCA and BRI derive from public available investor relations presentations
CI/Ratio, CET1 Ratio and ROE Improvement are absolute value differences between 2014 and 2018 results
PBT, CI/Ratio, CET1 Ratio and ROE Improvement for CIMB excludes the CPAM gain of RM928mil
2018 achievement results for regional peers are based on FY18 results
-9.3
4.7
4.5
3.9
3.3
3.0
2.5
1.4
1.3
1.3
0.9
0.8
0.2
0.0
Bank A
Bank F
Bank J
Bank D
Bank G
Bank K
Bank E
Bank L
Bank C
Bank I
Bank H
Bank B
0.4
0.3
-0.8
-2.6
-3.0
-3.1
-4.4
-5.4
-5.5
-6.5
-8.8
-8.9
-9.3
Bank I
Bank B
Bank D
Bank H
Bank E
Bank G
Bank C
Bank J
Bank F
Bank L
Bank A
Bank K 1.8
2.1
3.3
4.6
5.0
5.1
7.6
7.8
8.6
9.9
10.0
12.0
13.2
Bank L
Bank K
Bank J
Bank D
Bank E
Bank G
Bank F
Bank H
Bank A
Bank B
Bank I
Bank C
26
-4.6
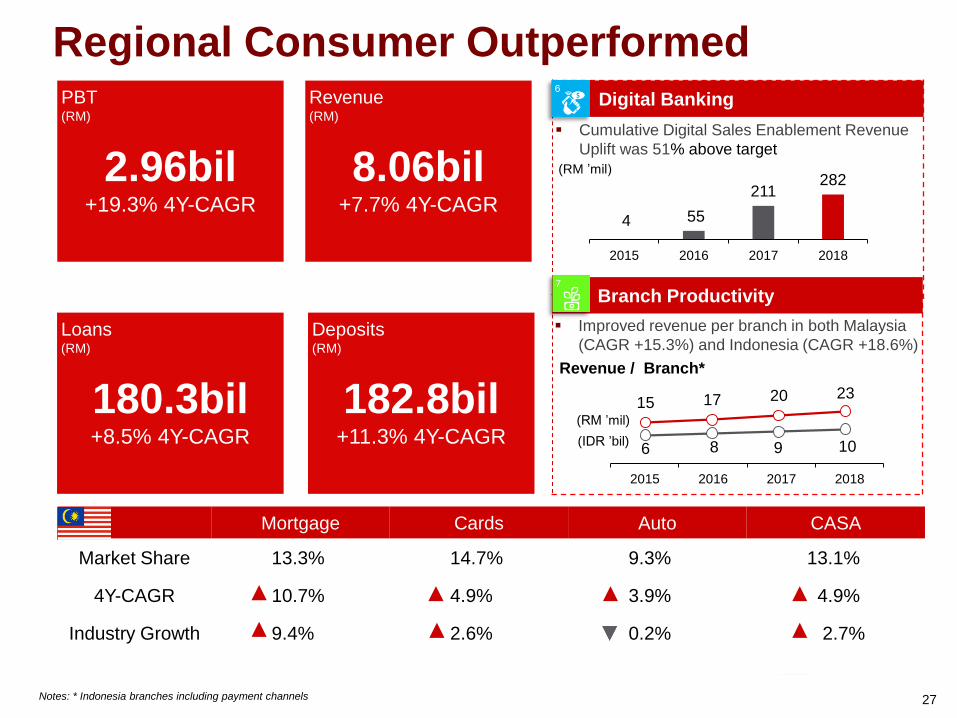
Regional Consumer Outperformed
Cumulative Digital Sales Enablement Revenue
Uplift was 51% above target
4 55
211282
2015 2016 2017 2018
Digital Banking
15 17 20 23
6 8 9 10
2015 2016 2017 2018
PBT(RM)
2.96bil+19.3% 4Y-CAGR
Revenue(RM)
8.06bil+7.7% 4Y-CAGR
Loans (RM)
180.3bil+8.5% 4Y-CAGR
Deposits (RM)
182.8bil+11.3% 4Y-CAGR
(RM ’mil)
Branch Productivity
Improved revenue per branch in both Malaysia
(CAGR +15.3%) and Indonesia (CAGR +18.6%)
(RM ’mil)
(IDR ’bil)
Revenue / Branch*
Mortgage Cards Auto CASA
Market Share 13.3% 14.7% 9.3% 13.1%
4Y-CAGR 10.7% 4.9% 3.9% 4.9%
Industry Growth 9.4% 2.6% 0.2% 2.7%
Notes: * Indonesia branches including payment channels 27

Modest Commercial & Wholesale Growth
PBT (RM)
0.66bil-1.8% 4Y-CAGR
Revenue(RM)
2.05bil+5.6% 4Y-CAGR
PPOP(RM)
0.92bil+9.6% 4Y-CAGR
Commercial Banking
Wholesale Banking
PBT (RM)
1.75bil+4.4% 4Y-CAGR
Revenue(RM)
4.84bil-1.5% 4Y-CAGR
PPOP(RM)
2.49bil+1.0% 4Y-CAGR
(RM ‘mil)
(RM ‘mil)
Commercial Banking
Provision Dropped
792
260
2017 2018
-67.2% Y-o-Y
Private Banking PBT
Improved
+35.1% 3Y-CAGR
62
153
2015 2018
28

2019 Targets
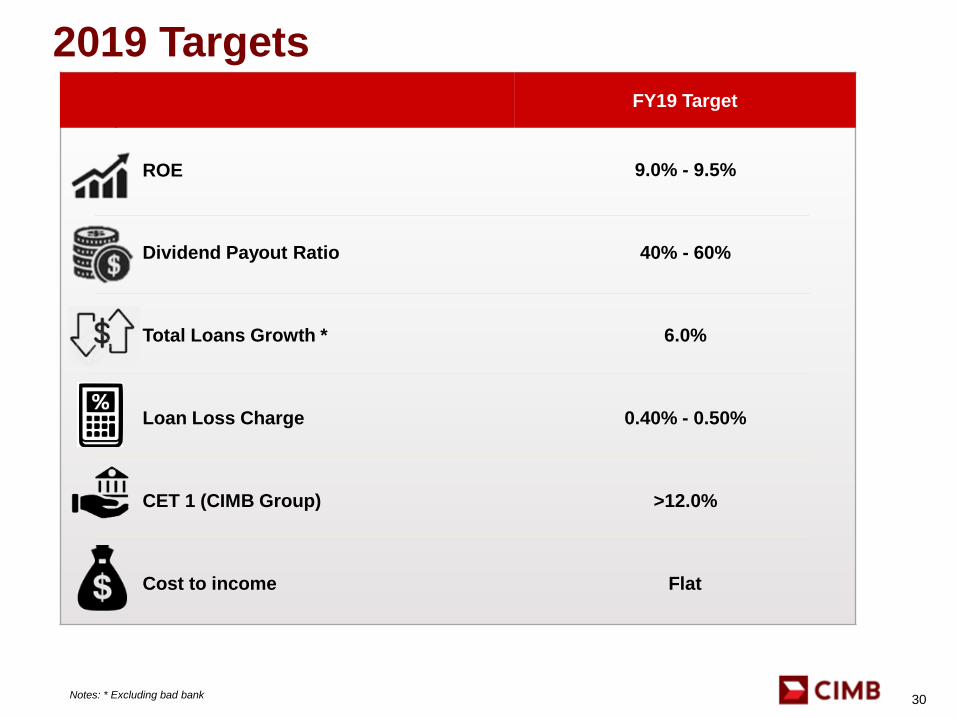
FY19 Target
ROE 9.0% - 9.5%
Dividend Payout Ratio 40% - 60%
Total Loans Growth * 6.0%
Loan Loss Charge 0.40% - 0.50%
CET 1 (CIMB Group) >12.0%
Cost to income Flat
Notes: * Excluding bad bank
2019 Targets
30

Appendices
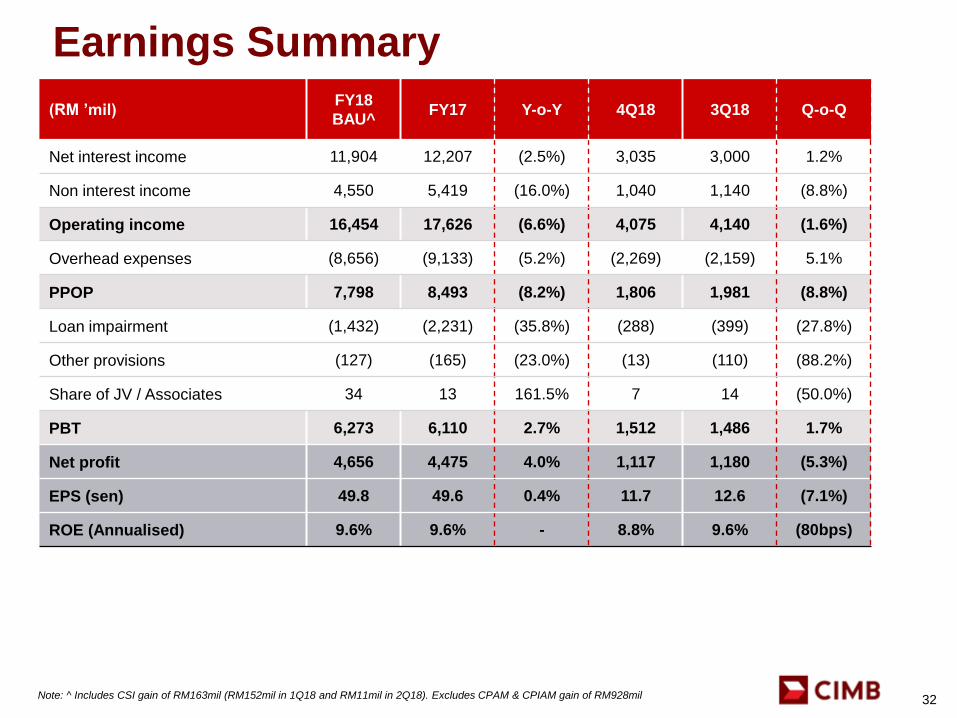
Earnings Summary
32
(RM ’mil)FY18
BAU^FY17 Y-o-Y 4Q18 3Q18 Q-o-Q
Net interest income 11,904 12,207 (2.5%) 3,035 3,000 1.2%
Non interest income 4,550 5,419 (16.0%) 1,040 1,140 (8.8%)
Operating income 16,454 17,626 (6.6%) 4,075 4,140 (1.6%)
Overhead expenses (8,656) (9,133) (5.2%) (2,269) (2,159) 5.1%
PPOP 7,798 8,493 (8.2%) 1,806 1,981 (8.8%)
Loan impairment (1,432) (2,231) (35.8%) (288) (399) (27.8%)
Other provisions (127) (165) (23.0%) (13) (110) (88.2%)
Share of JV / Associates 34 13 161.5% 7 14 (50.0%)
PBT 6,273 6,110 2.7% 1,512 1,486 1.7%
Net profit 4,656 4,475 4.0% 1,117 1,180 (5.3%)
EPS (sen) 49.8 49.6 0.4% 11.7 12.6 (7.1%)
ROE (Annualised) 9.6% 9.6% - 8.8% 9.6% (80bps)
Note: ^ Includes CSI gain of RM163mil (RM152mil in 1Q18 and RM11mil in 2Q18). Excludes CPAM & CPIAM gain of RM928mil
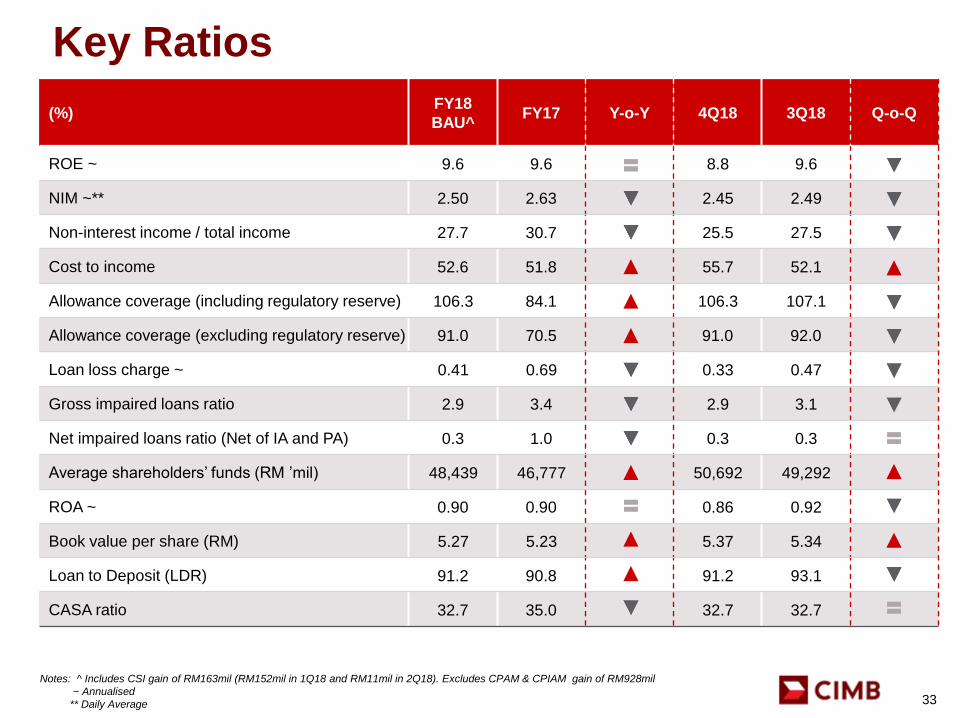
(%)FY18
BAU^FY17 Y-o-Y 4Q18 3Q18 Q-o-Q
ROE ~ 9.6 9.6 8.8 9.6
NIM ~** 2.50 2.63 2.45 2.49
Non-interest income / total income 27.7 30.7 25.5 27.5
Cost to income 52.6 51.8 55.7 52.1
Allowance coverage (including regulatory reserve) 106.3 84.1 106.3 107.1
Allowance coverage (excluding regulatory reserve) 91.0 70.5 91.0 92.0
Loan loss charge ~ 0.41 0.69 0.33 0.47
Gross impaired loans ratio 2.9 3.4 2.9 3.1
Net impaired loans ratio (Net of IA and PA) 0.3 1.0 0.3 0.3
Average shareholders’ funds (RM ’mil) 48,439 46,777 50,692 49,292
ROA ~ 0.90 0.90 0.86 0.92
Book value per share (RM) 5.27 5.23 5.37 5.34
Loan to Deposit (LDR) 91.2 90.8 91.2 93.1
CASA ratio 32.7 35.0 32.7 32.7
Key Ratios
33
Notes: ^ Includes CSI gain of RM163mil (RM152mil in 1Q18 and RM11mil in 2Q18). Excludes CPAM & CPIAM gain of RM928mil
~ Annualised
** Daily Average
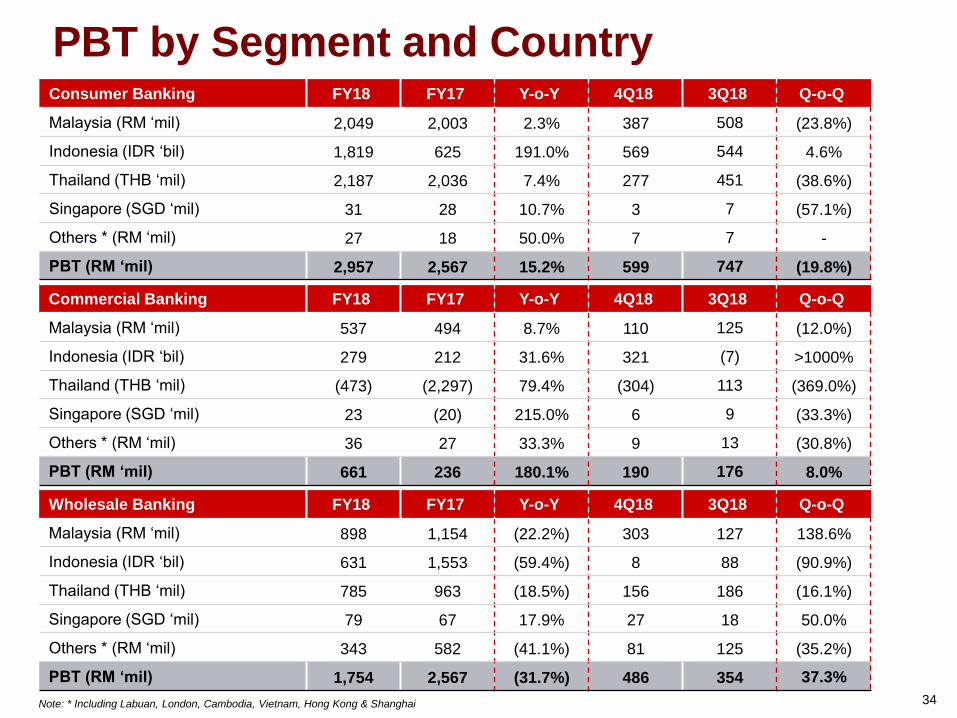
Wholesale Banking FY18 FY17 Y-o-Y 4Q18 3Q18 Q-o-Q
Malaysia (RM ‘mil) 898 1,154 (22.2%) 303 127 138.6%
Indonesia (IDR ‘bil) 631 1,553 (59.4%) 8 88 (90.9%)
Thailand (THB ‘mil) 785 963 (18.5%) 156 186 (16.1%)
Singapore (SGD ‘mil) 79 67 17.9% 27 18 50.0%
Others * (RM ‘mil) 343 582 (41.1%) 81 125 (35.2%)
PBT (RM ‘mil) 1,754 2,567 (31.7%) 486 354 37.3%
PBT by Segment and CountryConsumer Banking FY18 FY17 Y-o-Y 4Q18 3Q18 Q-o-Q
Malaysia (RM ‘mil) 2,049 2,003 2.3% 387 508 (23.8%)
Indonesia (IDR ‘bil) 1,819 625 191.0% 569 544 4.6%
Thailand (THB ‘mil) 2,187 2,036 7.4% 277 451 (38.6%)
Singapore (SGD ‘mil) 31 28 10.7% 3 7 (57.1%)
Others * (RM ‘mil) 27 18 50.0% 7 7 -
PBT (RM ‘mil) 2,957 2,567 15.2% 599 747 (19.8%)
Commercial Banking FY18 FY17 Y-o-Y 4Q18 3Q18 Q-o-Q
Malaysia (RM ‘mil) 537 494 8.7% 110 125 (12.0%)
Indonesia (IDR ‘bil) 279 212 31.6% 321 (7) >1000%
Thailand (THB ‘mil) (473) (2,297) 79.4% (304) 113 (369.0%)
Singapore (SGD ‘mil) 23 (20) 215.0% 6 9 (33.3%)
Others * (RM ‘mil) 36 27 33.3% 9 13 (30.8%)
PBT (RM ‘mil) 661 236 180.1% 190 176 8.0%
Note: * Including Labuan, London, Cambodia, Vietnam, Hong Kong & Shanghai 34
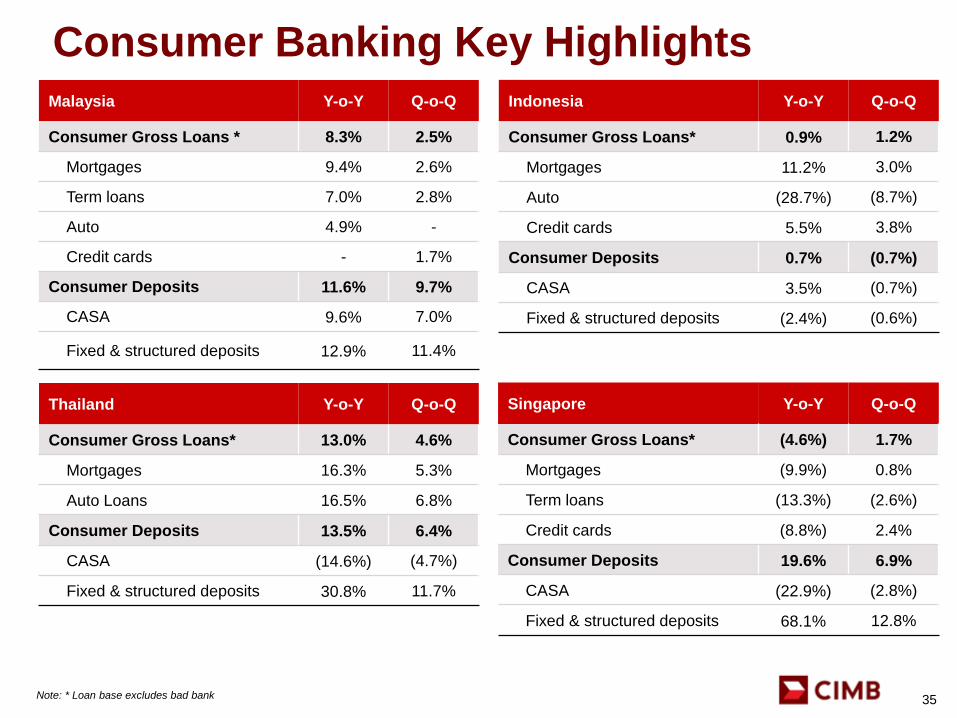
Consumer Banking Key Highlights
35
Malaysia Y-o-Y Q-o-Q
Consumer Gross Loans * 8.3% 2.5%
Mortgages 9.4% 2.6%
Term loans 7.0% 2.8%
Auto 4.9% -
Credit cards - 1.7%
Consumer Deposits 11.6% 9.7%
CASA 9.6% 7.0%
Fixed & structured deposits 12.9% 11.4%
Indonesia Y-o-Y Q-o-Q
Consumer Gross Loans* 0.9% 1.2%
Mortgages 11.2% 3.0%
Auto (28.7%) (8.7%)
Credit cards 5.5% 3.8%
Consumer Deposits 0.7% (0.7%)
CASA 3.5% (0.7%)
Fixed & structured deposits (2.4%) (0.6%)
Thailand Y-o-Y Q-o-Q
Consumer Gross Loans* 13.0% 4.6%
Mortgages 16.3% 5.3%
Auto Loans 16.5% 6.8%
Consumer Deposits 13.5% 6.4%
CASA (14.6%) (4.7%)
Fixed & structured deposits 30.8% 11.7%
Note: * Loan base excludes bad bank
Singapore Y-o-Y Q-o-Q
Consumer Gross Loans* (4.6%) 1.7%
Mortgages (9.9%) 0.8%
Term loans (13.3%) (2.6%)
Credit cards (8.8%) 2.4%
Consumer Deposits 19.6% 6.9%
CASA (22.9%) (2.8%)
Fixed & structured deposits 68.1% 12.8%
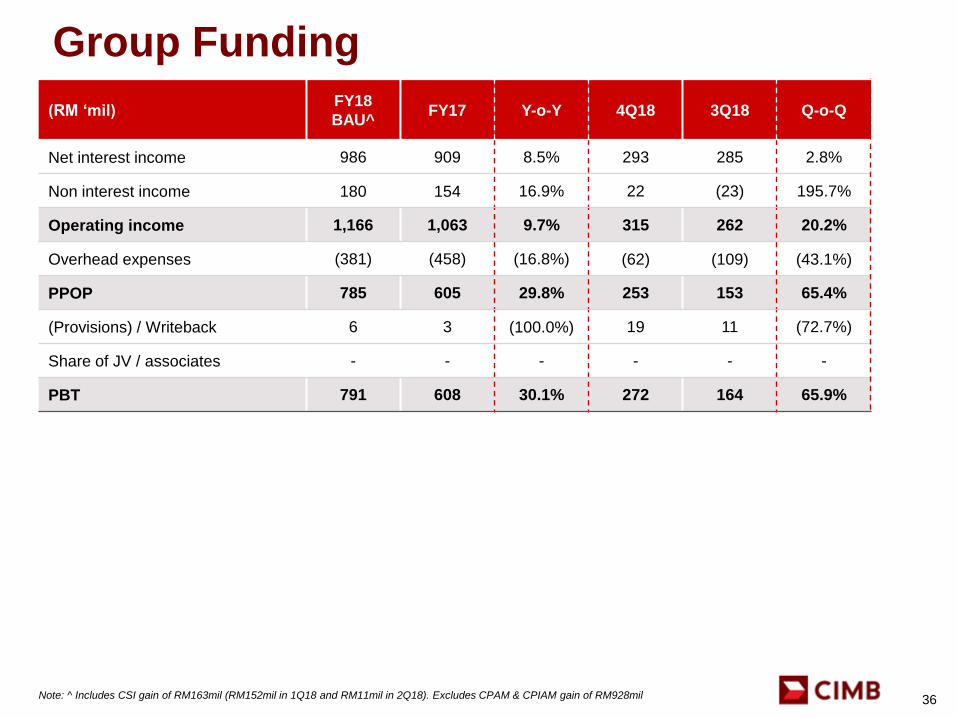
Group Funding
36
(RM ‘mil)FY18
BAU^FY17 Y-o-Y 4Q18 3Q18 Q-o-Q
Net interest income 986 909 8.5% 293 285 2.8%
Non interest income 180 154 16.9% 22 (23) 195.7%
Operating income 1,166 1,063 9.7% 315 262 20.2%
Overhead expenses (381) (458) (16.8%) (62) (109) (43.1%)
PPOP 785 605 29.8% 253 153 65.4%
(Provisions) / Writeback 6 3 (100.0%) 19 11 (72.7%)
Share of JV / associates - - - - - -
PBT 791 608 30.1% 272 164 65.9%
Note: ^ Includes CSI gain of RM163mil (RM152mil in 1Q18 and RM11mil in 2Q18). Excludes CPAM & CPIAM gain of RM928mil
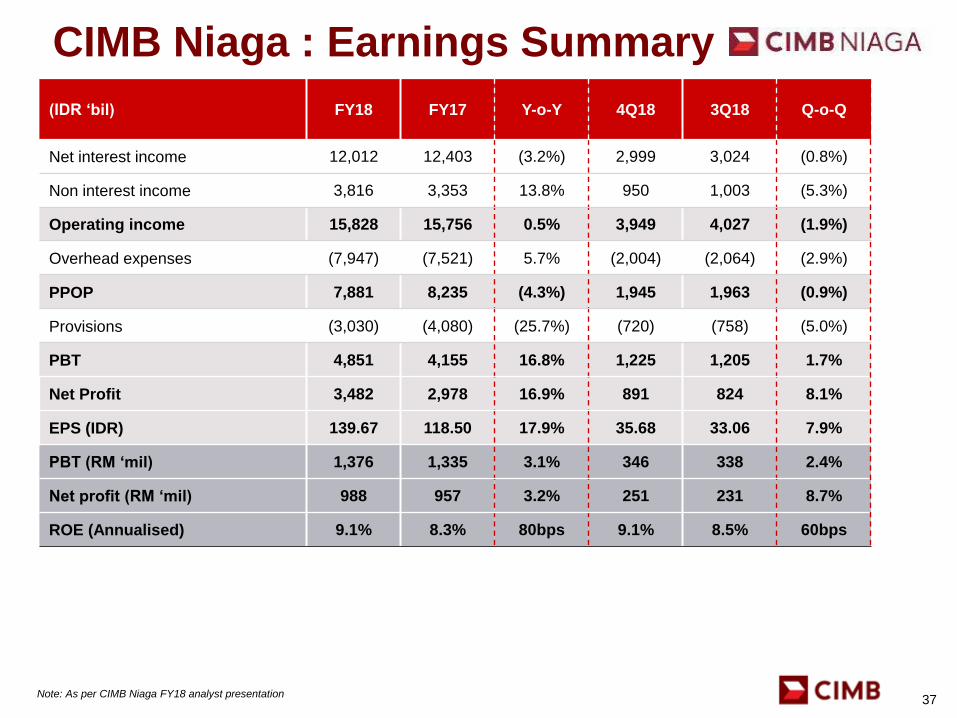
CIMB Niaga : Earnings Summary
37
(IDR ‘bil) FY18 FY17 Y-o-Y 4Q18 3Q18 Q-o-Q
Net interest income 12,012 12,403 (3.2%) 2,999 3,024 (0.8%)
Non interest income 3,816 3,353 13.8% 950 1,003 (5.3%)
Operating income 15,828 15,756 0.5% 3,949 4,027 (1.9%)
Overhead expenses (7,947) (7,521) 5.7% (2,004) (2,064) (2.9%)
PPOP 7,881 8,235 (4.3%) 1,945 1,963 (0.9%)
Provisions (3,030) (4,080) (25.7%) (720) (758) (5.0%)
PBT 4,851 4,155 16.8% 1,225 1,205 1.7%
Net Profit 3,482 2,978 16.9% 891 824 8.1%
EPS (IDR) 139.67 118.50 17.9% 35.68 33.06 7.9%
PBT (RM ‘mil) 1,376 1,335 3.1% 346 338 2.4%
Net profit (RM ‘mil) 988 957 3.2% 251 231 8.7%
ROE (Annualised) 9.1% 8.3% 80bps 9.1% 8.5% 60bps
Note: As per CIMB Niaga FY18 analyst presentation
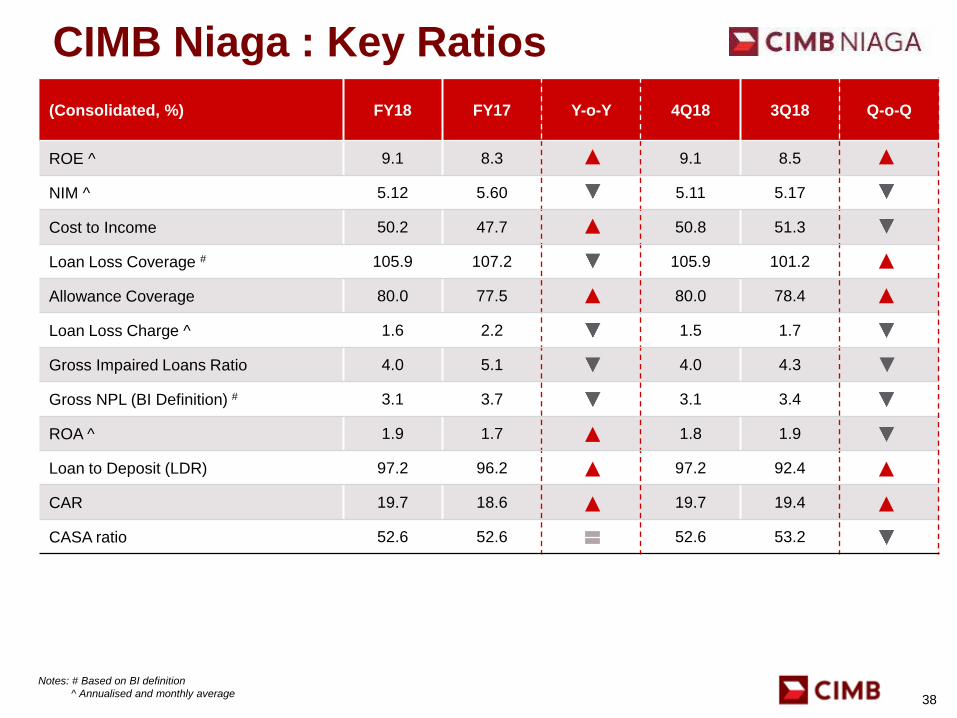
CIMB Niaga : Key Ratios
38
(Consolidated, %) FY18 FY17 Y-o-Y 4Q18 3Q18 Q-o-Q
ROE ^ 9.1 8.3 9.1 8.5
NIM ^ 5.12 5.60 5.11 5.17
Cost to Income 50.2 47.7 50.8 51.3
Loan Loss Coverage # 105.9 107.2 105.9 101.2
Allowance Coverage 80.0 77.5 80.0 78.4
Loan Loss Charge ^ 1.6 2.2 1.5 1.7
Gross Impaired Loans Ratio 4.0 5.1 4.0 4.3
Gross NPL (BI Definition) # 3.1 3.7 3.1 3.4
ROA ^ 1.9 1.7 1.8 1.9
Loan to Deposit (LDR) 97.2 96.2 97.2 92.4
CAR 19.7 18.6 19.7 19.4
CASA ratio 52.6 52.6 52.6 53.2
Notes: # Based on BI definition
^ Annualised and monthly average
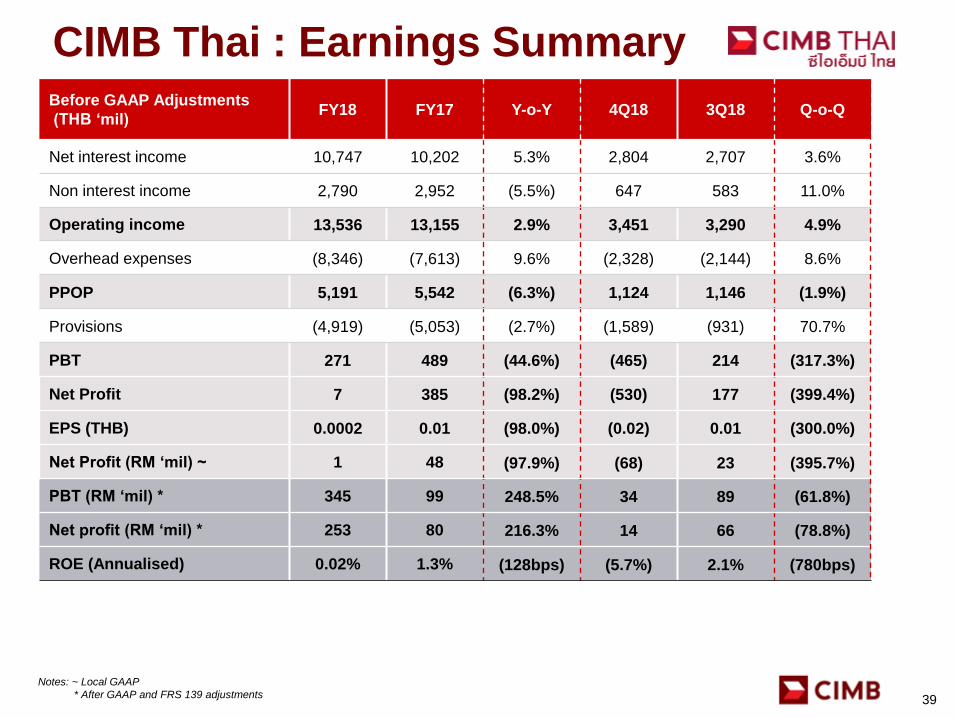
CIMB Thai : Earnings Summary
39
Before GAAP Adjustments
(THB ‘mil)FY18 FY17 Y-o-Y 4Q18 3Q18 Q-o-Q
Net interest income 10,747 10,202 5.3% 2,804 2,707 3.6%
Non interest income 2,790 2,952 (5.5%) 647 583 11.0%
Operating income 13,536 13,155 2.9% 3,451 3,290 4.9%
Overhead expenses (8,346) (7,613) 9.6% (2,328) (2,144) 8.6%
PPOP 5,191 5,542 (6.3%) 1,124 1,146 (1.9%)
Provisions (4,919) (5,053) (2.7%) (1,589) (931) 70.7%
PBT 271 489 (44.6%) (465) 214 (317.3%)
Net Profit 7 385 (98.2%) (530) 177 (399.4%)
EPS (THB) 0.0002 0.01 (98.0%) (0.02) 0.01 (300.0%)
Net Profit (RM ‘mil) ~ 1 48 (97.9%) (68) 23 (395.7%)
PBT (RM ‘mil) * 345 99 248.5% 34 89 (61.8%)
Net profit (RM ‘mil) * 253 80 216.3% 14 66 (78.8%)
ROE (Annualised) 0.02% 1.3% (128bps) (5.7%) 2.1% (780bps)
Notes: ~ Local GAAP
* After GAAP and FRS 139 adjustments

CIMB Thai : Key Ratios
40
(Consolidated, %) FY18 FY17 Y-o-Y 4Q18 3Q18 Q-o-Q
ROE ^ 0.02 1.3 (5.7) 2.1
NIM ^ 3.71 3.89 3.56 3.57
Cost to Income 61.7 57.9 67.4 65.2
Loan Loss Coverage ** 107.0 93.2 107.0 94.1
Loan Loss Charge ^ 2.2 2.4 2.8 1.7
Gross NPL ratio ** 4.3 4.8 4.3 5.7
Net NPL ratio ** 2.3 2.4 2.3 2.9
ROA 0.002 0.1 (0.6) 0.2
Loan to Deposit 122.3 119.0 122.3 118.8
Modified LDR *** 97.2 96.8 97.2 95.0
CAR * 18.7 16.6 18.7 17.2
CASA ratio # 29.7 34.7 29.7 29.2
Notes: * Bank Only
** Excluding STAMC
*** (Loan + MM) / (Deposit + MM + BE + S/T debenture + structured debenture)
^ Annualised
# Fixed deposit receipt call reclassified as savings from fixed deposits
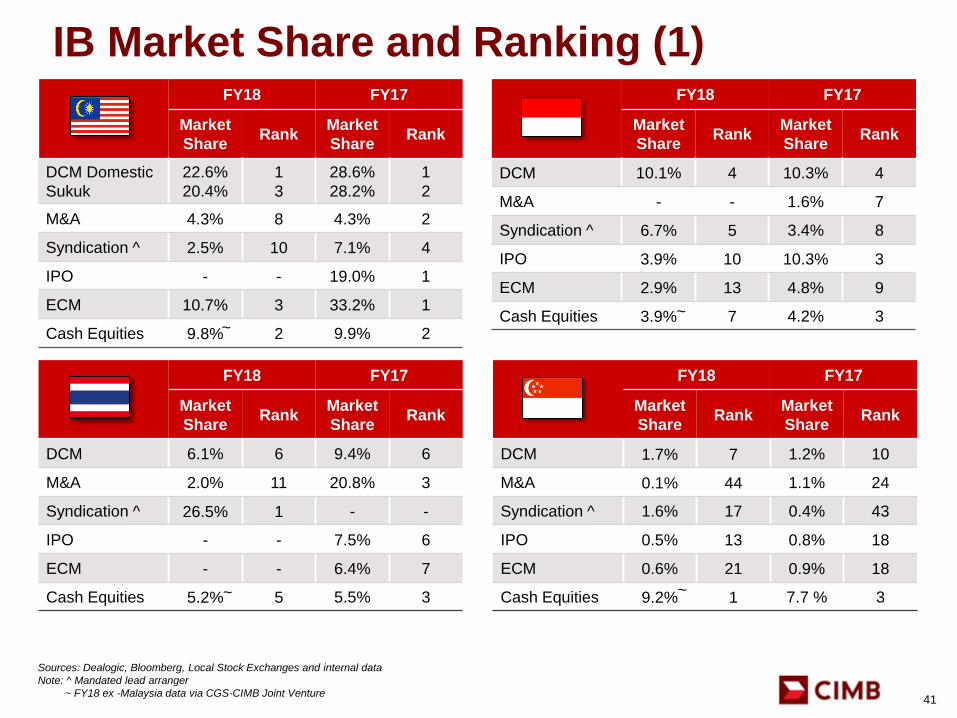
IB Market Share and Ranking (1)
41
FY18 FY17
Market
ShareRank
Market
ShareRank
DCM 6.1% 6 9.4% 6
M&A 2.0% 11 20.8% 3
Syndication ^ 26.5% 1 - -
IPO - - 7.5% 6
ECM - - 6.4% 7
Cash Equities 5.2% 5 5.5% 3
FY18 FY17
Market
ShareRank
Market
ShareRank
DCM 1.7% 7 1.2% 10
M&A 0.1% 44 1.1% 24
Syndication ^ 1.6% 17 0.4% 43
IPO 0.5% 13 0.8% 18
ECM 0.6% 21 0.9% 18
Cash Equities 9.2% 1 7.7 % 3
Sources: Dealogic, Bloomberg, Local Stock Exchanges and internal data
Note: ^ Mandated lead arranger
~ FY18 ex -Malaysia data via CGS-CIMB Joint Venture
FY18 FY17
Market
ShareRank
Market
ShareRank
DCM 10.1% 4 10.3% 4
M&A - - 1.6% 7
Syndication ^ 6.7% 5 3.4% 8
IPO 3.9% 10 10.3% 3
ECM 2.9% 13 4.8% 9
Cash Equities 3.9% 7 4.2% 3
FY18 FY17
Market
ShareRank
Market
ShareRank
DCM Domestic
Sukuk
22.6%
20.4%
1
3
28.6%
28.2%
1
2
M&A 4.3% 8 4.3% 2
Syndication ^ 2.5% 10 7.1% 4
IPO - - 19.0% 1
ECM 10.7% 3 33.2% 1
Cash Equities 9.8% 2 9.9% 2~~
~ ~
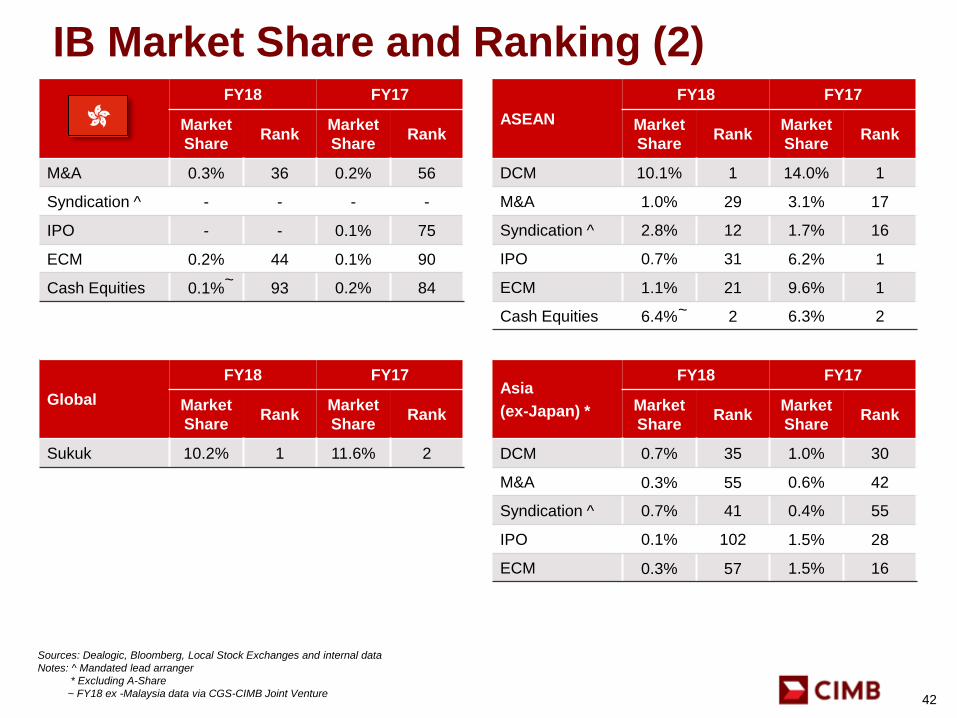
IB Market Share and Ranking (2)
42
FY18 FY17
Market
ShareRank
Market
ShareRank
M&A 0.3% 36 0.2% 56
Syndication ^ - - - -
IPO - - 0.1% 75
ECM 0.2% 44 0.1% 90
Cash Equities 0.1% 93 0.2% 84
Global
FY18 FY17
Market
ShareRank
Market
ShareRank
Sukuk 10.2% 1 11.6% 2
ASEAN
FY18 FY17
Market
ShareRank
Market
ShareRank
DCM 10.1% 1 14.0% 1
M&A 1.0% 29 3.1% 17
Syndication ^ 2.8% 12 1.7% 16
IPO 0.7% 31 6.2% 1
ECM 1.1% 21 9.6% 1
Cash Equities 6.4% 2 6.3% 2
Sources: Dealogic, Bloomberg, Local Stock Exchanges and internal data
Notes: ^ Mandated lead arranger
* Excluding A-Share
~ FY18 ex -Malaysia data via CGS-CIMB Joint Venture
Asia
(ex-Japan) *
FY18 FY17
Market
ShareRank
Market
ShareRank
DCM 0.7% 35 1.0% 30
M&A 0.3% 55 0.6% 42
Syndication ^ 0.7% 41 0.4% 55
IPO 0.1% 102 1.5% 28
ECM 0.3% 57 1.5% 16
~
~
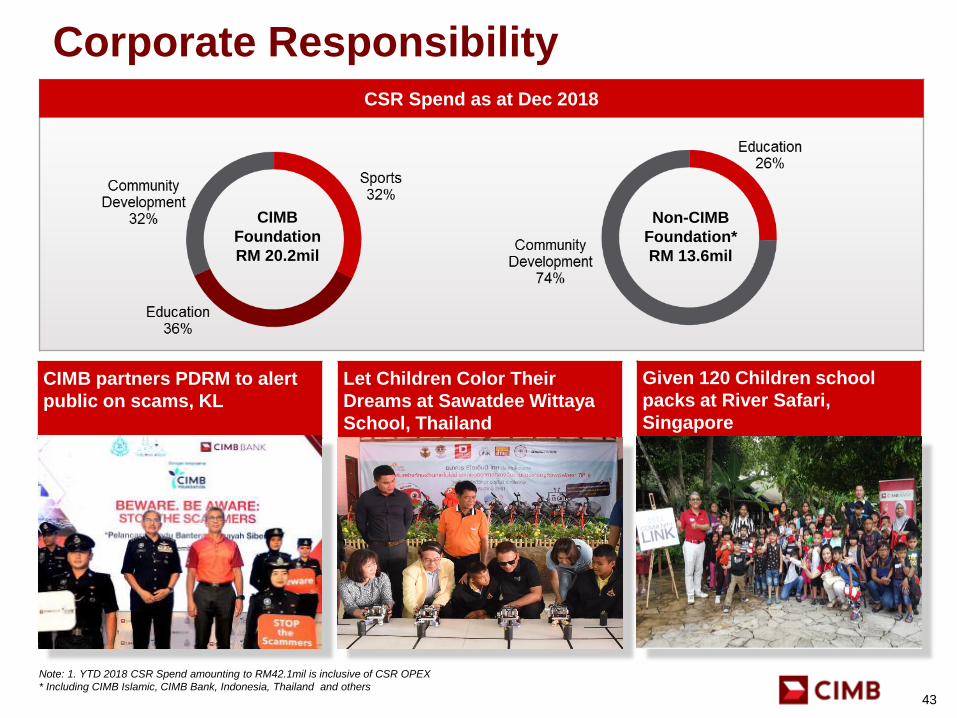
Given 120 Children school
packs at River Safari,
Singapore
Let Children Color Their
Dreams at Sawatdee Wittaya
School, Thailand
CIMB partners PDRM to alert
public on scams, KL
Corporate Responsibility
Note: 1. YTD 2018 CSR Spend amounting to RM42.1mil is inclusive of CSR OPEX
* Including CIMB Islamic, CIMB Bank, Indonesia, Thailand and others
CSR Spend as at Dec 2018
CIMB
Foundation
RM 20.2mil
Non-CIMB
Foundation*
RM 13.6mil
43


