Embed Size (px)
Citation preview

World Applied Sciences Journal 32 (3): 368-378, 2014ISSN 1818-4952© IDOSI Publications, 2014DOI: 10.5829/idosi.wasj.2014.32.03.987
Corresponding Author: Rajni Sehgal, AUUP, India.
368
Analysis of Software Fault Prediction Metrics
Rajni Sehgal and Deepti Mehrotra1 2
AUUP, India1
Director ASCS, Noida, India2
Abstract: This research emphasizes the need to find out the faults from software system to evaluate it for itsquality. Software metrics can be used to collect information regarding structural properties of a software designwhich can be further statistically analyzed, interpreted and linked to its quality. Metrics information can becollected from internal design like logic & algorithmic details as well as from the external design i.e. interfacesof software. There are various software metrics exists which can measure the faults from the software system,in this paper various faults prediction and classification techniques has been studied to find out the faults fromthe software system. This research identifies a set of metrics to measure and classify the faults from thesoftware systems.
Key words: Metrics Faults Error
INTRODUCTION Xiang-Sun Zhang found that Instead of performing a
To improve the quality of a system there is a need to von Neumann computer, artificial neural nets have theirfind out the faults from the system the system. There structures in dense interconnection of simplecould be many reasons for system to be faulty, most of computational elements [2] Norman E. Fenton reviewthe faults are due to the human factor; mistakes and errors literature to find out the wide range of prediction modelsmade in designing or coding by people, errors made by a use size and complexity metrics to predict defects [3].software team during specification, design, coding, data Hall T, Fenton N identify consensus requirements forentry and documentation, communication failure, To metric program success and examine how programs in twoidentify the faults we need metrics which can measure the organizations measured up [4]. Basili V.R. et al. presentsfaults from the system there are various metrics which can the results of a study in which they empiricallymeasure the faults at various phases of software life cycle investigated the suite of object-oriented (00) designSoftware metrics help to measure structural properties of metrics [5]. J.C. Munson et al., uses the statisticalan artifact. There is need to define metrics based on the technique of discriminate Analysis as a tool for theformal specifications so that they can be Theoretically as detection of fault-prone programs is explored [6]well as empirically Validated. Faults can be easily Porter. A et al. Proposed an approach that derives modelsrecognized by using the metrics, which may lead to good of problematic components, based on their measurablequality software. attributes and those of their development processes [7].
Related Works: At different levels of software life cycle, improvement-oriented software engineering processsoftware exists in different forms. It may be a software model was developed that uses the goal/question/metricRequirements specification document in the analysis paradigm to integrate the constructive and analyticphase, a design pattern in the design phase, or an aspects of software development [8].executable Software. Cartwright, M. Shepperd, M found S. Henry and D. Kafura puposes a metrics, based onthat there was a significant difference in the defect the number of possible paths of information flow throughdensities between those classes that participated in a given component, were used to evaluate the design andinheritance structures and those that did not [1]. implementation of a software system (the UNIX operating
program consisting of instructions sequentially as in a
V. Basili and H.D. Rombach purposes an

World Appl. Sci. J., 32 (3): 368-378, 2014
369
Table 1: Fault Prediction MetricsMetric SDLC phase Benefits DrawbackLines of Code) Predicted the faults in Early This metric calculate the faults by It depends on programming language used
life cycle of software Development The total number of lines The number of blank lines in module The number of lines of comments in a module Lines of executable code The number of lines which contain both code and comment in a module
Cyclomatic complexity Faults can be found after the The complexity of software can be correlated On changing the number of lines of codedevelopment of the software with the complexity of the graph. number of paths also changedi.e. later stage of SDLC McCabe proposed the cyclomatic number
V(G) which is equal to the number oflinearly independent paths through aprogram in its graphs representation toindicate the software complexity.The V(G) for a program controlgraph G, is given by:V(G) = E – N + PDesign ComplexityDesign complexity measures the amountof interaction between the modules in a system.Essential ComplexityEssential Complexity (eV (G)) is ameasure of the degree to which a modulecontains unstructured constructs.This metric measures the degree of qualityof the code. It is used to predict the maintenanceeffort and to help in the modularization process.
Halstead Metrics Predict the faults before the Halstead metrics are computed statically from It depends upon the tokens of thefaults propagates to testing phase the code and was introduced by Halstead in programming language
1977s[11] Metrics applicable to severalaspects of program. The metrics are definedas follows. The following token counts areused to compute the various Halstead metricsThe metrics are defined as follows.The following token counts are used tocompute the various Halstead metricsn1 = the number of distinct operatorsn = the number of distinct operands2
N = the total number of operators1
N = the total number of operands2
Halstead length contentN = N1 + N2Halstead volume metricVolume metric is a measure of the storagevolume required to represent the program.V = N. log2,n
where n = n1+n2Number of FaultsFaults=V/S0
system kernel) which exhibits the interconnectivity of Halstead et al., purposed the metrics to predict thecomponents typical of large-scale software systems [9]. fault in early life cycle of software development modelJ.A. McCall, Richards et al., Establish a concept of [11]. Zhou Jianhong et al., explored five Neural Networksoftware quality and provide an Air Force acquisition Based techniques and comparative analysis is performedmanager with a mechanism to quantitatively specify and for the modeling of severity of faults present in functionmeasure the desired level of quality in a software product based software systems [12]. Yuan, Dongliang et al.,[10]. presents a method to evaluate the software reliability

World Appl. Sci. J., 32 (3): 368-378, 2014
370
using Fuzzy-Neural network. They established a reliability Decision Tree Induction: The structure of a decision treeprediction model based on adaptive-network based fuzzy looks like flow-chart; internal nodes representing a testinference system (ANFIS) [13]. Bezerra, M.E.R et al., on an attribute, branches symbolize outcome of the testintroduces a novel algorithm based on constructive RBF and the leaf nodes denoting classes or classneural networks aimed at predicting the probability of distributions. The root node forms the topmost node in aerrors in fault-prone modules; it is called RBF-DDA with tree.Probabilistic Outputs and is an extension of RBF-DDA Unknown sample is classified by testing theneural networks [14]. Bradley valuate six machine learning sample against the decision tree, using values of thealgorithms (C4.5, Multiscale Classifier, Perceptron, attributes. A traceable pathway from the root to a leafMulti-layer Perceptron, k-Nearest Neighbours and a node holds the class prediction for that sample.Quadratic Discriminant Function) on six “real world” The classification rules used are easily got from decisionmedical diagnostics data sets [15]. Yi (Cathy) Liu et al., trees.Purposes genetic-programming-based approach includesthree strategies for modeling with multiple software Tree Pruning: Many of the branches of a decision treeprojects: Baseline Classifier, Validation Classifier and when built will reflect irregularities in the training data.Validation-and-Voting Classifier [16]. The irregularities occur due to noise or outliers. Tree
Data Mining Techniques of Defect Prediction: An the data. Pruning methods normally use statisticalemerging approach for defect prediction is the use of data procedures to eliminate the least reliable branches. Thismining techniques to predict the problematic areas in the elimination usually results in quicker classification and ansoftware. enhancement in the capability of the tree to appropriately
Naïve Bayes Classifier: A naive Bayes classifier is a a tree is “pruned" by stopping its construction early; thussimple probabilistic classifier based on applying Bayes' no further split or partition at a given node. On halting,theorem with strong (naive) independence assumptions. the node becomes a leaf which may now hold the mostThe underlying probability model is an independent recurrent class in the subset samples, or the probabilityfeature model. Mathematically classifiers map a discrete or distribution of those samples.continuous feature space X to a discrete set of labels Y.The Naïve Bayes classifiers are efficiently trained in Random Tree: Random tree is a decision tree thatsupervised learning due to the precise nature of the considers K randomly chosen attributes at each nodeprobability model. Maximum likelihood methodology is and allows class probabilities based on backfittingused to find the parameter estimates in the Naïve Bayes with no pruning (Frederick Livingston, 2005) [13]. Themodels. The advantage of Bayesian models is the easy effects of different variables are generally not found.incorporation of different significant but non-quantifiable The steps involved in a random tree are A data set [inbag]factors, such as quality of verification and validation is created from the training set by sampling withactivities, software complexity and test coverage in the replacement members. The number of examples in themodel. Mingxi et al., utilized a modified approach [inbag] data set is equal to that of the training data set.effectively to solve the error classification problem [7]. This new data set may contain duplicate examples from
Bayesian Logistic Regression: In a supervised learning usually one third of the training set data is not present inproblem, if an unknown target function. f: X Y or the inbag. This left over data is known as the out-of-bagequivalently P (Y X ) is to be approximated, assume Y is data. This above process is called bootstrapping eacha Boolean-valued random variable and X is a vector tree is made up of a random number of attributes.containing n Boolean attributes. In other words, X = (X , Nodes and leaves are formed using the attributes with1
X ,……. X ), where Xi is the Boolean random variable standard tree building algorithms. Pruning is not done2 n
denoting the i attribute of X. and tree is grown to maximum extent possible. Fromth
Applying Bayes rule, it is learnt that P (Y = y X) can Figure 1 it is seen that the split of the nodes can occuri
be represented as: using different logic for the given class labels. Taking the
denotes the k possible vector value for X results.x thk
pruning methods discovers this problem of over fitting
classify independent test data. In the pre pruning method,
the training set. Using the bootstrapping technique,
medial value of all the six different trees produces better

World Appl. Sci. J., 32 (3): 368-378, 2014
371
Fig. 1: Six different trees produced within random tree
Fig. 2: Classification and regression tree
Classification and Regression Tree (CART): The condition for split can be based on statistical value orClassification and regression tree (CART) is a non- based on other parameters like Gini index. The nodesparametric technique [5] that produces either terminate with the required class label. In the figure thereclassification for categorical variable or regression trees a total of 6 attributes and 4 classes.for numeric variable. Trees formed depend upon thevalues of variable in the modeling dataset from which a Neural Network: Artificial Neural Networks are acollection of rules is created. Rules are chosen based on programming model that seeks to imitate thethe capability of splits formed on variables’ values can computational analogues of neurons and are used widelydifferentiate observations based on the dependent in artificial intelligence problems from simple patternvariable. Child node formed by splitting a node into two, detection activities to advanced symbolic operations.the rule is applied in the case of parent node. CART stops The Multilayer Perception is an example of an artificialsplitting when it detects that there is no further splitting. neural network that is used extensively for the solution ofTerminal nodes at end of each branch. a number of different problems, including pattern
Each observation falls into one and exactly one recognition and interpolation. Artificial Neural Networksterminal node Set of rules define each terminal node endeavors to model the working of the human brain.uniquely Figure 2 shows the functioning of CART. The human brains consist of millions of individual cells
From Figure 2 it is seen that each attribute is taken which are called neuron. All experience and knowledge isas a node and a binary split is made on some conditions. encoded by the links that are present between neurons.
World Appl. Sci. J., 32 (3): 368-378, 2014
372
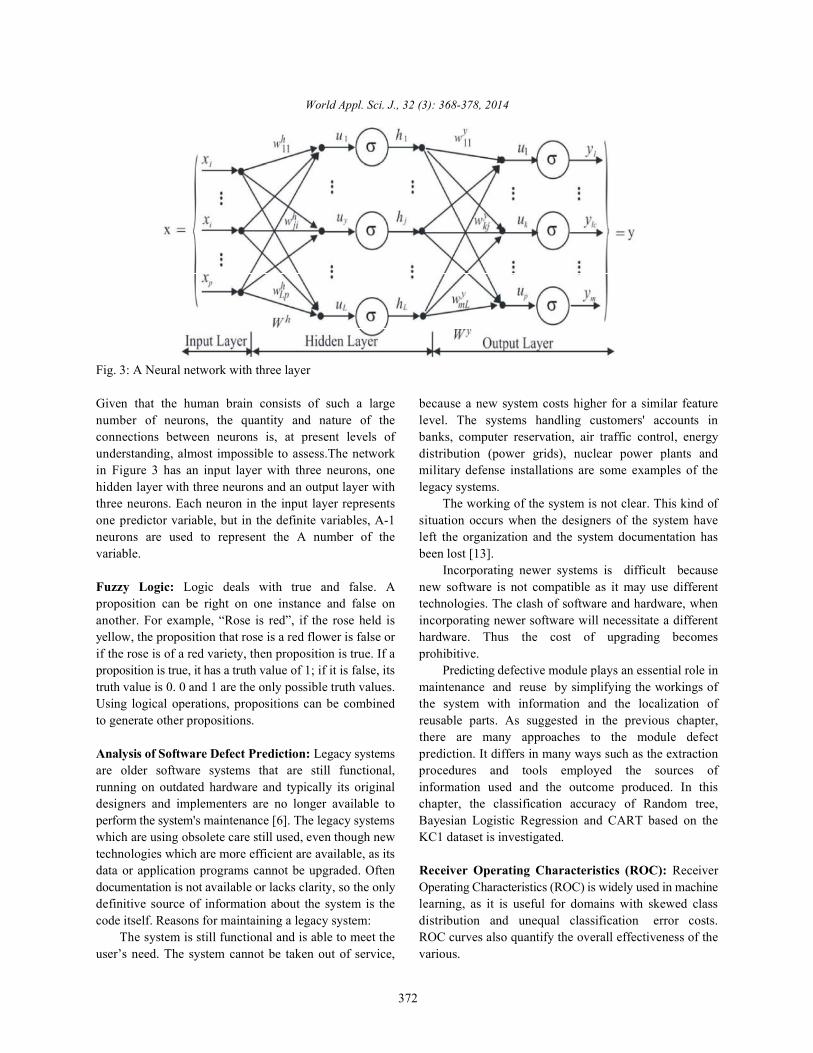
Fig. 3: A Neural network with three layer
Given that the human brain consists of such a large because a new system costs higher for a similar featurenumber of neurons, the quantity and nature of the level. The systems handling customers' accounts inconnections between neurons is, at present levels of banks, computer reservation, air traffic control, energyunderstanding, almost impossible to assess.The network distribution (power grids), nuclear power plants andin Figure 3 has an input layer with three neurons, one military defense installations are some examples of thehidden layer with three neurons and an output layer with legacy systems.three neurons. Each neuron in the input layer represents The working of the system is not clear. This kind ofone predictor variable, but in the definite variables, A-1 situation occurs when the designers of the system haveneurons are used to represent the A number of the left the organization and the system documentation hasvariable. been lost [13].
Fuzzy Logic: Logic deals with true and false. A new software is not compatible as it may use differentproposition can be right on one instance and false on technologies. The clash of software and hardware, whenanother. For example, “Rose is red”, if the rose held is incorporating newer software will necessitate a differentyellow, the proposition that rose is a red flower is false or hardware. Thus the cost of upgrading becomesif the rose is of a red variety, then proposition is true. If a prohibitive.proposition is true, it has a truth value of 1; if it is false, its Predicting defective module plays an essential role intruth value is 0. 0 and 1 are the only possible truth values. maintenance and reuse by simplifying the workings ofUsing logical operations, propositions can be combined the system with information and the localization ofto generate other propositions. reusable parts. As suggested in the previous chapter,
there are many approaches to the module defectAnalysis of Software Defect Prediction: Legacy systems prediction. It differs in many ways such as the extractionare older software systems that are still functional, procedures and tools employed the sources ofrunning on outdated hardware and typically its original information used and the outcome produced. In thisdesigners and implementers are no longer available to chapter, the classification accuracy of Random tree,perform the system's maintenance [6]. The legacy systems Bayesian Logistic Regression and CART based on thewhich are using obsolete care still used, even though new KC1 dataset is investigated.technologies which are more efficient are available, as itsdata or application programs cannot be upgraded. Often Receiver Operating Characteristics (ROC): Receiverdocumentation is not available or lacks clarity, so the only Operating Characteristics (ROC) is widely used in machinedefinitive source of information about the system is the learning, as it is useful for domains with skewed classcode itself. Reasons for maintaining a legacy system: distribution and unequal classification error costs.
The system is still functional and is able to meet the ROC curves also quantify the overall effectiveness of theuser’s need. The system cannot be taken out of service, various.
Incorporating newer systems is difficult because

positives correctly classifiedtptotal postivies
�
snegative incorrectly identifiedfp ratetotal negatives
�
TNspecificityFP TN
=+
(2.8.1).
number of true positivesSensitivityno of true positives no false negatives
=+
. (2.8.2). .
no of true negativesSpecificityno of true negatives no flase positives
=+
2
2( n )
22
1X [ n ] e x[ n ]2
−−
=
2
2( n )
n2
2
1X [ n ] e x[ n ]2
−−
−∞= ∫
World Appl. Sci. J., 32 (3): 368-378, 2014
373
Algorithms used in a particular study.In a classification problem, for a classifier and an
instance, there are four possible outcomes. The possibleoutcomes are: From Table 5 it is observed that the classifiers
Instance is positive and classified as positive – True attributed to the higher class labels available for trainingPositive (TP) The ROC characteristics of the three classifiers areInstance is positive and classified as negative – False shown in Figures 7 and 8.Negative (FN) ROC curve shows the tradeoff between sensitivityInstance is negative and classified as negative – True and specificity. ROC curves are plotted with the falseNegative (TN) positive rate as x axis and true positive rate as y axis.Instance is negative and classified as positive – False Figures 6, 7 and 8 show the area under curve withPositive (FP) very low values which shows the classifiers as inefficient
for predicting faults when used as such. Of the threeFor set of instances, confusion matrix is constructed classifiers CART shows the best values of Area under
representing the dispositions of the instances. This matrix Curve (AUC).forms the basis for many common matrix. The true positiverate (also known as hit rate and recall) of a classifier is Severity Based Code Optimization: A Data Miningestimated: Approach: Severity of errors in a module can be classified
The false positive rate or the false alarm rate is given by: devastating consequences for the system.
consequences for the system.
From the ROC curves, consequences for the system in question – there is awork around only after fixing a defect.
Sensitivity = Recall Minor: Defects that could (or did) cause small or
question. Easy to recover or work around.
= 1 – fp rate Such defects normally produce no erroneous
Positive predictive value = precision
RESULTS AND DISCUSSION on the class attribute of the training dataset. The
It is observe that Bayes Logistic Regression (BLR) function. For a given attribute X with values (x1,x2,. . . xn)provides the best classification accuracy. The confusion the normalized values are given by:matrix obtained for the three Classif iers is shown inTable 4.
The sensitivity and specificity plotted based onequation (2.8.1) and (2.8.1) is shown in Table 5 andFigure. When no defects are present in the module
perform extremely well with true positives which could be
as:
Catastrophic: Defects that could (or did) cause
Severe: Defects that could (or did) cause very severe
Major: Defects that could (or did) cause significant
insignificant consequences for the system in
No Effect: Trivial defects that can cause nonegative consequences for the system in question.
outputs.
The proposed method of data preprocessing depends
attributes are normalized using the cumulative distribution

World Appl. Sci. J., 32 (3): 368-378, 2014
374
Table 2: Tools used during the studyToolWEKA It supports uniform interface to various learning algorithms and also for several data mining process such as preprocessing, clustering,
classification and so on.Data Set KC1 dataset is a NASA Metrics Data Program taken for this study[17]
Table 3: Classification performance of Random tree, CART and BL regression on KC1 datasetKC1 Dataset Correctly classified % Root mean squared error Mean Absolute errorRandom tree 81.86 0.43 0.1924CART 84.91 0.35 0.2095Bayesian logistic regression 86.03 0.37 0.1397
Table 4: The confusion matrix for Random tree, CART and BL regression on KC1 datasetRandom Tree CART Bayesian Logistic Regression--------------------------------------- ----------------------------------------- ----------------------------------No defect Defect No defect Defect No Defect Defect
No defect 559 58 592 25 613 4Defect 72 27 83 16 96 3
Table 5: Sensitivity and Specificity for the classifiers Random tree, CART and BL regressionSensitivity Specificity
Random tree 0.91 0.32CART 0.88 0.39Bayesian logistic regression 0.86 0.43
Fig. 4: Classification accuracy on KC1 dataset
Fig. 5: The RMSE and Mean absolute error

World Appl. Sci. J., 32 (3): 368-378, 2014
375
Fig. 6: The sensitivity and specificity measured
Fig. 7: Receiver operating characteristic of Random Tree
Fig. 8: ROC of classification and regression tree

i 1
1
xin
n−
=∑
World Appl. Sci. J., 32 (3): 368-378, 2014
376
Fig. 9: ROC of Bayesian Logistic Regression
Fig 10: Classification accuracy using the proposed normalization technique
Fig. 11: Sensitivity and specificity
When the module contains a defect.where µ is given by

World Appl. Sci. J., 32 (3): 368-378, 2014
377
Fig. 12: Comparison of classification accuracy
Table 5: Classification accuracy for the classifiers Random tree, CART and BL regressionCorrectly classified % Root mean Squared error Mean Absolute error
Random tree 94.55 0.43 0.1924CART 95.67 0.35 0.2095Bayesian logistic regression 96.79 0.37 0.1397
The classification accuracy of the three classifiers exceed 0.6 and hence the classifiers are not suitable forused in the previous section is shown in Table 5 Figure 9. real time deployment. To overcome these issues, a novel
Compared to the results in the previous section it is pre processing technique was proposed. seen that the proposed method of data normalizationimproves the classification accuracy. REFERENCES
The sensitivity and specificity of the proposedmethod for all the three classifiers is shown in Figure 11. 1. Cartwright, M. and M. Shepperd, 2000. An empirical
Though the classification accuracy of Bayesian investigation of an object-oriented softwarelogistic regression is higher than CART, the variance of system, IEEE transactions on Software Engineering,error is lower in CART compared to Bayesian Logistic 26(8): 786-796.Regression. The comparative chart between the 2. Xiang-Sun Zhang, 2000. Neural Networks inclassification accuracy before and after normalization is Optimization, Springer.shown in Figure 4.9. It is observed that the classification 3. Fenton, N.E. and M. Neil, 1999. A Critique ofaccuracy improves on an average of 10% when Software Defect Prediction Models, IEEEpreprocessed with the proposed methodology. Transactions on Software Engineering, 25(5): 675-689.
CONCLUSION software metrics programmes, IEEE Software,
In this study various software defects and their 5. Basili, V.R., L.C. Briand and W.L. Melo, 1996. Acorresponding metrics were studied. Defect prediction Validation of Object-OrientedDesign Metrics astechniques using data mining algorithms available in Quality Indicators, IEEE Transactions on Softwareliterature were studied. In the next chapter it is proposed Engineering, 22(10): 751-761. to study the KC1 Dataset and existing data mining 6. Munson, J.C. Khoshgoftaar, 1992. The Detection ofalgorithms to review their classification accuracy. In this Fault-Prone Programs, IEEE Transactions on SoftwarePaper investigations were carried out to find the efficiency Engineering, 18(5): 423-433. of existing classifiers for software defect prediction. 7. Porter, A. and R. Selby, 1990. Empirically GuidedThough the classification accuracy obtained is greater Software Development Using Metric-Basedthan 80%, it is found that the area under curve does not Classification Trees, IEEE Software, 7(2): 46-54.
4. Hall, T. and N. Fenton, 1997. Implementing effective
pp: 55-65.

World Appl. Sci. J., 32 (3): 368-378, 2014
378
8. Basili, V. and H.D. Rombach, 1988. The TAME 13. Yuan, Dongliang and Zhang Chenchen, 2011.Project: Towards Improvement-Oriented Software "Evaluation strategy for software reliability basedEnvironments, IEEE Transactions on Software on ANFIS," Electronics, Communications andEngineering, 14(6): 758-773. Control (ICECC), 2011 International Conference on,
9. Henry, S. and D. Kafura, 1984. The Evaluation of pp: 3738-3741, 9-11 Sept. 2011Software System’s Structure Using Quantitative 14. Bezerra, M.E.R., AL.I. Oliveira and S.R.L. Meira, 0000.Software Metrics, Software Practice and Experience, "A Constructive RBF Neural Network for Estimating14(6): 561-573. the Probability of Defects in Software Modules.
10. McCall, J.A., P.K. Richards and G.F. Walters, 1977. 15. Bradley, A.P., 1997. `The use of the area under theFactors in Software Quality, RADC TR-77-369, Vols ROC curve in the evaluation of machine learningI, II, III, 1977, US Rome Air Development Center algorithms'. Pattern Recognition, 30(7): 1145-1159.Reports. 16. Yi (Cathy) Liu, Taghi M. Khoshgoftaar and Naeem
11. Halstead, Maurice H., 1977. Elements of Software Seliya, 2010. Evolutionary Optimization of SoftwareScience. Amsterdam: Elsevier North-Holland. Quality Modeling with Multiple Repositories,
12. Zhou Jianhong, P.S. Sandhu and S. Rani, 2010. "A IEEE Transactions On Software Engineering,Neural network based approach for modeling of 36(6): pp: 852-864.severity of defects in function based software 17. http://promise.site.uottawa.ca/.systems," Electronics and Information Engineering(ICEIE), 2010 International Conference On, 2: V2-568-V2-575, 1-3 Aug. 2010.