Embed Size (px)
Citation preview
RESEARCH PAPER
Analysis of lipid peroxidation biomarkers in extremely lowgestational age neonate urines by UPLC-MS/MS
Julia Kuligowski & Javier Escobar & Guillermo Quintás & Isabel Lliso &
Isabel Torres-Cuevas & Antonio Nuñez & Elena Cubells & Denise Rook &
Johannes B. van Goudoever & Máximo Vento
Received: 13 January 2014 /Revised: 21 March 2014 /Accepted: 7 April 2014# Springer-Verlag Berlin Heidelberg 2014
Abstract Extremely low gestational age neonates (ELGAN)frequently require the use of oxygen supply in the deliveryroom leading to systemic inflammation and oxidative stressthat are responsible for increased morbidity and mortality. Theobjective of this study was to establish reference ranges of aset of representative isoprostanes and prostaglandins, whichare stable biomarkers of lipid peroxidation often correlatedwith oxidative stress-related disorders. First, a quantitativeultra performance liquid chromatography—tandem massspectrometry (UPLC-MS/MS) method was developed and
validated. The proposed analytical method was tailored forits application in the field of neonatology, enabling multi-analyte detection in non-invasive, small-volume urine sam-ples. Then, the lipid peroxidation product concentrations in atotal of 536 urine samples collected within the framework oftwo clinical trials including extremely low gestational ageneonates (ELGAN) were analyzed. The access to a substan-tially large number of samples from this very vulnerablepopulation provided the chance to establish reference rangesof the studied biomarkers. Up to the present, and for thispopulation, this is the biggest reference data set reported inliterature. Results obtained should assist researchers and pe-diatricians in interpreting test results in future studies involv-ing isoprostanes and prostaglandins, and could help assessingmorbidities and evaluate effectiveness of treatment strategies(e.g., different resuscitation conditions) in the neonatal field.
Keywords Extremely low gestational age newborn(ELGAN) .Liquidchromatographytandemmassspectrometry(LC-MS/MS) . Lipid peroxidation . Isoprostanes . Oxidativestress . Method validation
AbbreviationsELGAN Extremely low gestational age
neonatesFDA Food and Drug AdministrationFiO2 Inspiratory fraction of oxygenGC-MS Gas chromatography with mass
spectrometric detectionILCOR International Liaison Committee on
ResuscitationIS Internal standardIsoPs IsoprostanesLC Liquid chromatographyLOD Limit of detectionLOQ Limit of quantification
Electronic supplementary material The online version of this article(doi:10.1007/s00216-014-7824-6) contains supplementary material,which is available to authorized users.
J. Kuligowski : J. Escobar : I. Lliso : I. Torres-Cuevas :A. Nuñez :E. Cubells :M. Vento (*)Neonatal Research Group, Health Research Institute Hospital La Fe,Bulevar Sur s/n, 46026 Valencia, Spaine-mail: [email protected]
G. QuintásLeitat Technological Center, Bio In Vitro Division,Avenida Campanar 21, 46009 Valencia, Spain
D. Rook : J. B. van GoudoeverDepartment of Pediatrics, Division of Neonatology,Erasmus Medical Centre-Sophia Children’s Hospital,3015 CE Rotterdam, The Netherlands
J. B. van GoudoeverDepartment of Pediatrics, VU University Medical Center,1081 HVAmsterdam, The Netherlands
J. B. van GoudoeverDepartment of Pediatrics, Emma Children’s Hospital,Academic Medical Center, Meibergdreef 9, 1105 AZ Amsterdam,The Netherlands
M. VentoDivision of Neonatology, University & Polytechnic Hospital La Fe,Bulevar Sur s/n, 46026 Valencia, Spain
Anal Bioanal ChemDOI 10.1007/s00216-014-7824-6

MRM Multiple reaction monitoringMS Mass spectrometrypaO2 arterial partial pressure of oxygenPGs prostaglandinsQC quality controlR2 coefficient of determinationROS reactive oxygen speciesRSD relative standard deviationSPE solid phase extractionSpO2 arterial oxygen saturation as measured
by pulse oximetryUPLC-MS/MS ultra performance liquid chromatography -
tandem mass spectrometry
Introduction
Fetal life develops in a relatively hypoxic environment with anin utero arterial partial O2 pressure (paO2) of 25–30 mmHg.With the initiation of lung respiration paO2 abruptly rises inthe first 5 to 10 min after birth up to 80–90 mmHg almostreaching adult values [1, 2]. This contributes to the generationof a burst of reactive oxygen species (ROS) which may act assignaling molecules modulating biological processes and spe-cific metabolic pathways leading to organ maturation in terminfants, but also to the formation of aggressive free radicalsespecially anion superoxide leading to oxidative stress [3].Remarkably, in extremely low gestational age neonates(ELGAN) the need of oxygen for postnatal stabilization andthe combination of an immature antioxidant system plus sur-factant deficiency unequivocally leads to oxidative stress,enhanced inflammatory response and frequently to oxidativestress-related conditions such as chronic lung disease, retinop-athy of prematurity, intra-periventricular intracranial hemor-rhage or persistent ductus arteriosus [2, 4–7]. The 2010International Liaison Committee on Resuscitation (ILCOR)guidelines recommend beginning resuscitation with air ratherthan 100 % O2 for term infants [8]. However, the determina-tion of the optimum inspiratory fraction of oxygen (FiO2) forstarting resuscitation in preterm infants, avoiding bothhyperoxemia and/or hypoxemia, is yet unknown and requiresfurther research [9].
ROS-derived free radicals may react with non-radical mol-ecules in chain reactions causing damage or structural alter-ation to DNA, proteins, and lipids or by promoting the for-mation of adducts with DNA and proteins [10, 11]. ROSmediated lipid peroxidation is of special importance due tothe high lipid content in the brain, which is the second tissue inlipid content after adipose tissue [12] and therefore biomarkersof lipid peroxidation are associated with neuronal damage[13]. Lipid peroxidation can lead to a number of products,like enzymatically (through the action of cyclooxygenases)formed prostaglandins (PGs) (e.g., PGF2α and PGE2) and
non-enzymatically formed isoprostanes (IsoPs). IsoPs are aunique series of prostaglandin-like compounds formed in vivovia the non-enzymatic peroxidation of arachidonic acid,which is a ubiquitous polyunsaturated fatty acid that can exertpotent biological effects and potentially mediate some of theadverse effects of oxidant injury [14, 15]. IsoPs are chemicallystable and have been detected in a variety of biological fluidsand tissues [14] and, since their discovery in 1990 [16], anumber of studies have shown that IsoPs are among the mostreliable biomarkers for the assessment of endogenous oxida-tive stress [14, 17, 18]. Whereas IsoPs are present mainly inester forms in plasma and tissues, they can be found in freeacid forms in urine [18].
The analysis of lipid peroxidation products such as IsoPsand PGs is highly complex due to the large number of typesand isomers with highly similar molecular structures andphysicochemical properties. Immunoassays are a high-throughput tool that does not require costly instrumentation.However, the polyclonal antibodies used to bind IsoPs in thistype of analysis exhibit cross-reactivity with interfering mol-ecules similar in structure, including cyclooxygenase-derivedPGF2α [19] and hence IsoP concentrations are overestimated[19, 20]. Proudfoot et al. reported poor correlation betweenurinary F2-IsoPs concentrations measured by gas chromatog-raphy with mass spectrometric detection (GC-MS) and enzy-matic immunoassays that was attributed to the measurementof different isomers [21].
Mass spectrometry (MS) is a widely employed alternativefor the determination of IsoPs that has become the method ofchoice for F2-IsoPs quantification [17]. Early approaches werebased on GC-MS detection, providing high specificity andsensitivity [19, 22, 23]. However, GC-MS analysis of lipidperoxidation products involves a time-consuming derivatiza-tion procedure and has been increasingly replaced by liquidchromatography (LC)–MS-based approaches [20, 24, 25].
The objective of the present study was to establish urinaryIsoPs and PGs reference concentration ranges for the assess-ment of the lipid peroxidation status in ELGAN. Accordingly,an ultra performance liquid chromatography - tandem massspectrometry (UPLC-MS/MS) method for the quantificationof a set of six IsoPs (2,3-dinor-iPF2α-III, 8-iso-15-keto-PGE2,8-iso-15-keto-PGF2α, 8-iso-PGE2, 5-iPF2α-VI, 8-iso-PGF2α)and two PGs (PGE2 and PGF2α) was developed and validated.Tailoring the analytical method for its application in the fieldof neonatology, special attention was paid to provide non-invasive collection of small volume urine samples. In addi-tion, urinary determination due to the small glomerular filtra-tion rate of preterm infants give the clinician a broad vision ofevolving clinical status over a long period of time (12–24 h)while plasma determination is meant to give a snapshot after aspecific intervention [4].
Sample size is a major factor to provide data reflective ofthe concentration levels of lipid peroxidation products in the
J. Kuligowski et al.
ELGAN underlying population. In this study, 536 urine sam-ples collected within the frame of two randomized, double-blinded clinical trials which were carried out at the Universityand Polytechnic Hospital La Fe (Spain), Sant Joan de Deu(Spain), and the Sophia’s Children Hospital (The Netherlands)were analyzed. Due to the high number of samples analyzed,results obtained should assist researchers and pediatricians ininterpreting test results from future studies involving IsoPsand PGs and they could help to assess morbidities and treat-ment strategies (e.g., different resuscitation conditions) in theneonatal field. Moreover, results obtained will be useful forthe development of further methods for the analysis of theselipid peroxidation products in urine samples.
Material and methods
Population
Eligible neonates were preterm babies below 32 weeks’gestation born in 3 different institutions (HU La Fe; SJde Deu; Sophia’s Children Hospital) for a 2-year studyperiod. All these babies needed active resuscitation inthe form of positive pressure ventilation in the deliveryroom and were allocated to receive an initial FiO2 of30 % (Low Oxygen Group) or 60 % (HU La Fe; SJ deDeu), or 65 % (Sophia’s Children Hospital). The resus-citation team was blinded except for a non-blindedinvestigator for the FiO2 provided to the patient, andtheir intervention was guided by readings of the pulseoximeter (peripheral capillary oxygen saturation, SpO2).SpO2 had to be kept within safety range according tothe universally accepted guidelines (ILCOR 2010). Oncethe babies were stabilized they were transferred to theneonatal intensive care unit. Clinical characteristics arepresented in Table 1.
Standards and reagents
IsoP standards of 2,3-dinor-iPF2α-III, 8-iso-15-keto-PGE2, 8-iso-15-keto-PGF2α, 8-iso-PGE2, 5-iPF2α-VI, 8-iso-PGF2α,the PGs PGE2 and PGF2α, as well as the deuterated internalstandard (IS) PGF2α-D4 were purchased from CaymanChemical Company (Ann Arbor, MI, USA). Formic acid(analytical grade) was from Sigma-Aldrich Química SA(Madrid, Spain). Ethanol (analytical grade), methanol (LC-MS grade) and n-heptane (analytical grade) were obtainedfrom J.T. Baker (Avantor Performance Materials B.V., TheNetherlands), and ethyl acetate (analytical grade) fromPanreac (Barcelona, Spain).
Urine collection, storage, and pretreatment
Five hundred thirty-six urine samples were collected withinthe frame of two randomized and double-blinded clinical trialsenrolling ELGAN (i.e., gestational age <32 weeks) carried outin the Division of Neonatology at the Hospital La Fe(Valencia, Spain) and Sant Joan de Deu (Barcelona, Spain),clinical study: REOX, 2012-2013, EUDRACT 2088-005047-42, and the Sophia’s Children Hospital (Rotterdam, TheNetherlands, clinical study: NTR243 2005-2007) [26]. Thestudy protocols were approved by the local ethics committees(Comité de Ética e Investigación and MC Medical EthicsCommitee). In addition, 32 urine samples from healthy termneonates in good general conditions were collected on post-natal day 2 (control group). Parental permission was obtainedby signing an informed consent.
Urinary samples were collected within 24 h of birth and onpostnatal days 2, 3, 4, 6, 7, 14, 21, and 28 under sterileconditions in Hollister bags or by adding gauzes into thediapers. Samples were stored at −80 °C. After thawing onice, urine samples were homogenized and centrifuged at7,500 rpm for 10 min at 4 °C. Six hundred microliters of
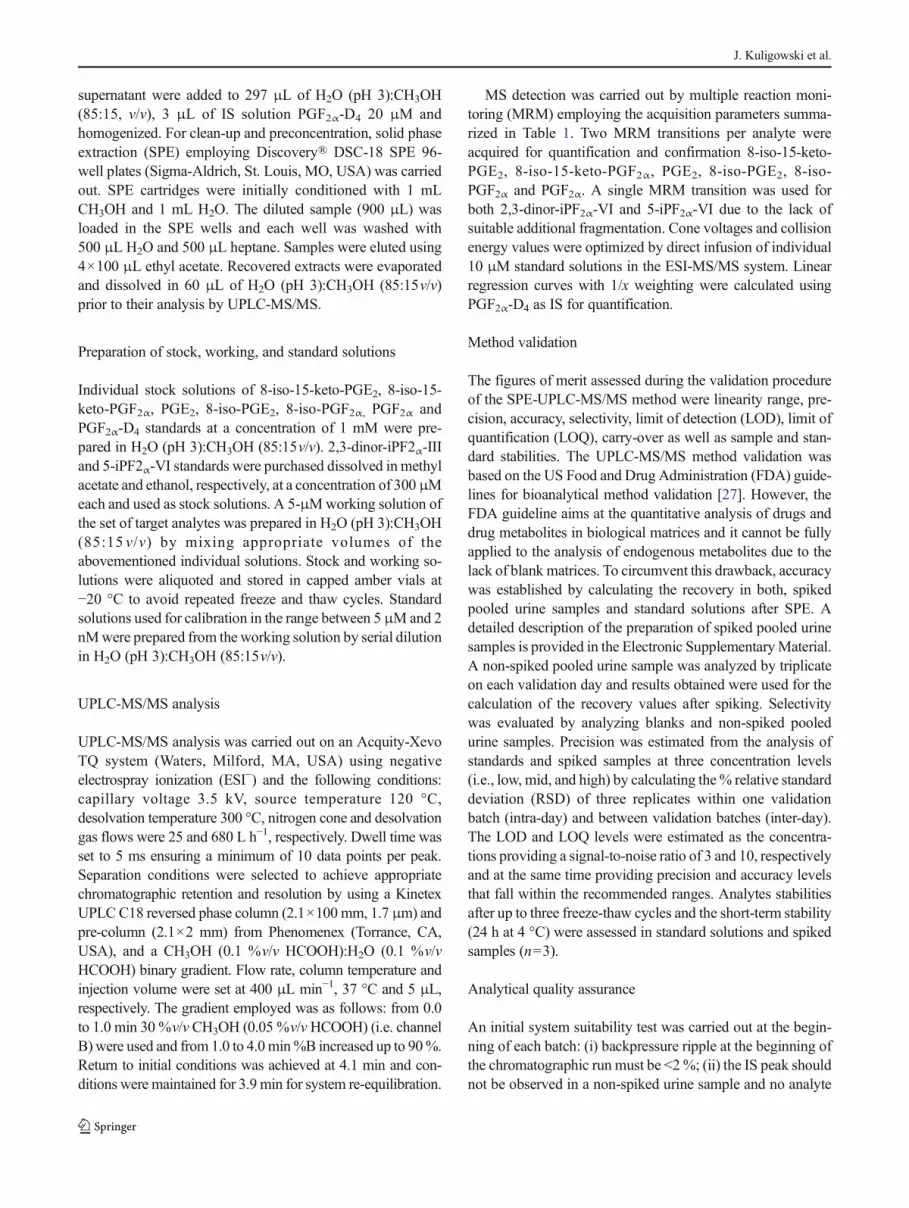
Table 1 Joint characteristics ofthe population of both clinicaltrials (Eudract 2088-005047-42;Valencia and Barcelona; Spainand the NTR243 2005-2007;Rotterdam; The Netherlands),which compared low (30–35 %)vs. high (60 %) initial FiO2 in thedelivery room in the stabilizationof very preterm infants
a Appearance (skin color), pulse(heart rate), grimace (reflex irrita-bility), activity (muscle tone),respiration
Low oxygen
N=143
High oxygen
N=120
Control
N=32
Male/female 69/74 58/62 20/12
Gestational age (weeks) 274/7±13/7 273/7±14/7 392/7±1.03
Birth weight (g)±s (g) 998±277 1021±303 3323±134
Antenatal steroids (%) 100 % 100 % 0 %
Vaginal/C-section (%) 24/76 31/69 32/0
Cord pH 7.22±1.1 7.17±1.8 7.34±0.18
Mean Apgar scorea (range) 1 min 6 (1–8) 6 (2–8) 9 (7–9)
Mean Apgar scorea (range) 5 min 7 (3–9) 7 (3–9) 9 (8–10)
Mean Apgar scorea (range) 10 min 8 (4–9) 8 (3–9) 9 (8–10)
Mortality (%) 6.5 % 11.6 % 0 %
Bronchopulmonary dysplasia 25.8 % 20.6 % 0 %
Lipid peroxidation biomarkers in ELGAN urines by UPLC-MS/MS
supernatant were added to 297 μL of H2O (pH 3):CH3OH(85:15, v/v), 3 μL of IS solution PGF2α-D4 20 μM andhomogenized. For clean-up and preconcentration, solid phaseextraction (SPE) employing Discovery® DSC-18 SPE 96-well plates (Sigma-Aldrich, St. Louis, MO, USA) was carriedout. SPE cartridges were initially conditioned with 1 mLCH3OH and 1 mL H2O. The diluted sample (900 μL) wasloaded in the SPE wells and each well was washed with500 μL H2O and 500 μL heptane. Samples were eluted using4×100 μL ethyl acetate. Recovered extracts were evaporatedand dissolved in 60 μL of H2O (pH 3):CH3OH (85:15v/v)prior to their analysis by UPLC-MS/MS.
Preparation of stock, working, and standard solutions
Individual stock solutions of 8-iso-15-keto-PGE2, 8-iso-15-keto-PGF2α, PGE2, 8-iso-PGE2, 8-iso-PGF2α, PGF2α andPGF2α-D4 standards at a concentration of 1 mM were pre-pared in H2O (pH 3):CH3OH (85:15v/v). 2,3-dinor-iPF2α-IIIand 5-iPF2α-VI standards were purchased dissolved in methylacetate and ethanol, respectively, at a concentration of 300 μMeach and used as stock solutions. A 5-μMworking solution ofthe set of target analytes was prepared in H2O (pH 3):CH3OH(85:15 v/v) by mixing appropriate volumes of theabovementioned individual solutions. Stock and working so-lutions were aliquoted and stored in capped amber vials at−20 °C to avoid repeated freeze and thaw cycles. Standardsolutions used for calibration in the range between 5 μMand 2nMwere prepared from the working solution by serial dilutionin H2O (pH 3):CH3OH (85:15v/v).
UPLC-MS/MS analysis
UPLC-MS/MS analysis was carried out on an Acquity-XevoTQ system (Waters, Milford, MA, USA) using negativeelectrospray ionization (ESI−) and the following conditions:capillary voltage 3.5 kV, source temperature 120 °C,desolvation temperature 300 °C, nitrogen cone and desolvationgas flows were 25 and 680 L h−1, respectively. Dwell time wasset to 5 ms ensuring a minimum of 10 data points per peak.Separation conditions were selected to achieve appropriatechromatographic retention and resolution by using a KinetexUPLCC18 reversed phase column (2.1×100 mm, 1.7 μm) andpre-column (2.1×2 mm) from Phenomenex (Torrance, CA,USA), and a CH3OH (0.1 %v/v HCOOH):H2O (0.1 %v/vHCOOH) binary gradient. Flow rate, column temperature andinjection volume were set at 400 μL min−1, 37 °C and 5 μL,respectively. The gradient employed was as follows: from 0.0to 1.0 min 30 %v/v CH3OH (0.05 %v/vHCOOH) (i.e. channelB) were used and from 1.0 to 4.0min%B increased up to 90%.Return to initial conditions was achieved at 4.1 min and con-ditions were maintained for 3.9 min for system re-equilibration.
MS detection was carried out by multiple reaction moni-toring (MRM) employing the acquisition parameters summa-rized in Table 1. Two MRM transitions per analyte wereacquired for quantification and confirmation 8-iso-15-keto-PGE2, 8-iso-15-keto-PGF2α, PGE2, 8-iso-PGE2, 8-iso-PGF2α and PGF2α. A single MRM transition was used forboth 2,3-dinor-iPF2α-VI and 5-iPF2α-VI due to the lack ofsuitable additional fragmentation. Cone voltages and collisionenergy values were optimized by direct infusion of individual10 μM standard solutions in the ESI-MS/MS system. Linearregression curves with 1/x weighting were calculated usingPGF2α-D4 as IS for quantification.
Method validation
The figures of merit assessed during the validation procedureof the SPE-UPLC-MS/MS method were linearity range, pre-cision, accuracy, selectivity, limit of detection (LOD), limit ofquantification (LOQ), carry-over as well as sample and stan-dard stabilities. The UPLC-MS/MS method validation wasbased on the US Food and Drug Administration (FDA) guide-lines for bioanalytical method validation [27]. However, theFDA guideline aims at the quantitative analysis of drugs anddrug metabolites in biological matrices and it cannot be fullyapplied to the analysis of endogenous metabolites due to thelack of blank matrices. To circumvent this drawback, accuracywas established by calculating the recovery in both, spikedpooled urine samples and standard solutions after SPE. Adetailed description of the preparation of spiked pooled urinesamples is provided in the Electronic SupplementaryMaterial.A non-spiked pooled urine sample was analyzed by triplicateon each validation day and results obtained were used for thecalculation of the recovery values after spiking. Selectivitywas evaluated by analyzing blanks and non-spiked pooledurine samples. Precision was estimated from the analysis ofstandards and spiked samples at three concentration levels(i.e., low, mid, and high) by calculating the% relative standarddeviation (RSD) of three replicates within one validationbatch (intra-day) and between validation batches (inter-day).The LOD and LOQ levels were estimated as the concentra-tions providing a signal-to-noise ratio of 3 and 10, respectivelyand at the same time providing precision and accuracy levelsthat fall within the recommended ranges. Analytes stabilitiesafter up to three freeze-thaw cycles and the short-term stability(24 h at 4 °C) were assessed in standard solutions and spikedsamples (n=3).
Analytical quality assurance
An initial system suitability test was carried out at the begin-ning of each batch: (i) backpressure ripple at the beginning ofthe chromatographic run must be <2%; (ii) the IS peak shouldnot be observed in a non-spiked urine sample and no analyte
J. Kuligowski et al.
peak should be detected in a solvent (i.e. H2O (0.05 %v/vHCOOH)) injection; (iii) appropriate sensitivity and precisionshould be observed from the triplicate analysis of a standardsolution at the LOQ. Accordingly, the %RSD of the peak areavalues should be ≤25 % and the signal-to-noise ratios shouldbe ≥9 for each analyte; and (iv) retention times should bewithin ±0.1 min between consecutive batches.
Blank samples and solvent blanks were analyzed atthe beginning of the sample batch measurement, after ahigh concentration standard and during the sample batchmeasurement to check for potential sources of contam-ination (e.g., column, mobile phase additives), carry-over and/or cross contamination. A mid-level spikedurine sample was analyzed in every sample batch mea-surement as quality control (QC) sample to detect devi-ations in accuracy and/or precision. Results from batchanalysis were accepted if at least 75 % of the valuesfound for the QC standards were within ±25 % of theirrespective nominal values.
Results
Selection of the UPLC-MS/MS conditions
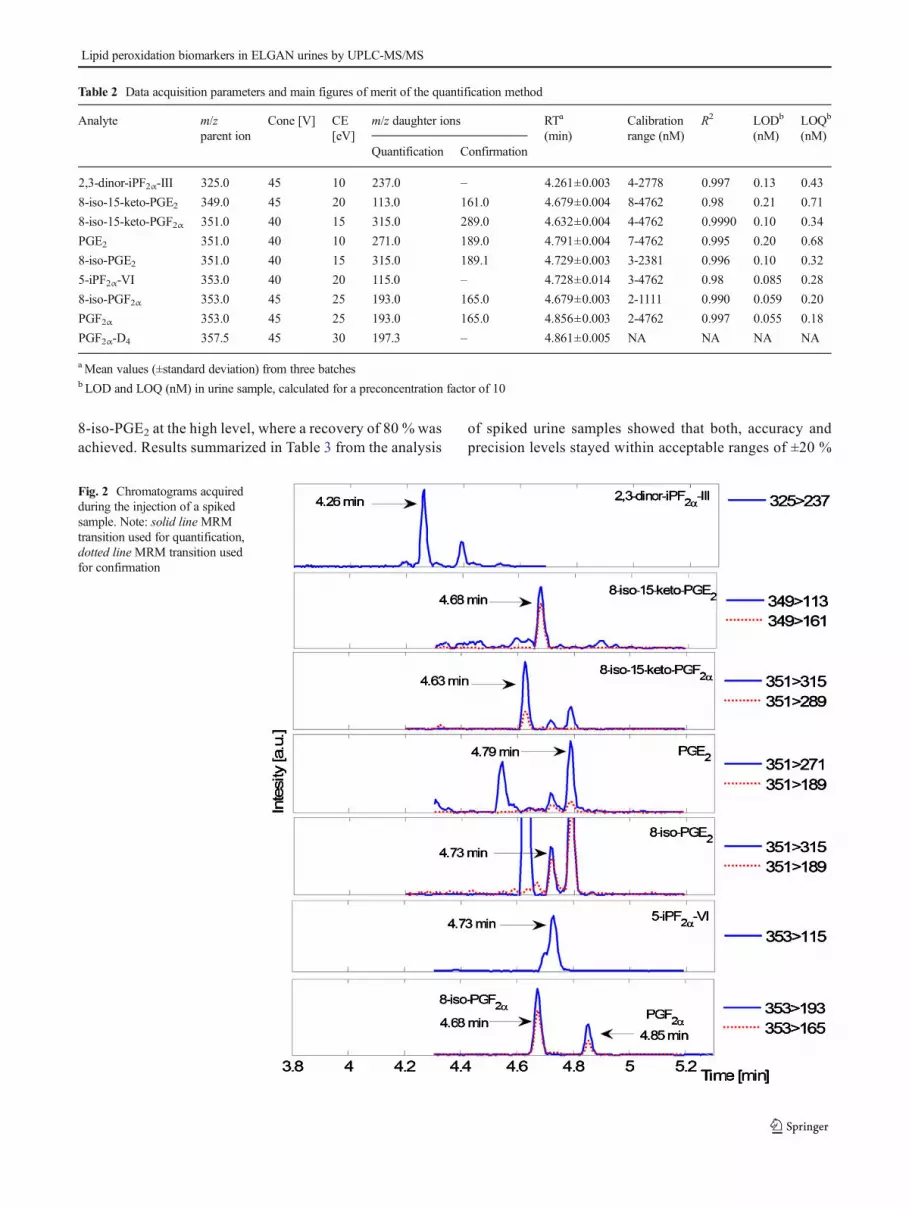
Ionization and fragmentation conditions for the MS/MS quan-tification of the selected IsoPs and PGs were optimized bydirect infusion of 10 μM individual standard solutions of 2,3-dinor-iPF2α-III, 8-iso-15-keto-PGE2, 8-iso-15-keto-PGF2α,PGE2, 8-iso-PGE2, 5-iPF2α-VI, 8-iso-PGF2α, PGF2α and theIS PGF2α-D4. Based on MS/MS spectra depicted in Fig. 1,conditions summarized in Table 2 were selected. From thedata shown, alternative MS/MS fragments could be selectedproviding comparable levels of sensitivity (data not shown).Specificity of the MRM transitions was assessed by analyzinga set of individual standards employing the proposed UPLC-MS/MS procedure as shown in Electronic SupplementaryMaterial Figure S1. Figure 2 displays representative UPLC-MS/MS chromatograms extracted from the analysis of aspiked pooled urine sample. The obtained results confirmedthat the chromatographic resolution among analytes was suf-ficient to resolve interfering compounds (e.g., PGE2, 8-iso-PGE2 and 8-iso-15-keto-PGF2α). However, a shoulder wasobserved during the analysis of both, standard solutions of 5-iPF2α-VI and spiked urine samples. The same observationwas made by Yan et al. [28] who stated that the interferingsignal is likely coming from an impurity of 5-epi-iPF2α-VI inthe analytical standard.
SPE of IsoPs and PGs
The proposed UPLC-MS/MS method aims at the assessmentof the status of lipid peroxidation in extremely low gestational
age newborns. In this type of studies the collected urinevolumes are typically very limited and so, the use of highvolumes of urine to increase the preconcentration factor is notfeasible. Therefore, a SPE preconcentration factor of 10was selected to provide higher sensitivity allowing atthe same time, sample reanalysis in case of, e.g., instru-mental failure. Electronic Supplementary MaterialFigure S2 shows the effect of the volume of ethylacetate ranging between 200 and 500 μL employed forthe elution of the analytes during SPE. From resultsshown, 400 μL provided maximum recoveries and so,further experiments were carried out under this condi-tion. After elution of the analytes from the SPE car-tridge, samples were evaporated to dryness at roomtemperature employing a stream of N2 and reconstitutedin 60 μL H2O (pH 3):CH3OH (85:15v/v). The effect ofsample evaporation and reconstitution was evaluated instandards, obtaining quantitative recoveries for allanalytes (results not shown).
To determine the accuracy and precision of the SPE proce-dure, standard solutions (n=9) covering the whole calibrationrange were extracted. Mean recoveries and standard deviationvalues obtained from the analysis of standard solutions beforeand after SPE are shown in Electronic SupplementaryMaterial Table S1. Herewith, it was confirmed that the devel-oped SPE procedure was highly efficient and quantitative forall tested analytes in aqueous solutions.
Quantification of IsoPs and PGs in urine samples
Table 2 summarizes the main figures of merit obtained for thequantification of the selected set of IsoPs and PGs. Highlyreproducible retention times were observed for the set ofmetabolites and the IS. Linear calibration lines calculatedusing PGF2α-D4 as IS were obtained covering three ordersof magnitude. Linearity was evaluated for all analytes usingthe coefficients of determination (R2>0.98) and by visualinspection of the homoscedasticity of the residuals. Besides,no carry-over was observed as peak areas of the blank injec-tion remained below 5 % of the signal of the LOD standard.LOD and LOQ expressed as nanomoles per liter urine were inthe 0.06–0.21 and 0.18–0.71 range, respectively. Theachieved LODs were of the same magnitude than those re-ported in published works employing LC-MS/MS methodsfor the same analytes: Masoodi et al. [29] determined 8-iso-15-keto-PGE2, 8-iso-15-keto-PGF2α, PGE2, 8-iso-PGE2, 8-iso-PGF2α, and PGF2α in urine, plasma and tissue samplesachieving LODs between 0.3 and 3 nM; Medina et al. [25]reported LODs of 0.12, 1.0 and 0.06 nM for 2,3-dinor-iPF2α-III, 8-iso-15-keto-PGF2α, and 8-iso-PGF2α in urine respec-tively. Prasain et al. [30] determined 8-iso-PGF2α and PGF2αin urine at LODs of 0.05 nM. Levison et al. [31] obtained anLOD of 0.2 nM for PGF2α in urine and plasma. Janagap et al.
Lipid peroxidation biomarkers in ELGAN urines by UPLC-MS/MS

[32] determined PGE2 and PGF2α in fish gonads with LODsof 3 and 4 nM, respectively. Langhorst et al. [33] and Zhanget al. [34] determined urinary 8-iso-PGF2α and 2,3-dinor-iPF2α-III with LODs of 0.3 and 0.6 nM, respectively andStrassburg et al. [35] reported LODs of 0.2, 0.4, 1.0 and 0.9nM for PGE2, 5-iPF2α-VI, 8-iso-PGF2α, and PGF2α, respec-tively, in plasma samples.
In Table 3, back-calculated recovery values in both,standard solutions and spiked urine samples after SPE aresummarized. A pooled urine sample prepared from 25
urine samples collected during the NTR243 2005–2007clinical study was spiked at three concentration levelsand recovery values were calculated taking into accountthe concentration of the analytes in the non-spiked sample.As shown in Electronic Supplementary Material Table S2,in this pooled urine sample only 5-iPF2α-VI and PGF2αconcentrations were above the LOQ. Adequate accuracieswere obtained in standard solutions ranging between 89and 114 %. Precision levels remained <20 % at the LOQand <15 % for higher concentrations, with the exception of
Fig. 1 MS/MS spectra obtainedby direct infusion of individualstandard solutions of each analyte
J. Kuligowski et al.
8-iso-PGE2 at the high level, where a recovery of 80 % wasachieved. Results summarized in Table 3 from the analysis
of spiked urine samples showed that both, accuracy andprecision levels stayed within acceptable ranges of ±20 %
Fig. 2 Chromatograms acquiredduring the injection of a spikedsample. Note: solid lineMRMtransition used for quantification,dotted lineMRM transition usedfor confirmation
Table 2 Data acquisition parameters and main figures of merit of the quantification method
Analyte m/zparent ion
Cone [V] CE[eV]
m/z daughter ions RTa
(min)Calibrationrange (nM)
R2 LODb
(nM)LOQb
(nM)Quantification Confirmation
2,3-dinor-iPF2α-III 325.0 45 10 237.0 – 4.261±0.003 4-2778 0.997 0.13 0.43
8-iso-15-keto-PGE2 349.0 45 20 113.0 161.0 4.679±0.004 8-4762 0.98 0.21 0.71
8-iso-15-keto-PGF2α 351.0 40 15 315.0 289.0 4.632±0.004 4-4762 0.9990 0.10 0.34
PGE2 351.0 40 10 271.0 189.0 4.791±0.004 7-4762 0.995 0.20 0.68
8-iso-PGE2 351.0 40 15 315.0 189.1 4.729±0.003 3-2381 0.996 0.10 0.32
5-iPF2α-VI 353.0 40 20 115.0 – 4.728±0.014 3-4762 0.98 0.085 0.28
8-iso-PGF2α 353.0 45 25 193.0 165.0 4.679±0.003 2-1111 0.990 0.059 0.20
PGF2α 353.0 45 25 193.0 165.0 4.856±0.003 2-4762 0.997 0.055 0.18
PGF2α-D4 357.5 45 30 197.3 – 4.861±0.005 NA NA NA NA
aMean values (±standard deviation) from three batchesb LOD and LOQ (nM) in urine sample, calculated for a preconcentration factor of 10
Lipid peroxidation biomarkers in ELGAN urines by UPLC-MS/MS
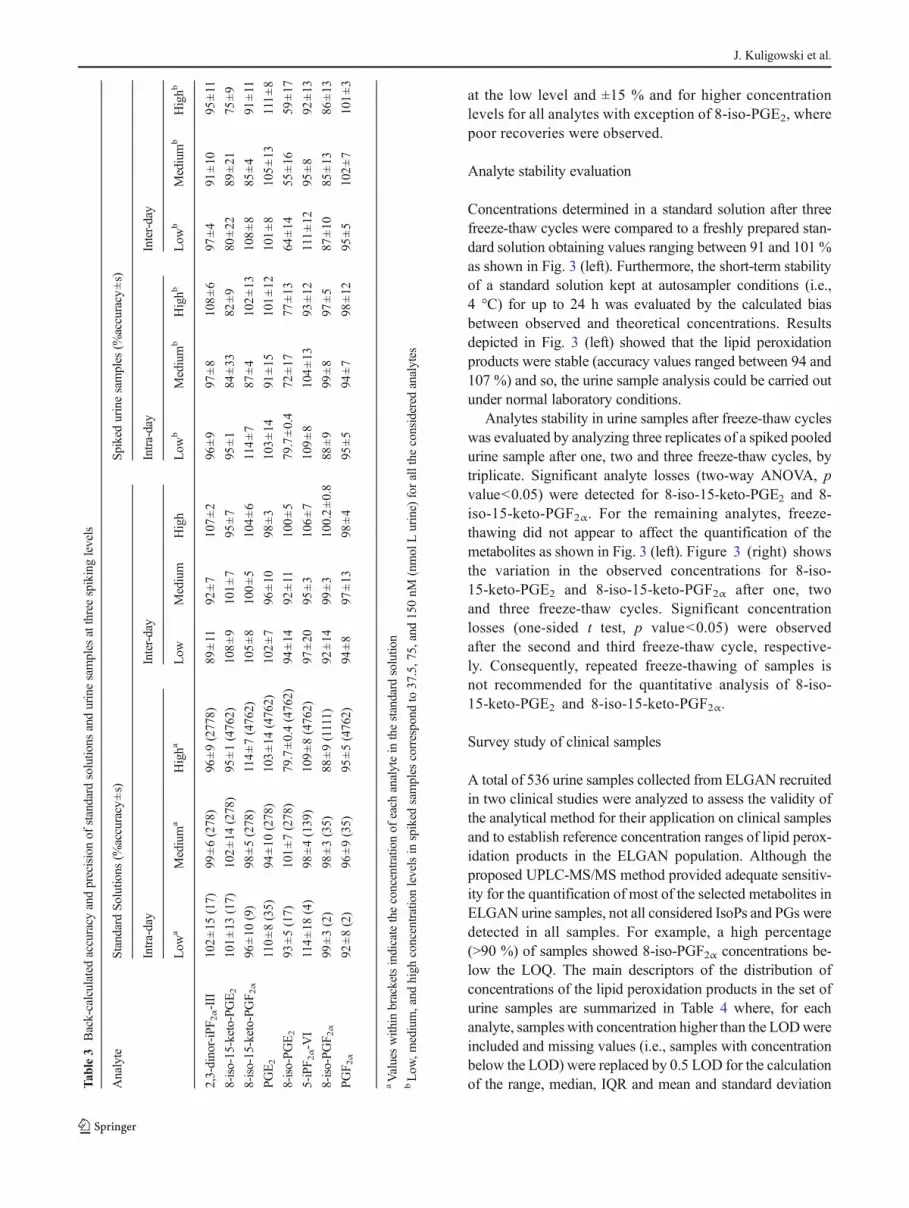
at the low level and ±15 % and for higher concentrationlevels for all analytes with exception of 8-iso-PGE2, wherepoor recoveries were observed.
Analyte stability evaluation
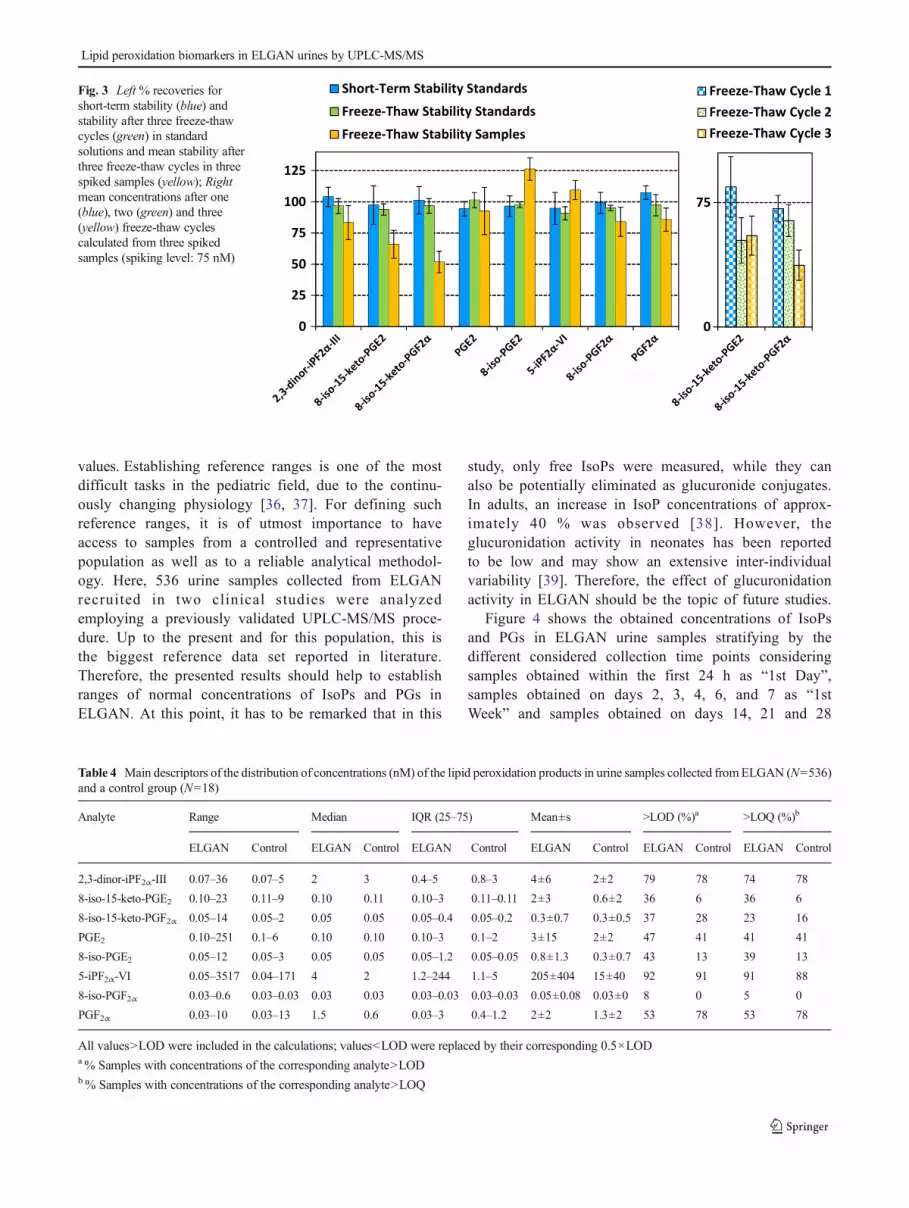
Concentrations determined in a standard solution after threefreeze-thaw cycles were compared to a freshly prepared stan-dard solution obtaining values ranging between 91 and 101 %as shown in Fig. 3 (left). Furthermore, the short-term stabilityof a standard solution kept at autosampler conditions (i.e.,4 °C) for up to 24 h was evaluated by the calculated biasbetween observed and theoretical concentrations. Resultsdepicted in Fig. 3 (left) showed that the lipid peroxidationproducts were stable (accuracy values ranged between 94 and107 %) and so, the urine sample analysis could be carried outunder normal laboratory conditions.
Analytes stability in urine samples after freeze-thaw cycleswas evaluated by analyzing three replicates of a spiked pooledurine sample after one, two and three freeze-thaw cycles, bytriplicate. Significant analyte losses (two-way ANOVA, pvalue<0.05) were detected for 8-iso-15-keto-PGE2 and 8-iso-15-keto-PGF2α. For the remaining analytes, freeze-thawing did not appear to affect the quantification of themetabolites as shown in Fig. 3 (left). Figure 3 (right) showsthe variation in the observed concentrations for 8-iso-15-keto-PGE2 and 8-iso-15-keto-PGF2α after one, twoand three freeze-thaw cycles. Significant concentrationlosses (one-sided t test, p value<0.05) were observedafter the second and third freeze-thaw cycle, respective-ly. Consequently, repeated freeze-thawing of samples isnot recommended for the quantitative analysis of 8-iso-15-keto-PGE2 and 8-iso-15-keto-PGF2α.
Survey study of clinical samples
A total of 536 urine samples collected from ELGAN recruitedin two clinical studies were analyzed to assess the validity ofthe analytical method for their application on clinical samplesand to establish reference concentration ranges of lipid perox-idation products in the ELGAN population. Although theproposed UPLC-MS/MS method provided adequate sensitiv-ity for the quantification of most of the selected metabolites inELGAN urine samples, not all considered IsoPs and PGs weredetected in all samples. For example, a high percentage(>90 %) of samples showed 8-iso-PGF2α concentrations be-low the LOQ. The main descriptors of the distribution ofconcentrations of the lipid peroxidation products in the set ofurine samples are summarized in Table 4 where, for eachanalyte, samples with concentration higher than the LODwereincluded and missing values (i.e., samples with concentrationbelow the LOD) were replaced by 0.5 LOD for the calculationof the range, median, IQR and mean and standard deviationT
able3
Back-calculated
accuracy
andprecisionof
standard
solutio
nsandurinesamples
atthreespikinglevels
Analyte
StandardSo
lutio
ns(%
accuracy±s)
Spikedurinesamples
(%accuracy
±s)
Intra-day
Inter-day
Intra-day
Inter-day
Low
aMedium
aHigha
Low
Medium
High
Low
bMedium
bHighb
Low
bMedium
bHighb
2,3-dinor-iPF2α-III
102±15
(17)
99±6(278)
96±9(2778)
89±11
92±7
107±2
96±9
97±8
108±6
97±4
91±10
95±11
8-iso-15-keto-PG
E2
101±13
(17)
102±14
(278)
95±1(4762)
108±9
101±7
95±7
95±1
84±33
82±9
80±22
89±21
75±9
8-iso-15-keto-PG
F 2α
96±10
(9)
98±5(278)
114±7(4762)
105±8
100±5
104±6
114±7
87±4
102±13
108±8
85±4
91±11
PGE2
110±8(35)
94±10
(278)
103±14
(4762)
102±7
96±10
98±3
103±14
91±15
101±12
101±8
105±13
111±8
8-iso-PG
E2
93±5(17)
101±7(278)
79.7±0.4(4762)
94±14
92±11
100±5
79.7±0.4
72±17
77±13
64±14
55±16
59±17
5-iPF2α-V
I114±18
(4)
98±4(139)
109±8(4762)
97±20
95±3
106±7
109±8
104±13
93±12
111±12
95±8
92±13
8-iso-PG
F 2α
99±3(2)
98±3(35)
88±9(1111)
92±14
99±3
100.2±0.8
88±9
99±8
97±5
87±10
85±13
86±13
PGF2α
92±8(2)
96±9(35)
95±5(4762)
94±8
97±13
98±4
95±5
94±7
98±12
95±5
102±7
101±3
aValueswith
inbracketsindicatetheconcentrationof
each
analytein
thestandard
solutio
nbLow
,medium,and
high
concentrationlevelsin
spiked
samples
correspond
to37.5,75,and150nM
(nmol
Lurine)
forallthe
considered
analytes
J. Kuligowski et al.
values. Establishing reference ranges is one of the mostdifficult tasks in the pediatric field, due to the continu-ously changing physiology [36, 37]. For defining suchreference ranges, it is of utmost importance to haveaccess to samples from a controlled and representativepopulation as well as to a reliable analytical methodol-ogy. Here, 536 urine samples collected from ELGANrecruited in two clinical studies were analyzedemploying a previously validated UPLC-MS/MS proce-dure. Up to the present and for this population, this isthe biggest reference data set reported in literature.Therefore, the presented results should help to establishranges of normal concentrations of IsoPs and PGs inELGAN. At this point, it has to be remarked that in this
study, only free IsoPs were measured, while they canalso be potentially eliminated as glucuronide conjugates.In adults, an increase in IsoP concentrations of approx-imately 40 % was observed [38]. However, theglucuronidation activity in neonates has been reportedto be low and may show an extensive inter-individualvariability [39]. Therefore, the effect of glucuronidationactivity in ELGAN should be the topic of future studies.
Figure 4 shows the obtained concentrations of IsoPsand PGs in ELGAN urine samples stratifying by thedifferent considered collection time points consideringsamples obtained within the first 24 h as “1st Day”,samples obtained on days 2, 3, 4, 6, and 7 as “1stWeek” and samples obtained on days 14, 21 and 28
Table 4 Main descriptors of the distribution of concentrations (nM) of the lipid peroxidation products in urine samples collected fromELGAN (N=536)and a control group (N=18)
Analyte Range Median IQR (25–75) Mean±s >LOD (%)a >LOQ (%)b
ELGAN Control ELGAN Control ELGAN Control ELGAN Control ELGAN Control ELGAN Control
2,3-dinor-iPF2α-III 0.07–36 0.07–5 2 3 0.4–5 0.8–3 4±6 2±2 79 78 74 78
8-iso-15-keto-PGE2 0.10–23 0.11–9 0.10 0.11 0.10–3 0.11–0.11 2±3 0.6±2 36 6 36 6
8-iso-15-keto-PGF2α 0.05–14 0.05–2 0.05 0.05 0.05–0.4 0.05–0.2 0.3±0.7 0.3±0.5 37 28 23 16
PGE2 0.10–251 0.1–6 0.10 0.10 0.10–3 0.1–2 3±15 2±2 47 41 41 41
8-iso-PGE2 0.05–12 0.05–3 0.05 0.05 0.05–1.2 0.05–0.05 0.8±1.3 0.3±0.7 43 13 39 13
5-iPF2α-VI 0.05–3517 0.04–171 4 2 1.2–244 1.1–5 205±404 15±40 92 91 91 88
8-iso-PGF2α 0.03–0.6 0.03–0.03 0.03 0.03 0.03–0.03 0.03–0.03 0.05±0.08 0.03±0 8 0 5 0
PGF2α 0.03–10 0.03–13 1.5 0.6 0.03–3 0.4–1.2 2±2 1.3±2 53 78 53 78
All values>LOD were included in the calculations; values<LOD were replaced by their corresponding 0.5×LODa% Samples with concentrations of the corresponding analyte>LODb% Samples with concentrations of the corresponding analyte>LOQ
Fig. 3 Left % recoveries forshort-term stability (blue) andstability after three freeze-thawcycles (green) in standardsolutions and mean stability afterthree freeze-thaw cycles in threespiked samples (yellow); Rightmean concentrations after one(blue), two (green) and three(yellow) freeze-thaw cyclescalculated from three spikedsamples (spiking level: 75 nM)
Lipid peroxidation biomarkers in ELGAN urines by UPLC-MS/MS
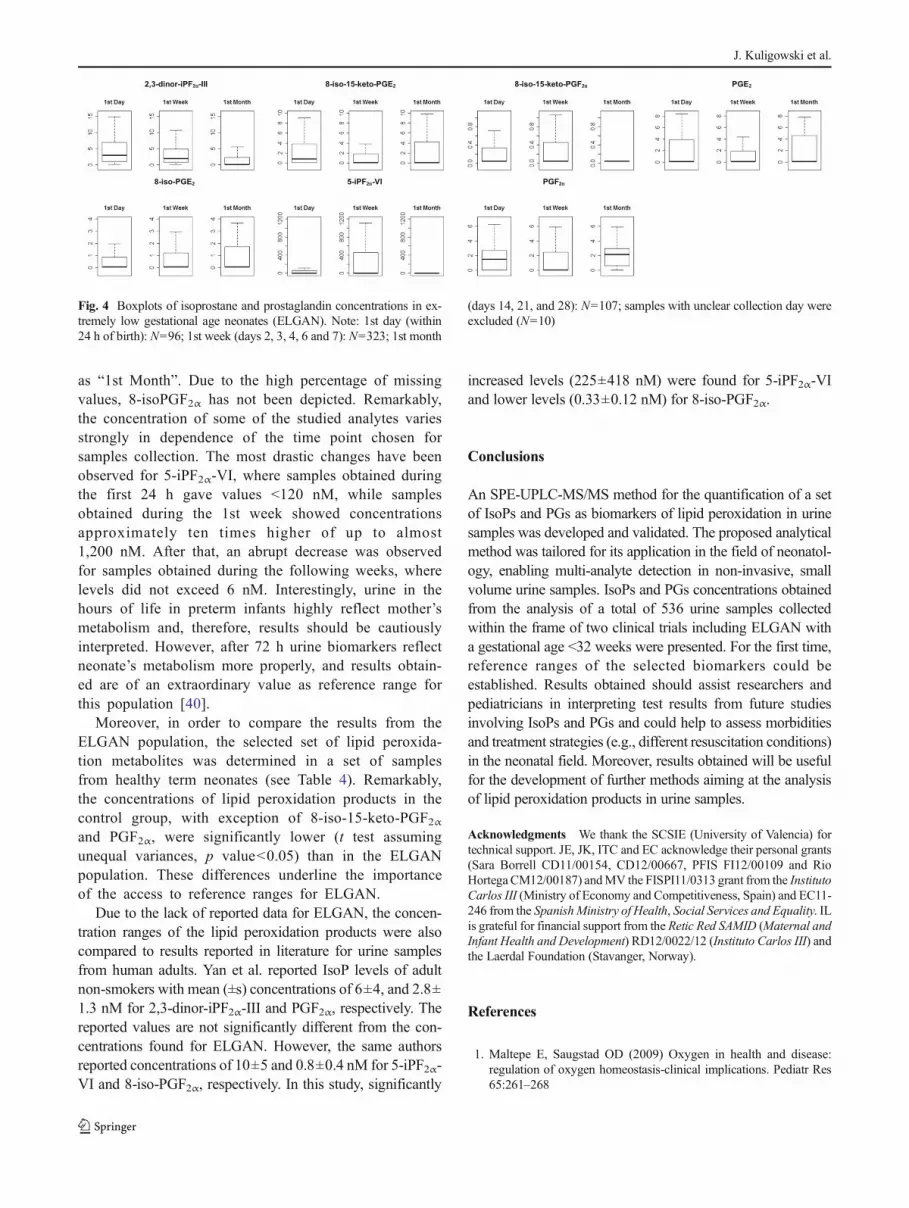
as “1st Month”. Due to the high percentage of missingvalues, 8-isoPGF2α has not been depicted. Remarkably,the concentration of some of the studied analytes variesstrongly in dependence of the time point chosen forsamples collection. The most drastic changes have beenobserved for 5-iPF2α-VI, where samples obtained duringthe first 24 h gave values <120 nM, while samplesobtained during the 1st week showed concentrationsapproximately ten times higher of up to almost1,200 nM. After that, an abrupt decrease was observedfor samples obtained during the following weeks, wherelevels did not exceed 6 nM. Interestingly, urine in thehours of life in preterm infants highly reflect mother’smetabolism and, therefore, results should be cautiouslyinterpreted. However, after 72 h urine biomarkers reflectneonate’s metabolism more properly, and results obtain-ed are of an extraordinary value as reference range forthis population [40].
Moreover, in order to compare the results from theELGAN population, the selected set of lipid peroxida-tion metabolites was determined in a set of samplesfrom healthy term neonates (see Table 4). Remarkably,the concentrations of lipid peroxidation products in thecontrol group, with exception of 8-iso-15-keto-PGF2αand PGF2α, were significantly lower (t test assumingunequal variances, p value<0.05) than in the ELGANpopulation. These differences underline the importanceof the access to reference ranges for ELGAN.
Due to the lack of reported data for ELGAN, the concen-tration ranges of the lipid peroxidation products were alsocompared to results reported in literature for urine samplesfrom human adults. Yan et al. reported IsoP levels of adultnon-smokers with mean (±s) concentrations of 6±4, and 2.8±1.3 nM for 2,3-dinor-iPF2α-III and PGF2α, respectively. Thereported values are not significantly different from the con-centrations found for ELGAN. However, the same authorsreported concentrations of 10±5 and 0.8±0.4 nM for 5-iPF2α-VI and 8-iso-PGF2α, respectively. In this study, significantly
increased levels (225±418 nM) were found for 5-iPF2α-VIand lower levels (0.33±0.12 nM) for 8-iso-PGF2α.
Conclusions
An SPE-UPLC-MS/MS method for the quantification of a setof IsoPs and PGs as biomarkers of lipid peroxidation in urinesamples was developed and validated. The proposed analyticalmethod was tailored for its application in the field of neonatol-ogy, enabling multi-analyte detection in non-invasive, smallvolume urine samples. IsoPs and PGs concentrations obtainedfrom the analysis of a total of 536 urine samples collectedwithin the frame of two clinical trials including ELGAN witha gestational age <32 weeks were presented. For the first time,reference ranges of the selected biomarkers could beestablished. Results obtained should assist researchers andpediatricians in interpreting test results from future studiesinvolving IsoPs and PGs and could help to assess morbiditiesand treatment strategies (e.g., different resuscitation conditions)in the neonatal field. Moreover, results obtained will be usefulfor the development of further methods aiming at the analysisof lipid peroxidation products in urine samples.
Acknowledgments We thank the SCSIE (University of Valencia) fortechnical support. JE, JK, ITC and EC acknowledge their personal grants(Sara Borrell CD11/00154, CD12/00667, PFIS FI12/00109 and RioHortega CM12/00187) andMV the FISPI11/0313 grant from the InstitutoCarlos III (Ministry of Economy and Competitiveness, Spain) and EC11-246 from the SpanishMinistry of Health, Social Services and Equality. ILis grateful for financial support from the Retic Red SAMID (Maternal andInfant Health and Development) RD12/0022/12 (Instituto Carlos III) andthe Laerdal Foundation (Stavanger, Norway).
References
1. Maltepe E, Saugstad OD (2009) Oxygen in health and disease:regulation of oxygen homeostasis-clinical implications. Pediatr Res65:261–268
Fig. 4 Boxplots of isoprostane and prostaglandin concentrations in ex-tremely low gestational age neonates (ELGAN). Note: 1st day (within24 h of birth): N=96; 1st week (days 2, 3, 4, 6 and 7): N=323; 1st month
(days 14, 21, and 28): N=107; samples with unclear collection day wereexcluded (N=10)
J. Kuligowski et al.
2. Vento M, Aguar M, Escobar J et al (2009) Antenatal steroids andantioxidant enzyme activity in preterm infants: influence of genderand timing. Antioxid Redox Signal 11:2945–2955. doi:10.1089/ars.2009.2671
3. Friel JK, Friesen RW, Harding SV, Roberts LJ (2004) Evidence ofoxidative stress in full-term healthy infants. Pediatr Res 56:878–882.doi:10.1203/01.PDR.0000146032.98120.43
4. Vento M, Escobar J, Cernada M et al (2012) The use and misuse ofoxygen during the neonatal period. Clin Perinatol 39:165. doi:10.1016/j.clp.2011.12.014
5. Dawson JA, Kamlin COF, Vento M et al (2010) Defining the refer-ence range for oxygen saturation for infants after birth. Pediatrics125:E1340–E1347. doi:10.1542/peds.2009-1510
6. Vento M, Saugstad OD (2011) Oxygen supplementation in the de-livery room: updated information. J Pediatr 158:e5–e7. doi:10.1016/j.jpeds.2010.11.004
7. Saugstad OD, Sejersted Y, Solberg R et al (2012) Oxygenation of thenewborn: a molecular approach. Neonatology 101:315–325. doi:10.1159/000337345
8. Perlman JM, Wyllie J, Kattwinkel J et al (2010) Part 11:Neonatal resuscitation: 2010 International Consensus onC a r d i o p u lmon a r y R e s u s c i t a t i o n a n d Eme rg e n c yC a r d i o v a s c u l a r C a r e S c i e n c e W i t h T r e a t m e n tRecommendations. Circulation 122:S516–S538. doi:10.1161/CIRCULATIONAHA.110.971127
9. Brown JVE, Moe-Byrne T, Harden M, McGuire W (2012) Lowerversus higher oxygen concentration for delivery room stabilisation ofpreterm neonates: systematic review. PLoS One 7:e52033. doi:10.1371/journal.pone.0052033
10. Halliwell B, Whiteman M (2004) Measuring reactive species andoxidative damage in vivo and in cell culture: how should you do itand what do the results mean? Br J Pharmacol 142:231–255. doi:10.1038/sj.bjp.0705776
11. Guéraud F, Atalay M, Bresgen N et al (2010) Chemistry and bio-chemistry of lipid peroxidation products. Free Radic Res 44:1098–1124. doi:10.3109/10715762.2010.498477
12. Lindauer E, Dupuis L, Müller H-P et al (2013) Adipose tissuedistribution predicts survival in amyotrophic lateral sclerosis. PLoSOne 8:e67783. doi:10.1371/journal.pone.0067783
13. Solberg R, Longini M, Proietti F et al (2012) Resuscitation withsupplementary oxygen induces oxidative injury in the cerebral cor-tex. Free Radic Biol Med 53:1061–1067. doi:10.1016/j.freeradbiomed.2012.07.022
14. Milne GL, Yin H, Hardy KD et al (2011) Isoprostane generation andfunction. Chem Rev 111:5973–5996. doi:10.1021/cr200160h
15. Roberts LJ, Milne GL (2009) Isoprostanes. J Lipid Res 50:S219–S223. doi:10.1194/jlr.R800037-JLR200
16. Morrow JD, Hill KE, Burk RF et al (1990) A series of prostaglandinF2-like compounds are produced in vivo in humans by a non-cyclooxygenase, free radical-catalyzed mechanism. Proc Natl AcadSci U S A 87:9383–9387
17. Roberts LJ II, Morrow JD (2000) Measurement of F2-isoprostanes asan index of oxidative stress in vivo. Free Radic Biol Med 28:505–513. doi:10.1016/S0891-5849(99)00264-6
18. Niki E (2014) Biomarkers of lipid peroxidation in clinical material.Biochim Biophys Acta 1840:809–817. doi:10.1016/j.bbagen.2013.03.020
19. Milne GL, Gao B, Terry ES et al (2013) Measurement of F2-isoprostanes and isofurans using gas chromatography-mass spec-trometry. Free Radic Biol Med 59:36–44. doi:10.1016/j.freeradbiomed.2012.09.030
20. Klawitter J, Haschke M, Shokati T et al (2011) Quantification of 15-F2t-isoprostane in human plasma and urine: results from enzyme-linked immunoassay and liquid chromatography/tandem mass spec-trometry cannot be compared. Rapid CommunMass Spectrom RCM25:463–468. doi:10.1002/rcm.4871
21. Proudfoot J, Barden A, Mori TA et al (1999) Measurement ofurinary F(2)-isoprostanes as markers of in vivo lipid peroxidation-Acomparison of enzyme immunoassay with gas chromatography/massspectrometry. Anal Biochem 272:209–215. doi:10.1006/abio.1999.4187
22. Lee C-YJ, Jenner AM, Halliwell B (2004) Rapid preparation ofhuman urine and plasma samples for analysis of F2-isoprostanes bygas chromatography-mass spectrometry. Biochem Biophys ResCommun 320:696–702. doi:10.1016/j.bbrc.2004.06.015
23. Mas E, Michel F, Guy A et al (2008) Quantification of urinary F2-isoprostanes with 4(RS)-F4t-neuroprostane as an internal standardusing gas chromatography-mass spectrometry Application topolytraumatized patients. J Chromatogr B Analyt Technol BiomedLife Sci 872:133–140. doi:10.1016/j.jchromb.2008.07.037
24. Sterz K, Scherer G, Ecker J (2012) A simple and robust UPLC-SRM/MS method to quantify urinary eicosanoids. J Lipid Res 53:1026–1036. doi:10.1194/jlr.D023739
25. Medina S, Domínguez-Perles R, Gil JI et al (2012) A ultra-pressureliquid chromatography/triple quadrupole tandem mass spectrometrymethod for the analysis of 13 eicosanoids in human urine andquantitative 24 hour values in healthy volunteers in a controlledconstant diet. Rapid Commun Mass Spectrom RCM 26:1249–1257. doi:10.1002/rcm.6224
26. Rook D, Schierbeek H, van der Eijk AC et al (2012) Resuscitation ofvery preterm infants with 30 % vs. 65 % oxygen at birth: studyprotocol for a randomized controlled trial. Trials 13:65
27. Food and Drug Administration (FDA) (2001) Guidance for industry:bioanalytical method validation
28. Yan W, Byrd GD, Ogden MW (2007) Quantitation of isoprostaneisomers in human urine from smokers and nonsmokers by LC-MS/MS. J Lipid Res 48:1607–1617. doi:10.1194/jlr.M700097-JLR200
29. Masoodi M, Nicolaou A (2006) Lipidomic analysis of twenty-sevenprostanoids and isoprostanes by liquid chromatography/electrospraytandem mass spectrometry. Rapid Commun Mass Spectrom RCM20:3023–3029. doi:10.1002/rcm.2697
30. Prasain JK, Arabshahi A, Taub PR et al (2013) Simultaneous quan-tification of F2-isoprostanes and prostaglandins in human urine byliquid chromatography tandem-mass spectrometry. J Chromatogr BAnalyt Technol Biomed Life Sci 913–914:161–168. doi:10.1016/j.jchromb.2012.12.009
31. Levison BS, Zhang R, Wang Z et al (2013) Quantification of fattyacid oxidation products using online high-performance liquid chro-matography tandem mass spectrometry. Free Radic Biol Med 59:2–13. doi:10.1016/j.freeradbiomed.2013.03.001
32. Janagap S, Azeredo R, Nguyen T-T et al (2012) Development ofan extraction method for the determination of prostaglandins inbiological tissue samples using liquid chromatography-tandemmass spectrometry: application to gonads of Atlantic cod(Gadus morhua). Anal Chim Acta 749:51–55. doi:10.1016/j.aca.2012.08.039
33. Langhorst ML, Hastings MJ, Yokoyama WH et al (2010)Determination of F2-isoprostanes in urine by online solid phaseextraction coupled to liquid chromatography with tandemmass spectrometry. J Agric Food Chem 58:6614–6620. doi:10.1021/jf101146q
34. Zhang H, Il’yasova D, Sztaray J et al (2010) Quantification of theoxidative damage biomarker 2,3-dinor-8-isoprostaglandin-F(2alpha)in human urine using liquid chromatography-tandem mass spectrom-etry. Anal Biochem 399:302–304. doi:10.1016/j.ab.2009.12.024
35. Strassburg K, Huijbrechts AML, Kortekaas KA et al (2012)Quantitative profiling of oxylipins through comprehensive LC-MS/MS analysis: application in cardiac surgery. Anal Bioanal Chem 404:1413–1426. doi:10.1007/s00216-012-6226-x
36. Ceriotti F (2012) Establishing pediatric reference intervals: achallenging task. Clin Chem 58:808–810. doi:10.1373/clinchem.2012.183483
Lipid peroxidation biomarkers in ELGAN urines by UPLC-MS/MS
37. Colantonio DA, Kyriakopoulou L, Chan MK et al (2012) Closingthe gaps in pediatric laboratory reference intervals: a CALIPERdatabase of 40 biochemical markers in a healthy and multiethnicpopulation of children. Clin Chem 58:854–868. doi:10.1373/clinchem.2011.177741
38. Yan Z, Mas E, Mori TA et al (2010) A significant proportion ofF2-isoprostanes in human urine are excreted as glucuronide con-jugates. Anal Biochem 403:126–128. doi:10.1016/j.ab.2010.04.016
39. Allegaert K, Vanhaesebrouck S, Verbesselt R, van den AnkerJN (2009) In vivo glucuronidation activity of drugs in neo-nates: extensive interindividual variability despite their youngage. Ther Drug Monit 31:411–415. doi:10.1097/FTD.0b013e3181a8cc0a
40. Gallini F, Maggio L, Romagnoli C et al (2000) Progression of renalfunction in preterm neonates with gestational age<or=32 weeks.Pediatr Nephrol Berl Ger 15:119–124
J. Kuligowski et al.