Embed Size (px)
Citation preview
High-Throughput Microbore UPLC−MS Metabolic Phenotypingof Urine for Large-Scale Epidemiology StudiesNicola Gray,† Matthew R. Lewis,‡ Robert S. Plumb,† Ian D. Wilson,† and Jeremy K. Nicholson†,‡,*†Division of Computational and Systems Medicine, Department of Surgery and Cancer, South Kensington Campus, London,SW7 2AZ, United Kingdom‡MRC-NIHR National Phenome Centre, Division of Computational and Systems Medicine, Department of Surgery and Cancer,IRDB Building, Imperial College London, Hammersmith Hospital, London, W12 0NN, United Kingdom
*S Supporting Information
ABSTRACT: A new generation of metabolic phenotypingcenters are being created to meet the increasing demands ofpersonalized healthcare, and this has resulted in a major require-ment for economical, high-throughput metabonomic analysisby liquid chromatography−mass spectrometry (LC−MS).Meeting these new demands represents an emerging bio-analytical problem that must be solved if metabolic phenotypingis to be successfully applied to large clinical and epidemiologicalsample sets. Ultraperformance (UP)LC−MS-based metabolicphenotyping, based on 2.1 mm i.d. LC columns, enablescomprehensive metabolic phenotyping but, when employed forthe analysis of thousands of samples, results in high solventusage. The use of UPLC−MS employing 1 mm i.d. columns formetabolic phenotyping rather than the conventional 2.1 mm i.d.methodology shows that the resulting optimized microbore method provided equivalent or superior performance in terms ofpeak capacity, sensitivity, and robustness. On average, we also observed, when using the microbore scale separation, an increasein response of 2-3 fold over that obtained with the standard 2.1 mm scale method. When applied to the analysis of human urine,the 1 mm scale method showed no decline in performance over the course of 1000 analyses, illustrating that microbore UPLC−MSrepresents a viable alternative to conventional 2.1 mm i.d. formats for routine large-scale metabolic profiling studies while alsoresulting in a 75% reduction in solvent usage. The modest increase in sensitivity provided by this methodology also offers thepotential to either reduce sample consumption or increase the number of metabolite features detected with confidence due to theincreased signal-to-noise ratios obtained. Implementation of this miniaturized UPLC−MS method of metabolic phenotypingresults in clear analytical, economic, and environmental benefits for large-scale metabolic profiling studies with similar orimproved analytical performance compared to conventional UPLC−MS.
KEYWORDS: Metabolic phenotyping, UPLC−MS, microbore columns, miniaturization
1. INTRODUCTION
One of the consequences of concepts such as personalizedhealthcare and large-scale biobanking initiatives is an emergingrequirement for the deep metabolic phenotyping of tens orhundreds of thousands of samples. This, in turn, has led to thecreation of a new generation of metabolic phenotyping centerswhere metabolic profiling is being applied to the analysis ofsamples from these large patient cohorts and populations tocharacterize the phenotypes associated with specific disease states,physiological stimuli, or gene−environment interactions.1−3 Meet-ing these increased demands for metabolic phenotyping bringswith it unprecedented analytical requirements for analytical quality,the harmonization of technologies, high-throughput analysis,and cost minimization. A number of analytical techniques areroutinely applied for the purpose of this type of metabolicphenotyping either singly or in combination. These techniquesinclude NMR spectroscopy,2,3 mass spectrometry (MS), either
as a direct infusion (or injection) approach4 or hyphenated to avariety of separation techniques such as liquid chromatography(LC),5−7 gas chromatography (GC),8,9 or capillary electro-phoresis (CE).10,11 Ultraperformance (or ultrahigh performance)liquid chromatography−mass spectrometry (U(H)PLC-MS)has, as a result of the high peak capacities and rapid analysisthat result from performing separations on sub-2 μm particlesat pressures of up to 15 000 psi, become increasingly widelyapplied as a tool for metabolic profiling.12−14
As methods for metabolic phenotyping have matured fromrelatively small-scale proof-of-principle studies, involving tensto hundreds of samples, there has been a trend toward thecomprehensive analysis of much larger sample sets comprisingthousands of samples to gain an understanding of disease state
Received: March 5, 2015Published: April 28, 2015
Technical Note
pubs.acs.org/jpr
© 2015 American Chemical Society 2714 DOI: 10.1021/acs.jproteome.5b00203J. Proteome Res. 2015, 14, 2714−2721
in large cohort studies. A result of this has been the develop-ment of dedicated phenotyping centers, such as the UK MRC-NIHR National Phenome Centre (NPC), established in 2013.The NPC is resourced to process the large numbers of samplesgenerated by epidemiological studies, for biomarker discoverythat enables the risk of developing disease to be assessed, andclinical studies aimed at providing biomarkers for patientstratification and prognostic markers to guide therapy. TheNPC performs comprehensive metabolic profiling of humanbiofluids using a range of 1H NMR3 and UPLC−MS-basedparallel assays to provide comprehensive metabolic phenotyp-ing. However, the multiplatform analyses, requiring significantamounts of sample, and large sample numbers involvedinevitably demand large volumes of solvent for the chromato-graphic analysis. Solvent use, while not often considered in thenormal course of analysis, can, in high-throughput environ-ments processing tens to hundreds of thousands of samples,result in a significant economic and environmental burdenwhen purchase and waste disposal costs are taken into account.For example, running 10 UPLC−MS instruments with 2.1 mminternal diameter (i.d.) columns operated at a flow rate of0.6 mL/min requires over 3000 L of solvent a year, at anestimated cost of $370 000. Scaling down to 1 mm i.d. columnsat a flow rate of 0.14 mL/min would require 700 L of solventcosting approximately $86 000, thereby reducing solvent usageby 2300 L and saving $284 000 a year.15 One obviousopportunity for improved methods that maintain performancewhile reducing solvent consumption is miniaturization. Potentialreductions in sample requirements also represent an additionaladvantage of miniaturization in situations where sample volumesare limited or where microsampling has been used such as, e.g.,dried blood spots, which can represent an attractive alternativefor facile and minimally invasive sampling.16
The use of microbore columns (i.d. < 2.1 mm or ≥ 0.5 mm)has received a certain amount of interest in metabolite profiling,17,18
offering enhanced analytical sensitivity combined with reducedmobile phase consumption resulting from the lower flow ratesemployed (typically, 50−400 μL/min).15 Due to the loweranalyte elution volume, which increases analyte concentrationand subsequent increase in detector response, a theoretical4-fold increase in sensitivity is obtained by employing 1 mm i.d.rather than 2.1 mm i.d. columns. For large-scale epidemio-logical studies comprising thousands of samples, the use ofmethods based on standard narrowbore (2.1 mm i.d.) columnsrequires large volumes of solvent to perform the separations,which is both expensive and environmentally unfriendly. Whencolumn i.d. is reduced, the volumetric flow rate must be scaleddown by the square of the column diameter in order tomaintain the same mobile phase linear velocity and obtaincomparable separations, resulting in a typical reduction in flowrate of 75% when scaling from 2.1 mm i.d. conditions to 1 mmi.d. Such a reduction in solvent consumption has an obviousand significant environmental and economic impact, providinga more efficient approach to analyzing large sample numbers.Lower flow rates are also more compatible with ESI-MS, wheresmaller droplet formation aids desolvation and thus results inhigher sensitivity. These benefits are very attractive in the areaof metabolic phenotyping, enabling the detection of low-levelanalytes and/or permitting smaller sample volumes, and are lessexpensive analyses with reduced solvent consumption. How-ever, despite the theoretical advantages of microscale LC, thetechnique has not been widely adopted for routine high-throughput analysis. This has largely been attributable to the
difficultly in translating the theoretical advantages into practicalobservations due to a lack of appropriate LC instrumentationand poor packing performance of microbore columns. Extra-columneffects have a much higher contribution to band broadening onsmaller diameter columns, which can result in a significant lossin resolution and sensitivity on conventional systems.19 Formany years, the major challenge has been the inherent disper-sion volume of HPLC systems, typically focused on thevolumetric needs of 4.6 mm i.d. columns. However, with theadvent of sub-2 μm particle columns packed into 2.1 mm i.d.geometries, more modern UHPLC systems are equipped withlower delay and dwell volumes and are more applicable toseparations with low peak volumes. Such advances in instru-mentation, together with improved column packing capabilities,minimize band broadening and permit the increased perform-ance of 2.1 mm i.d. columns to be realized. While nano-LCinstruments and chip-based formats have been commercializedand offer even further increases in assay sensitivity andreductions in solvent consumption, this comes at the cost ofreplacing the entire inlet system. For laboratories operatingUHPLC instrumentation with 2.1 mm i.d. columns, transferto 1 mm i.d. may offer a facile and economical approach tosignificantly minimize sample and solvent consumption whileretaining comparable chromatographic performance.Here, the potential applicability of microbore LC for large-
scale metabonomic studies has been evaluated with emphasison chromatographic performance, sensitivity, robustness, anddata quality. A critical comparison of 2.1 and 1 mm i.d. columnformats for reversed-phase separations was made to determinewhether micro-LC represents a viable approach for the routinemetabolic phenotyping of large numbers of human urine samples.
2. EXPERIMENTAL SECTION
2.1. Chemicals and Reagents
Optima grade LC−MS water was purchased from Fluka(Leicester, UK). Acetonitrile (LC−MS grade), formic acid(LC−MS grade), ammonium acetate (LC−MS grade), leucineenkephalin acetate salt hydrate, acetaminophen, caffeine,sulfadimethoxine, sulfaguanidine, verapamil, hippurate, andsodium formate solution were purchased from Sigma-Aldrich(Gillingham, UK). The chromatographic performance wasevaluated with a series of probe analytes used for the LC/MSsystems suitability test mix. The test mix comprisedsulfaguanidine (50 ng/mL), acetaminophen (125 ng/mL),caffeine (50 ng/mL), hippurate (500 ng/mL), leucineenkephalin (100 ng/mL), sulfadimethoxine (50 ng/mL), andverapamil (50 ng/mL).2.2. Samples and Sample Preparation
A subset of 80 randomized control human urine samples(obtained from both sexes) were used to compare the analyticalplatforms for metabonomic studies. Samples were storedat −80 °C prior to analysis, where a 50 μL aliquot wastransferred into an Eppendorf tube for centrifugation for 10min at 13 000g. A 40 μL volume of the supernatant was thenadded to 40 μL of water in a HPLC vial, and 5 μL of eachsample was combined to generate a pooled quality control(QC) sample (representative of the entire data set).20,21 Tenconsecutive injections of the pooled samples were made at thestart of the chromatographic run to condition the column,previously shown to be necessary for the analytical system toequilibrate. The pooled sample was injected after every10 samples to monitor instrument stability.
Journal of Proteome Research Technical Note
DOI: 10.1021/acs.jproteome.5b00203J. Proteome Res. 2015, 14, 2714−2721
2715
2.3. Liquid Chromatography−Mass Spectrometry (LC−MS)
2.3.1. Liquid Chromatography for System SuitabilityTest Mix. Liquid chromatographic analysis was performed onan Acquity UPLC system, equipped with a binary solventmanager, Acquity UPLC sample manager, and column heater(Waters Corp., Milford, MA, USA) and interfaced with a XevoTQ-S tandem quadrupole mass spectrometer (Waters Corp.,Manchester, UK). Separation was performed on a HSS T32.1 × 100 mm, 1.8 μm column or a HSS T3 1 × 100 mm, 1.8μm column (Waters Corp., Milford, MA, USA). Thechromatographic mobile phases were composed of 0.1% formicacid in water (A) and 0.1% formic acid in acetonitrile (B). Thecolumn temperature was maintained at 40 °C, and lineargradient elution was performed at 0.6 or 0.14 mL/min on the2.1 or 1 mm i.d. columns, respectively. The starting composi-tion was 5% B, increasing to 75% over 3 min and returning to5% B for a 1.4 min re-equilibration step. A 2 μL injection loopwas installed, and full-loop injection was performed. The weakand the strong washes were 95:5 (v/v) H2O/CH3CN and100% isopropanol, respectively.The use of 1 mm i.d. columns meant that a number of system
modifications were necessary to reduce peak dispersion. Forthese microbore separations, the standard outlet tubing i.d.(0.004″) was reduced to 0.0025″ of minimum length, and theESI stainless steel capillary (125 μm i.d.) was replaced with anarrow bore variant (50 μm i.d.).2.3.2. Liquid Chromatography for Metabolic Profiling.
Liquid chromatographic analysis was performed on an AcquityUPLC I-class system, equipped with a binary solvent manager,sample manager, and column heater (Waters Corp., Milford,MA, USA) and interfaced with a Synapt G2-S HDMS massspectrometer (Waters Corp., Manchester, UK). The separa-tions were performed on a HSS T3 2.1 × 100 mm, 1.8 μmcolumn or a HSS T3 1 × 100 mm, 1.8 μm column. The chro-matographic mobile phases were composed of 0.1% formic acidin water (A) and 0.1% formic acid in acetonitrile (B). The columntemperature was maintained at 40 °C, and linear gradient elutionwas performed at 0.5 or 0.11 mL/min on the 2.1 or 1 mm i.d.columns, respectively. The starting composition was 1% B, whichwas held for 1 min before increasing to 15% at 3 min, 50% at 6 min,95% at 9 min for a 1 min wash, and returning to 1% B for a 2 minre-equilibration step. A 0.5 μL injection of sample was performedusing the flow-through needle. The purge solvent was 95:5 (v/v)H2O/CH3CN, and sample manager wash was CH3OH.For use with 1 mm i.d. columns, minor system modifications
were made as described above (Section 2.3.1).2.3.3. Mass Spectrometry for System Suitability Test
Mix. The probe analyte analysis was performed on a Xevo TQ-Standem quadrupole instrument operated with electrosprayionization (ESI) operated in both positive (ESI+) and negative(ESI−) ion MS/MS modes. Nitrogen was used as the desolvationgas, and argon was used as the collision gas. The following genericsource conditions were used: capillary voltage, 3.0 kV (ESI+) and2.0 kV (ESI−); source offset, 50 V; desolvation temperature,600 °C; source temperature, 150 °C, desolvation gas flow, 1000L/h; cone gas flow, 150 L/h; nebulizer gas, 7.0 bar; collision gas,0.15 L/h. Compound specific parameters, including cone voltage,ion transitions, and collision energy, are detailed in Table S1.2.3.4. Mass Spectrometry for Metabolic Profiling.
Mass spectrometry for metabolic profiling was performed on aSynapt G2-S HDMS accurate mass instrument with electro-spray ionization (ESI) operated in both positive (ESI+) andnegative (ESI−) ion modes. The same MS conditions were
applied to both column dimensions. The capillary voltage was1.5 or 2.0 kV for ESI+ and ESI−, respectively, the cone voltagewas 30 V, the source temperature was set at 120 °C with a conegas (nitrogen) flow rate of 50 L/h, a desolvation gas tempera-ture of 500 °C, and a nebulization gas (nitrogen) flow of900 L/h. The instrument was operated in resolution (V optics)mode and set to acquire data over the m/z range 50−1200 witha scan time of 0.1 s. All mass spectral data were collected incentroid mode using the MSe data acquisition22 function toobtain fragmentation data simultaneously. In function one, alow collision energy (4 eV) was used, and in the secondfunction, a high collision energy (ramp 15−45 eV) was used forfragmentation. For mass accuracy, leucine enkephalin (MW =555.62) was used as a lock mass at a concentration of 200 pg/μL(in 50:50 CH3CN/H2O, 0.1% formic acid) infused at a flow rateof 20 μL/min via a lock spray interface. Lockmass scans werecollected every 30 s and averaged over 3 scans to perform masscorrection. The instrument was calibrated before analysis with0.5 mM sodium formate solution. The data were collected usingMassLynx, v4.1, software (Waters Corp., Manchester, UK).2.4. Data Analysis
The raw data from the system suitability test mix were analyzedby the TargetLynx application manager in MassLynx software;this application manager integrates peaks in the LC−MS databy using ApexTrack peak detection.The raw data from the metabolic profiling experiments were
processed by Progenesis QI data analysis software (NonlinearDynamics, Newcastle, UK) for peak picking, alignment, andnormalization to produce peak intensities for retention time(tR) and m/z data pairs. Further statistical analysis wasperformed on the resulting normalized peak intensities usingSIMCA P 13.0.2 (Umetrics, Umea, Sweden).
3. RESULTS AND DISCUSSIONIn order to evaluate the potential of microscale LC for metabolicphenotyping, columns of the same length and particle size wereused to compare the analytical sensitivity, reproducibility, androbustness to the conventional 2.1 mm i.d. reversed-phasemethodology currently used.13 In addition, to achieve the samelinear velocities for both column formats, the volumetric flow ratewas scaled from the 600 μL/min used for the 2.1 mm i.d. columnto 140 μL/min for the test 1 mm i.d. column. The advantages ofreduced flow rates for increasing sensitivity when using ESI-MS15
are well-known, and, indeed, a significant increase for both posi-tive and negative modes was seen using direct infusion experi-ments that mimicked the scaled conditions to be used forU(H)PLC−MS, with average increase of 3.2-fold (ESI+) and4-fold (ESI−), as shown in Supporting Information Figure S1.3.1. System Optimization for Microscale Separations
Initially, the chromatographic performance of the 2.1 and 1 mmi.d columns were compared on an unmodified UPLC system,which, when operated under identical conditions for bothcolumn geometries apart from flow rate, did provide a smallincrease in sensitivity for the microbore system. However, theoverall chromatographic performance for the 1 mm i.d. columnwas poor compared with that of the conventional 2.1 mm i.dformat, with significant band broadening evident such that thefinal two eluting peaks were barely resolved (see SupportingInformation Figure S2A,B). In order to eliminate these extra-column band-broadening effects, the system was modified tominimize dispersion by reducing pre- and postcolumn deadvolumes and ensuring good connections. Several components
Journal of Proteome Research Technical Note
DOI: 10.1021/acs.jproteome.5b00203J. Proteome Res. 2015, 14, 2714−2721
2716
of the conventional UPLC system, including tubing length andi.d., were modified to investigate, and minimize, their con-tribution to band spreading. The effects of these modificationson peak shape and intensity are shown in Supporting InformationFigure S3 and quantified in Supporting Information Table S2,whereas the effects on peak capacity are illustrated in SupportingInformation Figure S4. Peak capacity was greatly improved byreducing both the length and the i.d. of the outlet tubing (from0.004″ to 0.0025″ i.d. PEEK tubing). Reducing the i.d. of thestainless steel ESI capillary from 125 to 50 μm also resulted in asignificant improvement in the overall system chromatographicperformance. However, due to the already low dispersion fromthe inlet system, further attempts to minimize precolumnvolumes had little effect on peak capacity (see SupportingInformation Figure S5). The final optimized set up employedfor the 1 mm i.d. column used in this study was as described inthe Experimental Section.Once optimized for microbore LC, chromatographic
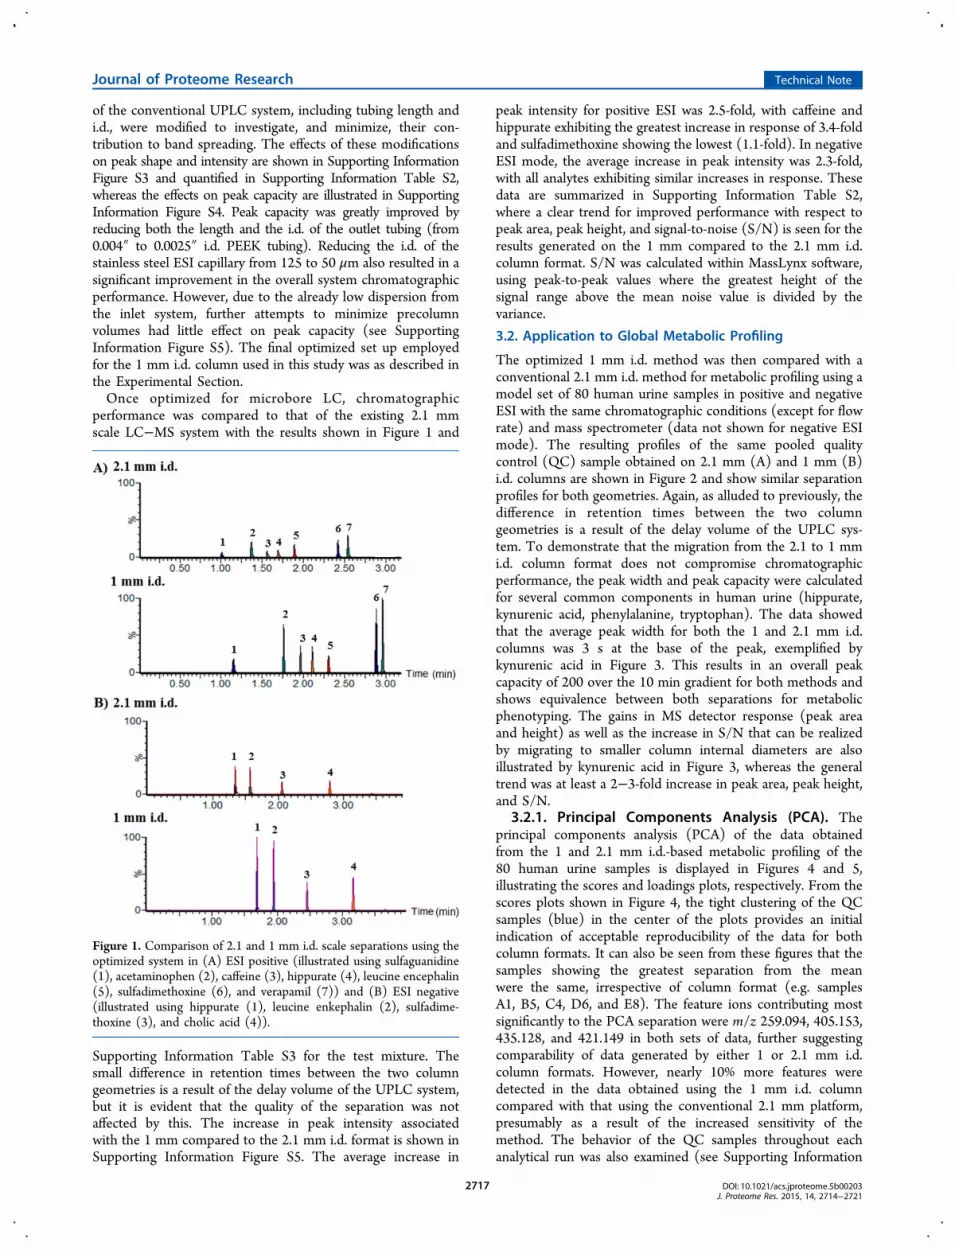
performance was compared to that of the existing 2.1 mmscale LC−MS system with the results shown in Figure 1 and
Supporting Information Table S3 for the test mixture. Thesmall difference in retention times between the two columngeometries is a result of the delay volume of the UPLC system,but it is evident that the quality of the separation was notaffected by this. The increase in peak intensity associatedwith the 1 mm compared to the 2.1 mm i.d. format is shown inSupporting Information Figure S5. The average increase in
peak intensity for positive ESI was 2.5-fold, with caffeine andhippurate exhibiting the greatest increase in response of 3.4-foldand sulfadimethoxine showing the lowest (1.1-fold). In negativeESI mode, the average increase in peak intensity was 2.3-fold,with all analytes exhibiting similar increases in response. Thesedata are summarized in Supporting Information Table S2,where a clear trend for improved performance with respect topeak area, peak height, and signal-to-noise (S/N) is seen for theresults generated on the 1 mm compared to the 2.1 mm i.d.column format. S/N was calculated within MassLynx software,using peak-to-peak values where the greatest height of thesignal range above the mean noise value is divided by thevariance.
3.2. Application to Global Metabolic Profiling
The optimized 1 mm i.d. method was then compared with aconventional 2.1 mm i.d. method for metabolic profiling using amodel set of 80 human urine samples in positive and negativeESI with the same chromatographic conditions (except for flowrate) and mass spectrometer (data not shown for negative ESImode). The resulting profiles of the same pooled qualitycontrol (QC) sample obtained on 2.1 mm (A) and 1 mm (B)i.d. columns are shown in Figure 2 and show similar separationprofiles for both geometries. Again, as alluded to previously, thedifference in retention times between the two columngeometries is a result of the delay volume of the UPLC sys-tem. To demonstrate that the migration from the 2.1 to 1 mmi.d. column format does not compromise chromatographicperformance, the peak width and peak capacity were calculatedfor several common components in human urine (hippurate,kynurenic acid, phenylalanine, tryptophan). The data showedthat the average peak width for both the 1 and 2.1 mm i.d.columns was 3 s at the base of the peak, exemplified bykynurenic acid in Figure 3. This results in an overall peakcapacity of 200 over the 10 min gradient for both methods andshows equivalence between both separations for metabolicphenotyping. The gains in MS detector response (peak areaand height) as well as the increase in S/N that can be realizedby migrating to smaller column internal diameters are alsoillustrated by kynurenic acid in Figure 3, whereas the generaltrend was at least a 2−3-fold increase in peak area, peak height,and S/N.
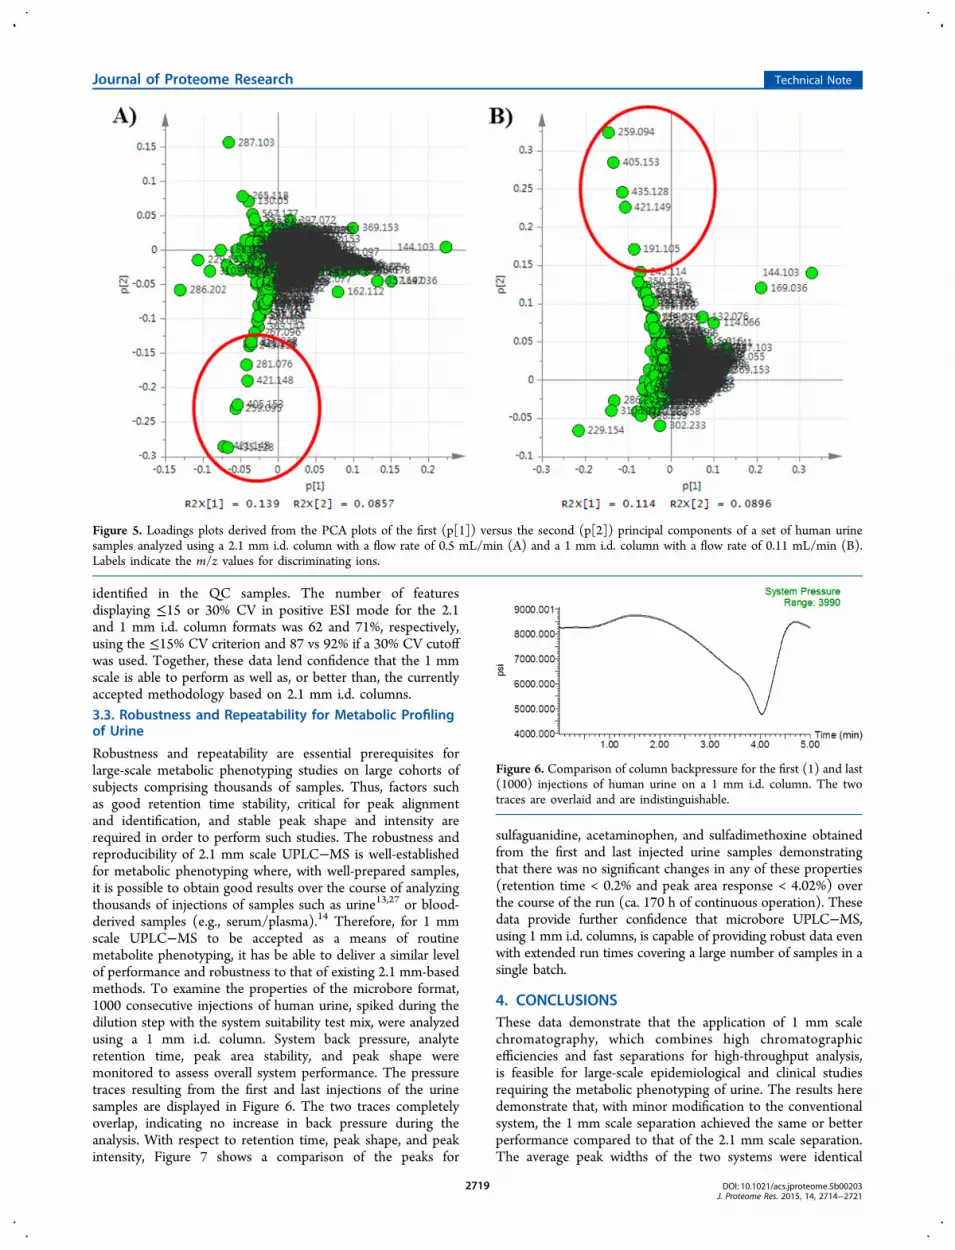
3.2.1. Principal Components Analysis (PCA). Theprincipal components analysis (PCA) of the data obtainedfrom the 1 and 2.1 mm i.d.-based metabolic profiling of the80 human urine samples is displayed in Figures 4 and 5,illustrating the scores and loadings plots, respectively. From thescores plots shown in Figure 4, the tight clustering of the QCsamples (blue) in the center of the plots provides an initialindication of acceptable reproducibility of the data for bothcolumn formats. It can also be seen from these figures that thesamples showing the greatest separation from the meanwere the same, irrespective of column format (e.g. samplesA1, B5, C4, D6, and E8). The feature ions contributing mostsignificantly to the PCA separation were m/z 259.094, 405.153,435.128, and 421.149 in both sets of data, further suggestingcomparability of data generated by either 1 or 2.1 mm i.d.column formats. However, nearly 10% more features weredetected in the data obtained using the 1 mm i.d. columncompared with that using the conventional 2.1 mm platform,presumably as a result of the increased sensitivity of themethod. The behavior of the QC samples throughout eachanalytical run was also examined (see Supporting Information
Figure 1. Comparison of 2.1 and 1 mm i.d. scale separations using theoptimized system in (A) ESI positive (illustrated using sulfaguanidine(1), acetaminophen (2), caffeine (3), hippurate (4), leucine encephalin(5), sulfadimethoxine (6), and verapamil (7)) and (B) ESI negative(illustrated using hippurate (1), leucine enkephalin (2), sulfadime-thoxine (3), and cholic acid (4)).
Journal of Proteome Research Technical Note
DOI: 10.1021/acs.jproteome.5b00203J. Proteome Res. 2015, 14, 2714−2721
2717
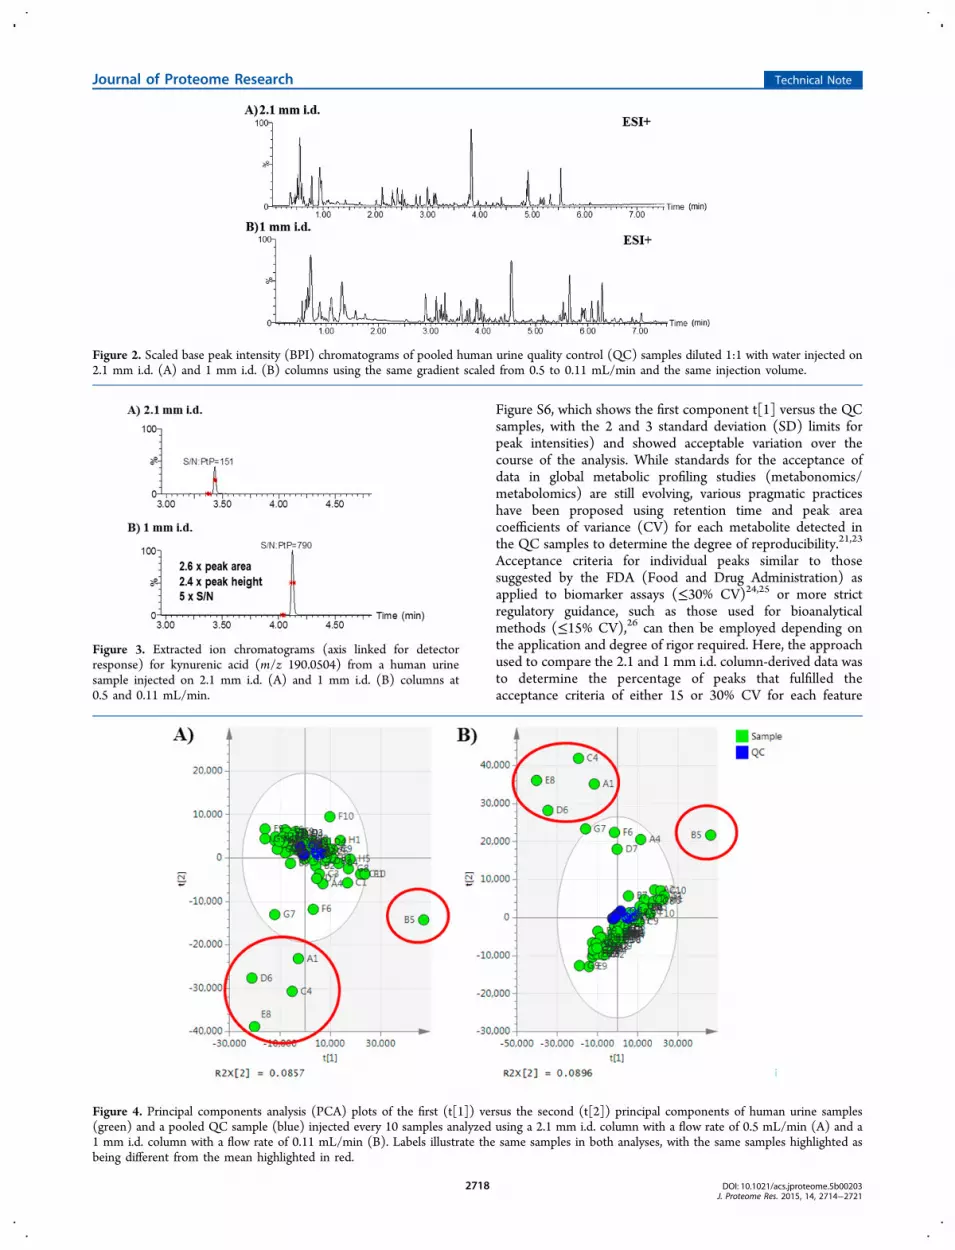
Figure S6, which shows the first component t[1] versus the QCsamples, with the 2 and 3 standard deviation (SD) limits forpeak intensities) and showed acceptable variation over thecourse of the analysis. While standards for the acceptance ofdata in global metabolic profiling studies (metabonomics/metabolomics) are still evolving, various pragmatic practiceshave been proposed using retention time and peak areacoefficients of variance (CV) for each metabolite detected inthe QC samples to determine the degree of reproducibility.21,23
Acceptance criteria for individual peaks similar to thosesuggested by the FDA (Food and Drug Administration) asapplied to biomarker assays (≤30% CV)24,25 or more strictregulatory guidance, such as those used for bioanalyticalmethods (≤15% CV),26 can then be employed depending onthe application and degree of rigor required. Here, the approachused to compare the 2.1 and 1 mm i.d. column-derived data wasto determine the percentage of peaks that fulfilled theacceptance criteria of either 15 or 30% CV for each feature
Figure 2. Scaled base peak intensity (BPI) chromatograms of pooled human urine quality control (QC) samples diluted 1:1 with water injected on2.1 mm i.d. (A) and 1 mm i.d. (B) columns using the same gradient scaled from 0.5 to 0.11 mL/min and the same injection volume.
Figure 3. Extracted ion chromatograms (axis linked for detectorresponse) for kynurenic acid (m/z 190.0504) from a human urinesample injected on 2.1 mm i.d. (A) and 1 mm i.d. (B) columns at0.5 and 0.11 mL/min.
Figure 4. Principal components analysis (PCA) plots of the first (t[1]) versus the second (t[2]) principal components of human urine samples(green) and a pooled QC sample (blue) injected every 10 samples analyzed using a 2.1 mm i.d. column with a flow rate of 0.5 mL/min (A) and a1 mm i.d. column with a flow rate of 0.11 mL/min (B). Labels illustrate the same samples in both analyses, with the same samples highlighted asbeing different from the mean highlighted in red.
Journal of Proteome Research Technical Note
DOI: 10.1021/acs.jproteome.5b00203J. Proteome Res. 2015, 14, 2714−2721
2718
identified in the QC samples. The number of featuresdisplaying ≤15 or 30% CV in positive ESI mode for the 2.1and 1 mm i.d. column formats was 62 and 71%, respectively,using the ≤15% CV criterion and 87 vs 92% if a 30% CV cutoffwas used. Together, these data lend confidence that the 1 mmscale is able to perform as well as, or better than, the currentlyaccepted methodology based on 2.1 mm i.d. columns.3.3. Robustness and Repeatability for Metabolic Profilingof Urine
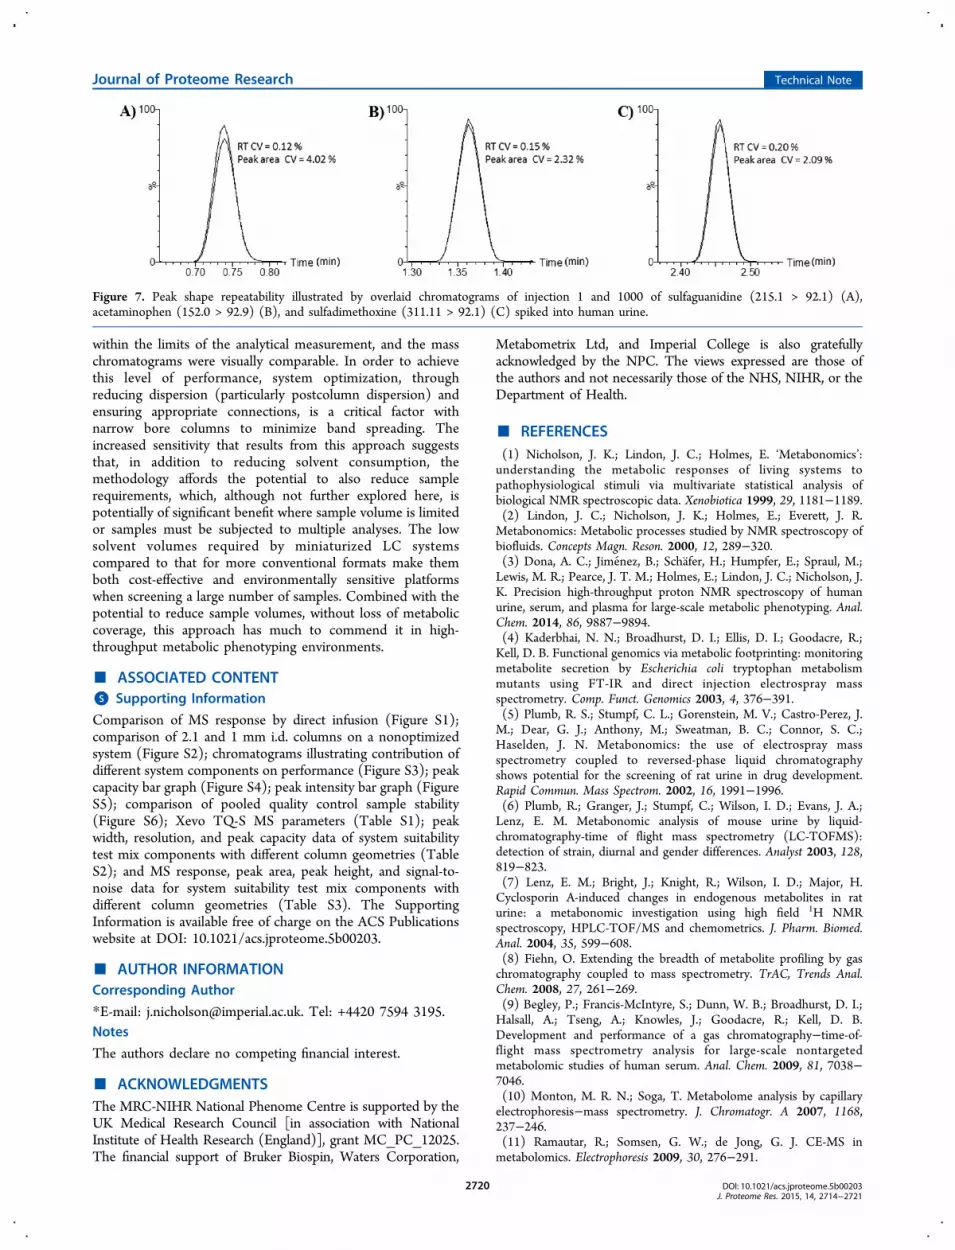
Robustness and repeatability are essential prerequisites forlarge-scale metabolic phenotyping studies on large cohorts ofsubjects comprising thousands of samples. Thus, factors suchas good retention time stability, critical for peak alignmentand identification, and stable peak shape and intensity arerequired in order to perform such studies. The robustness andreproducibility of 2.1 mm scale UPLC−MS is well-establishedfor metabolic phenotyping where, with well-prepared samples,it is possible to obtain good results over the course of analyzingthousands of injections of samples such as urine13,27 or blood-derived samples (e.g., serum/plasma).14 Therefore, for 1 mmscale UPLC−MS to be accepted as a means of routinemetabolite phenotyping, it has be able to deliver a similar levelof performance and robustness to that of existing 2.1 mm-basedmethods. To examine the properties of the microbore format,1000 consecutive injections of human urine, spiked during thedilution step with the system suitability test mix, were analyzedusing a 1 mm i.d. column. System back pressure, analyteretention time, peak area stability, and peak shape weremonitored to assess overall system performance. The pressuretraces resulting from the first and last injections of the urinesamples are displayed in Figure 6. The two traces completelyoverlap, indicating no increase in back pressure during theanalysis. With respect to retention time, peak shape, and peakintensity, Figure 7 shows a comparison of the peaks for
sulfaguanidine, acetaminophen, and sulfadimethoxine obtainedfrom the first and last injected urine samples demonstratingthat there was no significant changes in any of these properties(retention time < 0.2% and peak area response < 4.02%) overthe course of the run (ca. 170 h of continuous operation). Thesedata provide further confidence that microbore UPLC−MS,using 1 mm i.d. columns, is capable of providing robust data evenwith extended run times covering a large number of samples in asingle batch.
4. CONCLUSIONSThese data demonstrate that the application of 1 mm scalechromatography, which combines high chromatographicefficiencies and fast separations for high-throughput analysis,is feasible for large-scale epidemiological and clinical studiesrequiring the metabolic phenotyping of urine. The results heredemonstrate that, with minor modification to the conventionalsystem, the 1 mm scale separation achieved the same or betterperformance compared to that of the 2.1 mm scale separation.The average peak widths of the two systems were identical
Figure 5. Loadings plots derived from the PCA plots of the first (p[1]) versus the second (p[2]) principal components of a set of human urinesamples analyzed using a 2.1 mm i.d. column with a flow rate of 0.5 mL/min (A) and a 1 mm i.d. column with a flow rate of 0.11 mL/min (B).Labels indicate the m/z values for discriminating ions.
Figure 6. Comparison of column backpressure for the first (1) and last(1000) injections of human urine on a 1 mm i.d. column. The twotraces are overlaid and are indistinguishable.
Journal of Proteome Research Technical Note
DOI: 10.1021/acs.jproteome.5b00203J. Proteome Res. 2015, 14, 2714−2721
2719
within the limits of the analytical measurement, and the masschromatograms were visually comparable. In order to achievethis level of performance, system optimization, throughreducing dispersion (particularly postcolumn dispersion) andensuring appropriate connections, is a critical factor withnarrow bore columns to minimize band spreading. Theincreased sensitivity that results from this approach suggeststhat, in addition to reducing solvent consumption, themethodology affords the potential to also reduce samplerequirements, which, although not further explored here, ispotentially of significant benefit where sample volume is limitedor samples must be subjected to multiple analyses. The lowsolvent volumes required by miniaturized LC systemscompared to that for more conventional formats make themboth cost-effective and environmentally sensitive platformswhen screening a large number of samples. Combined with thepotential to reduce sample volumes, without loss of metaboliccoverage, this approach has much to commend it in high-throughput metabolic phenotyping environments.
■ ASSOCIATED CONTENT*S Supporting Information
Comparison of MS response by direct infusion (Figure S1);comparison of 2.1 and 1 mm i.d. columns on a nonoptimizedsystem (Figure S2); chromatograms illustrating contribution ofdifferent system components on performance (Figure S3); peakcapacity bar graph (Figure S4); peak intensity bar graph (FigureS5); comparison of pooled quality control sample stability(Figure S6); Xevo TQ-S MS parameters (Table S1); peakwidth, resolution, and peak capacity data of system suitabilitytest mix components with different column geometries (TableS2); and MS response, peak area, peak height, and signal-to-noise data for system suitability test mix components withdifferent column geometries (Table S3). The SupportingInformation is available free of charge on the ACS Publicationswebsite at DOI: 10.1021/acs.jproteome.5b00203.
■ AUTHOR INFORMATIONCorresponding Author
*E-mail: [email protected]. Tel: +4420 7594 3195.Notes
The authors declare no competing financial interest.
■ ACKNOWLEDGMENTSThe MRC-NIHR National Phenome Centre is supported by theUK Medical Research Council [in association with NationalInstitute of Health Research (England)], grant MC_PC_12025.The financial support of Bruker Biospin, Waters Corporation,
Metabometrix Ltd, and Imperial College is also gratefullyacknowledged by the NPC. The views expressed are those ofthe authors and not necessarily those of the NHS, NIHR, or theDepartment of Health.
■ REFERENCES(1) Nicholson, J. K.; Lindon, J. C.; Holmes, E. ‘Metabonomics’:understanding the metabolic responses of living systems topathophysiological stimuli via multivariate statistical analysis ofbiological NMR spectroscopic data. Xenobiotica 1999, 29, 1181−1189.(2) Lindon, J. C.; Nicholson, J. K.; Holmes, E.; Everett, J. R.Metabonomics: Metabolic processes studied by NMR spectroscopy ofbiofluids. Concepts Magn. Reson. 2000, 12, 289−320.(3) Dona, A. C.; Jimenez, B.; Schafer, H.; Humpfer, E.; Spraul, M.;Lewis, M. R.; Pearce, J. T. M.; Holmes, E.; Lindon, J. C.; Nicholson, J.K. Precision high-throughput proton NMR spectroscopy of humanurine, serum, and plasma for large-scale metabolic phenotyping. Anal.Chem. 2014, 86, 9887−9894.(4) Kaderbhai, N. N.; Broadhurst, D. I.; Ellis, D. I.; Goodacre, R.;Kell, D. B. Functional genomics via metabolic footprinting: monitoringmetabolite secretion by Escherichia coli tryptophan metabolismmutants using FT-IR and direct injection electrospray massspectrometry. Comp. Funct. Genomics 2003, 4, 376−391.(5) Plumb, R. S.; Stumpf, C. L.; Gorenstein, M. V.; Castro-Perez, J.M.; Dear, G. J.; Anthony, M.; Sweatman, B. C.; Connor, S. C.;Haselden, J. N. Metabonomics: the use of electrospray massspectrometry coupled to reversed-phase liquid chromatographyshows potential for the screening of rat urine in drug development.Rapid Commun. Mass Spectrom. 2002, 16, 1991−1996.(6) Plumb, R.; Granger, J.; Stumpf, C.; Wilson, I. D.; Evans, J. A.;Lenz, E. M. Metabonomic analysis of mouse urine by liquid-chromatography-time of flight mass spectrometry (LC-TOFMS):detection of strain, diurnal and gender differences. Analyst 2003, 128,819−823.(7) Lenz, E. M.; Bright, J.; Knight, R.; Wilson, I. D.; Major, H.Cyclosporin A-induced changes in endogenous metabolites in raturine: a metabonomic investigation using high field 1H NMRspectroscopy, HPLC-TOF/MS and chemometrics. J. Pharm. Biomed.Anal. 2004, 35, 599−608.(8) Fiehn, O. Extending the breadth of metabolite profiling by gaschromatography coupled to mass spectrometry. TrAC, Trends Anal.Chem. 2008, 27, 261−269.(9) Begley, P.; Francis-McIntyre, S.; Dunn, W. B.; Broadhurst, D. I.;Halsall, A.; Tseng, A.; Knowles, J.; Goodacre, R.; Kell, D. B.Development and performance of a gas chromatography−time-of-flight mass spectrometry analysis for large-scale nontargetedmetabolomic studies of human serum. Anal. Chem. 2009, 81, 7038−7046.(10) Monton, M. R. N.; Soga, T. Metabolome analysis by capillaryelectrophoresis−mass spectrometry. J. Chromatogr. A 2007, 1168,237−246.(11) Ramautar, R.; Somsen, G. W.; de Jong, G. J. CE-MS inmetabolomics. Electrophoresis 2009, 30, 276−291.
Figure 7. Peak shape repeatability illustrated by overlaid chromatograms of injection 1 and 1000 of sulfaguanidine (215.1 > 92.1) (A),acetaminophen (152.0 > 92.9) (B), and sulfadimethoxine (311.11 > 92.1) (C) spiked into human urine.
Journal of Proteome Research Technical Note
DOI: 10.1021/acs.jproteome.5b00203J. Proteome Res. 2015, 14, 2714−2721
2720
(12) Plumb, R.; Castro-Perez, J.; Granger, J.; Beattie, I.; Joncour, K.;Wright, A. Ultra-performance liquid chromatography coupled toquadrupole-orthogonal time-of-flight mass spectrometry. RapidCommun. Mass Spectrom. 2004, 18, 2331−2337.(13) Want, E. J.; Wilson, I. D.; Gika, H.; Theodoridis, G.; Plumb, R.S.; Shockcor, J.; Holmes, E.; Nicholson, J. K. Global metabolicprofiling procedures for urine using UPLC-MS. Nat. Protoc. 2010, 5,1005−1018.(14) Dunn, W. B.; Broadhurst, D.; Begley, P.; Zelena, E.; Francis-McIntyre, S.; Anderson, N.; Brown, M.; Knowles, J. D.; Halsall, A.;Haselden, J. N.; Nicholls, A. W.; Wilson, I. D.; Kell, D. B.; Goodacre,R. Procedures for large-scale metabolic profiling of serum and plasmausing gas chromatography and liquid chromatography coupled to massspectrometry. Nat. Protoc. 2011, 6, 1060−1083.(15) Rainville, P. D.; Simeone, J. L.; McCarthy, S. M.; Smith, N. W.;Cowan, D.; Plumb, R. S. Investigation of microbore UPLC andnontraditional mobile phase compositions for bioanalytical LC−MS/MS. Bioanalysis 2012, 4, 1287−1297.(16) Michopoulos, F.; Theodoridis, G.; Smith, C. J.; Wilson, I. D.Metabolite profiles from dried biofluid spots for metabonomic studiesusing UPLC combined with oaToF-MS. J. Proteome Res. 2010, 9,3328−3334.(17) Lenz, E. M.; Williams, R. E.; Sidaway, J.; Smith, B. W.; Plumb, R.S.; Johnson, K. A.; Rainville, P.; Shockcor, J.; Stumpf, C. L.; Granger, J.H.; Wilson, I. D. The application of microbore UPLC/oa-TOF-MSand 1H NMR spectroscopy to the metabonomic analysis of rat urinefollowing the intravenous administration of pravastatin. J. Pharm.Biomed. Anal. 2007, 44, 845−852.(18) Ogiso, H.; Suzuki, T.; Taguchi, R. Development of a reverse-phase liquid chromatography electrospray ionization mass spectrom-etry method for lipidomics, improving detection of phosphatidic acidand phosphatidylserine. Anal. Biochem. 2008, 375, 124−131.(19) Fountain, K. J.; Neue, U. D.; Grumbach, E. S.; Diehl, D. M.Effects of extra-column band spreading, liquid chromatography systemoperating pressure, and column temperature on the performance ofsub-2-μm porous particles. J. Chromatogr. A 2009, 1216, 5979−5988.(20) Gika, H. G.; Theodoridis, G. A.; Wingate, J. E.; Wilson, I. D.Within-day reproducibility of an HPLC−MS-based method formetabonomic analysis: application to human urine. J. Proteome Res.2007, 6, 3291−3303.(21) Gika, H. G.; Macpherson, E.; Theodoridis, G. A.; Wilson, I. D.Evaluation of the repeatability of ultra-performance liquid chromatog-raphy−TOF-MS for global metabolic profiling of human urinesamples. J. Chromatogr. B: Anal. Technol. Biomed. Life Sci. 2008, 871,299−305.(22) Wrona, M.; Mauriala, T.; Bateman, K. P.; Mortishire-Smith, R.J.; O’Connor, D. ‘All-in-One’ analysis for metabolite identificationusing liquid chromatography/hybrid quadrupole time-of-flight massspectrometry with collision energy switching. Rapid Commun. MassSpectrom. 2005, 19, 2597−2602.(23) Michopoulos, F.; Lai, L.; Gika, H.; Theodoridis, G.; Wilson, I.UPLC-MS-based analysis of human plasma for metabonomics usingsolvent precipitation or solid phase extraction. J. Proteome Res. 2009, 8,2114−2121.(24) Lee, J. W.; Weiner, R. S.; Sailstad, J. M.; Bowsher, R. R.; Knuth,D. W.; O’Brien, P. J.; Fourcroy, J. L.; Dixit, R.; Pandite, L.; Pietrusko,R. G.; Soares, H. D.; Quarmby, V.; Vesterqvist, O. L.; Potter, D. M.;Witliff, J. L.; Fritche, H. A.; O’Leary, T.; Perlee, L.; Kadam, S.; Wagner,J. A. Method validation and measurement of biomarkers in nonclinicaland clinical samples in drug development: a conference report. Pharm.Res. 2005, 22, 499−511.(25) Lee, J.; Devanarayan, V.; Barrett, Y.; Weiner, R.; Allinson, J.;Fountain, S.; Keller, S.; Weinryb, I.; Green, M.; Duan, L.; Rogers, J.;Millham, R.; O’Brien, P.; Sailstad, J.; Khan, M.; Ray, C.; Wagner, J. Fit-for-purpose method development and validation for successfulbiomarker measurement. Pharm. Res. 2006, 23, 312−328.(26) Bioanalytical Method Validation; U.S. Department of Health andHuman Services, Food and Drug Administration: Silver Spring, MD;
h t t p : / / w w w . f d a . g o v / d o w n l o a d s / d r u g s /guidancecomplianceregulatoryinformation/guidances/ucm368107.pdf.(27) Gika, H. G.; Theodoridis, G. A.; Earll, M.; Wilson, I. D. A QCapproach to the determination of day-to-day reproducibility androbustness of LC−MS methods for global metabolite profiling inmetabonomics/metabolomics. Bioanalysis 2012, 4, 2239−2247.
Journal of Proteome Research Technical Note
DOI: 10.1021/acs.jproteome.5b00203J. Proteome Res. 2015, 14, 2714−2721
2721


