Embed Size (px)
Citation preview
IEEE TRANSACTIONS ON COMPUTERSJOURNAL NAME, MAY 2013 MANUSCRIPT ID 1
Performance and Reliability Evaluation of BSM Broadcasting in DSRC with Multi-
channel Schemes Xiaoyan Yin+, Xiaomin Ma*, Kishor S. Trivedi+, Alexey Vinel#
+Department of Electrical and Computer Engineering, Duke University, Durham, USA *Department of Engineering and Physics, Oral Roberts University, Tulsa, USA
#Department of Communication Engineering, Tampere University of Technology, Finland Emails: [email protected], [email protected], [email protected], [email protected]
Abstract—IEEE 1609.4 protocol defines a channel switching mechanism to enable a single radio operating efficiently on
multiple channels to support both safety and non-safety services. Basic safety message (BSM) is transmitted only through the
control channel at regular intervals. In this paper, we propose an analytic model based on interacting semi-Markov process
(SMP) to evaluate both Medium Access Control (MAC) and application level performance and reliability of safety message
broadcasting incorporating the impact of multi-channel operations. Message service time distribution is derived using Laplace-
Stieltjes transform based on the proposed model. Due to the cyclic interactions between the SMP models for vehicles
contending the same channel, fixed-point iteration is used to obtain converged solutions. Subsequently, MAC and application-
level performance and reliability metrics are derived based on the converged solutions. Channel fading with path loss is taken
into consideration in this derivation. The analytic models are validated through extensive simulations in NS2 to verify the
effectiveness and accuracy of our proposed fixed-point iteration based model decomposition. The effects of channel switching
mechanism and channel fading are also evaluated by comparing with other analytic models.
Index Terms— analytic model; Basic Safety Message (BSM); multi-channel operation; performance and reliability; IEEE
1609.4.
—————————— � ——————————
1 INTRODUCTION
edicated Short Range Communication (DSRC) band in US consists of seven channels: one control chan-nel (CCH) and six service channels (SCHs). IEEE
1609.4 protocol [12] extends MAC layer operation of IEEE 802.11p and defines a channel switching mechanism to enable a single DSRC radio to operate efficiently on mul-tiple DSRC channels. The default access mode in IEEE 1609.4 is alternating access scheme in which the channel time is divided into synchronization periods with a fixed length of 100 ms, consisting of CCH and SCH intervals as shown in Fig. 1 [6]. All vehicles are assumed to have ac-cess to Universal Time Coordinated (UTC) (e.g., achieved via GPS). During CCH intervals, all vehicles tune on the CCH frequency for safety-related or system management data exchange. During SCH intervals, vehicles switch to one of the SCH frequencies for safety or non-safety relat-ed services according to their needs. 4 ms guard time is set at the beginning of each interval to account for switch-
ing delay and time inaccuracy. Basic Safety Message (BSM, also known as “beacon”) [6][7] is one type of mes-sage broadcast in CCH intervals to announce the status information of a vehicle (i.e., position, speed, direction) to its neighbors. Many safety applications rely on the timely and reliable transmissions of such information to provide satisfactory safety services.
The safety message broadcasting on CCH has been ex-tensively evaluated by either simulation or analytic mod-els, but most of them have not considered the channel switching for multi-channel operations and its impact on the system performance and reliability. The performance and reliability of multi-channel operations for safety mes-sages have been evaluated by simulations in [10][13][15]. Chen [10] evaluated three access modes of the communi-cation for a single radio and the one with optimized scheduling has shown to effectively avoid synchroniza-tion collisions associated with naïve use of channel switching access. Hong [13] proposed three alternative approaches for V2V safety communications in a multi-channel environment for single-radio and multi-radio vehicle accommodation. Du [15] assessed performance of periodic beacon message transmission in CCH intervals with respect to the number of vehicles in the system. However, they are all based on simulations in either NS2 or NCTUns and only a few MAC-level metrics (i.e., mes-sage reception probability, transmission delay) are evalu-ated. Several analytic models [2][3][14] have been
xxxx-xxxx/0x/$xx.00 © 200x IEEE
————————————————
• Xiaoyan Yin is with the Electrical and Computer Engineering Department, Duke University, Durham, NC 27708. E-mail: [email protected].
• Xiaomin Ma is with the College of Science and Engineering, Oral Roberts University, Tulsa, OK 74171. E-mail: [email protected].
• Kishor S. Trivedi is with the Electrical and Computer Engineering De-partment, Duke University, Durham, NC 27708. E-mail: [email protected].
• Alexey Vinel is with the Department of Communication Engineering, Tampere University of Technology, Finland. E-mail: [email protected].
Manuscript received (insert date of submission if desired). Please note that all acknowledgments should be placed at the end of the paper, before the bibliography.
D

2 IEEE TRANSACTIONS ON JOURNAL NAME, MANUSCRIPT ID
Fig. 1. Channel switching operation
proposed to characterize the MAC-level performance and reliability of safety messages broadcasting on CCH inter-vals. Campolo [2][3] proposed a recursive method to as-sess the basic access mode for channel switching opera-tion in which synchronization collisions remain a severe problem. In addition, hidden terminal problem, which is one of the major factors for degradation of packet deliv-ery reliability, is omitted in this work. Ghandour [14] con-structed analytic models for upper-bound on the packet delivery delay of safety broadcast messages in multi-channel environment and validated through simulations in NS2. These papers on analytic models only derived a few MAC-level performances and reliability metrics (i.e., transmission delay, packet reception probability) and channel fading with path loss effect has not been consid-ered in these analytic models as needed in practical com-munication environment.
In this paper, we further contribute to the analytical modeling of IEEE 1609.4 multi-channel switching and develop a detailed analytic model based on interacting SMPs [1] to characterize both MAC and application-level performance and reliability of BSM broadcasting in CCH interval for multi-channel operations in a single-radio device incorporating channel switching mechanism. Con-structing a monolithic model will be otherwise too com-plex when the number of vehicles to be analyzed is large. BSM service time distribution is derived using Laplace-Stieltjes transform based on the proposed SMP model. Subsequently, fixed-point iteration is used to resolve in-teracting SMPs as to obtain converged solutions. MAC and application-level performance and reliability metrics are then derived. Channel fading with path loss is taken into consideration in this derivation. Analytic models are validated through extensive simulations developed in NS2 to assess the effectiveness and accuracy of the pro-posed approximation of the interacing SMP model. The effects of concurrent collisions, hidden terminals problem and channel fading on the message delivery probability are evaluated to provide insights for improving system’s performance.
The major contributions of this paper are five-fold: 1) BSM broadcasting behavior in CCH interval incorporat-ing channel switching mechanism is accurately captured by a detailed analytic model; 2) Important MAC and ap-plication-level performance and reliability metrics are derived to evaluate the effectiveness of message broad-casting; 3) IEEE 1609.4 channel switching and optimized BSM scheduling [10][11] is implemented in NS2 to assess the accuracy of the proposed models; 4) Concurrent
transmissions due to IEEE 802.11p random access scheme, hidden terminal problem and channel fading effect are all taken into account in the performance and reliability as-sessment; 5) The impact of concurrent collisions, hidden terminals problem and channel fading are evaluated to provide deeper understandings on how various factors influence safety message delivery.
This paper is organized as follows. Section 2 briefly de-scribes the system assumptions made in this paper to produce a tractable analytic model. Section 3 shows the interacting SMP models and the fixed-point iteration. Sec-tion 4 presents the derivation for both MAC and applica-tion level performance and reliability metrics. Numerical results are presented in Section 5. Conclusions and future work are presented in the last section.
2 SYSTEM ASSUMPTIONS
In this paper, several assumptions are made to produce a simplified yet high fidelity analytic model. We consider one-dimensional (1-D) traffic on the highway and the number of vehicles in a line is assumed to follow a Pois-son distribution with parameter β (vehicle density). All vehicles have the same transmission range, receiving range and carrier sensing range R. To avoid synchronized collisions at the beginnings of synchronization periods, we utilize the optimized scheduling presented in [10][11]. If the message generation function in the higher layers is provided with a signal indicating the start point of a Sync period, a vehicle can choose to enqueue its generated message at the MAC layer during a random time within the CCH interval only [6]. Therefore, by using the opti-mized scheduling method, the BSM message generation frequency f is adjusted to f*(T/TC) (T represents Sync pe-riod time duration and TC represents CCH interval time duration), and then the message generated during SCH intervals are ignored and not counted. In other words, such optimized scheduling method intends to generate the same number of messages but all of them scheduled uniformly over only the CCH intervals. Since the default values are used for channel switching mechanism are sync period duration T=100 ms; CCH interval duration TC=46 ms and the typical safety message generation rate is 2~10 packets/second, we only consider at most one mes-sage transmission from a vehicle during a CCH interval. Channel fading with path loss is considered to reflect real traffic scenarios. Vehicle mobility is not considered.
3 ANALYTIC MODELS
3.1 Overall Method Description
Model decomposition is used to develop a tractable ana-lytic model to capture the interactions between multiple vehicles. First, an SMP model with absorbing state (de-noted as SMPA) is developed in Section 3.2 to capture the channel contention and backoff behavior for a BSM mes-sage transmission during a CCH interval. The contention influences from other vehicles are represented through three model parameters (pb, qb, rb) remaining to be deter-mined.
AUTHOR ET AL.: TITLE 3
TABLE 1 PARAMETERS DESCRIPTION
Parameters Descriptions
T Sync period duration TC CCH interval duration τ Message generation interval β Vehicle density R Transmission range σ Backoff time slot duration
DIFS Distributed Inter-Frame Space W Backoff window size
pb the probability that the tagged vehicle detects transmissions of other vehicles within a backoff time slot σ during the backoff procedure
qb the probability that the tagged vehicle detects other vehicle’s transmission within the channel sensing time DIFS
rb
the probability that the tagged vehicle waits for the current packet sent from another vehicle in the channel to finish transmission, and then sense the channel for DIFS time duration, which captures the transmission from a third vehi-cle and leads to further deference in its backoff procedure
PL Packet length
Rd Channel data transmission rate TH Time to transmit the packet header ϒ Path loss exponent m Fading parameter
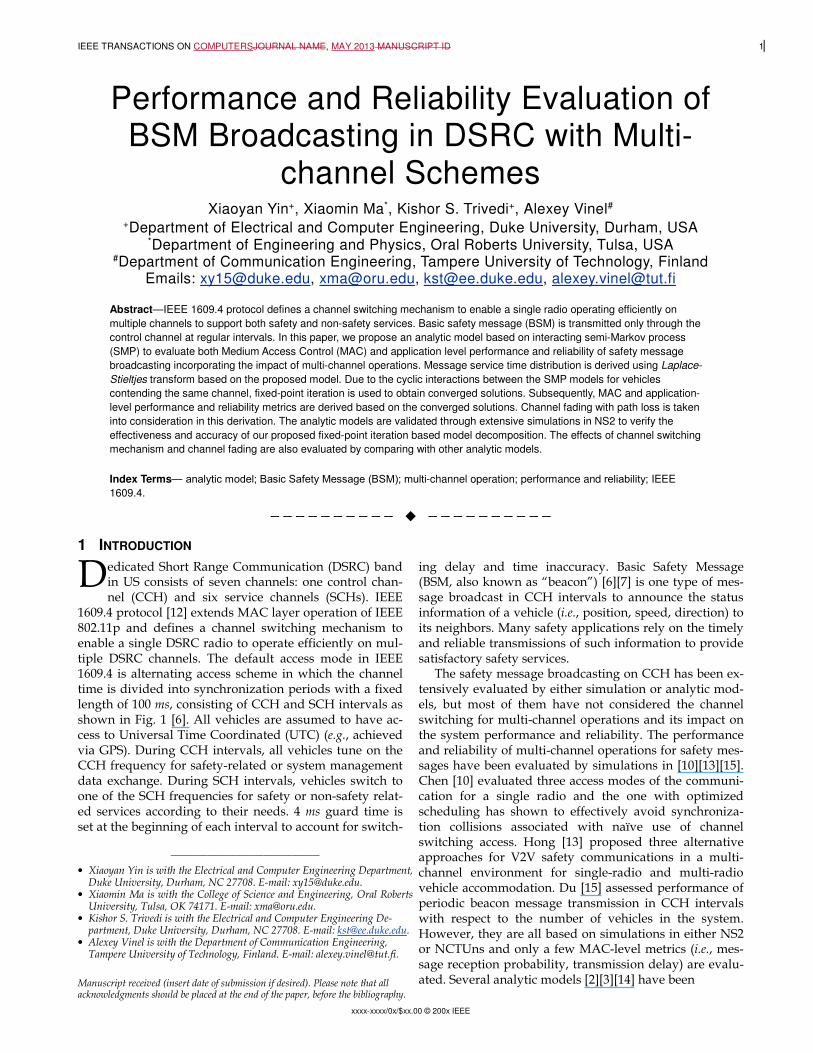
Based on the SMPA model, service time distribution
(FTA(t)) for a packet transmission can be computed using Laplace–Stieltjes transform in Section 3.3. If the service time exceeds this CCH interval, the message will be dis-carded. Hence, the probability that a BSM is not discard-ed (PTX) can be obtained based on the service time distri-bution computed earlier. SMPA model parameters pb, qb, rb can be subsequently derived based on PTX. Due to in-teractions between these four model parameters, fixed-point iteration is used to obtain the final converged solu-tions presented in Section 3.4. The import graph for such overall method is presented in Fig. 2. The main parame-ters used in this paper are listed in Table 1.
3.2 SMP Model
The behavior for a BSM transmission from a tagged vehi-cle is captured by the SMP model with absorbing state (SMPA) in Fig. 3. Initially, the vehicle is in CS state, indi-cating that it just generated a packet and has to sense
Fig. 2. Import graph for the overall method
Fig. 3. SMP model for a BSM transmission
the channel for DIFS time duration. If there is no ongoing packet transmission in the channel (with probability 1-qb), the vehicle immediately starts to transmit, after transiting to state TX. Otherwise, the vehicle will defer until the channel is idle for DIFS time duration transiting to state Dcs. Such deference behavior for the tagged vehicle in-cludes two parts: waiting for the current packet in the channel to finish transmission and waiting for subsequent transmissions, if any, from other neighbors within its re-ceiving range. The self-loop for state Dcs represents the phenomena that the tagged vehicle waits for the current packet in the channel to finish transmission, and then senses the channel for DIFS time duration, which cap-tures the transmission, if any, from another vehicle and leads to further deference. The probability that the tagged vehicle detects another neighbor’s transmission during DIFS time duration is denoted as rb.
If no other neighbors’ transmission is detected, the tagged vehicle will start the backoff procedure and ran-domly choose a backoff counter in the range [0, W-1], where W=CW+1 is the backoff window size and CW rep-resents the size of the contention window. The backoff counter will be decremented by one if the channel is de-tected idle for a time slot of duration σ (with probability 1-pb), which is captured by the transition from state W-i to state W-i-1. If the channel is busy during a backoff time slot of duration σ (i.e., another vehicle starts to transmit a packet during this time slot), the backoff counter of the tagged vehicle will be suspended, which is represented by the transition from state W-i to DW-i-1 with probability pb. Similar to state DCS, state DW-i-1 also contains the self-loop because other neighbors’ transmission can lead to further deference of the tagged vehicle. When the backoff counter reaches zero, the packet will directly be transmit-ted (an transition occurs from state 0 to state TX with probability one). In TX state, a packet is transmitting.
The SMP model with an absorbing state is constructed because we have assumed that at most one packet will transmit from a vehicle during a CCH interval, with lim-ited time duration of TC. In this SMPA model, sojourn time Tj in each state is deterministic:
1
2
3
4 0 1 2, , ,
0 0
1,2, , 1
CS
j
W
A j TX
A j CS
A j DT
A j D D D
j
j Wσ
−
=
= =
= =
=
= −
L
L
(1)
where
( )
1
2
3 1
4 1
/
/ 2
d HA PL R T
A DIFS
A A DIFS
A A DIFS
= +
=
= + = +
PL represents the packet length. Rd presents the data rate. Hence, PL/Rd is the time to transmit the packet. TH repre-sents the time to transmit the packet header including physical layer header and MAC layer header.

4 IEEE TRANSACTIONS ON JOURNAL NAME, MANUSCRIPT ID
3.3 Service Time Computation
Based on the SMPA model in Section 3.2, the time to reach the absorbing state, denoted as TA, will be the ser-vice time for a packet transmission. Denote the cumula-tive distribution function (CDF) for TA as FTA(t). Since the sojourn time in each state is deterministic, their Laplace–Stieltjes transform (LST) can be easily determined as fol-lows:
( )
1
2
3
4
0 1 2, ,
1 0
1, 1
j
j
s A
s A
s As T CS
T s A
W
s
e i TX
e i CS
e j DL s E e
e j D D D
j
e j Wσ
− ⋅
− ⋅
− ⋅− ⋅
− ⋅
−
− ⋅
=
= = = = = = = −
L
L
(2)
Therefore, the LST of the time to reach the absorbing state TA is:
( )
( )
( ) ( )( )
( ) ( ) ( ) ( )
3 3
1 2
4 4
0
1
0 0
11
1 1
s TA
TA
ks A s A b
b b b
ks A A
iW
ks A s As
b b b b
i k
L s E e
rq q e r e
We
p e p r e r eσσ
− ⋅
∞− ⋅ − ⋅
=− ⋅ +
− ∞− ⋅ + − ⋅− ⋅
= =
=
− − + ⋅ ⋅ ⋅
=
⋅ − ⋅ + ⋅ − ⋅
∑
∑ ∑
(3)
Hence, the Laplace transform of FTA(t), denoted as F*(s) is:
( )( )* TA
L sF s
s= (4)
Upon inversion of such Laplace transform, the service time distribution, FTA(t) , can be easily obtained:
( ) ( )( )1 *
TAF t L F s
−= (5)
Based on the service time distribution, the probability that a BSM message is not discarded when the CCH interval expires can be computed. Since the arrival time for a BSM is uniformly distributed in a CCH interval based on op-timized scheduling strategy [10][11], the conditional probability that a BSM is not discarded given that it ar-rives at time t0 is FTA(TC-t0) (we assume that the CCH in-terval starts at time 0 and the duration for CCH interval is TC). Therefore, the unconditional probability that a BSM is not discarded when the CCH interval expires is:
( )0 00
1cT
TX TA c
c
P F T t dtT
= ⋅ − ⋅∫ (6)
3.4 Fixed-point Iteration
As described in Section 3.2 and Section 3.3, four unknown model parameters need to be determined to obtain the system steady-state behavior. In the previous section, PTX is shown to depend on the service time distribution, which further depends on the other three model parame-ters pb, qb and rb. In this section, the channel busy proba-bilities pb, qb and rb are derived first, and each of them is shown to depend on the other three parameters. There-fore, fixed-point iteration is used to obtain final con-verged solutions.
pb is the probability that the tagged vehicle detected other vehicles start to transmit within a backoff time slot σ during the backoff procedure. Since PTX represents the probability that a vehicle transmits one packet during a
CCH interval, we can abstract the packet transmission as Fig. 4.
From Fig. 4, we know that the starting time instance of the packet transmission can only happen during TC-A1 interval. If one vehicle starts to transmit during one backoff time slot σ of the tagged vehicle, it will cause the tagged vehicle to freeze the backoff counter and wait for the packet finishes transmission. Hence, PTX·σ/(TC-A1) represents the probability that a vehicle transmits during one backoff time slot of the tagged vehicle. Hence,
( )
( )1
1
0
1 1-
1 1!
1
tr
T
tr
iTi Ntr
b
i
N D
Np D e
i
eτ
τ
∞⋅ −
=
− ⋅ −
= − −
= −
∑ (7)
where
1
1
TX
c
D PT A
σ= ⋅
−
and Ntr=2βR is the average number of vehicles within the transmission range of the tagged vehicle. In Equation (7), T/τ represents the total number of packets generated within one sync period from one vehicle. Based on opti-mized scheduling [10][11], the packets generated within the SCH period will be scheduled uniformly to CCH in-terval. Therefore, the packets generated from one vehicle will be T/τ within a CCH interval. Since we only consider the typical BSM generation rate 2~10Hz, then 0.2≤T/τ≤1. Hence, the packets generated from one vehicle within a CCH interval will be less than or equal to 1 (i.e., not larger than 1). If there are i vehicles within the tagged vehicle’s transmission range, the total number of packets generated from these i vehicles will be i·T/τ within a CCH interval. In other words, we can also interpret i·T/τ as the average number of vehicles that generate a packet within a CCH interval.
qb denotes the probability that the tagged vehicle de-tects other vehicle’s transmission within the channel sens-ing time DIFS. Fig. 5 shows that when a vehicle is trans-mitting, the tagged vehicle can detect this transmission
Fig. 4. A BSM transmission during CCH interval
Fig. 5. DIFS channel sensing during CCH interval
during DIFS time if there is an overlap between DIFS and A1. Hence, the starting point of DIFS can vary over range DIFS+A1 to detect such transmission. Therefore, PTX·(DIFS+A1)/TC represents the probability that a vehi-cle’s transmission is detected in the tagged vehicle’s DIFS channel sensing time.
Hence,

AUTHOR ET AL.: TITLE 5
( )( )21 1-
2
0
1 1 1!
T
tr
tr
i N DTi Ntr
b
i
Nq D e e
i
τ
τ
∞ − ⋅ − ⋅ −
=
= − − = −∑ (8)
where
1
2 TX
c
DIFS AD P
T
+= ⋅
rb presents the probability that the following phenom-ena occurs in Fig. 6: the tagged vehicle (vehicle B) waits for the current packet (from vehicle A) in the channel to finish transmission, and then sense the channel for DIFS time duration, which captures the transmission from an-other vehicle (vehicle C) and leads to further deference.
As shown in Fig. 6, A, B and C present the vehicles on a 1-D road. Two ovals present the transmission range of A and B respectively. For the tagged vehicle B, after it just received a packet from one of its neighbors A, it will sense the channel for DIFS time duration. During such DIFS time, only some of its neighbors are also in the DIFS channel sensing state (vehicles within S1), whereas the rest of its neighbors (vehicles within S2, such as vehicle C) are not influenced by A’s transmission since they are out-side A’s transmission range. Suppose the average number of these vehicles which are outside A’s transmission range but within B’s receiving range (i.e., space S2) is N. There-fore, in the tagged vehicle B’s DIFS channel sensing time, the probability that it receives a neighbor’s transmission is:
( )( ) ( )21 1-D
2
0
1 1 1!
TiNT
i N
b
i
Nr D e e
i
τ
τ
∞ − ⋅ − ⋅ −
=
= − − = −∑ (9)
where N is derived next. As shown in Fig. 6, let x denotes the distance between vehicle A and B. Then, the 1-D distance in S2 will also be x. Hence, the average number of vehicles in S2 is given by:
0
1
2 4
RtrNR
N x dxR
ββ= ⋅ = =∫
Based on the above analysis, we know that the four pa-rameters PTX, pb, qb and rb are interdependent. Hence, the fixed-point iteration is utilized and the pseudo-code is outlined as follows to obtain the final converged solu-tions.
//Initialization PTX=0; pb=1; qb=1; rb=1; PTX_new=1; pb_new=0; qb_new=0; rb_new=0; episolon=0.000001; while (abs(PTX-PTX_new)>episolon or abs(pb-pb_new)>episolon or abs(qb-qb_new)>episolon or abs(rb-rb_new)>episolon) { PTX=PTX_new; pb=pb_new; qb=qb_new; rb=rb_new; Use Equation (6)(7)(8)(9) to calculate PTX_new, pb_new, qb_new, rb_new. }
Once the parameters PTX, pb, qb, rb are determined using the above algorithm, they are used for both MAC and application level performance and reliability metrics computation in the next section.
Fig. 6. Channel sensing deference
4 PERFORMANCE AND RELIABILITY METRICS
4.1 MAC-level Metrics
4.1.1 Mean Transmission Delay
The mean transmission delay conditioning on that a BSM arrives at t0 is:
( )0
01
cT t
TAF t dt
−
− ∫
Therefore, the un-conditioning mean transmission delay for a BSM is given by:
[ ] ( )( )0
00 0
11
c cT T t
TA
c
E D F t dt dtT
−
= − ∫ ∫ (10)
4.1.2 Node Reception Probability (NRP)
To model real traffic scenarios, we take into account of hidden terminal problem, concurrent transmissions and channel fading with path loss to obtain MAC layer packet transmission reliability metrics. As shown in Fig. 7, we compute the NRP that vehicle U successfully receives the broadcast BSM from the tagged vehicle O.
Given a transmitting vehicles O placed at the origin, U is one of the receivers within the transmission range R of node O. U is placed on 1-D line with certain distance to O, denoted as x (0<x<R). The probability that the vehicle U receives the broadcast message from the tagged vehicle O successfully is the NRP at distance x, denoted as Ps(x). There are three factors affecting the NRP: hidden terminal problems, collisions due to concurrent packet transmis-sions and channel fading with path loss. a. Impact of hidden terminals The event that a transmission from hidden terminals col-lides with vehicle O’s transmission only happens when hidden terminals start to transmit during the vulnerable period 2A1 [16]. Based on the SMPA model and its solu-tion, we have the probability that vehicle U’s reception of the broadcast message from vehicle O is free from the hidden terminals:
1
1
1
0 1
21 1-
2 ( )( ) (1 )
!
T
TXc
T ii
x
H TX
i c
Ax P
T A
A xP x P e
T A i
e
τ
βτ
β
β∞ ⋅−
=
⋅
− − ⋅ −
⋅= − ⋅
−
=
∑
(11)
Fig. 7. Node reception probability computation
6 IEEE TRANSACTIONS ON JOURNAL NAME, MANUSCRIPT ID
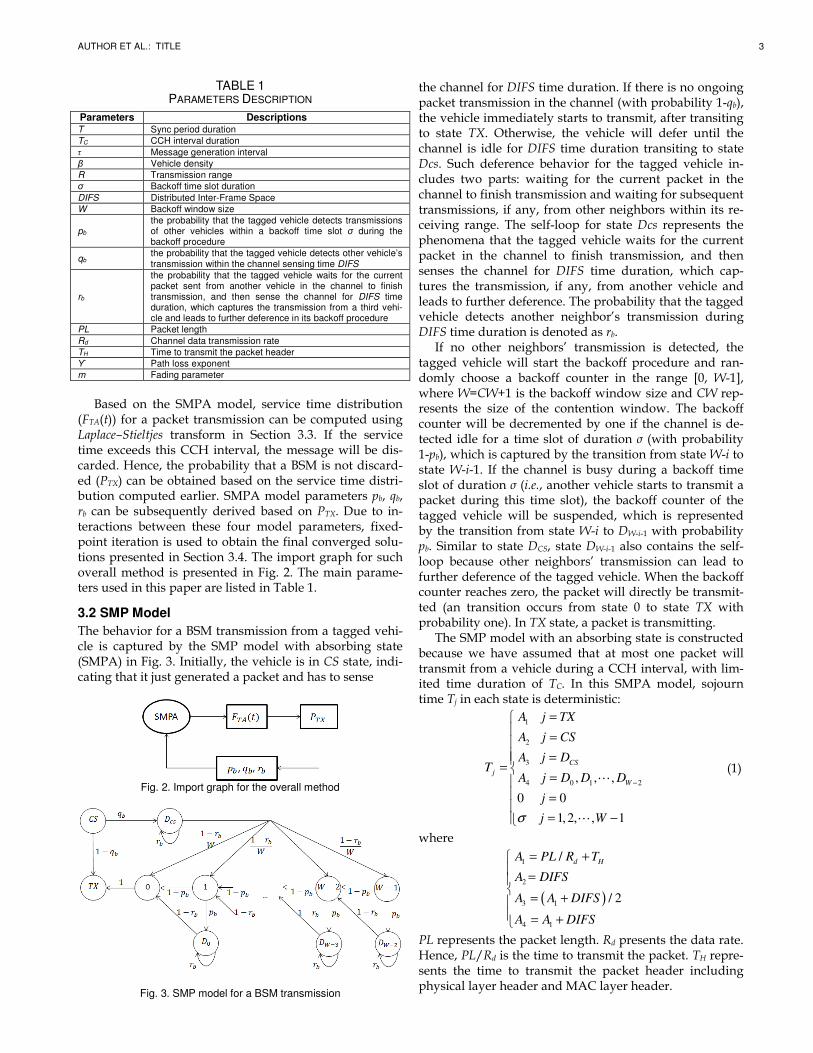
b. Impact of concurrent collisions In addition to collisions caused by the hidden terminals, transmissions from vehicles within the interference range from the tagged vehicles in the meantime at which the tagged vehicle transmits may also cause collisions. If the tagged vehicle has not gone through the backoff process before transmitting the packet, concurrent transmission will not occur (with probability 1-qb). Otherwise, the packet transmission is synchronized to the beginning of a slot time and concurrent transmission may occur if other vehicles transmission is also synchronized by the backoff process.
Given that as both O and U sense the channel idle, O will transmit within the duration of a slot. Suppose O has experienced the backoff process (with probability qb). In order to prevent interferences due to concurrent collisions to U’s receiving the broadcast message sent by O, no transmission in [-(R-x), R] is allowed. The average num-ber of nodes transmitting in the concurrent slot in area [0, x] is βxPTX·σ/(Tc-A1)·T/τ. Suppose vehicle Q is y away from O, x<y<R. The probability that concurrent transmis-sion occurs resulting from vehicle Q is the probability that vehicle Q starts to transmit during the concurrent slot and all nodes in [R+x, R+y] are not in the transmitting state, which is expressed as:
3
( )
1 3
0
( ) 1 (1 )
1
( ( ))( , ) (1 )
!
=
T
T ii
y x
s
i
y x D
T y xP y x D D e
i
TD e
τ
βτ
β
β
τ
τ
∞ ⋅− −
=
− − − −
−= ⋅ −
⋅
∑ (12)
where
1
3
1
TX
c
AD P
T A= ⋅
−
Therefore, the average number of nodes that start trans-mission during the slot that collides with the transmission from O is:
3
3
( ) 1 (1 )
1
( ) 1 (1 )1
3
( , )
1
1 (1 )
T
T
R
S sx
y x DR
x
R x D
T
n P y x dy
TD e dy
TD
e
D
τ
τ
β
β
τ
β
βτ
τ
− − − −
− − − −
=
= ⋅
⋅
= − − −
∫
∫ (13)
Suppose vehicle V is |z| away from O, -(R-x)<z<0, the probability that concurrent transmission occurs resulting from vehicle V is the probability that vehicle V starts to transmit during the concurrent slot and all vehicles in [z-R, -R] are not in the transmitting state, which is given by:
( )3
1 3
0
1 1
1
( )'( , ) (1 )
!
T
iTi
z
s
i
z D
zTP z x D D e
i
TD e
τ
βτ
β
β
τ
τ
∞ ⋅ −
=
− − −
= ⋅ −
= ⋅
∑ (14)
Therefore, the average number of vehicles that start transmission during the slot that collides with the trans-
mission from O is:
( )
( )
( )
( )
( )
3
3
0
1 10
1
( ) 1 11
3
'( , )
1
1 1
T
T
T sR x
z D
R x
R x D
T
n P z x dz
TD e dz
TD
e
D
τ
τ
β
β
τ
β
βτ
τ
− −
− − −
− −
− − − −
=
= ⋅
⋅
= − − −
∫
∫ (15)
Hence, the total average number of nodes that may transmit concurrently is:
1s T
Tn n n x Dβ
τ∑ = + + ⋅ ⋅ (16)
Given Poisson node distribution, the probability that no vehicles within the reception range of U start transmis-sion during the slot that collides with the transmission from O is given by:
( )
( )
0( )
( ) exp( ) 10!
exp( ) 1
con b b
b b
nP x q n q
q n q
∑∑
∑
= ⋅ − + −
= ⋅ − + −
(17)
c. Impact of channel fading with path loss DSRC channel modeling involves two important aspects: large scale path loss and small scale fading. The former is used to determine the average received signal strength at a particular distance from the transmitter, whereas small scale fading generally involves the detailed modeling of multi-path fading statistics, power delay profile, and Doppler spectrum. The Nakagami distribution has been shown to fit the amplitude envelope of empirical data for DSRC channel well. The probability density function (pdf) of a signal amplitude Y in Nakagami fading is:
2 1 22
( ) exp( ), 0, 0, 1/ 2( )
m m
Y m
m y myf y y m
mω
ωω
−
= − ≥ > ≥Γ
(18)
where m is the fading parameter, and ω is the average received power. The values of the two parameters are functions of distance to the sender. From empirical data obtained for vehicular environment in [4], the fading pa-rameter m is approximated as 3 for low values of d (d<50m) expecting line of sight conditions, 1.5 for middle range distances (50m≤d≤150m), and 1 (Rayleigh distribu-tion) for distance higher than 150m.
The path loss model is represented by the following:
0
0
( )( )
( )
x x
x x
γω
ω= (19)
where ω(x0) and ω(x) are the mean received power with the distance to the sender to be x0 and x, respectively, and γ is the path loss exponent. γ is usually empirically de-termined by field measurement. It can be 2 for free space environment, 1.6~1.8 for indoor line of sight, and 2.7~5 for obstructed area or shadowed urban area.
According to pdf for signal amplitude Y, the pdf of the signal power Z=Y2 is:
1 ( / )( )
( )
mm mz
Z m
mf z z e
m
ω
ω− −=
Γ (20)
Therefore, the cumulative distribution function (CDF) of
AUTHOR ET AL.: TITLE 7
the signal power Z is:
1 ( / )
0( )
( )
mz
m m x
Z m
mF z x e dx
m
ω
ω− −=
Γ ∫ (21)
Then, the probability that a message is successfully re-ceived in the absence of interferers is deduced from the probability that the message’s signal power is stronger than the power reception threshold pth, that is:
1 ( / )
0
( )
1 ( )
1( )
th
F Z th
Z th
mp
m m x
m
P P Z p
F p
mu e du
m
ω
ω− −
= >
= −
= −Γ ∫
(22)
pth should, in average, be detected in a distance equal to the “intended” communication range R from the trans-mitter, hence:
( )
( ) ( )
thp R x
x x R
γω
ω ω
= =
(23)
Therefore:
( )th
Rx p
x
γ
ω
=
(24)
Hence, we obtain the expected probability of successfully receiving a message at distance x only considering chan-nel fading with path loss effect:
( )
( )
1 ( / )
0
1/1
0
1( )
1( )
th
mp
m m u
F m
m
Rm x mu
mP x u e du
m
x mu e du
m
γγ
ω
γ
ω− −
− −
= −Γ
= −Γ
∫
∫
(25)
Taking hidden terminal, possible concurrent packet collisions, and channel fading with path loss into account, the NRP that the vehicle U receives the broadcast message from the tagged vehicle O is given by:
( ) ( ) ( ) ( )s H con F
P x P x P x P x= (26)
4.1.3 Packet Reception Ratio (PRR)
PRR over a coverage range with distance x is defined as: considering vehicles within the coverage range, the per-centage of nodes that successfully receive a packet from the tagged node among all the receivers that are investi-gated at the moment that the packet is sent out.
Assuming Poisson distribution of vehicles along a 1-D road, the average number of vehicles within an incremen-tal distance dx should be βdx. Given the NRP of each node Ps(x), the average number of vehicles in dx that success-fully receive the broadcast message from the tagged vehi-cle is Ps(x)βdx. For a coverage distance with range R from vehicle O, PRR over a coverage range with distance x (0<x≤R) found by integrating the probabilities that nodes with distance x to the source vehicle O within an incre-mental range successfully receives the broadcast message from O. Therefore:
0
0
( ) 1( ) ( ) ;
x
xs
s
P u duPRR x P u du x R
x x
β
β= = ≤∫
∫ (27)
4.1.3 Packet Delivery Ratio (PDR)
PDR over a coverage range with distance x is defined as the probability that a broadcast packet from the tagged
vehicle is successfully received by all vehicles within the coverage range. We need to derive PDR with respect to two aspects: the impact from concurrent transmissions and hidden terminal problem together and the impact from channel fading. a. Impact of hidden terminals and concurrent transmissions Suppose there is no influence from channel fading, then only concurrent transmissions and hidden terminals problem will play a role in packet reception failures. Sup-pose there are n1 vehicles locate on the left hand side of the tagged vehicle and n2 vehicles locate on the right hand side within distance x. Then, if both the left most vehicle and right most vehicle have successfully receive the pack-et from the tagged vehicle, then all vehicles within cover-age range x of the tagged vehicle will successfully receive the packet. This is resulting from the fact that both the left most vehicle and right most vehicle successfully receive the packet ensures that there is no concurrent transmis-sions and hidden terminals’ influence for all vehicles be-tween them.
Let’s consider vehicles on one hand side (left) of the tagged vehicle first. Given that there are n vehicles locat-ed on one hand side of the tagged vehicle within the cov-erage range x, the conditional joint pdf of the n vehicles’ locations Y1, Y2, …, Yn is given by [1]:
( )1 2
1 2
!, , , | ,
0
n n
n
nf y y y N x n
x
y y y x
= =
≤ ≤ ≤ ≤ ≤
L
L
(28)
Therefore, the probability that the left most vehicle within coverage area x of the tagged vehicle receive the packet successfully is expressed as:
( )
( ) ( ) ( )( )
( ) ( )( )
( ) ( )( )
2 3 1 2
2 1
2 3 1 2
2 1
1
1 20 0 0
0
1 20 0 0
0
1
0
!
!
!
n
n
n
n
n
n
y x y y y y
con n H n nny y yn
ny x y y y y
x
con n H n nny y yn
nny x
ncon n H n nny
PDR x
nP y P y dy dy dy P N x n
x
xnP y P y dy dy dy e
x n
xn yP y P y dy
x
ββ
β
∞ = = =
= = ==
∞ = = =−
= = ==
−=
=
= ⋅ ⋅ =
= ⋅ ⋅ ⋅
⋅= ⋅ ⋅ ⋅
∑ ∫ ∫ ∫
∑ ∫ ∫ ∫
∫
L L
L L
( ) ( ){ } ( )
( ) ( ) ( ){ } ( )
0
1
00
1
00
!
1 !
1 !
n
n
n
n
x
n
ny x
n x
con n H n n ny
n
y x n x
con n H n n ny
n
en
P y P y y dy en
P y P y y dy en
β
β
β
β
ββ
∞−
=
∞ =− −
==
∞ = − −
==
= ⋅ ⋅ ⋅−
= ⋅ ⋅ ⋅−
∑
∑ ∫
∑ ∫
(29)
b. Impact of channel fading with path loss For channel fading’s impact, we can assume that the im-pact of fading on different vehicles is independent from each other. Hence,
( )
( ) ( )( )
( )( )
( )
2 3 1 2
2 1
2 3 1 2
2 1
1
1
2
1 20 0 0
0 1
1 20 0 0
0 1
1 20
1
!
!
!
n
n
n
n
ny x y y y y
F i nny y yn i
nn
y x y y y yx
F i nny y yn i
ny
F i ny
i
PDR x
nP y dy dy dy P N x n
x
xnP y dy dy dy e
x n
P y dy dy dy
ββ
∞ = = =
= = == =
∞ = = =−
= = == =
==
= ⋅ ⋅ =
= ⋅ ⋅ ⋅
= ⋅
∑ ∏∫ ∫ ∫
∑ ∏∫ ∫ ∫
∏
L L
L L
L L( )
( )
2 3 2
2
2 3 1 2
2 1
0 00
1 20 0 0
0 1
!
!
n
n
n
n
ny x y y y
x
ny yn
ny x y y y y
n x
F i ny y y
n i
xne
x n
P y dy dy dy e
β
β
β
β
∞ = = =−
= ==
∞ = = =−
= = == =
⋅ ⋅
= ⋅ ⋅ ⋅
∑ ∫ ∫ ∫
∑ ∏∫ ∫ ∫L L
(30)
Therefore, taking into account of hidden terminal problem, concurrent transmissions and channel fading

8 IEEE TRANSACTIONS ON JOURNAL NAME, MANUSCRIPT ID
with path loss for vehicles on both sides of the tagged vehicle, PDR is given by:
( ) ( ) ( )2
1 2PDR x PDR x PDR x= ⋅ (31)
4.2 Application-level Metrics
4.2.1 Application-level Delay
Application-level delay is the duration between the time when a broadcast packet is generated at the application layer of transmitting vehicle and the time at which the first successful packet is received by the application layer of the receiving vehicle:
[ ] ( )1
1
( ) ( 1) [ ] ( ) 1 ( )
1[ ] 1
( )
i
D s s
i
s
E T i E D P x P x
E DP x
τ
τ
∞−
=
= − + −
= + −
∑ (32)
where x is the distance between the sender and receiver, E[D] is the MAC-level mean transmission delay of the BSM given by Equation (10) and Ps(x) is the NRP given in Equation (26). 4.2.2 T-window Reliability
Application-level T-window reliability is defined in [8] as the probability of successfully receiving at least one pack-et out of multiple packets from a broadcast vehicle at dis-tance x, within a given time Ttol (referred to as application tolerance window):
( , ) 1 (1 ( ))tolT
app tol sP x T P x τ= − − (33)
where τ is the beacon generation interval and Ps(x) is the NRP given in (26). 4.2.3 Awareness Probability
The awareness probability [9] is the probability of suc-cessfully receiving at least n packets in the tolerance time window Ttol.
( , , ) ( ) (1 ( ))
tol
tol
TTtol
kk
A tol s s
k n
T
P x n T P x P x
k
τττ
−
=
= −
∑ (34)
It is noted that the awareness probability PA(x, n, Ttol) be-comes the application-level T-window Reliability Papp(x, Ttol) as n is equal to 1. 4.2.4 Average number of invisible neighbors
The invisible neighbor problem is defined in [17]: if vehi-cle A has not received any broadcast packet from vehicle B for a certain time interval, vehicle B is an invisible neighbor of A. Based on such definition, we have the av-erage number of invisible neighbors as:
( )
0
0
( , ) 2 1 ( )
12 1 ( , )
2 2 ( , )
invisible tol
x
app tol
x
app tol
N x T x PRR x
x P s T dsx
x P s T ds
β
β
β β
= −
= − ⋅
= −
∫
∫
(35)
5 NUMERICAL RESULTS
5.1 Simulation Description
Different from the decomposition method for the interact-
ing SMP model, the simulation process simulates the mes-sage transmission behavior of the overall system consisting of a number of vehicles. The assumptions made in Section 2 for analytic modeling still hold in the simulation. The simulator package used in this work is NS2 release ver-sion 2.35. Channel switching mechanism is not incorpo-rated in this version; therefore, the NS2 source codes are modified to implement the channel switching behavior. We intend to evaluate the performance for broadcast BSM messages in the CCH while the radio is participating in IEEE 1609.4 compliant channel switching activities. Hence, based on the strategy in [10], the message genera-tion frequency is adjusted to 100/(46·τ), and the messages generated during non-CCH intervals are ignored and not been broadcast. In addition, unfinished packet receptions will be dropped when the CCH interval expires. This is implemented in PHY layer by setting an error flag for the MAC to declare CRC check failure.
5.2 Numerical Results for Performance and Reliability Indices
The MAC-level mean transmission delay under various network parameters is presented in Fig. 8 using parame-ters shown in Table 2. The network parameters are chosen reasonably based on the latest IEEE 802.11p protocol and some real testbeds [18][19]. The time to transmit the header is: TH= TH1+TH3/Rd+TH3.
TABLE 2 INPUT PARAMETER SETTINGS
Parameters Values Parameters Values
Transmission range R 300 m CCH interval Tc 46 ms
Slot time σ 13 us Data rate Rd 6 Mbps
DIFS 58 us Packet length PL 300 bytes
CW W-1 15 path loss exponent ϒ 2
PHY preamble TH1 40 µs
Fading Parameter m
3 for d<50m
1.5 for 50m≤d<150m
1 for d≥150m
MAC header TH2 272 bits
PLCP header TH3 4 µs
Sync period T 100 ms
Besides the fixed input network parameters presented in Table 2, many other adjustable parameters may also influence the performance and reliability metrics, such as vehicle density, message generation rate and distance to the sender. Hence, it is essential to evaluate our model accuracy over a wide range of such adjustable network parameters.
Fig. 8 shows that the MAC-level mean transmission delay has relatively good match with the simulation re-sults (99% confidence interval) under various vehicle density β (#vehicles/m) and message generation interval τ (s). The maximum relative difference between the ana-lytic-numeric and the simulation results is less than 4% which verified the accuracy of our proposed model. In addition, the MAC-level mean transmission delay is rela-tively small since the maximum delay is still less than 0.8 ms under typical network parameters that we choose.
The other MAC-level performance indices except the mean transmission delay are functions of distance from the sender to receiver. Therefore, it is essential to analyze the impact of distance on performance metrics such as PDR, PRR and NRP for better understanding of message

AUTHOR ET AL.: TITLE 9
Fig. 8. MAC-level mean transmission delay
Fig. 9. Packet transmission reliability
transmission behavior. Hence, we evaluate them accord-ing to distance under a specific vehicle density and mes-sage generation interval setting (β=0.1 vehicles/m and τ=1/5 s). The analytic-numerical results for NRP, PRR and PDR are obtained and compared with simulation results as shown in Fig. 9. We conducted 50 simulation runs with each run lasting 1 second. Due to the Central Limit Theo-rem, 99% confidence intervals (CI) are computed based on normal distribution. The time taken to obtain such analytic-numerical results for NRP, PRR and PDR is around 5 minutes, whereas the simulation takes several hours to obtain the corresponding 99% CI. The results in Fig. 9 show that NRP has a good match with the simula-tion results, and the relative difference becomes smaller when the distance from the sender is longer. Analytic result for PRR is relatively higher than the simulation results with acceptable accuracy. Such difference may result from the fact that the NRP for shorter distance is a little higher than the simulation results and PRR(x) is de-rived from the integration of NRP over the range [0, x]. The result for PDR shows that PDR has a very good match with the simulation results when the distance from the sender is longer than 150 m, while the difference is
relatively obvious when the distance is shorter than 150 m. This may also result from the fact that analytic model for PDR is derived from NRP which has bigger difference with the simulation results when the distance is shorter. In addition, due to the computational complexity for Equation (30), we used polynomial approximation to ap-proach the analytic results for PF(yi), which has relatively larger difference with the exact analytic-numerical results when the distance is short. To sum up, the analytic mod-els for MAC-level performance metrics have a good match with simulations with acceptable differences for shorter distances, which validate the accuracy of our model.
Moreover, we observe that as the distance becomes longer, the NRP, PRR and PDR decrease. For NRP, when the distance from the sender is longer, a receiver has low-er probability to receive a broadcast packet resulting from the impact of concurrent transmission, hidden terminal problems and channel fading with path loss. Due to this fact, the percentage of receivers that successfully receive the packet over all receivers in the coverage area (PRR) also decreases as the coverage area becomes larger. For PDR, which represents the probability that all vehicles within a coverage area receive a broadcast packet success-fully, decreases dramatically with the distance. Fig. 9 shows that PDR drops to almost 0 when the coverage area is a half of the communication range.
Fig. 10. Awareness probability with different packet requirements
Fig. 11. Application-level delay
0.02 0.04 0.06 0.08 0.1 0.12 0.14 0.16 0.18 0.25
6
7
8x 10
-4
Density (#vehicles/meter)
MA
C-lev
el m
ea
n t
ransm
issio
n d
ela
y (
sec
onds
)
tau=1 analytic
tau=1 sim 99% CI
tau=1/2 analytic
tau=1/2 sim 99% CI
tau=1/3 analytic
tau=1/3 sim 99% CI
0 50 100 150 200 250 3000
0.1
0.2
0.3
0.4
0.5
0.6
0.7
0.8
0.9
1
Distance (meters)
Pro
babili
ty
NRP analytic
PRR analytic
PDR analytic
NRP sim 99% CI
PRR sim 99% CI
PDR sim 99% CI
0 50 100 150 200 250 3000
0.1
0.2
0.3
0.4
0.5
0.6
0.7
0.8
0.9
1
Distance (meters)
Aw
are
ness p
robabili
ty
PA(n=1) analytic
PA(n=2) analytic
PA(n=3) analytic
PA(n=1) sim 99% CI
PA(n=2) sim 99% CI
PA(n=3) sim 99% CI
0 50 100 150 200 250 3000
0.1
0.2
0.3
0.4
0.5
0.6
Distance (meters)
Applic
ation layer
dela
y (
seconds)
analytic
simulation 99% CI

10 IEEE TRANSACTIONS ON JOURNAL NAME, MANUSCRIPT ID
Fig. 12. Average no. of invisible neighbors
Application-level metrics are derived from MAC-level
metrics to analyze the accumulative message transmis-sion behavior either through multiple transmissions or over specific time duration. Hence, they are expected to follow different trends from MAC-level metrics described above. Since they are distance-dependent, we evaluate the influence of distance upon the performance matrics next. Figs. 10-12 show the comparisons between analytic model and simulation for application-level performance and reliability metrics with tolerance window Ttol=1s. The re-sults show that they have very good match over the whole communication range. In addition, we observe that the differences with simulation results when the distance is shorter for MAC-level performance and reliability met-rics (NRP, PRR and PDR) have little impact on the accu-racy of the application-level metrics. Therefore, this fur-ther validates the accuracy ofour proposed model for ap-plication-level performance and reliability metrics. Fur-thermore, Figs. 10-12 show that the application-level met-rics varies dramatically when the distance from the send-er is longer. T-window reliability and awareness probabil-ity decreases with the distance (Notice that T-window reliability is equivalent to the awareness probability with packet requirement n=1). In addition, we observe from Fig. 10 that as the packet requirement increases, the awareness probability decreases faster. Fig. 11 shows that the application-level delay increases faster with the dis-tance and is much higher than the MAC-level mean transmission delay in Fig. 8. Fig. 12 shows that the aver-age number of invisible neighbors increases dramatically with the distance especially when the distance is longer.
5.3 Impacts analysis
In this paper, we have considered channel switching mechanism for BSM dissemination aacounting for three types of scenarios: concurrent collisions, hidden terminals and channel fading. Hence, the impacts of these three factors are evaluated in this section. Since most MAC-level and application-level metrics are derived based on NRP, we only evaluate the impacts on NRP.
Fig. 16. Impact analysis
Fig. 16 shows the analytic-numerical results for NRP
incorporating different effects: with concurrent collisions only; with concurrent collisions and hidden terminals; with concurrent collisions, hidden terminals and channel fading.As shown in this figure, concurrent collisions have very little influence on NRP, whereas hidden terminals problem leads to significant decrease of NRP. In addition, NRP under channel fading scenario is lower than that without channel fading. Such difference becomes more obvious when the distance from the sender is longer. When the distance is less than 150 m, the difference is rel-atively small because the fading parameter m we used is larger for small distances. Therefore, we conclude that bigger fading parameter brings less severe fading to the communications, whereas smaller fading parameter brings bigger degradation of the NRP. We also conclude that, to improve the performance of DSRC based message transmission, the most important thing is to reduce the impact of hidden terminals problem and channel fading.
6 CONCLUSIONS AND FUTURE WORK
In this paper, an analytic model is proposed to character-ize the BSM message broadcasting in CCH interval for multi-channel operations. Optimized scheduling is as-sumed to avoid synchronization collisions presented in basic access mode for IEEE 802.11p and IEEE 1609.4. Channel fading with path loss is taken into account in this work to capture practical communication environment. MAC-level performances including mean transmission delay, NRP, PDR, PRR and application-level performance including T-window reliability, awareness probability, application-level delay and average number of invisible neighbors are derived. Simulation in NS2 incorporating channel switching mechanism is implemented for verifi-cation purposes. The good match between the analytic model and simulation results validate the accuracy of our proposed model.
In future, vehicle mobility will be considered to make the model more realistic. Even though it has been proven in [4][5] that high mobility of vehicles has very minor im-pact on the performance of the direct message broadcast-
0 50 100 150 200 250 3000
0.5
1
1.5
2
2.5
3
Distance (meters)
Avera
ge n
o.
of
invis
ible
neig
hbors
Ninv analytic
Ninv sim 99% CI
0 50 100 150 200 250 3000
0.1
0.2
0.3
0.4
0.5
0.6
0.7
0.8
0.9
1
Distance (meters)
NR
P
concurren collisions
concurrent collisions & hidden terminal
concurrent collisions & hidden terminal & fading

AUTHOR ET AL.: TITLE 11
ing with high data rate, it may have great impact on ap-plication level performance metrics. In addition, 2-D model for urban, suburban and intersections will be de-veloped.
ACKNOWLEDGMENT
The authors would like to thank NSF grants (CNS-1018605 and CNS-1017722) to support this research.
REFERENCES
[1] K. S. Trivedi, Probability and Statistics with Reliability, Queu-
ing and Computer Science Applications, Second Edition, John
Wiley, 2002.
[2] C. Campolo, A. Vinel, A. Molinaro, Y. Koucheryavy, “Modeling
Broadcasting in IEEE 802.11p/WAVE Vehicular Networks”,
IEEE Communications Letters, , vol.15, no.2, pp.199-201, Feb-
ruary 2011.
[3] C. Campolo, A. Molinaro, A. Vinel, Y. Zhang, “Modelling Prior-
itized Broadcasting in Multi-Channel Vehicular Networks”,
IEEE Transactions on Vehicular Technology, Vol. 61, Issue 2,
Feb. 2012, pp. 687–701.
[4] M. T. Moreno, S. Corroy, H. Hartenstein, “IEEE 802.11-based
one-hop broadcast communications: understanding transmis-
sion success and failure under different radio propagation envi-
ronments” ACM International Workshop on Modeling Analy-
sis and Simulation of Wireless and Mobile Systems
(MSWiM’06), pp. 68-77, Spain, 2004
[5] X. Ma and X. Chen, “Delay and Broadcast Reception Rates of
Highway Safety Applications in Vehicular Ad Hoc Networks”,
IEEE INFOCOM2007 Workshop on Mobile Networks for Ve-
hicular Environments, pp. 85-90, 2007
[6] J. B. Kenney, “Dedicated short range communications (DSRC)
standards in the United States”, Proceedings of the IEEE, vol.
99, no. 7, pp. 1162-1182, 2011.
[7] “Dedicated Short Range Communications (DSRC) Message Set
Dictionary”, SAE Std. J2735, SAE Int., DSRC Committee, Nov.
2009.
[8] F. Bai, H. Krishnan, V. Sadekar, G. Holland, T. ElBatt, “Towards
characterizing and classifying communication-based automo-
tive applications from a wireless networking perspective”, IEEE
Workshop on Autonet, 2006.
[9] N. An, T. Gaugel, and H. Hartenstein, “VANET: is 95% proba-
bility of packet reception safe?” IEEE 11th International Confer-
ence on ITS Telecommunications”, 2011.
[10] Q. Chen, D. Jiang, L. Delgrossi, “IEEE 1609.4 DSRC Multi-
Channel Operations and Its Implications on Vehicle Safety
Communications”, IEEE VNC-2009.
[11] C. Campolo, A. Molinaro, A. Vinel “Understanding the Perfor-
mance of Short-lived Сontrol Broadcast Packets in
802.11p/WAVE Vehicular Networks”, Proc. of the 3rd IEEE
Vehicular Networking Conference – IEEE VNC-2011, Amster-
dam, Netherlands, 2011.
[12] “IEEE Trial-Use Standard for Wireless Access in Vehicular
Environments (WAVE) – Multi-Channel Operation,” IEEE
1609.4-2006.
[13] K. Hong, J. B. Kennedy, V. Rai and K. P. Laberteaux, “Evalua-
tion of Multi-Channel Schemes for Vehicular Safety Communi-
cations”, in Proc. of IEEE VTC-Spring, Taipei, pp. 1-5, 2010.
[14] A. J. Ghandour, M. D. Felice, L. Bononi, H. Artail, “Modeling
and simulation of WAVE 1609.4-based multi-channel vehicular
ad hoc networks”, Proceedings of the 5th International ICST
Conference on Simulation Tools and Techniques, pp. 148-156,
2012
[15] Y. Du, L. Zhang, Y. Feng, Z. Ren and Z. Wang, “Performance
Analysis and Enhancement of IEEE 802.11p/1609 Protocol
Family in Dense Vehicular Environments”, In Proc. of 13th In-
ternational IEEE Conference on Intelligent Transportation Sys-
tems, ITSC 2010, 19-22 Sep 2010.
[16] X. Yin, X. Ma, and K. S. Trivedi, “An Interacting Stochastic
Models Approach for the Performance Evaluation of DSRC Ve-
hicular Safety Communication,” IEEE Trans. on Computers,
62(5): 873-885, 2013.
[17] H. Lu, and C. Poellabauer, “Analysis of application-specific
broadcast reliability for vehicle safety communications”, ACM
VANET’11, 67-72, 2011
[18] G. Marfia, M. Roccetti, A. Amoroso, and G. Pau, “Safe Driving
in LA: Report from the Greatest Intervehicular Accident Detec-
tion Test Ever,” IEEE Transactions on Vehicular Technology,
Vol. 62, n. 2, February 2013.
[19] F. Bai, D. D. Stancil, and H. Krishnan, “Toward understanding
characteristics of Dedicated Short Range Communications
(DSRC) from a perspective of vehicular network engineers,” in
Proc. 16th Annu. Int. Con. MobiCom, 2010, pp. 329–340. Xiaoyan Yin received B.S. in Electrical Engineering and Computer Science at Peking University, China, and M.S. in Electrical and Computer Engineering at Duke University. Currently, she is a Ph. D. student in Electrical and Computer Engineering at Duke University. Her research interests include performance and reliability evaluation of computer and communication systems.
Xiaomin Ma (M’03-SM’08) received B.E. and M.E. degrees in elec-trical engineering in 1984 and 1989, respectively. He got the Ph.D. degree in Information engineering at the Beijing University of Posts & Telecommunications, China, in 1999. From 2000 to 2002, he was a post-doctoral fellow in the Department of Electrical and Computer Engineering, Duke University, USA. Currently, he is a professor in the College of Science and Engineering at Oral Roberts University in U.S. He has published more than 90 papers in peer-reviewed jour-nals and conferences. He also holds a US patent. His research interests include stochastic modeling and analysis of computer and communication systems, physical layer and MAC layer of vehicular ad hoc wireless networks, computational intelligence and its applica-tions to coding, signal processing, and control, and Quality of service (QoS) and call admission control protocols in wireless networks.
Kishor S. Trivedi (M’86-SM’87-F’92) received M.S. and Ph.D. de-grees in Computer Science from University of Illinois, Urbana-Champaign. He holds the Hudson Chair in the Department of Elec-trical and Computer Engineering at Duke University, Durham, NC. He has been on the Duke faculty since 1975. He is the author of a well known text entitled, Probability and Statistics with Reliability, Queuing and Computer Science Applications, published by Prentice-Hall; a thoroughly revised second edition (including its Indian edition) of this book has been published by John Wiley. He has also pub-lished two other books entitled, Performance and Reliability Analysis of Computer Systems, published by Kluwer Academic Publishers and Queueing Networks and Markov Chains, John Wiley. He is a Fellow of the Institute of Electrical and Electronics Engineers. He is a Golden Core Member of IEEE Computer Society. He has published over 480 articles and has supervised 44 Ph.D. dissertations. He is the recipient of IEEE Computer Society Technical Achievement Award for his research on Software Aging and Rejuvenation. His research interests are in reliability, availability, performance, per-formability and survivability modeling of computer and communica-tion systems. He works closely with industry in carrying our reliabil-ity/availability analysis, providing short courses on reliability, availa-bility, performability modeling and in the development and dissemi-nation of software packages such as SHARPE and SPNP.

12 IEEE TRANSACTIONS ON JOURNAL NAME, MANUSCRIPT ID
Alexey Vinel (M’07-SM’12) received the B.S. (Hons.) and M.S. (Hons.) degrees in information systems from Saint Petersburg State University of Aerospace Instrumentation, St.-Petersburg, Russia, in 2003 and 2005, respectively, and the Ph.D. (candidate of science) degree in technical sciences from the Institute for Information Transmission Problems, Russian Academy of Sciences, Moscow, Russia, in 2007. He is currently a Researcher with the Department of Communications Engineering, Tampere University of Technology, Tampere, Finland. His research interests include multiple-access protocols and intelligent transportation systems.