Embed Size (px)
Citation preview
A Primer on Environmental Life CycleAssessment (LCA) for Australian Grains
(September 2002)
Prepared byVenky Narayanaswamy
Jim AlthamRene Van Berkel
Murray McGregor
Funded by
A Primer on EnvironmentalLife Cycle Assessment (LCA)
for Australian Grains
Prepared by
Venky NarayanaswamyWilliam (Jim) Altham
Rene Van BerkelCentre of Excellence in Cleaner Production
Curtin University of TechnologyGPO Box U1987, PerthWestern Australia, 6845
Telephone +61 8 9266 4240Fax +61 8 9266 4811
Email: [email protected]://cleanerproduction.curtin.edu.au/
Murray McGregorMuresk Institute of AgricultureCurtin University of TechnologyNorthamWestern Australia, 6401Telephone +61 8 9690 1567Fax +61 8 9690 1500Email: [email protected]://www.curtin.edu.au/curtin/muresk/
© (September 2002) Curtin University of TechnologyThis publication can be reproduced in whole or in part and in any form foreducational or non-profit purposes without special permission from the copyrightholders, provided acknowledgement of the source is made.
2
3
Contents
Acknowledgments..........................................................................................................3PREFACE ����������������������������4Section 1 Why conduct Life Cycle Assessment? ......................................................5Section 2 Life Cycle Assessment Methodology ........................................................7Section 3 Goal and Scope Definition........................................................................9Section 4 Life Cycle Inventory Analysis.................................................................11Section 5 Life Cycle Impact Assessment ................................................................13Section 6 Life Cycle Interpretation.........................................................................16Section 7 Grains LCA Project.................................................................................19References ���������������������������..24List of Australian and International LCA organisations..........................................25
List of FiguresFigure 1 LCA Framework................................................................................................. 7Figure 2 Life Cycle of Wheat Starch.................................................................................. 9Figure 3 Grains LCA Project Overview ........................................................................... 19Figure 4 Environmental life cycle diagram of a grain supply chain .................................. 23
Acknowledgments
CECP and MIA, Curtin University of Technology jointly developed this primer, inconsultation with LCA practice groups and potential users, with funding support fromthe Grains Research and Development Corporation (GRDC). We gratefullyacknowledge the inputs provided by agricultural researchers and related organisations.We are grateful to overseas LCA practitioners on sharing literature and experience inapplying LCA to agricultural products in their countries.
PREFACE
GRDC entrusted a two-year pilot project to Curtin University of Technology in WesternAustralia. Starting in April 2002, the project includes conducting pilot LCAs for wheat, barleyand canola, and investigating how routinely collected agricultural statistics can be used forongoing, LCA based, environmental performance assessments. The project focuses on theenvironmental assessment of wheat-to-bread, barley-to-beer and canola-to-cooking oil chains.It aims to provide transparent and comprehensive LCA data sets and case studies on themethodology and outcomes of LCA in these chains. The project is expected to benefit the graingrowers, grains� storage and processing facilities by creating environmental and economicawareness (distribution of this primer is a part of this awareness campaign) by reducingconsumption of input-resources per unit of product output (water, chemicals, fertilisers andenergy consumed) whilst cutting down the release of pollutants to the environment fromvarious operations. Thus the project aims to cut input-costs and improve profitability withreduced stress on the living environment.
As a part of an awareness campaign in this project, a Primer on Environmental Life CycleAssessment for Australian grains processing industry has been prepared to introduce andexplain the LCA concepts and benefits to grains processing sector. The Primer has beenjointly developed by the Centre of Excellence in Cleaner Production (CECP) and MureskInstitute of Agriculture (MIA), both at Curtin University of Technology, WA. The primerexpands upon the CECP�s on-going efforts to promote preventive environmental strategiesacross all industry sectors and introduces LCA as an environmental management tool foragribusinesses and food processing industries.
The primer provides a road map for conducting and interpreting a LCA study. Readers will beable to understand how to use LCA as a tool to meet the environmental performance objectivesof their businesses. In addition, it also demonstrates to business managers and others that LCAis an important component of a company�s on-going environmental management program.Readers will learn that the LCA is a systematic tool to identify, assess and prioritiseenvironmental impacts within and across the businesses� supply and demand chains. It helpsidentifying and implementing measures to eliminate or reduce environmental impacts arisingwithin and across those chains. The primer also provides useful references for interestedreaders who wish to practise LCA and apply its techniques in their business arenas.
The primer starts (Section 1) with the emerging need (�business case�) and context for LCA asan environmental assessment tool for Australian agricultural products. It then provides anoverview of LCA methodology (Section 2) and takes you through four steps of LCA (Sections3-6) with a case example of wheat starch produced in Queensland. Section 7 talks about theGrains LCA project that we are currently working on.
Prof. Rene Van BerkelProf. Murray McGregorPrincipal InvestigatorsSeptember 2002
4
Section 1 Why conduct Life Cycle Assessment?
Australia is one of the world leaders in the production and export of broadacreagricultural products to Europe, United States of America and Asia-Pacific.Consequently, Australia faces three major challenges and opportunities to increase andsustain the long-term profitability of Australian grains:
�The farming system while being profitable must also look to maintain resources forfuture generations. Farming operations must become sustainable. We cannotsurvive on the perception of being clean and green � we need to account for it.�
- Agribusiness, BankWest, August 2002
Higher expectations of overseas customers on the environmental provenance ofAustralian grains.
There is a widespread perception in Europe and Americas that Australian farmingsystems are relatively less resource intensive, and hence more environmentallysound, in comparison to their domestic systems. Whilst these perceptions arebeginning to transform into demands in the market place, it would be wise tointrospect, substantiate and defend the Australian position by a scientific scrutinyon the environmental performance of the Australian grains' supply chain.
Widespread emergence of eco-labelling criteria and environmental managementsystems (EMS) now extends into grains production and processing sector
LCA of grains compliments and strengthens the implementation of EMS standard- AS/NZS ISO 14001 and eco-labelling standards: AS/NZS ISO 14020, 14021,14024 and HB 207.1, for agricultural food products. These are slowly evolving tobecome market-based voluntary mechanisms in the greening of grains� supply chain.
Major concerns such as dryland salinity, land clearing and loss of biodiversity andtheir propensity to continuously erode existing productive capacity, e.g. soilfertility.
Implication of these to maintaining long-term farm-productivity has nothistorically been directly integrated into day-to-day farm management. LCAhelps to achieve this by providing information to deal with these issues not only atthe farm level but also on region-wide.
5
�LCA provides an understanding of environmental impacts across agriculturalsupply chains and places agro-ecological stage in context with the rest of the foodsupply chain. The future of food business lies in demonstrating life cycleaccountability of agricultural products.�- Dr. Henry King, Safety and Environment Assurance Centre, Unilever, UK, July2002
Conducting a LCA of our agricultural products is a first step towards facing thesechallenges by establishing baseline information for the complete environmental profileof grain crops and downstream food products. It is also a step towards using theinformation to develop and assess sustainable farming practices and food processingoperations. Practices that reduce total energy use, improve chemical use efficiency andreduce emissions released to the environment. In other words, this information is usedto develop and implement cost-effective measures to mitigate environmental impacts. Itwill also lead to more systematic management of regional environmental issues such asdryland salinity and loss of biodiversity.
�Taking care of environmental considerations throughout the supply chain is thevital part of our business strategy as we transform perishable raw materials into highquality safe and wholesome food products that meet the needs of consumersthroughout their lives.�
- Nestlé�s Environmental Approach, September 2002
LCA of agricultural products compliments and supports ongoing efforts on eco-labelling and EMS in the grains production by providing new environmental nichemarket opportunities for Australian grains overseas. Overall, the whole exercise isexpected to enhance the environmental transparency and credibility of Australian crop-based products both domestically and internationally.
�Eco-Efficiency is reached by the delivery of competitively priced goods and services that satisfyhuman needs and bring quality of life, while progressively reducing ecological impacts and resourceintensity throughout the life cycle, to a level at leas t in line with the earth�s carrying capacity.�
The World Business Council for Sustainable Development (WBCSD) has identified three maincomponents of Eco-Efficiency. These are:
Reduce toxic emissionsE.g. Reducing both chemical application rates and chemicals toxicity to humans and other plants andanimals by substituting with more environmentally and agronomically preferred ones
Improve resource efficiencyE.g. Reducing ne t mineral nutrients intake by rotation of legumes and by recycling stubble
Create more valueE.g. Preventing soil salinity through improved land management practices
6
Section 2 Life Cycle Assessment Methodology
LCA is a tool to evaluate environmental impacts of a product or process throughout itsentire life cycle, from crop cultivation, through to food processing, use and disposal ofwastes associated with its final end-use. This includes identifying and quantifyingenergy and materials used and wastes released to the environment, calculating theirenvironmental impact, interpreting results, and evaluating improvement opportunities.
LCA has been structured by AS/NZS ISO14040, 14041, 14042 and 14043 standardswith technical inputs from expert organisations worldwide and in Australia. Thesestandards provide an internationally agreed method of conducting LCA, but leavesignificant degrees of flexibility in methodology to customise any individual project tothe desired application and outcomes. LCA can test the environmental efficacy ofalternative scenarios for preventing or reducing the adverse environmental impactsarising from various processes. LCAs are particularly useful in ensuring that identifiedeco-efficiency opportunities do not shift environmental impacts to other stages withinthe product�s life cycle. In this way, LCA has the ability to anticipate and prevent theenvironmental problem arising from a whole product chain as opposed to reactivesolutions that focus on rendering pollution harmless after they have been produced.This goes well with the adage �an ounce of prevention is worthier than a pound ofcure�.
Companies such as Unilever, Nestle, etc have been applying LCA to industrialpollution prevention problems for a number of years and have realised significanteconomic and environmental benefits. However, LCA in itself will not lead to betterenvironmental outcomes. Only when coupled with appropriate decision models ortools, LCA gets transformed into an environmental decision support tool for businessmanagers.
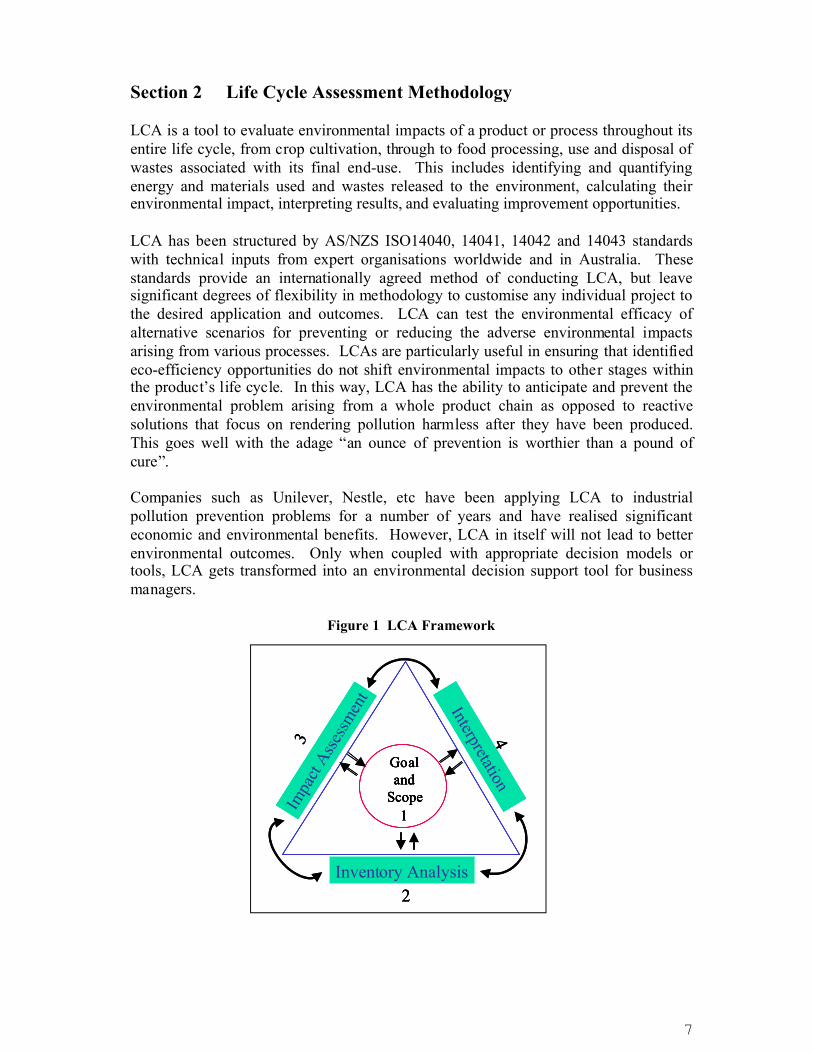
Figure 1 LCA Framework
Goaland
Scope1
Inventory Analysis2
Goaland
Scope1
Inventory Analysis2
Goaland
Scope1
Goaland
Scope1
Inventory Analysis2
7
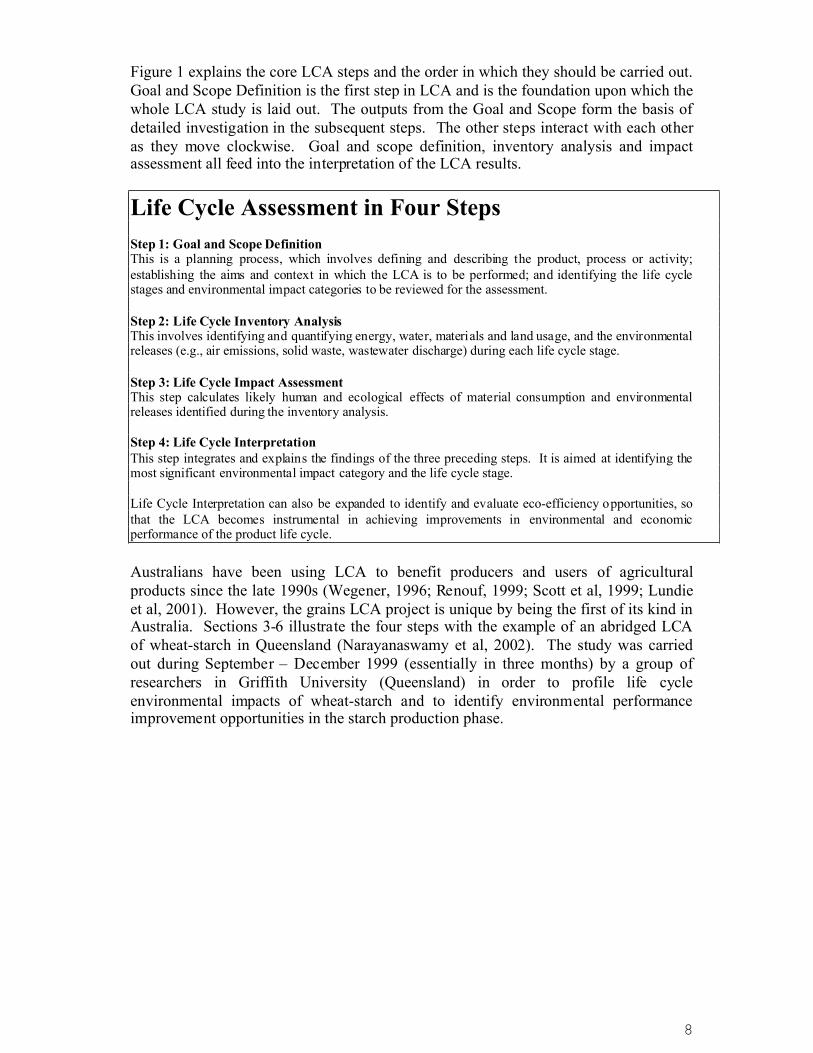
Figure 1 explains the core LCA steps and the order in which they should be carried out.Goal and Scope Definition is the first step in LCA and is the foundation upon which thewhole LCA study is laid out. The outputs from the Goal and Scope form the basis ofdetailed investigation in the subsequent steps. The other steps interact with each otheras they move clockwise. Goal and scope definition, inventory analysis and impactassessment all feed into the interpretation of the LCA results.
Life Cycle Assessment in Four StepsStep 1: Goal and Scope DefinitionThis is a planning process, which involves defining and describing the product, process or activity;establishing the aims and context in which the LCA is to be performed; and identifying the life cyclestages and environmental impact categories to be reviewed for the assessment.
Step 2: Life Cycle Inventory AnalysisThis involves identifying and quantifying energy, water, materials and land usage, and the environmentalreleases (e.g., air emissions, solid waste, wastewater discharge) during each life cycle stage.
Step 3: Life Cycle Impact AssessmentThis step calculates likely human and ecological effects of material consumption and environmentalreleases identified during the inventory analysis.
Step 4: Life Cycle InterpretationThis step integrates and explains the findings of the three preceding steps. It is aimed at identifying themost significant environmental impact category and the life cycle stage.
Life Cycle Interpretation can also be expanded to identify and evaluate eco-efficiency opportunities, sothat the LCA becomes instrumental in achieving improvements in environmental and economicperformance of the product life cycle.
Australians have been using LCA to benefit producers and users of agriculturalproducts since the late 1990s (Wegener, 1996; Renouf, 1999; Scott et al, 1999; Lundieet al, 2001). However, the grains LCA project is unique by being the first of its kind inAustralia. Sections 3-6 illustrate the four steps with the example of an abridged LCAof wheat-starch in Queensland (Narayanaswamy et al, 2002). The study was carriedout during September � December 1999 (essentially in three months) by a group ofresearchers in Griffith University (Queensland) in order to profile life cycleenvironmental impacts of wheat-starch and to identify environmental performanceimprovement opportunities in the starch production phase.
8
Section 3 Goal and Scope Definition
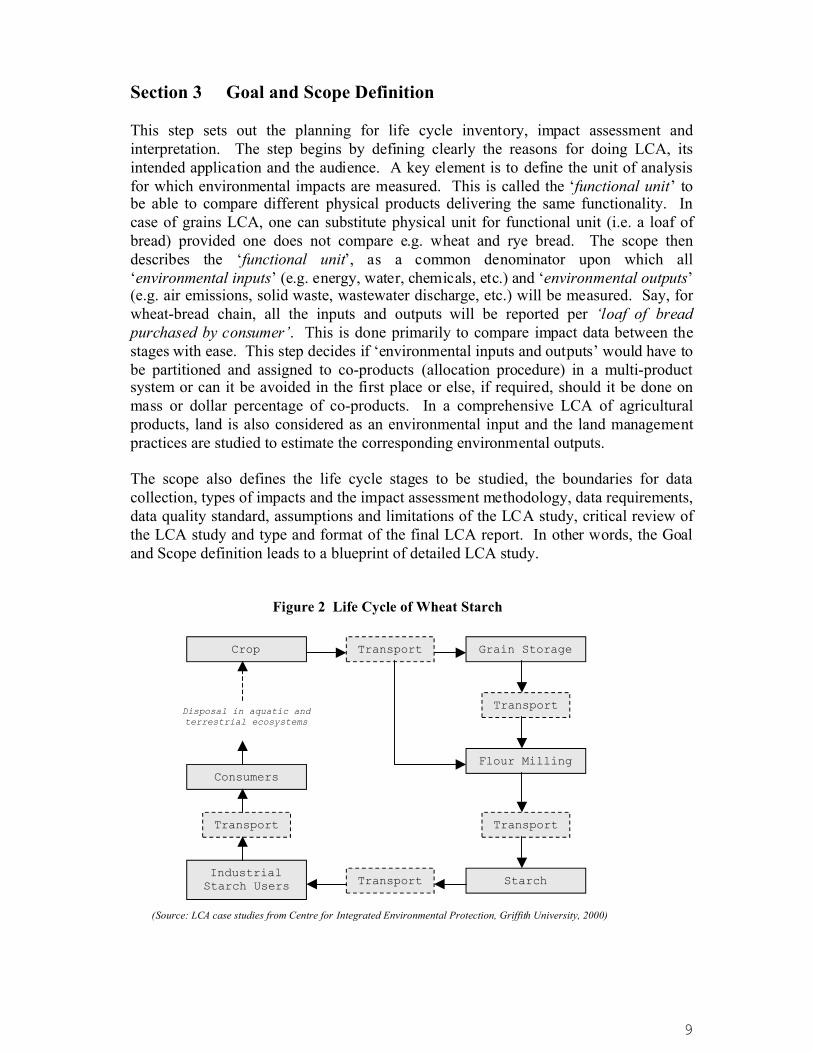
This step sets out the planning for life cycle inventory, impact assessment andinterpretation. The step begins by defining clearly the reasons for doing LCA, itsintended application and the audience. A key element is to define the unit of analysisfor which environmental impacts are measured. This is called the �functional unit� tobe able to compare different physical products delivering the same functionality. Incase of grains LCA, one can substitute physical unit for functional unit (i.e. a loaf ofbread) provided one does not compare e.g. wheat and rye bread. The scope thendescribes the �functional unit�, as a common denominator upon which all�environmental inputs� (e.g. energy, water, chemicals, etc.) and �environmental outputs�(e.g. air emissions, solid waste, wastewater discharge, etc.) will be measured. Say, forwheat-bread chain, all the inputs and outputs will be reported per �loaf of bread purchased by consumer�. This is done primarily to compare impact data between thestages with ease. This step decides if �environmental inputs and outputs� would have to be partitioned and assigned to co-products (allocation procedure) in a multi-productsystem or can it be avoided in the first place or else, if required, should it be done onmass or dollar percentage of co-products. In a comprehensive LCA of agriculturalproducts, land is also considered as an environmental input and the land managementpractices are studied to estimate the corresponding environmental outputs.
The scope also defines the life cycle stages to be studied, the boundaries for datacollection, types of impacts and the impact assessment methodology, data requirements,data quality standard, assumptions and limitations of the LCA study, critical review ofthe LCA study and type and format of the final LCA report. In other words, the Goaland Scope definition leads to a blueprint of detailed LCA study.
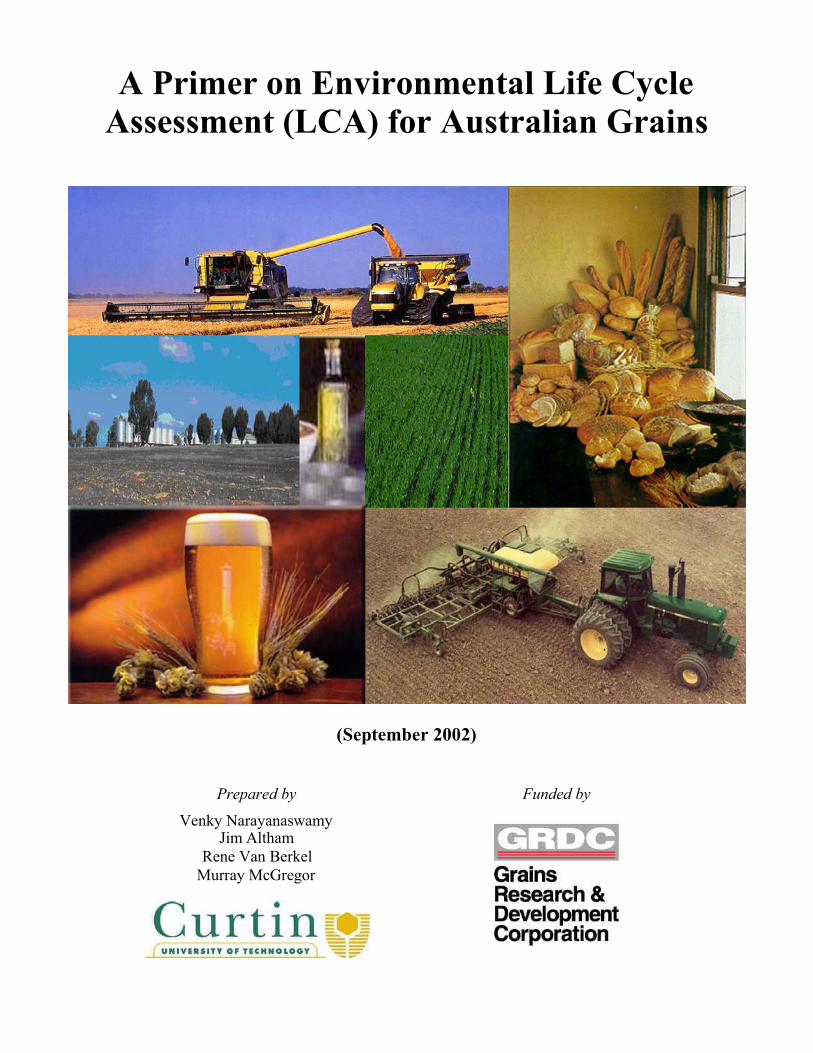
Figure 2 Life Cycle of Wheat Starch
Disposal in aquatic andterrestrial ecosystems
Consumers
Transport
IndustrialStarch Users Transport Starch
Transport
Flour Milling
Transport
Grain StorageTransportCrop
(Source: LCA case studies from Centre for Integrated Environmental Protection, Griffith University, 2000)
9
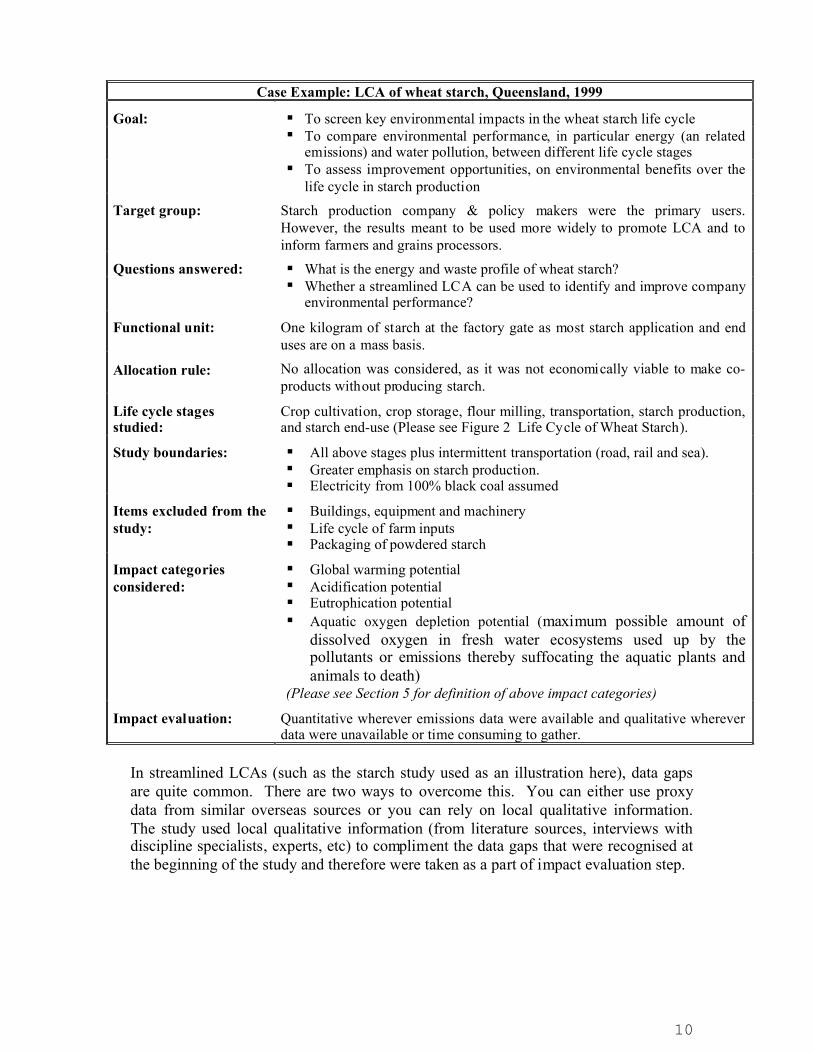
Case Example: LCA of wheat starch, Queensland, 1999
Goal: To screen key environmental impacts in the wheat starch life cycleTo compare environmental performance, in particular energy (an relatedemissions) and water pollution, between different life cycle stagesTo assess improvement opportunities, on environmental benefits over thelife cycle in starch production
Target group: Starch production company & policy makers were the primary users.However, the results meant to be used more widely to promote LCA and toinform farmers and grains processors.
Questions answered: What is the energy and waste profile of wheat starch?Whether a streamlined LCA can be used to identify and improve companyenvironmental performance?
Functional unit: One kilogram of starch at the factory gate as most starch application and enduses are on a mass basis.
Allocation rule: No allocation was considered, as it was not economically viable to make co-products without producing starch.
Life cycle stagesstudied:
Crop cultivation, crop storage, flour milling, transportation, starch production,and starch end-use (Please see Figure 2 Life Cycle of Wheat Starch).
Study boundaries: All above stages plus intermittent transportation (road, rail and sea).Greater emphasis on starch production.Electricity from 100% black coal assumed
Items excluded from thestudy:
Buildings, equipment and machineryLife cycle of farm inputsPackaging of powdered starch
Impact categoriesconsidered:
Global warming potentialAcidification potentialEutrophication potentialAquatic oxygen depletion potential (maximum possible amount ofdissolved oxygen in fresh water ecosystems used up by thepollutants or emissions thereby suffocating the aquatic plants andanimals to death)
(Please see Section 5 for definition of above impact categories)Impact evaluation: Quantitative wherever emissions data were available and qualitative wherever
data were unavailable or time consuming to gather.
In streamlined LCAs (such as the starch study used as an illustration here), data gapsare quite common. There are two ways to overcome this. You can either use proxydata from similar overseas sources or you can rely on local qualitative information.The study used local qualitative information (from literature sources, interviews withdiscipline specialists, experts, etc) to compliment the data gaps that were recognised atthe beginning of the study and therefore were taken as a part of impact evaluation step.
10
Section 4 Life Cycle Inventory Analysis
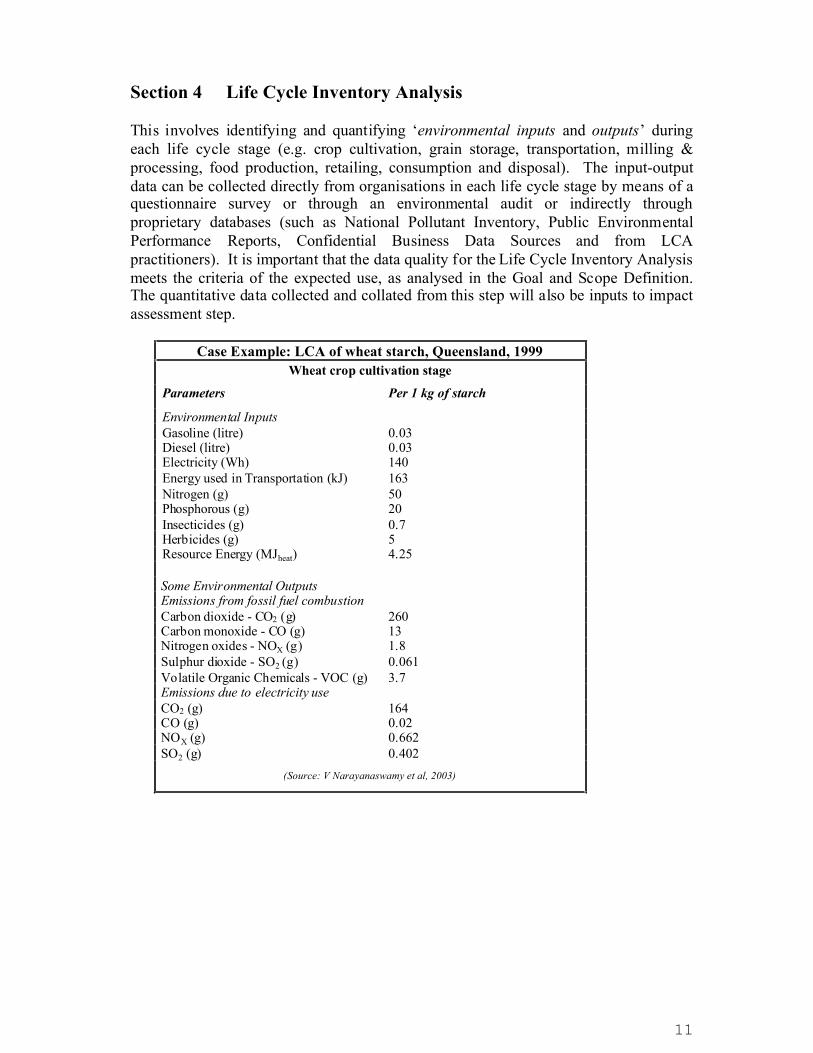
This involves identifying and quantifying �environmental inputs and outputs� during each life cycle stage (e.g. crop cultivation, grain storage, transportation, milling &processing, food production, retailing, consumption and disposal). The input-outputdata can be collected directly from organisations in each life cycle stage by means of aquestionnaire survey or through an environmental audit or indirectly throughproprietary databases (such as National Pollutant Inventory, Public EnvironmentalPerformance Reports, Confidential Business Data Sources and from LCApractitioners). It is important that the data quality for the Life Cycle Inventory Analysismeets the criteria of the expected use, as analysed in the Goal and Scope Definition.The quantitative data collected and collated from this step will also be inputs to impactassessment step.
Case Example: LCA of wheat starch, Queensland, 1999Wheat crop cultivation stage
Parameters Per 1 kg of starchEnvironmental InputsGasoline (litre) 0.03Diesel (litre) 0.03Electricity (Wh) 140Energy used in Transportation (kJ) 163Nitrogen (g) 50Phosphorous (g) 20Insecticides (g) 0.7Herbicides (g) 5Resource Energy (MJheat) 4.25
Some Environmental OutputsEmissions from fossil fuel combustionCarbon dioxide - CO2 (g) 260Carbon monoxide - CO (g) 13Nitrogen oxides - NOX (g) 1.8Sulphur dioxide - SO2 (g) 0.061Volatile Organic Chemicals - VOC (g) 3.7Emissions due to electricity useCO2 (g) 164CO (g) 0.02NOX (g) 0.662SO2 (g) 0.402
(Source: V Narayanaswamy et al, 2003)
11
A list of environmental inputs and outputs from wheat crop cultivation stage of thestarch life cycle is shown above. The inputs were directly gathered from theQueensland Grain Growers Association. The emissions due to fertilisers andpesticides application were estimated semi-quantitatively from the secondaryinformation sources such as Queensland Agforce reports, Queensland Department ofNatural Resources, Queensland Department of Primary Industries and from thejournal articles.
Each life cycle stage was approached for transportation data of products, co-productsand raw materials. The Queensland Road Transport Department was consulted on thetype and quantity of fuel consumed in the commercial heavy vehicles used.Queensland Rail was consulted on fuel consumption and other relevant details of railtransport.A literature survey was also conducted on published papers and articles for secondarydata sources on other life cycle stages. Internet resources, Environment Australia�sNational Pollutant Inventory (NPi), Australian Bureau of Agricultural and ResourceEconomics (ABARE), Queensland Agforce newsletters and articles, United StatesEnvironment Protection Agency�s (USEPA) Office of Enforcement and ComplianceAssurance (OECA) databases on emission factors and Australian Greenhouse Office�sInventory Reports were all consulted.
A data table similar to above was also constructed for other stages in the starch lifecycle. These data were used as an input to the impact assessment step.
12
Section 5 Life Cycle Impact Assessment
The resource and emissions data are assigned to the appropriated environmental impactcategories and then aggregated within each environmental impact category into a singlecategory indicator using characterisation factors the reflect the relative contribution ofeach emission to a given environmental impact category (e.g. using relative toxicity,relative global warming potential) (please see the text box on example of life cycleimpact categories). The category indicators can be based on estimated actual damageson the environment and humans such as the loss of bio-diversity, the loss of human life,the death of fish stocks, or on intermediate indicators such as the potential (maximumpossible) acidification of rivers, the release of toxins to the environment, or the releaseof greenhouse gases to atmosphere. For example, global warming potential isexpressed in kilograms of carbon dioxide equivalent. The LCA goal and the expecteduses drive the selection of impact categories for the Life Cycle Impact Assessment(LCIA), whereas the choice of an impact assessment methodology for each impactcategory is most often set by the availability of data (including causal understanding) ofenvironmental mechanisms.
The environmental impact categories can be broadly classified under:
Resource depletion and degradationHuman health impactEcosystem health impact
These three main impacts could be further subdivided for more specific impacts. Anindicative list of impact categories considered for LCA of grains is given below.
Energy and biodiversity (biological resource) loss relate to resource consumption anddepletion. Global warming impact is the result of fossil fuel use, and deals withadverse impacts on humans and ecosystem health. Human toxicity potential directlyaddresses human health issues whilst other impacts address potential adverse effects onnatural ecosystems. This step should be based on environmental science (i.e.understanding of the mechanisms involved in causing environmental impacts), but asenvironmental science is evolving, it involves value judgement. Undertaking LCIA isthe major work of, or can be embedded in LCA software, with few intermittentdiscussions and interactions with the stakeholders (owners of processes and otherrelevant research organisations).
13
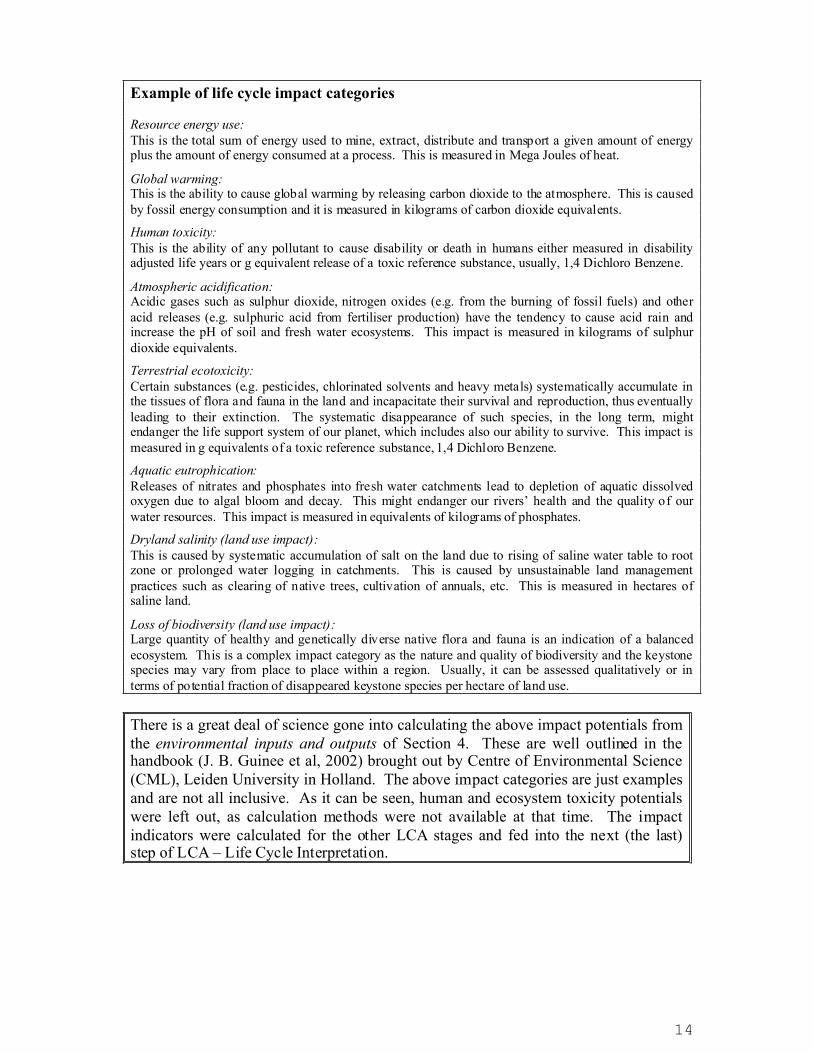
Example of life cycle impact categories
Resource energy use:This is the total sum of energy used to mine, extract, distribute and transport a given amount of energyplus the amount of energy consumed at a process. This is measured in Mega Joules of heat.Global warming:This is the ability to cause global warming by releasing carbon dioxide to the atmosphere. This is causedby fossil energy consumption and it is measured in kilograms of carbon dioxide equivalents.Human toxicity:This is the ability of any pollutant to cause disability or death in humans either measured in disabilityadjusted life years or g equivalent release of a toxic reference substance, usually, 1,4 Dichloro Benzene.Atmospheric acidification:Acidic gases such as sulphur dioxide, nitrogen oxides (e.g. from the burning of fossil fuels) and otheracid releases (e.g. sulphuric acid from fertiliser production) have the tendency to cause acid rain andincrease the pH of soil and fresh water ecosystems. This impact is measured in kilograms of sulphurdioxide equivalents.Terrestrial ecotoxicity:Certain substances (e.g. pesticides, chlorinated solvents and heavy metals) systematically accumulate inthe tissues of flora and fauna in the land and incapacitate their survival and reproduction, thus eventuallyleading to their extinction. The systematic disappearance of such species, in the long term, mightendanger the life support system of our planet, which includes also our ability to survive. This impact ismeasured in g equivalents of a toxic reference substance, 1,4 Dichloro Benzene.Aquatic eutrophication:Releases of nitrates and phosphates into fresh water catchments lead to depletion of aquatic dissolvedoxygen due to algal bloom and decay. This might endanger our rivers� health and the quality of our water resources. This impact is measured in equivalents of kilograms of phosphates.Dryland salinity (land use impact):This is caused by systematic accumulation of salt on the land due to rising of saline water table to rootzone or prolonged water logging in catchments. This is caused by unsustainable land managementpractices such as clearing of native trees, cultivation of annuals, etc. This is measured in hectares ofsaline land.Loss of biodiversity (land use impact):Large quantity of healthy and genetically diverse native flora and fauna is an indication of a balancedecosystem. This is a complex impact category as the nature and quality of biodiversity and the keystonespecies may vary from place to place within a region. Usually, it can be assessed qualitatively or interms of potential fraction of disappeared keystone species per hectare of land use.
There is a great deal of science gone into calculating the above impact potentials fromthe environmental inputs and outputs of Section 4. These are well outlined in thehandbook (J. B. Guinee et al, 2002) brought out by Centre of Environmental Science(CML), Leiden University in Holland. The above impact categories are just examplesand are not all inclusive. As it can be seen, human and ecosystem toxicity potentialswere left out, as calculation methods were not available at that time. The impactindicators were calculated for the other LCA stages and fed into the next (the last)step of LCA � Life Cycle Interpretation.
14
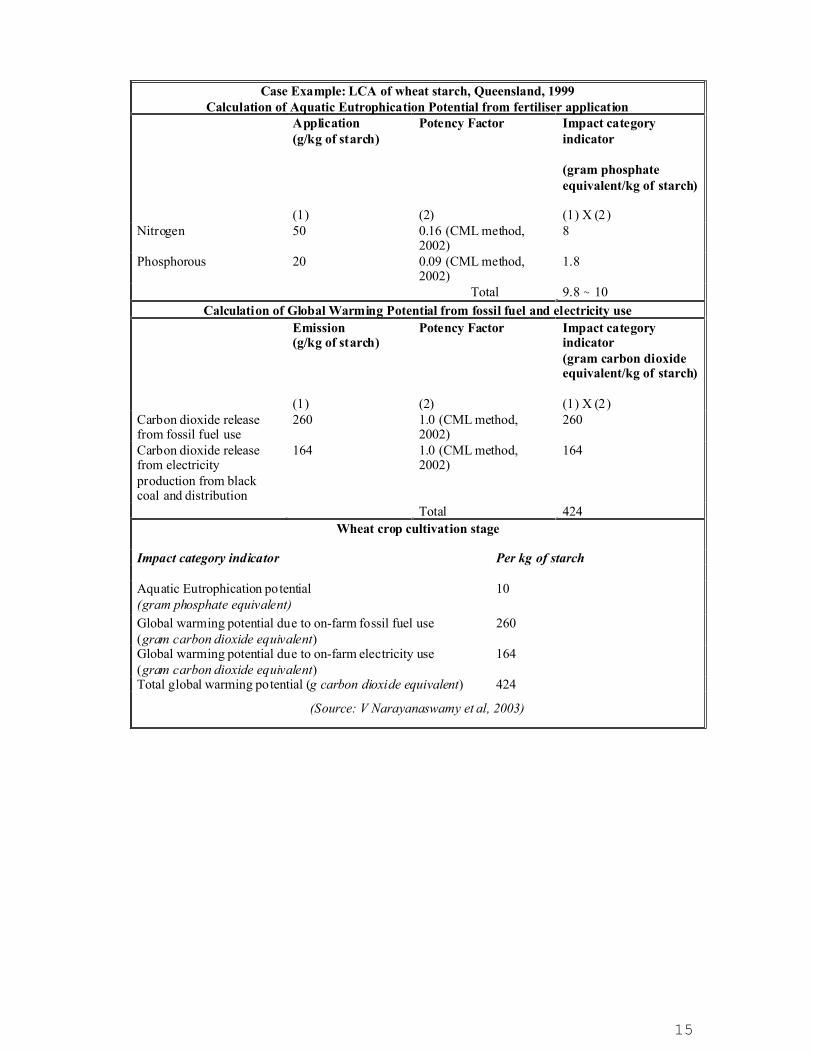
Case Example: LCA of wheat starch, Queensland, 1999Calculation of Aquatic Eutrophication Potential from fertiliser application
Application(g/kg of starch)
(1)
Potency Factor
(2)
Impact categoryindicator
(gram phosphateequivalent/kg of starch)
(1) X (2)Nitrogen 50 0.16 (CML method,
2002)8
Phosphorous 20 0.09 (CML method,2002)
1.8
Total 9.8 ~ 10Calculation of Global Warming Potential from fossil fuel and electricity use
Emission(g/kg of starch)
(1)
Potency Factor
(2)
Impact categoryindicator(gram carbon dioxideequivalent/kg of starch)
(1) X (2)Carbon dioxide releasefrom fossil fuel use
260 1.0 (CML method,2002)
260
Carbon dioxide releasefrom electricityproduction from blackcoal and distribution
164 1.0 (CML method,2002)
164
Total 424Wheat crop cultivation stage
Impact category indicator Per kg of starch
Aquatic Eutrophication potential(gram phosphate equivalent)
10
Global warming potential due to on-farm fossil fuel use(gram carbon dioxide equivalent)
260
Global warming potential due to on-farm electricity use(gram carbon dioxide equivalent)
164
Total global warming potential (g carbon dioxide equivalent) 424(Source: V Narayanaswamy et al, 2003)
15
Section 6 Life Cycle Interpretation
The objective of Life Cycle Interpretation is to arrive at valid conclusions from theresults of the LCI and LCIA. Most often, the Life Cycle Interpretation addresses atleast the relative contribution of a particular impact category or a life cycle stage to thetotal life cycle impact. To put simply, this step helps to rank the most environmentallysignificant or important life cycle stage and impact category that warrants immediatemanagement attention. This step connects the LCA findings to real world by answeringthe following questions:
What matters most in the findings and are they consistent?Are the findings robust in the light of expected use? Is the expected userealistic?Are the goals and objectives of the study met?Did the stakeholders participate meaningfully?What decisions will the results lead to by working further on them?
(Source: LCA case studies from Centre for Integrated Environmental Protection, Griffith University, 2000)
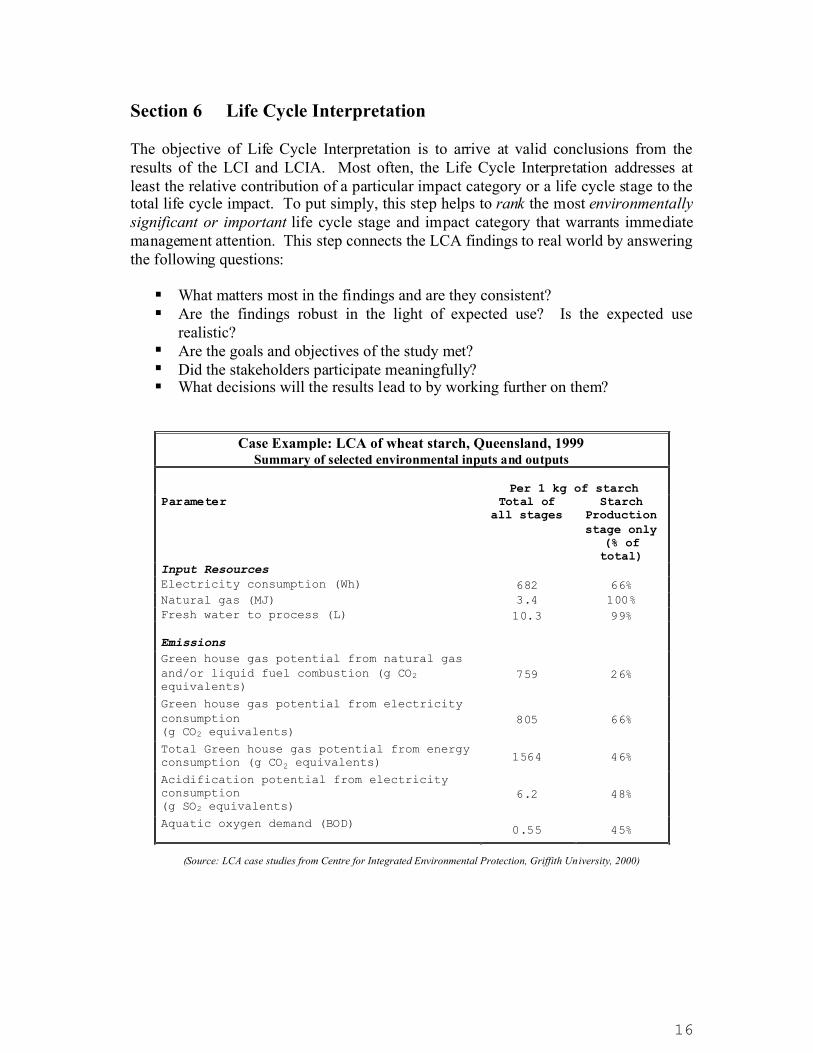
Case Example: LCA of wheat starch, Queensland, 1999Summary of selected environmental inputs and outputs
Per 1 kg of starchParameter Total of
all stagesStarch
Productionstage only
(% oftotal)
Input ResourcesElectricity consumption (Wh) 682 66%Natural gas (MJ) 3.4 100%Fresh water to process (L) 10.3 99%
EmissionsGreen house gas potential from natural gasand/or liquid fuel combustion (g CO2equivalents)
759 26%
Green house gas potential from electricityconsumption(g CO2 equivalents)
805 66%
Total Green house gas potential from energyconsumption (g CO2 equivalents) 1564 46%
Acidification potential from electricityconsumption(g SO2 equivalents)
6.2 48%
Aquatic oxygen demand (BOD) 0.55 45%
16
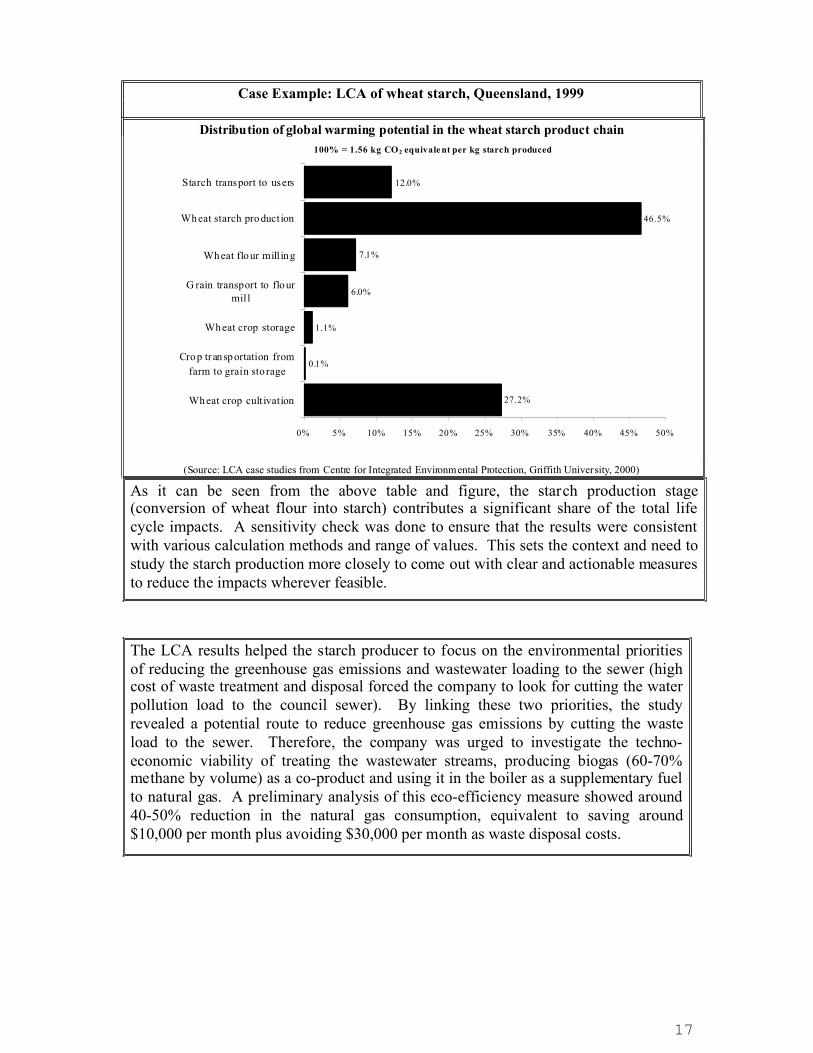
Case Example: LCA of wheat starch, Queensland, 1999
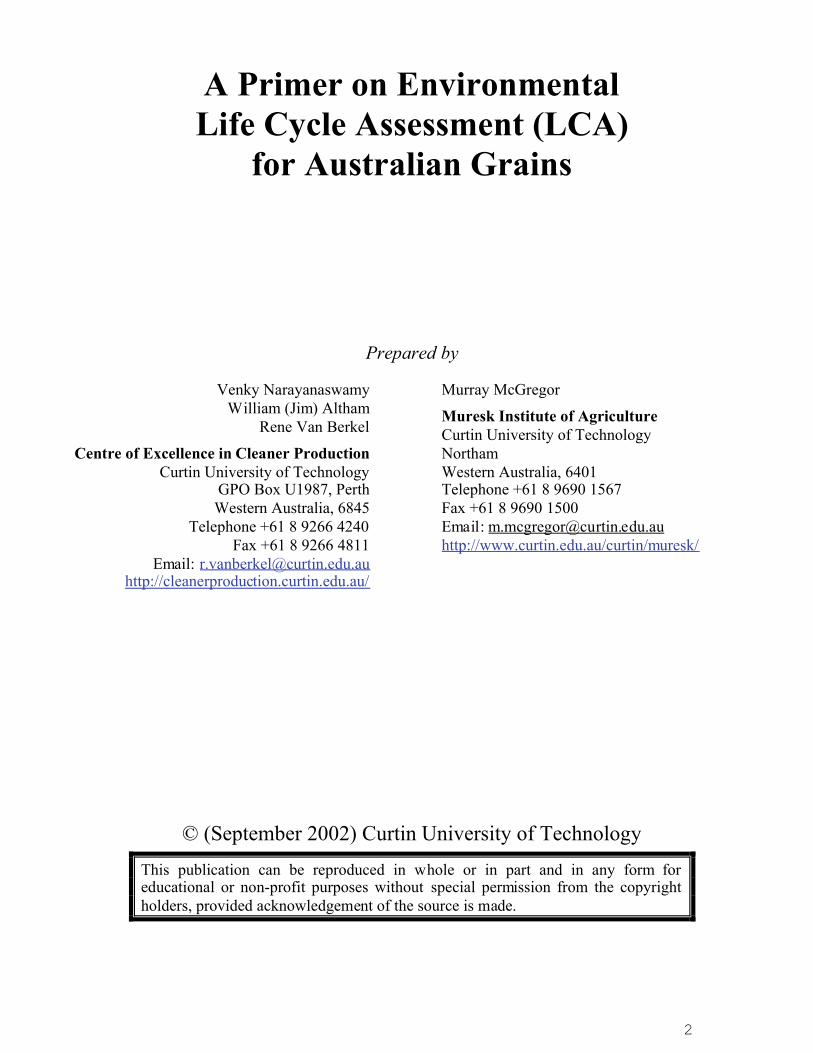
Distribution of global warming potential in the wheat starch product chain
27.2%
0.1%
1.1%
6.0%
7.1%
46.5%
12.0%
0% 5% 10% 15% 20% 25% 30% 35% 40% 45% 50%
Wheat crop cult ivation
Crop transportation fromfarm to grain sto rage
Wheat crop storage
G rain transport to flourmil l
Wheat flour mill ing
Wheat starch production
Starch transport to users
100% = 1.56 kg CO2 equivale nt per kg starch produced
(Source: LCA case studies from Centre for Integrated Environmental Protection, Griffith University, 2000)
As it can be seen from the above table and figure, the starch production stage(conversion of wheat flour into starch) contributes a significant share of the total lifecycle impacts. A sensitivity check was done to ensure that the results were consistentwith various calculation methods and range of values. This sets the context and need tostudy the starch production more closely to come out with clear and actionable measuresto reduce the impacts wherever feasible.
The LCA results helped the starch producer to focus on the environmental prioritiesof reducing the greenhouse gas emissions and wastewater loading to the sewer (highcost of waste treatment and disposal forced the company to look for cutting the waterpollution load to the council sewer). By linking these two priorities, the studyrevealed a potential route to reduce greenhouse gas emissions by cutting the wasteload to the sewer. Therefore, the company was urged to investigate the techno-economic viability of treating the wastewater streams, producing biogas (60-70%methane by volume) as a co-product and using it in the boiler as a supplementary fuelto natural gas. A preliminary analysis of this eco-efficiency measure showed around40-50% reduction in the natural gas consumption, equivalent to saving around$10,000 per month plus avoiding $30,000 per month as waste disposal costs.
17
Conclusions from the Queensland Case Example
Given the abridged nature of this LCA study and its goal of evaluating environmentalperformance, in particular energy (an related emissions) and water pollution between differentlife cycle stages, other impact categories such as toxicity and land use impacts of lifecycle stages were not investigated. However, within these limitations, following threemain conclusions could be derived from the wheat-starch case example:
Environmental life cycle assessment of wheat starch helps to track majorenvironmental �hot spots� and potential synergies.LCA approach helped to look at the environmental problems and solutions in aholistic manner by preventing the shifting of environmental burdens along theproduct�s supply chain.LCA helped to prioritise environmental issues to focus and take actions on the mostimportant and significant environmental issues along the product life cycle.
18
Section 7 Grains LCA Project
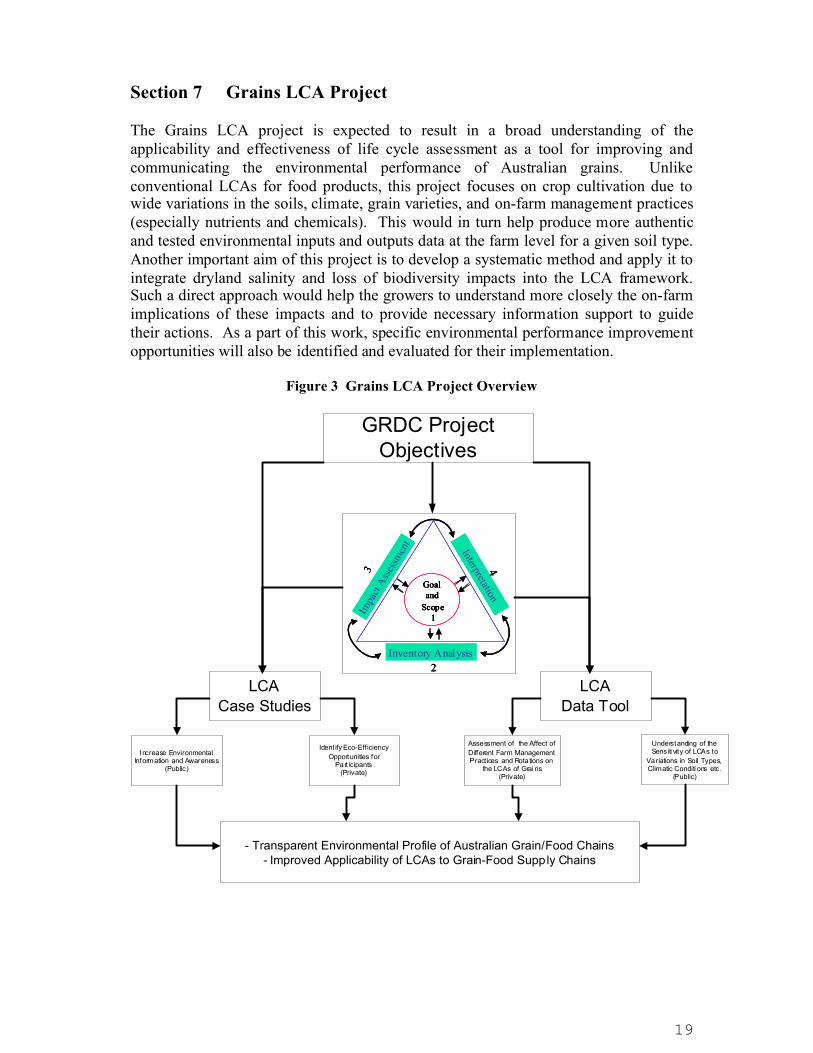
The Grains LCA project is expected to result in a broad understanding of theapplicability and effectiveness of life cycle assessment as a tool for improving andcommunicating the environmental performance of Australian grains. Unlikeconventional LCAs for food products, this project focuses on crop cultivation due towide variations in the soils, climate, grain varieties, and on-farm management practices(especially nutrients and chemicals). This would in turn help produce more authenticand tested environmental inputs and outputs data at the farm level for a given soil type.Another important aim of this project is to develop a systematic method and apply it tointegrate dryland salinity and loss of biodiversity impacts into the LCA framework.Such a direct approach would help the growers to understand more closely the on-farmimplications of these impacts and to provide necessary information support to guidetheir actions. As a part of this work, specific environmental performance improvementopportunities will also be identified and evaluated for their implementation.
Figure 3 Grains LCA Project Overview
Goaland
Scope1
Inventory Analysis2
Goaland
Scope1
Inventory Analysis2
Goaland
Scope1
Goaland
Scope1
Inventory Analysis2
GRDC ProjectObjectives
LCACase Studies
LCAData Tool
Ident ify Eco-Eff iciencyOpportunities for
Part icipants(Private)
Increase EnvironmentalInformation and Awareness
(Public)
Understanding of theSens iti vity of LCAs to
Variations in Soil Types,Climatic Conditi ons etc.
(Public)
Assessment of the Affect ofDifferent Farm ManagementPract ices and Rota tions on
the LCAs of Grai ns(Private)
- Transparent Environmental Profile of Australian Grain/Food Chains- Improved Applicability of LCAs to Grain-Food Supply Chains
19
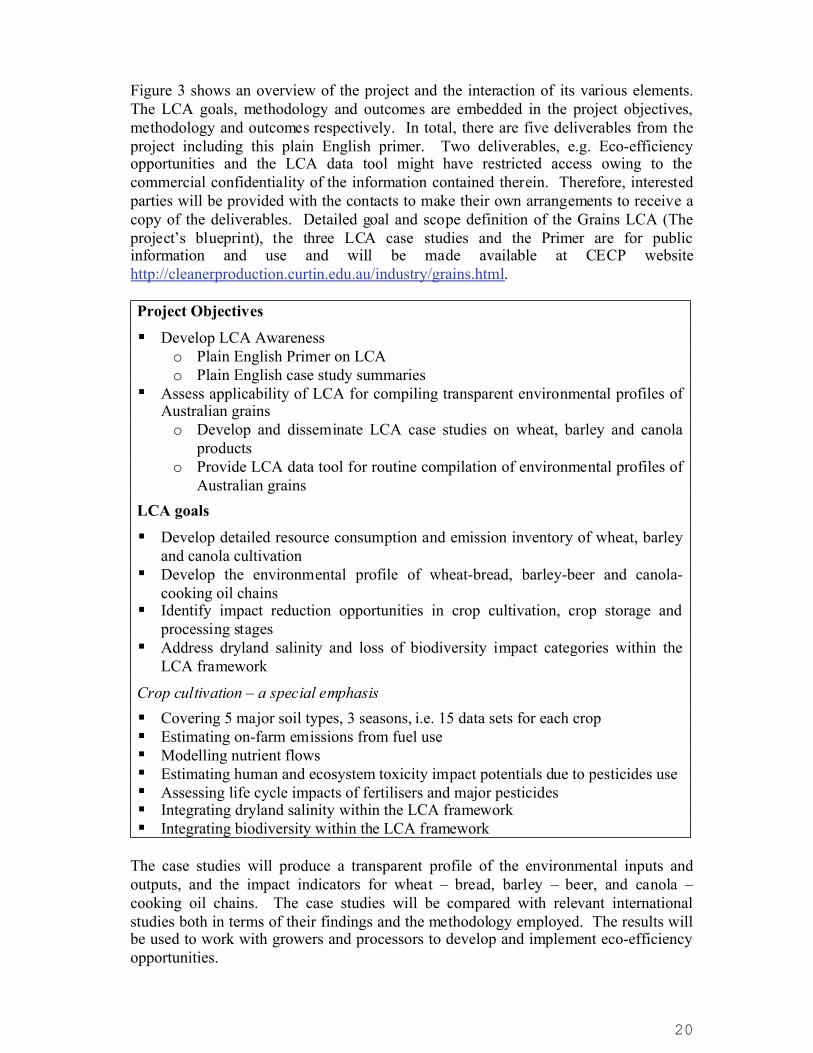
Figure 3 shows an overview of the project and the interaction of its various elements.The LCA goals, methodology and outcomes are embedded in the project objectives,methodology and outcomes respectively. In total, there are five deliverables from theproject including this plain English primer. Two deliverables, e.g. Eco-efficiencyopportunities and the LCA data tool might have restricted access owing to thecommercial confidentiality of the information contained therein. Therefore, interestedparties will be provided with the contacts to make their own arrangements to receive acopy of the deliverables. Detailed goal and scope definition of the Grains LCA (Theproject�s blueprint), the three LCA case studies and the Primer are for publicinformation and use and will be made available at CECP websitehttp://cleanerproduction.curtin.edu.au/industry/grains.html.
Project ObjectivesDevelop LCA Awarenesso Plain English Primer on LCAo Plain English case study summaries
Assess applicability of LCA for compiling transparent environmental profiles ofAustralian grainso Develop and disseminate LCA case studies on wheat, barley and canola
productso Provide LCA data tool for routine compilation of environmental profiles of
Australian grainsLCA goals
Develop detailed resource consumption and emission inventory of wheat, barleyand canola cultivationDevelop the environmental profile of wheat-bread, barley-beer and canola-cooking oil chainsIdentify impact reduction opportunities in crop cultivation, crop storage andprocessing stagesAddress dryland salinity and loss of biodiversity impact categories within theLCA framework
Crop cultivation � a special emphasis Covering 5 major soil types, 3 seasons, i.e. 15 data sets for each cropEstimating on-farm emissions from fuel useModelling nutrient flowsEstimating human and ecosystem toxicity impact potentials due to pesticides useAssessing life cycle impacts of fertilisers and major pesticidesIntegrating dryland salinity within the LCA frameworkIntegrating biodiversity within the LCA framework
The case studies will produce a transparent profile of the environmental inputs andoutputs, and the impact indicators for wheat � bread, barley � beer, and canola � cooking oil chains. The case studies will be compared with relevant internationalstudies both in terms of their findings and the methodology employed. The results willbe used to work with growers and processors to develop and implement eco-efficiencyopportunities.
20
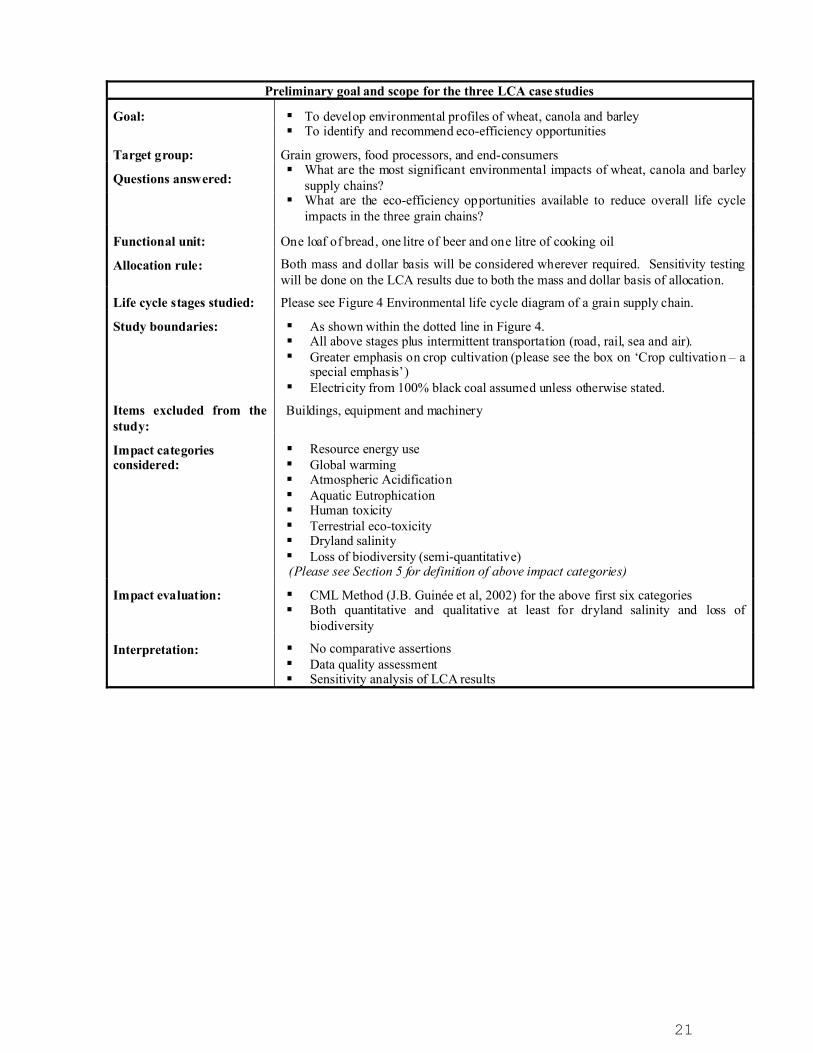
Preliminary goal and scope for the three LCA case studies
Goal: To develop environmental profiles of wheat, canola and barleyTo identify and recommend eco-efficiency opportunities
Target group: Grain growers, food processors, and end-consumersQuestions answered: What are the most significant environmental impacts of wheat, canola and barley
supply chains?What are the eco-efficiency opportunities available to reduce overall life cycleimpacts in the three grain chains?
Functional unit: One loaf of bread, one litre of beer and one litre of cooking oilAllocation rule: Both mass and dollar basis will be considered wherever required. Sensitivity testing
will be done on the LCA results due to both the mass and dollar basis of allocation.Life cycle stages studied: Please see Figure 4 Environmental life cycle diagram of a grain supply chain.Study boundaries: As shown within the dotted line in Figure 4.
All above stages plus intermittent transportation (road, rail, sea and air).Greater emphasis on crop cultivation (please see the box on �Crop cultivation � aspecial emphasis�)Electricity from 100% black coal assumed unless otherwise stated.
Items excluded from thestudy:
Buildings, equipment and machinery
Impact categoriesconsidered:
Resource energy useGlobal warmingAtmospheric AcidificationAquatic EutrophicationHuman toxicityTerrestrial eco-toxicityDryland salinityLoss of biodiversity (semi-quantitative)
(Please see Section 5 for definition of above impact categories)Impact evaluation: CML Method (J.B. Guinée et al, 2002) for the above first six categories
Both quantitative and qualitative at least for dryland salinity and loss ofbiodiversity
Interpretation: No comparative assertionsData quality assessmentSensitivity analysis of LCA results
21

Design parameters for the LCA data tool (�Paddock-to-Port�)
Goal: To provide an environmental information toolTo provide awareness on sensitivity of environmental profile for farmingpractices
User: Grain growersQuestions answered: What are the environmental outputs given the environmental inputs?Functional unit: One tonne of grainAllocation rule: Mass basis will be considered wherever required.Life cycle stagesstudied:
Background stagesMining and extraction of fertiliser inputsFertiliser production and transportation to farmMining and extraction of material inputs to chemicals productionChemicals production, formulation and transportation to farm
Foreground stageCrop cultivation and on-farm transportation
Background stagesCrop transportation from farm to grain storageCrop storageGrain transportation to port
(Please see Figure 4 Environmental life cycle diagram of a grain supply chain)Items excluded fromthe study:
Buildings, equipment and machinery
Environmentalinputs:
Crop rotation Soil type, land, etc.Average annual rainfall FertiliserHerbicide InsecticideFumigant Gasoline, diesel, natural gas,
etc.Electricity AuxiliariesWater
Environmentaloutputs:
Resource energy use Global warmingAtmospheric Acidification Aquatic EutrophicationHuman toxicity Terrestrial eco-toxicityDryland salinity Loss of biodiversity (semi-
quantitative)(Please see Section 5 for definition of above impact categories)
Impact evaluation: CML Method (J.B. Guinée et al, 2002) for the above first six categoriesBoth quantitative and qualitative for dryland salinity and loss ofbiodiversity
Interpretation: No comparative assertionsData quality assessmentSensitivity analysis of environmental outputs
Data platform: PC based Spreadsheet (Windows Excel) software
The experience and the data gained in collecting and assembling life cycle profile forthe three case studies will guide the development of the Grains Environmental DataTool. An inventory will be made of readily available grains production data (bothstatistical sources and farm level information systems) and this will be compared with
22
the information needs for conducting LCA. A zero release version of the GrainsEnvironmental Data Tool will then be developed (comprising of a set of PCspreadsheets). The Data Tool will then be used to generate a series of environmentalprofiles for different production locations and seasons for canola, wheat and barley.The calculated profiles will be compared so as to assess how production and seasonalfactors affect the environmental profiles of canola, wheat and barley, and how the DataTool can be used to provide transparent life cycle environmental information toconsumers of Australian grains.
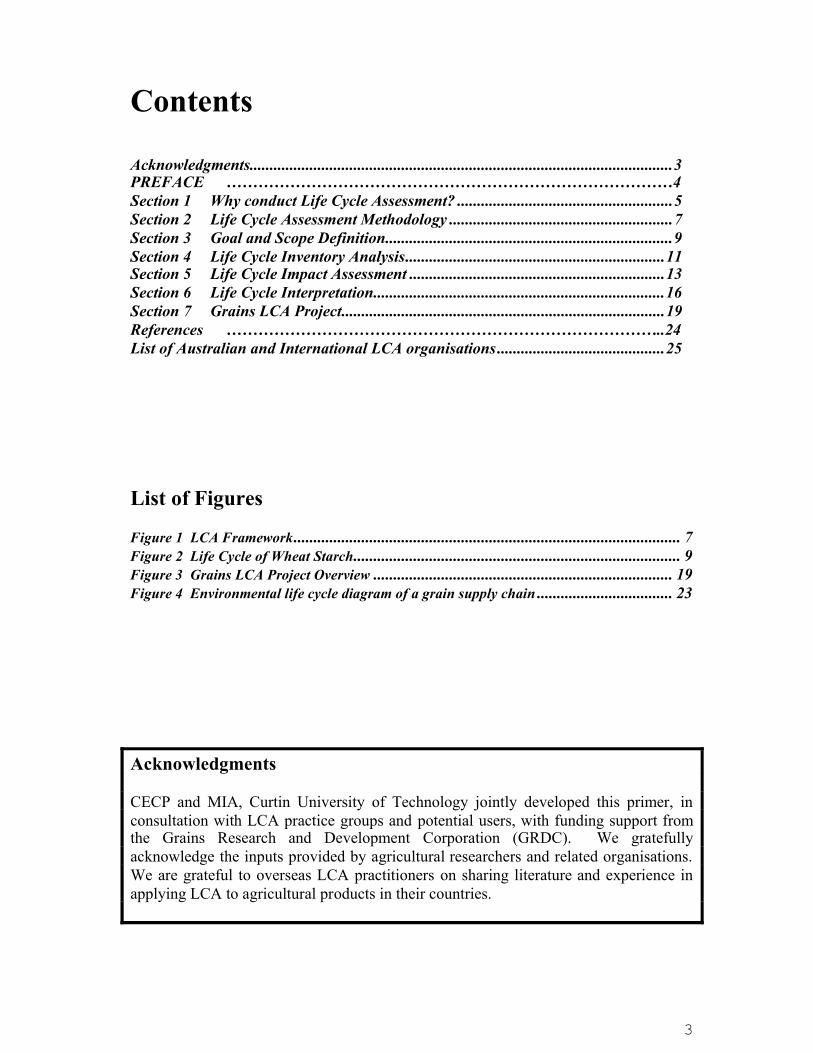
Figure 4 Environmental life cycle diagram of a grain supply chain
CropCultiv ation
Crop Storage
Bread or Beer or OilProduction
R etail Outlet
Expired Food andPackaging D isposal
Pakaging
Material Resources
Energy Resources
Emissions to Air
Emissions to Water
Emissions to Land
Consumpt ion Phase
T
T
T
T
T
Land Resources
Mining and Extraction
Fertiliser product ion
T
T - Transportation Sub-system
- Background Process
- Foreground Process
Shipped Overseas
T
Chemicals productionand formulation
T T
T
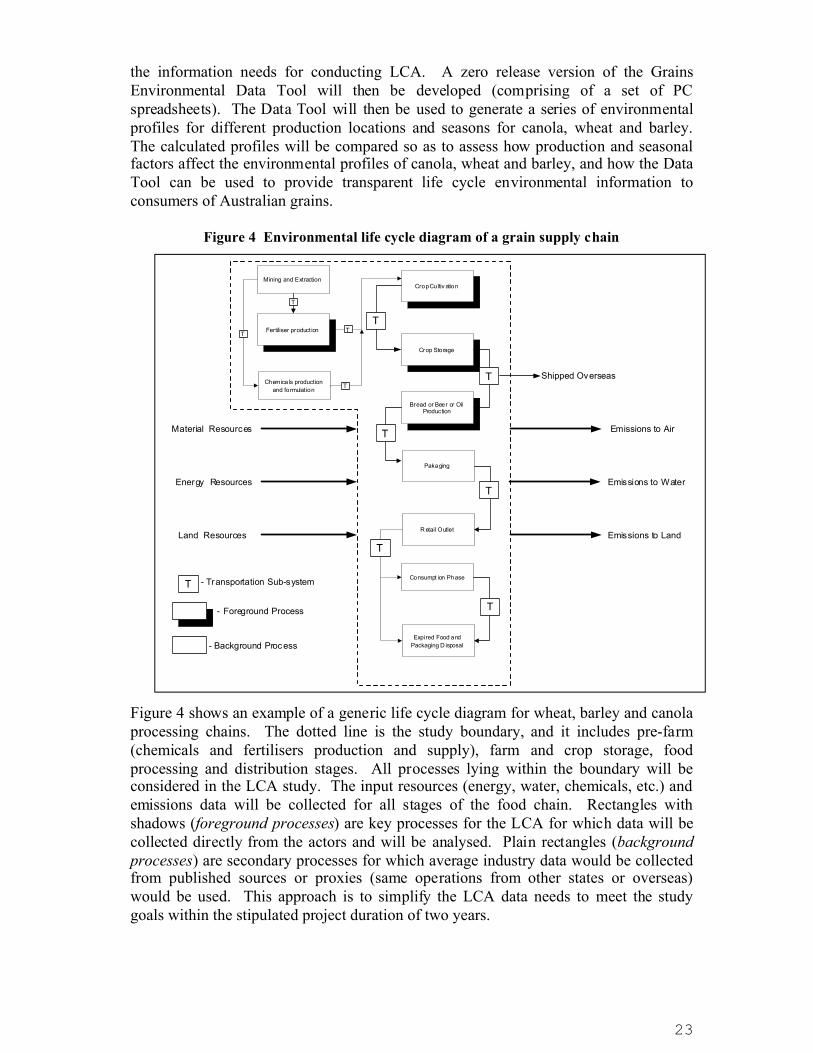
Figure 4 shows an example of a generic life cycle diagram for wheat, barley and canolaprocessing chains. The dotted line is the study boundary, and it includes pre-farm(chemicals and fertilisers production and supply), farm and crop storage, foodprocessing and distribution stages. All processes lying within the boundary will beconsidered in the LCA study. The input resources (energy, water, chemicals, etc.) andemissions data will be collected for all stages of the food chain. Rectangles withshadows (foreground processes) are key processes for the LCA for which data will becollected directly from the actors and will be analysed. Plain rectangles (backgroundprocesses) are secondary processes for which average industry data would be collectedfrom published sources or proxies (same operations from other states or overseas)would be used. This approach is to simplify the LCA data needs to meet the studygoals within the stipulated project duration of two years.
23
References
J.B. Guinée, M. Gorrée, R. Heijungs, G. Huppes, R. Kleijn, A. de Koning, L. van Oers,A. Wegener Sleeswijk, S. Suh, H.A. Udo de Haes, H. de Bruijn, R. van Duin, M.A.J.Huijbregts, Handbook on Life Cycle Assessment: Operational Guide to the ISOStandards. Kluwer Academic Publishers, Dordrecht, May 2002, xii + 704 pp.
Sven Lundie, Andrew Feitz, Michael Jones, Mark Morain, and Gary Dennie, 1999-2001, Life Cycle Assessment of the Australian Dairy Processing Industry, funded byDairy Research and Development Corporation, Centre for Water and WasteTechnology, University of New South Wales, Sydney.
V. Narayanaswamy, J. Ness, J.A. Scott and M. Lochhead, 2002, Resource flow andproduct chain analysis as practical tools to promote cleaner production initiatives,Journal of Cleaner Production, Vol. 11, No. 4, March 2003 (in press).
Marguerite Renouf, 1999, Environmental impact analysis of sugar production � a whole-of-life approach, University of Queensland, and Identifying environmentalpriority areas in meat production using LCA, United Nations Environment Programmefunded research on food industries, University of Queensland, Brisbane.
J.A. Scott, Jim Ness and Venky Narayanaswamy, 1999, Resource flow and rapid LCAof milk products, Dairy Farmers � Malanda and Queensland EPA funded research,Griffith University, Brisbane.
Malcolm Wegener, 1996, Environmental systems approach to impact analyses of dairy,poultry and pig farms, Department of Primary Industries funded research, University ofQueensland, Brisbane.
24
25
List of Australian and International LCA organisations
Tim GrantLCA Project ManagerCentre for Design at RMITRMIT UniversityGPO Box 2476V, Melbourne Vic 3001AustraliaTel: 03 9925 2362; Fax: 03 9639 3412; Email: [email protected]://www.cfd.rmit.edu.au
Sven LundieLCA Project LeaderCentre for Water and Waste Technology/CRC WMPCTel: 02 9385 5097; Fax: 02 9313 8624Email: [email protected]://www.civeng.unsw.edu.au/cwwt/index.html
Konrad SauerSociety of Environmental Toxicology and Chemistry (SETAC), Europe OfficeAv. de la Toison d'Or 67B-1060 BrusselsBelgiumTel: 32 2 772 72 81; Fax: 32 2 770 53 86, e-mail: [email protected]://www.setaceu.org
Rene Van BerkelCentre of Excellence in Cleaner ProductionCurtin University of TechnologyGPO Box U1987, Perth, WA 6845Tel: 08 9266 4240; Fax: 08 9266 4811Email: [email protected]://cleanerproduction.curtin.edu.au
Anneke Wegener SleeswijkCentre for Environmental Studies, Leiden University,P.O. Box 9518, 2300 RA Leiden, The Netherlands.Tel: +31 71 5275640; Fax: +31 71 5277434Email: [email protected]://www.leidenuniv.nl