Embed Size (px)
Citation preview

Western Michigan University Western Michigan University
ScholarWorks at WMU ScholarWorks at WMU
Dissertations Graduate College
4-1997
A Systems Approach to Performance Quality: An Application to A Systems Approach to Performance Quality: An Application to
Higher Education Higher Education
Tobias LaFleur Western Michigan University
Follow this and additional works at: https://scholarworks.wmich.edu/dissertations
Part of the Higher Education Commons, and the Industrial and Organizational Psychology Commons
Recommended Citation Recommended Citation LaFleur, Tobias, "A Systems Approach to Performance Quality: An Application to Higher Education" (1997). Dissertations. 1668. https://scholarworks.wmich.edu/dissertations/1668
This Dissertation-Open Access is brought to you for free and open access by the Graduate College at ScholarWorks at WMU. It has been accepted for inclusion in Dissertations by an authorized administrator of ScholarWorks at WMU. For more information, please contact [email protected].

A SYSTEMS APPROACH TO PERFORMANCE QUALITY:AN APPLICATION TO HIGHER EDUCATION
by
Tobias LaFleur
A Dissertation Submitted to the
Faculty of The Graduate College in partial fulfillment of the
requirements for the Degree of Doctor of Philosophy
Department of Psychology
Western Michigan University Kalamazoo, Michigan
April 1997
Reproduced with permission of the copyright owner. Further reproduction prohibited without permission.

A SYSTEMS APPROACH TO PERFORMANCE QUALITY:AN APPLICATION TO HIGHER EDUCATION
Tobias LaFleur, Ph.D.
Western Michigan University, 1997
Graduate-student teaching apprentices (TAs) in the psychology department
at a university in Michigan conducted seminars in an advanced undergraduate-level
psychology course. All were members of the department’s behavior analysis training
system (BATS). BATS was an integrated series of courses and practicum
experiences designed to achieve three main goals: recruiting, training, and
maintaining the skills of competent behavior analysts. Twenty-five different tasks
performed by the TAs were analyzed and measured prior to an intervention aimed at
their improvement. Informal observation suggested that failure to complete these
tasks reduced BATS’ ability to meet its larger goals. Three well-known systems
analysis models were applied, to differing degrees, in an effort to understand BATS
as a system: Rummler and Brache’s (1990) systems view to three levels of
performance, Gilbert’s (1978) behavior engineering model, and W. E. Deming’s
(1986) Total Quality Management (TQM) model. The application o f these models to
BATS was the first of its kind.
Two intervention packages were designed to enhance the reliability of TAs
conducting the seminars and completing out-of-class assignments. These packages
were also compared across semesters. In the first semester, the implementation of a
combination of task checklists and face-to-face supervisor feedback was associated
with statistically significant improvements in seminar and out-of-class performance of
Reproduced with permission of the copyright owner. Further reproduction prohibited without permission.

the TAs.
These levels of improved performance were maintained during the second
semester, with different tasks, when electronic-mail feedback was substituted for
face-to-face feedback.
In addition, two intervention packages were designed to increase the number
of learn units (question-answer-feedback sequences) completed by TAs. In the first
semester, face-to-face supervisor feedback had no statistically significant effect on the
frequency of learn units the TAs completed in the seminars during the first semester.
However, during the second semester, videotape feedback added to the face-
to-face supervisor feedback was associated with a statistically significant increase in
the frequency of learn units.
Reproduced with permission of the copyright owner. Further reproduction prohibited without permission.
INFORMATION TO USERS
This manuscript has been reproduced from the microfilm master. UMI
films the text directly from the original or copy submitted. Thus, some
thesis and dissertation copies are in typewriter face, while others may be
from any type of computer printer.
The quality of this reproduction is dependent upon the quality of the
copy submitted. Broken or indistinct print, colored or poor quality
illustrations and photographs, print bleedthrough, substandard margins,
and improper alignment can adversely affect reproduction.
In the unlikely event that the author did not send UMI a complete
manuscript and there are missing pages, these will be noted. Also, if
unauthorized copyright material had to be removed, a note will indicate
the deletion.
Oversize materials (e.g., maps, drawings, charts) are reproduced by
sectioning the original, beginning at the upper left-hand comer and
continuing from left to right in equal sections with small overlaps. Each
original is also photographed in one exposure and is included in reduced
form at the back of the book.
Photographs included in the original manuscript have been reproduced
xerographically in this copy. Higher quality 6” x 9” black and white
photographic prints are available for any photographs or illustrations
appearing in this copy for an additional charge. Contact UMI directly to
order.
UMIA Bell & Howell Information Company
300 North Zeeb Road, Ann Arbor MI 48106-1346 USA 313/761-4700 800/521-0600
Reproduced with permission of the copyright owner. Further reproduction prohibited without permission.

Reproduced with permission of the copyright owner. Further reproduction prohibited without permission.

UMI Number: 9724504
UMI Microform 9724504 Copyright 1997, by UMI Company. All rights reserved.
This microform edition is protected against unauthorized copying under Title 17, United States Code.
UMI300 North Zeeb Road Ann Arbor, MI 48103
Reproduced with permission of the copyright owner. Further reproduction prohibited without permission.

Copyright by Tobias LaFleur
1997
Reproduced with permission of the copyright owner. Further reproduction prohibited without permission.

ACKNOWLEDGMENTS
I deeply appreciate the advice and assistance I have received from Dr.
Richard Malott during the dissertation process and throughout my graduate studies.
His behavioral expertise and patience were invaluable. A very special thanks goes to
Dr. Brethower and Dr. Michael for helping to shape my behavioral repertoire these
past three years. In addition, I would like to thank Dr. Paul Selden for his invaluable
assistance in the dissertation process. I would like to thank Anne Banfield and
Samantha Picard for their contributions as research assistants. I would also like to
acknowledge the assistance given to me by my good friend Matthew Miller. Finally, I
would like to offer thanks to my family and my good friends Russell Bell and Lea
Limcaco for their encouragement and support and a special thanks to Mom and
Lance for making the defense so memorable.
Tobias LaFleur
ii
Reproduced with permission of the copyright owner. Further reproduction prohibited without permission.

TABLE OF CONTENTS
ACKNOWLEDGMENTS.................................................................................... ii
LIST OF TABLES ............................................................................................... vii
LIST OF FIGURES............................................................................................... viii
CHAPTER
I. A SYSTEMS APPROACH TO HIGHER EDUCATION.......................... 1
Introduction.......................................................................................... 1
Total Quality Management M odel...................................................... 3
Systems................................................................................................. 5
Rummler and Brache Model ............................................................... 5
Organizational Level..................................................................... 5
Process L evel................................................................................ 6
Job/Performer Level..................................................................... 6
Behavioral Engineering M odel............................................................. 7
Behavior Analysis Training System .................................................... 8
Systems Analysis of BATS ................................................................. 9
Techniques for Improving Performance.............................................. 18
Task Checklists ............................................................................ 18
Performance Feedback................................................................. 19
System L evels...................................................................................... 20
H. PERFORMANCE MANAGEMENT SYSTEM 1: METHOD ................. 22
Participants.......................................................................................... 22
Reproduced with permission of the copyright owner. Further reproduction prohibited without permission.

Table o f Contents—Continued
CHAPTER
Design and Procedure............................................................................ 22
Organizational-Level Intervention................................................... 24
Process-Level Intervention............................................................. 25
Job/Performer-Level Intervention................................................... 28
m . PERFORMANCE MANAGEMENT SYSTEM 1:RESULTS AND DISCUSSION................................................................... 32
Interobserver Agreement........................................................................ 38
IV. PERFORMANCE MANAGEMENT SYSTEM 2: CONTINUATIONOF SYSTEM IMPROVEMENTS ............................................................... 40
Introduction............................................................................................. 40
E-mail Feedback.............................................................................. 41
Videotaped Feedback...................................................................... 42
Videotaping Methods and Teaching....................................................... 43
Videotaped Feedback and Microteaching...................................... 43
Videotaped Feedback and Self-Assessment.................................... 44
Videotaped Feedback and Discrimination Training....................... 45
Videotaped Feedback and Supervisory Feedback ......................... 46
V. PERFORMANCE MANAGEMENT SYSTEM 2 : METHOD................... 48
Participants............................................................................................ 48
Design and Procedure ............................................................................ 48
VI. PERFORMANCE MANAGEMENT SYSTEM 2:RESULTS AND DISCUSSION................................................................... 52
Interobserver Agreement........................................................................ 58
iv
Reproduced with permission of the copyright owner. Further reproduction prohibited without permission.

Table o f Contents—Continued
CHAPTER
v n . GENERAL CONCLUSIONS..................................................................... 60
Job/Performer Level Summary............................................................. 62
Seminar and Out-of-Class Performance ...................................... 62
Learn Units .................................................................................. 68
Process-Level Summary....................................................................... 70
Researcher Recruitment............................................................... 70
Organizational-Level Summary........................................................... 70
Undergraduate Performance......................................................... 71
Undergraduate Evaluations........................................................... 72
Course Material Errors................................................................. 72
System Disconnects..................................................................... 73
Recommendations ....................................................................... 74
APPENDICES
A. Behavioral Engineering Model ................................................................... 77
B. Behavioral Checklist................................................................................... 79
C. 10-Question Definition Test ....................................................................... 81
D. 50-Question Multiple-Choice Test ............................................................. 83
E. 13-Question Short-Answer Conceptual T e s t.............................................. 90
F. Evaluation Psy. 460 ................................................................................... 94
G. Protocol Clearance From the Human SubjectsInstitutional Review B o a rd ......................................................................... 96
H Conducting Behavior Analysis Researchand Development Projects.......................................................................... 98
v
Reproduced with permission of the copyright owner. Further reproduction prohibited without permission.

BIBLIOGRAPHY
Table o f Contents—Continued
vi
Reproduced with permission of the copyright owner. Further reproduction prohibited without permission.

LIST OF TABLES
1. Denning's 14 Points for Management........................................................... 4
2. Performance Problems in BATS and Potential Solutions............................ 17
3. System Problems and Proposed Interventions for B A T S............................ 18
4. System Problems and Measures for BATS ................................................. 24
5. Performance Management System 1: Range and MeanPerformance Rating Under Each Condition................................................. 33
6. Performance Management System 1: Student Performance....................... 37
7. Performance Management System 1: Students’Academic/Career P lans................................................................................ 38
8. Performance Management System 2: Range and MeanPerformance Rating Under Each Condition................................................. 53
9. Performance Management System 2: Student Performance....................... 56
10. Performance Management System 2: Students'Academic/Career P lans................................................................................ 57
vii
Reproduced with permission of the copyright owner. Further reproduction prohibited without permission.

LIST OF FIGURES
1. Total Performance System Diagram for BATS............................................ 10
2. “Should” Process Map of the Recruiting Process in Psy. 460...................... 27
3. A Comparison o f the Number of Course Material ErrorsAcross Semesters........................................................................................... 35
4. Performance Management System 2: Learn UnitsCompleted per Hour...................................................................................... 54
Reproduced with permission of the copyright owner. Further reproduction prohibited without permission.

CHAPTER I
A SYSTEMS APPROACH TO HIGHER EDUCATION
Introduction
America’s schools are now laboring to ready themselves for the year 2000
under both the reform initiatives of the 1980s and the accountability requirements of
the current decade. The reform initiatives recommended, among other things, that
both proficiency standards and accountability for college training programs be
increased. In the early 1990s, President George Bush called this the decade of
accountability. Both initiatives came in response to an increased awareness that this
country is not only falling out of the lead but rapidly falling behind other countries in
educational standards (March, Peters, Schwartz, & Crisci, 1993). The static picture
in terms of high rates of illiteracy, high drop-out rates, and lower standardized
achievement-test scores as compared to other industrialized nations has been a
problem for our nation for some time (Pennypacker, 1994). Pennypacker describes
how numerous commissions have been formed and billions of dollars have been spent
in an effort to produce change with little resulting effects.
While student performance in this country is falling below educational
standards, teacher performance also has significant room for improvement (Aquino,
1975; Gamble, 1976). Gamble submits that many Ph.D. programs emphasize research
and the scientific method while rarely providing candidates with instruction that will
allow them to effectively teach. Aquino (1975) suggests that there is relatively little
1
Reproduced with permission of the copyright owner. Further reproduction prohibited without permission.

2research devoted to training college-level teachers, resulting in an excess of teachers
insufficiently trained to teach.
Jackniclce and Samiroden (1990) interviewed student teachers who felt that
the separation of theory and practice was unproductive and did not adequately
prepare them to effectively teach. Borko, Eisenhart, Underhill, Brown, Jones, and
Agard (1991) found that teacher educators oversimplify the reality of student
teaching and disregard many of the social and pedagogical variables that can affect a
novice’s instructional decisions. Bullough (1990) found that the overemphasis on
rating performances also results in an oversimplification of the process of teaching.
Kagen (1992) studied 40 leaming-to-teach research studies published
between 1987 and 1991 and found that preservice programs generally fail to provide
the novice with adequate knowledge of classroom procedures and student behaviors;
nor did programs provide sufficient classroom experiences.
The decline in the competency level of our teachers and students also
increases the likelihood that our schools will continue to fall behind both national and
international educational standards. Pennypacker (1994) suggests that the
documented failure of our educational system to produce sufficient numbers of
skilled workers has put our industries at a competitive disadvantage in the
international marketplace. In addition, many organizations are becoming caught in a
so-called incompetence trap (Brethower, 1993a, 1993b). Incompetence traps are
defined by three factors:
1. An increase in global competition coupled with an increase in demand for
quality has created a need for competent people in the workplace.
2. The increased competition and need for quality sometimes requires
expensive and complex work processes and equipment.
Reproduced with permission of the copyright owner. Further reproduction prohibited without permission.

3. At the same time, entry-level workers are increasingly deficient in basic
reading and computing skills as well as basic work habits (Lambert, 1989). As a
result, many managers are forced to deal with the decline in competence as well as
cost increases. Clearly, an important step toward improving this situation would be to
improve the quality of our educational system.
Total Quality Management Model
The Total Quality Management (TQM) is one well-known systems-analysis
model that is applied to understand and improve the quality of systems performance
(Deming, 1986). This philosophy is based upon Deming’s 14 points for management:
1. Create constancy of purpose for improvement of product or service.
2. Adopt the new philosophy.
3. Cease dependence on mass inspection.
4. End the practice of awarding business on the basis of price tag alone.
5. Improve constantly and forever the system of production and service.
6. Institute training.
7. Adopt and institute leadership.
8. Drive out fear.
9. Break down barriers between staff areas.
10. Eliminate slogans, exhortations, and targets for the workforce.
11. Eliminate numerical quotas for the workforce.
12. Remove barriers that rob people of pride of workmanship.
13. Encourage education and self-improvement for everyone.
14. Take action to accomplish the transformation.
Reproduced with permission of the copyright owner. Further reproduction prohibited without permission.

4
For example, the first point stresses the need for constancy of purpose and
one method of creating this purpose is by developing a mission statement. The fifth
point stresses the importance of continuous improvement of the system and TQM is a
model that facilitates quality improvements. The 14th point suggests one take action
to accomplish transformation. Manley and Manley (1996) state that this can be
accomplished by using the plan-do-check-act cycle. This cycle involves four steps:
(1) studying a process and deciding how to improve it, (2) developing and
implementing the intervention, (3) observing the effects of the intervention, and
(4) acting on the difference between the original intent and the actual outcome.
Manley and Manley (1996) state that Deming’s philosophy is finding its way
into education today. For example, this focus on the quality of education is embraced
by the Conroe Independent School District in Texas (Sharpies, Slusher, & Swaim,
1996). These authors describe how this district is attempting to optimize the
performance of all units that operate within its school system. The transformation
involves four phases: (1) a commitment phase, (2) an education and training phase,
(3) an application and practice phase, and (4) a standardization and recognition
phase. The first phase involves a strategic planning process, implementation planning
process, participation by cabinet members, presentation of a TQM plan to the board,
and adoption of the plan. The second phase involves TQM content and process
training. The third phase involves the formulation of teams (e.g., high school
department, instruction department, human resources). The last phase utilized TQM
coaches, or internal trainers, to provide support on an ongoing basis and to mentor
collegues. At the end of the year, all teams were able to document and present
reports of their projects accomplishments. Some of the improvements included a new
process to evaluate and serve students with significant gaps in reading performance, a
Reproduced with permission of the copyright owner. Further reproduction prohibited without permission.

50% reduction in the error rate of the state-reported special education data for state
funding, and the development and standardization of team meeting procedures.
Systems
The interconnecting relationships between students, faculty, and college deans
highlight the importance of examining the entire educational system. Morasky (1982)
describes systems as organizations that are dependent upon either a critical behavioral
component or performance within the organization to function. Cleary (1996)
suggests that the components and the processes within each component of quality
education systems must contribute to the overall mission of such systems.
Rummler and Brache Model
Likewise, Rummler and Brache (1990) state that the degree to which a
system effectively develops, produces, and/or delivers valued goods or services is the
result of the effectiveness of the various component parts at the three levels of
performance: (1) organizational level, (2) process level, and (3) individual level, and,
the extent to which these three levels act together as an integrated whole. It is
important to understand how a system’s internal and external ecosystem are
connected in order to improve both organizational and individual performance and
Rummler and Brache’s (1990) systems view to three levels of performance is a
second model used to understand and improve the quality of systems performance.
Organizational Level
According to Rummler and Brache (1990), when we first examine an
organization from a macro-systems point of view, we look at the variables at the
Reproduced with permission of the copyright owner. Further reproduction prohibited without permission.

6organizational level. This level contains the various functions that interact to form the
basic structure of the organization, such as: organization-wide goals and measures,
strategies, and the deployment of resources. Crowell and Anderson (1983) state that
behavior management programs must contribute to the organizational mission to be
considered socially valid and scientifically significant. Therefore, we should first
examine the organization level.
Process Level
The next level of performance that Rummler and Brache (1990) examine is
the process level. Melan (1992) describes processes as groups of interrelated work
activities that transform inputs into outputs of greater value. He suggests that this is
the main purpose of a productive process. Rummler and Brache (1990) suggest that
in order for an organization to fulfill its goals, the process outputs should meet the
needs of its customers; the processes themselves should be efficient, and the process
goals and measures should meet the requirements o f both internal and external
customers from their perspective. Processes are analyzed to estimate which, if
changed, will lead to the realization of both process and organizational goals.
Job/Performer Level
The third level of performance is the job/performer level. Rummler and
Brache (1990) suggest that organization and process goals will not be met if process
steps are not supported and if people are unable to maximally contribute to process
effectiveness and efficiency. According to Rummler and Brache, the variables that
must be managed at this level include: antecedents (e.g., standards, directions,
feedback), equipment, job responsibilities, reinforcement, and training.
Reproduced with permission of the copyright owner. Further reproduction prohibited without permission.

Behavioral Engineering Model
The effectiveness of each of the three levels of performance as well as the
effectiveness o f the entire system is determined by a number o f performance
variables. Gilbert’s (1978) behavioral engineering model provides a framework to
effectively analyze these performance variables (see Appendix A) and is especially
helpful at the job/performer level. Gilbert’s model will be used to analyze systems
performance at the job/performer level in the current research. The analysis of
performance and performance deficiencies is an important step in quality
improvement (Juran, 1993). This model is an elaboration of the familiar Antecedent -
Behavior - Consequence model widely used by behavior analysts to examine
performance contingencies as illustrated in Appendix A.
The model is divided into six cells. In the first cell, the antecedent conditions
are examined. Are there prompts, standards, feedback and/or direction provided? Do
the staff know what to do and when to do it? What type o f feedback is provided? In
the second cell, the equipment and procedures in the setting are examined. Are the
job procedures efficient and do they assure quality? In the third cell, motivating
contingencies are analyzed. What are the contingencies for performance (e.g., pay,
promotion, reprimand)? In the fourth cell, the repertoires of the individuals are
analyzed. Do they have the proper job skills? Is training adequate and does it match
the demands of the job? In the fifth cell, Gilbert examines the prerequisite physical
and verbal skills of the individuals for deficits (e.g., illiteracy). The last cell analyzes
whether or not the programmed consequences function as reinforcers for job
performance. This behavior engineering model is a tool for integrating the many
factors involved in improving performance. Elements of the three models were
Reproduced with permission of the copyright owner. Further reproduction prohibited without permission.

8applied, to varying degrees, to a university-level educational system in an effort to
analyze performance and identify performance discrepancies.
Behavior Analysis Training System
A university-level instructional system, the Behavior Analysis Training
System (BATS), was analyzed by applying Rummler and Brache’s (1990) systems
model. In addition, the TQM model was also used to analyze the organizational level
of BATS. Furthermore, the behavioral engineering model was used to analyze the
job/performer level of BATS, as will be discussed in the following paragraphs.
BATS functions within, and is supported by behavior-analytically oriented
undergraduate and graduate programs (Malott, Vunovich, Boettcher, & Groeger
1995). It typically is staffed by a faculty member, three BA, nine MA, and three
Ph.D. students. BATS’ mission is to help recruit, train, and maintain the skills of
effective behavior analysts. Harrington (1991) suggests that effective organizations
develop an overall mission and a strategy to achieve their goal. BATS consists of a
number of subsystems (e.g., undergraduate courses, training, recruitment, behavioral
academic career counseling) to be described in more detail in the following sections.
BATS is comprised of 15 different subsystems. Subsystems are portions of a
larger system or superordinate system that carry out a specific task or function.
Morasky (1982) defines two classes of subsystems: (1) in-line subsystems, and
(2) adjunct subsystems. In-line subsystems output to other systems or subsystems but
do not receive inputs from those systems to which their outputs flow. Adjunct
subsystems, however, can receive inputs from the same system to which it outputs.
The interrelations between these subsystems were not investigated for they were not
germane to this study.
Reproduced with permission of the copyright owner. Further reproduction prohibited without permission.

Systems Analysis of BATS
9
A systems analysis was conducted at all three levels of performance using
Rummler and Brache’s (1990) Model. In addition, several TQM principles were
applied to the organizational level of BATS.
The organizational level of BATS was examined first. Rummler and Brache
(1990) state that modest improvements in performance can be produced by managing
the organizational level. Furthermore, job/performer and process-level efforts will be
counterproductive without organizational-level management.
The first step in this analysis involved the development a total performance
system diagram (see Figure 1).
BATS is a system made up of inputs, outputs, and feedback at the
organizational, process, and job/performer levels. The total performance system
diagram demonstrates those five processes through which this system and its
components operate.
First, BATS converts various resource inputs (e.g., new students and
technology) into product and service outputs (e.g., competent behavior analysts and
research). Second, BATS which it provides these products and services to receiving
systems (e.g., customers). “Receiving system” is a term not commonly used in the
systems literature, although the concept occurs and the need exists for a descriptive
label (Brethower, 1972). Identification of customers and their needs are important
steps in quality planning (Juran, 1993).
Third, while being guided by its own internal standards and feedback, BATS
is ultimately driven by feedback given by its market. The concept of “feedback loop”
is often used in the quality control literature (Juran, 1988). This loop is has four
Reproduced with permission of the copyright owner. Further reproduction prohibited without permission.

10
General Environmental Influences
-WMU
- Piycholoov D w m iw iit
Pay 100 HonorsPsy360 Editing
RatChaining
- TechnologyBahavioral Caroa r
CousalingContinuous •aming Cantor
• FacultyComputarTraining
PhDResearchi -C lass Material!
CompeMtiors- Other Oraduata Programs
• Any Competing Activity
Figure 1. Total Performance System Diagram for BATS.
steps: (1) a goal is established for the performance of an individual or system;
(2) a sensor measures the actual performance; (3) a collator compares the actual
performance to the goal; and (4) if actual performance differs from the goal by more
than a predetermined tolerance, the feedback loop is closed, actuating the means for
restoring the status quo.
Fourth, all this time, the competition is also drawing on the same resources
and providing its products and services to the market. Fifth, these sequences of
events are all influenced by the social, economic, and political environment.
Reproduced with permission of the copyright owner. Further reproduction prohibited without permission.

Within BATS, various subsystems or components convert the inputs they
receive into outputs. These IS subsystems are comprised of the following: (1) an
undergraduate-level psychology course, namely, Psy. 100 honors; (2) Psy. 360;
(3) Psy. 460; (4) masters-level projects; (5) editing of course materials by masters
students; (6) rat chaining projects; (7) self-development interviews; (8) doctoral and
masters-level self-management projects; (9) Super A (for advanced undergraduate
students); (10) behavioral academic career counseling; (11) continuous learning
center, (12) new student recruitment; (13) computer training; (14) Croyden
practicum (undergraduate and masters-level students working with developmentally-
disabled children); and (15) doctoral-level research. All of these components have
similar systems characteristics as the total system.
One subsystem of BATS was selected for closer analysis; this subsystem
consisted of six sections of an advanced undergraduate psychology course, Psy. 460:
Survey of Behavior Analysis Research. The superordinate system in this case is
BATS, and the subordinate system is Psy. 460. For example, Psy. 460 can receive
various inputs from BATS (e.g., undergraduate students with little exposure to
applied behavior analysis) and produce outputs (e.g., students exposed to applied
behavior analysis) for Psy. 460 or for other subsystems within BATS. These
undergraduates may now have the skills required to participate as researchers in Psy.
460 or in other subsystems within BATS. In addition, some may choose to continue
graduate work in BATS and may then have an opportunity to conduct Psy. 460
seminars as TAs.
Psy. 460 sections are conducted in a seminar-style, as opposed to lecture
format. In other words, TAs do not lecture, but facilitate class discussion involving
the homework chapters. In the twice-weekly Psy. 460 seminars, students are seated
Reproduced with permission of the copyright owner. Further reproduction prohibited without permission.

12
in a semicircle around a teaching apprentice, alphabetically by first name. The faculty
member, namely Dr. Richard Malott, rotates between sections, so that each section is
taught by the faculty member every fifth seminar. On these occasions, the TA observe
Dr. Malott’s performance from the back of the class and take notes. Each section
typically holds between IS and 20 students. Students are taught the advanced applied
principles of behavior analysis. Student grades are based on performance in the
following four categories: (1) quizzes, (2) homework, (3) seminar participation, and
(4) a final presentation. Students are given a quiz every seminar. Quizzes cover
definitions of behavioral concepts and principles and are worth 20 points each.
Review quizzes are administered about once per month and are worth 20 points each.
Students are given flashcards of the quiz terms and use the flashcards to study the
definitions before each quiz. The terms are on one side of the flashcards and the
corresponding definitions are on the other side. Students are required to complete
one homework assignment prior to each seminar. The homework chapters were
developed by Dr. Richard Malott and cover behavioral topics such as performance
management, cultural change, parenting, and autism. The homework for each chapter
is worth 20 points. Text in the homework chapters is integrated with multiple-choice
questions, short answer questions, and contingency diagrams. These questions are
regularly interspersed within the text every two or three paragraphs. These
homework chapters constitute the only reading for the course.
In the seminars, a student reads a question coming from the homework, and
the teaching apprentice asks all of the students to show the answers they had in their
homework by raising marked index cards corresponding to those answers. The cards
are color-coded and either have the letters A, B, C, or D on the front o f them. In
addition, the response cards labeled with the letters A and B can be used to reply to
Reproduced with permission of the copyright owner. Further reproduction prohibited without permission.

13
yes or no questions. In the case o f a disagreement between the teaching apprentice
and a student, the teaching apprentice will ask a student to explain his or her answer
and then provide the student with feedback relevant to the answer. The entire
homework assignment is covered in class and then students are given a 5-minute
break. After the break, students are given the scheduled 20-point multiple-choice
quiz. Students can accumulate a total of 20 additional points for participation in the
seminars. Students receive participation scores based on active participation during
the seminars (i.e., answering questions, showing response cards, and participating in
seminar discussion) as measured subjectively by the TAs. Furthermore, at the end of
the semester, students are required to complete a three page paper on a behavioral
topic or performance-management project and deliver an oral presentation to the
class. Students spent approximately 4 hours in class and between 6 and 8 hours
studying outside of the classroom, as estimated by the systems manager (the
graduate-student course supervisor). A grade of 92%, or above, in each of three
categories (quizzes, homework, seminar participation) is required for an A in the
course. In the event that a student’s grade fell below a 92% during the semester, the
TA would speak with the student after the seminar and suggest a performance-
management intervention, most typically performance contracting, to increase their
study time.
It was believed that Psy. 460 greatly contributed towards the accomplishment
of the overall mission of BATS (i.e., to recruit, train, and maintain the skills of
competent behavior analysts) and the analysis focused on this subsystem for five
reasons.
First, due to the high number of seniors enrolled in the course, approximately
two thirds of students enrolled in the Psy. 460 sections as estimated by informal
Reproduced with permission of the copyright owner. Further reproduction prohibited without permission.

14observation, intervening in Psy. 460 provided an excellent occasion to increase
recruitment into behaviorally-oriented graduate programs or careers. By increasing
the number of students recruited into behavior analysis, large steps would be taken
towards accomplishing the first step element of BATS’ overall mission.
Second, it was believed that by improving the course across a wide variety
of variables, student behavior might be influenced in two areas. First, student
learning might increase. Psy. 460 affected the quality of the BA and MA behavior
analysts produced (i.e., undergraduate students and teaching apprentices). In this
course, students were taught the advanced principles of behavior analysis. This
course was typically one of the final courses taken by an undergraduate before
graduation.
Furthermore, a great deal of research and practicum related projects were
offered to students in Psy. 460. Both factors allowed students opportunities to
improve their behavioral repertoires. Consequently, these factors would contribute to
the second part of BATS’ mission.
Third, student evaluations might improve with respect to the course and
behavior analysis in general, thereby increasing the probability that students would
want to continue in the field either in graduate school or in a behaviorally-oriented
career.
Fourth, by involving students in behavioral research and practicum work in
BATS, large steps would also be taken towards placing these students in graduate
school or in a behavior-oriented career. These factors would improve the chances
that these students would continue to work in the field and increase the number of
behavior analysts in general. Consequently, the third part of the overall mission of
BATS would be accomplished.
Reproduced with permission of the copyright owner. Further reproduction prohibited without permission.

Fifth, Psy. 460 offered large room for improvement across a variety of levels
(e.g., increased TA reliability in seminar and out-of-class task completion, and learn
units per hour), as will be discussed in the following paragraphs. Not only was there
room for improvement, but there was potential for improving performance in an
efficient manner. I also served as the systems manager for Psy. 460 and was readily
available to work with this subsystem of BATS. Other components provided
opportunities to affect the overall mission of BATS to differing extents and some
offered large room for improvement in an efficient manner. However, it was
concluded that no other subsystem could affect the overall mission and offer the most
room for efficient improvement to this extent.
As a result of this organizational-level analysis, four variables were chosen
by the systems manager to be measured throughout both interventions: (1) the
number of competent BA/MA behavior analysts produced as measured by scores on
three pretests and posttests, (2) the number of BA students who report that they
want to pursue behavior analysis academically and as a career in the future, (3) the
number of course material mistakes, and (4) the number of system disconnects.
Rummler and Brache (1990) identify disconnects as missing, extraneous, or illogical
steps (e.g., between subsystems, within a process, between a subsystem and a
customer).
Based on an analysis using Rummler and Brache’s (1990) model, the primary
process-level variable chosen for analysis in this research was the recruitment
process. The total number of researchers recruited for the 15 BATS subsystems was
low prior to the first intervention. At most, two or three researchers were recruited,
and 15 researchers were needed (i.e., one researcher per subsystem). In addition,
increasing the number of students involved in behavioral research would help to
Reproduced with permission of the copyright owner. Further reproduction prohibited without permission.

16
accomplish the overall mission of BATS. Psy. 460 offered an effective arena to
recruit students for behavioral research due to the large numbers of junior and senior-
level students enrolled in the course. There was no recruitment process, however, at
the beginning of the intervention. The development of process features is an
important step in quality planning (Juran, 1993).
Due to my relative lack of hands-on knowledge of TQM, solutions for the
job/performer level relied primarily on behavior engineering techniques. Based on an
analysis using Gilbert’s (1978) behavior engineering model, 25 different staff tasks on
the job/performer level were chosen as areas for performance improvements (see
Appendix B). Tasks were often omitted when conducting seminars even though there
were written procedures detailing how seminars should be conducted. This
procedures manual, however, was not often referred to by the teaching apprentices.
The TAs were also given little performance feedback. Additionally, there was no
formal training for new TAs and no programmed consequences for either good or
poor performance. There appeared to be no deficiency in the capacity of the staff to
complete their jobs. All of the staff possessed the prerequisite physical and verbal
skills. In summary, it appeared first that there were deficits in antecedents (e.g.,
performance feedback, job procedures, and training) that needed correcting. Second,
there were no programmed consequences for seminar and out-of-class tasks or
frequency of learn units. In addition, there were no standards for job/performer-level
tasks (see Table 1).
Work procedures (i.e., task checklists) and performance feedback were the
strategies chosen to improve performance at both the process level and the
job/performer level. Providing strategies for improving performance is an important
step in quality improvement (Juran, 1993). The strategies chosen here have been
Reproduced with permission of the copyright owner. Further reproduction prohibited without permission.

17
demonstrated to effectively improve performance, and could be implemented easily,
with little cost in staff time as discussed in the following paragraphs.
Table 1
Performance Problems in BATS and Potential Solutions Using the Behavior Engineering Model
Antecedents Behavior Prerequisites Consequences
Information/Directions Equipment/Procedures Contingencies• lack of direction • equipment is • small but cumulative
(task checklists) accessible and improbable• lack of feedback
(3 types of performance
• nonefficient procedures (checklists/out-ofclass procedures)
consequences
Knowledge Capacity Motives• no training • prerequisite abilities
present• subjects not motivated
by job consequences
Due to time constraints, additional intervention components were not
simultaneously introduced. It was decided that if these interventions failed to
produce the desired effects, other options (i.e., performance training, programmed
consequences) would be implemented in future interventions. For a list o f the
systems problems and proposed interventions for BATS see Table 2. The
intervention components listed in this table will be described in detail in the method
section.
Reproduced with permission of the copyright owner. Further reproduction prohibited without permission.

18
Table 2
System Problems and Proposed Interventions for BATS
Organizational Level Process Level Job/Performer Level
Systems (1) no method for (1) low number of (1) low reliability ofProblems assessing the number undergraduate seminar task
of undergraduates who wish to pursue behavior analysis,
(2) no method for assessing competency of undergraduates other than course grades,
(3) high number of course material errors, and
(4) high number of system disconnects
researchers completion,(2) low reliability of
out-of-class task completion, and
(3) low frequency of learn units completed by TAs
Proposed (1) TPS diagram, (1) recruitment (1) task checklists,Interventions (2) measurement systems, process, and (2) face-to-face
and(3) procedures to edit
course materials and identify systems disconnects
(2) process goals supervisorfeedback,
(3) e-mail feedback, and
(4) videotaped feedback
Techniques for Improving Performance
Task Checklists
Task checklists involve changing the antecedents for task completion by
specifying the task components or task sequence. Gilbert (1978) suggested that a
checklist system is a viable and cost-effective strategy for improving staff
Reproduced with permission of the copyright owner. Further reproduction prohibited without permission.

performance. Consequently, a task checklist system was prepared to correct the
deficit in antecedents (see Appendix B).
Bacon, Fulton, and Malott (1983) suggested that task definition, recording
responses on checklists, and supervisor review are the three components of a
checklist system that are important for affecting performance improvements.
However, the establishment of a checklist does not necessarily ensure performance
improvements. It does not even ensure that individuals will use the checklists. Bacon
et al. (1983) suggested, however, that individuals will utilize task checklists if the
checklists facilitate completion of tasks by clarifying criteria and improving task
discrimination. By requiring employees to provide specific information about
completed tasks (e.g., employee signatures, completion times) on a task checklist,
they may be more likely to complete the job and less likely to provide false
information. Furthermore, the probability that individuals will utilize a task checklist
is more likely with the addition of supervisor review (i.e., supervisors monitoring task
and checklist completion).
The effects of self-monitoring (e.g., via task checklists) have been examined
with performance issues such as punctuality and time on task (Lamal & Benfield,
1978), customer assistance (Komaki, Waddell, & Pearce, 1977), cleaning behaviors
of hotel employees (Anderson, Crowell, Sponsel, Clarke, & Brence, 1982), and
banquet staff performance (LaFleur & Hyten, 1995).
Performance Feedback
The second method chosen to correct the deficit in antecedents was to
provide relevant and frequent feedback to the staff. The term “feedback” has been
given many definitions. Prue and Fairbank (1981) define feedback as information
Reproduced with permission of the copyright owner. Further reproduction prohibited without permission.

provided to individuals about the quality or quantity of their past performance.
Morasky (1982) defines feedback as: “information coming to a system about various
variables both within the system and within the receiving systems.”
Performance feedback is a well-documented procedure that has produced
performance improvement in such areas as counselor training (Bernstein & LeComte
1979), safety (Sulzer-Azaroff & De Santamaria, 1980), implementation of Statistical
Process Control (SPC) quality control training programs, and the reduction of
machine setup time (Wittkopp, Rowan, & Poling, 1990).
Literature reviews (Balcazar, Hopkins, & Suarez, 1986; Prue & Fairbank,
1981) have suggested that providing employees with feedback on their performance
is the most commonly used strategy for modifying employee behavior. According to
Prue and Fairbank (1981), performance feedback can vary along several dimensions,
including: the type of mechanism used to transmit the performance data (e.g., public
posting of performance information), the content of the feedback (e.g., the
comparison of an individual’s performance against a standard), the recipients of the
feedback (e.g., several employees), the source of feedback (e.g., supervisor), and the
frequency of the feedback delivery (e.g., daily). Several characteristics, such as
simplicity and flexibility of implementation, low economic cost, an emphasis on
positive consequences, rapidity of effects, and the capacity to be combined with other
interventions, make feedback an attractive strategy for improving performance
(Fairbank & Prue, 1982).
System Levels
Potentially, performance problems can occur at the organizational, process,
and job/performer levels in an organization. Consequently, we must clearly specify
Reproduced with permission of the copyright owner. Further reproduction prohibited without permission.

21
the desired outcomes and identify those areas where there is: (a) potential for
improving performance in an efficient manner, and (b) opportunity for positively
impacting the overall organizational goals. The three levels of performance can be
interdependent. It is important to realize that interventions targeted at performance
problems on one level might affect other levels.
As a result of the systems analysis of BATS, I chose to intervene at both the
process and the job/performer levels, with emphasis on the 25 staff tasks at the
job/performer level.
The effects of one intervention package consisting of task checklists and face-
to-face supervisor feedback were examined on the staff performance (i.e., conducting
undergraduate-level psychology seminars, completing out-of-class assignments,
completing learn units) of a group of graduate TAs. Four organizational measures
were also taken: (1) undergraduate performance on two pretests and posttests,
(2) course and staff evaluations, (3) number of system disconnects, and (4) number of
course material mistakes. In addition, one process-level measure was taken (i.e.,
number of undergraduate researchers recruited). All of the TAs were members of
BATS at Western Michigan University and assisted in the supervision of Psy. 460
seminars.
Reproduced with permission of the copyright owner. Further reproduction prohibited without permission.

CHAPTER n
PERFORMANCE MANAGEMENT SYSTEM 1: METHOD
The research method used in both interventions might best be called an
engineering or systems-analysis research-and-development approach, as opposed to
an experimental-laboratory approach. The general goal of a systems-analysis
approach is to work toward the overall improved functioning and output o f an
ongoing system, in a realistic, cost-effective manner. This essentially entails using
quasi-experimental designs where the input, processes, and output of the system are
measured as carefully as possible, but where it is neither practical nor feasible to
conduct the experimental controls needed to rule out all alternative explanations of
changes in functioning and outputs (the dependent variables) observed. Such a design
is characteristic of most systems research and development in ongoing organizations
whose main goal is something other than laboratory research.
Participants
Four MA students in the psychology department participated in this study.
They served as TAs for four undergraduate sections. All TAs signed consent forms
before the intervention began.
Design and Procedure
The Psy. 460 seminars were held on each Monday and Wednesday. Dr.
Malott, the four TAs, and I all met before each seminar for 2-hour staff meetings.
22
Reproduced with permission of the copyright owner. Further reproduction prohibited without permission.

The systems manager served as the researcher. The homework and quiz for the day
would be reviewed and all out-of-class assignments would be checked for completion
by the systems manager.
The systems manager observed the seminar performance of each TA for a full
seminar, on a rotational basis between the four sections. In other words, the seminar
performance of each TA was observed, for the entire class, sequentially, that is, a
different TA was watched each seminar by the systems manager. Twenty-five staff
tasks at the job/performer level were measured during each seminar using task
checklists. Task completion percentages were calculated for conducting the seminars
and out-of-class assignments. The total number of learn units per hour were also
counted. Greer (1994) defines a learn unit as follows:
1. A student is presented an unambiguous antecedent (e.g., a homework
question) and attends to the relevant attributes of the stimulus.
2. The teacher provides an appropriate interval for the student to respond
(e.g., to answer the question).
3. The student responds or does not respond.
4. The teacher corrects the response if incorrect or approves the response if
the response was correct.
In addition, four organizational measures and one process measure were also
taken (see Table 3).
TAs were told that the researcher’s role was that of a supervisor and were not
informed of the nature of the intervention. The intervention package was introduced
after two months.
Reproduced with permission of the copyright owner. Further reproduction prohibited without permission.

Table 3
System Problems and Measures for BATS
24
Organizational Level Process Level Job/Performer Level
Systems (1) no method for (1) low number of (1) low reliability ofProblems assessing the number undergraduate seminar task
of undergraduates who wish to pursue behavior analysis,
(2) no method for assessing competency of undergraduates other than course grades,
(3) high number of course material errors, and
(4) high number of system disconnects
researchers completion,(2) low reliability of
out-of-class task completion, and
(3) low frequency of team units completed by TAs
System (1) a student evaluation, (1) the number of (1) task checklistsMeasures (2) three types of researchers completion
competency tests, registered for percentages(3) the number of errors
as measured by TAs with checklists, and
(4) the number of disconnects as measured by systems manager
credits (2) reliability of tasks and frequency of leam units as measured by systems manager with checklists
Organizational-Level Intervention
The organizational-level intervention consisted of the development of goals
and measures. The first goal was to increase the number of competent behavior
analysts. Competency would be measured by delivering three varieties of pretests and
posttests to the students. These tests were independent of the regularly scheduled
tests on which the course grade was based. The first test involved writing 10 key
Reproduced with permission of the copyright owner. Further reproduction prohibited without permission.

definitions taught in the course (see Appendix C). A second test involved SO
multiple-choice questions covering key concepts in the course (see Appendix D). A
third test involved 13 short-answer questions, worth a total o f 30 points, covering
key conceptual material taught in the class (see Appendix E). The third test was only
given to the students in the second intervention due to time constraints. Pretests were
given at the end of baseline and posttests were given at the end of the intervention
phase.
The second goal was to increase the number of BA students who reported
that they wanted to pursue behavior analysis academically or as a career in the future.
Questionnaires were given at the end of the baseline and intervention phases (see
Appendix F). The final organizational goals were to decrease both the number of
course material mistakes and the number of system disconnects (i.e., missing,
extraneous, or illogical steps).
Process-Level Intervention
The TQM model holds that development of units of measures and goals are
important steps in quality control (Juran, 1993). Consequently, the process level
intervention consisted of two steps: (1) establishment of process goals and measures,
and (2) the development of a “should” process map.
The overall process goal was to recruit one undergraduate-level student as a
researcher in each of the components of BATS. Each of the undergraduate
researchers was required to enroll for three college credits of research before the
university enrollment deadline. Therefore, all process steps needed to be completed in
advance of this deadline and each step, consequently, had a deadline for completion.
Reproduced with permission of the copyright owner. Further reproduction prohibited without permission.

An “Is” process map shows the current chain of tasks which produce the
product or service required by the ultimate customer (Rummler & Brache, 1990).
Because there was no current recruitment process, no “Is” process map could be
developed. Therefore, a “Should” process map was developed (see Figure 2). The
“Should” process map depicts a process for achieving the overall process goal(s).
This process involved the following tasks: (a) developing a behavioral
research questionnaire (see Appendix H), (b) determining the number of students
who were enrolled in the Psy. 460 sections, (c) printing off the required number of
questionnaires, (d) distributing the questionnaires to the students, (e) completing the
questionnaires, (f) returning the questionnaires, (g) selecting the top candidates,
(h) interviewing the top candidates and assigning these students to subsystem
projects, (I) acceptance or rejection of the assignments by the undergraduate
students, (j) distributing registration forms, (k) completing the forms, 0) collecting
the forms and distributing the call number for registration, and (m) registering for the
research credits.
Intervening at the process level mid-semester is similar to what practitioners
of TQM refer to as on-line quality engineering. Fowlkes (1995) states that on-line
engineering involves processes that occur during production, while off-line quality
engineering occurs during the design and development of products.
The criteria for selecting a student as an undergraduate researcher included:
(a) a grade point average of at least 3.5 out of 4.0, and (b) a high interest in the field
of behavior analysis as measured by a five-point rating scale.
Reproduced with permission of the copyright owner. Further reproduction prohibited without permission.

27
« 2
Reproduced with permission of the copyright owner. Further reproduction prohibited without permission.
Figu
re 2.
“Sho
uld"
Pr
oces
s Ma
p of
the
Recr
uitin
g Pr
oces
s in
Psy.
460.

28
Job/Performer-Level Intervention
The job/performer level consisted of the following steps: (a) the development
of clear task specifications and a measurement system (i.e., task checklists); and
(b) the development of performance feedback (i.e., supervisor, electronic-mail, and
videotape feedback).
The three job/performer-level variables measured were: (1) the completion of
out-of class tasks by individual TAs, (2) the number o f leam units completed per
hour by each TA, and (3) the completion of Psy. 460 seminars by the TAs.
Conducting the seminars involved 15 more or less specific tasks. These tasks
included: (1) placing chairs in a semi-circle, (2) setting up the audiovisual equipment,
(3) returning class materials to the desktops, (4) posting the grade sheet, (5)
beginning class on time, (6) projecting and reviewing the agenda transparency,
(7) asking students to get out standard materials, (8) asking if the students had any
questions regarding materials previously covered, (9) asking if the students had
questions regarding the current chapter, (10) discussing the current materials,
(11) allowing the students a five-minute break, (12) handing out the quizzes,
(13) asking the students to leave their classwork on their desks, (14) picking up all
course materials, and (15) conducting any necessary self-development interviews
with students.
Out-of-class staff tasks included eight recurring tasks and individually
assigned non-recurring tasks to be completed by the TAs. Recurring tasks were
separated into two parts to make the workload more manageable for the TAs. The
first set of tasks consisted of the following: (a) reviewing the upcoming chapter for
important concepts and any errors, (b) reviewing the upcoming flashcards for errors,
Reproduced with permission of the copyright owner. Further reproduction prohibited without permission.
(c) counting the number of points possible for the upcoming chapter, (d) reviewing
the upcoming quiz for errors, and (e) creating the next staff meeting agenda. These
tasks were to be completed by one TA. The second set of tasks consisted of the
following: (a) revising the flashcards from the previous chapter, (b) revising the quiz
from the previous chapter, and (c) creating the chapter key for the current chapter.
These were completed by a second TA. The TAs assigned to complete this sequence
were responsible for bringing the products and/or information to each staff meeting
to be used by the entire staff. TAs were assigned recurring tasks on a rotational basis.
Non-recurring tasks were assigned randomly by the faculty member.
The number of incorrect answers was measured during the seminars. If a
student asked a question relevant to the homework and the TA answered incorrectly,
this was marked as an incorrect response on the checklist. The number of incorrect
answers given by the TAs was very low in both semesters, however, and these
measurements were not included in the results section.
The number of learn units completed per hour was also measured during the
seminars due to recent research suggesting its importance in improving student and
teacher performance (Greer, 1994). Greer submits that learn units are critical
measures of teaching behavior. The number of leam units is a measure of teacher
productivity first o f all. Second, accuracy in delivering leam units is important to
increasing the quality or effectiveness of teaching because student learning increases
when accuracy is improved. Several authors (Albers & Greer, 1991; Ingham &
Greer, 1992) showed that once the teacher increases the number of leam unit
presentations, student correct-answer rates dramatically increase while incorrect rates
remain low.
Reproduced with permission of the copyright owner. Further reproduction prohibited without permission.

30Some research also suggests that the quantity o f leam units completed
effectively predicts student achievement (Greer, 1994). In other words, the more
leam units completed, the more the student learns. In addition, increasing the number
of leam units completed per hour likely increases learning for teachers. Greer states
that these measures are utilized to teach and assist both students and teacher. Greer
suggests that measures o f teacher productivity and accuracy are needed to improve
teacher effectiveness.
Task checklists were given to the TAs and the intervention was described in
detail to them. The checklists were identical to those used covertly during the
baseline phase. TAs were asked to fill out the checklists as they completed each
activity during the seminar.
Performance feedback was given to the TAs by the systems manager at the
end of each monitored seminar. During this time, the systems manager would
compare the checklist filled out by the TA with a second identical checklist filled out
by the systems manager. The seminar completion percentage, as measured by the
systems manager, was then given to the TA. This percentage was computed by
dividing the total number of seminar tasks by the number of seminar tasks completed.
Any discrepancies between the two checklists were analyzed. In addition, the number
of leam units completed that hour, as measured by the system manager, was also
verbally presented to the TA. The primary measures examined at this stage were the
number of leam units completed per hour by the TAs and the various tasks involved
in conducting the seminars. TAs were not given explicit goals for the seminar and
out-of-class tasks or the frequency of leam units, although implicit goals may have
been present. For example, TAs were asked to complete a high number of leam units
but no specific number was given. This strategy was chosen in order to closely
Reproduced with permission of the copyright owner. Further reproduction prohibited without permission.

examine the effects of the feedback component and to avoid confounding the data
with the possible effects of goal-setting. Data were not included if a seminar could
not be directly observed for an entire hour or the seminar did not last for an entire
hour.
A variety of undergraduate-student performance scores were also analyzed
across conditions. Undergraduate students were given a 10-question pretest at the
end of the baseline phase and a posttest at the end of the intervention phase covering
the same material. This test consisted of 10 definitions covered in the course. One
definition was chosen from approximately every two to three homework chapters in
the course. Students were also given a 50-question pretest at the end of the baseline
phase and the identical posttest at the end of the intervention phase. This test
consisted of multiple-choice questions which covered key concepts taught in Psy. 360
and Psy. 460. Psy. 360 is the prerequisite class for Psy. 460 and covers the basic
principles of behavior analysis. Some of the students had taken the 50-question test
the previous semester. The data are only for those students who had not taken Psy.
360 the previous semester.
TA and course questionnaires were also collected from students once at the
end of the baseline phase and a second time at the end of the intervention phase.
Questionnaires covered topics including TA performance, various aspects of the
course, and the students’ academic and career plans.
Reproduced with permission of the copyright owner. Further reproduction prohibited without permission.

CHAPTER m
PERFORMANCE MANAGEMENT SYSTEM 1: RESULTS AND DISCUSSION
Three job/performer variables were measured in both interventions:
(1) seminar tasks, (2) out-of-class tasks, and (3) frequency of leam units.
First, the seminar process consisted of 15 staff tasks (e.g., reviewing the
agenda, discussing homework, collecting materials). Seminar task-completion
percentages are displayed in Table 4. Percentages increased from a range of 65% to
68% during the baseline condition to 85% to 100% during the intervention condition.
The differences in seminar task-completion percentages between baseline and
intervention phases were statistically significant according to a correlated-samples t
test (p z 0.002). (The correlated-samples t test was used because the percentages of
the TAs’ completed tasks were expected to co-vary from the baseline to the
intervention phase.) Generally, the completion of seminar tasks during baseline was
low, but during intervention it was not as low.
Second, out-of class tasks consisted of nine staff tasks (see Appendix B).
Out-of-class completion percentages increased from a range of 65% to 70% during
the baseline condition to 90% to 100% during the intervention condition (see Table
4). The differences between out-of-class percentages between phases were
statistically significant according to a correlated-samples t test (p s 0.004). Again, the
completion of seminar tasks during baseline was low, but during intervention it was
not as low.
32
Reproduced with permission of the copyright owner. Further reproduction prohibited without permission.

Table 4
Performance Management System 1: Range and Mean Performance Rating Under Each Condition
Variables Cond Range and Mean2-TailProb. df
SI S2 S3 S4
range range range rangeseminar % base 79-86% 58-71% 58-75% 50-82%
mean % mean% mean % mean%81% 68% 67% 65%
range range range rangeseminar % int 100-100% 86-93% 85-85% 90-100% .002* 3
mean % mean% mean % mean%100% 89.5% 85% 95%
range range range rangeout-of base 0-100% 43-100% 57-71% 50-100%class %
mean % mean % mean% mean %63% 65% 65% 70%
range range range rangeout-of int 100-100% 80-100% 100-100% 100-100% .004* 3class %
mean % mean% mean % mean%100% 90% 100% 100%
range range range range# of leam base 53-90 14-61 24-49 47-67units perhour mean mean mean mean
68 40 34 56
range range range range# of leam int 16-21 37-50 40-55 14-38 .363 3units perhour mean mean mean mean
18.5 43.5 47.5 26
^Significant at the .05 level.
Reproduced with permission of the copyright owner. Further reproduction prohibited without permission.

Third, the number of leam units completed per hour varied considerably
between subjects during both the baseline and intervention phases (see Table 4).
Overall group performance levels did not differ significantly between phases
according to a correlated-samples t test (p z 0.363). The variability between TAs
suggests that there was still considerable room for performance improvement during
intervention for some TAs.
There was one process-level variable measured during both semesters; the
number o f undergraduate researchers recruited into BATS projects. Thirteen
undergraduate students were recruited to participate in a variety of research projects
in BATS as a result of the new recruitment process in the first semester, as compared
to the estimate of the previously typical number of one or two students per semester,
at most. These data strongly suggest that the high number of researchers recruited is
the result o f this new process and not the result of simply asking the students to assist
in research, as had been done in previous semesters.
Five organizational-level variables were measured during both semesters: (1)
the number of course material errors, (2) the number of system disconnects, (3) the
number of competent behavior analysts trained as measured by three types of
competency tests given to undergraduates, (4) the number of undergraduates who
wish to pursue behavior analysis professionally and academically, and (5)
undergraduate ratings of course variables.
First, the number of errors in the instructional material we gave to the
students was measured. The instructional material was constantly being updated with
new additions by both the faculty member and the MA students. Occasionally, words,
sentences, or even pages were duplicated and/or missing. On other occasions, words
were misspelled, and so on. They may be taken as a baseline measure of the
Reproduced with permission of the copyright owner. Further reproduction prohibited without permission.

35performance of the Psy. 460 subsystem prior to this intervention. In the semester
prior to this intervention, there were an average of 6.4 mistakes per homework
chapter, 1.5 mistakes per quiz, and 6.1 mistakes per chapter o f definition
flashcards—sufficient to warrant the efforts to correct them during the present
intervention. These variables were measured throughout the next semester and can be
taken as a result of the current intervention. The results are: an average of 1.5
mistakes per homework chapter, 0.5 mistakes per quiz, and 1.8 mistakes per chapter
of definition flashcards. The two semesters are compared in Figure 3. While this
magnitude of improvements might have occurred without the intervention of
checklists and feedback, the systems manager doubts it.
7
Homework Flashcards Quizzes
I Baseline □ Intervention
Figure 3. A Comparison of the Number of Course Material Errors Across Semesters.
Second, there were a total of 13 system disconnects were measured in this
first intervention. The following is a list of those disconnects: (I) failure to distribute
Reproduced with permission of the copyright owner. Further reproduction prohibited without permission.

36and collect student mark-sense sheets (NCS forms), (2) M ure to distribute student
quizzes consistently, (3) no flashcard editing system, (4) no quiz editing system, (5)
no organization of the Psy. 460 and Psy. 360 computer files, (6) no computer backup
system, (7) no final quiz and flashcard review for the course packet, (8) no method of
determining why some course material editing was not completed, (9) no clear
directions for undergraduate students for the Chapter 11 quiz, (10) no recruitment
system, (11) student grades not brought to staff meetings, (12) no lecture for
Chapters 6 and 7, and (13) Chapter 24 was not completed. The number and
seriousness of these disconnects suggested room for improvement.
Third, undergraduate test scores are displayed in Table 5. Tests were
delivered halfway through the semester and during the final week of the semester.
The 10-question definition test was based on terms taught in Psy. 460 for the first
time. Forty-two out of 58 undergraduate students scored higher on this posttest after
the intervention condition. Overall undergraduate performance levels differed
significantly between phases according to a correlated-samples /-test ip < 0.001). The
overall baseline mean score for all undergraduate students was 5 points. The overall
intervention mean score was 7.7 points. Although there was considerable
improvement from the baseline to the intervention, there was still considerable room
for more improvement.
As mentioned earlier, Psy. 360 is a prerequisite of Psy. 460. The Psy. 360
50-question multiple choice test was given to the students in Psy. 460, though most
of these concepts were not explicitly taught in Psy. 460. Thirty-four out of 65
undergraduate students scored higher on the posttest after the intervention condition,
and overall performance did not differ significantly between conditions according to
a correlated-samples / test ip * 0.055). The overall baseline mean score for all
Reproduced with permission of the copyright owner. Further reproduction prohibited without permission.

37Tables
Performance Management System 1: Student Performance
PerformanceVariable
BaselineMean
InterventionMean
StudentImprovement
2-TailProb.
df
10-questionposttest
5 7.7 42/58=72% .001* 56
50-questionposttest
42.7 44 34/65=52% .055 57
•Significant at the .05 level.
undergraduate students was 42.7 points. The overall intervention mean score was 44
points. We may consider this a positive result, in that the performance on the Psy.
360 test was fairly high both at the beginning and end of the semester in Psy. 460; it
did not decrease during that semester. This suggests that the use of the Psy. 360
concepts in Psy. 460 may have maintained that fairly high level of performance.
Fourth, during baseline, 67% of the students (39 out of 58) stated that they
wished to pursue behavior analysis academically and 81% (47 out of 58) after the
intervention condition. During baseline, 74% of the students (43 out of 58) stated
that they wished to pursue behavior analysis in a career and 84.5% (49 out of 58)
during the intervention condition (see Table 6). While the percentages are good, even
during baseline, they appear to be even better by the end of the course.
Fifth, students were asked to rank the importance of various course variables.
The final rankings in terms of the percentage of students ranking each item as most
important were: (1) quality of the materials (39%), (2) quality and quantity of learn
units (28%), (3) mastery of the materials by the TA (17%), and (4) seminar
Reproduced with permission of the copyright owner. Further reproduction prohibited without permission.

38
Table 6
Performance Management System 1: Students’ Academic/Career Plans
Evaluation Variable Condition Percentage
% of students who want to baseline 39/58 = 67%pursue behavior analysis inacademics intervention 47/58 = 81%
% o f students who want to baseline 43/58 = 74%pursue behavior analysis in acareer intervention 49/58 = 84.5%
management (16%). These data are feedback from the BATS’ customers and can
provide BATS with information regarding organizational strengths and/or problems.
This feedback serves as a measure of the degree to which BATS’ products and
services meet the students’ needs and provides direction for organizational strategy
and performance.
Interobserver Agreement
Interobserver agreement was determined for checklist data during the
intervention phase (during baseline only the student investigator collected data). The
systems manager checked the reliability of every checklist that the TAs had
completed and determined the seminar completion percentage, number of learn units,
and incorrect answers. The performance of each TA was observed three times in the
baseline phase and two times during the intervention phase. Observers were
considered in agreement if each of the tasks listed as completed by one corresponded
to the identical tasks listed by the other. Agreement between the systems manager
Reproduced with permission of the copyright owner. Further reproduction prohibited without permission.

39and the four TAs occurred on 100% of seminars measured during the intervention
phase.
In addition, another doctoral student joined the student investigator in
independently checking the number o f learn units completed per hour by TAs two out
of eight possible seminars during the intervention phase. The interobserver agreement
percentage was calculated according to the formula: [Agreements/(Agreements +
Disagreements)] * 100. Agreement between the systems manager and the second
doctoral student occurred on 94% of seminars measured during the intervention
phase. Data collected by the systems manager were used in all graphs and tables.
Reproduced with permission of the copyright owner. Further reproduction prohibited without permission.

CHAPTER IV
PERFORMANCE MANAGEMENT SYSTEM 2: CONTINUATION OF SYSTEM IMPROVEMENTS
Introduction
In the first semester, the addition of task checklists combined with face-to-
face feedback significantly improved the reliability of graduate student teaching
apprentices (TAs) conducting seminars and completing out-of-class assignments.
Therefore, the faculty course supervisor and I decided to maintain both task
checklists and supervisor feedback in the second semester as part of a systems-
improvement plan. However, in the second semester, performance feedback would be
given weekly via electronic-mail (e-mail), instead of face-to-face, as discussed in the
following paragraphs.
Therefore, one goal was to compare the effects of task checklists and
supervisor feedback used in the first semester in an across-semester comparison with
an intervention package of task checklists and e-mail feedback in the second
semester. Again, seminar performance and completion of out-of-class assignments
would be the dependent variables.
Also, in the first semester, face-to-face supervisor feedback had no significant
effect on the number of hourly learn units during the seminar. Therefore, a second
goal was to examine the effects of an intervention package consisting of both face-to-
face supervisor feedback, and videotape feedback, with the hope that the addition of
the videotape would significantly increase the number of learn units. Learn units were
40
Reproduced with permission of the copyright owner. Further reproduction prohibited without permission.

41again chosen due to their importance as rated by our undergraduates and as indicated
by the research literature (Greer, 1994).
The same organizational and process-level dependent variables were studied
as during the previous semester (i.e., number of competent behavior analysts
produced, number of undergraduates who wish to pursue behavior analysis, number
of course material errors, number of system disconnects, and the number of
undergraduate researchers recruited).
Before looking at the details of the intervention in this semester, let us
examine the research literature relevant to the two new components o f this second
intervention—e-mail feedback and videotaped feedback.
E-mail Feedback
Computer-mediated communication differs from other communication in
time, space, speed, ease of use, audience, and opportunity for feedback (Kiesler,
Siegel, & McGuire, 1984). Picot, Klingensberg, and Kranzle (1982) found that
electronic communication users viewed this form of communication as less
confidential, more accurate, more formal, more dependable, less private, and less
stimulating as compared to face-to-face communication. Steinfield (1986) argued that
little systematic research is being done on non-office contexts and suggested that
educators might benefit from further research on the application of electronic
communication.
Kiesler et al. (1984) provide one of the few empirical studies on this aspect
and demonstrated that the use of e-mail versus face-to-face interactions had
significant effects on communication efficiency, participation, interpersonal behavior,
and decision making. The authors provide two tentative explanations for these
Reproduced with permission of the copyright owner. Further reproduction prohibited without permission.

results: (1) absence of social-influence cues for controlling discussion, and
(2) depersonalization from lack of nonverbal involvement and absence of norms.
In the second semester, we attempted to establish the feasibility of using
electronic communication for providing performance feedback.
Videotaped Feedback
Various methods have been employed to reliably measure, assess, and train
effective teacher behavior. While no definitive study has experimentally examined the
effects of various videotaped interventions on learn units completed per hour, the
following is a sampling of representative studies that have examined the use of
videotape in various aspects of teacher training. Whitman (1988) cites role playing,
manuals, written exercises, and videotape technology as components of various
teacher training programs.
In addition, McKnight (1971) recommended the use of videotapes in teacher
training because they provide a standard example of exemplary teacher performance
that can be reviewed at any time by teacher trainees.
Since the 1960s, video technology has paved the way for the application of
behavior modification techniques to teacher training. Videotape overcomes many
observational obstacles; it allows immediate and repetitive replay, accurate
performance recording, and total availability for analysis. Video technology has been
a component of a number of educational strategies (e.g., microteaching, self-
assessment, discrimination training, and videotaped feedback combined with
supervisory feedback). The influence of videotaping on teacher behavior and attitudes
towards teaching have been reported (e.g., McGarvey & Swallow, 1986; O’Brien &
Reproduced with permission of the copyright owner. Further reproduction prohibited without permission.

Korth, 1991; Orme, McDonald, & Allen, 1966). In the following section, the impact
of various videotaping methods on teacher training will be examined.
Videotaping Methods and Teaching
Videotaped Feedback and Microteaching
Videotaping strategies have been utilized in a great deal o f research involving
microteaching. Microteaching is a small practice-teaching situation first conducted in
1963 at Stanford University (McGarvey & Swallow, 1986). One important concept
of microteaching is that the teaching act is composed of a number o f teaching skills.
Furthermore, these teaching skills can be measured, evaluated, and trained.
Microteaching involves a trainee watching a video of another teacher. The trainee
then practices these skills by teaching a 5- to 10-minute lesson to a small group of
students (e.g., 6 to 10) while being videotaped. Video feedback is next given to the
trainee by supervisors, or from trainees themselves with the aid of an evaluation form.
Friebel and Kallenbach (1968) demonstrated the efficacy of a videotape
feedback intervention package (i.e., instructional films, model films, microteaching,
and videotape feedback) for significantly increasing the number of questions asked by
university-level student teachers which required longer student responses and fewer
questions that could be answered by yes or no or with a single word (p < .05).
Johnson and Sulzer-Azaroff (1978) examined the effects of watching and
evaluating role-playing by college TAs on the use of general prompts during quiz
evaluations. Use of general prompts increased from 50% before training to 90% after
training.
Reproduced with permission of the copyright owner. Further reproduction prohibited without permission.

44
Videotaped Feedback and Self-Assessment
Research findings also support the use of videotape feedback in conjunction
with a number of other strategies. One effective strategy is to have teachers evaluate
their own performance in the classroom after conducting a teaching session in either
simulated or actual classroom settings.
For example, Acheson (1964) examined the effects of videotape feedback on
the frequency of episodes of teacher-student interactions for teacher trainees who
observed their own teaching behavior via videotaped recordings during supervisory
conferences. Forty-eight teacher interns were videotaped two times each for a period
of 20 minutes. Videotaped feedback produced significant decreases (p = 0.05) in the
amount of teacher dialog and significant increases in the amount of student
participation.
McConnell and Fages (1980) compared the effects of videotape feedback on
reports of self-confidence and specific teaching skills (i.e., conducting structured
lessons) for preservice physical education teachers in two different settings: a college
laboratory setting, and a field experience setting. Students rated the effectiveness of
videotaped feedback on a Likert scale, with 1 representing very effective, and 5
representing not effective. The authors found significant differences (p - 0.05) in
ratings for the group that received videotape feedback in the field setting. The mean
rating for the field-setting group was 1.5, while the mean rating for the laboratory
group was 2.3.
Mertz (1972) examined the effects of three sessions o f split-screen
videotaping (one camera directed towards the students and one toward the teacher)
on the verbal and nonverbal behavior of 17 sixth, seventh, and eighth grade teachers.
Reproduced with permission of the copyright owner. Further reproduction prohibited without permission.

The teachers in the experimental conditions showed significant improvements
ip = 0.0S) in their verbal and nonverbal behavior as judged by administrative
evaluators. These effects continued for a period of 4 months, without the use of
videotaping, as assessed by a follow-up measure.
Videotaped Feedback and Discrimination Training
A third strategy has been to examine the effects of videotaped feedback in
conjunction with discrimination training (as described later).
For example, Orme et al. (1966) compared the effects of written feedback to
video feedback on the effectiveness of teacher training. The authors found that
teachers completed more so-called probes (e.g., clarification, prompting, and
redirection of student answers) after viewing the videotape feedback (p <10). The
authors suggest that probing should be used in lessons where student participation is
prerequisite to the goals o f instruction. However, the researchers also found that the
greater changes were produced when a supervisor who provided discrimination
training participated in the videotape feedback sessions than when the teachers
viewed their performances alone.
Legge and Asper (1972) conducted an experiment to examine the effects of
videotape methods in improving preservice teachers’ discrimination abilities. They
found that preservice teachers who viewed their own teaching performance were able
to view and rate a film of another teacher’s performance significantly closer
ip = .025) to the ratings of a group of master teachers than those preservice teachers
who attended the same course but did not view their own teaching performances. In
other words, the teachers learned to discriminate more accurately between good and
bad teacher performance.
Reproduced with permission of the copyright owner. Further reproduction prohibited without permission.

Videotaped Feedback and Supervisory Feedback
A fourth strategy used in teacher training is to examine the effects of
videotape feedback (in conjunction with self-analysis) in combination with
supervisory feedback. Hartshorn and Prather (1988) suggested that combining video
and supervisor feedback has the potential to both increase the uniformity of teacher
assessment, and provide effective feedback for teachers.
For example, Jensen and Young (1972) had student teachers deliver practice
lessons and then view a videotape of their performance in conjunction with
supervisor feedback given during the evaluation. A control group received no
videotape feedback. Both groups were then evaluated three times during student
teaching in real public-school classrooms. The group of teachers who received the
video feedback received significantly higher ratings (p = 0.5) on five of six rating
scales as compared to the control group with a general increase during later
evaluations.
Ford (1984) compared the effects of supervisor feedback and videotape
feedback, used singularly and in combination, on teaching skills (i.e., teaching dining,
dressing, and bathing) of paraprofessionals in a mental retardation facility. Mean
performance ratings ranged from 19% to 61% during baseline conditions.
Percentages increased to a range of 30% to 100% during the supervisory feedback
sessions. The highest performance ratings were obtained in the supervisor and
videotape feedback combination with a range of 74% to 100%.
Olivero (1964) attempted to answer the following three questions regarding
teacher performance:
Reproduced with permission of the copyright owner. Further reproduction prohibited without permission.
47
1. Does feedback from supervisors who observe televised recordings of
classroom performance produce more changes in teacher trainees' behaviors than
feedback from supervisors who observe the lesson taught in the classroom?
2. Do teacher trainees need to have feedback from supervisors in order to
change teacher trainees’ behavior?
3. Does verbal and videotape feedback from supervisors produce more
change in teacher trainees’ behaviors than verbal supervisor feedback alone?
Ninety intem-teachers and/or student teachers from a secondary education
program were chosen for the study and were assigned to nine groups. All of the
teacher trainees had four practice-teaching opportunities, taught a 5-minute lesson
that was videotaped, received one of the nine treatments, and retaught the same
5-minute lesson to a different group. Results showed that feedback from supervisors
who observe televised recordings of classroom performance do not produce more
changes in teacher trainees’ behaviors as compared to feedback from supervisors who
observe the lesson taught in the classroom. However, the results showed that teacher
trainees do need some form of feedback and that the combination of videotape and
verbal supervisor feedback is more effective than verbal supervisor feedback alone in
improving teacher performance (p < 0.05).
The present research extends Olivero’s (1964) findings by examining the
effects of an intervention package consisting of both face-to-face supervisor
feedback, and videotape feedback on learn units completed per hour, with the hope
that the addition of the videotape would significantly increase the number of learn
units. These results are then compared with the face-to-face supervisor-feedback-
alone intervention conducted during the first semester in an across-semesters
comparison.
Reproduced with permission of the copyright owner. Further reproduction prohibited without permission.
CHAPTER V
PERFORMANCE MANAGEMENT SYSTEM 2 : METHOD
Participants
There were two TAs in this phase of the intervention. Both were members of
the Behavior Analysis Training System. Neither TA participated in the first
intervention.
Design and Procedure
The seminars were held on each Monday and Wednesday. The faculty
systems supervisor, the systems manager, and both TAs met before each seminar for
2-hour staff meetings. I served as the systems manager again. The homework and
quiz for the day would be reviewed and all out-of-class assignments would be
checked for completion by the systems manager.
The systems manager measured the seminar performance of each TA for a full
seminar on a rotation basis between the four sections. Twenty-five staff tasks at the
job/performer level were measured during this period using task checklists. TAs were
not informed of the nature of the intervention. Task completion percentages were
calculated for conducting the seminars and out-of-class assignments. The total
number of leam units per hour were calculated. In addition, the identical
organizational and process measures were also taken.
48
Reproduced with permission of the copyright owner. Further reproduction prohibited without permission.
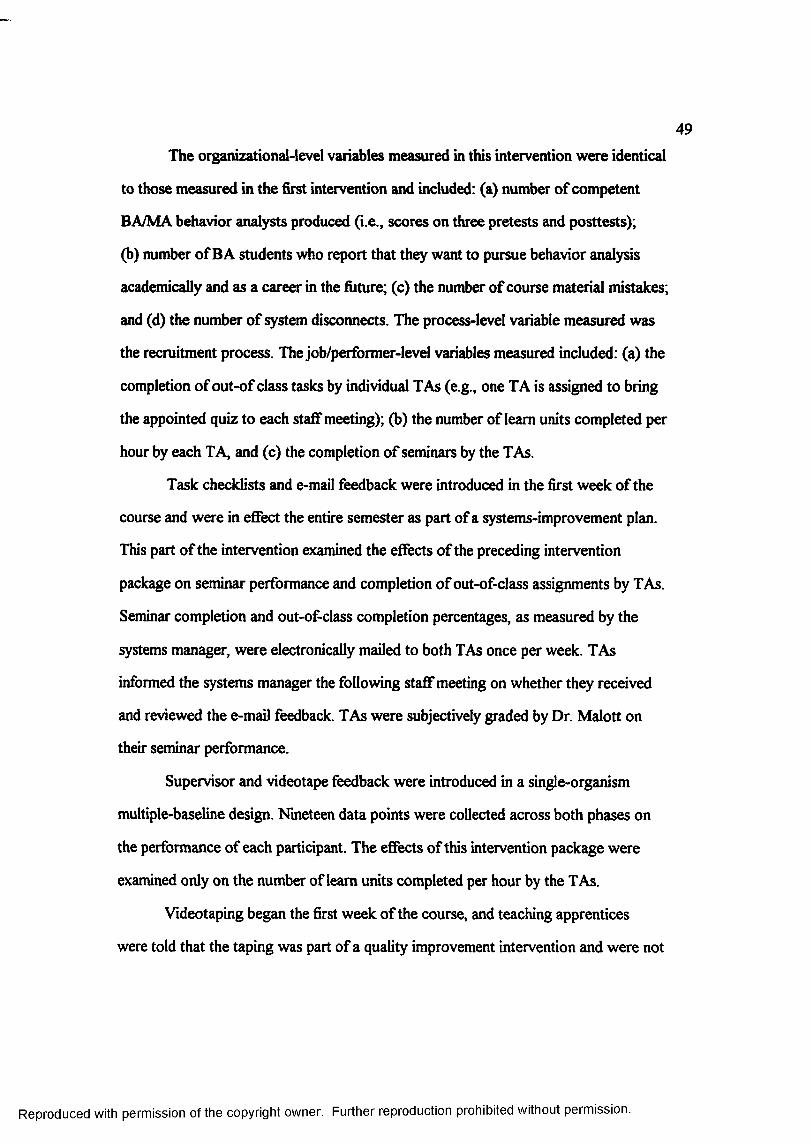
49
The organizational-level variables measured in this intervention were identical
to those measured in the first intervention and included: (a) number of competent
BA/MA behavior analysts produced (i.e., scores on three pretests and posttests);
(b) number of BA students who report that they want to pursue behavior analysis
academically and as a career in the future; (c) the number of course material mistakes;
and (d) the number of system disconnects. The process-level variable measured was
the recruitment process. The job/performer-level variables measured included: (a) the
completion of out-of class tasks by individual TAs (e.g., one TA is assigned to bring
the appointed quiz to each staff meeting); (b) the number of learn units completed per
hour by each TA, and (c) the completion of seminars by the TAs.
Task checklists and e-mail feedback were introduced in the first week of the
course and were in effect the entire semester as part of a systems-improvement plan.
This part of the intervention examined the effects of the preceding intervention
package on seminar performance and completion of out-of-class assignments by TAs.
Seminar completion and out-of-class completion percentages, as measured by the
systems manager, were electronically mailed to both TAs once per week. TAs
informed the systems manager the following staff meeting on whether they received
and reviewed the e-mail feedback. TAs were subjectively graded by Dr. Malott on
their seminar performance.
Supervisor and videotape feedback were introduced in a single-organism
multiple-baseline design. Nineteen data points were collected across both phases on
the performance of each participant. The effects of this intervention package were
examined only on the number of learn units completed per hour by the TAs.
Videotaping began the first week of the course, and teaching apprentices
were told that the taping was part of a quality improvement intervention and were not
Reproduced with permission of the copyright owner. Further reproduction prohibited without permission.

50
informed of the nature of the intervention.. Cameras were set up in the rear of the
classroom on a tripod. This equipment was provided by the audiovisual department
of the university. Seminar sections were taped on each Monday and Wednesday.
Each seminar was taped for one hour. Data were not included if the entire seminar
was not directly observed or if the seminar lasted less than an hour, as was the case
on 3 out of 22 occasions. The systems manager (current researcher) reviewed the
tapes during the week and counted the number of learn units per hour completed by
TAs. Interobserver reliability was also checked by the same doctoral student checked
reliability in the first intervention.
During the intervention phase, TAs individually viewed their performance
from the previous seminar for 10 minutes. The feedback sessions during this
intervention were more comprehensive than those conducted in the first intervention.
Sessions were conducted approximately a half an hour before the seminars. In the
first feedback session, the systems manager provided the TAs with the definition of a
learn unit and provided several examples. During each feedback session, the TAs
were asked to verbally identify when a learn unit was completed on the tape. The
systems manger then provided immediate feedback. The TA was informed as to
whether the identification of the learn unit was correct or incorrect and the rationale.
In the event that a learn unit was completed on the tape and the TA failed to identify
it, the systems manager stopped the tape, rewound it to the relevant point and
replayed the tape where the completed learn units occurred.
A variety of undergraduate student performance scores were also measured
by phase. Undergraduate students were given a 10-question pretest at the end of the
first baseline phase and the same test at the end of the intervention phase. This test
consisted of 10 randomly chosen definitions covered in the course. Second, students
Reproduced with permission of the copyright owner. Further reproduction prohibited without permission.

51
were also given a 50-question pretest at the end of the first baseline phase and an
identical posttest at the end of the intervention phase. This test consisted of multiple-
choice questions which covered key concepts taught in Psy. 360 and Psy. 460.
Psy. 360 is the prerequisite class for Psy. 460 and covers the basic principles of
behavior analysis. In addition, a 13-question short-answer conceptual test, worth a
total of 30 points, was administered at the end of both the baseline and intervention
phases (see Appendix E). This test covered more advanced concepts taught in the
course and was in a short-answer format.
TA and course questionnaires were also collected from students once at the
end of the first baseline phase and a second time at the end o f the intervention phase.
Questionnaires covered topics including: TA performance, various aspects of the
course, and academic and career plans.
Reproduced with permission of the copyright owner. Further reproduction prohibited without permission.

CHAPTER VI
PERFORMANCE MANAGEMENT SYSTEM 2:RESULTS AND DISCUSSION
As mentioned earlier, three job/performer variables were measured in both
interventions: (1) seminar tasks, (2) out-of-class tasks, and (3) frequency of learn
units. First, the seminar process consisted of the same 15 staff tasks as in the first
semester (e.g., reviewing the agenda, discussing homework, and collecting materials).
Percentage completion of seminar tasks ranged from 85% to 100% for subject 1 and
from 89% to 100% for subject 2 (see Table 7). The seminar process results obtained
in the intervention phases of both semesters did not differ significantly from each
other in a t test (p z 0.261). Furthermore, seminar process results obtained in the
intervention phase in the second semester were significantly better than the baseline
results in the first semester (p <, 0.008).
Second, out-of class tasks consisted of the same nine staff tasks as in the first
phase (e.g., reviewing the next chapter, revisions). Out-of-class completion
percentages were 100 % during this phase of the intervention for subject 1 and
ranged from 80 % to 100 % for subject 2 (see Table 7).
The out-of class task results obtained in the intervention phases of both
interventions were compared and did not differ significantly in a 2-sample t test
(p * 0.734). Furthermore, out-of-class results obtained in the intervention phase in
the second semester were significantly better than the baseline results in the first
semester (p <. 0.002). All of this suggests that the satisfactory performance obtained
52
Reproduced with permission of the copyright owner. Further reproduction prohibited without permission.

for both the seminar process and out-of-class tasks during the first semester, with
face-to-face feedback, was also obtained during the second semester, with e-mail
feedback.
Table 7
Performance Management System 2: Range and Mean Performance Rating Under Each Condition
Variables Cond Range and Mean 2-Tail Prob. df
SI S2Within
SemesterComparison
seminar % interventionrange
85-100%
mean%96.6%
range89-100%
mean % 97.2%
out-of-class % interventionrange
all 100%range
80-100%
mean % 97.1%
# of learn units per hour
baselinerange5-38
mean%18.5
range3-45
mean % 23.9
# of learn units per hour
interventionrange
22-80
mean%44.4
range39-59
mean % 48
0.023* 1
^Significant at the .05 level.
Reproduced with permission of the copyright owner. Further reproduction prohibited without permission.

Third, the number of learn units completed per hour by TAs across
experimental conditions is shown in Figure 4. The mean number of learn units
completed per hour increased from 18.5 during baseline to 44.4 during the
intervention phase for subject 1 and 23.9 to 48 for subject 2 (see Table 7)—a
significant improvement according to a correlated-samples t test (p £ 0.023). This
suggests that the videotape feedback was effective in increasing the number of learn
units, especially because face-to-face supervisory feedback did not produce a
significant increase during the previous semester. This across-semester comparison is
somewhat clouded, however, by the failure of an independent-samples t test
(p 2 0.069) to obtain a significant difference in the amount of improvement between
the two semesters and thus between the face-to-face and videotape feedback.
h3Oxka•o30aEoo3e3S0
_J
100
1 3 5 7 9 11 13 15 17 19Seminar Sessions
S1: Baseline S2: Baseline•O * S1: Intervention - * • S2: Intervention
Figure 4. Performance Management System 2: Learn Units Completed per Hour.
with permission of the copyright owner. Further reproduction prohibited without permission.

55
There was one process-level variable measured during both semesters: the
number of undergraduate researchers recruited into BATS projects. Thirteen
additional undergraduate researchers were recruited to participate in the research
projects in BATS as a result of the recruitment process, an important replication of
the previous semester’s results, especially when contrasted with the very low
estimated recruitment rate from earlier semesters.
Four organizational-level variables were measured during both semesters:
(1) the number of system disconnects, (2) the number of competent behavior
analysts trained as measured by three types of competency tests given to
undergraduates, (3) the number of undergraduates who wish to pursue behavior
analysis professionally and academically, and (4) undergraduate course variable
ratings.
First, a total of 3 system disconnects were found in this second intervention as
compared to 13 system disconnects found in the first semester. The 3 disconnects
found were: (1) no method of determining why some course material editing was not
completed; (2) student grades not brought to staff meetings; and (3) as in the
previous semester, no lecture for chapters six and seven. This would appear to be an
important decrease in disconnects.
Second, as Table 8 shows, 27 out o f 32 students scored significantly higher
on the 10-question definition test after the intervention phase, with a mean pretest
score of 2.8 questions correct and a mean posttest score of 6.2 correct according to a
correlated-samples t test (p <, 0.001). However, there is still more room for socially
and statistically significant improvement.
Table 8 also shows that 28 out of 32 students scored higher on the 50-
question Psy. 360 multiple-choice test after the intervention, with a mean pretest
Reproduced with permission of the copyright owner. Further reproduction prohibited without permission.

56
score of 36.3 questions correct and a mean posttest score of 39.4 correct, a
significant improvement according to a correlated-samples t test (p £ .001).
Table 8 further shows that 30 out of 34 undergraduate students scored higher
on the 13-question conceptual test after the intervention, with a mean pretest score of
12.3 points and a mean posttest score of 20.1 points out of 30, a significant
improvement according to a correlated-samples / test (p £ 0.001). While there is still
considerable room for improvement, considerable learning would also seem to have
occurred.
Table 8
Performance Management System 2: Student Performance
PerformanceVariable
BaselineMean
InterventionMean
% Improvement 2-TailProb.
d f
10-questionposttest
2.8 6.2 27/32 = 83.4% £.001* 31
50-questionposttest
36.3 39.4 28/32 = 87.5% £.001* 31
13-question conceptual posttest (30 points)
12.3 20.1 30/34 = 88.2% £.001* 33
‘ Significant at the .05 level.
Third, during baseline, 45% of the students (15 out of 33 ) stated that they
wished to pursue behavior analysis academically; this increased to 62% (18 out of 29)
at the end of the intervention. During baseline, 48.5% of the students (16 out of 33)
Reproduced with permission of the copyright owner. Further reproduction prohibited without permission.

57
stated that they did wish to pursue behavior analysis in a career academically; this
increased to 73.3% (22 out o f 30) at the end o f the intervention (see Table 9).
Table 9
Performance Management System 2: Students’ Academic/Career Plans
Evaluation Variable Condition Percentage
% of students who want to baseline 15/33=45%pursue behavior analysis in academics intervention 18/29 = 62%
% of students who want to baseline 16/33 = 48.5%pursue behavior analysis in a career intervention 22/30 = 73.3%
Fourth, students were asked to rank the importance of four course variables
on an evaluation (see Appendix F). The final rankings in terms of the percentage of
students ranking each item as most important were: (1) quality of the materials
(29%), (2) quality and quantity of learn units (27%), (3) mastery of the materials by
the TA (27%), and (4) seminar management (17%). An across-semester comparison
shows that the relative rankings of these variables did not change. The percentage of
students who ranked quality of the materials as most important, however, dropped
from 38% to 29%. It is possible that decreases in the percentage of students who
ranked course materials as most important may be associated with the considerable
editing improvements in the materials completed by the TAs. In the first semester,
approximately one fourth of the undergraduate students, as estimated by the systems
manager, verbally complained to TAs about the high number of errors in the course
materials. These complaints could not be specifically voiced in this evaluation
Reproduced with permission of the copyright owner. Further reproduction prohibited without permission.

58because no question specifically addressed complaints. In retrospect, this issue should
have been more closely assessed. Therefore, many of these complaining students may
have ranked the importance of the quality of course materials highly to ensure that
future students would receive instructional materials with far fewer mistakes. The
percentage of students who complained about material quality decreased 9% across
semesters. In addition, the relative importance of this variable, as measured by the
evaluations in the second semester, decreased.
Future social validity measures might assess if the decreased percentages in
the quality of materials variable was due to a decrease in the number of errors or
because students felt other variables played a more important role in learning. Data
obtained from part of the evaluation is being analyzed as part o f a separate study and
will not be presented.
Interobserver Agreement
Interobserver agreement was determined for checklist data during both the
baseline and intervention phases. The systems manager checked the accuracy of every
checklist that the TAs had completed and determined the seminar completion
percentage, the out-of-class assignment completion percentage, and the number of
leam units completed per hour. The performance of each TA was observed on 19
occasions. Observers were considered in agreement if each of the critical items listed
as completed by one corresponded to the identical items listed by the other.
Agreement between the systems manager and both TAs occurred on 100% of the
seminars during both the baseline and intervention phases.
In addition, a doctoral student joined the student investigator in independently
checking the number of leam units completed per hour by TAs 10 out of 38 possible
Reproduced with permission of the copyright owner. Further reproduction prohibited without permission.

seminars across both phases. The interobserver agreement percentage was calculated
according to the formula: [Agreements/(Agreements + Disagreements)] * 100.
Agreement between the systems manager and the second doctoral student occurred
on 89% of the seminars during both phases. Data collected by the systems manager
were used in all graphs and tables.
Reproduced with permission of the copyright owner. Further reproduction prohibited without permission.

CHAPTER Vn
GENERAL CONCLUSIONS
Rummler and Brache’s (1990) systems model holds that the degree to which
any system effectively fulfills its mission in society is the result of the effectiveness of
the various components at the organizational level, the process level, and the
job/performer level and the extent to which they act together as an integrated whole.
These three levels of performance are interdependent; so interventions targeted at
performance problems on one level may affect other levels. As a result of a systems
analysis of BATS, the interventions described here were aimed at both the process
and the job/performer levels, with emphasis on the 25 staff tasks at the job/performer
level. Performance was also measured at the organizational level.
The effectiveness of each level of performance is affected by a number of
variables. Gilbert’s (1978) behavioral engineering model provides a framework for
effectively analyzing these performance variables, especially at the job/performer
level. Gilbert listed six areas (clusters of performance variables) in the behavior
engineering model in which interventions might yield large returns in improved
performance. An analysis of the performance variables is required to determine which
areas are causing the performance problems and thus which interventions will yield
the best results. In many cases, not all six areas need improvement.
The Behavior Analysis Training System (BATS) was analyzed by applying the
systems view to the three levels of performance. The job/performer level was
analyzed using the behavioral engineering model. Additionally, one subsystem of
60
Reproduced with permission of the copyright owner. Further reproduction prohibited without permission.

61
BATS, sections of an advanced undergraduate psychology course (Psy 460), was
selected for closer analysis.
In the current study, there appeared to be no deficiency in the capacity of the
Psy. 460 staff, physically or verbally, to complete seminar and out-of-class tasks and
learn units. However, there appeared to be deficiencies in the other five performance
areas, as determined by the behavior engineering model. First, TAs received little
performance feedback/direction. Second, tasks were often omitted when conducting
seminars even though there were written procedures detailing how seminars should
be conducted. However, the procedure manual was rarely used by the TAs. Third,
there was no formal training for new TAs. Fourth, there were no programmed
consequences for either good or poor performance. However, small but cumulative
and/or improbable consequences were occasionally delivered. For example, if a TA
failed to complete an assigned task, a mild reprimand might be delivered. In other
cases, the incomplete task might not be monitored by the systems manager or faculty
member and a systems disconnect could result. Fifth, these small but cumulative
and/or improbable consequences did not effectively motivate TAs.
As a result of an analysis of the performance variables, the intervention
addressed two of these areas: directions and procedures, which seemed to have the
greatest potential for improvement with the resources available. The introduction of
the antecedent component (i.e., task checklists) was designed to correct the direction
deficits. The assignment of specific staff to certain tasks listed on checklists was
designed to improve out-of-class procedures. In addition, a variety of performance
feedback techniques were also utilized in each semester. These strategies have been
demonstrated to effectively improve performance, and could be implemented easily,
with little cost in staff time. Furthermore, the introduction of performance feedback
Reproduced with permission of the copyright owner. Further reproduction prohibited without permission.

may be placed in either the information/direction, contingencies, or training cell as
will be discussed in the following paragraphs. The problem areas and the
interventions are indicated in the table of the behavioral engineering model (see
Table 1).
Job/Performer Level Summary
Seminar and Out-of-Class Performance
In the first semester, the implementation of a combination of task checklists
and face-to-face supervisor feedback was associated with statistically significant
improvements in seminar and out-of-class performance of the TAs. This level of
improved performance was maintained during the second semester, with different
TAs, when e-mail feedback was substituted for face-to-face supervisor feedback.
A component analysis was not possible during the intervention phases due to
time constraints. Therefore, it is not clear whether either task checklists or supervisor
feedback alone or the combination produced and maintained increases in seminar and
out-of class completion percentages. However, it would be worthwhile to perform a
brief theoretical analysis to better comprehend the behavioral processes underlying
checklists and feedback.
Checklists
Task checklists may have functioned as warning stimuli, increasing the
frequency of seminar and out-of-class behaviors that had in the past been under the
control of rule-governed analogs to avoidance (e.g., avoidance of the loss of the
opportunity for praise and avoidance of reprimands). Such analog contingencies are
Reproduced with permission of the copyright owner. Further reproduction prohibited without permission.

63
suggested by the three-contingency model (Malott, 1992): the checklist may have
combined with noncompletion o f the checklist tasks to function as a conditional,
leamed-aversive stimulus. The TA then escaped the aversive stimulus by completing
the listed seminar and out-of-class tasks. In addition, the TAs, thereby, avoided the
delayed delivery of negative feedback from the systems manager and faculty member
and avoided the loss of the opportunity for praise from those supervisors.
This is an alternative to the more traditional analysis by Bacon et al. (1983)
who suggested that the effects of checklists may be a function of a general history of
reinforcement for following instructions from authorities. The present analysis also
brings into question the suggestion by Bacon et al. (1983) that the outcome of
viewing a checklist, recalling details of the task, and recording those details on the list
may acquire some (positive) reinforcing properties. Instead, the three contingency
model would suggest negative reinforcing properties.
The three-contingency model also suggests why the on-the-job checklist
might be more effective than an off-the-job procedure manual or earlier oral
instructions: Looking at the checklist might more reliably evoke a statement of the
rule describing the tasks and standards, and this rule statement could then combine
with the noncompletion of the tasks to more reliably generate the conditional,
leamed-aversive stimulus that the TA would escape by completing the tasks. In
everyday terms, the checklist would increase the likelihood the TAs would remember
what to be worried about.
Feedback
Both face-to-face supervisor and e-mail feedback may also have contributed
to the high seminar and out-of-class completion percentages. The present data
Reproduced with permission of the copyright owner. Further reproduction prohibited without permission.

64suggest that the introduction of checklists in conjunction with both face-to-face
supervisory feedback and e-mail feedback was associated with significant
improvements in seminar and out-of-class completion percentages. Again, because a
component analysis was not conducted, it is difficult to determine the effects of each
of these components independently.
There are several interpretations for the effects of face-to-face supervisor and
e-mail performance feedback. As many authors have indicated, to label information as
“feedback” does not clearly identify its role in controlling behavior (Duncan &
Bruwelheide, 1986). Peterson (1982) has called for the elimination of the term
“feedback” because it does not clearly specify a single function, and hence is
ambiguous. Peterson suggests that when feedback is used in research, it should be
specifically identified and operationalized as an independent variable. For example,
rather than stating “feedback was used to . . . , ” it might be better to say “the use of
individual TA electronic-mail posting was used to . . . ” In other words, one does not
explain the behavioral functions of the information provided by simply stating that
feedback was delivered. Information about an individual’s past performance might act
as an establishing operation, reinforcer, punisher, discriminative stimulus, conditional
stimulus, or play some role in the establishment of rule-governed behavior (Wittkopp
et al., 1990).
Feedback stimuli are often categorized as reinforcers or discriminative stimuli
(Peterson, 1982). However, Agnew and Redmon (1992) stated that feedback would
have to be correlated consistently with the presentation of a reinforcer and would
have to evoke behavior immediately in order to function as a discriminative stimulus.
Also, in their analysis, feedback would not only have to increase the probability of
behavior in the future but also follow past instances of that behavior immediately for
Reproduced with permission of the copyright owner. Further reproduction prohibited without permission.

65that feedback to be considered a reinforcer (or perhaps more precisely, for the
underlying process to be considered reinforcement). In other words, these
contingencies must be direct-acting contingencies in order to be reinforcement
contingencies.
Malott (1992) defined the direct-acting contingency as one in which
immediate consequences directly reinforce or punish behavior. An effective
contingency with an outcome that is too delayed to directly reinforce or punish the
behavior is an indirect-acting analog contingency. According to Malott, an indirect-
acting contingency can control behavior only when it is described by a rule; thus
behavior under the control of indirect-acting contingencies must be rule-governed.
Several authors (Agnew & Redmon, 1992; Malott, 1992; Peterson, 1982)
suggested that many examples of feedback can be explained in terms of rule-
governed behavior. Malott, Shimamune, and Malott (1992) argued that procedures
based on rule-governed analogs to direct-acting contingencies are used more
frequently in organizational behavior management research as compared to
procedures based on direct-acting contingencies alone. Agnew and Redmon (1992)
stated that rules describe behavioral contingencies and that behavior is evoked by the
events described by the rules. Malott (1992) suggested that people readily follow
rules describing indirect-acting contingencies, in spite of the delay, provided the
outcomes are sizable and probable.
In this study, the TAs received rules describing the indirect-acting
contingencies (i.e., delayed performance feedback). For example, TAs were told:
“The number of completed tasks for each seminar will be used to calculate a seminar
completion percentage you will receive via e-mail at the end of the week.”
Reproduced with permission of the copyright owner. Further reproduction prohibited without permission.

66Based on an analysis of rules as contingency-specifying stimuli by Blakely and
Schlinger (1987), Agnew and Redmon (1992) suggested that rules enhance the
effectiveness o f a variety of stimuli in the immediate environment, and it is those
altered stimuli which now directly control the behavior. They suggested that rules can
alter the evocative function of discriminative stimuli, the reinforcing or punishing
function of consequent stimuli, and the function of stimuli in respondent relations.
For example, the task checklists could function as discriminative stimuli which affect
the amount of work done, and completed out-of-class assignments and checklists
could function as reinforcing stimuli. According to this interpretation, such stimuli
might maintain superior performance after the statement of the rule.
Continuing with the rule-governed analysis, begun with the discussion of the
checklist, the same behavioral processes underlie the effectiveness of delayed
feedback. The indirect-acting feedback contingency directly reinforces task
completion by escape from the conditional learned aversive stimulus of the checklist
combined with noncompletion of the checklist tasks. The TA then escapes the
conditional learned aversive stimulus by completing the listed seminar and out-of
class tasks and marking the checklist. In this analysis, the immediate events are
primarily negative reinforcing contingencies.
But what role does the feedback play? For example, TAs were told: “If you
complete all of the assigned tasks while conducting a seminar, you will receive a
100% seminar completion percentage (or a lower percentage, if you complete fewer
tasks) at the end of the week.” This statement made prior to the seminar (even at the
beginning of the semester) is a verbal analog to a pairing procedure; the conditional
stimulus (incompleted tasks, task checklist, and proximity to the deadline) is paired
with the loss of the opportunity for high percentage-complete feedback, and it is also
Reproduced with permission of the copyright owner. Further reproduction prohibited without permission.

67
paired with the receipt o f lower percentage-complete feedback. In that way the
conditional stimulus (incompleted tasks, task checklist, and proximity to the deadline)
becomes a leamed-aversive stimulus. This is analogous to the direct pairing of the
waming-stimulus buzzer and the shock in a traditional, direct-acting, cued-avoidance
procedure—the pairing then causes the buzzer to become a learned aversive stimulus,
the rat escapes, according to the two-factor theory (Mowrer, 1947).
Note that this verbal, rule-governed analog pairing process can occur prior to
the opportunity to do the tasks. The feedback itself could serve to provide additional
analog pairings.
In summary, both interpretations agree that rules work to make delayed
consequences more effective. Agnew and Redmon (1992) suggested that rules
influence behavior by changing the function of a variety of stimuli. Malott (1992)
suggested that rules make delayed consequences more effective through the creation
of aversive stimulation that is escaped when the rule is followed.
After the introduction of the antecedent components, it is possible that
seminar and out-of-class behaviors were influenced by the rules provided at the
beginning of each intervention phase or by rules the TAs developed on their own.
These rules specified relations between performance and the delayed outcomes. In so
doing, they altered the function of a crucial conditional stimulus (incomplete tasks
combined with the checklist and proximity to the deadline) allowing for direct control
over the occurrence of the relevant behavior. It appears then, that the increase and
maintenance of completion percentages may have resulted from a combination of the
antecedent components (task checklists and feedback), the resulting rules (complete
the tasks properly and in a timely basis to receive good feedback), and the indirect-
acting contingencies (the relation between task and delayed performance feedback).
Reproduced with permission of the copyright owner. Further reproduction prohibited without permission.

68
Similar issues were raised in regards to the effects of videotaped feedback on the
number of learn units completed by TAs.
Learn Units
During the first semester, face-to-face supervisor feedback had no statistically
significant effect on the frequency of learn units (question-answer-feedback
sequences) the TAs completed in the seminars. However, during the second
semester, videotaped feedback added to the face-to-face supervisor feedback was
associated with a statistically significant increase in the frequency of learn units. It
may appear that instead of an intervention effect, there was an upward trend (see
Figure 4). However, if the data points for the first session are dropped (a common
practice to eliminate “warm-up” effects), there appears to be considerably less of an
overall upward trend. In the first semester, TAs were simply told the number of leam
units that had been completed in a seminar. In the second semester, TAs were shown
videotape footage of actual classroom performance. Continuing with the rule-
governed analysis, begun with the discussion of the checklist and delayed supervisor
feedback, the same behavioral processes would seem to underlie the effectiveness of
delayed videotape feedback.
The delivery of videotaped feedback might also be considered a form of
training. Odiome and Rummler (1988) suggest that videotape is not only an effective
strategy to be utilized in training, but that the resulting videotapes might then be
disseminated within and outside o f the system for marketing and client relations.
It is important to note, however, that both supervisor and videotaped
feedback were confounded with giving the definition of a completed leam unit to the
TAs at the beginning of each intervention phase. This would have been avoided had
Reproduced with permission of the copyright owner. Further reproduction prohibited without permission.

the definition been provided at the beginning of each baseline phase. While
performance did increase from baseline to intervention in the second semester, no
significant increases in completed leam units were found in the first semester. These
findings suggest that providing the definition of a completed leam unit at the
beginning of the intervention phases may not have affected performance.
The lack o f significant findings in the number of leam units in the first
semester may have been due to the type of feedback provided. In the first semester,
TAs were simply given the total number of leam units completed that seminar as
opposed to viewing videotaped footage of their performance. However, different
groups of TAs and students participated in each semester. So this comparison
between face-to-face supervisor and videotape feedback needs to be examined more
closely using a methodology that tests the effect of the confounding variables
separately.
Overall, job/performer-level performance improved across all three dependent
variables. Improvements in performance (i.e., increased reliability of conducting
seminars and completing out-of-class tasks, increased frequency of leam units) likely
affected the competency level of the TAs, thereby contributing to the second
component of the organizational goal of BATS (i.e., production of competent
behavior analysts). The first component of the organizational goal of BATS (i.e.,
recruitment of BA, MA, and Ph.D. students into behavior analysis) was addressed at
the process-level.
Reproduced with permission of the copyright owner. Further reproduction prohibited without permission.

Process-Level Summary
Researcher Recruitment
Thirteen undergraduate researchers were recruited in each semester to help
conduct behavioral research in BATS in comparison to two or three in previous
semesters. As a result, the process goal o f recruiting one undergraduate researcher
for each subsystem in BATS was achieved. In addition, accomplishing this overall
process goal contributed to the recruitment component of the overall organizational
goal of BATS.
The number of undergraduate researchers, however, that were recruited by
BATS in the semester following the completion of the second intervention declined
to four. This may be due to several reasons. First, the current systems manager was
not provided directions regarding the recruitment process from myself and may not
have been provided instructions or direction from the faculty member. Second, the
number of researchers needed by the various subsystems may have declined since the
end of the current intervention. Third, the number of researchers needed may not
have been assessed. In retrospect, a maintenance plan should have been included as
part of this intervention.
Organizational-Level Summary
If a behavior management program is to be socially valid as well as
scientifically significant, it must be carefully designed to help achieve the mission of a
system (Crowell & Anderson, 1983). Therefore, the performance goals at both the
job/performer and process-levels of BATS were designed to increase the likelihood
BATS would achieve its overall mission. Four organizational-level variables were
Reproduced with permission of the copyright owner. Further reproduction prohibited without permission.

tracked throughout both semesters and the results will be discussed in the following
paragraphs.
Undergraduate Performance
First, undergraduate performance significantly increased from baseline to
intervention on one of two types o f posttests during the first semester and on all three
posttests in the second semester. Undergraduate performance on the 50-question
definition test did not significantly improve across conditions in the first semester but
did in the second semester. This may be due to the fact that there was less room for
improvement from baseline to intervention in the first semester as compared to the
second semester. Overall mean scores increased from 42.7 during baseline to 44 in
the intervention condition of the first semester. In the second semester, overall mean
scores increased from 36.3 during baseline to 39.4 in the intervention condition.
While there were no significant improvements on the 50-question test in the
first semester, the overall mean scores in both phases were higher in comparison to
the overall mean scores in the second semester. This was also the case for the 10-
question definition test. Overall mean scores increased from 5 during baseline to 7.7
in the intervention condition of the first semester. In the second semester, overall
mean scores increased from 2.8 during baseline to 6.2 in the intervention condition.
Additionally, while there were no significant increases in leam units from baseline to
intervention in the first semester, the overall number of leam units completed by all
TAs in the first semester (41.7) was higher than the overall number in the second
semester (33.7). This may be accounted for by the fact that the group o f TAs in the
first semester had been in BATS for a full year prior to this research while the second
group of TAs were new graduate students. The association of higher overall scores
Reproduced with permission of the copyright owner. Further reproduction prohibited without permission.

by undergraduates with a higher overall number of leam units in the first semester
may lend some support to Greer’s (1994) contention that the more leam units
presented by a teacher, the more the student learns. While these data are far from
conclusive, they suggest follow-up research on the effects of leam units on student
performance to determine if a higher frequency of leam units completed by teachers
improves student performance.
Undergraduate Evaluations
Second, the percentage of undergraduate students who reported that they
would pursue behavior analysis academically and/or in a career also increased. The
percentage of students who would pursue behavior analysis academically increased
by 14% from baseline to intervention in the first semester and 17% in the second
semester. The percentage of students who would pursue behavior analysis in a career
increased by 10.5% from baseline to intervention in the first semester and by 24.8%
in the second semester.
Again, these improvements may be due to nonintervention variables. It may
be possible, however, that improvements in the seminars (i.e., seminar completion
percentages, fewer course material errors), in the preparation level o f the TAs (i.e.,
out-of-class assignments), and in the number of leam units completed may have
affected undergraduate evaluations.
Course Material Errors
Third, the average number of mistakes per chapter found by Tas, including
homework quizzes and flashcards, dropped dramatically from the 14 per chapter the
first semester to the 3.8 per chapter in the second semester. This drop in errors was
Reproduced with permission of the copyright owner. Further reproduction prohibited without permission.

73
likely the result of an increase in the rate o f completing out-of-class tasks (i.e.,
specifically course material editing by TAs) which significantly improved in both
interventions.
System Disconnects
Fourth, the number of system disconnects also decreased across semesters.
There were a total of 13 system disconnects measured in the first semester as
compared to 3 system disconnects in the second semester. It is likely the case that the
improved out-of-class procedures helped the TAs, systems manager, and faculty
member identify and correct systems disconnects more readily. It is recommended
that the current and future Psy. 460 systems managers continue to monitor the
number and type of systems disconnects. Currently, system disconnects are not being
measured, suggesting a need for a maintenance program and top management
support which quality improvement literature suggests is vital to ongoing
improvement efforts.
Wolverton (1996) suggests that an over-reliance on tradition and maintenance
of the status-quo can create a system that is resistant to change. In addition, quality
improvements require time, money, and effort. For this reason, Wolverton suggests
that quality improvement interventions require the ongoing endorcement of
organizational leadership. For example, college deans might encourage faculty
members to seek quality improvements by allowing faculty members to assess the
needs for improvements; then the dean might help by providing additional funding for
quality improvements. He continues by suggesting that faculty members can continue
this process with students through competency-based assessment, assessment for
improvement, and self-assessment.
Reproduced with permission of the copyright owner. Further reproduction prohibited without permission.

Recommendations
Five recommendations are suggested by the results of the present study and
the three models used to guide its direction.
First, future research should attempt to affect the third component of the
overall mission of BATS: maintaining competent behavior analysts. Steps should be
taken to determine how many graduating students are being placed in behavioral
programs and careers. Also, organizations should be contacted to determine their
requirements with respect to the skill-levels of potential graduate students and
current employees. For example, graduate programs might require a particular
behavioral repertoire of incoming graduate students. The subsystems within BATS
should also be analyzed to determine if these skills are being effectively taught. An
intervention to aid in student placement should be developed. In addition, close
contact with those successfully-placed students should be maintained. This might
provide a mechanism for future placements as well as assist in the maintenance of
placed students.
Second, the number of recruits dropped so dramatically following the high
levels of research recruits obtained during the present intervention that future systems
interventions involving BATS should address the status of the undergraduate-
researcher recruitment process. The recruiting process contributes to the overall
mission of BATS and should be analyzed, especially in this system manager’s
observation, to identify the disconnects. If the decline in the number of researchers
recruited into BATS continues, the 15 subsystems will themselves perform less
effectively and efficiently, due to the lack of research assistants to run them. In
addition, as current MA students graduate, it will take more time to train new MA
Reproduced with permission of the copyright owner. Further reproduction prohibited without permission.

75
students who have no prior research experience in BATS than those new MA
students who have previously contributed to the research in the BATS subsystems.
Finally, there will be more opportunity for systems competing for BATS’ resources
to recruit these same students.
The current BATS subsystems must be evaluated to determine the need for
researchers and process goals must be set. Then, the current systems manager can
begin analyzing the process by constructing an “Is” map and then possibly developing
a new “Should” map. Comparing actual performance to performance goals and
taking appropriate actions is an important strategy in quality control (Juran, 1993).
Third, from the point of view o f educational research, the effects of the
frequency of leam units in the seminar on undergraduate performance on the
conceptual posttest should be examined more closely. The current results suggest
that leam units may play a role in improving student performance, although the data
are far from conclusive. Therefore, an experiment might be performed where the
number of leam units is varied and the effect on conceptual test performance is
measured.
Furthermore, goals or standards should be set for the frequency of leam units
completed by TAs as well as for seminar and out-of-class tasks. Standards might be
based on the performance of the current TAs. Each chapter of homework might have
a single number or range of leam units as the criterion for performance appraisals.
Fourth, a variety of videotape interventions should be compared. The
introduction of videotaped feedback in the present study was associated with
significant increases in leam units. This study could be replicated with some
adjustments. First, the definition of a leam unit could be provided initially, instead of
at the beginning of the intervention condition to eliminate this possible confound.
Reproduced with permission of the copyright owner. Further reproduction prohibited without permission.

Second, the effects of the duration of videotaped feedback could be examined. It may
be that a longer feedback session might improve performance more.
TAs might be provided with training videos of models rather than videotaped
feedback of their own performance before seminars. From a cost/benefit analysis, if
training tapes were found to be as effective as videotaped feedback, this could save
time. For example, training tapes might be used once at the beginning of the semester
instead of providing videotaped feedback twice a week. Also, future TAs might view
their performance without supervisor feedback. This would save the systems manager
time.
Finally, additional performance variables listed in the behavior engineering
model might be included in future interventions. For example, various types of
training interventions might be possible, including modifications of this videotape
intervention. Furthermore, programmed consequences might be introduced. It is
possible that other leverage points (i.e., performance variables listed in the behavior
engineering model) might be more effective at improving performance in a more cost
effective manner.
Even more important, to extend the impact of such research to bear more
directly on the larger issues concerning the performance of our educational system as
a whole, all future interventions should examine the effects these areas have on the
three levels of performance (i.e., organization, process, and job/performer levels).
Reproduced with permission of the copyright owner. Further reproduction prohibited without permission.

Appendix A
Behavioral Engineering Model
77
Reproduced with permission of the copyright owner. Further reproduction prohibited without permission.

78
Antecedents B ehavior Prerequisites Consequences
Information/Directions• Good prompts and
direction?• Proper feedback?
Equipment/Procedures
• Equipment accessible?• Efficient procedures?
Contingencies
• Favor desired performance?
Knowledge
• Proper training?
Capacity
• Prerequisite abilities?
Motives
• Subjects motivated by job consequences?
Reproduced with permission of the copyright owner. Further reproduction prohibited without permission.

Appendix B
Behavioral Checklist
79
Reproduced with permission of the copyright owner. Further reproduction prohibited without permission.

80
SEMMAR PROCESS: Chapter: Date: -Chairs in a semi-circle
TA: Reliability
- AV equipment setup- Materials returned on desktops-Grade sheet posted- Begin class on time- Project A review agenda transparency- Ask students to get out standard materials• Ask for any questions on previous H.W.• Ask for any questions on current H.W.• Discuss present H.W. (including transparencies)- S Minute break-Ask students to leave H.W, scantrons & quizzes-Handout quizzes• Pick up materials• Conduct any necessary SOI's
OUT OP CLASS ASSIGNMENTS: -Review Chp.- Review Hashcards- Number of points• Review Quiz-Agenda-Revise Hashcards-Revise Quiz-NCSKey-Number of mistakes for Chp.___.Hashcards__ , and Out___- Assigned/Completed Tasks
LEARN UNfTS Researcher Reliability
• Number of Leam Units
Reproduced with permission of the copyright owner. Further reproduction prohibited without permission.

Appendix C
10-Question Definition Test
SI
Reproduced with permission of the copyright owner. Further reproduction prohibited without permission.

82Score /10 TA First Name:____ Last Name:___
Psy. 460/597
Review Terms from ELEMENTARY PRINCIPLES OF BEHAVIOR
1. Discriminitive stimulus (1) -
2. Reinforcer (1)-
3. Establishing operation (1) -
4. Conditioned stimulus (1) -
5. Warning stimulus (1) -
6. Rules that are hard to follow (1)-
7. Rule-governed analog to reinforcement by the presentation of a reinforcer (1)-
8. External validity (1) -
9. Extinction (1) -
10. Behavior analysis (1) -
Reproduced with permission of the copyright owner. Further reproduction prohibited without permission.

Appendix D
50-Question Multiple-Choice Test
83
Reproduced with permission of the copyright owner. Further reproduction prohibited without permission.

84
GENERAL BEHAVIOR ANALYSIS EVALUATIONSelect the mo«t specific and most technically correct answer. Marie your aiBwtn on the answer sheet, not on this sheet. Also mark your name eta on the answer sheet Thanks.
1. ___ a stimulus, event, or condition, immediately following a response, that will increase the likelihood of thattype of response, in the future.a. reinforcerb. repertoirec. borderline bulimiad. a behavioral intervention
2. ___ a view of human behavior that the behavior is a mere symptom of an underlying psychological condition.a. behavior analysisb. behavior analystc. medical modeld. none of the above
3. response-contingent immediate presentation of a reinforcer resulting in an increased frequency o f thatresponse.a. behavioral connectionb. bribec. delayed gratificationd. reinforcement
4. the occasion for a response, the response, and the outcome of the response.a. behavioral connectionb. behavioral contingencyc. gestaltd. reinforcement by the presentation of a reinforcer
5. response-contingent presentation of an aversive condition resulting in a decreased frequency of that response.a. punishmentb. reinforcementc. extinctiond. avoidance
6. any stimulus, event, or condition that will increase the future likelihood of a response, if the termination of that condition immediately follows the response.a. alternative stimulusb. aversive conditionc. positive reinforcerd. terminational stimulus
7. ___the replacement of a maladaptive response with an adaptive response that produces the same reinforcingoutcome (i.e., either the removal or reduction of an aversive condition or the presentation of a reinforcing condition).a. differential reinforcement of alternative behaviorb. symptom substitutionc. punishment by the presentation of an aversive conditiond. the sick social cycle
Reproduced with permission of the copyright owner. Further reproduction prohibited without permission.

858. When a resident trashed the ward of an institution, the behavior analyst required that she nuke the ward
even better and cleaner than before.a. negative reinforcementb. positive reinforcementc. ovc[correctiond. extinction
9. the removal of access to reinforcers, contingent on a response, with a resulting decreased likelihood of that response.a. preventionb. escapec. punishment by the presentation o f aversive conditionsd. time-out
10. the effects of our actions determine whether we will repeat them.a. controverted effectb. the adverse effectc. the law of effectd. actional effect
11. stopping the reinforcement or escape contingency for a previously reinforced response causes the response rate to decreasea. control conditionb. extinctionc. forgetting procedured. punishment
12. temporary reappearance of extinguished behavior.a. control conditionb. forgetting processc. spontaneous recovery from extinctiond. temporary resurgence
13. reinforcing one set of responses and not reinforcing another set of responses increases the rate of thereinforced set of responses, relative to the other seta. complex behavior analysisb. differential reinforcementc. multi-element designd. selective reinforcement
14. set o f responses that either are similar on at least one response dimension, or serve the same function (produce the same outcome), or share the effects of reinforcement and punishmenta. common setb. crucial groupc. response classd. response differentiation
using reinforcers to reinforce responses that more and more closely resemble the terminal responsea. minimal response methodb. shaping with reinforcersc. terminal behavior or terminal response development
Reproduced with permission of the copyright owner. Further reproduction prohibited without permission.

16. a procedure that affects learning and performance with respect to a particular reinforcer or aversivecondition.a. establishing operationb. Pretnack procedurec. procedure of reinforcer specificityd. sensitization
17. if one activity occurs more often than another, the opportunity to do the most frequent activity will reinforcethe less frequent activitya. added (extrinsic) reinforcement contingencyb. principle of deprivation and satiationc. establishing operationd. Premack principle
18. a reinforccr for which repeated exposure is an establishing operation.a. addictive reinforccrb. adjunctive reinforcerc. early stimulus reinforccrd. other-delivery reinforccr
19. a learned reinforcer that is a reinforcer, because it was paired with a wide variety of other reinforcers, whenthe organism has been deprived of those other reinforcers.a. deprivational reinforccrb. variegated reinforcerc. paired reinforccrd. none of the above
20. a system of learned generalized reinforcers in which the organism that receives those generalized reinforcerscan save them, and exchange them for a variety of backup reinforcers, later.a. token economyb. backup systemc. briberyd. none of the above
21. a stimulus in the presence of which a response will be reinforced or punished.a. SDb. promptc. S4d. warning stimulus
22. reinforcing or punishing a response in the presence of one stimulus and extinguishing it or allowing it to recover in the presence of another stimulusa. discrimination training procedureb. intervention designc. reversal designd. alternating design
23. the organism emits the same response to a different stimulusa. class differentiationb. common stimulic. stimulus generalizationd. (indefinable stimulus control
24. the use of a fading procedure to establish a discrimination, with essentially no errors during the traininga. errorless discrimination procedureb. establishment procedurec. gradual change procedured. gradual dimension
Reproduced with permission of the copyright owner. Further reproduction prohibited without permission.

8725. imitating the response o f a model without previous reinforcement of the imitation of that response
a. generalized imitationb. the nonrcinforcement procedurec. transfer of imitationd. verbal stimulus method (verbal approach)
26. selecting a ’variable* comparison stimulus equal to a sample stimulus.a. equal selectionb. matching to sample (stimulus matching)c. physical approximation method (physical approach)d. stimulus selection
27. after a response is reinforced, no responding occurs for a period of time, then, ABRUPTLY responding occurs at a high, steady rate until the next reinforcer is delivereda. continuous-rcinforcement respondingb. fixed-ratio respondingc. variable-interval respondingd. variablc-ratjo responding
28. the way reinforcement occurs, as a result o f the number of responses, time between responses, and stimulus conditionsa. availability schedule of reinforcementb. schedule of reinforcementc. the schedule of occasional reinforcementd. foe reinforcement matrix
29. a reinforccr is delivered after foe passage of a fixed period of time, independently of foe responsea. independence programmingb. fixed-interval schedule of reinforcementc. fixed-time schedule of reinforcementd. extinction training
30. reinforcement is available for only a limited time.a. independence programmingb. fixed-interval schedule of reinforcementc. limited holdd. no correct answer in this list
31. more than one contingency of reinforcement or punishment is in effect at foe same time.a. behavioral relativityb. concurrent contingenciesc. differential reinforcement of incompatible behaviord. multiple schedule
32. foe relative rate of responding on two concurrent schedules of reinforcement equals foe relative rate of reinforcement on those two schedules.a. behavioral relativityb. concurrency principlec. underlying causesd. matching law
33. If you get rid of one behavior, another will take its place, until you get rid of foe underlying cause of foeproblem.a. behavioral relativityb. concurrent contingencyc. underlying causesd. symptom substitution
Reproduced with permission of the copyright owner. Further reproduction prohibited without permission.

8834. the establishment o f the final link in a stimulus-response chain, with the addition of successive links, until
die first link is acquired.a. backward chainingb. forward chainingc. successive linkaged. the first link last method
35. With differential reinforcement of low rate, a response must occur before the reinforccr is delivered.a. trueb. false
36. a neutral stimulus acquires the eliciting properties o f an unconditioned stimulus through pairing theunconditioned stimulus with a neutral stimulus.a. acquisitional conditioningb. establishing operationc. habituationd. respondent conditioning
37. combining relaxation with a hierarchy of fear-producing stimuli, arranged from the less to the most frightening.a. acquisitional conditioningb. decondtioningc. higher-order conditioningd. systematic desensitization
38. a description of a behavioral contingencya. contingency controlb. descriptive contingencyc. independent variabled. rule
39. behavior under the control of a rulea. controlled behaviorb. dependent variablec. rule-governed behaviord. subjective behavior
40. the phase of the experiment where the dependent variable is measured in the absence of the interventiona. baselineb. contingency controlc. independent variabled. nonintervention phase
41. number of instances of behavior over time.a numerosityb. rate or frequencyc. relative frequencyd. latency
42. In behavioral psychology, what is usually placed along the horizontal axis of a graph?a. hypothetical constructb. intervening variablec. independent variabled. dependent variable
Reproduced with permission of the copyright owner. Further reproduction prohibited without permission.

8943. an experimental design in which the replications involve baselines of differing durations and, therefore,
interventions of differing starting timesa. component analysisb. differential-baseline designc. method of response repetitiond. multipie-baseline design
44. private behavior (not visible to the outside observer)a. covert behaviorb. intuitive controlc. mystical behaviord. none of the above
45. a written rule statement describing the desired or undesired behavior, the occasion when the behaviorshould or should not occur, and the added outcome for that behavior.a. performance contract or contingency contractb. written role statementc. specification sheetd. the accounting of occasions or accountancy agreement
46. pay (usually with money or the equivalent) is contingent on specific agreed-upon achievements.a. pay for performanceb. the immediate change methodc. briberyd. achievement programming
47. Add a reinforcement contingency to increase the rate of behavior. Then the behavior will frequently contact built-in reinforcement contingencies. And those built-in contingencies will maintain that behavior.a. the incremental methodb. the principle of the behavior trapc. the built-in procedured. the frequent contact method
48. the goals, procedures, and results of an intervention arc socially acceptable to the client, the behavioranalyst, and society.a. social validityb. internal validityc. external validityd. consential validity
49. reliability between observations of two or more independent observers.a. internal validityb. external validityc. consential validityd. interobserver agreement
50. The rate of a response is a typical example.a. hypothetical constructb. intervening variablec. independent variabled. dependent variable
Reproduced with permission of the copyright owner. Further reproduction prohibited without permission.

Appendix E
13-Question Short-Answer Conceptual Test
90
Reproduced with permission of the copyright owner. Further reproduction prohibited without permission.
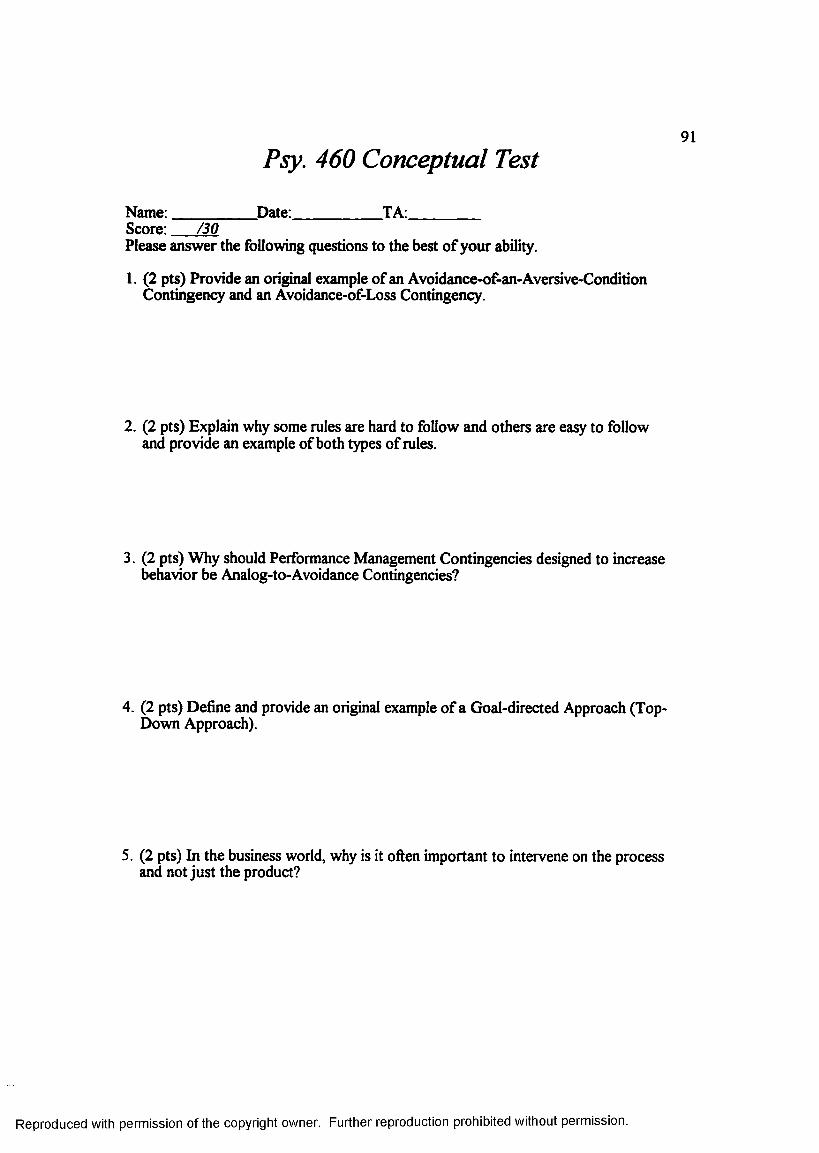
91Psy. 460 Conceptual Test
Name:__________ Date:___________ TA:_________Score: /30Please answer the following questions to the best of your ability.
1. (2 pts) Provide an original example of an Avoidance-of-an-Aversive-Condition Contingency and an Avoidance-of-Loss Contingency.
2. (2 pts) Explain why some rules are hard to follow and others are easy to follow and provide an example of both types of rules.
3. (2 pts) Why should Performance Management Contingencies designed to increase behavior be Analog-to-Avoidance Contingencies?
4. (2 pts) Define and provide an original example of a Goal-directed Approach (Top- Down Approach).
5. (2 pts) In the business world, why is it often important to intervene on the process and not just the product?
Reproduced with permission of the copyright owner. Further reproduction prohibited without permission.

926. (6 pts) Define the six steps of Behavioral Systems Analysis and provide a short
example for each step.
1)
2)
3)
4)
5)
6)
7. (2 pts) Describe a behavioral contingency and explain how this example could either be under contingency control or rule control.
8. (2 pts) Provide an original example of the Two-Factor Theory of Avoidance.
9. (2 pts.) Provide an example of the Error of Reification.
10. (2 pts) What are three problems with Labels (e.g., John is an “aggressive” child.)?
1)
2)
3)
Reproduced with permission of the copyright owner. Further reproduction prohibited without permission.

93
11. (2 pts) Do we treat the “feelings of depression” by changing the feelings or by changing the contingencies? Do an armchair behavioral analysis and provide a likely cause for the “feelings of depression.”
12. (2 pts) Describe the details of a realistic procedure for addressing a behavioral problem particularly relevant or of interest to you (e.g., driving too fast, not practicing safe sex).
13. (2 pts) Please diagram the three-contingency model for your procedure.
Three- Contingency Diagram
Reproduced with permission of the copyright owner. Further reproduction prohibited without permission.

Appendix F
Evaluation Psy. 460
94
Reproduced with permission of the copyright owner. Further reproduction prohibited without permission.

Evaluation P460
Please evaluate each of the following items and comment according to your persona] view. Do not put your name on this form.Semester:______ Year:________Course Assistant:_____
Please rate the following questions:
1. What’s your overall evaluation of the course?Great 1 2 3 4 5 Bad
2. What’s your overall evaluation of the materials utilized in this course (e.g., textbook, and flashcards)?Great 1 2 3 4 5 Bad
3. How well does your teaching assistant facilitate learning the material (e.g., prompting, providing corrective feedback or reinforcement for responses)? Well 1 2 3 4 5 Little
4. How well does your teaching assistant demonstrate mastery of the material? Well 1 2 3 4 5 Little
5. How well does your teaching assistant run your seminar (e.g., room setup, grade sheets posted, answering difficult questions from previous homework, providing a break before quizzes, and returning corrected material in a timely manner)?Well 1 2 3 4 5 Little
Please rank the following items in terms of importance:1.
□ Mastery of the course materials on the part of the TA□ The quality of the course materials□ Facilitation of learning (e.g., prompts and questions by the TA and
clear feedback)□ The manner in which the seminar is conducted
Please answer the following questions to the best of your ability:
1. Do your future academic plans involve behavior analysis?______2. Do your future career plans involve behavior analysis?________
Reproduced with permission of the copyright owner. Further reproduction prohibited without permission.

Appendix G
Protocol Clearance From the Human Subjects Institutional Review Board
96
Reproduced with permission of the copyright owner. Further reproduction prohibited without permission.

97
Human Subjects Institutional Review Board Kalamazoo. Nficrtgan 43008-3899 616 387-8293
W e s t e r n M ic h ig a n U n iv e r s it y
To: Dr. Richard MalottTobias LaFleur
From: Richard A. Wright, ChairHuman Subjects Institutional Review Board
Subject: HSlKB troject # V6-U9-03
Date: September 13,1996
This is to inform you that your project entitled “Psy. 460: A Systems Analysis,” has been approved under the exempt category of research. This approval is based upon your proposal as presented to the HSIRB, and you may utilize human subjects only in accord with this approved proposal.
Your project is approved for a period of one year from the above date. If you should revise any procedures relative to human subjects or materials, you must resubmit those changes for review in order to retain approval. Should any untoward incidents or unanticipated adverse reactions occur with the subjects in the process of this study, you must suspend the study and notify me immediately. The HSIRB will then determine whether or not the study may continue.
Please be reminded that all research involving human subjects must be accomplished in full accord with the policies and procedures of Western Michigan University, as well as all applicable local, state, and federal laws and regulations. Any deviation from those policies, procedures, laws or regulations may cause immediate termination of approval for this project
Thank you for your cooperation. If you have any questions, please do not hesitate to contact me.
Project Expiration Date: September 13,1997
Reproduced with permission of the copyright owner. Further reproduction prohibited without permission.

Appendix H
Conducting Behavior Analysis Research and Development Projects
98
Reproduced with permission of the copyright owner. Further reproduction prohibited without permission.

99
Conducting Behavior Analysis Research and Development Projects
Name:_______________
Please answer the following questions to the best of your ability.
1. On a scale from 1 (Very Interested) to 5 (Not Interested), how interested are you in attending graduate school?__
2. On a scale from 1 (Very Interested) to 5 (Not Interested), how interested are you in eventually obtaining a MS (or Ph.D.) degree in psychology?___
3. On a scale from 1 (Very Interested) to 5 (Not Interested), how interested are you in attending graduate school at Western Michigan University?
4. On a scale from 1 (Very Interested) to 5 (Not Interested), how interested are you in Behavior Analysis?__
5. Are you interested in helping to conduct a behavioral research and development project probably related to Psy. 460?(Y )/(N )_
6. Are you a member of the honors college?(Y)/(N)__
7. Overall G.P.A.? ___
8. Phone Number: ___
Reproduced with permission of the copyright owner. Further reproduction prohibited without permission.

BIBLIOGRAPHY
Acheson, H. A. (1964). The effects o f feedback from television recordings and three types o f supervisory treatment. Unpublished manuscript, Stanford University.
Agnew J. L., & Redmon, W. K. (1992). Contingency specifying stimuli: The role of rules in organizational behavior management. Journal o f Organizational Behavior Management, 12, 67-76.
Albers, A., & Greer, R. D. (1991). Is the three-term contingency trial a predictor of effective instruction? Journal o f Behavioral Education, 1(3), 337-354.
Anderson, D. C., Crowell, C. R., Sponsel, S. S., Clarke, M., & Brence, J. (1982). Behavior management in the public accommodation industry: A three-project demonstration. Journal o f Organizational Behavior Management, 4, 33-67.
Aquino, J. (1975). The preparation of college teachers. Journal o f Teacher Education, 25, 78.
Bacon, D. L., Fulton, B. J., & Malott, R. W. (1983). Improving staff performance through the use of task checklists. Journal of Organizational Behavior Management, 4, 17-25.
Bailey, G. D. (1978). Improving classroom instruction: Is there a better model? NASSP Bulletin, 1, 52-59.
Balcazar, F. E., Hopkins, B., & Suarez, Y. (1986). A critical, objective review of performance feedback. Journal o f Organizational Behavior Management, 7, 65-89.
Bartalo, D. (1988). Turn “B” teachers into A+s.” The School Administrator, I1(AS), 15-17.
Bernstein, B. L., & Lecomte, C. (1979). Supervisory-type feedback effects: Feedback discrepancy level, trainee psychological differentiation, and immediate responses. Journal o f Counseling Psychology, 26, 295-303.
Blakely, E., & Schlinger, H. (1987). Rules: Function-altering contingency-specifying stimuli. The Behavior Analyst, 10, 183-187.
Bolton, D. (1973). Selection and evaluation o f teachers. Berkeley, CA: McCutchan Publishing Corporation.
100
Reproduced with permission of the copyright owner. Further reproduction prohibited without permission.

101
Borko, H., Eisenhart, M., Underhill, R. G., Brown, C. A., Jones, D., & Agard, P. C. (1991). To teach mathematicsfor conceptual and procedural knowledge: A dilemma o f learning to teach in the “new world order ” of mathematics education reform. Paper presented at the annual meeting of the American Education Research Association, Chicago.
Brethower, D. L. (1972). Behavioral analysis in business and industry: A total performance system. Kalamazoo, MI. Behaviordelia.
Brethower, D. L. (1993a). Strategic Improvements of Workplace Competencies I: Breaking out of the incompetence trap. Performance Improvement Quarterly,5(2), 17-28.
Brethower, D. L. (1993b). Strategic Improvements of Workplace Competencies II:The economics of competence. Performance Improvement Ouarterly, 5(2),29-42.
Bullough, R. V., Jr. (1990). Supervision, mentoring, and self-discovery: A case study of the first year teacher. Journal o f Curriculum and Supervision, 5, 338-360.
Calabrese, R. (1986). Effective schools and classroom instruction. The Clearing House, 59(6), 272-274.
Cleary, B. A. (1996). Relearning the learning process. Quality Progress, 4, 79-85.
Crowell, C. R., & Anderson, C. D. (1983). Systemic behavior management: General program considerations. Journal o f Organizational Behavior Management, 5, 129-163.
Deming, W. E. (1986). Out o f the crisis. Cambridge, MA: Massachusetts Institute of Technology Center for Advancement of Engineering Study.
Duncan, P. K., & Bruwelheide, L. R. (1986). Feedback: Use and possible behavioral functions. Journal of Organizational Behavior Management, 7, 91-114.
Fairbank, J. A., & Prue, D. M. (1982). Developing performance feedback systems. In L. W. Frederiksen (Ed.), Handbook o f behavior management, (pp. 281-290).New York: Wiley.
Ford, J. E. (1984). A comparison of three feedback procedures for improving teaching skills. Journal o f Organizational Behavior Management, 6, 65-77.
Fowlkes, W. Y. (1995). Engineering methods for robust product design: Using taguchi methods in technology and product development. Addison-Wesley.
Friebel, A. C., & Kallenbach, W. (1968). Effects o f videotape feedback and microteaching as developed in the field test o f minicourse I with student teachers. Unpublished manuscript, Far West Laboratory for Educational Research and Development, Berkeley.
Reproduced with permission of the copyright owner. Further reproduction prohibited without permission.

102
Gamble, M. (1976). College teacher training: Myth or reality? Unpublished manuscript, Queens College.
Gilbert, T. F. (1978). Human competence: Engineering worthy performance. New York: McGraw-Hill.
Greer, R. D. (1994). The measure of a teacher. Behavior Analysis in Education:Focus on measurably superior instruction. Pacific Grove, CA: Brooks/Cole.
Harrington, H. J. (1991). Business process improvement: The breakthrough strategy for total quality, productivity, and competitiveness. New York: McGraw-Hill.
Hartshorn, R. L., & Prather, J. P. (1988). Examination of Tennessee teachers’ attitudes toward videotape-jury reviews as an alternative for career ladder evaluation. Education, 108(4), 433-442.
Ingham, M., & Greer, R. D. (1992). Functional relationships between supervisors’ observations of teachers in observed and generalized settings. Journal o f Applied Behavior Analysis, 25, 153-164.
Jacknicke, K. G., & Samiroden, W. E. (1990). Some perceptions of an internship program. Alberta Journal o f Educational Research, 37, 99-118.
Jacobsen, W. (1987). The rewards of instructional leadership. National Association of Secondary School Principals Bulletin, 7/(498), 57-58, 60-66.
Jensen, L. C., & Young, J. I. (1972). Effect of televised simulated instruction on subsequent teaching. Journal o f Educational Psychology, 63, 368-373.
Johnson, K. R., & Sulzer-Azaroff, B. (1978). An experimental analysis of proctor prompting behavior in a personalized instruction course. Journal o f Personalized Instruction, 5(3), 122-130.
Juran, J. M. (1988). Juran's quality control handbook New York: McGraw-Hill.
Juran, J. M. (1993). Quality planning and analysis: From product development through use. New York: McGraw-Hill.
Kagen, D. (1992). Professional growth among preservice and beginning teachers.Review of Educational Research, 62(2), 129-169.
Kiesler, S., Siegel, J., & McGuire, T. W. (1984). Social psychological aspects of computer-mediated communication. American Psychologist, 39, 1123-1134.
Komaki, J., Waddell, W. M., & Pearce, M. G. (1977). The applied behavior analysis approach and individual employees: Improving performance in two small businesses. Organizational Behavior and Human Performance, 19, 337-352.
Reproduced with permission of the copyright owner. Further reproduction prohibited without permission.
103LaFleur, T., & Hyten, C. (1995) Improving the quality of hotel banquet staff
performance. Journal o f Organizational Behavior Management, 15, 69-93.
Lamal, P. A., & Benfield, A. (1978). The effect of self-monitoring on job tardiness and percentage of time spent working. Journal o f Organizational Management,1, 142-149.
Lambert, J. R. (1989). The workforce challenges of the 21st century. Washington,DC: CUE/NAM.
Legge, W. B., & Asper, L. (1972). The effect of videotaped microteaching lessons on the evaluative behaviors of pre-student-teachers. Journal o f Teacher Education, 23(3), 363-366.
Malott, R. W. (1992). A theory of rule-governed behavior and organizationalbehavior management. Journal o f Organizational Behavior Management, 12, 43-64.
Malott, R. W., Shimamune, S., & Malott, M. E. (1992). Rule-governed behavior and organizational behavior management: An analysis of the literature. Journal o f Organizational Behavior Management, 12, 103-116.
Malott, R W., Vunovich, P. L., Boettcher, W., & Groeger, C. (1995). Saving the world by teaching behavior analysis: A behavioral systems approach. The Behavior Analyst, 18, 341-356.
Manley, R., & Manley, J. M. (1996). Sharing the wealth: TQM spreads from business to education. Quality Progress, 6, 51-55.
March, J. K., Peters, R. H., Schwartz, M., & Crisci, P. E. (1993). The long-term impact o f a staff development program on student performance in an urban setting. Paper presented at the annual meeting of the American Educational Research Association, Atlanta.
McConnell, A., & Fages, S. (1980). Videotaped feedback in physical education methods class. Journal o f Physical Education and Recreation, 51, 64-65.
McGarvey, B., & Swallow, D. (1986). Microteaching in teacher education training. Crrom Helm.
McGreal, T. (1988). Evaluation for enhancing instruction: Linking teacher evaluation and staff development. In S. Stanley and W. J. Popham (Eds.), Teacher evaluation: Six prescriptions for success (pp. 1-29). Alexandria, VA:Association for Supervision and Cumulative Development.
McKnight, P. C. (1971). Microteaching in teacher training: A review of research. Research in Education, 6, 24-28.
Reproduced with permission of the copyright owner. Further reproduction prohibited without permission.

104Melan, E. H. (1992). Process management: Methods for improving products and
service. New York: McGraw-Hill.
Mertz, D. C. (1972). The effects o f split-screen videotaping as a vehicle to encourage teacher self-analysis. Unpublished manuscript, University of Toledo.
Morasky, R. L. (1982). Behavioral systems. New York: Praeger.
Mowrer, O. H. (1947). On the dual nature of learning—A reinterpretation of “conditioning” and “problem-solving.” Harvard Educational Review, 17,102-148.
O’Brien, G. E., & Korth, W. W. (1991). Videotaping: A tool for enhancing the teacher’s understanding of cognitive science and teacher self-development.Journal o f Science Teacher Education, 2(4), 90-93.
Odiome, G. S., & Rummler, G. A. (1988). Training and development: A guide for professionals. Chicago: Commerce Clearing House, Inc.
Olivero, J. L. (1964). Video recordings as a substitute for live observations in teacher education. Unpublished doctoral dissertation, Stanford University.
Orme, M. E. J., McDonald, F. J., & Allen D. W. (1966). The effects o f modeling and feedback variables on the application of a complex teaching strategy.Unpublished paper. (ERIC Document Reproduction Service No. ED 014 441)
Pennypacker, H. S. (1994). A selectionist’s view of the future of behavior analysis in education. Behavior analysis in education: Focus on measurably superior instruction. Pacific Grove, CA: Brooks/Cole.
Peterson, N. (1982). Feedback is not a new principle of behavior. The Behavior Analyst, 5, 101-102.
Picot, A., Klingensberg, H., & Kranzle, H. (1982). Office technology: A report on attitudes and channel selection from field studies in Germany. In M. Burgoon (Ed.), Communication yearbook 6. Beverly Hills, CA: Sage.
Prue, D. M., & Fairbank, J. A. (1981). Performance management in organizational behavior management: A review. Journal o f Organizational Behavior Management, 3, 1-15.
Rummler, G. A., & Brache, A. P. (1990). Improving performance: How to manage the white space on the organizational chart. San Francisco: Jossey-Bass.
Schlinger, H. D., Blakely, E., Fillhard, J., & Polings A. (1991). Defining terms in behavior analysis: Reinforcer and discriminative stimulus. The Analysis o f Verbal Behavior, 9, 153-161.
Reproduced with permission of the copyright owner. Further reproduction prohibited without permission.

105
Sharpies, K. A., Slusher, M., & Swaim, M. (1996). How TQM can work in education. Quality Progress, 5, 75-78.
Steinfield, C. (1986). Computer-mediated communications systems. In M E.Williams (Ed.), Annual review o f information science and technology. White Plains, NY: Knowledge Industry.
Sulzer-Azaroff, B., & De Santamaria, M. C. (1980). Industrial safety hazard reduction through performance feedback. Journal o f Applied Behavior Analysis, 13, 287-295.
Whitman, N. A. (1988). Peer teaching: To teach twice is to learn twice (ASHE- ERIC Higher Education Report No. 4). Washington, DC: Association for the Study of Higher Education.
Wittkopp, C. J., Rowan, J. F., & Poling, A (1990). Use of a feedback package to reduce machine set-up time in a manufacturing setting. Journal o f Organizational Behavior Management, 11, 7-22.
Wolverton, M. (1996). The zealots and the old guard. Quality Progress, 6, 65-71.
Reproduced with permission of the copyright owner. Further reproduction prohibited without permission.