Embed Size (px)
Citation preview

������������������� ���������������������� �����
������������� ���� ������ ��
��������������� �����
American Indian and Alaska Native Mental Health Research Copyright: Centers for American Indian and Alaska Native Health
Colorado School of Public Health/University of Colorado Anschutz Medical Campus (www.ucdenver.edu/caianh)

�������������� ��������������������
���������������� !! ��"��������
����������������
����� ������� ��� ������� �� ������ �������������������������������� �������� ��!���"���������
���#$$#� �#�%��� ��� #%%#�� #��#��!����������������������������������� �����������������������������
����%��&�� �#��$�%���!��� �#''�#(� )�*���������������������������������� ����������������
!��$����#)�#���!��� ����� )�� )�+)#��!�����������������$������ ���,����������"���"�������������
���#������%��!��!��� ��(�#� ��!#���������,����������"���"������������� ��������������!��������
��!#����#��%#)���!��� $#�#������%�'��!��)�#��������,����������"���"������������� �������������������
��%�����)��)��� ��� ��%� ��%#��*��!���$-�����!�-��������..-����������,� ���,����������"���"�������������
��������)� ������ �#���%��#��%# (���������������������������������� �����������������/���
���!���*���)�*#������ ����%� %������ ���������������������0�����"���,� ���/��������������������
������#�!��'%#!)�*����� �)%)����!�(���������������������������������� ����������������1�!�2�"�
*#��*#�!��*�)%!#$����� �#�$�)�#�!#�)�)�#�������������������-,�����-�� &�03����� ��-����0���
���#�$���� #��#�*����� *#��%�� ��!���$$��#������������������������������-���� ������������������0���'���4��0�
American Indian and Alaska Native Mental Health Research Copyright: Centers for American Indian and Alaska Native Health
Colorado School of Public Health/University of Colorado Anschutz Medical Campus (www.ucdenver.edu/caianh)
����������������#��$ �%�&5
��!#��!������ ��� �)����������%+������������������������� ������������������4-�,
$�#�#����6�#%%�� ��� ��!#���������#��!��������������������,�� �����������������������������
#�� #)���� ��� �$�)�)���)% 7&�% #�������������&)��#����"�������"��������,��. ���,����������"���"�������������
����#$#�������� �)%)� ��!#� #%%�� ���*������� ��"�-������..-���� ��3���������������1�!�2�"�!�����������������"��
��� ���#��)�#����� ���#��#��$�)!�%#���������������'������� ��!���"��������� &�������&����,��������������
������#������#����� �����%#�&�% #���!�����������������!�������� ���,����������"���"�������������
&)%%)�!������� ��!��� ���#��&#�$#�!#(#���!������,����������"���"������������� !�����3����� ��!���"���������
*���#� �&%#��� ��*#�� ��� �)��#����&)%%)������������������������ ���������������0���.��������
��������&�%'��!���%��,���� �����"�� ��"���,��� �
��"0�����������������89:�;�����"-����"�5�3������-.���1�"���"�-������������-���!�0�� "�"0�� 3���4��� ��<� �����=���)��!��=��-����� ��� ��� ��������� �������>>::�#��?@����������2��A??7?9������������� �BA@@A�
)���� ?:997CC9?D?EEE�$������������������ �����.���"���)���������
����0���������!������������������"�������� ��������������,�����������
American Indian and Alaska Native Mental Health Research Copyright: Centers for American Indian and Alaska Native Health
Colorado School of Public Health/University of Colorado Anschutz Medical Campus (www.ucdenver.edu/caianh)
������������������� ���������������������� �����
������%���!��'�$�����$ ���!���$��(�!%)��*���%)+���,��-...
�%$%����'�$���/�)�� 0�����& �����&��!��1����$ 2�����$�!��!$��������0�3�������%���!��'�$�����$ ���!���$��/
����������������� ��������� 2
�& $�� �!� ���������� ��������� 2
���2����)�� 0�����& ������$�!���!$�����&���%�2�4��������������� -
���$���)�� 0�����& ����!! ��0�����$�!���!$�����&�������)��$��� ��$
�� ����� ������������������� �������� ���� -,
���$�!���!$�����&��������)��$��'��''������2�$ ���)�� 0�����& ������ !�� �����$������� 5���
�� ���!���"������������"�������������������#�������� 67
���$�!���!$�����&��������)��$��'��%0���8����+����$ 2���)�� 0����� %!�$ ��
$� ����%������ ������� 9-
American Indian and Alaska Native Mental Health Research Copyright: Centers for American Indian and Alaska Native Health
Colorado School of Public Health/University of Colorado Anschutz Medical Campus (www.ucdenver.edu/caianh)

�������
�� ��� �0 �!����%���'�&#�����'�������&��������"������"��(���"��)������� �����$������� ����'� � ����:� 0��&��0� +��$������%!$���')��$�!����!$�����&��������)��$�� ��'��)�&�+4�'�%��%�+����)�� 0�����& ����;�� 5�$ ���������-..-��$�����& �����!$�����2 0��'%�&�&�$� ����$ ��: &� � $ �$ 2��: $��$���;��!��'�&�$��) � �;�$������&�'���0%!$%��!!4�� �� � �$�)��$�!����!$�����2 0����)��;��)�� 0�����& ��� �� !����� & �;� ��%�+�������������$���;%��$��& $������:�%!&�! 1��$��$�1��$� ��� ��$%� $4�$��+� �'!4�C !����$���� ;� ' 0��0���'�$����� � ���� ��$���0��$�C$��'� ��;��)��2�!%�$ ����&� !��� �;�'����!0���!��&�%;����&�)��$�!����!$��#���=����2 0���'����)�� 0����& ���0�))%� $ ���
?�4�&���2�!%�$ ���� ��;��)����&��$��$�; 0� !��� �;��''��$��'���������2 0�������'$������)� ��&�B%�$�H���%0���''��$���'$��� �2�!2��$���0�) !�C$��1���'�0�!!�0$ �;� �'��)�$ ���0��0��� �;�)��1��������I �& 0�$����J��'�$��IB%�! $4� �'� 0���J� $��$� �� ��$ 0%!��� ���� ���2 0�� ��;�� 5�$ ��� ��2 &�������%�����'�$���B%�! $4��'�0��������)��$��'$���& 2 &�&� �$��$���'�!!�: �;$�����&�)� ���#����+�& ����-.**=3�#�=�$���I�$�%0$%��!J��$$� +%$����'�$����;�� 5�$ ��� $��!'�K��;���$�� � �;���C �� ��0�����&�0%!$%��!�0�) �$��0���'$���0! � 0�!��$�''L>�#+=�$���B%�! $4��'�$���I ��0���J��'�0���� ��2 &�&�+4�$����;�� 5�$ ���K��;���:� $ �;�$ )���:��$����$���0! � 0 ���B%�� �&���&���0��&�&���@� ��������)��$��'��% 0 &�!� �$��$�&%� �;�$��� �$��2 �:��'���&� �����& �& 2 &%�!L>���&�#0=�$���I�%$0�)�J��'�0�����'� �& 2 &%�!����&�'�) ! ���:��%��� ���2 0��� ��2 &�&� +4� $��� ��;�� 5�$ ��� K��;��� �4) $�)� ��&%0$ ��� ) ��2�)��$� ���&� $ 2��'%�0$ �� �;�� ��$ 0 ��$���$ �'�0$ ��L�����'��)�$ ���'�$� ����$%��� ��0��$� �!4�0� $ 0�!�'����2�!%�$ �����&� ��;��)� !��� �;��4�$:�������'$���%�0��2 �0�&�$��$�$����� �& 0�$����������:��!������%���%���'B%�! $4��������2 0���
����0� $ 0�!�0�))%� $4�0��$�C$���'��������2 0��������$� 1 �;!4�) �� �;'��)��%0���''��$������� &���$���'�!!�: �;�B%��$ ������?��$�����$��� ��2�!��0���&� �$$������'����� ��+!�)���)��;�0�))%� $4�)�)+���H��?��$�����$�� ��2� ! �;� 0�))%� $4� �""�"����� $�:��&�� ���� & ���&���H� � ��:��&� ������2 0��H���������&�&����2 0����2� !�+!�H������C �$ �;� ��;��)��:��1�$�;�$���� ��$ 0%!��!4�'��� �& 2 &%�!����&�'�) ! ���: $��0�) !�C����&�H��?��$�;� �� ����2 0���&��0�))%� $4�)�)+���� &��$ '4H���:�&��0�))%� $4�)�)+��� ��0� 2���C �$ �;��������2 0��H������$��4�������� ���#��;���0��2�� ��$�!�0�$ ����&� ��%���� �''��&�+!�� '���=H� � ���� $��4������"� ��� #��;��� ��'��� ���!�1��:!�&;��+!���0%!$%��!!4�0�) �$��$����&�� �� � �$���$�''=H
�������:����$���%0�� �B% � ���0������ !4�$%����� ��;��)��2�!%�$ ����� $�� ���&�� � ���� �C�) !��� 0��� &��� ��� ���� ���2 0�� ��;�� 5�$ ��� $��$&�)���$��$����C0�!!��$��%$0�)����+%$� �� ��0� 2�&�+4����%+�$��$ �!��%)+���'�0�))%� $4�)�)+�������& '' 0%!$�$���00����+�0�%����'���!��;�:� $ �;�! �$'����0��&%! �;� � $ �!�� � �$)��$������������2 0����;�� 5�$ ���$��$�� �0 �! 5��
��
American Indian and Alaska Native Mental Health Research Copyright: Centers for American Indian and Alaska Native Health
Colorado School of Public Health/University of Colorado Anschutz Medical Campus (www.ucdenver.edu/caianh)

������$�$��)��'�0%��&����2 0���'����&A%�$)��$�& ���&���� ����0�))%� $4: $�� �� � ;�� ��2�!��0�� �'� 0���� 0� ���� 0��& $ ����� � ��� �2��� �� ���2 0���;�� 5�$ ���$��$�0���&�0%)��$�$���0%!$%��!�0�) �$��0���'� $���$�''�#��� ;� ��0��$�;�� �'� �)�� 0��� ��& ��� �$�''=�� +%$� �� ��0� 2�&� +4� 0�))%� $4)�)+�������%��00� $�+!��+�0�%����'�$���0%!$%��!!4� �� �� � �$��+���2 ���'��������$:��1�4�0! � 0 ����
��%��� �$����!!4� '�0%��&� ���� ��;��)� �2�!%�$ ��� �� �2�!%�$ ���$� �&��'�0��$�C$��)��� �;����&�2�!%�����:���'���� �;��$���������$���-..-��& �����!$�����2 0��#��=�'%�&�&��''��$��'���$���)��$�!����!$�����&�������)��$� �'� �)�� 0��� ��& ���� �� �� �%)+��� �'� 0 $ ��� : $�� �%+�$��$ �!�)�� 0�����& ��� � %!�$ �����'�%���'�:� 0������ �����$�&� ��$� ��2�!%)��
������;�� 5�$ ����'%�&�&�+4�$������$�� ��'��)�$�����������)��$�'�0�&�$���%���2 �+!��$��1��'�0�) !�$ �;�$���:��1����������$�$ )��! ���: $�! ) $�&�'%�& �;���&�!�01��'���0������%�������:�$�� ��0��&��� $����'����)�� 0����& �������'���%�+��� � %!�$ ���� ��;�����!�����&��&��$������%�2�4����2����%)+����'�� ;� ' 0��$�! ) $�$ ����� �0!%& �;���) ! �;��$��$�; ���$��$�&����$���%������� �����$�$ 2����) ! �;��'���0��0 $4M���)�� 0�����& ��� � %!�$ ����&����!4$ 0�� ���0����$��$������C0!%� 2�!4�&��0� $ 2�����$ !!��$��� � ��� �����$�&��������'!�0$���2�� �$4��'���� ������$��$�����0��!!��;�������%!$ �; ����2�!%)��$��$�; 2���2� 0��$��0�))%� $4�)�)+���M�0��0������+�%$�$��)��$�!����!$�� ��+!�)��$��$�$��4���&�$�� ��'�) ! ���'�0������:�!!������:$��4�'��!�$����� ��+!�)�����%!&�+���&&�����&�
� ��$� �����$���;��$�$�)��$��'����&�������)��$�!����!$�� ��+!�)� &��$ ' �&� �0!%&�� ��%����%0�����&� ���� �����&��%+�$��0��%������:�2���$�����)��$�!����!$�����&������)�$0��&�����2����C0��&�&�+4����&��'��)�����% ��$ 2�����2 0����%0������) !�4)��$���&���%� �;����:�!!�����$���;0��0������+�%$�)� �$� � �;�0����0$ ����: $�������2�$ ���0�))%� $ �����&&�2�!� �;���0��$���'����)�� 0�����& ���0%!$%���: $� ��$���0 $4�
��0��&� ����0!����)����;�����%�&����2 0��&�! 2��4�����+���)��$�!���!$�� ��2 &�����'$����&&������%0�� ��+!�)���%$��'�$�� ����0 �!�0��$�C$��� �� ����$��00� $�+!��$��$��� ��$ 0 ��$�� ��$�����������)��$����N����$��$���$)��$��'�&� ���� ��� �� ) ��$��$��+%$���� ��A�+�0�%���! �;����!����$����)��$�!����!$�����2 0������%!&�+��&�! 2���&�: $� ����0%!$%��!�0��$�C$������&�� ���'���0%!$%��!��0$ 2 $ �����)�� 0�����& ���)��$�!����!$�� ��2 &�������:�!!����$������&�'���$��& $ ���!����!���������$���;!4��C �����&���?��$��)��;��'��)�$������%�2�4�� ����2 � ����'����2 0���:� 0���&&�����)��$�!����!$�� ��%��: $� ��$�������0 �!���&�0%!$%��!�0��$�C$��������&�0��$�C$%�! 5�$ ����'�)��$�!���!$�����&�� ��)����$����%��00� $�+!��$��)��4��'�$�������� ��&��$�>� $� �'���1!4� �0�) ������ +!��� � �� �� �� )��$� 0!���!4� ����� �� $��� � ����$ �0�) �$ + ! $4��'���� ������ ��$����%�2�4�0�) !�$�&�+4����$��������! ����&���2 ��'���$�����$ 2���)�� 0����'����))%� $4��0$ ������0��#�!�;�$�''=���& 2 &%�!��:������1�&��+�%$�$���%����'�$��& $ ���!����!���� ��$:��0��$�C$��' ��$� ��$���0��$�C$��'����2 0��%���#:� 0��-O���� ��&�&��'' �)�$ 2�!4=����&��0��&� ��$���0��$�C$��'�0%!$%���#:� 0�����%!$�&� ������'' �)�$ 2����� ������'
���
American Indian and Alaska Native Mental Health Research Copyright: Centers for American Indian and Alaska Native Health
Colorado School of Public Health/University of Colorado Anschutz Medical Campus (www.ucdenver.edu/caianh)
76O=���������& ''����0��� � �$��%$���:�$���?��$����)�&�!��'��� ���$ �;)��$�!����!$�����&��'��)�� � $%�!���&�0%!$%��!�0��0����� �� �� �� � �$��'��)��4�%�+����)�� 0�����& �������������&�'�����;�� 5�$ ����$��$����2��$��'%!!�0 �0!���'�$�����&�)� ��� ��%�&���0���&�+4�$������$%& ���
�� ��' �& �;�����)�A��� ) ! 0�$ ����'���$���:�4�$��������&��$��� ��2 &�����'�)��$�!����!$�����2 0���&�� ;�����2 0���'���%�+����)�� 0����& �������������%�+������!$�� ��A�0$���'$���'�0%����� �0���� �;��00����$��C �$ �;����2 0���'%�&�&�'��)��$������%�0������������C �$ �;����2 0�������!4 ��2 &�� ��;��)��� �0 ' 0�!!4�&�� ;��&�'����)�� 0�����& �������&�0��$� �!4'� !�$��)��$�$���� ;���$��&��&��'�0�) ������ 2�����2 0�������%$! ��&��+�2����:�;��%�&+���1 �;�0�!!�+���$ �������&�$��+��&�2�!� �&�+�$:����$���%�+���)�� 0�����& ���0�))%� $4��$���������&��C �$ �;����2 0����;�� 5�$ ����$����%���$���&�2�!� )��$��'��%0�� ��;��)��
�:��C0 $ �;��� ;�$�4�����!�$����$��0��� &���$����� � ���� ��$���0��$�C$�'�$��� �0!����'������� $ �$ 2���� �0!����'�����#�=��� ������&�+4�$����$���'������$�!���!$�����2 0���#��=��$�����& �����!$�����2 0�����&$����'' 0���'��%2�� !���%�$ 0����&���! �B%��04����2��$ ���� ��'%�& �;�� ���)�� 0�����& �����;�� 5�$ ����# �0!%& �;�$����� ��%�+��������=�$��&�2�!� !����'���0�) ������ 2���������2 0���'����)�� 0�����& ���0� !&������&�&�!��0��$��: $����� �%���)�$ ���!�& �$%�+��0������� ���$��$�; 0� !��� �;�''��$� ��� )�&��$� �� �� �;�;���$����$��0�) �$���%00���'%!!4�'��������&�$����0� !&����2 0���;���$���:� 0��: !!����+!��$��)�$��)�1��$����� !��������! $4�����%����� �0!%&�������C$��� 2���2�!%�$ ���0�) ����$�$��$��)+��0���� 0���'%!� &��0� $ ��� �'� $��� �C �$ �;� �4�$�)� �'� ���2 0���� ������)��$� �'0�))%� $4����&��'���)��$�!����!$�����2 0������&����� $ 2���C ! 0�$ ����'0�))%� $4�)�)+���� ��� �0$ 2���0��0��� �;����� ��+!�)����&����2 0�����&��&��$� ���C$��&���2���$��&�2�!� �;�0�))%� $4�� �0 ' 0�&�' � $ �����'��� �%���)�$ ���!�& �$%�+��0��������!��������'�$�����-..-� � ���� ���!���&4 ��2 & �;�0� $ 0�!�;% &��0��$��$�����;���$�������$��4� ��;�����$���%;�$�� ���$��$�; 0� !��� �;��''��$���
?��$��)��;���'��)�$����� � ���� ��0!�����2 &��0��'���$������&�'���������2 0�����&�'���$���&�2�!� )��$��'���:�0�) ������ 2�� �40�����0 ��0%!$%��!�0��$����$��)��$�$� �����&����!����2 &��$� ��$������&�$��+� �;�)���� ;���%���0 ��$ ' 0� �2��$ ;�$ ���� �$��$����0� ���0����0$�� �$ 0���&�2�!� )��$�!$��A�0$��4����&�� $ )�!�$���$)��$�� ���0�����'�)��$�!����!$�� ��+!�)��)��;�%�+����)�� 0�����& ��������%���$� ��2�!%)��0!�� ' ���$���0��!!��;����&�$��1��'��� ��0$ $ �������0�))%� $4�!��&�������&��0 ��$ �$��
��%;!���"����2 ����������@������
9977���-6����2������C��E--�-,���2�������*E66E
����
American Indian and Alaska Native Mental Health Research Copyright: Centers for American Indian and Alaska Native Health
Colorado School of Public Health/University of Colorado Anschutz Medical Campus (www.ucdenver.edu/caianh)

��'����0��
����4����������;?EBB5�������������������� ���� ��� ��� ��������� ���������������4��<���������.�����������������
��$��
�N�%�0���!�����)�����+�%$� �0!����'�����+4�2 � $ �;�$���:��!&�: &��:�+�� $��'� $��� �0!��� �'� ���� �2�!%�$ ��� ��0�� 0�!� ��� �$��0�� ��$��� #�$$ 3@@:::�%0��0��&%@�)@0�0=�
��
American Indian and Alaska Native Mental Health Research Copyright: Centers for American Indian and Alaska Native Health
Colorado School of Public Health/University of Colorado Anschutz Medical Campus (www.ucdenver.edu/caianh)
1
DENVER AMERICAN INDIAN MENTAL HEALTH NEEDS SURVEY
Jeff King, Ph.D.
Abstract: American Indians are at higher risk for mentalhealth problems than other ethnic groups in the UnitedStates (Nelson, McCoy, Stetter, & Vanderwagen, 1992). Littleattention has been directed towards assessing mental healthproblems among urban American Indians. In response to anIndian Health Service (IHS) call for proposals, this surveyaddressed the mental health needs of Denver urban AmericanIndians. The purpose of the survey was to gather data fromDenver American Indian adults and adolescents as well asservice providers in the Denver area who work, to onedegree or the other, with members of the American Indiancommunity. These data were to provide a general idea ofthe breadth of mental health and other associated problemsamong the Denver American Indian population.
Demographic Profile For Denver American Indians
The estimated population for American Indians living in the Denvermetropolitan area is 20,000 (Source: Catchment Area Population Estimates,extracted from Colorado Division Local Government [DLG], 1991). Most ofthe American Indian population live in or near the downtown area, althoughthere is not an “American Indian community” by locale. The survey totals foryouth and adults (442) was approximately 2% of this population. DenverAmerican Indians comprise about 0.9% of the Denver metro population.
The term American Indian will be used for description of the Nativepopulation. A second term, Native people will also be used.
Survey Design
Three mental health questionnaires were developed for: AmericanIndian adults, American Indian adolescents, and service providers. The surveyitems were derived from a number of mental health and health surveys(American Indian and non-American Indian) from various areas in the UnitedStates. The early drafts were critiqued for their readability and content
American Indian and Alaska Native Mental Health Research Copyright: Centers for American Indian and Alaska Native Health
Colorado School of Public Health/University of Colorado Anschutz Medical Campus (www.ucdenver.edu/caianh)
2 VOLUME 8, NUMBER 3
appropriateness for Denver American Indians by American Indianprofessionals in Denver. Items were deleted, added, and modified accordingly.
Survey administration began in March, 1992 and ended in August,1992. Professionals and agencies in the Denver American Indian communitywere very willing to help out in the administration of the surveys. Surveyadministrations took place at: Title V (American Indian Education), the DenverIndian Center, Denver Indian Health and Family Services, the Spirit of theRainbow project, and at a Health Fair at the Denver Indian Health and FamilyServices. Flyers regarding the survey were posted at all three places, and awrite-up of the study and information about obtaining and completing aquestionnaire appeared in the Title V newsletter. Service providerquestionnaires were given out to American Indian Child Welfare,Win’Yan’Was’Aka (Domestic Violence program), American Indian HealthEducation program, Vision Quest, and the American Indian Alcohol andSubstance Abuse Prevention program.
There were many difficulties in accessing the Denver American Indianpopulation. The American Indian population is spread out throughout thecity. Therefore, the use of Title V, DIHFS, and the Denver Indian Center onlyreached a small portion of the 20,000 or so American Indian residents.Furthermore, American Indian adolescents were extremely hard to locate.Title V coordinators were contacted throughout the Denver metropolitanarea and consistently reported that there were no schools which contained alarge number of American Indian students. There was no easy access tothese adolescents. The small number of actual completed surveys reflectsthis difficulty. This paper will focus specifically on the sample of AmericanIndian adults.
Methodology
The survey design focused on three primary sampling domains.Phase One focused on the urban American Indian adults, Phase Two focusedon urban American Indian adolescents, and Phase Three addressed theservice providers. The survey sample is not a representative sample. Ratherit is a sample of convenience. However, it is thought that the sample obtainedis composed of those most likely in need of mental health services. Thedemographic information described later will clarify this notion. From thebeginning, this survey was considered to be a community effort. Many of thequestions were obtained from community members. Early drafts weresubmitted to American Indian professionals and non-American Indianprofessionals who work in the American Indian community for their inputand criticism. The various American Indian agencies in Denver participatedin the survey distribution and administration.
The survey design focused on three main domains of mental health:(a) personal problems past and present, (b) problems experienced byhousehold members, and (c) perceptions of problems existing in the
American Indian and Alaska Native Mental Health Research Copyright: Centers for American Indian and Alaska Native Health
Colorado School of Public Health/University of Colorado Anschutz Medical Campus (www.ucdenver.edu/caianh)

DENVER MENTAL HEALTH NEEDS SURVEY 3
community. Within these domains, questions were asked regardingpsychological problems, personal trauma, and substance abuse. Questionspertaining to service utilization were also asked. These asked if serviceswere sought and if so, which services; and if not, reasons for not seekingservices. Other survey questions asked respondents questions about ethnicidentification and to list what they viewed as the critical mental health needsfor the Denver American Indian community.
Participants were provided with a cover sheet to the survey whichserved as an informed consent. This cover sheet briefly explained the purposeof the study and the confidentiality of the respondent’s answers. They weretold that the consent sheet they signed would be placed in a separate pilefrom the questionnaire so that there would be no way to link their name withtheir survey. Adults were reimbursed $5 and adolescents $3 for theirparticipation.
Statistical Procedures
Since the overall goal of the survey was to gain a breadth ofperspective, statistical procedures were descriptive in nature. There areconsiderable data in which more in-depth analyses could be made, andhopefully this will occur in the near future. However, the focus of this surveyis to provide frequencies of the various mental health and related problemsin the Denver American Indian community. In this paper, descriptive data isprovided for the adult American Indian sample.
Results
The following results are those thought most useful to readers. Fulldescriptive data from the survey are available upon request to the author.
Sample
Survey participants included 374 adults from the Denver urban areas.There were 205 females, 165 males, and 4 did not indicate their gender.Ages ranged from 17 years to 71 years old. The average age of the adultrespondent was 34 years old. One-hundred-fifty-eight adults reported beingsingle, 74 married, 57 divorced, 43 living with someone, 27 separated, 12widowed, and 3 did not indicate their marital status.
Family Size
Although 78 persons reported having no children, almost 80% ofthe sample reported having at least one child. The average number ofchildren was almost two and a half. Number of children here did not necessarilymean number of children still with the parent. Sixty-five percent of thehouseholds have children in them. The average number of children perhousehold is approximately one and a half.
American Indian and Alaska Native Mental Health Research Copyright: Centers for American Indian and Alaska Native Health
Colorado School of Public Health/University of Colorado Anschutz Medical Campus (www.ucdenver.edu/caianh)

4 VOLUME 8, NUMBER 3
Tribal Enrollment
Most participants were tribally enrolled (91%). Almost half (47%)were from South Dakota, 11% from Oklahoma, and there were smallernumbers from eighteen other states.
Degree of American Indian Blood
Eighty-five percent of those sampled reported being at least 1/2degree of American Indian blood. A high percentage of the respondents(51.9%) reported being full-bloods.
Education
Over half of the survey participants have completed at least a highschool education. However, approximately one out of four of the respondents(26.6%) did not finish high school.
Years in Denver
The average amount of time lived in Denver was ten years. However,the range was quite broad, with the highest number of respondents havinglived in Denver less than one year (14.4%), and the second and third highestreporting one and two years residency respectively. More than one-third ofthe respondents have lived in Denver two years or less.
Employment
Only 18% of the sample reported having a full-time job. Twentypercent reported having part-time jobs and 58%, a majority of this sample,were unemployed.
Income
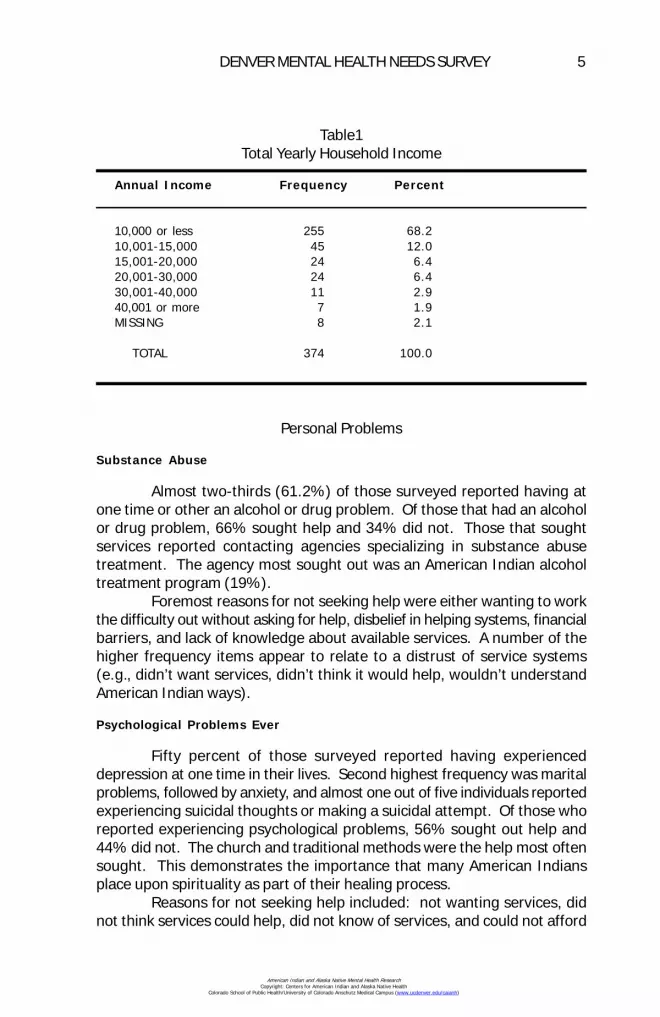
Almost 70% of those sampled reported annual incomes of less than$10,000. The second highest frequency (12%) were those reporting incomesof $10-15,000. Combined, 80% of the American Indian adults surveyed hadincomes of less than $15,000 per year (Table 1). This result may reflectsome of the sampling bias, as it seems that more affluent American Indiansliving in Denver did not participate in the survey.
General Health Care
Almost half of the sample did not know how to find the medicalinformation they needed.
American Indian and Alaska Native Mental Health Research Copyright: Centers for American Indian and Alaska Native Health
Colorado School of Public Health/University of Colorado Anschutz Medical Campus (www.ucdenver.edu/caianh)
DENVER MENTAL HEALTH NEEDS SURVEY 5
Personal Problems
Substance Abuse
Almost two-thirds (61.2%) of those surveyed reported having atone time or other an alcohol or drug problem. Of those that had an alcoholor drug problem, 66% sought help and 34% did not. Those that soughtservices reported contacting agencies specializing in substance abusetreatment. The agency most sought out was an American Indian alcoholtreatment program (19%).
Foremost reasons for not seeking help were either wanting to workthe difficulty out without asking for help, disbelief in helping systems, financialbarriers, and lack of knowledge about available services. A number of thehigher frequency items appear to relate to a distrust of service systems(e.g., didn’t want services, didn’t think it would help, wouldn’t understandAmerican Indian ways).
Psychological Problems Ever
Fifty percent of those surveyed reported having experienceddepression at one time in their lives. Second highest frequency was maritalproblems, followed by anxiety, and almost one out of five individuals reportedexperiencing suicidal thoughts or making a suicidal attempt. Of those whoreported experiencing psychological problems, 56% sought out help and44% did not. The church and traditional methods were the help most oftensought. This demonstrates the importance that many American Indiansplace upon spirituality as part of their healing process.
Reasons for not seeking help included: not wanting services, didnot think services could help, did not know of services, and could not afford
Table1Total Yearly Household Income
Annual Income Frequency Percent
10,000 or less 255 68.210,001-15,000 45 12.015,001-20,000 24 6.420,001-30,000 24 6.430,001-40,000 11 2.940,001 or more 7 1.9MISSING 8 2.1
TOTAL 374 100.0
American Indian and Alaska Native Mental Health Research Copyright: Centers for American Indian and Alaska Native Health
Colorado School of Public Health/University of Colorado Anschutz Medical Campus (www.ucdenver.edu/caianh)

6 VOLUME 8, NUMBER 3
services. These responses suggest a possible distrust of service systems aswell as an inability to pay for treatment.
Personal Trauma Issues Ever
There was a high prevalence of personal trauma among this sampleof the American Indian population in Denver. Almost two-fifths (37.2%) havebeen victims of spouse abuse, 12% reported being victims of child abuse orneglect, and 10% reported having been raped or sexually abused. Of thosereporting some sort of trauma, almost half (48%) did not seek treatment.Service providers most sought were the church (8%), police (8%), and socialservices (7%).
Reasons for not seeking help included: believed I should work it outmyself (10%), didn’t know of services (8%), didn’t think it would help (8%),and could not afford services (7%).
Psychological Symptom Scale
This set of items addressed current psychological and financialproblems (Table 2). Listed are those problems which occur weekly or moreoften. Overwhelmingly, the foremost problem reported was financialdifficulties (65%). Second to financial problems were family problems (35%).Feeling overwhelmed (29%) was the third most reported symptom. Ofconcern also were the next five items in which almost one in four reportedexperiencing at least once per week: anxiety (28%), overeating (28%),angry or bitter feelings (26%), and loneliness (25%).
Household Problems
Psychological Problems
These questions asked whether or not anyone living in therespondent’s home had experienced any kind of psychological problem.Respondents reported only 32% of household members experienceddepression. This is lower than the 50% reported by individuals aboutthemselves. Responses for others in household tended to be lower or abouteven to the individual problem categories: anxiety reported at 14%, andsuicidal thought/attempts also 14%.
Again, about 50% sought help for their problem(s) and about 50%did not. Household members tended to use the hospital more frequentlythan the individual, but also exhibited a strong trend toward traditional healingmethods and agencies which served the American Indian population.
Personal Trauma
These are traumatic events for persons living in the household ofthe person filling out the questionnaire. Reports here are lower than those
American Indian and Alaska Native Mental Health Research Copyright: Centers for American Indian and Alaska Native Health
Colorado School of Public Health/University of Colorado Anschutz Medical Campus (www.ucdenver.edu/caianh)

DENVER MENTAL HEALTH NEEDS SURVEY 7
of the individuals themselves, but this may be due to victims not telling othersabout what happened. Twenty-five percent indicated household membershad been victims of spouse abuse, and 10% reported household membershaving been abused or neglected as children. Help-seeking falls in the 50-50ratio, with half of the sample reporting seeking help for their problems andhalf not seeking help.
Services most sought were social services (9%), police (7.5%), andchurch (6%). Reasons for not seeking help were similar to previous answers:did not think it would help, could not afford services, didn’t know of services.Also included as reasons were fear of repercussions: afraid of what mighthappen, and afraid that others would find out.
Mental Health Problems For American Indian Community
This question is directed to the individual’s knowledge about peoplein the broader American Indian community. Community problems reportedwere: alcohol abuse (69%), unemployment (56%), financial problems (52%),youth runaway problems (48%), drug abuse (45%), spouse abuse (40%),school problems (38%), depression (35%), and child abuse/neglect (28%).Although unemployment and financial problems are not mental healthproblems directly, they were included because of their significant link toproblems in mental health.
Table 2Problems Which Occur Weekly or More Often1
Frequency Percent
Financial Problems 244 65.2Family Problems 131 35.0Overwhelmed 118 28.9Anxiety 105 28.1I Eat Too Much 104 27.8Angry or Bitter 98 26.2Lonely 92 24.6Depressed 88 23.5Physical Problem 87 23.2Drink Too Much 83 22.2Guilty 76 20.3My Thoughts Race In My Mind 76 20.3
1Psychological symptom scale—occurring weekly or more often—among 20% or moreof Adult Sample.
American Indian and Alaska Native Mental Health Research Copyright: Centers for American Indian and Alaska Native Health
Colorado School of Public Health/University of Colorado Anschutz Medical Campus (www.ucdenver.edu/caianh)
8 VOLUME 8, NUMBER 3
Counselor Preference
Client Comfort Level
Regarding mental health treatment, questions asked about clientcomfort level and counselor preference. Given that 50% of the AmericanIndian people sampled said they did not seek help for their problems, one ofthe possible reasons is distrust for the dominant culture’s type of careprovision. If American Indian people are not comfortable talking aboutpersonal issues with White people, it makes sense that they do not accessservices provided by predominantly White-staffed agencies. Almost two-thirds (61.2%) of those sampled reported that they felt uncomfortable talkingwith Whites about personal issues, while 36% reported no discomfort.
Counselor Preference
In terms of actual preference for counselor ethnicity, the percentageis similar to the previous question: two-thirds indicated they would preferan American Indian counselor, 27% indicated that it did not matter, and only4% said no to preferring an American Indian counselor.
Traditional Healers
The use of traditional methods of healing is still very important tothe American Indian community. On this item, over half reported that theywanted to see a traditional healer over the past year.
School Testing
Another realm for cultural issues in mental health is with the testingof our children at school. Very little attention has been directed at this area,and perhaps none directed at asking the parents how they feel about testingfor their children at school. Most adults (83%) indicated no real problemswith school testing. Approximately 20% had at least some reservationsabout testing for American Indian children.
When it came to fairness in school testing a greater number ofadults felt testing was unfair (46%), while (51%) felt tests were fair forAmerican Indian children, (3%) responded “don’t know.”
Eighty-three percent of the respondents indicated they would preferexaminers who were sensitive to American Indian cultural issues. Only 10%of the sample indicated they would not like testing to be carried out bysomeone familiar with American Indian culture.
American Indian and Alaska Native Mental Health Research Copyright: Centers for American Indian and Alaska Native Health
Colorado School of Public Health/University of Colorado Anschutz Medical Campus (www.ucdenver.edu/caianh)

DENVER MENTAL HEALTH NEEDS SURVEY 9
Community Input on Mental Health Prevention-Perceived Availability of Services
Approximately one-quarter to one-third of those sampled felt thatmost of the services listed below were not available to them or other AmericanIndians. The five services most endorsed are listed in order: marriage andfamily counseling (38%), a mental health center (34%), educational testing(33%), self-help groups (33%), family therapy (31%), and emergency homevisits (31%).
Ninety percent of respondents said they would use these services ifthey were available. This finding must be contrasted with the other findingthat only 50% have sought help in the past.
In terms of which services respondents would use, the primarycharacteristic appeared to be culturally sensitive and traditional methods(58%). However, they also indicated a willingness to use: individual counseling(52%), financial counseling (51%), stress management (41%), substanceabuse education (37%), help with self-esteem (37%), and family counseling(36%).
Current Problem Areas For Denver American Indian Community
This question addressed broader issues than just mental health thatthe individual feels are current problems in their life. Again, finances wereby far the most frequent problem. Second and third were housing andjobs—both related to financial problems. Fourth was alcohol, and interestinglyracial prejudice was reported by 26% of those sampled as a current problem.
Activities Needed In American Indian Adult Community
A significant proportion of those surveyed reported the need forAmerican Indian social workers (66%). The other responses focused onsocial networking of one sort or the other: organized recreation (47%),community meetings (46%), transportation (45%), a newsletter (37%).
Activities Needed In American Indian Youth Community
Activities for youth were also much in need. Adults most oftenreported the need for instruction in cultural heritage for the youth (66%).Second was the need for tutoring (46%). This is not too surprising, giventhat nation-wide American Indian students have the highest drop-out ratesfor any ethnic minority group. All of the following were endorsed by a largeportion of the adults surveyed: someone to listen (43%), summer jobs(40%), substance abuse counseling (36%), recreational activities (34%), ayouth center (34%), general counseling services (23%).
American Indian and Alaska Native Mental Health Research Copyright: Centers for American Indian and Alaska Native Health
Colorado School of Public Health/University of Colorado Anschutz Medical Campus (www.ucdenver.edu/caianh)
10 VOLUME 8, NUMBER 3
Family Services
Sixty-six percent of adults surveyed felt the need for protection ofchildren from violence and 55% indicated the need to protect children fromneglect. This indicated a note of serious concern by the community for thewelfare and well-being of American Indian children. Other responsesincluded: parenting classes (43%), American Indian foster homes (38%),domestic violence prevention (38%), and child protection (36%).
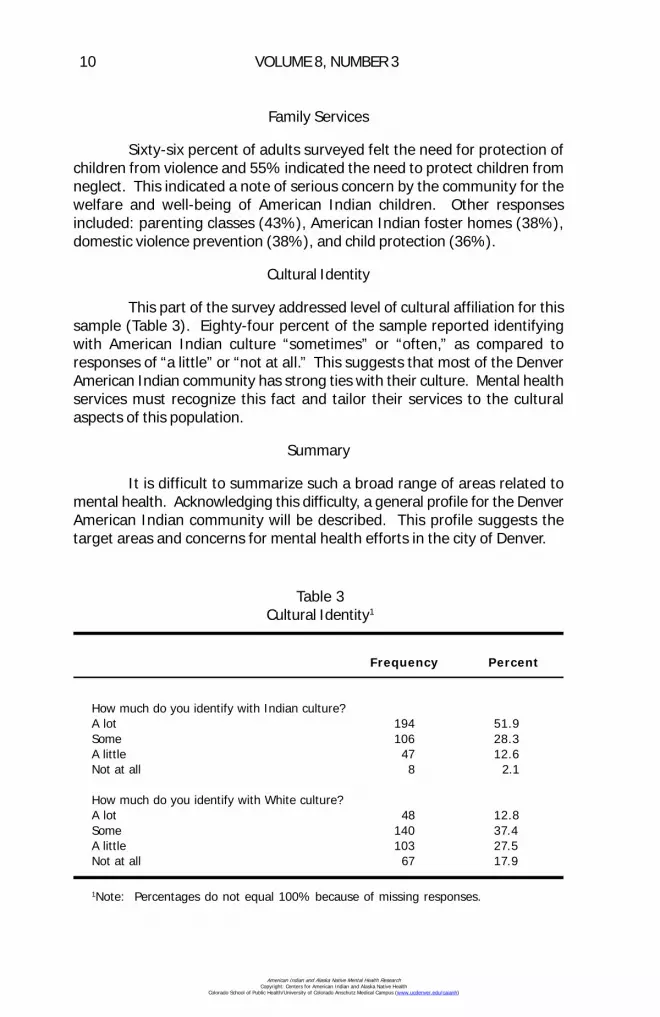
Cultural Identity
This part of the survey addressed level of cultural affiliation for thissample (Table 3). Eighty-four percent of the sample reported identifyingwith American Indian culture “sometimes” or “often,” as compared toresponses of “a little” or “not at all.” This suggests that most of the DenverAmerican Indian community has strong ties with their culture. Mental healthservices must recognize this fact and tailor their services to the culturalaspects of this population.
Summary
It is difficult to summarize such a broad range of areas related tomental health. Acknowledging this difficulty, a general profile for the DenverAmerican Indian community will be described. This profile suggests thetarget areas and concerns for mental health efforts in the city of Denver.
Table 3Cultural Identity1
Frequency Percent
How much do you identify with Indian culture?A lot 194 51.9Some 106 28.3A little 47 12.6Not at all 8 2.1
How much do you identify with White culture?A lot 48 12.8Some 140 37.4A little 103 27.5Not at all 67 17.9
1Note: Percentages do not equal 100% because of missing responses.
American Indian and Alaska Native Mental Health Research Copyright: Centers for American Indian and Alaska Native Health
Colorado School of Public Health/University of Colorado Anschutz Medical Campus (www.ucdenver.edu/caianh)

DENVER MENTAL HEALTH NEEDS SURVEY 11
The American Indian population in Denver is poor. Most of thecommunity lives below, or close to the poverty line for annual income ($14,000per household of four). Many of these residents are new to Denver (movedhere within the last two years). The major problems besetting this groupare financial and job related. Unemployment is extremely high, thereforefinances are slim and housing situations leave much to be desired. Researchhas demonstrated that these sort of socioeconomic conditions contributesignificantly to increased mental health problems.
Over half of the Denver American Indians surveyed have experiencedsome kind of mental health problem in their lives, with approximately 30%currently experiencing at least weekly symptoms of psychological problems.There is reported widespread problems for domestic violence, child neglectand abuse, spouse abuse, and marital and family problems. Basically, mostareas of mental health difficulties included in the survey show high rates ofoccurrence within the Denver American Indian community.
Even though there are high occurrences of mental health problemsin the Denver American Indian Community, more than half of those peopleexperiencing these problems do not seek help. Those that do seek help tendto first consult with someone from church or traditional healing methods/persons. Lack of affordable mental health care also prevents getting help.
All this suggests that many in the American Indian community aredistrustful of the broader mental health provider agencies and want AmericanIndian providers or at least providers who are sensitive to American Indianculture. This finding has been noted elsewhere (Neligh, 1990). It is strikingthat over 90% of the American Indian adults surveyed indicated they woulduse mental health services if they were available.
The need clearly is for American Indian mental health providerswith a broad range of expertise to serve the Denver American Indiancommunity. There are dire needs at all levels of mental health care. Someof these levels are: family, marital, adult, adolescent, and child therapies;school-related, court-related, Social Services-related, and American IndianChild Welfare-related interventions; psychological, developmental, andlearning disability testing; child-custody evaluations; interventions fordomestic violence, spousal abuse, child physical and sexual abuse; alcoholand drug related case management; psychiatric care for medicationevaluations and monitoring; and community level interventions such asprevention, and information dissemination.
Jeff King, Ph.D.Native American Counseling, Inc.
1739 Vine StreetDenver, CO 80206
American Indian and Alaska Native Mental Health Research Copyright: Centers for American Indian and Alaska Native Health
Colorado School of Public Health/University of Colorado Anschutz Medical Campus (www.ucdenver.edu/caianh)
12 VOLUME 8, NUMBER 3
References
Catchment Area Population Estimates, (1991). Colorado Division of LocalGovernment (DLG).
Neligh, G. (1990). Mental health programs for American Indians: Their logic,structure and function. American Indian & Alaska Native Mental HealthResearch: The Journal of the National Center Monograph Series, 3, Monograph3.
Nelson, S., McCoy, G., Stetter, M., & Vanderwagen, W. C. (1992). An overviewof mental health services for American Indians and Alaska Natives in the1990’s. Hospital & Community Psychiatry, 43(3), 257-261.
American Indian and Alaska Native Mental Health Research Copyright: Centers for American Indian and Alaska Native Health
Colorado School of Public Health/University of Colorado Anschutz Medical Campus (www.ucdenver.edu/caianh)
NORTH AMERICAN INDIAN ALLIANCEMENTAL HEALTH NEEDS ASSESSMENT REPORT
Lloyd Barron, Linda L. Oge, and Joseph Markovich
Abstract: The North American Indian Alliance (NAIA),located in Butte, Montana, conducted a mental health needsassessment from December, 1991 to June, 1992. The goalsof this assessment were to identify unmet health needs,obtain input regarding the need for additional services, andidentify barriers to providing and accessing services. Surveysof mental health service providers (n=30) and consumers ofNAIA services (n=74) were conducted. The results of thesesurveys and their implications for service provision areexplored.
The North American Indian Alliance (NAIA), an urban American IndianHealth Program, is located in Butte, Montana. The NAIA is a non-profitorganization that provides a limited realm of services to the approximate1,000 American Indians within the Butte-Silver Bow counties. It beganoperation in 1969 through the initiative of community members identifying aneed for American Indian services. Program operations and policy decisionsare made by a seven member Board of Directors. The primary purpose ofthe NAIA is to promote health, educational, economic, social, and culturaldevelopment of American Indians in the Butte-Silver Bow urban community.The current staff consists of the director, a health coordinator, a datacoordinator, two chemical dependency counselors, an education andprevention facilitator and a number of volunteers. The alliance also servesas an advocate for American Indians within the Butte-Silver Bow community,to facilitate and promote a better awareness of the American Indian culture.
The location of the NAIA places it further away from any AmericanIndian reservation than any other IHS program in the state of Montana. Theclosest reservation is the Flathead Reservation, located about 180 milesnorthwest of Butte. Thus, while other urban American Indian health programshave easy access to referral services on reservations for eligible consumers,the NAIA continues to attempt to operate without that benefit. There islimited information available concerning the need for mental health servicesamong American Indians residing in the Butte-Silver Bow communities.Therefore, a mental health needs assessment was conducted to identify
13
American Indian and Alaska Native Mental Health Research Copyright: Centers for American Indian and Alaska Native Health
Colorado School of Public Health/University of Colorado Anschutz Medical Campus (www.ucdenver.edu/caianh)
14 VOLUME 8, NUMBER 3
health needs that continue to be unmet, obtain input related to what kinds ofprograms and services are needed, and identify barriers to providing andaccessing services.
Methods
The NAIA Mental Health Needs Assessment was conducted fromDecember, 1991 through June, 1992. Two separate surveys were conductedof: (a) Mental Health Service providers within the community, and (b)consumers of NAIA services.
An estimated 515 males and females, 15 years of age and older,used NAIA services within the past year. This is almost 100% of the 519American Indians found to be residing in the Butte community by the 1990U.S. Census. These consumers were determined to be the most appropriatesample to identify American Indian community mental health needs. However,to capture data from individuals who may have other unique needs, thequestionnaire also was completed by American Indian individuals in the ButtePre-release Program. The Butte Pre-Release is a transitional living facilityfor state prisoners who are in the process of becoming paroled by the Stateof Montana’s correctional institution. At best three males and three femaleswere interviewed.
A stratified (by sex) systematic sample with a random start wasselected from the list. An estimated sample size of 81 was expected to yieldresulting data within the 95% confidence level, + or - 10%. However, inconsideration of the response rates in past face-to-face, community basedstudies in the urban American Indian population of between 62% to 73%, aslightly larger sample was drawn (50 males and 50 females). This samplesize represents approximately 20% of the Butte American Indian population,according to the 1990 U.S. Census. This information was taken from theDepartment of Vital Statistics records in Helena, Montana.
Separate questionnaires were developed for use in interviewingproviders and consumers. Questionnaires were completed through the useof face-to-face household interviewing. A contract male interviewer arrangedand completed the interviews.
Results
Survey of Providers
Of the 55 Mental Health Care Providers in the Butte Community, 35were offered the opportunity to participate. As a result of difficulties inscheduling interviews with the providers and the six month time frame forthe survey, 30 actually completed questionnaires.
American Indian and Alaska Native Mental Health Research Copyright: Centers for American Indian and Alaska Native Health
Colorado School of Public Health/University of Colorado Anschutz Medical Campus (www.ucdenver.edu/caianh)
NORTH AMERICAN INDIAN ALLIANCE 15
Provider Characteristics
Seventeen percent of the respondents reported being in the MedicalProfessional group, indicating that they were physicians, psychiatrists, orpsychologists. Fifty percent reported being in the Mental Health group,indicating that they were social workers, chemical dependency counselors,or mental health workers. Twenty-three percent reported being in the HumanServices group, indicating that they may be social workers or referral sourcessuch as in-take counselors, etc. Ten percent reported being in the “other”group, which included physicians and other professional/paraprofessionalhealth providers who were not directly involved in the treatment of mentalillness. Seventeen percent of the respondents reported being AmericanIndian.
Children’s Services Offered
Sixty-three percent of the respondents offered crisis services; 47%offered outpatient services, 50% offered inpatient services, 10% offeredresidential services, and 33% offered other types of children’s services notspecifically listed in the questionnaire. These included prevention and earlyintervention, aftercare, evaluation, education, parenting classes, adolescentsupport groups, cultural education, child abuse and neglect investigativeservices, and referral services.
Adult Services Offered
Forty-seven percent of the respondents offered crisis services, 16%offered outpatient services, 4% offered inpatient services, 3% offered grouphome/transitional services, and 11% offered “other” kinds of services notspecifically listed in the questionnaire. These included prevention andintensive outpatient early intervention, family therapy, ACT (drivers educationrelated to convictions for driving under the influence of alcohol), parentingclasses, cultural education, chemical dependency education, health education,adult abuse and neglect investigative services, and referral services.
American Indian Client Population
Eighty percent of the respondents reported that 25% or less of theirclient population was American Indian; 13% reported that between 25%and 50% of their client population was American Indian, and 7% reportedthat between 75% and 100% of their client population was American Indian.Thus, most of the providers surveyed do not specialize in the treatment ofAmerican Indians.
Contacts with American Indian clients are made by: (a) self referral47%, (b) referral from agencies such as Social Services or Department ofFamily Services 15%, (c) referrals from hospitals or reservations 8%, (d)during inpatient treatment 7%, (e) during project work 5%, (f) at the
American Indian and Alaska Native Mental Health Research Copyright: Centers for American Indian and Alaska Native Health
Colorado School of Public Health/University of Colorado Anschutz Medical Campus (www.ucdenver.edu/caianh)

16 VOLUME 8, NUMBER 3
Community Health Center 5%, (g) during community outreach visits 3%, (h)in client work environments 3%, (i) when visiting American Indian homes2%, (j) during agency meetings 2%, (k) in the schools 2%, and (l) duringvisits to the emergency room 1%.
Referral Practices
Seventy-seven percent of the provider respondents reported that intheir client encounters they refer American Indian clients to other agencies;23% reported that they do not. The agencies clients are referred to: (a)NAIA 67%, (b) Human Services 13%, (c) Probation Services 5%, (d) familyplanning services 4%, (e) safe houses 4%, (f) Mental Health Services 3%,(g) foster care 1%, (h) American Indian Health Service 1%, (i) specific tribalservices 1%, and (j) Alcoholics Anonymous 1%.
The reasons given by respondent providers for referral of clientsincluded: (a) the agency they referred clients to had access to reliablesupportive resources in a variety of areas, (b) placement, (c) investigation,(d) obtaining benefit from other programs for which they are eligible, (e)obtaining additional specialty services/treatment, and (f) at the request ofpatients and/or their families.
Knowledge of and Referral to NAIA
Ninety percent of the provider respondents indicated that they knewabout the North American Indian Alliance. When asked about their awarenessof specific services offered by NAIA, 77% of providers were aware of theChemical Dependency (CD) Counseling program, 63% of the Health Education/Prevention program, 50% of the Job Training Partnership Assistance program,73% of the Youth Chemical Awareness program, and 57% were aware ofthe Youth Cultural Awareness program. Slightly more than half (54%) of theprovider respondents reported that they made referrals to the NAIA.
Provider Perceptions of How the Mental Health of American Indians Differs From the General Population
Seventy-two percent of the provider respondents reported that theyfelt the mental health of American Indians is different than those of thegeneral population. The following are examples of the differences theydescribed:1. While classic mental illnesses will have similar symptoms in bothsubpopulations, the American Indian community may be negatively affectedto a larger degree because of the lack of economic resources available totreat the individual. This may be further complicated by the fact that AmericanIndians are more likely to have to rely on treatment from public facilities,which may not be necessarily the best source of treatment for their specificillnesses. In addition, we may be attempting to treat social problems and
American Indian and Alaska Native Mental Health Research Copyright: Centers for American Indian and Alaska Native Health
Colorado School of Public Health/University of Colorado Anschutz Medical Campus (www.ucdenver.edu/caianh)

NORTH AMERICAN INDIAN ALLIANCE 17
political problems as mental health problems; in which case, it is not theindividual who needs appropriate treatment, but the situation.2. American Indians often have cultural, religious, and often social, valuesand beliefs that are much different from, poorly understood, and ultimatelyaccepted, by the general population. Not only do these differences createproblems between subgroups, but often the expectations of families andcommunities create a conflict within individuals to meet personal and socialneeds. Thus, not only are the mental health needs different, or greater, butrequire an approach that is different than the general population, includes agenuine sensitivity, and considers the more traditional holistic approach.3. The transitional period involved in moving from the reservation to theurban community has a tremendous impact on the mental health of AmericanIndians. The stressors of leaving an area that they were raised in andsupport groups they have grown accustomed to and trying to fit into thegeneral population and be productive, without the familiar coping skills andsupport systems, would adversely impact most individuals, but is magnifiedin the American Indian for a variety of reasons. Those reasons are not onlyrelated to cultural, religious, or social differences, but the result of humanresponses to changes in socialization, poor assimilation into unfamiliar anddifferent settings, etc. It often leads to loss of identity, and resulting loss ofself-esteem, etc.
Suggested Improvements to the Mental Health Care System
Providers were asked to suggest ways to improve the delivery ofmental health services to American Indians. Suggestions included: (a) useof American Indian mental health workers, (b) improved interaction andcommunications with tribal agencies, (c) improve non-Indian providerknowledge of services offered and how to access them, and (d) more outreachand targeted case management.
Provider respondents were also asked to suggest the types ofeducation and information that would enhance their knowledge, awareness,and sensitivity to the American Indian community. Suggestions included:(a) demographic information about the population, (b) information onexperience of American Indian women and their relationship to AmericanIndian men, (c) training on cultural networking, (d) cultural training workshops,(e) listings of resources available to American Indians, (f) information aboutwhat the NAIA does and the services offered, and (g) interagency meetingsthat included cultural education and presentations by spiritual leaders.
Survey of Consumers
Of the 50 males and 50 females randomly selected as the sample,44 males and 30 females agreed to participate. This resulted in an overallresponse rate of 74% (88% for males and 60% for females).
American Indian and Alaska Native Mental Health Research Copyright: Centers for American Indian and Alaska Native Health
Colorado School of Public Health/University of Colorado Anschutz Medical Campus (www.ucdenver.edu/caianh)

18 VOLUME 8, NUMBER 3
Population Characteristics
Age: The age of the respondents ranged from 17 to 79 years ofage, with an average age of 37 years. Females were slightly older thanmales, with average ages of 39 and 36, respectively.
Marital Status: One-quarter of both the females and males werecurrently married or living with someone. Twenty-five percent of the malesand 10% of the females had never been married or lived with anyone. Malesand females reported that they have been married or lived with someone anaverage of 3 and 2 times respectively.
Size of Household: Males reported having a range of between 1and 6, with an average of 2.2, people living in their household. Femaleswere similar with a range between 1 and 5 and an average of 2.3 people inthe household.
Education: Over a third of the males and females (39% and 33%,respectively) reported to have completed their high school or equivalenteducation (G.E.D. or Vo-tech). And, slightly more males (19%) than females(13%) reported having some college education.5. Income: A quarter (25.8%) of all the respondents reported that they hadreceived less than $2,000 as total family income during the past year. Maleswere more prevalent in this low income category than females (34% and13%), respectively. Ninety percent of the males and 86.4% of the femalerespondents reported receiving less than $10,000 in total family income duringthe last year.
Employment Status: Part of the reason for the low levels of totalfamily income reported may be the employment status of the respondentsduring the last 12 months. Only 14.6% of the males and 13.3% of thefemales reported being employed at least part-time during the past year.
Other Assistance: When asked if they received benefits from othersubsistence assistance during the past year, 52% of the respondents reportedreceiving some kind of alternate subsistence assistance. Eighty percent ofthese respondents received Aid to Families with Dependent Children, 20%received food stamps, 18% received Medicaid, 15% received GeneralAssistance (State Welfare), 14% received some other assistance, 8% receivedSocial Security, and 4% received Human Resources or Commodities.
Of the 14% reporting that they received other assistance, 21%received disability compensation, 14% received Energy Assistance, 14%received VA pensions, 7% received American Indian Per Capita, 7% receivedMedicare, 7% received Railroad Retirement, 7% received UnemploymentCompensation, and 7% received assistance from the North American IndianAlliance.
Mobility: When asked how long they have lived in Butte, therespondents indicated a residence of between 1 and 79 years; with an averageresidency of 21.4 years. When asked how long they have been living off areservation, the respondents reported a range of between 3 and 50 years;
American Indian and Alaska Native Mental Health Research Copyright: Centers for American Indian and Alaska Native Health
Colorado School of Public Health/University of Colorado Anschutz Medical Campus (www.ucdenver.edu/caianh)
NORTH AMERICAN INDIAN ALLIANCE 19
with an average of 18.9 years. Nineteen percent of the respondents reportedthat they have never lived on a reservation.
Mental Health Needs
Talking About Problems: When asked who they usually talked towhen they had problems, 23% of the females and 16% of the males reportedthat they didn’t discuss their problems with anyone. Twenty-three percentof the females and 54% of the males indicated that they talked to friendsabout problems. In addition the males reported that they talked to family(26%), doctors (9%), NAIA counselors (7%), and AA sponsors (2%). Whenthey discussed problems with anyone, females reported talking to family(37%), a minister or priest (10%), NAIA counselor (7%), doctors (3%), andother counselors (3%).
Thus, while the males and females differ slightly in who they discussproblems with, there appears to be a large percentage (23% and 16%,respectively of females and males) who do not discuss their problems withanyone. This could be the result of a variety of factors such as not beingaware of who they go to, how to access counseling services, distrust, etc.
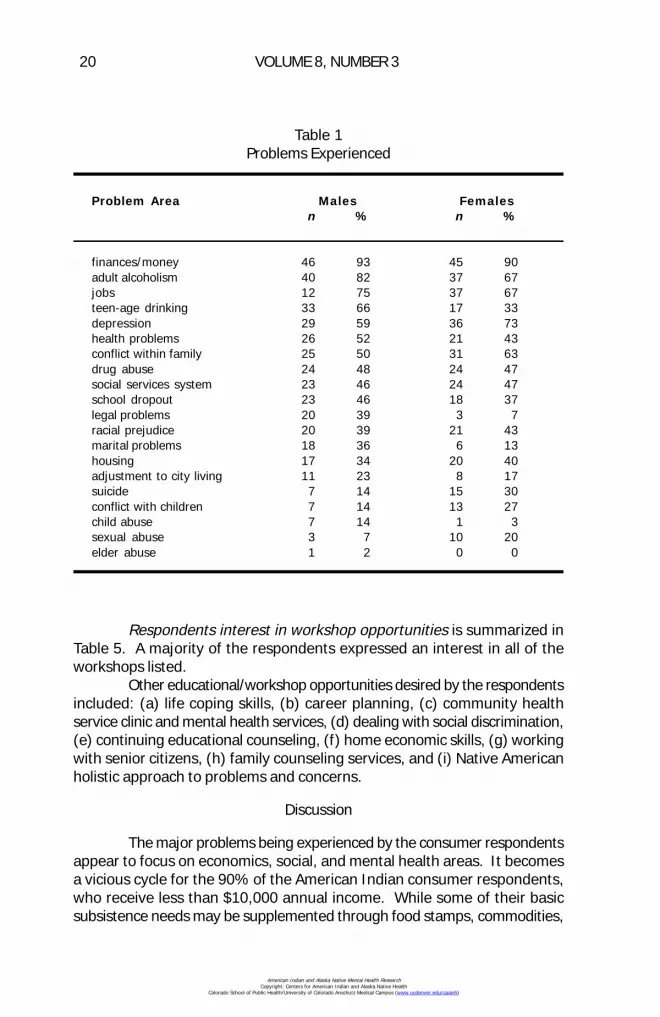
Problems Experienced are reported in Table 1. Males identifieddifferent problems than females. Sexual abuse, conflict with children, anddepression were more commonly reported as problems by the femalerespondents. Adult alcoholism, teenage drinking, legal problems, and maritalproblems were more commonly reported as problems by the malerespondents.
Frequently Experienced Problems: Problems respondents identifiedas experiencing at least on a weekly basis are reported in Table 2. Financialproblems were the most commonly reported problems by both men andwomen. The next most commonly reported problems for males were socialwithdrawal, difficulty sleeping, feeling angry/bitter, and family problems. Thenext most commonly reported problems for females were difficulty sleeping,spouse/family member abuses, alcohol/drugs, feeling angry/bitter, and familyproblems.
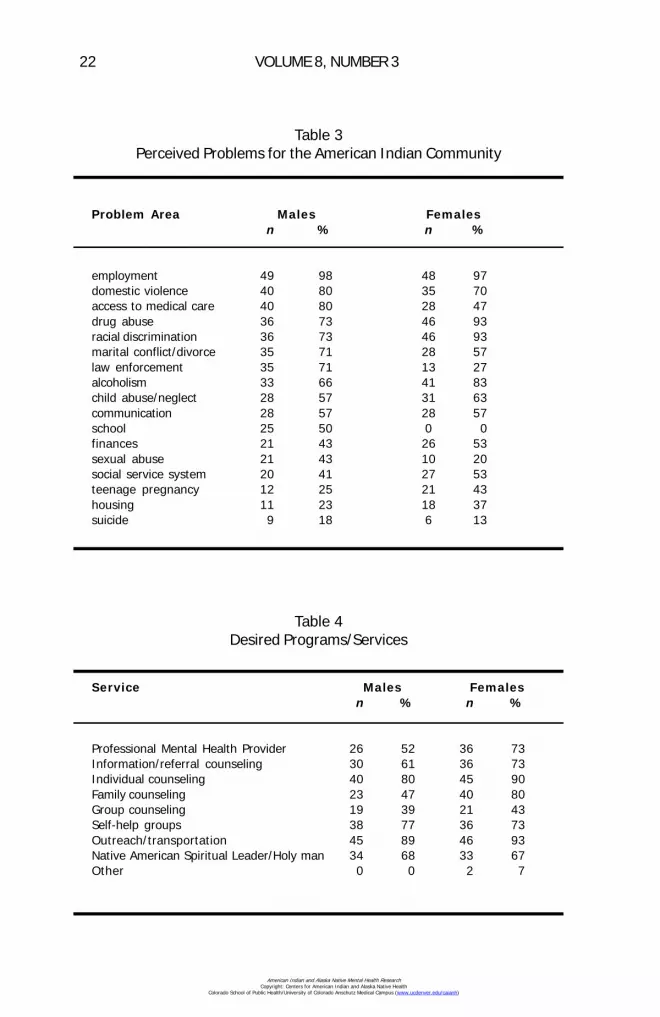
Perceived Problems for the American Indian Community are reportedin Table 3. Almost all the respondents identified employment and over two-thirds identified domestic violence as problems for the community. As wasthe case when asked to identify personal problem areas, males endorseddifferent problems than females. Drug abuse, racial discrimination, alcoholism,and teenage pregnancy were perceived as problems for the community byfemales. Access to medical care, marital conflict/divorce, law enforcement,school, and sexual abuse were perceived as problems for the community bymales.
Desired Programs/Services are reported on Table 4. A majority ofrespondents of both genders reported an interest in using all the serviceslisted except for group and family counseling. The “other” services seen asuseful by the female respondents were pastoral services and schooling.
American Indian and Alaska Native Mental Health Research Copyright: Centers for American Indian and Alaska Native Health
Colorado School of Public Health/University of Colorado Anschutz Medical Campus (www.ucdenver.edu/caianh)
20 VOLUME 8, NUMBER 3
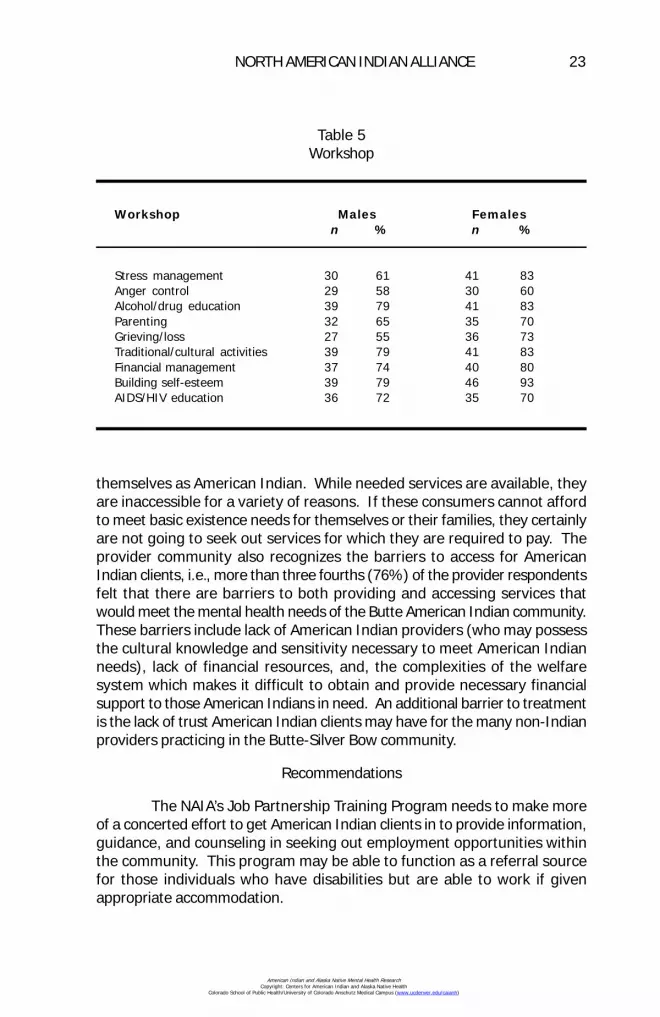
Respondents interest in workshop opportunities is summarized inTable 5. A majority of the respondents expressed an interest in all of theworkshops listed.
Other educational/workshop opportunities desired by the respondentsincluded: (a) life coping skills, (b) career planning, (c) community healthservice clinic and mental health services, (d) dealing with social discrimination,(e) continuing educational counseling, (f) home economic skills, (g) workingwith senior citizens, (h) family counseling services, and (i) Native Americanholistic approach to problems and concerns.
Discussion
The major problems being experienced by the consumer respondentsappear to focus on economics, social, and mental health areas. It becomesa vicious cycle for the 90% of the American Indian consumer respondents,who receive less than $10,000 annual income. While some of their basicsubsistence needs may be supplemented through food stamps, commodities,
Table 1Problems Experienced
Problem Area Males Femalesn % n %
finances/money 46 93 45 90adult alcoholism 40 82 37 67jobs 12 75 37 67teen-age drinking 33 66 17 33depression 29 59 36 73health problems 26 52 21 43conflict within family 25 50 31 63drug abuse 24 48 24 47social services system 23 46 24 47school dropout 23 46 18 37legal problems 20 39 3 7racial prejudice 20 39 21 43marital problems 18 36 6 13housing 17 34 20 40adjustment to city living 11 23 8 17suicide 7 14 15 30conflict with children 7 14 13 27child abuse 7 14 1 3sexual abuse 3 7 10 20elder abuse 1 2 0 0
American Indian and Alaska Native Mental Health Research Copyright: Centers for American Indian and Alaska Native Health
Colorado School of Public Health/University of Colorado Anschutz Medical Campus (www.ucdenver.edu/caianh)

NORTH AMERICAN INDIAN ALLIANCE 21
etc., the need to seek out and apply for benefits from these special programsoften adversely impacts an individual’s self esteem. Thus, those who feelthey have little control over their lives may seek alternate coping mechanisms,such as alcohol or drug abuse, to get away from their problems, if onlymomentarily. The prevalence of self-reported chemical abuse in the consumerpopulation (82% of males and 67% of females self-reported adult alcoholismin their lives while 48% of the males and 67% of the females self-reporteddrug abuse as a problem in their lives) may be partially responsible for thedomestic and personal violence, abuse, and problems reportedly experiencedby 20% to 50% of the client population.
While there are mental health services available within the community,80% of the provider respondents reported that less than 25% of their clientpopulation was American Indian. Only 17% of the providers surveyed identified
Table 2Identified Problems and Affect
At least weekly
Problem Males Femalesn % n %
financial problems 31 62 35 72social withdrawal1 26 54 15 31difficulty sleeping 23 46 22 44feeling angry/bitter 20 40 21 43family problems 20 40 18 37feeling depressed1 15 30 11 23spouse/family member abuses alcohol/drugs 15 30 22 45feeling lonely 15 29 15 31frequent back pain1 14 28 15 30legal problems 12 25 10 20frequent severe headaches1 10 21 15 30feeling guilty 10 21 12 24feeling that I’m not good/decent person 10 21 8 17lack of appetite 10 19 13 27feeling lack of control 8 17 14 28too much drinking 7 14 13 27frequent stomach aches1 7 14 10 20use of drugs 1 2 3 6
1Diagnostic and Statistical Manual of Mental Disorders: Clients experiencing at least5 of these criteria for 2 weeks, representing a change in previous function, may beclinically depressed.
American Indian and Alaska Native Mental Health Research Copyright: Centers for American Indian and Alaska Native Health
Colorado School of Public Health/University of Colorado Anschutz Medical Campus (www.ucdenver.edu/caianh)
22 VOLUME 8, NUMBER 3
Table 3Perceived Problems for the American Indian Community
Problem Area Males Femalesn % n %
employment 49 98 48 97domestic violence 40 80 35 70access to medical care 40 80 28 47drug abuse 36 73 46 93racial discrimination 36 73 46 93marital conflict/divorce 35 71 28 57law enforcement 35 71 13 27alcoholism 33 66 41 83child abuse/neglect 28 57 31 63communication 28 57 28 57school 25 50 0 0finances 21 43 26 53sexual abuse 21 43 10 20social service system 20 41 27 53teenage pregnancy 12 25 21 43housing 11 23 18 37suicide 9 18 6 13
Table 4Desired Programs/Services
Service Males Femalesn % n %
Professional Mental Health Provider 26 52 36 73Information/referral counseling 30 61 36 73Individual counseling 40 80 45 90Family counseling 23 47 40 80Group counseling 19 39 21 43Self-help groups 38 77 36 73Outreach/transportation 45 89 46 93Native American Spiritual Leader/Holy man 34 68 33 67Other 0 0 2 7
American Indian and Alaska Native Mental Health Research Copyright: Centers for American Indian and Alaska Native Health
Colorado School of Public Health/University of Colorado Anschutz Medical Campus (www.ucdenver.edu/caianh)
NORTH AMERICAN INDIAN ALLIANCE 23
themselves as American Indian. While needed services are available, theyare inaccessible for a variety of reasons. If these consumers cannot affordto meet basic existence needs for themselves or their families, they certainlyare not going to seek out services for which they are required to pay. Theprovider community also recognizes the barriers to access for AmericanIndian clients, i.e., more than three fourths (76%) of the provider respondentsfelt that there are barriers to both providing and accessing services thatwould meet the mental health needs of the Butte American Indian community.These barriers include lack of American Indian providers (who may possessthe cultural knowledge and sensitivity necessary to meet American Indianneeds), lack of financial resources, and, the complexities of the welfaresystem which makes it difficult to obtain and provide necessary financialsupport to those American Indians in need. An additional barrier to treatmentis the lack of trust American Indian clients may have for the many non-Indianproviders practicing in the Butte-Silver Bow community.
Recommendations
The NAIA’s Job Partnership Training Program needs to make moreof a concerted effort to get American Indian clients in to provide information,guidance, and counseling in seeking out employment opportunities withinthe community. This program may be able to function as a referral sourcefor those individuals who have disabilities but are able to work if givenappropriate accommodation.
Table 5Workshop
Workshop Males Femalesn % n %
Stress management 30 61 41 83Anger control 29 58 30 60Alcohol/drug education 39 79 41 83Parenting 32 65 35 70Grieving/loss 27 55 36 73Traditional/cultural activities 39 79 41 83Financial management 37 74 40 80Building self-esteem 39 79 46 93AIDS/HIV education 36 72 35 70
American Indian and Alaska Native Mental Health Research Copyright: Centers for American Indian and Alaska Native Health
Colorado School of Public Health/University of Colorado Anschutz Medical Campus (www.ucdenver.edu/caianh)
24 VOLUME 8, NUMBER 3
There is clearly a need for American Indian Mental Health CareProviders in our community. However, considering the prevalence of mentalhealth problems reported here, it is doubtful that there will be enoughAmerican Indian providers to meet the service needs of the community. AnAmerican Indian Provider may be better used as both a conduit for referralof clients to appropriate treatment resources as well as a source of trainingand information to non-Indian providers about the cultural expectations,customs, and beliefs of their American Indian clientele.
The NAIA has operated in the Butte-Silver Bow community for overtwenty-five years and almost the entire American Indian population of thiscommunity utilize its resources. Thus, the NAIA is in a unique position inbeing able to: (a) identify the mental health needs of this American Indiancommunity, (b) provide culturally sensitive treatment, and (c) develop areferral network of knowledgeable outside providers.
Send Correspondence to:Debbie Ouellette
3030 HannibalButte, MT 59701
Authors' Note
This survey was conducted and the report written by: Mr. LloydBarron, Director North American Indian Alliance, Butte, Montana.
Ms. Linda L. Oge, Health Systems Specialist, Billings Area Office,Indian Health Service.
Mr. Joseph Markovich, Contracted Mental Health Worker, NorthAmerican Indian Alliance, Butte, Montana.
This project was made possible by the following individuals andorganizations: Mr. Pete Conway, Assistant Area Director, Tribal HealthPrograms Staff, Billings Indian Health Service; Board of Directors, NativeAmerican Indian Alliance, Butte, Montana; Ms. Debra Ouellette, OfficeManager/Data Coordinator, North American Indian Alliance, Butte, Montana
American Indian and Alaska Native Mental Health Research Copyright: Centers for American Indian and Alaska Native Health
Colorado School of Public Health/University of Colorado Anschutz Medical Campus (www.ucdenver.edu/caianh)
MENTAL HEALTH NEEDS ASSESSMENT OF OFF-RESERVATIONAMERICAN INDIAN PEOPLE IN NORTHERN ARIZONA
Barbara Chester Ph.D., Patricia Mahalish, and James Davis
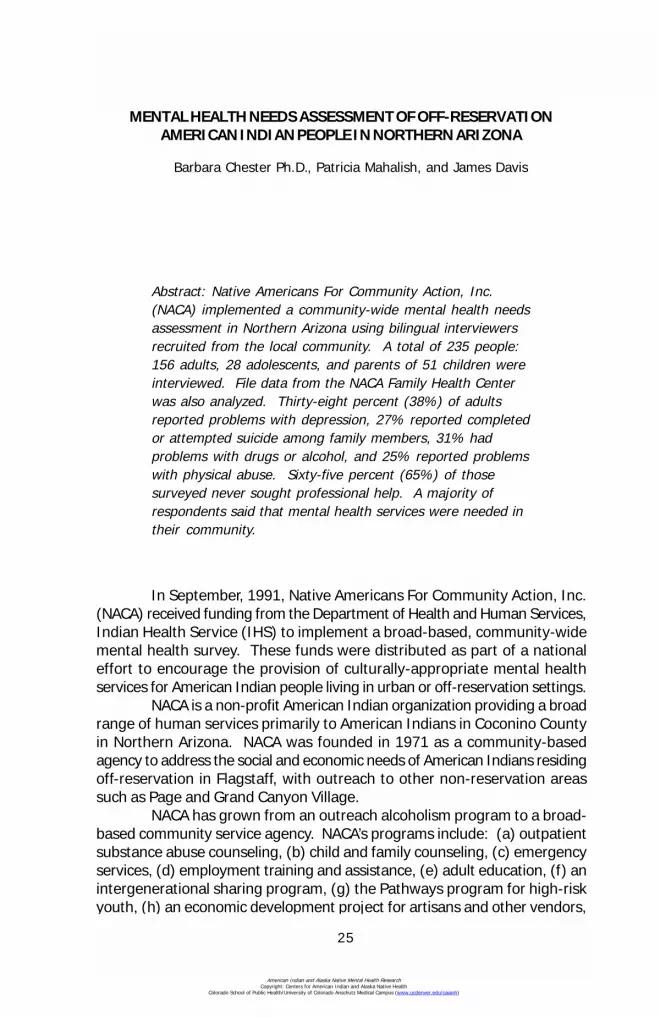
Abstract: Native Americans For Community Action, Inc.(NACA) implemented a community-wide mental health needsassessment in Northern Arizona using bilingual interviewersrecruited from the local community. A total of 235 people:156 adults, 28 adolescents, and parents of 51 children wereinterviewed. File data from the NACA Family Health Centerwas also analyzed. Thirty-eight percent (38%) of adultsreported problems with depression, 27% reported completedor attempted suicide among family members, 31% hadproblems with drugs or alcohol, and 25% reported problemswith physical abuse. Sixty-five percent (65%) of thosesurveyed never sought professional help. A majority ofrespondents said that mental health services were needed intheir community.
In September, 1991, Native Americans For Community Action, Inc.(NACA) received funding from the Department of Health and Human Services,Indian Health Service (IHS) to implement a broad-based, community-widemental health survey. These funds were distributed as part of a nationaleffort to encourage the provision of culturally-appropriate mental healthservices for American Indian people living in urban or off-reservation settings.
NACA is a non-profit American Indian organization providing a broadrange of human services primarily to American Indians in Coconino Countyin Northern Arizona. NACA was founded in 1971 as a community-basedagency to address the social and economic needs of American Indians residingoff-reservation in Flagstaff, with outreach to other non-reservation areassuch as Page and Grand Canyon Village.
NACA has grown from an outreach alcoholism program to a broad-based community service agency. NACA’s programs include: (a) outpatientsubstance abuse counseling, (b) child and family counseling, (c) emergencyservices, (d) employment training and assistance, (e) adult education, (f) anintergenerational sharing program, (g) the Pathways program for high-riskyouth, (h) an economic development project for artisans and other vendors,
25
American Indian and Alaska Native Mental Health Research Copyright: Centers for American Indian and Alaska Native Health
Colorado School of Public Health/University of Colorado Anschutz Medical Campus (www.ucdenver.edu/caianh)

26 VOLUME 8, NUMBER 3
and (i) post-move services for individuals relocated from the Navajo-HopiJoint Use Area. Within the two-year time period from February, 1989 -February, 1991, the substance abuse program alone provided treatment,screening, and prevention services to almost 1,800 people. In 1991, NACAadded an outpatient, ambulatory health center offering family medicine, wellchild clinics, prenatal care, and AIDS and nutritional counseling. During itsfirst year of operation, the health center accommodated approximately 6,000patient visits from 3,000 unduplicated individuals.
NACA offices are located in Flagstaff, Arizona, and its service areaincludes all of off-reservation Coconino County. The county population is91,900, which includes portions of the Havasupai, Hopi, Hualapai, Kaibab,and Navajo reservations (Arizona Department of Economic Security, 1989).
American Indians comprise almost 10% of Flagstaff’s population,approximately 4,800 people. In the surrounding non-reservation areas ofCoconino County, the American Indian population is 2,370 (for a total non-reservation Indian population of almost 7,200 people). This population ispredominantly Navajo, which is reflected in NACA’s current client population.
NACA estimates that 55% of all county American Indian adults areunemployed and 35% are under-employed. Seventy-five percent (75%) ofadults have not completed high school or achieved a GED. School districtfigures show a 12.5% American Indian drop-out rate (this is undoubtedly anunderestimate since the figure does not include children leaving elementaryor middle school or the migrant youngsters who move from community tocommunity without enrolling in school).
Flagstaff is the market center for the adjacent reservation areas.The reservation populations are increasingly moving from isolated rural homesites to reservation growth centers and bordertowns where schools, jobs,and services are concentrated. With this migration, the extended family andclan network that traditionally provided support for tribal members frombirth through old age is breaking down.
In addition to this “immigration,” Flagstaff also receives “refugees.”These are former residents of the Navajo-Hopi Joint Use Area, now relocatedas a result of the Navajo-Hopi Land Settlement Act (PL 93-531). The relocateestend to be more traditional, lack cross-cultural skills, are less likely to speakEnglish, and possess fewer employable skills than other off-reservationresidents. The process of relocation and adjustment is extremely stressful,particularly for the elderly (Kammer, 1980).
Interviews with service providers in the Flagstaff area indicate thatthere are few culturally-appropriate services available on an in- or out-patientbasis for American Indian people. While mental health services are providedby community agencies, none provide culturally-specific or bilingual services,and none employ American Indian staff.
American Indian and Alaska Native Mental Health Research Copyright: Centers for American Indian and Alaska Native Health
Colorado School of Public Health/University of Colorado Anschutz Medical Campus (www.ucdenver.edu/caianh)
NORTHERN ARIZONA MENTAL HEALTH NEEDS 27
Methods
The primary purpose of this study was to gather information forNACA from the community that the organization serves. The survey wasconducted in four phases:
Pre-Survey Interviews and Design of Protocol: This phase includedinterviews with NACA staff and consumers of service. NACA staff wereinterviewed to determine what questions they would like answered, whatapproaches were practical, and what problems they thought might beencountered in attempting to conduct these surveys. In addition, the staffwere asked for their cooperation in referring people for interviews and weregiven a chance to review survey instruments prior to finalizing the procedures.
Time, monetary, and other constraints required using a protocolthat could be completed in one hour, with instruments that could easily betranslated into Navajo, Hopi, and other community languages. Telephoneinterviews with national experts were conducted to ascertain whatinstruments existed that would fulfill these requirements.
Selection and Training of Bilingual Surveyors: Four NACA staff andinterns took part in the survey, and five additional individuals were interviewedand hired. All of these individuals received two days of training which coveredsuch topics as project goals, concepts of mental health, mental healthprevention models, psychological tests and survey instruments, interviewingskills, confidentiality, and mandatory reporting. Training also includeddiscussion about how concepts and items could be interpreted into the Navajolanguage. Eight people completed the training of which seven were women,and all were bilingual Navajo speakers.
Interviews: Interviews were conducted from January 2 - June 1,1992. The sample goal was between 200-300 individuals, based upon asemi-stratified sample of both selected and unselected people. By June 1st,235 surveys were completed, and interviewing was discontinued.
Medical Record Review: In addition to the surveys, approximately10% of adult intake files from the Family Health Center were reviewed forboth corroborative and comparative purposes. According to the Health CenterDirector, 48% of the 3,000 unduplicated individuals seen at the clinic duringthe first year of operation were above age 18. The files of 144 adults wereexamined at random for demographic information, as well as for reviewingseveral items of the intake form. These items included (a) difficulty sleeping,(b) feeling tired, (c) feeling down/depressed, (d) feeling nervous/irritable,(e) alcohol/drug use, (f) frequent headaches, (g) shortness of breath, (h)night sweats, and (i) feeling dizzy/faint.
Sample
NACA’s 15 programs include a range of services to the community.Several of these programs involve clients selected on the basis of health or
American Indian and Alaska Native Mental Health Research Copyright: Centers for American Indian and Alaska Native Health
Colorado School of Public Health/University of Colorado Anschutz Medical Campus (www.ucdenver.edu/caianh)
28 VOLUME 8, NUMBER 3
mental health problems, while clients of other programs are not admitted tothe agency on this basis.
The sample was semi-stratified in that both selected and unselectedindividuals were targeted from all age groups including (a) children, (b)adolescents, and (c) adults. Selected individuals were recruited from severalNACA clinical programs while unselected individuals were recruited fromNACA’s non-clinical programs.
In addition to NACA programs, fliers announcing the project weredistributed to area schools, churches, and service agencies. Also, letterswere sent to all post-move clients (relocatees) living in or around Page,Arizona, one of NACA’s off-reservation catchment sites. Meetings were alsoheld with Title V counselors and the staff of the Flagstaff Bordertown Dormitoryto enlist their aid with the project. All individuals interviewed were guaranteedconfidentiality. Interviewers were instructed not to interview close friends orfamily members, but to pass these names to other, unrelated surveyors.
A total of 156 adults, 28 adolescents, and 51 parents of children inthe community completed surveys. Of the adults surveyed, 12% were aged60 or older. Seventy percent (70%) of the individuals came from unselectedsources while 30% of the interviewees were clients selected from NACAhealth or counseling programs. Ninety-seven percent (97%) of the interviewswere conducted in the Flagstaff area and 3% of respondents were interviewedin Page.
Measures
The final protocol included a demographic survey including a sectionon barriers to service utilization, acculturation scale (Albaugh, Robin, &Chester, 1991) and a standardized, age appropriate checklist. Both thedemographic survey and acculturation scale were adapted from similarinstruments presently being used by the National Institutes of Health (NIH) inthree American Indian communities.
The Child Behavioral Checklist (CBCL) (Achenbach, 1991a) and YouthSelf Report (YSR) (Achenbach, 1991b) were developed as part of a multiaxialempirically-based assessment procedure. For children, this procedure isbased upon the assumption that parents and parent surrogates are typicallyamong the most important sources of data about children’s competenciesand problems, particularly as these occur across both time and situations.
The YSR is interpreted through use of a profile analysis. Thecompetence profile is based upon three scores: (a) activities, (b) social, and(c) school performance. Problem areas are scored on the basis of ninescales: (a) withdrawn, (b) somatic complaints, (c) anxious/depressed, (d)social problems, (e) thought problems, (f) attention problems, (g) delinquentbehavior, and (h) aggressive behavior. The scores of scales a, b, and c aretotaled to determine the “internalizing” problems scale score, while scales gand h are totaled to determine the “externalizing” problems scale score.The CBCL is scored in a similar fashion.
American Indian and Alaska Native Mental Health Research Copyright: Centers for American Indian and Alaska Native Health
Colorado School of Public Health/University of Colorado Anschutz Medical Campus (www.ucdenver.edu/caianh)

NORTHERN ARIZONA MENTAL HEALTH NEEDS 29
Although used in a multitude of cross-cultural studies, great caremust be taken when interpreting and applying the results of these surveys tothe present population. This is due to the fact that only 3% of the combinednormative sample of 2,368 were “other” (possibly including American Indians),as opposed to 7% Hispanic, 16% Black, and 73% White. Also, the normativesample came primarily from the northeast and north central regions, andwas predominantly upper or middle class.
The Personal Problems Checklist for Adults (Schinka, 1984) is agross survey of common problems, developed primarily for screening andintake purposes. The checklist covers 13 problem areas including (a) family/home, (b) crisis, (c) finances, (d) emotional problems, (e) health/habits,and (f) legal problems.
The Acculturation Questionnaire used in the present study wasdesigned through a process of dialogue with acknowledged community leadersfrom several tribal groups in Arizona, New Mexico, and Oklahoma. Thisscale is a shortened version of an instrument presently being used byresearchers from NIH. The scale examines such characteristics as values,beliefs, practice, and knowledge within the five dimensions of language,cultural heritage, ethnicity, spirituality, and perceived discrimination. Sincethe instrument has not yet been normed, interpretation for the purposes ofthis study involved a simple item analysis. This instrument was administeredto individuals over the age of thirteen.
All but one of these instruments (the Acculturation Questionnaire)were originally designed to be completed by the interviewee. However, forpurposes of this study, all items were presented orally by the trained, bilingualinterviewers. This was done to increase rapport and interviewee willingnessto respond, and to overcome possible lack of reading comprehension.
Analytic Plan
NACA staff were most interested in population specific results inorder to design practical mental health services. Almost all information wastabulated by item with the exception of the YSR and CBCL. These checklistswere scored using standard profiles in order to examine areas of competence,problem areas, and the percentage of children and youth whose problemscores placed them within the clinical range. Mean T-scores were calculatedfor the competencies scale, internalizing problems scale, externalizingproblems scale, and overall problems scales. In addition the endorsementitems from the YSR and CBCL were also examined.
Results
The entire survey packet was administered to a total of 235 people:156 adults, 28 adolescents, and parents of 51 children. Interviews variedgreatly in length, depending upon the age and interest of the interviewee
American Indian and Alaska Native Mental Health Research Copyright: Centers for American Indian and Alaska Native Health
Colorado School of Public Health/University of Colorado Anschutz Medical Campus (www.ucdenver.edu/caianh)
30 VOLUME 8, NUMBER 3
and language of the interview. Eighteen percent (18%) of the surveys wereconducted in the Navajo language and the remaining 82% in English.Demographic characteristics of the respondents are summarized in Table 1.
Factors Affecting Service Utilization
One important area of concern for NACA was the use of and barriersto use of services. The demographic survey explored several issues in thisarea, the results of which are summarized in Table 2.
Of those using professional help, 48% said that the experience washelpful and continue to use these services as needed. Others stopped usingthese services for a variety of reasons including (a) family criticism (20%),(b) feeling “judged” by the professional (16%), (c) referrals to costlyprofessional services (8%), and (d) lack of skill on the part of the professional(8%). When traditional healers were included in the category of professionalhelp, only 1% of respondents reported using this service.
Of those who never used professional services, 60% stated thatthey had no need of these services, 20% said that they had no informationregarding these services, 17% felt that people should only talk about thesethings with close relatives, and 16% said that these services cost too muchmoney.
Personal Problem Checklist for Adults
The endorsement of the 146 adult interviewees (46 male and 100female) of specific problems from the personal problems checklist issummarized in Table 3. In terms of designing a mental health program, it isnotable that 46% of these adults endorsed “family death,” 39% anxiety, 37%depression, 16% drugs/alcohol, and 9% suicidal thoughts as personalproblems. Twenty-seven percent (27%) of the adult interviewees reportedthat suicide attempts and suicide completion had occurred in their families.
Youth Self-Report
The mean competence T-scores and percentage of youth with belowaverage competence scores from the YSR are summarized in Table 4. Onequarter of youth who completed the YSR had below average competencescores. These low scores were due exclusively to low scores on the schoolperformance scale.
The mean problems scores and percentage of youth scoring withinthe clinical range on the YSR is summarized in Table 5. T-scores on thesescales ranged from 45 to 79. Almost one-fifth of youth scored within theclinical range on the Total Problems scale. Responses to several questionsfrom the YSR were also examined. Fifty-eight percent (58%) of the 28youths reported problematic nightmares, 51% associated with badcompanions, 42% were truant, and 27% admitted to alcohol and/or druguse.
American Indian and Alaska Native Mental Health Research Copyright: Centers for American Indian and Alaska Native Health
Colorado School of Public Health/University of Colorado Anschutz Medical Campus (www.ucdenver.edu/caianh)
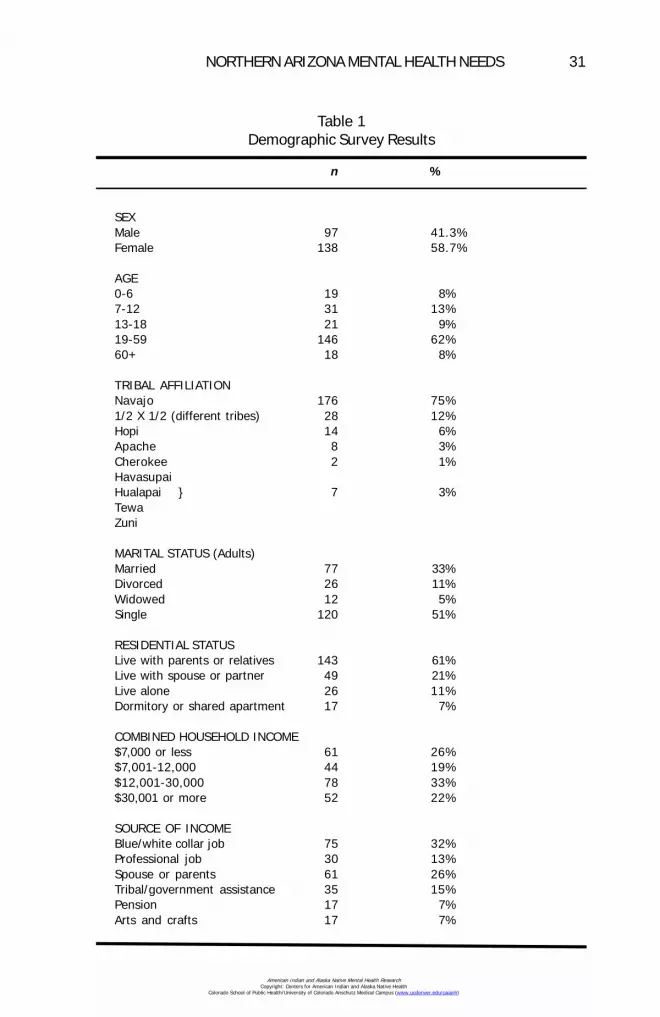
NORTHERN ARIZONA MENTAL HEALTH NEEDS 31
Table 1Demographic Survey Results
n %
SEXMale 97 41.3%Female 138 58.7%
AGE0-6 19 8%7-12 31 13%13-18 21 9%19-59 146 62%60+ 18 8%
TRIBAL AFFILIATIONNavajo 176 75%1/2 X 1/2 (different tribes) 28 12%Hopi 14 6%Apache 8 3%Cherokee 2 1%HavasupaiHualapai } 7 3%TewaZuni
MARITAL STATUS (Adults)Married 77 33%Divorced 26 11%Widowed 12 5%Single 120 51%
RESIDENTIAL STATUSLive with parents or relatives 143 61%Live with spouse or partner 49 21%Live alone 26 11%Dormitory or shared apartment 17 7%
COMBINED HOUSEHOLD INCOME$7,000 or less 61 26%$7,001-12,000 44 19%$12,001-30,000 78 33%$30,001 or more 52 22%
SOURCE OF INCOMEBlue/white collar job 75 32%Professional job 30 13%Spouse or parents 61 26%Tribal/government assistance 35 15%Pension 17 7%Arts and crafts 17 7%
American Indian and Alaska Native Mental Health Research Copyright: Centers for American Indian and Alaska Native Health
Colorado School of Public Health/University of Colorado Anschutz Medical Campus (www.ucdenver.edu/caianh)
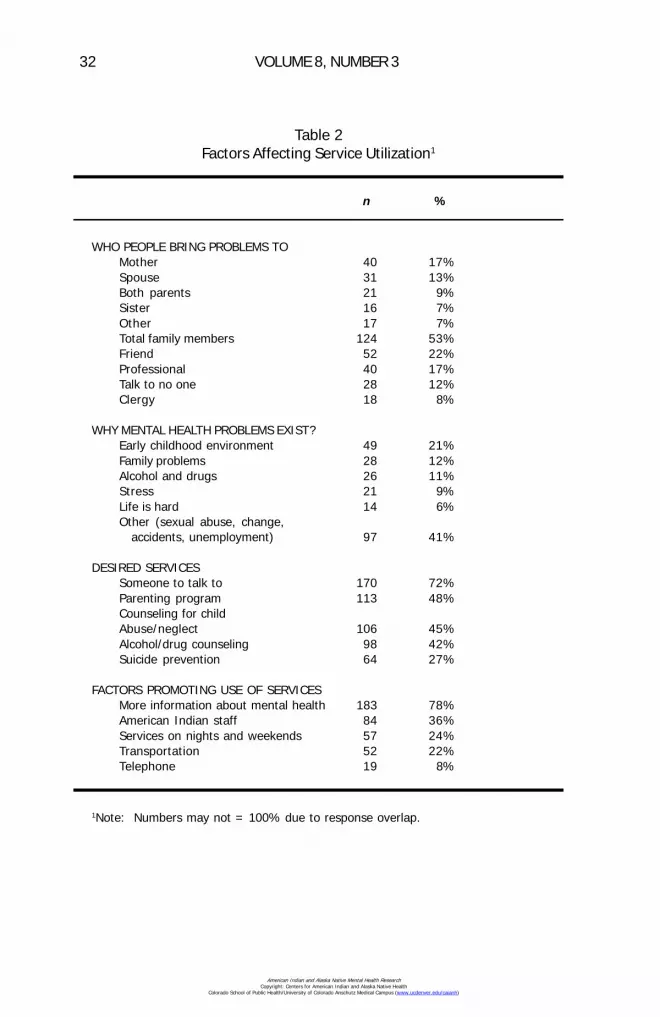
32 VOLUME 8, NUMBER 3
Table 2Factors Affecting Service Utilization1
n %
WHO PEOPLE BRING PROBLEMS TOMother 40 17%Spouse 31 13%Both parents 21 9%Sister 16 7%Other 17 7%Total family members 124 53%Friend 52 22%Professional 40 17%Talk to no one 28 12%Clergy 18 8%
WHY MENTAL HEALTH PROBLEMS EXIST?Early childhood environment 49 21%Family problems 28 12%Alcohol and drugs 26 11%Stress 21 9%Life is hard 14 6%Other (sexual abuse, change, accidents, unemployment) 97 41%
DESIRED SERVICESSomeone to talk to 170 72%Parenting program 113 48%Counseling for childAbuse/neglect 106 45%Alcohol/drug counseling 98 42%Suicide prevention 64 27%
FACTORS PROMOTING USE OF SERVICESMore information about mental health 183 78%American Indian staff 84 36%Services on nights and weekends 57 24%Transportation 52 22%Telephone 19 8%
1Note: Numbers may not = 100% due to response overlap.
American Indian and Alaska Native Mental Health Research Copyright: Centers for American Indian and Alaska Native Health
Colorado School of Public Health/University of Colorado Anschutz Medical Campus (www.ucdenver.edu/caianh)
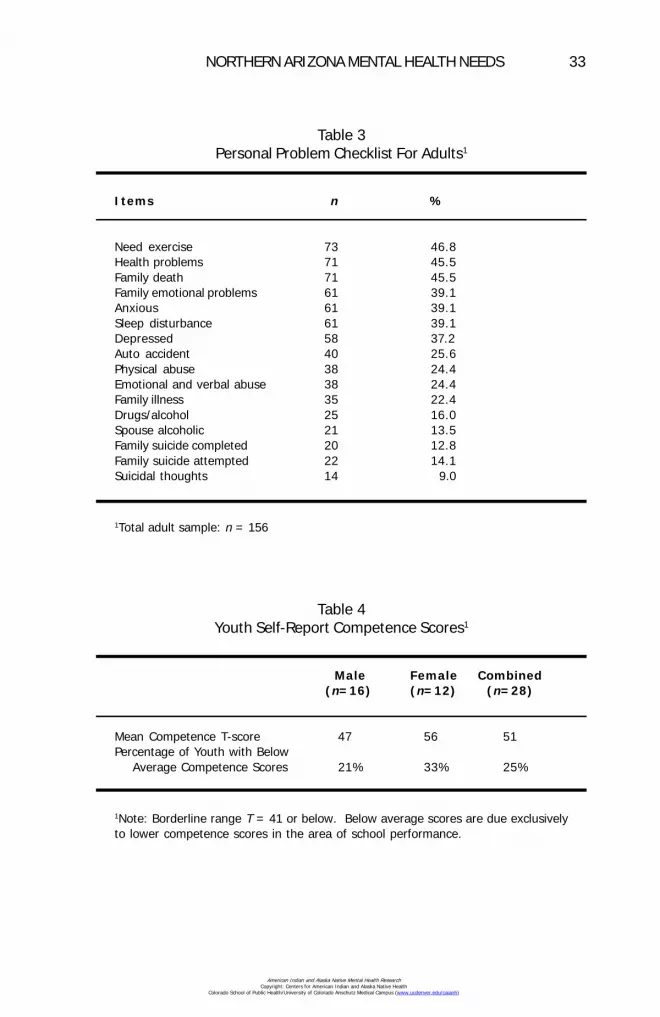
NORTHERN ARIZONA MENTAL HEALTH NEEDS 33
Table 3Personal Problem Checklist For Adults1
Items n %
Need exercise 73 46.8Health problems 71 45.5Family death 71 45.5Family emotional problems 61 39.1Anxious 61 39.1Sleep disturbance 61 39.1Depressed 58 37.2Auto accident 40 25.6Physical abuse 38 24.4Emotional and verbal abuse 38 24.4Family illness 35 22.4Drugs/alcohol 25 16.0Spouse alcoholic 21 13.5Family suicide completed 20 12.8Family suicide attempted 22 14.1Suicidal thoughts 14 9.0
1Total adult sample: n = 156
Table 4Youth Self-Report Competence Scores1
Male Female Combined(n=16) (n=12) (n=28)
Mean Competence T-score 47 56 51Percentage of Youth with Below Average Competence Scores 21% 33% 25%
1Note: Borderline range T = 41 or below. Below average scores are due exclusivelyto lower competence scores in the area of school performance.
American Indian and Alaska Native Mental Health Research Copyright: Centers for American Indian and Alaska Native Health
Colorado School of Public Health/University of Colorado Anschutz Medical Campus (www.ucdenver.edu/caianh)
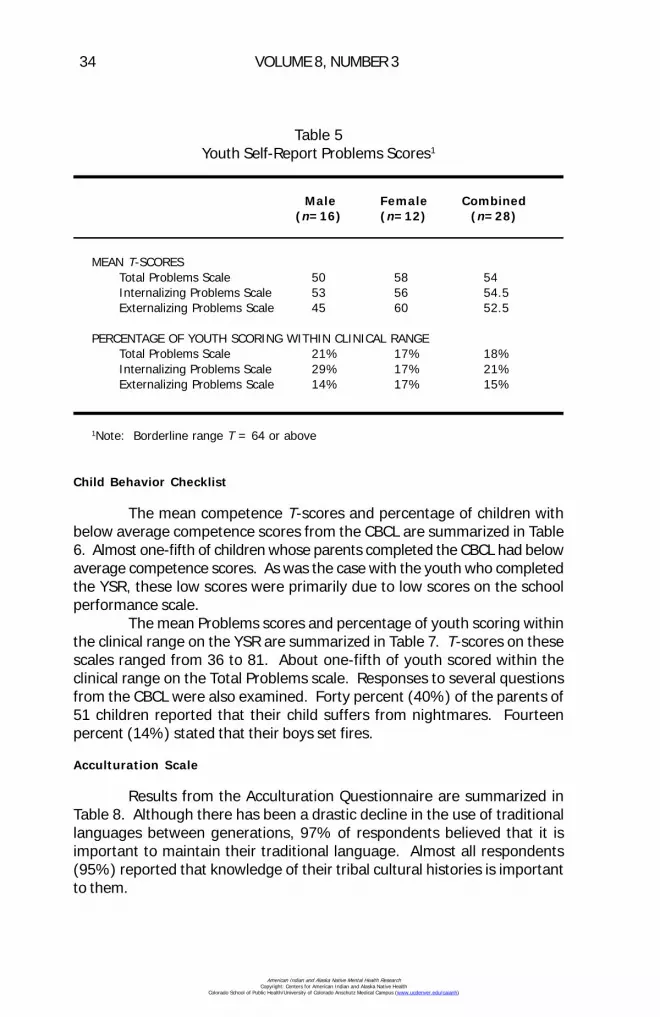
34 VOLUME 8, NUMBER 3
Child Behavior Checklist
The mean competence T-scores and percentage of children withbelow average competence scores from the CBCL are summarized in Table6. Almost one-fifth of children whose parents completed the CBCL had belowaverage competence scores. As was the case with the youth who completedthe YSR, these low scores were primarily due to low scores on the schoolperformance scale.
The mean Problems scores and percentage of youth scoring withinthe clinical range on the YSR are summarized in Table 7. T-scores on thesescales ranged from 36 to 81. About one-fifth of youth scored within theclinical range on the Total Problems scale. Responses to several questionsfrom the CBCL were also examined. Forty percent (40%) of the parents of51 children reported that their child suffers from nightmares. Fourteenpercent (14%) stated that their boys set fires.
Acculturation Scale
Results from the Acculturation Questionnaire are summarized inTable 8. Although there has been a drastic decline in the use of traditionallanguages between generations, 97% of respondents believed that it isimportant to maintain their traditional language. Almost all respondents(95%) reported that knowledge of their tribal cultural histories is importantto them.
Table 5Youth Self-Report Problems Scores1
Male Female Combined(n=16) (n=12) (n=28)
MEAN T-SCORESTotal Problems Scale 50 58 54Internalizing Problems Scale 53 56 54.5Externalizing Problems Scale 45 60 52.5
PERCENTAGE OF YOUTH SCORING WITHIN CLINICAL RANGETotal Problems Scale 21% 17% 18%Internalizing Problems Scale 29% 17% 21%Externalizing Problems Scale 14% 17% 15%
1Note: Borderline range T = 64 or above
American Indian and Alaska Native Mental Health Research Copyright: Centers for American Indian and Alaska Native Health
Colorado School of Public Health/University of Colorado Anschutz Medical Campus (www.ucdenver.edu/caianh)

NORTHERN ARIZONA MENTAL HEALTH NEEDS 35
Table 6Child Behavior Checklist Competence Scores1
Male Female Combined(n=35) (n=16) (n=51)
Mean Competence T-score 45 51 48Percentage of Youth with Below Average Competence Scores 28% 8% 18%
1Note: Borderline range T = 41 or below. Below average scores are due primarily toschool performance.
Table 7Child Behavior Checklist Clinical Scores1
Male Female Combined(n=35) (n=15) (n=51)
MEAN T-SCORESTotal Problems Scale 55 52 53.5Internalizing Problems Scale 55 50 52.5Externalizing Problems Scale 52 48 50
PERCENTAGE OF YOUTH SCORING WITHIN CLINICAL RANGE
Total Problems Scale 31% 13% 22%Internalizing Problems Scale 29% 19% 24%Externalizing Problems Scale 20% 6% 13%
1Note: Borderline range T = 64 or above
American Indian and Alaska Native Mental Health Research Copyright: Centers for American Indian and Alaska Native Health
Colorado School of Public Health/University of Colorado Anschutz Medical Campus (www.ucdenver.edu/caianh)

36 VOLUME 8, NUMBER 3
In terms of ethnic identity, 58% of those responding to the surveyidentified primarily with their own tribal group (e.g., Navajo, Hopi, Hualapai),while 44% identified themselves more broadly as American Indian. Only 5%of those responding identified themselves primarily as “American.” Morethan half (55%) of those responding to the survey reported that they haveexperienced discrimination because of their ethnicity. Thirty-nine percent(39%) also believed that they receive different treatment from other AmericanIndian people who are not part of their tribe.
Most respondents (73%) felt that the best thing for American Indianpeople is to accommodate to modern life, and 74% said that moderntechnology has been good for peoples’ lives.
Medical Record Review
Fourteen percent (14%) of adult clinic patients reported self orspousal problems with alcohol use. Ten percent (10%) reported feelings ofdepression. Reported physical symptoms that may be related to emotionaldistress are shown in Table 9.
Table 8Acculturation Scale1
n %
LANGUAGESpeaks traditional language fluently 118 64%Verbal comprehension of language 138 75%Speaks English fluently 162 88%Children speak language fluently 27 15%Traditional language spoken at home 13 7%
HERITAGEReservation born 147 80%Born in bordertown 30 16%Never lived on reservation 7 4%Told traditional stories as child 143 78%Given Indian name 83 45%
SPIRITUALITY/RELIGIONParticipated in clan initiation ceremonies 101 55%Use traditional healers or medicine person 96 52%Belong to denominational church 112 61%Belong to Native American Church 47 26%
1Total adult and adolescent sample: n = 184
American Indian and Alaska Native Mental Health Research Copyright: Centers for American Indian and Alaska Native Health
Colorado School of Public Health/University of Colorado Anschutz Medical Campus (www.ucdenver.edu/caianh)

NORTHERN ARIZONA MENTAL HEALTH NEEDS 37
Discussion
Consistent with others studies of American Indian people, the currentsurvey demonstrates a high rate of distress within this off-reservationpopulation. After reviewing the survey results, it is clear that there are fiveprimary factors that require serious consideration when planning a programfor this community.
First, a mental health agency developed within this community needsto take an integrated approach to services, and to consider the impact ofphysical, social, and economic concerns on mental and emotional health.Consistent with other findings (i.e., Resnick & Blum, 1992), this communityreports high rates of feeling depressed (38%), suicide in family members(27% completed or attempted), and drug and alcohol abuse (31%). Inaddition to these problems, people expressed concerns about their generalhealth, the need for vacations, physical exercise, and job security. Almosthalf (45%) of the people surveyed live in households that are close to orbelow the poverty level for families of four or more.
Second, elements contributing to distress at differing ages shouldbe the target of age-specific prevention programs. Children appear todemonstrate more competence than youth in school performance, a findingalso noted by others (Lujan, Debruyn, May, & Bird, 1989). Internalizingproblems appear to be more prevalent in the adolescents, and externalizingproblems more prevalent in adolescent females when compared to theparental report concerning female children. Findings also demonstratenightmares during sleep in 40% of children and 58% adolescents, suggesting
Table 9Information From NACA Health Clinic Files1
n %
Frequent headaches 26 18%Tired 26 18%Alcohol/drug use 20 14%Dizzy/faint 19 13%Down/depressed 15 10%Nervous/irritable 15 10%Difficulty sleeping 12 8%Shortness of breath 7 5%Night sweats 4 3%
1Ten percent of adult intake files: n = 144
American Indian and Alaska Native Mental Health Research Copyright: Centers for American Indian and Alaska Native Health
Colorado School of Public Health/University of Colorado Anschutz Medical Campus (www.ucdenver.edu/caianh)
38 VOLUME 8, NUMBER 3
the possibility of significant trauma in these groups. In general, this surveydemonstrates a progression of both problems and coping mechanisms which,if handled well at critical developmental levels, might reduce crises andenhance coping in later life.
Third, the ability to adapt to another culture in the midst of rapidchange, while maintaining one’s own cultural integrity, is an inherent strengththat can and should be utilized in program planning on both the individualand community level. It is clear from the responses to the AcculturationQuestionnaire that culture is an important element in the lives of communityindividuals. To be effective, a mental health program must integrate culturalvariables into the treatment milieu.
It is also important to note that there is a large contrast between theinformation obtained using the Acculturation Questionnaire (52%) and thatobtained in the demographic survey (1%) regarding the use of traditionalhealers. This may be due to the fact that respondents view traditional healingfrom a cultural or spiritual context, as opposed to a professional one. Thiskind of contrast underscores the importance of using collateral forms of dataand being aware of the context of questions, particularly when working withdiverse cultures.
Fourth, an outreach component is necessary for a successful off-reservation mental health program. One compelling finding indicated thatlack of information about mental health and available services is a strongbarrier to service utilization. Similarly, almost one-fourth (22%) of thepopulation is hampered by a lack of transportation. A bilingual, biculturaloutreach to individuals is essential in order to address these needs.
Fifth, the screening for psychological distress in general health casesettings should be reconsidered. The present survey supports the under-reporting of data from client files found in the literature (O’Nell, 1989). Muchlower levels of self-reported psychological symptoms and behaviors werefound on intake forms used by patients at the Health Clinic than when peoplewere asked similar questions by local interviewers. For example, while 31%of the interviewed adult sample reported problems with alcohol or drug useby self or spouse, only 14% of adult clinic patients reported such use. While38% of the interviewed adult sample reported problematic feelings ofdepression, only 10% of adult clinic patients self-reported such feelings.
As clinic patients are drawn from the same population as theinterviewed sample, it is unlikely that their emotional distress or use of alcoholwould be lower than the interviewed sample. It is more likely that, for variousreasons, patients self-report significantly fewer emotional problems in medicalclinics than they do in personal interviews with trained bilingual interviewers.
Conclusion
There are many elements that compose the value that is defined asmental health, and a number of factors that have a potential impact on well-
American Indian and Alaska Native Mental Health Research Copyright: Centers for American Indian and Alaska Native Health
Colorado School of Public Health/University of Colorado Anschutz Medical Campus (www.ucdenver.edu/caianh)
NORTHERN ARIZONA MENTAL HEALTH NEEDS 39
being at all developmental stages. Although a community mental healthprogram cannot reverse the deleterious effects of poverty, marginalization,and racism, such a program can name and recognize both the problemareas and competencies that have an impact on recovery.
Happily I recover. Happily my interior becomes cool. Happily I goforth. My interior feeling cool, may I walk. No longer sore, may Iwalk. Impervious to pain, may I walk. With lively feelings, may Iwalk. As it used to be long ago, may I walk. Happily may I walk.(Navajo Night Chant)
Direct all correspondence to:Robert W. Robin, Ph.D.
P.O. Box 617Sitka, AK 99835
References
Achenbach, T. M. (1991a). Manual for the Child Behavior Checklist 4-18 and1991 Profile. Burlington, VT: University of Vermont.
Achenbach, T. M. (1991b). Manual for the Youth Self-Report and 1991 Profile.Burlington, VT: University of Vermont.
Albaugh, B., Robin, R. W., & Chester, B. (1991). The ARC Acculturation Scale.Unpublished. Bethesda, MD: National Institute on Alcohol Abuse andAlcoholism, National Institute of Health.
Arizona Department of Economic Security. (1989). Population Estimates, Stateof Arizona, Phoenix.
Kammer, J. (1980). The second long walk. Albuquerque, NM: University of NewMexico Press.
Lujan, C., Debruyn, L. M., May, P. A., & Bird, M. E. (1989). Profile of abused andneglected American Indian children in the southwest. Child Abuse Neglect,13(4), 449-461.
O’Nell, T. D. (1989). Psychiatric investigations among American Indians andAlaska Natives: A critical review. Culture, Medicine, and Psychiatry, 13, 51-87.
Resnick, M. D., & Blum, R. (1992). The state of Native American youth health.Minneapolis, MN: University of Minnesota, Division of General Pediatrics andAdolescent Health.
Schinka, J. A. (1984). The Personal Problems Checklist for Adults. Odessa, FL:Psychological Assessment Resources.
American Indian and Alaska Native Mental Health Research Copyright: Centers for American Indian and Alaska Native Health
Colorado School of Public Health/University of Colorado Anschutz Medical Campus (www.ucdenver.edu/caianh)
40 VOLUME 8, NUMBER 3
Authors' Note
Dr. Barbara Chester died in October of 1997. We lament the loss ofan effective advocate for indigenous people and a champion of human rights.
Appreciation is extended to Freida Brown, Loria Carter, FannieDedman, Bettie Gleason, Dorothy Hatathli, Karen Smith, Norma Tracey, UrsulaWatson, and Stephanie Dempsey.
American Indian and Alaska Native Mental Health Research Copyright: Centers for American Indian and Alaska Native Health
Colorado School of Public Health/University of Colorado Anschutz Medical Campus (www.ucdenver.edu/caianh)

MENTAL HEALTH NEEDS ASSESSMENT OF TUCSON’SURBAN NATIVE AMERICAN POPULATION
Veronica Evaneshko, Ph.D., RN
Abstract: This report presents the design, implementation,and results of a 1992 mental health needs assessment ofTucson’s urban American Indians. The study was conductedunder the auspices of the Traditional Indian Alliance (TIA) ofGreater Tucson, Inc.1 TIA is a community-based, non-profitcorporation committed to addressing the health and socialwelfare issues of Tucson’s American Indians. As a result ofhaving provided health and social services since 1974, TIArecognized that there were many unmet needs for culturallysensitive American Indian mental health programs. Theorganization established a goal of assessing the mental healthneeds of Tucson’s urban American Indians in order to obtainthe information needed to enhance program developmentand the provision of services. This survey was conducted inorder for Traditional Indian Alliance to enhance its mentalhealth program development and improve the provision ofmental health services to Tucson’s urban American Indians.The specific objectives of this study on Tucson’s urbanAmerican Indian population included documentation of (a)the nature of socioeconomic problems that might have apsychological effect, (b) the existence of psychologicaldistress, and (c) the types of available support systems andtheir utilization.
Urban American Indians have both the reservation population’sburden of poor physical health and the urban area’s burden of increasedstress combined with fewer available health services (American Indian HealthCare Association, 1989). A few studies have specifically documented thehigh levels of mental health problems among urban American Indians (Borunda& Shore, 1980; Joe & Miller, 1989; Rhoades, Marshall, Attneave, Echohawk,Bjork, & Beiser, 1980; U.S. Senate Select Committee on Indian Affairs, 1985).
41
American Indian and Alaska Native Mental Health Research Copyright: Centers for American Indian and Alaska Native Health
Colorado School of Public Health/University of Colorado Anschutz Medical Campus (www.ucdenver.edu/caianh)

42 VOLUME 8, NUMBER 3
Methods
Study Design
Issues of study design that required resolution included (a) clarity ofthe concepts being measured, (b) adequacy of the instrument designed tomeasure the concepts, and (c) the most effective means of administeringthe instrument. While these are important issues in any study, they requireparticular attention when an assessment is done in a cross-cultural setting.
Data collection for screening purposes (as opposed to diagnosticuses) dictated a focus on social dysfunction rather than psychopathology perse (National Institute of Mental Health, 1985). Measurement of socialdysfunction can involve behavior and/or attitudes and beliefs. For this study,emphasis was placed on obtaining data about how the individual felt sincecognitive processes often have a greater impact than actual circumstanceson how well an individual handles life’s challenges.
Data collecting instruments used in American Indian cross-culturalsettings have unique validation concerns (Liberman & Frank, 1980; O’Nell,1989; Shore & Manson, 1981; Spaulding & Balch, 1985). The instrumentused in this study was an amalgamation of several tools developed and usedby other urban American Indian groups and was obtained from the DallasIntertribal Center. Local American Indians assisted in adapting thequestionnaire to Tucson’s urban residents, focusing on relevancy and culturalmeaningfulness.
A community-wide survey format utilizing American Indianinterviewers was the collection design of choice. The Dallas Intertribal Centerelected to employ their instrument, primarily (but not exclusively), in a selfadministered format to their clinic population. TIA was interested in obtainingknowledge and information from both clinic and nonclinic users in their needsassessment since there is extensive information identifying barriers to urbanAmerican Indian clinic use (Kahn, 1982; LaFromboise, 1988; Lake, 1982;Shannon & Bashshur, 1982). An interview design was preferred in order toprovide an opportunity to clarify items if needed and to benefit from theAmerican Indian interviewer’s insights.
Data Collection Procedure
The data collection format involved home (or, rarely, office) interviewsof American Indians living in the metropolitan area. Initially, five AmericanIndian interviewers were recruited to administer the questionnaires. Twointerviewers were female Tohono O’Odham Registered Nurses; two weremale public school educators (one Navajo, one Apache); and one was aTohono O’Odham female community resident. A male Yaqui public schoolboard member and a female Yaqui community member were used to completea small number of the questionnaires towards the end of the project.
American Indian and Alaska Native Mental Health Research Copyright: Centers for American Indian and Alaska Native Health
Colorado School of Public Health/University of Colorado Anschutz Medical Campus (www.ucdenver.edu/caianh)

TUCSON MENTAL HEALTH NEEDS 43
The five original interviewers participated in a six hour training sessiondesigned to acquaint them with the project’s goals and procedures of datacollection. During the training session the interviewers participated in adaptingthe questionnaire to ensure relevancy for the local American Indian population.The interviewers also recommended changes in wording and item sequencingwhich enhanced the quality of the final product as well as provided for easieradministration of the instrument.
The interviewers were responsible for locating potential respondents.Each interviewer was assigned an area of the community with which he orshe was familiar and was provided a suggested number of individuals to beinterviewed from specific tribal groups for the area assigned. For example,one area might require interviews from 41 Yaqui, 38 Tohono O’Odham, 12Navajo, etc. The number of respondents from each tribal group that wasneeded for city-wide proportional representation was extrapolated from 1990U.S. Census tract maps for the greater Tucson area.
Respondent recruitment occurred in a number of ways, includingthe use of relatives, friends, neighbors, acquaintances, participant referrals,and serendipity. This recruitment format was used since addresses werenot available and a reliance on clinic lists for potential respondents was notdesired, nor was entry into unknown ghetto pockets where drugs and violencemight exist. The interviewers understood and made a concerted effort toget proportional representation of the entire metropolitan area in terms oftribal affiliation, socioeconomic status, and area of residence.
Only one adult from each household was eligible to participate inthe study for which s/he received a $10 compensation fee. Respondentqualifications included (a) tribal affiliation, (b) urban residency, and (c) age18 or older. The interviewers received $20 per completed interview plusmileage. Although the data collection procedure emphasized an interviewformat at a place of residence or similar area, a few of the questionnaireswere left at office settings for self administration. The interviewer was thenresponsible for going over any questionable parts with the respondent.
The questionnaire was extensive and took an average of 45-60minutes to complete. Data on sociodemographics were collected to presenta profile of the sample population; to discuss the sample population’srepresentativeness; and to establish the existence of potential and actualsocial problems known to be associated with mental health disorders. Dataon personal and community support systems were collected to identifyknowledge of available support systems and their utilization. Mental healthdata were collected to document indications of psychological distress.
Results
A total of 199 questionnaires were obtained of which 174 were usedin this analysis. Twenty-five questionnaires were not used because therespondents were at least one of the following: (a) nonurban, (b) homeless
American Indian and Alaska Native Mental Health Research Copyright: Centers for American Indian and Alaska Native Health
Colorado School of Public Health/University of Colorado Anschutz Medical Campus (www.ucdenver.edu/caianh)
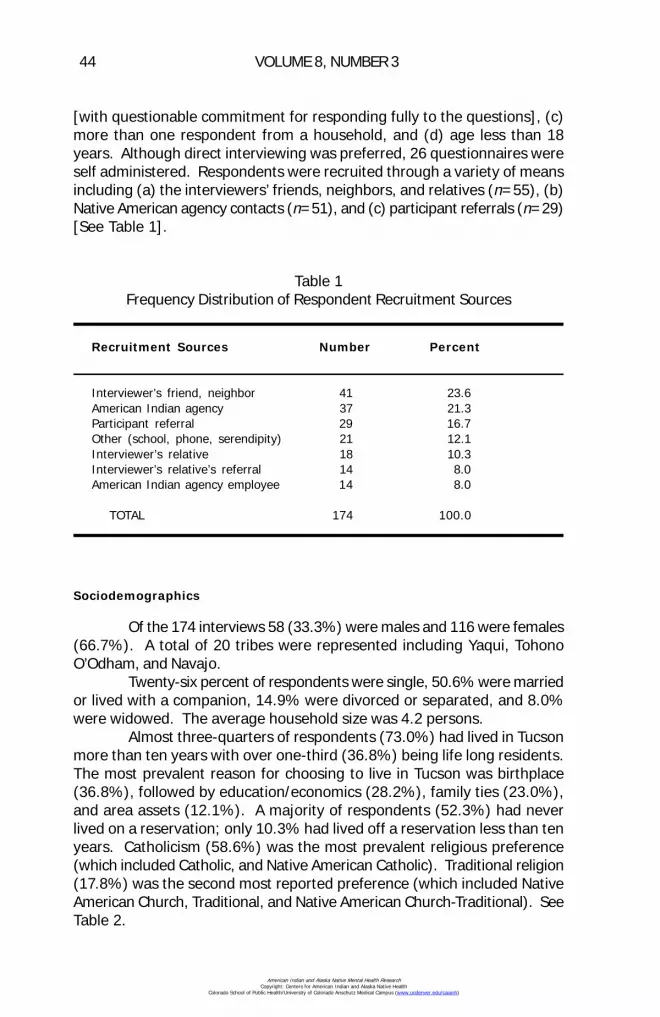
44 VOLUME 8, NUMBER 3
[with questionable commitment for responding fully to the questions], (c)more than one respondent from a household, and (d) age less than 18years. Although direct interviewing was preferred, 26 questionnaires wereself administered. Respondents were recruited through a variety of meansincluding (a) the interviewers’ friends, neighbors, and relatives (n=55), (b)Native American agency contacts (n=51), and (c) participant referrals (n=29)[See Table 1].
Sociodemographics
Of the 174 interviews 58 (33.3%) were males and 116 were females(66.7%). A total of 20 tribes were represented including Yaqui, TohonoO’Odham, and Navajo.
Twenty-six percent of respondents were single, 50.6% were marriedor lived with a companion, 14.9% were divorced or separated, and 8.0%were widowed. The average household size was 4.2 persons.
Almost three-quarters of respondents (73.0%) had lived in Tucsonmore than ten years with over one-third (36.8%) being life long residents.The most prevalent reason for choosing to live in Tucson was birthplace(36.8%), followed by education/economics (28.2%), family ties (23.0%),and area assets (12.1%). A majority of respondents (52.3%) had neverlived on a reservation; only 10.3% had lived off a reservation less than tenyears. Catholicism (58.6%) was the most prevalent religious preference(which included Catholic, and Native American Catholic). Traditional religion(17.8%) was the second most reported preference (which included NativeAmerican Church, Traditional, and Native American Church-Traditional). SeeTable 2.
Table 1Frequency Distribution of Respondent Recruitment Sources
Recruitment Sources Number Percent
Interviewer’s friend, neighbor 41 23.6American Indian agency 37 21.3Participant referral 29 16.7Other (school, phone, serendipity) 21 12.1Interviewer’s relative 18 10.3Interviewer’s relative’s referral 14 8.0American Indian agency employee 14 8.0
TOTAL 174 100.0
American Indian and Alaska Native Mental Health Research Copyright: Centers for American Indian and Alaska Native Health
Colorado School of Public Health/University of Colorado Anschutz Medical Campus (www.ucdenver.edu/caianh)

TUCSON MENTAL HEALTH NEEDS 45
In order to assess acculturation levels, respondents were askedwhether they and their families held to traditional ways, to more modernways, or to both modern and traditional ways. A large majority believed thatthey (73.0%) and their families (60.9%) “held to both modern and traditionalways.” See Table 3.
A review of the available, albeit limited literature, indicated the studygroup was representative of Tucson’s urban American Indian population interms of age range, tribal affiliation, and acculturation (Miller & DeJong,1990). However, the study’s male-female ratio (1:3) deviated from parity toa larger extent than the usual sex ratio (1:1.2) for Tucson’s urban AmericanIndians (Evaneshko, 1984). The extra number of female respondents wasnot considered a severe impediment given the generally accepted knowledgethat women respondents do better in participating and answering surveys ofthis nature.
A majority of respondents (57.5%) held jobs, 29.9% wereunemployed, and 12.0% were retired, students, or individuals with incomesfrom self employment like bead and silver work. Among the employed the
Table 2Frequency Distribution for Tribal Affiliation, Marital Status,
and Religious Affiliation
Number Percent
Tribal AffiliationYaqui 55 31.6Tohono O’Odham 50 28.7Navajo 21 12.1Apache 8 4.6Cherokee 7 4.0Other 33 19.0
Marital StatusMarried/Companion 87 50.0Single 46 26.4Separated/Divorced 26 14.9Widowed 14 8.0No Answer 1 0.6
Religious AffiliationCatholic 102 58.6Traditional 31 17.8Protestant 23 13.2Other 18 10.3
American Indian and Alaska Native Mental Health Research Copyright: Centers for American Indian and Alaska Native Health
Colorado School of Public Health/University of Colorado Anschutz Medical Campus (www.ucdenver.edu/caianh)

46 VOLUME 8, NUMBER 3
largest number (53%) held semiskilled jobs. The next largest group (33%)worked in skilled positions, while the remainder (14%) held unskilled positions.Also among the employed, 78% were full time and 22% were part time.More than half of the employed respondents (56%) had held their job threeyears or less.
Almost one-third (29.3%) of respondents had less than 12 years ofeducation, 18.4% had earned a high school diploma, and 40.2% had somecollege or completed trade school. Almost half (47.1%) believed theireducation had not prepared them to provide for self and/or family.
More than half of all respondents (54.6%) had total yearly incomesof less than $10,000. Only one-third of respondents were satisfied with theirincomes. Sixty-four percent of respondents rented with 8.6% receiving arent subsidy or residing in public housing. Almost a quarter of the respondents(24.1%) were dissatisfied with their housing situation. Twenty-eight percentof respondents received welfare and 12.6% received tribal supplementassistance. Concomitantly, one third (33.9%) of the respondents identifiedMedicare or AHCCCS (Arizona’s Medicaid) as their medical insurance, andslightly more than one third (36.2%) claimed only IHS (Indian Health Service)service eligibility or no insurance at all. The remaining respondents (29.9%)stated they had group, private, or VA medical insurance.
Cultural Support
Twenty percent of the respondents did not have a reservation ortribal area they called home. Of the 129 respondents who did identify atribal home area, 40.8% had returned more than three times in 1991, whileonly 13.8% had not made any visits.
When asked what services were available at the tribal home areathat could not be obtained in Tucson, the most prevalent response was full,free, or better health care (32.6%), followed by general assistance (28.7%).
Table 3Frequency Distributions of Acculturation Beliefs For Respondent and
Respondent’s Family
Acculturation Categories Respondent Respondent's Familyn % n %
Traditional ways 18 10.3 26 14.9More modern ways 29 16.7 41 23.6Modern and traditional 127 73.0 106 60.9No answer 1 0.6
American Indian and Alaska Native Mental Health Research Copyright: Centers for American Indian and Alaska Native Health
Colorado School of Public Health/University of Colorado Anschutz Medical Campus (www.ucdenver.edu/caianh)

TUCSON MENTAL HEALTH NEEDS 47
A few respondents (9.3%) mentioned cultural support (which includedtraditional medicine), but others (24.8%) said there were no services at thetribal home area that could not be obtained in Tucson. It is important to notethat a quarter of the respondent group had no opinion on this question becausethey had no tribal home area experience. Close to 60% of the respondentssaid they would travel to the reservation or tribal area if the health careservices they needed were there instead of using the services in Tucson.
Family Support
When respondents were asked whether they saw relatives as oftenas they wished 97 (55.7%) responded ‘no’. Reasons given included: (a)distance (31.6%), (b) transportation (16.7%), (c) too busy (16.1%), and (d)money (5.7%). Seven percent of respondents mentioned some form offamily estrangement as a reason for not wishing to see family.
The kinds of things with which relatives helped, that Tucson areaagencies do not or cannot do, included: (a) financial aid (58.0%), (b) emotionalsupport (29.9%), and (c) general assistance (16.7%).
Community Resources
A large majority of respondents (76.4%) indicated they knew of theplaces where community help was available. Respondents most often reliedon local Indian Health Service facilities (50.6%) for their health care. Theuse of other community resources was determined by asking respondents tocheck off from a list of 19 community services. The most frequently checkedcommunity resources used in the past year were (a) food programs (40.2%),(b) Arizona’s Medicaid (39.1%), (c) non urban Native American health carefacilities (31.0%), (d) Traditional Indian Alliance (20.6%), (e) native medicine(20.1%), and (f) Native American church (16.7%). Eight percent of therespondents used an alcohol or drug program in the past year. See Table 4for the top ten community resources reported used in the past year.
The most liked aspect of the community services used was theirgeneral helpfulness (42.5%). The miscellaneous category, which representedthe second highest number of responses (13.8%) included such answers ascompassionate, courteous, professionally efficient, minimal waiting, andtransportation assistance. Almost a fifth (18.4%) of the respondents statedthey had no opinion because they had not needed or had not used Tucson’scommunity services.
Categories of responses for what the individual disliked about thecommunity services that had been used included: (a) nothing (27.6%); and(b) management of time (24.1%) including the hours, excessive waits, faultswith the appointment system, and lack of sufficient time spent with the patientor family; (c) insensitivity (15.5%); and (d) bureaucracy (16.1%).
American Indian and Alaska Native Mental Health Research Copyright: Centers for American Indian and Alaska Native Health
Colorado School of Public Health/University of Colorado Anschutz Medical Campus (www.ucdenver.edu/caianh)
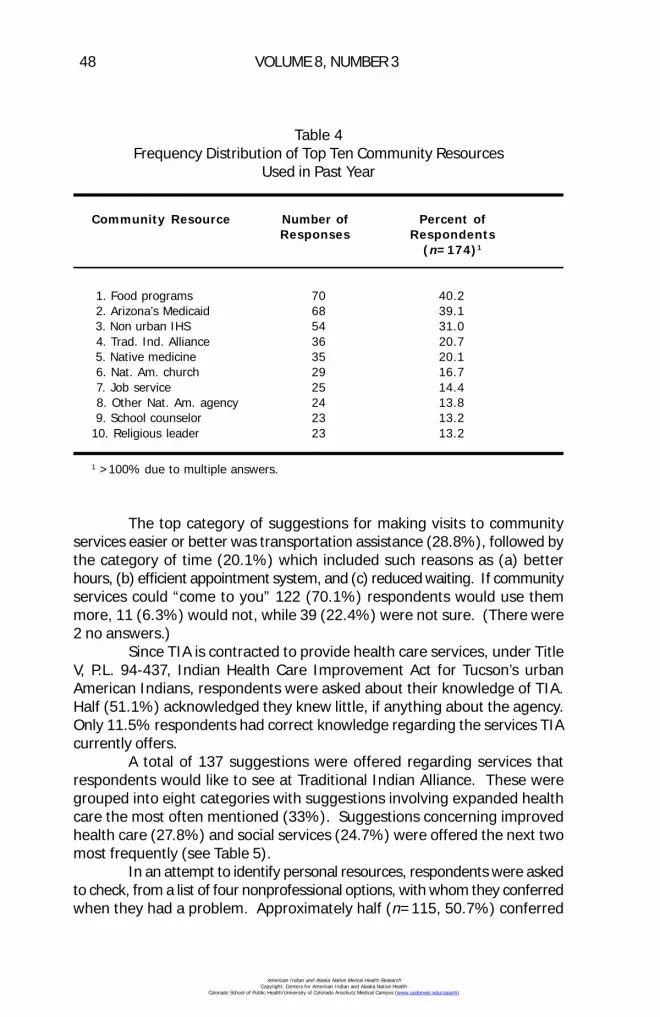
48 VOLUME 8, NUMBER 3
The top category of suggestions for making visits to communityservices easier or better was transportation assistance (28.8%), followed bythe category of time (20.1%) which included such reasons as (a) betterhours, (b) efficient appointment system, and (c) reduced waiting. If communityservices could “come to you” 122 (70.1%) respondents would use themmore, 11 (6.3%) would not, while 39 (22.4%) were not sure. (There were2 no answers.)
Since TIA is contracted to provide health care services, under TitleV, P.L. 94-437, Indian Health Care Improvement Act for Tucson’s urbanAmerican Indians, respondents were asked about their knowledge of TIA.Half (51.1%) acknowledged they knew little, if anything about the agency.Only 11.5% respondents had correct knowledge regarding the services TIAcurrently offers.
A total of 137 suggestions were offered regarding services thatrespondents would like to see at Traditional Indian Alliance. These weregrouped into eight categories with suggestions involving expanded healthcare the most often mentioned (33%). Suggestions concerning improvedhealth care (27.8%) and social services (24.7%) were offered the next twomost frequently (see Table 5).
In an attempt to identify personal resources, respondents were askedto check, from a list of four nonprofessional options, with whom they conferredwhen they had a problem. Approximately half (n=115, 50.7%) conferred
Table 4Frequency Distribution of Top Ten Community Resources
Used in Past Year
Community Resource Number of Percent ofResponses Respondents
(n=174)1
1. Food programs 70 40.2 2. Arizona’s Medicaid 68 39.1 3. Non urban IHS 54 31.0 4. Trad. Ind. Alliance 36 20.7 5. Native medicine 35 20.1 6. Nat. Am. church 29 16.7 7. Job service 25 14.4 8. Other Nat. Am. agency 24 13.8 9. School counselor 23 13.210. Religious leader 23 13.2
1 >100% due to multiple answers.
American Indian and Alaska Native Mental Health Research Copyright: Centers for American Indian and Alaska Native Health
Colorado School of Public Health/University of Colorado Anschutz Medical Campus (www.ucdenver.edu/caianh)
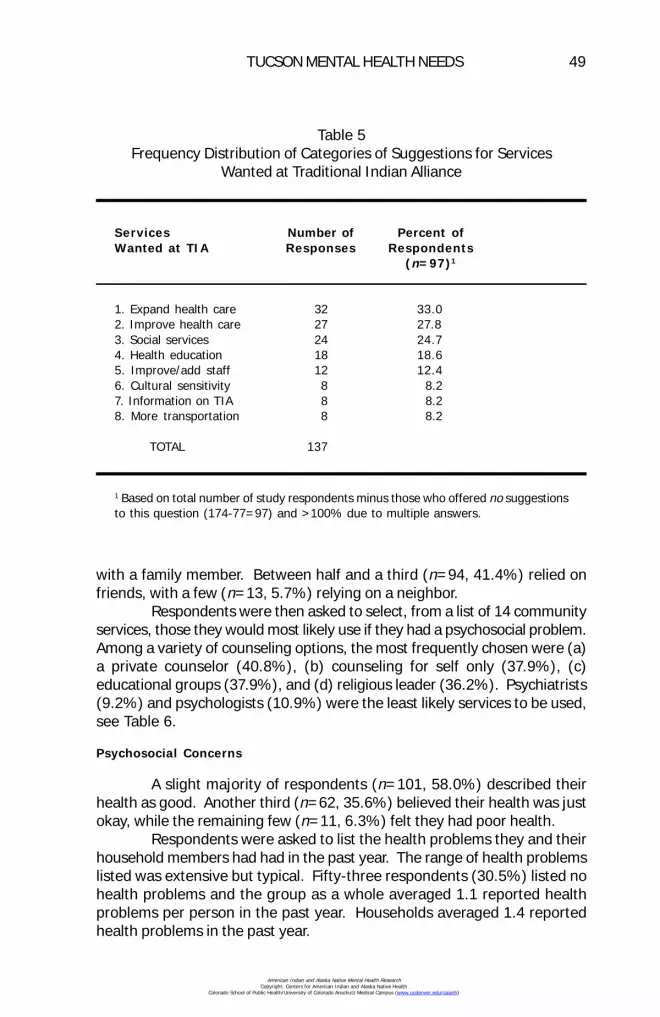
TUCSON MENTAL HEALTH NEEDS 49
with a family member. Between half and a third (n=94, 41.4%) relied onfriends, with a few (n=13, 5.7%) relying on a neighbor.
Respondents were then asked to select, from a list of 14 communityservices, those they would most likely use if they had a psychosocial problem.Among a variety of counseling options, the most frequently chosen were (a)a private counselor (40.8%), (b) counseling for self only (37.9%), (c)educational groups (37.9%), and (d) religious leader (36.2%). Psychiatrists(9.2%) and psychologists (10.9%) were the least likely services to be used,see Table 6.
Psychosocial Concerns
A slight majority of respondents (n=101, 58.0%) described theirhealth as good. Another third (n=62, 35.6%) believed their health was justokay, while the remaining few (n=11, 6.3%) felt they had poor health.
Respondents were asked to list the health problems they and theirhousehold members had had in the past year. The range of health problemslisted was extensive but typical. Fifty-three respondents (30.5%) listed nohealth problems and the group as a whole averaged 1.1 reported healthproblems per person in the past year. Households averaged 1.4 reportedhealth problems in the past year.
Table 5Frequency Distribution of Categories of Suggestions for Services
Wanted at Traditional Indian Alliance
Services Number of Percent ofWanted at TIA Responses Respondents
(n=97)1
1. Expand health care 32 33.02. Improve health care 27 27.83. Social services 24 24.74. Health education 18 18.65. Improve/add staff 12 12.46. Cultural sensitivity 8 8.27. Information on TIA 8 8.28. More transportation 8 8.2
TOTAL 137
1 Based on total number of study respondents minus those who offered no suggestionsto this question (174-77=97) and >100% due to multiple answers.
American Indian and Alaska Native Mental Health Research Copyright: Centers for American Indian and Alaska Native Health
Colorado School of Public Health/University of Colorado Anschutz Medical Campus (www.ucdenver.edu/caianh)
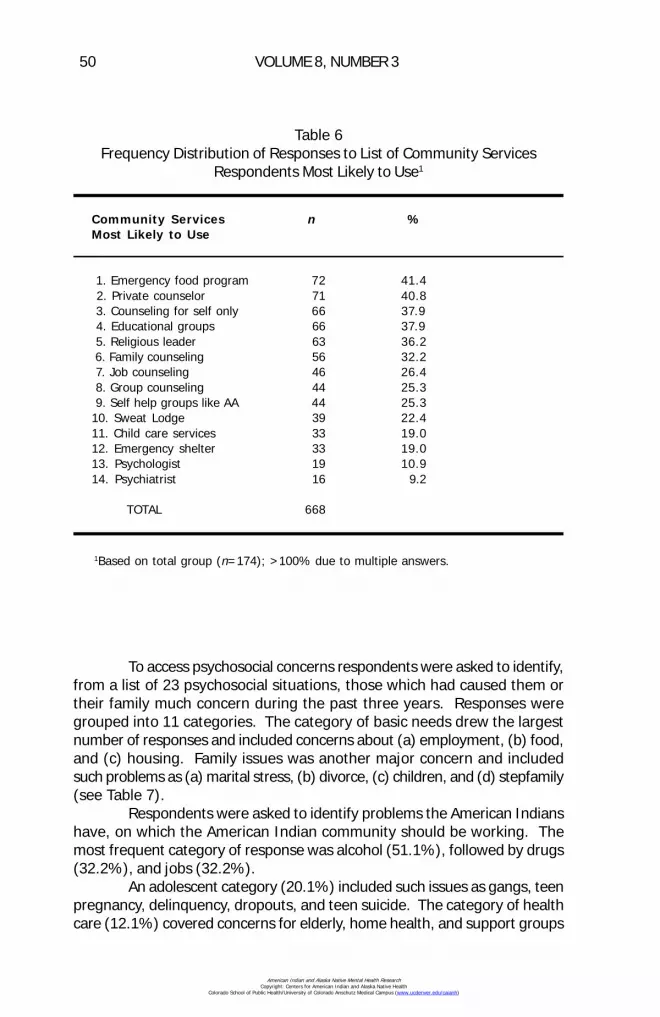
50 VOLUME 8, NUMBER 3
To access psychosocial concerns respondents were asked to identify,from a list of 23 psychosocial situations, those which had caused them ortheir family much concern during the past three years. Responses weregrouped into 11 categories. The category of basic needs drew the largestnumber of responses and included concerns about (a) employment, (b) food,and (c) housing. Family issues was another major concern and includedsuch problems as (a) marital stress, (b) divorce, (c) children, and (d) stepfamily(see Table 7).
Respondents were asked to identify problems the American Indianshave, on which the American Indian community should be working. Themost frequent category of response was alcohol (51.1%), followed by drugs(32.2%), and jobs (32.2%).
An adolescent category (20.1%) included such issues as gangs, teenpregnancy, delinquency, dropouts, and teen suicide. The category of healthcare (12.1%) covered concerns for elderly, home health, and support groups
Table 6Frequency Distribution of Responses to List of Community Services
Respondents Most Likely to Use1
Community Services n %Most Likely to Use
1. Emergency food program 72 41.4 2. Private counselor 71 40.8 3. Counseling for self only 66 37.9 4. Educational groups 66 37.9 5. Religious leader 63 36.2 6. Family counseling 56 32.2 7. Job counseling 46 26.4 8. Group counseling 44 25.3 9. Self help groups like AA 44 25.310. Sweat Lodge 39 22.411. Child care services 33 19.012. Emergency shelter 33 19.013. Psychologist 19 10.914. Psychiatrist 16 9.2
TOTAL 668
1Based on total group (n=174); >100% due to multiple answers.
American Indian and Alaska Native Mental Health Research Copyright: Centers for American Indian and Alaska Native Health
Colorado School of Public Health/University of Colorado Anschutz Medical Campus (www.ucdenver.edu/caianh)

TUCSON MENTAL HEALTH NEEDS 51
such as parenting and money management. A cultural unity category (14.4%)concerned cultural support, self esteem, cultural networking and unity. Afew of the items in the miscellaneous category (16.1%) included prejudice,general assistance, social activities, and the need for American Indians tovolunteer their services to the community. See Table 8 for a full listing of thecategories of American Indian community problems identified by studyrespondents.
To further assess potential psychosocial needs, respondents wereasked to check how often (daily, weekly, seldom, or never) they had concernsabout 22 examples of mental health stresses. When daily and weeklyresponses were combined, the most frequently mentioned stressor was money(55.7%), followed by family members who use alcohol (50.0%). Other highscoring stressors included (a) a feeling of being stressed out (46.0%), (b)feelings of anxiety (41.1%), (c) fear of neighborhood violence (30.5%), and
Table 7Frequency Distribution of Categories of Psychosocial Concerns
n %1
1. Basic needsjob 99 56.9food 81 46.6housing 67 38.5
2. Family issuesmarital stress 31 17.8divorce 26 14.9children 36 20.7
3. Money 140 80.5 4. Drug and/or alcohol 92 52.9 5. Transportation 88 50.6 6. Physical Health 76 43.7 7. Violence
safety 37 21.3suicide 17 9.8abuse 11 6.3
8. Adolescentdropout 35 20.1alcohol use 29 16.7
9. Depression 57 32.810. Law/legal problems 48 27.611. Prejudice 47 27.0
1>100% as multiple responses were allowed
American Indian and Alaska Native Mental Health Research Copyright: Centers for American Indian and Alaska Native Health
Colorado School of Public Health/University of Colorado Anschutz Medical Campus (www.ucdenver.edu/caianh)
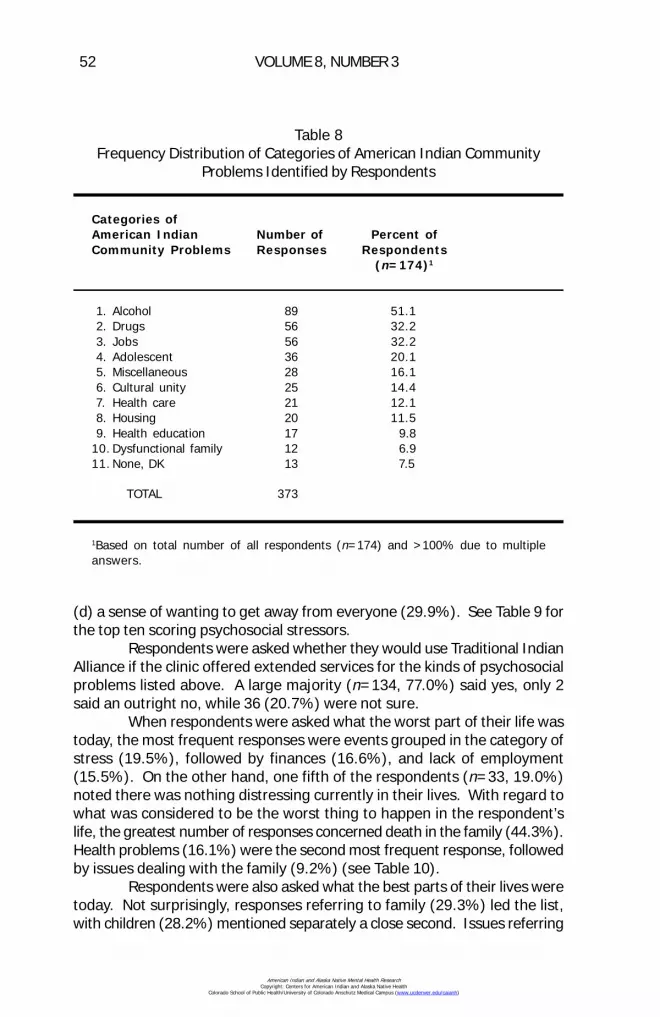
52 VOLUME 8, NUMBER 3
(d) a sense of wanting to get away from everyone (29.9%). See Table 9 forthe top ten scoring psychosocial stressors.
Respondents were asked whether they would use Traditional IndianAlliance if the clinic offered extended services for the kinds of psychosocialproblems listed above. A large majority (n=134, 77.0%) said yes, only 2said an outright no, while 36 (20.7%) were not sure.
When respondents were asked what the worst part of their life wastoday, the most frequent responses were events grouped in the category ofstress (19.5%), followed by finances (16.6%), and lack of employment(15.5%). On the other hand, one fifth of the respondents (n=33, 19.0%)noted there was nothing distressing currently in their lives. With regard towhat was considered to be the worst thing to happen in the respondent’slife, the greatest number of responses concerned death in the family (44.3%).Health problems (16.1%) were the second most frequent response, followedby issues dealing with the family (9.2%) (see Table 10).
Respondents were also asked what the best parts of their lives weretoday. Not surprisingly, responses referring to family (29.3%) led the list,with children (28.2%) mentioned separately a close second. Issues referring
Table 8Frequency Distribution of Categories of American Indian Community
Problems Identified by Respondents
Categories ofAmerican Indian Number of Percent ofCommunity Problems Responses Respondents
(n=174)1
1. Alcohol 89 51.1 2. Drugs 56 32.2 3. Jobs 56 32.2 4. Adolescent 36 20.1 5. Miscellaneous 28 16.1 6. Cultural unity 25 14.4 7. Health care 21 12.1 8. Housing 20 11.5 9. Health education 17 9.810. Dysfunctional family 12 6.911. None, DK 13 7.5
TOTAL 373
1Based on total number of all respondents (n=174) and >100% due to multipleanswers.
American Indian and Alaska Native Mental Health Research Copyright: Centers for American Indian and Alaska Native Health
Colorado School of Public Health/University of Colorado Anschutz Medical Campus (www.ucdenver.edu/caianh)
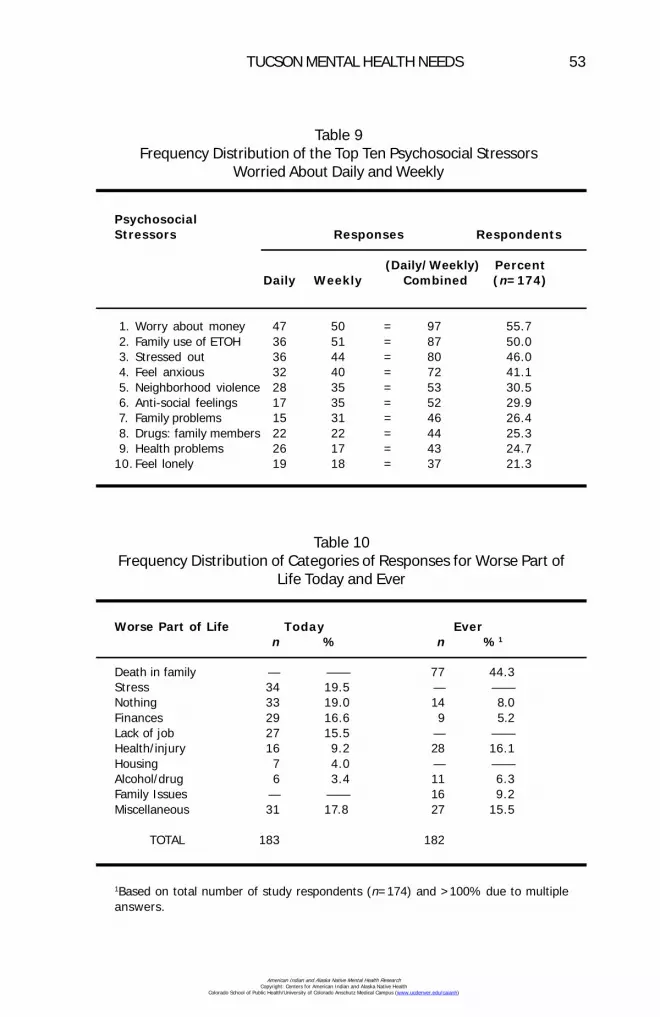
TUCSON MENTAL HEALTH NEEDS 53
Table 9Frequency Distribution of the Top Ten Psychosocial Stressors
Worried About Daily and Weekly
PsychosocialStressors Responses Respondents
(Daily/Weekly) PercentDaily Weekly Combined (n=174)
1. Worry about money 47 50 = 97 55.7 2. Family use of ETOH 36 51 = 87 50.0 3. Stressed out 36 44 = 80 46.0 4. Feel anxious 32 40 = 72 41.1 5. Neighborhood violence 28 35 = 53 30.5 6. Anti-social feelings 17 35 = 52 29.9 7. Family problems 15 31 = 46 26.4 8. Drugs: family members 22 22 = 44 25.3 9. Health problems 26 17 = 43 24.710. Feel lonely 19 18 = 37 21.3
Table 10Frequency Distribution of Categories of Responses for Worse Part of
Life Today and Ever
Worse Part of Life Today Evern % n %1
Death in family — —— 77 44.3Stress 34 19.5 — ——Nothing 33 19.0 14 8.0Finances 29 16.6 9 5.2Lack of job 27 15.5 — ——Health/injury 16 9.2 28 16.1Housing 7 4.0 — ——Alcohol/drug 6 3.4 11 6.3Family Issues — —— 16 9.2Miscellaneous 31 17.8 27 15.5
TOTAL 183 182
1Based on total number of study respondents (n=174) and >100% due to multipleanswers.
American Indian and Alaska Native Mental Health Research Copyright: Centers for American Indian and Alaska Native Health
Colorado School of Public Health/University of Colorado Anschutz Medical Campus (www.ucdenver.edu/caianh)
54 VOLUME 8, NUMBER 3
to personal growth (21.3%) rounded out the top three categories of responses.Childhood (24.1%) was the happiest time in many respondent’s lives, followedby meeting and/or marrying one’s spouse (17.2%). Family (14.4%) andchildren (12.6%) rounded out the top four categories of responses to thequestion of happiest time ever.
Discussion
Socioeconomic Issues
The association between socioeconomics and mental health is welldocumented, with individuals living in poverty having the highest rates ofsevere emotional disorders (Dohrenwend & Dohrenwend, 1969; Hollingshead& Redlich, 1958; Srole, Langer, Michael, Kirkpatrick, Opler, & Rennie, 1962).Few people can stand up to the constant pressure inherent in deciding whichamong life’s necessities will have to be foregone because money is notavailable.
Potentially significant socioeconomic stressors identified in this studyincluded the high number of individuals (a) with less than 12 years of schooling,29%; (b) with yearly incomes of less than $10,000, 55%; (c) with more thanthree people per household, 56%; (d) with semi or unskilled jobs, 39%; (e)with part time positions, 26%; (f) without transportation, 41%; (g) withoutemployment, 30%; (h) without health insurance, 36%; (i) who lived in rentedresidences, 64%; and (j) who relied on income assistance, 36%.
The effect of these socioeconomic factors can be glimpsed from thenumber of respondents who felt the following had given them or their familymuch concern in the past three years: (a) money, 81%; (b) transportation,51%; and (c) basic needs, including job, food, and housing, 47%. Highpercentages of one or two of the above noted economic indicators might betolerable, but the combined weight of all of the indicators paints a grimpicture of a group under severe pressure.
Psychosocial Concerns
Poverty, prolonged unemployment, substandard housing, poornutrition, and inadequate health care in an environment that provides fewsatisfactory options for human action promotes the existence of psychologicalproblems (DeLeon, 1977; LaFromboise, 1988). This situation is compoundedfor a minority group that in many ways has only weakly and partially acceptedwestern values and has, in turn, been allowed only limited, conditionalacceptance and access to the dominant culture (Kahn, 1982).
Evidence of potential psychological distress identified in this studyincluded the high number of individuals: (a) who defined their health aspoor or just okay, 42%; (b) whose family members abuse alcohol, 50%; (c)or drugs, 25%; (d) who frequently feel stressed out, 46%; (e) or anxious,41%; or (f) who often feel the need to get away from everyone, 30%.
American Indian and Alaska Native Mental Health Research Copyright: Centers for American Indian and Alaska Native Health
Colorado School of Public Health/University of Colorado Anschutz Medical Campus (www.ucdenver.edu/caianh)
TUCSON MENTAL HEALTH NEEDS 55
Additional distress signs included reports of: (a) family violence, 18%; (b)other dysfunctional family behaviors, 26%; (c) personal depression, 33%;and (d) concern over personal health, 44%. The respondents furtherdocumented the stress that Tucson’s American Indians were under withtheir identification of the following major problems confronting theircommunity: (a) alcohol, 51%; (b) drugs, 32%; (c) employment, 32%; (d)adolescent troubles, 20%; and (e) cultural disruption, 14%.
Family, Cultural, and Community Resources
Use of the family as a resource was evident in this study. Manyrespondents (23%) chose to live in Tucson because their families were there.A very high 83% believed family members provided each other with strongsupport. Relatives helped with finances (58%), emotional support (30%),and general assistance (17%). A family member would be used as anonprofessional resource by 51% of respondents if they had a problem.Another good indication of the strength of family ties was the fact that morethan half (56%) of the respondents did not see relatives as often as theywould like. Finally, the happiest event in the majority of respondents’ livesconcerned the family (68%), while the worse event also concerned family(55%).
Given the considerable pressures for assimilation which urbanAmerican Indians battle daily, it is surprising the extent to which traditionalvalues and knowledge remain (Miller & De Jong, 1990). One studydocumented the high degree to which Tucson’s American Indians retainedtheir tribal customs and traditions (Joe, Miller, & Narum, 1988). The authorsfound that despite prolonged urbanization, many still speak their nativelanguage and continue to use various types of traditional healing ceremoniesand medicines. Many Tucson American Indians see their residence in thecity as a mere extension of their traditional homeland (Miller & De Jong,1990). Evidence for cultural strength and resource was also found in thiscurrent study.
One of the most intriguing results of this study was the extent towhich respondents maintained contact with their home reservations or tribalareas. This in spite of the fact that 52% had never lived on a reservation andanother 26% had lived off reservation for 15 or more years. More than 40%had returned at least three times in 1991. Only 14% had not visited at all.The high degree of contact can be explained, in part, by the fact that thetraditional home areas for 60% of the respondents are adjacent to the Tucsonmetropolitan area (e.g., San Xavier, Pascua Pueblo, Old Pascua, and theSells Reservation). This proximity, however, was problematic for respondentswith nearby traditional home areas who were part of the 56% not able tovisit relatives as often as they wanted because of distance, lack oftransportation, and finances.
American Indian and Alaska Native Mental Health Research Copyright: Centers for American Indian and Alaska Native Health
Colorado School of Public Health/University of Colorado Anschutz Medical Campus (www.ucdenver.edu/caianh)

56 VOLUME 8, NUMBER 3
Another interesting area for consideration was the respondents’acculturation beliefs. Despite being long time urban residents a very largenumber (83%) retained some component of their traditional ways.Respondents also believed by a large majority (77%) that their families heldto traditional ways. One interpretation of these results is the previouslynoted tendency for native peoples under bombardment to turn to their rootsand seek sanctuary in their traditional value systems. It is not unreasonableto propose that, because of limited, conditional acceptance and access tothe dominant culture, Tucson’s American Indians are rediscovering and placinga higher value on their cultural traditions as a means of offsetting the dominantculture’s dominance. This support of traditional values among urbanAmerican Indians has significance for the provision of their health and socialservices and is discussed further below. Additional evidence of therespondents’ attachment to their traditional home areas was seen in theirresponses to other questions. Many would return for family and for tribalevents (34%). Respondents would also return if they could meet their basicneeds (61%), and would travel to the reservation if the health care servicesthey needed were available (59%). The strength of cultural ties was alsoevident in: (a) preference for traditional religion, 18%; (b) family support ofcultural values, 29%; (c) use of either native medicine, 20%; (d) and/orNative American church, 17%, in the past year; and (e) likely to use sweatlodge if needed, 22%.
Community Resources
Despite the value placed on, and support received from, family andcultural traditions, Tucson’s American Indians are highly dependent on thedominant culture for social and health services. And while many, if not most,of the needed services are available in Tucson the issues of accessibility,acceptability, affordability, and accommodation determine their usage(American Indian Health Care Association, 1989). There has been somedocumentation regarding the failure of American Indians to utilize availableservices (Barter & Barter, 1974; Borunda & Shore, 1980; Dinges, Trimble,Manson, & Pasquale, 1981; Dukepoo, 1980; Red Horse, Lewis, Feit, & Decker,1978; Sue, 1977; Trimble, Manson, Dinges, & Medicine, 1984). Frequentlymentioned was (a) lack of knowledge of availability, (b) lack of understandingof the processes or resource agencies, (c) discouragement due to bureaucraticmorass, and (d) perceptions of agency unresponsiveness. All these andmore were reported by respondents in this study.
To begin with, 23% of respondents stated they did not know wherethey could get help in Tucson. And 36% stated that their lack of knowledgeabout the availability of community services kept them from using theseresources. Other top reasons for not using community services included:(a) excessive waiting, 35%; (b) inconvenient hours, 29%; (c) distance toofar, 29%; (d) lack of transportation, 24%; (e) could not afford availableservice, 22%; and (f) negative experience, 20%. In conjunction with some
American Indian and Alaska Native Mental Health Research Copyright: Centers for American Indian and Alaska Native Health
Colorado School of Public Health/University of Colorado Anschutz Medical Campus (www.ucdenver.edu/caianh)

TUCSON MENTAL HEALTH NEEDS 57
of these responses, it is appropriate to note that 70% of respondents saidthey would use community services more if the services could come to them.The above data do not say that Tucson’s services were not appreciated.When asked what they had liked about community services which they hadused, 52% state that the services were helpful, 11% like their cost (free),and 9% like their availability. Several respondents mentioned how muchthey appreciated the way they were treated at the “local” San Xavier IHSfacility. Their comments specifically mentioned the staff’s attempts to beculturally sensitive. The fairly substantial approval rating offered by therespondents may be due, in part, to the American Indians well knownpreference for acceding, especially vis-a-vis the dominant culture. Thecharming book “Yes Is Better Than No” by Byrd Baylor (1972) exemplifies theunwillingness of American Indians to become embroiled in dissension andnegativity. Because all things are interrelated in the American Indian worldview, everyone and everything is treated with respect; man’s relationship toman is one of getting along, helping one another out. To respond in anegative fashion is to disrupt the harmony of the interrelated whole. “Ratherthan adjust things (including people) to him, the (Native American) is awarethat he, as the one responsible for keeping the balance among all things,must adjust himself to them” (Bryde, 1971, pg. 13). Given this world view,the remarkable thing is the extent to which even some of the respondentsvoiced dislikes.
Additional data from the study points to problems with communityservices utilization. Whereas 68% of respondents had yearly incomes ofless then $15,000, only 34% received assistance from Medicare or Arizona’sMedicaid (AHCCCS). A similar discrepancy between need and assistancewas noted in the American Indian Health Care Association study (1989) ofArizona’s urban American Indians. In their study, of the 37% of Tucson’sAmerican Indians who applied for AHCCCS, only 22% received help.
Traditional Indian Alliance
The problem of the cultural vacuum - that is, lack of American Indiancultural sensitivity by mainstream society - must be bridged, especially whenworking in the crosscultural setting of American Indian mental health (Joe &Miller, 1989, p. 253). Enough information has been accumulated to identifythat the direct application, of a mental health intervention model based onthe dominant society’s beliefs, to an American Indian group is almostguaranteed to fail (Attneave, 1969; Dinges et al., 1981; Kahn, 1982; Lake,1982; Manson, Walker, & Kivlahan, 1987; Scott, et al., 1982). In this context,the importance of an urban clinic with a mission to provide health care for itsAmerican Indians, cannot be underestimated. Clearly TIA is in the positionof being in the vanguard for providing the necessary mental health care forTucson’s American Indians. However, the data in this study pinpoint a fewproblems that will need to be addressed if TIA is to be successful.
American Indian and Alaska Native Mental Health Research Copyright: Centers for American Indian and Alaska Native Health
Colorado School of Public Health/University of Colorado Anschutz Medical Campus (www.ucdenver.edu/caianh)
58 VOLUME 8, NUMBER 3
When respondents were asked what they knew about TIA, 51%stated they had no knowledge of the agency. Only 12% had correct information,while another 13% offered a vague comment that TIA provided AmericanIndian services. The remainder of respondent answers mentioned just oneof the several services provided by TIA. Respondents were also asked whatservices they would like to see at TIA. A large number (44%) had no opinionbecause of their unfamiliarity with the agency. Among those who did knowsomething about TIA, (a) expanded health care, 33%; (b) improved healthcare, 28%; and (c) social services, 25% were the most frequent answers.Interspersed among the answers were a few rare comments on (a) theneed for a better attitude among some of the staff, (b) the need to treat allAmerican Indians who seek help, (c) a concern about nepotism, and (d) thedesire to see more support for traditional medicine. Altogether, these negativecomments came from less than 3% of all respondents.
Overall, just 21% of the respondents had used TIA’s services in thepast year. One explanation for this rather small usage figure was that 34%of the respondents said they had not needed services of a community agencyin general. In addition, TIA offers only a limited number of services, including(a) home health care, (b) information and referral services, and (c) patienteducation programs. Due to the high cost of malpractice insurance andchronic underfunding by Congress, TIA was forced to terminate its medicalclinic in 1989. Also, a significant number of TIA’s potential client base waseither unaware of its existence, or did not know of all the services the agencyoffers.
The summary statement to this study comes from The AmericanIndian Health Care Association (1989, p. 6), in its study on the health careneeds of Arizona’s urban American Indians. “It is encouraging to note thatthe [urban American Indian] community reports a need for mental healthservices, indicating that the often significant barrier of denial of need formental health care does not exist.” However, providing for the mental healthneeds of Tucson’s American Indian population remains a challenge for theTIA and other community services.
Corrine JymmExecutive Director
Inter-Tribal Health Care Center307 E. University Blvd.
P.O. Box 27185Tucson, AZ 85726
American Indian and Alaska Native Mental Health Research Copyright: Centers for American Indian and Alaska Native Health
Colorado School of Public Health/University of Colorado Anschutz Medical Campus (www.ucdenver.edu/caianh)

TUCSON MENTAL HEALTH NEEDS 59
References
American Indian Health Care Association (1989). Assessment of the health careneeds of the urban Indian population in the state of Arizona. (Senate Report100-165 and Conference Report 100-498 of Fiscal Year 1988). Washington,DC: Superintendent of Documents, U.S. Government Printing Office.
Attneave, C. L. (1969). Therapy in tribal settings and urban network intervention.Family Process, 8, 192-210.
Barter, E. R., & Barter, J. T. (1974). Urban Indians and mental health problems.Psychiatric Annals, 4, 37-43.
Baylor, B. (1972). Yes is better than no. New York: Avon Books.
Borunda, P., & Shore, J. H. (1980). Neglected minority-urban Indians and mentalhealth. International Journal of Social Psychology, 24, 220-224.
Bryde, J. F. (1971). Indian students and guidance. Guidance Monograph Series,Series IV: Minority Groups and Guidance. Boston: Houghton Mifflin Company.
DeLeon, P. H. (1977). Psychology and the Carter administration. AmericanPsychologist, 32, 750-751.
Dinges, N., Trimble, J., Manson, S., & Pasquale, F. (1981). The social ecology ofcounseling and psychotherapy with American Indians and Alaska Natives.In A. Marsella & P. Pederson (Eds.), Cross-cultural counseling andpsychotherapy (pp. 243-276). New York: Pergamon Press.
Dohrenwend, B. P., & Dohrenwend, B. S. (1969). Social status and psychologicaldisorders: A causal inquiry. New York: Wiley.
Dukepoo, P. C. (1980). The elder American Indian. San Diego, CA: Campanile.
Evaneshko, V. (1984). Demographics of Native Americans in the TraditionalIndian Alliance catchment area. Unpublished master’s thesis, College ofNursing, University of Arizona, Tucson.
Hollingshead, A. B., & Redlich, F. C. (1958). Social class and mental disorder.New York: Wiley & Sons.
Joe, J., & Miller, D. L. (1989). Barriers and survival: A study of an urban Indianhealth center. American Indian Culture and Research Journal, 13(3&4),233-256.
Joe, J., Miller, D., & Narum, T. (1988). Traditional Indian Alliance: Delivery ofhealth care services to American Indians in Tucson. Tucson: Native AmericanResearch and Training Center, University of Arizona.
Kahn, M. W. (1982). Cultural clash and psychopathology in three aboriginalcultures. Academic Psychology Bulletin, 4, 553-561.
Lake, R. G. (1982). A discussion of Native American health problems, needs,and services, with a focus on northwestern California. White Cloud Journal,2(4), 23-31.
American Indian and Alaska Native Mental Health Research Copyright: Centers for American Indian and Alaska Native Health
Colorado School of Public Health/University of Colorado Anschutz Medical Campus (www.ucdenver.edu/caianh)

60 VOLUME 8, NUMBER 3
LaFromboise, T. D. (1988). American Indian mental health policy. AmericanPsychologist, 43(5), 388-397.
Liberman, D., & Frank, J. (1980). Individuals’ perceptions of stressful life events:A comparison of Native American, rural, and urban samples using the socialreadjustment rating scale. White Cloud Journal, 1(4), 15-19.
Manson, S. M., Walker, R. D., & Kivlahan, D. R. (1987). Psychiatric assessmentand treatment of American Indians and Alaska Natives. Hospital andCommunity Psychiatry, 38(2), 165-173.
Miller, D. L., & De Jong, D. H. (1990). Native Americans in Tucson: Our home-your city. Tucson: Metropolitan Tucson Commission on Urban Naive AmericanAffairs.
National Institute of Mental Health. (1985). Measuring social functioning inmental health studies: Concepts and instruments (Series DN No. 5, by Kane,R. A., Kane, R. L., & Arnold, S., DHHS Pub. No. [ADM]85-1384). Washington,DC: Superintendent of Documents, U.S. Government Printing Office.
O’Nell, T. D. (1989). Psychiatric investigations among American Indians andAlaska Natives: A critical review. Culture, Medicine, and Psychiatry, 13, 51-87.
Red Horse, J. G., Lewis, R. L., Feit, M., & Decker, J. (1978). Family behavior ofurban American Indians. Social Casework, 59, 67-72.
Rhoades, E. R., Marshall, M., Attneave, C., Echohawk, M., Bjork, J., & Beiser, M.(1980). Impact of mental disorders upon elderly American Indians as reflectedin visits to ambulatory care facilities. Journal of the American GeriatricsSociety, 28(1), 33-39.
Scott, N., Soule, S., Bill, D., Friendman, J., Collier, B., Walluk, S., Wiscinckas, E.,& Graf, M. (1982). Community mental health in bush Alaska: A joint report.Coping, Winter, 20-27.
Shannon, G. W., & Bashshur, R. L. (1982). Accessibility to medical care amongurban American Indians in a large metropolitan area. Social Science Medicine,16, 571-575.
Shore, J. H., & Manson, S. M. (1981). Cross-cultural studies of depression amongAmerican Indians and Alaska Natives. White Cloud Journal, 2(2), 5-12.
Spaulding, J. M., & Balch, P. (1985). Perceptions of mental disorder of YaquiIndians in Arizona: An initial investigation. White Cloud Journal, 3(4), 19-26.
Srole, L, Langer, T. S., Michael, S. T., Kirkpatrick, P., Opler, M. K., & Rennie, T. A.C. (1962). Mental health in the metropolis: The midtown Manhattan study.New York: McGraw-Hill Book Company.
Sue, S. (1977). Community mental health services to minority groups: Someoptimism, some pessimism. American Psychologist, 32, 616-624.
American Indian and Alaska Native Mental Health Research Copyright: Centers for American Indian and Alaska Native Health
Colorado School of Public Health/University of Colorado Anschutz Medical Campus (www.ucdenver.edu/caianh)
TUCSON MENTAL HEALTH NEEDS 61
Trimble, J. E., Manson, S. M., Dinges, N. G., & Medicine, B. (1984). AmericanIndian concepts of mental health: Reflections and directions. In P. Pedersen,N. Sartorious, & A. Marsella (Eds.), Mental health services: The cross-culturalcontext (pp. 119-220). Beverly Hills, CA: Sage.
U.S. Senate Select Committee on Indian Affairs. (1985). Indian juvenile alcoholismand eligibility for BIA schools (Senate Hearing 99-286). Washington, DC:U.S. Government Printing Office.
Authors Note
The author is grateful to Margarita Kay, Ph.D., RN for her commentsand suggestions.
Footnote
1Traditional Indian Alliance wishes to acknowledge the support andassistance with this study, of the University of Arizona’s Native AmericanResearch and Training Center. There was an organizational name change in1993 from Traditional Indian Alliance to Inter-Tribal Health Care Center,Inc.
American Indian and Alaska Native Mental Health Research Copyright: Centers for American Indian and Alaska Native Health
Colorado School of Public Health/University of Colorado Anschutz Medical Campus (www.ucdenver.edu/caianh)


