Embed Size (px)
Citation preview
AIX-MARSEILLE UNIVERSITE
ECOLE DOCTORALE : Sciences de la Vie et de la Santé
Unité de recherche : MEPHI-E3-Immunobiologie des relations hôtes-pathogène
Thèse présentée pour obtenir le grade universitaire de docteur
Discipline : Biologie-Santé
Spécialité : Maladies infectieuses
Aurélie DAUMAS
Exploration de la réponse de l'hôte
au travers de différentes approches globales
Soutenue le 16 Décembre 2019 devant le jury :
Professeur Florence PINET Rapporteur
Professeur Alain CARIOU Rapporteur
Professeur Patrick VILLANI Examinateur
Professeur Karim ASEHNOUNE Examinateur
Professeur Brigitte GRANEL Présidente
Professeur Jean-Louis MEGE Directeur
2
Résumé
Introduction : Le sepsis constitue une des principales causes de mortalité tant en médecine
ambulatoire qu’en milieu hospitalier notamment dans la population gériatrique. Un diagnostic précoce ainsi que l’identification de la gravité du tableau sont les 2 principaux éléments
nécessaires pour une prise en charge rapide, optimale, synonyme d’amélioration du pronostic. La réalité clinique est qu’il est souvent difficile d’affirmer le caractère infectieux de la réaction inflammatoire systémique observée et que malgré l’amélioration des techniques
microbiologiques, jusqu’à 40% des infections ne sont pas documentées.
Patients et méthodes : Nous avons utilisé la spectrométrie de masse MALDI-TOF, outil de
routine pour l’identification des micro-organismes pour identifier un profil de réponse
spécifique des PBMCs à une agression infectieuse. Cette approche pourrait ainsi apporter une
aide au clinicien pour orienter la prise en charge du patient avant même l’identification
microbiologique. Nous nous sommes également intéressés à la formation in vitro de
granulomes, structures organisées de la réponse immunitaire, comme moyen d’exploration de l’immunodépression du patient en sepsis sévère et de la personne âgée infectée, à risque d’infections nosocomiales.
Résultats : Nous avons identifié des signatures spécifiques chez les cellules mononucléées
stimulées in vitro par des agonistes M1, des cytokines M2 ou différentes bactéries. La
comparaison de spectres de patients en sepsis sévère avec ou sans documentation
microbiologique avec les spectres des PBMCs stimulés in vitro a ensuite mis en évidence chez
tous les patients une signature spectrale de type Interleukine IL-10 et Interféron IFN- ainsi
qu’une signature spectrale oligodésoxynucléotides CPG (CpG ODN) suggérant une étiologie
bactérienne. L’évaluation in vitro de la formation de granulomes a permis de mettre en évidence
un défaut de formation de granulomes chez les patients septiques quel que soient leur âge. Pour
expliquer ce défaut, les patients en sepsis sévère ne formant pas de granulome présentaient des
numérations de monocytes et de lymphocytes diminuées. Chez la personne âgée, une
dénutrition était retrouvée chez les patients ne formant pas de granulome. Un déficit en TNF
sans augmentation de l’IL-10 associé à un défaut de différenciation des macrophages en cellules
épithélioides et en cellules géantes multinucléées sont retrouvés en cas de défaut de formation
de granulomes.
Discussion
La spectrométrie de masse MALDI-TOF par son approche de caractérisation cellulaire par
« profiling » à partir de l’analyse directe des cellules entières présente de nombreux avantages car elle requiert très peu de préparation des échantillons cellulaires et aucune extraction ou
séparation préalable des biomolécules. Elle est extrêmement sensible et reproductible. Malgré
les limites de nos travaux, la spectrométrie de masse pourrait permettre de distinguer un SIRS
en lien avec une pathologie inflammatoire ou infectieuse ou encore d’aider le clinicien dans un contexte de SIRS non infectieux à dépister l’apparition d’une complication infectieuse avant même la clinique et l’identification d’un micro-organisme sur des prélèvements. La mesure de
la formation in vitro de granulomes pourrait quant à elle permettre d’évaluer le degré
d’immunosuppression et servir à monitorer la réponse immune en réponse à un traitement.
D’autres études sont nécessaires pour comprendre les différents mécanismes impliqués dans le défaut de formation des cellules géantes multinucléées.
Conclusion : La réponse de l’hôte à l’infection est complexe. Son exploration nécessite des approches combinées afin de permettre une personnalisation des thérapeutiques dans le cadre
du suivi des patients.

3
Summary
Introduction: Sepsis is a major cause of mortality in both outpatient medicine and hospitals,
especially in the geriatric population. Early diagnosis and identification of the severity of the
picture are crucial to ensuring swift and optimal management, which is synonymous with a
better prognosis. However, the clinical reality is that it is often hard to confirm the infectious
nature of the systemic inflammatory response syndrome observed and that, despite advances in
microbiological techniques, up to 40% of infections are not documented.
Patients and methods: We used MALDI-TOF mass spectrometry, a routine method for the
identification of microorganisms, to identify a specific response profile of PBMCs to infectious
aggression. This approach could be used to help clinicians determine patient treatment even
before microbiological identification. We also investigated the in vitro formation of
granulomas–organized structures formed as an immune response–to explore
immunodepression in patients with severe sepsis and infected elderly subjects susceptible to
nosocomial infections.
Results: We identified specific signatures in monocytes stimulated in vitro by M1 agonists, M2
cytokines or various bacteria. The comparison of the spectra of patients with severe sepsis (with
or without microbiological evaluation) with the spectra of PBMCs stimulated in vitro
highlighted an Interleukin IL-10 and Interferon IFN- -type spectral signature in all the patients
as well as a CpG oligodeoxyribonucleotide (CpG-ODN) spectral signature, thus indicating a
bacterial etiology. The assessment of granuloma formation in vitro highlighted the absence of
granuloma formation in patients with sepsis regardless of their age. The lower monocyte and
leukocyte counts in patients with severe sepsis not forming granulomas could explain this
defect. In elderly subjects, malnutrition was observed in patients not forming granulomas. A
TNF deficiency without an increase in IL-10 associated with defective differentiation of
macrophages into epithelioid cells and multinuclear giant cells was observed in cases of
defective granuloma formation.
Discussion
The direct analysis of whole cells using MALDI-TOF mass spectrometry profiling offers
numerous advantages as it requires very little sample preparation and no prior extraction or
separation of the biomolecules. Furthermore, this technique is extremely sensitive and
reproducible. Despite the limitations of our research, mass spectrometry could help distinguish
SIRS associated with an inflammatory or infectious condition or even help the clinician in cases
of non-infectious SIRS to detect the onset of an infectious complication even before the
appearance of any clinical signs or the identification of the microorganism. The assessment of
granuloma formation in vitro could be used to determine the degree of immunosuppression and
to monitor the immune response to therapy. Further studies are necessary to understand the
different mechanisms involved in the defective formation of multinuclear giant cells.
Conclusion: The host response to infection is complex and its exploration requires the use of
combined methods to personalize therapy within the context of patient follow-up.
4
Remerciements
A Madame le Professeur Florence PINET
Vous avez été dans le jury de thèse de Richard Ouedraogo et c’est ainsi un grand honneur
que vous me faites d’avoir accepté de rapporter ce travail. Veuillez recevoir mes sincères
remerciements et mon profond respect.
A Monsieur le Professeur Alain CARIOU
Vous suivez mon parcours depuis maintenant quelques années. En tant que rapporteur de mon
dossier au CNU, j’avais été très touchée par votre bienveillance et vos conseils pour recentrer
mes activités. J’espère depuis ne pas vous décevoir et vous remercie infiniment pour votre
soutien et votre disponibilité. Je vous remercie d’avoir accepté de participer au jury de ma
thèse dont la finalisation a tardé et surtout d’être à nouveau rapporteur. Veuillez trouver ici le
témoignage de ma plus grande considération.
A Monsieur le Professeur Karim ASEHNOUNE
Vous avez accepté sans aucune hésitation de participer à ce jury. Votre travail sur la formation
des granulomes chez les patients traumatisés crâniens nous a grandement inspiré. Vous me
faites l’honneur d’apporter vos compétences à la critique de mon travail. Veuillez recevoir mes
sincères remerciements et mon profond respect
A Monsieur le Professeur Patrick VILLANI
Pour la confiance que vous m’accordez, pour votre aide et votre soutien depuis maintenant 7
ans, je vous remercie sincèrement. Vous m’avez laissé prolonger cette thèse afin de concilier
avec bonheur une activité clinique importante à laquelle je suis très attachée, un investissement
pédagogique et une implication dans les essais cliniques dans la sclérodermie. Veuillez trouver
ici le témoignage de ma reconnaissance et de mon respect le plus sincère.
A Monsieur le Professeur Jean-Louis MEGE
J’imagine que vous deviez penser que je ne l’écrirai plus cette thèse après une maternité puis
une mobilité. Je vous remercie pour votre patience, votre indulgence, votre disponibilité et
vos encouragements. Vos conseils ont été précieux et votre relecture rassurante. J’espère être
à la hauteur de votre confiance.
5
A Madame le Professeur Brigitte GRANEL
Brigitte, c’était une évidence que tu sois dans ce jury et je te remercie d’avoir accepté. J’avais
dit lors de ma thèse d’exercice que je ne comptais pas m’arrêter de travailler avec toi et bien
les années le prouvent et ma mobilité actuelle également. La recherche sur la sclérodermie à
tes côtés a participé au fait que je ne me suis pas concentrée qu’à cette thèse mais merci pour
toutes les opportunités qui m’ont été offertes dans la recherche clinique grâce à la fraction
vasculaire stromale ! Je te remercie pour ta disponibilité, ton écoute et la confiance que tu me
témoignes. De tout cela, je te suis profondément reconnaissante et redevable.
Je ne peux pas dire qu’il a été plus facile d’écrire cette thèse que les lignes qui vont suivre mais
en fait si je suis la personne que je suis aujourd’hui c’est grâce à vous....
A mes parents, des exemples pour moi, pour votre soutien réconfortant apporté en toutes
circonstances et pour votre amour. Je n’en serais pas là aujourd’hui sans vous. Merci pour
avoir « adopté » Romain et pour être un papou et une mamou extraordinaires pour Lucas. Je
vous aime.
A ma sœur que j’aime très fort. J’espère que tu es fière de moi comme je le suis de toi. Je suis
une tatie comblée avec Léo et Emma. Fabien merci de prendre soin d’eux.
A Romain sans qui je n’en serai pas là aujourd’hui. Je te remercie de m’aimer autant et de
comprendre l’importance de mon travail. Tu m’as permis d’avoir le plus grand bonheur de ma
vie, Lucas et grâce à toi je peux concilier vie de famille et vie professionnelle. Sans toi à mes
côtés, je n’aurai pu gérer ma mobilité et cette thèse. Je vais pouvoir abandonner mon
ordinateur plus souvent à la maison maintenant. Je te dois tant…JTM
A mon loulou et au bonheur que tu nous apportes au quotidien, tu as changé notre vie et nous
t’aimons si fort.
A ma grand-mère, tu as contribué à faire de moi la personne et le médecin que je suis devenue.
J’espère que tu seras toujours là pour veiller sur nous et pour me faire signe de là-haut si je
fais fausse route.
A mon grand-père, tu as toujours été là pour moi avec grand-mère, votre maison était mon
refuge. Je n’oublierai jamais tout ce que vous avez fait pour moi et tu ne peux pas savoir comme
je suis heureuse de te voir si fier avec Lucas.
A mes grands-parents partis trop tôt pour tous les souvenirs qu’on se remémore en famille.
A ma belle-maman pour votre fils et pour Lucas qui a de la chance d’avoir une Nanny aussi
top. Merci pour votre aide et le soutien que vous apportez à Romain quand je ne suis pas là,
sans jugement.
Au reste de la famille, aux souvenirs et à votre soutien.
6
A Sandie, Olivia et Elodie, le temps passe si vite... Merci pour notre amitié et pour vos
encouragements dans ce parcours pas si reposant. J’ai déteint sur toi ma Sandie pour cette
thèse, il fallait la passer !!
A tous nos amis que je n’énumèrerai pas de peur d’en oublier un ! pour tous les bons moments
que l’on passe ensemble et pour votre présence dès que l’on a besoin. A ma laeti pour être
présente le jour J, merci.
A tous ceux qui m’ont aidé pour réaliser cette thèse notamment à Christian Capo pour vos
conseils et le temps que vous avez passé à m’aider pour la rédaction des articles, Julien Textoris
parti trop tôt du laboratoire, Richard pour m’avoir tout appris sur le MALDI, Catherine,
Céline, Amira pour votre aide pour les granulomes, Julie pour cette année en commun au
laboratoire à compter nos granulomes, Delphine et Mignane pour m’avoir permis d’aborder
d’autres aspects de la recherche menée au laboratoire.
Merci à mes collègues dans le service qui m’ont permis de pouvoir me libérer pour mener à
bien les expérimentations nécessaires à cette thèse.
Merci aux patients qui motivent notre recherche chaque jour et sans qui la recherche ne
pourrait parfois pas avancer.
« Dans la vie, rien n'est à craindre, tout est à comprendre. »
Marie Curie (1867 - 1934)
7
Table des matières
Avant-propos p9
Introduction p16
1. Les réponses immunitaires p16
2. Les biomarqueurs à visée diagnostique dans le sepsis p21
3. La spectrométrie de masse MALDI-TOF p25
4. Le granulome inflammatoire p30
Exposé des travaux p35
Article 1 p36
Analysis and Characterization of Immune Cells and Their Activation Status by Whole-Cell
MALDI-TOF Mass Spectrometry.
Article 2 p49
Whole-cell MALDI-TOF mass spectrometry: a tool for immune cell analysis and
characterization. 2013
Analysis and Characterization of Immune Cells and Their Activation Status by Whole-Cell
MALDI-TOF Mass Spectrometry. 2019
Article 3 p63
Whole-cell MALDI-TOF mass spectrometry is an accurate and rapid method to analyze
different modes of macrophage activation.
Article 4 p74
MALDI-TOF MS monitoring of PBMC activation status in sepsis.
Article 5 p88
Granulomatous response to Coxiella burnetii, the agent of Q fever: the lessons from gene
expression analysis.
Article 6 p100
Impaired Granuloma Formation in Sepsis: Impact of Monocytopenia.
Article 7 p118
8
Defective granuloma formation in elderly infected patients
Article 8 p150
Phenotypic diversity and emerging new tools to study macrophage activation in bacterial
infectious diseases.
Discussion et perspectives p158
Conclusion p166
Références bibliographiques p167
Annexes (posters et communications orales) p180
9
AVANT-PROPOS
Cette thèse est née d’une préoccupation de la clinicienne que je suis, à pouvoir distinguer une
réponse inflammatoire systémique d’origine infectieuse ou sepsis, d’un syndrome
inflammatoire généralisé (« SIRS » pour « Systemic Inflammatory Response Syndrome »)
d’une origine non infectieuse pour une prise en charge efficace du patient ; et de la rencontre
avec le Professeur JL. MEGE et son équipe qui utilisent différentes approches pour évaluer la
réponse de l’hôte à une infection.
Nos hypothèses de travail ont été : - tout d’abord que la spectrométrie de masse MALDI-TOF
(pour Matrix-Assisted Laser Desorption/Ionisation - Time-Of-Flight) utilisée en routine pour
l’identification des micro-organismes par analyse de leurs protéines totales pourrait avoir un
intérêt dans l’identification d’un profil de réponse des cellules de l’immunité à une agression et
ainsi apporter une aide au clinicien pour orienter la prise en charge du patient avant même
d’obtenir une éventuelle identification microbiologique; - puis, nous nous sommes intéressés à
la formation in vitro de granulomes, structures organisées de la réponse immunitaire, comme
moyen d’exploration de l’immunodépression du patient en sepsis sévère et de la personne âgée
infectée, à risque d’infections nosocomiales et de décès.
Par souci de clarté, nous rappelons que les recommandations internationales de 2012 (Surviving
Sepsis Campaign [1]) distinguaient : 1) le sepsis comme étant un état inflammatoire selon les
critères SIRS en relation avec une cause infectieuse, 2) le sepsis sévère correspondant à un
sepsis avec apparition d’une défaillance d’organe et 3) le choc septique, défini comme un sepsis
sévère avec une altération hémodynamique persistante après remplissage vasculaire. Nous
utiliserons ces termes dans ce manuscrit bien que de nouvelles définitions soient utilisées depuis
2016 [2] dans l’idée d’identifier plus précocement les états infectieux susceptibles d’évolution
défavorable en l’absence d’un traitement efficace, rapide. Le sepsis à l’heure actuelle est défini
comme « un dysfonctionnement d’organe engageant le pronostic vital, provoqué par une
réponse inappropriée de l’hôte envers une infection ». Sur le plan clinique, la dysfonction
d’organe est représentée par un score SOFA (Sequential [Sepsis-related] Organ Failure
Assessment) ≥ 2 ou augmenté d’au moins 2 points en cas de dysfonction d’organe présente
avant l’infection.
10
Le sepsis constitue une des principales causes de mortalité tant en médecine ambulatoire qu’en
milieu hospitalier notamment dans la population gériatrique. En effet, les infections sont en
constante augmentation en raison du vieillissement de la population, de la meilleure prise en
charge des pathologies qui les favorisent (diabète, cancers…) mais aussi de l’emploi croissant
de thérapies immunosuppressives. Le diagnostic précoce d’une infection ainsi que
l’identification de la gravité du tableau sont les 2 principaux éléments nécessaires pour une
prise en charge rapide, optimale, synonyme d’amélioration du pronostic [3]. L’association entre
le retard thérapeutique et la mortalité est en effet largement démontrée [4]. Cependant,
l’utilisation abusive, inadaptée de traitements anti-infectieux à large spectre n'est pas du tout
recommandée en raison de l’augmentation du risque de développement de germes résistants.
Les principales limites à une prise en charge rapide et efficace sont d’une part, la capacité à
déterminer le caractère infectieux de la réaction inflammatoire systémique observée et, d’autre
part, la possibilité d’identifier précocement l’agent pathogène responsable de la pathologie
infectieuse éventuelle. En effet, il existe une difficulté diagnostique liée à une symptomatologie
infectieuse souvent fruste et peu spécifique (asthénie, absence de fièvre, tachypnée, tachycardie,
taux de leucocytes normal…) parfois masquée par une polymédication (anti-inflammatoires,
corticoïdes, β-bloquants). De plus, il existe souvent de nombreux facteurs confondants que
constituent les comorbidités notamment chez la personne âgée : insuffisance cardiaque,
respiratoire, troubles cognitifs, etc.. qui peuvent conduire à un retard de prise en charge,
l’étiologie infectieuse n’étant pas rapidement identifiée comme cause de la symptomatologie
du patient et de la dégradation de ses fonctions vitales [5,6]. Enfin, malgré l’amélioration des
techniques microbiologiques, jusqu’à 40% des infections ne sont pas documentées [7].
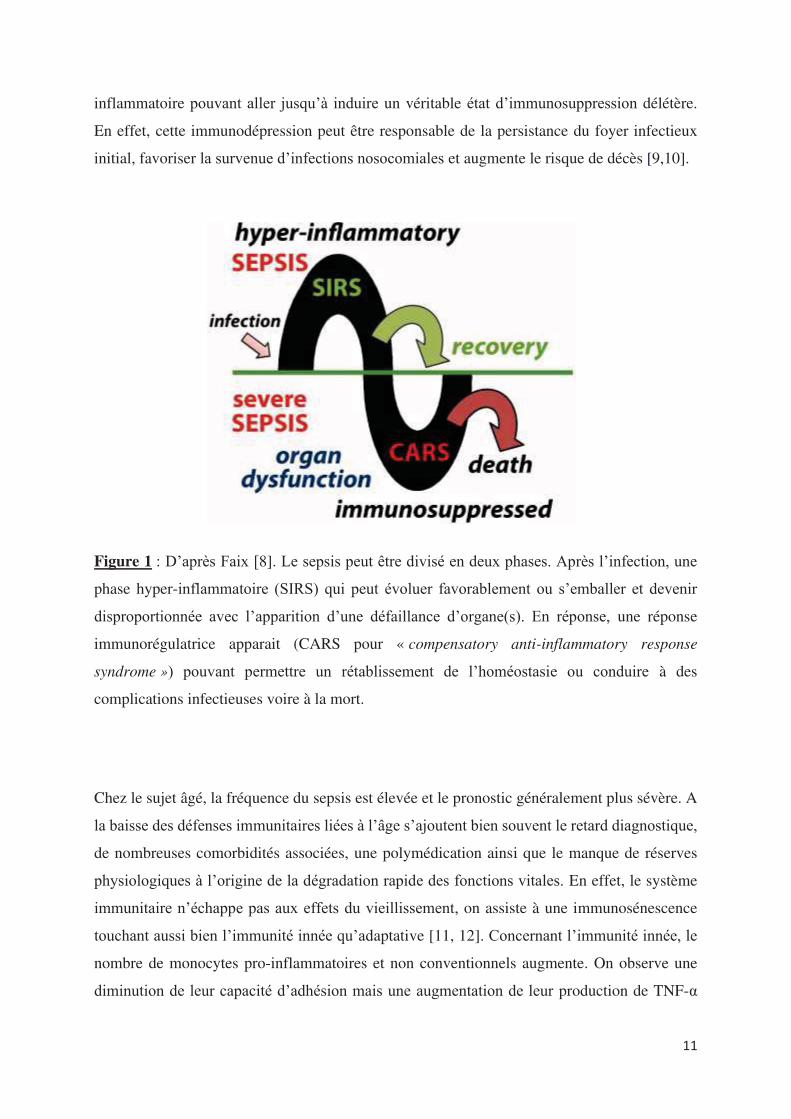
D'un point de vue physiopathologique, le sepsis est un phénomène dynamique, complexe où
l'infection déclenche une réponse systémique de l'organisme pouvant devenir inappropriée. La
réponse immunitaire met en jeu l’immunité innée et adaptative avec une importante capacité
d’échange d’informations entre les différents acteurs et une forte régulation pour préserver
l’équilibre du système immunitaire. Pour expliciter cette physiopathologie complexe,
schématiquement, la réponse immunitaire au cours du sepsis doit être considérée comme un
processus biphasique (figure 1) [8]. La mise en jeu normale des défenses de l’organisme contre
l’agent infectieux déclenche une réponse inflammatoire initiale. Toutefois, chez certains
patients, cette réponse peut devenir disproportionnée induisant une défaillance d’organe(s). En
réponse, des mécanismes immunorégulateurs se mettent en place pour contrôler la réponse
11
inflammatoire pouvant aller jusqu’à induire un véritable état d’immunosuppression délétère.
En effet, cette immunodépression peut être responsable de la persistance du foyer infectieux
initial, favoriser la survenue d’infections nosocomiales et augmente le risque de décès [9,10].
Figure 1 : D’après Faix [8]. Le sepsis peut être divisé en deux phases. Après l’infection, une
phase hyper-inflammatoire (SIRS) qui peut évoluer favorablement ou s’emballer et devenir
disproportionnée avec l’apparition d’une défaillance d’organe(s). En réponse, une réponse
immunorégulatrice apparait (CARS pour « compensatory anti-inflammatory response
syndrome ») pouvant permettre un rétablissement de l’homéostasie ou conduire à des
complications infectieuses voire à la mort.
Chez le sujet âgé, la fréquence du sepsis est élevée et le pronostic généralement plus sévère. A
la baisse des défenses immunitaires liées à l’âge s’ajoutent bien souvent le retard diagnostique,
de nombreuses comorbidités associées, une polymédication ainsi que le manque de réserves
physiologiques à l’origine de la dégradation rapide des fonctions vitales. En effet, le système
immunitaire n’échappe pas aux effets du vieillissement, on assiste à une immunosénescence
touchant aussi bien l’immunité innée qu’adaptative [11, 12]. Concernant l’immunité innée, le
nombre de monocytes pro-inflammatoires et non conventionnels augmente. On observe une
diminution de leur capacité d’adhésion mais une augmentation de leur production de TNF-α
12
[13]. Les neutrophiles sont également impactés par le vieillissement avec des capacités de
phagocytose, de chimiotactisme et de production de résidu du stress oxydatif diminuées [14].
Le vieillissement du compartiment lymphocytaire T est caractérisé principalement par : - une
diminution du nombre de lymphocytes T naïfs ; - un appauvrissement du répertoire T qui
conduit à une diminution de sa capacité à reconnaître de nouveaux antigènes ; - une
augmentation de la proportion de lymphocytes T mémoires impliqués dans le contrôle
d’infections virales persistantes et - un raccourcissement des télomères [15]. Concernant les
lymphocytes B, la production de nouveaux lymphocytes B naïfs est réduite et, par conséquent,
les cellules mémoires sont majoritaires. Cependant les lymphocytes B mémoires ont une
production d’anticorps altérés participant ainsi au déclin de la qualité de la réponse humorale
avec le vieillissement [16]. Le vieillissement s’accompagne aussi d’une production accrue de
cytokines pro-inflammatoires, on parle « inflamm-aging » dont l’origine semble
multifactorielle. Cet état est associé à la fragilité et une augmentation de la morbi-mortalité. A
l’inverse, les patients âgés présentant des taux de cytokines anti-inflammatoires élevés semblent
mieux vieillir [17].
La situation est donc complexe pour le clinicien face à un malade compte tenu du
polymorphisme possible de présentation du sepsis et encore nous n’avons pas évoqué l’impact
de la nature du micro-organisme ni du site de l’infection. Il y a donc un espoir important mis
dans la recherche de biomarqueurs, facilement et rapidement disponibles pour faire la
distinction entre un sepsis et une réaction inflammatoire systémique d’origine non infectieuse.
L’intérêt porté à la recherche de biomarqueurs pour le diagnostic du sepsis est croissant
notamment avec le développement des nouvelles technologies de biologie moléculaire [8,18].
Cependant, l’étude d’un biomarqueur nécessite de démontrer que les propriétés du biomarqueur
augmentent la capacité du médecin à prendre la bonne décision. Or pour cela, des outils basés
sur la reclassification des patients sont nécessaires. La reclassification consiste, dans un
premier temps, à classer les patients dans des catégories de diagnostic prédéfinies à l’aide d’un
modèle de prédiction clinique puis, dans un second temps, à examiner les changements de
catégories des patients induits par l’ajout du biomarqueur. A l’heure d’aujourd’hui, aucun
biomarqueur ne permet d’affirmer le diagnostic de sepsis avec certitude et compte tenu de la
complexité du sepsis, il apparait que ce diagnostic ne pourra être affirmé qu’en combinant
différents marqueurs, représentatifs de plusieurs voies fonctionnelles impliquées dans la
réponse de l’hôte à une infection ou grâce à une approche globale permettant de mettre en
évidence un profil d’expression des cellules en réponse à une infection [19].
13
Dans le but d’appréhender la réponse de l’hôte à une infection, nous nous sommes intéressés
tout d’abord à la spectrométrie de masse MALDI-TOF. Utilisée dans de nombreux laboratoires
de microbiologie, cette méthode permet l’obtention d’un spectre caractéristique ou « empreinte
spectrale » du micro-organisme à identifier, spectre qui est ensuite comparé aux empreintes
spectrales de référence d’une base de données permettant ainsi une identification précise du
micro-organisme. L’équipe du Professeur JL. MEGE a étendu en 2010 cette approche à
l’identification de cellules eucaryotes avec succès après la construction d’une banque de
spectres de référence [20].
Nous avons étudié dans un premier temps la capacité de cette méthode à différencier des profils
d’activation de macrophages stimulés par des différents agonistes ainsi que des bactéries
inactivées. Nos résultats confirment la sensibilité de la méthode permettant de distinguer
différents états d’activation des macrophages (article 1). Le protocole expérimental d’analyse
des cellules eucaryotes et d’exploration de l’activation des macrophages en spectrométrie de
masse MALDI-TOF a été publié dans Methods in Molecular Biology (article 2) ainsi que filmé
pour la revue JoVE (Journal of Visualized Experiments) (article 3). Dans l’idée d’une
utilisation en routine pour guider le clinicien pour la prise en charge des patients, l’étude des
macrophages n’est pas envisageable ni même d’un unique type cellulaire dont l’obtention
nécessite un tri, une sélection. Nous nous sommes alors demandé si les cellules mononuclées
du sang (PBMCs pour Peripheral Blood Mononuclear Cells) avaient une empreinte spectrale
reproductible et différente en réponse à différents stimuli. Les PBMCs sont en effet facilement
récupérés à partir du sang total par gradient de Ficoll. Nous avons montré que la spectrométrie
de masse MALDI-TOF pouvait permettre l’étude des PBMCs. Des signatures spécifiques ont
été obtenues suite à la stimulation in vitro des PBMCs par différents agonistes. La comparaison
de spectres de patients en sepsis sévère avec ou sans documentation microbiologique avec les
spectres des PBMCs stimulés in vitro a ensuite mis en évidence chez tous les patients une
signature spectrale de type Interleukine IL-10 et Interferon IFN- en accord avec les 2 réponses
inflammatoires et anti-inflammatoires observées dans le sepsis. Une signature spectrale
oligodésoxynucléotides CPG (CpG ODN) a également été identifiée suggérant une étiologie
bactérienne. Ces données viennent ainsi conforter le diagnostic de sepsis chez les patients sans
documentation microbiologique (article 4).
14
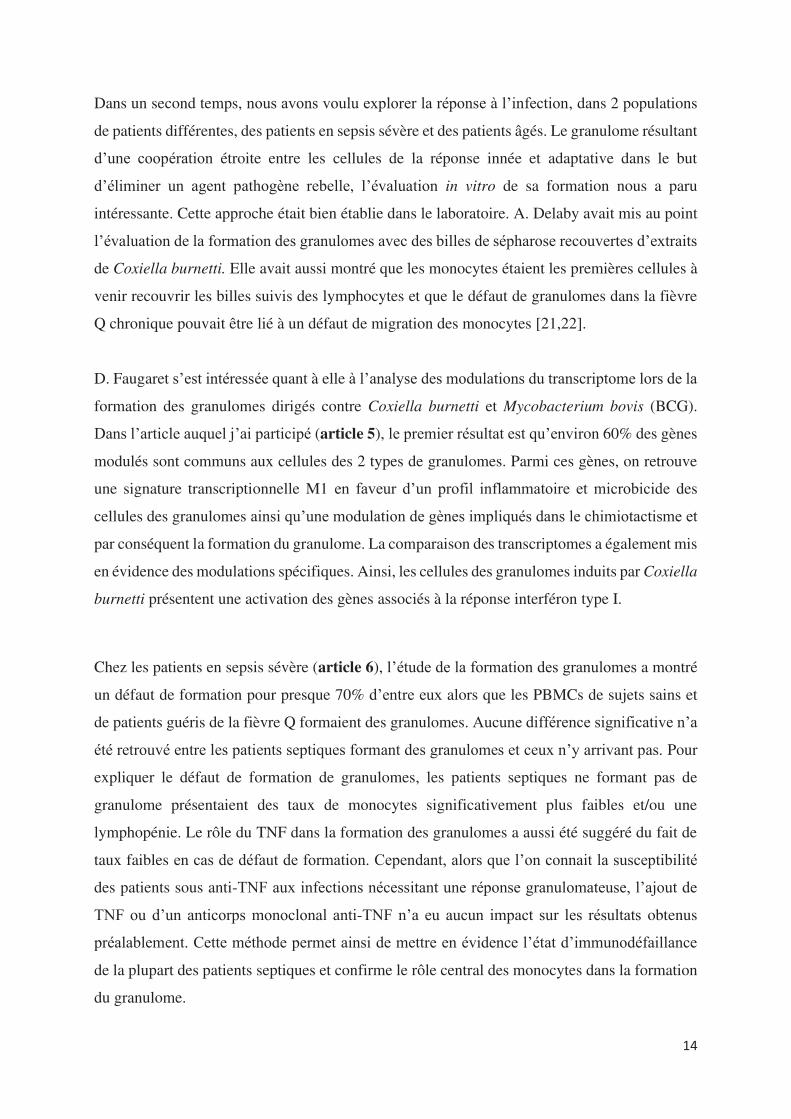
Dans un second temps, nous avons voulu explorer la réponse à l’infection, dans 2 populations
de patients différentes, des patients en sepsis sévère et des patients âgés. Le granulome résultant
d’une coopération étroite entre les cellules de la réponse innée et adaptative dans le but
d’éliminer un agent pathogène rebelle, l’évaluation in vitro de sa formation nous a paru
intéressante. Cette approche était bien établie dans le laboratoire. A. Delaby avait mis au point
l’évaluation de la formation des granulomes avec des billes de sépharose recouvertes d’extraits
de Coxiella burnetti. Elle avait aussi montré que les monocytes étaient les premières cellules à
venir recouvrir les billes suivis des lymphocytes et que le défaut de granulomes dans la fièvre
Q chronique pouvait être lié à un défaut de migration des monocytes [21,22].
D. Faugaret s’est intéressée quant à elle à l’analyse des modulations du transcriptome lors de la
formation des granulomes dirigés contre Coxiella burnetti et Mycobacterium bovis (BCG).
Dans l’article auquel j’ai participé (article 5), le premier résultat est qu’environ 60% des gènes
modulés sont communs aux cellules des 2 types de granulomes. Parmi ces gènes, on retrouve
une signature transcriptionnelle M1 en faveur d’un profil inflammatoire et microbicide des
cellules des granulomes ainsi qu’une modulation de gènes impliqués dans le chimiotactisme et
par conséquent la formation du granulome. La comparaison des transcriptomes a également mis
en évidence des modulations spécifiques. Ainsi, les cellules des granulomes induits par Coxiella
burnetti présentent une activation des gènes associés à la réponse interféron type I.
Chez les patients en sepsis sévère (article 6), l’étude de la formation des granulomes a montré
un défaut de formation pour presque 70% d’entre eux alors que les PBMCs de sujets sains et
de patients guéris de la fièvre Q formaient des granulomes. Aucune différence significative n’a
été retrouvé entre les patients septiques formant des granulomes et ceux n’y arrivant pas. Pour
expliquer le défaut de formation de granulomes, les patients septiques ne formant pas de
granulome présentaient des taux de monocytes significativement plus faibles et/ou une
lymphopénie. Le rôle du TNF dans la formation des granulomes a aussi été suggéré du fait de
taux faibles en cas de défaut de formation. Cependant, alors que l’on connait la susceptibilité
des patients sous anti-TNF aux infections nécessitant une réponse granulomateuse, l’ajout de
TNF ou d’un anticorps monoclonal anti-TNF n’a eu aucun impact sur les résultats obtenus
préalablement. Cette méthode permet ainsi de mettre en évidence l’état d’immunodéfaillance
de la plupart des patients septiques et confirme le rôle central des monocytes dans la formation
du granulome.
15
Plus récemment, nous avons étudié la capacité de sujets âgés en bonne santé et infectés à former
des granulomes en réponse à des extraits de Coxiella burnetii et de BCG (article 7). Nous avons
montré que plus de la moitié des sujets infectés étaient incapables de former des granulomes
contre seulement 8% des sujets sains que ce soit en réponse à Coxiella burnetii ou BCG. Sur le
plan clinique, une dénutrition étaient significativement retrouvée chez les patients ne formant
pas de granulome. Contrairement à l’étude chez les patients en sepsis, les sujets âgés incapables
de former des granulomes ne présentaient pas de monocytopénie et/ou de lymphopénie. Ce
défaut de formation était associé à un défaut de différenciation des macrophages en cellules
épithélioides et en cellules géantes multinucléés. En outre, la production de TNF était diminuée
sans lien avec une surexpression d’IL-10. Au niveau du transcriptome, tous les gènes décrits et
étudiés dans la formation des granulomes [article 5], à l’exception d’un gène impliqué dans la
polarisation M1 des macrophages, étaient sous-exprimés chez les patients ne formant pas de
granulome par rapport aux patients en formant. Ainsi, cette méthode semble être un excellent
outil d’évaluation de la capacité du système immunitaire dans son ensemble à répondre à une
agression. En objectivant dès J3, l’incapacité des PBMCs d’un patient à former des granulomes,
cela pourrait amener à adapter la prise en charge du patient mais reste à démontrer que le
pronostic de ces patients est différent de celui des patients qui forment et plus grave. Ce travail
est soumis à publication.
Enfin, ces différentes études s’intéressant à l’activation des cellules myéloïdes aussi bien in
vitro que in vivo au cours de maladies infectieuses, m’ont amenée à être co-auteur d’une revue
de la littérature remettant en question la distinction simpliste macrophages M1 ou M2 à travers
différents exemples (article 8). La modulation des phénotypes M1/M2 pourrait ainsi être une
stratégie thérapeutique à explorer.
16
INTRODUCTION
1. Les réponses immunitaires
Le système immunitaire de l’Homme est un système biologique vivant complexe composé
d’organes lymphoïdes, de tissus, de cellules, de facteurs humoraux et de cytokines. Sa fonction
est d’assurer le maintien de l’intégrité de l’organisme dans un équilibre dynamique. Ce rôle
essentiel est illustré au mieux par les maladies qui résultent de son dysfonctionnement : -
infections graves, tumeurs, maladies lymphoprolifératives dans les déficits immunitaires
congénitaux et acquis, notamment d'origine virale (SIDA) ; - maladies allergiques en cas de
réponse excessive ou encore - maladies auto-immunes quand l'organisme déclenche une
réaction immunitaire contre lui-même [23].
Il est habituel de distinguer, de manière un peu dogmatique, l’immunité « innée » de l’immunité
« adaptative ». À l’évidence, de plus en plus de données montrent que cette distinction ne
correspond pas à la réalité. En 1999, Charles Janeway proposait une théorie intégrative
suggérant une liaison étroite entre les deux types de réponses [24]. Il existe en effet des « ponts
» majeurs entre ces deux réponses immunes, dont on commence seulement à comprendre
l’importance aussi bien dans la physiologie du système immunitaire que dans la
physiopathologie de l’allergie ou des maladies auto-immunes [25, 26].
Schématiquement, on peut identifier deux systèmes de défense interdépendants contre les
agents pathogènes [23, 27]. Par souci de clarté, nous allons aborder l’immunité anti-infectieuse
et nous n’aborderons pas les différences qui existent en fonction de la nature du pathogène
notamment de son développement intra-cellulaire ou extracellulaire.
Pour protéger l'hôte contre les infections, la réponse immunitaire innée constitue la première
ligne de défense. Elle associe des mécanismes physiques, humoraux et cellulaires qui se
conjuguent entrainant la réponse inflammatoire. L’immunité innée est une réponse immédiate
qui survient en l’absence d’immunisation préalable, non spécifique de l'agent infectieux. Elle
fait intervenir des barrières physiques comme la peau et les muqueuses, une composante
cellulaire (polynucléaires, monocytes/macrophages, cellules dendritiques, mastocytes,
17
lymphocytes NK « natural killer ») et une composante humorale (système du complément,
cytokines, protéines de l’inflammation, peptides antimicrobiens). Récemment, un nouveau
groupe de cellules lymphoïdes innées (les ILC « helper like ») a été défini avec 3 sous-groupes
selon les cytokines produites, les ILC1, IL2 et ILC3 [28, 29]. Ses différents acteurs sont
naturellement présents et opérationnels pour défendre l’hôte contre l’agent infectieux mais ne
sont pas doués de mémoire.
Les épithéliums constituent des barrières physiques et chimiques contre les infections. Quand
ces barrières sont franchies, les tissus lésés et l’agent infectieux vont déclencher la réaction
inflammatoire via des signaux de danger avec l’activation des cellules résidentes notamment
les mastocytes, cellules dendritiques et macrophages, du système du complément et la synthèse
des protéines de l’inflammation. Ce processus va permettre le recrutement des cellules
circulantes depuis le sang vers les tissus (diapédèse). Les cellules de l’immunité innée
reconnaissent leur cible grâce à des récepteurs de reconnaissance de motifs, les PRRs pour «
Pattern Recognition Receptors », qui se lient à des motifs moléculaires conservés au cours de
l'évolution des micro-organismes les MAMPs « Microbe Associated Molecular Patterns ». Les
PRRs reconnaissent aussi des molécules libérées par les cellules endommagées ou signaux de
danger (Danger Associated Molecular Patterns ou DAMPS). Trois familles de PRRs sont
décrites : les PRR solubles et deux types de récepteurs cellulaires, les récepteurs d’endocytose
et les récepteurs de signalisation. Les PRR solubles se fixent aux micro-organismes et facilitent
leur élimination par les cellules phagocytaires. Il s’agit notamment des facteurs du complément
et des protéines de la phase aigüe de l’inflammation [30,31]. Les récepteurs d’endocytose,
membranaires, sont exprimés essentiellement par les monocytes et les macrophages. Il s’agit
notamment des scavenger receptors et des lectines de type C [32,33]. Enfin, les récepteurs de
signalisation sont impliqués dans l’activation des cellules. Ils appartiennent à la famille des
molécules TLR (Toll-like receptors), NOD (nuclear oligomerization domain) et des hélicases.
Ces molécules sont soit d’expression membranaire, à la surface des cellules (TLR1, 2, 4, 6) ou
dans les endosomes/lysosomes (TLR3, 7, 8, 9), soit d’expression cytosolique (NOD, hélicases)
[34-36].
Les PRRs reconnaissent des motifs différents selon leur type. Par exemple, le
lipopolysaccharide (LPS), composant majeur des parois des bactéries Gram négatif, se lie au
TLR4. En ce qui concerne TLR2, il reconnait entre autres le peptidoglycane et l’acide
lipoteïchoïque des bactéries Gram positif, le lipo-arabinomanne des mycobactéries mais aussi
la molécule OmpA de la paroi des bactéries à Gram négatif. TLR1/TLR2 détecte les
lipopeptides tricylés et TRL6/TRL2 les lipopeptides diacylés. Les ADN bactériens sont
18
caractérisés par des motifs hypométhylés (motifs CpG) reconnus par TLR9. Les molécules
TLR7 et TLR8 reconnaissent les ARN simple brin viraux. TLR3 reconnaît quant à lui les ARN
double brins viraux, ainsi que l’homologue structural synthétique (poly[I:C]) [37,38].
L’engagement des PRRs amplifie la réponse inflammatoire, stimule la destruction de l’agent
infectieux mais aussi régule le recrutement des cellules et l'apoptose. La phagocytose est le
mécanisme majeur de destruction des pathogènes [39]. Elle est facilitée par leur opsonisation.
En plus de la phagocytose, les polynucléaires neutrophiles possèdent de nombreuses fonctions
microbicides et cytotoxiques : la dégranulation d'enzymes protéolytiques, la production de
formes réactives de l'oxygène et la libération de Neutrophil Extracellular Traps. Les
monocytes/macrophages vont également produire de grandes quantités de cytokines pro ou
anti-inflammatoires selon l’environnement et des chimiokines. L’activation des cellules
lymphoïdes innées induit la production de peptides antimicrobiens, de cytokines comme
l’interferon gamma (IFN- ) et potentialise leurs activités cytotoxiques [40]. Les cibles des
cytokines de l'immunité innée sont les cellules de l'immunité innée elles-mêmes (régulation de
la réponse), mais aussi des organes comme le foie (synthèse de protéines comme la CRP),
l'hypothalamus (induction de la fièvre) ou les cellules endothéliales pour faciliter le recrutement
des cellules au niveau de la zone infectée.
En plus de son action microbicide, la réponse innée va déclencher la réponse adaptative et les
processus de réparation tissulaire/cicatrisation. La réponse adaptative est spécifique de
l’antigène, limitée dans le temps à l'éradication de l'agent infectieux dont elle garde par contre
la mémoire. Les cellules dendritiques se situent à l’interface entre immunité innée et immunité
adaptative [41]. Elles sont les principales cellules présentatrices d’antigène capables d’activer
les lymphocytes T naïfs. Dans les tissus, les cellules dendritiques sont sous forme immature et
jouent un rôle de sentinelles spécialisées dans la capture d’antigènes. Les cellules dendritiques
ayant capturé des antigènes deviennent matures et migrent vers les ganglions périphériques,
pour les présenter aux lymphocytes T naïfs. L'activation complète conduisant à l'expansion
clonale des lymphocytes T nécessite une interaction prolongée entre le lymphocyte T et la
cellule dendritique. Cette interaction lymphocyte T- cellule dendritique fait intervenir la
reconnaissance du peptide par le récepteur T (TCR) associé au complexe CD3, les molécules
du CMH de classe II, des molécules de costimulation et d'adhésion. Les cellules dendritiques
interviennent aussi en orientant la polarisation fonctionnelle des lymphocytes T afin d’induire
vers la réponse la plus adaptée à l'agression. Le signal de différentiation dépend majoritairement
des cytokines présentes dans le micro-environnement (IL-12 et IFN-γ pour les Th1, IL-4 pour
19
les Th2, Transforming growth factor TGF-β et diverses cytokines pro-inflammatoires telles que
l'IL-6 pour les Th17 ou encore TGF-β et IL-2 pour les T régulateurs induits (iTreg)). La liaison
des cytokines à leurs récepteurs induit également l'activation des protéines de la famille STAT
(Signaling Transducer and Activator of Transcription). Ces protéines induisent une
augmentation de l'expression des facteurs de transcription de différents gènes, y compris ceux
des cytokines elles-mêmes, ayant comme conséquence la production des « signatures »
cytokiniques. Chaque type fonctionnel de lymphocyte T possède ainsi un facteur de
transcription majeur et spécifique qui, dans une action conjointe et complexe avec des protéines
STAT spécifiques, inhibe le développement des autres profils et polarise la cellule [42]. Les
lymphocytes T CD4+ de type Th1 produisent majoritairement de l’IFN-γ, du Tumor necrosis
factor TNF-α et de l’IL-2 et ainsi sont de puissants inducteurs de la réponse à médiation
cellulaire, notamment avec l’activation des macrophages et des lymphocytes T CD8+. Les
lymphocytes T CD4+ de type Th2 produisent de l’IL-4, de l’IL-5, de l’IL-10 et de l’IL-13. Ils
induisent la production d'IgE et stimulent l'action des éosinophiles, favorisant l'élimination des
parasites extra-cellulaires. Les cellules Th17 produisent de l'IL-17, de l'IL-22. Ces cellules sont
importantes pour le contrôle des infections bactériennes extra-cellulaires et fongiques. Les
iTreg quant à eux régulent l'intensité et la durée des réponses immunitaires [43]. Les
lymphocytes T CD8 + naïfs doivent être activés pour se différencier en lymphocytes T CD8 +
cytotoxiques capables de détruire les cellules qui hébergent un hôte intra-cellulaire. Cette
activation dépend de signaux reçus en provenance des cellules dendritiques et des lymphocytes
T CD4 + Th1 [44]. Le principal mécanisme de lyse des lymphocytes T CD8 + cytotoxiques est
la dégranulation avec relargage de granzyme et de perforine. L'activation des lymphocytes B
s'effectue quant à elle par reconnaissance de l’antigène par un récepteur membranaire spécifique
appelé BCR et des signaux de co-stimulation solubles et membranaires apportés par les
lymphocytes T folliculaires. Les lymphocytes B activés prolifèrent ensuite et se différencient
en plasmocytes sécréteurs d'immunoglobulines. Les anticorps ont ensuite plusieurs fonctions à
savoir neutraliser des toxines bactériennes, opsoniser une bactérie ou un virus et ainsi favoriser
la phagocytose, inhiber l’adhérence bactérienne ou encore activer le système du complément et
entrainer la lyse des cellules infectées.
Après élimination de l'agent infectieux, la réponse inflammatoire s'autolimite afin de réduire
les dommages tissulaires. Ceci implique la suppression des gradients de molécules
chimioattractantes et la production de médiateurs antiinflammatoires. Les macrophages jouent
un rôle majeur dans le retour à l'homéostasie par l'élimination des débris cellulaires.
20
L'efférocytose va entraîner un changement de polarisation des macrophages qui vont passer
d'un phénotype pro-inflammatoire (M1) à un phénotype anti-inflammatoire (M2) [45]. Les
polynucléaires neutrophiles participent également à la résolution de l'inflammation avec la
production de médiateurs anti-inflammatoires. Les cellules de l'immunité innée ne sont donc
pas uniquement des cellules tueuses mais jouent également un rôle dans la régulation des
réponses immunitaires et le remodelage tissulaire.
Toute primo-infection va induire une mémoire immunitaire. Lors d'un premier contact
antigénique, l'organisme développe une réponse primaire mais aussi des cellules mémoires qui
seront capables d’agir plus rapidement et plus efficacement lors d’un nouveau contact avec
l’antigène correspondant. Une fois l’infection maitrisée, différents mécanismes interviennent
pour éliminer la majorité des cellules T effectrices « contraction clonale » tout en permettant la
constitution d'un pool hétérogène de cellules T mémoires [46]. L'activation des cellules B
naïves spécifiques de l'antigène aboutit également à la production de cellules B mémoires [44].
Les cellules B mémoires, permettent en cas de nouveau contact avec l'antigène une
différentiation très rapide en plasmocytes et la production d'une grande quantité d'anticorps de
forte affinité. Le principe des vaccins repose sur cette mémoire.
En conclusion, comme le décrit le Professeur J. SIBILIA : « Le système immunitaire est un
véritable orchestre et ses réponses de véritables symphonies. Les "chefs d’orchestre" sont ceux
qui mettent en musique en donnant une note personnelle à ce système. Ces sont les organes
lymphoïdes centraux dans lesquels s’effectue l’éducation élémentaire des cellules de
l’immunité (lymphocytes T et B) et les organes lymphoïdes secondaires dans lesquels
s’effectueront les "cours de rattrapage". Les "musiciens" sont les cellules de l’immunité innée
et adaptative. Seules les cellules de l’immunité adaptative ont besoin d’une éducation, alors
que celles de l’immunité innée ont leurs fonctions préprogrammées. Enfin, les "instruments"
sont toutes les substances produites qui permettent la communication entre les cellules. »
21
2. Les biomarqueurs pour aider au diagnostic du sepsis
La reconnaissance précoce d’un sepsis est nécessaire pour une prise en charge rapide avec la
mise en œuvre d’un traitement anti-infectieux dont le pronostic dépend fortement [4]. Toutefois
le diagnostic peut s’avérer difficile dans l’attente ou en l’absence de documentation
microbiologique, en raison de signes cliniques et/ou biologiques souvent non spécifiques
retrouvés aussi bien dans les pathologies infectieuses que inflammatoires non infectieuses.
L’exemple le plus évident est la fièvre qui n’est absolument pas synonyme d’infection et que
l’on peut observer dans différentes situations cliniques non infectieuses allant du cancer à
l’hyperthyroïdie en passant par les maladies inflammatoires et auto-immunes. Pourtant
l’urgence devant un patient fébrile, c’est de poser le diagnostic d’infection qui justifie d’un
traitement sans délai. D’autres situations sont également quotidiennes : les tableaux d’altération
de l’état général sans point d’appel chez des patients âgés ou encore la dyspnée aiguë chez un
patient insuffisant respiratoire chronique. La certitude du diagnostic repose souvent sur
l’identification du micro-organisme mais en dehors de la positivité de l’examen direct d’un
liquide biologique (liquide céphalo-rachidien, liquide d’ascite, liquide pleural, liquide
articulaire), cette confirmation ne peut pas être attendue pour décider de débuter un traitement
tout en sachant qu’une documentation microbiologique n’est pas systématique en plus. Cette
difficulté à identifier les patients septiques conduit à l’évidence à la sur prescription
d’antibiotiques notamment. Ainsi, il existe une demande importante des cliniciens pour des
biomarqueurs pour les aider à distinguer les patients nécessitant un traitement anti-infectieux,
c’est-à-dire permettant la distinction entre SIRS et sepsis.
Les biomarqueurs connaissent actuellement un développement sans précédent. Plus de 5000
articles sur biomarqueurs et sepsis ont été publiés ces 10 dernières années [18]. Cependant,
aucun ne permet de diagnostiquer aujourd’hui un sepsis avec certitude. Ainsi dans les dernières
recommandations de la Surviving Sepsis Campaign, il est rappelé que la décision de débuter,
modifier ou arrêter un traitement anti-infectieux ne doit jamais être uniquement basé sur un
biomarqueur même la procalcitonine (PCT) [47].
La protéine C réactive (CRP) est sans doute le biomarqueur le mieux connu et le plus utilisé au
quotidien mais il s’agit d’un biomarqueur d’inflammation, pas d’infection. Synthétisée par les
hépatocytes, en réponse à une stimulation par des cytokines, son taux augmente dans les six
heures suivant le début du processus inflammatoire pour atteindre un pic entre 24 et 48 heures.
22
Que l’on regarde la valeur absolue de CRP ou la cinétique d’évolution des taux, les capacités
de la CRP à distinguer un sepsis d’un SIRS non infectieux sont très faibles [48,49].
La procalcitonine est le biomarqueur le plus étudié à l’heure d’aujourd’hui. Prohormone de la
calcitonine, lors d’un stimulus inflammatoire, la protéolyse de la PCT en calcitonine ne se
produit pas, et la PCT intacte est libérée dans la circulation sanguine. La concentration
plasmatique de PCT augmente rapidement dès la troisième heure, avec un pic à 24 heures.
Initialement considérée comme spécifique des infections, la PCT augmente en fait dans de
nombreuses autres situations cliniques (polytraumatisme, brûlures, cancers, etc…). Il existe
aussi des faux négatifs (pneumopathies à germes atypiques, tuberculose, etc..). Toutefois, une
récente méta-analyse [50] a montré une sensibilité de 0,77 (IC 95% 0,72-0,81) et une spécificité
de 0,79 (IC 95% 0,74-0,84) de la PCT pour distinguer un sepsis d’un SIRS d’origine non
infectieuse faisant de ce biomarqueur le meilleur par rapport à la CRP [51], le
lipopolysaccharide-binding protein (LBP) [52], l’IL-6 [52], le soluble triggering receptor
expressed on myeloid cells-1 (sTREM-1) [53] et le soluble urokinase plasminogen activator
receptor (suPAR) [54]. Mais qui dit meilleur ne dit pas idéal. En plus des biomarqueurs
précédemment cités, de nombreux autres ont été proposés pour tenter d’améliorer le diagnostic
du sepsis. Force est de constater qu’aucun n’est idéal et qu’il est peu probable qu’un seul
biomarqueur puisse diagnostiquer toutes les formes de sepsis. Il n’y a pas une réponse à
l’infection mais plutôt une réponse à chaque infection. L’enjeu est donc probablement de
trouver les points communs entre la plupart de ces réponses.
Des approches combinant plusieurs biomarqueurs ont ainsi été testées. A titre d’exemple, le «
bioscore » développé pour le diagnostic des infections en réanimation, est une combinaison de
3 biomarqueurs : la PCT, le sTREM-1 et l’expression de CD64 sur les neutrophiles, marqueur
d’activation leucocytaire au cours de la réponse immunitaire innée. Avec une aire sous la courbe
ROC (AUC) à 0,95, supérieure à celle de chaque biomarqueur pris individuellement,
l’utilisation de ce « bioscore » à l’admission en réanimation puis à 24 heures permet d’identifier
correctement les patients septiques dans la plupart des cas [55]. De même, le panel de six
biomarqueurs (suPAR, sTREM-1, MIF [macrophage migration inhibitory factor], CRP, PCT et
leucocytes) possède une capacité supérieure en comparaison de chaque marqueur évalué
isolément, pour distinguer SIRS/sepsis chez des patients aux urgences ou hospitalisés en
maladies infectieuses [56]. Cependant, ces marqueurs restent pour la plupart du domaine de la
recherche.
23
Jusqu’à récemment, les biomarqueurs étudiés étaient tous issus de l’étude des voies
fonctionnelles impliquées dans le sepsis. Avec l’avènement des techniques « omiques », une
analyse globale sans a priori à l’échelle du transcriptome, du protéome ou encore du
métabolome est maintenant possible permettant d’appréhender autrement la réponse de l’hôte.
On est ainsi passé d’une approche « réductionniste » se focalisant sur les cellules et molécules
individuellement à une approche « systémique » permettant de rendre compte de la manière
dont les éléments interagissent entre eux et d’explorer la variabilité des réponses intra et inter-
individuelles pour une même agression. Ainsi si on reprend la comparaison du Professeur J.
SIBILIA, si on écoute séparément les instruments d’un orchestre, on réalise rapidement qu’il
nous est impossible d’apprécier la symphonie.
L’intérêt du transcriptome est maintenant bien connu. Contrairement à l’ADN, dont la séquence
est presque identique entre les cellules d’un même organisme, le contenu en ARN est hautement
variable selon la cellule ou le tissu étudié(e) et le contexte physiopathologique. On compare
souvent le transcriptome à une photographie à un instant précis de l’expression du génome.
Grâce aux puces transcriptomiques, il est maintenant possible de savoir, à l’échelle du génome,
dans un compartiment cellulaire donné, quels gènes sont actifs, et dans quelle proportion ils
sont transcrits. Plusieurs études ont montré que l’analyse transcriptomique permettait d’obtenir
une réponse spécifique des patients septiques par rapport aux patients inflammatoires. Ainsi à
titre d’exemple, en comparant les profils transcriptomiques des leucocytes de patients atteints
de pneumopathie à ceux de patients admis en réanimation avec une présentation clinique
semblable mais sans infection, Scicluna et al. [57] ont retrouvé une signature de 78 gènes
spécifiques du diagnostic de pneumopathie et ont identifié le ratio d’expression génique
FAIM3/PLAC8 comme biomarqueur avec une AUC à 0,845, une valeur prédictive positive
(VPP, probabilité d'avoir une pneumopathie en cas de ratio faible) de 83% et une valeur
prédictive négative (VPN, probabilité que le diagnostic de pneumopathie soit faux si le ratio est
élevé) de 81%. De même, Miller et al. [58] ont mis au point un test SeptiCyteTM LAB qui
mesure simultanément le niveau d’expression des gènes CAECAM4, LAMP1, PLA2G7 et
PLAC8 permettant de distinguer les patients admis en réanimation pour un sepsis des patients
admis pour un syndrome de réponse inflammatoire systémique d’origine non infectieuse avec
une AUC à 0,82, une VPP de 69% et une VPN de 91%. Ce test est autorisé par la FDA pour
une utilisation en routine en réanimation depuis 2017.
L’analyse du transcriptome permet également de mettre en évidence des différences selon le
micro-organisme en cause. Ephraim et al. [59] ont également montré la capacité du
24
transcriptome à distinguer chez des patients présentant une infection respiratoire haute, une
origine virale, d’une origine bactérienne ou non infectieuse. Comparée à la PCT, l’analyse
transcriptomique était meilleure pour discriminer les infections bactériennes des tableaux non
infectieux [105/124 versus 79/124 (AUC 0,72) ; p<0,001] et pour discriminer les infections
bactériennes des tableaux d’autres causes (infections virales et autres) [215/238 versus 186/238
(AUC 0,82) ; p=0,02]. De même, chez des patients présentant une infection respiratoire basse,
Suarez et al. [60] ont identifié une signature de 10 gènes permettant de discriminer les infections
bactériennes et virales avec une sensibilité de 95%, une spécificité de 92% versus 38% et 91%
respectivement pour la PCT. D’autres études confirment l’intérêt du transcriptome pour
distinguer l’infection en fonction de la nature de l’agent microbien, par contre il n’est pas mis
en évidence de différence en fonction des bactéries ou virus en cause [61,62]. Deux études
conduites sur des patients hospitalisés en réanimation n’ont pas montré la capacité de cette
technique à discriminer une infection par une bactérie a Gram positif ou négatif [63,64].
Bien que moins connus l’étude du métabolome et du protéome grâce au développement des
techniques de spectrométrie de masse est tout aussi intéressante dans le sepsis [65]. A titre
d’exemple, Schmerler et al. [66] ont étudié le plasma de 74 patients présentant un SIRS et de
69 patients en sepsis et trouvé 2 lipides (C10:1 et phosphatidylcholine 32:0) significativement
élevés chez les patients septiques. Grâce à ces 2 marqueurs, 80% des patients septiques étaient
reconnus comme tels et 70% des patients non septiques étaient classés comme non infectés.
Overd et al. [67] ont quant à eux étudié 600 protéines chez 765 patients, 319 présentant une
infection bactérienne, 334 une infection virale et 112 non infectés. Les concentrations
plasmatiques de 3 protéines (TRAIL, IL-10 et CRP) ont permis de distinguer les patients
infectés des non-infectés avec une AUC à 0,89.
Ces nouvelles techniques sont ainsi très intéressantes, relativement sensibles et spécifiques. En
pleine expansion, elles restent cependant difficiles à envisager en routine pour l’instant. La
spectrométrie de masse MALDI-TOF est cependant aujourd’hui utilisée en routine clinique
pour l’identification et le typage des micro-organismes [68].
25
3. La spectrométrie de masse MALDI-TOF
Largement utilisée dans le domaine de la métabolomique et de la protéomique, la spectrométrie
de masse est maintenant d’utilisation en routine en microbiologie [69-72]. Elle permet en effet
à ce jour dans de nombreux laboratoires l’identification de nombreux micro-organismes entiers
sans étape d’extraction protéique dont on obtient un spectre caractéristique par la comparaison
du spectre entier avec des bases de données d’empreintes spectrales de référence [68,73,74].
La spectrométrie de masse est une technique d’analyse qui permet de détecter et d'identifier des
molécules d’intérêt par mesure de leur masse. Son principe réside dans la séparation en phase
gazeuse de molécules chargées en fonction de leur rapport masse/charge (m/z).
Un spectromètre de masse comprend toujours un système d’introduction de l’échantillon à
analyser, une source d’ionisation permettant le passage en phase gazeuse de l’échantillon et
l’ionisation des molécules, un analyseur qui sépare les ions produits selon leur rapport m/z puis
un détecteur qui fournit un signal électrique proportionnel au nombre d’ions détectés et enfin
un système de traitement informatique du signal pour obtenir le spectre de masse représentant
les rapports m/z, où m représente la masse et z la valence des ions détectés selon l'axe des
abscisses et l'abondance relative de ces ions selon l'axe de ordonnées [75].
La méthode MALDI (Matrix-Assisted Laser Desorption Ionization) permettant l’analyse de
macromolécules en empêchant leur fragmentation, consiste à ajouter à l’échantillon déposé sur
un support, une solution organique appelée matrice, qui vont cristalliser ensemble sous l’effet
de l’évaporation. Ce mélange est ensuite irradié par un faisceau laser ce qui entraine la
désorption (passage en phase gazeuse) puis l’ionisation des molécules (figure 2). La technique
TOF (Time of Flight) qui est associée consiste à mesurer le temps que met un ion, accéléré
préalablement par une tension, à parcourir une distance donnée. L’analyseur de temps de vol se
compose d'une zone d'accélération où est appliquée une tension accélératrice, et d'une zone
appelée tube de vol, libre de champ électrique, dans lequel les ions accélérés volent jusqu’au
détecteur (figure 2). La séparation des ions va donc dépendre de la vitesse acquise lors de la
phase d'accélération. Ainsi les ions ayant une masse élevée parviendront au détecteur plus
lentement que les ions de rapport m/z plus petit. Le détecteur envoie ensuite les informations
enregistrées à l’analyseur qui va traiter les données et les présenter sous forme de spectre.
26
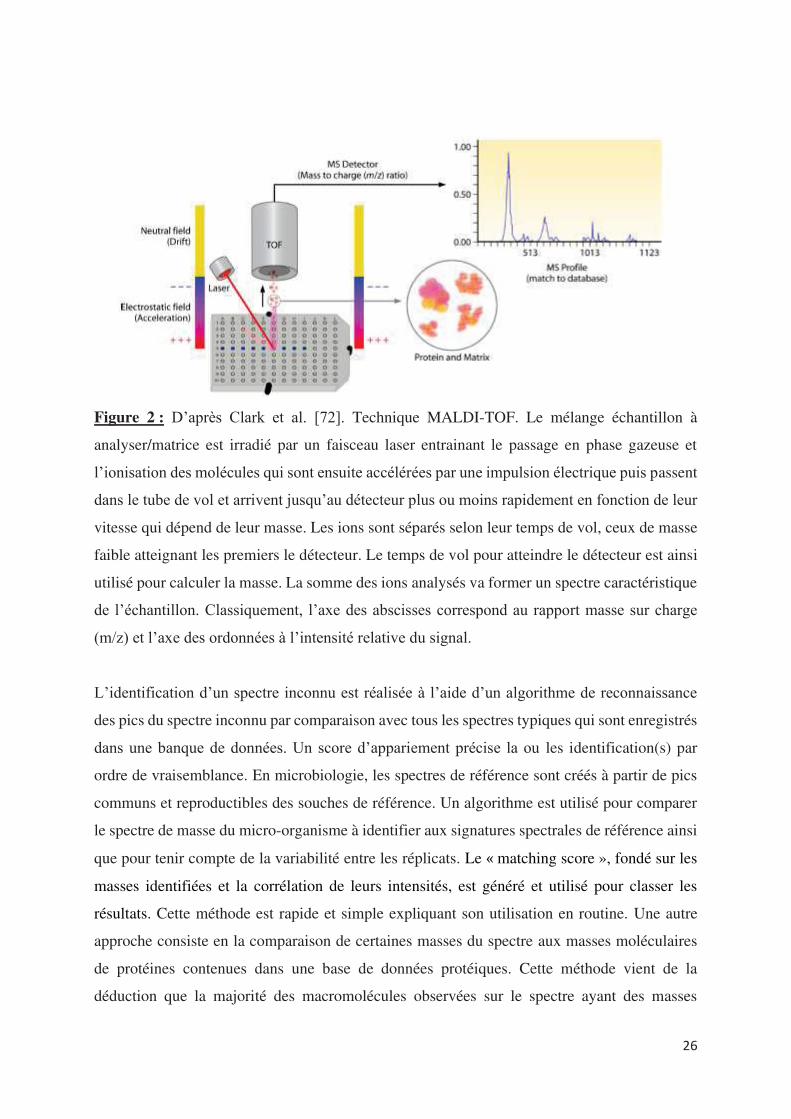
Figure 2 : D’après Clark et al. [72]. Technique MALDI-TOF. Le mélange échantillon à
analyser/matrice est irradié par un faisceau laser entrainant le passage en phase gazeuse et
l’ionisation des molécules qui sont ensuite accélérées par une impulsion électrique puis passent
dans le tube de vol et arrivent jusqu’au détecteur plus ou moins rapidement en fonction de leur
vitesse qui dépend de leur masse. Les ions sont séparés selon leur temps de vol, ceux de masse
faible atteignant les premiers le détecteur. Le temps de vol pour atteindre le détecteur est ainsi
utilisé pour calculer la masse. La somme des ions analysés va former un spectre caractéristique
de l’échantillon. Classiquement, l’axe des abscisses correspond au rapport masse sur charge
(m/z) et l’axe des ordonnées à l’intensité relative du signal.
L’identification d’un spectre inconnu est réalisée à l’aide d’un algorithme de reconnaissance
des pics du spectre inconnu par comparaison avec tous les spectres typiques qui sont enregistrés
dans une banque de données. Un score d’appariement précise la ou les identification(s) par
ordre de vraisemblance. En microbiologie, les spectres de référence sont créés à partir de pics
communs et reproductibles des souches de référence. Un algorithme est utilisé pour comparer
le spectre de masse du micro-organisme à identifier aux signatures spectrales de référence ainsi
que pour tenir compte de la variabilité entre les réplicats. Le matching score », fondé sur les
masses identifiées et la corrélation de leurs intensités, est généré et utilisé pour classer les
résultats. Cette méthode est rapide et simple expliquant son utilisation en routine. Une autre
approche consiste en la comparaison de certaines masses du spectre aux masses moléculaires
de protéines contenues dans une base de données protéiques. Cette méthode vient de la
déduction que la majorité des macromolécules observées sur le spectre ayant des masses
27
supérieures à 4000 m/z sont des protéines et que la moitié des pics des spectres bactériens
correspondent à des protéines ribosomales [60,76,77]. Cependant cette approche nécessite la
connaissance des protéomes de tous les micro-organismes d’intérêt clinique ce qui n’est pas le
cas pour l’instant.
Chaque instrument est associé à une bibliothèque ou banque de données qui peut être
incrémentée, à un algorithme et à des critères d’interprétation différents rendant leur
comparaison difficile. Avec le système de Bruker daltonics (appareil Microflex®, logiciel
Biotyper®) que nous avons utilisé, un score de correspondance basé sur les masses identifiées
et leur corrélation d’intensité est généré et utilisé pour l’identification des microorganismes. Un
score entre 2,33 et 3 permet de conclure à une très probable identification d’espèce, entre 2 et
2, 32 à une bonne identification de genre et une probable identification d’espèce, entre 1,7 et
1,999 à une probable identification de genre nécessitant d’autres tests et les scores inférieurs à
1,699 ne permettent pas d’identification.
Seng et al. ont [78] été les premiers à montrer l’intérêt de cette technique avec le système de
Bruker daltonics dans l’identification de bactéries à partir de colonies. Depuis le nombre de
publications est exponentiel vantant les performances de cette technique également pour
l’identification des mycobactéries, levures et champignons [72, 79-82]. L’analyse directe des
bactéries à partir d’échantillons de bouillons d’hémocultures positives est maintenant
également possible grâce à la commercialisation de kits comme SepsiTyper® pour Bruker
daltonics [83]. Cette identification possible à partir des hémocultures permet l’instauration
précoce d’un traitement ciblé sur l’espèce identifiée limitant l’utilisation des thérapies à large
spectre et réduisant ainsi le risque potentiel de résistances. Clerc et al. [84] ont démontré sur
l’étude de 202 cas de bactériémies à bacilles Gram négatif, que les résultats du MALDI-TOF
sur le bouillon d’hémocultures conduisaient à une modification de l’antibiothérapie probabiliste
initialement débutée dans 35,1% des cas versus dans 20,8% des cas seulement pour les résultats
du Gram. Dans 43,7% des cas, les résultats du MALDI-TOF ont conduit à un élargissement du
spectre de l’antibiothérapie en raison notamment de la mise en évidence d’un enterobacter
cloacae. Concernant l’utilisation de la technique sur les urines, différents traitements pré-
analytiques des urines ont été proposés avec des résultats très encourageants à condition d’avoir
un inoculum bactérien supérieur à 105 CFU/mL [85,86]. Le champ d’investigation reste
important avec la comparaison des souches, au sein d’une même espèce, l’identification de
facteurs de virulence ou encore l’étude de la résistance aux antibiotiques. L’enjeu de la
détection de la résistance aux antibiotiques est important car à l’exception de quelques bactéries
28
pour lesquelles des tests rapides de recherche de résistances existent (ex : la recherche de
résistance à la méticilline des staphylocoques), le délai de rendu des antibiogrammes est souvent
long. Or si l’identification rapide des bactéries permet d’améliorer l’antibiothérapie probabiliste
avec la prise en compte du profil de résistance de l’espèce et de l’écologie de l’environnement,
ce sont les résultats de la sensibilité aux antibiotiques qui conditionnent l’antibiothérapie
optimale pour le patient. Certaines équipes arrivent à détecter la résistance aux béta-lactamines
des entérobactéries et bacilles Gram négatifs non-fermentants ou encore la résistance des
entérocoques à la vancomycine grâce à la mise en évidence de pics spécifiques [87-91].
Cependant, aucune de ces méthodes n’est actuellement utilisée en routine.
Lors de l’essor de l’ICM-MS (Intact Cell MALDI-TOF Mass Spectrometry), terme retrouvé
dans la littérature, l’équipe s’est intéressée à l’application de la méthode MALDI-TOF pour
identifier des cellules eucaryotes entières compte tenu des contraintes et limites des techniques
existantes. C’est ainsi que Ouedraogo et al. [20] pour la première fois ont réussi à mettre en
évidence des signatures spectrales reproductibles de 18 types cellulaires de mammifères et de
4 types d’amibes. Ainsi entre autres, les polynucléaires neutrophiles, les monocytes, les
lymphocytes T, les globules rouges, les cellules dendritiques obtenues après culture de
monocytes et les macrophages dérivés de monocytes sont identifiables en spectrométrie de
masse MALDI-TOF grâce à des pics spécifiques formant une signature spectrale unique.
Organisés sous la forme d’un dendogramme, à l’exception des globules rouges, tous les spectres
des cellules de mammifères sont regroupés dans un même cluster alors que ceux des cellules
des amibes sont dans un autre cluster. Ouedraogo et al. [20] ont également montré que les
spectres des cellules immunitaires circulantes avaient de nombreux pics en commun. Dans
l’objectif de pouvoir utiliser la technique pour identifier les cellules, pour chaque type
cellulaire, un spectre de référence a été créé alimentant ainsi une banque cellulaire. Le test a été
ensuite fait en se servant de l’algorithme de l’appareil pour comparer le spectre de monocytes
puis d’un mélange de monocytes et lymphocytes T puis de PBMCs (cellules mononuclées du
sang obtenues par Ficoll) avec les spectres de la banque. Une identification des cellules a été
faite dans les 3 situations. L’équipe a donc transposé avec succès l’utilisation de la
spectrométrie de masse MALDI-TOF à la caractérisation et l’identification de cellules.
Cette approche de caractérisation cellulaire par « profiling » à partir de l’analyse directe de
cellules eucaryotes entières par spectrométrie de masse MALDI-TOF présente de nombreux
avantages car elle requiert très peu de préparation d’échantillons cellulaires et aucune extraction
29
ou séparation préalable des biomolécules. Elle est extrêmement sensible et reproductible
comme le confirme d’autres études avec la mise en évidence des profils spectraux spécifiques
de cellules uniques variées chez l’homme comme chez l’animal [92-97] jusqu’à des spectres de
groupes de cellules (frottis) [98,99]. Maurer et al. [98] ont en effet créé une base de données de
spectres correspondant à des frottis de carcinomes épidermoïdes buccaux et de muqueuses
saines de 26 patients. En aveugle, 26 nouveaux prélèvements (de carcinomes, de muqueuses
saines et de lésions buccales bénignes) ont ensuite été analysés avec la reconnaissance parfaite
des lésions cancéreuses et un seul faux positif. Cette technique a également montré sa capacité
pour différencier des lignées cellulaires proches (ex : cellules gliales [94]), évaluer la réponse
cellulaire à différentes conditions physiologiques (étapes de maturation, viabilité..) [96,97] et
pathologiques [98-100], identifier des réponses à l’exposition à de produits toxiques [101,102]
ou à des médicaments [103], ainsi que dépister des performances de lignées cellulaires comme
la production d’anticorps [104,105].
A la lecture de ces différentes approches et pouvant assimiler les spectres obtenus par la
spectrométrie de masse MALDI-TOF a de véritables « empreintes digitales », nous avons
souhaité explorer la polarisation fonctionnelle des macrophages puis l’activation des cellules
issues de patients dans l’idée de trouver des signatures ou biomarqueurs potentiels représentatifs
de situations pathologiques (infection/inflammation). L’objectif ultime espéré serait de pouvoir
rapidement avant même l’identification d’un éventuel micro-organisme soit conforter le
clinicien dans son choix de débuter précocement un traitement antimicrobien probabiliste afin
de réduire la morbidité et la mortalité, soit à l’inverse lui éviter d’exposer le patient à un
traitement large spectre qui risque de faire émerger des résistances.
Au-delà de l’étude de l’activation des cellules de l’immunité en réponse à une agression, nous
avons souhaité explorer la variabilité des réponses à l’infection observée en clinique grâce à au
modèle in vitro de formation de granulomes afin d’appréhender plus finement la réponse de
l’hôte et de mieux comprendre les susceptibilités individuelles dans des contextes cliniques
particuliers.
30
4. Le granulome inflammatoire
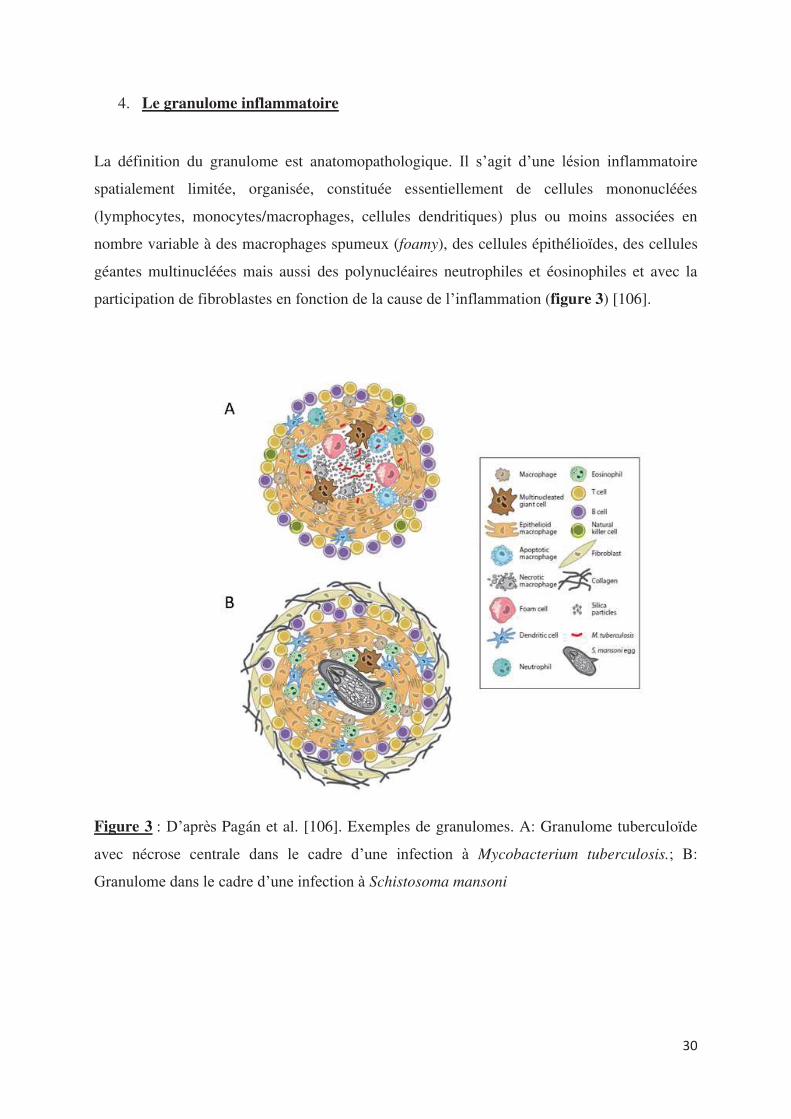
La définition du granulome est anatomopathologique. Il s’agit d’une lésion inflammatoire
spatialement limitée, organisée, constituée essentiellement de cellules mononucléées
(lymphocytes, monocytes/macrophages, cellules dendritiques) plus ou moins associées en
nombre variable à des macrophages spumeux (foamy), des cellules épithélioïdes, des cellules
géantes multinucléées mais aussi des polynucléaires neutrophiles et éosinophiles et avec la
participation de fibroblastes en fonction de la cause de l’inflammation (figure 3) [106].
Figure 3 : D’après Pagán et al. [106]. Exemples de granulomes. A: Granulome tuberculoïde
avec nécrose centrale dans le cadre d’une infection à Mycobacterium tuberculosis.; B:
Granulome dans le cadre d’une infection à Schistosoma mansoni
31
dans la sarcoïdose ou la maladie de Crohn, l’antigéne responsable n’est pas connu posant un
véritable problème diagnostique.
On retrouve dans la composition du granulome les cellules de l’immunité innée mais aussi des
cellules spécifiques. Les macrophages spumeux (foamy), les cellules épithélioïdes et les cellules
géantes multinucléées sont issues de la différentiation des macrophages activés. Les
macrophages spumeux sont surtout observés dans les granulomes à mycobactéries. Leur nom
vient du fait qu’ils contiennent de nombreuses gouttelettes lipidiques qui serviraient de réserve
nutritive pour le pathogène ; lequel pourrait ainsi rester en état de dormance [107]. Les cellules
épithélioïdes et les cellules géantes multinucléées sont retrouvées quant à elles dans tout
granulome correspondant respectivement à la différentiation des macrophages soumis à une
stimulation antigénique prolongée puis à leur fusion. Il semblerait que les cellules épithélioïdes
n’aient pas de rôle dans la phagocytose mais plutôt un rôle sécrétoire [108]. En ce qui concerne
les cellules géantes multinucléées, la raison de leur formation et leur rôle questionnent toujours.
In vitro, la formation de cellules géantes multinucléées peut être induite par différents stimuli
entre autres par l’IL-4, l’IL-13, le facteur de croissance GM-CFS (Granulocyte Macrophage
Colony Stimulating Factor) avec de l’IL-4, de l’IFN- plus IL-3 ou encore des lipides
mycobactériens [109,110]. Quant à leur rôle, leur capacité de phagocytose serait faible mais en
tant que cellules présentatrices de l’antigène, elles participeraient à l’induction de la réponse
adaptive [111]. Selon Midle et al. [112], les cellules géantes multinucléées seraient spécialisées
dans la phagocytose des cibles de grande taille médiée par le système du complément.
Le granulome traduit habituellement une réaction inflammatoire chronique en réponse à la
persistance d’un agent pathogène (agent infectieux, corps étranger..). Le granulome représente
alors un exemple de réaction d’hypersensibilité retardée. Toutefois, dans certains cas comme
32
De façon retardée, après reconnaissance de l’antigène et activation, les lymphocytes viennent
s’accumuler en couronne à la périphérie du granulome. Le rôle des lymphocytes B est peu
étudié. Les lymphocytes T CD8+ ne semblent pas indispensables à la formation des granulomes
bien qu’ils soient retrouvés notamment dans les granulomes tuberculeux et induits par
Schistosoma mansoni [113,114]. Connus pour leurs propriétés cytolytiques notamment par le
relargage de granzymes et perforine, dans l’inflammation granulomateuse, ils agiraient aussi
par la sécrétion de chimiokines et cytokines notamment IFN- . Les lymphocytes T CD4+ jouent
par contre un rôle essentiel dans la réponse anti-infectieuse des granulomes. En effet, chez
l’homme l’infection par le VIH se traduit par une susceptibilité aux infections entrainant une
réponse inflammatoire granulomateuse [115]. De même chez les souris déficientes infectées
par Mycobacterium tuberculosis, on note un échappement du contrôle de l’infection au bout de
quelques jours aboutissant au décès systématique [116].
En fonction de l’ambiance cytokinique liée au pathogène, les lymphocytes T CD4+ vont se
différencier notamment en Th1, Th2. Les lymphocytes Th1 sécrétant majoritairement de l'IFN-
γ, du TNF-α et de l’IL-2 induisent les réponses immunes cellulaires les plus efficaces contre les
virus et bactéries. Les lymphocytes Th2 par la sécrétion d'IL-4, IL-5, IL-10 et IL-13, induisent
la production d'IgE et stimulent l'action des éosinophiles, favorisant l'élimination des parasites
extra-cellulaires comme les helminthes. Typiquement, on trouve des granulomes « Th1 » dans
les infections à mycobactéries, salmonelles ou leishmanies et « Th2 » dans les infections à
helminthes comme Schistosoma mansoni [117,118]. Les lymphocytes Th17 produisent de l'IL-
17, de l'IL-22 et de l'IL-21. Ces cellules sont importantes pour le contrôle des infections
bactériennes extra-cellulaires et fongiques. En effet, elles facilitent le recrutement et l'activation
des cellules phagocytaires, en particulier les polynucléaires neutrophiles [119].
Le modèle de la tuberculose est l’archétype de cette réponse granulomateuse. Dans la mesure
où les bactéries intra-cellulaires survivent au sein des cellules phagocytaires, l'immunité innée
est peu efficace. Les cellules NK jouent néanmoins un rôle important car activées par l'IL-12
produite par les macrophages, elles produisent de l'IFN-γ qui renforce l’activation des
macrophages infectés et participent au contrôle initial de l'infection. L'immunité humorale est
également peu efficace bien que des anticorps dirigés contre les mycobactéries soient présents
au cours des infections à mycobactéries ; le principal mécanisme de défense repose donc sur
l'immunité adaptative à médiation cellulaire. La réaction d'hypersensibilité retardée dépend de
l'activation de lymphocytes T CD4 + Th1 et de la production de cytokines (IFN-γ et TNF-α)
qui favorisent le recrutement des leucocytes au niveau du site de l'inflammation et augmentent
33
la microbicidie des macrophages. Les granulomes limitent le plus souvent la dissémination des
bactéries et favorise leur élimination mais parfois, les réponses immunes mises en place
contiennent le pathogène sans l'éradiquer (infection latente) avec un risque de réactivation de 5
à 15 % des cas en fonction de l'immuno-compétence du sujet [120]. En cas
d'immunodépression, il y a un risque élevé de réactivation avec la survenue d'une tuberculose
maladie. Celle-ci dépend de la charge mycobactérienne, en général corrélée au degré d'immuno-
compétence. Dans le cas de l'infection par le VIH, les patients ayant une immunodépression
profonde présentent souvent des tuberculoses disséminées gravissimes. C'est le cas également
des patients porteurs de déficits congénitaux en IL-12 et/ou IFN-γ ou leurs récepteurs [121].
L’étude in situ des granulomes chez l’homme exige des pièces anatomiques provenant de
biopsies. Pour pallier cela, une méthode de formation in vitro de granulomes a été mise au point
en incubant in vitro des cellules mononucléées du sang périphérique (PBMCs) avec des billes
de sépharose couplées à des extraits de Mycobacterium bovis [110] ou, plus récemment, de
Coxiella burnetii [21]. Cette méthode simple a permis d’avancer dans la compréhension des
mécanismes de formation des granulomes. Il a ainsi été montré dans l’équipe par Delaby et al.
[21] que la formation des granulomes résulte de la fixation initiale des monocytes sur les billes
puis du recrutement des lymphocytes T et qu’en l’absence de monocytes, il n’y a pas de
formation de granulomes. Appliquée dans la fièvre Q chronique, cette méthode a permis de
mettre en évidence que le défaut de formation de granulomes constaté résulte d’un défaut de
migration des monocytes [22].
Comme nous l’avons vu la réponse immunitaire granulomateuse engage l’ensemble des acteurs
du système immunitaire et suit les mêmes étapes que la réponse non granulomateuse. Ainsi
l’étude de la formation in vitro du granulome représente un moyen d’évaluer de façon globale
ex vivo la réponse immune de patients. C’est ce que et al. [ ] ont fait chez des
patients traumatisés crâniens qui dans plus de 40% des cas développent une pneumopathie
nosocomiale. Ils ont montré une diminution significative de la formation de granulomes chez
les traumatisés crâniens par rapport à des sujets sains et parmi les traumatisés crâniens, ceux
développant une pneumopathie nosocomiale en formaient significativement moins que ceux
non infectés. Pour expliquer ce défaut de formation, ils ont mis en évidence une diminution
significative au niveau des granulomes des cellules géantes multinucléés et des lymphocytes
NK chez les traumatisés crâniens.

34
Il nous a donc semblé opportun d’étudier la réponse immunitaire granulomateuse chez des
patients en sepsis sévère et des patients âgés afin d’explorer les mécanismes
physiopathologiques qui favorisent les infections dans ces 2 populations.

35
EXPOSE DES TRAVAUX
36
Whole-cell MALDI-TOF MS: a new tool to assess the multifaceted
activation of macrophages
Ouedraogo R, Daumas A, Ghigo E, Capo C, Mege JL, Textoris J.
J Proteomics. 2012 Oct 22;75(18):5523-32.
doi: 10.1016/j.jprot.2012.07.046.
L’utilisation de la spectrométrie de masse MALDI-TOF MS permet à l’heure d’aujourd’hui une
identification des germes à partir de cultures et même de certains fluides biologiques infectés.
La rapidité et la fiabilité du diagnostic microbien par cette méthode ne sont plus à démontrer.
Les micro-organismes inconnus sont identifiés en comparant leurs pics individuels à la banque
de données. Le matching score », fondé sur les masses identifiées et la corrélation de leurs
intensités, est généré et utilisé pour classer les résultats.
En utilisant la même approche, Ouedraogo et al. [20] ont montré qu’il était possible de
distinguer 22 types cellulaires différents intacts. Après création d’une banque de spectres de
référence, la spectrométrie de masse MALDI-TOF a permis d’identifier parmi les cellules
mononuclées du sang (PBMCs), les « empreintes » des monocytes et des lymphocytes.
Il est bien connu que les propriétés fonctionnelles des macrophages varient selon leur
distribution tissulaire et leur état d’activation. Une classification M1/M2 des macrophages a été
proposée sur le modèle de la polarisation lymphocytaire Th1/Th2 [123]. Alors que les
macrophages M1 sont inflammatoires et microbicides, les macrophages M2 modulent la
réponse immune et sont faiblement microbicides. En réalité, cette notion de polarisation M1/M2
des macrophages recouvre un continuum d’états fonctionnels. Les macrophages peuvent être,
initialement inflammatoires avant de participer au remodelage tissulaire et retour à
l’homéostasie, ce qui suggère que les changements fonctionnels des macrophages résultent de
modifications de leur microenvironnement. L’étude de ces profils bénéficie des approches
récentes de biologie systémique qui permettent de mettre en évidence différents types de
signatures. Cependant, toutes ces techniques sont longues, plus ou moins sophistiquées et
surtout onéreuses.
37
Ainsi, nous nous sommes demandé si la spectrométrie de masse MALDI-TOF permettrait de
détecter différents profils d’activation des macrophages. Aux côtés de Richard Ouedraogo, j’ai
pu me familiariser à l’utilisation du spectromètre de masse et à l’analyse des données obtenues.
Pour cette étude, les monocytes ont été isolés à partir de PBMCs puis différenciés en
macrophages qui ont ensuite été activés par des agonistes M1 (IFN- , TNF-α, LPS
d’Escherichia coli), des agonistes M2 (IL-4, IL-10 et TGF-β) et des bactéries extracellulaires
(Streptococcus agalactiae et Staphylococcus aureus) et intracellulaires (Mycobacterium bovis
que l’on retrouve dans le vaccin contre la tuberculose, Coxiella burnetii agent de la fièvre Q et
Orientia tsutsugamushi responsable du typhus des broussailles en Asie) inactivées.
Les cellules activées ont été ensuite déposées sur la plaque du spectromètre et une matrice
HCCA (acide a-cyano-4- hydroxycinnamique) a été ajoutée. Les différents mélanges ont
ensuite été irradiés. Afin de nous affranchir des outils d’analyse imposés par l’industriel, grâce
à Julien Textoris, les données ont été analysées à l’aide du Logiciel gratuit R. Un script
d’analyse a ainsi été créé afin de normaliser, aligner et analyser les spectres ainsi obtenus.
Nous avons obtenu après au moins 18h de stimulation par IFN- ou IL-4, 2 signatures spectrales
très différentes et distinctes de celle des macrophages non activés. Fort de ce premier résultat,
nous avons comparé les spectres des macrophages activés par les différents agonistes M1 (IFN-
, TNF-α, LPS d’Escherichia coli) puis ceux des macrophages activés par les différents
agonistes M2 (IL-4, IL-10 et TGF-β). On note que les spectres des macrophages activés se
regroupent dans un même cluster distinct du cluster avec les spectres des macrophages non
activés. On retrouve également une signature spécifique à chaque source d’activation. Il est
ainsi possible de distinguer différents profils d’activation des macrophages avec des différences
évidentes entre un macrophage M1 et M2.
Nous avons ensuite étudié les spectres des macrophages activés par les bactéries extra-
cellulaires et intra-cellulaires. Les signatures induites par les bactéries extracellulaires
Streptococcus agalactiae et Staphylococcus aureus sont spécifiques de chaque type bactérien
et plus proches d’une signature M2 que d’une signature M1. En ce qui concerne les bactéries
intracellulaires, les profils d’activation sont distincts les uns des autres à nouveau. Mais alors
que les spectres des macrophages activés par Mycobacterium bovis clustérisent avec ceux des
macrophages activés par L’IL-4 (profil plutôt M2), les spectres des macrophages activés par
Coxiella burnetii et Orientia tsutsugamushi se regroupent avec ceux des macrophages inactivés.

38
Il ressort donc de cette étude que la spectrométrie de masse MALDI-TOF est une méthode assez
sensible pour détecter rapidement différents états d’activation des macrophages qu’ils soient
induits par des agonistes M1, des cytokines M2 ou différentes bactéries. Notre étude met
également en évidence la plasticité des macrophages en réponse aux stimuli environnementaux.
Cette approche de caractérisation cellulaire par « profiling » à partir de l’analyse directe des
cellules entières présente de nombreux avantages car elle requière très peu de préparation des
échantillons cellulaires et aucune extraction ou séparation préalable des biomolécules. Elle est
extrêmement sensible et reproductible.
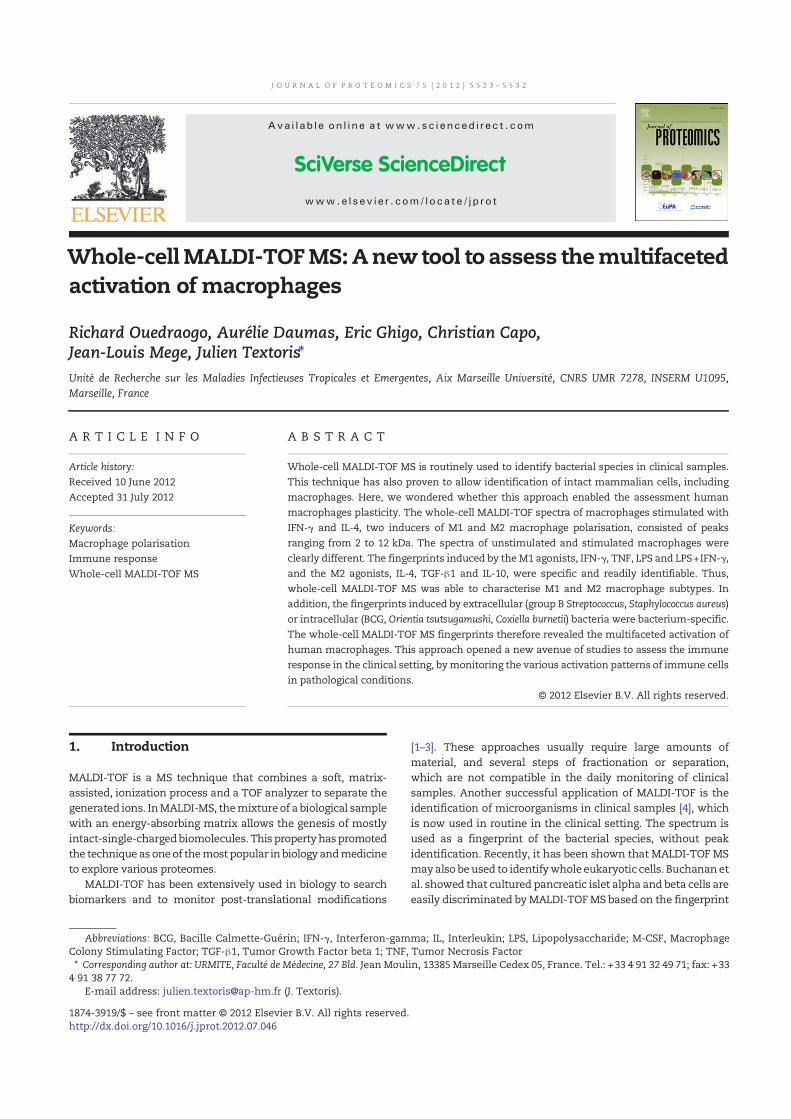
Whole-cellMALDI-TOFMS:Anew tool to assess themultifaceted
activation of macrophages
Richard Ouedraogo, Aurélie Daumas, Eric Ghigo, Christian Capo,Jean-Louis Mege, Julien Textoris⁎
Unité de Recherche sur les Maladies Infectieuses Tropicales et Emergentes, Aix Marseille Université, CNRS UMR 7278, INSERM U1095,
Marseille, France
A R T I C L E I N F O A B S T R A C T
Article history:
Received 10 June 2012
Accepted 31 July 2012
Whole-cell MALDI-TOF MS is routinely used to identify bacterial species in clinical samples.
This technique has also proven to allow identification of intact mammalian cells, including
macrophages. Here, we wondered whether this approach enabled the assessment human
macrophages plasticity. The whole-cell MALDI-TOF spectra of macrophages stimulated with
IFN-γ and IL-4, two inducers of M1 and M2 macrophage polarisation, consisted of peaks
ranging from 2 to 12 kDa. The spectra of unstimulated and stimulated macrophages were
clearly different. The fingerprints induced by the M1 agonists, IFN-γ, TNF, LPS and LPS+IFN-γ,
and the M2 agonists, IL-4, TGF-β1 and IL-10, were specific and readily identifiable. Thus,
whole-cell MALDI-TOF MS was able to characterise M1 and M2 macrophage subtypes. In
addition, the fingerprints induced by extracellular (group B Streptococcus, Staphylococcus aureus)
or intracellular (BCG, Orientia tsutsugamushi, Coxiella burnetii) bacteria were bacterium-specific.
The whole-cell MALDI-TOF MS fingerprints therefore revealed the multifaceted activation of
human macrophages. This approach opened a new avenue of studies to assess the immune
response in the clinical setting, bymonitoring the various activation patterns of immune cells
in pathological conditions.
© 2012 Elsevier B.V. All rights reserved.
Keywords:
Macrophage polarisation
Immune response
Whole-cell MALDI-TOF MS
1. Introduction
MALDI-TOF is a MS technique that combines a soft, matrix-
assisted, ionization process and a TOF analyzer to separate the
generated ions. InMALDI-MS, themixture of a biological sample
with an energy-absorbing matrix allows the genesis of mostly
intact-single-chargedbiomolecules. This propertyhaspromoted
the technique asoneof themost popular in biology andmedicine
to explore various proteomes.
MALDI-TOF has been extensively used in biology to search
biomarkers and to monitor post-translational modifications
[1–3]. These approaches usually require large amounts of
material, and several steps of fractionation or separation,
which are not compatible in the daily monitoring of clinical
samples. Another successful application of MALDI-TOF is the
identification of microorganisms in clinical samples [4], which
is now used in routine in the clinical setting. The spectrum is
used as a fingerprint of the bacterial species, without peak
identification. Recently, it has been shown that MALDI-TOF MS
mayalso be used to identifywhole eukaryotic cells. Buchananet
al. showed that cultured pancreatic islet alpha and beta cells are
easily discriminated byMALDI-TOFMS based on the fingerprint
J O U R N A L O F P R O T E O M I C S 7 5 ( 2 0 1 2 ) 5 5 2 3 – 5 5 3 2
Abbreviations: BCG, Bacille Calmette-Guérin; IFN-γ, Interferon-gamma; IL, Interleukin; LPS, Lipopolysaccharide; M-CSF, MacrophageColony Stimulating Factor; TGF-β1, Tumor Growth Factor beta 1; TNF, Tumor Necrosis Factor⁎ Corresponding author at: URMITE, Faculté de Médecine, 27 Bld. Jean Moulin, 13385 Marseille Cedex 05, France. Tel.: +33 4 91 32 49 71; fax: +33
4 91 38 77 72.E-mail address: [email protected] (J. Textoris).
1874-3919/$ – see front matter © 2012 Elsevier B.V. All rights reserved.http://dx.doi.org/10.1016/j.jprot.2012.07.046
Ava i l ab l e on l i ne a t www.sc i enced i r ec t . com
www.e l sev i e r . com/ loca te / j p ro t
derived from the different hormone peptides produced by the
cells [5]. MALDI-TOF MS has been employed to identify intact
mammalian cells including lymphocytes, monocytes, polymor-
phonuclear cells and erythrocytes. In a similar way, different
types of macrophages such as monocyte-derived-macrophages
or macrophage cell-lines from different species were easily
distinguished [6].
Tissue macrophages play a pivotal role in mounting an
immune response to microbial pathogens. They sense infec-
tious agents through receptors that bind conserved and
ubiquitous microbial motifs, such as LPS and peptidoglycan
and they produce microbicidal compounds [7]. Macrophages
present microbial antigens to T cells, thus contributing to the
development of adaptive immune response. T cells release
cytokines that in turn activate macrophages and either rein-
force or regulate their microbicidal activity. Such responses
have been classified into M1 and M2 macrophage responses
that are analogous to the model of Th1/Th2 lymphocyte
polarisation [8–10]. Macrophages activated by the classical
pathway (type I cytokines such as IFN-γ and TNF, or bacterial
products, such as LPS) are considered M1 macrophages, which
are inflammatory, microbicidal and tumouricidal [9,11–14].
Macrophages activated by alternative pathways (IL-4, IL-10,
TGF-β1) are considered M2 macrophages, which are poorly
microbicidal and tumouricidal and regulate inflammatory and
immune responses [10,15,16]. Whole proteome studies have
been made using gel-based separation systems and such
approach have allowed the identification of a large number of
proteins in the proteome, the secretome and in membranes
from activated macrophages [17]. Brown et al. showed that 80%
of proteins represent the core macrophage proteome, and 20%
of proteins define the response-specific proteome. Among the
latter proteins, it is possible to identify two unique M1-related
signatures induced by either IFN-γ or LPS [18]. Using pulse stable
isotope labeling of amino acids in cell culture, Kraft-Terry et al.
identified a bioprofile inM-CSF-differentiatedmonocytes that is
consistent with an M2 profile [19].
Due to their high degree of plasticity in response to their
micro-environment, macrophages constitute a model of
choice to assess the accuracy of whole-cell MALDI-TOF MS
to detect subtle modifications. In the current study, we
demonstrated that MALDI-TOF MS accuracy is sufficient to
study the multifaceted activation of macrophages. When
various M1 agonists (IFN-γ, TNF, LPS, LPS+IFN-γ) and M2
agonists (IL-4, TGF-β1, IL-10) were used to stimulate human
macrophages, MALDI-TOF MS fingerprints revealed the M1
and M2 subtypes. When macrophages were activated by
extracellular bacteria, specific signatures were obtained that
were similar to those induced by IL-4. In contrast, intracellu-
lar bacteria induced signatures that did not fit with either of
the M1 or M2 polarization profiles.
2. Materials and methods
2.1. Bacterial species
Staphylococcus aureus (CIP strain 7625) and group B Streptococcus
(CIP strain 103227) were obtained from the Laboratory of
Microbiology of the Hospital La Timone (Marseille). Briefly, S.
aureus and group B Streptococcus were grown on sheep blood
Colombia agar for 2 days, and the purity of the cultures was
assessed as previously described [20]. The Mycobacterium bovis
Bacille Calmette-Guerin (BCG) strain was provided by the
Institute Pasteur (CIP strain 105050), and the bacteria were
subcultured on Middlebrook 7H10 agar (Becton Dickinson, le
Pont de Claix, France) for 2–3 weeks as previously described
[21]. Orientia tsutsugamushi, strain Kato (CSUR R163), and Coxiella
burnetii, strain Nine Mile (RSA 493), were cultured on mouse L929
cells in MEM containing 5% FCS and 2 mM L-glutamine as
previously described [22]. The L929 cells were infected for
approximately 7 days. Infected cells were sonicated and
centrifuged at 300 ×g for 10 min to discard cellular debris. The
supernatants were then centrifuged at higher speed and bacteria
were collected. The collected bacteriawerewashed inPBS (pH7.2)
and stored at −80 °C. Bacterial concentrations were determined
by indirect immunofluorescence and/or quantitative PCR using
specific primers. The bacterial viability was assessed using the
LIVE/DEAD BacLight bacterial viability kit (Molecular Probes, Life
Technologies, Saint Aubin, France). Heat-killed bacteria were
obtained by incubating the bacteria at 95 °C for 1 h.
2.2. Activation of macrophages
Peripheral bloodmononuclear cellswere isolated from five buffy
coats (Etablissement Français du Sang, Marseille) and three
healthy blood donors by Ficoll density gradient as previously
described [23]. Monocytes were obtained from mononuclear
cells using magnetic beads coated with anti-CD14 Abs (Miltenyi
Biotech, Paris, France) according to the manufacturer's instruc-
tions. This procedure resulted in more than 95% monocyte
purity as assessed by flow cytometry, and monocyte viability
was greater than 98% as determined by trypan blue exclusion.
Monocytes (106 cells in 6-well plates) were incubated in 3 mL of
RPMI 1640 containing 20 mM HEPES, 10% human serum AB+,
2 mM L-glutamine, 100 IU/mL penicillin and 100 μg/mL strep-
tomycin (Life Technologies) for 4 days, and FCS replaced human
serum for an additional 3 days. The obtained cell population
was identified as macrophages (more than 95% pure) by flow
cytometry using CD68 expression as a positive marker of
macrophages. Macrophages were stimulated with 20 ng/mL
human recombinant IFN-γ (PeproTech, Neuilly-sur-Seine,
France), IL-4 (AbCys, Paris, France), IL-10, TGF-β1 (R&D Systems,
Lille, France) and TNF (Euromedex, Mundolsheim, France) for
different periods of time.Macrophageswere also stimulatedwith
1 μg/mL LPS from Escherichia coli (Sigma–Aldrich, Saint Quentin
Fallavier, France) or heat-killed bacteria (50 bacteria per cell).
2.3. MALDI-TOF MS
Stimulated macrophages (106 cells) were centrifuged for
5 min at 300 ×g. The cell pellets were suspended in 10 μL of
sterile PBS and frozen at −80 °C for 2 to 3 days. After
thawing, 1 μL of the cell suspension was added to 1 μL of
α-cyano-4-hydroxy-cynnamique acid matrix and the mixture
was deposited onto the MALDI target using an AutoFlexII
spectrometer and FlexControl software (Bruker Daltonics,
Wissembourg, France) as previously described [6]. The ions
that resulted from a 170 ns pulse ion extraction of the laser
emitting at 337 nm were subjected to an electric field of 20 kV
5524 J O U R N A L O F P R O T E O M I C S 7 5 ( 2 0 1 2 ) 5 5 2 3 – 5 5 3 2
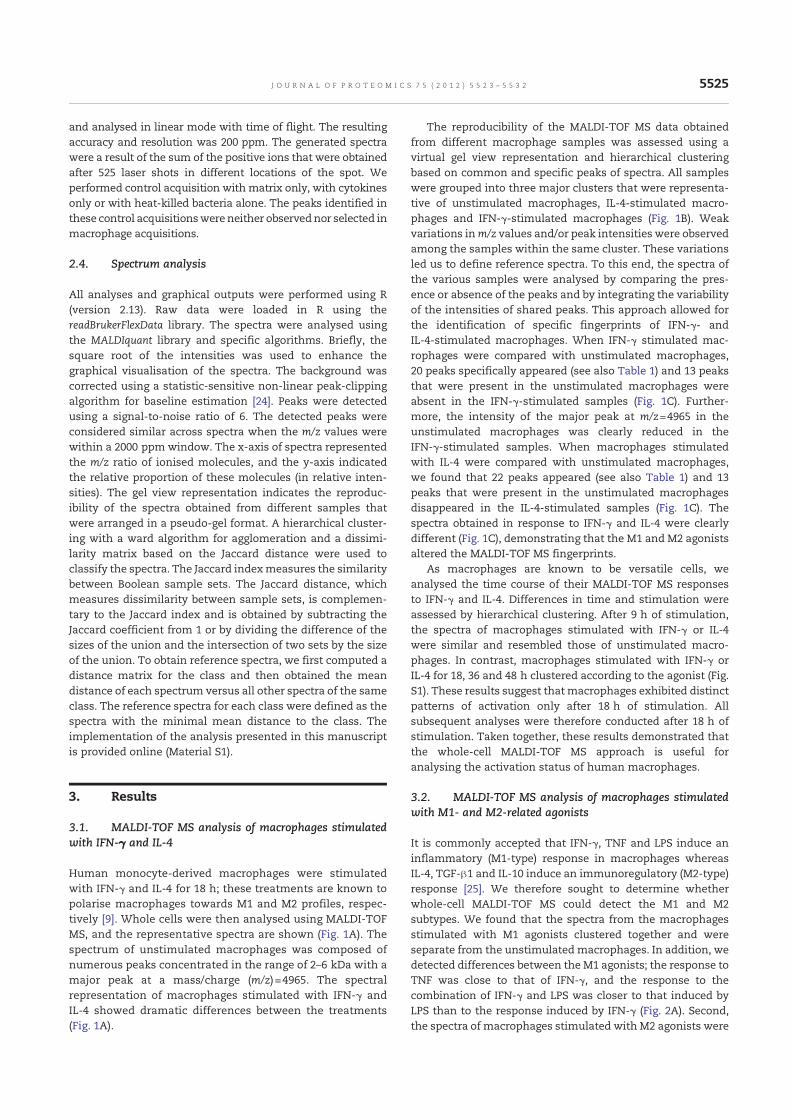
and analysed in linear mode with time of flight. The resulting
accuracy and resolution was 200 ppm. The generated spectra
were a result of the sum of the positive ions that were obtained
after 525 laser shots in different locations of the spot. We
performed control acquisition with matrix only, with cytokines
only or with heat-killed bacteria alone. The peaks identified in
these control acquisitionswereneither observednor selected in
macrophage acquisitions.
2.4. Spectrum analysis
All analyses and graphical outputs were performed using R
(version 2.13). Raw data were loaded in R using the
readBrukerFlexData library. The spectra were analysed using
the MALDIquant library and specific algorithms. Briefly, the
square root of the intensities was used to enhance the
graphical visualisation of the spectra. The background was
corrected using a statistic-sensitive non-linear peak-clipping
algorithm for baseline estimation [24]. Peaks were detected
using a signal-to-noise ratio of 6. The detected peaks were
considered similar across spectra when the m/z values were
within a 2000 ppm window. The x-axis of spectra represented
the m/z ratio of ionised molecules, and the y-axis indicated
the relative proportion of these molecules (in relative inten-
sities). The gel view representation indicates the reproduc-
ibility of the spectra obtained from different samples that
were arranged in a pseudo-gel format. A hierarchical cluster-
ing with a ward algorithm for agglomeration and a dissimi-
larity matrix based on the Jaccard distance were used to
classify the spectra. The Jaccard indexmeasures the similarity
between Boolean sample sets. The Jaccard distance, which
measures dissimilarity between sample sets, is complemen-
tary to the Jaccard index and is obtained by subtracting the
Jaccard coefficient from 1 or by dividing the difference of the
sizes of the union and the intersection of two sets by the size
of the union. To obtain reference spectra, we first computed a
distance matrix for the class and then obtained the mean
distance of each spectrum versus all other spectra of the same
class. The reference spectra for each class were defined as the
spectra with the minimal mean distance to the class. The
implementation of the analysis presented in this manuscript
is provided online (Material S1).
3. Results
3.1. MALDI-TOF MS analysis of macrophages stimulated
with IFN-γ and IL-4
Human monocyte-derived macrophages were stimulated
with IFN-γ and IL-4 for 18 h; these treatments are known to
polarise macrophages towards M1 and M2 profiles, respec-
tively [9]. Whole cells were then analysed using MALDI-TOF
MS, and the representative spectra are shown (Fig. 1A). The
spectrum of unstimulated macrophages was composed of
numerous peaks concentrated in the range of 2–6 kDa with a
major peak at a mass/charge (m/z)=4965. The spectral
representation of macrophages stimulated with IFN-γ and
IL-4 showed dramatic differences between the treatments
(Fig. 1A).
The reproducibility of the MALDI-TOF MS data obtained
from different macrophage samples was assessed using a
virtual gel view representation and hierarchical clustering
based on common and specific peaks of spectra. All samples
were grouped into three major clusters that were representa-
tive of unstimulated macrophages, IL-4-stimulated macro-
phages and IFN-γ-stimulated macrophages (Fig. 1B). Weak
variations inm/z values and/or peak intensities were observed
among the samples within the same cluster. These variations
led us to define reference spectra. To this end, the spectra of
the various samples were analysed by comparing the pres-
ence or absence of the peaks and by integrating the variability
of the intensities of shared peaks. This approach allowed for
the identification of specific fingerprints of IFN-γ- and
IL-4-stimulated macrophages. When IFN-γ stimulated mac-
rophages were compared with unstimulated macrophages,
20 peaks specifically appeared (see also Table 1) and 13 peaks
that were present in the unstimulated macrophages were
absent in the IFN-γ-stimulated samples (Fig. 1C). Further-
more, the intensity of the major peak at m/z=4965 in the
unstimulated macrophages was clearly reduced in the
IFN-γ-stimulated samples. When macrophages stimulated
with IL-4 were compared with unstimulated macrophages,
we found that 22 peaks appeared (see also Table 1) and 13
peaks that were present in the unstimulated macrophages
disappeared in the IL-4-stimulated samples (Fig. 1C). The
spectra obtained in response to IFN-γ and IL-4 were clearly
different (Fig. 1C), demonstrating that the M1 and M2 agonists
altered the MALDI-TOF MS fingerprints.
As macrophages are known to be versatile cells, we
analysed the time course of their MALDI-TOF MS responses
to IFN-γ and IL-4. Differences in time and stimulation were
assessed by hierarchical clustering. After 9 h of stimulation,
the spectra of macrophages stimulated with IFN-γ or IL-4
were similar and resembled those of unstimulated macro-
phages. In contrast, macrophages stimulated with IFN-γ or
IL-4 for 18, 36 and 48 h clustered according to the agonist (Fig.
S1). These results suggest thatmacrophages exhibited distinct
patterns of activation only after 18 h of stimulation. All
subsequent analyses were therefore conducted after 18 h of
stimulation. Taken together, these results demonstrated that
the whole-cell MALDI-TOF MS approach is useful for
analysing the activation status of human macrophages.
3.2. MALDI-TOF MS analysis of macrophages stimulated
with M1- and M2-related agonists
It is commonly accepted that IFN-γ, TNF and LPS induce an
inflammatory (M1-type) response in macrophages whereas
IL-4, TGF-β1 and IL-10 induce an immunoregulatory (M2-type)
response [25]. We therefore sought to determine whether
whole-cell MALDI-TOF MS could detect the M1 and M2
subtypes. We found that the spectra from the macrophages
stimulated with M1 agonists clustered together and were
separate from the unstimulated macrophages. In addition, we
detected differences between the M1 agonists; the response to
TNF was close to that of IFN-γ, and the response to the
combination of IFN-γ and LPS was closer to that induced by
LPS than to the response induced by IFN-γ (Fig. 2A). Second,
the spectra of macrophages stimulated with M2 agonists were
5525J O U R N A L O F P R O T E O M I C S 7 5 ( 2 0 1 2 ) 5 5 2 3 – 5 5 3 2
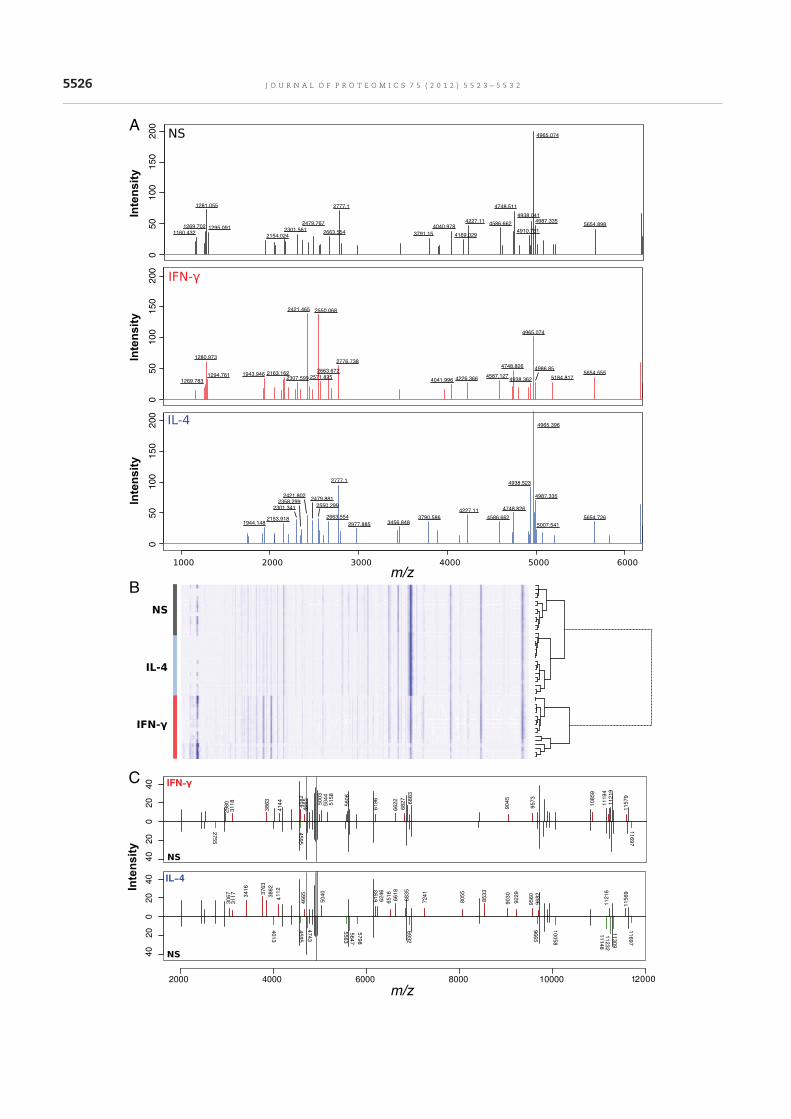
050
100
150
200
1269.783
1280.973
1294.761 1943.946 2163.1622307.599
2421.465 2550.068
2571.825
2663.672
2776.738
4041.996 4226.3664587.127
4748.826
4938.362
4965.074
4986.85
5184.8175654.555
050
100
150
200
1160.432
1269.702
1281.055
1295.091
2154.024
2301.561
2479.767
2663.554
2777.1
3791.15
4040.978
4169.029
4227.114586.662
4748.511
4910.761
4938.041
4965.074
4987.3355654.898
050
100
150
200
1944.1482153.918
2301.341
2358.299
2421.8022479.881
2550.299
2663.554
2777.1
2977.885 3456.8483790.586
4227.11
4586.662
4748.826
4938.523
4965.396
4987.335
5007.541
5654.726
A
C
B
5526 J O U R N A L O F P R O T E O M I C S 7 5 ( 2 0 1 2 ) 5 5 2 3 – 5 5 3 2
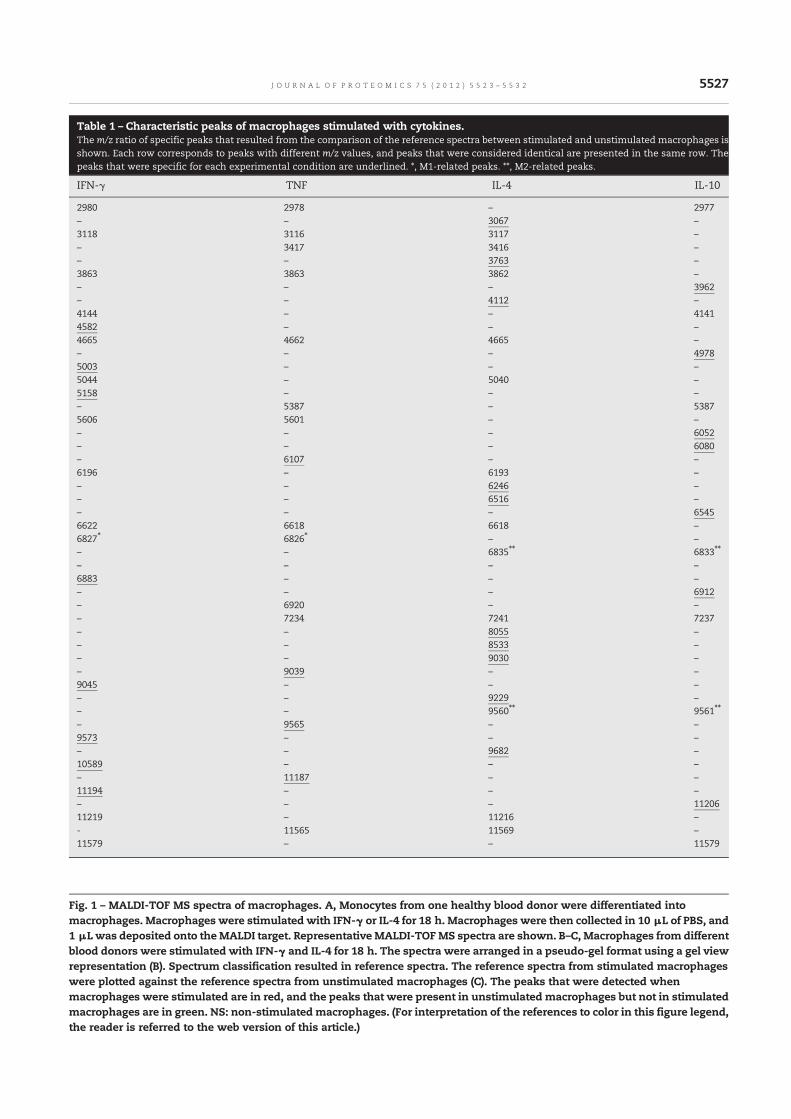
Fig. 1 – MALDI-TOF MS spectra of macrophages. A, Monocytes from one healthy blood donor were differentiated into
macrophages. Macrophages were stimulated with IFN-γ or IL-4 for 18 h. Macrophages were then collected in 10 μL of PBS, and
1 μL was deposited onto theMALDI target. Representative MALDI-TOFMS spectra are shown. B–C, Macrophages from different
blood donors were stimulated with IFN-γ and IL-4 for 18 h. The spectra were arranged in a pseudo-gel format using a gel view
representation (B). Spectrum classification resulted in reference spectra. The reference spectra from stimulated macrophages
were plotted against the reference spectra from unstimulated macrophages (C). The peaks that were detected when
macrophages were stimulated are in red, and the peaks that were present in unstimulated macrophages but not in stimulated
macrophages are in green. NS: non-stimulated macrophages. (For interpretation of the references to color in this figure legend,
the reader is referred to the web version of this article.)
Table 1 – Characteristic peaks of macrophages stimulated with cytokines.The m/z ratio of specific peaks that resulted from the comparison of the reference spectra between stimulated and unstimulated macrophages is
shown. Each row corresponds to peaks with different m/z values, and peaks that were considered identical are presented in the same row. The
peaks that were specific for each experimental condition are underlined. *, M1-related peaks. **, M2-related peaks.
IFN-γ TNF IL-4 IL-10
2980 2978 – 2977
– – 3067 –
3118 3116 3117 –
– 3417 3416 –
– – 3763 –
3863 3863 3862 –
– – – 3962
– – 4112 –
4144 – – 4141
4582 – – –
4665 4662 4665 –
– – – 4978
5003 – – –
5044 – 5040 –
5158 – – –
– 5387 – 5387
5606 5601 – –
– – – 6052
– – – 6080
– 6107 – –
6196 – 6193 –
– – 6246 –
– – 6516 –
– – – 6545
6622 6618 6618 –
6827⁎ 6826⁎ – –
– – 6835⁎⁎ 6833⁎⁎
– – – –
6883 – – –
– – – 6912
– 6920 – –
– 7234 7241 7237
– – 8055 –
– – 8533 –
– – 9030 –
– 9039 – –
9045 – – –
– – 9229 –
– – 9560⁎⁎ 9561⁎⁎
– 9565 – –
9573 – – –
– – 9682 –
10589 – – –
– 11187 – –
11194 – – –
– – – 11206
11219 – 11216 –
- 11565 11569 –
11579 – – 11579
5527J O U R N A L O F P R O T E O M I C S 7 5 ( 2 0 1 2 ) 5 5 2 3 – 5 5 3 2
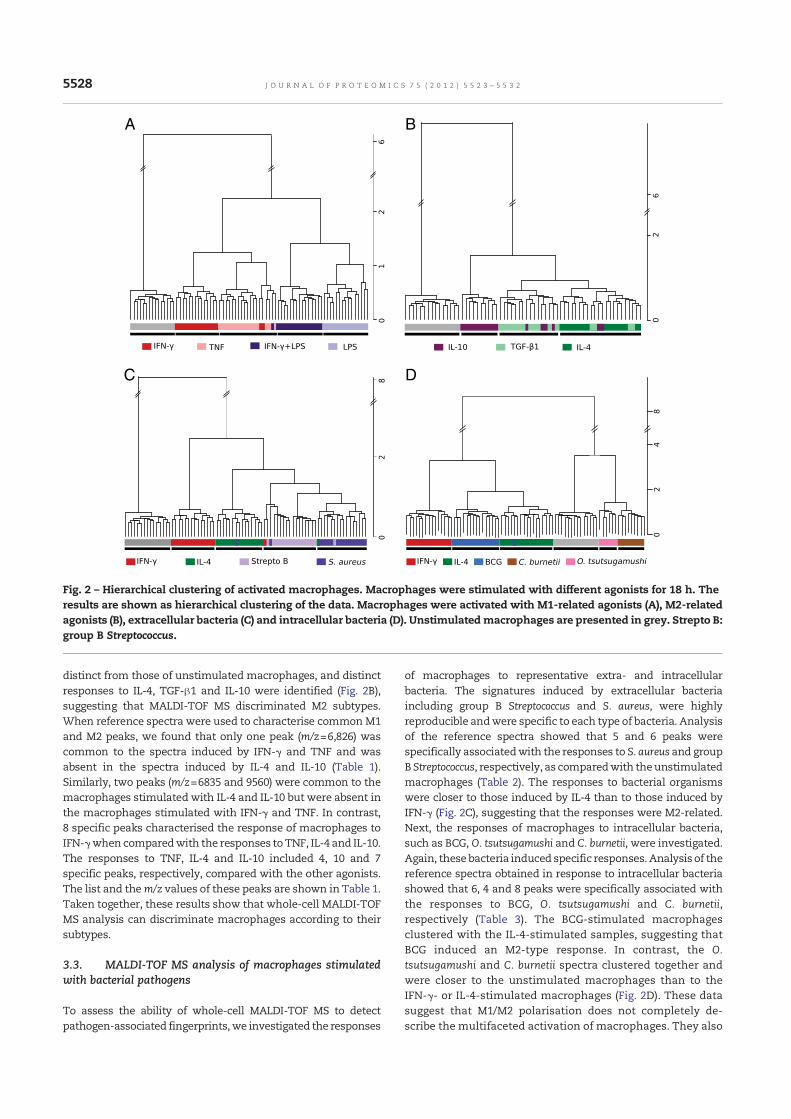
distinct from those of unstimulated macrophages, and distinct
responses to IL-4, TGF-β1 and IL-10 were identified (Fig. 2B),
suggesting that MALDI-TOF MS discriminated M2 subtypes.
When reference spectra were used to characterise common M1
and M2 peaks, we found that only one peak (m/z=6,826) was
common to the spectra induced by IFN-γ and TNF and was
absent in the spectra induced by IL-4 and IL-10 (Table 1).
Similarly, two peaks (m/z=6835 and 9560) were common to the
macrophages stimulated with IL-4 and IL-10 but were absent in
the macrophages stimulated with IFN-γ and TNF. In contrast,
8 specific peaks characterised the response of macrophages to
IFN-γwhen comparedwith the responses toTNF, IL-4 and IL-10.
The responses to TNF, IL-4 and IL-10 included 4, 10 and 7
specific peaks, respectively, compared with the other agonists.
The list and them/z values of these peaks are shown in Table 1.
Taken together, these results show that whole-cell MALDI-TOF
MS analysis can discriminate macrophages according to their
subtypes.
3.3. MALDI-TOF MS analysis of macrophages stimulated
with bacterial pathogens
To assess the ability of whole-cell MALDI-TOF MS to detect
pathogen-associated fingerprints,we investigated the responses
of macrophages to representative extra- and intracellular
bacteria. The signatures induced by extracellular bacteria
including group B Streptococcus and S. aureus, were highly
reproducible andwere specific to each type of bacteria. Analysis
of the reference spectra showed that 5 and 6 peaks were
specifically associatedwith the responses to S. aureus and group
B Streptococcus, respectively, as comparedwith theunstimulated
macrophages (Table 2). The responses to bacterial organisms
were closer to those induced by IL-4 than to those induced by
IFN-γ (Fig. 2C), suggesting that the responses were M2-related.
Next, the responses of macrophages to intracellular bacteria,
such as BCG, O. tsutsugamushi and C. burnetii, were investigated.
Again, these bacteria induced specific responses. Analysis of the
reference spectra obtained in response to intracellular bacteria
showed that 6, 4 and 8 peaks were specifically associated with
the responses to BCG, O. tsutsugamushi and C. burnetii,
respectively (Table 3). The BCG-stimulated macrophages
clustered with the IL-4-stimulated samples, suggesting that
BCG induced an M2-type response. In contrast, the O.
tsutsugamushi and C. burnetii spectra clustered together and
were closer to the unstimulated macrophages than to the
IFN-γ- or IL-4-stimulated macrophages (Fig. 2D). These data
suggest that M1/M2 polarisation does not completely de-
scribe the multifaceted activation of macrophages. They also
B
D
A
C
Fig. 2 – Hierarchical clustering of activated macrophages. Macrophages were stimulated with different agonists for 18 h. The
results are shown as hierarchical clustering of the data. Macrophages were activated with M1-related agonists (A), M2-related
agonists (B), extracellular bacteria (C) and intracellular bacteria (D). Unstimulatedmacrophages are presented in grey. Strepto B:
group B Streptococcus.
5528 J O U R N A L O F P R O T E O M I C S 7 5 ( 2 0 1 2 ) 5 5 2 3 – 5 5 3 2
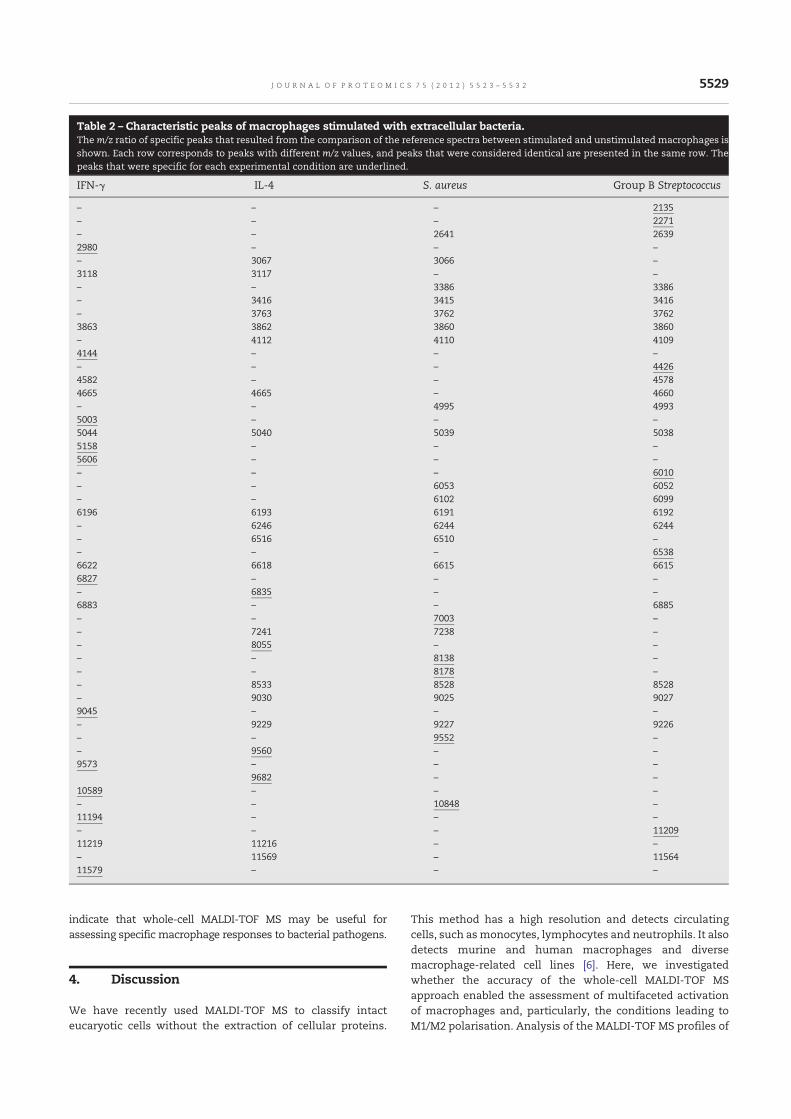
indicate that whole-cell MALDI-TOF MS may be useful for
assessing specific macrophage responses to bacterial pathogens.
4. Discussion
We have recently used MALDI-TOF MS to classify intact
eucaryotic cells without the extraction of cellular proteins.
This method has a high resolution and detects circulating
cells, such asmonocytes, lymphocytes and neutrophils. It also
detects murine and human macrophages and diverse
macrophage-related cell lines [6]. Here, we investigated
whether the accuracy of the whole-cell MALDI-TOF MS
approach enabled the assessment of multifaceted activation
of macrophages and, particularly, the conditions leading to
M1/M2 polarisation. Analysis of the MALDI-TOF MS profiles of
Table 2 – Characteristic peaks of macrophages stimulated with extracellular bacteria.The m/z ratio of specific peaks that resulted from the comparison of the reference spectra between stimulated and unstimulated macrophages is
shown. Each row corresponds to peaks with different m/z values, and peaks that were considered identical are presented in the same row. The
peaks that were specific for each experimental condition are underlined.
IFN-γ IL-4 S. aureus Group B Streptococcus
– – – 2135
– – – 2271
– – 2641 2639
2980 – – –
– 3067 3066 –
3118 3117 – –
– – 3386 3386
– 3416 3415 3416
– 3763 3762 3762
3863 3862 3860 3860
– 4112 4110 4109
4144 – – –
– – – 4426
4582 – – 4578
4665 4665 – 4660
– – 4995 4993
5003 – – –
5044 5040 5039 5038
5158 – – –
5606 – – –
– – – 6010
– – 6053 6052
– – 6102 6099
6196 6193 6191 6192
– 6246 6244 6244
– 6516 6510 –
– – – 6538
6622 6618 6615 6615
6827 – – –
– 6835 – –
6883 – – 6885
– – 7003 –
– 7241 7238 –
– 8055 – –
– – 8138 –
– – 8178 –
– 8533 8528 8528
– 9030 9025 9027
9045 – – –
– 9229 9227 9226
– – 9552 –
– 9560 – –
9573 – – –
9682 – –
10589 – – –
– – 10848 –
11194 – – –
– – – 11209
11219 11216 – –
– 11569 – 11564
11579 – – –
5529J O U R N A L O F P R O T E O M I C S 7 5 ( 2 0 1 2 ) 5 5 2 3 – 5 5 3 2

Table 3 – Characteristic peaks of macrophages stimulated with intracellular bacteria.The m/z ratio of specific peaks that resulted from the comparison of the reference spectra between stimulated and unstimulated macrophages is
shown. Each row corresponds to peaks with different m/z values, and peaks that were considered identical are presented in the same row. The
peaks that were specific for each experimental condition are underlined.
IFN-γ IL-4 BCG O. tsutsugamushi C. burnetii
– – – 2283 2282
– – – – 2339
– – – – 2429
– – – 2666 2668
– – – 2780 2779
2980 – – – –
– 3067 3071 – –
– – – 3087 3087
3118 3117 – – –
– – – – 3153
– 3416 3417 – –
– 3763 3766 3768 3768
– – – 3791 –
3863 3862 3862 3865 3866
– 4112 4111 – –
4144 – – – –
– – 4430 4432 –
4582 – – 4583 4584
– – – 4607 –
4665 4665 – – –
– – – 4984 –
5003 – 5002 5006 5006
5044 5040 – – –
– – – 5071 –
5158 – – – –
5606 – – – –
– – – – 5779
– – 6014 – 6017
– – 6054 – –
– – – – 6061
6196 6193 6195 6196 6195
– 6246 6247 6251 –
– 6516 6516 – –
– – – – 6544
6622 6618 – 6621 6627
6827 – – – –
– 6835 6832 – –
6883 – – – –
– 7241 7240 – 7244
– – 7454 7458 –
– 8055 – – –
– – 8181 – –
– – – – 8272
– 8533 – – –
– 9030 – – –
9045 – – – –
– 9229 – – –
– 9560 – – –
9573 – – – –
– – 9661 – –
– 9682 – – –
– – 9877 – –
– – 9921 – –
– – – – 9932
10589 – – – –
– – 10855 – –
11194 – – – –
11219 11216 – – –
– 11569 – – –
5530 J O U R N A L O F P R O T E O M I C S 7 5 ( 2 0 1 2 ) 5 5 2 3 – 5 5 3 2
macrophages showed that the responses to IFN-γ and IL-4,
two canonical inducers of M1 and M2 macrophages, respec-
tively, clustered into distinct groups. The resulting spectra of
the M1/M2 polarised macrophages were highly reproducible.
Hence, MALDI-TOF MS profiles of macrophages stimulated
with IFN-γ and IL-4 may be considered fingerprints of M1 and
M2 macrophages, respectively. To our knowledge, only two
studies have explored the ability of whole-cell MALDI-TOF MS
to assess various states of a unique cell type. Small differ-
ences in MALDI-TOF MS spectra are sufficient to assess the
viability of CHO cells [26]. Marvin-Guy et al. demonstrated that
the spectra from T84 epithelial cells in the growth phase are
very different from those of confluent cells [27]. Our results
suggested that whole-cell MALDI-TOF MS could be used to
assess the plasticity of cells, such as macrophages.
The inflammatory cytokine, TNF, and the bacterial compo-
nent, LPS, are considered to be M1 agonists; thus, we investi-
gatedwhetherwhole-cellMALDI-TOFMScould be used to study
the activationofmacrophagesbyTNF and LPS. The TNF and LPS
responses were close to the classical M1 response induced by
IFN-γ although the TNF and LPS responses exhibited specific
features. This underlines that the accuracy of the technique
allowed to detect distinct subgroups in the M1 polarised
macrophages. The combination of IFN-γ and LPS also led to an
M1-type response, and was closer to the profile induced by LPS
alone. This finding may be a result of the differences between
the priming and activation of macrophages. Indeed, it is well
known that IFN-γ does not induce cytokine release or promote
the microbicidal activity of macrophages, but it amplifies these
functions in themacrophage response to LPS [28]. IFN-γ and LPS
differentially modulate gene expression in macrophages [29],
and it has recently been demonstrated that proteome profiles
are different inhumanmacrophages stimulatedwith IFN-γ, LPS
and the combination of IFN-γ+LPS [18]. We also asked whether
whole-cell MALDI-TOF MS could be used to discriminate
different types of M2 macrophages. It has been suggested that
M2 macrophages include at least three subsets with different
phenotypic characteristics, repertoires of gene expression,
abilities to produce cytokines and functional activities [30,31].
We found that IL-10 andTGF-β1 induced spectra thatwere close
to but distinct from those induced by IL-4. Taken together, these
results demonstrated thatMALDI-TOFMS approachwas able to
discriminate different subtypes of M1 and M2macrophages.
Macrophages are known to play essential roles in host
defence by recognising, engulfing and killing microorganisms.
They respond to a broad variety of bacteria through a unique
pattern of gene expression changes, referred to as the “common
host response” [12,32–34]. Evidence also indicates that bacterial
pathogens can interfere with macrophage activation. We found
that the MALDI-TOF MS spectra of macrophages stimulated
with the extracellular bacteria such as S. aureus and group B
Streptococcus evoked M2 profiles. These M2-type profiles may be
a result of the production of IL-10 by macrophages stimulated
with S. aureus [35] and the inhibition of the NF-κB pathway by
group B Streptococcus [36]. The MALDI-TOF MS approach dis-
criminated the responses to S. aureus and group B Streptococcus.
The MALDI-TOF MS profiles of macrophages stimulated with
intracellular bacteria were clustered into a group that included
BCG- and cytokine-stimulated macrophages and a distinct
cluster composed of O. tsutsugamushi, the agent of scrub typhus,
C. burnetii, the agent of Q fever, and unstimulatedmacrophages.
Interestingly, BCG-stimulated macrophages exhibited a more
similar response to macrophage stimulated with IL-4 than with
IFN-γ, suggesting anM2-type response. It has been demonstrat-
ed that bacteria, such asMycobacterium tuberculosis, induce anM2
phenotype in vitro [37], which is consistentwith our findings.We
previously demonstrated that O. tsutsugamushi replicates in
humanmonocytes andupregulates the expression of genes that
are associated with the M1 polarisation of macrophages [22].
This apparent discrepancy with our current results may be
attributed to a variety of causes. For example, exocytosis may
interfere with the fingerprints observed in the MALDI-TOF MS
analysis, as macrophages are known to produce high levels of
cytokines in response to pathogens. Moreover, the response to
heat-killed O. tsutsugamushi is dramatically different from that
of live organisms [22], suggesting that the use of macrophages
and heat-killed pathogens instead of monocytes and live
organisms may affect the cellular response to bacterial aggres-
sion. This is highlighted by the transcriptional responses of
monocytes and macrophages to C. burnetii. Indeed, C. burnetii
induces a transcriptional M1-type response in monocytes and
an atypicalM2-typeprofile inmacrophages [12]. Taken together,
these results show that an easy assay using whole-cell
MALDI-TOF was able to detect specific fingerprints of macro-
phages stimulatedwith various bacteria.Whole-cellMALDI-TOF
may therefore be suitable to explore the immune response.
In conclusion, the accuracy and reproducibility of the
whole-cell MALDI-TOF MS approach enables the analysis of
different types of macrophage activation. This fast and
inexpensive method permits the classification of M1- and
M2-associated macrophage phenotypes and reveals the di-
versity of proteomic responses to cytokines and bacterial
pathogens. The specific fingerprints we found may be useful
for studying the activation of macrophages in pathological
conditions.Supplementary data to this article can be found online at
http://dx.doi.org/10.1016/j.jprot.2012.07.046.
Conflict of interest
There is no financial/commercial conflict of interests.
Acknowledgments
RichardOuedraogowas supported by a grant from theMinistère
de la Santé (PHRC 2010).
R E F E R E N C E S
[1] Huang Q, Huang Q, Chen W, Wang L, Lin W, Lin J, et al.Identification of transgelin as a potential novel biomarker forgastric adenocarcinoma based on proteomics technology.J Cancer Res Clin Oncol 2008;134:1219-27.
[2] Visentin M, Simula MP, Sartor F, Petrucco A, De Re V, ToffoliG. Identification of proteins associated to multi-drugresistance in LoVo human colon cancer cells. Int J Oncol2009;34:1281-9.
5531J O U R N A L O F P R O T E O M I C S 7 5 ( 2 0 1 2 ) 5 5 2 3 – 5 5 3 2
[3] Fan Y, Wang J, Yang Y, Liu Q, Fan Y, Yu J, et al. Detection andidentification of potential biomarkers of breast cancer.J Cancer Res Clin Oncol 2010;136:1243-54.
[4] Welker M. Proteomics for routine identification ofmicroorganisms. Proteomics 2011;11:3143-53.
[5] Buchanan CM, Malik AS, Cooper GJS. Direct visualisation ofpeptide hormones in cultured pancreatic islet alpha- andbeta-cells by intact-cell mass spectrometry. Rapid CommunMass Spectrom 2007;21:3452-8.
[6] Ouedraogo R, Flaudrops C, Ben Amara A, Capo C, Raoult D,Mege JL. Global analysis of circulating immune cells bymatrix-assisted laser desorption ionization time-of-flightmass spectrometry. PLoS One 2010;5:e13691.
[7] Ishii KJ, Koyama S, Nakagawa A, Coban C, Akira S. Host innateimmune receptors and beyond: making sense of microbialinfections. Cell Host Microbe 2008;3:352-63.
[8] Mantovani A, Sica A, Locati M. Macrophage polarizationcomes of age. Immunity 2005;23:344-6.
[9] Martinez FO, Sica A, Mantovani A, Locati M. Macrophageactivation and polarization. Front Biosci 2008;13:453-61.
[10] Mosser DM, Edwards JP. Exploring the full spectrum ofmacrophage activation. Nat Rev Immunol 2008;8:958-69.
[11] Murray PJ, Wynn TA. Protective and pathogenic functions ofmacrophage subsets. Nat Rev Immunol 2011;11:723-37.
[12] Benoit M, Desnues B, Mege JL. Macrophage polarization inbacterial infections. J Immunol 2008;181:3733-9.
[13] Biswas SK, Sica A, Lewis CE. Plasticity of macrophagefunction during tumor progression: regulation by distinctmolecular mechanisms. J Immunol 2008;180:2011-7.
[14] Cassetta L, Cassol E, Poli G. Macrophage polarization inhealth and disease. Sci World J 2011;11:2391-402.
[15] Gordon S. Alternative activation of macrophages. Nat RevImmunol 2003;3:23-35.
[16] Mantovani A, Sica A, Sozzani S, Allavena P, Vecchi A, LocatiM. The chemokine system in diverse forms of macrophageactivation and polarization. Trends Immunol 2004;25:677-86.
[17] Slomianny M-C, Dupont A, Bouanou F, Beseme O, Guihot AL,Amouyel P, et al. Profiling of membrane proteins from humanmacrophages: comparison of two approaches. Proteomics2006;6:2365-75.
[18] Brown J, Wallet MA, Krastins B, Sarracino D, Goodenow MM.Proteome bioprofiles distinguish between M1 priming andactivation states in human macrophages. J Leukoc Biol2010;87:655-62.
[19] Kraft-Terry SD, Gendelman HE. Proteomic biosignatures formonocyte-macrophage differentiation. Cell Immunol2011;271:239-55.
[20] Drancourt M, Roux V, Fournier PE, Raoult D. rpoB genesequence-based identification of aerobic Gram-positive cocciof the genera Streptococcus, Enterococcus, Gemella, Abiotrophia,and Granulicatella. J Clin Microbiol 2004;42:497-504.
[21] Delaby A, Gorvel L, Espinosa L, Lépolard C, Raoult D, Ghigo E,et al. Defective monocyte dynamics in q Fever granulomadeficiency. J Infect Dis 2012;205:1086-94.
[22] Tantibhedhyangkul W, Prachason T, Waywa D, El Filali A,Ghigo E, Thongnoppakhun W, et al. Orientia tsutsugamushi
stimulates an original gene expression program inmonocytes:relationship with gene expression in patients with scrubtyphus. PLoS Negl Trop Dis 2011;5:e1028.
[23] Ghigo E, Imbert G, Capo C, Raoult D, Mege JL. Interleukin-4induces Coxiella burnetii replication in human monocytes butnot in macrophages. Ann N Y Acad Sci 2003;990:450-9.
[24] Ryan CG, Clayton E, Griffin W, Sie S, Cousens D. SNIP, astatistics-sensitive background treatment for the quantitativeanalysis of PIXE spectra in geoscience applications. Nucl InstMethods Phys Res B 1988;34:396-402.
[25] Biswas SK,Mantovani A.Macrophage plasticity and interactionwith lymphocyte subsets: cancer as a paradigm. Nat Immunol2010;11:889-96.
[26] Feng H, Sim LC, Wan C, Wong NSC, Yang Y. Rapidcharacterization of protein productivity and productionstability of CHO cells by matrix-assisted laserdesorption/ionization time-of-flight mass spectrometry.Rapid Commun Mass Spectrom 2011;25:1407-12.
[27] Marvin-Guy LF, Duncan P, Wagnière S, Antille N, Porta N,Affolter M, et al. Rapid identification of differentiationmarkers from whole epithelial cells by matrix-assisted laserdesorption/ionisation time-of-flight mass spectrometry andstatistical analysis. Rapid Commun Mass Spectrom 2008;22:1099-108.
[28] Gifford GE, Lohmann-Matthes ML. Gamma interferon primingof mouse and human macrophages for induction of tumornecrosis factor production by bacterial lipopolysaccharide.J Natl Cancer Inst 1987;78:121-4.
[29] Yu SF, Koerner TJ, Adams DO. Gene regulation inmacrophageactivation: differential regulation of genes encoding fortumor necrosis factor, interleukin-1, JE, and KC byinterferon-gamma and lipopolysaccharide. J Leukoc Biol1990;48:412-9.
[30] Mantovani A, Sozzani S, Locati M, Allavena P, Sica A.Macrophage polarization: tumor-associated macrophages asa paradigm for polarized M2 mononuclear phagocytes.Trends Immunol 2002;23:549-55.
[31] Mège J-L, Mehraj V, Capo C. Macrophage polarization andbacterial infections. Curr Opin Infect Dis 2011;24:230-4.
[32] Nau GJ, Richmond JFL, Schlesinger A, Jennings EG, Lander ES,Young RA. Human macrophage activation programs inducedby bacterial pathogens. Proc Natl Acad Sci USA 2002;99:1503-8.
[33] Akira S, Uematsu S, Takeuchi O. Pathogen recognition andinnate immunity. Cell 2006;124:783-801.
[34] Jenner RG, Young RA. Insights into host responses againstpathogens from transcriptional profiling. Nat Rev Microbiol2005;3:281-94.
[35] Frodermann V, Chau TA, Sayedyahossein S, Toth JM,Heinrichs DE, Madrenas J. A modulatory interleukin-10response to staphylococcal peptidoglycan prevents Th1/Th17adaptive immunity to Staphylococcus aureus. J Infect Dis2011;204:253-62.
[36] Fong CHY, Bebien M, Didierlaurent A, Nebauer R, Hussell T,Broide D, et al. An antiinflammatory role for IKKbeta throughthe inhibition of “classical”macrophage activation. J Exp Med2008;205:1269-76.
[37] Rajaram MVS, Brooks MN, Morris JD, Torrelles JB, Azad AK,Schlesinger LS. Mycobacterium tuberculosis activates humanmacrophage peroxisome proliferator-activated receptorgamma linking mannose receptor recognition to regulationof immune responses. J Immunol 2010;185:929-42.
5532 J O U R N A L O F P R O T E O M I C S 7 5 ( 2 0 1 2 ) 5 5 2 3 – 5 5 3 2
49
Whole-cell MALDI-TOF mass spectrometry: a tool for immune
cell analysis and characterization
Ouedraogo R, Textoris J, Daumas A, Capo C, Mege JL.
Methods Mol Biol. 2013;1061:197-209.
doi: 10.1007/978-1-62703-589-7_12.
Analysis and Characterization of Immune Cells and Their
Activation Status by Whole-Cell MALDI-TOF Mass
Spectrometry
Ouedraogo R, Textoris J, Gorvel L, Daumas A, Capo C, Mege JL.
Methods Mol Biol. 2019;2024:339-351.
Le protocole expérimental d’analyse des cellules eucaryotes et d’exploration de l’activation des
macrophages en spectrométrie de masse MALDI-TOF a été publié. Une mise à jour du chapitre
vient d’être publiée. Seule cette dernière version est présentée ci-dessous.
Certains résultats de la première publication de l’équipe [20] et de l’étude ci-dessous [Article
1] sont repris dans ces publications à visée didactique mais il est aussi fait mention de l’analyse
détaillée des spectres à l’aide du logiciel R permettant de s’affranchir du logiciel associé au
spectromètre de masse adapté à la microbiologie.
197
Kelly M. Fulton and Susan M. Twine (eds.), Immunoproteomics: Methods and Protocols, Methods in Molecular Biology, vol. 1061,DOI 10.1007/978-1-62703-589-7_12, © Springer Science+Business Media, LLC 2013
Chapter 12
Whole-Cell MALDI-TOF Mass Spectrometry: A Tool for Immune Cell Analysis and Characterization
Richard Ouedraogo , Julien Textoris , Aurélie Daumas , Christian Capo , and Jean-Louis Mege
Abstract
Matrix-assisted laser desorption/ionization time-of-fl ight mass spectrometry (MALDI-TOF MS) is widely used in proteomics. It has been recently demonstrated that MALDI-TOF MS can be used to identify and classify numerous bacterial species or subspecies. We applied MALDI-TOF MS directly to intact mamma-lian cells, and we found that this method is valuable to identify human circulating cells and cells involved in the immune response including macrophages. As macrophages are characterized by a high degree of plasticity in response to their microenvironment, we stimulated human macrophages with cytokines, bac-terial products, and a variety of bacteria. We found that MALDI-TOF MS discriminated unstimulated and stimulated macrophages, and also detected multifaceted activation of macrophages. We conclude that whole-cell MALDI-TOF MS is an accurate method to identify various cell types and to detect subtle modi-fi cations in cell activity.
Key words Mass spectrometry , Matrix-assisted laser desorption/ionization time-of-fl ight , Intact cell , Macrophage , Cell activation
1 Introduction
Matrix-assisted laser desorption/ionization time-of-fl ight mass spectrometry (MALDI-TOF MS) is a powerful tool for the analy-sis of ionized molecules (i.e., proteins) by measuring their mass/charge ( m / z ) ratio. This technique is currently used in biochemis-try to identify peptides, proteins, posttranslational modifi cations of proteins [ 1 , 2 ], and nucleic acids [ 2 , 3 ]. Typically, in cell biology, using MALDI-TOF MS to analyze cellular protein composition requires a critical cell lysis step, as well as a variety of fractionation and separation steps, including affi nity separation methods, gel electrophoresis, chromatographic separations [ 4 ]. Combined with gel electrophoresis, MALDI-TOF MS allows for the study of the proteome [ 5 ] and the identifi cation of a large number of proteins
198
in the proteome, the secretome, and membranes from activated macrophages [ 6 ]. Seemingly, MALDI-TOF MS can identify M1 responses of macrophages, such as the response to interferon (IFN)-γ and lipopolysaccharide (LPS) [ 5 ]. Using pulse stable isotope labeling of amino acids in cell culture, Kraft-Terry et al. identifi ed a bioprofi le in macrophage colony-stimulating factor -differentiated monocytes that is consistent with an M2 profi le [ 6 ]. However, these approaches based on cell component separation require large sample quantities and cannot be used to analyze clini-cal specimens. Various attempts have been made to study single mammalian cells by MALDI-TOF MS, but, to date, these methods have been proven fastidious, and the biological information extracted is limited [ 7 ].
New applications of the MALDI-TOF MS method have been introduced recently in bacteriology laboratories. The fi ngerprints of intact bacteria allow rapid identifi cation and taxonomic classifi -cation of numerous bacterial species and subspecies [ 8 – 10 ]. Using databases established from isolated bacterial species, the identifi ca-tion of many bacterial species in clinical samples [ 11 ] is fast, easy to perform, and inexpensive.
The MALDI-TOF MS procedure for the identifi cation of bac-terial species was expanded to three mammalian cell lines in 2006 [ 4 ]. More recently, 66 cell lines, representing 34 species from insects to primates, have been identifi ed by MALDI-TOF MS [ 12 ]; but this method involves ethanol inactivation and formic acid–acetonitrile extraction. We applied MALDI-TOF MS directly to intact cells, and found this method highly valuable to the identifi cation of human circulating cells, and cells involved in the immune response, including macrophages [ 13 ]. In addition, mac-rophages have a high degree of plasticity, and adapt quickly in response to their microenvironment. They sense microorganisms through receptors that bind conserved and ubiquitous microbial motifs, such as LPS. Macrophages stimulated with type I cytokines, i.e., IFN-γ, Tumor Necrosis Factor (TNF), or bacterial products, i.e., LPS, adopt an M1 macrophage phenotype which is infl amma-tory, tumoricidal, and microbicidal. Macrophages stimulated with interleukin (IL)-4 or IL-10, adopt an M2 macrophage phenotype, which regulates infl ammatory and immune responses, and is only weakly tumoricidal and microbicidal [ 14 ]. Hence, macrophages constitute a model of choice to assess the accuracy of whole-cell MALDI-TOF MS to detect subtle modifi cations in cell activity [ 15 ].
We describe here the effective use of MALDI-TOF MS to identify many intact eukaryotic cell populations by creating a data-base of known samples. The experimental protocol, bioinformatics analysis of whole-cell MALDI-TOF MS spectra, and the compari-son of unknown samples to the database allow the identifi cation of various cell types within heterogeneous samples [ 13 ] or multifaceted activation of macrophages [ 15 ].
Richard Ouedraogo et al.
199
2 Materials
The different cell types or stimulated cells were prepared separately to establish databases. Experiments with mixed cell types (circulat-ing cells) are indicated. Prepare sterile solutions for cell isolation and culture. Prepare and store all reagents at 4 °C. Prepare MALDI-TOF matrix just before use.
1. Isolate peripheral blood mononuclear cells (PBMCs) from leu-kopacks (or blood donors) by Ficoll gradient (MSL, Eurobio), as previously described [ 16 ].
2. Prepare CD14 + monocytes using CD14 MicroBeads and the MACS separation system (Miltenyi Biotec), according to the manufacturer’s protocol.
3. Prepare T CD3 + lymphocytes using CD3 MicroBeads and the MACS separation system (Miltenyi Biotec), according to the manufacturer’s protocol.
4. Obtain monocyte-derived macrophages (MDMs) by incubating monocytes (10 6 cells in 6-well plates) in 3 mL of RPMI 1640 containing 20 mM HEPES, 10 % human serum AB + , 2 mM L -glu-tamine, 100 IU/mL penicillin, and 100 μg/mL streptomycin for 4 days. Replace human serum with fetal calf serum (FCS) for 3 additional days. The obtained cell population was identifi ed as macrophages (more than 95 %) by acquisition of membrane CD68 expression and CD14 down-modulation.
5. Obtain dendritic cells (DCs) by incubating monocytes with 1,000 U/mL human recombinant granulocyte macrophage- colony stimulating factor (GM-CSF) and 500 U/mL of human recombinant IL-4 in RPMI 1640 containing 10 % FCS, 2 mM L -glutamine, 100 IU/mL penicillin, and 50 μg/mL strepto-mycin for 7 days. Change the medium every 3 days and add again 1,000 U/mL GM-CSF and 500 U/mL IL-4. The obtained cells expressed high levels of CD11c and CD1a, and low levels of CD14 and CD68.
6. Obtain polymorphonuclear cells (PMNs) after Ficoll centrifu-gation, by sedimentation of red blood cells (RBCs) within dex-tran T500 (1.5 % (w/v), Pharmacosmos) ( see Note 1 ).
7. Obtain red blood cells (RBCs) by 1/1,000 dilution of blood in Phosphate-buffered saline (PBS).
The preparation of several cell populations including mammalian primary cells and cell lines, one Xenopus laevis cell line (XTC-2 cells), and four types of amoebae ( Acanthamoeba polyphaga , Acanthamoeba castellanii , Hartmannella vermiformis , Poteriochromonas melhamensis ) is described in ref. 13 .
2.1 Human
Circulating Cells
2.2 Noncir-
culating Cells
Whole-Cell MALDI TOF Mass Spectrometry
200
1. Stimulate MDMs with 20 ng/mL of human recombinant IFN-γ, IL-4, IL-10, or TNF (purchased from R&D Systems or other suppliers) for different time points. Also stimulate MDMs with 1 μg/mL LPS from Escherichia coli or heat-killed bacteria (50 bacteria per cell) including Mycobacterium tuberculosis , Mycobacterium bovis , Mycobacterium avium , Rickettsia prowa-zekii , and Orientia tsutsugamushi ( see Note 2 )
2. M. tuberculosis (CIP H37Rv strain 103471), M. bovis (Bacillus Calmette-Guérin, BCG CIP strain 671203), and a clinical isolate of M. avium subsp. hominissuis were obtained from the Laboratory of Microbiology of the Hospital La Timone (Marseille) [ 17 ].
3. R. prowazekii strain Breinl (ATCC VR-142), the agent of epi-demic typhus [ 18 ], and O. tsutsugamushi s train Kato (CSUR R163) [ 19 ], the agent of scrub typhus, were propagated in L929 cells ( see Note 3 ).
4. Heat-killed bacteria were obtained after heating microorganisms at 95 °C for 1 h.
1. The matrix solution consists of a 10 mg/mL solution of acid-α-cyano-4-hydroxy cinnamic (HCCA) diluted in 500 μL ace-tonitrile, 250 μL Milli-Q grade water, and 250 μL trifl uoroacetic acid at 10 %. Mix and sonicate for at least 20 min. Centrifuge at 13,000 × g for 5 min. Discard the pellet and keep the superna-tant. The matrix solution is ready for use ( see Note 4 ).
2. AutoFlex II mass spectrometer (Bruker Daltonics).
3. Bruker MSP 384 software polished steel target (Bruker Daltonics).
4. FlexControl 3.0 software (Bruker Daltonics).
5. FlexAnalysis 3.3 software (Bruker Daltonics).
6. Biotyper 3.0 software (Bruker Daltonics).
7. ClinProTools 2.2 software (Bruker Daltonics).
3 Methods
1. Moisten the Bruker MSP 384 polished steel target with hot tap water. Rub with KIMTECH paper. Rub with 70 % ethanol. Rinse with hot tap water by rubbing with KIMTECH paper. Rub fi nally with 70 % ethanol.
2. Immerse the target in 70 % ethanol and sonicate for at least 15 min.
3. Cover the target with 500 μL to 1 mL of trifl uoroacetic acid. Rub with KIMTECH paper. Rinse with high performance liquid chromatography (HPLC) grade water without rubbing. Dry the target at room temperature ( see Note 5 ).
2.3 Macrophage
Stimulation
2.4 Reagents and
Materials for MALDI-
TOF MS
3.1 MALDI-TOF
Target Preparation
Richard Ouedraogo et al.
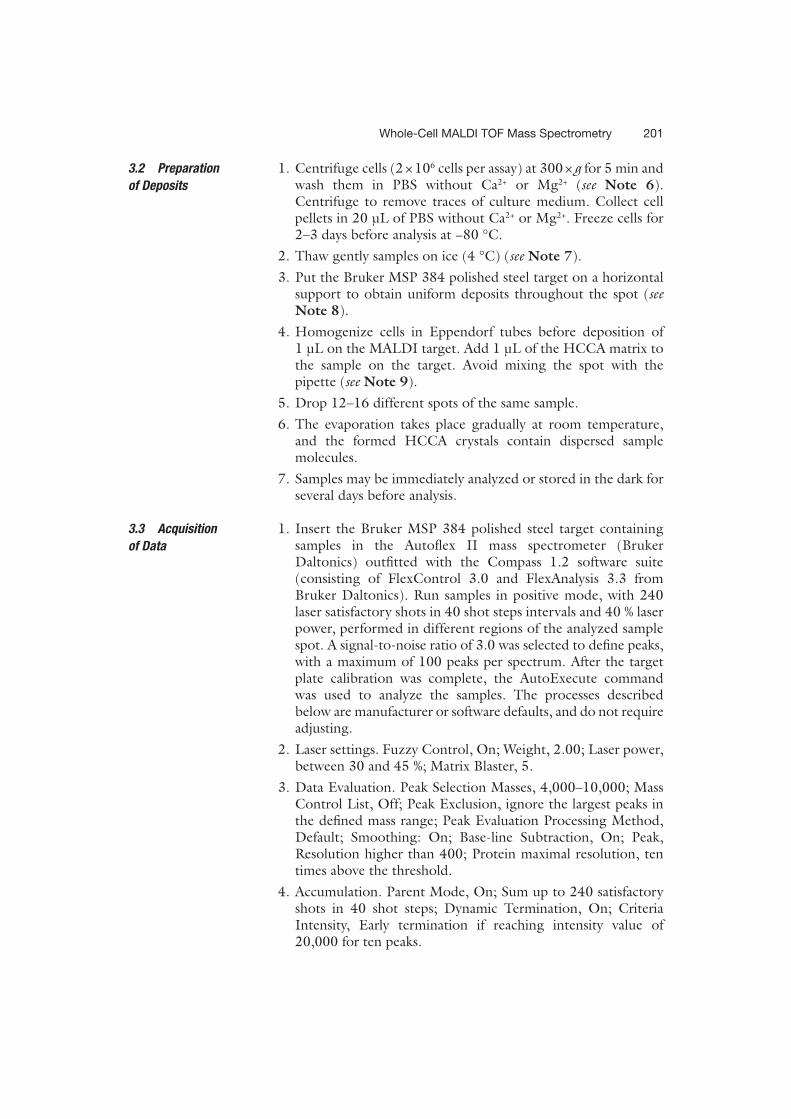
201
1. Centrifuge cells (2 × 10 6 cells per assay) at 300 × g for 5 min and wash them in PBS without Ca 2+ or Mg 2+ ( see Note 6 ). Centrifuge to remove traces of culture medium. Collect cell pellets in 20 μL of PBS without Ca 2+ or Mg 2+ . Freeze cells for 2–3 days before analysis at −80 °C.
2. Thaw gently samples on ice (4 °C) ( see Note 7 ).
3. Put the Bruker MSP 384 polished steel target on a horizontal support to obtain uniform deposits throughout the spot ( see Note 8 ).
4. Homogenize cells in Eppendorf tubes before deposition of 1 μL on the MALDI target. Add 1 μL of the HCCA matrix to the sample on the target. Avoid mixing the spot with the pipette ( see Note 9 ).
5. Drop 12–16 different spots of the same sample.
6. The evaporation takes place gradually at room temperature, and the formed HCCA crystals contain dispersed sample molecules.
7. Samples may be immediately analyzed or stored in the dark for several days before analysis.
1. Insert the Bruker MSP 384 polished steel target containing samples in the Autofl ex II mass spectrometer (Bruker Daltonics) outfi tted with the Compass 1.2 software suite (consisting of FlexControl 3.0 and FlexAnalysis 3.3 from Bruker Daltonics). Run samples in positive mode, with 240 laser satisfactory shots in 40 shot steps intervals and 40 % laser power, performed in different regions of the analyzed sample spot. A signal-to-noise ratio of 3.0 was selected to defi ne peaks, with a maximum of 100 peaks per spectrum. After the target plate calibration was complete, the AutoExecute command was used to analyze the samples. The processes described below are manufacturer or software defaults, and do not require adjusting.
2. Laser settings. Fuzzy Control, On; Weight, 2.00; Laser power, between 30 and 45 %; Matrix Blaster, 5.
3. Data Evaluation. Peak Selection Masses, 4,000–10,000; Mass Control List, Off; Peak Exclusion, ignore the largest peaks in the defi ned mass range; Peak Evaluation Processing Method, Default; Smoothing: On; Base-line Subtraction, On; Peak, Resolution higher than 400; Protein maximal resolution, ten times above the threshold.
4. Accumulation. Parent Mode, On; Sum up to 240 satisfactory shots in 40 shot steps; Dynamic Termination, On; Criteria Intensity, Early termination if reaching intensity value of 20,000 for ten peaks.
3.2 Preparation
of Deposits
3.3 Acquisition
of Data
Whole-Cell MALDI TOF Mass Spectrometry
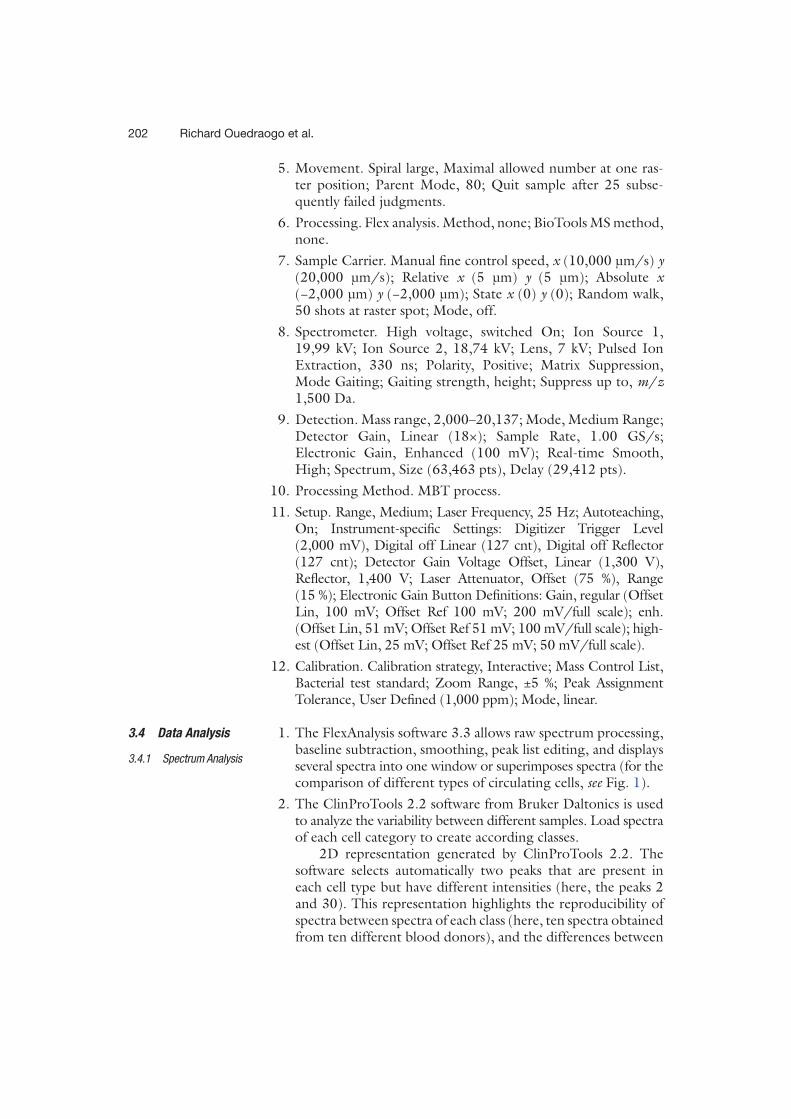
202
5. Movement. Spiral large, Maximal allowed number at one ras-ter position; Parent Mode, 80; Quit sample after 25 subse-quently failed judgments.
6. Processing. Flex analysis. Method, none; BioTools MS method, none.
7. Sample Carrier. Manual fi ne control speed, x (10,000 μm/s) y (20,000 μm/s); Relative x (5 μm) y (5 μm); Absolute x (−2,000 μm) y (−2,000 μm); State x (0) y (0); Random walk, 50 shots at raster spot; Mode, off.
8. Spectrometer. High voltage, switched On; Ion Source 1, 19,99 kV; Ion Source 2, 18,74 kV; Lens, 7 kV; Pulsed Ion Extraction, 330 ns; Polarity, Positive; Matrix Suppression, Mode Gaiting; Gaiting strength, height; Suppress up to, m / z 1,500 Da.
9. Detection. Mass range, 2,000–20,137; Mode, Medium Range; Detector Gain, Linear (18×); Sample Rate, 1.00 GS/s; Electronic Gain, Enhanced (100 mV); Real-time Smooth, High; Spectrum, Size (63,463 pts), Delay (29,412 pts).
10. Processing Method. MBT process.
11. Setup. Range, Medium; Laser Frequency, 25 Hz; Autoteaching, On; Instrument-specifi c Settings: Digitizer Trigger Level (2,000 mV), Digital off Linear (127 cnt), Digital off Refl ector (127 cnt); Detector Gain Voltage Offset, Linear (1,300 V), Refl ector, 1,400 V; Laser Attenuator, Offset (75 %), Range (15 %); Electronic Gain Button Defi nitions: Gain, regular (Offset Lin, 100 mV; Offset Ref 100 mV; 200 mV/full scale); enh. (Offset Lin, 51 mV; Offset Ref 51 mV; 100 mV/full scale); high-est (Offset Lin, 25 mV; Offset Ref 25 mV; 50 mV/full scale).
12. Calibration. Calibration strategy, Interactive; Mass Control List, Bacterial test standard; Zoom Range, ±5 %; Peak Assignment Tolerance, User Defi ned (1,000 ppm); Mode, linear.
1. The FlexAnalysis software 3.3 allows raw spectrum processing, baseline subtraction, smoothing, peak list editing, and displays several spectra into one window or superimposes spectra (for the comparison of different types of circulating cells, see Fig. 1 ).
2. The ClinProTools 2.2 software from Bruker Daltonics is used to analyze the variability between different samples. Load spectra of each cell category to create according classes.
2D representation generated by ClinProTools 2.2. The software selects automatically two peaks that are present in each cell type but have different intensities (here, the peaks 2 and 30). This representation highlights the reproducibility of spectra between spectra of each class (here, ten spectra obtained from ten different blood donors), and the differences between
3.4 Data Analysis
3.4.1 Spectrum Analysis
Richard Ouedraogo et al.
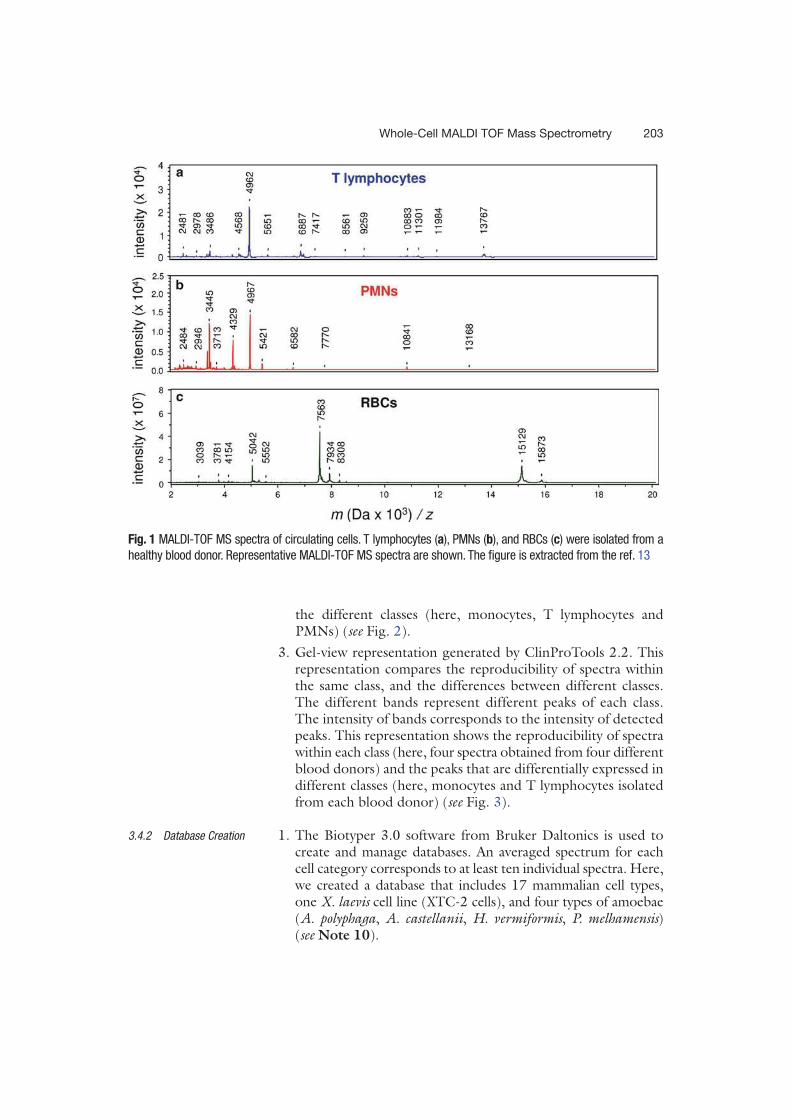
203
the different classes (here, monocytes, T lymphocytes and PMNs) ( see Fig. 2 ).
3. Gel-view representation generated by ClinProTools 2.2. This representation compares the reproducibility of spectra within the same class, and the differences between different classes. The different bands represent different peaks of each class. The intensity of bands corresponds to the intensity of detected peaks. This representation shows the reproducibility of spectra within each class (here, four spectra obtained from four different blood donors) and the peaks that are differentially expressed in different classes (here, monocytes and T lymphocytes isolated from each blood donor) ( see Fig. 3 ).
1. The Biotyper 3.0 software from Bruker Daltonics is used to create and manage databases. An averaged spectrum for each cell category corresponds to at least ten individual spectra. Here, we created a database that includes 17 mammalian cell types, one X. laevis cell line (XTC-2 cells), and four types of amoebae ( A. polyphaga , A. castellanii , H. vermiformis , P. melhamensis ) ( see Note 10 ).
3.4.2 Database Creation
Fig. 1 MALDI-TOF MS spectra of circulating cells. T lymphocytes ( a ), PMNs ( b ), and RBCs ( c ) were isolated from a
healthy blood donor. Representative MALDI-TOF MS spectra are shown. The fi gure is extracted from the ref. 13
Whole-Cell MALDI TOF Mass Spectrometry
204
2. Baselines are automatically subtracted from spectra, and the background noise smoothed. An average spectrum is automat-ically created using default Biotyper method settings provided by the manufacturer. The sensitivity (the maximum tolerated
Fig. 2 Reproducibility of MALDI-TOF MS signatures. Monocytes, T lymphocytes, and PMNs were isolated from
ten healthy blood donors. MALDI-TOF MS spectra were analyzed using 2D Peak Distribution View. The relative
intensities of the two peaks automatically selected were homogenous among blood donors, and the ellipses
represent the standard deviation within each cell population (monocytes, T lymphocytes, and PMNs, respec-
tively). See ref. 13
Fig. 3 Gel view representation of monocytes and T lymphocytes. Circulating cells were isolated from four dif-
ferent healthy blood donors. MALDI-TOF MS spectra are presented in Gel View representation. Spectra are
shown with m / z values on the x -axis and the peak intensity (in arbitrary units) is coded with the grey scale
presented on the right . Major differences between monocytes and T lymphocytes are indicated by arrowheads .
See ref. 13
Richard Ouedraogo et al.
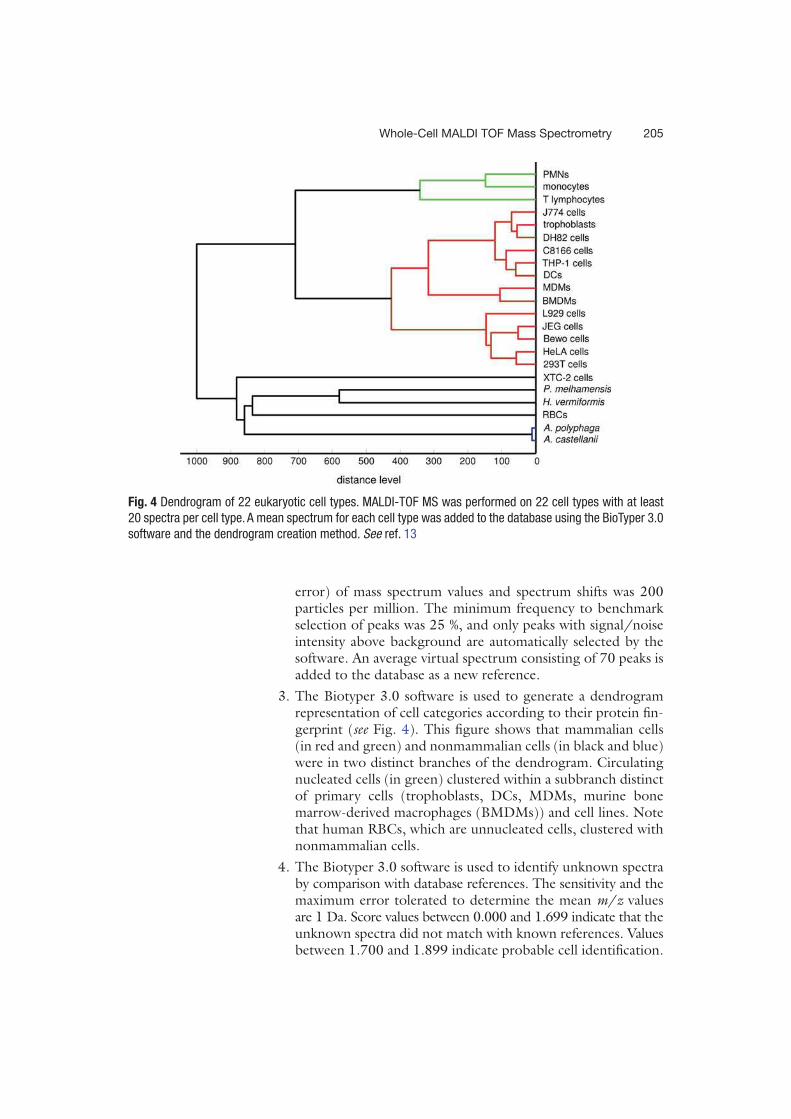
205
error) of mass spectrum values and spectrum shifts was 200 particles per million. The minimum frequency to benchmark selection of peaks was 25 %, and only peaks with signal/noise intensity above background are automatically selected by the software. An average virtual spectrum consisting of 70 peaks is added to the database as a new reference.
3. The Biotyper 3.0 software is used to generate a dendrogram representation of cell categories according to their protein fi n-gerprint ( see Fig. 4 ). This fi gure shows that mammalian cells (in red and green) and nonmammalian cells (in black and blue) were in two distinct branches of the dendrogram. Circulating nucleated cells (in green) clustered within a subbranch distinct of primary cells (trophoblasts, DCs, MDMs, murine bone marrow- derived macrophages (BMDMs)) and cell lines. Note that human RBCs, which are unnucleated cells, clustered with nonmammalian cells.
4. The Biotyper 3.0 software is used to identify unknown spectra by comparison with database references. The sensitivity and the maximum error tolerated to determine the mean m / z values are 1 Da. Score values between 0.000 and 1.699 indicate that the unknown spectra did not match with known references. Values between 1.700 and 1.899 indicate probable cell identifi cation.
Fig. 4 Dendrogram of 22 eukaryotic cell types. MALDI-TOF MS was performed on 22 cell types with at least
20 spectra per cell type. A mean spectrum for each cell type was added to the database using the BioTyper 3.0
software and the dendrogram creation method. See ref. 13
Whole-Cell MALDI TOF Mass Spectrometry
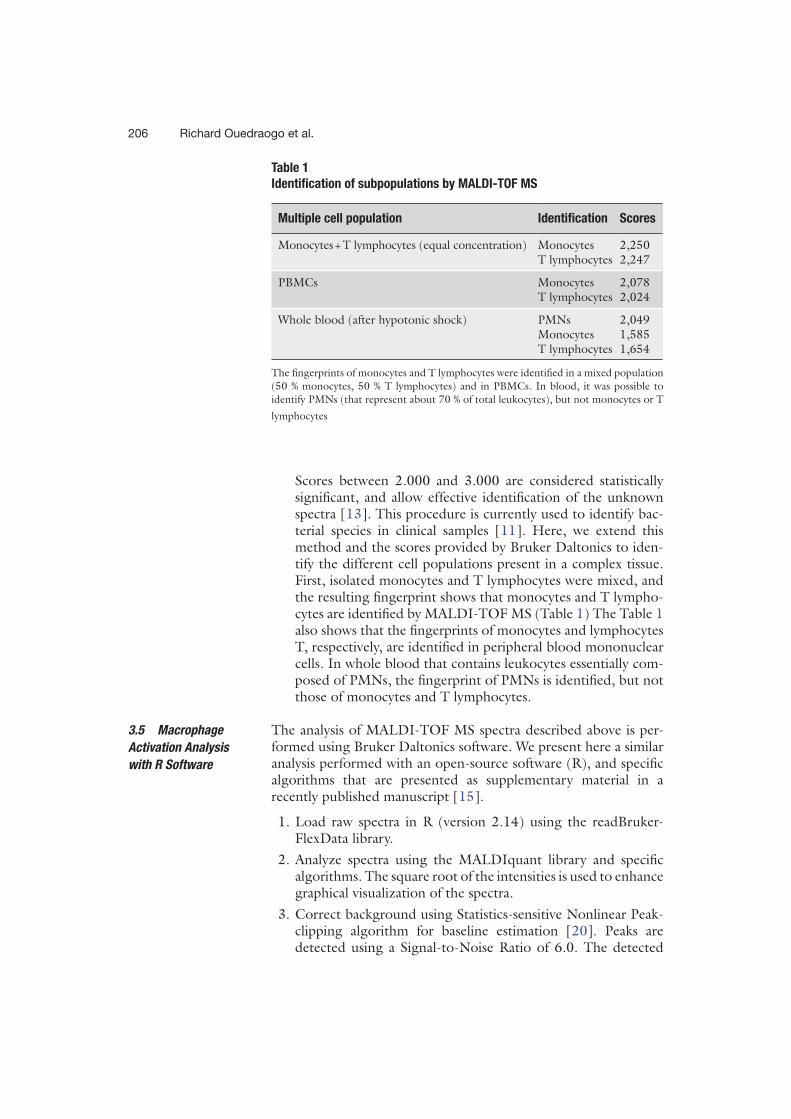
206
Scores between 2.000 and 3.000 are considered statistically signifi cant, and allow effective identifi cation of the unknown spectra [ 13 ]. This procedure is currently used to identify bac-terial species in clinical samples [ 11 ]. Here, we extend this method and the scores provided by Bruker Daltonics to iden-tify the different cell populations present in a complex tissue. First, isolated monocytes and T lymphocytes were mixed, and the resulting fi ngerprint shows that monocytes and T lympho-cytes are identifi ed by MALDI-TOF MS (Table 1 ) The Table 1 also shows that the fi ngerprints of monocytes and lymphocytes T, respectively, are identifi ed in peripheral blood mononuclear cells. In whole blood that contains leukocytes essentially com-posed of PMNs, the fi ngerprint of PMNs is identifi ed, but not those of monocytes and T lymphocytes.
The analysis of MALDI-TOF MS spectra described above is per-formed using Bruker Daltonics software. We present here a similar analysis performed with an open-source software (R), and specifi c algorithms that are presented as supplementary material in a recently published manuscript [ 15 ].
1. Load raw spectra in R (version 2.14) using the readBruker-FlexData library.
2. Analyze spectra using the MALDIquant library and specifi c algorithms. The square root of the intensities is used to enhance graphical visualization of the spectra.
3. Correct background using Statistics-sensitive Nonlinear Peak- clipping algorithm for baseline estimation [ 20 ]. Peaks are detected using a Signal-to-Noise Ratio of 6.0. The detected
3.5 Macrophage
Activation Analysis
with R Software
Table 1
Identifi cation of subpopulations by MALDI-TOF MS
Multiple cell population Identifi cation Scores
Monocytes + T lymphocytes (equal concentration) Monocytes 2,250 T lymphocytes 2,247
PBMCs Monocytes 2,078 T lymphocytes 2,024
Whole blood (after hypotonic shock) PMNs 2,049 Monocytes 1,585 T lymphocytes 1,654
The fi ngerprints of monocytes and T lymphocytes were identifi ed in a mixed population
(50 % monocytes, 50 % T lymphocytes) and in PBMCs. In blood, it was possible to
identify PMNs (that represent about 70 % of total leukocytes), but not monocytes or T
lymphocytes
Richard Ouedraogo et al.
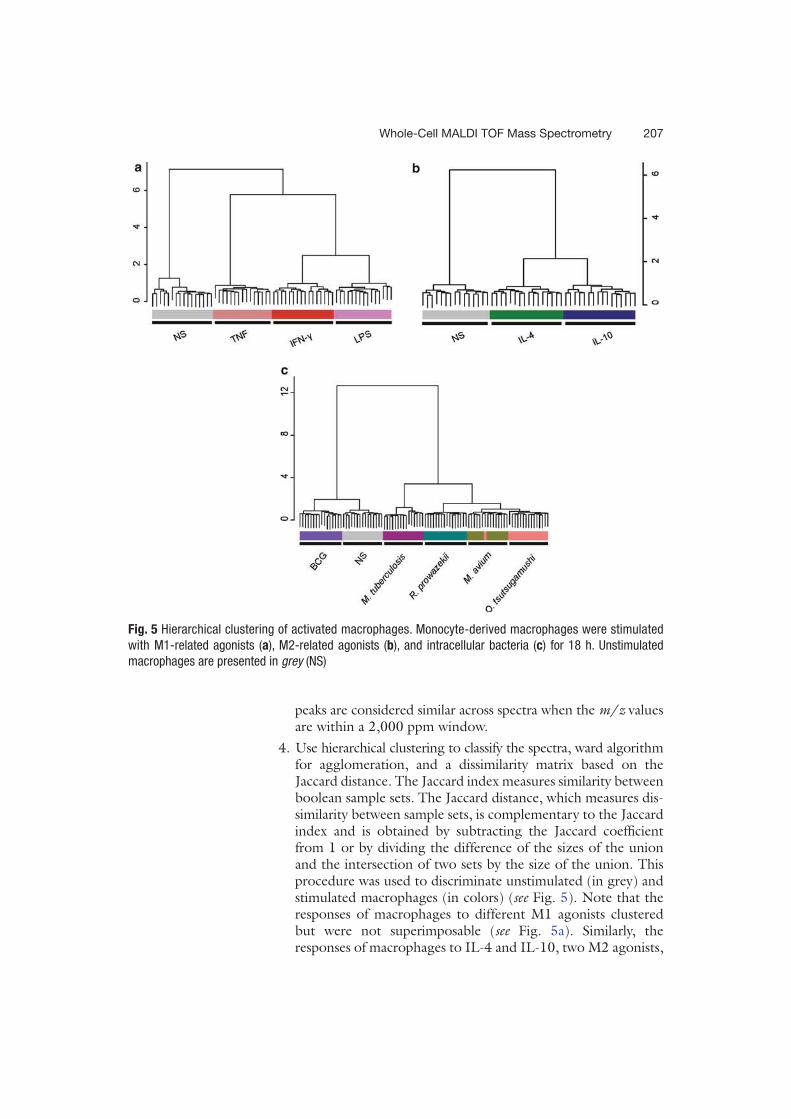
207
peaks are considered similar across spectra when the m / z values are within a 2,000 ppm window.
4. Use hierarchical clustering to classify the spectra, ward algorithm for agglomeration, and a dissimilarity matrix based on the Jaccard distance. The Jaccard index measures similarity between boolean sample sets. The Jaccard distance, which measures dis-similarity between sample sets, is complementary to the Jaccard index and is obtained by subtracting the Jaccard coeffi cient from 1 or by dividing the difference of the sizes of the union and the intersection of two sets by the size of the union. This procedure was used to discriminate unstimulated (in grey) and stimulated macrophages (in colors) ( see Fig. 5 ). Note that the responses of macrophages to different M1 agonists clustered but were not superimposable ( see Fig. 5a ). Similarly, the responses of macrophages to IL-4 and IL-10, two M2 agonists,
Fig. 5 Hierarchical clustering of activated macrophages. Monocyte-derived macrophages were stimulated
with M1-related agonists ( a ), M2-related agonists ( b ), and intracellular bacteria ( c ) for 18 h. Unstimulated
macrophages are presented in grey (NS)
Whole-Cell MALDI TOF Mass Spectrometry
208
clustered compared to unstimulated macrophages but were distinct ( see Fig. 5b ). Different intracellular bacteria induced specifi c signatures ( see Fig. 5c ). Taken together, these results show that MALDI-TOF MS detected the multifaceted activation of macrophages.
4 Notes
1. PMNs must be isolated from remaining RBCs after dextran T500 sedimentation. Lyse RBCs by a 30 s hypotonic shock to obtain pure PMNs. In the absence of lysis, RBC signals were detected in MALDI-TOF MS and masked the detection of PMNs.
2. The stimulation of human MDMs is usually performed in RPMI 1640 supplemented with 10 % FCS, 100 UI/mL peni-cillin and 50 μg/mL streptomycin.
3. Wash bacteria with PBS to remove the components contained in growth media (such as serum proteins) that may interfere with MALDI-TOF MS spectra.
4. A matrix solution containing crystals does not allow a good ionization of sample molecules, and may affect the quality of spectra.
5. A target improperly cleaned may bias the results. It is therefore very important to take the time to carefully clean targets.
6. Cells may agglutinate in the presence of Ca 2+ and Mg 2+ . In addition, salts may interfere with MALDI-TOF MS.
7. Rapid and vigorous thawing alters samples, thus affecting the MALDI-TOF MS analysis.
8. Homogeneous deposits are necessary to obtain reproducible and high-quality spectra.
9. Mixing spots with pipettes alters spectrum quality. It is there-fore important to respect the proportions and indicated details.
10. Each laboratory needs to construct its own databases before comparing cell populations and looking at unknown samples. We may export our databases to other laboratories.
Acknowledgments
We thank Nicolas Armstrong, Carine Couderc, Philippe Decloquement, and Christophe Flaudrops for their technical assistance.
Richard Ouedraogo et al.
209
References
1. Johnson RP, El-Yazbi AF, Hughes MF, Schriemer DC, Walsh EJ, Walsh MP et al (2009) Identifi cation and functional character-ization of protein kinase A-catalyzed phos-phorylation of potassium channel Kv1.2 at serine 449. J Biol Chem 284:16562–16574
2. Li X, Cowles EA, Cowles RS, Gaugler R, Cox- Foster DL (2009) Characterization of immu-nosuppressive surface coat proteins from Steinernema glaseri that selectively kill blood cells in susceptible hosts. Mol Biochem Parasitol 165:162–169
3. Mellmann A, Cloud J, Maier T, Keckevoet U, Ramminger I, Iwen P et al (2008) Evaluation of matrix-assisted laser desorption ionization-time- of-fl ight mass spectrometry in compari-son to 16S rRNA gene sequencing for species identifi cation of nonfermenting bacteria. J Clin Microbiol 46:1946–1954
4. Zhang X, Scalf M, Berggren TW, Westphall MS, Smith LM (2006) Identifi cation of mam-malian cell lines using MALDI-TOF and LC-ESI-MS/MS mass spectrometry. J Am Soc Mass Spectrom 17:490–499
5. Brown J, Wallet MA, Krastins B, Sarracino D, Goodenow MM (2010) Proteome bioprofi les distinguish between M1 priming and activation states in human macrophages. J Leukoc Biol 87:655–662
6. Kraft-Terry SD, Gendelman HE (2011) Proteomic biosignatures for monocyte- macrophage differentiation. Cell Immunol 271:239–255
7. Rubakhin SS, Churchill JD, Greenough WT, Sweedler JV (2006) Profi ling signaling pep-tides in single mammalian cells using mass spectrometry. Anal Chem 78:7267–7272
8. Sauer S, Freiwald A, Maier T, Kube M, Reinhardt R, Kostrzewa M et al (2008) Classifi cation and identifi cation of bacteria by mass spectrometry and computational analysis. PLoS One 3:e2843
9. Dieckmann R, Helmuth R, Erhard M, Malorny B (2008) Rapid classifi cation and identifi cation of salmonellae at the species and subspecies levels by whole-cell matrix-assisted laser desorption ionization-time of fl ight mass spectrometry. Appl Environ Microbiol 74:7767–7778
10. Lay JO Jr, Holland RD (2000) Rapid identifi -cation of bacteria based on spectral patterns
using MALDI-TOF MS. Methods Mol Biol 146:461–487
11. Seng P, Drancourt M, Gouriet F, La Scola B, Fournier PE, Rolain JM et al (2009) Ongoing revolution in bacteriology: routine identifi ca-tion of bacteria by matrix-assisted laser desorp-tion ionization time-of-fl ight mass spectrometry. Clin Infect Dis 49:543–551
12. Karger A, Bettin B, Lenk M, Mettenleiter TC (2010) Rapid characterisation of cell cultures by matrix-assisted laser desorption/ionisation mass spectrometric typing. J Virol Methods 164:116–121
13. Ouedraogo R, Flaudrops C, Ben Amara A, Capo C, Raoult D, Mege JL (2010) Global analysis of circulating immune cells by matrix- assisted laser desorption ionization time-of- fl ight mass spectrometry. PLoS One 5:e13691
14. Benoit M, Desnues B, Mege JL (2008) Macrophage polarization in bacterial infec-tions. J Immunol 181:3733–3739
15. Ouedraogo R, Daumas A, Ghigo E, Capo C, Mege JL, Textoris J (2012) Whole-cell MALDI-TOF MS: a new tool to assess the multifaceted activation of macrophages. J Proteomics 75:5523–5532
16. Delaby A, Gorvel L, Espinosa L, Lépolard C, Raoult D, Ghigo E et al (2012) Defective monocyte dynamics in Q fever granuloma defi -ciency. J Infect Dis 205:1086–1094
17. Mba Medie F, Ben Salah I, Henrissat B, Raoult D, Drancourt M (2011) Mycobacterium tuber-culosis complex mycobacteria as amoeba- resistant organisms. PLoS One 6:e20499
18. Meghari S, Bechah Y, Capo C, Lepidi H, Raoult D, Murray PJ et al (2008) Persistent Coxiella burnetii infection in mice overexpress-ing IL-10: an effi cient model for chronic Q fever pathogenesis. PLoS Pathog 4:e23
19. Tantibhedhyangkul W, Prachason T, Waywa D, El Filali A, Ghigo E, Thongnoppakhun W et al (2011) Orientia tsutsugamushi stimulates an original gene expression program in mono-cytes: relationship with gene expression in patients with scrub typhus. PLoS Negl Trop Dis 5:e1028
20. Ryan CG, Clayton E, Griffi n WL, Sie SH, Cousens DR (1988) SNIP, a statistics-sensitive background treatment for the quantitative analysis of PIXE spectra in geoscience applica-tions. Nucl Inst Meth Phys Res B 34:396–402
Whole-Cell MALDI TOF Mass Spectrometry
63
Whole-cell MALDI-TOF mass spectrometry is an accurate and
rapid method to analyze different modes of macrophage
activation
Ouedraogo R, Daumas A, Capo C, Mege JL, Textoris J.
J Vis Exp. 2013 Dec 26;(82):50926.
doi: 10.3791/50926.
L’équipe a eu l’opportunité de pouvoir présenter la spectrométrie de masse MALDI-TOF en
tant qu’outil d’évaluation de l’activation macrophagique sous un format vidéo pour la revue
JoVE.
JoVE (Journal of Visualized Experiments) est une revue scientifique en vidéo contrôlée par un
comité éditorial. Créée en 2006, JoVE se destine à la publication sous forme audiovisuelle
d’expérimentations et accroît ainsi la productivité et la reproductibilité des travaux de recherche
scientifique. JoVE diffuse des vidéos montrant des expérimentations menées dans des
laboratoires du plus haut niveau et les propose en ligne à des millions de chercheurs,
d’enseignants et d’étudiants dans le monde.
La méthode présentée est explicitée dans la publication qui y est associée, présentée ci-dessous.
La vidéo est quant à elle disponible en suivant le lien http://www.jove.com/video/50926/
L’article et la vidéo explicitent le protocole expérimental utilisé pour analyser par spectrométrie
de masse MALDI-TOF sur cellules entières différents modes d’activation des macrophages
dérivés de monocytes : l’obtention des macrophages et leur stimulation par les différents
agonistes, le traitement des échantillons pour leur analyse avec le spectromètre de masse
MALDI-TOF et enfin, le traitement bio-informatique des résultats obtenus indépendamment
des programmes d’analyse liés à l’appareil d’acquisition.

64
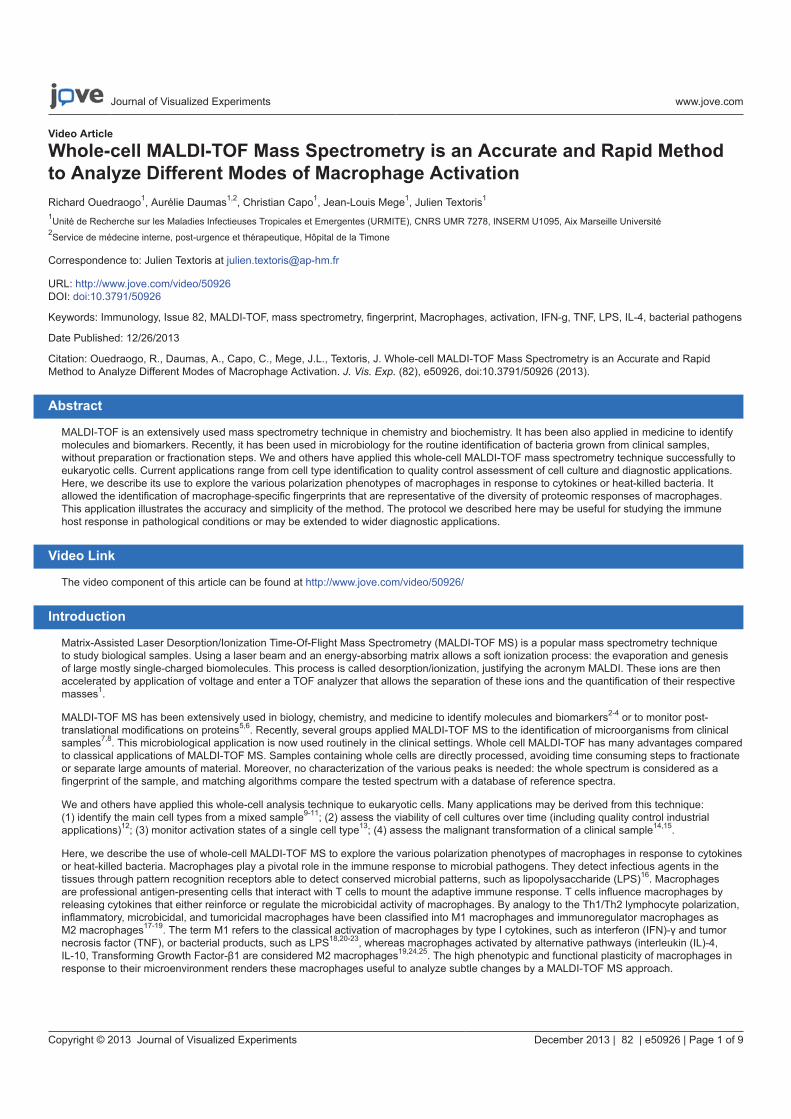
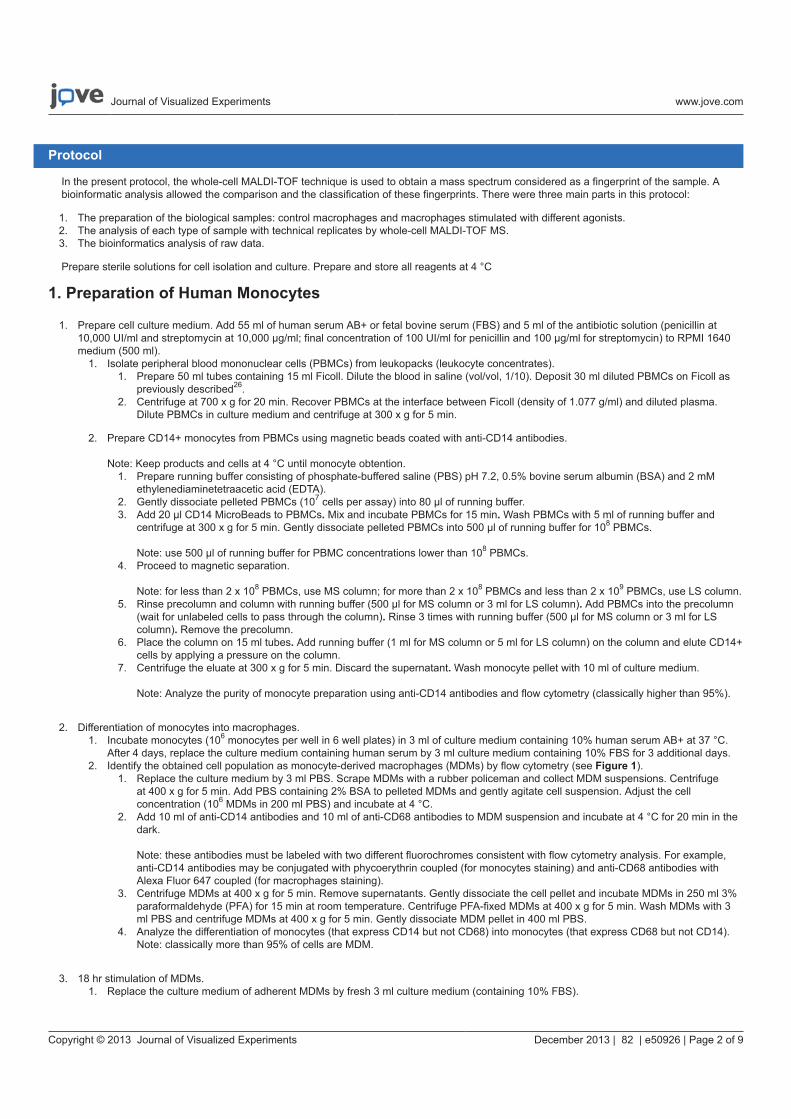
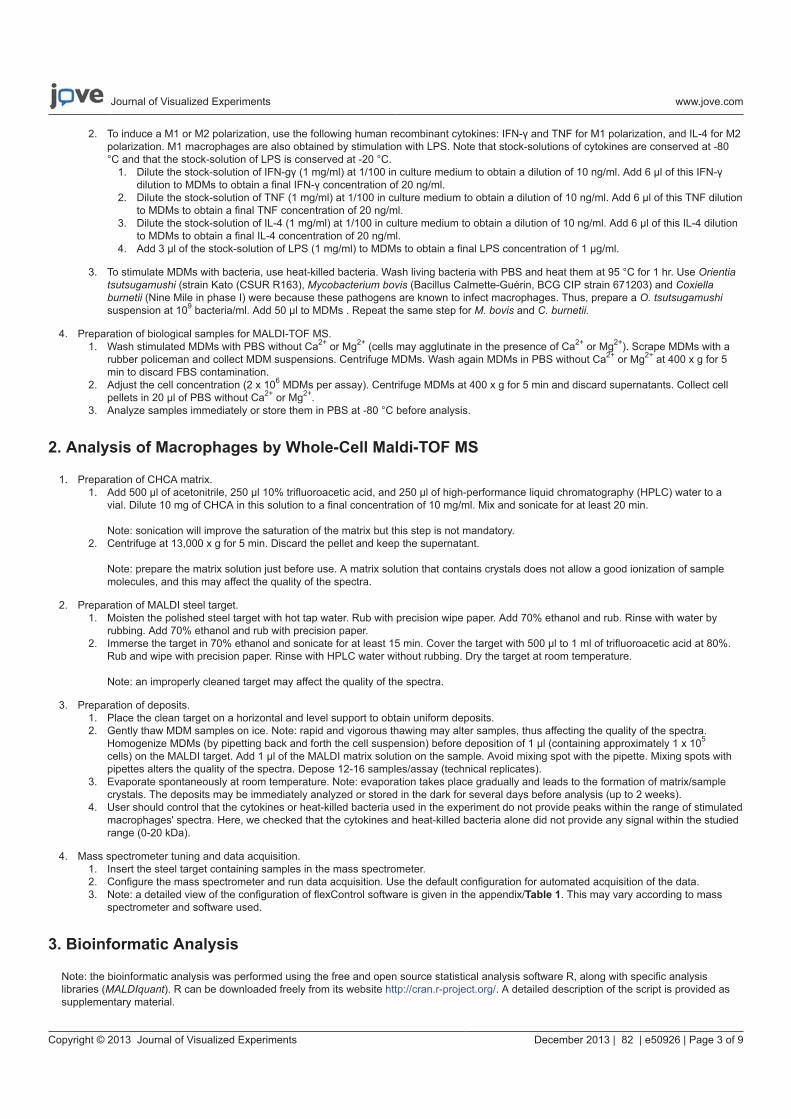
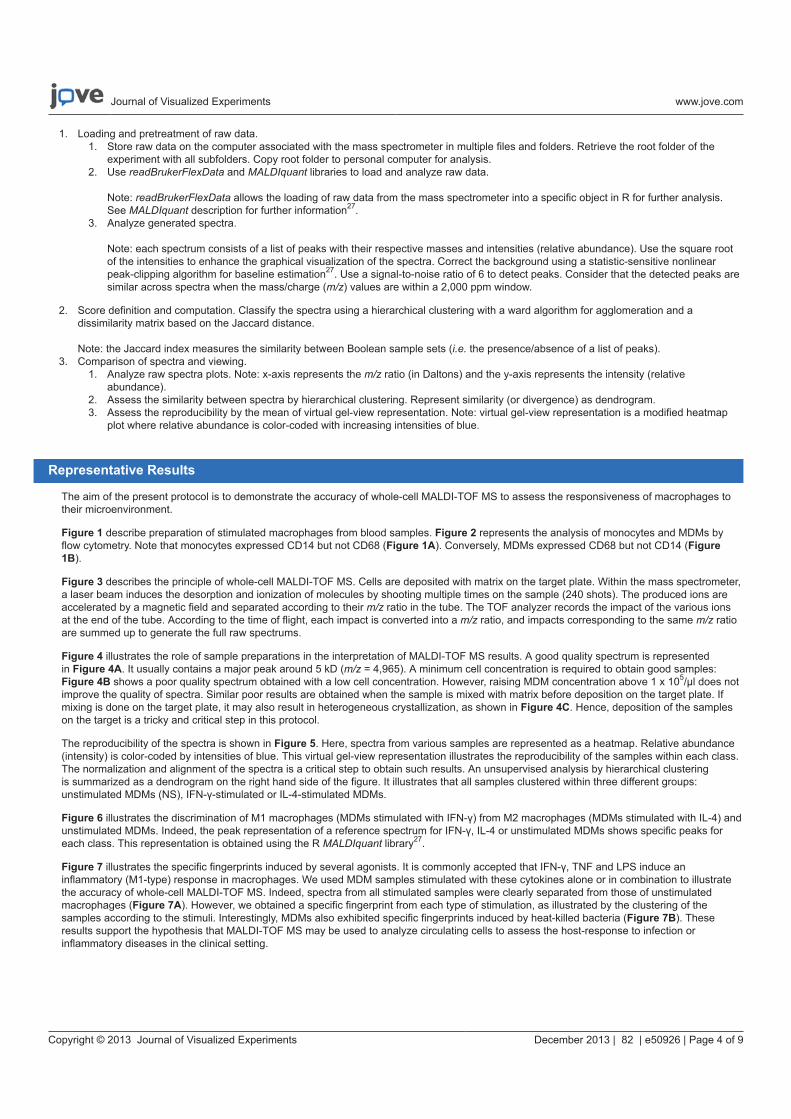
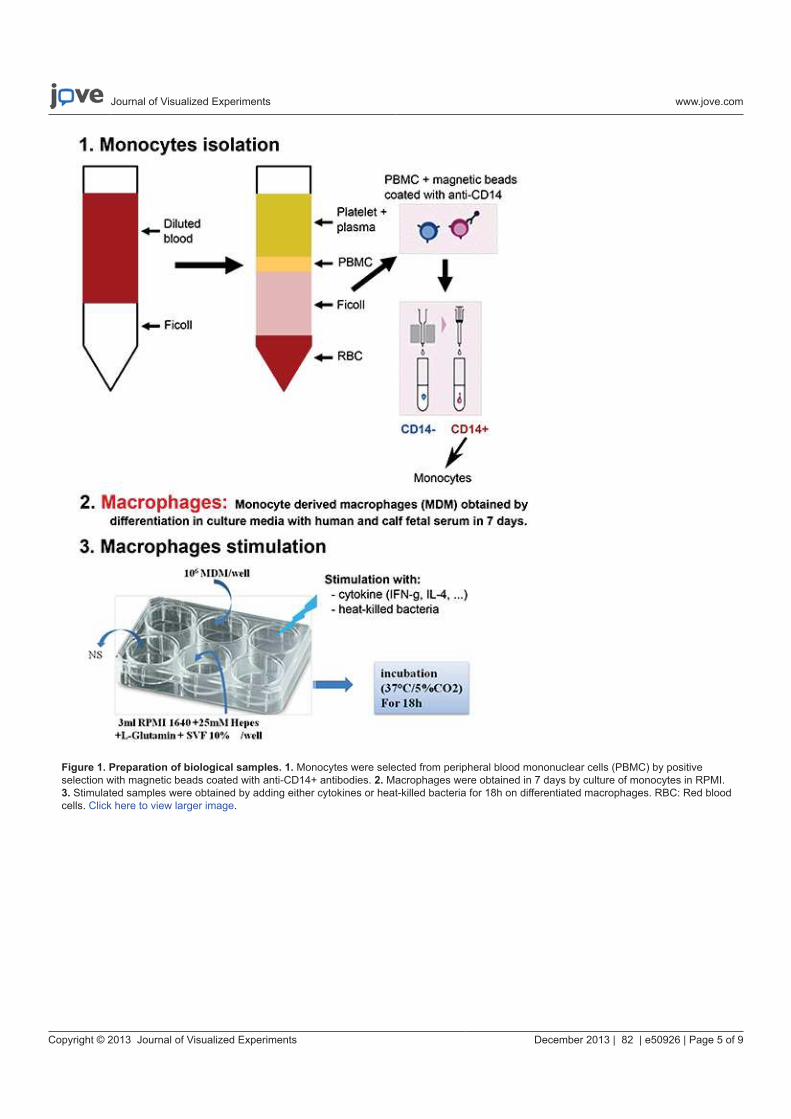
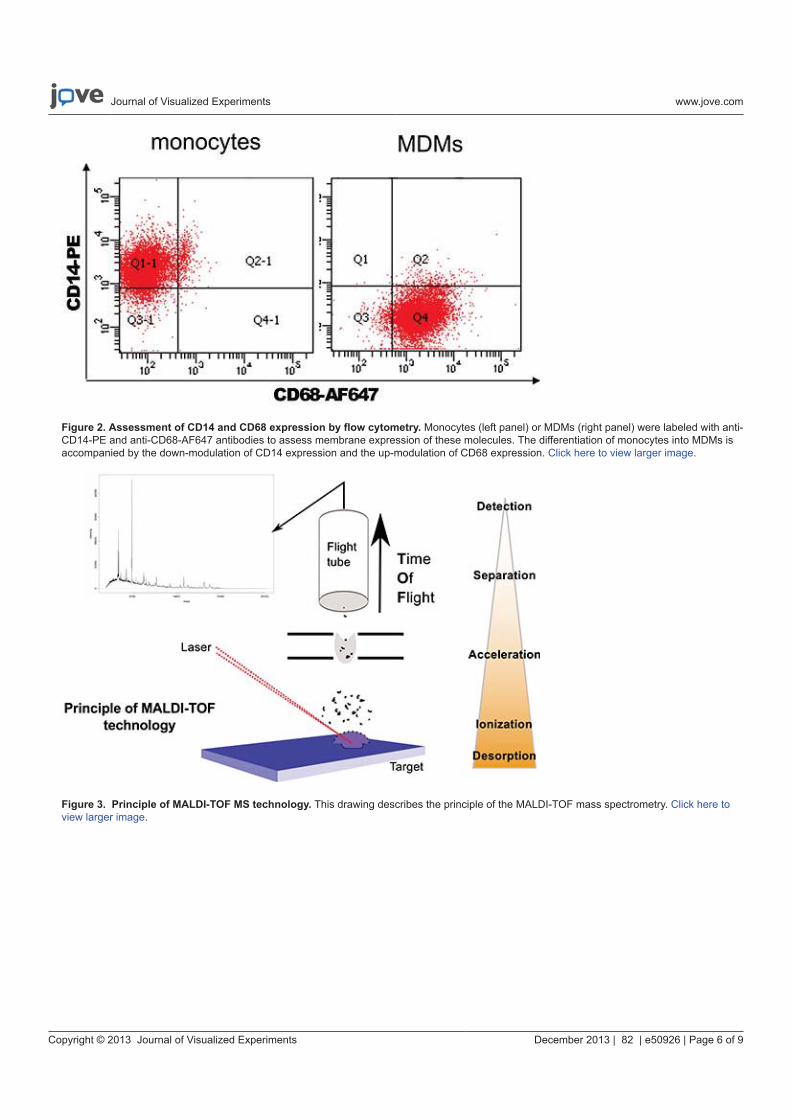
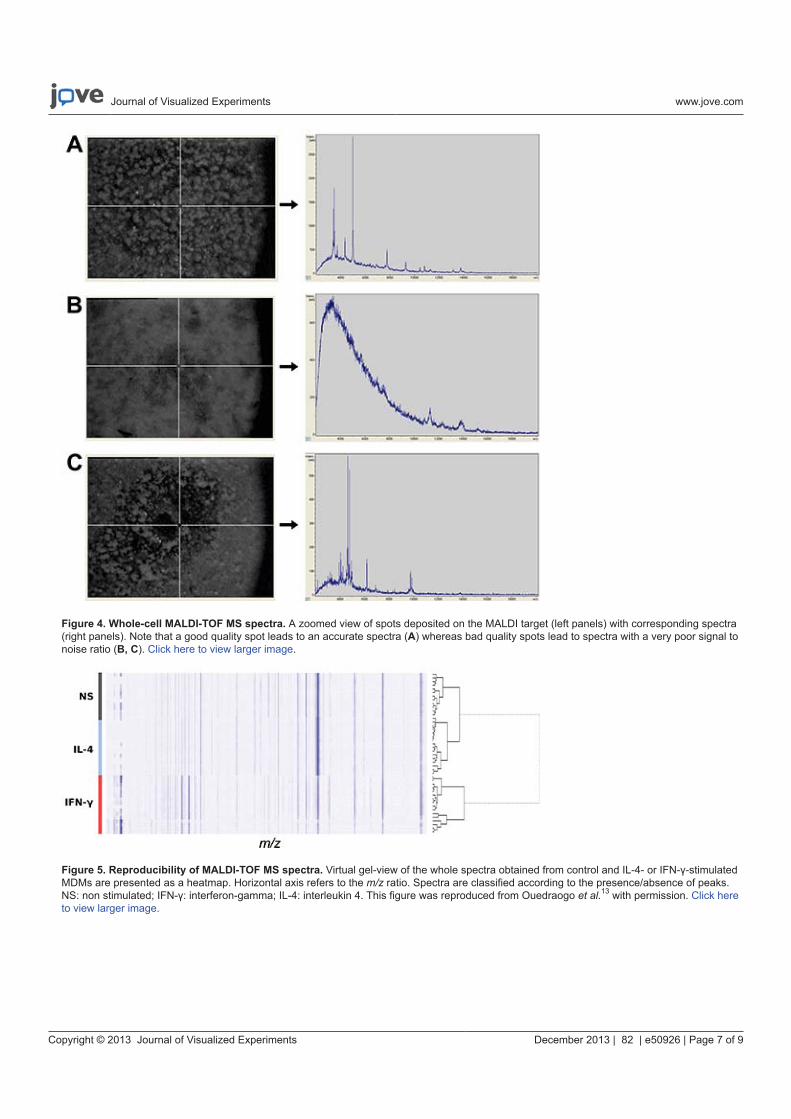
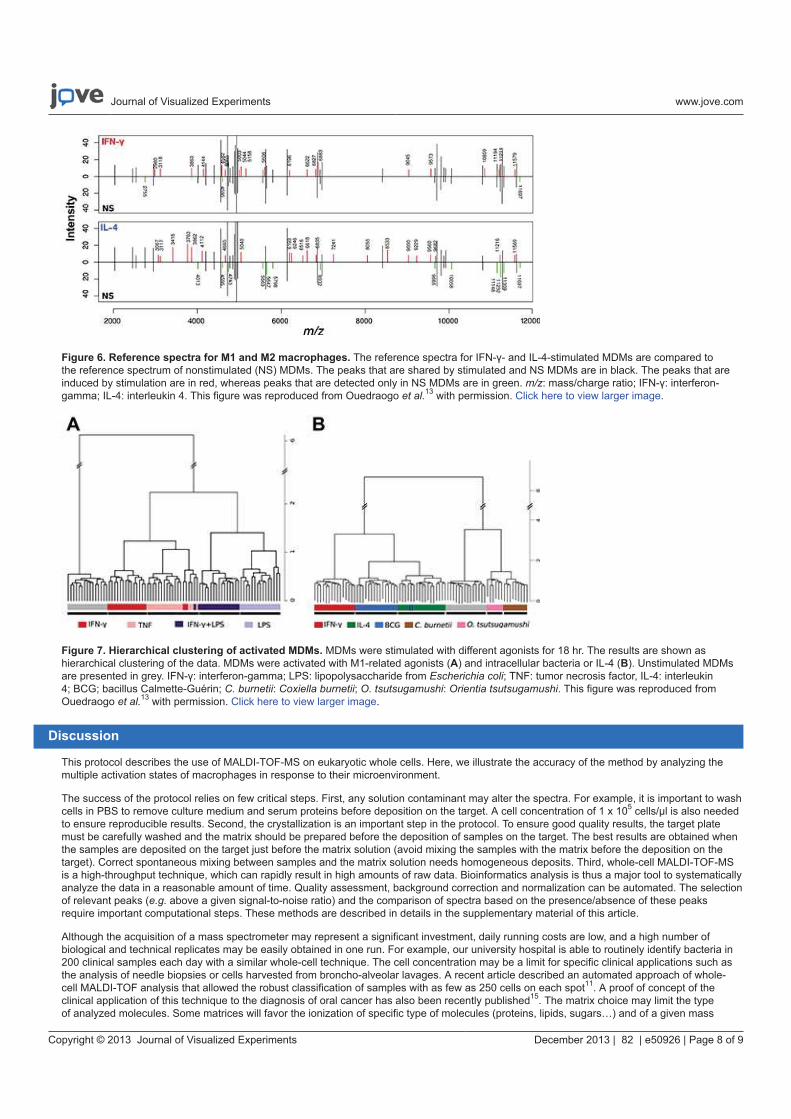
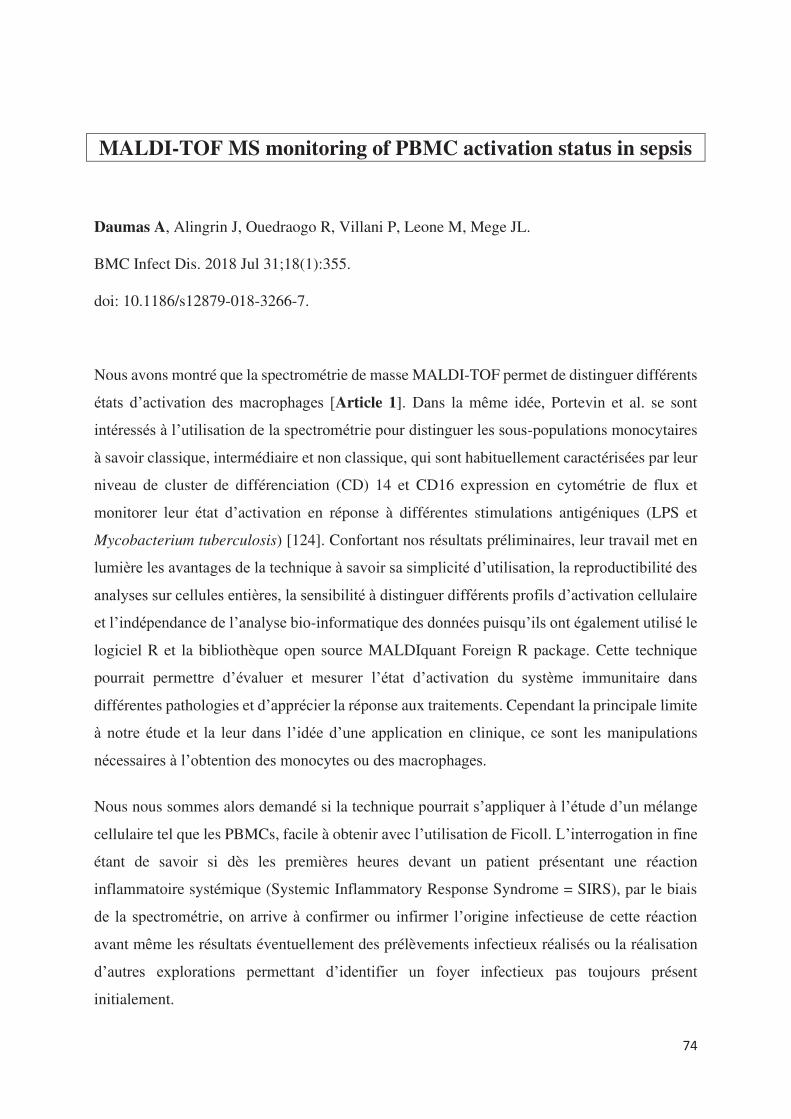
74
MALDI-TOF MS monitoring of PBMC activation status in sepsis
Daumas A, Alingrin J, Ouedraogo R, Villani P, Leone M, Mege JL.
BMC Infect Dis. 2018 Jul 31;18(1):355.
doi: 10.1186/s12879-018-3266-7.
Nous avons montré que la spectrométrie de masse MALDI-TOF permet de distinguer différents
états d’activation des macrophages [Article 1]. Dans la même idée, Portevin et al. se sont
intéressés à l’utilisation de la spectrométrie pour distinguer les sous-populations monocytaires
à savoir classique, intermédiaire et non classique, qui sont habituellement caractérisées par leur
niveau de cluster de différenciation (CD) 14 et CD16 expression en cytométrie de flux et
monitorer leur état d’activation en réponse à différentes stimulations antigéniques (LPS et
Mycobacterium tuberculosis) [124]. Confortant nos résultats préliminaires, leur travail met en
lumière les avantages de la technique à savoir sa simplicité d’utilisation, la reproductibilité des
analyses sur cellules entières, la sensibilité à distinguer différents profils d’activation cellulaire
et l’indépendance de l’analyse bio-informatique des données puisqu’ils ont également utilisé le
logiciel R et la bibliothèque open source MALDIquant Foreign R package. Cette technique
pourrait permettre d’évaluer et mesurer l’état d’activation du système immunitaire dans
différentes pathologies et d’apprécier la réponse aux traitements. Cependant la principale limite
à notre étude et la leur dans l’idée d’une application en clinique, ce sont les manipulations
nécessaires à l’obtention des monocytes ou des macrophages.
Nous nous sommes alors demandé si la technique pourrait s’appliquer à l’étude d’un mélange
cellulaire tel que les PBMCs, facile à obtenir avec l’utilisation de Ficoll. L’interrogation in fine
étant de savoir si dès les premières heures devant un patient présentant une réaction
inflammatoire systémique (Systemic Inflammatory Response Syndrome = SIRS), par le biais
de la spectrométrie, on arrive à confirmer ou infirmer l’origine infectieuse de cette réaction
avant même les résultats éventuellement des prélèvements infectieux réalisés ou la réalisation
d’autres explorations permettant d’identifier un foyer infectieux pas toujours présent
initialement.
75
J’ai ainsi étudié dans un premier temps les signatures spectrales des PBMCs de 12 patients en
sepsis sévère (2 présentant une bactériémie à Staphylococcus aureus, 4 une bactériémie à bacille
Gram négatif et 6 n’ayant pas de documentation microbiologique bien qu’une infection soit
fortement suspectée) et de sujets sains selon le même protocole qu’utilisé auparavant (Articles
présentés précédemment).
Nous avons montré que les spectres des PBMCs de sujets sains étaient très différents des
spectres des patients. Afin d’incrémenter le dendogramme réalisé par l’équipe, nous avons
analysé le positionnement des spectres de 2 sujets sains et de 2 patients et observé que les
spectres des patients se rapprochent le plus des spectres des polynucléaires et des monocytes
alors que les spectres des sujets sains sont plus proches des lymphocytes. De façon rassurante
en tout cas, les spectres des PBMCs sont très éloignés des spectres des autres cellules eucaryotes
caractérisées par Ouedraogo et al. [20]. Nous avons pu mettre en évidence la présence ou
absence spécifique de pics significatifs sur les spectres des patients et sujets sains.
Nous avons ensuite stimulé les PBMCs avec des cytokines (IFN- , IL-4 et IL-10), des motifs
moléculaires associés aux micro-organismes (MAMPs) (LPS d’Escherichia coli,
peptidoglycane de Bacillus subtilis, des oligonucléotides CpG et poly I :C pour les virus) et
enfin des bactéries inactivées (Staphylococcus aureus, Streptococcus agalactiae, Pseudomonas
aeruginosa et Escherichia coli).
Nous avons obtenu des signatures spécifiques et reproductibles pour chaque condition
d’activation. Les spectres des PBMCs stimulés par les agonistes pro-inflammatoires (IFN- et
LPS) se regroupent dans un même cluster bien distinct du cluster des spectres des PBMCs
stimulés par les cytokines anti-inflammatoires à savoir IL-4 et IL-10. On observe également
que les spectres des PBMCs stimulés par les MAMPs et les bactéries sont proches et qu’ils se
différencient nettement des spectres des PBMCs non stimulés ou stimulés par poly I:C.
Les signatures obtenues étant spécifiques, nous avons créé une référence spectrale pour chaque
état d’activation dans l’idée d’une banque de données. Nous avons ensuite comparé les spectres
des patients avec ces spectres de référence sur le modèle de l’identification des micro-
organismes avec un score de concordance.
76
Nous retrouvons clairement une signature IFN- et IL-10 chez tous les patients septiques
prévisible du fait de la réponse inflammatoire et antiinflammatoire concomitante au cours du
sepsis. Mais le résultat le plus marquant est que l’on identifie aussi chez tous les patients
septiques indépendamment de la documentation microbiologique, une signature CpG ODN
faisant évoquer une activation à un pathogène bactérien. Nous n’avons par contre pas retrouvé
de concordance étroite entre le spectre des PBMCs stimulés par Staphylococcus aureus et les
spectres des patients infectés à Staphylococcus aureus, de même qu’entre le spectre des PBMCs
stimulés par le LPS d’Escherichia coli et les spectres des patients infectés à Escherichia coli.
Malgré les limites de cette première étude, la spectrométrie de masse pourrait permettre de
distinguer un SIRS en lien avec une pathologie inflammatoire ou infectieuse ou encore d’aider
le clinicien dans un contexte de SIRS non infectieux à dépister l’apparition d’une complication
infectieuse avant même la clinique et bien avant l’éventuelle identification d’un micro-
organisme sur des prélèvements. La sensibilité de la technique ne permet pas par contre d’aller
à une caractérisation plus précise du stimulus bactérien.
Des études de confirmation sont nécessaires mais l’application de la technique au monitorage
de la réponse immunitaire semble prometteuse.
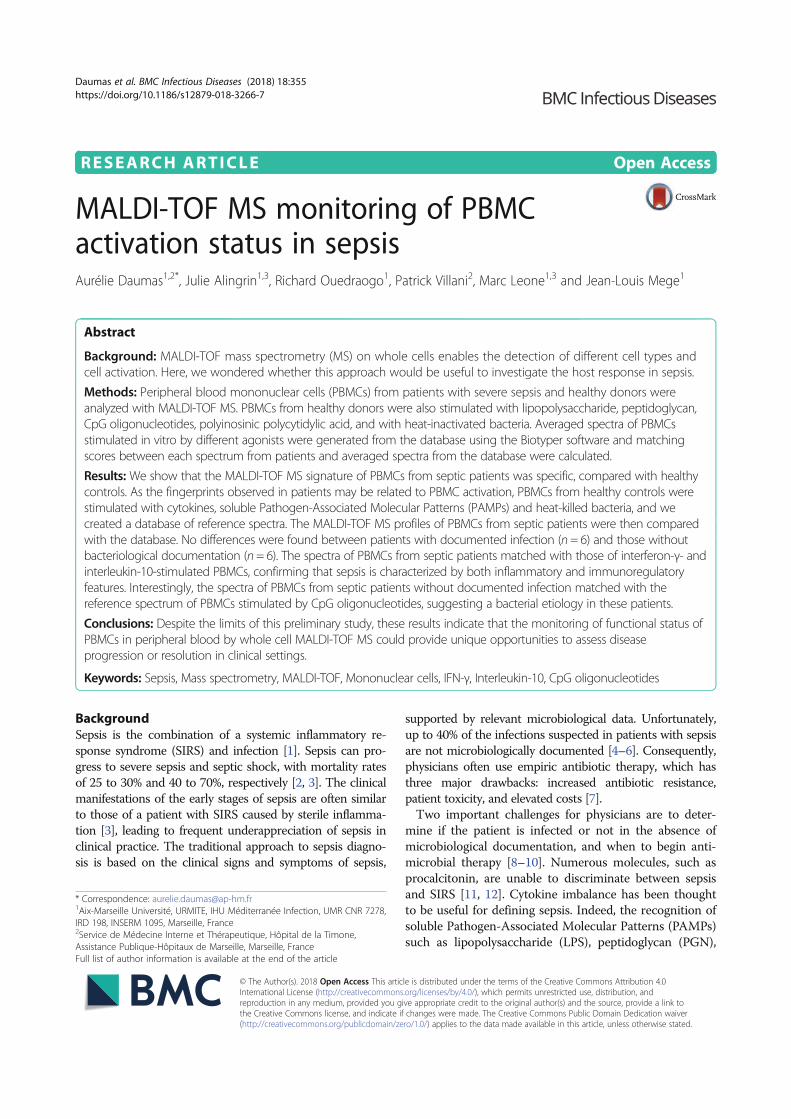
RESEARCH ARTICLE Open Access
MALDI-TOF MS monitoring of PBMCactivation status in sepsisAurélie Daumas1,2*, Julie Alingrin1,3, Richard Ouedraogo1, Patrick Villani2, Marc Leone1,3 and Jean-Louis Mege1
Abstract
Background: MALDI-TOF mass spectrometry (MS) on whole cells enables the detection of different cell types and
cell activation. Here, we wondered whether this approach would be useful to investigate the host response in sepsis.
Methods: Peripheral blood mononuclear cells (PBMCs) from patients with severe sepsis and healthy donors were
analyzed with MALDI-TOF MS. PBMCs from healthy donors were also stimulated with lipopolysaccharide, peptidoglycan,
CpG oligonucleotides, polyinosinic polycytidylic acid, and with heat-inactivated bacteria. Averaged spectra of PBMCs
stimulated in vitro by different agonists were generated from the database using the Biotyper software and matching
scores between each spectrum from patients and averaged spectra from the database were calculated.
Results: We show that the MALDI-TOF MS signature of PBMCs from septic patients was specific, compared with healthy
controls. As the fingerprints observed in patients may be related to PBMC activation, PBMCs from healthy controls were
stimulated with cytokines, soluble Pathogen-Associated Molecular Patterns (PAMPs) and heat-killed bacteria, and we
created a database of reference spectra. The MALDI-TOF MS profiles of PBMCs from septic patients were then compared
with the database. No differences were found between patients with documented infection (n = 6) and those without
bacteriological documentation (n = 6). The spectra of PBMCs from septic patients matched with those of interferon-γ- and
interleukin-10-stimulated PBMCs, confirming that sepsis is characterized by both inflammatory and immunoregulatory
features. Interestingly, the spectra of PBMCs from septic patients without documented infection matched with the
reference spectrum of PBMCs stimulated by CpG oligonucleotides, suggesting a bacterial etiology in these patients.
Conclusions: Despite the limits of this preliminary study, these results indicate that the monitoring of functional status of
PBMCs in peripheral blood by whole cell MALDI-TOF MS could provide unique opportunities to assess disease
progression or resolution in clinical settings.
Keywords: Sepsis, Mass spectrometry, MALDI-TOF, Mononuclear cells, IFN-γ, Interleukin-10, CpG oligonucleotides
Background
Sepsis is the combination of a systemic inflammatory re-
sponse syndrome (SIRS) and infection [1]. Sepsis can pro-
gress to severe sepsis and septic shock, with mortality rates
of 25 to 30% and 40 to 70%, respectively [2, 3]. The clinical
manifestations of the early stages of sepsis are often similar
to those of a patient with SIRS caused by sterile inflamma-
tion [3], leading to frequent underappreciation of sepsis in
clinical practice. The traditional approach to sepsis diagno-
sis is based on the clinical signs and symptoms of sepsis,
supported by relevant microbiological data. Unfortunately,
up to 40% of the infections suspected in patients with sepsis
are not microbiologically documented [4–6]. Consequently,
physicians often use empiric antibiotic therapy, which has
three major drawbacks: increased antibiotic resistance,
patient toxicity, and elevated costs [7].
Two important challenges for physicians are to deter-
mine if the patient is infected or not in the absence of
microbiological documentation, and when to begin anti-
microbial therapy [8–10]. Numerous molecules, such as
procalcitonin, are unable to discriminate between sepsis
and SIRS [11, 12]. Cytokine imbalance has been thought
to be useful for defining sepsis. Indeed, the recognition of
soluble Pathogen-Associated Molecular Patterns (PAMPs)
such as lipopolysaccharide (LPS), peptidoglycan (PGN),
* Correspondence: [email protected] Université, URMITE, IHU Méditerranée Infection, UMR CNR 7278,
IRD 198, INSERM 1095, Marseille, France2Service de Médecine Interne et Thérapeutique, Hôpital de la Timone,
Assistance Publique-Hôpitaux de Marseille, Marseille, France
Full list of author information is available at the end of the article
© The Author(s). 2018 Open Access This article is distributed under the terms of the Creative Commons Attribution 4.0International License (http://creativecommons.org/licenses/by/4.0/), which permits unrestricted use, distribution, andreproduction in any medium, provided you give appropriate credit to the original author(s) and the source, provide a link tothe Creative Commons license, and indicate if changes were made. The Creative Commons Public Domain Dedication waiver(http://creativecommons.org/publicdomain/zero/1.0/) applies to the data made available in this article, unless otherwise stated.
Daumas et al. BMC Infectious Diseases (2018) 18:355
https://doi.org/10.1186/s12879-018-3266-7
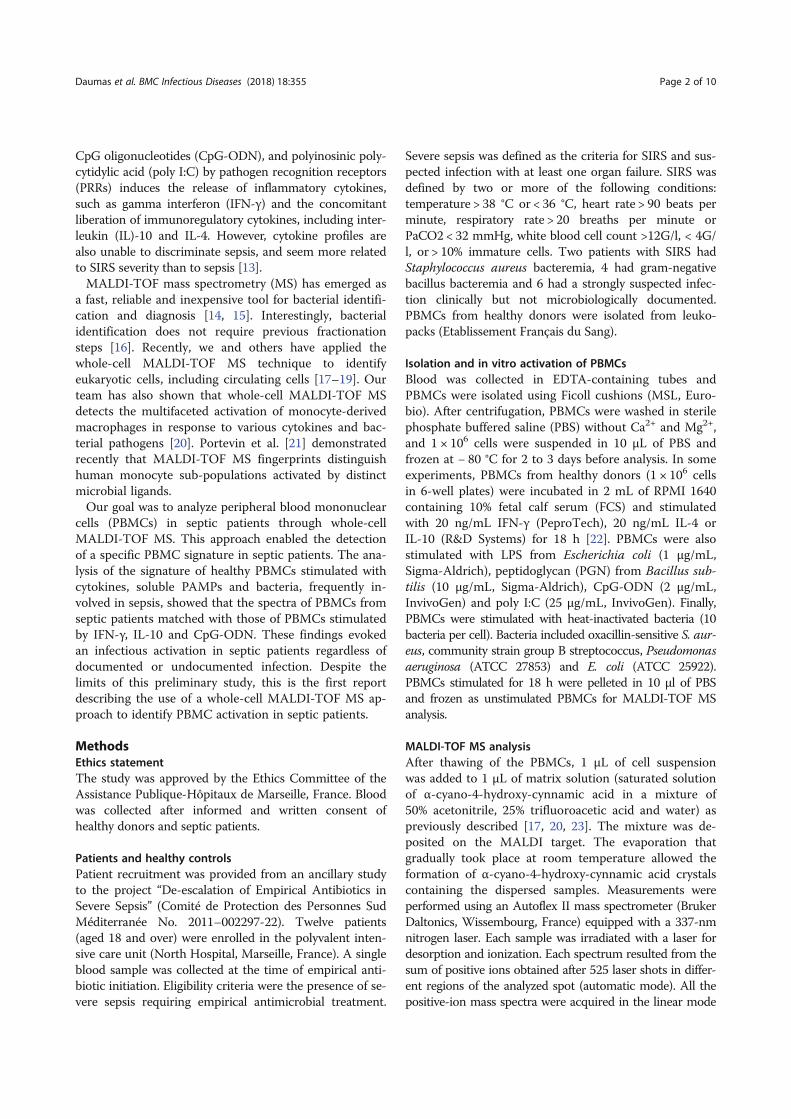
CpG oligonucleotides (CpG-ODN), and polyinosinic poly-
cytidylic acid (poly I:C) by pathogen recognition receptors
(PRRs) induces the release of inflammatory cytokines,
such as gamma interferon (IFN-γ) and the concomitant
liberation of immunoregulatory cytokines, including inter-
leukin (IL)-10 and IL-4. However, cytokine profiles are
also unable to discriminate sepsis, and seem more related
to SIRS severity than to sepsis [13].
MALDI-TOF mass spectrometry (MS) has emerged as
a fast, reliable and inexpensive tool for bacterial identifi-
cation and diagnosis [14, 15]. Interestingly, bacterial
identification does not require previous fractionation
steps [16]. Recently, we and others have applied the
whole-cell MALDI-TOF MS technique to identify
eukaryotic cells, including circulating cells [17–19]. Our
team has also shown that whole-cell MALDI-TOF MS
detects the multifaceted activation of monocyte-derived
macrophages in response to various cytokines and bac-
terial pathogens [20]. Portevin et al. [21] demonstrated
recently that MALDI-TOF MS fingerprints distinguish
human monocyte sub-populations activated by distinct
microbial ligands.
Our goal was to analyze peripheral blood mononuclear
cells (PBMCs) in septic patients through whole-cell
MALDI-TOF MS. This approach enabled the detection
of a specific PBMC signature in septic patients. The ana-
lysis of the signature of healthy PBMCs stimulated with
cytokines, soluble PAMPs and bacteria, frequently in-
volved in sepsis, showed that the spectra of PBMCs from
septic patients matched with those of PBMCs stimulated
by IFN-γ, IL-10 and CpG-ODN. These findings evoked
an infectious activation in septic patients regardless of
documented or undocumented infection. Despite the
limits of this preliminary study, this is the first report
describing the use of a whole-cell MALDI-TOF MS ap-
proach to identify PBMC activation in septic patients.
Methods
Ethics statement
The study was approved by the Ethics Committee of the
Assistance Publique-Hôpitaux de Marseille, France. Blood
was collected after informed and written consent of
healthy donors and septic patients.
Patients and healthy controls
Patient recruitment was provided from an ancillary study
to the project “De-escalation of Empirical Antibiotics in
Severe Sepsis” (Comité de Protection des Personnes Sud
Méditerranée No. 2011–002297-22). Twelve patients
(aged 18 and over) were enrolled in the polyvalent inten-
sive care unit (North Hospital, Marseille, France). A single
blood sample was collected at the time of empirical anti-
biotic initiation. Eligibility criteria were the presence of se-
vere sepsis requiring empirical antimicrobial treatment.
Severe sepsis was defined as the criteria for SIRS and sus-
pected infection with at least one organ failure. SIRS was
defined by two or more of the following conditions:
temperature > 38 °C or < 36 °C, heart rate > 90 beats per
minute, respiratory rate > 20 breaths per minute or
PaCO2 < 32 mmHg, white blood cell count >12G/l, < 4G/
l, or > 10% immature cells. Two patients with SIRS had
Staphylococcus aureus bacteremia, 4 had gram-negative
bacillus bacteremia and 6 had a strongly suspected infec-
tion clinically but not microbiologically documented.
PBMCs from healthy donors were isolated from leuko-
packs (Etablissement Français du Sang).
Isolation and in vitro activation of PBMCs
Blood was collected in EDTA-containing tubes and
PBMCs were isolated using Ficoll cushions (MSL, Euro-
bio). After centrifugation, PBMCs were washed in sterile
phosphate buffered saline (PBS) without Ca2+ and Mg2+,
and 1 × 10⁶ cells were suspended in 10 μL of PBS and
frozen at − 80 °C for 2 to 3 days before analysis. In some
experiments, PBMCs from healthy donors (1 × 10⁶ cells
in 6-well plates) were incubated in 2 mL of RPMI 1640
containing 10% fetal calf serum (FCS) and stimulated
with 20 ng/mL IFN-γ (PeproTech), 20 ng/mL IL-4 or
IL-10 (R&D Systems) for 18 h [22]. PBMCs were also
stimulated with LPS from Escherichia coli (1 μg/mL,
Sigma-Aldrich), peptidoglycan (PGN) from Bacillus sub-
tilis (10 μg/mL, Sigma-Aldrich), CpG-ODN (2 μg/mL,
InvivoGen) and poly I:C (25 μg/mL, InvivoGen). Finally,
PBMCs were stimulated with heat-inactivated bacteria (10
bacteria per cell). Bacteria included oxacillin-sensitive S. aur-
eus, community strain group B streptococcus, Pseudomonas
aeruginosa (ATCC 27853) and E. coli (ATCC 25922).
PBMCs stimulated for 18 h were pelleted in 10 μl of PBS
and frozen as unstimulated PBMCs for MALDI-TOF MS
analysis.
MALDI-TOF MS analysis
After thawing of the PBMCs, 1 μL of cell suspension
was added to 1 μL of matrix solution (saturated solution
of α-cyano-4-hydroxy-cynnamic acid in a mixture of
50% acetonitrile, 25% trifluoroacetic acid and water) as
previously described [17, 20, 23]. The mixture was de-
posited on the MALDI target. The evaporation that
gradually took place at room temperature allowed the
formation of α-cyano-4-hydroxy-cynnamic acid crystals
containing the dispersed samples. Measurements were
performed using an Autoflex II mass spectrometer (Bruker
Daltonics, Wissembourg, France) equipped with a 337-nm
nitrogen laser. Each sample was irradiated with a laser for
desorption and ionization. Each spectrum resulted from the
sum of positive ions obtained after 525 laser shots in differ-
ent regions of the analyzed spot (automatic mode). All the
positive-ion mass spectra were acquired in the linear mode
Daumas et al. BMC Infectious Diseases (2018) 18:355 Page 2 of 10
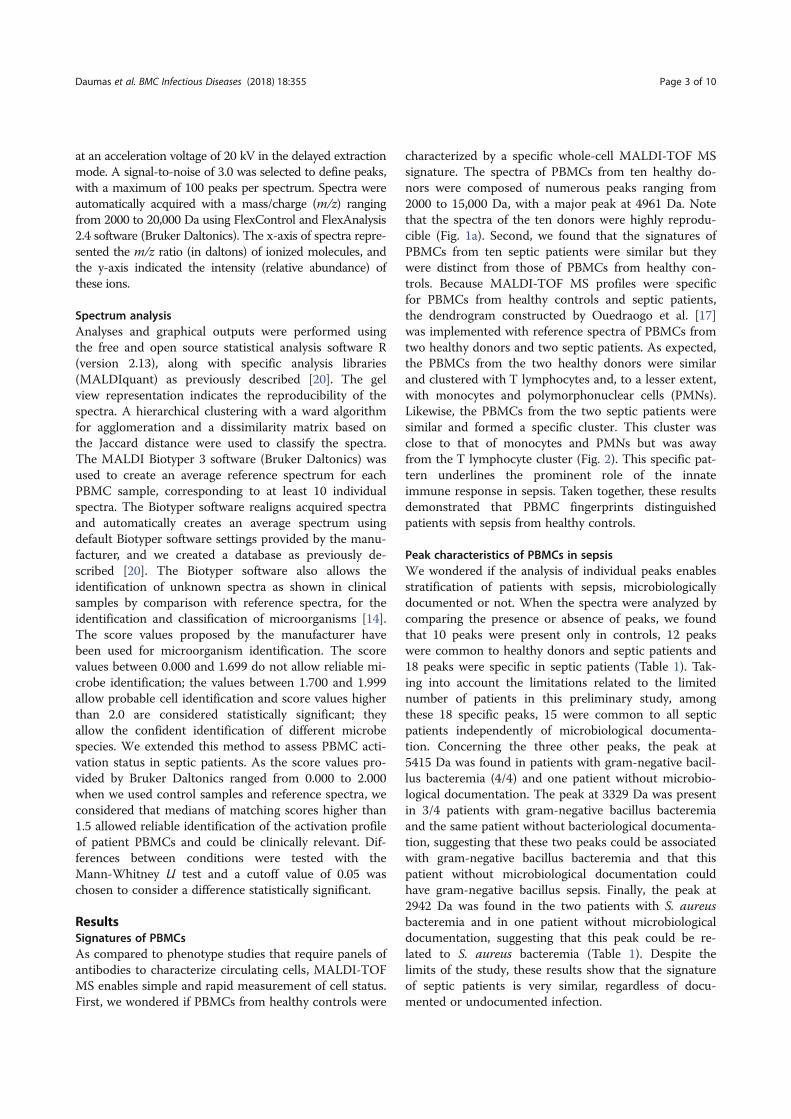
at an acceleration voltage of 20 kV in the delayed extraction
mode. A signal-to-noise of 3.0 was selected to define peaks,
with a maximum of 100 peaks per spectrum. Spectra were
automatically acquired with a mass/charge (m/z) ranging
from 2000 to 20,000 Da using FlexControl and FlexAnalysis
2.4 software (Bruker Daltonics). The x-axis of spectra repre-
sented the m/z ratio (in daltons) of ionized molecules, and
the y-axis indicated the intensity (relative abundance) of
these ions.
Spectrum analysis
Analyses and graphical outputs were performed using
the free and open source statistical analysis software R
(version 2.13), along with specific analysis libraries
(MALDIquant) as previously described [20]. The gel
view representation indicates the reproducibility of the
spectra. A hierarchical clustering with a ward algorithm
for agglomeration and a dissimilarity matrix based on
the Jaccard distance were used to classify the spectra.
The MALDI Biotyper 3 software (Bruker Daltonics) was
used to create an average reference spectrum for each
PBMC sample, corresponding to at least 10 individual
spectra. The Biotyper software realigns acquired spectra
and automatically creates an average spectrum using
default Biotyper software settings provided by the manu-
facturer, and we created a database as previously de-
scribed [20]. The Biotyper software also allows the
identification of unknown spectra as shown in clinical
samples by comparison with reference spectra, for the
identification and classification of microorganisms [14].
The score values proposed by the manufacturer have
been used for microorganism identification. The score
values between 0.000 and 1.699 do not allow reliable mi-
crobe identification; the values between 1.700 and 1.999
allow probable cell identification and score values higher
than 2.0 are considered statistically significant; they
allow the confident identification of different microbe
species. We extended this method to assess PBMC acti-
vation status in septic patients. As the score values pro-
vided by Bruker Daltonics ranged from 0.000 to 2.000
when we used control samples and reference spectra, we
considered that medians of matching scores higher than
1.5 allowed reliable identification of the activation profile
of patient PBMCs and could be clinically relevant. Dif-
ferences between conditions were tested with the
Mann-Whitney U test and a cutoff value of 0.05 was
chosen to consider a difference statistically significant.
ResultsSignatures of PBMCs
As compared to phenotype studies that require panels of
antibodies to characterize circulating cells, MALDI-TOF
MS enables simple and rapid measurement of cell status.
First, we wondered if PBMCs from healthy controls were
characterized by a specific whole-cell MALDI-TOF MS
signature. The spectra of PBMCs from ten healthy do-
nors were composed of numerous peaks ranging from
2000 to 15,000 Da, with a major peak at 4961 Da. Note
that the spectra of the ten donors were highly reprodu-
cible (Fig. 1a). Second, we found that the signatures of
PBMCs from ten septic patients were similar but they
were distinct from those of PBMCs from healthy con-
trols. Because MALDI-TOF MS profiles were specific
for PBMCs from healthy controls and septic patients,
the dendrogram constructed by Ouedraogo et al. [17]
was implemented with reference spectra of PBMCs from
two healthy donors and two septic patients. As expected,
the PBMCs from the two healthy donors were similar
and clustered with T lymphocytes and, to a lesser extent,
with monocytes and polymorphonuclear cells (PMNs).
Likewise, the PBMCs from the two septic patients were
similar and formed a specific cluster. This cluster was
close to that of monocytes and PMNs but was away
from the T lymphocyte cluster (Fig. 2). This specific pat-
tern underlines the prominent role of the innate
immune response in sepsis. Taken together, these results
demonstrated that PBMC fingerprints distinguished
patients with sepsis from healthy controls.
Peak characteristics of PBMCs in sepsis
We wondered if the analysis of individual peaks enables
stratification of patients with sepsis, microbiologically
documented or not. When the spectra were analyzed by
comparing the presence or absence of peaks, we found
that 10 peaks were present only in controls, 12 peaks
were common to healthy donors and septic patients and
18 peaks were specific in septic patients (Table 1). Tak-
ing into account the limitations related to the limited
number of patients in this preliminary study, among
these 18 specific peaks, 15 were common to all septic
patients independently of microbiological documenta-
tion. Concerning the three other peaks, the peak at
5415 Da was found in patients with gram-negative bacil-
lus bacteremia (4/4) and one patient without microbio-
logical documentation. The peak at 3329 Da was present
in 3/4 patients with gram-negative bacillus bacteremia
and the same patient without bacteriological documenta-
tion, suggesting that these two peaks could be associated
with gram-negative bacillus bacteremia and that this
patient without microbiological documentation could
have gram-negative bacillus sepsis. Finally, the peak at
2942 Da was found in the two patients with S. aureus
bacteremia and in one patient without microbiological
documentation, suggesting that this peak could be re-
lated to S. aureus bacteremia (Table 1). Despite the
limits of the study, these results show that the signature
of septic patients is very similar, regardless of docu-
mented or undocumented infection.
Daumas et al. BMC Infectious Diseases (2018) 18:355 Page 3 of 10
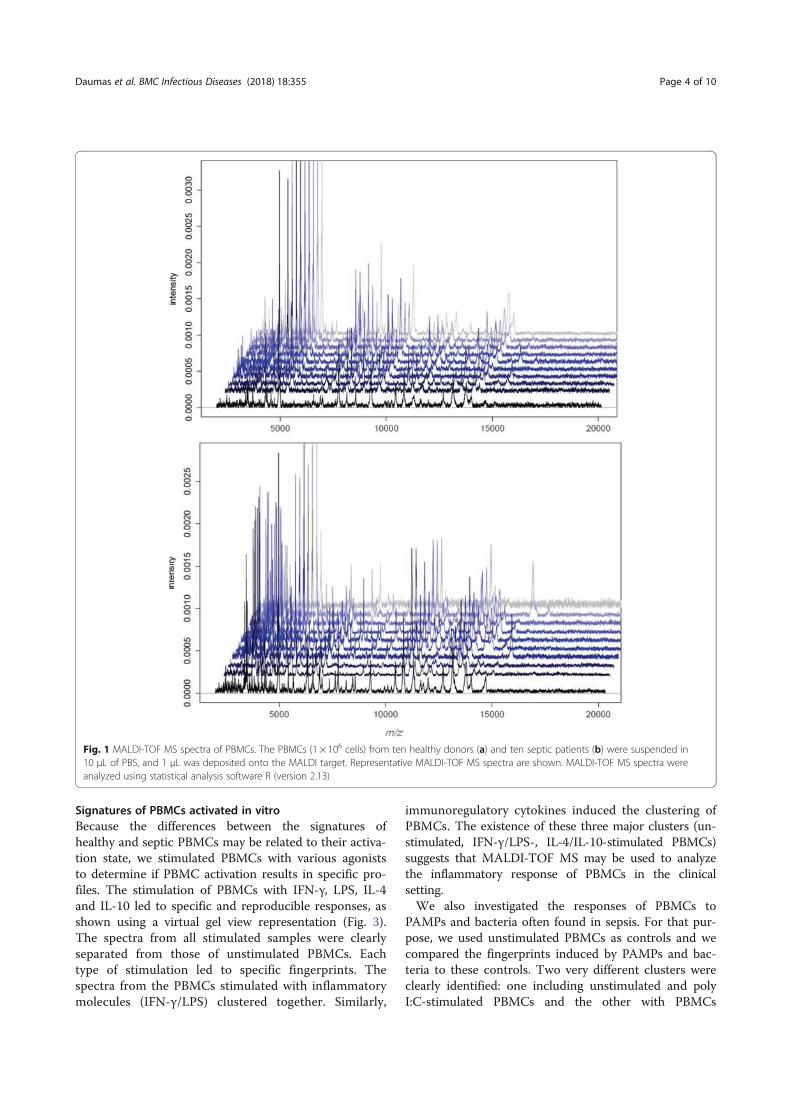
Signatures of PBMCs activated in vitro
Because the differences between the signatures of
healthy and septic PBMCs may be related to their activa-
tion state, we stimulated PBMCs with various agonists
to determine if PBMC activation results in specific pro-
files. The stimulation of PBMCs with IFN-γ, LPS, IL-4
and IL-10 led to specific and reproducible responses, as
shown using a virtual gel view representation (Fig. 3).
The spectra from all stimulated samples were clearly
separated from those of unstimulated PBMCs. Each
type of stimulation led to specific fingerprints. The
spectra from the PBMCs stimulated with inflammatory
molecules (IFN-γ/LPS) clustered together. Similarly,
immunoregulatory cytokines induced the clustering of
PBMCs. The existence of these three major clusters (un-
stimulated, IFN-γ/LPS-, IL-4/IL-10-stimulated PBMCs)
suggests that MALDI-TOF MS may be used to analyze
the inflammatory response of PBMCs in the clinical
setting.
We also investigated the responses of PBMCs to
PAMPs and bacteria often found in sepsis. For that pur-
pose, we used unstimulated PBMCs as controls and we
compared the fingerprints induced by PAMPs and bac-
teria to these controls. Two very different clusters were
clearly identified: one including unstimulated and poly
I:C-stimulated PBMCs and the other with PBMCs
Fig. 1 MALDI-TOF MS spectra of PBMCs. The PBMCs (1 × 10⁶ cells) from ten healthy donors (a) and ten septic patients (b) were suspended in
10 μL of PBS, and 1 μL was deposited onto the MALDI target. Representative MALDI-TOF MS spectra are shown. MALDI-TOF MS spectra were
analyzed using statistical analysis software R (version 2.13)
Daumas et al. BMC Infectious Diseases (2018) 18:355 Page 4 of 10
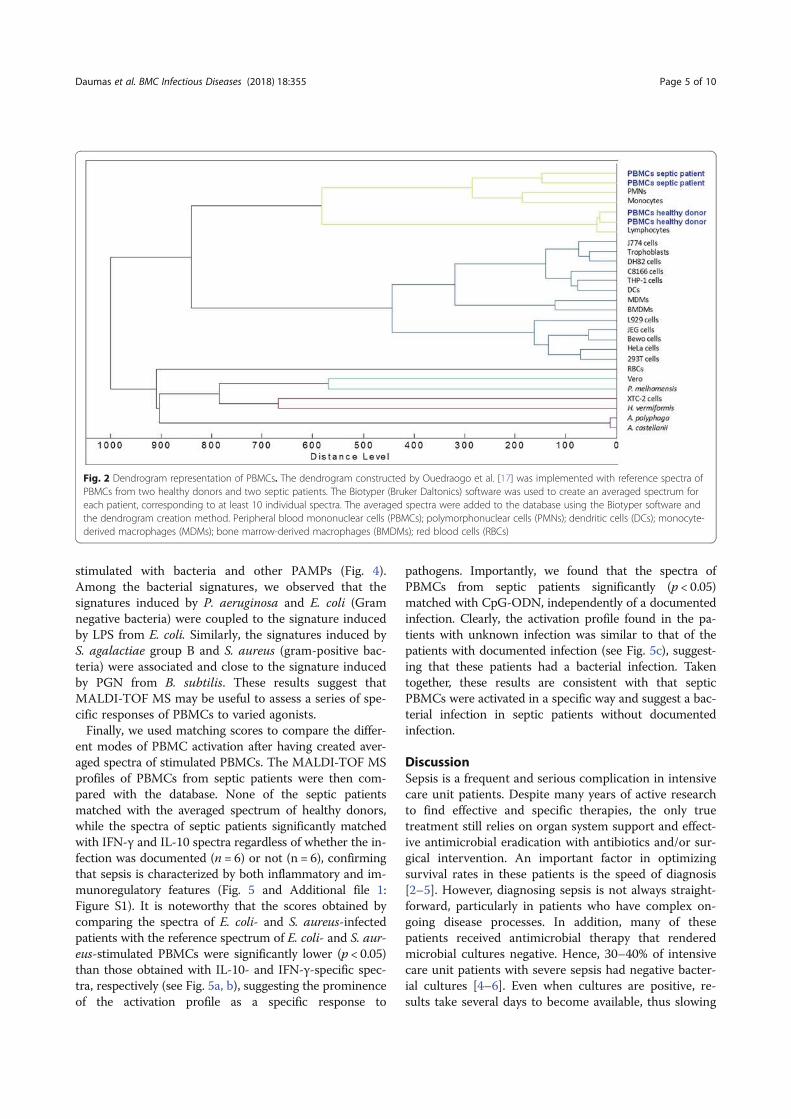
stimulated with bacteria and other PAMPs (Fig. 4).
Among the bacterial signatures, we observed that the
signatures induced by P. aeruginosa and E. coli (Gram
negative bacteria) were coupled to the signature induced
by LPS from E. coli. Similarly, the signatures induced by
S. agalactiae group B and S. aureus (gram-positive bac-
teria) were associated and close to the signature induced
by PGN from B. subtilis. These results suggest that
MALDI-TOF MS may be useful to assess a series of spe-
cific responses of PBMCs to varied agonists.
Finally, we used matching scores to compare the differ-
ent modes of PBMC activation after having created aver-
aged spectra of stimulated PBMCs. The MALDI-TOF MS
profiles of PBMCs from septic patients were then com-
pared with the database. None of the septic patients
matched with the averaged spectrum of healthy donors,
while the spectra of septic patients significantly matched
with IFN-γ and IL-10 spectra regardless of whether the in-
fection was documented (n = 6) or not (n = 6), confirming
that sepsis is characterized by both inflammatory and im-
munoregulatory features (Fig. 5 and Additional file 1:
Figure S1). It is noteworthy that the scores obtained by
comparing the spectra of E. coli- and S. aureus-infected
patients with the reference spectrum of E. coli- and S. aur-
eus-stimulated PBMCs were significantly lower (p < 0.05)
than those obtained with IL-10- and IFN-γ-specific spec-
tra, respectively (see Fig. 5a, b), suggesting the prominence
of the activation profile as a specific response to
pathogens. Importantly, we found that the spectra of
PBMCs from septic patients significantly (p < 0.05)
matched with CpG-ODN, independently of a documented
infection. Clearly, the activation profile found in the pa-
tients with unknown infection was similar to that of the
patients with documented infection (see Fig. 5c), suggest-
ing that these patients had a bacterial infection. Taken
together, these results are consistent with that septic
PBMCs were activated in a specific way and suggest a bac-
terial infection in septic patients without documented
infection.
Discussion
Sepsis is a frequent and serious complication in intensive
care unit patients. Despite many years of active research
to find effective and specific therapies, the only true
treatment still relies on organ system support and effect-
ive antimicrobial eradication with antibiotics and/or sur-
gical intervention. An important factor in optimizing
survival rates in these patients is the speed of diagnosis
[2–5]. However, diagnosing sepsis is not always straight-
forward, particularly in patients who have complex on-
going disease processes. In addition, many of these
patients received antimicrobial therapy that rendered
microbial cultures negative. Hence, 30–40% of intensive
care unit patients with severe sepsis had negative bacter-
ial cultures [4–6]. Even when cultures are positive, re-
sults take several days to become available, thus slowing
Fig. 2 Dendrogram representation of PBMCs. The dendrogram constructed by Ouedraogo et al. [17] was implemented with reference spectra of
PBMCs from two healthy donors and two septic patients. The Biotyper (Bruker Daltonics) software was used to create an averaged spectrum for
each patient, corresponding to at least 10 individual spectra. The averaged spectra were added to the database using the Biotyper software and
the dendrogram creation method. Peripheral blood mononuclear cells (PBMCs); polymorphonuclear cells (PMNs); dendritic cells (DCs); monocyte-
derived macrophages (MDMs); bone marrow-derived macrophages (BMDMs); red blood cells (RBCs)
Daumas et al. BMC Infectious Diseases (2018) 18:355 Page 5 of 10
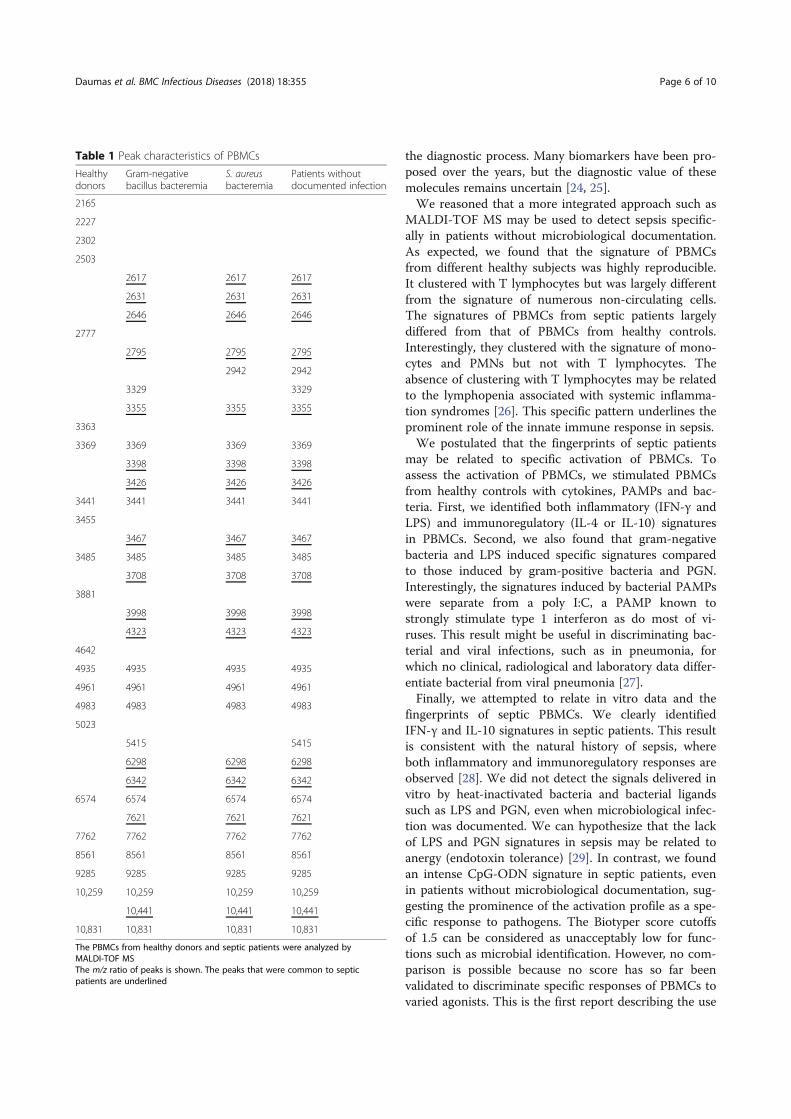
the diagnostic process. Many biomarkers have been pro-
posed over the years, but the diagnostic value of these
molecules remains uncertain [24, 25].
We reasoned that a more integrated approach such as
MALDI-TOF MS may be used to detect sepsis specific-
ally in patients without microbiological documentation.
As expected, we found that the signature of PBMCs
from different healthy subjects was highly reproducible.
It clustered with T lymphocytes but was largely different
from the signature of numerous non-circulating cells.
The signatures of PBMCs from septic patients largely
differed from that of PBMCs from healthy controls.
Interestingly, they clustered with the signature of mono-
cytes and PMNs but not with T lymphocytes. The
absence of clustering with T lymphocytes may be related
to the lymphopenia associated with systemic inflamma-
tion syndromes [26]. This specific pattern underlines the
prominent role of the innate immune response in sepsis.
We postulated that the fingerprints of septic patients
may be related to specific activation of PBMCs. To
assess the activation of PBMCs, we stimulated PBMCs
from healthy controls with cytokines, PAMPs and bac-
teria. First, we identified both inflammatory (IFN-γ and
LPS) and immunoregulatory (IL-4 or IL-10) signatures
in PBMCs. Second, we also found that gram-negative
bacteria and LPS induced specific signatures compared
to those induced by gram-positive bacteria and PGN.
Interestingly, the signatures induced by bacterial PAMPs
were separate from a poly I:C, a PAMP known to
strongly stimulate type 1 interferon as do most of vi-
ruses. This result might be useful in discriminating bac-
terial and viral infections, such as in pneumonia, for
which no clinical, radiological and laboratory data differ-
entiate bacterial from viral pneumonia [27].
Finally, we attempted to relate in vitro data and the
fingerprints of septic PBMCs. We clearly identified
IFN-γ and IL-10 signatures in septic patients. This result
is consistent with the natural history of sepsis, where
both inflammatory and immunoregulatory responses are
observed [28]. We did not detect the signals delivered in
vitro by heat-inactivated bacteria and bacterial ligands
such as LPS and PGN, even when microbiological infec-
tion was documented. We can hypothesize that the lack
of LPS and PGN signatures in sepsis may be related to
anergy (endotoxin tolerance) [29]. In contrast, we found
an intense CpG-ODN signature in septic patients, even
in patients without microbiological documentation, sug-
gesting the prominence of the activation profile as a spe-
cific response to pathogens. The Biotyper score cutoffs
of 1.5 can be considered as unacceptably low for func-
tions such as microbial identification. However, no com-
parison is possible because no score has so far been
validated to discriminate specific responses of PBMCs to
varied agonists. This is the first report describing the use
Table 1 Peak characteristics of PBMCs
Healthydonors
Gram-negativebacillus bacteremia
S. aureusbacteremia
Patients withoutdocumented infection
2165
2227
2302
2503
2617 2617 2617
2631 2631 2631
2646 2646 2646
2777
2795 2795 2795
2942 2942
3329 3329
3355 3355 3355
3363
3369 3369 3369 3369
3398 3398 3398
3426 3426 3426
3441 3441 3441 3441
3455
3467 3467 3467
3485 3485 3485 3485
3708 3708 3708
3881
3998 3998 3998
4323 4323 4323
4642
4935 4935 4935 4935
4961 4961 4961 4961
4983 4983 4983 4983
5023
5415 5415
6298 6298 6298
6342 6342 6342
6574 6574 6574 6574
7621 7621 7621
7762 7762 7762 7762
8561 8561 8561 8561
9285 9285 9285 9285
10,259 10,259 10,259 10,259
10,441 10,441 10,441
10,831 10,831 10,831 10,831
The PBMCs from healthy donors and septic patients were analyzed by
MALDI-TOF MS
The m/z ratio of peaks is shown. The peaks that were common to septic
patients are underlined
Daumas et al. BMC Infectious Diseases (2018) 18:355 Page 6 of 10
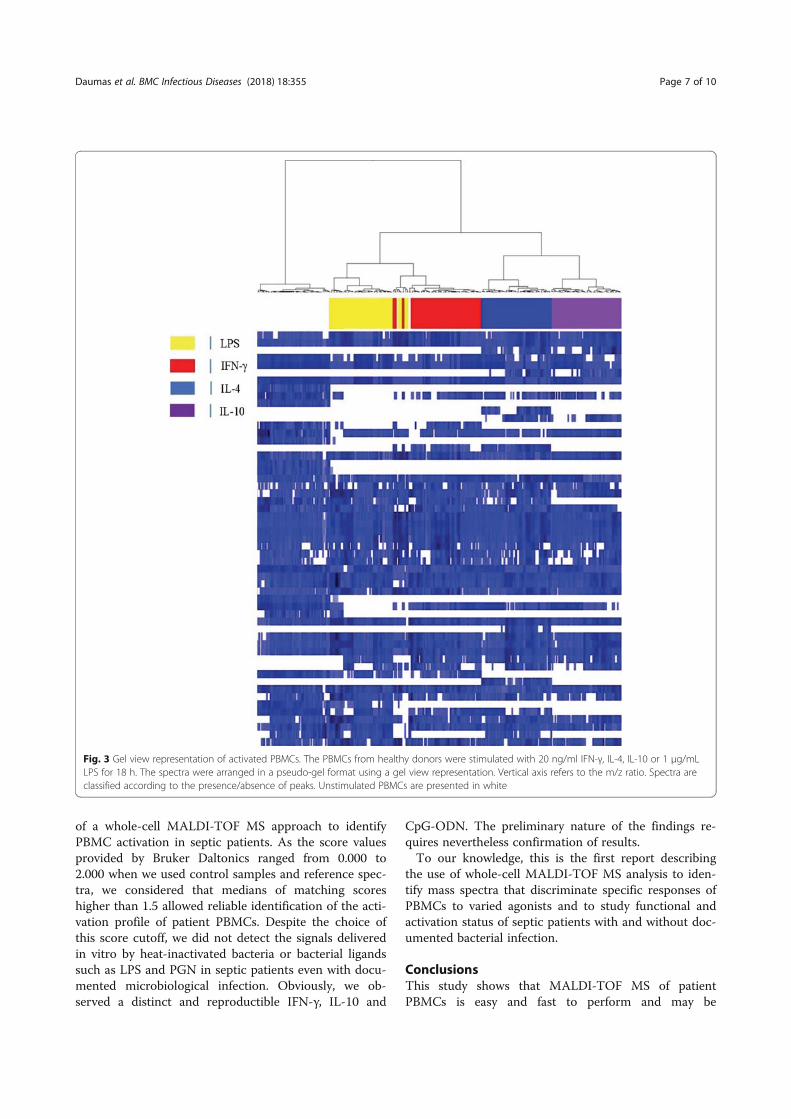
of a whole-cell MALDI-TOF MS approach to identify
PBMC activation in septic patients. As the score values
provided by Bruker Daltonics ranged from 0.000 to
2.000 when we used control samples and reference spec-
tra, we considered that medians of matching scores
higher than 1.5 allowed reliable identification of the acti-
vation profile of patient PBMCs. Despite the choice of
this score cutoff, we did not detect the signals delivered
in vitro by heat-inactivated bacteria or bacterial ligands
such as LPS and PGN in septic patients even with docu-
mented microbiological infection. Obviously, we ob-
served a distinct and reproductible IFN-γ, IL-10 and
CpG-ODN. The preliminary nature of the findings re-
quires nevertheless confirmation of results.
To our knowledge, this is the first report describing
the use of whole-cell MALDI-TOF MS analysis to iden-
tify mass spectra that discriminate specific responses of
PBMCs to varied agonists and to study functional and
activation status of septic patients with and without doc-
umented bacterial infection.
ConclusionsThis study shows that MALDI-TOF MS of patient
PBMCs is easy and fast to perform and may be
Fig. 3 Gel view representation of activated PBMCs. The PBMCs from healthy donors were stimulated with 20 ng/ml IFN-γ, IL-4, IL-10 or 1 μg/mL
LPS for 18 h. The spectra were arranged in a pseudo-gel format using a gel view representation. Vertical axis refers to the m/z ratio. Spectra are
classified according to the presence/absence of peaks. Unstimulated PBMCs are presented in white
Daumas et al. BMC Infectious Diseases (2018) 18:355 Page 7 of 10
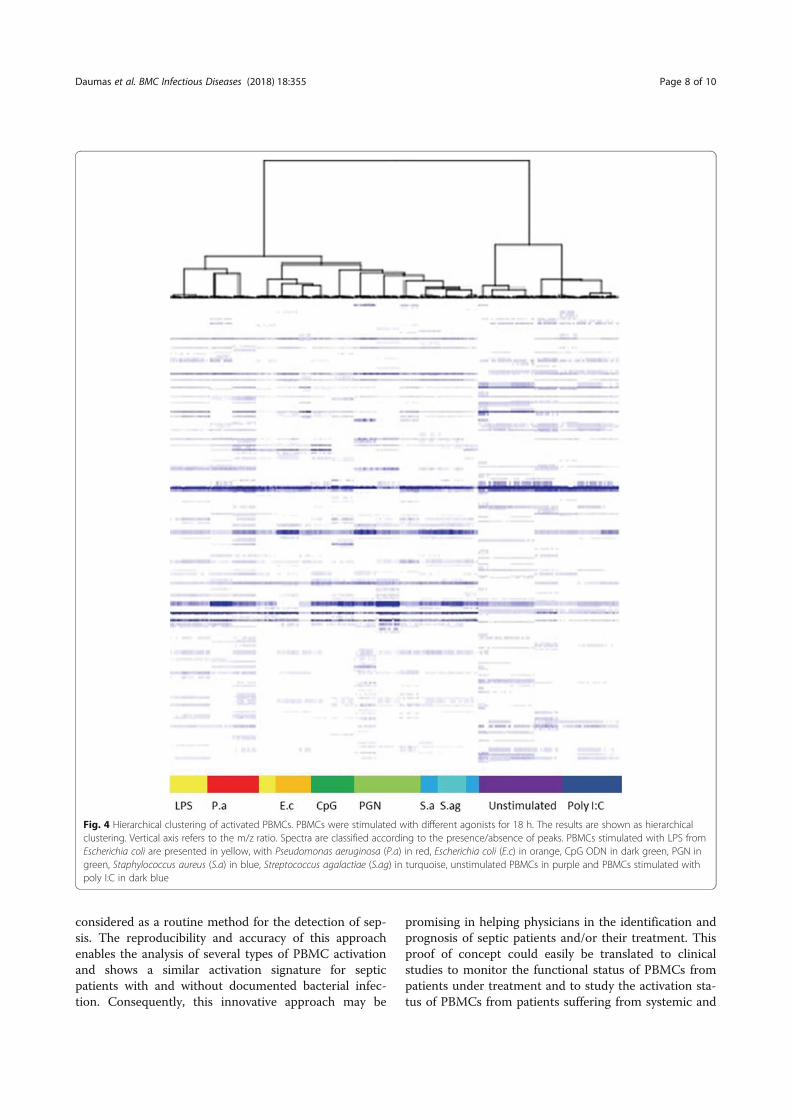
considered as a routine method for the detection of sep-
sis. The reproducibility and accuracy of this approach
enables the analysis of several types of PBMC activation
and shows a similar activation signature for septic
patients with and without documented bacterial infec-
tion. Consequently, this innovative approach may be
promising in helping physicians in the identification and
prognosis of septic patients and/or their treatment. This
proof of concept could easily be translated to clinical
studies to monitor the functional status of PBMCs from
patients under treatment and to study the activation sta-
tus of PBMCs from patients suffering from systemic and
Fig. 4 Hierarchical clustering of activated PBMCs. PBMCs were stimulated with different agonists for 18 h. The results are shown as hierarchical
clustering. Vertical axis refers to the m/z ratio. Spectra are classified according to the presence/absence of peaks. PBMCs stimulated with LPS from
Escherichia coli are presented in yellow, with Pseudomonas aeruginosa (P.a) in red, Escherichia coli (E.c) in orange, CpG ODN in dark green, PGN in
green, Staphylococcus aureus (S.a) in blue, Streptococcus agalactiae (S.ag) in turquoise, unstimulated PBMCs in purple and PBMCs stimulated with
poly I:C in dark blue
Daumas et al. BMC Infectious Diseases (2018) 18:355 Page 8 of 10
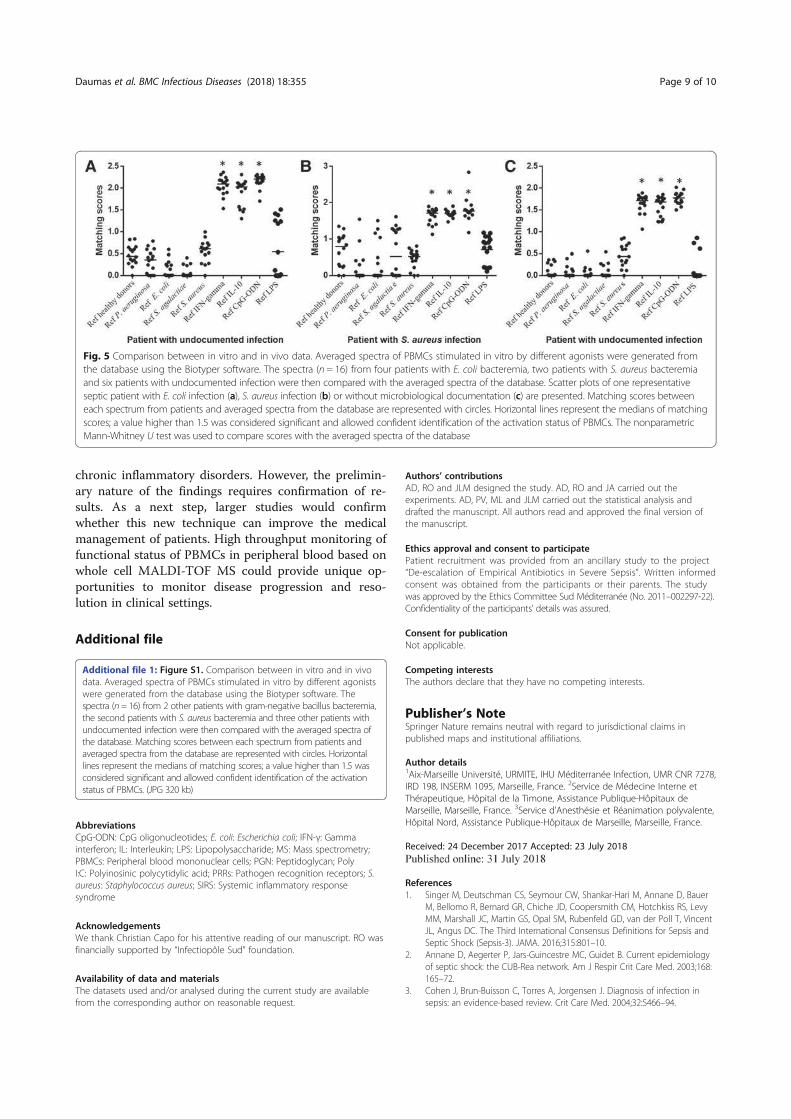
chronic inflammatory disorders. However, the prelimin-
ary nature of the findings requires confirmation of re-
sults. As a next step, larger studies would confirm
whether this new technique can improve the medical
management of patients. High throughput monitoring of
functional status of PBMCs in peripheral blood based on
whole cell MALDI-TOF MS could provide unique op-
portunities to monitor disease progression and reso-
lution in clinical settings.
Additional file
Additional file 1: Figure S1. Comparison between in vitro and in vivo
data. Averaged spectra of PBMCs stimulated in vitro by different agonists
were generated from the database using the Biotyper software. The
spectra (n = 16) from 2 other patients with gram-negative bacillus bacteremia,
the second patients with S. aureus bacteremia and three other patients with
undocumented infection were then compared with the averaged spectra of
the database. Matching scores between each spectrum from patients and
averaged spectra from the database are represented with circles. Horizontal
lines represent the medians of matching scores; a value higher than 1.5 was
considered significant and allowed confident identification of the activation
status of PBMCs. (JPG 320 kb)
Abbreviations
CpG-ODN: CpG oligonucleotides; E. coli: Escherichia coli; IFN-γ: Gamma
interferon; IL: Interleukin; LPS: Lipopolysaccharide; MS: Mass spectrometry;
PBMCs: Peripheral blood mononuclear cells; PGN: Peptidoglycan; Poly
I:C: Polyinosinic polycytidylic acid; PRRs: Pathogen recognition receptors; S.
aureus: Staphylococcus aureus; SIRS: Systemic inflammatory response
syndrome
Acknowledgements
We thank Christian Capo for his attentive reading of our manuscript. RO was
financially supported by “Infectiopôle Sud” foundation.
Availability of data and materials
The datasets used and/or analysed during the current study are available
from the corresponding author on reasonable request.
Authors’ contributions
AD, RO and JLM designed the study. AD, RO and JA carried out the
experiments. AD, PV, ML and JLM carried out the statistical analysis and
drafted the manuscript. All authors read and approved the final version of
the manuscript.
Ethics approval and consent to participate
Patient recruitment was provided from an ancillary study to the project
“De-escalation of Empirical Antibiotics in Severe Sepsis”. Written informed
consent was obtained from the participants or their parents. The study
was approved by the Ethics Committee Sud Méditerranée (No. 2011–002297-22).
Confidentiality of the participants’ details was assured.
Consent for publication
Not applicable.
Competing interests
The authors declare that they have no competing interests.
Publisher’s NoteSpringer Nature remains neutral with regard to jurisdictional claims in
published maps and institutional affiliations.
Author details1Aix-Marseille Université, URMITE, IHU Méditerranée Infection, UMR CNR 7278,
IRD 198, INSERM 1095, Marseille, France. 2Service de Médecine Interne et
Thérapeutique, Hôpital de la Timone, Assistance Publique-Hôpitaux de
Marseille, Marseille, France. 3Service d’Anesthésie et Réanimation polyvalente,
Hôpital Nord, Assistance Publique-Hôpitaux de Marseille, Marseille, France.
Received: 24 December 2017 Accepted: 23 July 2018
References
1. Singer M, Deutschman CS, Seymour CW, Shankar-Hari M, Annane D, Bauer
M, Bellomo R, Bernard GR, Chiche JD, Coopersmith CM, Hotchkiss RS, Levy
MM, Marshall JC, Martin GS, Opal SM, Rubenfeld GD, van der Poll T, Vincent
JL, Angus DC. The Third International Consensus Definitions for Sepsis and
Septic Shock (Sepsis-3). JAMA. 2016;315:801–10.
2. Annane D, Aegerter P, Jars-Guincestre MC, Guidet B. Current epidemiology
of septic shock: the CUB-Rea network. Am J Respir Crit Care Med. 2003;168:
165–72.
3. Cohen J, Brun-Buisson C, Torres A, Jorgensen J. Diagnosis of infection in
sepsis: an evidence-based review. Crit Care Med. 2004;32:S466–94.
Fig. 5 Comparison between in vitro and in vivo data. Averaged spectra of PBMCs stimulated in vitro by different agonists were generated from
the database using the Biotyper software. The spectra (n = 16) from four patients with E. coli bacteremia, two patients with S. aureus bacteremia
and six patients with undocumented infection were then compared with the averaged spectra of the database. Scatter plots of one representative
septic patient with E. coli infection (a), S. aureus infection (b) or without microbiological documentation (c) are presented. Matching scores between
each spectrum from patients and averaged spectra from the database are represented with circles. Horizontal lines represent the medians of matching
scores; a value higher than 1.5 was considered significant and allowed confident identification of the activation status of PBMCs. The nonparametric
Mann-Whitney U test was used to compare scores with the averaged spectra of the database
Daumas et al. BMC Infectious Diseases (2018) 18:355 Page 9 of 10
4. Dellinger RP, Levy MM, Rhodes A, Annane D, Gerlach H, Opal SM,
Sevransky JE, Sprung CL, Douglas IS, Jaeschke R, Osborn TM, Nunnally
ME, Townsend SR, Reinhart K, Kleinpell RM, Angus DC, Deutschman CS,
Machado FR, Rubenfeld GD, Webb S, Beale RJ, Vincent JL, Moreno R,
Surviving Sepsis Campaign Guidelines Committee including The
Pediatric Subgroup. Surviving Sepsis Campaign: international guidelines
for management of severe sepsis and septic shock, 2012. Intensive Care
Med. 2013;39:165–228.
5. Adrie C, Alberti C, Chaix-Couturier C, Azoulay E, De Lassence A, Cohen
Y, Meshaka P, Cheval C, Thuong M, Troché G, Garrouste-Orgeas M,
Timsit JF. Epidemiology and economic evaluation of severe sepsis in
France: age, severity, infection site, and place of acquisition
(community, hospital, or intensive care unit) as determinants of
workload and cost. J Crit Care. 2005;20:46–58.
6. Levy MM, Fink MP, Marshall JC, Abraham E, Angus D, Cook D, Cohen
J, Opal SM, Vincent JL, Ramsay G. 2001 SCCM/ESICM/ACCP/ATS/SIS
international Sepsis definitions conference. Crit Care Med. 2003;3:
1250–6.
7. Birmingham MC, Hassett JM, Schentag JJ, Paladino JA. Assessing
antibacterial pharmacoeconomics in the intensive care unit.
Pharmacoeconomics. 1997;12:637–47.
8. Rivers E, Nguyen B, Havstad S, Ressler J, Muzzin A, Knoblich B, Peterson E,
Tomlanovich M, Early Goal-Directed Therapy Collaborative Group. Early
goal-directed therapy in the treatment of severe sepsis and septic shock. N
Engl J Med. 2001;345:1368–77.
9. Dellinger RP. The Surviving Sepsis Campaign: where have we been and
where are we going? Cleve Clin J Med. 2015;82:237–44.
10. Bochud PY, Bonten M, Marchetti O, Calandra T. Antimicrobial therapy for
patients with severe sepsis and septic shock: an evidence-based review. Crit
Care Med. 2004;32:S495–512.
11. Tang BM, Eslick GD, Craig JC, McLean AS. Accuracy of procalcitonin for
sepsis diagnosis in critically ill patients: systematic review and meta-analysis.
Lancet Infect Dis. 2007;7:210–7.
12. Adib-Conquy M, Monchi M, Goulenok C, Laurent I, Thuong M, Cavaillon JM,
Adrie C. Increased plasma levels of soluble triggering receptor expressed on
myeloid cells 1 and procalcitonin after cardiac surgery and cardiac arrest
without infection. Shock. 2007;28:406–10.
13. Bozza FA, Salluh JI, Japiassu AM, Soares M, Assis EF, Gomes RN, et al.
Cytokine profiles as markers of disease severity in sepsis: a multiplex
analysis. Crit Care. 2007;11:R49.
14. Drancourt M. Detection of microorganisms in blood specimens using
matrix-assisted laser desorption ionization time-of-flight mass spectrometry:
a review. Clin Microbiol Infect. 2010;16:1620–5.
15. Ferreira L, Sánchez-Juanes F, González-Avila M, Cembrero-Fuciños D,
Herrero-Hernández A, González-Buitrago JM, Muñoz-Bellido JL. Direct
identification of urinary tract pathogens from urine samples by matrix-
assisted laser desorption ionization-time of flight mass spectrometry. J Clin
Microbiol. 2010;48:2110–5.
16. Singhal N, Kumar M, Kanaujia PK, Virdi JS. MALDI-TOF mass spectrometry: an
emerging technology for microbial identification and diagnosis. Front
Microbiol. 2015;6:791.
17. Ouedraogo R, Flaudrops C, Ben Amara A, Capo C, Raoult D, Mege JL. Global
analysis of circulating immune cells by matrix-assisted laser desorption
ionization time-of-flight mass spectrometry. PLoS One. 2010;27(5):e13691.
18. Buchanan CM, Malik AS, Cooper GJ. Direct visualisation of peptide
hormones in cultured pancreatic islet alpha- and beta-cells by intact-cell
mass spectrometry. Rapid Commun Mass Spectrom. 2007;21:3452–8.
19. Munteanu B, von Reitzenstein C, Hänsch GM, Meyer B, Hopf C. Sensitive,
robust and automated protein analysis of cell differentiation and of primary
human blood cells by intact cell MALDI mass spectrometry biotyping. Anal
Bioanal Chem. 2012;8:2277–86.
20. Ouedraogo R, Daumas A, Ghigo E, Capo C, Mege JL, Textoris J. Whole-cell
MALDI-TOF MS: a new tool to assess the multifaceted activation of
macrophages. J Proteome. 2012;75:5523–32.
21. Portevin D, Pflüger V, Otieno P, Brunisholz R, Vogel G, Daubenberger C.
Quantitative whole-cell MALDI-TOF MS fingerprints distinguishes human
monocyte sub-populations activated by distinct microbial ligands. BMC
Biotechnol. 2015;15:24.
22. Mehraj V, Textoris J, Ben Amara A, Ghigo E, Raoult D, Capo C, Mege JL.
Monocyte responses in the context of Q fever: from a static polarized
model to a kinetic model of activation. J Infect Dis. 2013;208:942–51.
23. Ouedraogo R, Daumas A, Capo C, Mege JL, Textoris J. Whole-cell MALDI-
TOF mass spectrometry is an accurate and rapid method to analyze
different modes of macrophage activation. J Vis Exp. 2013;26:50926.
24. Biteker FS, Çaylak SD, Sözen H. Biomarkers in sepsis. Am J Emerg Med. 2016;
34:924-5.
25. Biron BM, Ayala A, Lomas-Neira JL. Biomarkers for Sepsis: what is and what
might be? Biomark Insights. 2015;10:7–17.
26. Markwart R, Condotta SA, Requardt RP, Borken F, Schubert K, Weigel C,
Bauer M, Griffith TS, Förster M, Brunkhorst FM, Badovinac VP, Rubio I.
Immunosuppression after sepsis: systemic inflammation and sepsis induce a
loss of naïve T-cells but no enduring cell-autonomous defects in T-cell
function. PLoS One. 2014;9:e115094.
27. Engel MF, Paling FP, Hoepelman AI, van der Meer V, Oosterheert JJ. Evaluating
the evidence for the implementation of C-reactive protein measurement in
adult patients with suspected lower respiratory tract infection in primary care:
a systematic review. Fam Pract. 2012;29:383–93.
28. Hotchkiss RS, Karl IE. The pathophysiology and treatment of sepsis. N Engl J
Med. 2003;348:138–50.
29. Peng Q, O’Loughin JL, Humphrey MB. DOK 3 negatively regulates LPS
responses and endotoxin tolerance. PLoS One. 2012;7:e39967.
Daumas et al. BMC Infectious Diseases (2018) 18:355 Page 10 of 10
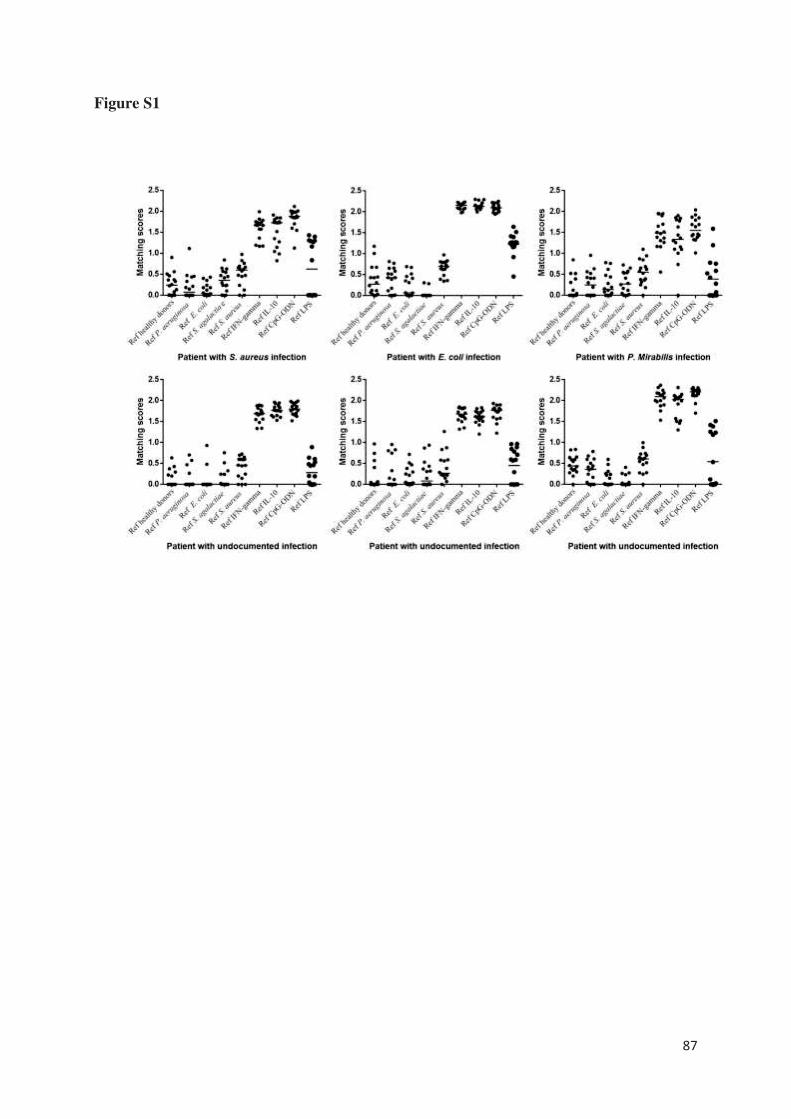
87
Figure S1
88
Granulomatous response to Coxiella burnetii, the agent of Q
fever: the lessons from gene expression analysis
Faugaret D, Ben Amara A, Alingrin J, Daumas A, Delaby A, Lépolard C, Raoult D, Textoris
J, Mège JL.
Front Cell Infect Microbiol. 2014 Dec 15;4:172.
doi: 10.3389/fcimb.2014.00172. eCollection 2014.
Le granulome est le résultat d’une coopération intense entre les cellules de la réponse innée et
adaptative dans le but d’éliminer des agents infectieux plutôt rebelles. La formation de
granulomes constitue la signature histologique de diverses pathologies infectieuses, telles que
la fièvre Q et la tuberculose.
La fièvre Q est une zoonose causée par une bactérie intracellulaire, Coxiella burnetti, transmise
par voie respiratoire et plus rarement par voie digestive ou piqûre de tiques. Elle n’est
symptomatique que dans 10 % des cas : c’est la fièvre Q aiguë. Elle est alors responsable de
syndrome pseudo-grippal, de pneumopathie atypique et d’hépatite aiguë [125,126]. Dans la
majorité des cas, la maladie est spontanément résolutive. Sur le plan anatomopathologique, on
retrouve des granulomes inflammatoires centrés par une vacuole lipidique réalisant la classique
« image en beignet » [127]. Dans 5 % des cas environ, la bactérie n’est pas contrôlée par le
système immunitaire et va persister, principalement au niveau des valves cardiaques, des
prothèses ou anévrismes vasculaires, mais aussi de façon plus rare au niveau pulmonaire, utérin,
ostéoarticulaire ou ganglionnaire [125,126]. Une caractéristique commune de ces infections
persistantes est leur évolution lente sur plusieurs mois à années et le plus souvent de façon
asymptomatique. L’immunodépression favorise ces infections persistantes. La fièvre Q
chronique est caractérisée par l’absence de granulome et la présence d'infiltrats leucocytaires
bordant des zones de nécrose [128].
La tuberculose, qui demeure la 3ème cause infectieuse de mortalité dans le monde, touche
principalement les populations des pays en voie de développement où vivant dans la précarité.
Elle est due à Mycobacterium tuberculosis, un bacille aérobie transmis par voie respiratoire.
89
L'histoire naturelle de la maladie comprend 3 étapes : contamination, tuberculose-infection,
tuberculose-maladie. La primo-infection tuberculeuse ou tuberculose-infection se manifeste par
le développement d'une réponse immunologique plus ou moins intense vis à vis du bacille
tuberculeux avec la formation de granulomes « tuberculeux » caractérisés par la présence de
nécrose caséeuse [106, 120]. Le développement des granulomes est asymptomatique (aucun
signe clinique et radiologique). La seule manifestation est le virage des réactions cutanées à la
tuberculine (après intradermo-réaction ou la positivité des tests IGRA (Quantiféron® et
TspotTB® qui explorent la production d’IFN-γ de l’individu en réponse à des antigènes
spécifiques de Mycobacterium tuberculosis). Dans 90 % des cas, l’infection est maîtrisée par la
réaction immunitaire de l’individu. Certains granulomes peuvent persister des années, voire
même toute la vie, ils sont souvent calcifiés et ainsi visibles radiologiquement. Les bacilles dans
ces foyers persistent mais ne se multiplient pas activement. Ils ont un métabolisme ralenti
(bacilles dormants). On parle d’infection tuberculeuse latente. Dans les 10 % de cas restant
(quantité abondante de la bactérie, enfant ou état d'immunodépression), l’infection n’est pas
maitrisée et le bacille continue de se multiplier évoluant vers la tuberculose-maladie
symptomatique à la fois sur le plan clinique et radiologique. Une tuberculose-maladie peut aussi
survenir à distance de la tuberculose-infection. Il s’agit de réactivations soit en lien avec le
vieillissement, soit dans un contexte d’immunodépression [129].
Afin d’explorer la réponse immunitaire granulomateuse à Coxiella burnetti et Mycobacterium
bovis (BCG), l’évaluation in vitro de la formation des granulomes représente une approche
globale simple. J’ai pu participer à l’étude de D. Faugaret sur l’analyse du transcriptome des
cellules des granulomes formés en réponse à Coxiella burnetti et Mycobacterium bovis (BCG).
Il a été mis en évidence qu’environ 60% des gènes modulés étaient communs aux granulomes
induits par ces 2 agents pathogènes. Un quart des gènes était spécifiquement lié à la réponse à
Coxiella burnetti et 14% à la réponse à Mycoplasma bovis (BCG).
Parmi les gènes modulés de façon similaire, on retient des gènes impliqués dans le recrutement
des cellules mononuclées confirmant le rôle majeur des chémokines notamment CLL2 et CLL5
qui inhibées empêchent la formation des granulomes. Cependant le rôle de CLL2 semble
prédominant puisque le blocage de CCR5 n’affecte pas par contre leur formation. Une signature
transcriptionnelle de 206 gènes dont l’expression est modulée entre les granulomes à Coxiella
burnetti et Mycobacterium bovis (BCG) a été étudiée. Parmi ces gènes, on retrouve des gènes
impliqués dans la reconnaissance des pathogènes, la réponse inflammatoire et anti-
90
inflammatoire, l’activité microbicide mais aussi la mort cellulaire. Ainsi, de nombreux gènes
de l’inflammation sont down-régulés avec Coxiella burnetti et up-régulés avec BCG. Une
modulation inverse est retrouvée pour les gènes de la réponse anti-inflammatoire. Cependant,
on observe aussi une surexpression de gènes codant pour des médiateurs de l’inflammation avec
Coxiella burnetti comme EPHB2. L’expression des gènes impliqués dans la microbicidie est
augmentée en réponse à Coxiella burnetti avec notamment des gènes de la réponse à l’IFN type
I ou ISGs (rencontrés dans la réponse antivirale mais aussi en réponse à des bactéries ou
composants bactériens comme le LPS), et diminuée pour BCG. En effet, l’expression d’IFIT1
et d’OAS2 est significativement augmentée dans les cellules des granulomes induits par
Coxiella burnetti par rapport à BCG. Enfin, Coxiella burnetti diminue l’expression de gènes
impliqués dans la mort cellulaire alors qu’ils sont surexprimés avec BCG. Ainsi, FASLG et
GNLY sont significativement surexprimés dans les cellules des granulomes induits par BCG par
rapport à Coxiella burnetti.
Enfin, les macrophages représentant environ 40% des cellules constituant les granulomes, on
s’est intéressé à leur polarisation au sein des granulomes à travers l’étude de la modulation des
gènes activés lors de la stimulation des macrophages par l’IFN- (9 gènes M1) ou par l’IL-4 et
l’IL-10 (9 gènes M2) sélectionnées à partir de données publiques. Des macrophages stimulés
par ces cytokines ont été pris pour contrôles. Cette analyse a montré que les cellules des
granulomes expriment un profil plutôt M1 correspondant à un phénotype inflammatoire et
microbicide concordant avec les taux élevés de TNF et IFN- mesurés dans les surnageants.
Cette analyse du transcriptome des cellules des granulomes semble dans la fièvre Q
correspondre à l’évolution naturelle de la maladie qui est l’élimination de Coxiella burnetti et
la guérison alors que l’absence de formation de granulomes est retrouvée dans les formes
chroniques de la maladie.
ORIGINAL RESEARCH ARTICLEpublished: 15 December 2014
doi: 10.3389/fcimb.2014.00172
Granulomatous response to Coxiella burnetii, the agent ofQ fever: the lessons from gene expression analysis
Delphine Faugaret1,2, Amira Ben Amara1, Julie Alingrin1, Aurélie Daumas 1, Amélie Delaby1,3,Catherine Lépolard1, Didier Raoult1, Julien Textoris1,4 and Jean-Louis Mège1*
1Aix Marseille Université, URMITE, UMR CNRS 7278, IRD 198, INSERM 1095, Marseille, France
2 AltraBio SAS, Lyon, France3 Centre d’Immunologie de Marseille-Luminy, Parc Scientifique et Technologique, Marseille, France4 Unité Mixte BioMérieux-HCL, Hôpital Edouard Herriot - Pav P, Lyon, France
Edited by:
Benjamin Coiffard, Hôpital Nord,
France
Reviewed by:
Janakiram Seshu, The University of
Texas at San Antonio, USA
Subramanian Dhandayuthapani,
Texas Tech Health Sciences Center,
USA
*Correspondence:
Jean-Louis Mège, Aix Marseille
Université, URMITE, UMR CNRS
7278, IRD 198, INSERM 1095, 27
Bld. Jean Moulin, 13005 Marseille,
France
e-mail: [email protected]
The formation of granulomas is associated with the resolution of Q fever, a zoonosis due
to Coxiella burnetii; however the molecular mechanisms of granuloma formation remain
poorly understood. We generated human granulomas with peripheral blood mononuclear
cells (PBMCs) and beads coated with C. burnetii, using BCG extracts as controls. A
microarray analysis showed dramatic changes in gene expression in granuloma cells of
which more than 50% were commonly modulated genes in response to C. burnetii and
BCG. They included M1-related genes and genes related to chemotaxis. The inhibition of
the chemokines, CCL2 and CCL5, directly interfered with granuloma formation. C. burnetii
granulomas also expressed a specific transcriptional profile that was essentially enriched
in genes associated with type I interferon response. Our results showed that granuloma
formation is associated with a core of transcriptional response based on inflammatory
genes. The specific granulomatous response to C. burnetii is characterized by the
activation of type 1 interferon pathway.
Keywords: granuloma, Q fever, Coxiella burnetii , BCG, transcriptome, type 1 interferon pathway
INTRODUCTIONQ fever is a worldwide zoonosis caused by Coxiella burnetii (Mege
et al., 1997). The primary C. burnetii infection leads to isolated
fever, pneumonia, or hepatitis in 40% of exposed individuals. C.
burnetii infection may become chronic in patients with valvu-
lar lesions, pregnant women, or immuno-compromised patients.
In contrast with acute Q fever where the outcome is usually
favorable, chronic Q fever is characterized by a long-term drug
treatment and persistent risk of relapses. Interestingly, tissue
granulomas are present in patients with acute Q fever. In chronic
Q fever, granulomas are absent, replaced by lymphocyte infil-
trates (Raoult et al., 2005), suggesting that granulomas play an
important role in the resolution of Q fever.
Granulomas, defined as tissue collections of macrophages, are
generated in response to various microorganisms (Zumla and
James, 1996). Their organization varies according to the type
of microorganism. In humans, C. burnetii-induced granulomas,
which are paucibacillary, are composed of a lipid vacuole sur-
rounded by a fibrinoid ring, the “doughnut granuloma” (Srigley
et al., 1985; Travis et al., 1986). In contrast, tuberculous gran-
ulomas, which are multibacillary, consist of a necrotic core
containing bacilli, enclosed by macrophages and surrounded by
lymphocytes (Ulrichs and Kaufmann, 2006).
Granulomas are not static organizations but are characterized
by continual remodeling and interactions between cell partners
(Ramakrishnan, 2012; Shaler et al., 2013). After initial uptake
of microorganisms by resident macrophages, the granuloma
formation is initiated by recruiting macrophages and blood-
derived myeloid cells. The recruitment of activated T-cells by
these nascent granulomas completes granuloma formation, and
renders them functional (Egen et al., 2008). The main function
of granulomas is to contain infectious agents within a limited
area, thus restricting the spread of pathogens. Once the infection
is contained, the granuloma cells participate in the destruction
of infectious agents. Indeed, wild type mice clear mycobacterial
infection through granuloma formation whereas mycobacteria
disseminate and granulomas are absent in mice that do not
express interferon-γ (Cooper et al., 1993). In the majority of
patients with tuberculosis, the presence of calcified granuloma-
tous lesions is associated with a controlled infection (Ulrichs and
Kaufmann, 2006). However, in others, mycobacteria induce the
necrosis of infected macrophages, resulting in a caseum at the
center of granulomas. This accumulation of caseum leads to col-
lapsing granulomas and the spread of bacteria (Russell et al.,
2009).
Studying granuloma formation in mice requires invasive
methods that are not appropriate for human studies. A method
was recently developed to generate human granulomas in vitro
using peripheral blood mononuclear cells (PBMCs) co-cultured
with beads coated with BCG (Puissegur et al., 2004; Delaby
et al., 2010) or C. burnetii extracts (Delaby et al., 2010). This
method enables to follow the initial events of granuloma forma-
tion and to investigate the molecular mechanisms of granulomas
(Egen et al., 2008; Delaby et al., 2012). In this study, we used a
Frontiers in Cellular and Infection Microbiology www.frontiersin.org December 2014 | Volume 4 | Article 172 | 1
CELLULAR AND INFECTION MICROBIOLOGY
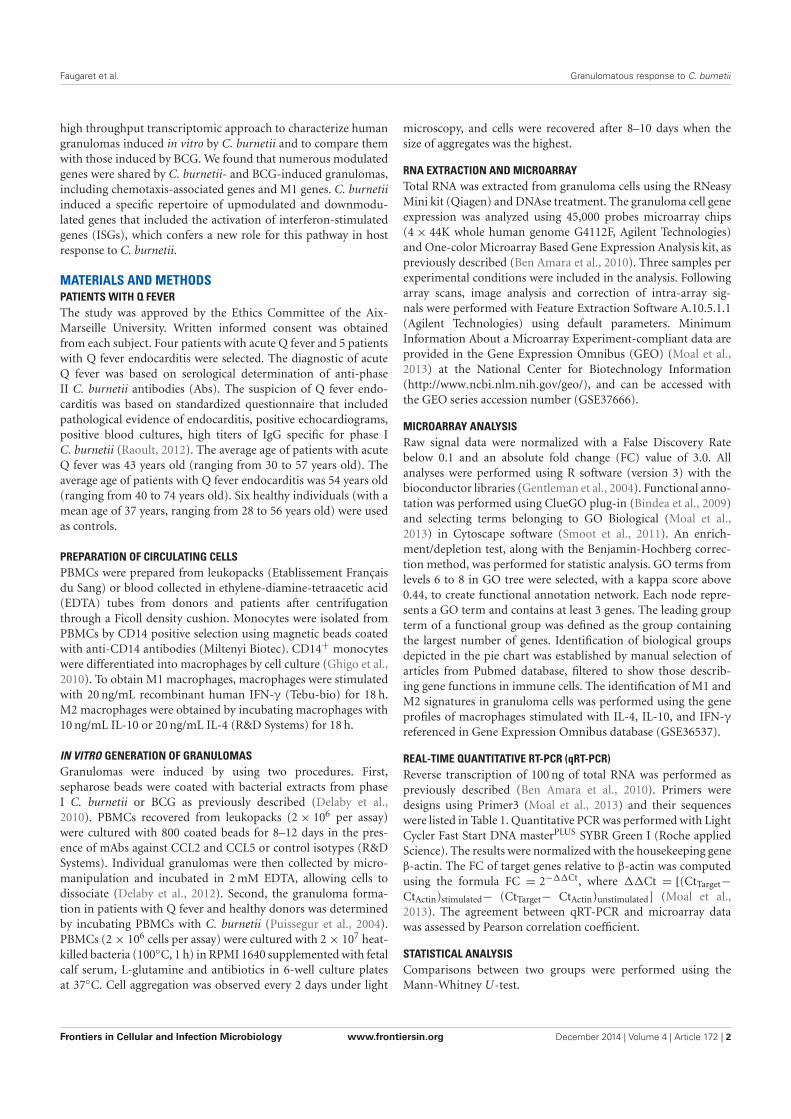
Faugaret et al. Granulomatous response to C. burnetii
high throughput transcriptomic approach to characterize human
granulomas induced in vitro by C. burnetii and to compare them
with those induced by BCG. We found that numerous modulated
genes were shared by C. burnetii- and BCG-induced granulomas,
including chemotaxis-associated genes and M1 genes. C. burnetii
induced a specific repertoire of upmodulated and downmodu-
lated genes that included the activation of interferon-stimulated
genes (ISGs), which confers a new role for this pathway in host
response to C. burnetii.
MATERIALS AND METHODSPATIENTS WITH Q FEVER
The study was approved by the Ethics Committee of the Aix-
Marseille University. Written informed consent was obtained
from each subject. Four patients with acute Q fever and 5 patients
with Q fever endocarditis were selected. The diagnostic of acute
Q fever was based on serological determination of anti-phase
II C. burnetii antibodies (Abs). The suspicion of Q fever endo-
carditis was based on standardized questionnaire that included
pathological evidence of endocarditis, positive echocardiograms,
positive blood cultures, high titers of IgG specific for phase I
C. burnetii (Raoult, 2012). The average age of patients with acute
Q fever was 43 years old (ranging from 30 to 57 years old). The
average age of patients with Q fever endocarditis was 54 years old
(ranging from 40 to 74 years old). Six healthy individuals (with a
mean age of 37 years, ranging from 28 to 56 years old) were used
as controls.
PREPARATION OF CIRCULATING CELLS
PBMCs were prepared from leukopacks (Etablissement Français
du Sang) or blood collected in ethylene-diamine-tetraacetic acid
(EDTA) tubes from donors and patients after centrifugation
through a Ficoll density cushion. Monocytes were isolated from
PBMCs by CD14 positive selection using magnetic beads coated
with anti-CD14 antibodies (Miltenyi Biotec). CD14+ monocytes
were differentiated into macrophages by cell culture (Ghigo et al.,
2010). To obtain M1 macrophages, macrophages were stimulated
with 20 ng/mL recombinant human IFN-γ (Tebu-bio) for 18 h.
M2 macrophages were obtained by incubating macrophages with
10 ng/mL IL-10 or 20 ng/mL IL-4 (R&D Systems) for 18 h.
IN VITRO GENERATION OF GRANULOMAS
Granulomas were induced by using two procedures. First,
sepharose beads were coated with bacterial extracts from phase
I C. burnetii or BCG as previously described (Delaby et al.,
2010). PBMCs recovered from leukopacks (2 × 10⁶ per assay)
were cultured with 800 coated beads for 8–12 days in the pres-
ence of mAbs against CCL2 and CCL5 or control isotypes (R&D
Systems). Individual granulomas were then collected by micro-
manipulation and incubated in 2 mM EDTA, allowing cells to
dissociate (Delaby et al., 2012). Second, the granuloma forma-
tion in patients with Q fever and healthy donors was determined
by incubating PBMCs with C. burnetii (Puissegur et al., 2004).
PBMCs (2 × 10⁶ cells per assay) were cultured with 2 × 10⁷ heat-
killed bacteria (100◦C, 1 h) in RPMI 1640 supplemented with fetal
calf serum, L-glutamine and antibiotics in 6-well culture plates
at 37◦C. Cell aggregation was observed every 2 days under light
microscopy, and cells were recovered after 8–10 days when the
size of aggregates was the highest.
RNA EXTRACTION AND MICROARRAY
Total RNA was extracted from granuloma cells using the RNeasy
Mini kit (Qiagen) and DNAse treatment. The granuloma cell gene
expression was analyzed using 45,000 probes microarray chips
(4 × 44K whole human genome G4112F, Agilent Technologies)
and One-color Microarray Based Gene Expression Analysis kit, as
previously described (Ben Amara et al., 2010). Three samples per
experimental conditions were included in the analysis. Following
array scans, image analysis and correction of intra-array sig-
nals were performed with Feature Extraction Software A.10.5.1.1
(Agilent Technologies) using default parameters. Minimum
Information About a Microarray Experiment-compliant data are
provided in the Gene Expression Omnibus (GEO) (Moal et al.,
2013) at the National Center for Biotechnology Information
(http://www.ncbi.nlm.nih.gov/geo/), and can be accessed with
the GEO series accession number (GSE37666).
MICROARRAY ANALYSIS
Raw signal data were normalized with a False Discovery Rate
below 0.1 and an absolute fold change (FC) value of 3.0. All
analyses were performed using R software (version 3) with the
bioconductor libraries (Gentleman et al., 2004). Functional anno-
tation was performed using ClueGO plug-in (Bindea et al., 2009)
and selecting terms belonging to GO Biological (Moal et al.,
2013) in Cytoscape software (Smoot et al., 2011). An enrich-
ment/depletion test, along with the Benjamin-Hochberg correc-
tion method, was performed for statistic analysis. GO terms from
levels 6 to 8 in GO tree were selected, with a kappa score above
0.44, to create functional annotation network. Each node repre-
sents a GO term and contains at least 3 genes. The leading group
term of a functional group was defined as the group containing
the largest number of genes. Identification of biological groups
depicted in the pie chart was established by manual selection of
articles from Pubmed database, filtered to show those describ-
ing gene functions in immune cells. The identification of M1 and
M2 signatures in granuloma cells was performed using the gene
profiles of macrophages stimulated with IL-4, IL-10, and IFN-γ
referenced in Gene Expression Omnibus database (GSE36537).
REAL-TIME QUANTITATIVE RT-PCR (qRT-PCR)
Reverse transcription of 100 ng of total RNA was performed as
previously described (Ben Amara et al., 2010). Primers were
designs using Primer3 (Moal et al., 2013) and their sequences
were listed in Table 1. Quantitative PCR was performed with Light
Cycler Fast Start DNA masterPLUS SYBR Green I (Roche applied
Science). The results were normalized with the housekeeping gene
β-actin. The FC of target genes relative to β-actin was computed
using the formula FC = 2−��Ct, where ��Ct = [(CtTarget−
CtActin)stimulated− (CtTarget− CtActin)unstimulated] (Moal et al.,
2013). The agreement between qRT-PCR and microarray data
was assessed by Pearson correlation coefficient.
STATISTICAL ANALYSIS
Comparisons between two groups were performed using the
Mann-Whitney U-test.
Frontiers in Cellular and Infection Microbiology www.frontiersin.org December 2014 | Volume 4 | Article 172 | 2
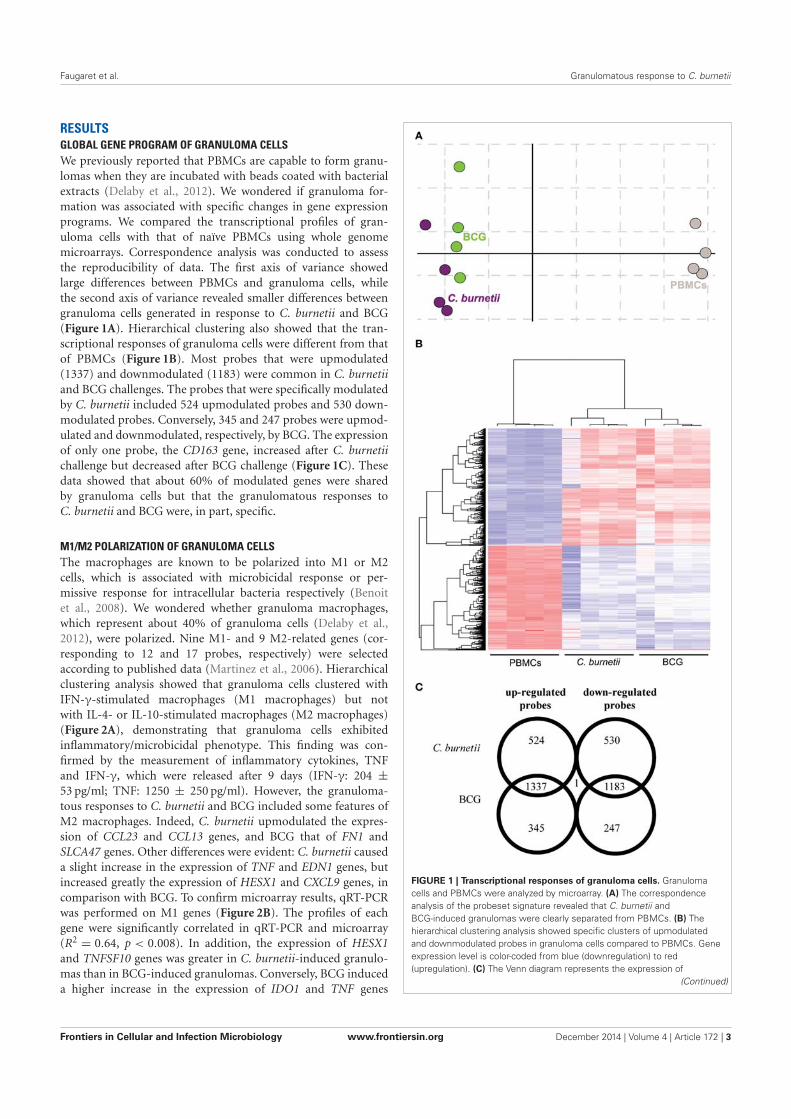
Faugaret et al. Granulomatous response to C. burnetii
RESULTSGLOBAL GENE PROGRAM OF GRANULOMA CELLS
We previously reported that PBMCs are capable to form granu-
lomas when they are incubated with beads coated with bacterial
extracts (Delaby et al., 2012). We wondered if granuloma for-
mation was associated with specific changes in gene expression
programs. We compared the transcriptional profiles of gran-
uloma cells with that of naïve PBMCs using whole genome
microarrays. Correspondence analysis was conducted to assess
the reproducibility of data. The first axis of variance showed
large differences between PBMCs and granuloma cells, while
the second axis of variance revealed smaller differences between
granuloma cells generated in response to C. burnetii and BCG
(Figure 1A). Hierarchical clustering also showed that the tran-
scriptional responses of granuloma cells were different from that
of PBMCs (Figure 1B). Most probes that were upmodulated
(1337) and downmodulated (1183) were common in C. burnetii
and BCG challenges. The probes that were specifically modulated
by C. burnetii included 524 upmodulated probes and 530 down-
modulated probes. Conversely, 345 and 247 probes were upmod-
ulated and downmodulated, respectively, by BCG. The expression
of only one probe, the CD163 gene, increased after C. burnetii
challenge but decreased after BCG challenge (Figure 1C). These
data showed that about 60% of modulated genes were shared
by granuloma cells but that the granulomatous responses to
C. burnetii and BCG were, in part, specific.
M1/M2 POLARIZATION OF GRANULOMA CELLS
The macrophages are known to be polarized into M1 or M2
cells, which is associated with microbicidal response or per-
missive response for intracellular bacteria respectively (Benoit
et al., 2008). We wondered whether granuloma macrophages,
which represent about 40% of granuloma cells (Delaby et al.,
2012), were polarized. Nine M1- and 9 M2-related genes (cor-
responding to 12 and 17 probes, respectively) were selected
according to published data (Martinez et al., 2006). Hierarchical
clustering analysis showed that granuloma cells clustered with
IFN-γ-stimulated macrophages (M1 macrophages) but not
with IL-4- or IL-10-stimulated macrophages (M2 macrophages)
(Figure 2A), demonstrating that granuloma cells exhibited
inflammatory/microbicidal phenotype. This finding was con-
firmed by the measurement of inflammatory cytokines, TNF
and IFN-γ, which were released after 9 days (IFN-γ: 204 ±
53 pg/ml; TNF: 1250 ± 250 pg/ml). However, the granuloma-
tous responses to C. burnetii and BCG included some features of
M2 macrophages. Indeed, C. burnetii upmodulated the expres-
sion of CCL23 and CCL13 genes, and BCG that of FN1 and
SLCA47 genes. Other differences were evident: C. burnetii caused
a slight increase in the expression of TNF and EDN1 genes, but
increased greatly the expression of HESX1 and CXCL9 genes, in
comparison with BCG. To confirm microarray results, qRT-PCR
was performed on M1 genes (Figure 2B). The profiles of each
gene were significantly correlated in qRT-PCR and microarray
(R2 = 0.64, p < 0.008). In addition, the expression of HESX1
and TNFSF10 genes was greater in C. burnetii-induced granulo-
mas than in BCG-induced granulomas. Conversely, BCG induced
a higher increase in the expression of IDO1 and TNF genes
FIGURE 1 | Transcriptional responses of granuloma cells. Granuloma
cells and PBMCs were analyzed by microarray. (A) The correspondence
analysis of the probeset signature revealed that C. burnetii and
BCG-induced granulomas were clearly separated from PBMCs. (B) The
hierarchical clustering analysis showed specific clusters of upmodulated
and downmodulated probes in granuloma cells compared to PBMCs. Gene
expression level is color-coded from blue (downregulation) to red
(upregulation). (C) The Venn diagram represents the expression of
(Continued)
Frontiers in Cellular and Infection Microbiology www.frontiersin.org December 2014 | Volume 4 | Article 172 | 3
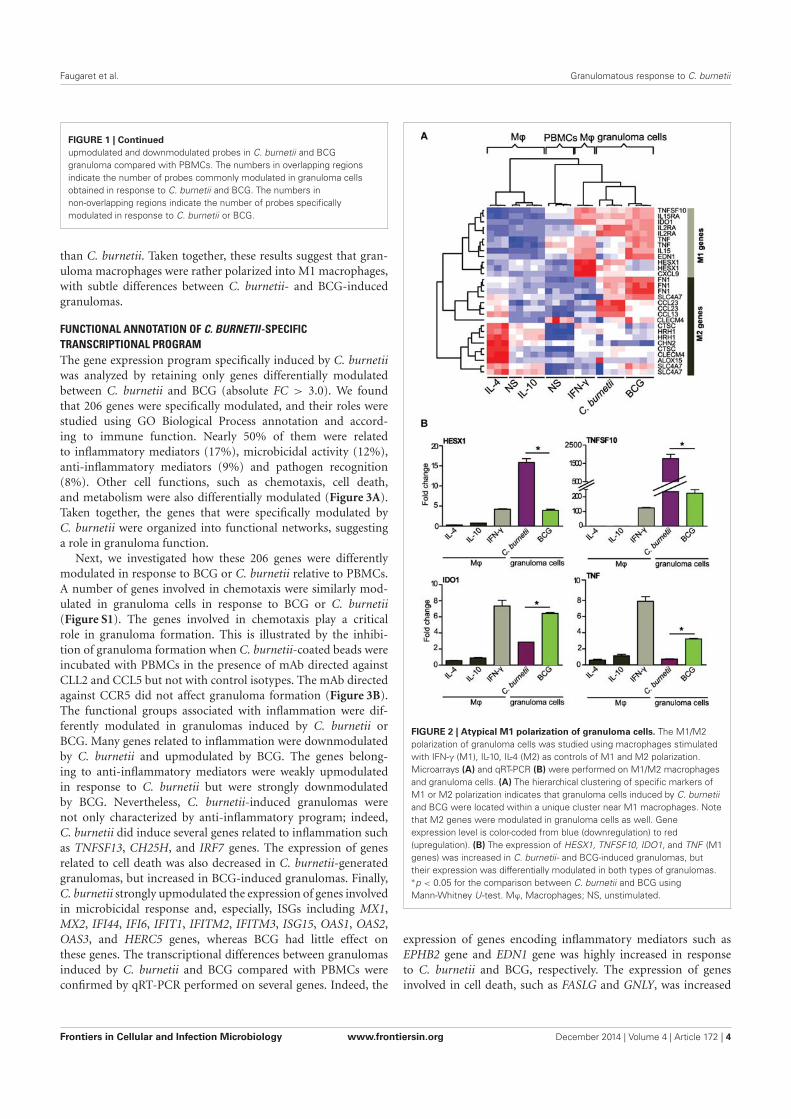
Faugaret et al. Granulomatous response to C. burnetii
FIGURE 1 | Continued
upmodulated and downmodulated probes in C. burnetii and BCG
granuloma compared with PBMCs. The numbers in overlapping regions
indicate the number of probes commonly modulated in granuloma cells
obtained in response to C. burnetii and BCG. The numbers in
non-overlapping regions indicate the number of probes specifically
modulated in response to C. burnetii or BCG.
than C. burnetii. Taken together, these results suggest that gran-
uloma macrophages were rather polarized into M1 macrophages,
with subtle differences between C. burnetii- and BCG-induced
granulomas.
FUNCTIONAL ANNOTATION OF C. BURNETII-SPECIFIC
TRANSCRIPTIONAL PROGRAM
The gene expression program specifically induced by C. burnetii
was analyzed by retaining only genes differentially modulated
between C. burnetii and BCG (absolute FC > 3.0). We found
that 206 genes were specifically modulated, and their roles were
studied using GO Biological Process annotation and accord-
ing to immune function. Nearly 50% of them were related
to inflammatory mediators (17%), microbicidal activity (12%),
anti-inflammatory mediators (9%) and pathogen recognition
(8%). Other cell functions, such as chemotaxis, cell death,
and metabolism were also differentially modulated (Figure 3A).
Taken together, the genes that were specifically modulated by
C. burnetii were organized into functional networks, suggesting
a role in granuloma function.
Next, we investigated how these 206 genes were differently
modulated in response to BCG or C. burnetii relative to PBMCs.
A number of genes involved in chemotaxis were similarly mod-
ulated in granuloma cells in response to BCG or C. burnetii
(Figure S1). The genes involved in chemotaxis play a critical
role in granuloma formation. This is illustrated by the inhibi-
tion of granuloma formation when C. burnetii-coated beads were
incubated with PBMCs in the presence of mAb directed against
CLL2 and CCL5 but not with control isotypes. The mAb directed
against CCR5 did not affect granuloma formation (Figure 3B).
The functional groups associated with inflammation were dif-
ferently modulated in granulomas induced by C. burnetii or
BCG. Many genes related to inflammation were downmodulated
by C. burnetii and upmodulated by BCG. The genes belong-
ing to anti-inflammatory mediators were weakly upmodulated
in response to C. burnetii but were strongly downmodulated
by BCG. Nevertheless, C. burnetii-induced granulomas were
not only characterized by anti-inflammatory program; indeed,
C. burnetii did induce several genes related to inflammation such
as TNFSF13, CH25H, and IRF7 genes. The expression of genes
related to cell death was also decreased in C. burnetii-generated
granulomas, but increased in BCG-induced granulomas. Finally,
C. burnetii strongly upmodulated the expression of genes involved
in microbicidal response and, especially, ISGs including MX1,
MX2, IFI44, IFI6, IFIT1, IFITM2, IFITM3, ISG15, OAS1, OAS2,
OAS3, and HERC5 genes, whereas BCG had little effect on
these genes. The transcriptional differences between granulomas
induced by C. burnetii and BCG compared with PBMCs were
confirmed by qRT-PCR performed on several genes. Indeed, the
FIGURE 2 | Atypical M1 polarization of granuloma cells. The M1/M2
polarization of granuloma cells was studied using macrophages stimulated
with IFN-γ (M1), IL-10, IL-4 (M2) as controls of M1 and M2 polarization.
Microarrays (A) and qRT-PCR (B) were performed on M1/M2 macrophages
and granuloma cells. (A) The hierarchical clustering of specific markers of
M1 or M2 polarization indicates that granuloma cells induced by C. burnetii
and BCG were located within a unique cluster near M1 macrophages. Note
that M2 genes were modulated in granuloma cells as well. Gene
expression level is color-coded from blue (downregulation) to red
(upregulation). (B) The expression of HESX1, TNFSF10, IDO1, and TNF (M1
genes) was increased in C. burnetii- and BCG-induced granulomas, but
their expression was differentially modulated in both types of granulomas.∗p < 0.05 for the comparison between C. burnetii and BCG using
Mann-Whitney U-test. Mϕ, Macrophages; NS, unstimulated.
expression of genes encoding inflammatory mediators such as
EPHB2 gene and EDN1 gene was highly increased in response
to C. burnetii and BCG, respectively. The expression of genes
involved in cell death, such as FASLG and GNLY, was increased
Frontiers in Cellular and Infection Microbiology www.frontiersin.org December 2014 | Volume 4 | Article 172 | 4
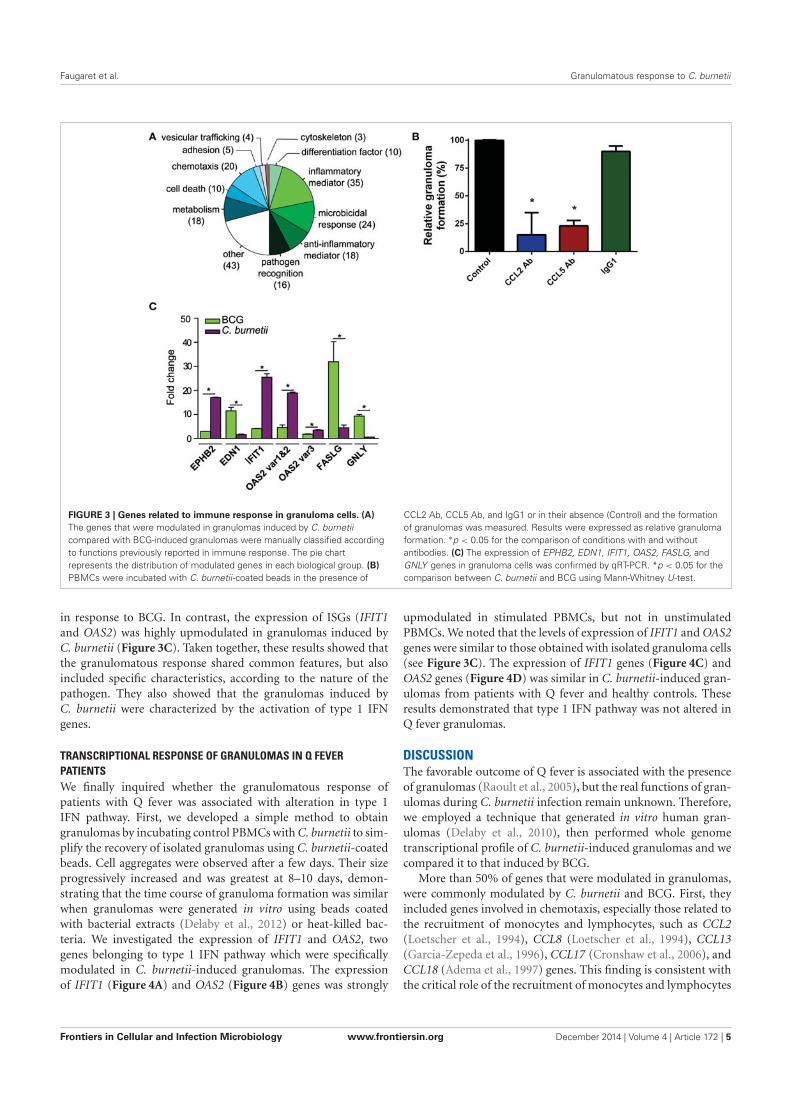
Faugaret et al. Granulomatous response to C. burnetii
FIGURE 3 | Genes related to immune response in granuloma cells. (A)
The genes that were modulated in granulomas induced by C. burnetii
compared with BCG-induced granulomas were manually classified according
to functions previously reported in immune response. The pie chart
represents the distribution of modulated genes in each biological group. (B)
PBMCs were incubated with C. burnetii-coated beads in the presence of
CCL2 Ab, CCL5 Ab, and IgG1 or in their absence (Control) and the formation
of granulomas was measured. Results were expressed as relative granuloma
formation. ∗p < 0.05 for the comparison of conditions with and without
antibodies. (C) The expression of EPHB2, EDN1, IFIT1, OAS2, FASLG, and
GNLY genes in granuloma cells was confirmed by qRT-PCR. *p < 0.05 for the
comparison between C. burnetii and BCG using Mann-Whitney U-test.
in response to BCG. In contrast, the expression of ISGs (IFIT1
and OAS2) was highly upmodulated in granulomas induced by
C. burnetii (Figure 3C). Taken together, these results showed that
the granulomatous response shared common features, but also
included specific characteristics, according to the nature of the
pathogen. They also showed that the granulomas induced by
C. burnetii were characterized by the activation of type 1 IFN
genes.
TRANSCRIPTIONAL RESPONSE OF GRANULOMAS IN Q FEVER
PATIENTS
We finally inquired whether the granulomatous response of
patients with Q fever was associated with alteration in type 1
IFN pathway. First, we developed a simple method to obtain
granulomas by incubating control PBMCs with C. burnetii to sim-
plify the recovery of isolated granulomas using C. burnetii-coated
beads. Cell aggregates were observed after a few days. Their size
progressively increased and was greatest at 8–10 days, demon-
strating that the time course of granuloma formation was similar
when granulomas were generated in vitro using beads coated
with bacterial extracts (Delaby et al., 2012) or heat-killed bac-
teria. We investigated the expression of IFIT1 and OAS2, two
genes belonging to type 1 IFN pathway which were specifically
modulated in C. burnetii-induced granulomas. The expression
of IFIT1 (Figure 4A) and OAS2 (Figure 4B) genes was strongly
upmodulated in stimulated PBMCs, but not in unstimulated
PBMCs. We noted that the levels of expression of IFIT1 and OAS2
genes were similar to those obtained with isolated granuloma cells
(see Figure 3C). The expression of IFIT1 genes (Figure 4C) and
OAS2 genes (Figure 4D) was similar in C. burnetii-induced gran-
ulomas from patients with Q fever and healthy controls. These
results demonstrated that type 1 IFN pathway was not altered in
Q fever granulomas.
DISCUSSIONThe favorable outcome of Q fever is associated with the presence
of granulomas (Raoult et al., 2005), but the real functions of gran-
ulomas during C. burnetii infection remain unknown. Therefore,
we employed a technique that generated in vitro human gran-
ulomas (Delaby et al., 2010), then performed whole genome
transcriptional profile of C. burnetii-induced granulomas and we
compared it to that induced by BCG.
More than 50% of genes that were modulated in granulomas,
were commonly modulated by C. burnetii and BCG. First, they
included genes involved in chemotaxis, especially those related to
the recruitment of monocytes and lymphocytes, such as CCL2
(Loetscher et al., 1994), CCL8 (Loetscher et al., 1994), CCL13
(Garcia-Zepeda et al., 1996), CCL17 (Cronshaw et al., 2006), and
CCL18 (Adema et al., 1997) genes. This finding is consistent with
the critical role of the recruitment of monocytes and lymphocytes
Frontiers in Cellular and Infection Microbiology www.frontiersin.org December 2014 | Volume 4 | Article 172 | 5
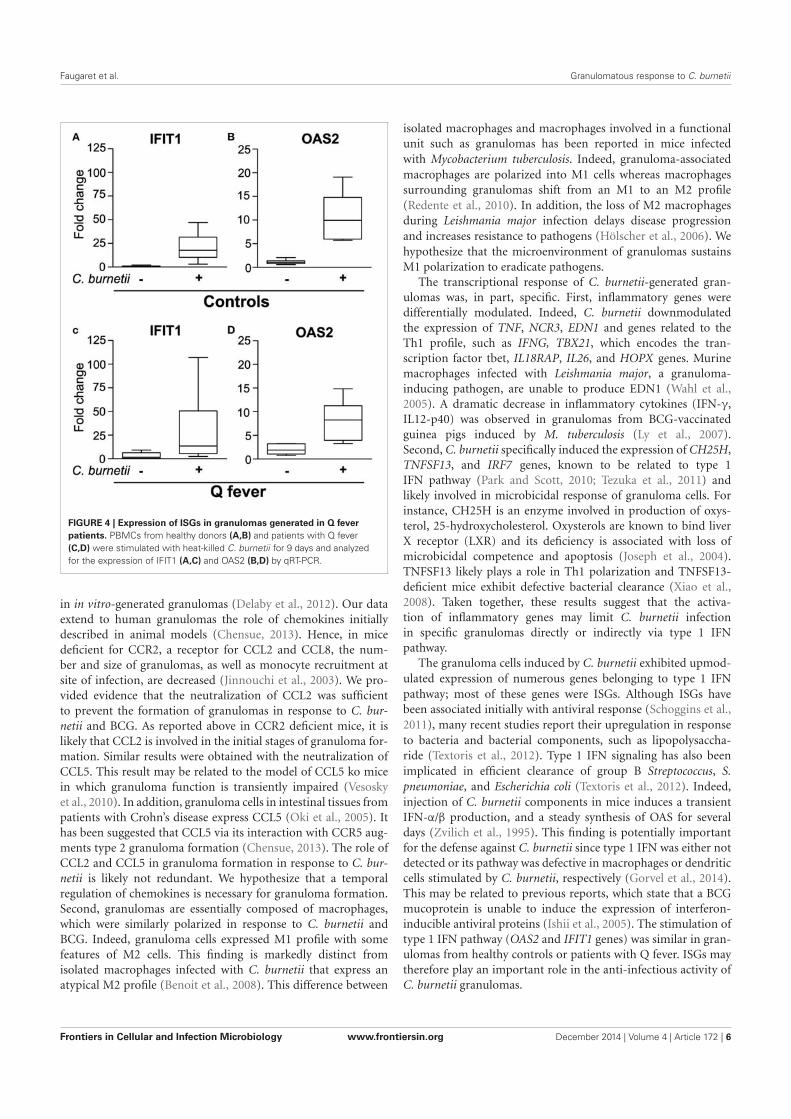
Faugaret et al. Granulomatous response to C. burnetii
FIGURE 4 | Expression of ISGs in granulomas generated in Q fever
patients. PBMCs from healthy donors (A,B) and patients with Q fever
(C,D) were stimulated with heat-killed C. burnetii for 9 days and analyzed
for the expression of IFIT1 (A,C) and OAS2 (B,D) by qRT-PCR.
in in vitro-generated granulomas (Delaby et al., 2012). Our data
extend to human granulomas the role of chemokines initially
described in animal models (Chensue, 2013). Hence, in mice
deficient for CCR2, a receptor for CCL2 and CCL8, the num-
ber and size of granulomas, as well as monocyte recruitment at
site of infection, are decreased (Jinnouchi et al., 2003). We pro-
vided evidence that the neutralization of CCL2 was sufficient
to prevent the formation of granulomas in response to C. bur-
netii and BCG. As reported above in CCR2 deficient mice, it is
likely that CCL2 is involved in the initial stages of granuloma for-
mation. Similar results were obtained with the neutralization of
CCL5. This result may be related to the model of CCL5 ko mice
in which granuloma function is transiently impaired (Vesosky
et al., 2010). In addition, granuloma cells in intestinal tissues from
patients with Crohn’s disease express CCL5 (Oki et al., 2005). It
has been suggested that CCL5 via its interaction with CCR5 aug-
ments type 2 granuloma formation (Chensue, 2013). The role of
CCL2 and CCL5 in granuloma formation in response to C. bur-
netii is likely not redundant. We hypothesize that a temporal
regulation of chemokines is necessary for granuloma formation.
Second, granulomas are essentially composed of macrophages,
which were similarly polarized in response to C. burnetii and
BCG. Indeed, granuloma cells expressed M1 profile with some
features of M2 cells. This finding is markedly distinct from
isolated macrophages infected with C. burnetii that express an
atypical M2 profile (Benoit et al., 2008). This difference between
isolated macrophages and macrophages involved in a functional
unit such as granulomas has been reported in mice infected
with Mycobacterium tuberculosis. Indeed, granuloma-associated
macrophages are polarized into M1 cells whereas macrophages
surrounding granulomas shift from an M1 to an M2 profile
(Redente et al., 2010). In addition, the loss of M2 macrophages
during Leishmania major infection delays disease progression
and increases resistance to pathogens (Hölscher et al., 2006). We
hypothesize that the microenvironment of granulomas sustains
M1 polarization to eradicate pathogens.
The transcriptional response of C. burnetii-generated gran-
ulomas was, in part, specific. First, inflammatory genes were
differentially modulated. Indeed, C. burnetii downmodulated
the expression of TNF, NCR3, EDN1 and genes related to the
Th1 profile, such as IFNG, TBX21, which encodes the tran-
scription factor tbet, IL18RAP, IL26, and HOPX genes. Murine
macrophages infected with Leishmania major, a granuloma-
inducing pathogen, are unable to produce EDN1 (Wahl et al.,
2005). A dramatic decrease in inflammatory cytokines (IFN-γ,
IL12-p40) was observed in granulomas from BCG-vaccinated
guinea pigs induced by M. tuberculosis (Ly et al., 2007).
Second, C. burnetii specifically induced the expression of CH25H,
TNFSF13, and IRF7 genes, known to be related to type 1
IFN pathway (Park and Scott, 2010; Tezuka et al., 2011) and
likely involved in microbicidal response of granuloma cells. For
instance, CH25H is an enzyme involved in production of oxys-
terol, 25-hydroxycholesterol. Oxysterols are known to bind liver
X receptor (LXR) and its deficiency is associated with loss of
microbicidal competence and apoptosis (Joseph et al., 2004).
TNFSF13 likely plays a role in Th1 polarization and TNFSF13-
deficient mice exhibit defective bacterial clearance (Xiao et al.,
2008). Taken together, these results suggest that the activa-
tion of inflammatory genes may limit C. burnetii infection
in specific granulomas directly or indirectly via type 1 IFN
pathway.
The granuloma cells induced by C. burnetii exhibited upmod-
ulated expression of numerous genes belonging to type 1 IFN
pathway; most of these genes were ISGs. Although ISGs have
been associated initially with antiviral response (Schoggins et al.,
2011), many recent studies report their upregulation in response
to bacteria and bacterial components, such as lipopolysaccha-
ride (Textoris et al., 2012). Type 1 IFN signaling has also been
implicated in efficient clearance of group B Streptococcus, S.
pneumoniae, and Escherichia coli (Textoris et al., 2012). Indeed,
injection of C. burnetii components in mice induces a transient
IFN-α/β production, and a steady synthesis of OAS for several
days (Zvilich et al., 1995). This finding is potentially important
for the defense against C. burnetii since type 1 IFN was either not
detected or its pathway was defective in macrophages or dendritic
cells stimulated by C. burnetii, respectively (Gorvel et al., 2014).
This may be related to previous reports, which state that a BCG
mucoprotein is unable to induce the expression of interferon-
inducible antiviral proteins (Ishii et al., 2005). The stimulation of
type 1 IFN pathway (OAS2 and IFIT1 genes) was similar in gran-
ulomas from healthy controls or patients with Q fever. ISGs may
therefore play an important role in the anti-infectious activity of
C. burnetii granulomas.
Frontiers in Cellular and Infection Microbiology www.frontiersin.org December 2014 | Volume 4 | Article 172 | 6
Faugaret et al. Granulomatous response to C. burnetii
In conclusion, the transcriptional response of C. burnetii gran-
ulomas includes a common part shared with other infectious
granulomas and a part specific for C. burnetii. The specific
response to C. burnetii involved the activation of genes involved
in inflammation including type 1 IFN related genes, microbicidal
activity, and apoptosis. This transcriptional program may account
for the granuloma-mediated elimination of C. burnetii, in accor-
dance with the natural history of Q fever where granulomas are
associated with a protective immune response and resolution of
the disease, whereas the absence of granulomas is associated with
the chronic evolution of the disease.
ACKNOWLEDGMENTSThe authors would like to thank Olivia DeLozier for editing the
English language manuscript.
SUPPLEMENTARY MATERIALThe Supplementary Material for this article can be found
online at: http://www.frontiersin.org/journal/10.3389/fcimb.
2014.00172/abstract
Figure S1 | Functional annotation of C. burnetii- and BCG-modulated
genes. The expression of the modulated genes in C. burnetii- and
BCG-induced granulomas was compared to their expression in PBMCs.
The functional groups that contain the largest number of distinctly
modulated genes were selected, and genes were depicted. The direction
of gene regulation is color-coded, with blue indicating downregulation, and
red indicating upregulation.
REFERENCESAdema, G. J., Hartgers, F., Verstraten, R., de Vries, E., Marland, G., Menon, S.,
et al. (1997). A dendritic-cell-derived C-C chemokine that preferentially attracts
naive T cells. Nature 387, 713–717. doi: 10.1038/42716
Ben Amara, A., Ghigo, E., Le Priol, Y., Lépolard, C., Salcedo, S. P., Lemichez,
E., et al. (2010). Coxiella burnetii, the agent of Q fever, replicates within tro-
phoblasts and induces a unique transcriptional response. PLoS ONE 5:e15315.
doi: 10.1371/journal.pone.0015315
Benoit, M., Barbarat, B., Bernard, A., Olive, D., and Mege, J.-L. (2008).
Coxiella burnetii, the agent of Q fever, stimulates an atypical M2 activa-
tion program in human macrophages. Eur. J. Immunol. 38, 1065–1070. doi:
10.1002/eji.200738067
Bindea, G., Mlecnik, B., Hackl, H., Charoentong, P., Tosolini, M., Kirilovsky, A.,
et al. (2009). ClueGO: a Cytoscape plug-in to decipher functionally grouped
gene ontology and pathway annotation networks. Bioinformatics 25, 1091–1093.
doi: 10.1093/bioinformatics/btp101
Chensue, S. W. (2013). Chemokines in innate and adaptive granuloma formation.
Front. Immunol. 4:43. doi: 10.3389/fimmu.2013.00043
Cooper, A. M., Dalton, D. K., Stewart, T. A., Griffin, J. P., Russell, D. G., and Orme,
I. M. (1993). Disseminated tuberculosis in interferon gamma gene-disrupted
mice. J. Exp. Med. 178:2243. doi: 10.1084/jem.178.6.2243
Cronshaw, D. G., Kouroumalis, A., Parry, R., Webb, A., Brown, Z., and Ward, S. G.
(2006). Evidence that phospholipase-C dependent, calcium-independent mech-
anisms are required for directional migration of T-lymphocytes in response to
the CCR4 ligands CCL17 and CCL22. J. Leukoc. Biol. 79, 1369–1370.
Delaby, A., Espinosa, L., Lépolard, C., Capo, C., and Mège, J.-L. (2010). 3D
reconstruction of granulomas from transmitted light images implemented
for long-time microscope applications. J. Immunol. Methods 360, 10–19. doi:
10.1016/j.jim.2010.06.008
Delaby, A., Gorvel, L., Espinosa, L., Lépolard, C., Raoult, D., Ghigo, E., et al. (2012).
Defective monocyte dynamics in Q fever granuloma deficiency. J. Infect. Dis.
205, 1086–1094. doi: 10.1093/infdis/jis013
Egen, J. G., Rothfuchs, A. G., Feng, C. G., Winter, N., Sher, A., and Germain,
R. N. (2008). Macrophage and T cell dynamics during the development
and disintegration of mycobacterial granulomas. Immunity 28, 271–284. doi:
10.1016/j.immuni.2007.12.010
Garcia-Zepeda, E. A., Combadiere, C., Rothenberg, M. E., Sarafi, M. N., Lavigne, F.,
Hamid, Q., et al. (1996). Human monocyte chemoattractant protein (MCP)-4 is
a novel CC chemokine with activities on monocytes, eosinophils, and basophils
induced in allergic and nonallergic inflammation that signals through the CC
chemokine receptors (CCR)-2 and -3. J. Immunol. 157, 5613–5626.
Gentleman, R. C., Carey, V. J., Bates, D. M., Bolstad, B., Dettling, M., Dudoit,
S., et al. (2004). Bioconductor: open software development for computational
biology and bioinformatics. Genome Biol. 5:R80. doi: 10.1186/gb-2004-5-10-r80
Ghigo, E., Barry, A. O., Pretat, L., Al Moussawi, K., Desnues, B., Capo, C., et al.
(2010). IL-16 promotes T. whipplei replication by inhibiting phagosome con-
version and modulating macrophage activation. PLoS ONE 5:e13561. doi:
10.1371/journal.pone.0013561
Gorvel, L., Textoris, J., Banchereau, R., Ben Amara, A., Tantibhedhyangkul, W.,
von Bargen, K., et al. (2014). Intracellular bacteria interfere with dendritic
cell functions: role of the type I interferon pathway. PLoS ONE 9:e99420. doi:
10.1371/journal.pone.0099420
Hölscher, C., Arendse, B., Schwegmann, A., Myburgh, E., and Brombacher, F.
(2006). Impairment of alternative macrophage activation delays cutaneous
leishmaniasis in nonhealing BALB/c mice. J. Immunol. 176, 1115–1121. doi:
10.4049/jimmunol.176.2.1115
Ishii, K., Kurita-Taniguchi, M., Aoki, M., Kimura, T., Kashiwazaki, Y., Matsumoto,
M., et al. (2005). Gene-inducing program of human dendritic cells in response
to BCG cell-wall skeleton (CWS), which reflects adjuvancy required for
tumor immunotherapy. Immunol. Lett. 98, 280–290. doi: 10.1016/j.imlet.2004.
12.002
Jinnouchi, K., Terasaki, Y., Fujiyama, S., Tomita, K., Kuziel, W. A., Maeda, N.,
et al. (2003). Impaired hepatic granuloma formation in mice deficient in C-C
chemokine receptor 2. J. Pathol. 200, 406–416. doi: 10.1002/path.1362
Joseph, S. B., Bradley, M. N., Castrillo, A., Bruhn, K. W., Mak, P. A.,
Pei, L., et al. (2004). LXR-dependent gene expression is important for
macrophage survival and the innate immune response. Cell 119, 299–309. doi:
10.1016/j.cell.2004.09.032
Loetscher, P., Seitz, M., Clark-Lewis, I., Baggiolini, M., and Moser, B. (1994).
Monocyte chemotactic proteins MCP-1, MCP-2, and MCP-3 are major attrac-
tants for human CD4+ and CD8+ T lymphocytes. FASEB J. 8, 1055–1060.
Ly, L. H., Russell, M. I., and McMurray, D. N. (2007). Microdissection of the
cytokine milieu of pulmonary granulomas from tuberculous guinea pigs. Cell.
Microbiol. 9, 1127–1136. doi: 10.1111/j.1462-5822.2006.00854.x
Martinez, F. O., Gordon, S., Locati, M., and Mantovani, A. (2006). Transcriptional
profiling of the human monocyte-to-macrophage differentiation and polar-
ization: new molecules and patterns of gene expression. J. Immunol. 177,
7303–7311. doi: 10.4049/jimmunol.177.10.7303
Mege, J. L., Maurin, M., Capo, C., and Raoult, D. (1997). Coxiella burnetii: the
“query” fever bacterium. A model of immune subversion by a strictly intracel-
lular microorganism. FEMS Microbiol. Rev. 19, 209–217. doi: 10.1016/S0168-
6445(96)00030-7
Moal, V., Textoris, J., Ben Amara, A., Mehraj, V., Berland, Y., Colson, P., et al.
(2013). Chronic hepatitis E virus infection is specifically associated with an
interferon-related transcriptional program. J. Infect. Dis. 207, 125–132. doi:
10.1093/infdis/jis632
Oki, M., Ohtani, H., Kinouchi, Y., Sato, E., Nakamura, S., Matsumoto, T., et al.
(2005). Accumulation of CCR5+ T cells around RANTES+ granulomas in
Crohn’s disease: a pivotal site of Th1-shifted immune response? Lab. Invest. 85,
137–145. doi: 10.1038/labinvest.3700189
Park, K., and Scott, A. L. (2010). Cholesterol 25-hydroxylase production by den-
dritic cells and macrophages is regulated by type I interferons. J. Leukoc. Biol.
88, 1081–1087. doi: 10.1189/jlb.0610318
Puissegur, M.-P., Botanch, C., Duteyrat, J.-L., Delsol, G., Caratero, C., and Altare,
F. (2004). An in vitro dual model of mycobacterial granulomas to investigate
the molecular interactions between mycobacteria and human host cells. Cell.
Microbiol. 6, 423–433. doi: 10.1111/j.1462-5822.2004.00371.x
Ramakrishnan, L. (2012). Revisiting the role of the granuloma in tuberculosis. Nat.
Rev. Immunol. 12, 352–366. doi: 10.1038/nri3211
Raoult, D. (2012). Chronic Q fever: expert opinion versus literature analysis and
consensus. J. Infect. 65, 102–108. doi: 10.1016/j.jinf.2012.04.006
Raoult, D., Marrie, T., and Mege, J. L. (2005). Natural history and pathophysiology
of Q fever. Lancet Infect. Dis. 5, 219–226. doi: 10.1016/S1473-3099(05)70052-9
Frontiers in Cellular and Infection Microbiology www.frontiersin.org December 2014 | Volume 4 | Article 172 | 7
Faugaret et al. Granulomatous response to C. burnetii
Redente, E. F., Higgins, D. M., Dwyer-Nield, L. D., Orme, I. M., Gonzalez-
Juarrero, M., and Malkinson, A. M. (2010). Differential polarization of alveolar
macrophages and bone marrow-derived monocytes following chemically and
pathogen-induced chronic lung inflammation. J. Leukoc. Biol. 88, 159–168. doi:
10.1189/jlb.0609378
Russell, D. G., Cardona, P.-J., Kim, M.-J., Allain, S., and Altare, F. (2009). Foamy
macrophages and the progression of the human tuberculosis granuloma. Nat.
Immunol. 10, 943–948. doi: 10.1038/ni.1781
Schoggins, J. W., Wilson, S. J., Panis, M., Murphy, M. Y., Jones, C. T., Bieniasz,
P., et al. (2011). A diverse range of gene products are effectors of the type I
interferon antiviral response. Nature 472, 481–485. doi: 10.1038/nature09907
Shaler, C. R., Horvath, C. N., Jeyanathan, M., and Xing, Z. (2013). Within the
Enemy’s Camp: contribution of the granuloma to the dissemination, persis-
tence and transmission of Mycobacterium tuberculosis. Front. Immunol. 4:30.
doi: 10.3389/fimmu.2013.00030
Smoot, M. E., Ono, K., Ruscheinski, J., Wang, P.-L., and Ideker, T. (2011). Cytoscape
2.8: new features for data integration and network visualization. Bioinformatics
27, 431–432. doi: 10.1093/bioinformatics/btq675
Srigley, J. R., Vellend, H., Palmer, N., Phillips, M. J., Geddie, W. R., Van Nostrand,
A. W., et al. (1985). Q-fever. The liver and bone marrow pathology. Am. J. Surg.
Pathol. 9, 752–758. doi: 10.1097/00000478-198510000-00007
Textoris, J., Capo, C., and Mège, J.-L. (2012). “Type I interferons and bacterial infec-
tious diseases: new features,” in Recent Research Developments in Immunology, ed
S. G. Pandalai (Trivandrum: Research Signpost), 49–74.
Tezuka, H., Abe, Y., Asano, J., Sato, T., Liu, J., Iwata, M., et al. (2011). Prominent role
for plasmacytoid dendritic cells in mucosal T cell-independent IgA induction.
Immunity 34, 247–257. doi: 10.1016/j.immuni.2011.02.002
Travis, L. B., Travis, W. D., Li, C. Y., and Pierre, R. V. (1986). Q fever. A clinico-
pathologic study of five cases. Arch. Pathol. Lab. Med. 110, 1017–1020.
Ulrichs, T., and Kaufmann, S. H. E. (2006). New insights into the function of gran-
ulomas in human tuberculosis. J. Pathol. 208, 261–269. doi: 10.1002/path.1906
Vesosky, B., Rottinghaus, E. K., Stromberg, P., Turner, J., and Beamer, G. (2010).
CCL5 participates in early protection against Mycobacterium tuberculosis.
J. Leukoc. Biol. 87, 1153–1165. doi: 10.1189/jlb.1109742
Wahl, J. R., Goetsch, N. J., Young, H. J., Van Maanen, R. J., Johnson, J. D., Pea,
A. S., et al. (2005). Murine macrophages produce endothelin-1 after microbial
stimulation. Exp. Biol. Med. (Maywood) 230, 652–658.
Xiao, Y., Motomura, S., and Podack, E. R. (2008). APRIL (TNFSF13) regulates
collagen-induced arthritis, IL-17 production and Th2 response. Eur. J. Immunol.
38, 3450–3458. doi: 10.1002/eji.200838640
Zumla, A., and James, D. G. (1996). Granulomatous infections: etiology and
classification. Clin. Infect. Dis. 23, 146–158. doi: 10.1093/clinids/23.1.146
Zvilich, M., Williams, J. C., Waag, D., Rill, W. R., Malli, R. J., Bell, P., et al. (1995).
Characterization of the non-specific humoral and cellular antiviral immunity
stimulated by the chloroform-methanol residue (CMR) fraction of Coxiella
burnetii. Antiviral Res. 27, 389–404. doi: 10.1016/0166-3542(95)00022-E
Conflict of Interest Statement: The Guest Associate Editor, Benjamin Coiffard,
declares that, despite having collaborated with author, Aurélie Daumas, the
review process was handled objectively. The authors declare that the research was
conducted in the absence of any commercial or financial relationships that could
be construed as a potential conflict of interest.
Received: 29 July 2014; accepted: 21 November 2014; published online: 15 December
2014.
Citation: Faugaret D, Ben Amara A, Alingrin J, Daumas A, Delaby A, Lépolard C,
Raoult D, Textoris J and Mège J-L (2014) Granulomatous response to Coxiella bur-
netii, the agent of Q fever: the lessons from gene expression analysis. Front. Cell. Infect.
Microbiol. 4:172. doi: 10.3389/fcimb.2014.00172
This article was submitted to the journal Frontiers in Cellular and Infection
Microbiology.
Copyright © 2014 Faugaret, Ben Amara, Alingrin, Daumas, Delaby, Lépolard,
Raoult, Textoris and Mège. This is an open-access article distributed under the terms
of the Creative Commons Attribution License (CC BY). The use, distribution or repro-
duction in other forums is permitted, provided the original author(s) or licensor are
credited and that the original publication in this journal is cited, in accordance with
accepted academic practice. No use, distribution or reproduction is permitted which
does not comply with these terms.
Frontiers in Cellular and Infection Microbiology www.frontiersin.org December 2014 | Volume 4 | Article 172 | 8
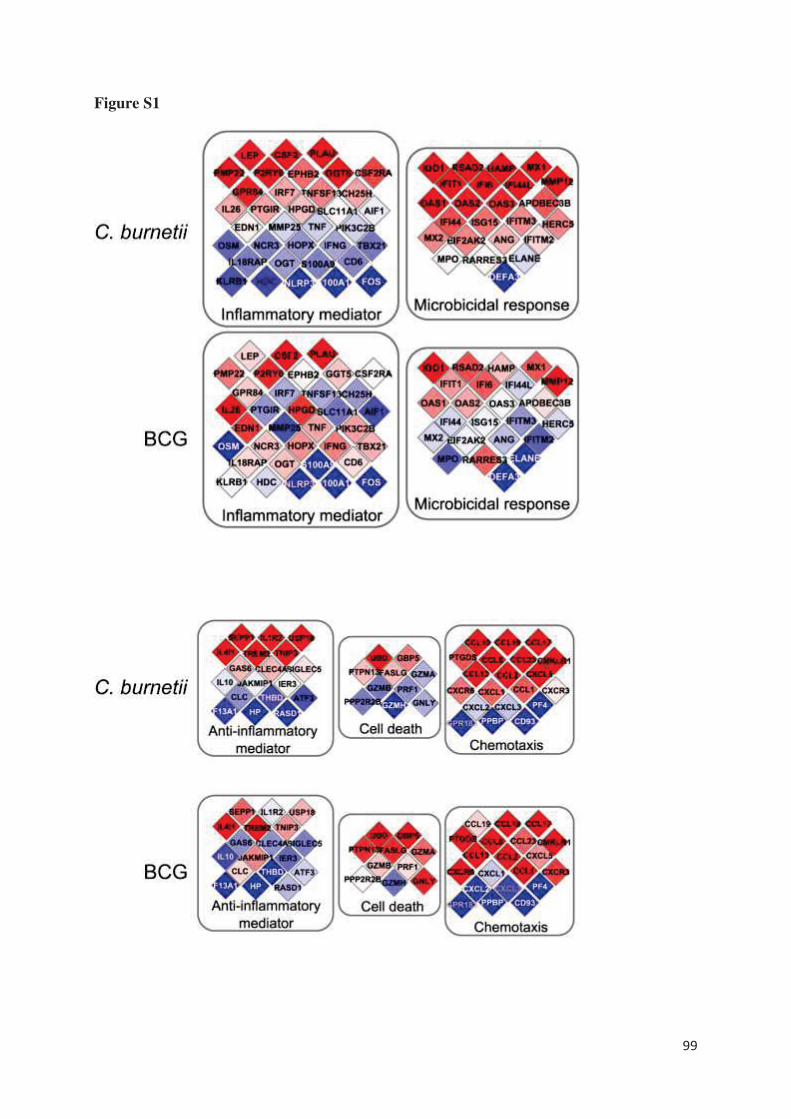
99
Figure S1
100
Impaired Granuloma Formation in Sepsis: Impact of
Monocytopenia
Alingrin J, Coiffard B, Textoris J, Belenotti P, Daumas A, Leone M, Mege JL.
PLoS One. 2016 Jul 21;11(7):e0158528.
doi: 10.1371/journal.pone.0158528. eCollection 2016.
La mise en jeu normale des défenses de l’organisme contre une infection implique une réponse
inflammatoire initiale. Néanmoins, chez certains patients, cette réponse est disproportionnée
entrainant des défaillances d’organe (sepsis sévère) voire un état de choc [130]. De manière
logique, cette réponse inflammatoire est rapidement associée à une intense réponse anti-
inflammatoire conduisant à une baisse de l’hypersensibilité retardée et une incapacité de juguler
l’infection, et prédisposant à la survenue d’infections nosocomiales [131]. La méconnaissance
jusqu’à il y a une dizaine d’années de l’importance et de la précocité d’apparition de cette
immunodépression (le terme de « paralysie immunitaire » est également utilisé) explique au
moins en partie les échecs des stratégies thérapeutiques étudiées par le passé qui visaient à
corriger les désordres inflammatoires en inhibant encore plus le système immunitaire des
patients [132]. Dans ce contexte de défaillance immunitaire, les patients qui vont normaliser
rapidement leurs fonctions immunitaires restent le plus souvent indemnes d’infections
nosocomiales et évoluent favorablement. A l’inverse, les patients qui présentent des
dysfonctions immunitaires persistantes au cours du temps, ont un risque élevé d’infections liées
aux soins et de décès. Nous savons aujourd’hui que l’ensemble des mécanismes immunitaires
est touché aussi bien la réponse innée qu’adaptative avec un défaut de réponse monocytaire et
une anergie lymphocytaire cependant variable en fonction des patients [131,133]. Tout l’enjeu
est donc de pouvoir monitorer la réponse immunitaire des patients grâce à un panel de
biomarqueurs de la réponse de l’hôte pour permettre de proposer une prise en charge
personnalisée avec des thérapies ciblées visant à restaurer spécifiquement leurs fonctions
immunitaires.
Le granulome est la résultante d’une coopération intense entre les cellules de la réponse innée
et adaptative dans le but d’éliminer un agent pathogène rebelle. L’évaluation in vitro de sa
101
formation permet ainsi d’explorer la fonctionnalité des différents acteurs du système
immunitaire et leurs interactions et de mieux comprendre les complications de son
dysfonctionnement. Cette méthode déjà utilisée au sein du laboratoire pour l’étude de la fièvre
Q, est apparue séduisante pour évaluer l’état d’immunodépression des patients en sepsis sévère
et éventuellement étudier l’effet de thérapies immunomodulatrices. J’ai participé à l’étude de
Julie Alingrin alors que je réalisais la même évaluation chez les patients âgés.
Dix-neuf patients en sepsis sévère, 9 patients avec un antécédent de fièvre Q guérie et 9
volontaires sains ont été étudiés. L’isolement des cellules mononucléées du sang périphérique
(PBMCs) a été effectué à partir d’échantillons sanguins par une technique manuelle utilisant un
gradient de Ficoll. Les PBMCs ont ensuite été incubés avec les billes couplées aux extraits
bactériens (Mycobacterium bovis et Coxiella burnetii). La formation des granulomes a été
quantifiée après 3, 6 et 9 jours de culture, par le compte du nombre de billes nues, de granulomes
partiels et de granulomes complets.
Quatre conditions expérimentales ont tout d’abord été testées en raison d’une quantité limitée
de cellules afin de définir le rapport nombre de cellules/ nombre de billes optimal qui s’est avéré
être 2,5 x 10⁵ cellules avec 50 billes par puit.
Cette étape de mis au point de la méthode réalisée, nous avons ensuite pu comparer la formation
de granulome dans nos différentes populations. En raison d’une probable immunisation des
patients par Mycobactérium bovis, il a été décidé d’étudier également des patients immunisés
par Coxiella burnetii.
Le premier résultat de cette étude est un défaut de formation de granulomes chez les patients
septiques aux différents temps d’analyse quels que soient les extraits bactériens utilisés. A noter
cependant que 6 patients septiques sur 19 arrivent à former des granulomes mais avec une
cinétique plus lente pour 3 d’entre eux et qu’un sujet contrôle sain ne forme pas de granulomes.
Aucune différence significative n’a été retrouvée entre les patients septiques formant des
granulomes et ceux n’y arrivant pas. Ainsi, la formation in vitro de granulomes pourrait servir
à évaluer le degré d’immunosuppression et le monitorer en réponse à un traitement voir évaluer
le pronostic.
Pour expliquer le défaut de formation de granulomes, les taux de monocytes et de lymphocytes
circulants ont été comparés. Les patients septiques ne formant pas de granulome présentaient
102
des taux de monocytes significativement plus faibles et/ou une lymphopénie bien que cette
anomalie ne soit pas significativement associée à l’absence de formation de granulomes. Du
fait d’exceptions donc, la formule leucocytaire ne peut pas permettre de prédire la capacité de
formation de granulomes.
Le dosage du TNF dans les surnageants a mis en évidence des taux significativement plus
faibles chez les patients qui ne forment pas de granulomes sans augmentation de l’IL-10 en
parallèle. Pour confirmer le rôle du TNF dans la formation des granulomes, qui en clinique a
du sens (susceptibilité des patients sous anti-TNF aux infections), l’ajout de TNF ou d’un
anticorps monoclonal anti-TNF a été étudié sans aucun impact sur les résultats obtenus
préalablement.
Ainsi, cette méthode permet de mettre en évidence la défaillance immunitaire de la plupart des
patients septiques et confirme le rôle central des monocytes dans la formation du granulome
comme déjà rapporté [22]. En ce qui concerne l’imputabilité du TNF dans la formation des
granulomes, la réalité est plus complexe que ce que l’on peut imaginer car l’ajout de TNF ne
suffit pas à reverser le processus.
.
RESEARCH ARTICLE
Impaired Granuloma Formation in Sepsis:
Impact of Monocytopenia
Julie Alingrin1,2, Benjamin Coiffard1,2, Julien Textoris1¤, Pauline Belenotti1,
Aurélie Daumas1,3, Marc Leone1,2, Jean-Louis Mege1*
1 Unité de Recherche sur les Maladies Infectieuses Tropicales et Emergentes, UMR 63, CNRS 7278, IRD
198, INSERMU1095, Aix-Marseille Université, Marseille, France, 2 Service d’Anesthésie et de Réanimation,Hôpital Nord, Assistance Publique-Hôpitaux de Marseille, Aix-Marseille Université, Marseille, France,3 Service de Médecine Interne, Gériatrie et Thérapeutique, Hôpital de la Timone, Assistance Publique-
Hôpitaux de Marseille, Aix-Marseille Université, Marseille, France
¤ Current address: Institut BioMerieux, Unité Mixte BioMérieux-HCL, Hôpital Edouard Herriot—Pav P, 5,Place d'Arsonval, 69437, Lyon Cedex 03, France* [email protected]
Abstract
Granulomas are a collection of immune cells considered to be protective in infectious dis-
eases. The in vitro generation of granulomas is an interesting substitution to invasive
approaches of granuloma study. The monitoring of immune response through the determi-
nation of in vitro granuloma formation in patients with severe sepsis may be critical to indi-
vidualize treatments. We compared the in vitro generation of granulomas by co-culturing
circulating mononuclear cells from 19 patients with severe sepsis, 9 patients cured from Q
fever and 12 healthy subjects as controls, and Sepharose beads coated either with BCG or
Coxiella burnetii extracts to analyze both immune and innate granulomas, respectively. We
showed that the great majority of patients with severe sepsis were unable to form granulo-
mas in response to BCG and C. burnetii extracts whereas more than 80% of healthy con-
trols and patients cured from Q fever formed granulomas. We also found that
monocytopenia and defective production of tumor necrosis factor were associated with
reduced formation of granulomas in patients with severe sepsis even if TNF did not seem to
be involved in the defective granuloma formation. Taken together, these results suggest
that the deficiency of granuloma formation may be a measurement of altered recruitment
and activation of monocytes and lymphocytes in patients with severe sepsis.
Introduction
Granulomas are a tissue collection of macrophages and lymphocytes, which are generated in
response to various microorganisms [1], toxic molecules and foreign materials [2]. The first
step of granuloma formation is the recruitment of macrophages and blood-derived myeloid
cells, which is completed by the recruitment of activated T cells. Macrophages within granulo-
mas undergo a maturation program leading to the formation of multinucleated giant cells
(MGCs) and foamy cells [3,4]. The formation of granulomas is conditioned by the cytokine
PLOSONE | DOI:10.1371/journal.pone.0158528 July 21, 2016 1 / 13
a11111
OPEN ACCESS
Citation: Alingrin J, Coiffard B, Textoris J, Belenotti P,
Daumas A, Leone M, et al. (2016) Impaired
Granuloma Formation in Sepsis: Impact of
Monocytopenia. PLoS ONE 11(7): e0158528.
doi:10.1371/journal.pone.0158528
Editor: Alain Haziot, INSERM, FRANCE
Received: February 9, 2016
Accepted: June 16, 2016
Published: July 21, 2016
Copyright: © 2016 Alingrin et al. This is an open
access article distributed under the terms of the
Creative Commons Attribution License, which permits
unrestricted use, distribution, and reproduction in any
medium, provided the original author and source are
credited.
Data Availability Statement: All relevant data are
within the paper and its Supporting Information files.
Funding: The authors have no support or funding to
report.
Competing Interests: The authors have declared
that no competing interests exist.
context. Indeed, type 1 cytokines such as interferon (IFN)-γ, interleukin (IL)-12, and tumor
necrosis factor (TNF) are necessary for the formation of granulomas in response to bacteria
[5]. The granulomas evolve from “innate granulomas” that do not require T cells to “immune
granulomas” in which T cells are required [6].
The study of tissue granulomas requires invasive methods that are not convenient for the
investigation of patients. A method was recently developed to generate granulomas in vitro
using the co-culture of peripheral blood mononuclear cells (PBMCs) and Sepharose beads
coated with bacterial extracts from BCG [7] or Coxiella burnetii (CB) [8]. The monocytes
migrate to the beads and maturate into macrophages and MGCs in the presence of lympho-
cytes [8]. Hence, the in vitro assay of granuloma formation measures the activation and the
ability of monocytes to migrate towards the source of infection and could be used in clinics.
For instance, this assay has been used to study the ability of invasive Escherichia coli from
patients with Crohn disease to elicit the aggregation of macrophages and lymphocytes [9]. A
similar assay combined with high-content screening technology allows investigating anti-
tuberculous compound activities [10]. In brain-injured patients who develop nosocomial pneu-
monia, PBMCs generate fewer mature granulomas than those of controls in response to BCG
[11]. PBMCs from a large proportion of patients with Q fever endocarditis are unable to form
granulomas in the presence of beads coated with CB extracts. This is related to altered recruit-
ment of monocytes since the distance covered by monocytes was lower in Q fever endocarditis
than in controls [12]. Hence, the in vitro assay can mimic the lack of granulomas found in
patients with chronic evolution of Q fever and suggests that impaired monocyte migration is
involved in defective formation of granulomas. Taken together, these data suggest that the in
vitro formation of granulomas could be a new method to assess recruitment and activation of
immune cells in patients.
Severe sepsis is defined as the combination of a systemic inflammatory response syndrome
and suspected infection with at least one organ failure including hypotension, respiratory fail-
ure, coma, liver failure, thrombocytopenia and acute renal failure [13]. It is characterized by an
uncontrolled inflammatory response that leads to immune system failure including a loss of
delayed hypersensitivity, an inability to clear infections and a predisposition to nosocomial
infections [14]. Some cytokines such as circulating TNF have been correlated with the progno-
sis of severe sepsis [15] and such findings have served as a basis for immunotherapy of sepsis
targeting TNF. Unfortunately, this strategy was unsuccessful [16]. Few molecules have been
proposed to assess the prognosis of severe sepsis and to identify patients who can benefit from
innovative treatments. For instance, the expression of HLA-DR is used before the administra-
tion of granulocyte-macrophage colony-stimulating factor in patients with a defective immune
response [17]. Although these tools investigate some features of the immune response, we need
bioassays that enable us to assess the activation of immune cells in patients to adapt immune
therapy.
Here, we assessed the ability of PBMCs from patients with severe sepsis to generate granulo-
mas. To exonerate our data from the constraints of prior immunization, we compared granu-
loma formation in response to BCG and CB (a majority vs. a minority of patients specifically
immunized). We found that 13 of 19 patients with severe sepsis were unable to form granulo-
mas, suggesting severe impairment of their ability to recruit and activate immune cells. We also
demonstrated a relationship between the impairment of granuloma formation and
monocytopenia.
Granuloma and Sepsis
PLOS ONE | DOI:10.1371/journal.pone.0158528 July 21, 2016 2 / 13
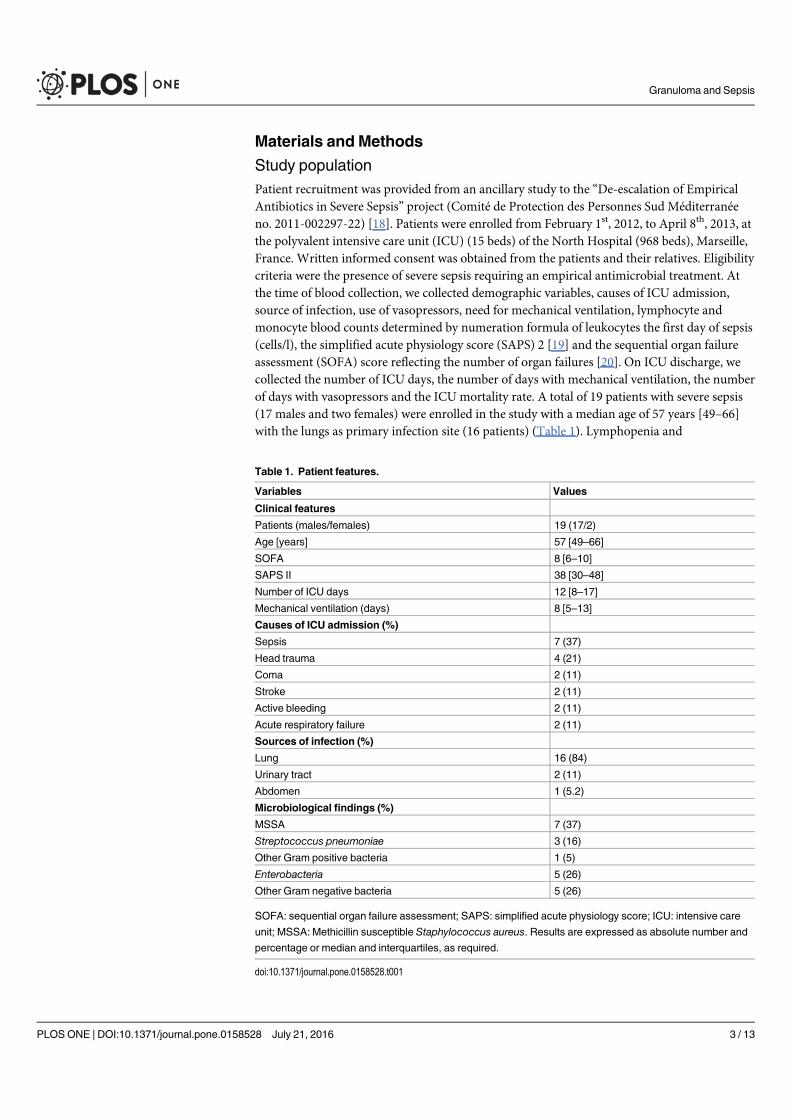
Materials and Methods
Study population
Patient recruitment was provided from an ancillary study to the “De-escalation of Empirical
Antibiotics in Severe Sepsis” project (Comité de Protection des Personnes Sud Méditerranée
no. 2011-002297-22) [18]. Patients were enrolled from February 1st, 2012, to April 8th, 2013, at
the polyvalent intensive care unit (ICU) (15 beds) of the North Hospital (968 beds), Marseille,
France. Written informed consent was obtained from the patients and their relatives. Eligibility
criteria were the presence of severe sepsis requiring an empirical antimicrobial treatment. At
the time of blood collection, we collected demographic variables, causes of ICU admission,
source of infection, use of vasopressors, need for mechanical ventilation, lymphocyte and
monocyte blood counts determined by numeration formula of leukocytes the first day of sepsis
(cells/l), the simplified acute physiology score (SAPS) 2 [19] and the sequential organ failure
assessment (SOFA) score reflecting the number of organ failures [20]. On ICU discharge, we
collected the number of ICU days, the number of days with mechanical ventilation, the number
of days with vasopressors and the ICU mortality rate. A total of 19 patients with severe sepsis
(17 males and two females) were enrolled in the study with a median age of 57 years [49–66]
with the lungs as primary infection site (16 patients) (Table 1). Lymphopenia and
Table 1. Patient features.
Variables Values
Clinical features
Patients (males/females) 19 (17/2)
Age [years] 57 [49–66]
SOFA 8 [6–10]
SAPS II 38 [30–48]
Number of ICU days 12 [8–17]
Mechanical ventilation (days) 8 [5–13]
Causes of ICU admission (%)
Sepsis 7 (37)
Head trauma 4 (21)
Coma 2 (11)
Stroke 2 (11)
Active bleeding 2 (11)
Acute respiratory failure 2 (11)
Sources of infection (%)
Lung 16 (84)
Urinary tract 2 (11)
Abdomen 1 (5.2)
Microbiological findings (%)
MSSA 7 (37)
Streptococcus pneumoniae 3 (16)
Other Gram positive bacteria 1 (5)
Enterobacteria 5 (26)
Other Gram negative bacteria 5 (26)
SOFA: sequential organ failure assessment; SAPS: simplified acute physiology score; ICU: intensive care
unit; MSSA: Methicillin susceptible Staphylococcus aureus. Results are expressed as absolute number and
percentage or median and interquartiles, as required.
doi:10.1371/journal.pone.0158528.t001
Granuloma and Sepsis
PLOS ONE | DOI:10.1371/journal.pone.0158528 July 21, 2016 3 / 13
monocytopenia are defined as cell counts lower than 1 × 10⁹ cells/l and 0.2 × 10⁹ cells/l, respec-
tively. An historical cohort of 21 individuals as controls including 12 healthy donors and 9
patients with cured Q fever was defined on clinical (history of acute Q fever) and serological
recovery (residual levels of anti-C. burnetii antibodies (Abs)).
PBMC isolation
The EDTA-anticoagulated blood samples (5 ml) were withdrawn the day of empirical antibi-
otic onset. The PBMCs were isolated after centrifugation on Ficoll cushion, as previously
described [21]. The PBMCs were then suspended (about 5 × 10⁶ cells/ml) in RPMI 1640 con-
taining 20% fetal calf serum (FCS, Invitrogen) and 10% dimethyl sulfoxide and conserved at
-80°C.
Bacteria and bead preparation
BCG (Mycobacterium bovis, American Type Culture Collection, stub 35734) was cultured on
agarose (Middlebrook 7H10 agar medium). C. burnetii (Nine Mile strain RSA496) was cul-
tured as previously described [22]. The bacteria (109 per assay) were sonicated in a coupling
buffer (NaHCO3 0.1 M pH 8.3 with NaCl 0.5 M) and their protein content was determined by
Bradford’s method as previously described [12]. Activated 4B Sepharose beads (about 4 × 10⁴
beads, 40–100 μm diameter, GE Healthcare) were coated with bacterial extracts (0.5 mg of pro-
teins). The coupling efficiency was determined by measuring the protein content of
supernatants.
Granuloma formation
The formation of granulomas was studied using a modified method adapted from Delaby et al.
to investigate patients with severe sepsis [12]. For that purpose, different concentrations of
PBMCs (1 × 10⁵ and 2.5 × 10⁵ per well) were incubated in 96-well microplates in the presence
of 50 or 100 beads coated with BCG or CB in 200 μl of RPMI 1640 containing 10% FCS and
antibiotics at 37°C. The formation of granulomas was measured after 3, 6 and 9 days in dupli-
cates and evaluated by reverse microscopy. Only beads that were completely covered by cells
were considered granulomas and the results were expressed as the percentage of granulomas.
The reproducibility was assessed in 3 individuals who were assayed 3 times with similar results.
To assess the impact of freezing on the ability to forming granulomas, PBMCs from three indi-
viduals were frozen or immediately used, and the formation of granulomas was measured. In
some experiments, PBMCs from patients who did not form granulomas were incubated with
beads coated with BCG or CB extracts and 10 ng/ml of human recombinant TNF (R&D Sys-
tems) while control PBMCs were incubated with coated beads and 10 ng/ml monoclonal Ab
(mAb) directed against TNF (Adalimumab kindly provided by Professor J. Roudier, Marseille)
and granuloma formation was measured. Crude data are available in the S1 Table.
Cytokine measurement
PBMCs (2.5 × 10⁵ cells/well) were incubated with beads coated with bacterial extracts (50
beads/well) for 1 day of culture. Each experiment was performed in duplicate. Cell superna-
tants were collected and TNF and IL-10 were assayed in duplicates (100 μl each) using specific
immunoassays (R&D Systems). The results were expressed as pg/ml. The detection limits of
immunoassays were of 5.5 and 3.9 pg/ml for TNF and IL-10, respectively. The intra- and inter-
specific coefficients of variation ranged from 5% to 10%. Crude data are available in S2 Table.
Granuloma and Sepsis
PLOS ONE | DOI:10.1371/journal.pone.0158528 July 21, 2016 4 / 13
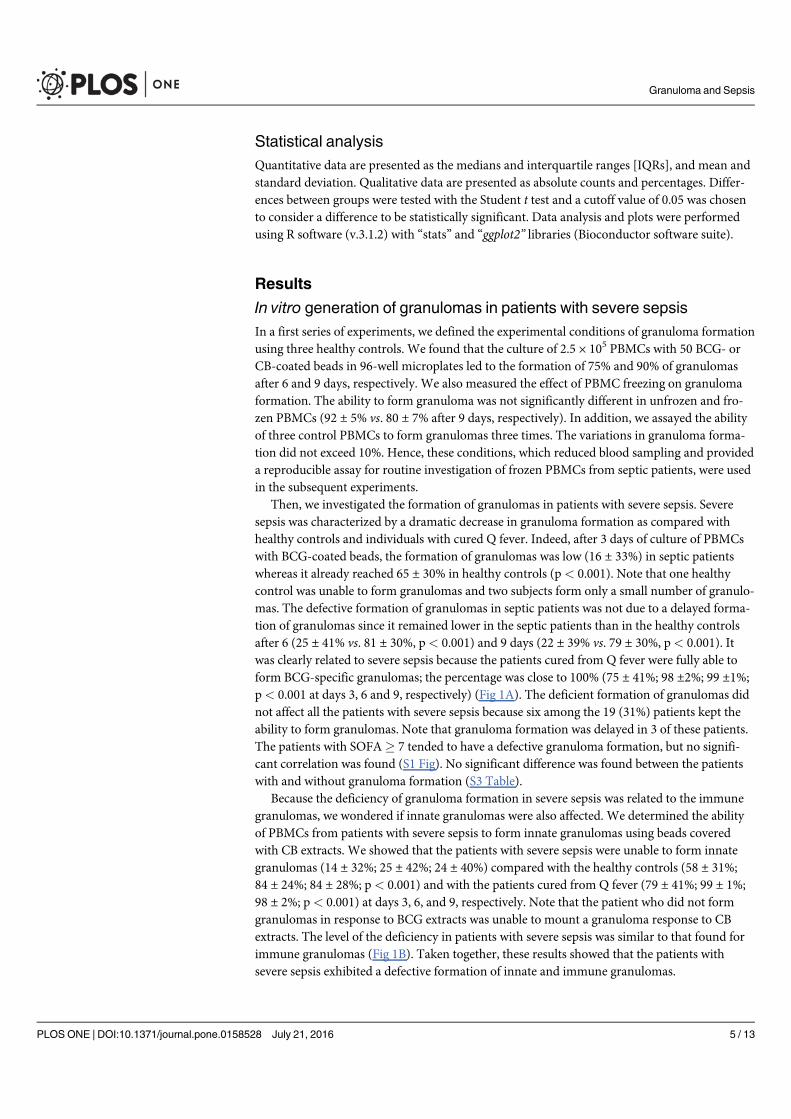
Statistical analysis
Quantitative data are presented as the medians and interquartile ranges [IQRs], and mean and
standard deviation. Qualitative data are presented as absolute counts and percentages. Differ-
ences between groups were tested with the Student t test and a cutoff value of 0.05 was chosen
to consider a difference to be statistically significant. Data analysis and plots were performed
using R software (v.3.1.2) with “stats” and “ggplot2” libraries (Bioconductor software suite).
Results
In vitro generation of granulomas in patients with severe sepsis
In a first series of experiments, we defined the experimental conditions of granuloma formation
using three healthy controls. We found that the culture of 2.5 × 10⁵ PBMCs with 50 BCG- or
CB-coated beads in 96-well microplates led to the formation of 75% and 90% of granulomas
after 6 and 9 days, respectively. We also measured the effect of PBMC freezing on granuloma
formation. The ability to form granuloma was not significantly different in unfrozen and fro-
zen PBMCs (92 ± 5% vs. 80 ± 7% after 9 days, respectively). In addition, we assayed the ability
of three control PBMCs to form granulomas three times. The variations in granuloma forma-
tion did not exceed 10%. Hence, these conditions, which reduced blood sampling and provided
a reproducible assay for routine investigation of frozen PBMCs from septic patients, were used
in the subsequent experiments.
Then, we investigated the formation of granulomas in patients with severe sepsis. Severe
sepsis was characterized by a dramatic decrease in granuloma formation as compared with
healthy controls and individuals with cured Q fever. Indeed, after 3 days of culture of PBMCs
with BCG-coated beads, the formation of granulomas was low (16 ± 33%) in septic patients
whereas it already reached 65 ± 30% in healthy controls (p< 0.001). Note that one healthy
control was unable to form granulomas and two subjects form only a small number of granulo-
mas. The defective formation of granulomas in septic patients was not due to a delayed forma-
tion of granulomas since it remained lower in the septic patients than in the healthy controls
after 6 (25 ± 41% vs. 81 ± 30%, p< 0.001) and 9 days (22 ± 39% vs. 79 ± 30%, p< 0.001). It
was clearly related to severe sepsis because the patients cured from Q fever were fully able to
form BCG-specific granulomas; the percentage was close to 100% (75 ± 41%; 98 ±2%; 99 ±1%;
p< 0.001 at days 3, 6 and 9, respectively) (Fig 1A). The deficient formation of granulomas did
not affect all the patients with severe sepsis because six among the 19 (31%) patients kept the
ability to form granulomas. Note that granuloma formation was delayed in 3 of these patients.
The patients with SOFA� 7 tended to have a defective granuloma formation, but no signifi-
cant correlation was found (S1 Fig). No significant difference was found between the patients
with and without granuloma formation (S3 Table).
Because the deficiency of granuloma formation in severe sepsis was related to the immune
granulomas, we wondered if innate granulomas were also affected. We determined the ability
of PBMCs from patients with severe sepsis to form innate granulomas using beads covered
with CB extracts. We showed that the patients with severe sepsis were unable to form innate
granulomas (14 ± 32%; 25 ± 42%; 24 ± 40%) compared with the healthy controls (58 ± 31%;
84 ± 24%; 84 ± 28%; p< 0.001) and with the patients cured from Q fever (79 ± 41%; 99 ± 1%;
98 ± 2%; p< 0.001) at days 3, 6, and 9, respectively. Note that the patient who did not form
granulomas in response to BCG extracts was unable to mount a granuloma response to CB
extracts. The level of the deficiency in patients with severe sepsis was similar to that found for
immune granulomas (Fig 1B). Taken together, these results showed that the patients with
severe sepsis exhibited a defective formation of innate and immune granulomas.
Granuloma and Sepsis
PLOS ONE | DOI:10.1371/journal.pone.0158528 July 21, 2016 5 / 13
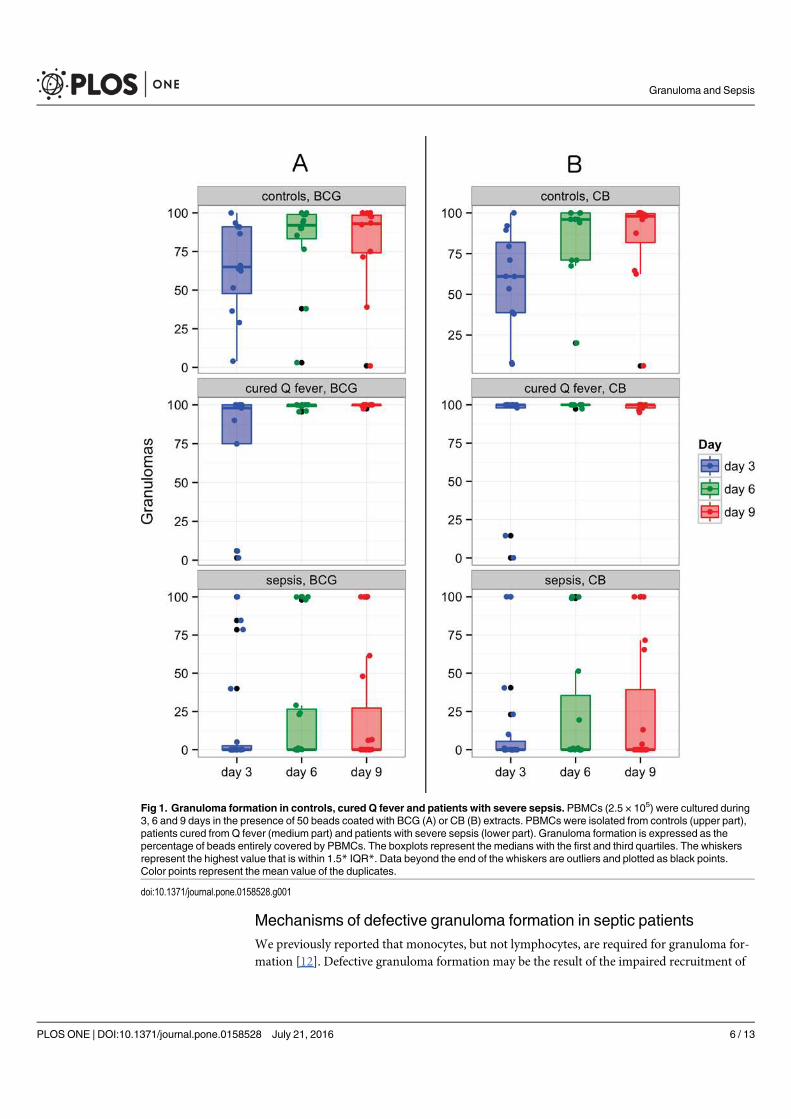
Mechanisms of defective granuloma formation in septic patients
We previously reported that monocytes, but not lymphocytes, are required for granuloma for-
mation [12]. Defective granuloma formation may be the result of the impaired recruitment of
Fig 1. Granuloma formation in controls, cured Q fever and patients with severe sepsis. PBMCs (2.5 × 10⁵) were cultured during3, 6 and 9 days in the presence of 50 beads coated with BCG (A) or CB (B) extracts. PBMCs were isolated from controls (upper part),patients cured from Q fever (medium part) and patients with severe sepsis (lower part). Granuloma formation is expressed as thepercentage of beads entirely covered by PBMCs. The boxplots represent the medians with the first and third quartiles. The whiskersrepresent the highest value that is within 1.5* IQR*. Data beyond the end of the whiskers are outliers and plotted as black points.Color points represent the mean value of the duplicates.
doi:10.1371/journal.pone.0158528.g001
Granuloma and Sepsis
PLOS ONE | DOI:10.1371/journal.pone.0158528 July 21, 2016 6 / 13
monocytes. We wondered if changes in monocyte and lymphocyte circulating levels impacted
granuloma formation in patients with severe sepsis. The cohort of septic patients consisted of
11 patients with an abnormal formula, including 9 patients who did not form granulomas. The
alteration of circulating mononuclear cells consisted of lymphopenia for 9 patients and mono-
cytopenia for 5 patients. Three patients were both lymphopenic and monocytopenic. Lympho-
penia in patients with severe sepsis was not significantly associated with the impaired
formation of immune and innate granulomas although 7 patients with lymphopenia did not
form granulomas (Fig 2A). In contrast, the five patients with monocytopenia (0.12 ± 0.08 × 10⁹
Fig 2. Granuloma formation according to lymphopenia or monocytopenia.Granuloma formation with BCG-coated beads (left)and CB-coated beads (right) was measured during 9 days in PBMCs from patients with severe sepsis. Patients were classifiedaccording to lymphopenia (A) and monocytopenia (B). The results are expressed as the percentage of beads entirely covered byPBMCs. The boxplots represent the medians with the first and third quartiles. The whiskers represent the highest value that is within1.5*IQR. Data beyond the end of the whiskers are outliers and plotted as black points. * p < 0.05 represents the differences betweenpatients with and without monocytopenia.
doi:10.1371/journal.pone.0158528.g002
Granuloma and Sepsis
PLOS ONE | DOI:10.1371/journal.pone.0158528 July 21, 2016 7 / 13
cells/l) were unable to form immune and innate granulomas (Fig 2B), showing that monocyto-
penia was associated with defective granuloma formation.
As monocytopenia did not account for all the patients with defective granuloma formation,
we wondered whether alterations in cytokine imbalance interfered with granuloma formation.
As TNF is associated with granuloma formation, we measured its release by PBMCs from sep-
tic patients. The amounts of TNF in supernatants from BCG-stimulated PBMCs were signifi-
cantly (p = 0.02 and p = 0.03, respectively) lower in the patients with severe sepsis (54 [36–150]
pg/ml) than in the healthy controls (295 [198–626] pg/ml) and the patients with cured Q fever
(362 [279–443] pg/ml). Similarly, the amounts of TNF in supernatants from CB-stimulated
PBMCs were significantly (p = 0.04 and p = 0.05, respectively) lower in the patients with severe
sepsis (59 [35–290] pg/ml) than in the healthy controls (311 [169–791] pg/ml) and the patients
with cured Q fever (480 [292–647] pg/ml) (Fig 3A). The decreased production of TNF may be
related to the hyporesponsiveness of PBMCs from patients with severe sepsis or the increased
production of an immunosuppressive cytokine such as IL-10. To discriminate between these
hypotheses, we determined the release of IL-10 by PBMCs in the presence of BCG- or CB-
coated beads. The release of IL-10 by control PBMCs stimulated with BCG- or CB-coated
beads did not exceed 40 pg/ml in healthy controls and patients cured from Q fever. The release
of IL-10 by PBMCs from septic patients was rather lower than that found in controls and
patients with cured Q fever (Fig 3A), suggesting that the decreased release of TNF in severe
sepsis was not related to the overproduction of an immunosuppressive cytokine such as IL-10.
Finally, we studied the relationship between the capacity to form granulomas and the produc-
tion of TNF in septic patients. The release of TNF (182 [104–349] and 232 [109–564] pg/ml,
respectively) by PBMCs from the patients who formed immune (BCG) and innate (CB) granu-
lomas was significantly (p< 0.05) higher than that of PBMCs from patients unable to form
immune and innate granulomas (36 [23–46] and 38 [18–50] pg/ml, respectively) (Fig 3B).
Taken together, these results showed that the defective formation of innate and immune granu-
lomas in patients with severe sepsis was related to monocytopenia and associated with reduced
production of TNF.
To tempt to relate defective granuloma formation and reduced production of TNF, we per-
formed additional experiments. First, we added recombinant TNF to PBMCs from 3 patients
who did not form granulomas: TNF was unable to increase the formation of immune and
innate granulomas. Indeed, the percentage of immune granulomas observed when PBMCs
were incubated in the presence of TNF was of 18 ± 25%; 27 ± 38%; 28 ± 42% at days 3, 6 and 9,
respectively. Similarly, TNF did not increase the percentage of innate granulomas in patients
unable to form granulomas (20 ± 25%, 27 ± 38%; 28 ± 42% at days 3, 6 and 9, respectively).
Second, we added mAb directed against TNF to control PBMCs cultured for 9 days in the pres-
ence of beads coated with BCG or CB extracts. We found that such treatment had no effect on
granuloma formation. Indeed, the percentage of immune granulomas remained high in the
presence of anti-TNF mAb (55 ± 37%, 75 ± 35% and 87 ± 24% at days 3, 6 and 9, respectively.
Similarly, anti-TNF mAb did not affect the percentage of innate granulomas (48 ± 42%,
78 ± 32% and 88 ± 21% at days 3, 6 and 9, respectively). Taken together, these results showed
that the formation of granulomas was not directly related to TNF.
Discussion
The study of immune response through the measurement of individual biomarkers to predict
the evolution of patients with severe sepsis has been unsuccessful to date. We are proposing an
alternative method, measurement of the in vitro formation of granulomas. It has been shown
that PBMCs are able to form in vitro granulomas using beads covered with BCG [7] or CB [12]
Granuloma and Sepsis
PLOS ONE | DOI:10.1371/journal.pone.0158528 July 21, 2016 8 / 13
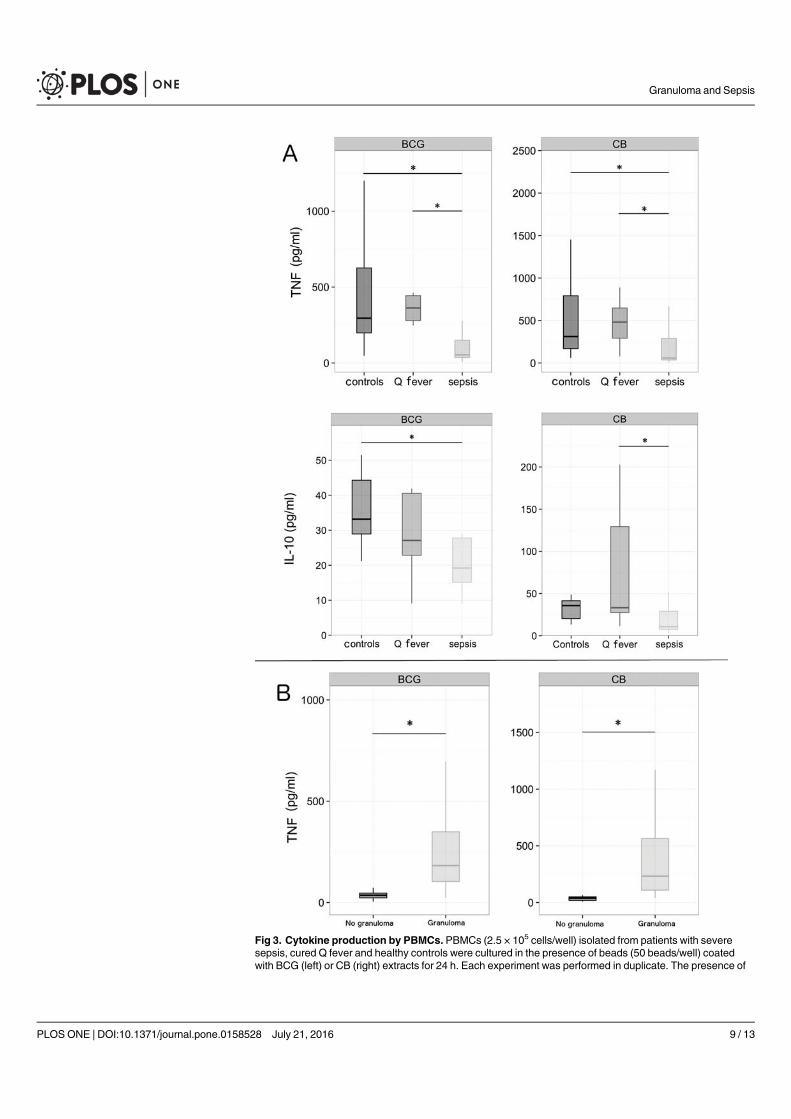
Fig 3. Cytokine production by PBMCs. PBMCs (2.5 × 10⁵ cells/well) isolated from patients with severesepsis, cured Q fever and healthy controls were cultured in the presence of beads (50 beads/well) coatedwith BCG (left) or CB (right) extracts for 24 h. Each experiment was performed in duplicate. The presence of
Granuloma and Sepsis
PLOS ONE | DOI:10.1371/journal.pone.0158528 July 21, 2016 9 / 13
extracts. Here, we developed an in vitro assay to measure granuloma formation with low-size
blood samples. In addition, using beads coated with BCG or CB extracts enabled us to investi-
gate innate and immune responses in patients. The assay was distinct from the measurement
of isolated biomarkers such as membrane antigens or soluble cytokines but could be related to
whole blood stimulation assay. Nevertheless, while the former assesses activation and recruit-
ment of PBMCs, the latter measures the ability of circulating cells to produce soluble
mediators.
We found that granuloma formation was impaired in patients with severe sepsis. As the
BCG vaccinal status of healthy subjects and septic patients was unknown, this may be a limit of
the study. However, it is likely that most of them were immunized due to the inclusion criteria
in France (affiliation to the national health system for being included in clinical trials). We also
used samples of patients cured from Q fever as controls in order to have a population with spe-
cific immunization. The defective formation of granulomas with BCG-coated beads reflects a
defective cell-mediated immune response. It may be related to loss of the delayed hypersensi-
tivity response to common recall antigens associated with sepsis-induced immunosuppression
[14]. Impaired granuloma formation with CB-coated beads in patients with severe sepsis who
are not sensitized to CB suggests an immunoparalysis state [14]. Nevertheless, a minority of
patients with severe sepsis was able to form granulomas, although we ignore if these granulo-
mas are functionally competent. Conversely, one healthy control was unable to form granulo-
mas. As the age of this control was 70 years, we suggest that the inability to form granulomas
may be related to immunosenescence because about 10% of healthy aged individuals were
unable to form granulomas (manuscript in preparation). Defective granuloma formation may
be associated with the severity of sepsis or patient outcomes. We assessed granuloma formation
according to severity including the severity score (SOFA) and survival. There is a tendency
between defective granuloma formation and high SOFA but no significant correlation was
found, likely due to the size of samples.
We then investigated the mechanisms involved in the defective granuloma formation in
patients with severe sepsis. First, we showed that defective granuloma formation was associated
with monocytopenia, but not with lymphopenia. This is consistent with our previous report in
which we showed that monocytes, but not lymphocytes, are required for the initial phases of
granuloma formation including the migration toward beads coated with bacterial extracts [12].
This may be also related to the role of macrophage supply in the maintain of granuloma integ-
rity as demonstrated in a zebrafish model of granuloma formation [23]. Nevertheless, defective
granuloma formation related to monocytopenia did not account for all the septic patients who
did not form granulomas. Second, the defective granuloma formation in septic patients may
depend on an inflammatory process or bacterial infection. We investigated the hypothesis
based on cytokine imbalance because sepsis-induced immunosuppression is associated with
decreased production of inflammatory cytokines and a high IL-10-to-TNF ratio [24]. We
found that the TNF release induced by BCG or CB extracts was decreased in PBMCs from
patients with severe sepsis. This finding is consistent with initial papers that showed the role of
TNF in granuloma formation [5]. The decrease of TNF production occurs without IL-10
increase, suggesting that the modulation of TNF release was not related to the overproduction
of IL-10, as in sepsis-induced immunosuppression based on LPS tolerance [25]. Our results are
TNF and IL-10 in cell supernatants was assayed twice. The results were expressed as pg/ml. In A, TNF andIL-10 were measured in 8 Controls, 7 Q fever, and 14 samples of Sepsis. In B, TNF was measured in patientswith severe sepsis who formed (6 samples) or did not form (8 samples) granulomas. The boxplots representthe medians with the first and third quartiles. The whiskers represent the highest value that is within 1.5 *IQR.* p < 0.05.
doi:10.1371/journal.pone.0158528.g003
Granuloma and Sepsis
PLOS ONE | DOI:10.1371/journal.pone.0158528 July 21, 2016 10 / 13
also distinct from those concerning patients with traumatic brain injury associated with defec-
tive granuloma formation in which a strong inflammatory response was observed [11]. The
decrease in TNF release may result from a decreased number of TNF-producing cells in the
blood, especially monocytes, rather than a repolarization of the immune response toward an
anti-inflammatory profile. However, TNF adding to PBMCs from septic patients unable to
form granulomas did not restore the formation of immune and innate granulomas. Similarly,
adding anti-TNF mAb to control PBMCs did not inhibit the formation of immune and innate
granulomas. These results suggest that TNF is dispensable or acts in synergy with other cyto-
kines in granuloma formation. We hypothesize that the defective granuloma formation in sep-
tic patients may depend on bacterial infection. Indeed, Deknuydt et al. included patients with
traumatic brain injury before the occurrence of nosocomial pneumonia and showed that
impaired granuloma formation in these patients is associated with an increased frequency of
secondary infections [11], suggesting that bacterial infection plays a major role in the defective
formation of granulomas in patients with severe sepsis.
Conclusion
In conclusion, this study showed that the assay of in vitro granuloma formation was convenient
to study small blood samples in clinical practice. It also demonstrated that granuloma forma-
tion was impaired in a large proportion of patients with severe sepsis, as well as the role of
monocytes. This study also suggests that immune response impairment is somewhat heteroge-
neous in patients with severe sepsis and use of this assay with larger cohorts of patients will be
necessary.
Supporting Information
S1 Fig. Granuloma formation according to ICU discharge and SOFA score. PBMCs isolated
from patients with severe sepsis were cultured in the presence of beads coated with BCG (left)
or CB (right) extracts for 9 days. Patients were classified according to ICU discharge (dead or
alive) (A) and SOFA score (� 7 or<7) (B). The results are expressed as the percentage of
beads entirely covered by PBMCs. The boxplots represent the medians with the first and third
quartiles. The whiskers represent the highest value that is within 1.5� IQR. Data beyond the
end of the whiskers are outliers and plotted as black points.
(TIFF)
S1 Table. Granuloma data. Represents each value (in percentage) of granuloma formation, at
day 3, 6, 9, from controls, cured Q fever, or sepsis PBMCs, coated with CB or BCG beads, in
duplicates.
(PDF)
S2 Table. Cytokine data. Represents TNF and IL-10 values (in pg/ml) in cells supernatants for
1 day of culture, according granuloma formation, from controls, cured Q fever, or sepsis
PBMCs, coated with CB or BCG beads, in duplicates.
(PDF)
S3 Table. Patient features according to granuloma formation or no granuloma formation.
SOFA: sequential organ failure assessment; SAPS: simplified acute physiology score; ICU:
intensive care unit. Results are expressed as absolute number and percentage or median and
interquartiles, as required.
(DOCX)
Granuloma and Sepsis
PLOS ONE | DOI:10.1371/journal.pone.0158528 July 21, 2016 11 / 13
Author Contributions
Conceived and designed the experiments: JT ML JLM. Performed the experiments: JA AD PB.
Analyzed the data: BC JT ML JLM. Contributed reagents/materials/analysis tools: JA BC JT PB
ADML JLM. Wrote the paper: JA JT ML JLM.
References1. Zumla A, James DG. Granulomatous infections: etiology and classification. Clin Infect Dis Off Publ
Infect Dis Soc Am. 1996; 23(1):146–58.
2. Molina-Ruiz AM, Requena L. Foreign Body Granulomas. Dermatol Clin. 2015; 33(3):497–523. doi: 10.1016/j.det.2015.03.014 PMID: 26143429
3. Egen JG, Rothfuchs AG, Feng CG, Winter N, Sher A, Germain RN. Macrophage and T cell dynamicsduring the development and disintegration of mycobacterial granulomas. Immunity. 2008; 28(2):271–84. doi: 10.1016/j.immuni.2007.12.010 PMID: 18261937
4. Russell DG, Cardona PJ, Kim MJ, Allain S, Altare F. Foamy macrophages and the progression of thehuman TB granuloma. Nat Immunol. 2009; 10(9):943–8. doi: 10.1038/ni.1781 PMID: 19692995
5. Ramakrishnan L. Revisiting the role of the granuloma in tuberculosis. Nat Rev Immunol. 2012; 12(5):352–66. doi: 10.1038/nri3211 PMID: 22517424
6. Shaler CR, Horvath CN, JeyanathanM, Xing Z. Within the Enemy’s Camp: contribution of the granu-loma to the dissemination, persistence and transmission of Mycobacterium tuberculosis. Front Immu-nol. 2013; 4:30. doi: 10.3389/fimmu.2013.00030 PMID: 23420646
7. Puissegur MP, Botanch C, Duteyrat JL, Delsol G, Caratero C, Altare F. An in vitro dual model of myco-bacterial granulomas to investigate the molecular interactions between mycobacteria and human hostcells. Cell Microbiol. 2004; 6(5):423–33. PMID: 15056213
8. Delaby A, Espinosa L, Lépolard C, Capo C, Mège JL. 3D reconstruction of granulomas from transmittedlight images implemented for long-time microscope applications. J Immunol Methods. 2010; 360(1–2):10–9. J Immunol Methods. 2010 Aug 31;360(1–2):10–9. doi: 10.1016/j.jim.2010.06.008 PMID:20561526
9. Meconi S, Vercellone A, Levillain F, Payré B, Al Saati T, Capilla F, et al. Adherent-invasive Escherichiacoli isolated from Crohn’s disease patients induce granulomas in vitro. Cell Microbiol. 2007; 9(5):1252–61. PMID: 17223928
10. Silva-Miranda M, Ekaza E, Breiman A, Asehnoune K, Barros-Aguirre D, Pethe K, et al. High-contentscreening technology combined with a human granuloma model as a new approach to evaluate theactivities of drugs against Mycobacterium tuberculosis. Antimicrob Agents Chemother. 2015; 59(1):693–7. doi: 10.1128/AAC.03705-14 PMID: 25348525
11. Deknuydt F, Roquilly A, Cinotti R, Altare F, Asehnoune K. An In vitro model of mycobacterial granulomato investigate the immune response in brain-injured patients. Crit Care Med. 2013; 41(1):245–54. doi:10.1097/CCM.0b013e3182676052 PMID: 23128384
12. Delaby A, Gorvel L, Espinosa L, Lépolard C, Raoult D, Ghigo E, et al. Defective monocyte dynamics inQ fever granuloma deficiency. J Infect Dis. 2012; 205(7):1086–94. doi: 10.1093/infdis/jis013 PMID:22351939
13. Calandra T, Cohen J, International Sepsis Forum Definition of Infection in the ICU Consensus Confer-ence. The international sepsis forum consensus conference on definitions of infection in the intensivecare unit. Crit Care Med. 2005; 33(7):1538–48. PMID: 16003060
14. Hotchkiss RS, Monneret G, Payen D. Sepsis-induced immunosuppression: from cellular dysfunctionsto immunotherapy. Nat Rev Immunol. 2013; 13(12):862–74. doi: 10.1038/nri3552 PMID: 24232462
15. Debets JM, Kampmeijer R, van der Linden MP, BuurmanWA, van der Linden CJ. Plasma tumor necro-sis factor and mortality in critically ill septic patients. Crit Care Med. 1989; 17(6):489–94. PMID:2721208
16. Hotchkiss RS, Karl IE. The Pathophysiology and Treatment of Sepsis. N Engl J Med. 2003; 348(2):138–50. PMID: 12519925
17. Meisel C, Schefold JC, Pschowski R, Baumann T, Hetzger K, Gregor J, et al. Granulocyte-macrophagecolony-stimulating factor to reverse sepsis-associated immunosuppression: a double-blind, random-ized, placebo-controlled multicenter trial. Am J Respir Crit Care Med. 2009; 180(7):640–8. doi: 10.1164/rccm.200903-0363OC PMID: 19590022
18. Leone M, Bechis C, Baumstarck K, Lefrant JY, Albanèse J, Jaber S, et al. De-escalation versus contin-uation of empirical antimicrobial treatment in severe sepsis: a multicenter non-blinded randomized
Granuloma and Sepsis
PLOS ONE | DOI:10.1371/journal.pone.0158528 July 21, 2016 12 / 13
noninferiority trial. Intensive Care Med. 2014; 40(10):1399–408. doi: 10.1007/s00134-014-3411-8PMID: 25091790
19. Le Gall JR, Loirat P, Alperovitch A, Glaser P, Granthil C, Mathieu D, et al. A simplified acute physiologyscore for ICU patients. Crit Care Med. 1984; 12(11):975–7. PMID: 6499483
20. Vincent JL, Sakr Y, Sprung CL, Ranieri VM, Reinhart K, Gerlach H, et al. Sepsis in European intensivecare units: results of the SOAP study. Crit Care Med. 2006; 34(2):344–53. PMID: 16424713
21. Honstettre A, Imbert G, Ghigo E, Gouriet F, Capo C, Raoult D, et al. Dysregulation of cytokines in acuteQ fever: role of interleukin-10 and tumor necrosis factor in chronic evolution of Q fever. J Infect Dis.2003; 187(6):956–62. PMID: 12660942
22. Gorvel L, Textoris J, Banchereau R, Ben Amara A, Tantibhedhyangkul W, von Bargen K, et al. Intracel-lular bacteria interfere with dendritic cell functions: role of the type I interferon pathway. PloS One.2014; 9:e99420. doi: 10.1371/journal.pone.0099420 PMID: 24915541
23. Pagán AJ, Yang CT, Cameron J, Swaim LE, Ellett F, Lieschke GJ, et al. Myeloid Growth Factors Pro-mote Resistance to Mycobacterial Infection by Curtailing Granuloma Necrosis through MacrophageReplenishment. Cell Host Microbe. 2015; 18(1):15–26. doi: 10.1016/j.chom.2015.06.008 PMID:26159717
24. Boomer JS, To K, Chang KC, Takasu O, Osborne DF, Walton AH, et al. Immunosuppression in patientswho die of sepsis and multiple organ failure. JAMA. 2011; 306(23):2594–605. doi: 10.1001/jama.2011.1829 PMID: 22187279
25. Biswas SK, Lopez-Collazo E. Endotoxin tolerance: newmechanisms, molecules and clinical signifi-cance. Trends Immunol. 2009; 30(10):475–87. doi: 10.1016/j.it.2009.07.009 PMID: 19781994
Granuloma and Sepsis
PLOS ONE | DOI:10.1371/journal.pone.0158528 July 21, 2016 13 / 13
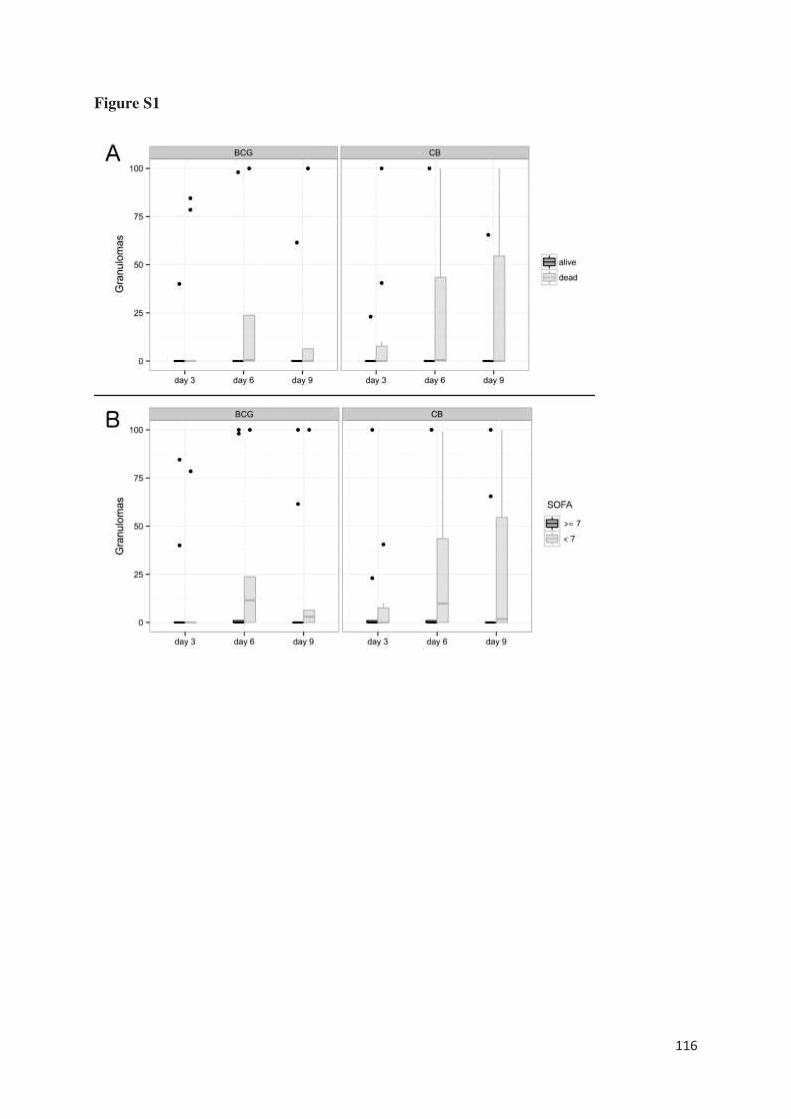
116
Figure S1
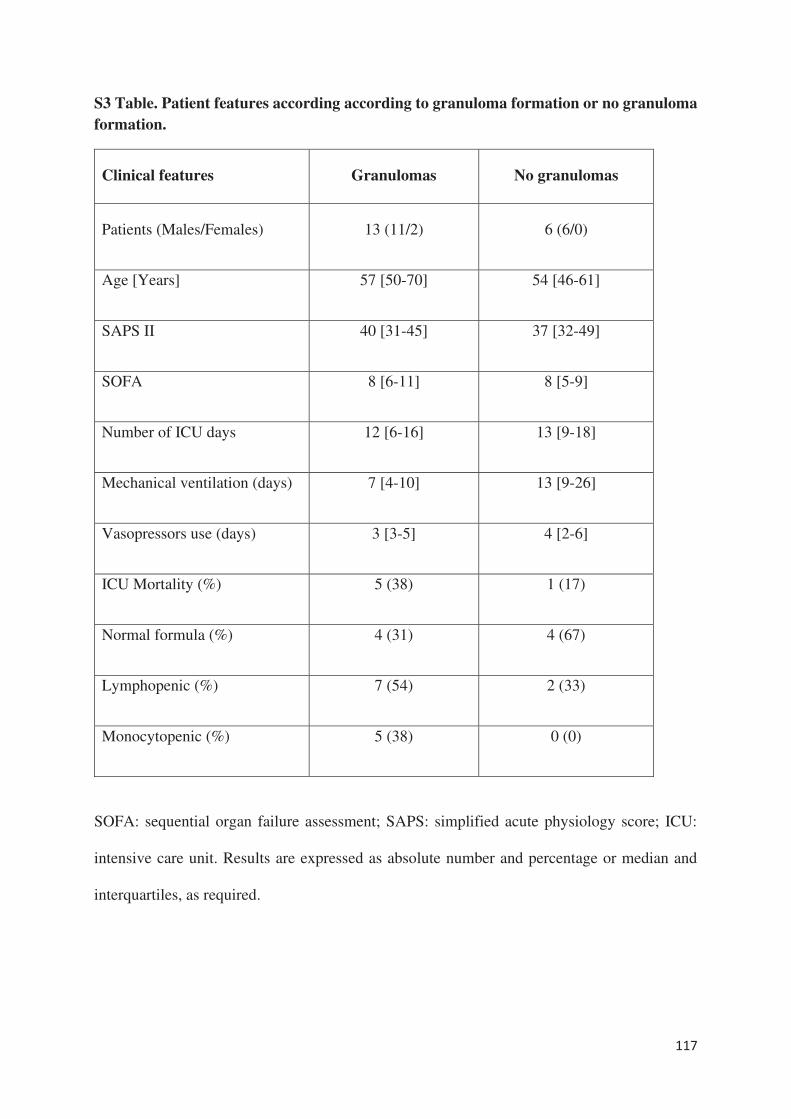
117
S3 Table. Patient features according according to granuloma formation or no granuloma
formation.
Clinical features Granulomas No granulomas
Patients (Males/Females) 13 (11/2) 6 (6/0)
Age [Years] 57 [50-70] 54 [46-61]
SAPS II 40 [31-45] 37 [32-49]
SOFA 8 [6-11] 8 [5-9]
Number of ICU days 12 [6-16] 13 [9-18]
Mechanical ventilation (days) 7 [4-10] 13 [9-26]
Vasopressors use (days) 3 [3-5] 4 [2-6]
ICU Mortality (%) 5 (38) 1 (17)
Normal formula (%) 4 (31) 4 (67)
Lymphopenic (%) 7 (54) 2 (33)
Monocytopenic (%) 5 (38) 0 (0)
SOFA: sequential organ failure assessment; SAPS: simplified acute physiology score; ICU:
intensive care unit. Results are expressed as absolute number and percentage or median and
interquartiles, as required.
118
Defective granuloma formation in elderly infected patients
Aurélie Daumas1,2, Benjamin Coiffard1, Céline chartier1, Amira Ben amara1, Julie
Alingrin3, Patrick Villani2, Jean-Louis Mege1
1 Aix-Marseille Univ, IRD, APHM, MEPHI, IHU-Méditerranée Infection, Marseille, France.
2 Service de Médecine Interne, Gériatrie et Thérapeutique, Hôpital de la Timone, Assistance
Publique-Hôpitaux de Marseille
3 Service d’Anesthésie et de Réanimation, Hôpital Nord, Assistance Publique-Hôpitaux de
Marseille
Corresponding author:
Professor Jean-Louis MEGE
Aix-Marseille Université, IRD, APHM, MEPHI, IHU-Méditerranée Infection
Marseille, France
Soumis à Frontiers in Cellular and Infection Microbiology
119
La population vieillie, notamment dans les pays industrialisés avec un triplement de la
population âgée de plus de 60 ans d’ici 2050. Le vieillissement est complexe associant
modifications physiologiques et pathologies chroniques qui entraînent une diminution des
capacités de réserve du sujet. Le vieillissement est hétérogène. En effet, tous les organes ne
vieillissent pas de la même manière au sein d’une même personne et tous les individus ne sont
pas égaux face au vieillissement. Le vieillissement est associé à un déclin des capacités du
système immunitaire, appelé immunosénescence, touchant à la fois le compartiment inné et
adaptatif. Il s’y associe un autre phénomène appelé « inflamm-aging » caractérisé par une
production accrue de cytokines pro-inflammatoires [134]. L’ensemble de ces modifications
diminue les capacités du patient âgé à produire une réponse immune efficace contre les
agressions.
Ainsi, le sepsis est beaucoup plus fréquent dans la population âgée et est associé à deux fois
plus de mortalité [135]. Deux phases sont décrites dans le sepsis à savoir tout d’abord une phase
pro-inflammatoire puis une phase immunodépressive permettant le retour à l’homéostasie
[136]. Des altérations du fonctionnement du système immunitaire ont été décrites au cours de
la phase immunodépressive notamment une altération fonctionnelle des monocytes, une
augmentation des lymphocytes T régulateurs et l’augmentation de cytokines suppressives telles
que l’IL-10 [136]. La persistance de cet état est associée à un mauvais pronostic avec un risque
élevé d’infections et une augmentation de la mortalité. L’avenir se tourne donc vers des
traitements immunomodulateurs, cependant, l’impact du sepsis sur le système immunitaire
sénescent humain est encore mal compris et nécessite d’être étudié.
Nous avons donc décidé d’utiliser la méthode de formation in vitro de granulomes pour étudier
l’impact du sepsis sur le déroulement de la réponse immunitaire. Nous avons ainsi étudié la
capacité de sujets âgés en bonne santé et infectés à former des granulomes en réponse à des
extraits de Coxiella burnetii et de BCG. Nous avons inclus 23 patients âgés en sepsis et 24
patients âgés non infectés comme contrôles. La formation des granulomes a été étudiée durant
les 9 jours suivant la mise en culture des PBMCs des patients avec les billes de sépharose
couplées aux extraits bactériens de Coxiella burnetii ou Mycobacterium bovis (BCG).
Le résultat principal est que plus de la moitié des sujets infectés (52%) sont incapables de former
des granulomes contre seulement 8% des sujets sains que ce soit en réponse à Coxiella burnetii
120
ou BCG. Sur le plan clinique, une dénutrition étaient significativement retrouvée chez les
patients ne formant pas de granulome. Contrairement à l’étude chez les patients en sepsis, les
sujets âgés incapables de former des granulomes ne présentaient pas de monocytopénie et/ou
de lymphopénie. Ce défaut de formation était associé à un défaut de différenciation des
macrophages en cellules épithélioides et en cellules géantes multinucléés. En outre, la
production de TNF était diminuée sans lien avec une surexpression d’IL-10. Au niveau du
transcriptome, tous les gènes décrits et étudiés dans la formation des granulomes [Article 5], à
l’exception d’un gène impliqué dans la polarisation M1 des macrophages, étaient sous-
exprimés chez les patients ne formant pas de granulome par rapport aux patients en formant.
Ainsi, cette méthode semble être un excellent outil d’évaluation de la capacité du système
immunitaire dans son ensemble à répondre à une agression. En objectivant dès J3, l’incapacité
des PBMCs d’un patient à former des granulomes, cela pourrait amener à adapter la prise en
charge du patient.
121
Abstract
Granulomas are compact structures formed in tissues by the immune system in response to
aggressions. The in vitro generation of granulomas using circulating mononuclear cells is an
innovative method to easily assess the immune status of patients. Monitoring the immune
response in infected elderly patients would help improve their therapeutic management.
Circulating mononuclear cells from 23 elderly patients with sepsis and 24 healthy elderly
patients were incubated with Sepharose beads coated with either BCG or Coxiella burnetii
extracts. The formation of granulomas was measured over 9 days.
Most healthy elderly patients (92%) were able to form granulomas in response to BCG and C.
burnetii extracts compared to only 48% of infected elderly patients. Malnutrition was
significantly associated with impaired granuloma formation in healthy and infected patients.
Granulomas typically comprise epithelioid cells and multinucleated giant cells, however, these
cells were not detected in samples obtained from patients unable to form granulomas. We also
found that the impairment of granuloma formation was associated with reduced production of
tumor necrosis factor without overproduction of interleukin-10. Finally, all genes specifically
modulated in granulomatous cells were down-modulated in patients with defective granuloma
formation. TNFSF10 was the only M1 gene markedly upregulated in patients who did not form
granulomas. These results suggest that defective granuloma formation may be a marker of
altered activation of immune cells in elderly patients accounting for the difficulty in clearing
infections and the predisposition to nosocomial infections.
Keywords: sepsis, elderly patient, granuloma, tumor necrosis factor, multinucleated giant cell
122
INTRODUCTION
Granulomas are organized collections of immune cells that reflect tissue immune response to
aggressions. They are dynamic structures based on the recruitment of monocytes, macrophages,
and T lymphocytes, and the subsequent differentiation of macrophages into epithelioid cells
and multinuclear giant cells (MGCs). Granulomas have a significant protective function but can
also be pathogenic [1,2]. Their main function is to isolate bacteria or other pathogens from the
body and facilitate their destruction by granulomatous cells. Tuberculous granulomas contain
primarily monocyte-derived macrophages and epithelioid cells surrounded by a ring of CD4+
and CD8+ T cells. These granulomas are also rich in MGCs generated by the fusion of activated
macrophages. Cytokines and chemokines play a critical role in granuloma formation through
their control of the recruitment and activation of immune cells [3]. Indeed, type 1 cytokines
such as interferon (IFN)-γ, tumor necrosis factor (TNF), and interleukin (IL)-12 are involved
in the acquisition of the microbial competence of macrophages and contribute substantially to
the ability of the host to eradicate pathogens. Conversely, IL-10, an anti-inflammatory cytokine,
negatively regulates the protective immune response [4]. In intracellular bacterial infections,
CD4+ T cells differentiate into T helper type 1 (Th1) effector cells that secrete IFN-γ and TNF;
these mediate protection by stimulating the microbial activity of macrophages [1]. In a mouse
model of mycobacterial infection, the absence of TNF and IFN-γ leads to impaired granuloma
formation and increases bacterial infection [5,6]. Furthermore, the use of anti-TNF antibodies
in patients highlights the role of TNF in granuloma formation. Clinical observations have
revealed that anti-TNF-α treatment is associated with a risk of tuberculosis reactivation.
However, we recently reported that anti-TNF antibodies do not affect the formation of
granulomas but that of MGCs [7]. In humans, impaired IL12/IFN-γ predisposes patients to
123
mycobacterial infections and interferes with granuloma formation depending on the severity of
IFN-γ impairment [8].
The study of tissue granulomas in patients requires biopsies, which cannot be performed
routinely. Recently, an in vitro alternative was proposed. The method is based on the culture of
peripheral blood mononuclear cells (PBMCs) with Sepharose beads coated with bacterial
extracts from BCG, an attenuated strain derived from Mycobacterium bovis [9], and from
Coxiella burnetii (CB), the causative agent of Q fever [10]. This method is convenient to study
the initial phases of granuloma formation and the transcriptional signature. More than 50% of
genes are commonly modulated in response to CB and BCG. They include M1-related genes
such as HESX1, TNFSF10, IDO1 and TNF, and genes related to chemotaxis (CCL2, CCL5).
CB strongly upmodulates the expression of genes involved in microbicidal response, especially
ISGs including IFIT1. Furthermore, the expression of genes such as FASLG and GNLY
involved in cell death is increased in response to BCG [11]. This approach enables the formation
of granulomas to be investigated in clinical practice. Indeed, the in vitro formation of
granulomas is defective in the majority of patients with chronic Q fever; this is related to the
impaired migration of monocytes toward CB-coated beads [12]. In brain injury patients, the
defective in vitro formation of granulomas involving monocytes, natural killer cells, and γδ T
cells, is associated with increased nosocomial pneumonia [13]. In patients with severe sepsis,
the defective in vitro formation of granulomas is related to monocytopenia and associated with
reduced production of TNF [14].
Elderly individuals are at risk of contracting infectious diseases due to their declining immune
system known as "immunosenescence". If the latter affects both innate and adaptive immunity,
other factors likely contribute to the increased risk; these include malnutrition, comorbidities,
diminished mucosal barriers, decreased cough reflex, and mechanical changes to the urinary
124
tract system [15,16]. The most common comorbidities that have been linked to an increased
risk of infection are congestive heart failure, chronic kidney disease, diabetes mellitus, cirrhosis,
chronic obstructive lung disease, and malignancies [17]. In infectious diseases, patient outcome
is determined by a complex interplay between pro- and anti-inflammatory host responses [18].
In most patients, the pro-inflammatory response is self-limited. However, in patients who
develop sepsis, the response is exaggerated (or “hyper-inflammatory”) and leads to a
compensatory downregulation of the immune system during which the patient is susceptible to
organ dysfunction and nosocomial infection. The mechanisms of resistance or susceptibility of
individuals are not well understood. A major risk factor appears to be some degree of pre-
existing immune dysfunction. For instance, elderly patients and immunosuppressed patients
both have a higher incidence of sepsis, as well as a higher mortality rate [18]. Martin et al. [19]
showed that the incidence of sepsis is disproportionately higher in elderly adults and age is an
independent predictor of mortality.
We hypothesized that infected elderly patients would be unable to mount an efficient immune
response against pathogens. To test this hypothesis, we assessed the ability of PBMCs to
generate granulomas in vitro in response to BCG and CB.
We found that the ability to develop an in vitro granulomatous response to BCG or CB was
impaired in a majority (52%) of infected elderly patients whereas only 8% of healthy patients
did not form granulomas. The defective formation of granulomas was associated with decreased
formation of epithelioid cells and MGCs and reduced production of TNF. In addition, the
impairment of granuloma formation was associated with a marked alteration in the activation
of granuloma cells without polarization of macrophages.
125
MATERIALS AND METHODS
Study population
Patients recruitment was provided from an ancillary study to NCT02734017. Written informed
consent was obtained from the patients or their relatives. Patients from the geriatric unit at
Timone Hospital in Marseille, France were enrolled from January 1st 2015 to April 30th 2016
according to the following criteria: aged over 65 years with at least three chronic illnesses or
over 75 years and with presence or absence of sepsis without organ failure lasting for less than
48 hours requiring empirical antimicrobial treatment. We included 23 infected patients with
different pathogens and sources of infection and 24 patients without infection as healthy
patients. The latter were devoid of immunodeficiency, cancer in the previous 5 years, and
immunosuppressive and immunomodulatory drugs. At the time of blood collection, we also
collected demographic variables, comorbidities, biological data, and the source of infection for
the infected patients. The main clinical characteristics of the 47 patients enrolled are
summarized in Table 1.
Mononuclear cell isolation
EDTA-anticoagulated blood samples (5 mL) were collected (on day of initiation of empirical
antibiotic treatment for infected patients) and immediately sent to the laboratory. Peripheral
blood mononuclear cells (PBMCs) from infected patients and controls were isolated from whole
blood using a Ficoll gradient (MSL, Eurobio) and suspended in RPMI 1640 containing 25 mM
HEPES and 2 mM L-glutamine (Invitrogen) [14]. After centrifugation at 500 × g, PBMCs were
washed in sterile phosphate-buffered saline (PBS, Life Technologies) and suspended (about 5
× 106 cells/ml) in RPMI 1640 containing 20% fetal calf serum (FCS, Invitrogen) and 10%
dimethylsulfoxide, and preserved at -80°C.
126
Coupling of beads with bacterial extracts
CB organisms (Nine Mile strain, RSA 495) and BCG (CIP 105050) were cultured as described
previously [9]. The bacteria (109 per assay) were sonicated in a coupling buffer (0.1 M NaHCO3
pH 8.3 containing 0.5 M NaCl) and their protein content was determined using Bradford's
method (BioRad protein assay). Cyanogen-bromide (CN-Br)-activated Sepharose 4B beads 40
to 100 μm in diameter (GE Healthcare, France) were suspended in 1 mM HCl for 15 min and
then washed in a coupling buffer according to the manufacturer's instructions.
Bacterial extracts (0.5 mg of protein corresponding to about 2.5 × 10⁸ bacteria) were added to
10 mg (4 × 10⁴ beads) of beads and the mixture was rotated overnight at 4 °C in a coupling
buffer. After centrifugation at 120 × g for 10 min, the coupling efficiency of the bacterial
extracts was determined by measuring the protein content of the supernatants. The beads were
then extensively washed, and the remaining CN-Br active groups were blocked by incubating
the beads with 0.1 M Tris–HCl buffer pH 8.0 for 2 h. After centrifugation at 120 × g for 10 min,
the beads were washed again three times in acetate and Tris-HCl buffers. The beads were finally
stored at 4 °C in phosphate-buffered saline for a month.
Granuloma formation
In vitro granuloma formation was assessed after incubation of 2.5 x 10⁵ PBMCs with 50
Sepharose beads coated with either CB or BCG extracts in 96-well plates containing RPMI
1640 medium supplemented with 25 mM HEPES, 2 mM of L-glutamine, 10% FCS, and
antibiotics at 37°C. The formation of granulomas was evaluated after 3, 6, and 9 days of culture
using inverse microscopy (DIM3000 B, Leica). Only beads completely covered with cells were
considered granulomas. All the wells (3 per experiment) were examined under an optical
microscope to determine the number of granulomas. The results were expressed as the
percentage of granulomas in relation to the number of beads in the well.
127
Cell characterization
May-Grünwald Giemsa (Sigma, France) staining was used to identify epithelioid cells and
MGCs in dissociated granuloma cells. The percentage of epithelioid cells and MGCs was
quantified using an inverted microscope after 3, 6, and 9 days of culture.
Dissociated granuloma cells (5 x 10⁵) were also analyzed using flow cytometry. PBMCs were
labeled with a mixture of the following fluorescent antibodies: CD3-PC5 (Beckman Coulter,
France), CD4-APC (Dako, France), CD8-PE (Beckman Coulter, France), CD68-FTIC (Dako,
France), and CD45-APC H7 (Becton Dickinson Biosciences, France) with isotype-matched
fluorophore-conjugated immunoglobulin G (IgG) for the controls. Cell populations were
identified using a CANTO II flow cytometer (Becton Dickinson Biosciences) and DIVA BD
software (San Jose, CA) was used to analyze the data.
In patients unable to form granulomas, the cells were recovered and analyzed in the same way
as the granuloma cells.
Cytokine measurement
PBMCs (2.5 x 10⁵ cells/well) were incubated with coated beads (50 beads/well) and the
supernatants were collected after 1 and 3 days. TNF and IL-10 production were measured in
the supernatants using enzyme immunoassays (R&D Systems, Quantinine® ELISA kit)
according to the manufacturer’s instructions. The results were expressed as pg/ml. The intra-
and inter-specific coefficients of variation ranged from 5% to 10%.
RNA Extraction and Real-time quantitative RT-PCR (qRT-PCR)
Granuloma cells were dissociated by incubation in PBS buffer containing 2 mM EDTA
(Invitrogen). Total RNA from granuloma cells was extracted and treated with DNase using the
RNeasy® Mini Kit (Qiagen). Reverse transcription of 150 ng of total RNA was performed as
128
described previously [20]. We assessed the expression of nine M1 (TNFSF10, IL15RA, IDO1,
IL2RA, TNF, IL15, EDN1, HESX1, CXCL29), seven M2 (ALOX15, FN1, CCL23, CCL13,
CLEC4, CSTE, HRH1), and four granulomatous genes (EPBH2, FASLG, GNLY, IFIT1) in
granuloma cells in response to CB and BCG, as previously studied [11]. All selected primers
were designed using Primer3 (version 0.4.0; http://bioinfo.ut.ee/primer3/). Quantitative PCR
was performed using LightCycler FastStart DNA MasterPLUS SYBR Green I (Roche). The
results were normalized with the housekeeping gene β-actin. The fold change (FC) of the target
genes relative to β-actin was computed using the formula FC = 2-ΔΔCt, where ΔΔCt = (CtTarget -
CtActin)stimulated - (CtTarget - CtActin)unstimulated [20].
Statistical Analysis
Quantitative data are presented as the mean with range or standard deviation. Qualitative data
are presented as absolute counts and percentages. Results between groups were compared using
the Mann-Whitney U test. Differences were considered significant when p < 0.05. Data analysis
was performed, and plots were generated using GraphPad Prism 5 (GraphPad Software Inc).
RESULTS
Patient characteristics
The characteristics of the study population are shown in Table 1. Twenty-three infected patients
(14 women and 9 men) with an average age of 81.7 years and 24 healthy patients (13 women
and 11 men) with an average age of 84.6 years were included. The leukocyte and neutrophil
counts were significantly (p < 0.001) higher in infected patients than in healthy patients,
whereas the monocyte and lymphocyte counts were not significantly different. C-reactive
protein and albumin levels were significantly (p < 0.001) higher and lower, respectively, in
infected patients. The most frequent infections were urinary tract infections (8 patients) and
129
pneumonia (6 patients). The microbial etiology was identified in only 50% of infected patients
and consisted mainly of gram-negative bacilli (n = 8). No patient had a medical history of
tuberculosis or Q fever.
Defective formation of granulomas in infected patients
We wondered if the occurrence of infection in elderly subjects was associated with impaired
granuloma formation. PBMCs from healthy patients and infected patients were incubated with
beads coated with BCG and granuloma formation was measured for 9 days (Figure 1A). The
great majority of healthy patients (22 out of 24, 92%) were able to form granulomas, whereas
only 48% of infected patients were. The defective formation of granulomas in infected patients
was not due to a delayed formation because the formation of granulomas was significantly
lower in infected patients than in healthy patients at days 3, 6, and 9 (p < 0.001) (Figure 1B).
After cultivating PBMCs with BCG-coated beads for 3 days, the formation of granulomas was
significantly lower in infected patients (22 ± 36%), whereas it reached 42 ± 40% in healthy
patients. The defective formation of granulomas was not due to a delayed formation because it
remained lower in infected patients than in healthy patients after 6 days (50 ± 42% vs 74 ±
31%) and 9 days (49 ± 45% vs 72 ± 33%). Interestingly, when CB-coated beads were used
instead of BCG-beads, the patients who did not form granulomas in response to BCG extracts
were also unable to form granulomas in response to CB extracts. After 3 days of culture of
PBMCs with CB-coated beads, the formation of granulomas was also significantly low in
infected patients. The defective formation of granulomas was not due to a delayed formation
since it remained lower in infected patients than healthy patients after 6 and 9 days (Figure
1C). The comparison of granuloma formation in response to BCG and CB extracts did not show
any significant difference, except at day 9 for healthy patients for whom the granuloma
percentage was significantly lower in response to CB extracts than in response to BCG (Figure
130
2). Taken together, these results show that the ability to develop an in vitro granulomatous
response to BCG or CB extracts was altered in infected elderly patients. Given these results,
the following experiments were performed with BCG-coated beads only.
Granuloma formation and patient characteristics
As infected patients were partitioned into two populations able or unable to form granulomas,
we wondered if impaired granuloma formation was associated with some clinical and/or
biological features of patients (Tables S1 and S2). We found that infected female patients were
more prone to forming granulomas than their male counterparts. This gender effect was not
observed in healthy patients. Among the clinical parameters, malnutrition was significantly
associated with impaired granuloma formation in both healthy and infected patients (p = 0.02).
The inflammatory status as assessed by the CRP level was not significantly different in infected
patients who did or did not form granulomas. Leukocyte and neutrophil counts were
significantly higher in healthy patients who formed granulomas than in patients who did not
form granulomas. No difference was found in infected patients. So, except malnutrition, no
significant difference was found between patients with and without granuloma formation.
Hence, clinical and biological parameters were not sufficient to account for impaired granuloma
formation.
Cell composition of granulomas
We wondered whether the cellular composition of granulomas was altered in patients. First, we
measured the proportion of cell populations placed in culture from patients who would form
granulomas and those who would not. The proportion of monocytes and CD4+ and CD8+ T
lymphocytes determined using flow cytometry was similar between healthy patients and
infected patients regardless of their capacity to form granulomas or not (data not shown).
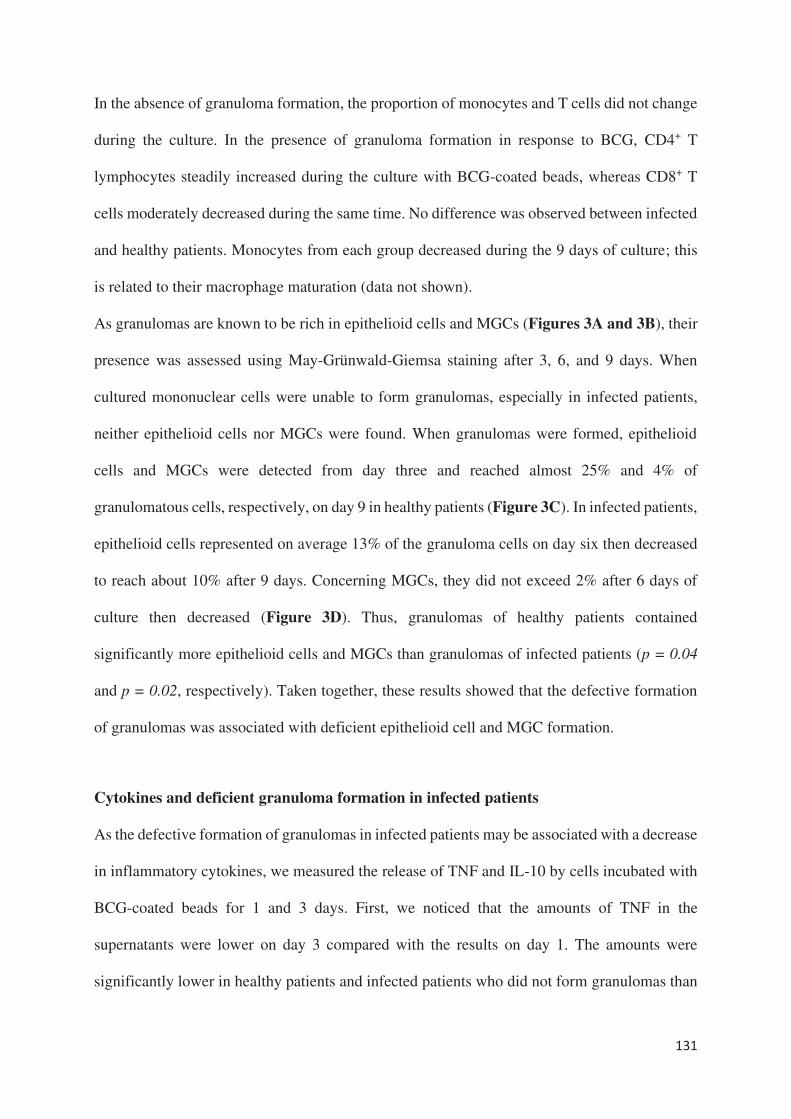
131
In the absence of granuloma formation, the proportion of monocytes and T cells did not change
during the culture. In the presence of granuloma formation in response to BCG, CD4+ T
lymphocytes steadily increased during the culture with BCG-coated beads, whereas CD8+ T
cells moderately decreased during the same time. No difference was observed between infected
and healthy patients. Monocytes from each group decreased during the 9 days of culture; this
is related to their macrophage maturation (data not shown).
As granulomas are known to be rich in epithelioid cells and MGCs (Figures 3A and 3B), their
presence was assessed using May-Grünwald-Giemsa staining after 3, 6, and 9 days. When
cultured mononuclear cells were unable to form granulomas, especially in infected patients,
neither epithelioid cells nor MGCs were found. When granulomas were formed, epithelioid
cells and MGCs were detected from day three and reached almost 25% and 4% of
granulomatous cells, respectively, on day 9 in healthy patients (Figure 3C). In infected patients,
epithelioid cells represented on average 13% of the granuloma cells on day six then decreased
to reach about 10% after 9 days. Concerning MGCs, they did not exceed 2% after 6 days of
culture then decreased (Figure 3D). Thus, granulomas of healthy patients contained
significantly more epithelioid cells and MGCs than granulomas of infected patients (p = 0.04
and p = 0.02, respectively). Taken together, these results showed that the defective formation
of granulomas was associated with deficient epithelioid cell and MGC formation.
Cytokines and deficient granuloma formation in infected patients
As the defective formation of granulomas in infected patients may be associated with a decrease
in inflammatory cytokines, we measured the release of TNF and IL-10 by cells incubated with
BCG-coated beads for 1 and 3 days. First, we noticed that the amounts of TNF in the
supernatants were lower on day 3 compared with the results on day 1. The amounts were
significantly lower in healthy patients and infected patients who did not form granulomas than
132
in healthy patients and infected patients with granuloma formation on day 1 as well as on day
3 (p < 0.05 for healthy patients and p < 0.001 for infected patients) (Figure 4). The decrease
in production of TNF may be related to an increase in production of an immunosuppressive
cytokine such as IL-10. Therefore, the amounts of IL-10 in the supernatants were measured.
They were low and similar in infected and healthy patients with or without granuloma formation
(Figure 4). Taken together, these results suggested that the defective formation of granulomas
was associated with a decrease in TNF production and not an increase in IL-10 production.
Gene expression programs and deficient granuloma formation in infected patients
As the alteration in granuloma formation was related to TNF deficiency, we investigated the
activation status of granulomatous cells in individuals who formed granulomas. We collected
cells from granulomas after dissociation in eight patients who formed granulomas (5 infected
patients and 3 healthy patients) and assessed the expression of a panel of nine M1, seven M2,
and four granulomatous genes, as reported previously [11]. In patients who formed granulomas,
M1, M2, and granulomatous genes were upregulated, suggesting strong activation of
granulomatous cells without M1 or M2 polarization (Figure 5A). It is noteworthy that in
patients who did not form granulomas (n=3), the expression of M1, M2, and granulomatous
genes was markedly depressed, with the exception of TNFSF10 (Figure 5B). Hence, the
granulomas formed in healthy individuals and infected patients exhibited normal activation
profiles. Healthy and infected patients with impaired formation of granulomas are associated
with a profound alteration in the activation program of immune cells.
DISCUSSION
Elderly patients are susceptible to infection and the risk of complications is higher when they
are infected. Several factors affect the prognosis of infected elderly patients such as
immunosenescence-associated immunosuppression, age-related organ changes, comorbidities,
133
malnutrition or polypharmacy [21]. We hypothesized that infected elderly patients were unable
to mount an efficient immune response against pathogens and we proposed answering this
question by measuring the in vitro formation of granulomas using beads covered with BCG [8]
and CB [9] extracts.
We showed that granuloma formation was impaired in infected patients compared to healthy
patients in response to both BCG and CB extracts. To exempt our data from the constraints of
prior immunization, we compared granuloma formation in response to BCG to which a majority
of individuals are immunized and CB to which a minority of individuals are immunized.
Clearly, our results are not dependent on prior immunization as the modulation of BCG and CB
granulomas was similar. This result is consistent with defective granuloma formation observed
in patients with severe sepsis [14]. Likewise, PBMCs from brain-injured patients with
nosocomial pneumonia generated significantly fewer granulomas compared with brain-injured
patients without nosocomial pneumonia and healthy donors [13].
Deficient granuloma formation was observed in a large proportion (48%) of infected patients
and a minority of healthy patients (8%). No relationship was found between defective
granuloma formation and age, sex or comorbidities. Clinically, only malnutrition was
significantly associated with the impairment of granuloma formation. Malnutrition can be
defined as the state of being poorly nourished. The causes of malnutrition are extremely varied,
and can be divided into three main types: medical, social, and psychological. For example,
ageing is frequently associated with decreases in taste acuity and smell, deteriorating dental
health, and decreases in physical activity, which may all affect nutrient intake. Malnutrition
primarily leads to a decrease in T cells. The number of CD4+ T cells from spleens of fasted
mice is 40 to 50% lower compared to fed control animals [22]. Other studies have shown that
mice fed a protein-deficient diet exhibit lower T cell numbers compared to chow-fed control
mice [23,24]. A similar observation was made in humans. Malnourished children have lower
134
circulating CD4+ and CD8+ T cell numbers compared to well-nourished children [25]. The
decrease in immune cell numbers during malnutrition contributes to a devastating effect on the
ability of the immune system to mount a successful immune response to infection. This
accounts for increased susceptibility to microbial pathogens such as influenza, M. tuberculosis,
Streptococcus pneumonia, and gastrointestinal infection microbes in malnourished individuals
[26,27]. A relationship between defective granuloma formation and monocyte and lymphocyte
counts has been reported in the absence of malnutrition. In patients with severe sepsis, we
showed that defective granuloma formation was associated with monocytopenia, whereas
brain-injured patients experienced lymphopenia with a non-significant trend toward a lower
lymphocyte count in patients with nosocomial pneumonia compared with patients without
infection [13,14].
We showed previously that monocytes migrate to the beads, mature into macrophages, then
progress to epithelioid cells and MGCs under the influence of lymphocytes [10]. We wondered
if the cell composition of granulomas was affected by infection in elderly patients. We found
that when mononuclear cells did not form granulomas, neither epithelioid cells nor MGCs were
found. When mononuclear cells formed granulomas, the number of epithelioid cells and MGCs
in infected elderly patients was lower than in granulomas of healthy patients. This alteration of
granuloma organization is consistent with other reports. In brain-injured patients, the
percentage of MGCs was lower in patients, especially with infection, compared with healthy
donors [13]. These results suggest that the maturation process of macrophages is impaired in
infected patients.
As many reports have established a relationship between cytokine production and granuloma
formation, including the presence of epithelioid cells and MGCs, we investigated pro/anti-
inflammatory cytokine imbalance. TNF is necessary for the formation of granulomas and Il-10
is involved in the inhibition of macrophage activation and high levels are associated with a
135
disorganization of granulomas [2,28]. We found that TNF release decreased in PBMCs from
patients unable to form granulomas with no increase in IL-10, suggesting that the modulation
of TNF production was not related to the overproduction of IL-10. The same results were
obtained in patients with severe sepsis [14]. Several studies have highlighted through the use
of TNF deficient mice or anti-TNF-α drugs that TNF-α is essential for the formation and
maintenance of granulomas [29,30]. Recently, we showed that etanercept slightly delayed the
formation of granulomas and reduced the generation of MGCs by inhibiting cell fusion in the
same way as adalimumab treatment [7]. As the transformation and fusion of macrophages
require autocrine stimulation by TNF production, the low production of TNF can explain the
defective differentiation of granuloma macrophages we observed [31].
We previously reported that BCG- and CB-induced granulomas were characterized by the
expression of genes related to M1 macrophage polarization and chemotaxis [11]. First, we
found that polarization and granuloma formation-associated gene expression was dramatically
decreased in mononuclear cells that did not form granulomas. M1, M2, and granulomatous gene
expression was upregulated without polarization in patients who formed granulomas. The lack
of polarization may be related to immunosenescence.
Altogether, we have shown that infection in elderly patients decreases granuloma formation
and reduces the production of TNF-α and the formation of epithelioid cells and MGCs. This
study also suggests that the impact of infection on the immune response is heterogeneous in
elderly patients. Further studies are necessary to understand why some patients form
granulomas and others do not when they are infected.
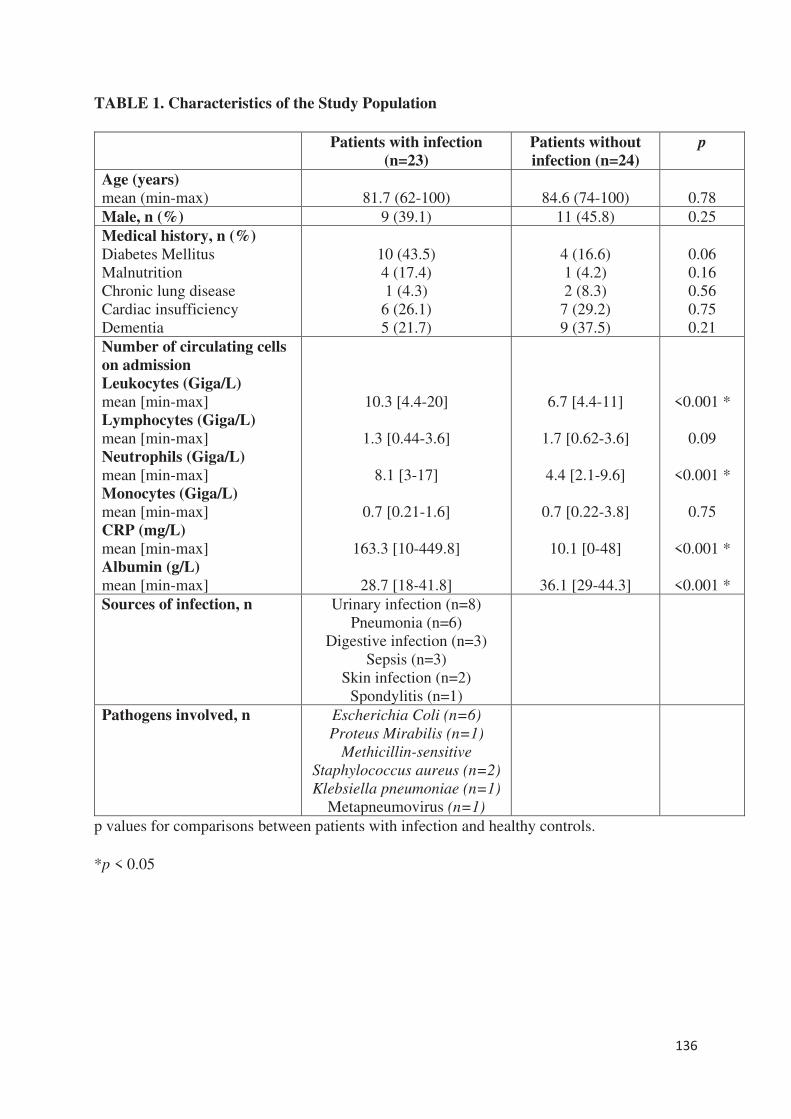
136
TABLE 1. Characteristics of the Study Population
Patients with infection
(n=23)
Patients without
infection (n=24)
p
Age (years)
mean (min-max)
81.7 (62-100)
84.6 (74-100)
0.78
Male, n (%) 9 (39.1) 11 (45.8) 0.25
Medical history, n (%)
Diabetes Mellitus
Malnutrition
Chronic lung disease
Cardiac insufficiency
Dementia
10 (43.5)
4 (17.4)
1 (4.3)
6 (26.1)
5 (21.7)
4 (16.6)
1 (4.2)
2 (8.3)
7 (29.2)
9 (37.5)
0.06
0.16
0.56
0.75
0.21
Number of circulating cells
on admission
Leukocytes (Giga/L)
mean [min-max]
Lymphocytes (Giga/L)
mean [min-max]
Neutrophils (Giga/L)
mean [min-max]
Monocytes (Giga/L)
mean [min-max]
CRP (mg/L)
mean [min-max]
Albumin (g/L)
mean [min-max]
10.3 [4.4-20]
1.3 [0.44-3.6]
8.1 [3-17]
0.7 [0.21-1.6]
163.3 [10-449.8]
28.7 [18-41.8]
6.7 [4.4-11]
1.7 [0.62-3.6]
4.4 [2.1-9.6]
0.7 [0.22-3.8]
10.1 [0-48]
36.1 [29-44.3]
<0.001 *
0.09
<0.001 *
0.75
<0.001 *
<0.001 *
Sources of infection, n Urinary infection (n=8)
Pneumonia (n=6)
Digestive infection (n=3)
Sepsis (n=3)
Skin infection (n=2)
Spondylitis (n=1)
Pathogens involved, n Escherichia Coli (n=6)
Proteus Mirabilis (n=1)
Methicillin-sensitive
Staphylococcus aureus (n=2)
Klebsiella pneumoniae (n=1)
Metapneumovirus (n=1)
p values for comparisons between patients with infection and healthy controls.
*p < 0.05
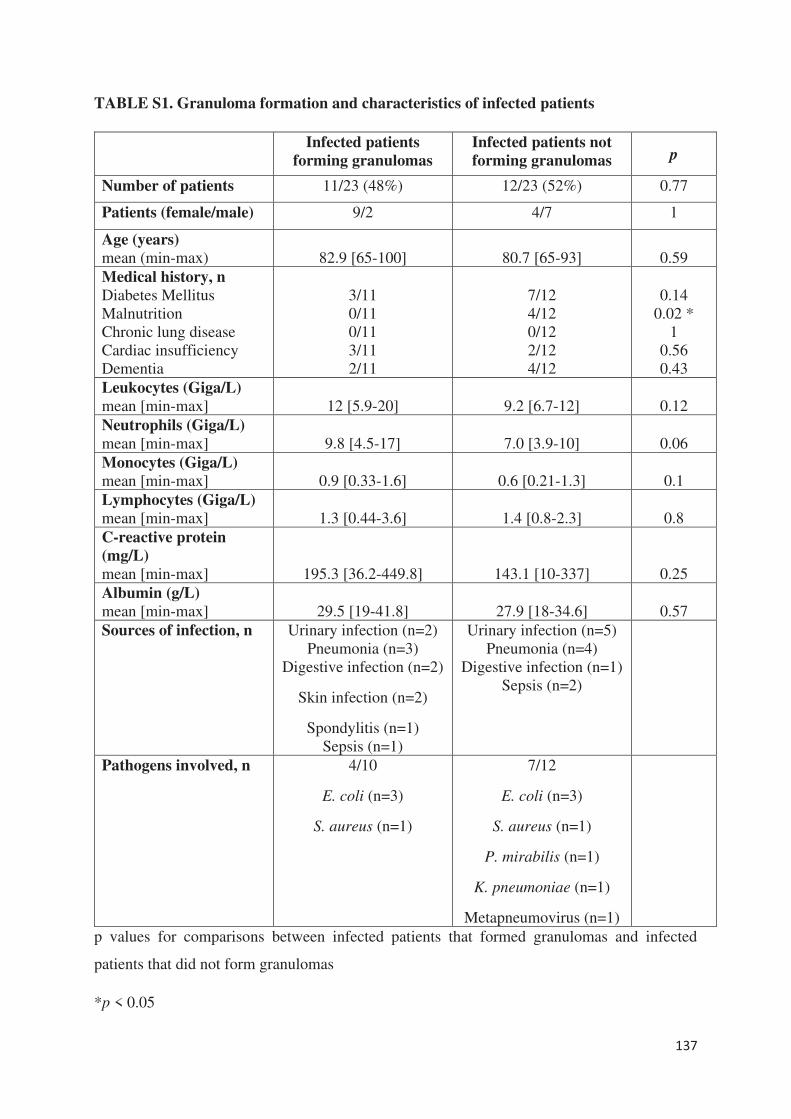
137
TABLE S1. Granuloma formation and characteristics of infected patients
Infected patients
forming granulomas
Infected patients not
forming granulomas p
Number of patients 11/23 (48%) 12/23 (52%) 0.77
Patients (female/male) 9/2 4/7 1
Age (years)
mean (min-max)
82.9 [65-100]
80.7 [65-93]
0.59
Medical history, n
Diabetes Mellitus
Malnutrition
Chronic lung disease
Cardiac insufficiency
Dementia
3/11
0/11
0/11
3/11
2/11
7/12
4/12
0/12
2/12
4/12
0.14
0.02 *
1
0.56
0.43
Leukocytes (Giga/L)
mean [min-max]
12 [5.9-20]
9.2 [6.7-12]
0.12
Neutrophils (Giga/L)
mean [min-max]
9.8 [4.5-17]
7.0 [3.9-10]
0.06
Monocytes (Giga/L)
mean [min-max]
0.9 [0.33-1.6]
0.6 [0.21-1.3]
0.1
Lymphocytes (Giga/L)
mean [min-max]
1.3 [0.44-3.6]
1.4 [0.8-2.3]
0.8
C-reactive protein
(mg/L)
mean [min-max]
195.3 [36.2-449.8]
143.1 [10-337]
0.25
Albumin (g/L)
mean [min-max]
29.5 [19-41.8]
27.9 [18-34.6]
0.57
Sources of infection, n Urinary infection (n=2)
Pneumonia (n=3)
Digestive infection (n=2)
Skin infection (n=2)
Spondylitis (n=1)
Sepsis (n=1)
Urinary infection (n=5)
Pneumonia (n=4)
Digestive infection (n=1)
Sepsis (n=2)
Pathogens involved, n 4/10
E. coli (n=3)
S. aureus (n=1)
7/12
E. coli (n=3)
S. aureus (n=1)
P. mirabilis (n=1)
K. pneumoniae (n=1)
Metapneumovirus (n=1)
p values for comparisons between infected patients that formed granulomas and infected
patients that did not form granulomas
*p < 0.05
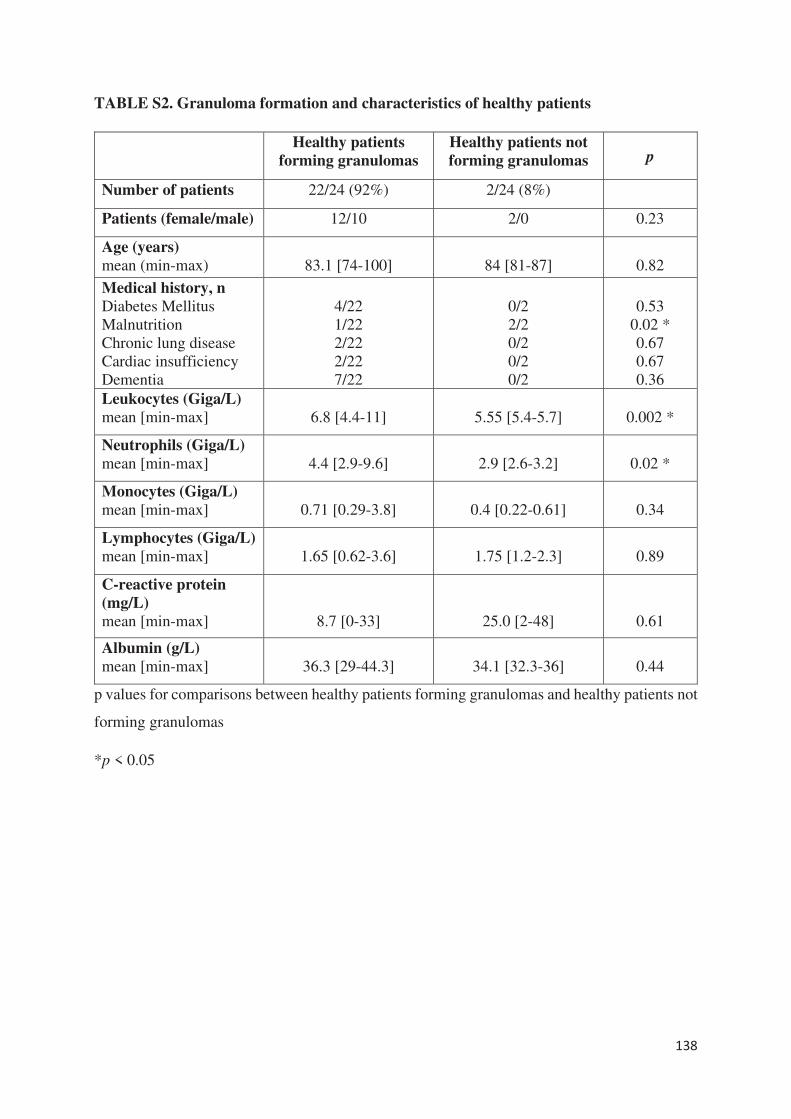
138
TABLE S2. Granuloma formation and characteristics of healthy patients
Healthy patients
forming granulomas
Healthy patients not
forming granulomas p
Number of patients 22/24 (92%) 2/24 (8%)
Patients (female/male) 12/10 2/0 0.23
Age (years)
mean (min-max)
83.1 [74-100]
84 [81-87]
0.82
Medical history, n
Diabetes Mellitus
Malnutrition
Chronic lung disease
Cardiac insufficiency
Dementia
4/22
1/22
2/22
2/22
7/22
0/2
2/2
0/2
0/2
0/2
0.53
0.02 *
0.67
0.67
0.36
Leukocytes (Giga/L)
mean [min-max]
6.8 [4.4-11]
5.55 [5.4-5.7]
0.002 *
Neutrophils (Giga/L)
mean [min-max]
4.4 [2.9-9.6]
2.9 [2.6-3.2]
0.02 *
Monocytes (Giga/L)
mean [min-max]
0.71 [0.29-3.8]
0.4 [0.22-0.61]
0.34
Lymphocytes (Giga/L)
mean [min-max]
1.65 [0.62-3.6]
1.75 [1.2-2.3]
0.89
C-reactive protein
(mg/L)
mean [min-max]
8.7 [0-33]
25.0 [2-48]
0.61
Albumin (g/L)
mean [min-max]
36.3 [29-44.3]
34.1 [32.3-36]
0.44
p values for comparisons between healthy patients forming granulomas and healthy patients not
forming granulomas
*p < 0.05
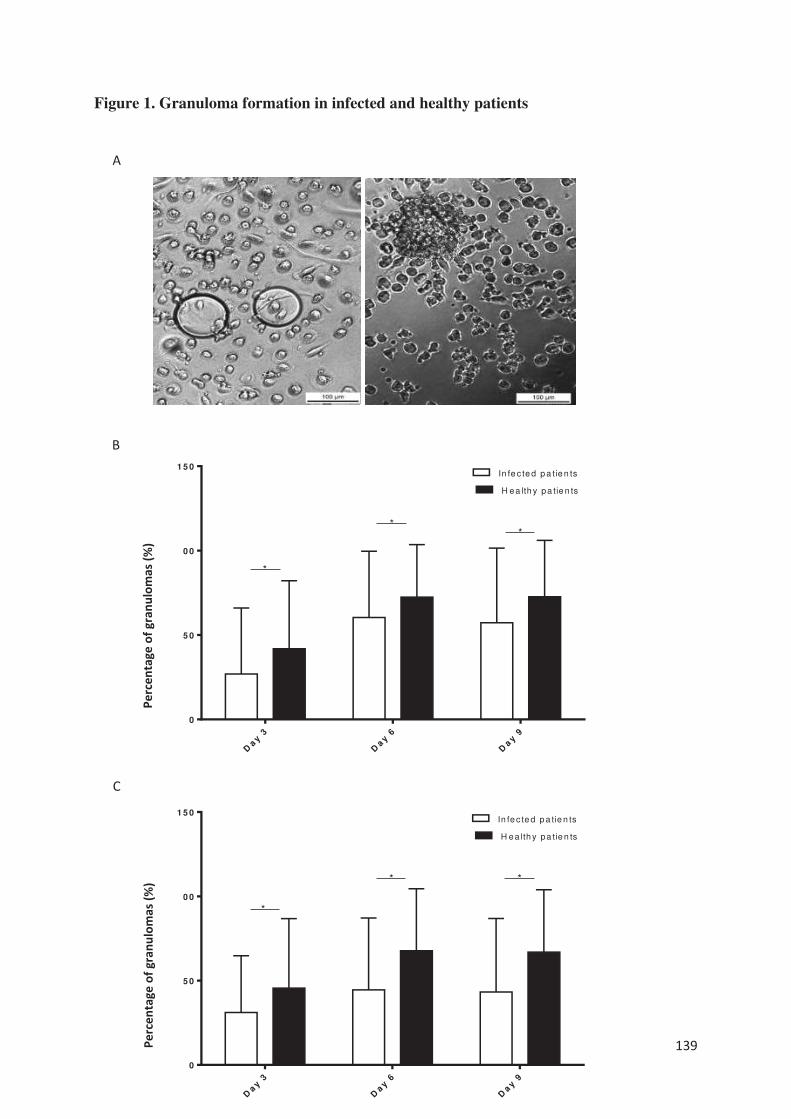
139
Figure 1. Granuloma formation in infected and healthy patients
A
B
C
Day
3
Day
6
Day
9
0
5 0
1 0 0
1 5 0
Pe
rc
en
tag
eo
fg
ra
nu
lom
a(%
)
H ea lth y pa tie n ts
In fe c te d p a tie n ts
**
*
Day
3
Day
6
Day
9
0
5 0
1 0 0
1 5 0
Pe
rc
en
tag
eo
fg
ra
nu
lom
a(%
)
H ea lth y pa tie n ts
In fe c te d p a tie n ts
**
*
Perc
enta
ge o
f gra
nulo
mas
(%)
Perc
enta
ge o
f gra
nulo
mas
(%)
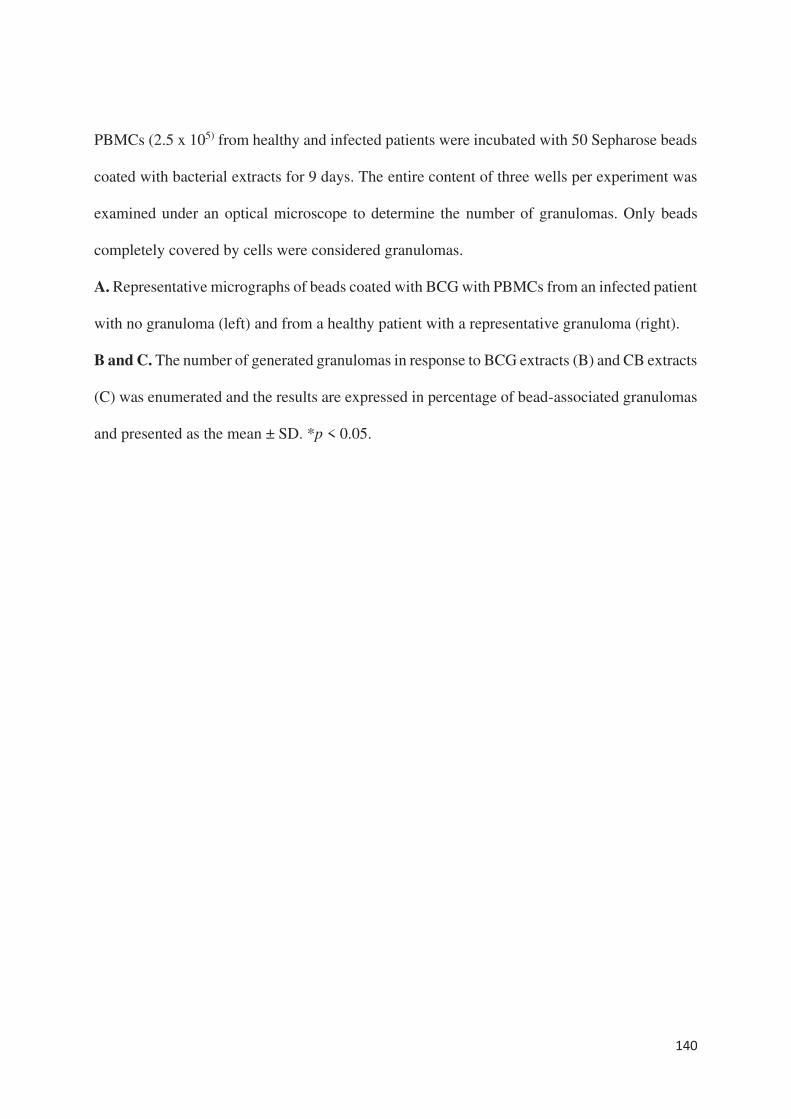
140
PBMCs (2.5 x 10⁵) from healthy and infected patients were incubated with 50 Sepharose beads
coated with bacterial extracts for 9 days. The entire content of three wells per experiment was
examined under an optical microscope to determine the number of granulomas. Only beads
completely covered by cells were considered granulomas.
A. Representative micrographs of beads coated with BCG with PBMCs from an infected patient
with no granuloma (left) and from a healthy patient with a representative granuloma (right).
B and C. The number of generated granulomas in response to BCG extracts (B) and CB extracts
(C) was enumerated and the results are expressed in percentage of bead-associated granulomas
and presented as the mean ± SD. *p < 0.05.
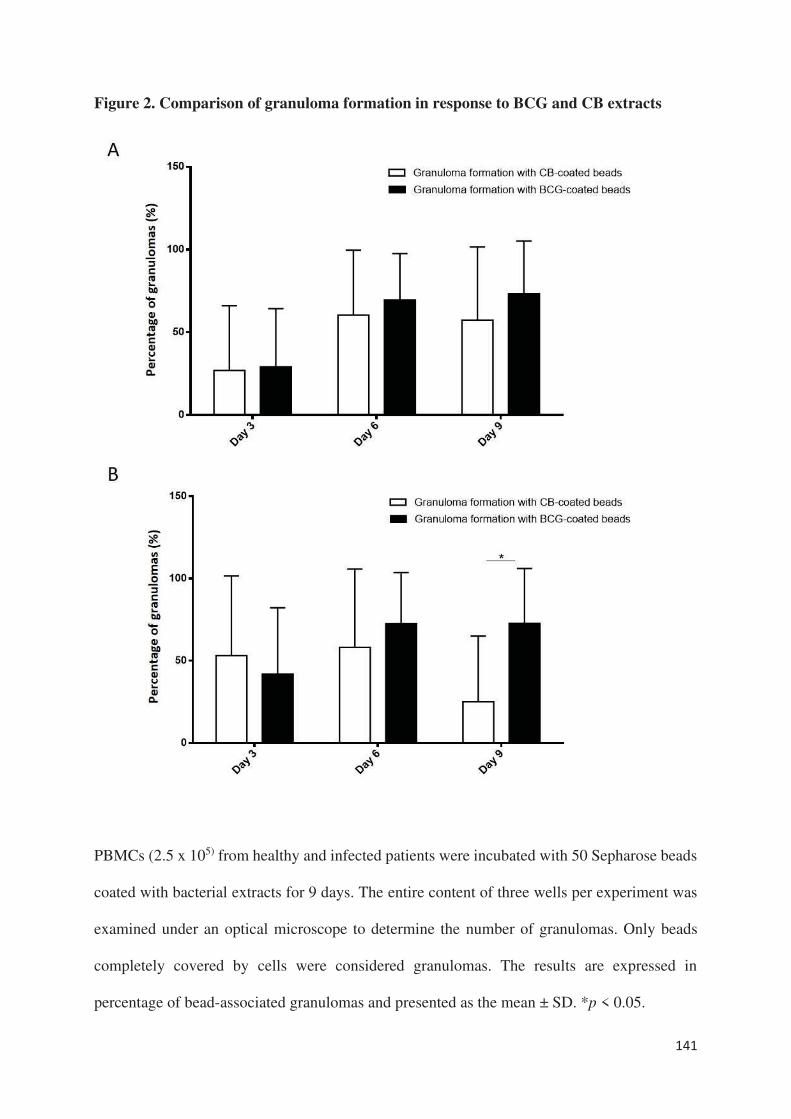
141
Figure 2. Comparison of granuloma formation in response to BCG and CB extracts
PBMCs (2.5 x 10⁵) from healthy and infected patients were incubated with 50 Sepharose beads
coated with bacterial extracts for 9 days. The entire content of three wells per experiment was
examined under an optical microscope to determine the number of granulomas. Only beads
completely covered by cells were considered granulomas. The results are expressed in
percentage of bead-associated granulomas and presented as the mean ± SD. *p < 0.05.

142
A. There was no significant difference in granuloma formation in infected patients, regardless
of the beads used.
B. In healthy patients, the percentage of granulomas on day 9 was significantly lower with the
CB-coated beads than the BCG-coated beads.
143
Figure 3. Cell composition of granulomas
BCG-granulomas were recovered and the cells were dissociated from the beads by mechanical
agitation. They were then stained using May-Grünwald Giemsa staining and observed under an
optical microscope. The percentages of cells were compared between six infected patients and
six healthy patients. Each experiment was performed in duplicate.
A. The black arrow indicates a typical epithelioid cell
B. The thick black arrow indicates a typical MGC
C and D. The proportion of epithelioid cells and MGCs relative to the granuloma cells was
determined after 3, 6, and 9 days. The results are presented as the mean ± SD.
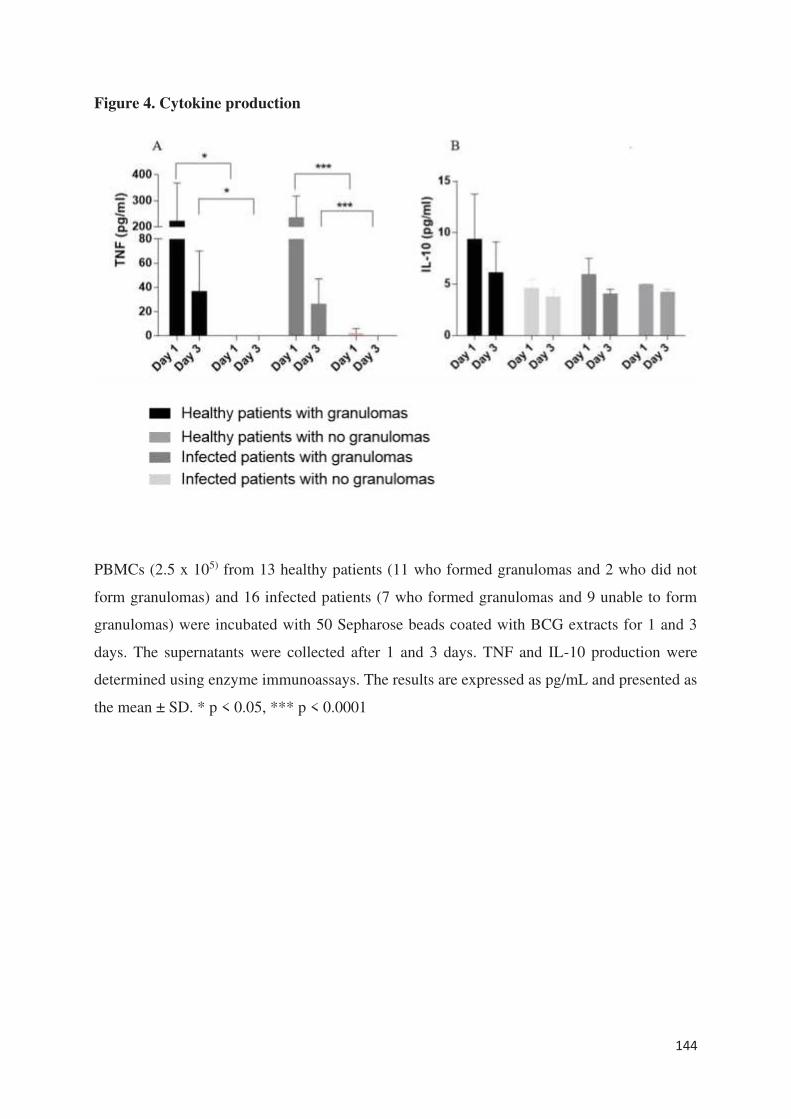
144
Figure 4. Cytokine production
PBMCs (2.5 x 10⁵) from 13 healthy patients (11 who formed granulomas and 2 who did not
form granulomas) and 16 infected patients (7 who formed granulomas and 9 unable to form
granulomas) were incubated with 50 Sepharose beads coated with BCG extracts for 1 and 3
days. The supernatants were collected after 1 and 3 days. TNF and IL-10 production were
determined using enzyme immunoassays. The results are expressed as pg/mL and presented as
the mean ± SD. * p < 0.05, *** p < 0.0001
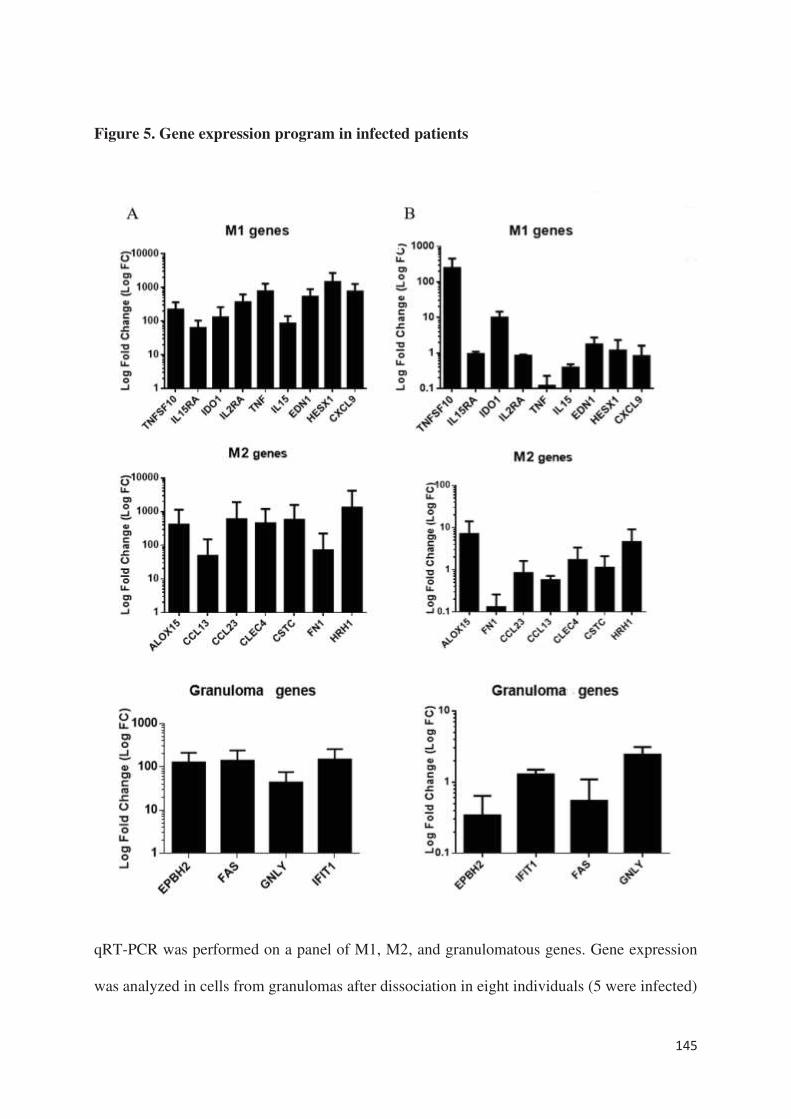
145
Figure 5. Gene expression program in infected patients
qRT-PCR was performed on a panel of M1, M2, and granulomatous genes. Gene expression
was analyzed in cells from granulomas after dissociation in eight individuals (5 were infected)

146
who formed granulomas (A) and in mononuclear cells in three patients who did not form
granulomas (2 were infected) (B). The results were normalized with the housekeeping gene β-
actin. The FC of the target genes relative to β-actin was computed using the formula FC = 2-
ΔΔCt, where ΔΔCt = (CtTarget - CtActin)stimulated - (CtTarget - CtActin)unstimulated. The results are expressed
as the log fold change ± SD.
147
REFERENCES
[1] Saunders BM, Britton WJ. Life and death in the granuloma: immunopathology of
tuberculosis. Immunol Cell Biol. 2007;85:103-11.
[2] Pagán AJ, Ramakrishnan L. The Formation and Function of Granulomas. Annu Rev
Immunol. 2018;36:639-65.
[3] Turner MD, Nedjai B, Hurst T, Pennington DJ. Cytokines and chemokines: At the
crossroads of cell signalling and inflammatory disease. Biochim Biophys Acta.
2014;1843:2563-2582.
[4] Silva Miranda M, Breiman A, Allain S, Deknuydt F, Altare F. The tuberculous
granuloma: an unsuccessful host defence mechanism providing a safety shelter for the bacteria?
Clin Dev Immunol. 2012;2012:139127.
[5] Gallegos AM, van Heijst JW, Samstein M, Su X, Pamer EG, Glickman MS. A gamma
interferon independent mechanism of CD4 T cell mediated control of M. tuberculosis infection
in vivo. PLoS Pathog. 2011;7:e1002052.
[6] Beham AW, Puellmann K, Laird R, Fuchs T, Streich R, Breysach C, Raddatz D, Oniga
S, Peccerella T, Findeisen P, Kzhyshkowska J, Gratchev A, Schweyer S, Saunders B, Wessels
JT, Möbius W, Keane J, Becker H, Ganser A, Neumaier M, Kaminski WE. A TNF-regulated
recombinatorial macrophage immune receptor implicated in granuloma formation in
tuberculosis. PLoS Pathog. 2011;7:e1002375.
[7] Mezouar S, Diarra I, Roudier J, Desnues B, Mege JL. Tumor Necrosis Factor-Alpha
Antagonist Interferes with the Formation of Granulomatous Multinucleated Giant Cells: New
Insights Into Mycobacterium tuberculosis Infection. Front Immunol. 2019;10:1947.
[8] Naranbhai V. The role of host genetics (and genomics) in Tuberculosis. Microbiol
Spectr. 2016;4.
[9] Puissegur MP, Botanch C, Duteyrat JL, Delsol G, Caratero C, Altare F. An in vitro dual
model of mycobacterial granulomas to investigate the molecular interactions between
mycobacteria and human host cells. Cell Microbiol. 2004;6:423-33.
[10] Delaby A, Espinosa L, Lépolard C, Capo C, Mège JL. 3D reconstruction of granulomas
from transmitted light images implemented for long-time microscope applications. J Immunol
Methods. 2010;360:10-9.
[11] Faugaret D, Ben Amara A, Alingrin J, Daumas A, Delaby A, Lépolard C, Raoult D,
Textoris J, Mège JL. Granulomatous response to Coxiella burnetii, the agent of Q fever: the
lessons from gene expression analysis. Front Cell Infect Microbiol. 2014;4:172.
[12] Delaby A, Gorvel L, Espinosa L, Lépolard C, Raoult D, Ghigo E, Capo C, Mege JL.
Defective monocyte dynamics in Q fever granuloma deficiency. J Infect Dis. 2012;205:1086-
94.
148
[13] Deknuydt F, Roquilly A, Cinotti R, Altare F, Asehnoune K. An in vitro model of
mycobacterial granuloma to investigate the immune response in brain-injured patients. Crit
Care Med. 2013;41:245-254.
[14] Alingrin J, Coiffard B, Textoris J, Belenotti P, Daumas A, Leone M, Mege JL. Impaired
Granuloma Formation in Sepsis: Impact of Monocytopenia. PLoS One. 2016;11:e0158528.
[15] Gavazzi G, Krause KH. Ageing and infection. Lancet Infect Dis. 2002;2:659-66.
[16] Hepper HJ, Sieber C, Walger P, Bahrmann P, Singler K. Infections in the elderly. Crit
Care Clin. 2013;29:757-74.
[17] Esper AM, Moss M, Lewis CA, Nisbet R, Mannino DM, Martin GS. The role of
infection and comorbidity; factors that influence disparities in sepsis. Crit Care Med.
2006;34:2576-82.
[18] Faix JD. Biomarkers of sepsis Crit Rev Clin Lab Sci. 2013;50:23-36.
[19] Martin GS, Mannino DM, Moss M. The effect of age on the development and outcome
of adult sepsis. Crit Care Med. 2006;34:15-21.
[20] Ben Amara A, Ghigo E, Le Priol Y, Lépolard C, Salcedo SP, Lemichez E, Bretelle F,
Capo C, Mege JL. Coxiella burnetii, the agent of Q fever, replicates within trophoblasts and
induces a unique transcriptional response. PLoS One. 2010;5:e15315.
[21] Tannaou T, Koeberle S, Manckoundia P, Aubry R. Multifactorial immunodeficiency in
frail elderly patients: Contributing factors and management. Med Mal Infect. 2019;49:167-72.
[22] Saucillo DC, Gerriets VA, Sheng J, Rathmell JC, Maciver NJ. Leptin metabolically
licenses T cells for activation to link nutrition and immunity. J Immunol. 2014;192:136-44.
[23] Pena-Cruz V, Reiss CS, McIntosh K. Sendai virus infection of mice with protein
malnutrition. J Virol. 1989;63:354164.
[24] Taylor AK, Cao W, Vora KP, De La Cruz J, Shieh WJ, Zaki SR, et al. Protein energy
malnutrition decreases immunity and increases susceptibility to influenza infection in mice. J
Infect Dis. 2013;207:501-10.
[25] Najera O, Gonzalez C, Toledo G, Lopez L, Ortiz R. Flow cytometry study of
lymphocyte subsets in malnourished and well-nourished children with bacterial infections. Clin
Diagn Lab Immunol. 2004;11:577-80.
[26] Cegielski JP, McMurray DN. The relationship between malnutrition and tuberculosis:
evidence from studies in humans and experimental animals. Int J Tuberc Lung Dis. 2004;8:286-
98.
[27] Verhagen LM, Gomez-Castellano K, Snelders E, Rivera-Olivero I, Pocaterra L,
Melchers WJ, et al. Respiratory infections in Enepa Amerindians are related to malnutrition
and Streptococcus pneumoniae carriage. J Infect. 2013;67:273-81.
149
[28] Boomer JS, Green JM, Hotchkiss RS. The changing immune system in sepsis: is
individualized immuno-modulatory therapy the answer? Virulence. 2014;5:45-56.
[29] Kindler V, Sappino AP, Grau GE, Piguet PF, Vassalli P. The inducing role of tumor
necrosis factor in the development of bactericidal granulomas during BCG infection. Cell.
1989;56:731-40.
[30] Roach DR, Bean AG, Demangel C, France MP, Briscoe H, Britton WJ. TNF regulates
chemokine induction essential for cell recruitment, granuloma formation, and clearance of
mycobacterial infection. J Immunol. 2000;168:4620-7.
[31] Takashima T, Ohnishi K, Tsuyuguchi I, et al: Differential regulation of formation of
multinucleated giant cells from concanavalin A-stimulated human blood monocytes by IFN-
gamma and IL-4. J Immunol. 1993;150:3002-10
150
Phenotypic diversity and emerging new tools to study macrophage
activation in bacterial infectious diseases
Ka MB, Daumas A, Textoris J, Mege JL.
Front Immunol. 2014 Oct 10;5:500.
doi: 10.3389/fimmu.2014.00500. eCollection 2014. Review.
Nous avons abordé dans la plupart des articles précédents le sujet de l’état d’activation des
cellules notamment des monocytes/macrophages dans différentes situations pathologiques mais
aussi normales. Il semble à cet égard que le concept de polarisation M1/M2 des macrophages
semble plutôt maintenant être un continuum d’états fonctionnels dépendant de l’agression, de
l’environnement et évoluant ainsi dans le temps, reflétant par conséquent mieux la variabilité
et complexité des réponses aux agressions. En effet, une classification M1/M2 des macrophages
a été proposée il y a une vingtaine d’année sur le modèle de la polarisation lymphocytaire
Th1/Th2 qui a montré depuis ses limites. Alors que les macrophages M1 sont inflammatoires,
microbicides et promoteurs d’une réponse immunitaire adaptative de type Th1, les macrophages
M2 régulent la réponse inflammatoire et sont fortement impliqués dans le retour à
l’homéostasie. Dans la réalité, les mêmes macrophages peuvent être, dans un premier temps,
inflammatoires, avant de participer à la résolution de l’inflammation. Il apparaît également que
certains pathogènes comme les bactéries intracellulaires promeuvent une polarisation M2 pour
pouvoir survivre dans les macrophages. De même, l’évolution chronique de certaines maladies
infectieuses est liée à une reprogrammation des macrophages vers des profils M2. Ainsi, bien
plus que 2 visages, les macrophages peuvent exprimer tout un panel de profils d’activation en
fonction du contexte.
La tentation est également souvent grande d’appliquer cette distinction M1/M2 aux monocytes
circulants, considérant qu’ils répondent de la même façon que les macrophages aux stimuli. En
fait, différentes études montrent que la réponse des monocytes est différente de celle des
macrophages et que leur polarisation n’est pas aussi affirmée que celle des macrophages.
A travers cette revue, nous avons voulu montrer les nombreux visages de l’activation des
macrophages dans la lutte contre les infections.
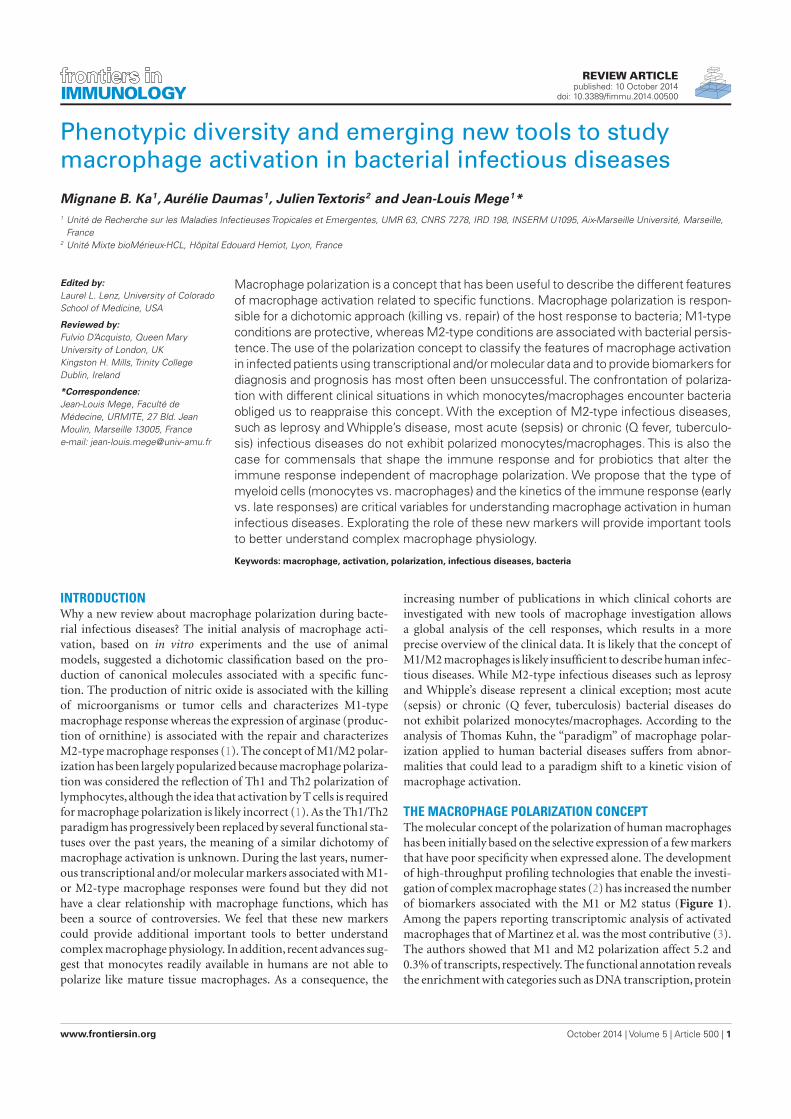
REVIEW ARTICLEpublished: 10 October 2014
doi: 10.3389/fimmu.2014.00500
Phenotypic diversity and emerging new tools to studymacrophage activation in bacterial infectious diseases
Mignane B. Ka1, Aurélie Daumas1, JulienTextoris2 and Jean-Louis Mege1*
1 Unité de Recherche sur les Maladies Infectieuses Tropicales et Emergentes, UMR 63, CNRS 7278, IRD 198, INSERM U1095, Aix-Marseille Université, Marseille,
France2 Unité Mixte bioMérieux-HCL, Hôpital Edouard Herriot, Lyon, France
Edited by:
Laurel L. Lenz, University of Colorado
School of Medicine, USA
Reviewed by:
Fulvio D’Acquisto, Queen Mary
University of London, UK
Kingston H. Mills, Trinity College
Dublin, Ireland
*Correspondence:
Jean-Louis Mege, Faculté de
Médecine, URMITE, 27 Bld. Jean
Moulin, Marseille 13005, France
e-mail: [email protected]
Macrophage polarization is a concept that has been useful to describe the different features
of macrophage activation related to specific functions. Macrophage polarization is respon-
sible for a dichotomic approach (killing vs. repair) of the host response to bacteria; M1-type
conditions are protective, whereas M2-type conditions are associated with bacterial persis-
tence.The use of the polarization concept to classify the features of macrophage activation
in infected patients using transcriptional and/or molecular data and to provide biomarkers for
diagnosis and prognosis has most often been unsuccessful. The confrontation of polariza-
tion with different clinical situations in which monocytes/macrophages encounter bacteria
obliged us to reappraise this concept. With the exception of M2-type infectious diseases,
such as leprosy and Whipple’s disease, most acute (sepsis) or chronic (Q fever, tuberculo-
sis) infectious diseases do not exhibit polarized monocytes/macrophages. This is also the
case for commensals that shape the immune response and for probiotics that alter the
immune response independent of macrophage polarization. We propose that the type of
myeloid cells (monocytes vs. macrophages) and the kinetics of the immune response (early
vs. late responses) are critical variables for understanding macrophage activation in human
infectious diseases. Explorating the role of these new markers will provide important tools
to better understand complex macrophage physiology.
Keywords: macrophage, activation, polarization, infectious diseases, bacteria
INTRODUCTIONWhy a new review about macrophage polarization during bacte-
rial infectious diseases? The initial analysis of macrophage acti-
vation, based on in vitro experiments and the use of animal
models, suggested a dichotomic classification based on the pro-
duction of canonical molecules associated with a specific func-
tion. The production of nitric oxide is associated with the killing
of microorganisms or tumor cells and characterizes M1-type
macrophage response whereas the expression of arginase (produc-
tion of ornithine) is associated with the repair and characterizes
M2-type macrophage responses (1). The concept of M1/M2 polar-
ization has been largely popularized because macrophage polariza-
tion was considered the reflection of Th1 and Th2 polarization of
lymphocytes, although the idea that activation by T cells is required
for macrophage polarization is likely incorrect (1). As the Th1/Th2
paradigm has progressively been replaced by several functional sta-
tuses over the past years, the meaning of a similar dichotomy of
macrophage activation is unknown. During the last years, numer-
ous transcriptional and/or molecular markers associated with M1-
or M2-type macrophage responses were found but they did not
have a clear relationship with macrophage functions, which has
been a source of controversies. We feel that these new markers
could provide additional important tools to better understand
complex macrophage physiology. In addition, recent advances sug-
gest that monocytes readily available in humans are not able to
polarize like mature tissue macrophages. As a consequence, the
increasing number of publications in which clinical cohorts are
investigated with new tools of macrophage investigation allows
a global analysis of the cell responses, which results in a more
precise overview of the clinical data. It is likely that the concept of
M1/M2 macrophages is likely insufficient to describe human infec-
tious diseases. While M2-type infectious diseases such as leprosy
and Whipple’s disease represent a clinical exception; most acute
(sepsis) or chronic (Q fever, tuberculosis) bacterial diseases do
not exhibit polarized monocytes/macrophages. According to the
analysis of Thomas Kuhn, the “paradigm” of macrophage polar-
ization applied to human bacterial diseases suffers from abnor-
malities that could lead to a paradigm shift to a kinetic vision of
macrophage activation.
THE MACROPHAGE POLARIZATION CONCEPTThe molecular concept of the polarization of human macrophages
has been initially based on the selective expression of a few markers
that have poor specificity when expressed alone. The development
of high-throughput profiling technologies that enable the investi-
gation of complex macrophage states (2) has increased the number
of biomarkers associated with the M1 or M2 status (Figure 1).
Among the papers reporting transcriptomic analysis of activated
macrophages that of Martinez et al. was the most contributive (3).
The authors showed that M1 and M2 polarization affect 5.2 and
0.3% of transcripts, respectively. The functional annotation reveals
the enrichment with categories such as DNA transcription, protein
www.frontiersin.org October 2014 | Volume 5 | Article 500 | 1
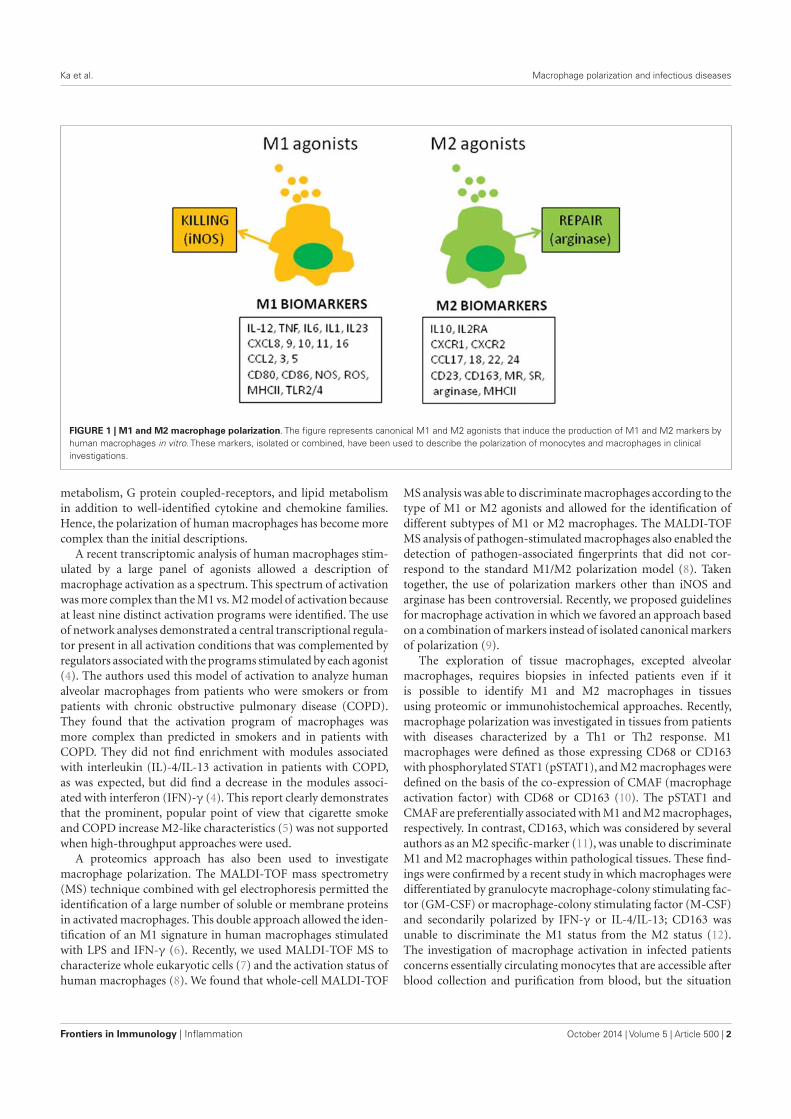
Ka et al. Macrophage polarization and infectious diseases
FIGURE 1 | M1 and M2 macrophage polarization. The figure represents canonical M1 and M2 agonists that induce the production of M1 and M2 markers by
human macrophages in vitro. These markers, isolated or combined, have been used to describe the polarization of monocytes and macrophages in clinical
investigations.
metabolism, G protein coupled-receptors, and lipid metabolism
in addition to well-identified cytokine and chemokine families.
Hence, the polarization of human macrophages has become more
complex than the initial descriptions.
A recent transcriptomic analysis of human macrophages stim-
ulated by a large panel of agonists allowed a description of
macrophage activation as a spectrum. This spectrum of activation
was more complex than the M1 vs. M2 model of activation because
at least nine distinct activation programs were identified. The use
of network analyses demonstrated a central transcriptional regula-
tor present in all activation conditions that was complemented by
regulators associated with the programs stimulated by each agonist
(4). The authors used this model of activation to analyze human
alveolar macrophages from patients who were smokers or from
patients with chronic obstructive pulmonary disease (COPD).
They found that the activation program of macrophages was
more complex than predicted in smokers and in patients with
COPD. They did not find enrichment with modules associated
with interleukin (IL)-4/IL-13 activation in patients with COPD,
as was expected, but did find a decrease in the modules associ-
ated with interferon (IFN)-γ (4). This report clearly demonstrates
that the prominent, popular point of view that cigarette smoke
and COPD increase M2-like characteristics (5) was not supported
when high-throughput approaches were used.
A proteomics approach has also been used to investigate
macrophage polarization. The MALDI-TOF mass spectrometry
(MS) technique combined with gel electrophoresis permitted the
identification of a large number of soluble or membrane proteins
in activated macrophages. This double approach allowed the iden-
tification of an M1 signature in human macrophages stimulated
with LPS and IFN-γ (6). Recently, we used MALDI-TOF MS to
characterize whole eukaryotic cells (7) and the activation status of
human macrophages (8). We found that whole-cell MALDI-TOF
MS analysis was able to discriminate macrophages according to the
type of M1 or M2 agonists and allowed for the identification of
different subtypes of M1 or M2 macrophages. The MALDI-TOF
MS analysis of pathogen-stimulated macrophages also enabled the
detection of pathogen-associated fingerprints that did not cor-
respond to the standard M1/M2 polarization model (8). Taken
together, the use of polarization markers other than iNOS and
arginase has been controversial. Recently, we proposed guidelines
for macrophage activation in which we favored an approach based
on a combination of markers instead of isolated canonical markers
of polarization (9).
The exploration of tissue macrophages, excepted alveolar
macrophages, requires biopsies in infected patients even if it
is possible to identify M1 and M2 macrophages in tissues
using proteomic or immunohistochemical approaches. Recently,
macrophage polarization was investigated in tissues from patients
with diseases characterized by a Th1 or Th2 response. M1
macrophages were defined as those expressing CD68 or CD163
with phosphorylated STAT1 (pSTAT1), and M2 macrophages were
defined on the basis of the co-expression of CMAF (macrophage
activation factor) with CD68 or CD163 (10). The pSTAT1 and
CMAF are preferentially associated with M1 and M2 macrophages,
respectively. In contrast, CD163, which was considered by several
authors as an M2 specific-marker (11), was unable to discriminate
M1 and M2 macrophages within pathological tissues. These find-
ings were confirmed by a recent study in which macrophages were
differentiated by granulocyte macrophage-colony stimulating fac-
tor (GM-CSF) or macrophage-colony stimulating factor (M-CSF)
and secondarily polarized by IFN-γ or IL-4/IL-13; CD163 was
unable to discriminate the M1 status from the M2 status (12).
The investigation of macrophage activation in infected patients
concerns essentially circulating monocytes that are accessible after
blood collection and purification from blood, but the situation
Frontiers in Immunology | Inflammation October 2014 | Volume 5 | Article 500 | 2
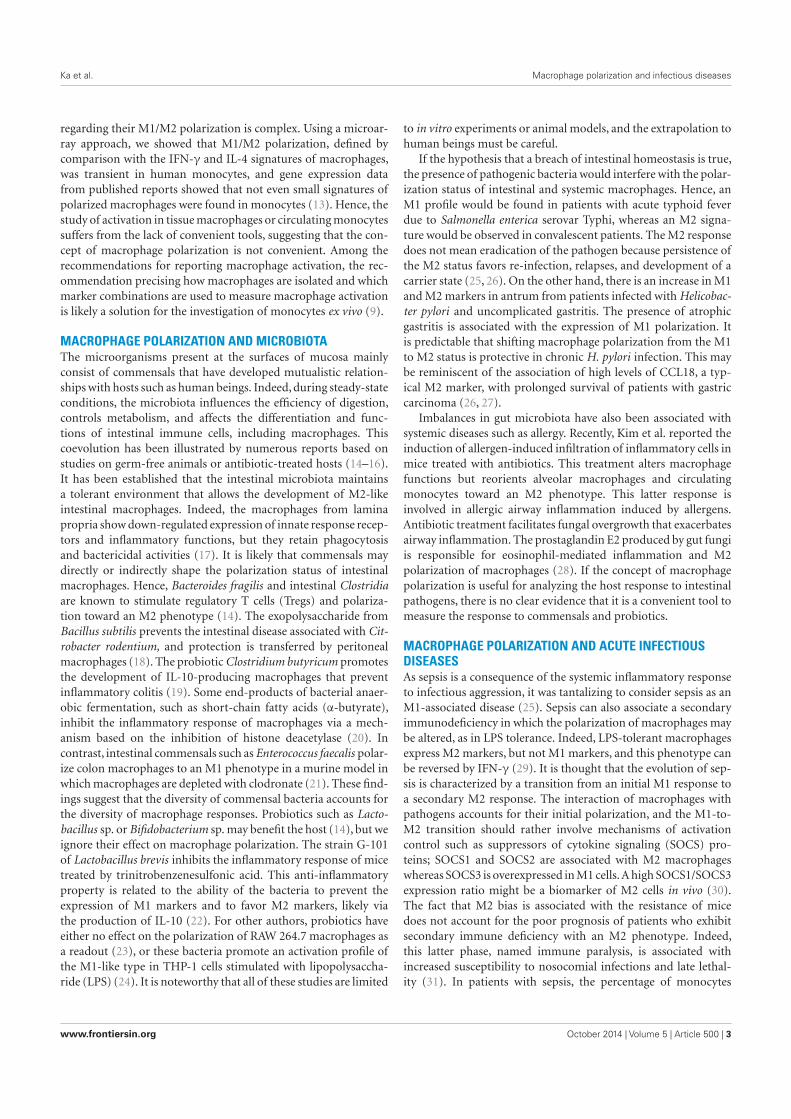
Ka et al. Macrophage polarization and infectious diseases
regarding their M1/M2 polarization is complex. Using a microar-
ray approach, we showed that M1/M2 polarization, defined by
comparison with the IFN-γ and IL-4 signatures of macrophages,
was transient in human monocytes, and gene expression data
from published reports showed that not even small signatures of
polarized macrophages were found in monocytes (13). Hence, the
study of activation in tissue macrophages or circulating monocytes
suffers from the lack of convenient tools, suggesting that the con-
cept of macrophage polarization is not convenient. Among the
recommendations for reporting macrophage activation, the rec-
ommendation precising how macrophages are isolated and which
marker combinations are used to measure macrophage activation
is likely a solution for the investigation of monocytes ex vivo (9).
MACROPHAGE POLARIZATION AND MICROBIOTAThe microorganisms present at the surfaces of mucosa mainly
consist of commensals that have developed mutualistic relation-
ships with hosts such as human beings. Indeed, during steady-state
conditions, the microbiota influences the efficiency of digestion,
controls metabolism, and affects the differentiation and func-
tions of intestinal immune cells, including macrophages. This
coevolution has been illustrated by numerous reports based on
studies on germ-free animals or antibiotic-treated hosts (14–16).
It has been established that the intestinal microbiota maintains
a tolerant environment that allows the development of M2-like
intestinal macrophages. Indeed, the macrophages from lamina
propria show down-regulated expression of innate response recep-
tors and inflammatory functions, but they retain phagocytosis
and bactericidal activities (17). It is likely that commensals may
directly or indirectly shape the polarization status of intestinal
macrophages. Hence, Bacteroides fragilis and intestinal Clostridia
are known to stimulate regulatory T cells (Tregs) and polariza-
tion toward an M2 phenotype (14). The exopolysaccharide from
Bacillus subtilis prevents the intestinal disease associated with Cit-
robacter rodentium, and protection is transferred by peritoneal
macrophages (18). The probiotic Clostridium butyricum promotes
the development of IL-10-producing macrophages that prevent
inflammatory colitis (19). Some end-products of bacterial anaer-
obic fermentation, such as short-chain fatty acids (α-butyrate),
inhibit the inflammatory response of macrophages via a mech-
anism based on the inhibition of histone deacetylase (20). In
contrast, intestinal commensals such as Enterococcus faecalis polar-
ize colon macrophages to an M1 phenotype in a murine model in
which macrophages are depleted with clodronate (21). These find-
ings suggest that the diversity of commensal bacteria accounts for
the diversity of macrophage responses. Probiotics such as Lacto-
bacillus sp. or Bifidobacterium sp. may benefit the host (14), but we
ignore their effect on macrophage polarization. The strain G-101
of Lactobacillus brevis inhibits the inflammatory response of mice
treated by trinitrobenzenesulfonic acid. This anti-inflammatory
property is related to the ability of the bacteria to prevent the
expression of M1 markers and to favor M2 markers, likely via
the production of IL-10 (22). For other authors, probiotics have
either no effect on the polarization of RAW 264.7 macrophages as
a readout (23), or these bacteria promote an activation profile of
the M1-like type in THP-1 cells stimulated with lipopolysaccha-
ride (LPS) (24). It is noteworthy that all of these studies are limited
to in vitro experiments or animal models, and the extrapolation to
human beings must be careful.
If the hypothesis that a breach of intestinal homeostasis is true,
the presence of pathogenic bacteria would interfere with the polar-
ization status of intestinal and systemic macrophages. Hence, an
M1 profile would be found in patients with acute typhoid fever
due to Salmonella enterica serovar Typhi, whereas an M2 signa-
ture would be observed in convalescent patients. The M2 response
does not mean eradication of the pathogen because persistence of
the M2 status favors re-infection, relapses, and development of a
carrier state (25, 26). On the other hand, there is an increase in M1
and M2 markers in antrum from patients infected with Helicobac-
ter pylori and uncomplicated gastritis. The presence of atrophic
gastritis is associated with the expression of M1 polarization. It
is predictable that shifting macrophage polarization from the M1
to M2 status is protective in chronic H. pylori infection. This may
be reminiscent of the association of high levels of CCL18, a typ-
ical M2 marker, with prolonged survival of patients with gastric
carcinoma (26, 27).
Imbalances in gut microbiota have also been associated with
systemic diseases such as allergy. Recently, Kim et al. reported the
induction of allergen-induced infiltration of inflammatory cells in
mice treated with antibiotics. This treatment alters macrophage
functions but reorients alveolar macrophages and circulating
monocytes toward an M2 phenotype. This latter response is
involved in allergic airway inflammation induced by allergens.
Antibiotic treatment facilitates fungal overgrowth that exacerbates
airway inflammation. The prostaglandin E2 produced by gut fungi
is responsible for eosinophil-mediated inflammation and M2
polarization of macrophages (28). If the concept of macrophage
polarization is useful for analyzing the host response to intestinal
pathogens, there is no clear evidence that it is a convenient tool to
measure the response to commensals and probiotics.
MACROPHAGE POLARIZATION AND ACUTE INFECTIOUSDISEASESAs sepsis is a consequence of the systemic inflammatory response
to infectious aggression, it was tantalizing to consider sepsis as an
M1-associated disease (25). Sepsis can also associate a secondary
immunodeficiency in which the polarization of macrophages may
be altered, as in LPS tolerance. Indeed, LPS-tolerant macrophages
express M2 markers, but not M1 markers, and this phenotype can
be reversed by IFN-γ (29). It is thought that the evolution of sep-
sis is characterized by a transition from an initial M1 response to
a secondary M2 response. The interaction of macrophages with
pathogens accounts for their initial polarization, and the M1-to-
M2 transition should rather involve mechanisms of activation
control such as suppressors of cytokine signaling (SOCS) pro-
teins; SOCS1 and SOCS2 are associated with M2 macrophages
whereas SOCS3 is overexpressed in M1 cells. A high SOCS1/SOCS3
expression ratio might be a biomarker of M2 cells in vivo (30).
The fact that M2 bias is associated with the resistance of mice
does not account for the poor prognosis of patients who exhibit
secondary immune deficiency with an M2 phenotype. Indeed,
this latter phase, named immune paralysis, is associated with
increased susceptibility to nosocomial infections and late lethal-
ity (31). In patients with sepsis, the percentage of monocytes
www.frontiersin.org October 2014 | Volume 5 | Article 500 | 3
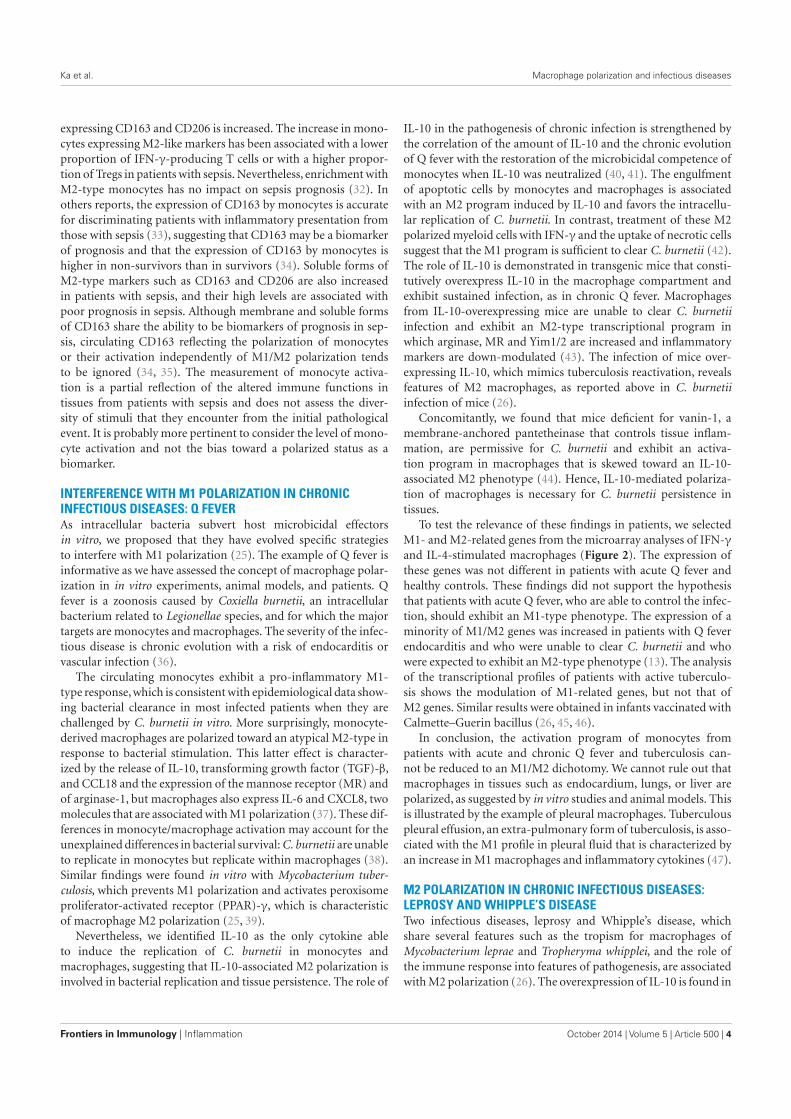
Ka et al. Macrophage polarization and infectious diseases
expressing CD163 and CD206 is increased. The increase in mono-
cytes expressing M2-like markers has been associated with a lower
proportion of IFN-γ-producing T cells or with a higher propor-
tion of Tregs in patients with sepsis. Nevertheless, enrichment with
M2-type monocytes has no impact on sepsis prognosis (32). In
others reports, the expression of CD163 by monocytes is accurate
for discriminating patients with inflammatory presentation from
those with sepsis (33), suggesting that CD163 may be a biomarker
of prognosis and that the expression of CD163 by monocytes is
higher in non-survivors than in survivors (34). Soluble forms of
M2-type markers such as CD163 and CD206 are also increased
in patients with sepsis, and their high levels are associated with
poor prognosis in sepsis. Although membrane and soluble forms
of CD163 share the ability to be biomarkers of prognosis in sep-
sis, circulating CD163 reflecting the polarization of monocytes
or their activation independently of M1/M2 polarization tends
to be ignored (34, 35). The measurement of monocyte activa-
tion is a partial reflection of the altered immune functions in
tissues from patients with sepsis and does not assess the diver-
sity of stimuli that they encounter from the initial pathological
event. It is probably more pertinent to consider the level of mono-
cyte activation and not the bias toward a polarized status as a
biomarker.
INTERFERENCE WITH M1 POLARIZATION IN CHRONICINFECTIOUS DISEASES: Q FEVERAs intracellular bacteria subvert host microbicidal effectors
in vitro, we proposed that they have evolved specific strategies
to interfere with M1 polarization (25). The example of Q fever is
informative as we have assessed the concept of macrophage polar-
ization in in vitro experiments, animal models, and patients. Q
fever is a zoonosis caused by Coxiella burnetii, an intracellular
bacterium related to Legionellae species, and for which the major
targets are monocytes and macrophages. The severity of the infec-
tious disease is chronic evolution with a risk of endocarditis or
vascular infection (36).
The circulating monocytes exhibit a pro-inflammatory M1-
type response, which is consistent with epidemiological data show-
ing bacterial clearance in most infected patients when they are
challenged by C. burnetii in vitro. More surprisingly, monocyte-
derived macrophages are polarized toward an atypical M2-type in
response to bacterial stimulation. This latter effect is character-
ized by the release of IL-10, transforming growth factor (TGF)-β,
and CCL18 and the expression of the mannose receptor (MR) and
of arginase-1, but macrophages also express IL-6 and CXCL8, two
molecules that are associated with M1 polarization (37). These dif-
ferences in monocyte/macrophage activation may account for the
unexplained differences in bacterial survival: C. burnetii are unable
to replicate in monocytes but replicate within macrophages (38).
Similar findings were found in vitro with Mycobacterium tuber-
culosis, which prevents M1 polarization and activates peroxisome
proliferator-activated receptor (PPAR)-γ, which is characteristic
of macrophage M2 polarization (25, 39).
Nevertheless, we identified IL-10 as the only cytokine able
to induce the replication of C. burnetii in monocytes and
macrophages, suggesting that IL-10-associated M2 polarization is
involved in bacterial replication and tissue persistence. The role of
IL-10 in the pathogenesis of chronic infection is strengthened by
the correlation of the amount of IL-10 and the chronic evolution
of Q fever with the restoration of the microbicidal competence of
monocytes when IL-10 was neutralized (40, 41). The engulfment
of apoptotic cells by monocytes and macrophages is associated
with an M2 program induced by IL-10 and favors the intracellu-
lar replication of C. burnetii. In contrast, treatment of these M2
polarized myeloid cells with IFN-γ and the uptake of necrotic cells
suggest that the M1 program is sufficient to clear C. burnetii (42).
The role of IL-10 is demonstrated in transgenic mice that consti-
tutively overexpress IL-10 in the macrophage compartment and
exhibit sustained infection, as in chronic Q fever. Macrophages
from IL-10-overexpressing mice are unable to clear C. burnetii
infection and exhibit an M2-type transcriptional program in
which arginase, MR and Yim1/2 are increased and inflammatory
markers are down-modulated (43). The infection of mice over-
expressing IL-10, which mimics tuberculosis reactivation, reveals
features of M2 macrophages, as reported above in C. burnetii
infection of mice (26).
Concomitantly, we found that mice deficient for vanin-1, a
membrane-anchored pantetheinase that controls tissue inflam-
mation, are permissive for C. burnetii and exhibit an activa-
tion program in macrophages that is skewed toward an IL-10-
associated M2 phenotype (44). Hence, IL-10-mediated polariza-
tion of macrophages is necessary for C. burnetii persistence in
tissues.
To test the relevance of these findings in patients, we selected
M1- and M2-related genes from the microarray analyses of IFN-γ
and IL-4-stimulated macrophages (Figure 2). The expression of
these genes was not different in patients with acute Q fever and
healthy controls. These findings did not support the hypothesis
that patients with acute Q fever, who are able to control the infec-
tion, should exhibit an M1-type phenotype. The expression of a
minority of M1/M2 genes was increased in patients with Q fever
endocarditis and who were unable to clear C. burnetii and who
were expected to exhibit an M2-type phenotype (13). The analysis
of the transcriptional profiles of patients with active tuberculo-
sis shows the modulation of M1-related genes, but not that of
M2 genes. Similar results were obtained in infants vaccinated with
Calmette–Guerin bacillus (26, 45, 46).
In conclusion, the activation program of monocytes from
patients with acute and chronic Q fever and tuberculosis can-
not be reduced to an M1/M2 dichotomy. We cannot rule out that
macrophages in tissues such as endocardium, lungs, or liver are
polarized, as suggested by in vitro studies and animal models. This
is illustrated by the example of pleural macrophages. Tuberculous
pleural effusion, an extra-pulmonary form of tuberculosis, is asso-
ciated with the M1 profile in pleural fluid that is characterized by
an increase in M1 macrophages and inflammatory cytokines (47).
M2 POLARIZATION IN CHRONIC INFECTIOUS DISEASES:LEPROSY AND WHIPPLE’S DISEASETwo infectious diseases, leprosy and Whipple’s disease, which
share several features such as the tropism for macrophages of
Mycobacterium leprae and Tropheryma whipplei, and the role of
the immune response into features of pathogenesis, are associated
with M2 polarization (26). The overexpression of IL-10 is found in
Frontiers in Immunology | Inflammation October 2014 | Volume 5 | Article 500 | 4
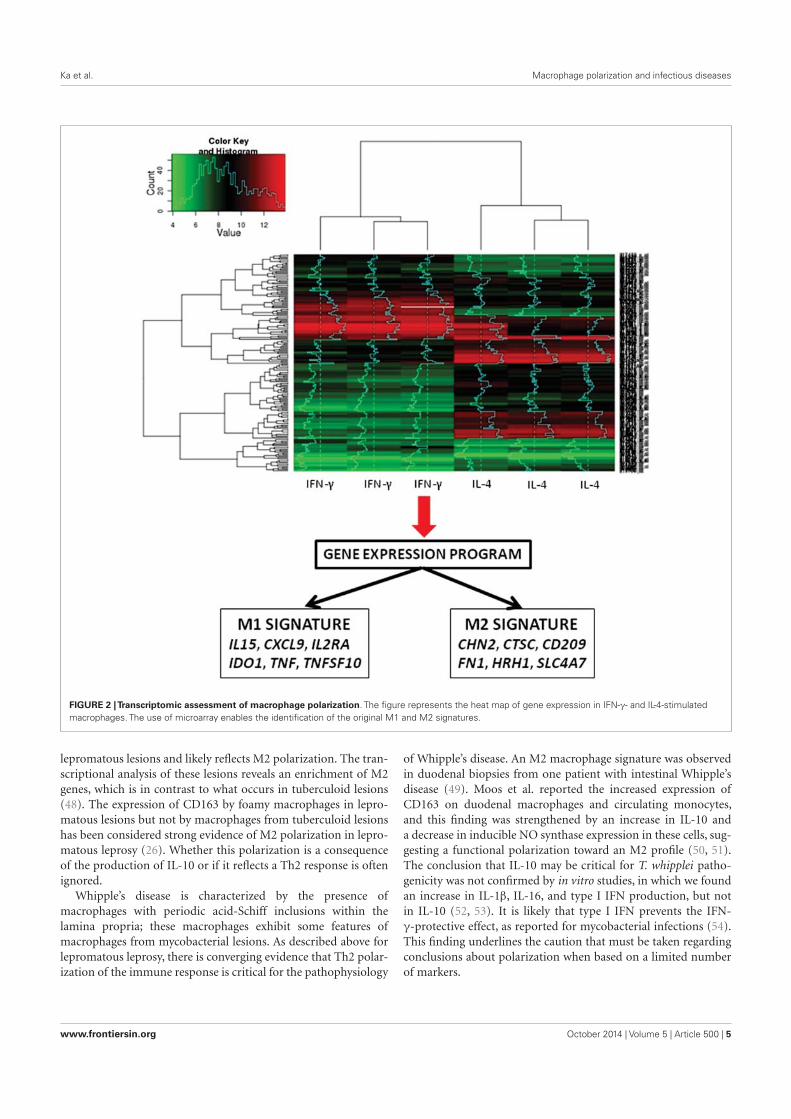
Ka et al. Macrophage polarization and infectious diseases
FIGURE 2 |Transcriptomic assessment of macrophage polarization. The figure represents the heat map of gene expression in IFN-γ- and IL-4-stimulated
macrophages. The use of microarray enables the identification of the original M1 and M2 signatures.
lepromatous lesions and likely reflects M2 polarization. The tran-
scriptional analysis of these lesions reveals an enrichment of M2
genes, which is in contrast to what occurs in tuberculoid lesions
(48). The expression of CD163 by foamy macrophages in lepro-
matous lesions but not by macrophages from tuberculoid lesions
has been considered strong evidence of M2 polarization in lepro-
matous leprosy (26). Whether this polarization is a consequence
of the production of IL-10 or if it reflects a Th2 response is often
ignored.
Whipple’s disease is characterized by the presence of
macrophages with periodic acid-Schiff inclusions within the
lamina propria; these macrophages exhibit some features of
macrophages from mycobacterial lesions. As described above for
lepromatous leprosy, there is converging evidence that Th2 polar-
ization of the immune response is critical for the pathophysiology
of Whipple’s disease. An M2 macrophage signature was observed
in duodenal biopsies from one patient with intestinal Whipple’s
disease (49). Moos et al. reported the increased expression of
CD163 on duodenal macrophages and circulating monocytes,
and this finding was strengthened by an increase in IL-10 and
a decrease in inducible NO synthase expression in these cells, sug-
gesting a functional polarization toward an M2 profile (50, 51).
The conclusion that IL-10 may be critical for T. whipplei patho-
genicity was not confirmed by in vitro studies, in which we found
an increase in IL-1β, IL-16, and type I IFN production, but not
in IL-10 (52, 53). It is likely that type I IFN prevents the IFN-
γ-protective effect, as reported for mycobacterial infections (54).
This finding underlines the caution that must be taken regarding
conclusions about polarization when based on a limited number
of markers.
www.frontiersin.org October 2014 | Volume 5 | Article 500 | 5
Ka et al. Macrophage polarization and infectious diseases
COMPLEXITY OF MACROPHAGE ACTIVATION IN INFECTIOUSDISEASESThe analysis of infectious disease literature (see above) reveals
that modulation of monocyte/macrophage activation is frequently
observed, whereas clear-cut M1/M2 polarization is rather a rare
event. This observation is related to the history of infected patients.
Indeed, the stage of the disease is a critical parameter. For instance,
the activation of monocytes/macrophages is different in patients
with initial sepsis and those with delayed complications. In addi-
tion, numerous patients are distributed between two extreme
situations: between patients with acute Q fever and those with Q
fever endocarditis, there is a population of patients with valvular
disease and Q fever associated with a risk of chronic evolution, and
these patients overproduce IL-10 in a sustained manner. However,
the measurement of IL-10 at a given time of Q fever evolution
is not sufficient to assess the prognosis of patients with Q fever
(55). In patients with tuberculosis, the transcriptional signature
is transient at the beginning of the disease and is finished 1 year
later (45). Clearly, the analysis of the transcriptional pattern of
patients with tuberculosis will be dramatically different accord-
ing to the time of the inclusion, and such an analysis is often
difficult to assess at the beginning of the disease. These different
clinical and experimental situations drove us to propose a model
of monocyte/macrophage activation in which the kinetic compo-
nent of the disease was integrated. This model is based on the
comparison of the transcriptomes from activated monocytes and
macrophages. The responses of monocytes to polarizing ligands
are characterized by two early and late phases of monocyte acti-
vation. The hallmarks of the M1/M2 status are found in the early
phase but are absent from the late phase of activation. We selected
a series of early and late genes and measured their expression in
monocytes from patients with acute and chronic Q fever. Most
of the early genes were found to be up-regulated in monocytes
from patients with acute Q fever, two of them, NLRC5 and RTP4,
were up-regulated by IFN-γ, suggesting that IFN-γ plays a role in
the host response during acute Q fever. In contrast, the late genes
were up-regulated in chronic Q fever, and some early genes were
down-modulated. There was a specific association between late
genes such as ALOX15, CLEC4F, CCL13, and CCL23 and chronic
Q fever (13). It is noteworthy that some of them have been asso-
ciated with the M2 program, which is a result that might lead to
incorrect conclusions about monocyte activation. We are unable
to assign a function to the modulated genes.
In conclusion, the analysis of macrophage polarization through
clinical situations revealed that the mechanisms underlying the
activation of monocytes and macrophages are distinct. This point
is critical because most clinical investigations are based on mono-
cytes and the conclusions are extrapolated on data obtained with
macrophages. The second observation is the importance of acti-
vation kinetics in the assessment of infected patients who are at
different stages of disease history. Therefore, early and late genes
may be alternative biomarkers for analyzing infectious and inflam-
matory diseases. The lessons from the investigation of infected
patients do not invalidate the functional model of M1/M2 polar-
ization. They revealed the difficulty to relate a signature and a
function. In addition, the finding of a role for these genes in
the activation of macrophages will be useful to understand the
complexity of macrophage physiology in normal and pathological
conditions.
REFERENCES1. Mills CD, Ley K. M1 and M2 macrophages: the chicken and the egg of immunity.
J Innate Immun (2014). doi:10.1159/000364945
2. Kidd BA, Peters LA, Schadt EE, Dudley JT. Unifying immunology with infor-
matics and multiscale biology. Nat Immunol (2014) 15(2):118–27. doi:10.1038/
ni0914-894c
3. Martinez FO, Gordon S, Locati M, Mantovani A. Transcriptional profiling of the
human monocyte-to-macrophage differentiation and polarization: new mol-
ecules and patterns of gene expression. J Immunol (2006) 177(10):7303–11.
doi:10.4049/jimmunol.177.10.7303
4. Xue J, Schmidt SV, Sander J, Draffehn A, Krebs W, Quester I, et al. Transcriptome-
based network analysis reveals a spectrum model of human macrophage activa-
tion. Immunity (2014) 40(2):274–88. doi:10.1016/j.immuni.2014.01.006
5. Hussell T, Bell TJ. Alveolar macrophages: plasticity in a tissue-specific context.
Nat Rev Immunol (2014) 14(2):81–93. doi:10.1038/nri3600
6. Brown J, Wallet MA, Krastins B, Sarracino D, Goodenow MM. Proteome
bioprofiles distinguish between M1 priming and activation states in human
macrophages. J Leukoc Biol (2010) 87(4):655–62. doi:10.1189/jlb.0809570
7. Ouedraogo R, Flaudrops C, Ben Amara A, Capo C, Raoult D, Mege JL.
Global analysis of circulating immune cells by matrix-assisted laser desorption
ionization time-of-flight mass spectrometry. PLoS One (2010) 5(10):e13691.
doi:10.1371/journal.pone.0013691
8. Ouedraogo R, Daumas A, Ghigo E, Capo C, Mege JL, Textoris J.
Whole-cell MALDI-TOF MS: a new tool to assess the multifaceted activation
of macrophages. J Proteomics (2012) 75(18):5523–32. doi:10.1016/j.jprot.2012.
07.046
9. Murray PJ, Allen JE, Biswas SK, Fisher EA, Gilroy DW, Goerdt S, et al.
Macrophage activation and polarization: nomenclature and experimental guide-
lines. Immunity (2014) 41(1):14–20. doi:10.1016/j.immuni.2014.06.008
10. Barros MH, Hauck F, Dreyer JH, Kempkes B, Niedobitek G. Macrophage
polarisation: an immunohistochemical approach for identifying M1 and
M2 macrophages. PLoS One (2013) 8(11):e80908. doi:10.1371/journal.pone.
0080908
11. Buechler C, Ritter M, Orso E, Langmann T, Klucken J, Schmitz G. Regulation of
scavenger receptor CD163 expression in human monocytes and macrophages
by pro- and antiinflammatory stimuli. J Leukoc Biol (2000) 67(1):97–103.
doi:10.1189/jlb.0813437
12. Kittan NA, Allen RM, Dhaliwal A, Cavassani KA, Schaller M, Gallagher
KA, et al. Cytokine induced phenotypic and epigenetic signatures are key to
establishing specific macrophage phenotypes. PLoS One (2013) 8(10):e78045.
doi:10.1371/journal.pone.0078045
13. Mehraj V, Textoris J, Ben Amara A, Ghigo E, Raoult D, Capo C, et al. Mono-
cyte responses in the context of Q fever: from a static polarized model to a
kinetic model of activation. J Infect Dis (2013) 208(6):942–51. doi:10.1093/
infdis/jit266
14. Ivanov II, Honda K. Intestinal commensal microbes as immune modulators.
Cell Host Microbe (2012) 12(4):496–508. doi:10.1016/j.chom.2012.09.009
15. Hooper LV, Macpherson AJ. Immune adaptations that maintain homeosta-
sis with the intestinal microbiota. Nat Rev Immunol (2010) 10(3):159–69.
doi:10.1038/nri2710
16. Round JL, Mazmanian SK. The gut microbiota shapes intestinal immune
responses during health and disease. Nat Rev Immunol (2009) 9(5):313–23.
doi:10.1038/nri2515
17. Smith PD,Ochsenbauer-Jambor C,Smythies LE. Intestinal macrophages: unique
effector cells of the innate immune system. Immunol Rev (2005) 206:149–59.
doi:10.1111/j.0105-2896.2005.00288.x
18. Jones SE, Paynich ML, Kearns DB, Knight KL. Protection from intestinal inflam-
mation by bacterial exopolysaccharides. J Immunol (2014) 192(10):4813–20.
doi:10.4049/jimmunol.1303369
19. Hayashi A, Sato T, Kamada N, Mikami Y, Matsuoka K, Hisamatsu T, et al.
A single strain of Clostridium butyricum induces intestinal IL-10-producing
macrophages to suppress acute experimental colitis in mice. Cell Host Microbe
(2013) 13(6):711–22. doi:10.1016/j.chom.2013.05.013
20. Chang PV, Hao L, Offermanns S, Medzhitov R. The microbial metabo-
lite butyrate regulates intestinal macrophage function via histone deacetylase
Frontiers in Immunology | Inflammation October 2014 | Volume 5 | Article 500 | 6
Ka et al. Macrophage polarization and infectious diseases
inhibition. Proc Natl Acad Sci U S A (2014) 111(6):2247–52. doi:10.1073/pnas.
1322269111
21. Yang Y, Wang X, Huycke T, Moore DR, Lightfoot SA, Huycke MM. Colon
macrophages polarized by commensal bacteria cause colitis and cancer
through the bystander effect. Transl Oncol (2013) 6(5):596–606. doi:10.1593/
tlo.13412
22. Jang SE, Hyam SR, Han MJ, Kim SY, Lee BG, Kim DH. Lactobacillus brevis G-101
ameliorates colitis in mice by inhibiting NF-κB, MAPK and AKT pathways and
by polarizing M1 macrophages to M2-like macrophages. J Appl Microbiol (2013)
115(3):888–96. doi:10.1111/jam.12273
23. Christoffersen TE, Hult LT, Kuczkowska K, Moe KM, Skeie S, Lea T, et al. In vitro
comparison of the effects of probiotic, commensal and pathogenic strains
on macrophage polarization. Probiotics Antimicrob Proteins (2014) 6(1):1–10.
doi:10.1007/s12602-013-9152-0
24. Habil N, Al-Murrani W, Beal J, Foey AD. Probiotic bacterial strains differen-
tially modulate macrophage cytokine production in a strain-dependent and
cell subset-specific manner. Benef Microbes (2011) 2(4):283–93. doi:10.3920/
BM2011.0027
25. Benoit M, Desnues B, Mege JL. Macrophage polarization in bacterial infections.
J Immunol (2008) 181(6):3733–9. doi:10.4049/jimmunol.181.6.3733
26. Mege JL, Mehraj V, Capo C. Macrophage polarization and bacterial infections.
Curr Opin Infect Dis (2011) 24(3):230–4. doi:10.1097/QCO.0b013e328344b73e
27. Quiding-Jarbrink M, Raghavan S, Sundquist M. Enhanced M1 macrophage
polarization in human Helicobacter pylori-associated atrophic gastritis and in
vaccinated mice. PLoS One (2010) 5(11):e15018. doi:10.1371/journal.pone.
0015018
28. Kim YG, Udayanga KG, Totsuka N, Weinberg JB, Nunez G, Shibuya A. Gut
dysbiosis promotes M2 macrophage polarization and allergic airway inflam-
mation via fungi-induced PGE2. Cell Host Microbe (2014) 15(1):95–102.
doi:10.1016/j.chom.2013.12.010
29. Chen J, Ivashkiv LB. IFN-γ abrogates endotoxin tolerance by facilitating Toll-
like receptor-induced chromatin remodeling. Proc Natl Acad Sci U S A (2010)
107(45):19438–43. doi:10.1073/pnas.1007816107
30. Wilson HM. SOCS proteins in macrophage polarization and function. Front
Immunol (2014) 5:357. doi:10.3389/fimmu.2014.00357
31. Hotchkiss RS, Karl IE. The pathophysiology and treatment of sepsis. N Engl
J Med (2003) 348(2):138–50. doi:10.1056/NEJMra021333
32. Brunialti MK, Santos MC, Rigato O, Machado FR, Silva E, Salomao R. Increased
percentages of T helper cells producing IL-17 and monocytes expressing markers
of alternative activation in patients with sepsis. PLoS One (2012) 7(5):e37393.
doi:10.1371/journal.pone.0037393
33. Moller HJ, Moestrup SK, Weis N, Wejse C, Nielsen H, Pedersen SS, et al.
Macrophage serum markers in pneumococcal bacteremia: prediction of sur-
vival by soluble CD163. Crit Care Med (2006) 34(10):2561–6. doi:10.1097/01.
CCM.0000239120.32490.AB
34. Kjaergaard AG, Rodgaard-Hansen S, Dige A, Krog J, Moller HJ, Tonnesen
E. Monocyte expression and soluble levels of the haemoglobin receptor
(CD163/sCD163) and the mannose receptor (MR/sMR) in septic and critically
ill non-septic ICU patients. PLoS One (2014) 9(3):e92331. doi:10.1371/journal.
pone.0092331
35. Rodgaard-Hansen S, Rafique A, Christensen PA, Maniecki MB, Sandahl TD,
Nexo E, et al. A soluble form of the macrophage-related mannose receptor
(MR/CD206) is present in human serum and elevated in critical illness. Clin
Chem Lab Med (2014) 52(3):453–61. doi:10.1515/cclm-2013-0451
36. Raoult D, Marrie T, Mege JL. Natural history and pathophysiology of Q fever.
Lancet Infect Dis (2005) 5(4):219–26. doi:10.1016/S1473-3099(05)70052-9
37. Benoit M, Barbarat B, Bernard A, Olive D, Mege JL. Coxiella burnetii, the agent of
Q fever, stimulates an atypical M2 activation program in human macrophages.
Eur J Immunol (2008) 38(4):1065–70. doi:10.1002/eji.200738067
38. Ben Amara A, Bechah Y, Mege JL. Immune response and Coxiella burnetii inva-
sion. Adv Exp Med Biol (2012) 984:287–98. doi:10.1007/978-94-007-4315-1_15
39. Rajaram MV, Brooks MN, Morris JD, Torrelles JB, Azad AK, Schlesinger
LS. Mycobacterium tuberculosis activates human macrophage peroxisome
proliferator-activated receptor gamma linking mannose receptor recognition
to regulation of immune responses. J Immunol (2010) 185(2):929–42. doi:10.
4049/jimmunol.1000866
40. Ghigo E, Capo C, Raoult D, Mege JL. Interleukin-10 stimulates Coxiella bur-
netii replication in human monocytes through tumor necrosis factor down-
modulation: role in microbicidal defect of Q fever. Infect Immun (2001)
69(4):2345–52. doi:10.1128/IAI.69.4.2345-2352.2001
41. Ghigo E, Honstettre A, Capo C, Gorvel JP, Raoult D, Mege JL. Link between
impaired maturation of phagosomes and defective Coxiella burnetii killing in
patients with chronic Q fever. J Infect Dis (2004) 190(10):1767–72. doi:10.1086/
425041
42. Benoit M, Ghigo E, Capo C, Raoult D, Mege JL. The uptake of apoptotic cells
drives Coxiella burnetii replication and macrophage polarization: a model for
Q fever endocarditis. PLoS Pathog (2008) 4(5):e1000066. doi:10.1371/journal.
ppat.1000066
43. Meghari S, Bechah Y, Capo C, Lepidi H, Raoult D, Murray PJ, et al. Persistent
Coxiella burnetii infection in mice overexpressing IL-10: an efficient model for
chronic Q fever pathogenesis. PLoS Pathog (2008) 4(2):e23. doi:10.1371/journal.
ppat.0040023
44. Meghari S, Berruyer C, Lepidi H, Galland F, Naquet P, Mege JL. Vanin-1 con-
trols granuloma formation and macrophage polarization in Coxiella burnetii
infection. Eur J Immunol (2007) 37(1):24–32. doi:10.1002/eji.200636054
45. Berry MP, Graham CM, McNab FW, Xu Z, Bloch SA, Oni T, et al. An interferon-
inducible neutrophil-driven blood transcriptional signature in human tubercu-
losis. Nature (2010) 466(7309):973–7. doi:10.1038/nature09247
46. Fletcher HA, Keyser A, Bowmaker M, Sayles PC, Kaplan G, Hussey G, et al.
Transcriptional profiling of mycobacterial antigen-induced responses in infants
vaccinated with BCG at birth. BMC Med Genomics (2009) 2:10. doi:10.1186/
1755-8794-2-10
47. Tang Y, Hua SC, Qin GX, Xu LJ, Jiang YF. Different subsets of macrophages
in patients with new onset tuberculous pleural effusion. PLoS One (2014)
9(2):e88343. doi:10.1371/journal.pone.0088343
48. Montoya D, Cruz D, Teles RM, Lee DJ, Ochoa MT, Krutzik SR, et al. Divergence
of macrophage phagocytic and antimicrobial programs in leprosy. Cell Host
Microbe (2009) 6(4):343–53. doi:10.1016/j.chom.2009.09.002
49. Desnues B, Lepidi H, Raoult D, Mege JL. Whipple disease: intestinal infiltrating
cells exhibit a transcriptional pattern of M2/alternatively activated macrophages.
J Infect Dis (2005) 192(9):1642–6. doi:10.1086/491745
50. Moos V, Schmidt C, Geelhaar A, Kunkel D, Allers K, Schinnerling K, et al.
Impaired immune functions of monocytes and macrophages in Whipple’s dis-
ease. Gastroenterology (2010) 138(1):210–20. doi:10.1053/j.gastro.2009.07.066
51. Geelhaar-Karsch A, Schinnerling K, Conrad K, Friebel J, Allers K, Schneider T,
et al. Evaluation of arginine metabolism for the analysis of M1/M2 macrophage
activation in human clinical specimens. Inflamm Res (2013) 62(9):865–9.
doi:10.1007/s00011-013-0642-z
52. Al Moussawi K, Ghigo E, Kalinke U, Alexopoulou L, Mege JL, Desnues B.
Type I interferon induction is detrimental during infection with the Whipple’s
disease bacterium, Tropheryma whipplei. PLoS Pathog (2010) 6(1):e1000722.
doi:10.1371/journal.ppat.1000722
53. Desnues B, Raoult D, Mege JL. IL-16 is critical for Tropheryma whipplei repli-
cation in Whipple’s disease. J Immunol (2005) 175(7):4575–82. doi:10.4049/
jimmunol.175.7.4575
54. Rayamajhi M, Humann J, Kearney S, Hill KK, Lenz LL. Antagonistic crosstalk
between type I and II interferons and increased host susceptibility to bacterial
infections. Virulence (2010) 1(5):418–22. doi:10.4161/viru.1.5.12787
55. Honstettre A, Imbert G, Ghigo E, Gouriet F, Capo C, Raoult D, et al. Dysreg-
ulation of cytokines in acute Q fever: role of interleukin-10 and tumor necro-
sis factor in chronic evolution of Q fever. J Infect Dis (2003) 187(6):956–62.
doi:10.1086/368129
Conflict of Interest Statement: The authors declare that the research was conducted
in the absence of any commercial or financial relationships that could be construed
as a potential conflict of interest.
Received: 24 July 2014; accepted: 25 September 2014; published online: 10 October
2014.
Citation: Ka MB, Daumas A, Textoris J and Mege J-L (2014) Phenotypic diversity
and emerging new tools to study macrophage activation in bacterial infectious diseases.
Front. Immunol. 5:500. doi: 10.3389/fimmu.2014.00500
This article was submitted to Inflammation, a section of the journal Frontiers in
Immunology.
Copyright © 2014 Ka, Daumas, Textoris and Mege. This is an open-access article dis-
tributed under the terms of the Creative Commons Attribution License (CC BY). The
use, distribution or reproduction in other forums is permitted, provided the original
author(s) or licensor are credited and that the original publication in this journal is cited,
in accordance with accepted academic practice. No use, distribution or reproduction is
permitted which does not comply with these terms.
www.frontiersin.org October 2014 | Volume 5 | Article 500 | 7
158
DISCUSSION et PERSPECTIVES
Nous allons discuter les deux approches auxquelles nous nous sommes intéressés dans cette
thèse à savoir la spectrométrie de type MALDI-TOF et la mesure de la formation des
granulomes. Ces 2 approches originales apportent une aide dans la prise en charge des patients
infectés dont on a rappelé les enjeux et les risques.
1. La spectrométrie de masse de type MALDI-TOF
La spectrométrie de masse de type MALDI-TOF est devenue dans les laboratoires de
microbiologie, un outil indispensable à l’identification des germes à partir de cultures liquides
ou solides, ou de fluides biologiques infectés [137]. Ses atouts sont nombreux, rapidité et
précision d’identification, utilisation aisée et faible coût par échantillon [74]. Certes l’achat et
l’entretien de l’appareil est onéreux, mais sur le long terme l’outil semble largement rentabilisé.
En effet, une identification rapide faite directement à partir des prélèvements permet une
optimisation de la prise en charge du patient en minimisant les coûts (réduction de la
prescription d’antibiotiques à large spectre, de l’émergence de résistances notamment). Même
si l’identification rapide des bactéries par la technique MALDI-TOF permet d’adapter
l’antibiothérapie probabiliste, la détermination de la sensibilité aux antibiotiques est l’analyse
qui conditionne le bon traitement anti-infectieux pour le patient. Peu de bactéries sont
concernées par des tests rapides de recherche de résistances. De nombreuses études montrent la
capacité de la technique pour caractériser les enzymes ou les produits de dégradation dus aux
mécanismes de résistance aux antibiotiques [138]. Cependant, aucune de ces méthodes n’est
actuellement utilisée en routine.
Au regard de ces nombreux avantages, en utilisant la même approche, nous avons montré qu’il
était possible d’identifier des cellules entières sans extraction préalable, en particulier des
cellules immunitaires mais aussi des mélanges cellulaires et de distinguer différents états
d’activation. Nous avons retrouvé une signature IFN- et IL-10 chez tous les patients septiques
ainsi qu’une signature CpG ODN indépendamment de la documentation microbiologique
suggérant une activation à un pathogène bactérien.
159
La principale limite de cette étude est cependant de ne pas avoir étudié le profil spectral des
PBMCs de patients présentant un SIRS d’origine non infectieuse afin de s’assurer de la
spécificité de la signature CpG ODN. A ce jour, aucune étude n’a été retrouvée dans la
littérature sur ce sujet. Si cette technique permet d’aider le clinicien dans la décision de débuter
un traitement anti-infectieux avant même les résultats des prélèvements infectieux, nous
n’avons pas trouvé d’indices pour identifier l’agent infectieux impliqué. En effet, la sensibilité
de la technique ne permet pas d’aller à une caractérisation plus précise du stimulus bactérien.
Notre travail ne peut donc pas être une alternative à la spectrométrie de masse de type MALDI-
TOF pour l’identification des micro-organismes. On peut donc voir cette technique comme un
outil d’aide à la prise en charge thérapeutique rapide d’un patient en SIRS mais aussi nous
pourrions envisager qu’elle soit une aide pour monitorer la réponse immunitaire à l’infection.
Le profil d’activation des PBMCs varie peut-être en fonction du temps ce que nous n’avons pu
mettre en évidence compte tenu des critères d’inclusion stricts des patients dans l’étude. Une
variation du profil d’activation des PBMCs pourrait permettre de guider au mieux et de
personnaliser la prise en charge thérapeutique du patient.
Sur le plan pratique, bien que la technique semble simple et indépendante de l’opérateur, sa
principale difficulté concerne le mélange échantillon/matrice et son dépôt sur la plaque -
métallique de support. Un excès d’échantillon de même qu’un mauvais dépôt peuvent altérer la
qualité du spectre et rendre l’identification difficile. Une certaine précision est également
nécessaire afin de ne pas contaminer l’échantillon voisin.
Une des questions qui se pose concerne l’identification précise des protéines spécifiques
constituant les signatures obtenues par MALDI-TOF. Bien que cela ne soit pas un prérequis
pour l’usage du MALDI-TOF en clinique dans le contexte d’un SIRS, elle présente néanmoins
plusieurs intérêts. L’identification des protéines spécifiques permet de réaliser une étape de
validation par des méthodes indépendantes de type immunologique (ELISA), et donc
d’augmenter la valeur prédictive de la signature spectrale. Par ailleurs, la caractérisation de ces
marqueurs potentiels peut permettre d’améliorer la compréhension de la réponse immunitaire.
Enfin dans le domaine de la cancérologie, dans certains cas où la caractérisation des marqueurs
a été effectuée, les protéines identifiées correspondaient à des protéines majoritaires du sérum
comme l’apolipoprotéine A1, la transthyrétine ou l’α-antitrypsine. On peut alors de se
demander si ces marqueurs voient leur expression altérée spécifiquement en réponse à la
160
prolifération tumorale ou de manière non spécifique en réponse à des épiphénomènes tels que
l’état général du patient ou des processus inflammatoires ?
C’est ainsi que le SELDI-TOF (surfaced-enhanced laser desorption/ionization time-of-flight)
présente également de nombreux avantages (simplicité d’utilisation, sensibilité et capacité
d’analyse à haut débit des échantillons). Cette technique permet la séparation, la détection et
l’analyse de protéines, directement à partir de l’échantillon biologique avec une sensibilité de
l’ordre de la femtomole. Elle est toutefois limitée par la gamme de masse protéique analysable,
avec une très bonne détection pour les protéines inférieures à 20-30 kDa et une sensibilité
moindre pour les protéines de plus hautes masses. Cette technique permet d’obtenir une vue
d’ensemble des peptides et des protéines présents dans l’échantillon testé. L’analyse
différentielle et statistique de l’ensemble des données fournies par les profils protéiques des
groupes témoins et pathologiques repose ensuite sur des algorithmes informatiques permettant
d’extraire des spectres de masse la meilleure combinaison de marqueurs capables de discriminer
chacun des deux groupes. Cette technologie a permis l’émergence du concept de signature
protéique tumorale. Dès 2002, un profil protéique constitué de cinq marqueurs permettait de
dépister, à partir d’un simple échantillon sanguin, des cancers de l’ovaire dès le stade I (stade
le plus précoce) avec une sensibilité de 100 %, une spécificité de 95 % et une valeur prédictive
positive de 94 % [139]. Des résultats similaires ont été obtenus par la suite pour les cancers du
sein, de la vessie, du pancréas, du rein ou du foie à partir d’échantillons variés [140,141]. Une
méta-analyse réalisée à partir des données issues de cinq publications indépendantes a
cependant suggéré un défaut de reproductibilité d’un laboratoire à l’autre [142]. En fait, il est
apparu que l’établissement des profils protéiques était très dépendant des algorithmes
informatiques utilisés. Ainsi une validation et une standardisation des techniques utilisées sont
nécessaires pour les rendre utilisables en clinique.
D’autres approches sont à la disposition des cliniciens pour appréhender la réponse du système
immunitaire à un pathogène. Parmi celles-ci, on peut citer la cytométrie de flux qui a permis la
mise en évidence d’une multitude de cellules du système immunitaire, de leur rôle
physiologique ou en pathologie [143]. L’une des difficultés avec la cytométrie en flux c’est le
nombre restreint de fluorochromes et le nombre limité de longueurs d’ondes possibles [144].
De plus, il est nécessaire d’utiliser des longueurs d’ondes d’excitation distinctes pour chaque
fluorochrome, ce qui implique d’équiper les instruments de plusieurs lasers fonctionnant
simultanément. Par ailleurs, le spectre d’émission de chaque fluorochrome peut être large, ce
161
qui entraîne des recouvrements dans la détection de la lumière émise lorsque plusieurs
marqueurs (et donc plusieurs fluorochromes) sont analysés sur une même cellule. Pour
s’affranchir de ces limites, la cytométrie de masse a vu le jour. Les anticorps, ou tout autre
ligand utilisé pour marquer la cellule, sont couplés à un métal. Les cellules marquées sont
vaporisées et introduites une à une dans une chambre à plasma où elles sont atomisées et
ionisées. Chaque cellule génère ainsi un nuage d’ions dont le temps de vol (TOF) est analysé
par spectrométrie de masse. Puisque le métal n’est pas un produit naturel de la cellule, la
signature de chaque métal est ainsi spécifique du marqueur cellulaire identifié. L’avantage
majeur de cette technologie est l’absence de recouvrement des signaux obtenus pour chaque
métal dans les différents canaux de détection. En effet, chaque métal produit un signal unique
qui est fonction de son poids moléculaire. Près de 60 métaux peuvent ainsi être détectés
simultanément [145]. L’utilisation de la spectrométrie de masse permet aussi une quantification
directe et absolue, sans traitement nécessaire des données brutes.
A noter également un intérêt croissant pour les techniques de biologie moléculaire. La
technologie des microarrays, ou biopuces, permet d’analyser simultanément plusieurs milliers
de gènes au sein d’un seul échantillon. Les puces transcriptomiques permettent de savoir, à
l’échelle du génome dans un compartiment cellulaire donné, quels gènes sont actifs, et dans
quelle proportion ils sont transcrits. Le transcriptome est une photographie « instantanée » de
l'expression du génome. Aujourd’hui, l'analyse du transcriptome est également un outil
d'analyse de la réponse de l'hôte à l'agression. Les résultats des puces transcriptomiques
permettent ainsi de décrire la réponse de l’hôte à diverses agressions notamment à l’infection
et ont permis la découverte de biomarqueurs diagnostiques, thérapeutiques ou encore
pronostiques. Ainsi à titre d’exemple, la comparaison des profils transcriptomiques
leucocytaires sanguins de patients atteints de pneumopathie à ceux de patients admis en
réanimation avec une présentation clinique semblable mais sans infection, a permis d’identifier
une signature de 78 gènes spécifiques du diagnostic de pneumopathie [57]. Le test SeptiCyte
LAB en mesurant simultanément le niveau d’expression de 4 gènes (CAECAM4, LAMP1,
PLA2G7 et PLAC8), concurrence notre approche en MALDI-TOF en permettant de distinguer
les patients admis en réanimation pour un sepsis des patients admis pour un SIRS d’origine non
infectieuse [146]. Des signatures spécifiques ont également été identifiées comme associées à
un mauvais pronostic. Ainsi, l’étude des profils transcriptomiques leucocytaires sanguins de
patients admis en réanimation pour une pneumopathie a permis d’identifier 2 sous-groupes de
patients présentant, malgré des caractéristiques cliniques similaires, des profils d’expression
162
génomiques particuliers SRS1 and SRS2. Les patients SRS1 présentaient une mortalité
significativement plus élevée à J14 que les patients SRS2 [147]. Une des difficultés est
cependant l’influence de nombreux facteurs sur les réponses comme le temps (la réponse de
l’hôte est variable en fonction du délai écoulé depuis le début de l’infection et celui de la prise
en charge), l’hôte et le micro-organisme. Cette technique s’intègre totalement dans l’optique
d’une prise en charge personnalisée, adaptée à la situation clinique mais aussi à la réponse
spécifique du patient en temps réel bien que non utilisable en routine clinique pour l’instant.
À l’heure actuelle, il est impératif de valider nos résultats sur une plus grande cohorte de patients
en SIRS et de comparer les différents systèmes disponibles quant à leurs performances
techniques. Enfin, le champ d’investigation des différentes approches de spectrométrie de
masse est très largement ouvert permettant d’envisager d’identifier les protéines spécifiques des
profils spectraux et de monitorer la réponse aux traitements.
2. Le modèle de formation de granulomes in vitro
Le granulome est la résultante d’une coopération intense entre les cellules de la réponse innée
et adaptative dans le but d’éliminer un agent pathogène. L’évaluation in vitro de sa formation
permet ainsi d’explorer la fonctionnalité des différents acteurs du système immunitaire et leurs
interactions et de mieux comprendre les complications de son dysfonctionnement en cas de
sepsis. Nous avons ainsi étudié la capacité de sujets en sepsis sévère et de sujets âgés infectés
à former des granulomes en réponse à des extraits de Coxiella burnetii et de BCG par rapport à
des sujets sains.
Nous avons retrouvé un défaut de formation de granulomes chez les patients septiques quel que
soient leur âge et les extraits bactériens utilisés, aux différents temps d’analyse. Ainsi, la
formation in vitro de granulomes pourrait servir à évaluer le degré d’immunosuppression et le
monitorer en réponse à un traitement voir évaluer le pronostic.
Pour expliquer le défaut de formation de granulomes, les patients en sepsis sévère ne formant
pas de granulome présentaient des taux de monocytes significativement plus faibles et/ou une
lymphopénie. Chez la personne âgée, une dénutrition était retrouvée chez les patients ne
formant pas de granulome. Contrairement à l’étude chez les patients en sepsis, les sujets âgés
163
incapables de former des granulomes ne présentaient pas de monocytopénie et/ou de
lymphopénie.
Le dosage du TNF dans les surnageants a mis en évidence des taux significativement plus
faibles chez les patients qui ne forment pas de granulomes sans augmentation de l’IL-10 en
parallèle. De plus, ce défaut de formation était associé à un défaut de différenciation des
macrophages en cellules épithélioides et en cellules géantes multinucléés (MGCs) et à une
down-modulation des gènes impliqués dans la polarisation M1/M2 des macrophages à
l’exception de TNFSF10 et à une down-modulation également des gènes du granulome.
Pour confirmer le rôle du TNF dans la formation des granulomes, qui en clinique a du sens
(susceptibilité des patients sous anti-TNF aux infections et réactivation de tuberculose latente),
Soraya Mezouar dans l’équipe du Pr MEGE a étudié l’impact de l’étanercept et de
l’adalimumab, sur la formation du granulome [148]. Ces 2 thérapeutiques actuellement
couramment utilisées dans des indications diverses (rhumatismes inflammatoires, psoriasis,
maladie de Crohn notamment), se lient au TNF, neutralisant ainsi sa fonction biologique en
bloquant son interaction avec ses récepteurs. Leur travail a mis en évidence que l’étanercept
retarde la formation de granulome et réduit la génération de cellules géantes multinucléées
(MGCs). Sur le plan transcriptomique, une surexpression des gènes de la polarisation M1 est
observée mais également une augmentation de la sécrétion d'IL-10 qui participe au défaut de
formation de MGCs en inhibant la fusion cellulaire. Leurs résultats montrent que l'adalimumab,
lui aussi induit un défaut de formation de MGCs mais indépendamment de l’IL-10 dont la
sécrétion n’est pas modifiée. L’adalimumab impacterait la formation des MGCs plutôt en
induisant une apoptose des macrophages.
Récemment, Djalma A. Alves da Silva et al. [149], ont quant à eux étudié l’impact de
l’infliximab sur la formation in vitro du granulome et la production de cytokines (TNF-α, IFN-
γ, IL-12p40, IL-10 and IL-17). Comme utilisé au sein du laboratoire, ils ont étudié la formation
des granulomes en incubant les PBMCs de patients (32 avec une tuberculose active, 27 guéris
et 17 contrôles) avec des billes de sépharose couplées à des extraits de Mycobacterium bovis.
Leurs résultats montrent une formation significativement plus importante de granulomes chez
les patients guéris par rapport aux patients infectés et aux patients sains en l’absence d’anti-
TNF. Sous infliximab, la formation des granulomes chez les patients guéris est
significativement réduite alors qu’elle n’est pas significativement impactée dans les 2 autres
groupes. Ils ne se sont pas intéressés à la formation des MGCs mais à la production de cytokines
164
qui est significativement diminuée dans les 3 groupes. L’intérêt de cette étude est de montrer
que malgré l’impact négatif de l’infliximab sur la production de nombreuses cytokines, la
formation des granulomes n’est diminuée que dans le groupe des patients guéris de la
tuberculose. Cela suggère l'implication d'autres cytokines ou chimiokines, ainsi que de
molécules d'adhésion qui pourraient être directement responsables de l'adhésion intercellulaire
dans la formation de granulomes [33–35] et de voies de signalisation en aval de l'action de ces
cytokines.
Ces différentes études montrent sur le plan pratique que l’utilisation de ce modèle est facile et
reproductible. L’évaluation de la formation des granulomes n’est par contre pas standardisée.
Dans l’étude de Djalma A. Alves da Silva et al. [149], il utilise un score allant de 1 « billes
nues » à 6 lorsque plusieurs couches de cellules sont mises en évidence avec des MGCs. Dans
l’équipe, l’évaluation était plus simple avec la distinction billes nues et granulomes lors que les
billes étaient totalement recouvertes de cellules.
Le modèle de formation in vitro de granulome est un bon modèle pour mettre en évidence un
défaut de la réponse immunitaire quel que soit sa cause et ainsi détecter les patients
potentiellement à risque d’évolution défavorable. Deknuydt et al. [122] ont montré une
diminution significative de la formation de granulomes chez les traumatisés crâniens par rapport
à des sujets sains et parmi les traumatisés crâniens, ceux développant une pneumopathie
nosocomiale en formaient significativement moins que ceux non infectés. Une des limites de
nos travaux dans nos 2 populations est l’absence d’analyse du devenir des patients par rapport
leur capacité à former des granulomes pour savoir si le défaut de formation de granulomes est
associé un moins bon pronostic.
Comme nos résultats et ceux de Mezouar et al. [147], Deknuydt et al. [122] ont montré une
diminution des MGCs dans les granulomes. La formation des MGCs est ainsi nécessaire au
développement des granulomes. Le rôle du TNF semble central mais d’autres mécanismes sont
également mis en jeu (défaut de fusion, apoptose macrophagique). Nous avons en effet montré
que l’ajout de TNF ne permettait pas de corriger le défaut de formation de granulomes [14].
L’utilisation de ce modèle est difficilement envisageable en routine clinique bien que le recueil
des PBMCs soit relativement facile et rapide et que le défaut ou le retard de formation des
granulomes s’observe le plus souvent dès le 3ième jour. Il peut par contre être utilisé comme
outil d’évaluation de l’impact de nouvelles thérapeutiques sur le système immunitaire. Il serait

165
ainsi intéressant d’étudier s’il y a un impact de la dose d’anti-TNF sur le défaut de formation
des MGCs et sur le pronostic. Dans ce cas, ce modèle pourrait servir à monitorer la réponse
immunitaire et à personnaliser le traitement.
166
CONCLUSION
En conclusion, la réponse de l’hôte à l’infection est complexe. Son exploration nécessite des
approches combinées dans le but de permettre une prise en charge optimisée et personnalisée.
Notre travail a reposé sur deux approches : la spectrométrie de masse MALDI-TOF et la
formation in vitro de granulomes.
En spectrométrie de masse MALDI-TOF, nous avons pu identifier différents profils
d’activation des cellules de l’immunité et mettre en évidence une signature spectrale spécifique
chez les patients septiques apportant ainsi une aide au clinicien pour orienter la prise en charge
du patient avant même d’obtenir une éventuelle identification microbiologique. Par l’étude de
la formation in vitro de granulomes, nous avons mis en évidence un défaut de formation de
granulomes chez les patients septiques quel que soient leur âge dont les causes sont multiples.
Notre travail démontre le potentiel de ces 2 outils dans l’évaluation de la réponse de l’hôte à
l’infection. Nos résultats ouvrent sur des perspectives cliniques pour la spectrométrie de masse
après la validation de la signature spectrale retrouvée dans une plus grande cohorte de patients
comprenant des patients en SIRS d’origine non infectieuse. Quant à l’étude de la formation in
vitro des granulomes, elle pourrait permettre de monitorer l’impact sur la réponse immunitaire
de traitements pris au long cours par les patients afin de personnaliser le traitement et diminuer
le risque de complications infectieuses.
167
REFERENCES BIBLIOGRAPHIQUES
[1] Dellinger RP, Levy MM, Rhodes A, Annane D, Gerlach H, Opal SM et al. Surviving sepsis
campaign: International guidelines for management of severe sepsis and septic shock, 2012.
Crit Care Med. 2013;41:580‑637.
[2] Singer M, Deutschman CS, Warren Seymour C, et al. The Third International Consensus
Definitions for Sepsis and Septic Shock (Sepsis-3). JAMA. 2016;315:801-10.
[3] Zambon M, Ceola M, Almeida-de-Castro R, Gullo A, Vincent JL. Implementation of the
Surviving Sepsis Campaign guidelines for severe sepsis and septic shock: we could go
faster. J Crit Care. 2008;23:455-60.
[4] Liu VX, Fielding-Singh V, Greene JD, Baker JM, Iwashyna TJ, Bhattacharya J, Escobar
GJ. The Timing of Early Antibiotics and Hospital Mortality in Sepsis. Am J Respir Crit
Care Med. 2017;196:856-863.
[5] Wester AL, Dunlop O, Melby KK, Dahle UR, Wyller TB. Age-related differences in
symptoms, diagnosis and prognosis of bacteremia. BMC Infect Dis. 2013;13:346.
[6] Seigel TA, Cocchi MN, Salciccioli J, Shapiro NI, Howell M, Tang A, et al. Inadequacy of
temperature and white blood cell count in predicting bacteremia in patients with suspected
infection. J Emerg Med.2012;42:254-9.
[7] Adrie C, Alberti C, Chaix-Couturier C, Azoulay E, De Lassence A, Cohen Y, et al.
Epidemiology and economic evaluation of severe sepsis in France: age, severity, infection
site, and place of acquisition (community, hospital, or intensive care unit) as determinants
of workload and cost. J Crit Care. 2005;20:46-58.
[8] Faix JD. Biomarkers of sepsis. Crit Rev Clin Lab Sci. 2013;50:23-36.
[9] Hotchkiss RS, Monneret G, Payen D. Sepsis-induced immunosuppression: from cellular
dysfunctions to immunotherapy. Nat Rev Immunol. 2013;13:862-74.
[10] Tolsma V, Schwebel C, Azoulay E, Darmon M, Souweine B, Vesin A, et al. Sepsis
severe or septic shock: outcome according to immune status and immunodeficiency profile.
Chest. 2014;146:1205-1213.
[11] Goronzy JJ, Weyand CM. Understanding immunosenescence to improve responses to
vaccines. Nat Immunol. 2013;14:428-36.
[12] Vallet H, Fali T, Sauce D. [Aging of the immune system: From fundamental to clinical
data]. Rev Med Interne. 2019;40:105-111.
168
[13] Hearps AC, Martin GE, Angelovich TA, Cheng W-J, Maisa A, Landay AL, et
al. Aging is associated with chronic innate immune activation and dysregulation of
monocyte phenotype and function. Aging Cell. 2012;11:867-75.
[14] Sauce D, Dong Y, Campillo-Gimenez L, Casulli S, Bayard C, Autran B, et al.
Reduced oxidative burst by primed neutrophils in the elderly individuals is associated
with increased levels of the CD16bright/CD62Ldim immunosuppressive subset. J
Gerontol A Biol Sci Med Sci. 2017;72:163-72.
[15] Naylor K, Li G, Vallejo AN, Lee W-W, Koetz K, Bryl E, et al. The influence of
age on T cell generation and TCR diversity. J Immunol Baltim Md 1950;
2005;174:7446-52.
[16] Johnson SA, Cambier JC. Ageing, autoimmunity and arthritis: senescence of th
eB cell compartment – implications for humoral immunity. Arthritis Res Ther.
2004;6:131-9.
[17] Xia S, Zhang X, Zheng S, Khanabdali R, Kalionis B, Wu J, et al. An update on
inflamm-aging: mechanisms, prevention, and treatment. J Immunol Res.
2016;2016:8426874.
[18] van Engelen TSR, Wiersinga WJ, Scicluna BP, van der Poll T. Biomarkers in
Sepsis. Crit Care Clin. 2018;34:139-152.
[19] Lemarié J, Gibot S. [Combining biomarkers to improve sepsis diagnosis in the
intensive care unit]. Réanimation. 2013.22:306-313.
[20] Ouedraogo R, Flaudrops C, Ben Amara A, Capo C, Raoult D, Mege JL. Global
analysis of circulating immune cells by matrix-assisted laser desorption ionization time-
of-flight mass spectrometry. PLoS One. 2010;5:e13691.
[21] Delaby A, Espinosa L, Lépolard C, Capo C, Mège JL. 3D reconstruction of
granulomas from transmitted light images implemented for long-time microscope
applications. J Immunol Methods. 2010; 360:10-9.
[22] Delaby A, Gorvel L, Espinosa L, Lépolard C, Raoult D, Ghigo E, et al. Defective
monocyte dynamics in Q fever granuloma deficiency. J Infect Dis. 2012; 205:1086-94.
[23] Parkin J, Cohen B. An overview of the immune system. Lancet. 2001;357:1777-
89.
[24] Medzhitov R, Janeway CA Jr. Innate immune induction of the adaptive immune
response. Cold Spring Harb Symp Quant Biol. 1999;64:429-35.
[25] Leadbetter EA, Rifkin IR, Hohlbaum AM, Beaudette BC, Shlomchik MJ,
Marshak- Rothstein A. Chromatin-IgG complexes activate B cells by dual engagement
of IgM and Toll-like receptors. Nat Immunol. 2002;416:603-7.
[26] Bach JF. The relation between the decrease of infectious diseases and the
increase of auto-immune and allergic diseases. N Engl J Med. 2002;347:911-20.
169
[27] Sattler S. The Role of the Immune System Beyond the Fight Against Infection.
Adv Exp Med Biol. 2017;1003:3-14.
[28] McKenzie AN, Spits H, Eberl G. Innate lymphoid cells in inflammation and
immunity. Immunity. 2014;41:366-74.
[29] Eberl G, Di Santo JP, Vivier E. The brave new world of innate lymphoid cells.
Nat Immunol.2015;16:1-5.
[30] Rus H, Cudrici C, Niculescu F. The role of the complement system in innate
immunity. Immunol Res. 2005;33:103-12.
[31] Garlanda C, Bottazzi B, Bastone A, Mantovani A. Pentraxins at the crossroads
between innate immunity, inflammation, matrix deposition, and female fertility. Annu
Rev Immunol. 2005;23:337-66.
[32] Peiser L, Mukhopadhyay S, Gordon S. Scavenger receptors in innate immunity.
Curr Opin Immunol. 2002;14:123-8.
[33] Cambi A, Figdor CG. Levels of complexity in pathogen recognition by C-type
lectins. Curr Opin Immunol. 2005;17:345-51.
[34] Takeda K, Kaisho T, Akira S. Toll-like receptors. Annu Rev Immunol.
2003;21:335-76.
[35] Girardin SE, Boneca IG, Carneiro LA, Antignac A, Jéhanno M, Viala J et al.
Nod1 detects a unique muropeptide from gram negative bacterial peptidoglycan.
Science. 2003;300:1584-7.
[36] Yoneyama M, Kikuchi M, Matsumoto K, Imaizumi T, Miyagishi M, Taira K et
al. Shared and unique functions of the DExD/H-box helicases RIG-I, MDA5, and LGP2
in antiviral innate immunity. J Immunol. 2005;175:2851-8.
[37] Casanova JL, Abel L, Quintana-Murci L. Human TLRs and IL-1Rs in Host
Defense : Natural Insights from Evolutionary, Epidemiological, and Clinical Genetics.
Annu Rev Immunol. 2011;29:447-491.
[38] Takeda K, Akira S. Toll-like receptors. Curr Protoc Immunol. 2015;109:14.12.1-
10.
[39] Lim JJ, Grinstein S, Roth Z. Diversity and Versatility of Phagocytosis: Roles in
Innate Immunity, Tissue Remodeling, and Homeostasis. Front Cell Infect Microbiol.
2017;7:191.
[40] Chalifour A, Jeannin P, Gauchat JF, et al. Direct bacterial protein PAMP
recognition by human NK cells involves TLRs and triggers alpha-defensin production.
Blood. 2004;104:1778-83.
170
[41] Waisman A, Lukas D, Clausen BE, Yogev N. Dendritic cells as gatekeepers of
tolerance. Semin Immunopathol. 2017;39:153-163.
[42] Zygmunt B., Veldhoen M. T helper cell differentiation more than just cytokines.
Advances in Immunology. 2011;109:159-196.
[43] Ivanova EA, Orekhov AN. T Helper Lymphocyte Subsets and Plasticity in
Autoimmunity and Cancer: An Overview. Biomed Res Int. 2015;2015:327470.
[44] Cui W, Kaech SM. Generation of effector CD8+ T cells and their conversion to
memory T cells. Immunol Rev. 2010;236:151-66.
[45] Kumaran Satyanarayanan S, El Kebir D, Soboh S, Butenko S, Sekheri M, Saadi
J, et al. IFN-β is a macrophage-derived effector cytokine facilitating the resolution of
bacterial inflammation. Nat Commun. 2019;10:3471.
[46] Clark RA. Resident memory T cells in human health and disease. Sci Transl
Med. 2015;7:269rv1.
[47] Rhodes A, Evans LE, Alhazzani W, Levy MM, Antonelli M, Ferrer R, et al.
Surviving Sepsis Campaign: international guidelines for management of sepsis and
septic shock: 2016. Intensive Care Med. 2017;43:304-77.
[48] Silvestre J, Póvoa P, Coelho L, Almeida E, Moreira P, Fernandes A, et al.Is C-
reactive protein a good prognostic marker in septic patients? Intensive Care Med.
2009;35:909-13.
[49] Luzzani A, Polati E, Dorizzi R, Rungatscher A, Pavan R, Merlini A. Comparison
of procalcitonin and C-reactive protein as markers of sepsis. Crit Care Med.
2003;3:1737-41.
[50] Wacker C, Prkno A, Brunkhorst FM, Schlattmann P. Procalcitonin as a
diagnostic marker for sepsis: a systematic review and meta-analysis. Lancet Infect Dis.
2013;13:426-35.
[51] Simon L, Gauvin F, Amre DK, Saint-Louis P, Lacroix J. Serum procalcitonin
and C-reactive protein levels as markers of bacterial infection: a systematic review and
meta-analysis. Clin Infect Dis. 2004;39:206617.
[52] Sakr Y, Burgett U, Nacul FE, Reinhart K, Brunkhorst F. Lipopolysaccharide
binding protein in a surgical intensive care unit: a marker of sepsis? Crit Care Med.
2008;36:2014-22.
[53] Wu Y, Wang F, Fan X, Bao R, Bo L, Li J, Deng X. Accuracy of plasma sTREM-
1 for sepsis diagnosis in systemic inflammatory patients: a systematic review and meta-
analysis. Crit Care. 2012;16:R229.
171
[54] Backes Y, van der Sluijs KF, Mackie DP, Tacke F, Koch A, Tenhunen JJ, et al.
Usefulness of suPAR as a biological marker in patients with systemic inflammation or
infection: a systematic review. Intensive Care Med. 2012;38:1418-28.
[55] Gibot S, Béné MC, Noel R, Massin F, Guy J, Cravoisy A, et al. Combination
biomarkers to diagnose sepsis in the critically ill patient. Am J Respir Crit Care Med.
2012;186:65-71.
[56] Kofoed K, Andersen O, Kronborg G, Tvede M, Petersen J, Eugen-Olsen J, et al.
Use of plasma C-reactive protein, procalcitonin, neutrophils, macrophage migration
inhibitory factor, soluble urokinase-type plasminogen activator receptor, and soluble
triggering receptor expressed on myeloid cells-1 in combination to diagnose infections:
a prospective study. Crit Care. 2007;11:R38.
[57] Scicluna BP, Klein Klouwenberg PM, van Vught LA, Wiewel MA, Ong DS,
Zwinderman AH, et al. A molecular biomarker to diagnose community-acquired
pneumonia on intensive care unit admission. Am J Respir Crit Care Med. 2015;192:826-
35.
[58] Miller RR, Lopansri BK, Burke JP, Levy M, Opal S, Rothman RE, et al.
Validation of a Host Response Assay, SeptiCyte LAB, for Discriminating Sepsis from
Systemic Inflammatory Response Syndrome in the ICU. Am J Respir Crit Care Med.
2018;198:903-13.
[59] Ephraim L. Tsalik, Ricardo Henao, Marshall Nichols, Thomas Burke, Emily R.
Ko, Micah T, et al. Host gene expression classifiers diagnose acute respiratory illness
etiology. Sci Transl Med. 2016;8:322ra11.
[60] Suarez NM, Bunsow E, Falsey AR, et al. Superiority of transcriptional profiling
over procalcitonin for distinguishing bacterial from viral lower respiratory tract
infections in hospitalized adults. J Infect Dis. 2015;212:213-22.
[61] Parnell GP, McLean AS, Booth DR, Armstrong NJ, Nalos M, Huang SJ, et al.
A distinct influenza infection signature in the blood transcriptome of patients with
severe community-acquired pneumonia. Crit Care. 2012;16:R157.
[62] Sweeney TE, Wong HR, Khatri P. Robust classification of bacterial and viral
infections via integrated host gene expression diagnostics. Sci translational Med.
2016;8:346ra91.
[63] Tang BMP, McLean AS, Dawes IW, Huang SJ, Cowley MJ, Lin RCY: Gene
expression profiling of gram-positive and gram-negative sepsis in critically ill patients.
Crit. Care Med. 2008.36:1125-28.
[64] Tang BMP, McLean AS, Dawes IW, Huang SJ, Lin RCY: Gene-expression
profiling of peripheral blood mononuclear cells in sepsis. Crit. Care Med. 2009;37:882-
88.
172
[65] Ludwig KR, Hummon AB. Mass spectrometry for the discovery of biomarkers
of sepsis. Mol Biosystems. 2017;13:648-64.
[66] Schmerler D, Neugebauer S, Ludewig K, Bremer-Streck S, Brunkhorst FM,
Kiehntopf M. Targeted metabolomics for discrimination of systemic inflammatory
disorders in critically ill patients. J Lipid Res. 2012;53:1369-75.
[67] Oved K, Cohen A, Boico O, Navon R, Friedman T, Etshtein L et al. A novel
host-proteome signature for distinguishing between acute bacterial and viral infections.
PLoS One. 2015;10:e0120012.
[68] Fenselau C, Demirev PA. Characterization of intact microorganisms by MALDI
mass spectrometry. Mass Spectrom Rev. 2001;20:157-71.
[69] Mann M, Hendrickson RC, Pandey A. Analysis of proteins and proteomes by
mass spectrometry. Annu Rev Biochem. 2001;70:437-73.
[70] Greco V, Piras C, Pieroni L, Ronci M, Putignani L, Roncada P, Urbani A.
Applications of MALDI-TOF mass spectrometry in clinical proteomics. Expert Rev
Proteomics. 2018;15:683-696.
[71] Schubert S, Kostrzewa M. MALDI-TOF MS in the Microbiology Laboratory:
Current Trends. Curr Issues Mol Biol. 2017;23:17-20.
[72] Clark AE, Kaleta EJ, Arora A, Wolk DM. Matrix-assisted laser desorption
ionization-time of flight mass spectrometry: a fundamental shift in the routine practice
of clinical microbiology. Clin Microbiol Rev. 2013;26:547-603.
[73] Keys CJ, Dare DJ, Sutton H, Wells G, Lunt M, McKenna T, et al. Compilation
of a MALDI-TOF mass spectral database for the rapid screening and characterisation
of bacteria implicated in human infectious diseases. Infect Genet Evol. 2004;4:221-42.
[74] Bright JJ, Claydon MA, Soufian M, Gordon DB. Rapid typing of bacteria using
matrix-assisted laser desorption ionisation Time of flight mass spectrometry and pattern
recognition software. J Microbiol Methods. 2002;48:127-38.
[75] Wolk DM, Clark AE. Matrix-Assisted Laser Desorption Time of Flight Mass
Spectrometry. Clin Lab Med. 2018;38:471-86.
[76] Ryzhov V, Fenselau C. Characterization of the protein subset desorbed by
MALDI from whole bacterial cells. Anal Chem. 2001;73:746-50.
[77] Holland RD, Duffy CR, Rafii F, Sutherland JB, Heinze TM, Holder CL, et al.
Identification of bacterial proteins observed in MALDI-TOF mass spectra from whole
cells. Anal Chem. 1999;71:3226-30.
173
[78] Seng P, Drancourt M, Gouriet F, La Scola B, Fournier PE, Rolain JM, et al.
Ongoing revolution in bacteriology: routine identification of bacteria by matrix-assisted
laser desorption ionization Time of flight mass spectrometry. Clin Infect Dis.
2009;49:543-51.
[79] Normand AC, Becker P, Gabriel F, Cassagne C, Accoceberry I, Gari-Toussaint
M, et al. Validation of a New Web Application for Identification of Fungi by Use of
Matrix-Assisted Laser Desorption Ionization–Time of Flight Mass Spectrometry. J Clin
Microbiol. 2017;55:2661-70.
[80] Neelja Singhal, Manish Kumar, Pawan K. Kanaujia, Jugsharan S. Virdi.
MALDI-TOF mass spectrometry: an emerging technology for microbial identification
and diagnosis. Front Microbiol. 2015;6:791.
[81] Barbara A. Body, Melodie A. Beard, E. Susan Slechta, Kimberly E. Hanson,
Adam P. Barker, N. Esther Babady, et al. Evaluation of the Vitek MS v3.0 Matrix-
Assisted Laser Desorption Ionization–Time of Flight Mass Spectrometry System for
Identification of Mycobacterium and Nocardia Species J Clin Microbiol. 2018;56:
e00237-18.
[82] Gautier M, Ranque S, Normand AC, Becker P, Packeu A, Cassagne C, et al.
Matrix-assisted laser desorption ionization time-of-flight mass spectrometry:
revolutionizing clinical laboratory diagnosis of mould infections. Clin Microbiol Infect.
2014;20:1366-71.
[83] Jamal W, Saleem R, Rotimi VO. Rapid identification of pathogens directly from
blood culture bottles by Bruker matrix-assisted laser desorption laser ionization time of
flight mass spectrometry versus routine methods. Diagn Microbiol Infect Dis.
2013;76:404-8.
[84] Clerc O, Prod'hom G, Vogne C, Bizzini A, Calandra T, Greub G. Impact of
matrix-assisted laser desorption ionization time-of-flight mass spectrometry on the
clinical management of patients with Gram-negative bacteremia: a prospective
observational study. Clin Infect Dis. 2013;:1101-7.
[85] Ferreira L, Sanchez-Juanes F, Gonzalez-Avila M, Cembrero-Fucinos D,
Herrero- Hernandez A, Gonzalez-Buitrago JM, et al. Direct identification of urinary
tract pathogens from urine samples by matrix-assisted laser desorption ionization time
of flight mass spectrometry. J Clin Microbiol. 2010;48:2110-5.
[86] Sánchez-Juanes F, Siller Ruiz M, Moreno Obregón F, Criado González M,
Hernández Egido S, de Frutos Serna M, et al. Pretreatment of urine samples with SDS
improves direct identification of urinary tract pathogens with matrix-assisted laser
desorption ionization-time of flight mass spectrometry. J Clin Microbiol. 2014;52:335-
8.
174
[87] Sparbier K, Schubert S, Weller U, Boogen C, Kostrzewa M. Matrix-assisted
laser desorption ionization time of flight mass spectrometry-based functional assay for
rapid detection of resistance against beta-lactam antibiotics. J Clin Microbiol.
2012;50:927-37.
[88] Hrabak J, Chudackova E, Walkova R. Matrix-assisted laser desorption
ionization time of flight (maldi-tof) mass spectrometry for detection of antibiotic
resistance mechanisms: from research to routine diagnosis. Clin Microbiol Rev.
2013;26:103-14.
[89] Alvarez-Buylla A, Picazo JJ, Culebras E. Optimized method for Acinetobacter
species carbapenemase detection and identification by matrix-assisted laser desorption
ionization time of flight mass spectrometry. J Clin Microbiol. 2013;51:1589-92.
[90] Griffin PM, Price GR, Schooneveldt JM, Schlebusch S, Tilse MH, Urbanski T,
et al. Use of matrix-assisted laser desorption ionization time of flight mass spectrom-
etry to identify vancomycin-resistant enterococci and investigate the epidemiology of
an outbreak. J Clin Microbiol. 2012;50:2918-31.
[91] Florio W, Tavanti A, Barnini S, Ghelardi E, Lupetti A. Recent Advances and
Ongoing Challenges in the Diagnosis of Microbial Infections by MALDI-TOF Mass
Spectrometry. J Biotechnol. 2014;184:84-93.
[92] Munteanu B, von Reitzenstein C, Hänsch GM, Meyer B, Hopf C. Sensitive,
robust and automated protein analysis of cell differentiation and of primary human
blood cells by intact cell MALDI mass spectrometry biotyping. Anal Bioanal Chem.
2012;404:2277-86.
[93] Povey JF, O'Malley CJ, Root T, Martin EB, Montague GA, Feary M, et al
Hanrieder. Rapid high-throughput characterisation, classification and selection of
recombinant mammalian cell line phenotypes using intact cell MALDI-ToF mass
spectrometry fingerprinting and PLS-DA modelling. J Biotechnol. 2014;184:84-93.
[94] Hanrieder J, Wicher G, Bergquist J, Andersson M, Fex-Svenningsen A. MALDI
mass spectrometry based molecular phenotyping of CNS glial cells for prediction in
mammalian brain tissue. Anal Bioanal Chem. 2011;401:135-47.
[95] Karger A, Bettin B, Lenk M, Mettenleiter TC. Rapid characterisation of cell
cultures by matrix-assisted laser desorption/ionisation mass spectrometric typing. J
Virol Methods. 2010;164:116-21.
[96] Labas V, Teixeira-Gomes AP, Bouguereau L, Gargaros A, Spina L, Marestaing
A, et al. Intact cell MALDI-TOF mass spectrometry on single bovine oocyte and
follicular cells combined with top-down proteomics: A novel approach to characterise
markers of oocyte maturation. J Proteomics. 2018;175:56-74.
175
[97] Schwamb S, Munteanu B, Meyer B, Hopf C, Hafner M, Wiedemann P.
Monitoring CHO cell cultures: cell stress and early apoptosis assessment by mass
spectrometry. J Biotechnol. 2013;168:452-61.
[98] Maurer K, Eschrich K, Schellenberger W, Bertolini J, Rupf S, Remmerbach TW.
Oral brush biopsy analysis by MALDI-ToF Mass Spectrometry for early cancer
diagnosis. Oral Oncol. 2013;49:152-6.
[99] Amann JM, Chaurand P, Gonzalez A, Mobley JA, Massion PP, Carbone DP, et
al. Selective profiling of proteins in lung cancer cells from fine-needle aspirates by
matrix-assisted laser desorption ionization time-of-flight mass spectrometry. Clin
Cancer Res. 2006;12:5142-50.
[100] Dong H, Shen W, Cheung MT, Liang Y, Cheung HY, Allmaier G, Kin-Chung
Au O, Lam YW. Rapid detection of apoptosis in mammalian cells by using intact cell
MALDI mass spectrometry. Analyst. 2011;136:5181-9.
[101] Kober SL, Meyer-Alert H, Grienitz D, Hollert H, Frohme M. Intact cell mass
spectrometry as a rapid and specific tool for the differentiation of toxic effects in cell-
based ecotoxicological test systems. Anal Bioanal Chem. 2015;407:7721-31.
[102] Chiu NH, Jia Z, Diaz R, Wright P. Rapid differentiation of in vitro cellular
responses to toxic chemicals by using matrix-assisted laser desorption/ionization time-
of-flight mass spectrometry. Environ Toxicol Chem. 2015;34:161-6.
[103] Munteanu B, Meyer B, von Reitzenstein C, Burgermeister E, Bog S, Pahl A, et
al. Label-free in situ monitoring of histone deacetylase drug target engagement by
matrix-assisted laser desorption ionization-mass spectrometry biotyping and imaging.
Anal Chem. 2014;86:4642-7.
[104] Feng HT, Wong NS, Sim LC, Wati L, Ho Y, Lee MM. Rapid characterization
of high/low producer CHO cells using matrix-assisted laser desorption/ionization time-
of-flight. Rapid Commun Mass Spectrom. 2010;24:1226-30.
[105] Feng HT, Sim LC, Wan C, Wong NS, Yang Y. Rapid characterization of protein
productivity and production stability of CHO cells by matrix-assisted laser
desorption/ionization time-of-flight mass spectrometry.Rapid Commun Mass
Spectrom. 2011;25:1407-12.
[106] Pagán AJ, Ramakrishnan L. The Formation and Function of Granulomas. Annu
Rev Immunol. 2018;36:639-65.
[107] Peyron P, Vaubourgeix J, Poquet Y, Levillain F, Botanch C, Bardou F, et al.
Foamy macrophages from tuberculous patients' granulomas constitute a nutrient-rich
reservoir for M. tuberculosis persistence. PLoS Pathog. 2008;4:e1000204.
176
[108] Crawford CL, Hardwicke PM. Experimental leprosy: a model of epithelioid cell
granuloma. Int J Dermatol. 2011;50:255-61.
[109] Helming L, Gordon S. Molecular mediators of macrophage fusion. Trends Cell
Biol. 2009;19:514-22.
[110] Puissegur MP, Lay G, Gilleron M, Botella L, Nigou J, Marrakchi H, et al.
Mycobacterial lipomannan induces granuloma macrophage fusion via a TLR2-
dependent, ADAM9- and beta1 integrin-mediated pathway. J Immunol. 2007;178:3161-
9.
[111] Lay G, Poquet Y, Salek-Peyron P, Puissegur MP, Botanch C, Bon H, et al.
Langhans giant cells from M. tuberculosis-induced human granulomas cannot mediate
mycobacterial uptake. J Pathol. 2007;211:76-85.
[112] Milde R, Ritter J, Tennent GA, et al. Multinucleated giant cells are specialized
for complement-mediated phagocytosis and large target destruction. Cell Rep.
2015;13:19376-8.
[113] Ordway D, Higgins DM, Sanchez-Campillo J, Spencer JS, Henao-Tamayo M,
Harton M, et al. XCL1 (lymphotactin) chemokine produced by activated CD8 T cells
during the chronic stage of infection with Mycobacterium tuberculosis negatively
affects production of IFN-gamma by CD4 T cells and participates in granuloma
stability. J Leukoc Biol. 2007;82:1221-9.
[114] Yap G, Cheever A, Caspar P, Jankovic D, Sher A. Unimpaired down-modulation
of the hepatic granulomatous response in CD8 T-cell- and gamma interferon-deficient
mice chronically infected with Schistosoma mansoni. Infect Immun. 1997;65:2583-6.
[115] Co DO, Hogan LH, Il-Kim S, Sandor M. T cell contributions to the different
phases of granuloma formation. Immunol Lett. 2004;92:135-42.
[116] Saunders BM, Frank AA, Orme IM, Cooper AM. CD4 is required for the
development of a protective granulomatous response to pulmonary tuberculosis. Cell
Immunol. 2002;216:65-72.
[117] Grencis RK. Immunity to helminths: resistance, regulation, and susceptibility to
gastrointestinal nematodes. Annu Rev Immunol. 2015;33:201-25.
[118] Tubo NJ, Jenkins MK. CD4+ T Cells: guardians of the phagosome. Clin
Microbiol Rev. 2014;27:200-13.
[119] Silva DAAD, Silva MVD, Barros CCO, Alexandre PBD, Timóteo RP, Catarino
JS, et al. TNF-α blockade impairs in vitro tuberculous granuloma formation and down
modulate Th1, Th17 and Treg cytokines. PLoS One. 2018;13:e0194430.
177
[120] Saunders BM, Britton WJ. Life and death in the granuloma: immunopathology
of tuberculosis. Immunol Cell Biol. 2007;85:103-11.
[121] Lammas DA, De Heer E, Edgar JD, Novelli V, Ben-Smith A, Baretto R, et al.
Heterogeneity in the granulomatous response to mycobacterial infection in patients with
defined genetic mutations in the interleukin 12-dependent interferon-gamma production
pathway. Int J Exp Pathol. 2002;83:1-20.
[122] Deknuydt F, Roquilly A, Cinotti R, Altare F, Asehnoune K. An in vitro model
of mycobacterial granuloma to investigate the immune response in brain-injured
patients. Crit Care Med. 2013 Jan;41(1):245-54.
[123] Mège JL, Mehraj V, Capo C. Macrophage polarization and bacterial infections.
Curr Opin Infect Dis. 2011;24:230-4.
[124] Portevin D, Pflüger V, Otieno P, Brunisholz R, Vogel G, Daubenberger C.
Quantitative whole-cell MALDI-TOF MS fingerprints distinguishes human monocyte
sub-populations activated by distinct microbial ligands. BMC Biotechnol. 2015;15:24.
[125] Million M, Lepidi H, Raoult D. Q fever: current diagnosis and treatment options.
Med Mal Infect. 2009;39:82-94
[126] Raoult D, Marrie T, Mege J. Natural history and pathophysiology of Q fever.
Lancet Infect Dis. 2005;5:219-26
[127] Fournier PE, Marrie TJ, Raoult D. Diagnosis of Q fever. J Clin Microbiol.
1998;36:1823-34.
[128] Fenollar F, Fournier PE, Carrieri MP, Habib G, Messana T, Raoult D. Risks
factors and prevention of Q fever endocarditis. Clin Infect Dis. 2001;33:312-6.
[129] Salgame P, Geadas C, Collins L, Jones-López E, Ellner JJ. Latent tuberculosis
infection--Revisiting and revising concepts. Tuberculosis (Edinb). 2015;95:373-84.
[130] Annane D, Bellissant E, Cavaillon JM. Septic shock. Lancet. 2005;365:63-78.
[131] Hotchkiss RS, Coopersmith CM, McDunn JE, Ferguson TA. The sepsis seesaw:
tilting toward immunosuppression. Nat Med. 2009;15:496-7.
[132] Zeni F, Freeman B, Natanson C. Anti-inflammatory therapies to treat sepsis and
septic shock: a reassessment. Crit Care Med. 1997;25:1095-100.
[133] Monneret G, Venet F, Pachot A, et al. Monitoring immune dysfunctions in the
septic patient: a new skin for the old ceremony. Mol Med. 2008;14:64-78.
[134] Pawelec G, Gupta S. Editorial: Immunology of Aging. Front Immunol.
2019;10:1614.
178
[135] Martin GS, Mannino DM, Moss M. The effect of age on the development and
outcome of adult sepsis. Crit Care Med. 2006;34:15-21.
[136] Delano MJ, Ward PA. The immune system’s role in sepsis progression, resolution, and long-term outcome. Immunol Rev. 2016;274:330-53.
[137] Luethy PM, Johnson JK. The Use of Matrix-Assisted Laser
Desorption/Ionization Time-of-Flight Mass Spectrometry (MALDI-TOF MS) for the
Identification of Pathogens Causing Sepsis. J Appl Lab Med. 2019;3:675-85.
[138] Oviaño M, Bou G. Matrix-Assisted Laser Desorption Ionization-Time of Flight
Mass Spectrometry for the Rapid Detection of Antimicrobial Resistance Mechanisms
and Beyond. Clin Microbiol Rev. 2018;32.
[139] Petricoin EF, Ardekani AM, Hitt BA, Levine PJ, Fusaro VA, Steinberg SM et
al. Use of proteomic patterns in serum to identify ovarian cancer. Lancet 2002 ; 359 :
572-7.
[140] Koopmann J, Zhang Z, White N, Rosenzweig J, Fedarko N, Jagannath S et al.
Serum diagnosis of pancreatic adenocarcinoma using surface-enhanced laser desorption
and ionization mass spectrometry.Clin Cancer Res 2004 ; 10 : 860-8.
[141] Vlahou A, Laronga C, Wilson L, Gregory B, Fournier K, McGaughey D et al. A
novel approach toward development of a rapid blood test for breast cancer.Clin Breast
Cancer 2003 ; 4 : 203-9.
[142] Diamandis EP. Mass spectrometry as a diagnostic and a cancer biomarker
discovery tool : opportunities and potential limitations.Mol Cell Proteomics 2004 ; 3 :
367-78.
[143] De Rosa SC, Roederer M. Eleven-color flow cytometry. A powerful tool for
elucidation of the complex immune system. Clin Lab Med. 2001;21:697-712.
[144] Lawrence WG, Varadi G, Entine G, Podniesinski E, Wallace PK. Enhanced red
and near infrared detection in flow cytometry using avalanche photodiodes. Cytometry
A. 2008;73:767-76.
[145] Bandura DR, Baranov VI, Ornatsky OI, et al. Mass cytometry: technique for real
time single cell multitarget immunoassay based on inductively coupled plasma time-of-
flight mass spectrometry. Anal Chem 2009 ; 81 : 6813–6822.
[146] McHugh L, Seldon TA, Brandon RA, Kirk JT, Rapisarda A, Sutherland AJ, et
al. A Molecular Host Response Assay to Discriminate Between Sepsis and Infection-
Negative Systemic Inflammation in Critically Ill Patients: Discovery and Validation in
Independent Cohorts. PLoS Med. 2015;12:e1001916.
179
[147] Davenport EE, Burnham KL, Radhakrishnan J, Humburg P, Hutton P, Mills TC
et al. Genomic landscape of the individual host response and outcomes in sepsis: a
prospective cohort study. Lancet Respir Med. 2016;4:259-71.
[148] Mezouar S, Diarra I, Roudier J, Desnues B, Mege JL. Tumor Necrosis Factor-
Alpha Antagonist Interferes with the Formation of Granulomatous Multinucleated Giant
Cells: New Insights Into Mycobacterium tuberculosis Infection. Front Immunol.
2019;10:1947.
[149] Silva DAAD, Silva MVD, Barros CCO, Alexandre PBD, Timóteo RP, Catarino
JS et al.TNF-α blockade impairs in vitro tuberculous granuloma formation and down modulate Th1, Th17 and Treg cytokines. PLoS One. 2018;13:e0194430.
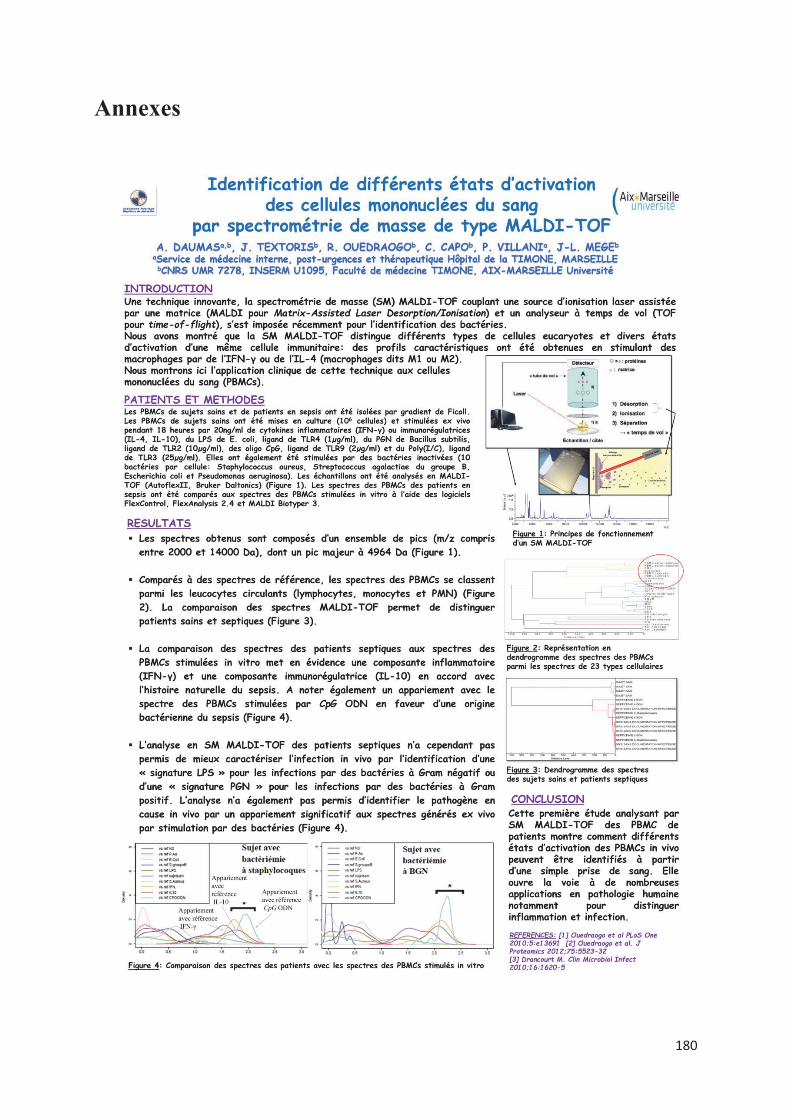
180
Annexes
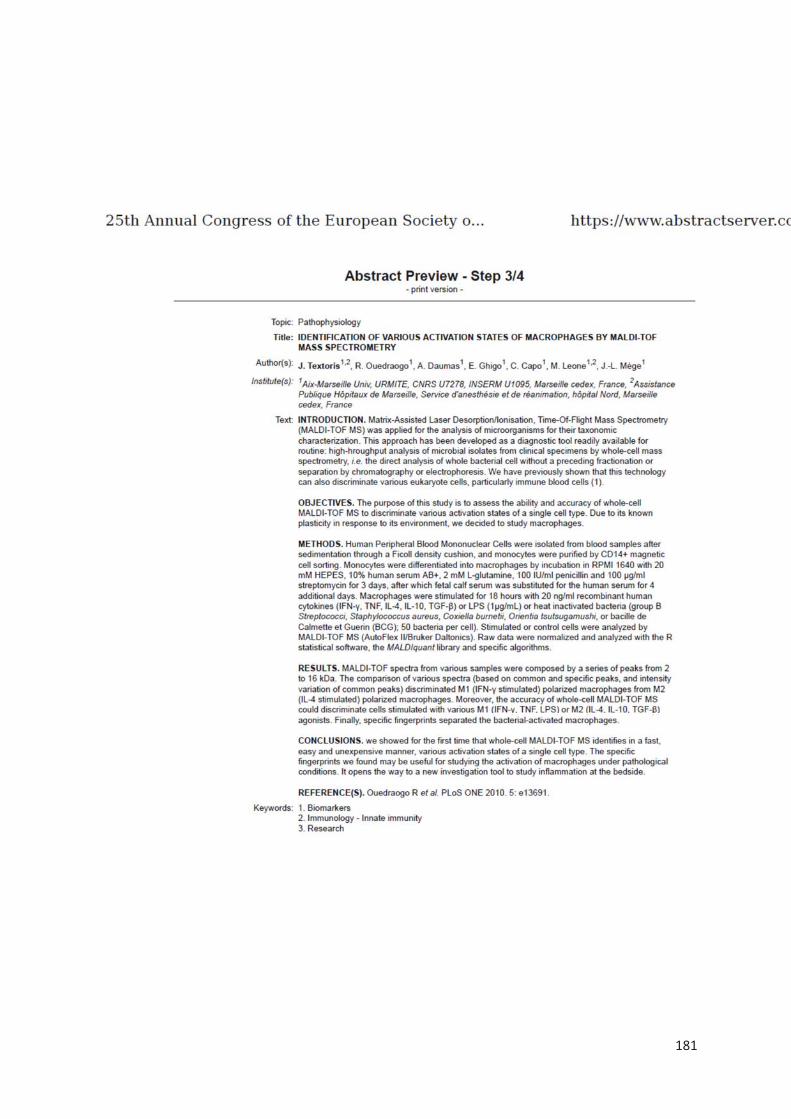
181
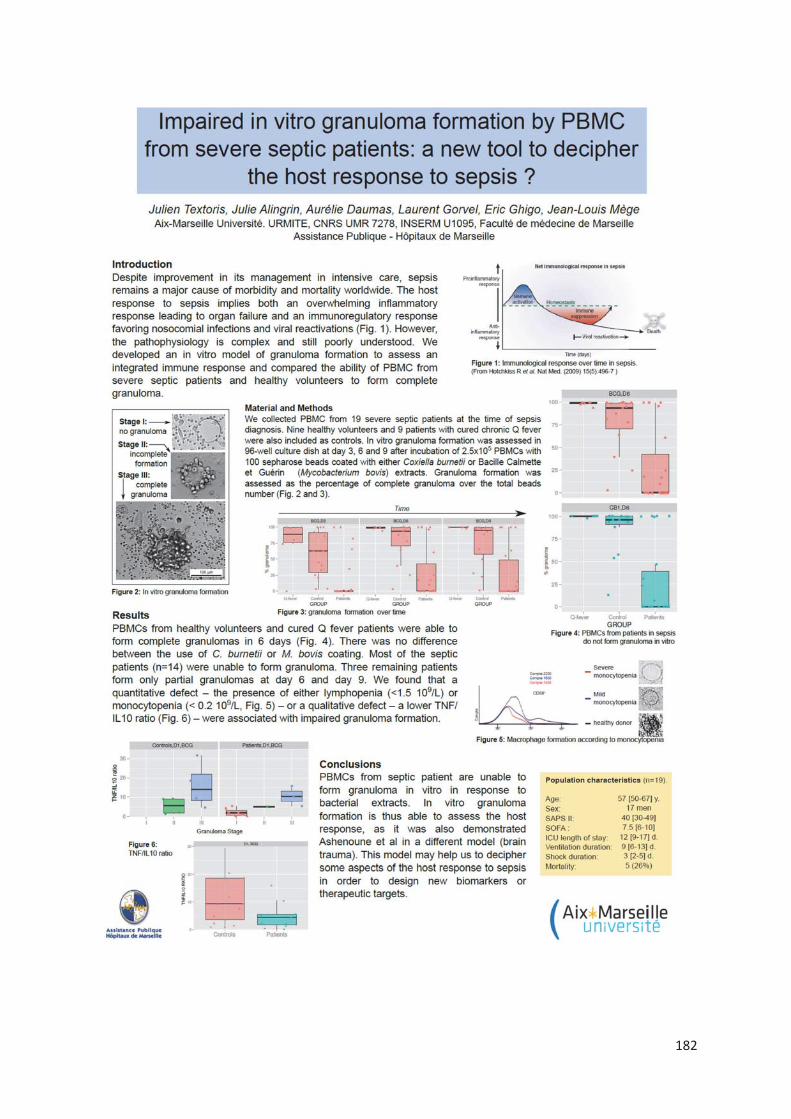
182
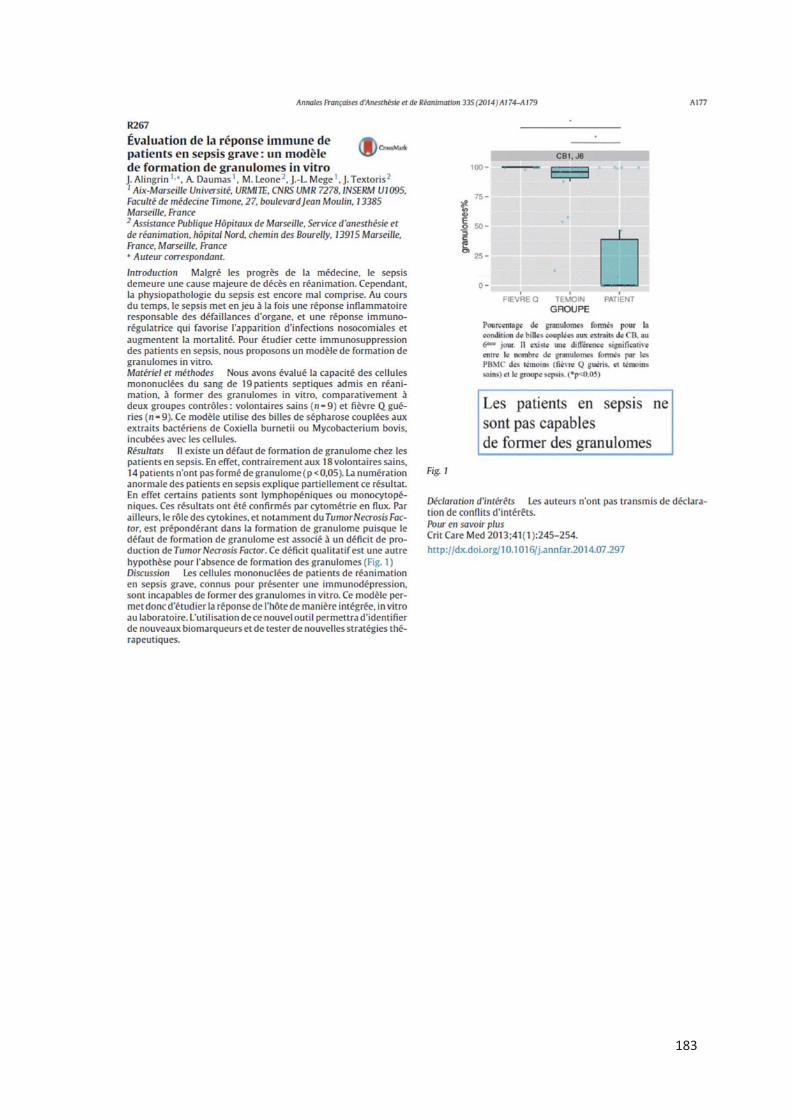
183
184
185
186
Résumé
Introduction : Le sepsis constitue une des principales causes de mortalité tant en médecine
ambulatoire qu’en milieu hospitalier notamment dans la population gériatrique. Un diagnostic précoce ainsi que l’identification de la gravité du tableau sont les 2 principaux éléments
nécessaires pour une prise en charge rapide, optimale, synonyme d’amélioration du pronostic. La réalité clinique est qu’il est souvent difficile d’affirmer le caractère infectieux de la réaction inflammatoire systémique observée et que malgré l’amélioration des techniques
microbiologiques, jusqu’à 40% des infections ne sont pas documentées.
Patients et méthodes : Nous avons utilisé la spectrométrie de masse MALDI-TOF, outil de
routine pour l’identification des micro-organismes pour identifier un profil de réponse
spécifique des PBMCs à une agression infectieuse. Cette approche pourrait ainsi apporter une
aide au clinicien pour orienter la prise en charge du patient avant même l’identification
microbiologique. Nous nous sommes également intéressés à la formation in vitro de
granulomes, structures organisées de la réponse immunitaire, comme moyen d’exploration de l’immunodépression du patient en sepsis sévère et de la personne âgée infectée, à risque d’infections nosocomiales.
Résultats : Nous avons identifié des signatures spécifiques chez les cellules mononucléées
stimulées in vitro par des agonistes M1, des cytokines M2 ou différentes bactéries. La
comparaison de spectres de patients en sepsis sévère avec ou sans documentation
microbiologique avec les spectres des PBMCs stimulés in vitro a ensuite mis en évidence chez
tous les patients une signature spectrale de type Interleukine IL-10 et Interféron IFN- ainsi
qu’une signature spectrale oligodésoxynucléotides CPG (CpG ODN) suggérant une étiologie
bactérienne. L’évaluation in vitro de la formation de granulomes a permis de mettre en évidence
un défaut de formation de granulomes chez les patients septiques quel que soient leur âge. Pour
expliquer ce défaut, les patients en sepsis sévère ne formant pas de granulome présentaient des
numérations de monocytes et de lymphocytes diminuées. Chez la personne âgée, une
dénutrition était retrouvée chez les patients ne formant pas de granulome. Un déficit en TNF
sans augmentation de l’IL-10 associé à un défaut de différenciation des macrophages en cellules
épithélioides et en cellules géantes multinucléées sont retrouvés en cas de défaut de formation
de granulomes.
Discussion
La spectrométrie de masse MALDI-TOF par son approche de caractérisation cellulaire par
« profiling » à partir de l’analyse directe des cellules entières présente de nombreux avantages
car elle requiert très peu de préparation des échantillons cellulaires et aucune extraction ou
séparation préalable des biomolécules. Elle est extrêmement sensible et reproductible. Malgré
les limites de nos travaux, la spectrométrie de masse pourrait permettre de distinguer un SIRS
en lien avec une pathologie inflammatoire ou infectieuse ou encore d’aider le clinicien dans un contexte de SIRS non infectieux à dépister l’apparition d’une complication infectieuse avant même la clinique et l’identification d’un micro-organisme sur des prélèvements. La mesure de
la formation in vitro de granulomes pourrait quant à elle permettre d’évaluer le degré
d’immunosuppression et servir à monitorer la réponse immune en réponse à un traitement.
D’autres études sont nécessaires pour comprendre les différents mécanismes impliqués dans le
défaut de formation des cellules géantes multinucléées.
Conclusion : La réponse de l’hôte à l’infection est complexe. Son exploration nécessite des approches combinées afin de permettre une personnalisation des thérapeutiques dans le cadre
du suivi des patients.
187
Summary
Introduction: Sepsis is a major cause of mortality in both outpatient medicine and hospitals,
especially in the geriatric population. Early diagnosis and identification of the severity of the
picture are crucial to ensuring swift and optimal management, which is synonymous with a
better prognosis. However, the clinical reality is that it is often hard to confirm the infectious
nature of the systemic inflammatory response syndrome observed and that, despite advances in
microbiological techniques, up to 40% of infections are not documented.
Patients and methods: We used MALDI-TOF mass spectrometry, a routine method for the
identification of microorganisms, to identify a specific response profile of PBMCs to infectious
aggression. This approach could be used to help clinicians determine patient treatment even
before microbiological identification. We also investigated the in vitro formation of
granulomas–organized structures formed as an immune response–to explore
immunodepression in patients with severe sepsis and infected elderly subjects susceptible to
nosocomial infections.
Results: We identified specific signatures in monocytes stimulated in vitro by M1 agonists, M2
cytokines or various bacteria. The comparison of the spectra of patients with severe sepsis (with
or without microbiological evaluation) with the spectra of PBMCs stimulated in vitro
highlighted an Interleukin IL-10 and Interferon IFN- -type spectral signature in all the patients
as well as a CpG oligodeoxyribonucleotide (CpG-ODN) spectral signature, thus indicating a
bacterial etiology. The assessment of granuloma formation in vitro highlighted the absence of
granuloma formation in patients with sepsis regardless of their age. The lower monocyte and
leukocyte counts in patients with severe sepsis not forming granulomas could explain this
defect. In elderly subjects, malnutrition was observed in patients not forming granulomas. A
TNF deficiency without an increase in IL-10 associated with defective differentiation of
macrophages into epithelioid cells and multinuclear giant cells was observed in cases of
defective granuloma formation.
Discussion
The direct analysis of whole cells using MALDI-TOF mass spectrometry profiling offers
numerous advantages as it requires very little sample preparation and no prior extraction or
separation of the biomolecules. Furthermore, this technique is extremely sensitive and
reproducible. Despite the limitations of our research, mass spectrometry could help distinguish
SIRS associated with an inflammatory or infectious condition or even help the clinician in cases
of non-infectious SIRS to detect the onset of an infectious complication even before the
appearance of any clinical signs or the identification of the microorganism. The assessment of
granuloma formation in vitro could be used to determine the degree of immunosuppression and
to monitor the immune response to therapy. Further studies are necessary to understand the
different mechanisms involved in the defective formation of multinuclear giant cells.
Conclusion: The host response to infection is complex and its exploration requires the use of
combined methods to personalize therapy within the context of patient follow-up.

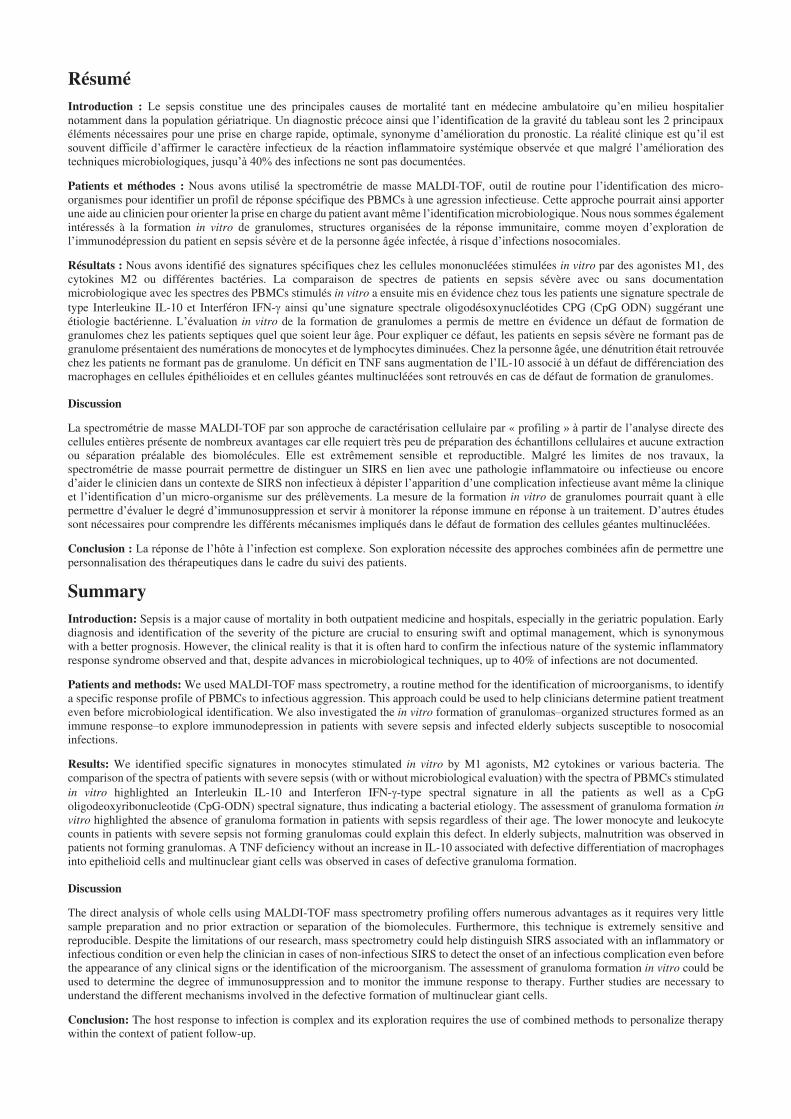
Résumé
Introduction : Le sepsis constitue une des principales causes de mortalité tant en médecine ambulatoire qu’en milieu hospitalier
notamment dans la population gériatrique. Un diagnostic précoce ainsi que l’identification de la gravité du tableau sont les 2 principaux
éléments nécessaires pour une prise en charge rapide, optimale, synonyme d’amélioration du pronostic. La réalité clinique est qu’il est
souvent difficile d’affirmer le caractère infectieux de la réaction inflammatoire systémique observée et que malgré l’amélioration des
techniques microbiologiques, jusqu’à 40% des infections ne sont pas documentées.
Patients et méthodes : Nous avons utilisé la spectrométrie de masse MALDI-TOF, outil de routine pour l’identification des micro-
organismes pour identifier un profil de réponse spécifique des PBMCs à une agression infectieuse. Cette approche pourrait ainsi apporter
une aide au clinicien pour orienter la prise en charge du patient avant même l’identification microbiologique. Nous nous sommes également
intéressés à la formation in vitro de granulomes, structures organisées de la réponse immunitaire, comme moyen d’exploration de
l’immunodépression du patient en sepsis sévère et de la personne âgée infectée, à risque d’infections nosocomiales.
Résultats : Nous avons identifié des signatures spécifiques chez les cellules mononucléées stimulées in vitro par des agonistes M1, des
cytokines M2 ou différentes bactéries. La comparaison de spectres de patients en sepsis sévère avec ou sans documentation
microbiologique avec les spectres des PBMCs stimulés in vitro a ensuite mis en évidence chez tous les patients une signature spectrale de
type Interleukine IL-10 et Interféron IFN- ainsi qu’une signature spectrale oligodésoxynucléotides CPG (CpG ODN) suggérant une
étiologie bactérienne. L’évaluation in vitro de la formation de granulomes a permis de mettre en évidence un défaut de formation de
granulomes chez les patients septiques quel que soient leur âge. Pour expliquer ce défaut, les patients en sepsis sévère ne formant pas de
granulome présentaient des numérations de monocytes et de lymphocytes diminuées. Chez la personne âgée, une dénutrition était retrouvée
chez les patients ne formant pas de granulome. Un déficit en TNF sans augmentation de l’IL-10 associé à un défaut de différenciation des
macrophages en cellules épithélioides et en cellules géantes multinucléées sont retrouvés en cas de défaut de formation de granulomes.
Discussion
La spectrométrie de masse MALDI-TOF par son approche de caractérisation cellulaire par « profiling » à partir de l’analyse directe des
cellules entières présente de nombreux avantages car elle requiert très peu de préparation des échantillons cellulaires et aucune extraction
ou séparation préalable des biomolécules. Elle est extrêmement sensible et reproductible. Malgré les limites de nos travaux, la
spectrométrie de masse pourrait permettre de distinguer un SIRS en lien avec une pathologie inflammatoire ou infectieuse ou encore
d’aider le clinicien dans un contexte de SIRS non infectieux à dépister l’apparition d’une complication infectieuse avant même la clinique
et l’identification d’un micro-organisme sur des prélèvements. La mesure de la formation in vitro de granulomes pourrait quant à elle
permettre d’évaluer le degré d’immunosuppression et servir à monitorer la réponse immune en réponse à un traitement. D’autres études
sont nécessaires pour comprendre les différents mécanismes impliqués dans le défaut de formation des cellules géantes multinucléées.
Conclusion : La réponse de l’hôte à l’infection est complexe. Son exploration nécessite des approches combinées afin de permettre une
personnalisation des thérapeutiques dans le cadre du suivi des patients.
Summary
Introduction: Sepsis is a major cause of mortality in both outpatient medicine and hospitals, especially in the geriatric population. Early
diagnosis and identification of the severity of the picture are crucial to ensuring swift and optimal management, which is synonymous
with a better prognosis. However, the clinical reality is that it is often hard to confirm the infectious nature of the systemic inflammatory
response syndrome observed and that, despite advances in microbiological techniques, up to 40% of infections are not documented.
Patients and methods: We used MALDI-TOF mass spectrometry, a routine method for the identification of microorganisms, to identify
a specific response profile of PBMCs to infectious aggression. This approach could be used to help clinicians determine patient treatment
even before microbiological identification. We also investigated the in vitro formation of granulomas–organized structures formed as an
immune response–to explore immunodepression in patients with severe sepsis and infected elderly subjects susceptible to nosocomial
infections.
Results: We identified specific signatures in monocytes stimulated in vitro by M1 agonists, M2 cytokines or various bacteria. The
comparison of the spectra of patients with severe sepsis (with or without microbiological evaluation) with the spectra of PBMCs stimulated
in vitro highlighted an Interleukin IL-10 and Interferon IFN- -type spectral signature in all the patients as well as a CpG
oligodeoxyribonucleotide (CpG-ODN) spectral signature, thus indicating a bacterial etiology. The assessment of granuloma formation in
vitro highlighted the absence of granuloma formation in patients with sepsis regardless of their age. The lower monocyte and leukocyte
counts in patients with severe sepsis not forming granulomas could explain this defect. In elderly subjects, malnutrition was observed in
patients not forming granulomas. A TNF deficiency without an increase in IL-10 associated with defective differentiation of macrophages
into epithelioid cells and multinuclear giant cells was observed in cases of defective granuloma formation.
Discussion
The direct analysis of whole cells using MALDI-TOF mass spectrometry profiling offers numerous advantages as it requires very little
sample preparation and no prior extraction or separation of the biomolecules. Furthermore, this technique is extremely sensitive and
reproducible. Despite the limitations of our research, mass spectrometry could help distinguish SIRS associated with an inflammatory or
infectious condition or even help the clinician in cases of non-infectious SIRS to detect the onset of an infectious complication even before
the appearance of any clinical signs or the identification of the microorganism. The assessment of granuloma formation in vitro could be
used to determine the degree of immunosuppression and to monitor the immune response to therapy. Further studies are necessary to
understand the different mechanisms involved in the defective formation of multinuclear giant cells.
Conclusion: The host response to infection is complex and its exploration requires the use of combined methods to personalize therapy
within the context of patient follow-up.


