Embed Size (px)
Citation preview
Acid catalysis using zirconia-supported Keggin
heteropoly acids
A thesis submitted to the
UNIVERSITY OF PUNE
for the degree of
DOCTOR OF PHILOSOPHY
(in Chemistry)
BY
Biju M. Devassy
CATALYSIS DIVISION NATIONAL CHEMICAL LABORATORY
PUNE- 411008 INDIA
September 2005
CERTIFICATE
Certified that the work incorporated in the thesis, “Acid catalysis using zirconia-
supported Keggin heteropoly acids” submitted by Mr. Biju M. Devassy, for the
Degree of Doctor of Philosophy, was carried out by the candidate under my supervision
in the Catalysis Division, National Chemical Laboratory, Pune - 411008, India. Materials
obtained from other sources have been duly acknowledged in the thesis.
Dr. S. B. Halligudi (Research Supervisor)

Dedicated to… My Parents and Brothers
ACKNOWLEDGEMENTS
It is my great pleasure to express my heartfelt gratitude to my research supervisor,
Dr. S. B. Halligudi, for his unending support and invaluable guidance throughout the
period of this investigation. I sincerely thank him for the care and affection that I received
from him in the entire period.
I am very much grateful to Dr. Rajiv Kumar, Head, Catalysis and Inorganic
Chemistry Division, NCL, who is very kind and generous towards me and his help is
gratefully acknowledged.
I am also grateful to Dr. S. Sivasanker and Dr. A. V. Ramaswamy, former Heads
of the Division for their support and help during the period of my research work.
I acknowledge the friendly and cooperative attitude of all scientific staff of our
Division. I would like to thank Dr. S. G. Hegde, Dr. A. J. Chandwadkar, Dr. Veda
Ramaswamy, Dr. A. P. Singh, Dr. M. K. Dongare, Dr. D. Srinivas, Dr. C. V. V.
Satyanarayana, Dr. C. S. Gopinath, Dr. S. P. Mirajkar, Dr. R. A. Shaikh, Dr. P.
Manikandan, Dr. S. A. Pardhy, Dr. Seema Deshpande, Dr. Belhekar, Dr. Awate, Dr. T.
Raja, Dr. Selvaraj, Dr. S. Umbarkar, Dr. A. K. Kinage, Mr. V. V. Bokade, Ms. Violet
Samuel, Mrs. Nalini Jacob, Ms. Agashe, Mr. S. C. Jha, and Mr. Purushothaman for their
valuable help and cooperation in completing my research work successfully.
I also thank Dr. C. Gopinathan, Dr. Sarada Gopinathan, Dr. P. A. Joy and Dr.
Vijayamohanan for their help on various occasions. I would like to acknowledge the help
received from Mr. Madhu, Mr. Kashinathan, Mr. Milind and Mr. Katti.
I sincerely thank my labmates Dr. Tressa (and family), Dhanashri, Shanbhag,
Ankur, Suman, Nevin, Suresh and Nicola Toma for their friendly help and kind
cooperation during the period of my work. I also thank all my friends in the division and
in NCL for their help and support in one way or other, which made my work much easier.
My special thanks are due to Mr. Rajeeve Antony, Dr. K. Sreekumar, and Dr. T.
M. Jyothi for their whole-hearted help.
I would like to thank my friends Dr. Shiju, Dr. Thomas, Shylesh, Surendran, Dr.
Jolly, Dr. Sreejith, Dr. Sureshan, Rajesh, Dr. Shivasankar, Dr. Pradeep Pallan, Rajsankar,
Sajeev, Santhosh, Hari, Dr. Muthu, Jainy, Sebastian, Dr. Kala and family for their all
kind of help extended to me. Their company provided me joyful moments during the stay
in Pune.
I would like to thank all my teachers in various classes for the love and
encouragement that I received from them. I take this occasion to thank all my classmates
till M.Tech course, whose cooperative attitude helped me very much. Also, I thank all
well-wishers and friends, whose names are not mentioned here.
I would like to thank Dr. S. Sivaram, Director, NCL and Dr. P. Ratnasamy
(former Director, NCL) for allowing me to carryout the research work at NCL and CSIR,
New Delhi, India, for the financial support in the form of senior research fellowship.
(Biju M. Devassy)
Contents
1. Introduction
1.1. Introduction 1
1.2. Structure of heteropoly compounds in the solid state 3
1.2.1. Primary structure 3
1.2.2. Secondary structure 4
1.2.3. Tertiary structure 6
1.3. Synthesis 7
1.4. Stability of heteropoly acids 7
1.5. Characterization 8
1.5.1. Infrared spectroscopy 8
1.5.2. Raman spectroscopy 8
1.5.3. NMR spectroscopy 8
1.5.4. Electronic spectroscopy 9
1.6. Homogeneous reactions 9
1.6.1. Hydration of olefins 10
1.6.2. Biphasic reactions 10
1.7. Heterogeneous catalysis 11
1.7.1. Surface-type catalysis 11
1.7.2. Bulk-type (I) catalysis 11
1.7.3. Bulk-type (I1) catalysis 12
1.8. Acid and redox properties 13
1.8.1. Acidic properties 13
1.8.2. Redox properties 13
1.9. Supported heteropolyacids 14
1.10. Heterogeneous acid-catalyzed reactions 16
1.11. Oxidation reactions 16
1.12. Zirconia as a catalyst and a catalyst support 18
1.13. Zirconia based solid acids 19
1.13.1. Sulfated zirconia 19
1.13.2. Tungstated zirconia 20
1.14. Scope of the thesis 21
1.15. References 24
2. Preparation and characterization of zirconia-supported heteropoly
acid catalysts
2.1. Introduction 30
2.2. Catalyst preparation 30
2.3. Catalyst characterization – Theory and experimental procedure 31
2.3.1. Surface area measurement by BET method 31
2.3.2. X-ray diffraction 32
2.3.3. Raman spectroscopy 33
2.3.4. Thermal analysis 34
2.3.5. X-ray photoelectron spectroscopy 34
2.3.6. Temperature programmed techniques: TPD of ammonia 36
2.3.7. Infrared adsorption studies - Pyridine adsorption 36
2.3.8. Diffuse reflectance UV-visible spectroscopy 37
2.3.9. 31P solid-state nuclear magnetic resonance spectroscopy 38
2.3. References 40
3. Zirconia-supported silicotungstic acid
3.1. Introduction 41
3.2. Preparation 41
3.3. Characterization - Results and discussion 41
3.3.1. Surface area 41
3.3.2. X-ray diffraction 42
3.3.3. Raman spectroscopy 44
3.3.4. Differential thermal analysis 45
3.3.5. X-ray photoelectron spectroscopy 47
3.3.6. TPD of NH3 48
3.3.7. FTIR pyridine adsorption 49
3.3.8. Diffuse-reflectance UV-visible spectroscopy 51
3.4. Veratrole benzoylation 54
3.4.1. Introduction 54
3.4.2. Experimental procedure 54
3.4.3. Results and discussion 55
3.5. Phenol tert-butylation 60
3.5.1. Introduction 60
3.5.2. Experimental procedure 60
3.5.3. Results and discussion 61
3.5.3.1. Effect of STA loading 61
3.5.3.2 Effect of calcination temperature 63
3.5.3.3. Effect of reaction temperature 64
3.5.3.4. Effect of molar ratio 65
3.5.3.5. Effect of space velocity 67
3.5.3.6. Effect of time on stream 68
3.6. References 70
4. Zirconia-supported phosphotungstic acid
4.1. Introduction 73
4.2. Preparation 73
4.3. Characterization - Results and discussion 73
4.3.1. Surface area 73
4.3.2. X-ray diffraction 74
4.3.3. Thermal analysis 76
4.3.4. FTIR pyridine adsorption 77
4.3.5. TPD of NH3 78
4.3.6. 31P MAS NMR spectroscopy 80
4.4. Alkylation of benzene 84
4.4.1. Introduction 84
4.4.2. Experimental procedure 85
4.4.3. Results and discussion 85
4.5. 2-Methoxynaphthalene acylation 90
4.5.1. Introduction 90
4.5.2. Experimental procedure 91
4.5.3. Results and discussion 91
4.6. Comparison of the activities of 15 SZ-750 and 15 PZ-750
catalysts
94
4.7. References 98
5. Zirconia-supported phosphomolybdic acid
5.1. Introduction 101
5.2. Preparation 101
5.3. Catalyst characterization - Results and discussion 101
5.3.1. X-ray diffraction 101
5.3.2. 31P MAS NMR spectroscopy 103
5.3.3. FTIR pyridine adsorption 105
5.4. Alkylation of benzene 106
5.4.1. Results and discussion 106
5.5. Phenol tert-butylation 109
5.5.1. Results and discussion 109
5.5.1.1. Effect of PMA loading 109
5.5.1.2. Effect of calcination temperature 110
5.5.1.3. Effect of reaction temperature 111
5.5.1.4. Effect of molar ratio 112
5.5.1.5. Effect of space velocity 113
5.5.1.6. Effect of time on stream 114
5.6. References 116
6. Summary and conclusions 117
ABSTRACT
Heteropoly acids (HPAs) are a unique class of materials active in both acid and redox catalysis. These are polyoxometallates made up of heteropoly anions having metal-oxygen octahedra as the basic structural unit. HPAs can be used either directly as a bulk material or in supported form. The use in supported form is preferable because of its high surface area compared to the bulk material (5-8 m2g-1) and better accessibility of reactants to the active sites. Acidic or neutral solids, which interact weakly with HPAs such as silica, active carbon and acidic ion-exchange resin, have been reported to be suitable as HPA supports. However, heteropoly acids on these conventional supports are not highly stable in polar reaction media and part of the reaction can occur due to homogeneous catalysis. Serious problems associated with this type of materials are their susceptibility to deactivation during organic reactions due to the formation of carbonaceous deposit (coke) on the catalyst surface. The thermal stability of HPAs is not high enough to carry out conventional regeneration by burning coke at 500-550 oC, as routinely used in the case of zeolites and aluminosilicates. Thus the preparation of an active and stable HPA in supported form is essential in order to utilize fully the potential of these materials as catalysts.
This thesis describes the preparation, characterization and catalytic evaluation of
zirconia-supported Keggin heteropoly acids such as silicotungstic acid, phosphotungstic
acid and phosphomolybdic acid. The present work showed that heteropoly tungstic acids
such as silicotungstic acid and phosphotungstic acid supported on zirconia acts as
efficient and stable solid acid catalysts, while heteropoly molybdic acid such as
phosphomolybdic acid supported on zirconia leaches to the reaction medium in presence
of polar reactants.
Key words: Zirconia; Heteropoly acids; Silicotungstic acid; Phosphotungstic acid;
Phosphomolybdic acid; Acid catalysis; Alkylation; Acylation
Chapter 1
Introduction
1.1. Introduction Heteropolyacids (HPAs) are hydrogen forms of heteropolyanions produced by the
condensation of more than two kinds of oxoanions. HPAs have several advantages as
catalysts, which make them economically and environmentally attractive. On the one
hand, HPAs have a very strong Brönsted acidity; on the other, they are efficient
oxidants under rather mild conditions. HPAs have a very high solubility in polar
solvents and fairly high thermal stability in the solid state. These properties render
HPAs potentially promising acid, redox, and bifunctional catalysts in homogeneous
as well as in heterogeneous systems. HPAs are widely used as model systems for
fundamental research, providing unique opportunities for mechanistic studies on the
molecular level. The catalytic function of heteropoly compounds has attracted much
attention in recent years and design of the catalyst is possible at atomic or molecular
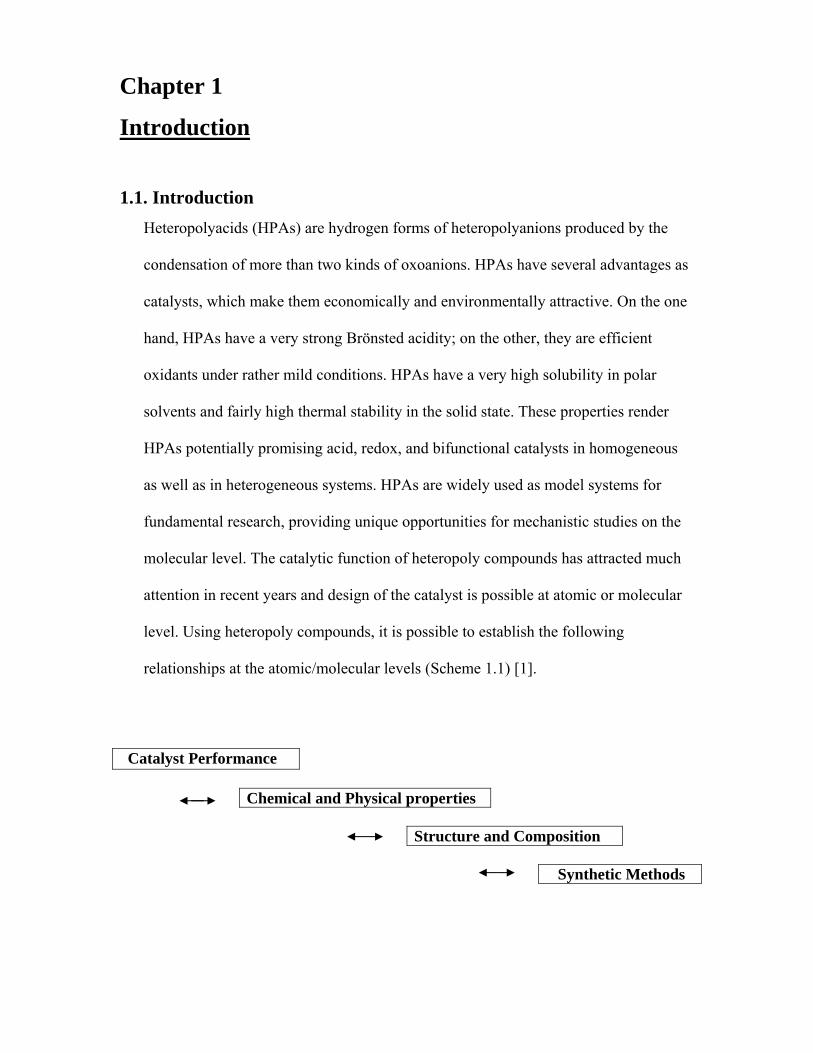
level. Using heteropoly compounds, it is possible to establish the following
relationships at the atomic/molecular levels (Scheme 1.1) [1].
Catalyst Performance
Chemical and Physical properties
Structure and Composition
Synthetic Methods
Scheme 1.1
The elucidation of catalytic processes is also possible at the atomic/molecular
level due to their molecular nature. The reason why heteropoly acid catalysts are
attractive is their variety and high potential as catalyst. The characteristic advantages of
HPA catalysts [2] are listed in Table 1.1.
Table 1.1: Advantages of heteropoly catalysts
1. Catalyst design at atomic/molecular levels based on the following:
1-1. Acidic and redox properties
These two important properties of catalysis can be controlled by choosing
appropriate constituent elements (type of polyanion, addenda atom, hetero
atom, counter cation etc.).
1-2. Multifunctionality
Acid-redox, acid-base, multi-electron transfer, photosensitivity, etc
1-3. Tertiary structure, bulk-type behavior, etc., for solid state
These are well controlled by countercations
2. Molecularity-Metal oxide cluster
2-1. Molecular design of the catalysts
2-2. Cluster models of mixed oxide catalysts and relationships between solid
and solution catalysts
2-3. Description of catalytic properties at atomic/molecular levels
Spectroscopic study and stoichiometry are realistic
3. Unique reaction field
3-1. Bulk type catalysis
“Pseudoliquid” and bulk type II behavior provide unique three-dimensional
reaction environments for catalysis
3-2. Pseudoliquid behavior
This makes spectroscopic stoichiometric studies feasible and realistic
3-3. Phase-transfer catalysis
3-4. Shape selectivity
4. Unique basicity of polyanion
4-1. Selective coordination and stabilization of reaction intermediates in
solution and in pseudoliquid phase, and possibility also on the surface
4-2. Ligands and supports for metals and organometallics
1.2. Structure of heteropoly compounds in the solid state
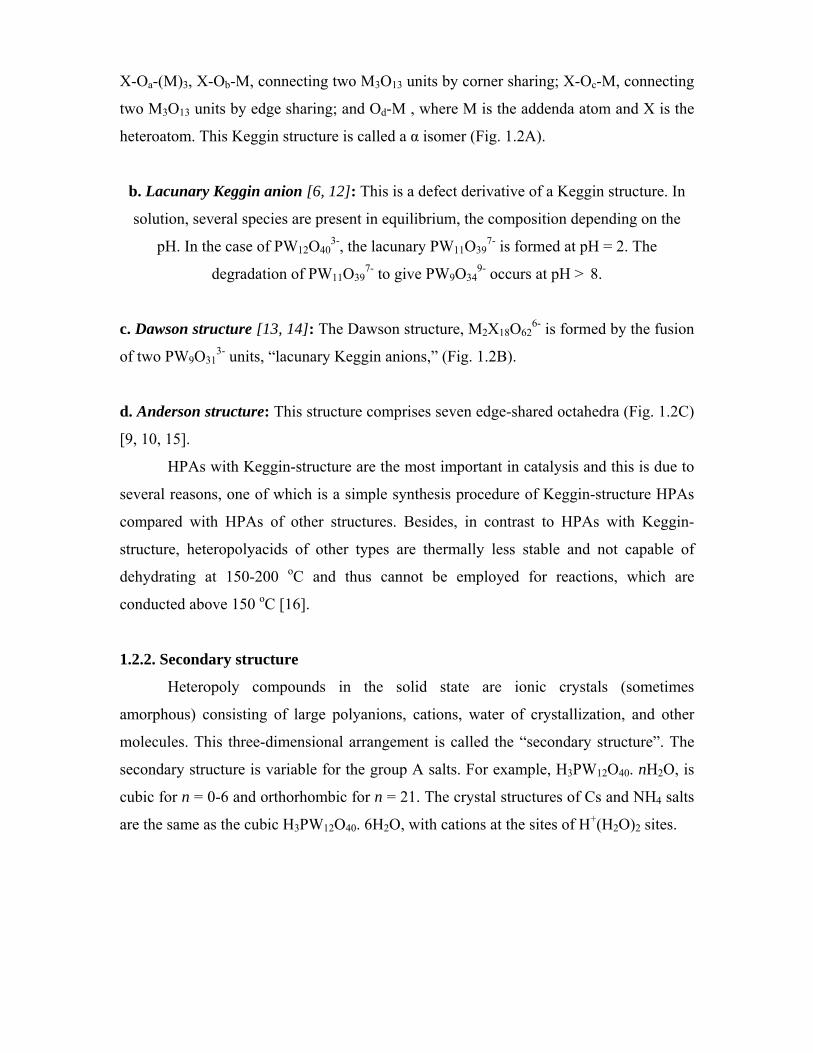
In solid state, HPAs show hierarchic structure [2, 3]. The structure divided into three
levels – primary, secondary and tertiary as exemplified in Fig. 1.1.
1.2.1. Primary structure
The structure of a heteropolyanion or polyoxoanion molecule itself is called a
primary structure [4]. In solution, heteropolyanions are present in the unit of the primary
structure, being coordinated with solvent molecules and/or protonated. Based on primary
structure, different polyoxoanion structures exist.
a. Keggin structure [5-11]: Keggin structures are anionic metal-oxygen cluster
compounds having the molecular formula XM12O40, where “X” is a central, tetrahedrally
coordinated atom connecting twelve peripheral, octahedrally coordinated “M” metal
atoms. Berzelius synthesized the first Keggin structure (ammonium 12-
molybdophosphate) in 1826, Marignac determined the analytical composition in 1862,
and Keggin correctly deduced its geometry based on powder X-ray diffraction patterns in
1933. The acid and salt forms of the structure have proven to be industrially important:
as ion-exchange materials; as analytical reagents for the determination of environmental
contaminant concentrations; as protein precipitants; and as catalysts.
The ideal Keggin structure of the α type has Td symmetry and consists of a central
XO4 tetrahedron (X = heteroatoms or central atom, most commonly SiIV, PV, or GeIV)
surrounded by twelve MO6 octahedra (M = addenda atom, most commonly Mo or W).
The twelve MO6 octahedra comprise four groups of three edge-shared octahedra, the
M3O13 triplet, which have a common oxygen vertex connected to the central heteroatom.
The oxygen atoms in this structure fall into four classes of symmetry-equivalent oxygens:
X-Oa-(M)3, X-Ob-M, connecting two M3O13 units by corner sharing; X-Oc-M, connecting
two M3O13 units by edge sharing; and Od-M , where M is the addenda atom and X is the
heteroatom. This Keggin structure is called a α isomer (Fig. 1.2A).
b. Lacunary Keggin anion [6, 12]: This is a defect derivative of a Keggin structure. In
solution, several species are present in equilibrium, the composition depending on the
pH. In the case of PW12O403-, the lacunary PW11O39
7- is formed at pH = 2. The
degradation of PW11O397- to give PW9O34
9- occurs at pH > 8.
c. Dawson structure [13, 14]: The Dawson structure, M2X18O626- is formed by the fusion
of two PW9O313- units, “lacunary Keggin anions,” (Fig. 1.2B).
d. Anderson structure: This structure comprises seven edge-shared octahedra (Fig. 1.2C)
[9, 10, 15].
HPAs with Keggin-structure are the most important in catalysis and this is due to
several reasons, one of which is a simple synthesis procedure of Keggin-structure HPAs
compared with HPAs of other structures. Besides, in contrast to HPAs with Keggin-
structure, heteropolyacids of other types are thermally less stable and not capable of
dehydrating at 150-200 oC and thus cannot be employed for reactions, which are
conducted above 150 oC [16].
1.2.2. Secondary structure
Heteropoly compounds in the solid state are ionic crystals (sometimes
amorphous) consisting of large polyanions, cations, water of crystallization, and other
molecules. This three-dimensional arrangement is called the “secondary structure”. The
secondary structure is variable for the group A salts. For example, H3PW12O40. nH2O, is
cubic for n = 0-6 and orthorhombic for n = 21. The crystal structures of Cs and NH4 salts
are the same as the cubic H3PW12O40. 6H2O, with cations at the sites of H+(H2O)2 sites.
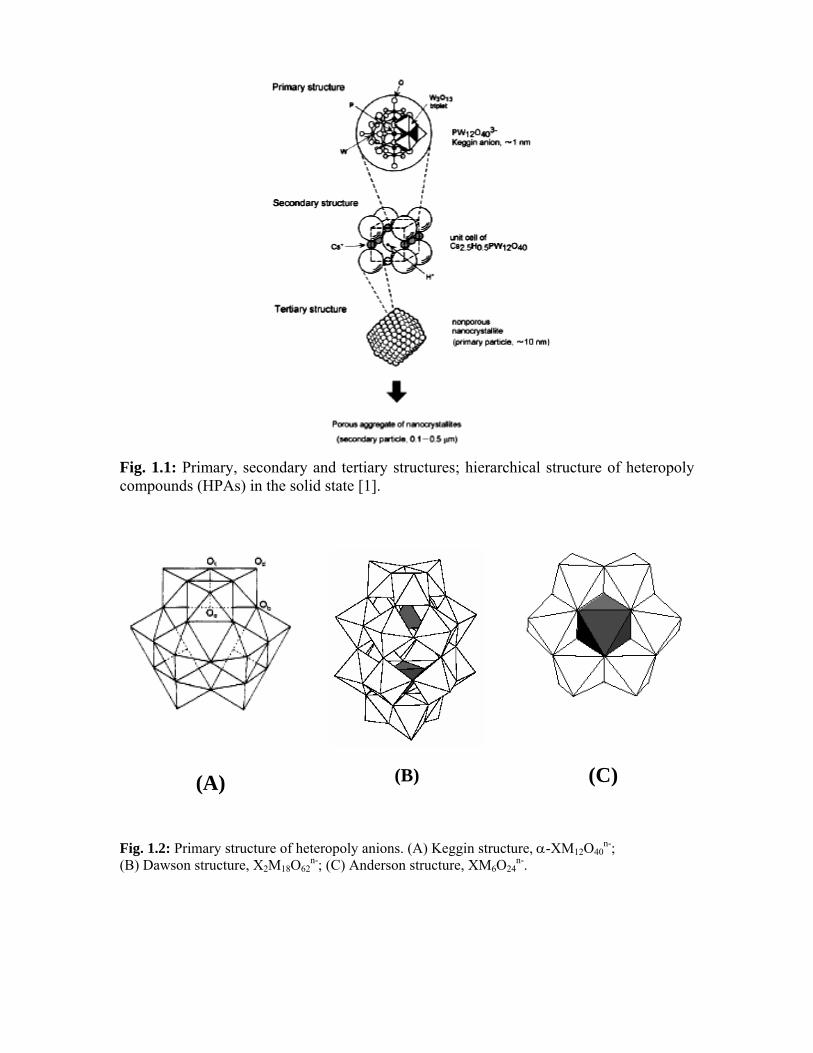
Fig. 1.1: Primary, secondary and tertiary structures; hierarchical structure of heteropoly compounds (HPAs) in the solid state [1].
(A)
(B)
(C)
Fig. 1.2: Primary structure of heteropoly anions. (A) Keggin structure, α-XM12O40n-;
(B) Dawson structure, X2M18O62n-; (C) Anderson structure, XM6O24
n-.
Proton structure
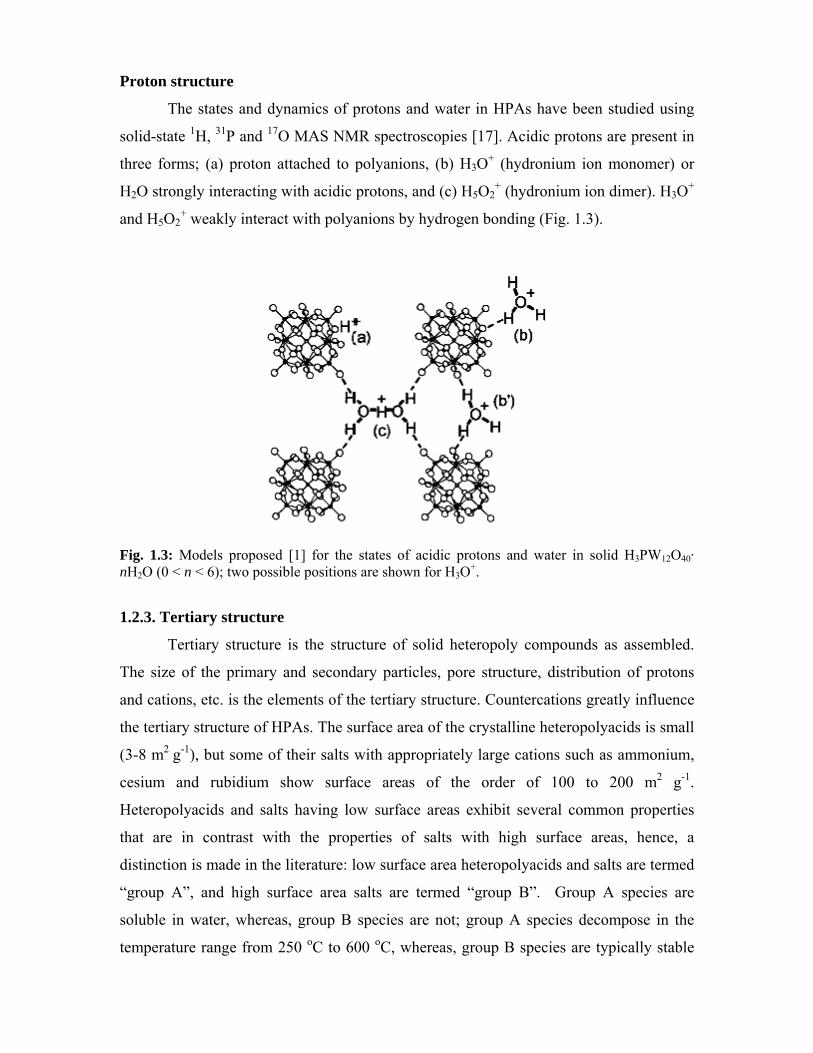
The states and dynamics of protons and water in HPAs have been studied using
solid-state 1H, 31P and 17O MAS NMR spectroscopies [17]. Acidic protons are present in
three forms; (a) proton attached to polyanions, (b) H3O+ (hydronium ion monomer) or
H2O strongly interacting with acidic protons, and (c) H5O2+ (hydronium ion dimer). H3O+
and H5O2+ weakly interact with polyanions by hydrogen bonding (Fig. 1.3).
Fig. 1.3: Models proposed [1] for the states of acidic protons and water in solid H3PW12O40· nH2O (0 < n < 6); two possible positions are shown for H3O+.
1.2.3. Tertiary structure
Tertiary structure is the structure of solid heteropoly compounds as assembled.
The size of the primary and secondary particles, pore structure, distribution of protons
and cations, etc. is the elements of the tertiary structure. Countercations greatly influence
the tertiary structure of HPAs. The surface area of the crystalline heteropolyacids is small
(3-8 m2 g-1), but some of their salts with appropriately large cations such as ammonium,
cesium and rubidium show surface areas of the order of 100 to 200 m2 g-1.
Heteropolyacids and salts having low surface areas exhibit several common properties
that are in contrast with the properties of salts with high surface areas, hence, a
distinction is made in the literature: low surface area heteropolyacids and salts are termed
“group A”, and high surface area salts are termed “group B”. Group A species are
soluble in water, whereas, group B species are not; group A species decompose in the
temperature range from 250 oC to 600 oC, whereas, group B species are typically stable
up to 700°C and above; and group A species exhibit interesting properties ascribed to a
“pseudo-liquid” phase, whereas, group B species do not.
1.3. Synthesis
The simplest way to prepare heteropolyanions involves the acidification of an
aqueous solution containing the oxoanions and the heteroatom [5, 18-22].
12 WO42- + HPO4
2- + 23 H+ [PW12O40]3- + 12 H2O
Control of the pH and X/M (central atom/addenda atom) ratio is necessary in
order to obtain the desired structure, i.e., the Keggin HPA, the Wells-Dawson HPA, the
Anderson HPA, a lacunary compound or the desired specific isomer. Free acids are
synthesized primarily by following two methods: (1) by extraction with ether from
acidified aqueous solutions and (2) by ion exchange from salts of heteropoly acids.
1.4. Stability of heteropoly acids Two important types of stabilities associated with heteropolyacids are: thermal
stability and hydrolytic stability in solution [2, 4]. The solution stability of HPA depends
on pH of the solution [23]. The thermal stability is measured mainly by X-ray diffraction
(XRD), thermal gravimetric analysis, and differential thermal analysis (TG-DTA)
experiments, where the exothermic peak in DTA estimates the decomposition
temperature. Results from TG and DTA shows the presence of two types of water in
heteropoly compounds, i.e., water of crystallization and “constitutional water molecules”
[24]. Loss of former occurs at temperature below 200 oC. The constitutional water
molecules (acidic protons bound to the oxygen of the polyanion) are lost at temperature
exceeding 270 oC for H3PMo12O40 or 350 oC for H3PW12O40. The thermal stability of
hydrogen forms of HPAs changes with heteroatom, polyatom, and polyanion structure as
follows: H3PW12O40 > H4SiW12O40 > H3PMo12O40 > H4SiMo12O40, while hydrolytic
stability follow the order: H4SiW12O40 > H3PW12O40 > H4SiMo12O40 > H3PMo12O40 [5,
25, 26]. The decomposition of HPAs causes the loss of their acidity. However, thermally
decomposed molybdenum HPAs becomes reconstructed under exposure to water [27].
1.5. Characterization The most important techniques used for characterizing heteropolyacids and the
informations obtained are:
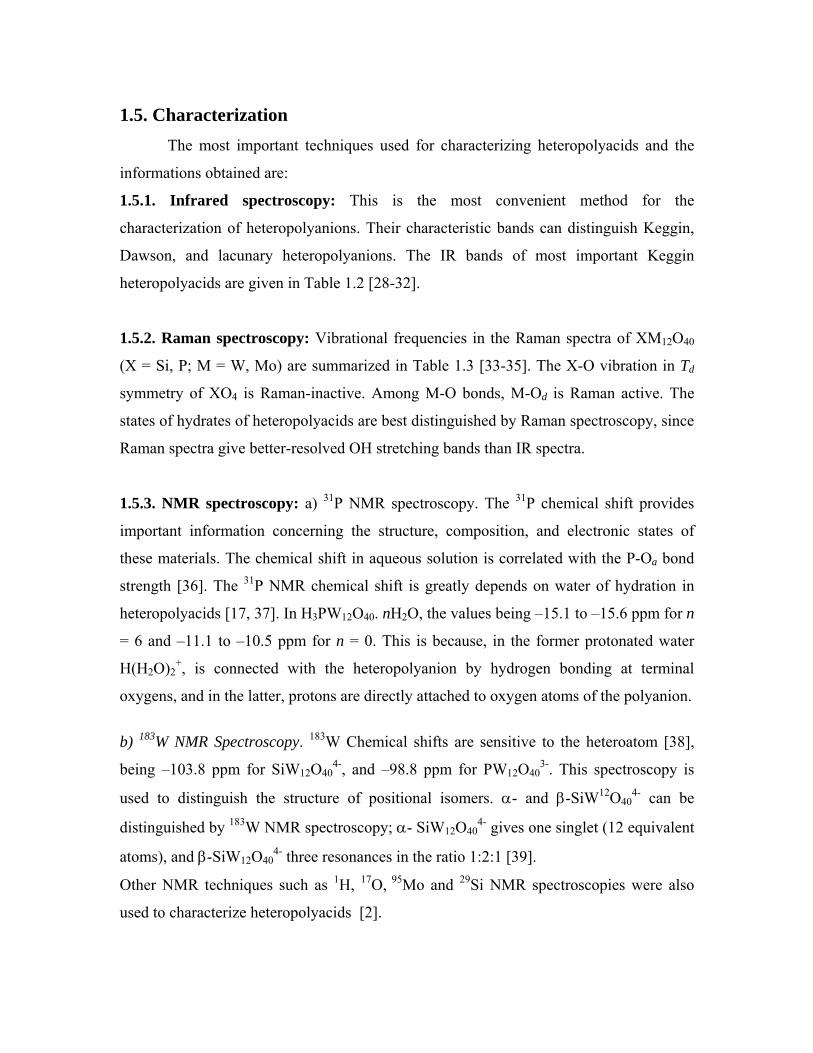
1.5.1. Infrared spectroscopy: This is the most convenient method for the
characterization of heteropolyanions. Their characteristic bands can distinguish Keggin,
Dawson, and lacunary heteropolyanions. The IR bands of most important Keggin
heteropolyacids are given in Table 1.2 [28-32].
1.5.2. Raman spectroscopy: Vibrational frequencies in the Raman spectra of XM12O40
(X = Si, P; M = W, Mo) are summarized in Table 1.3 [33-35]. The X-O vibration in Td
symmetry of XO4 is Raman-inactive. Among M-O bonds, M-Od is Raman active. The
states of hydrates of heteropolyacids are best distinguished by Raman spectroscopy, since
Raman spectra give better-resolved OH stretching bands than IR spectra.
1.5.3. NMR spectroscopy: a) 31P NMR spectroscopy. The 31P chemical shift provides
important information concerning the structure, composition, and electronic states of
these materials. The chemical shift in aqueous solution is correlated with the P-Oa bond
strength [36]. The 31P NMR chemical shift is greatly depends on water of hydration in
heteropolyacids [17, 37]. In H3PW12O40. nH2O, the values being –15.1 to –15.6 ppm for n
= 6 and –11.1 to –10.5 ppm for n = 0. This is because, in the former protonated water
H(H2O)2+, is connected with the heteropolyanion by hydrogen bonding at terminal
oxygens, and in the latter, protons are directly attached to oxygen atoms of the polyanion.
b) 183W NMR Spectroscopy. 183W Chemical shifts are sensitive to the heteroatom [38],
being –103.8 ppm for SiW12O404-, and –98.8 ppm for PW12O40
3-. This spectroscopy is
used to distinguish the structure of positional isomers. α- and β-SiW12O404- can be
distinguished by 183W NMR spectroscopy; α- SiW12O404- gives one singlet (12 equivalent
atoms), and β-SiW12O404- three resonances in the ratio 1:2:1 [39].
Other NMR techniques such as 1H, 17O, 95Mo and 29Si NMR spectroscopies were also
used to characterize heteropolyacids [2].
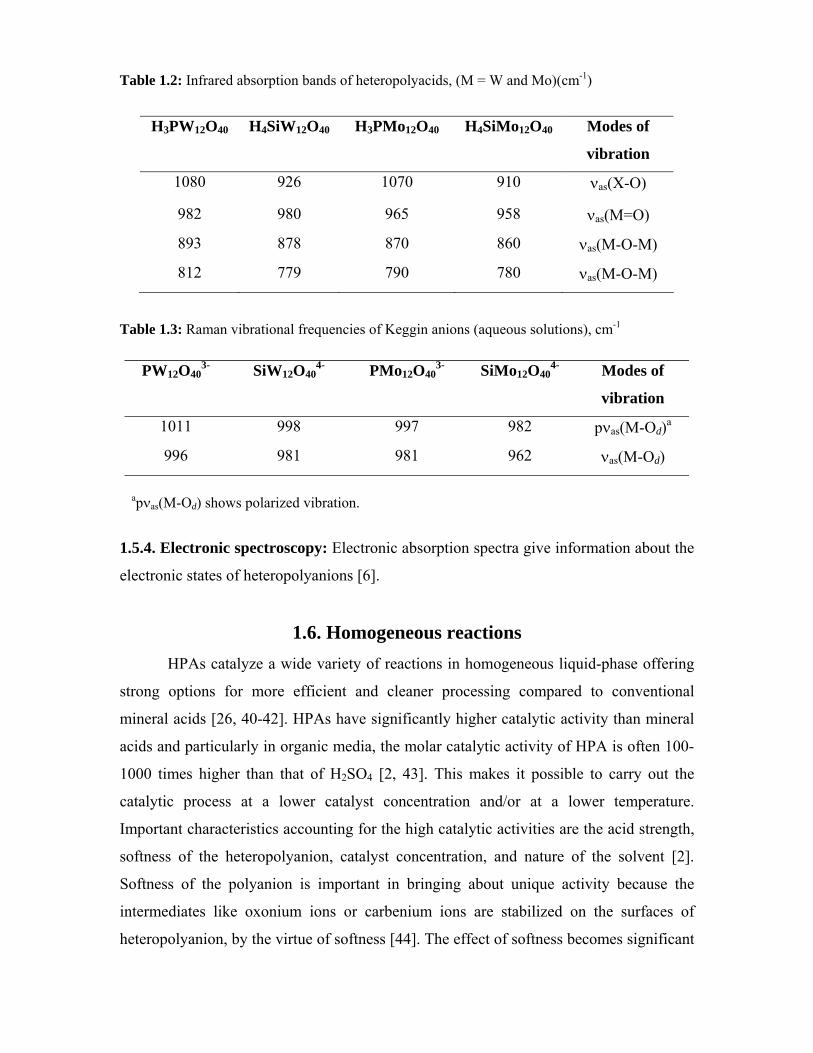
Table 1.2: Infrared absorption bands of heteropolyacids, (M = W and Mo)(cm-1)
H3PW12O40 H4SiW12O40 H3PMo12O40 H4SiMo12O40 Modes of
vibration
1080 926 1070 910 νas(X-O)
982 980 965 958 νas(M=O)
893 878 870 860 νas(M-O-M)
812 779 790 780 νas(M-O-M)
Table 1.3: Raman vibrational frequencies of Keggin anions (aqueous solutions), cm-1
PW12O403- SiW12O40
4- PMo12O403- SiMo12O40
4- Modes of
vibration
1011 998 997 982 pνas(M-Od)a
996 981 981 962 νas(M-Od)
apνas(M-Od) shows polarized vibration.
1.5.4. Electronic spectroscopy: Electronic absorption spectra give information about the
electronic states of heteropolyanions [6].
1.6. Homogeneous reactions HPAs catalyze a wide variety of reactions in homogeneous liquid-phase offering
strong options for more efficient and cleaner processing compared to conventional
mineral acids [26, 40-42]. HPAs have significantly higher catalytic activity than mineral
acids and particularly in organic media, the molar catalytic activity of HPA is often 100-
1000 times higher than that of H2SO4 [2, 43]. This makes it possible to carry out the
catalytic process at a lower catalyst concentration and/or at a lower temperature.
Important characteristics accounting for the high catalytic activities are the acid strength,
softness of the heteropolyanion, catalyst concentration, and nature of the solvent [2].
Softness of the polyanion is important in bringing about unique activity because the
intermediates like oxonium ions or carbenium ions are stabilized on the surfaces of
heteropolyanion, by the virtue of softness [44]. The effect of softness becomes significant
for reactions in aqueous solutions, in which the influence of the difference in the acid
strength is small, since most of the heropolyacids are completely dissociated. Further,
HPA catalysis lacks side reactions such as sulfonation, chlorination, nitration, etc., which
occur with mineral acids [43]. As stable, relatively nontoxic crystalline substances, HPAs
are also preferable with regard to safety and ease of handling. The relative activity of
Keggin HPAs primarily depends on their acid strength. Other properties, such as the
oxidation potential, which determine the reducibility of HPA by reaction medium, as well
as the thermal and hydrolytic stability, are also important. Typical examples for HPA
catalyzed homogeneous reactions are:
1.6.1. Hydration of olefins
The HPA-catalyzed hydration of C3-C4 olefins is an industrially important
reaction, the hydration of propene to isopropyl alcohol being the first commercial process
based on HPA catalysis [45]. The hydration of isobutene to tert-butyl alcohol is used for
the separation of isobutene from a mixture of C4 hydrocarbon stream by the use of
concentrated solution of heteropolyacids [2, 26]. Compared to the mineral acid HNO3,
H3PW12O40 is 10 times more active and isobutene in the mixture selectively hydrated in
the concentrated solution, minimizing side reactions such as isobutene olegomerization.
1.6.2. Biphasic reactions
Separation of products and recovery and recycling of a catalyst becomes easier if
a homogeneously catalyzed reaction can be performed in a biphasic system consisting of
two immiscible liquid phases - a catalyst phase and a product/reactant phases - with
intense mass transfer between them. HPAs due to their special solubility properties, i.e.,
high solubility in polar solvents and insolubility in nonpolar solvents, are suitable
catalysts for operating under phase-transfer conditions. The reaction predominantly
proceeds in the catalyst phase, and the product formed is transferred to the less polar
product phase. Typical examples for biphasic catalysis are polymerization of
tetrahydrofuran (THF) to polyoxotetramethylene glycol (PTMG) [46] and synthesis of
diphenyl methane by the reaction of benzene with aqueous formaldehyde [47, 48].
1.7. Heterogeneous catalysis There are three types of catalysis of solid HPAs; (1) surface, (2) bulk type I
(pseudoliquid), and (3) bulk type II catalysis (Fig. 1.4), as given in Table 1.4.
1.7.1. Surface-type catalysis
Surface-type catalysis is the ordinary heterogeneous catalysis, where the reactions
take place on the two-dimensional surface (outer surface and pore wall) of solid catalysts.
The reaction rate is proportional to the surface area in principle. Rates of double-bond
isomerization of olefins are proportional to the surface area of H3PMo12O40 [49].
1.7.2. Bulk-type (I) catalysis
In the bulk-type (I) catalysis, e.g., acid-catalyzed reactions of polar molecules
over the hydrogen forms and group A salts at relatively low temperatures, the reactant
molecules are absorbed in the interpolyanion space of the ionic crystal (not
intrapolyanion) and react there, and then the products desorb from the solid [4, 50, 51].
Because of the flexible and hydrophilic nature of the secondary structures of the acid
form and group A salts, polar molecules like alcohols and amines are readily absorbed
into the solid bulk by substituting for water molecules and/or by expanding the distance
between polyanions. The number of absorbed molecules is 10-100 times greater than the
amount of monolayer adsorption estimated from N2 adsorption. The solid behaves like a
solution and the reaction field becomes three-dimensional. This is known as
“pseudoliquid” catalysis first proposed in 1979 [52-54]. The reaction rate is proportional
to the volume of catalyst in the ideal case; for example, the rate of acid-catalyzed reaction
is governed by the bulk acidity. In the pseudoliquid phase, such catalysts appear as solids,
but, behaves like liquids (solvent). As the active sites in the solid bulk e.g. protons, take
part in catalysis, very high catalytic activities are often observed in the bulk phase.
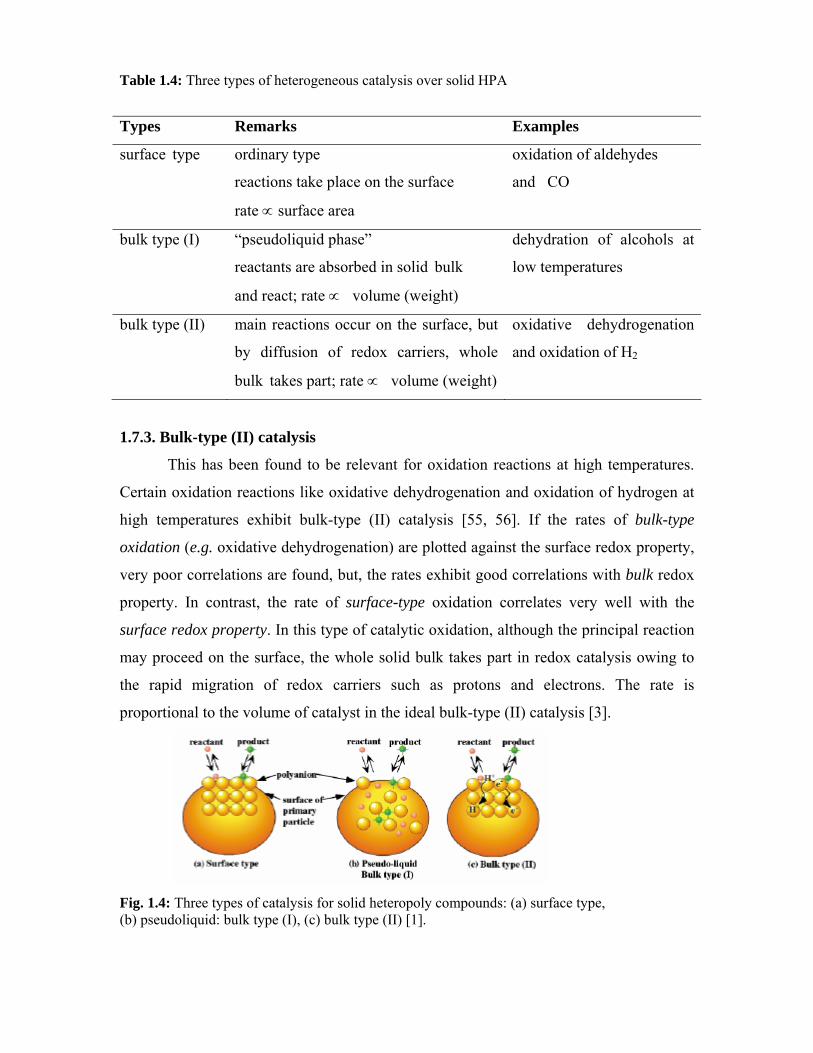
Table 1.4: Three types of heterogeneous catalysis over solid HPA
Types Remarks Examples
surface type
ordinary type
reactions take place on the surface
rate ∝ surface area
oxidation of aldehydes
and CO
bulk type (I)
“pseudoliquid phase”
reactants are absorbed in solid bulk
and react; rate ∝ volume (weight)
dehydration of alcohols at
low temperatures
bulk type (II) main reactions occur on the surface, but
by diffusion of redox carriers, whole
bulk takes part; rate ∝ volume (weight)
oxidative dehydrogenation
and oxidation of H2
1.7.3. Bulk-type (II) catalysis
This has been found to be relevant for oxidation reactions at high temperatures.
Certain oxidation reactions like oxidative dehydrogenation and oxidation of hydrogen at
high temperatures exhibit bulk-type (II) catalysis [55, 56]. If the rates of bulk-type
oxidation (e.g. oxidative dehydrogenation) are plotted against the surface redox property,
very poor correlations are found, but, the rates exhibit good correlations with bulk redox
property. In contrast, the rate of surface-type oxidation correlates very well with the
surface redox property. In this type of catalytic oxidation, although the principal reaction
may proceed on the surface, the whole solid bulk takes part in redox catalysis owing to
the rapid migration of redox carriers such as protons and electrons. The rate is
proportional to the volume of catalyst in the ideal bulk-type (II) catalysis [3].
Fig. 1.4: Three types of catalysis for solid heteropoly compounds: (a) surface type, (b) pseudoliquid: bulk type (I), (c) bulk type (II) [1].
1.8. Acid and redox properties 1.8.1. Acidic properties
Acidic properties of heteropoly compounds in the solid state are sensitive to
countercations, constituent elements of polyanions, and tertiary structure. Typical
heteropolyacids having the Keggin structures, such as, H3PW12O40 and H4SiW12O40, are
strong acids; protons are dissociated completely from the structures in aqueous solution.
Heteropolyacids are much stronger acids than H2SO4, HBr, HCl, HNO3, and HClO4. The
greater acid strength of heteropolyacids than that of mineral acids is explained as follows
[2]. Since, in heteroplyanions the negative charge of similar value is spread over much
larger anions than those formed from mineral acids, the electrostatic interaction between
proton and anion is much less for heteropolyacids than for mineral acids. An additional
important factor is the dynamic delocalizability of the charge or electron. The change in
the electronic charge caused by deprotonation may be spread over the entire polyanion
unit. In acetone, heteropolyacids show the following order of acidity: H3PW12O40 >
H4SiW12O40 ≈ H3PMo12O40 > H3PMo11VO40 > H4SiMo12O40 [43]. Solid HPAs, such as
H3PW12O40 and H3PMo12O40 are pure Brönsted acids and stronger than the conventional
solid acids, such as SiO2-Al2O3, H3PO4/SiO2, and HX and HY zeolites [57].
1.8.2. Redox properties
HPAs in solid state act as good oxidation catalysts and shows two types of
oxidation catalysis: bulk type and surface type (Fig. 1.5). The reduction of H3PM12O40 (M
= Mo, W) and its Na salts by hydrogen proceeds in the following three steps [3, 58]:
xH2(gas) + PM12O403-(surface) 2xH+(bulk) + PM12O40
(3+2x)-(bulk) (1)
2xH+(bulk) + PM12O40(3+2x)-(bulk) PM12O40-x
3- (bulk) + xH2O (bulk) (2)
xH2O (bulk) xH2O (gas) (3)
The first step is H2 → 2H+ (present between polyanions) + 2e (present in
polyanion), without formation of water. In the second step, the protons formed in the first
step react with the oxygen of polyanion to form water, which evolves in step 3 into the
gas phase. The diffusion of protons and electrons in the solid state of H3PM12O40 (M =
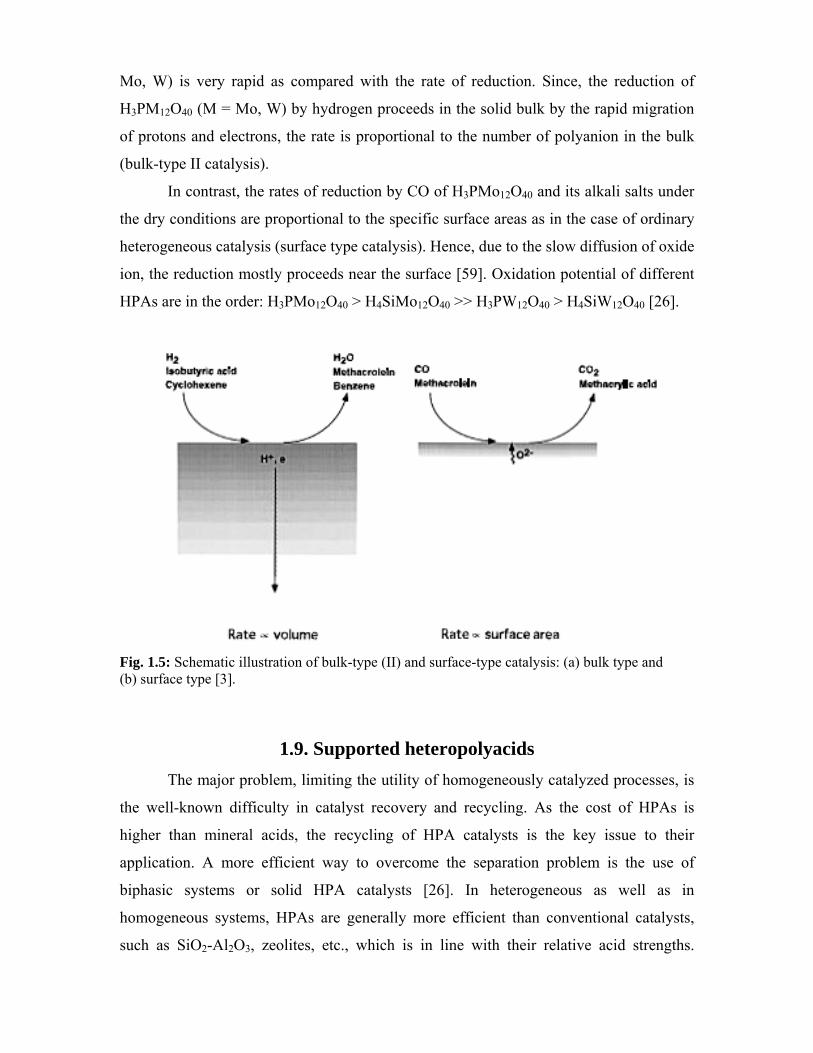
Mo, W) is very rapid as compared with the rate of reduction. Since, the reduction of
H3PM12O40 (M = Mo, W) by hydrogen proceeds in the solid bulk by the rapid migration
of protons and electrons, the rate is proportional to the number of polyanion in the bulk
(bulk-type II catalysis).
In contrast, the rates of reduction by CO of H3PMo12O40 and its alkali salts under
the dry conditions are proportional to the specific surface areas as in the case of ordinary
heterogeneous catalysis (surface type catalysis). Hence, due to the slow diffusion of oxide
ion, the reduction mostly proceeds near the surface [59]. Oxidation potential of different
HPAs are in the order: H3PMo12O40 > H4SiMo12O40 >> H3PW12O40 > H4SiW12O40 [26].
Fig. 1.5: Schematic illustration of bulk-type (II) and surface-type catalysis: (a) bulk type and (b) surface type [3].
1.9. Supported heteropolyacids The major problem, limiting the utility of homogeneously catalyzed processes, is
the well-known difficulty in catalyst recovery and recycling. As the cost of HPAs is
higher than mineral acids, the recycling of HPA catalysts is the key issue to their
application. A more efficient way to overcome the separation problem is the use of
biphasic systems or solid HPA catalysts [26]. In heterogeneous as well as in
homogeneous systems, HPAs are generally more efficient than conventional catalysts,
such as SiO2-Al2O3, zeolites, etc., which is in line with their relative acid strengths.
Obvious advantage of heterogeneous systems over homogeneous is easy separation of a
catalyst from reaction products.
A serious problem with the solid HPA catalysts is their deactivation during
organic reactions due to the formation of carbonaceous deposit (coke) on the catalyst
surface. Conventional regeneration by burning coke at 500-550 °C, which is routinely
used in the case of aluminosilicates and zeolites, is not applicable to HPAs because their
thermal stability is not high enough to do so. Supporting HPA on a carrier inhibits the
formation of coke, while bulk HPAs, having very strong acid sites and low surface area,
coke forms more rapidly [60].
Hydrogen forms (or free acids) of HPAs usually have low surface areas (1-10 m2
g-1). Supporting heteropolyacids on solids with high surface areas is a useful method for
improving catalytic performance, where the stability of the HPA and firm fixation are the
key issues [1]. Acidic or neutral materials such as SiO2, carbon, acidic ion-exchange
resin, etc., are suitable as supports. Basic solids such as MgO and Al2O3, tend to
decompose HPAs [61-64].
The thermal stability of HPA on SiO2 is comparable to or slightly lower than that
of the parent HPA. The interactions between H3PW12O40 and the surface OH groups of
SiO2 have been detected at low loading levels by 1H and 31P MAS NMR and Raman
spectroscopies [65-69]. HPAs supported on certain activated carbons are considered to be
promising fixed-bed acid catalysts for liquid-phase reactions because of their stability
towards HPA leaching from the carrier. However, the acid strength of H3PW12O40 is
reduced after loading on activated carbon or silica. Enhanced catalytic activity of HPAs
was found, when they were supported on a strongly acidic ion exchange resin,
Amberlyst-15 [70]. The activity was much higher than those of Amberlyst-15 and of the
acids supported on active carbon. The higher activity was explained by the synergism due
to the interaction of the heteropolyanions and protons of the ion exchanger.
1.10. Heterogeneous acid-catalyzed reactions
Acidity, basicity, and pseudoliquid behavior are the most important factors
governing the acid catalysis of solid HPAs. The acidic properties are mainly controlled
by (i) the structure and composition of the heteropolyanion itself, (ii) the countercations,
and (iii) the dispersion on supports. The secondary and tertiary structures are affected by
these three factors. In addition to the acidic properties, the absorption properties for polar
molecules are critical in determining the catalytic function in the case of “pseudoliquid”
catalysis. Soft basicity of the heteropolyanion itself sometimes plays an important role for
high catalytic activity. The soft basicity of polyanion follow the order of SiW12O404- >
GeW12O404- > PW12O40
3- > SiMo12O404- > SO42-. The acidity of HPAs in the solid state
reflects in general the acidity in solution; the acid strength decreases when Mo replaces
W and when the central P atom is replaced by Si for Keggin HPAs, which are stronger
acids than Dawson HPAs [71].
The group B heteropolyacids salt Cs2.5H0.5PW12O40 has strong acid sites, high
surface area (100-200 m2 g-1) and acts as an efficient solid acid catalyst for a variety of
organic reactions [1-4]. But, these materials, tends to become a milky suspension during
liquid-phase reactions, which makes it difficult to separate the catalyst after the reaction
is completed [1].
The catalyst deactivation is usually observed during the catalytic reaction, and the
deactivation is sensitive to the kind of reactant, product, solvent, and reaction
temperature. There are several possible causes for the catalyst deactivation, e.g., coke
formation, adsorption of products, catalyst reduction, catalyst decomposition, and
catalyst dissolution. HPAs containing Mo and V are susceptible for deactivation by
reduction, while HPAs of W are more resistant towards deactivation by reduction.
The coke formation or strong adsorption of polymerized products often causes
deactivation as in the case of other solid acid catalysts. Therefore, the suppression of
the deactivation and the method of regeneration are the important problems in the
acid catalysis of HPAs [3].
1.11. Oxidation reactions
Keggin-type heteropoly compounds having Mo and V as addenda atoms are
usually used for oxidation reactions. Two most important heterogeneous oxidation
reactions catalyzed by solid HPAs are oxidation of methacrolein to methacrylic acid and
oxidation of ethylene to acetic acid in presence of water and O2. The acidity and
oxidizing ability work cooperatively in methacrolein oxidation. The heteropoly catalysts
of composition H3-xCsxPMo12-yVyO40 (2 < x <3; 0 < y < 2) are used industrially for this
reaction. Acidic Cs salts that are nearly stoichiometric are used because Cs salts markedly
increase the surface area and thermal stability of the catalysts [2, 3].
For the one-stage process of acetic acid production from a mixture of ethylene,
water, and O2 by the direct oxidation of ethylene, Pd-H4SiW12O40 promoted by Se or Te
was highly efficient. The combination of metallic Pd and heteropolyacid is indispensable
for the reaction. The presence of small amount of Se or Te enhances the acetic acid
selectivity by effectively reducing the formation of CO2. The reaction proceeds in two
steps: (1) hydration of ethylene to ethanol catalyzed by the heteropolyacid (acid catalysis)
and (2) oxidation of ethanol to acetic acid on the Pd site [72].
The liquid-phase oxidation of organic substances catalyzed by heteropolyacids
proceeds in homogeneous or biphasic systems, with dioxygen, hydrogen peroxide,
alkylperoxides, etc., as oxidants [26]. Keggin-type mixed-addenda heteropolyanions
PMo12-nVnO40(3+n)- (HPA-n) catalytic system, discovered by Matveev et al. [73, 74] in the
1970s, is the most efficient and versatile catalyst for oxidation by O2. As the catalysts,
either one-component or two- and multicomponent systems are used. The most important
two-component system includes HPA-n and Pd(II) for the oxidation of ethylene to
acetaldehyde [2, 26].
Venturello [75-77] and Ishii [78-87] developed the most important hydrogen
peroxide based oxidation reaction (olefin epoxidation). The reaction is usually performed
under biphasic conditions in presence of Keggin type HPA (catalyst precursor) and a
phase transfer reagent such as cetyl pyridinium chloride. The reaction takes place
preferentially in the organic phase via the oxygen atom transfer from the peroxo
polyoxometallate to the substrate. The phase-transfer reagent transfer the active peroxo
polyoxometallate formed in the aqueous phase by the interaction of heteropolyanion with
hydrogen peroxide into the organic phase. The Keggin type HPA; H3PW12O40 is the most
active precursor in this type of reaction. Catalyst deactivation and the use of chlorinated
hydrocarbons as solvents are the major drawbacks of Venturello-Ishi process [88].
1.12. Zirconia as a catalyst and a catalyst support
Zirconium dioxide (zirconia) is an oxide with a high melting point about (2700 oC), and shows low thermal conductivity, and high resistance for corrosion, which has
been used for refractories, pigments, piezoelectric devices, ceramic condensers, and
oxygen sensors. The partially stabilized zirconia with high mechanical strength and high
tenacity is used in fine ceramics. It is quite insoluble at low and high pH.
Zirconia is usually obtained by the calcination of its hydroxide/oxyhydroxide,
which is prepared by hydrolysis of zirconium salts. Mainly three crystalline modifications
of zirconia are known; the monoclinic which is stable up to 1200 oC, the tetragonal which
is stable up to 1900 oC, and the cubic which is stable above 1900 oC. However, tetragonal
zirconia can be prepared at low temperatures (in the range of 550-750 oC) in the form of
metastable phase.
Temperature ranges where the above-mentioned crystal forms are stabilized are
depending upon the presence of impurities or additives. Transformation of the metastable
tetragonal to the monoclinic form is sensitive to the existence of impurities or additives
and they usually stabilize the metastable tetragonal form at higher temperatures [89].
ZrO2 is stable under oxidizing and reducing atmosphere and possesses both acid
and base properties. The acid site (Zr4+) and base site (O2-) present in ZrO2 is very weak.
In solution, acidic and basic sites are neutralized immediately, however, they may exist
independently at the surface. Thus acidic and basic sites on the surface of oxides work
both independently and cooperatively and hence ZrO2 act as an acid-base bifunctional
oxide and hence show acid-base bifunctional catalysis. The existence of both acidic and
basic properties is evidenced by the adsorption of CO2 and NH3 [89, 90].
Zirconium oxyhydroxide adsorbs both cations and anions in an aqueous solution.
In acidic solution, it adsorb anions such as SO42- ions, while in basic solution, cations are
preferentially adsorbed. The acidic and basic sites (OH) on the surface of ZrO2 calcined
at relatively low temperature are very weak. Based on ZrO2, three processes are
industrialized such as synthesis of α-olefin, ketones, and aromatic aldehydes. The high
activities of ZrO2 in these reactions are due to the acid-base bifunctional catalysis. For
the bifunctional catalysis, the orientation of acid-base pair sites is vitally important. The
orientation can largely changed by the preparation method, the pretreatment condition,
and the addition of small amounts of the other metal oxides [90].
1.13. Zirconia based solid acids The most important zirconia based solid acids are 1) sulfated zirconia and 2)
tungstated zirconia
1.13.1. Sulfated zirconia: Holm and Bailey in 1962, disclosed for the first time that
sulfated zirconia modified with platinum as an active catalyst for isomerization of n-
pentane at low temperature [91]. Later in 1970’s Arata et al. observed that the sulfate
treated metal oxides, ZrO2 or Fe2O3, are able to isomerize n-butane at low temperature
(room temperature), like superacids (SbF5-HF and SbF5-FSO3H) [92, 93]. Zirconia, when
modified with anions, such as sulfate ions, forms a highly acidic catalyst that exhibits
superior catalytic activity in many reactions. The catalytic performance of sulfated
zirconia is significantly dependent on the preparation methods and on the activation
procedure prior to reaction. Sulfated zirconia is usually prepared by two-step procedure.
In the first step, the zirconium oxyhydroxide is precipitated by the addition of aqueous
ammonia to a zirconium salt, such as ZrOCl2 or ZrO(NO3)2. The hydroxide obtained by
the precipitation after washing and drying, impregnated with a solution of H2SO4 or
(NH4)2SO4 in the second step [94]. After impregnation, the resulting solid is dried and
calcined at 550-650 oC. The calcination is a crucial step for the generation of strong
acidity of sulfated zirconia. Active catalyst is prepared by the calcination of sulfated
zirconia precursor at 550-650 oC for several hours in air [95]. Sulfated zirconia prepared
by the conventional method is mainly exists in metastable tetragonal phase. However,
monoclinic sulfated zirconia prepared by sulfating crystalline monoclinic sulfated
zirconia is also found to be active for n-butane isomerization but, compared to the
tetragonal one, monoclinic sulfated zirconia had low activity, which indicates that
tetragonal phase favors n-butane isomerization [96]. Calcination at higher temperature
leads to an inactive catalyst with low sulfur content. One of the functions of calcination
step is to transform the inactive amorphous zirconium oxyhydroxide into active
tetragonal zirconia by dehydration and serving the sulfate groups to bind the zirconia
surface to form the active sites. Another important function of the calcination is to create
strong Lewis acidity (coordinatively unsaturated Zr(IV)). Sulfated zirconia is considered
as a super acid initially, but later studies confirmed that acidity is similar to that of
sulfuric acid. Depending on the level of surface hydration/dehydration, sulfated zirconia
shows Brönsted and Lewis acidity. The acidity and surface area strongly depend on the
preparation procedure, and the exact nature of acid sites as well as the structure sulfate
groups remains the object of debate [97-104].
Sulfated zirconia has attracted considerable interest as a potential replacement for
liquid catalysts in such processes as isomerization, hydrocracking, alkylation, acylation,
etc [105-113]. However, their poor stability, and their tendency to form volatile sulfur
compounds during catalysis and regeneration limits their applicability [114, 115].
1.13.2. Tungstated zirconia: Tungstated zirconia (zirconia-supported tungsten oxide,
WOx/ZrO2-WZ) is found to be better catalyst than sulfated zirconia in terms of its easy
preparation method, slow deactivation and superior stability under both reducing and
oxidizing conditions. WZ catalysts were first reported to be strongly acidic by Hino and
Arata [116]. They reported low temperature n-butane and n-pentane isomerization
activity on WZ catalysts prepared by impregnating zirconium oxyhydroxide with aqueous
ammonium metatungstate (13 wt.% W) and subsequent high temperature oxidation (800 oC). n-Pentane isomerization rates decreased markedly when metatungstate solutions
were impregnated on crystalline ZrO2 supports instead of amorphous zirconium
oxyhydroxide support, suggesting that hydrated WOx species combine with zirconium
oxyhydroxide surface sites and such sites are not available after crystalline tetragonal or
monoclinic ZrO2 structures are formed. The initial formation of dispersed tungstate
species occurs via anion exchange or condensation reactions of hydrated aqueous
tungstate anions with surface OH species in zirconium oxyhydroxide. The resulting high
dispersion of WOx species inhibits the crystallization and sintering of the ZrO2 support
crystallites leads to the formation of WOx clusters of varying size and catalytic properties.
The catalyst with the tungsten loading slightly exceeding the theoretical monolayer
coverage was found to be the most active. Under these conditions tungsten oxide species
exist as three-dimensional polyoxotungstate clusters on the surface of zirconia [117-119].
The tungsten atoms in these polyoxotungstate clusters are located in a distorted
octahedral environment, which are grafted to the support through W-O-Zr bridges. The
structure and the size of these clusters, as well as their specific interactions with the
zirconia support, largely determine the acidic, redox, and catalytic properties of these
catalysts. In WZ catalysts, WOx clusters of intermediate size (polyoxotungstate clusters)
delocalize a net negative charge caused by the slight reduction of W6+ centers in reactant
environments containing H2 or hydrocarbons. This temporary charge imbalance leads to
the formation of Brönsted acid (WO3)m{W6-nO3}{n-H+} centers on the zirconia support.
These Brönsted acid sites on WZ appear to form via a mechanism similar to that on
heteropolytungstate clusters, but in this case, the charge imbalance is not permanent; it is
reversible and created in-situ by the reducing environment of the acid-catalyzed reaction
[120, 121].
1.14. Scope of the thesis This thesis describes the preparation, characterization and catalytic activity
studies of zirconia-supported Keggin heteropolyacids. The heteropolyacids under study
include 12-tungstosilicic acid (silicotungstic acid, STA), 12-tungstophosphoric acid
(phosphotungstic acid, PTA), and 12-molybdophosphoric acid (phosphomolybdic acid,
PMA). The thermal stability of heteropolyacids supported on conventional supports like
silica, carbon, ion exchange resin etc. are not high enough to carry out regeneration by
calcination. Moreover, heteropolyacids supported on conventional supports can leach into
the reaction medium in presence of polar reactants and hence catalyze the reaction
homogeneously. One of the objectives of the work described in this thesis is to explore
the possibility of the preparation of stable supported heteropolyacid catalysts. The thesis
intends to investigate the relationship between surface properties of the catalysts with
observed catalytic properties.
The thesis has been divided into six chapters.
Chapter 1 gives a general introduction to heteropoly acids (HPAs), its structure,
classification, and catalytic properties. It also gives an introduction to supported-
heteropoly acids and the conventional supports used for the preparation of supported-
heteropoly acids. Further, this chapter gives an introduction to zirconia, its properties, and
zirconia based solid acids. Finally, the scope of the thesis is outlined.
Chapter 2 describes the preparation and characterization of zirconia-supported
heteropoly acid catalysts and its characterization by different techniques. Catalysts with
different HPA loading (wt.%) and calcination temperature (oC) were prepared. These
catalysts were characterized by different techniques such as surface area (N2 adsorption),
XRD, Raman spectroscopy, TG-DTA, NH3-TPD, FTIR pyridine adsorption, and 31P
MAS NMR spectroscopy. For each technique, its theory and experimental procedures are
described briefly.
Chapter 3 describes the characterization results of zirconia-supported
silicotungstic acid catalysts with different STA loading and calcination temperature by
surface area, XRD, Raman spectroscopy, XPS, NH3-TPD, FTIR pyridine adsorption, and
DRUV-vis spectroscopy and the results are discussed.
The catalysts were used in the liquid-phase benzoylation of veratrole with benzoic
anhydride and alkylation of phenol with tert-butanol in a fixed-bed down flow reactor.
The effect of parameters like STA loading and calcination temperature on catalytic
activity is studied and the relation between catalytic activities and surface properties are
discussed. The most active catalyst has been used to study different reaction parameters
like temperature, molar ratio, catalyst weight, effect of time/space velocity and time on
stream on conversion and product selectivity.
Chapter 4 describes the characterization results of zirconia-supported
phosphotungstic acid catalysts by surface area, XRD, TG-DTA, NH3-TPD, FTIR
pyridine adsorption and 31P MAS NMR spectroscopy. In order to understand the role of
the solvent used for the catalyst preparation, the catalyst with optimum PTA loading and
calcination temperature was prepared using different solvents and characterized by 31P
MAS NMR spectroscopy and the results are discussed.
These catalysts were used in the liquid-phase synthesis of linear alkyl benzene by
the alkylation of benzene with higher linear olefins like 1-octene and 1-dodecene and
acylation of 2-methoxy naphthalene with acetic anhydride. The effect of parameters like
PTA loading and calcination temperature on catalytic activity is studied and relation
between catalytic activities and surface properties are discussed. The catalysts with
optimum PTA loading and calcination temperature prepared under different solvents
were used in liquid-phase alkylation of benzene with 1-octene and a discussion is made
on the difference in catalytic activity between the catalysts prepared in different solvents.
The most active catalyst has been used to study different reaction parameters like
temperature, molar ratio, catalyst weight and effect of time on conversion and product
selectivity.
Chapter 5 describes the characterization results of zirconia-supported
phosphomolybdic acid catalysts with different PMA loading and calcination temperature
by XRD and 31P MAS NMR spectroscopy. The nature of acidic sites present in the most
active catalyst is probed by FTIR pyridine adsorption.
These catalysts were used in liquid-phase synthesis of linear alkyl benzenes by the
alkylation of benzene with higher linear olefins like 1-octene and 1-dodecene and
alkylation of phenol with tert-butanol in a fixed-bed down flow reactor. The effect of
parameters like PMA loading and calcination temperature on catalytic activity is studied.
The most active catalyst has been used to study the reaction parameters like temperature,
catalyst weight, molar ratio, space velocity and time on stream on conversion and product
selectivity.
Chapter 6 gives the summary and conclusions reached in this thesis.
1.15. References
1. M. Misono, Chem. Commun. (2001) 1141.
2. T. Okuhara, N. Mizuno, M. Misono, Adv. Catal. 41 (1996) 113.
3. N. Mizuno, M. Misono, Chem. Rev. 98 (1998) 199.
4. M. Misono, Catal. Rev. Sci. Eng. 29 (1987) 269; 30 (1988) 339.
5. G.A. Tsigdinos, Top. Curr. Chem. 76 (1978) 1.
6. M.T. Pope, “Heteropoly and Isopoly Oxometalates”. Springer-Verlag,
Berlin, 1983.
7. M.T. Pope, A. Muller, Angew. Chem. Int. Ed. Engl. 30 (1991) 34.
8.
“Polyoxometallates: From Platonic Solids to Anti-Retroviral Activity.” (M.T
Pope and A. Muller, Eds.). Kluwer, Dordrecht, 1994.
9. Y. Jeannin, G. Herve, A. Proust, Inorg. Chim. Acta 189 (1992) 319.
10. T.J.R. Weakly, Struct. Bonding 18 (1974) 131.
11. J.F. Keggin, Nature (London) 131 (1933) 908.
12. L. Pettersson, I. Anderson, L.O. Ohman, Inorg. Chem. 25 (1986) 4726.
13. B. Dawson, Acta Crystallogr. 6 (1953) 113.
14. H. D’Amour, Acta Crystallogr. B32 (1976) 729.
15. J.S. Anderson, Nature 140 (1937) 850.
16. M.N. Timofeeva, Appl. Catal. A 256 (2003) 19.
17. S. Uchida, K. Inumaru, M. Misono, J. Phys. Chem. B 104 (2000) 8108.
18. G.A. Tsigdinos, Ind. Eng. Chem. Prod. Res. Dev. 13 (1974) 267.
19. B. Gruttner, and G. Jander, in “Handbook of Preparative Inorganic Chemistry,”
2nd Ed. (G. Brauer, Ed.), Academic Press, New York, 1976, Vol. 2, p. 1716.
20. J.C. Bailar, Inorg. Synth. 1 (1939) 132.
21. H. Hu, J. Biol. Chem. 43 (1920) 189.
22. R.D. Hall, J. Am. Chem. Soc. 24 (1907) 780.
23. F. Cavani, Catal. Today 41 (1998) 73.
24. C. Rocchiccioli-Deltcheff, Inorg. Chem. 22 (1983) 207.
25. M. Fournier, C. F-Jantou, C. Rabia, G. Herve, S. Launary,
J. Mater. Chem. 2 (1992) 971.
26. I.V. Kozhevnikov, Chem. Rev. 98 (1998) 171.
27. I.V. Kozhevnikov, Appl. Catal. A 256 (2003) 3.
28. C. Rocchiccioli-Deltcheff, R. Thouvent, R. Franck,
Spectrochim. Acta 32A (1976) 587.
29. D.H. Brown, Spectrochim. Acta 19 (1963) 583.
30. C. Hu, M. Hashimoto, T. Okuhara, M. Misono, J. Catal. 143 (1993) 437.
31.
T. Okuhara, C. Hu, M. Hashimoto, M. Misono,
Bull. Chem. Soc. Jpn. 67 (1994) 1186.
32. F. Boeschen, B. Brus, B. Krebs, Acta Crystallogr. B30 (1974) 48.
33. C. Rocchiccioli, M. Fournier, R. Franck, R. Thouvent,
Inorg. Chem. 22 (1983) 207.
34. C. Rocchiccioli-Deltcheff, R. Thouvent,
J. Chem. Res. (S) (1977) 46; (M) (1977) 546.
35. T. Fukumoto, K. Murata, S. Ikeda, Anal. Chem. 56 (1984) 929.
36. C. Rocchiccioli, R. Thouvenot, Spectrosc. Lett. 12 (2) (1979) 127.
37. Y. Kanada, Y. Lee, S. Nakata, S. Asaoka, M. Misono, Chem. Lett. (1988) 139.
38. R. Acerete, C.F. Hammer, L.C.W. Baker, J. Am. Chem. Soc. 101 (1979) 267.
39. J. Lefevre, F. Chauveau, P. Doppelt, J. Am. Chem. Soc. 103 (1981) 4581.
40. I. V. Kozhevnikov, K.I. Matveev, Appl. Catal. 5 (1983) 135.
41. I. V. Kozhevnikov, Stud. Surf. Sci. Catal. 90 (1994) 21.
42. I. V. Kozhevnikov, Catal. Rev. Sci. Eng. 37 (1995) 311.
43. I. V. Kozhevnikov, Russ. Chem. Rev., 56 (1987) 811.
44. K. Urabe, K. Fukita, Y. Izumi, Shokubai (Catalyst) 22 (1983) 223.
45. M. Misono, N. Nojiri, Appl. Catal. 64 (1990) 1.
46. A. Aoshima, S. Tonomura, S. Yamamatsu, Polym. Adv. Tech. 2 (1990) 127.
47. Z. Hou, T. Okuhara, J. Chem. Soc., Chem. Commun. (2001) 1686.
48. Z. Hou, T. Okuhara, J. Mol. Catal. A 206 (2003) 121.
49. M. Misono, Y. Konishi, M. Furuta, Y. Yoneda, Chem. Lett. (1978) 709.
50. M. Misono, N. Mizuno, K. Katamura, A. Kasai, Y. Konishi, K. Sakata,
T. Okuhara, Y. Yoneda, Bull. Chem. Soc. Jpn. 55 (1982) 400.
51. T. Okuhara, S. Tatematsu, K.Y. Lee, M. Misono,
Bull. Chem. Soc. Jpn. 62 (1989) 717.
52. M. Misono, K. Sakata, Y. Yoneda, W.Y. Lee, in “Proc. 7th Int. Congr. Catal.
Tokyo, 1980,” Kodansha, Tokyo, Elsevier, Amsterdam, 1981; p. 1047.
53. K. Sakata, M. Furuta, M. Misono, Y. Yoneda, ACS/CSJ Chemical Congr.
Honolulu, April, 1979.
54. M. Misono, 1st Japan-France Catal. Seminar, July (1979).
55. T. Komaya, M. Misono, Chem. Lett. (1983) 1177.
56.
M. Misono, N. Mizuno, T. Komaya, In Proc. 8th Int. Congr. Catal. 1984; Verlag
Chemie: Weinheim, 1984; Vol. 5, p. 487.
57. M. Furuta, K. Sakata, M. Misono, Y. Yoneda, Chem. Lett. (1979) 31.
58. N. Mizuno, M. Misono, J. Phys. Chem. 93 (1989) 3334.
59. N. Mizuno, T. Watanabe, M. Misono, J. Phys. Chem. 89 (1985) 80.
60.
Y. Izumi, K. Urabe, M. Onaka, Zeolite, Clay and Heteropoly Acid in Organic
Reactions; Kodansha/VCH: Tokyo, 1992, p. 99.
61. W.-C. Cheng, N. P. Luthra, J. Catal. 109 (1988) 163.
62.
K. Nowinska, R. Fiedorow, J. J. Adamiec,
Chem. Soc., Faraday Trans. 87 (1991) 749.
63. K.M. Rao, R. Gobetto, A. Lannibello, A. Zecchina, J. Catal. 119 (1989) 512.
64.
J.A.R. van Veer, P.A. J. M. Hendriks, R.R. Andrea, E.J.M. Romers,
A. E. Wilson, J. Phys. Chem. 94 (1990) 1831.
65.
V.M. Mastikhin, S.M. Kulikov, A.V. Nosov, I.V. Kozhevnikov,
I.L. Mudrakovsky, M.N. Timofeeva, J. Mol. Catal. 60 (1990) 65.
66. F. Lefebvre, J. Chem. Soc., Chem. Commun. (1992) 756.
67.
R. Thouvenot, C. Rocchiccioli-Delcheff, M. Fournier,
J. Chem. Soc., Chem. Commun. (1991) 1252.
68.
R. Thouvenot, M. Fournier. C. Rocchiccioli-Delcheff,
J. Chem. Soc., Faraday Trans. 87 (1991) 2829.
69. C. Rocchicioli-Deltcheff, M. Amirouche, M. Fournier, J. Catal. 138 (1992) 445.
70. T. Baba, Y. Ono, Appl. Catal. 22 (1986) 321.
71.
G.I. Kapustin, T.R. Brueva, A.L. Klyachko, M.N. Timofeeva, S.M. Kulikov,
I.V. Kozhevnikov, Kinet. Katal. 31 (1990) 1017.
72. T. Okuhara, Chem. Rev. 102 (2002) 3641.
73. K.I. Matveev, Kinet. Katal. 18 (1977) 862.
74. K.I. Matveev, E.G. Zhizhina, N.B. Shitova, L.I. Kuznetsova,
Kinet. Katal. 18 (1977) 380.
75. C. Venturello, R. D’Aloisio, J.C.J. Bart, M. Ricci, J. Mol. Catal. 32, (1985) 107.
76. C. Venturello, E. Alneri, M. Ricci, J. Org. Chem. 48 (1983) 3831.
77. C. Venturello, M. Gambaro, Synthesis (1989) 295.
78.
Y. Matoba, H. Inoue, J. Akagi, T. Okabayashi, Y. Ishii, M. Ogawa,
Synth. Commun. 14 (1984) 865.
79. Y. Sakata, Y.J. Ishii, Org. Chem. 56 (1991) 6233.
80. Y. Ishii, Y. Sakata, J. Org. Chem. 55 (1990) 5545.
81. S. Sakaue, T. Tsubakino, Y. Nishiyama, Y. Ishii, J. Org. Chem. 58 (1993) 3633.
82.
Y. Ishii, Y. Yamawaki, T. Ura, H. Yamada, T. Yoshida, M. Ogawa,
J. Org. Chem. 53 (1988) 3587.
83.
T. Oguchi, Y. Sakata, N. Takeuchi, K. Kaneda, Y. Ishii, M. Ogawa,
Chem. Lett. (1989) 2053.
84. S. Sakaue, Y. Sakata, Y. Nishiyama, Y. Ishii, Chem. Lett. (1992) 289.
85. Y. Ishii, Y. Sakato, J. Org. Chem. 55, (1990) 5545.
86.
S. Sakaguchi, S. Watase, Y. Katayama, Y. Sakata, Y. Nishiyama, Y. Ishii,
J. Org. Chem. 59 (1994) 5681.
87. Y. Ishii, H. Tanaka, Y. Nishiyama, Chem. Lett. (1994) 1.
88.
D. C. Duncan, R. C.Chambers, E. Hecht, C. L. Hill,
J. Am. Chem. Soc. 117 (1995) 681.
89. T. Yamaguchi, Catal. Today 20 (1994) 199.
90. K. Tanabe, T. Yamaguchi, Catal. Today 20 (1994) 185.
91. V.C.F. Holm, G.C. Bailey, US patent 3,032,599, 1962.
92. M. Hino, K. Arata, J. Chem. Soc., Chem. Commun. (1979) 1148.
93. M. Hino, K. Arata, J. Chem. Soc., Chem. Commun. (1980) 851.
94. A. Corma, Chem. Rev. 95 (1995) 559.
95. F.R. Chen, G.Coudurier, J.F. Joly, J.C. Vedrine, J. Catal. 143 (1993) 616.
96. W. Stichert, F. Schüth, S. Kuba, H. Knözinger, J. Catal. 198 (2001) 277.
97. A. Clearfield, G.P.D. Serrette, A. H. Khazi-Syed, Catal. Today 20 (1994) 295.
98.
T. Reimer, D. Spielbauer, M. Hunger, A.H. Mekhemer, H. Knozinger,
J. Chem. Soc., Chem. Commun. (1994) 1181.
99. C. Morterra, G. Cerrato, S. Ardizzone, C.L. Bianchi, M. Signoretto, F. Pinna,
Phys. Chem. Chem. Phys. 4 (2002) 3136.
100. S.X. Song, R.A. Kydd, J. Chem. Soc., Faraday Trans. 94 (1998) 1333.
101.
J.A. Navío, G. Colón, M. Macías, J.M. Camplelo, A.A. Romero, J. M. Marinas,
J. Catal. 161 (1996) 605.
102.
M. Benaïssa, J.G. Santiesteban, G. Díaz, C. D. Chang, M. José-Yacamán,
J. Catal. 161 (1996) 694.
103. F. Babou, B. Bigot, P. Sautet, J. Phys. Chem. 97, (1993) 11501.
104. F. Haase, J. Sauer, J. Am. Chem. Soc. 120 (1998) 13503.
105. B.H. Davis, R.A. Keogh, R. Srinivasan, Catal. Today 20 (1994) 219.
106. X.M. Song, A. Sayari, Catal. ReV. Sci. Eng. 38 (1996) 320.
107. G.D. Yadav, N. Kirthivasan, Chem. Commun. (1995) 203.
108. G.D. Yadav, J.J. Nair, Microp. Mesop. Mater. 33 (1999) 1.
109.
C.Y. Hsu, C.R. Heimbuch, C.T. Armes, B.C. Gates,
J. Chem. Soc., Chem. Commun. (1992) 1645.
110. T.-K. Cheung, J. L. d’Itri, B. C. Gates, J. Catal. 151 (1995) 464.
111. T.-K. Cheung, B. C. Gates, Top. Catal. 6 (1998) 41.
112. B.-Q. Xu, W.M.H. Sachtler, J. Catal. 167 (1997) 224.
113. J. Sommer, R. Jost, M. Hachoumy, Catal. Today 38 (1997) 309.
114. R. Sreenivasan, R.A. Keogh, D.R. Milburn, B.H. Davis, J. Catal 153 (1995) 123.
115.
G. Larsen, E. Lotero, R.D. Parra, L.M. Petkovic, H.S. Silva, S. Radhavan,
Appl. Catal. A 130 (1995) 213.
116. M. Hino, K. Arata, J. Chem. Soc. Chem. Commun. 1259 (1988).
117.
M. Scheithauer, T.K. Cheung, R.E. Jentoft, R.K. Grasselli, B.C. Gates,
H. Knözinger, J. Catal. 180 (1998) 1.
118. M. Scheithauer, R.K. Grasselli, H. Knözinger, Langmuir 14 (1998) 3019.
119.
D.G. Barton, S.L. Soled, G.D. Meitzner, G.A. Fuentes, E. Iglesia,
J. Catal. 181 (1999) 57.
120. D.G. Barton, S.L. Soled, E. Iglesia, Topics Catal. 6 (1998) 87.
121. S. Kuba, P. Lukinskas, R.K. Grasselli, B.C. Gates, H. Knözinger,
J. Catal. 216 (2003) 353 and references there in.
Chapter 2
Preparation and characterization of zirconia-supported
heteropoly acid catalysts 2.1. Introduction
The successful heterogeneous catalysts should possess high catalytic activity for the desired reaction, high selectivity for the desired product and acceptable commercial life. The characterization of catalytic material is a very important step in the process of catalyst development, which gives insight into the relation between physical and chemical properties of the catalyst and its activity. If the structure and composition of the catalyst can be correlated with its activity and selectivity, the working of the catalyst can be understood.
In this work, the catalysts were prepared by impregnation method and
characterized by various techniques such as surface area, X-ray diffraction, Raman
spectroscopy, TG-DTA, XPS, FTIR pyridine adsorption, TPD of ammonia, DRUV-vis
spectroscopy, NMR etc. The theory and experimental procedure of various
characterization techniques used are briefly described in the following sections.
2.2. Catalyst preparation The catalysts were prepared by suspending a known amount of dried zirconium
oxyhydroxide powder in a methanol solution of heteropoly acids (HPAs). HPAs (Aldrich) under study include silicotungstic acid, phosphotungstic acid and phosphomolybdic acid. Zirconium oxyhydroxide was prepared by the hydrolysis of 0.5 M zirconyl chloride solution by the drop wise addition of aqueous ammonia (10 M) to a final pH of 10. The precipitate was filtered and washed with ammoniacal water (pH = 8) until free from chloride ions by the silver nitrate test. Zirconium oxyhydroxide thus obtained was dried at 120 oC for 12 h, powdered well and dried again for another 12 h. Each time, 4 ml of methanol per gram of solid support was used and the mixture was stirred in a rotary evaporator for 8-10 h. After stirring, the excess methanol was removed at ca. 50 oC under vacuum. The resulting solid materials were dried at 120 oC for 24 h and ground well. A series of catalysts with different HPA loading were prepared by changing the HPA concentration in methanol. The dried samples were then calcined in air. All samples were calcined in shallow quartz boats placed inside a 3 cm diameter quartz tube placed in a tubular furnace. The samples were heated at the rate of 5 oC min-1 to the specified temperature and held for 4 h under static conditions, and then cooled at the rate of 5 oC min-1 to room temperature.
2.3. Catalyst characterization – Theory and
experimental procedure 2.3.1. Surface area measurement by BET method
The common method of measuring surface area of catalyst materials is based on the theory developed by Brunauer, Emmett and Teller in 1938 considering the concept of multilayer adsorption. The isotherm points are transformed into the linear version of BET equation [1]:
P/V(P0-P) = 1/VmC + [(C-1)/VmC] (P/P0) (2.1)
Where, P is the adsorption equilibrium pressure, P0 is the saturation vapor pressure of the
adsorbate at the experimental temperature, V is the volume of gas adsorbed at pressure P,
Vm is the volume of adsorbate required for monolayer coverage and C, a constant that is
related to the heat of adsorption and liquefaction. A plot of P/V(P0-P) Vs (P/P0) will yield
a straight line usually in the range 0.05 ≤ P/P0 ≤ 0.35. The monolayer volume, Vm is given
by 1/(S+I), where S is the slope, which is equal to (C-1)/VmC and I is the intercept, which
is equal to 1/VmC. The surface area of the catalyst (SBET) is related to Vm, by the
equation,
SBET = Vm/22414) Na σ (2.2)
where, Na is the Avogadro number and σ is mean cross sectional area covered by one
adsorbate molecule. The σ value generally used for N2 is 0.162 nm2.
The specific surface area of the catalysts were measured by N2 physisorption at
liquid nitrogen temperature using a Quantachrome Nova-1200 surface area analyzer and
standard multi point BET analysis method. Zirconia-supported silicotungstic acid
samples were dried in flowing N2, while zirconia-supported phosphotungstic acid
samples were dried under dynamic vacuum for 2 h at 300 oC before N2 physisorption
measurements.
2.3.2. X-ray diffraction X-ray diffraction (XRD) is used to identify bulk phases, if desired under in situ
conditions and to estimate particle sizes. In catalyst characterization, diffraction patterns
are mainly used to identify the crystallographic phases that are present in the catalyst [2].
This method involves the interaction between the incident monochromatized X-rays (like
Cu Kα or Mo Kα source) with the atoms of a periodic lattice. X-rays scattered by atoms
in an ordered lattice interfere constructively in directions given by Bragg’s law:
nλ = 2 d sinθ; n = 1, 2, 3,…. (2.3)
Where, λ is the wavelength of the X-rays, d is the distance between two lattice planes, θ
is the angle between the incoming X-rays and the normal to the reflecting lattice plane
and n is the integer called order of the reflection.
The Bragg peaks are measured by observing the intensity of the scattered
radiation as a function of scattering angle 2θ. The angles of maximum intensity enable
one to calculate the spacing between the lattice planes and allow phase identification. The
width of diffraction peaks provides information on the dimensions of the reflecting
planes. Diffraction lines from the perfect crystals are very narrow. For crystals with size
below 100 nm, line broadening occurs due to incomplete destructive interference in
scattering directions, where the X-rays are out of phase. The width of the diffraction lines
can be used to estimate the crystal size by the relation, Debye-Scherrer formula [1],
Dhkl = 0.9λ/βcosθ (2.4)
where, Dhkl, λ, β and θ are the volume averaged particle diameter, X-ray wavelength, full
width at half maximum (FWHM), and diffraction angle respectively.
A major limitation of XRD is that this technique requires samples possessing
sufficient long-range order. Amorphous phases and small particles give either broad and
weak diffraction lines or no diffraction at all which makes them virtually invisible for
XRD.
X-ray diffraction (XRD) measurements of the catalyst powder were recorded
using a Rigaku Geigerflex diffractometer equipped with Ni filtered CuKα radiation (λ =
1.5418 Å). The volume percentage of the tetragonal phase (Vt) of the calcined samples
was estimated using the formula proposed by Toraya et al. [3],
Xm = Im (11-1) + Im (111)/[Im (11-1) + Im (111) + It (111)] (2.5)
Vm = 1.311 Xm / [1 + 0.31 Xm] and Vt = 1-Vm (2.6)
where, Im (hkl) is the integral intensity of the (hkl) reflections of the monoclinic phase
and It (111) the intensity of the (111) reflection of the tetragonal phase.
2.3.3. Raman spectroscopy
Raman spectroscopy is based on the inelastic scattering of photons, which loose energy by exciting vibrations in the sample. A vibration is Raman active if it changes the polarizability of the molecule. Raman and infrared spectroscopies complement each other, in particular for highly symmetrical molecules.
Raman spectroscopy can be used for investigations of oxides, supported and bulk
metals, and has found increasing applications for the characterization of supported
transition metal oxide catalysts since the work of Villa et al. in 1974 [4]. It is particularly
powerful for investigations of the structure of supported oxide catalysts. All characteristic
vibrational features of oxides of the transition metals like Mo, W, Cr, V and Re fall into
the frequency range below 1100 cm-1. These oxides have high Raman scattering cross-
sections because of their relatively high covalent bond character. The usual support
materials (particularly alumina and silica) have very low Raman scattering cross-sections
and only show weak absorption bands in the 700-1100 cm-1 region. Hence, it has the
advantage that the normal modes of the minority components, namely the transition metal
oxides dispersed on the supports, can most frequently be detected by it with relative ease
in the frequency region 500-1000 cm-1. It should be also mentioned that titania and
zirconia oxides possess strong Raman absorption bands in the region below 700 cm-1.
There are some major problems that may be encountered in it like the heating effects of
the laser beam, low sensitivity of the technique and background fluorescence.
Raman spectra of the catalysts were recorded on powder samples at room
temperature with a Bruker IFS 66 spectrometer connected to Raman module FRA 106.
The 1.06 µm line of NdYAG laser was used for excitation and spectral resolution was 3
cm-1.
2.3.4. Thermal analysis
Thermo analytical techniques involve the measurement of the response of the
solid under study (energy or mass released or consumed) as a function of temperature (or
time) dynamically by the application of a linear temperature program. Thermogravimetry
(TG) is a technique, which measures the variation in mass of a sample when it undergoes
temperature scanning in a controlled atmosphere. Differential thermal analysis (DTA) is a
technique, which measures the difference in temperature between a sample and a
reference (a thermally inert material) as a function of time or temperature, when they
undergo temperature scanning in a controlled atmosphere. DTA method enables any
transformation to be detected for all the categories of materials, providing information on
exothermic and endothermic reactions taking place in the sample, which include phase
transitions, dehydration, decomposition, redox, or solid-state reactions. In catalysis, these
techniques are used to study the genesis of catalytic materials via solid-state reactions.
Differential thermal analysis (DTA) measurements of zirconia-supported
silicotungstic acid samples were performed on a Pyris Diamond TG-DTA apparatus from
room temperature to 1000 oC in flowing dry oxygen (ca. 50 ml min-1), using α-Al2O3 as
reference. In each experiment, 5-8 mg of the sample was used with a heating rate of 20 oC min-1.
Thermogravimetric and differential thermal analysis (TG-DTA) measurements of
zirconia-supported phosphotungstic acid samples were performed on a Setaram TG-DTA
92 apparatus from room temperature to 1000 oC in flowing dry air (ca. 50 ml min-1),
using α-Al2O3 as reference. In each experiment, 25-30 mg of the sample was used with a
heating rate of 10 oC min-1. TGA curves are depicted as first derivative DTG of the direct
weight loss traces.
2.3.5. X-ray photoelectron spectroscopy
X-ray photoelectron spectroscopy (XPS) is one of the most frequently used
techniques in catalysis. It gives information on the elemental composition, the oxidation
state of the elements and in some cases on the dispersion of one phase over another. XPS
is based on the photoelectric effect [5-7] . In this technique, sample surface is irradiated
with X rays and the emitted photoelectrons are measured. When an atom absorbs a
photon of energy hν, a core or valence electron with binding energy Eb is ejected with
kinetic energy Ek:
Ek = hν- Eb - ϕ (2.7)
where, h is Planck’s constant, ν is the frequency of the exciting radiation, Eb is the
binding energy of the photoelectron relative to the Fermi level of the sample and ϕ is the
work function of the spectrometer.
XPS (also referred by the acronym ESCA, electron spectroscopy for chemical analysis) entails emission from both core and valence electrons of the solid, the stimulating X-ray sources being usually Al Kα (1486.6 eV) or Mg Kα (1253.6 eV). XPS spectrum is a plot of the intensity of photoelectrons Vs binding energy. Since, the electrons whose energies are analyzed in XPS arise from a depth of no greater than about 5 nm, the technique is highly surface specific. A set of binding energies is characteristic
for an element and hence XPS can be used to analyze the composition of samples, considering the area of the peak and cross section for photoemission. Binding energies are not only element specific but contain chemical information like oxidation state, because the energy levels of core electrons depend slightly on the chemical state of the atom.
An experimental problem in XPS is that electrically insulating samples may
charge during measurement, as photoelectrons leave the sample. Due to the positive
charge on the sample, all XPS peaks in the spectrum shift by the same amount to higher
binding energies. Calibration for this effect can be done by using C 1s binding energy
(284.9 eV) from carbon contamination, which is present in most of the catalysts.
X-ray photoelectron spectroscopy (XPS) measurements were performed on a VG
Microtech Multilab ESCA 3000 specrometer with a non-monochromatized Mg-Kα X-ray
source. Base pressure in the analysis chamber was maintained at 3-6 x 10⁻¹⁰ Torr range.
Energy resolution of the spectrometer was set at 0.8 eV with Mg-Kα radiation at a pass
energy of 50 eV.
2.3.6. Temperature programmed techniques: TPD of ammonia
Temperature programmed reduction (TPR), oxidation (TPO), desorption (TPD)
and reaction spectroscopy (TPRS) typically involves monitoring surface or bulk
processes between the solid catalyst and its gaseous environment via continuous analysis
of the gas phase composition as the temperature is raised linearly with time.
Instrumentation for temperature-programmed investigations consists of a reactor charged
with catalyst in a furnace that can be temperature programmed and a thermal conductivity
detector (TCD) to measure the concerned active gas of the gas mixture before and after
interaction.
The acidity of the catalysts were measured by temperature programmed desorption of NH3 (NH3-TPD) using a micromeritics AutoChem-2910 instrument. It was carried out after ~ 0.5 g of the catalyst sample was dehydrated at 600 oC in helium flow (30 cm3 min-1) for 1 h. The temperature was decreased to 100 oC and NH3 was adsorbed by exposing the samples treated in this manner to a stream containing 10 % NH3 in helium for 1 h at 100 oC. It was then flushed with helium for another 1 h to remove physisorbed NH3. The desorption of NH3 was carried out in helium flow (30 cm3 min-1) by increasing the temperature to 600 oC at 10 oC min-1 measuring NH3 desorption using TCD detector.
For zirconia-supported phosphotungstic acid catalysts, NH3-TPD measurements
were carried out after 0.1 g of the catalyst sample was dehydrated at 500 oC in dry air for
1 h and purged with helium for 0.5 h. The temperature was decreased to 125 oC under the
flow of helium and then 0.5 ml NH3 pulses were supplied to the samples until no further
uptake of ammonia was observed. NH3 was desorbed in helium flow by increasing the
temperature to 540 oC at 10 oC min-1 measuring NH3 desorption using a TCD detector.
2.3.7. Infrared adsorption studies - Pyridine adsorption The most common application of IR in catalysis is to identify adsorbed species
and to study the way in which these species are chemisorbed on the surface of the catalyst
[8-10]. More specifically, IR spectroscopy has been used to study the adsorption of
typical probe molecules like ammonia, pyridine and other bases, hydrocarbons, carbon
dioxide which can monitor either the acidic or basic sites on oxide catalysts [11].
Investigation of adsorbed species in relation to their behavior in catalytic reactions is the
main field of application of IR spectroscopy.
The pyridine adsorption studies were carried out in the DRIFT (diffuse reflectance infrared Fourier transform) mode using a Shimadzu SSU 8000 instrument. A calcined powder sample in a sample holder was placed in a specially designed cell. The samples were then heated in-situ from room temperature to 400 oC at a heating rate of 5 oC min-1 in a flowing stream (40 ml min-1) of pure N2. The samples were kept at 400 oC for 3 h and cooled to 100 oC and then pyridine vapor (20 µl) was introduced under N2 flow and the IR spectra were recorded at different temperatures up to 400 oC. A resolution of 4 cm-1 was attained after averaging over 500 scans for all the IR spectra reported in this study.
For zirconia-supported phosphotungstic acid (PTA) catalysts with different PTA
loading, pyridine adsorption studies were performed using NICOLET MODEL 60 SXB
instrument by heating in-situ a self-supporting wafer (20 mg) of the sample from room
temperature to 400 oC with a heating rate of 5 oC min-1 under vacuum (10-6 mbar). The
samples were kept at 400 oC for 3 h followed by cooling to 100 oC. Pyridine vapor (10
mm Hg) was introduced into the cell and allowed to equilibrate for 45 minutes followed
by evacuation at 100 oC for 30 minutes and the IR spectrum was recorded. Then the
temperature was slowly increased and IR spectra were recorded at different temperatures
up to 400 oC.
2.3.8. Diffuse reflectance UV-visible spectroscopy Diffuse reflectance spectroscopy (DRS) is a spectroscopic technique based on the
reflection of light in the ultraviolet (UV), visible (VIS) and near-infrared (NIR) region by
a powdered sample. In a DRS spectrum, the ratio of the light scattered from an “infinitely
thick” closely packed catalyst layer and the scattered light from an infinitely thick layer
of an ideal non-absorbing (white) reference sample is measured as a function of the
wavelength λ. The scattered radiation, emanating from the sample, is collected in an
integration sphere and detected. The most popular continuum theory describing diffuse
reflectance effect is Schuster-Kubelka-Munk (SKM) theory. If the sample is infinitely
thick, the diffuse reflection of the sample (R∞) is related to an apparent absorption (K)
and apparent scattering coefficient (S) by the SKM equation [12, 13]:
F(R∞) = (1-R∞)2 / 2R∞ = K/S (2.8)
At low concentrations of supported transition metal ions (TMI), this equation is a good
representation of the absorbing spectrum and allows a quantitative determination of the
TMI.
F(R∞) = (1-R∞)2 / 2R∞ = K/S = αCTMI / S = k CTMI (2.9)
At a given wavelength λ, S is constant, the above equation gives a linear relation between
F(R∞) and the TMI concentration, CTMI. The coefficients α and k are proportionality
constants.
DRS is a suitable technique for studying the speciation of supported TMIs
because it measures both their d-d transitions and charge transfer bands. The obtained
information is directly chemical since the outer shell electrons are probed. The DRS
technique can be used under in-situ conditions and can be applied at different levels of
sophistication, from detecting the presence of a certain oxidation state of a supported
TMI to a detailed distribution of different oxidation states and coordination environments
under catalytic conditions.
The disadvantage is that the DRS signals are usually broad and overlap with each other, leading to a biased spectral analysis. In addition, the origin of the specific electronic transition is sometimes difficult to isolate due to its dependence on the local coordination environment, the polymerization degree and the specific oxidation state.
Diffuse reflectance UV-vis (DRUV–vis) spectra of catalyst samples were
obtained using a Shimadzu UV-2101 PC spectrometer equipped with a diffuse-
reflectance attachment, with BaSO4 as the reference. The reflectance spectra were
converted into the Kubelka-Munk function, F(R), which is proportional to the absorption
coefficient for low values of F(R). The spectra were measured in the range of 200-800
nm in air at room temperature.
2.3.9. 31P solid-state nuclear magnetic resonance spectroscopy
Nuclear Magnetic Resonance (NMR) spectroscopy gives information on the
interaction of a nucleus having a nuclear spin quantum number, I, greater than zero with
an external magnetic field. The interaction of nuclear spins with the externally applied
magnetic field, B0, and their environment can be described by the spin Hamiltonian H:
H = HZ + HCS + HQ + HD + HJ (2.10)
HZ is a Hamiltonian, which describes the interaction of the nuclear spin with the external
field B0 (Zeeman interaction). The chemical shift Hamiltonian HCS gives the information
on the local environment of a nucleus. The chemical shift is measured relative to that of a
reference compound and is expressed in Hertz or in ppm with respect to the resonance
frequency of the reference compound. HQ describes the quadrupolar interaction of the
nucleus with the surrounding electric field gradient. HD describes the dipolar interaction
with other nuclei, while HJ describes the interaction with other nuclei through J-coupling.
In solid-state NMR, the line shape is determined by dipolar and quadrupolar
interactions. The lines are usually broader because the rigid structure of the solid phase
prevents the averaging of the dipolar interaction (HD) by motions. Since, the first order
quadrupolar and dipolar interactions are proportional to (3 cos2θ - 1), where, θ is the
angle between an internuclear vector and the magnetic field, these interactions can be
removed, to a first order approximation, by spinning the sample around the so-called
magic angle β with respect to the external magnetic field, for which 3 cos2β - 1 = 0, i.e. β
= 54.74o. This technique is known as Magic Angle Spinning (MAS) [14, 15].
Phosphorus contains only one isotope, 31P, with a nuclear spin of I = 1/2. This and
the high magnetic moment (which results in a high sensitivity) makes it an interesting
nucleus for NMR spectroscopy. Solid state NMR gives insight into the structure of solids
and enables us to probe the local environment of a nucleus. Unlike X-ray diffraction,

NMR spectroscopy is not restricted to materials with long-range order but can also be
applied to amorphous substances.
The 31P MAS NMR spectra were recorded using a Bruker DSX-300 spectrometer at 121.5 MHz with high power decoupling with a Bruker 4 mm probe head. The spinning rate was 10 KHz and the delay between two pulses was varied between 1 and 30 s to ensure the complete relaxation of the 31P nuclei occurred. The chemical shifts are given relative to external 85 % H3PO4.
2.3. References 1. J. M. Thomas, W. J. Thomas, Principles and Practice of Heterogeneous catalysis,
VCH, Weinheim, 1997.
2. J. W. Niemantsverdriet, Spectroscopic methods in Heterogeneous catalysis, VCH,
Weinheim, 1993.
3. H. Toraya, M. Yoshimura, S. Somiya, J. Am. Ceram. Soc. 67, (1984) C 119.
4. P. L. Villa, F. Trifiro, I. Pasquon, React. Kinet. Catal. Lett., 1 (1974) 341.
5. T. A. Carlson, X-ray Photoelectron Spectroscopy, Dowden, Hutchinson & Ross:
Stroudsburg, PA, 1978.
6. D. Briggs, M. P. Seah (Eds.), Practical Surface Analysis, Vol. 1: Auger and X-ray
Photoelectron Spectroscopy (2nd ed.) Wiley, New York, 1990.
7. S. Hüfner, Photoelectron Spectroscopy, Springer-Verlag, Berlin, 1995.
8. M. D. Baker, Catal. Rev. Sci. & Eng., 29 (1987) 269.
9. J. A. Lercher, C. Grundling and G. Eder-Mirth, Catal. Today, 27 (1996) 353.
10. J. C. Lavalley, Catal. Today, 27 (1996) 377.
11. M. C. Kung and H. H. Kung, Catal. Rev. Sci. & Eng., 27 (1985) 425.
12. B. M. Weckhuysen, R. A. Schoonheydt, Catal. Today, 49 (1999) 441.
13. R. A. Schoonheydt, Diffuse Reflectance Spectroscopy, Chapter 4, in:
Characterization of Heterogeneous Catalysts, F. Delannay (Ed.), Marcel Dekker,
New York, 1984.
14. R. A. Wind, in A. I. Popov, K. Hallenga (Eds.), Modern NMR Techniques and
Their Application in Chemistry, p. 156, Marcel Dekker, Inc., New York, 1991.
15. R. H. H. Smits, Ph. D. Thesis, Netherlands, 1994.
Chapter 3
Zirconia-supported silicotungstic acid
3.1. Introduction
This section deals with the characterization of zirconia-supported silicotungstic acid (STA) catalysts by techniques such as X-ray diffraction (XRD), Raman spectroscopy, differential thermal analysis (DTA), X-ray photoelectron spectroscopy (XPS), temperature programmed desorption of ammonia (NH3-TPD), FTIR (Fourier transform infrared) pyridine adsorption, and diffuse reflectance ultraviolet-visible (DRUV-vis) spectroscopy. These catalysts were used in the liquid-phase benzoylation of veratrole (1,2-dimethoxy benzene) with benzoic anhydride and tert-butylation of phenol with tert-butanol.
3.2. Preparation Zirconia-supported silicotungstic acid catalysts were prepared by the procedure
given in section 2.2. These catalysts were represented by x SZ-T, where x represents wt.
%, S represents STA, Z represents zirconia and T denotes calcination temperature (oC).
For comparison, catalyst with 15 % STA on silica gel was prepared and calcined
at 300 oC [1]. The silica gel support was prepared by the hydrolysis of tetraethyl
orthosilicate, TEOS (Aldrich) in presence of HNO3 followed by drying at 120 oC for 12
h, powdering and further drying for another 12 h. This catalyst was represented by 15 SS-
300.
3.3. Characterization - Results and discussion 3.3.1. Surface area
Pure zirconium oxyhydroxide dried at 120 oC had a surface area 332 m2g-1 and after
calcination at 750 oC, the surface area was decreased to 16 m2 g-1. Addition of STA to the
support resulted in an increase of the surface area, which reached maximum at 15 % STA
loading (Table 3.1). This could be explained as the strong interaction of STA with the
support reduces the surface diffusion of zirconia and inhibits sintering and stabilizes the
tetragonal phase of zirconia, which leads to an increase in surface area. Above 15 % STA
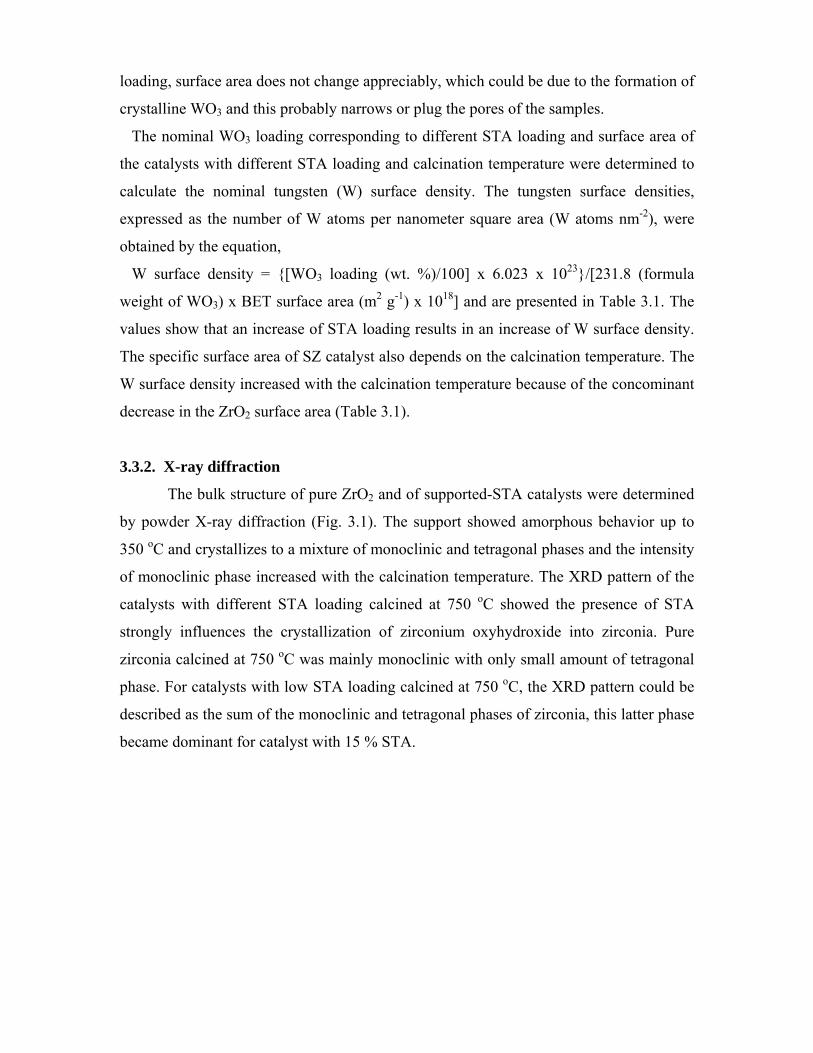
loading, surface area does not change appreciably, which could be due to the formation of
crystalline WO3 and this probably narrows or plug the pores of the samples.
The nominal WO3 loading corresponding to different STA loading and surface area of
the catalysts with different STA loading and calcination temperature were determined to
calculate the nominal tungsten (W) surface density. The tungsten surface densities,
expressed as the number of W atoms per nanometer square area (W atoms nm-2), were
obtained by the equation,
W surface density = {[WO3 loading (wt. %)/100] x 6.023 x 1023}/[231.8 (formula
weight of WO3) x BET surface area (m2 g-1) x 1018] and are presented in Table 3.1. The
values show that an increase of STA loading results in an increase of W surface density.
The specific surface area of SZ catalyst also depends on the calcination temperature. The
W surface density increased with the calcination temperature because of the concominant
decrease in the ZrO2 surface area (Table 3.1).
3.3.2. X-ray diffraction
The bulk structure of pure ZrO2 and of supported-STA catalysts were determined
by powder X-ray diffraction (Fig. 3.1). The support showed amorphous behavior up to
350 oC and crystallizes to a mixture of monoclinic and tetragonal phases and the intensity
of monoclinic phase increased with the calcination temperature. The XRD pattern of the
catalysts with different STA loading calcined at 750 oC showed the presence of STA
strongly influences the crystallization of zirconium oxyhydroxide into zirconia. Pure
zirconia calcined at 750 oC was mainly monoclinic with only small amount of tetragonal
phase. For catalysts with low STA loading calcined at 750 oC, the XRD pattern could be
described as the sum of the monoclinic and tetragonal phases of zirconia, this latter phase
became dominant for catalyst with 15 % STA.
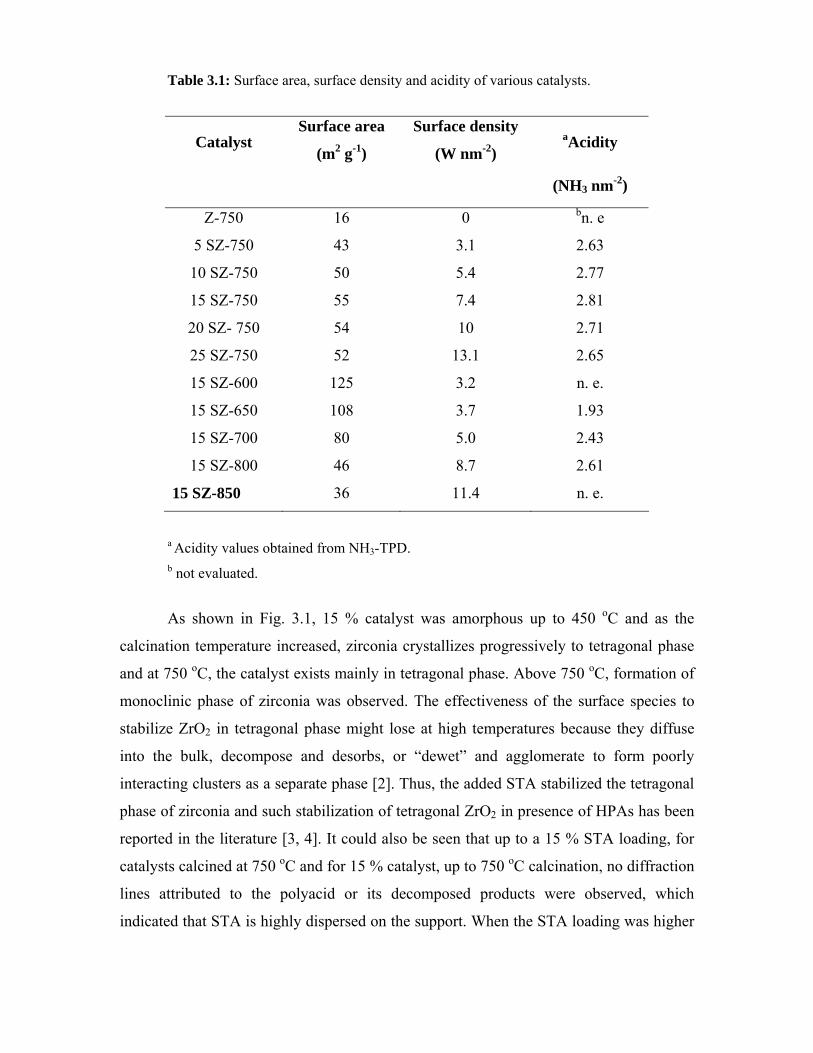
Table 3.1: Surface area, surface density and acidity of various catalysts.
Catalyst Surface area
(m2 g-1)
Surface density
(W nm-2) aAcidity
(NH3 nm-2)
Z-750 16 0 bn. e
5 SZ-750 43 3.1 2.63
10 SZ-750 50 5.4 2.77
15 SZ-750 55 7.4 2.81
20 SZ- 750 54 10 2.71
25 SZ-750 52 13.1 2.65
15 SZ-600 125 3.2 n. e.
15 SZ-650 108 3.7 1.93
15 SZ-700 80 5.0 2.43
15 SZ-800 46 8.7 2.61
15 SZ-850 36 11.4 n. e.
a Acidity values obtained from NH3-TPD. b not evaluated.
As shown in Fig. 3.1, 15 % catalyst was amorphous up to 450 oC and as the
calcination temperature increased, zirconia crystallizes progressively to tetragonal phase
and at 750 oC, the catalyst exists mainly in tetragonal phase. Above 750 oC, formation of
monoclinic phase of zirconia was observed. The effectiveness of the surface species to
stabilize ZrO2 in tetragonal phase might lose at high temperatures because they diffuse
into the bulk, decompose and desorbs, or “dewet” and agglomerate to form poorly
interacting clusters as a separate phase [2]. Thus, the added STA stabilized the tetragonal
phase of zirconia and such stabilization of tetragonal ZrO2 in presence of HPAs has been
reported in the literature [3, 4]. It could also be seen that up to a 15 % STA loading, for
catalysts calcined at 750 oC and for 15 % catalyst, up to 750 oC calcination, no diffraction
lines attributed to the polyacid or its decomposed products were observed, which
indicated that STA is highly dispersed on the support. When the STA loading was higher
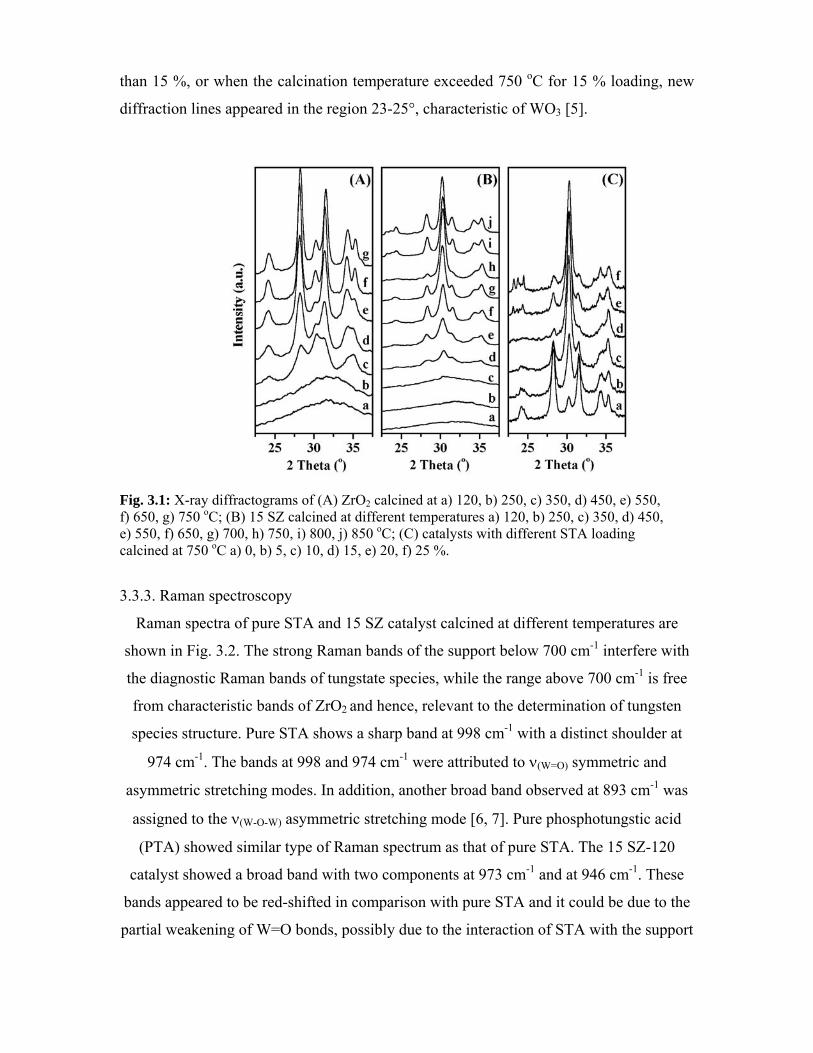
than 15 %, or when the calcination temperature exceeded 750 oC for 15 % loading, new
diffraction lines appeared in the region 23-25°, characteristic of WO3 [5].
Fig. 3.1: X-ray diffractograms of (A) ZrO2 calcined at a) 120, b) 250, c) 350, d) 450, e) 550, f) 650, g) 750 oC; (B) 15 SZ calcined at different temperatures a) 120, b) 250, c) 350, d) 450, e) 550, f) 650, g) 700, h) 750, i) 800, j) 850 oC; (C) catalysts with different STA loading calcined at 750 oC a) 0, b) 5, c) 10, d) 15, e) 20, f) 25 %.
3.3.3. Raman spectroscopy
Raman spectra of pure STA and 15 SZ catalyst calcined at different temperatures are
shown in Fig. 3.2. The strong Raman bands of the support below 700 cm-1 interfere with
the diagnostic Raman bands of tungstate species, while the range above 700 cm-1 is free
from characteristic bands of ZrO2 and hence, relevant to the determination of tungsten
species structure. Pure STA shows a sharp band at 998 cm-1 with a distinct shoulder at
974 cm-1. The bands at 998 and 974 cm-1 were attributed to ν(W=O) symmetric and
asymmetric stretching modes. In addition, another broad band observed at 893 cm-1 was
assigned to the ν(W-O-W) asymmetric stretching mode [6, 7]. Pure phosphotungstic acid
(PTA) showed similar type of Raman spectrum as that of pure STA. The 15 SZ-120
catalyst showed a broad band with two components at 973 cm-1 and at 946 cm-1. These
bands appeared to be red-shifted in comparison with pure STA and it could be due to the
partial weakening of W=O bonds, possibly due to the interaction of STA with the support
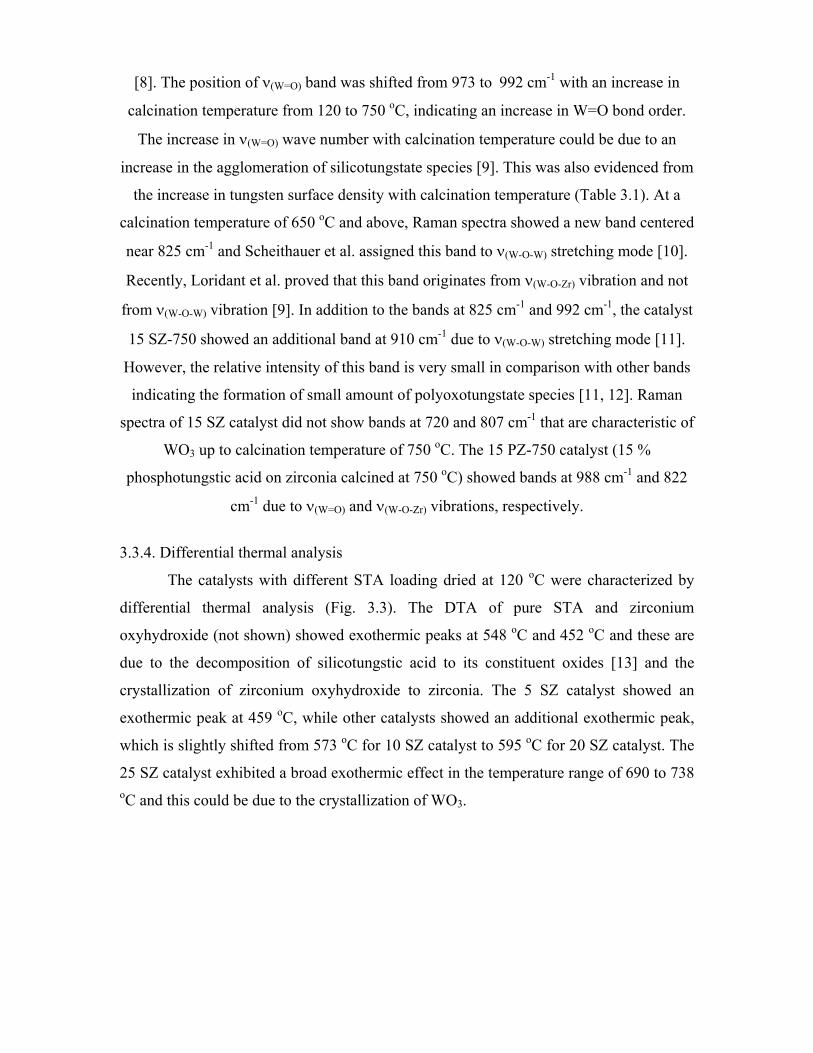
[8]. The position of ν(W=O) band was shifted from 973 to 992 cm-1 with an increase in
calcination temperature from 120 to 750 oC, indicating an increase in W=O bond order.
The increase in ν(W=O) wave number with calcination temperature could be due to an
increase in the agglomeration of silicotungstate species [9]. This was also evidenced from
the increase in tungsten surface density with calcination temperature (Table 3.1). At a
calcination temperature of 650 oC and above, Raman spectra showed a new band centered
near 825 cm-1 and Scheithauer et al. assigned this band to ν(W-O-W) stretching mode [10].
Recently, Loridant et al. proved that this band originates from ν(W-O-Zr) vibration and not
from ν(W-O-W) vibration [9]. In addition to the bands at 825 cm-1 and 992 cm-1, the catalyst
15 SZ-750 showed an additional band at 910 cm-1 due to ν(W-O-W) stretching mode [11].
However, the relative intensity of this band is very small in comparison with other bands
indicating the formation of small amount of polyoxotungstate species [11, 12]. Raman
spectra of 15 SZ catalyst did not show bands at 720 and 807 cm-1 that are characteristic of
WO3 up to calcination temperature of 750 oC. The 15 PZ-750 catalyst (15 %
phosphotungstic acid on zirconia calcined at 750 oC) showed bands at 988 cm-1 and 822
cm-1 due to ν(W=O) and ν(W-O-Zr) vibrations, respectively.
3.3.4. Differential thermal analysis
The catalysts with different STA loading dried at 120 oC were characterized by
differential thermal analysis (Fig. 3.3). The DTA of pure STA and zirconium
oxyhydroxide (not shown) showed exothermic peaks at 548 oC and 452 oC and these are
due to the decomposition of silicotungstic acid to its constituent oxides [13] and the
crystallization of zirconium oxyhydroxide to zirconia. The 5 SZ catalyst showed an
exothermic peak at 459 oC, while other catalysts showed an additional exothermic peak,
which is slightly shifted from 573 oC for 10 SZ catalyst to 595 oC for 20 SZ catalyst. The
25 SZ catalyst exhibited a broad exothermic effect in the temperature range of 690 to 738 oC and this could be due to the crystallization of WO3.
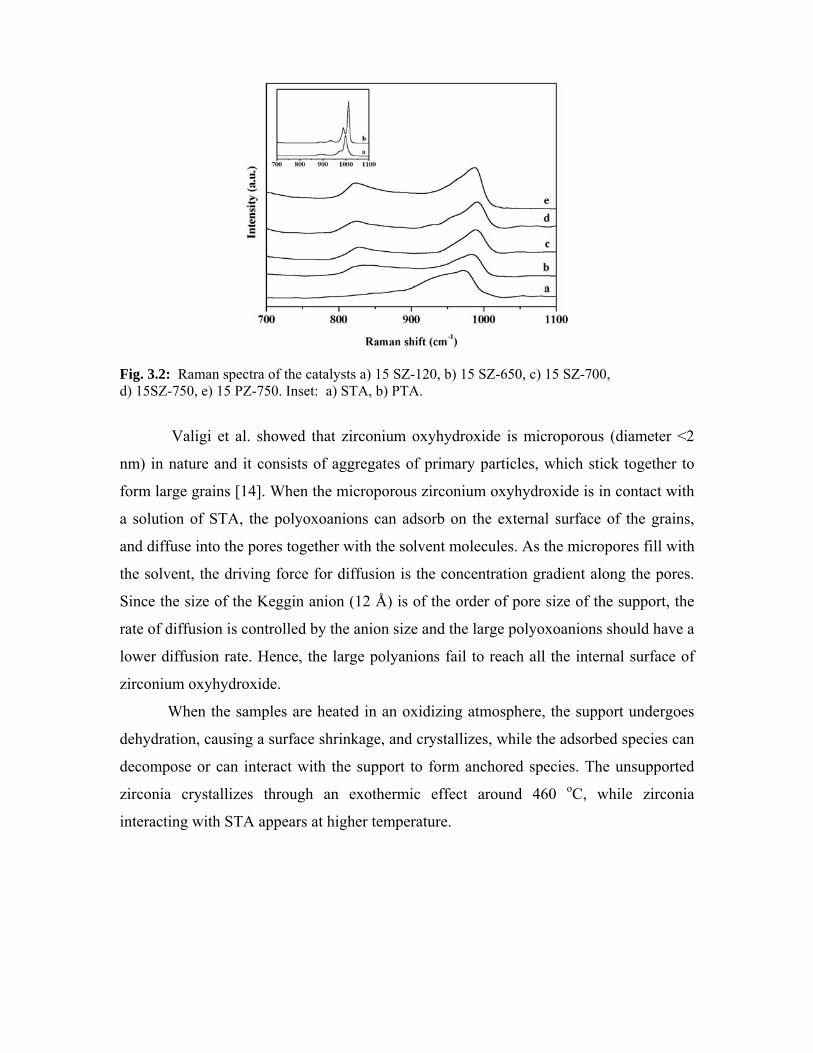
Fig. 3.2: Raman spectra of the catalysts a) 15 SZ-120, b) 15 SZ-650, c) 15 SZ-700, d) 15SZ-750, e) 15 PZ-750. Inset: a) STA, b) PTA.
Valigi et al. showed that zirconium oxyhydroxide is microporous (diameter <2
nm) in nature and it consists of aggregates of primary particles, which stick together to
form large grains [14]. When the microporous zirconium oxyhydroxide is in contact with
a solution of STA, the polyoxoanions can adsorb on the external surface of the grains,
and diffuse into the pores together with the solvent molecules. As the micropores fill with
the solvent, the driving force for diffusion is the concentration gradient along the pores.
Since the size of the Keggin anion (12 Å) is of the order of pore size of the support, the
rate of diffusion is controlled by the anion size and the large polyoxoanions should have a
lower diffusion rate. Hence, the large polyanions fail to reach all the internal surface of
zirconium oxyhydroxide.
When the samples are heated in an oxidizing atmosphere, the support undergoes
dehydration, causing a surface shrinkage, and crystallizes, while the adsorbed species can
decompose or can interact with the support to form anchored species. The unsupported
zirconia crystallizes through an exothermic effect around 460 oC, while zirconia
interacting with STA appears at higher temperature.
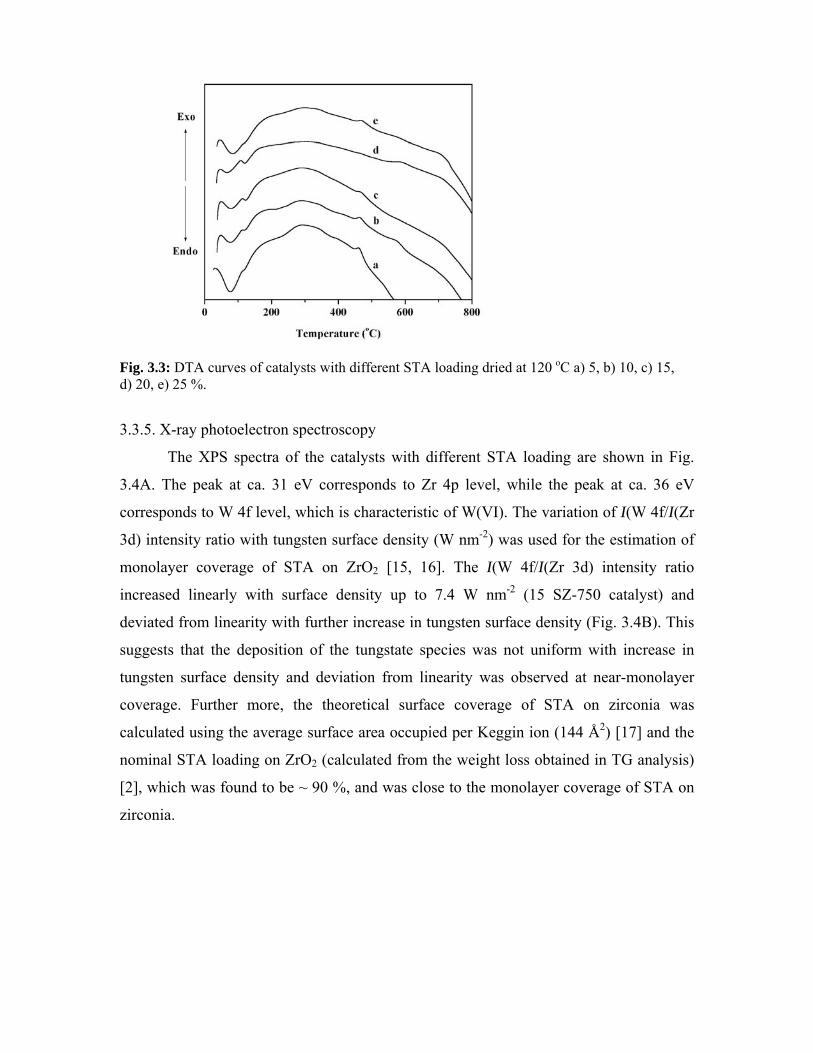
Fig. 3.3: DTA curves of catalysts with different STA loading dried at 120 oC a) 5, b) 10, c) 15, d) 20, e) 25 %.
3.3.5. X-ray photoelectron spectroscopy
The XPS spectra of the catalysts with different STA loading are shown in Fig.
3.4A. The peak at ca. 31 eV corresponds to Zr 4p level, while the peak at ca. 36 eV
corresponds to W 4f level, which is characteristic of W(VI). The variation of I(W 4f/I(Zr
3d) intensity ratio with tungsten surface density (W nm-2) was used for the estimation of
monolayer coverage of STA on ZrO2 [15, 16]. The I(W 4f/I(Zr 3d) intensity ratio
increased linearly with surface density up to 7.4 W nm-2 (15 SZ-750 catalyst) and
deviated from linearity with further increase in tungsten surface density (Fig. 3.4B). This
suggests that the deposition of the tungstate species was not uniform with increase in
tungsten surface density and deviation from linearity was observed at near-monolayer
coverage. Further more, the theoretical surface coverage of STA on zirconia was
calculated using the average surface area occupied per Keggin ion (144 Å2) [17] and the
nominal STA loading on ZrO2 (calculated from the weight loss obtained in TG analysis)
[2], which was found to be ~ 90 %, and was close to the monolayer coverage of STA on
zirconia.
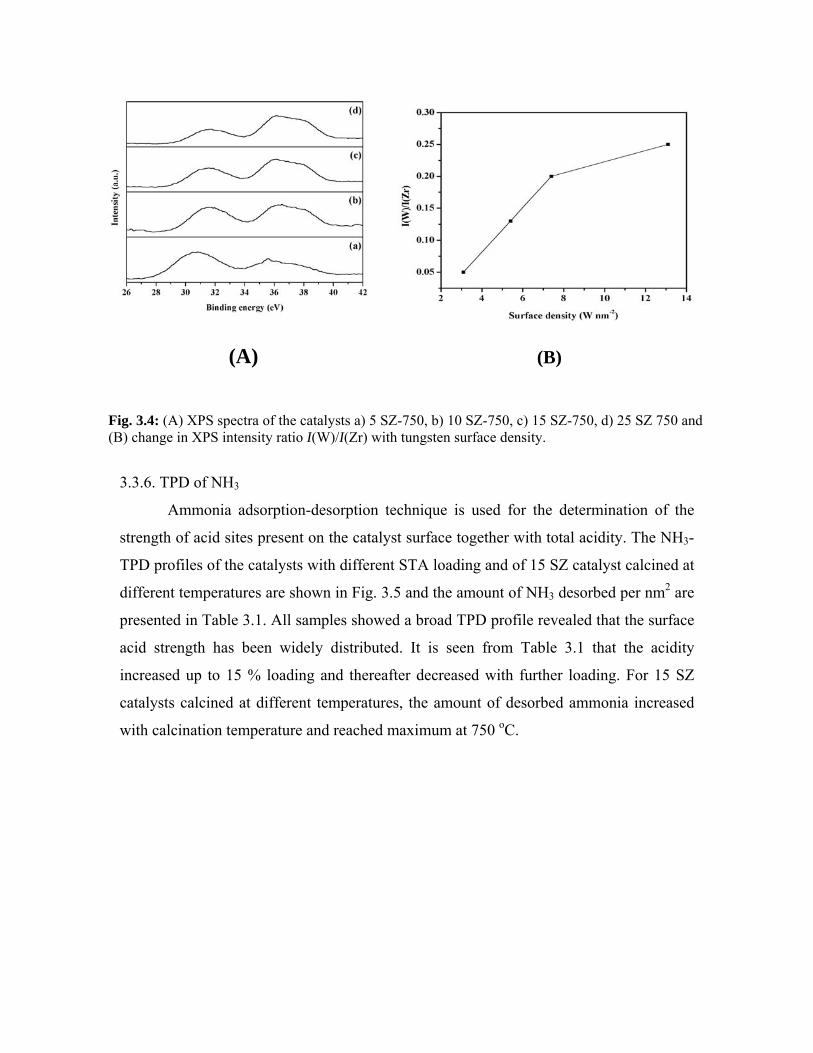
(A)
(B)
Fig. 3.4: (A) XPS spectra of the catalysts a) 5 SZ-750, b) 10 SZ-750, c) 15 SZ-750, d) 25 SZ 750 and (B) change in XPS intensity ratio I(W)/I(Zr) with tungsten surface density.
3.3.6. TPD of NH3
Ammonia adsorption-desorption technique is used for the determination of the
strength of acid sites present on the catalyst surface together with total acidity. The NH3-
TPD profiles of the catalysts with different STA loading and of 15 SZ catalyst calcined at
different temperatures are shown in Fig. 3.5 and the amount of NH3 desorbed per nm2 are
presented in Table 3.1. All samples showed a broad TPD profile revealed that the surface
acid strength has been widely distributed. It is seen from Table 3.1 that the acidity
increased up to 15 % loading and thereafter decreased with further loading. For 15 SZ
catalysts calcined at different temperatures, the amount of desorbed ammonia increased
with calcination temperature and reached maximum at 750 oC.
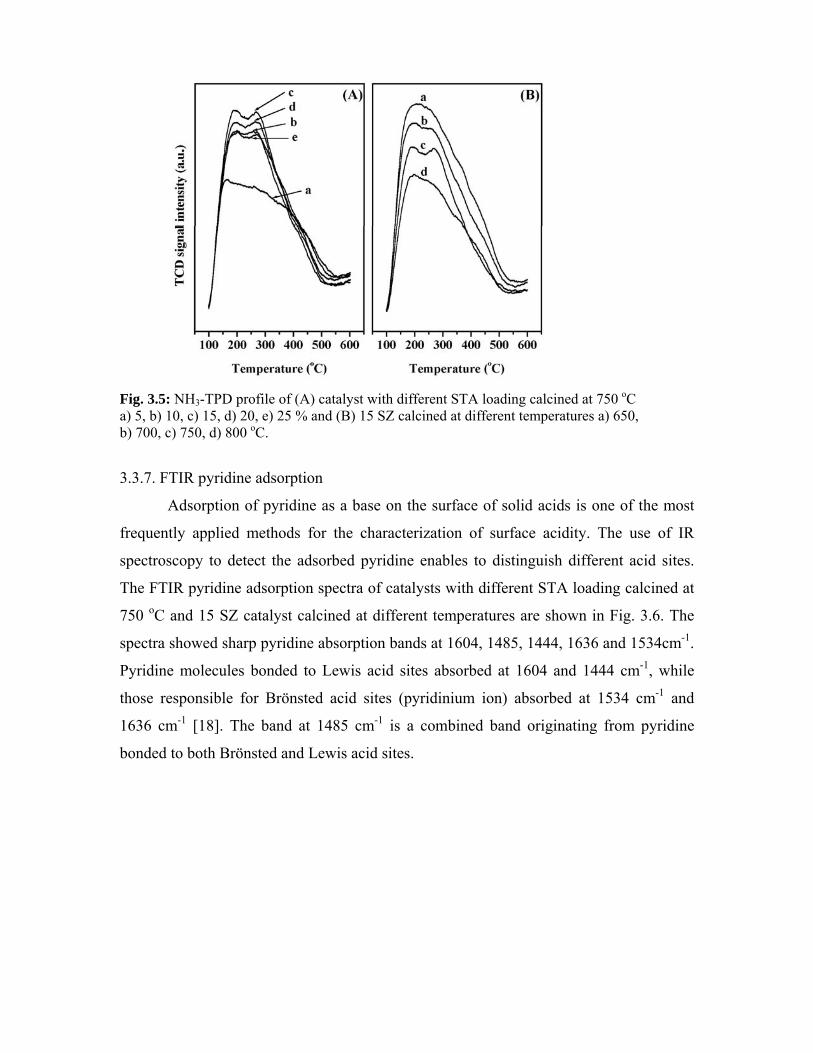
Fig. 3.5: NH3-TPD profile of (A) catalyst with different STA loading calcined at 750 oC a) 5, b) 10, c) 15, d) 20, e) 25 % and (B) 15 SZ calcined at different temperatures a) 650, b) 700, c) 750, d) 800 oC.
3.3.7. FTIR pyridine adsorption
Adsorption of pyridine as a base on the surface of solid acids is one of the most
frequently applied methods for the characterization of surface acidity. The use of IR
spectroscopy to detect the adsorbed pyridine enables to distinguish different acid sites.
The FTIR pyridine adsorption spectra of catalysts with different STA loading calcined at
750 oC and 15 SZ catalyst calcined at different temperatures are shown in Fig. 3.6. The
spectra showed sharp pyridine absorption bands at 1604, 1485, 1444, 1636 and 1534cm-1.
Pyridine molecules bonded to Lewis acid sites absorbed at 1604 and 1444 cm-1, while
those responsible for Brönsted acid sites (pyridinium ion) absorbed at 1534 cm-1 and
1636 cm-1 [18]. The band at 1485 cm-1 is a combined band originating from pyridine
bonded to both Brönsted and Lewis acid sites.
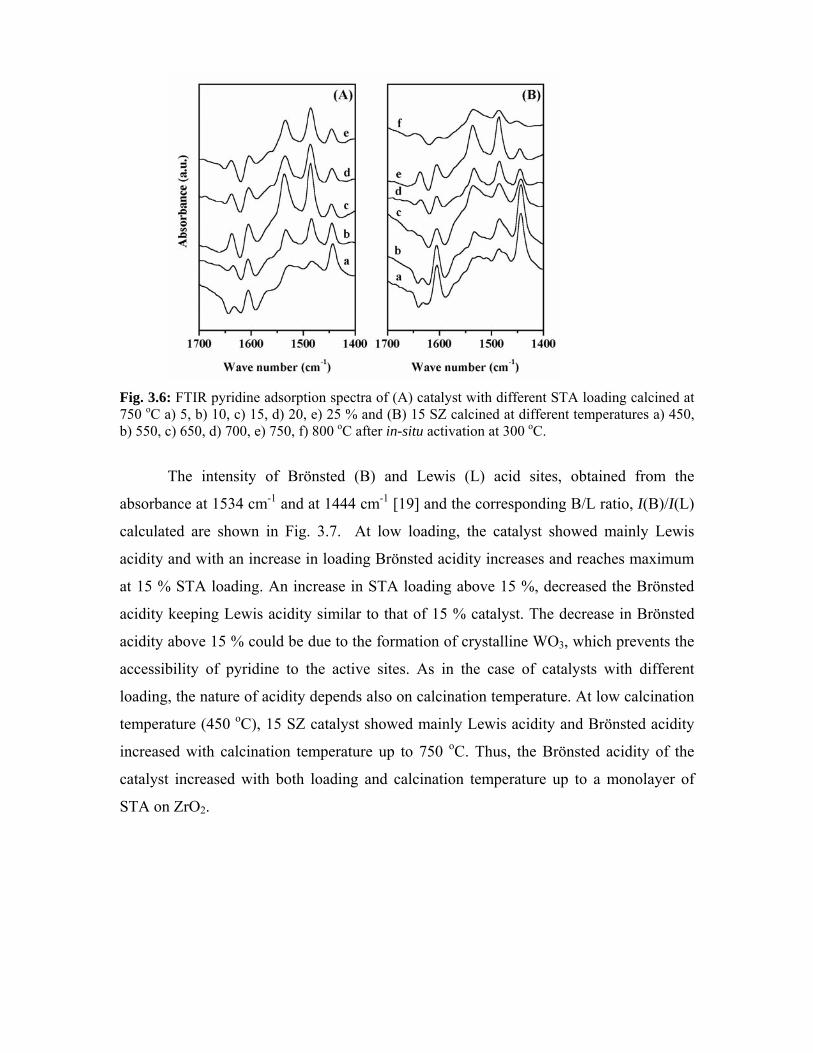
Fig. 3.6: FTIR pyridine adsorption spectra of (A) catalyst with different STA loading calcined at 750 oC a) 5, b) 10, c) 15, d) 20, e) 25 % and (B) 15 SZ calcined at different temperatures a) 450, b) 550, c) 650, d) 700, e) 750, f) 800 oC after in-situ activation at 300 oC.
The intensity of Brönsted (B) and Lewis (L) acid sites, obtained from the
absorbance at 1534 cm-1 and at 1444 cm-1 [19] and the corresponding B/L ratio, I(B)/I(L)
calculated are shown in Fig. 3.7. At low loading, the catalyst showed mainly Lewis
acidity and with an increase in loading Brönsted acidity increases and reaches maximum
at 15 % STA loading. An increase in STA loading above 15 %, decreased the Brönsted
acidity keeping Lewis acidity similar to that of 15 % catalyst. The decrease in Brönsted
acidity above 15 % could be due to the formation of crystalline WO3, which prevents the
accessibility of pyridine to the active sites. As in the case of catalysts with different
loading, the nature of acidity depends also on calcination temperature. At low calcination
temperature (450 oC), 15 SZ catalyst showed mainly Lewis acidity and Brönsted acidity
increased with calcination temperature up to 750 oC. Thus, the Brönsted acidity of the
catalyst increased with both loading and calcination temperature up to a monolayer of
STA on ZrO2.
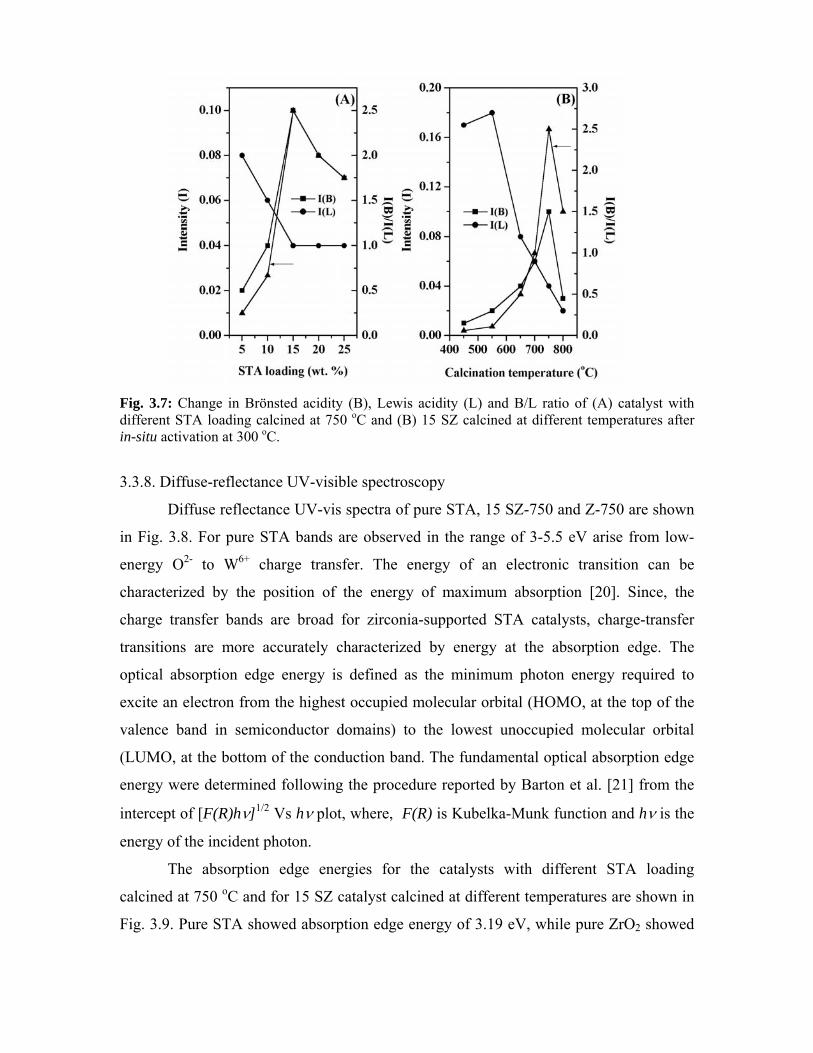
Fig. 3.7: Change in Brönsted acidity (B), Lewis acidity (L) and B/L ratio of (A) catalyst with different STA loading calcined at 750 oC and (B) 15 SZ calcined at different temperatures after in-situ activation at 300 oC.
3.3.8. Diffuse-reflectance UV-visible spectroscopy
Diffuse reflectance UV-vis spectra of pure STA, 15 SZ-750 and Z-750 are shown
in Fig. 3.8. For pure STA bands are observed in the range of 3-5.5 eV arise from low-
energy O2- to W6+ charge transfer. The energy of an electronic transition can be
characterized by the position of the energy of maximum absorption [20]. Since, the
charge transfer bands are broad for zirconia-supported STA catalysts, charge-transfer
transitions are more accurately characterized by energy at the absorption edge. The
optical absorption edge energy is defined as the minimum photon energy required to
excite an electron from the highest occupied molecular orbital (HOMO, at the top of the
valence band in semiconductor domains) to the lowest unoccupied molecular orbital
(LUMO, at the bottom of the conduction band. The fundamental optical absorption edge
energy were determined following the procedure reported by Barton et al. [21] from the
intercept of [F(R)hν]1/2 Vs hν plot, where, F(R) is Kubelka-Munk function and hν is the
energy of the incident photon.
The absorption edge energies for the catalysts with different STA loading
calcined at 750 oC and for 15 SZ catalyst calcined at different temperatures are shown in
Fig. 3.9. Pure STA showed absorption edge energy of 3.19 eV, while pure ZrO2 showed
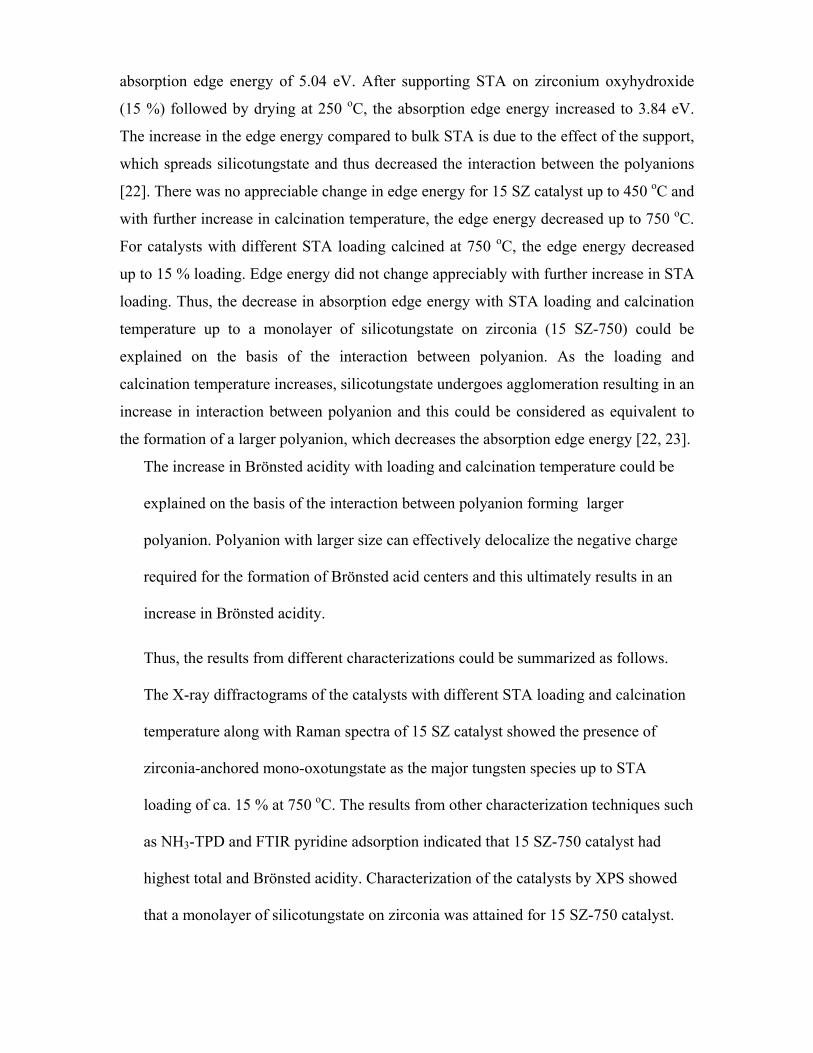
absorption edge energy of 5.04 eV. After supporting STA on zirconium oxyhydroxide
(15 %) followed by drying at 250 oC, the absorption edge energy increased to 3.84 eV.
The increase in the edge energy compared to bulk STA is due to the effect of the support,
which spreads silicotungstate and thus decreased the interaction between the polyanions
[22]. There was no appreciable change in edge energy for 15 SZ catalyst up to 450 oC and
with further increase in calcination temperature, the edge energy decreased up to 750 oC.
For catalysts with different STA loading calcined at 750 oC, the edge energy decreased
up to 15 % loading. Edge energy did not change appreciably with further increase in STA
loading. Thus, the decrease in absorption edge energy with STA loading and calcination
temperature up to a monolayer of silicotungstate on zirconia (15 SZ-750) could be
explained on the basis of the interaction between polyanion. As the loading and
calcination temperature increases, silicotungstate undergoes agglomeration resulting in an
increase in interaction between polyanion and this could be considered as equivalent to
the formation of a larger polyanion, which decreases the absorption edge energy [22, 23].
The increase in Brönsted acidity with loading and calcination temperature could be
explained on the basis of the interaction between polyanion forming larger
polyanion. Polyanion with larger size can effectively delocalize the negative charge
required for the formation of Brönsted acid centers and this ultimately results in an
increase in Brönsted acidity.
Thus, the results from different characterizations could be summarized as follows.
The X-ray diffractograms of the catalysts with different STA loading and calcination
temperature along with Raman spectra of 15 SZ catalyst showed the presence of
zirconia-anchored mono-oxotungstate as the major tungsten species up to STA
loading of ca. 15 % at 750 oC. The results from other characterization techniques such
as NH3-TPD and FTIR pyridine adsorption indicated that 15 SZ-750 catalyst had
highest total and Brönsted acidity. Characterization of the catalysts by XPS showed
that a monolayer of silicotungstate on zirconia was attained for 15 SZ-750 catalyst.
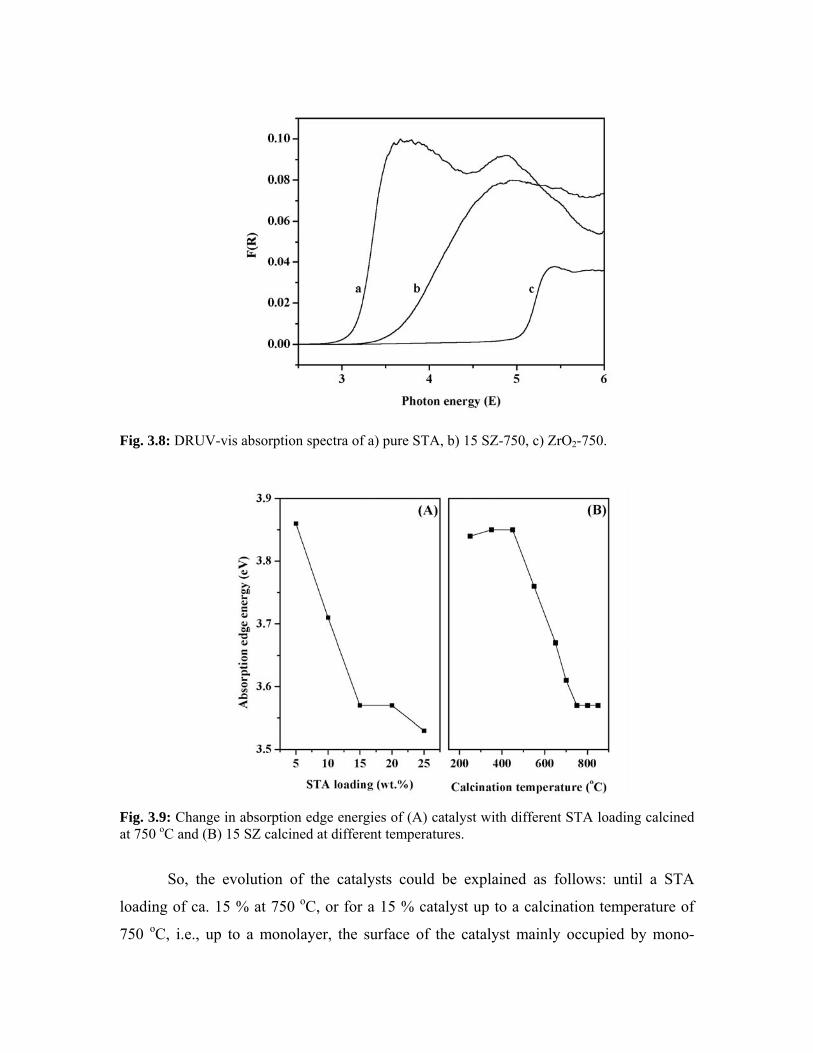
Fig. 3.8: DRUV-vis absorption spectra of a) pure STA, b) 15 SZ-750, c) ZrO2-750.
Fig. 3.9: Change in absorption edge energies of (A) catalyst with different STA loading calcined at 750 oC and (B) 15 SZ calcined at different temperatures.
So, the evolution of the catalysts could be explained as follows: until a STA
loading of ca. 15 % at 750 oC, or for a 15 % catalyst up to a calcination temperature of
750 oC, i.e., up to a monolayer, the surface of the catalyst mainly occupied by mono-
oxotungstate and below this monolayer coverage, acidity of the catalyst increased with
STA loading and calcination temperature. When the surface coverage exceeds
monolayer, the formation of crystalline WO3 was indicated, which was accompanied by a
decrease in Brönsted acidity.
3.4. Veratrole benzoylation
3.4.1. Introduction
Friedel-Crafts acylation reactions are of great importance in the industrial
manufacture of aryl ketones, and are used extensively in the production of
pharmaceuticals, insecticides, dyes and other commercial products. Conventionally, these
reactions are carried out in presence of aluminium chloride, using an acylating agent such
as acid chloride in a volatile organic solvent [24]. Due to the complexation of the product
ketone with aluminium chloride stoichiometric excess of the catalyst must be used, which
is then destroyed in the hydrolysis step required for product isolation. The large quantities
of metal salt waste formed, as well as the production of HCl, have aroused much research
interest in the development of new cleaner technologies, which generate minimal waste.
A major step towards waste minimization would be to develop a truly catalytic process,
using an acid anhydride, where the catalyst does not form a strong complex with product
and is recyclable. At present, considerable efforts are being made to find efficient,
sustainable, recyclable and eco-friendly solid acid catalysts, as substitute for current
homogeneous Brönsted and Lewis acids. Various catalysts such as zeolites [25-28],
heteropoly acids [29-32], and sulfated metal oxides [33-35] were tested for this reaction.
3.4.2. Experimental procedure
The liquid-phase benzoylation reactions were carried out in a 50 ml glass batch
reactor (slurry reactor) with anhydrous CaCl2 guard tube. The reaction temperature was
maintained by silicon oil bath equipped with a thermostat and magnetic stirrer. The
catalyst freshly activated at 500 oC for 2 h, was weighed in the reactor and then veratrole
(Aldrich, 99 %) was added according to the proportion desired. Finally benzoic
anhydride, BA (E. Merck, 98 %) was added in order to obtain the desired molar ratio of
veratrole to benzoic anhydride. For example, a typical reaction mixture consists of 3.77 g
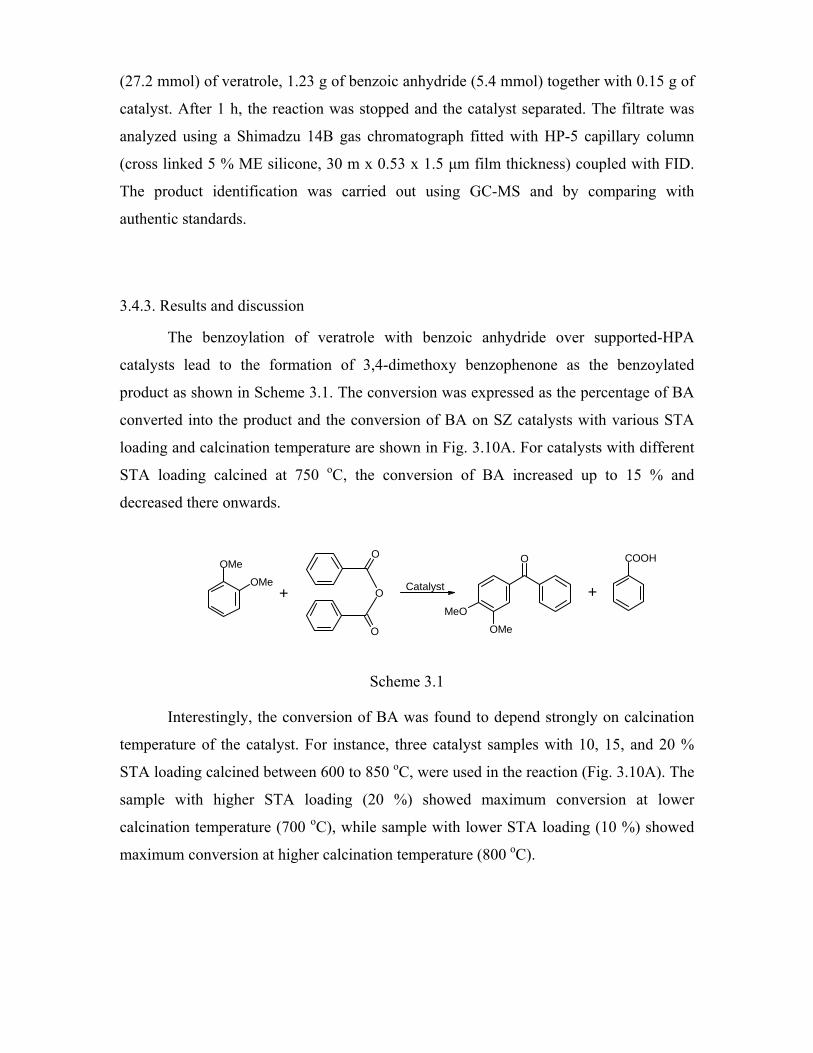
(27.2 mmol) of veratrole, 1.23 g of benzoic anhydride (5.4 mmol) together with 0.15 g of
catalyst. After 1 h, the reaction was stopped and the catalyst separated. The filtrate was
analyzed using a Shimadzu 14B gas chromatograph fitted with HP-5 capillary column
(cross linked 5 % ME silicone, 30 m x 0.53 x 1.5 µm film thickness) coupled with FID.
The product identification was carried out using GC-MS and by comparing with
authentic standards.
3.4.3. Results and discussion
The benzoylation of veratrole with benzoic anhydride over supported-HPA
catalysts lead to the formation of 3,4-dimethoxy benzophenone as the benzoylated
product as shown in Scheme 3.1. The conversion was expressed as the percentage of BA
converted into the product and the conversion of BA on SZ catalysts with various STA
loading and calcination temperature are shown in Fig. 3.10A. For catalysts with different
STA loading calcined at 750 oC, the conversion of BA increased up to 15 % and
decreased there onwards.
OMe
OMe
O
O
O
OMe
MeO
O COOH
+ +Catalyst
Scheme 3.1
Interestingly, the conversion of BA was found to depend strongly on calcination
temperature of the catalyst. For instance, three catalyst samples with 10, 15, and 20 %
STA loading calcined between 600 to 850 oC, were used in the reaction (Fig. 3.10A). The
sample with higher STA loading (20 %) showed maximum conversion at lower
calcination temperature (700 oC), while sample with lower STA loading (10 %) showed
maximum conversion at higher calcination temperature (800 oC).
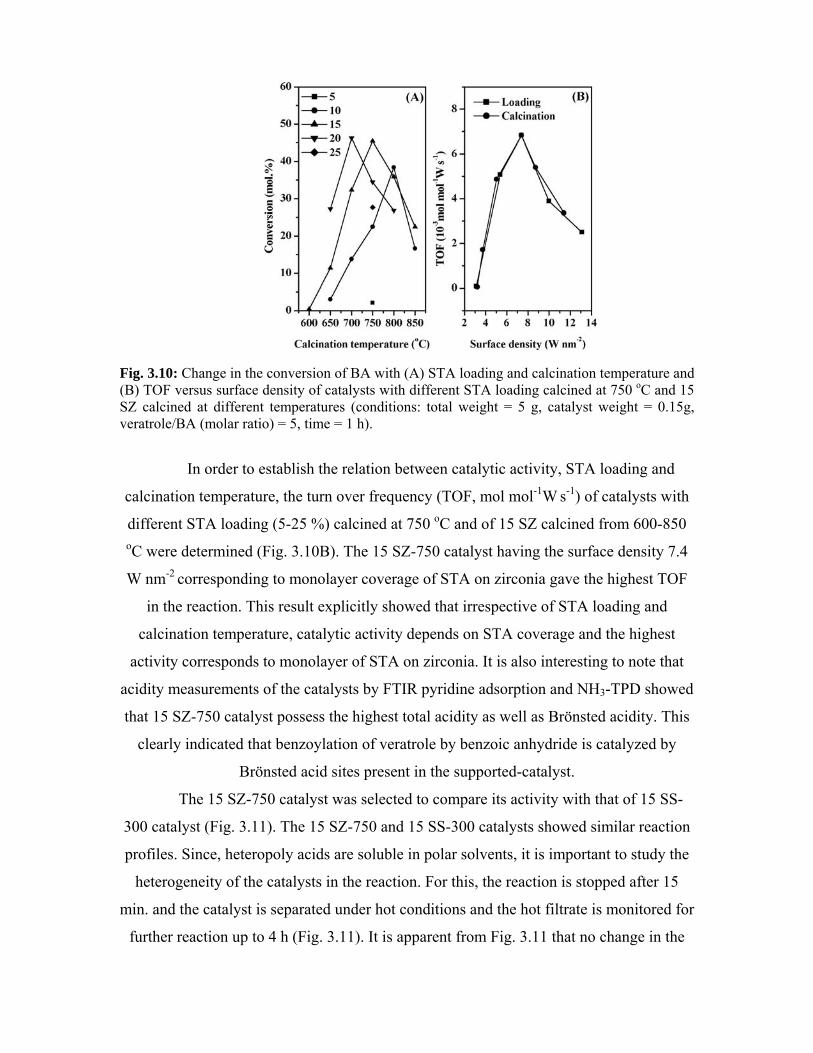
Fig. 3.10: Change in the conversion of BA with (A) STA loading and calcination temperature and (B) TOF versus surface density of catalysts with different STA loading calcined at 750 oC and 15 SZ calcined at different temperatures (conditions: total weight = 5 g, catalyst weight = 0.15g, veratrole/BA (molar ratio) = 5, time = 1 h).
In order to establish the relation between catalytic activity, STA loading and
calcination temperature, the turn over frequency (TOF, mol mol-1W s-1) of catalysts with
different STA loading (5-25 %) calcined at 750 oC and of 15 SZ calcined from 600-850 oC were determined (Fig. 3.10B). The 15 SZ-750 catalyst having the surface density 7.4
W nm-2 corresponding to monolayer coverage of STA on zirconia gave the highest TOF
in the reaction. This result explicitly showed that irrespective of STA loading and
calcination temperature, catalytic activity depends on STA coverage and the highest
activity corresponds to monolayer of STA on zirconia. It is also interesting to note that
acidity measurements of the catalysts by FTIR pyridine adsorption and NH3-TPD showed
that 15 SZ-750 catalyst possess the highest total acidity as well as Brönsted acidity. This
clearly indicated that benzoylation of veratrole by benzoic anhydride is catalyzed by
Brönsted acid sites present in the supported-catalyst.
The 15 SZ-750 catalyst was selected to compare its activity with that of 15 SS-
300 catalyst (Fig. 3.11). The 15 SZ-750 and 15 SS-300 catalysts showed similar reaction
profiles. Since, heteropoly acids are soluble in polar solvents, it is important to study the
heterogeneity of the catalysts in the reaction. For this, the reaction is stopped after 15
min. and the catalyst is separated under hot conditions and the hot filtrate is monitored for
further reaction up to 4 h (Fig. 3.11). It is apparent from Fig. 3.11 that no change in the
conversion of BA with time for filtrates obtained from 15 SZ-750 catalyst. However, for
the filtrate obtained from 15 SS-300 catalyst, the conversion of BA increased from 14 %
at 15 min. to 48 % after 4 h. The analysis of the filtrate by inductively coupled plasma-
optical emission spectroscopy (ICP-OES) showed 70 % STA from 15 SS-300 catalyst
leached into the reaction medium during reaction. This clearly showed that STA on
zirconia act as heterogeneous catalyst, while STA on silica is not stable and leaches into
the reaction medium during reaction.
Thus, 15 SZ-750 catalyst with highest activity was used to study the effect
different reaction parameters. The influence of temperature on the conversion of BA was
studied in the temperature range 60 to 120 oC for 2 h (Fig. 3.12A). At 60 oC, the
conversion was 31 % and it increased to 99 % at 120 oC. The influence of veratrole/BA
molar ratio (3 to 9) on the conversion of BA was studied keeping the total weight of the
reaction mixture constant (Fig. 3.12B). At a molar ratio of 3, the conversion of BA was
35 % and as the molar ratio increased to 9, conversion increased to 83 %. This is
probably due to the inhibiting effect of 3,4-dimethoxy benzophenone, which can be
strongly adsorbed on the catalyst surface. This inhibiting effect would be less significant
for mixtures richer in veratrole, because the excess of veratrole acts as a solvent for the
ketone produced and product inhibition is reduced, and therefore the conversion of BA is
higher at higher veratrole/BA molar ratio [27, 36]. The influence of catalyst weight on the
conversion of BA showed that catalyst concentration of 2 wt. % (of the total mass of the
reactants) gave conversion of BA 37 % and increased to 84 % with 5 wt. % catalyst (Fig.
3.12C), which could be due to the increase in the number of active sites of the catalyst.
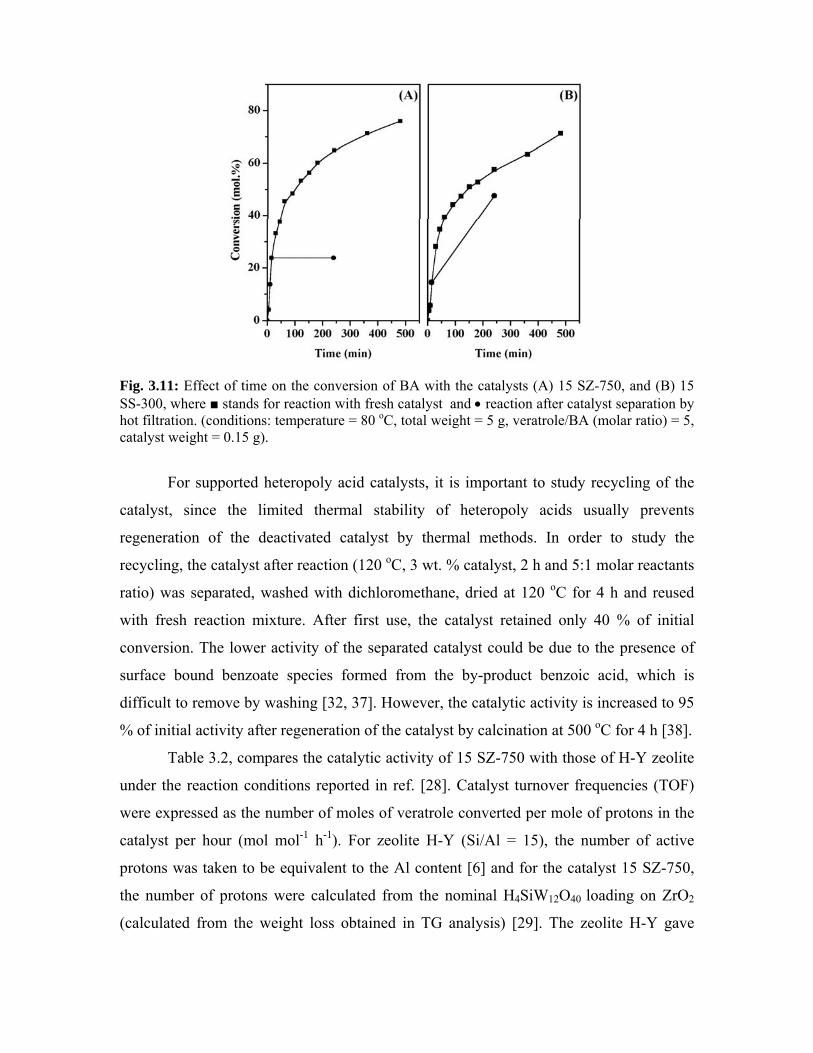
Fig. 3.11: Effect of time on the conversion of BA with the catalysts (A) 15 SZ-750, and (B) 15 SS-300, where ■ stands for reaction with fresh catalyst and • reaction after catalyst separation by hot filtration. (conditions: temperature = 80 oC, total weight = 5 g, veratrole/BA (molar ratio) = 5, catalyst weight = 0.15 g).
For supported heteropoly acid catalysts, it is important to study recycling of the
catalyst, since the limited thermal stability of heteropoly acids usually prevents
regeneration of the deactivated catalyst by thermal methods. In order to study the
recycling, the catalyst after reaction (120 oC, 3 wt. % catalyst, 2 h and 5:1 molar reactants
ratio) was separated, washed with dichloromethane, dried at 120 oC for 4 h and reused
with fresh reaction mixture. After first use, the catalyst retained only 40 % of initial
conversion. The lower activity of the separated catalyst could be due to the presence of
surface bound benzoate species formed from the by-product benzoic acid, which is
difficult to remove by washing [32, 37]. However, the catalytic activity is increased to 95
% of initial activity after regeneration of the catalyst by calcination at 500 oC for 4 h [38].
Table 3.2, compares the catalytic activity of 15 SZ-750 with those of H-Y zeolite
under the reaction conditions reported in ref. [28]. Catalyst turnover frequencies (TOF)
were expressed as the number of moles of veratrole converted per mole of protons in the
catalyst per hour (mol mol-1 h-1). For zeolite H-Y (Si/Al = 15), the number of active
protons was taken to be equivalent to the Al content [6] and for the catalyst 15 SZ-750,
the number of protons were calculated from the nominal H4SiW12O40 loading on ZrO2
(calculated from the weight loss obtained in TG analysis) [29]. The zeolite H-Y gave
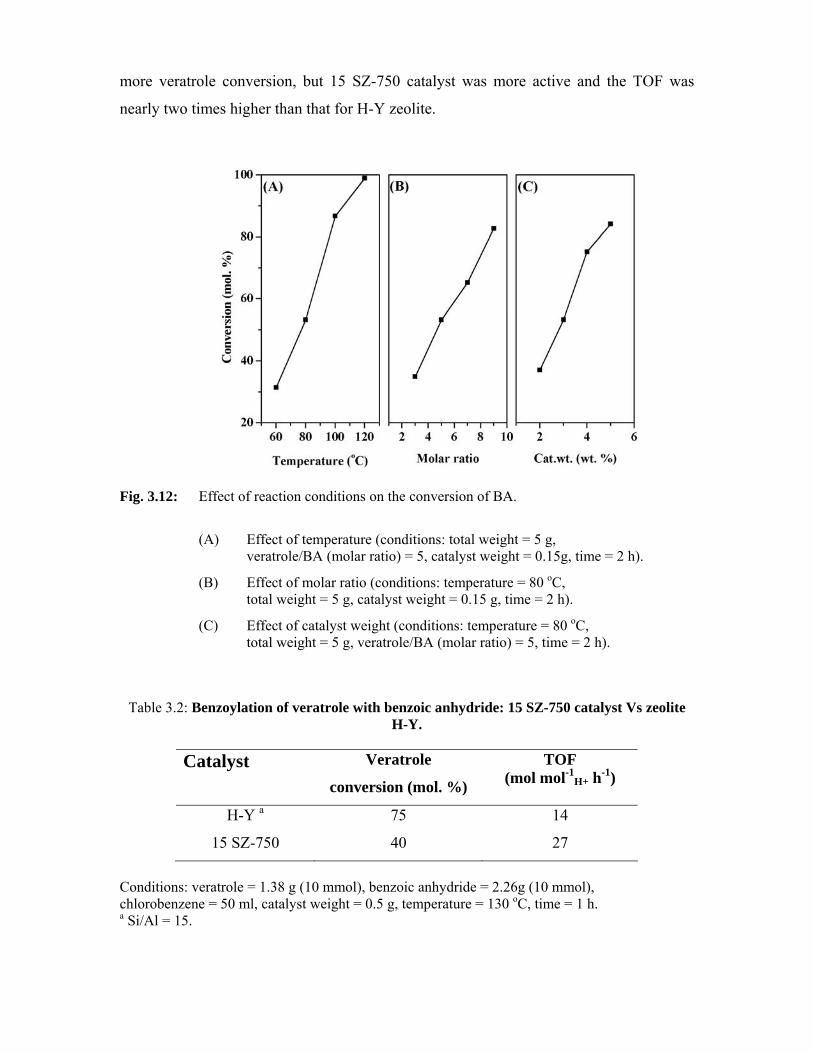
more veratrole conversion, but 15 SZ-750 catalyst was more active and the TOF was
nearly two times higher than that for H-Y zeolite.
Effect of reaction conditions on the conversion of BA.
(A) Effect of temperature (conditions: total weight = 5 g, veratrole/BA (molar ratio) = 5, catalyst weight = 0.15g, time = 2 h).
(B) Effect of molar ratio (conditions: temperature = 80 oC, total weight = 5 g, catalyst weight = 0.15 g, time = 2 h).
Fig. 3.12:
(C) Effect of catalyst weight (conditions: temperature = 80 oC, total weight = 5 g, veratrole/BA (molar ratio) = 5, time = 2 h).
Table 3.2: Benzoylation of veratrole with benzoic anhydride: 15 SZ-750 catalyst Vs zeolite H-Y.
Catalyst Veratrole
conversion (mol. %)
TOF (mol mol-1
H+ h-1)
H-Y a 75 14
15 SZ-750 40 27
Conditions: veratrole = 1.38 g (10 mmol), benzoic anhydride = 2.26g (10 mmol), chlorobenzene = 50 ml, catalyst weight = 0.5 g, temperature = 130 oC, time = 1 h. a Si/Al = 15.
3.5. Phenol tert-butylation
3.5.1. Introduction The alkylation of phenol with different alcohols is industrially important as it is
used for the production of a variety of products [39]. Among these, alkylation of phenol
with tert-butanol to tert-butylated phenols is important. For instance, 2-tert-butyl phenol
(2-TBP) is a starting material for the synthesis of antioxidants and agrochemicals,
whereas 4-tert-butyl phenol (4-TBP) is used to make fragrances and phosphate esters,
2,4-di-tert-butyl phenol (2,4-DTBP) is used in the synthesis of substituted triaryl
phophites. Commercially tert-butyl phenols are produced by the reaction of phenol with
isobutene in presence of homogeneous catalysts. The use of these catalysts possesses
many problems concerning handling, safety, corrosion, and waste disposal. There fore,
considerable efforts have been made for the development of suitable heterogeneous
catalysts. The various catalysts reported for this reaction include metal oxides [40],
zeolites [41-43], various microporous and mesoporous materials [44-48], clays and clay-
based materials [49]. Both the formation of C- and O- alkylated products are possible
depending on reaction conditions such as reaction temperature and type of catalyst. The
catalyst with strong acidic sites or at high reaction temperature, the reaction results in the
formation of C- alkylated products, while catalysts with weak acidic sites or at low
reaction temperature leads to the formation of O-alkylated product [50, 51]. Even though
many of the catalyst systems reported for this reactions show good activity, they do not
provide sustainable catalytic activities and hence limits their successful application in
large-scale production.
3.5.2. Experimental procedure
The alkylation of phenol with tert-butanol was carried out under atmospheric
pressure using a fixed-bed down flow glass reactor (30 cm length and 1.3 cm OD). The
catalyst (2 g, 30-40-mesh size) was loaded at the center of the reactor in such a way that
the catalyst bed was sandwiched between inert porcelain beads. The reactor was placed
in a double-zone furnace equipped with a thermocouple for sensing the reaction
temperature. The catalyst was activated at 500 oC for 5 h in a flow of dry air and cooled
to the reaction temperature in presence of dry nitrogen before the reactions were
conducted. The feed containing a mixture of phenol (E. Merck, >99 %) and tert-butanol
(E. Merck, >99 %) of desired molar ratio was introduced into the reactor with a fixed
space velocity using a syringe pump (Sage Instruments, Model 352, USA). Nitrogen was
used as a carrier gas with a flow rate of 35 ml/min. Although fresh catalysts were used
every time for different measurements, the reusability of the catalyst was also studied, by
regenerating the catalyst calcination at 500 oC. The products were collected in a cold trap
and analyzed by Shimadzu 14B gas chromatograph, equipped with a flame ionization
detector and SE-52 packed column. The products were identified by GC-MS and by
comparing with authentic samples. Conversion was defined as the percentage of phenol
converted into products.
3.5.3. Results and discussion
The main products of the tert-butylation of phenol were 2-tert-butyl phenol (2-
TBP), 4-tert-butyl phenol (4-TBP), 2,4-di-tert-butyl phenol (2,4-DTBP) and tert-butyl
phenyl ether (TBPE). The products like 2,6-di-tert-butyl phenol and 2,4,6-tri-tert-butyl
phenol were detected in trace amounts in some runs. C8 and C12 olefins, formed by the
oligomerization of isobutene were also observed in the reaction, where isobutene was
formed by the acid catalyzed dehydration of tert-butanol. Scheme 3.2, represents the
formation of different alkylated products during tert-butylation of phenol.
3.5.3.1. Effect of STA loading
In order to investigate the effect of STA loading, catalysts with 5-25 % STA on
zirconia calcined at 750 oC were used in alkylation of phenol with tert-butanol at 120 oC
with a space velocity of 6.7 h-1 (Fig. 3.13). Pure ZrO2 calcined at 750 oC showed
negligible activity. Out of the catalysts with different STA content, 5 SZ-750 catalyst
showed the lowest conversion of phenol (29 %), while 15 SZ-750 catalyst gave the
highest conversion (59 %) and further increase in STA loading decreased the conversion
of phenol.
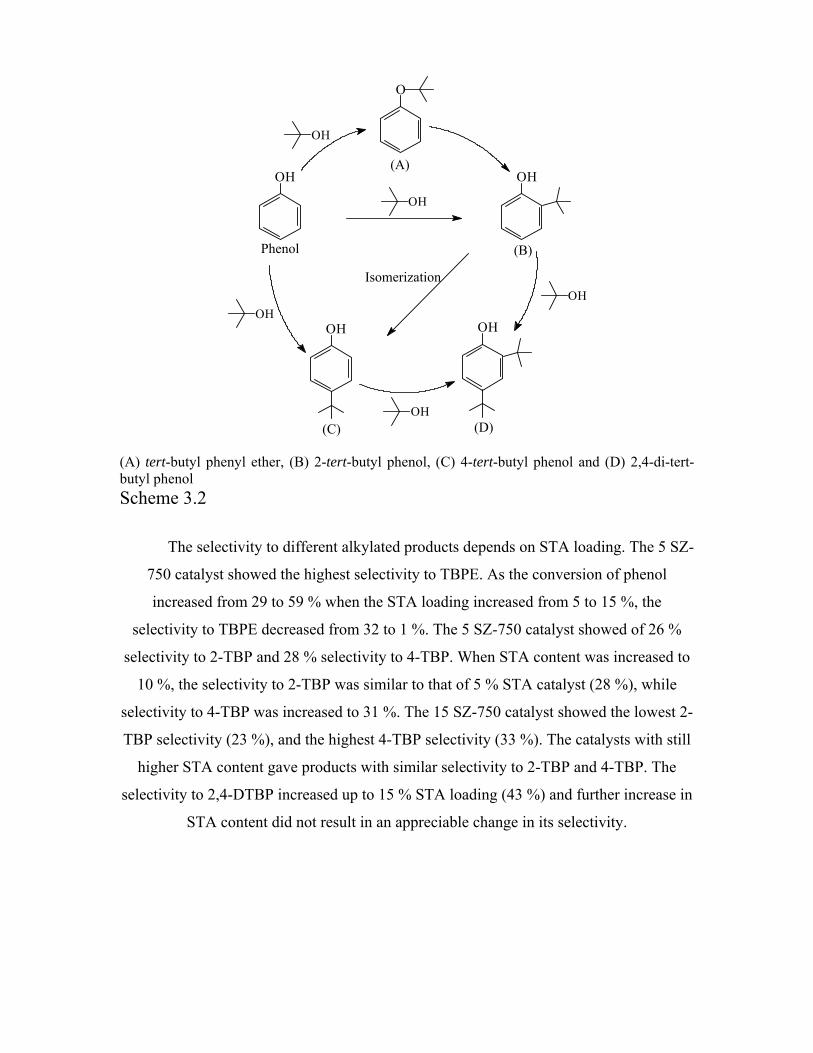
OH
O
OH
OH
(A)
(B)
(C) (D)
Phenol
OH OHOH
OH
OH
OH
Isomerization
(A) tert-butyl phenyl ether, (B) 2-tert-butyl phenol, (C) 4-tert-butyl phenol and (D) 2,4-di-tert-butyl phenol Scheme 3.2
The selectivity to different alkylated products depends on STA loading. The 5 SZ-
750 catalyst showed the highest selectivity to TBPE. As the conversion of phenol
increased from 29 to 59 % when the STA loading increased from 5 to 15 %, the
selectivity to TBPE decreased from 32 to 1 %. The 5 SZ-750 catalyst showed of 26 %
selectivity to 2-TBP and 28 % selectivity to 4-TBP. When STA content was increased to
10 %, the selectivity to 2-TBP was similar to that of 5 % STA catalyst (28 %), while
selectivity to 4-TBP was increased to 31 %. The 15 SZ-750 catalyst showed the lowest 2-
TBP selectivity (23 %), and the highest 4-TBP selectivity (33 %). The catalysts with still
higher STA content gave products with similar selectivity to 2-TBP and 4-TBP. The
selectivity to 2,4-DTBP increased up to 15 % STA loading (43 %) and further increase in
STA content did not result in an appreciable change in its selectivity.
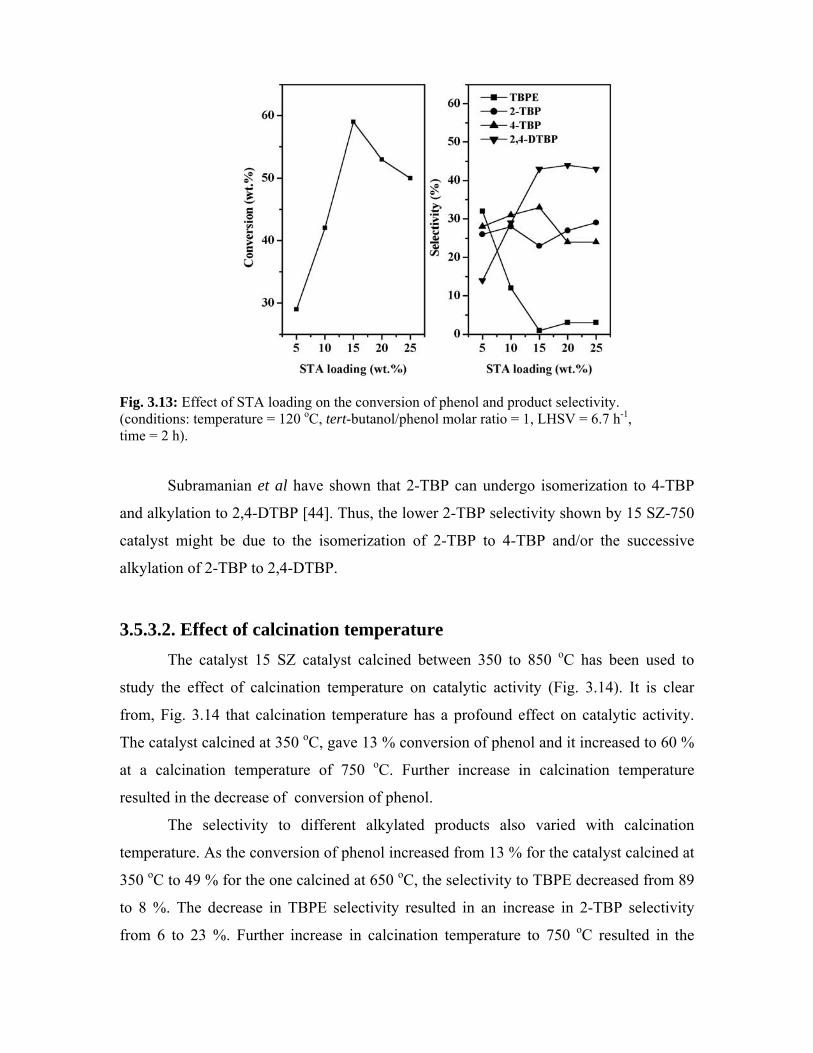
Fig. 3.13: Effect of STA loading on the conversion of phenol and product selectivity. (conditions: temperature = 120 oC, tert-butanol/phenol molar ratio = 1, LHSV = 6.7 h-1, time = 2 h).
Subramanian et al have shown that 2-TBP can undergo isomerization to 4-TBP
and alkylation to 2,4-DTBP [44]. Thus, the lower 2-TBP selectivity shown by 15 SZ-750
catalyst might be due to the isomerization of 2-TBP to 4-TBP and/or the successive
alkylation of 2-TBP to 2,4-DTBP.
3.5.3.2. Effect of calcination temperature The catalyst 15 SZ catalyst calcined between 350 to 850 oC has been used to
study the effect of calcination temperature on catalytic activity (Fig. 3.14). It is clear
from, Fig. 3.14 that calcination temperature has a profound effect on catalytic activity.
The catalyst calcined at 350 oC, gave 13 % conversion of phenol and it increased to 60 %
at a calcination temperature of 750 oC. Further increase in calcination temperature
resulted in the decrease of conversion of phenol.
The selectivity to different alkylated products also varied with calcination
temperature. As the conversion of phenol increased from 13 % for the catalyst calcined at
350 oC to 49 % for the one calcined at 650 oC, the selectivity to TBPE decreased from 89
to 8 %. The decrease in TBPE selectivity resulted in an increase in 2-TBP selectivity
from 6 to 23 %. Further increase in calcination temperature to 750 oC resulted in the
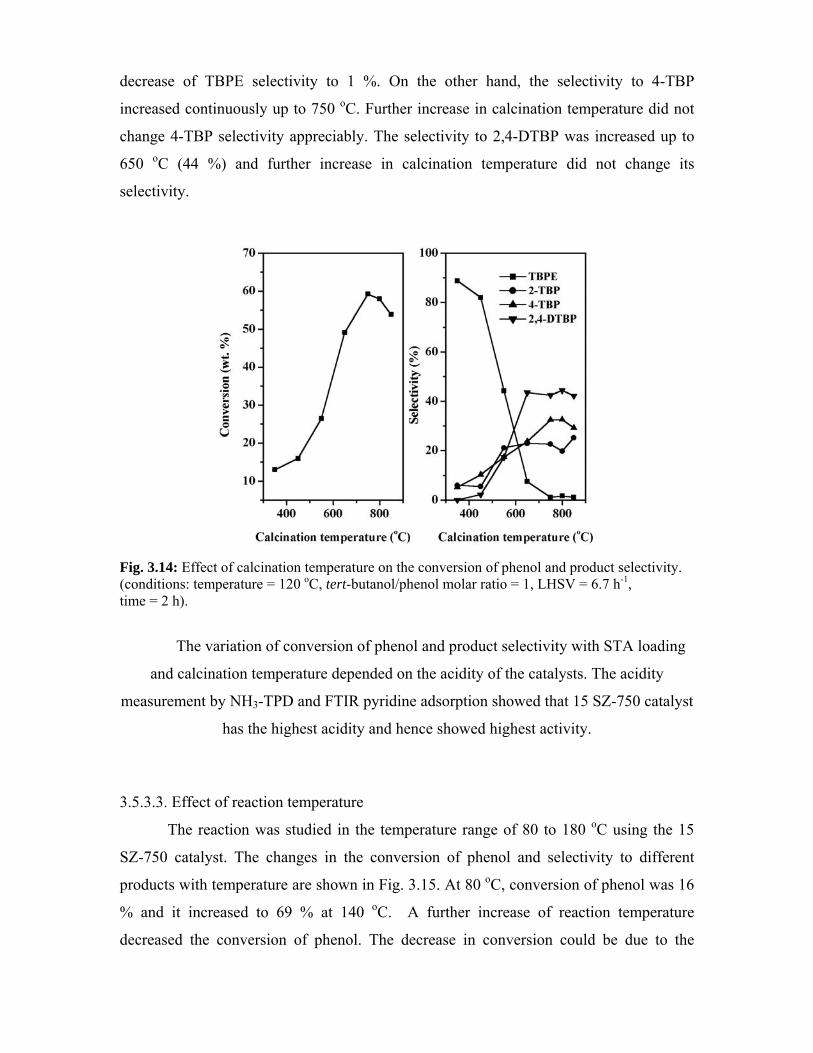
decrease of TBPE selectivity to 1 %. On the other hand, the selectivity to 4-TBP
increased continuously up to 750 oC. Further increase in calcination temperature did not
change 4-TBP selectivity appreciably. The selectivity to 2,4-DTBP was increased up to
650 oC (44 %) and further increase in calcination temperature did not change its
selectivity.
Fig. 3.14: Effect of calcination temperature on the conversion of phenol and product selectivity. (conditions: temperature = 120 oC, tert-butanol/phenol molar ratio = 1, LHSV = 6.7 h-1, time = 2 h).
The variation of conversion of phenol and product selectivity with STA loading
and calcination temperature depended on the acidity of the catalysts. The acidity
measurement by NH3-TPD and FTIR pyridine adsorption showed that 15 SZ-750 catalyst
has the highest acidity and hence showed highest activity.
3.5.3.3. Effect of reaction temperature
The reaction was studied in the temperature range of 80 to 180 oC using the 15
SZ-750 catalyst. The changes in the conversion of phenol and selectivity to different
products with temperature are shown in Fig. 3.15. At 80 oC, conversion of phenol was 16
% and it increased to 69 % at 140 oC. A further increase of reaction temperature
decreased the conversion of phenol. The decrease in conversion could be due to the
dealkylation of tert-butyl phenol to phenol at high temperatures and also the diminishing
availability of tert-butanol as it undergoes oligomerization rather than alkylation [44, 45].
At 80 oC, TBPE was obtained as the major product (86 %) and as the conversion
of phenol increased, TBPE selectivity decreased and it was completely absent at 140 oC.
The decrease in TBPE selectivity with temperature could be due to its rearrangement to
C-alkylated product. Indeed, it has been shown that such rearrangements occurred on
heating in presence of an acid catalyst [52]. The highest selectivity to 2-TBP was found
to be at 100 oC (26 %), while the selectivity to 2,4-DTBP (43 %) was highest at 120 oC.
The higher selectivity of 2,4-DTBP at this temperature could be due to the higher
stability and the availability of tert-butyl cation at lower reaction temperature. The
formation of 4-TBP was favored at high temperature as it is the thermodynamically stable
product and hence an increase of temperature always resulted in an increase of its
selectivity.
3.5.3.4. Effect of molar ratio
The effect of molar ratio on the conversion of phenol and product selectivity was
studied at 140 oC with tert-butanol/phenol molar ratio of 0.5 to 4 using 15 SZ-750
catalyst (Fig. 3.16). Generally, the conversion of phenol was increased with an increase
in the amount of tert-butanol. At a molar ratio of 0.5, conversion of phenol was 52 % and
it increased to 89 % at a molar ratio of 2. An increase of molar ratio from 2 to 3 added an
additional 5 % conversion of phenol. A further increase in molar ratio had no effect on
the conversion of phenol. It was shown that the polar molecule, such as methanol and
higher alcohols compete with phenol for adsorption sites and an increase in the molar
excess of alkylating agent results in an increase in the conversion of phenol as observed
in the present study [43].
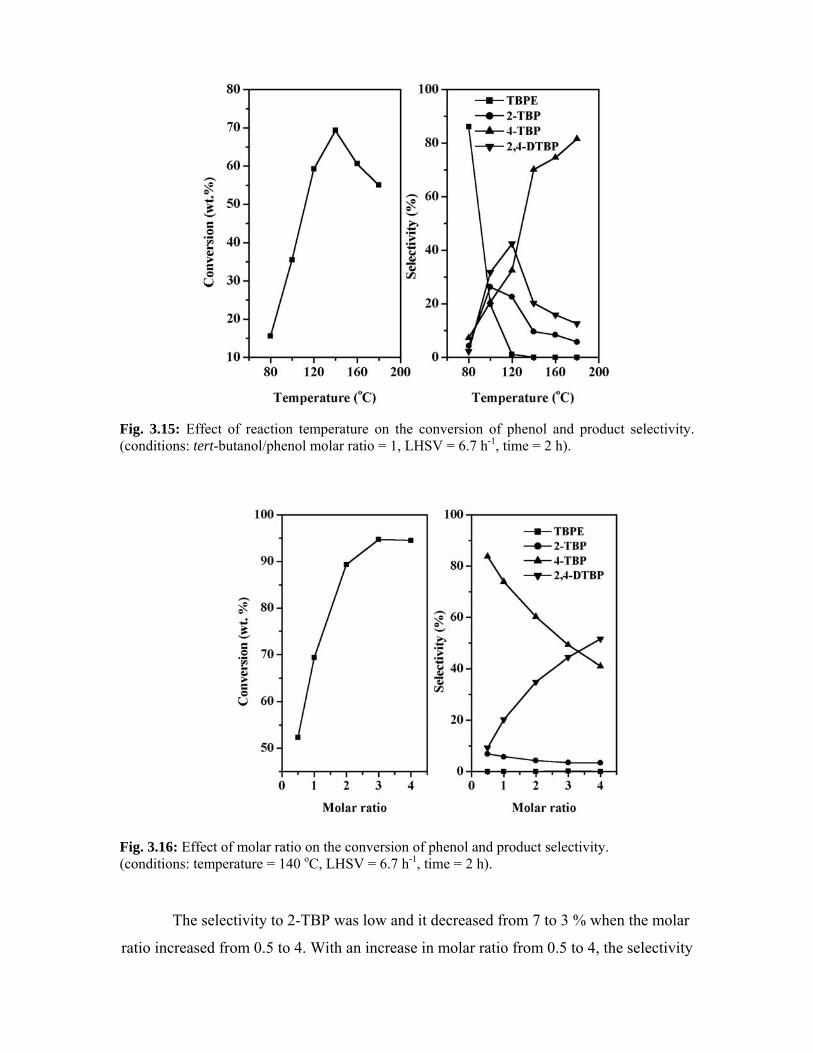
Fig. 3.15: Effect of reaction temperature on the conversion of phenol and product selectivity. (conditions: tert-butanol/phenol molar ratio = 1, LHSV = 6.7 h-1, time = 2 h).
Fig. 3.16: Effect of molar ratio on the conversion of phenol and product selectivity. (conditions: temperature = 140 oC, LHSV = 6.7 h-1, time = 2 h).
The selectivity to 2-TBP was low and it decreased from 7 to 3 % when the molar
ratio increased from 0.5 to 4. With an increase in molar ratio from 0.5 to 4, the selectivity
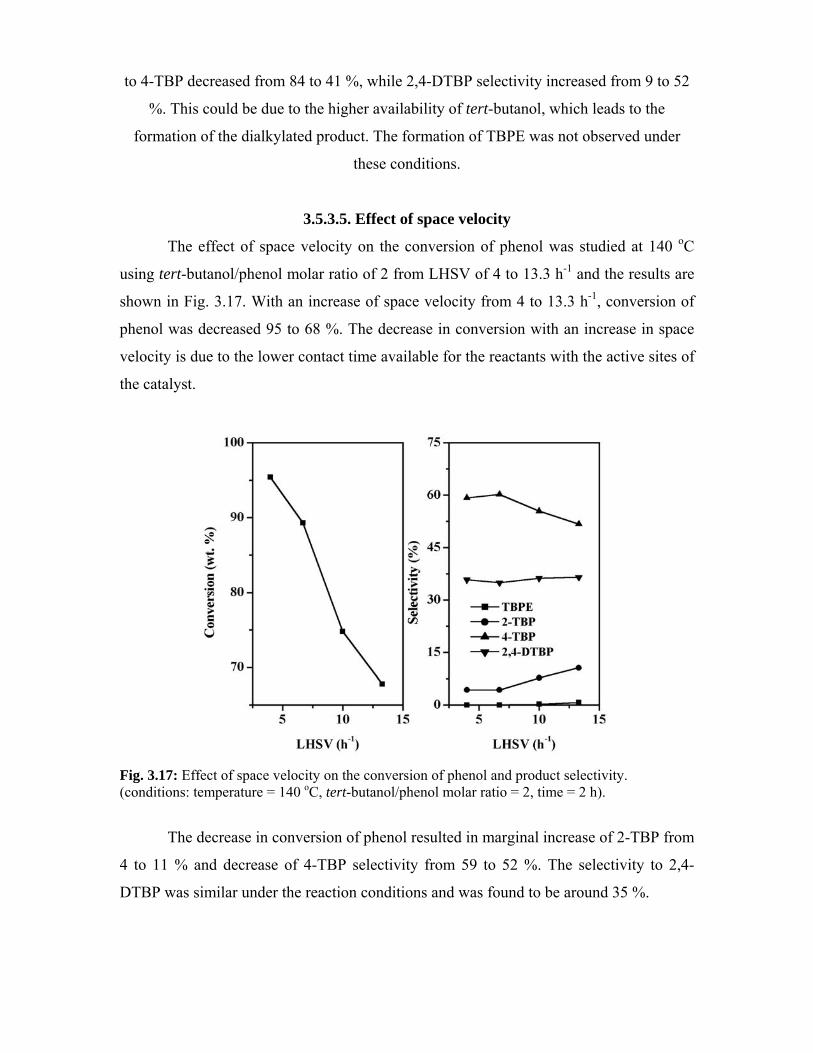
to 4-TBP decreased from 84 to 41 %, while 2,4-DTBP selectivity increased from 9 to 52
%. This could be due to the higher availability of tert-butanol, which leads to the
formation of the dialkylated product. The formation of TBPE was not observed under
these conditions.
3.5.3.5. Effect of space velocity
The effect of space velocity on the conversion of phenol was studied at 140 oC
using tert-butanol/phenol molar ratio of 2 from LHSV of 4 to 13.3 h-1 and the results are
shown in Fig. 3.17. With an increase of space velocity from 4 to 13.3 h-1, conversion of
phenol was decreased 95 to 68 %. The decrease in conversion with an increase in space
velocity is due to the lower contact time available for the reactants with the active sites of
the catalyst.
Fig. 3.17: Effect of space velocity on the conversion of phenol and product selectivity. (conditions: temperature = 140 oC, tert-butanol/phenol molar ratio = 2, time = 2 h).
The decrease in conversion of phenol resulted in marginal increase of 2-TBP from
4 to 11 % and decrease of 4-TBP selectivity from 59 to 52 %. The selectivity to 2,4-
DTBP was similar under the reaction conditions and was found to be around 35 %.
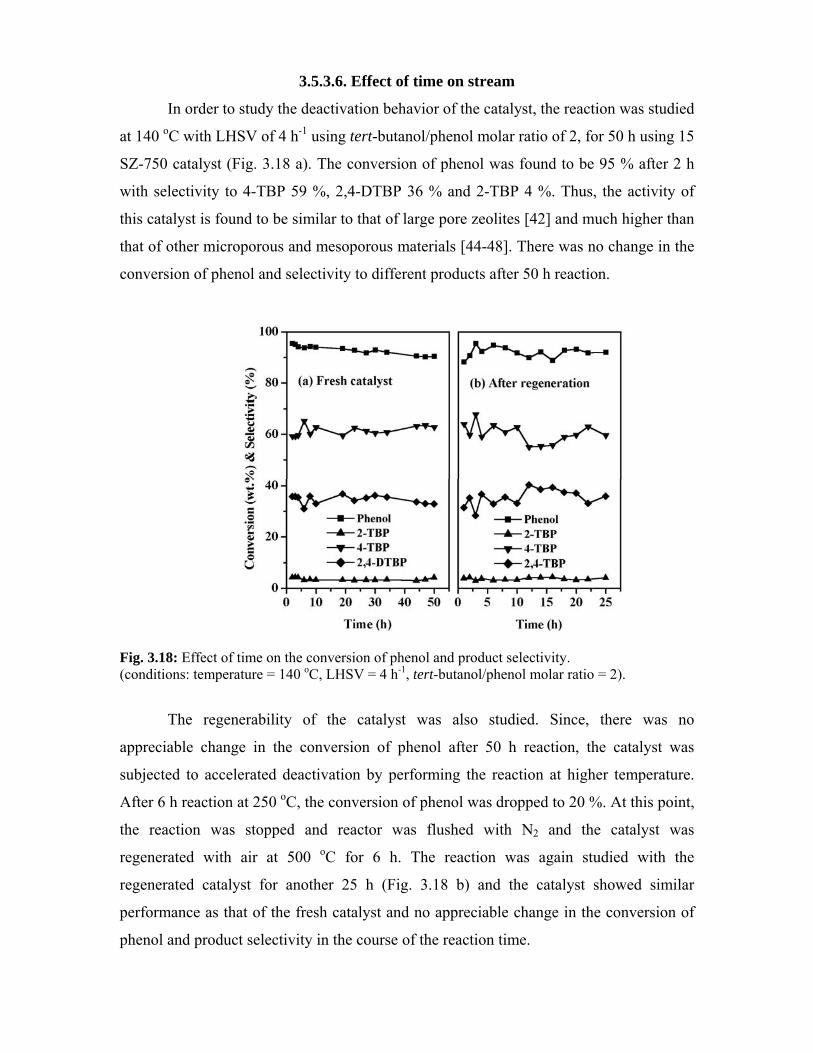
3.5.3.6. Effect of time on stream
In order to study the deactivation behavior of the catalyst, the reaction was studied
at 140 oC with LHSV of 4 h-1 using tert-butanol/phenol molar ratio of 2, for 50 h using 15
SZ-750 catalyst (Fig. 3.18 a). The conversion of phenol was found to be 95 % after 2 h
with selectivity to 4-TBP 59 %, 2,4-DTBP 36 % and 2-TBP 4 %. Thus, the activity of
this catalyst is found to be similar to that of large pore zeolites [42] and much higher than
that of other microporous and mesoporous materials [44-48]. There was no change in the
conversion of phenol and selectivity to different products after 50 h reaction.
Fig. 3.18: Effect of time on the conversion of phenol and product selectivity. (conditions: temperature = 140 oC, LHSV = 4 h-1, tert-butanol/phenol molar ratio = 2).
The regenerability of the catalyst was also studied. Since, there was no
appreciable change in the conversion of phenol after 50 h reaction, the catalyst was
subjected to accelerated deactivation by performing the reaction at higher temperature.
After 6 h reaction at 250 oC, the conversion of phenol was dropped to 20 %. At this point,
the reaction was stopped and reactor was flushed with N2 and the catalyst was
regenerated with air at 500 oC for 6 h. The reaction was again studied with the
regenerated catalyst for another 25 h (Fig. 3.18 b) and the catalyst showed similar
performance as that of the fresh catalyst and no appreciable change in the conversion of
phenol and product selectivity in the course of the reaction time.
3.6. References 1. Miyaji, T. Echizen, K. Nagata, Y. Yoshinaga, T. Okuhara,
J. Mol. Catal. A 201(2003) 145.
2. D.G. Barton, S.L. Soled, G.D. Meitzner, G.A. Fuentes, E. Iglesia,
J. Catal. 181 (1999) 57.
3. B.M. Devassy, S.B. Halligudi, S.G. Hegde, A.B. Halgeri, F. Lefebvre,
Chem. Commun. (2002) 1074.
4. B.M. Devassy, F. Lefebvre, S.B. Halligudi, J. Catal. 231 (2005) 1.
5. JCPDS-International Center for diffraction data, 1990, Card 43-1035.
6. C. Rocchiccioli-Deltcheff, M. Fournier, R. Franck, R. Thouvenot,
Inorg. Chem. 22 (1983) 207.
7. C.M. Teague, X. Li, M.E. Biggin, L. Lee, J. Kim, A.A. Gewirth,
J. Phys. Chem. B 108 (2004) 1974.
8. E. Lopez-Salinas, J.G. Hermandez-Cortez, I. Schifter, E. Torres-Garcia,
J. Navarrete, A. Gutierrez-Carrillo, T. Lopez, P.P. Lottici, D. Bersani,
Appl. Catal. A 193 (2000) 215.
9. S. Loridant, C. Feche, N. Essayem, F. Figueras,
J. Phys. Chem. B 109 (2005) 5631.
10. M. Scheithauer, R.K. Grasselli, H. Knözinger, Langmuir 14 (1998) 3019.
11. S. Kuba, P. Lukinskas, R.K. Grasselli, B.C. Gates, H. Knözinger,
J. Catal. 216 (2003) 353.
12. M. Scheithauer, R.K. Grasselli, H. Knözinger, Langmuir 14 (1998) 3019.
13. I.V. Kozhevnikov, Catalysts for Fine Chenical Synthesis. Vol. 2. Catalysis by
polyoxometalates, Wiley & Sons, Ltd., 2002. p. 15.
14. M. Valigi, D. Gazzoli, G. Ferraris, E. Bemporad,
Phys. Chem. Chem. Phy. 5 (2003) 4974.
15. M. Valigi, D. Gazzoli, I. Pettiti, G. Mattei, S. Colonna, S.D. Rossi,
G. Ferraris, Appl. Catal. A 231 (2002) 159.
16. F.J. Gil-Llambías, A.M. Escudey, J.L.G. Fierro, A.L. Agudo,
J. Catal 95 (1985) 520.
17. M.S. Kaba, I.K. Song, D.C. Duncan, C.L. Hill, M.A. Barteau,
Inorg. Chem. 37 (1998) 398.
18. G. Busca, Catal. Today 41 (1998) 191.
19. B.H. Davis, R.A. Keogh, S. Alerasool, D.J. Zalewski, D.E. Day,
P.K. Doolin, J. Catal. 183 (1999) 45.
20. A. Khodakov, J. Yang, S. Su, E. Iglesia, A.T. Bell, J. Catal 177 (1998) 343.
21. D.G. Barton, M. Shtein, R.D. Wilson, S.L. Soled, E. Iglesia,
J. Phys. Chem. B 103 (1999) 630.
22. M. Fournier, C. Louis, M. Che, P. Chaquin, D. Masure,
J. Catal 119 (1989) 400.
23.
D. Masure, P. Chaquin, C. Louis, M. Che, M. Fournier,
J. Catal 119 (1989) 415.
24. G. Olah, Friedel-Crafts and related reactions, Wiley, New York,
1963-1964.
25. D. Rohan, C. Canaff, E. Fromentin, M. Guisnet, J. Catal. 177 (1998) 296.
26. E.G. Derouane, C.J. Dillon, D. Bethell, S.B. Derouane-Abd Hamid,
J. Catal 187 (1999) 209.
27. E.G. Derouane, G. Crehan, C.J. Dillon, D. Bethell, H. He,
S.B. Derouane-Abd Hamid, J. Catal. 194 (2000) 410.
28. T. Raja, A.P. Singh, A.V. Ramaswamy, A. Finiels, P. Moreau,
Appl. Catal. A 211 (2001) 31.
29. J. Kaur, K. Griffin, B. Harrison, I.V. Kozhevnikov,
J. Catal. 208 (2002) 448.
30. I.V. Kozhevnikov, Appl. Catal. A 256 (2003) 3.
31. L.A.M. Cardoso, W.A. Jr, A.R.E. Gonzaga, L.M.G. Aguiar,
H.M.C. Andrade, J. Mol. Catal. A 209 (2004) 189.
32. B. Bachiller-Baeza, J.A. Anderson, J. Catal. 228 (2004) 225.
33. V. Quaschning, J. Deutsch, P. Druska, H.-J. Niclas, E. Kemnitz,
J. Catal. 177 (1998) 164.
34. K. Arata, H. Nakamura, M. Shouji, Appl. Catal. A 197 (2000) 213.
35. J. Deutsch, H.A. Prescott, D. Müller, E. Kemnitz, H. Lieske,
J. Catal. 231 (2005) 268.
36. P. Botella, A. Corma, J.M. López-Nieto, S. Valencia, R. Jacquot,
J. Catal 195 (2000) 161.
37. A. Trunschke, J. Deutsch, D. Müller, H. Lieske, V. Quaschning,
E. Kemnitz, Catal. Lett. 83 (2002) 271.
38.
B.M. Devassy, G.V. Shanbhag, S.P. Mirajkar, W. Böhringer,
J. Fletcher, S.B. Halligudi, J. Mol. Catal. A 233 (2005) 141.
39.
H.-W. Voges, in: B. Elvers, S. Hawkins, G. Schulz (eds.), Ullmann’s Encyclopedia
of Industrial Chemistry, vol. A19, VHC, Weinheim, Germany, 1991, p. 328.
40. T. Mathew, B.S. Rao, C.S. Gopinath, J. Catal 222 (2004) 107.
41. A. Corma, H. Garcia, J. Primo, J. Chem. Res. 40 (1988).
42. K. Zhang, Ch. Huang, H. Zhang, S. Xiang, S. Liu, D. Xu, H. Li,
Appl. Catal. A 166 (1998) 89.
43. R.F. Parton, J.M. Jacobs, D.R. Huybrechts, P.A. Jacobs,
Stud. Surf. Sci. Catal. 46 (1989) 163.
44.
S. Subramanian, A. Mitra, C.V.V. Satyanarayana, D.K. Chakrabarty,
Appl. Catal. A. 159 (1997) 229.
45. A. Sakthivel, S. K. Badamali, P. Selvam,
Micropor. Mesopor. Mater. 39 (2000) 457.
46. S.K. Badamali, A. Sakthivel, P. Selvam, Catal. Today 63 (2000) 291.
47. A. Vinu, K.U. Nandhini, V. Murugesan, W. Böhlmann, V. Umamaheswari,
A. Pöppl, M. Hartmann, Appl. Catal. A 265 (2004) 1.
48. M. Karthik, A.K. Tripathi, N.M. Gupta, A. Vinu, M. Hartmann,
M. Palanichamy, V. Murugesan, Appl. Catal. A 268 (2004) 139.
49. G.D. Yadav, N.S. Doshi, Appl. Catal. A 236 (2002) 129.
50.
C. DeCastro, E. Sauvage, M.H. Valkenberg, W.F. Hoelderich,
J. Catal196 (2000) 86.
51.
Y. Ono, in “Catalysis by Zeolites” (B. Imelik, etal., Ed.), p. 19. Elsevier,
Amsterdam 1980.
52.
B.M. Devassy, S.B. Halligudi, S.P. Elangovan, S. Ernst, M. Hartmann,
F. Lefebvre, J. Mol. Catal. A 210 (2004) 125.
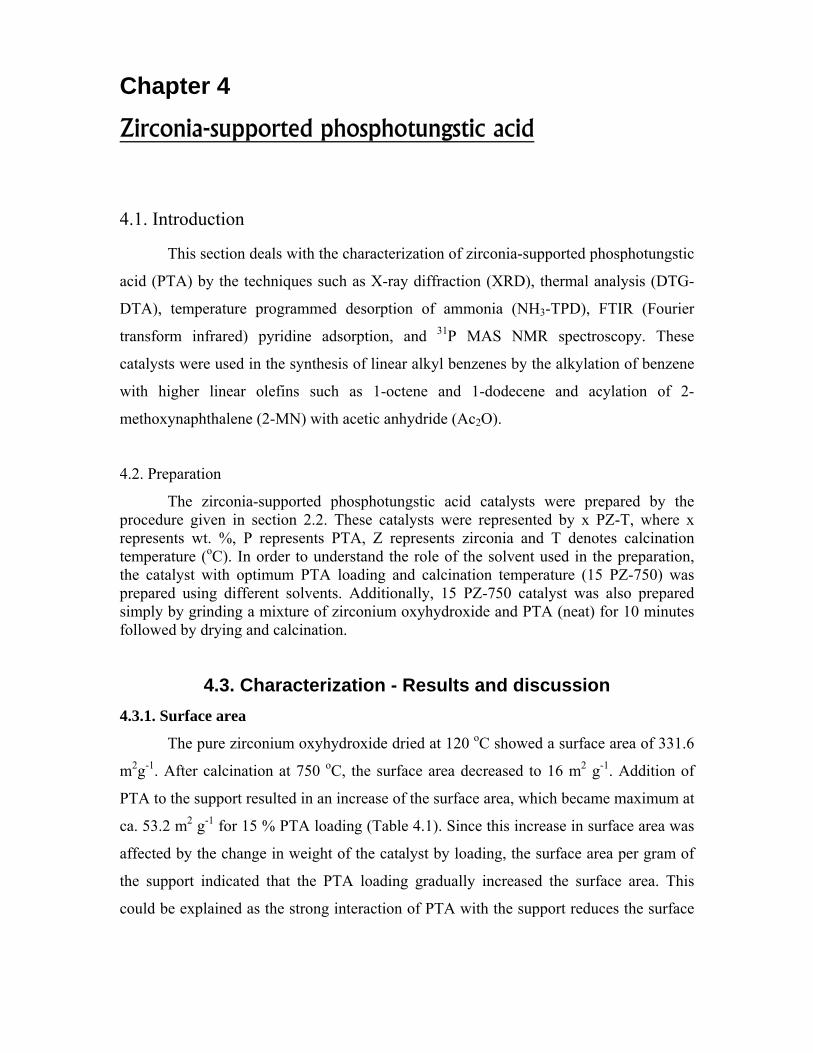
Chapter 4
Zirconia-supported phosphotungstic acid
4.1. Introduction
This section deals with the characterization of zirconia-supported phosphotungstic
acid (PTA) by the techniques such as X-ray diffraction (XRD), thermal analysis (DTG-
DTA), temperature programmed desorption of ammonia (NH3-TPD), FTIR (Fourier
transform infrared) pyridine adsorption, and 31P MAS NMR spectroscopy. These
catalysts were used in the synthesis of linear alkyl benzenes by the alkylation of benzene
with higher linear olefins such as 1-octene and 1-dodecene and acylation of 2-
methoxynaphthalene (2-MN) with acetic anhydride (Ac2O).
4.2. Preparation
The zirconia-supported phosphotungstic acid catalysts were prepared by the procedure given in section 2.2. These catalysts were represented by x PZ-T, where x represents wt. %, P represents PTA, Z represents zirconia and T denotes calcination temperature (oC). In order to understand the role of the solvent used in the preparation, the catalyst with optimum PTA loading and calcination temperature (15 PZ-750) was prepared using different solvents. Additionally, 15 PZ-750 catalyst was also prepared simply by grinding a mixture of zirconium oxyhydroxide and PTA (neat) for 10 minutes followed by drying and calcination.
4.3. Characterization - Results and discussion 4.3.1. Surface area
The pure zirconium oxyhydroxide dried at 120 oC showed a surface area of 331.6
m2g-1. After calcination at 750 oC, the surface area decreased to 16 m2 g-1. Addition of
PTA to the support resulted in an increase of the surface area, which became maximum at
ca. 53.2 m2 g-1 for 15 % PTA loading (Table 4.1). Since this increase in surface area was
affected by the change in weight of the catalyst by loading, the surface area per gram of
the support indicated that the PTA loading gradually increased the surface area. This
could be explained as the strong interaction of PTA with the support reduces the surface
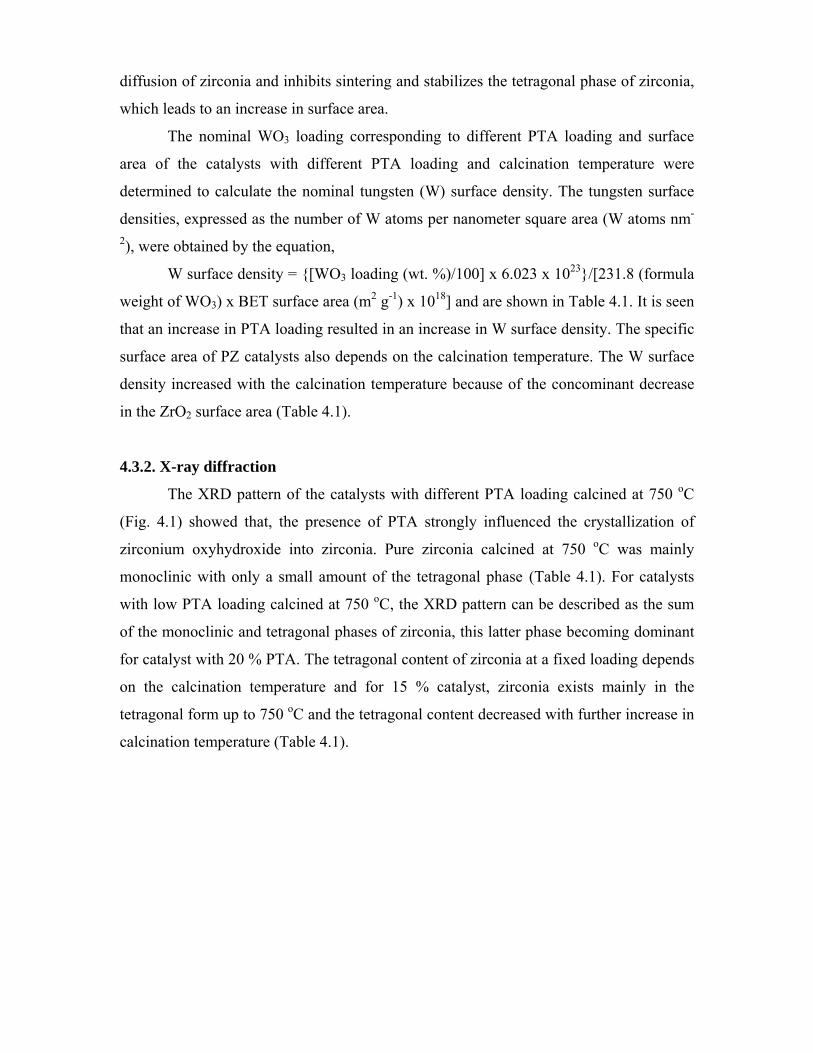
diffusion of zirconia and inhibits sintering and stabilizes the tetragonal phase of zirconia,
which leads to an increase in surface area.
The nominal WO3 loading corresponding to different PTA loading and surface
area of the catalysts with different PTA loading and calcination temperature were
determined to calculate the nominal tungsten (W) surface density. The tungsten surface
densities, expressed as the number of W atoms per nanometer square area (W atoms nm-
2), were obtained by the equation,
W surface density = {[WO3 loading (wt. %)/100] x 6.023 x 1023}/[231.8 (formula
weight of WO3) x BET surface area (m2 g-1) x 1018] and are shown in Table 4.1. It is seen
that an increase in PTA loading resulted in an increase in W surface density. The specific
surface area of PZ catalysts also depends on the calcination temperature. The W surface
density increased with the calcination temperature because of the concominant decrease
in the ZrO2 surface area (Table 4.1).
4.3.2. X-ray diffraction
The XRD pattern of the catalysts with different PTA loading calcined at 750 oC
(Fig. 4.1) showed that, the presence of PTA strongly influenced the crystallization of
zirconium oxyhydroxide into zirconia. Pure zirconia calcined at 750 oC was mainly
monoclinic with only a small amount of the tetragonal phase (Table 4.1). For catalysts
with low PTA loading calcined at 750 oC, the XRD pattern can be described as the sum
of the monoclinic and tetragonal phases of zirconia, this latter phase becoming dominant
for catalyst with 20 % PTA. The tetragonal content of zirconia at a fixed loading depends
on the calcination temperature and for 15 % catalyst, zirconia exists mainly in the
tetragonal form up to 750 oC and the tetragonal content decreased with further increase in
calcination temperature (Table 4.1).
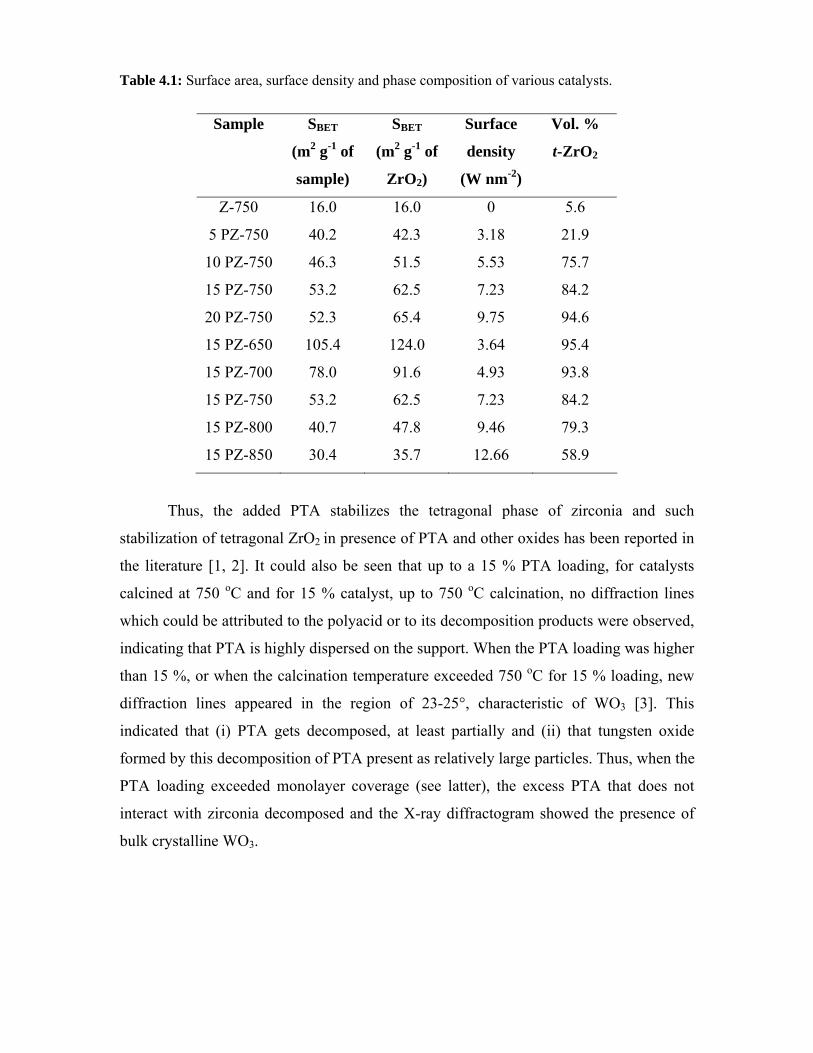
Table 4.1: Surface area, surface density and phase composition of various catalysts.
Sample
SBET
(m2 g-1 of
sample)
SBET
(m2 g-1 of
ZrO2)
Surface
density
(W nm-2)
Vol. %
t-ZrO2
Z-750 16.0 16.0 0 5.6
5 PZ-750 40.2 42.3 3.18 21.9
10 PZ-750 46.3 51.5 5.53 75.7
15 PZ-750 53.2 62.5 7.23 84.2
20 PZ-750 52.3 65.4 9.75 94.6
15 PZ-650 105.4 124.0 3.64 95.4
15 PZ-700 78.0 91.6 4.93 93.8
15 PZ-750 53.2 62.5 7.23 84.2
15 PZ-800 40.7 47.8 9.46 79.3
15 PZ-850 30.4 35.7 12.66 58.9
Thus, the added PTA stabilizes the tetragonal phase of zirconia and such
stabilization of tetragonal ZrO2 in presence of PTA and other oxides has been reported in
the literature [1, 2]. It could also be seen that up to a 15 % PTA loading, for catalysts
calcined at 750 oC and for 15 % catalyst, up to 750 oC calcination, no diffraction lines
which could be attributed to the polyacid or to its decomposition products were observed,
indicating that PTA is highly dispersed on the support. When the PTA loading was higher
than 15 %, or when the calcination temperature exceeded 750 oC for 15 % loading, new
diffraction lines appeared in the region of 23-25°, characteristic of WO3 [3]. This
indicated that (i) PTA gets decomposed, at least partially and (ii) that tungsten oxide
formed by this decomposition of PTA present as relatively large particles. Thus, when the
PTA loading exceeded monolayer coverage (see latter), the excess PTA that does not
interact with zirconia decomposed and the X-ray diffractogram showed the presence of
bulk crystalline WO3.
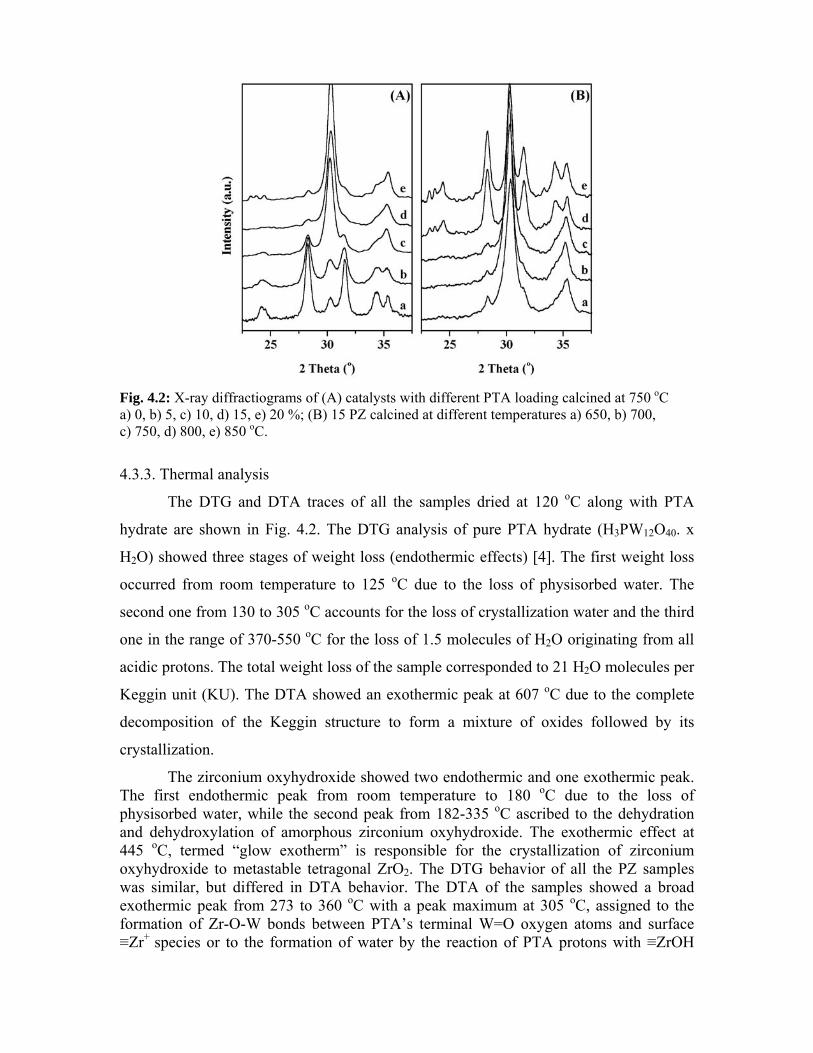
Fig. 4.2: X-ray diffractiograms of (A) catalysts with different PTA loading calcined at 750 oC a) 0, b) 5, c) 10, d) 15, e) 20 %; (B) 15 PZ calcined at different temperatures a) 650, b) 700, c) 750, d) 800, e) 850 oC.
4.3.3. Thermal analysis
The DTG and DTA traces of all the samples dried at 120 oC along with PTA
hydrate are shown in Fig. 4.2. The DTG analysis of pure PTA hydrate (H3PW12O40. x
H2O) showed three stages of weight loss (endothermic effects) [4]. The first weight loss
occurred from room temperature to 125 oC due to the loss of physisorbed water. The
second one from 130 to 305 oC accounts for the loss of crystallization water and the third
one in the range of 370-550 oC for the loss of 1.5 molecules of H2O originating from all
acidic protons. The total weight loss of the sample corresponded to 21 H2O molecules per
Keggin unit (KU). The DTA showed an exothermic peak at 607 oC due to the complete
decomposition of the Keggin structure to form a mixture of oxides followed by its
crystallization.
The zirconium oxyhydroxide showed two endothermic and one exothermic peak. The first endothermic peak from room temperature to 180 oC due to the loss of physisorbed water, while the second peak from 182-335 oC ascribed to the dehydration and dehydroxylation of amorphous zirconium oxyhydroxide. The exothermic effect at 445 oC, termed “glow exotherm” is responsible for the crystallization of zirconium oxyhydroxide to metastable tetragonal ZrO2. The DTG behavior of all the PZ samples was similar, but differed in DTA behavior. The DTA of the samples showed a broad exothermic peak from 273 to 360 oC with a peak maximum at 305 oC, assigned to the formation of Zr-O-W bonds between PTA’s terminal W=O oxygen atoms and surface ≡Zr+ species or to the formation of water by the reaction of PTA protons with ≡ZrOH
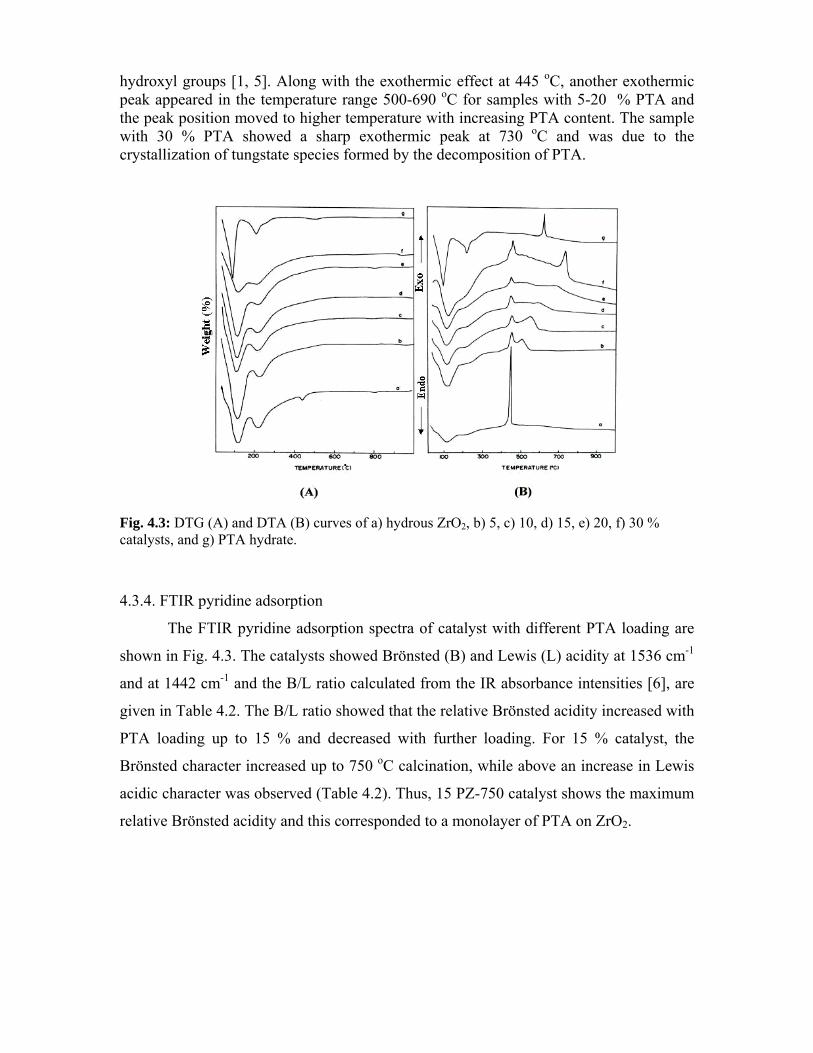
hydroxyl groups [1, 5]. Along with the exothermic effect at 445 oC, another exothermic peak appeared in the temperature range 500-690 oC for samples with 5-20 % PTA and the peak position moved to higher temperature with increasing PTA content. The sample with 30 % PTA showed a sharp exothermic peak at 730 oC and was due to the crystallization of tungstate species formed by the decomposition of PTA.
Fig. 4.3: DTG (A) and DTA (B) curves of a) hydrous ZrO2, b) 5, c) 10, d) 15, e) 20, f) 30 % catalysts, and g) PTA hydrate.
4.3.4. FTIR pyridine adsorption
The FTIR pyridine adsorption spectra of catalyst with different PTA loading are
shown in Fig. 4.3. The catalysts showed Brönsted (B) and Lewis (L) acidity at 1536 cm-1
and at 1442 cm-1 and the B/L ratio calculated from the IR absorbance intensities [6], are
given in Table 4.2. The B/L ratio showed that the relative Brönsted acidity increased with
PTA loading up to 15 % and decreased with further loading. For 15 % catalyst, the
Brönsted character increased up to 750 oC calcination, while above an increase in Lewis
acidic character was observed (Table 4.2). Thus, 15 PZ-750 catalyst shows the maximum
relative Brönsted acidity and this corresponded to a monolayer of PTA on ZrO2.
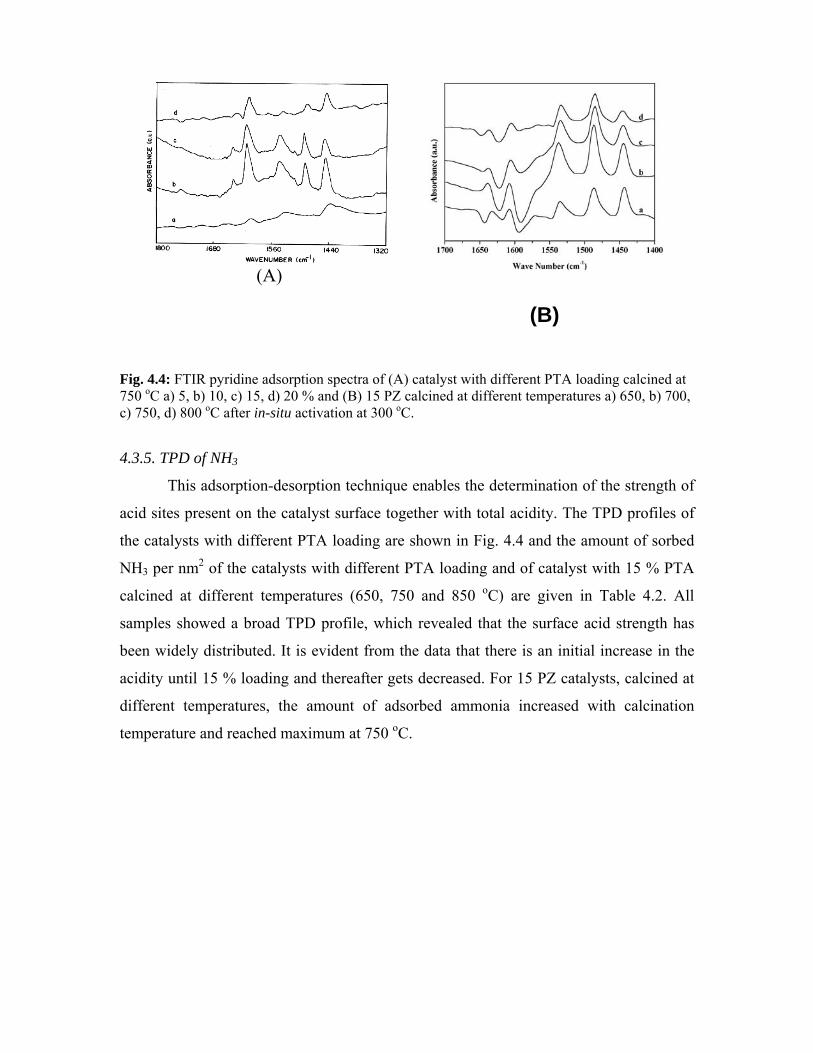
(A)
(B)
Fig. 4.4: FTIR pyridine adsorption spectra of (A) catalyst with different PTA loading calcined at 750 oC a) 5, b) 10, c) 15, d) 20 % and (B) 15 PZ calcined at different temperatures a) 650, b) 700, c) 750, d) 800 oC after in-situ activation at 300 oC.
4.3.5. TPD of NH3
This adsorption-desorption technique enables the determination of the strength of
acid sites present on the catalyst surface together with total acidity. The TPD profiles of
the catalysts with different PTA loading are shown in Fig. 4.4 and the amount of sorbed
NH3 per nm2 of the catalysts with different PTA loading and of catalyst with 15 % PTA
calcined at different temperatures (650, 750 and 850 oC) are given in Table 4.2. All
samples showed a broad TPD profile, which revealed that the surface acid strength has
been widely distributed. It is evident from the data that there is an initial increase in the
acidity until 15 % loading and thereafter gets decreased. For 15 PZ catalysts, calcined at
different temperatures, the amount of adsorbed ammonia increased with calcination
temperature and reached maximum at 750 oC.
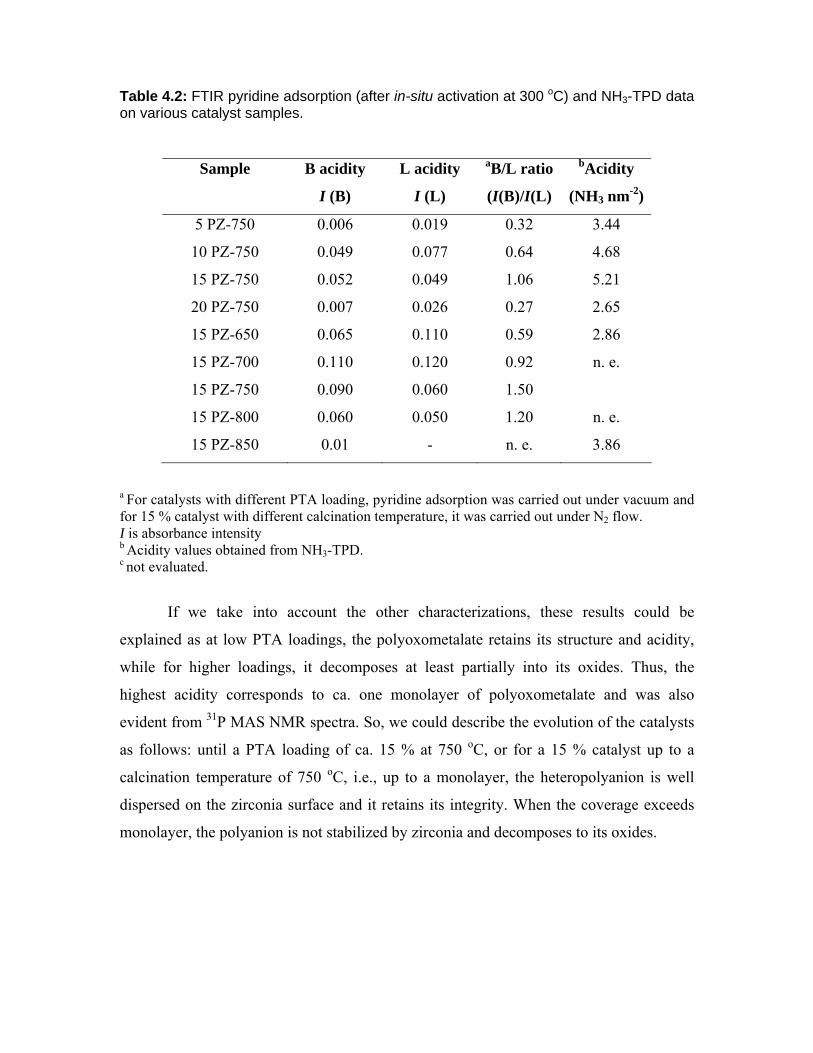
Table 4.2: FTIR pyridine adsorption (after in-situ activation at 300 oC) and NH3-TPD data on various catalyst samples.
Sample
B acidity
I (B)
L acidity
I (L)
aB/L ratio
(I(B)/I(L)
bAcidity
(NH3 nm-2)
5 PZ-750 0.006 0.019 0.32 3.44
10 PZ-750 0.049 0.077 0.64 4.68
15 PZ-750 0.052 0.049 1.06 5.21
20 PZ-750 0.007 0.026 0.27 2.65
15 PZ-650 0.065 0.110 0.59 2.86
15 PZ-700 0.110 0.120 0.92 n. e.
15 PZ-750 0.090 0.060 1.50
15 PZ-800 0.060 0.050 1.20 n. e.
15 PZ-850 0.01 - n. e. 3.86
a For catalysts with different PTA loading, pyridine adsorption was carried out under vacuum and for 15 % catalyst with different calcination temperature, it was carried out under N2 flow. I is absorbance intensity b Acidity values obtained from NH3-TPD. c not evaluated.
If we take into account the other characterizations, these results could be
explained as at low PTA loadings, the polyoxometalate retains its structure and acidity,
while for higher loadings, it decomposes at least partially into its oxides. Thus, the
highest acidity corresponds to ca. one monolayer of polyoxometalate and was also
evident from 31P MAS NMR spectra. So, we could describe the evolution of the catalysts
as follows: until a PTA loading of ca. 15 % at 750 oC, or for a 15 % catalyst up to a
calcination temperature of 750 oC, i.e., up to a monolayer, the heteropolyanion is well
dispersed on the zirconia surface and it retains its integrity. When the coverage exceeds
monolayer, the polyanion is not stabilized by zirconia and decomposes to its oxides.
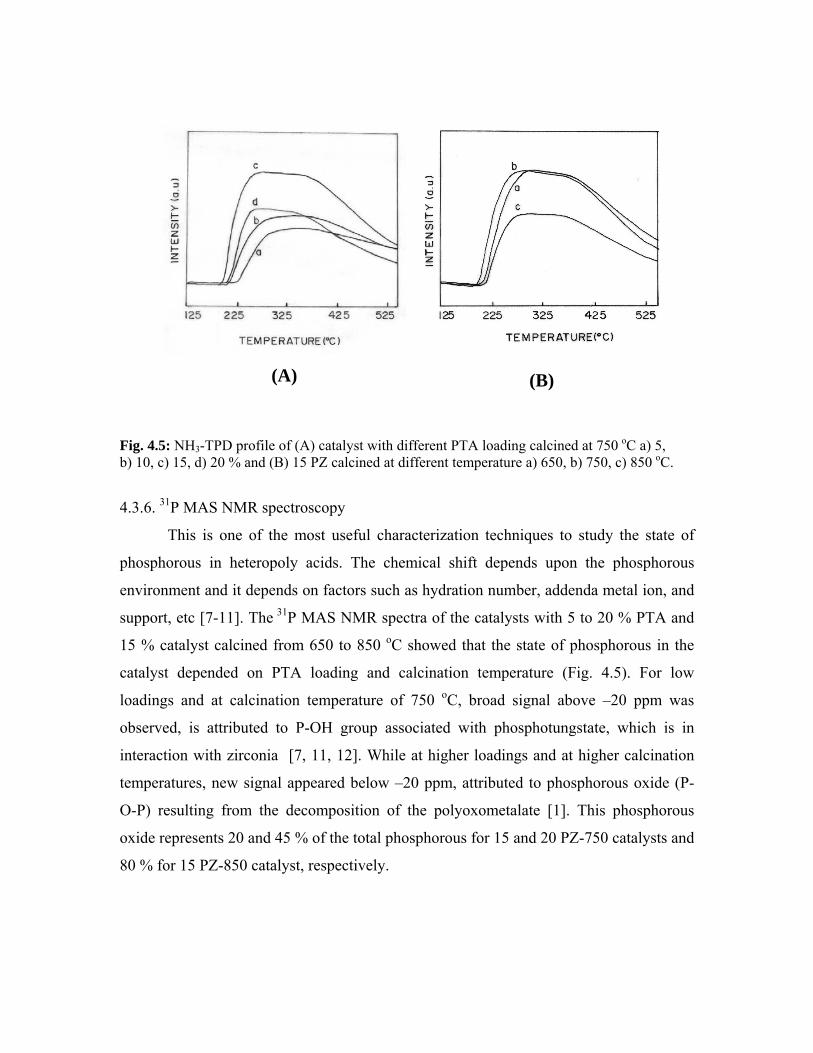
(A)
(B)
Fig. 4.5: NH3-TPD profile of (A) catalyst with different PTA loading calcined at 750 oC a) 5, b) 10, c) 15, d) 20 % and (B) 15 PZ calcined at different temperature a) 650, b) 750, c) 850 oC.
4.3.6. 31P MAS NMR spectroscopy
This is one of the most useful characterization techniques to study the state of
phosphorous in heteropoly acids. The chemical shift depends upon the phosphorous
environment and it depends on factors such as hydration number, addenda metal ion, and
support, etc [7-11]. The 31P MAS NMR spectra of the catalysts with 5 to 20 % PTA and
15 % catalyst calcined from 650 to 850 oC showed that the state of phosphorous in the
catalyst depended on PTA loading and calcination temperature (Fig. 4.5). For low
loadings and at calcination temperature of 750 oC, broad signal above –20 ppm was
observed, is attributed to P-OH group associated with phosphotungstate, which is in
interaction with zirconia [7, 11, 12]. While at higher loadings and at higher calcination
temperatures, new signal appeared below –20 ppm, attributed to phosphorous oxide (P-
O-P) resulting from the decomposition of the polyoxometalate [1]. This phosphorous
oxide represents 20 and 45 % of the total phosphorous for 15 and 20 PZ-750 catalysts and
80 % for 15 PZ-850 catalyst, respectively.
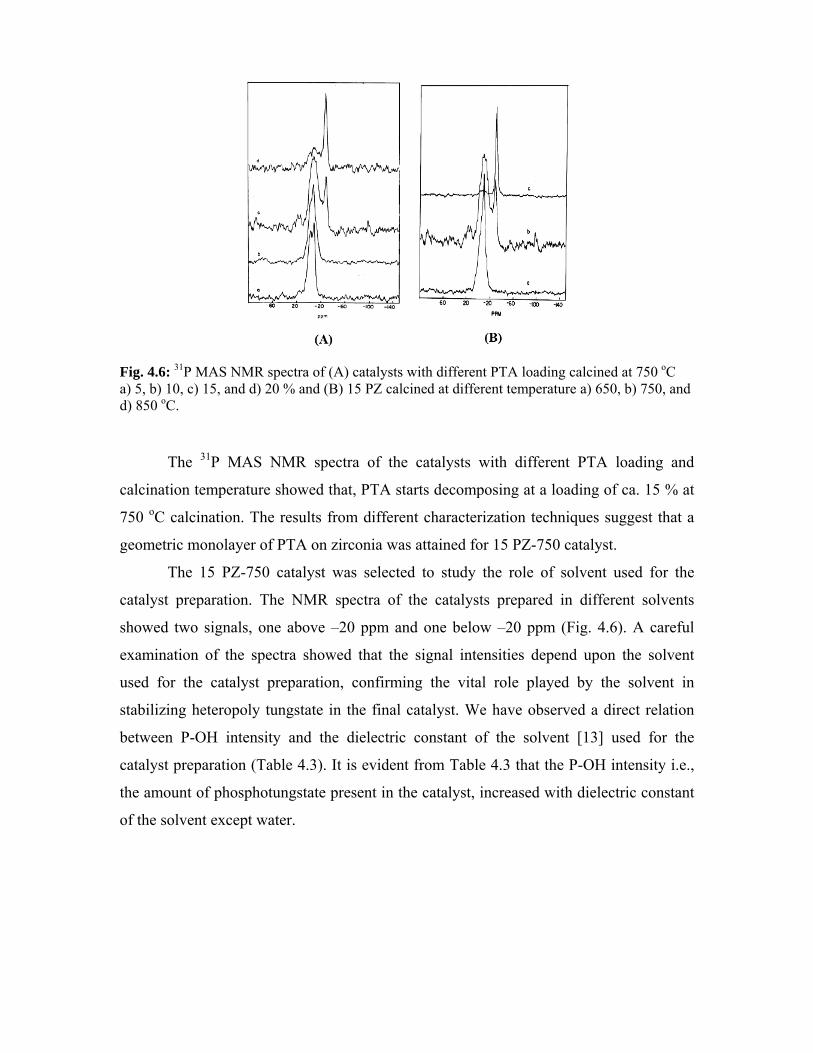
Fig. 4.6: 31P MAS NMR spectra of (A) catalysts with different PTA loading calcined at 750 oC a) 5, b) 10, c) 15, and d) 20 % and (B) 15 PZ calcined at different temperature a) 650, b) 750, and d) 850 oC.
The 31P MAS NMR spectra of the catalysts with different PTA loading and
calcination temperature showed that, PTA starts decomposing at a loading of ca. 15 % at
750 oC calcination. The results from different characterization techniques suggest that a
geometric monolayer of PTA on zirconia was attained for 15 PZ-750 catalyst.
The 15 PZ-750 catalyst was selected to study the role of solvent used for the
catalyst preparation. The NMR spectra of the catalysts prepared in different solvents
showed two signals, one above –20 ppm and one below –20 ppm (Fig. 4.6). A careful
examination of the spectra showed that the signal intensities depend upon the solvent
used for the catalyst preparation, confirming the vital role played by the solvent in
stabilizing heteropoly tungstate in the final catalyst. We have observed a direct relation
between P-OH intensity and the dielectric constant of the solvent [13] used for the
catalyst preparation (Table 4.3). It is evident from Table 4.3 that the P-OH intensity i.e.,
the amount of phosphotungstate present in the catalyst, increased with dielectric constant
of the solvent except water.
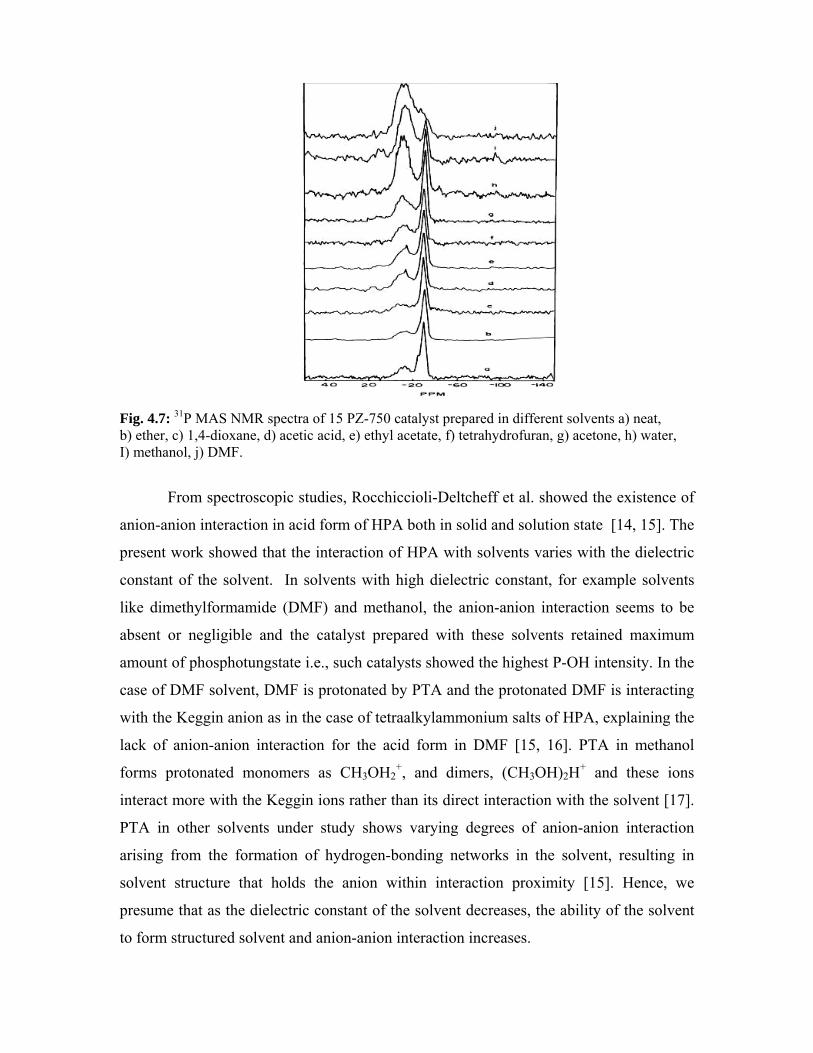
Fig. 4.7: 31P MAS NMR spectra of 15 PZ-750 catalyst prepared in different solvents a) neat, b) ether, c) 1,4-dioxane, d) acetic acid, e) ethyl acetate, f) tetrahydrofuran, g) acetone, h) water, I) methanol, j) DMF.
From spectroscopic studies, Rocchiccioli-Deltcheff et al. showed the existence of
anion-anion interaction in acid form of HPA both in solid and solution state [14, 15]. The
present work showed that the interaction of HPA with solvents varies with the dielectric
constant of the solvent. In solvents with high dielectric constant, for example solvents
like dimethylformamide (DMF) and methanol, the anion-anion interaction seems to be
absent or negligible and the catalyst prepared with these solvents retained maximum
amount of phosphotungstate i.e., such catalysts showed the highest P-OH intensity. In the
case of DMF solvent, DMF is protonated by PTA and the protonated DMF is interacting
with the Keggin anion as in the case of tetraalkylammonium salts of HPA, explaining the
lack of anion-anion interaction for the acid form in DMF [15, 16]. PTA in methanol
forms protonated monomers as CH3OH2+, and dimers, (CH3OH)2H+ and these ions
interact more with the Keggin ions rather than its direct interaction with the solvent [17].
PTA in other solvents under study shows varying degrees of anion-anion interaction
arising from the formation of hydrogen-bonding networks in the solvent, resulting in
solvent structure that holds the anion within interaction proximity [15]. Hence, we
presume that as the dielectric constant of the solvent decreases, the ability of the solvent
to form structured solvent and anion-anion interaction increases.
The hydroxyl group of the zirconium oxyhydroxide tends to be either positively or
negatively charged below or above the isoelectric point, IEP (pH = 6-7) [18]. Above
IEP, the hydroxyl groups tend to be negatively charged, so that it is relatively difficult
for the anions to be adsorbed on the hydroxide surface, due to electrostatic repulsion.
On the other hand, the adsorption of the anions is favored below the IEP of the
support. Hence, the adsorption of phosphotungstate Keggin anions on the surface of
zirconium oxyhydroxide is favorable when water is used as the solvent, which is not
applicable in the case of non-aqueous solvents. The solvent water has the highest
dielectric constant (79.7), but the catalyst prepared in water showed P-OH intensity
lower than that prepared in methanol. In aqueous solution, heteropoly anions are not
stable at pH > 1 as reported by McGarvey and Moffat and this has been observed in
this study [19]. The low P-OH intensity of the catalyst prepared in water is attributed
to the low stability of PTA in water [15].
The different behavior of the catalysts prepared in different solvents can also
originate from diffusion limitation of PTA into the pores of the support. The size of the
Keggin anion (12 Å) is of the order of pore size of the support (diameter < 2 nm) [20], the
rate of diffusion is controlled by the anion size and the large polyoxoanions should have a
lower diffusion rate. Since, the HPA anions are very weakly solvated in solvents, the
solubility of heteropoly acids depend on the solvation of cations [21]. Thus, the effective
size of the Keggin unit can vary from solvent to solvent and hence the diffusivity of the
polyanion, which ultimately results in different dispersion of HPA on the support and
hence the amount of phosphotungstate present on ZrO2 surface. These results are in good
agreement with the observations of Fournier et al. who suggest the use of DMF as solvent
to achieve good dispersion during the preparation of supported heteropoly acid catalysts
[15]. We have used methanol as the solvent due to its higher volatility and easiness in
handling.
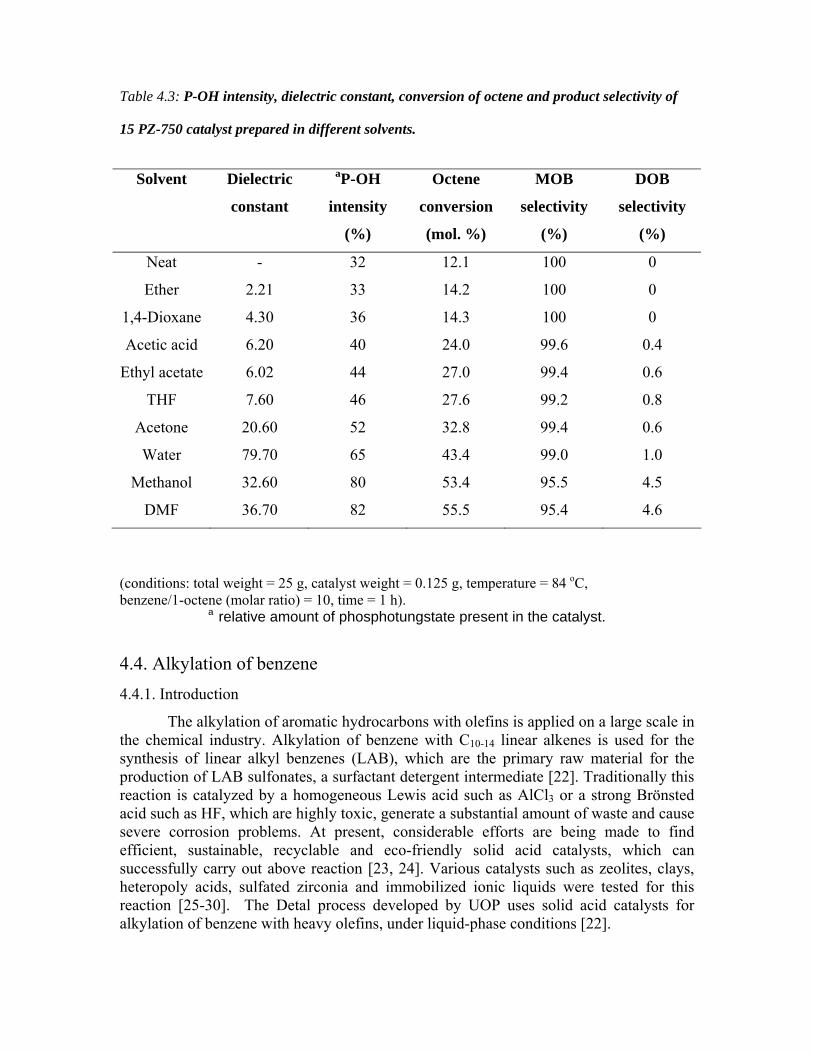
Table 4.3: P-OH intensity, dielectric constant, conversion of octene and product selectivity of
15 PZ-750 catalyst prepared in different solvents.
Solvent Dielectric
constant
aP-OH
intensity
(%)
Octene
conversion
(mol. %)
MOB
selectivity
(%)
DOB
selectivity
(%)
Neat - 32 12.1 100 0
Ether 2.21 33 14.2 100 0
1,4-Dioxane 4.30 36 14.3 100 0
Acetic acid 6.20 40 24.0 99.6 0.4
Ethyl acetate 6.02 44 27.0 99.4 0.6
THF 7.60 46 27.6 99.2 0.8
Acetone 20.60 52 32.8 99.4 0.6
Water 79.70 65 43.4 99.0 1.0
Methanol 32.60 80 53.4 95.5 4.5
DMF 36.70 82 55.5 95.4 4.6
(conditions: total weight = 25 g, catalyst weight = 0.125 g, temperature = 84 oC, benzene/1-octene (molar ratio) = 10, time = 1 h).
a relative amount of phosphotungstate present in the catalyst.
4.4. Alkylation of benzene 4.4.1. Introduction
The alkylation of aromatic hydrocarbons with olefins is applied on a large scale in the chemical industry. Alkylation of benzene with C10-14 linear alkenes is used for the synthesis of linear alkyl benzenes (LAB), which are the primary raw material for the production of LAB sulfonates, a surfactant detergent intermediate [22]. Traditionally this reaction is catalyzed by a homogeneous Lewis acid such as AlCl3 or a strong Brönsted acid such as HF, which are highly toxic, generate a substantial amount of waste and cause severe corrosion problems. At present, considerable efforts are being made to find efficient, sustainable, recyclable and eco-friendly solid acid catalysts, which can successfully carry out above reaction [23, 24]. Various catalysts such as zeolites, clays, heteropoly acids, sulfated zirconia and immobilized ionic liquids were tested for this reaction [25-30]. The Detal process developed by UOP uses solid acid catalysts for alkylation of benzene with heavy olefins, under liquid-phase conditions [22].
4.4.2. Experimental procedure
The liquid-phase alkylation reactions were carried out using zirconia-supported
PTA catalysts in a 50 ml glass batch reactor (slurry reactor) with anhydrous CaCl2 guard
tube. The reaction temperature was maintained by silicon oil bath equipped with a
thermostat and magnetic stirrer; the temperature was measured at the reaction mixture.
The catalyst freshly activated at 500 oC for 2 h, was weighed in the reactor and then
benzene (E. Merck, >99 %) was added according to the proportion desired. Finally 1-
alkene (Aldrich) [1-octene (98 %) and 1-dodecene (95 %)] was added in order to obtain
the desired molar ratio of benzene to 1-alkene. For example, a typical reaction mixture
consists of 21.86 g (280 mmol) of benzene, 3.14 g of 1-octene (28 mmol) together with
0.125 g of catalyst. The reaction carried out at the desired temperature was stopped after
1 h and the catalyst separated. The filtrate was analyzed using a Shimadzu 14B gas
chromatograph using HP-5 capillary column (cross linked 5 % ME silicone, 30 m x 0.53
x 1.5 µm film thickness), coupled with FID. The product identification was carried out
using GC-MS.
4.4.3. Results and discussion
The main reactions occurred with these catalysts were alkene double bond shift
isomerization and benzene alkylation as shown in Scheme 4.1. Monoalkylbenzenes
(MOB) was the main reaction product, whereas dialkylbenzenes (DOB) and alkene
dimers (DIM) formed in low amount. The conversion was expressed as the percentage of
alkene converted into products. The effect of PTA loading on the conversion of octene
and product selectivity is presented in Table 4.4. The 5 PZ-750 catalyst gave 1.3 %
conversion of octene and increased to 53.4 % at 15 % loading. The selectivity to mono
and dialkylated products depended on PTA loading and the catalyst with 15 % PTA gave
95.5 % mono alkylation selectivity.
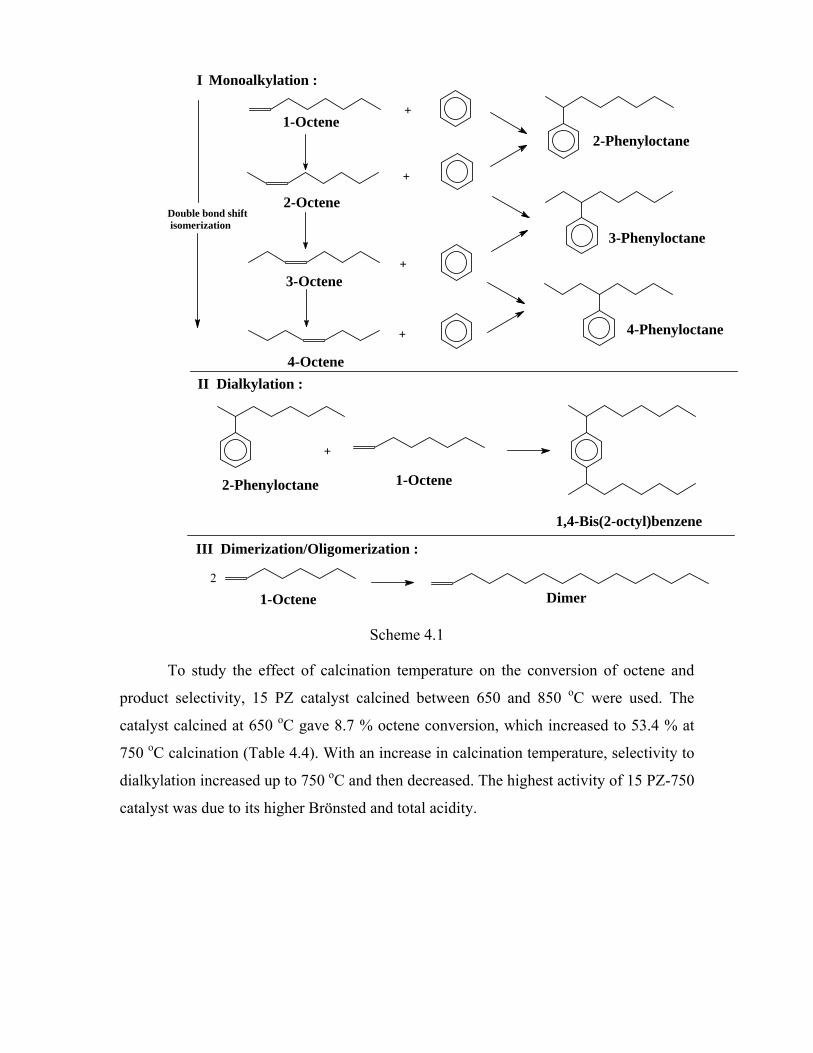
I Monoalkylation :
1-Octene
2-Octene
3-Octene
4-Octene
2-Phenyloctane
3-Phenyloctane
4-Phenyloctane
Double bond shift isomerization
II Dialkylation :
2-Phenyloctane
+
1-Octene
+
+
+
+
III Dimerization/Oligomerization :
1-Octene2
Dimer
1,4-Bis(2-octyl)benzene
Scheme 4.1
To study the effect of calcination temperature on the conversion of octene and
product selectivity, 15 PZ catalyst calcined between 650 and 850 oC were used. The
catalyst calcined at 650 oC gave 8.7 % octene conversion, which increased to 53.4 % at
750 oC calcination (Table 4.4). With an increase in calcination temperature, selectivity to
dialkylation increased up to 750 oC and then decreased. The highest activity of 15 PZ-750
catalyst was due to its higher Brönsted and total acidity.
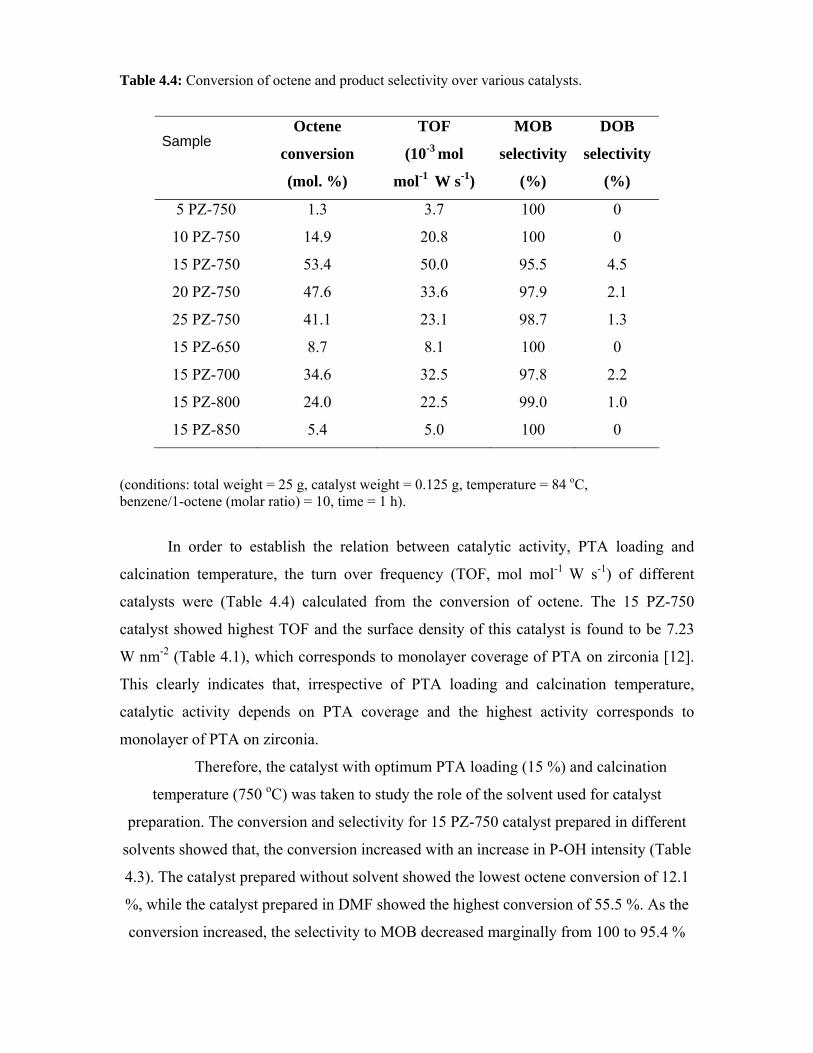
Table 4.4: Conversion of octene and product selectivity over various catalysts.
Sample Octene
conversion
(mol. %)
TOF
(10-3 mol
mol-1 W s-1)
MOB
selectivity
(%)
DOB
selectivity
(%)
5 PZ-750 1.3 3.7 100 0
10 PZ-750 14.9 20.8 100 0
15 PZ-750 53.4 50.0 95.5 4.5
20 PZ-750 47.6 33.6 97.9 2.1
25 PZ-750 41.1 23.1 98.7 1.3
15 PZ-650 8.7 8.1 100 0
15 PZ-700 34.6 32.5 97.8 2.2
15 PZ-800 24.0 22.5 99.0 1.0
15 PZ-850 5.4 5.0 100 0
(conditions: total weight = 25 g, catalyst weight = 0.125 g, temperature = 84 oC, benzene/1-octene (molar ratio) = 10, time = 1 h).
In order to establish the relation between catalytic activity, PTA loading and
calcination temperature, the turn over frequency (TOF, mol mol-1 W s-1) of different
catalysts were (Table 4.4) calculated from the conversion of octene. The 15 PZ-750
catalyst showed highest TOF and the surface density of this catalyst is found to be 7.23
W nm-2 (Table 4.1), which corresponds to monolayer coverage of PTA on zirconia [12].
This clearly indicates that, irrespective of PTA loading and calcination temperature,
catalytic activity depends on PTA coverage and the highest activity corresponds to
monolayer of PTA on zirconia.
Therefore, the catalyst with optimum PTA loading (15 %) and calcination
temperature (750 oC) was taken to study the role of the solvent used for catalyst
preparation. The conversion and selectivity for 15 PZ-750 catalyst prepared in different
solvents showed that, the conversion increased with an increase in P-OH intensity (Table
4.3). The catalyst prepared without solvent showed the lowest octene conversion of 12.1
%, while the catalyst prepared in DMF showed the highest conversion of 55.5 %. As the
conversion increased, the selectivity to MOB decreased marginally from 100 to 95.4 %
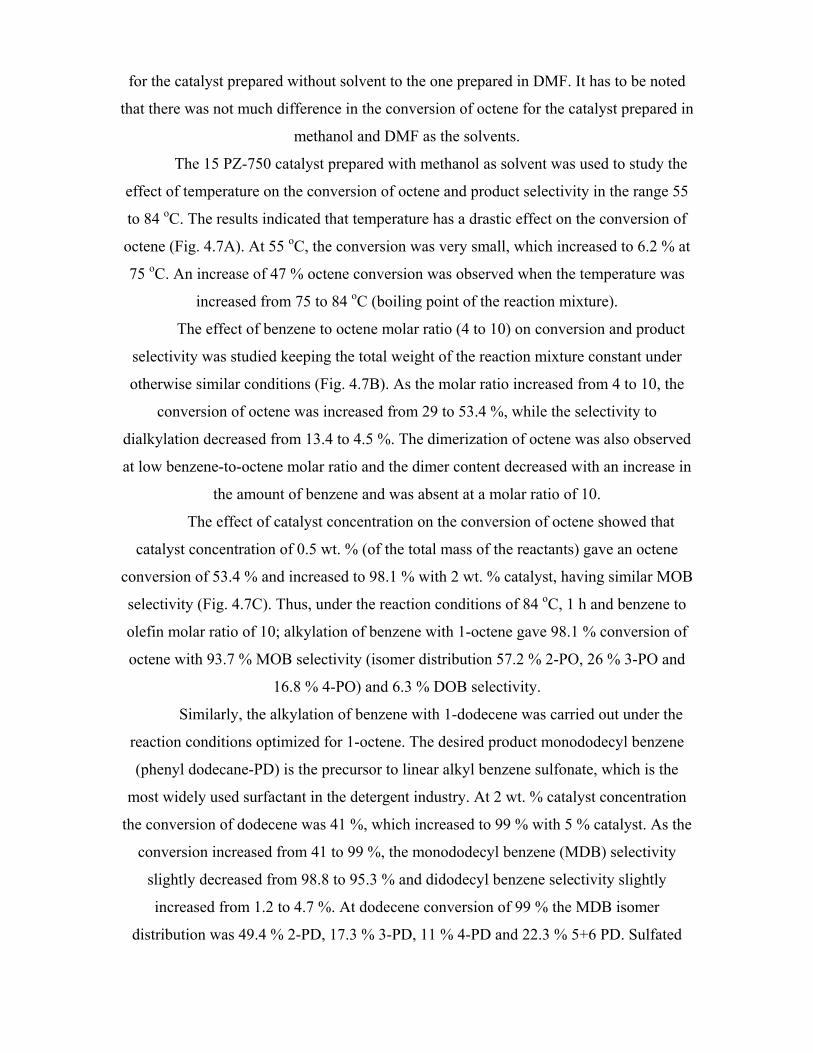
for the catalyst prepared without solvent to the one prepared in DMF. It has to be noted
that there was not much difference in the conversion of octene for the catalyst prepared in
methanol and DMF as the solvents.
The 15 PZ-750 catalyst prepared with methanol as solvent was used to study the
effect of temperature on the conversion of octene and product selectivity in the range 55
to 84 oC. The results indicated that temperature has a drastic effect on the conversion of
octene (Fig. 4.7A). At 55 oC, the conversion was very small, which increased to 6.2 % at
75 oC. An increase of 47 % octene conversion was observed when the temperature was
increased from 75 to 84 oC (boiling point of the reaction mixture).
The effect of benzene to octene molar ratio (4 to 10) on conversion and product
selectivity was studied keeping the total weight of the reaction mixture constant under
otherwise similar conditions (Fig. 4.7B). As the molar ratio increased from 4 to 10, the
conversion of octene was increased from 29 to 53.4 %, while the selectivity to
dialkylation decreased from 13.4 to 4.5 %. The dimerization of octene was also observed
at low benzene-to-octene molar ratio and the dimer content decreased with an increase in
the amount of benzene and was absent at a molar ratio of 10.
The effect of catalyst concentration on the conversion of octene showed that
catalyst concentration of 0.5 wt. % (of the total mass of the reactants) gave an octene
conversion of 53.4 % and increased to 98.1 % with 2 wt. % catalyst, having similar MOB
selectivity (Fig. 4.7C). Thus, under the reaction conditions of 84 oC, 1 h and benzene to
olefin molar ratio of 10; alkylation of benzene with 1-octene gave 98.1 % conversion of
octene with 93.7 % MOB selectivity (isomer distribution 57.2 % 2-PO, 26 % 3-PO and
16.8 % 4-PO) and 6.3 % DOB selectivity.
Similarly, the alkylation of benzene with 1-dodecene was carried out under the
reaction conditions optimized for 1-octene. The desired product monododecyl benzene
(phenyl dodecane-PD) is the precursor to linear alkyl benzene sulfonate, which is the
most widely used surfactant in the detergent industry. At 2 wt. % catalyst concentration
the conversion of dodecene was 41 %, which increased to 99 % with 5 % catalyst. As the
conversion increased from 41 to 99 %, the monododecyl benzene (MDB) selectivity
slightly decreased from 98.8 to 95.3 % and didodecyl benzene selectivity slightly
increased from 1.2 to 4.7 %. At dodecene conversion of 99 % the MDB isomer
distribution was 49.4 % 2-PD, 17.3 % 3-PD, 11 % 4-PD and 22.3 % 5+6 PD. Sulfated
zirconia was shown to be more active [28], and zeolites as more selective catalyst (to 2-
isomer but at low activity) [30] for this reaction.
Effect of reaction conditions on the conversion of octene and product selectivity.
(A) Effect of temperature (conditions: total weight = 25 g, catalyst weight = 0.125 g, benzene/1-octene (molar ratio) = 10, time = 1 h).
(B) Effect of molar ratio (conditions: total weight = 25 g, catalyst weight = 0.125 g, temperature = 84 oC, time = 1 h).
Fig. 4.7:
(C) Effect of catalyst weight (conditions: total weight = 25 g, temperature = 84 oC, benzene/1-octene (molar ratio) = 10, time = 1 h).
The recyclability of 15 TZ-750 catalyst was tested in the alkylation of benzene
with 1-octene at 84 oC (2 wt. % catalyst, 1 h and benzene to octene molar ratio 10). In
order to study the recycling, the catalyst after first cycle was separated (with out
washing), dried in air at 80 oC for 4 h and reused with fresh reaction mixture. After first
use, the catalyst retained only 30 % of initial conversion. Thermal analysis of the
separated catalyst showed a continuous weight loss (3.8 %) in the temperature range of
230-580 oC, attributed to adsorbed products and alkene oligomers. This result suggests
that the loss in catalytic activity is due the blockage of active sites of the catalyst by
heavy aromatics and oligomerised octene [28]. The deactivated catalyst can be partially
regenerated by refluxing with dichloromethane. The dried catalyst obtained after
refluxing with dichloromethane gave 60 % of initial conversion. After the first recycling,
the catalyst was reused twice without appreciable loss in activity, after regeneration. The
regeneration was achieved by catalyst separation followed by drying at 120 oC for 4 h
and calcination at 600 oC for 4 h in presence of air. After 2nd regeneration, the catalyst
gave more than 96 % initial conversion.
4.5. 2-Methoxynaphthalene acylation 4.5.1. Introduction
The Friedel–Crafts acylation is a key step in the production of aromatic ketones
largely used as intermediates in the fine chemicals and pharmaceutical industry [31]. The
conventional synthetic procedure is the Friedel–Crafts acylation in homogeneous phase
with carboxylic acid derivatives and Lewis acid anhydrous metal halides like AlCl3 as
catalyst. The catalyst is used in more than stoichiometric amount and must be hydrolyzed
after the reaction producing large amounts of waste products that cause serious
technological and environmental problems. The use of recoverable and regenerable solid
acid catalysts can overcome many of these problems [32].
The heterogeneously catalyzed acylation of 2-methoxynapthalene (2-MN) has
been the object of several studies because the acylation in 6-position is of particular
interest for the production of the anti-inflammatory drug Naproxen (2-(6-methoxy-2-
naphthyl) propionic acid, Naproxyn, Syntex) [33]. The acylation of 2-
methoxynaphthalene is actively catalyzed by zeolites [34-36], MCM-41 molecular sieves
[37], sulfated zirconia [38, 39] and cation-exchanged clays [40]. In all the cases, 1-acetyl-
2-methoxynaphthalene was obtained as the major product. The zeolite, H-beta with
narrower 12-ring channels and no super cages is shown to be a selective catalyst for the
synthesis of 6-acetyl-2-methoxynaohthalene [41-45].
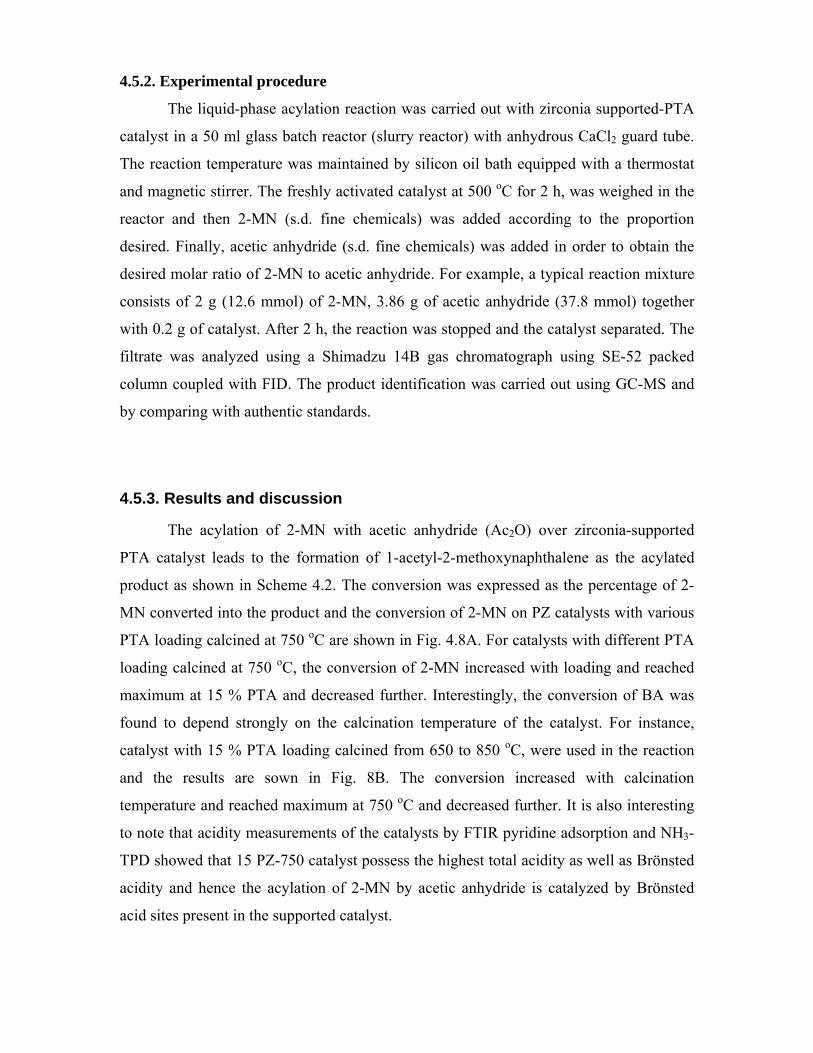
4.5.2. Experimental procedure
The liquid-phase acylation reaction was carried out with zirconia supported-PTA
catalyst in a 50 ml glass batch reactor (slurry reactor) with anhydrous CaCl2 guard tube.
The reaction temperature was maintained by silicon oil bath equipped with a thermostat
and magnetic stirrer. The freshly activated catalyst at 500 oC for 2 h, was weighed in the
reactor and then 2-MN (s.d. fine chemicals) was added according to the proportion
desired. Finally, acetic anhydride (s.d. fine chemicals) was added in order to obtain the
desired molar ratio of 2-MN to acetic anhydride. For example, a typical reaction mixture
consists of 2 g (12.6 mmol) of 2-MN, 3.86 g of acetic anhydride (37.8 mmol) together
with 0.2 g of catalyst. After 2 h, the reaction was stopped and the catalyst separated. The
filtrate was analyzed using a Shimadzu 14B gas chromatograph using SE-52 packed
column coupled with FID. The product identification was carried out using GC-MS and
by comparing with authentic standards.
4.5.3. Results and discussion
The acylation of 2-MN with acetic anhydride (Ac2O) over zirconia-supported
PTA catalyst leads to the formation of 1-acetyl-2-methoxynaphthalene as the acylated
product as shown in Scheme 4.2. The conversion was expressed as the percentage of 2-
MN converted into the product and the conversion of 2-MN on PZ catalysts with various
PTA loading calcined at 750 oC are shown in Fig. 4.8A. For catalysts with different PTA
loading calcined at 750 oC, the conversion of 2-MN increased with loading and reached
maximum at 15 % PTA and decreased further. Interestingly, the conversion of BA was
found to depend strongly on the calcination temperature of the catalyst. For instance,
catalyst with 15 % PTA loading calcined from 650 to 850 oC, were used in the reaction
and the results are sown in Fig. 8B. The conversion increased with calcination
temperature and reached maximum at 750 oC and decreased further. It is also interesting
to note that acidity measurements of the catalysts by FTIR pyridine adsorption and NH3-
TPD showed that 15 PZ-750 catalyst possess the highest total acidity as well as Brönsted
acidity and hence the acylation of 2-MN by acetic anhydride is catalyzed by Brönsted
acid sites present in the supported catalyst.
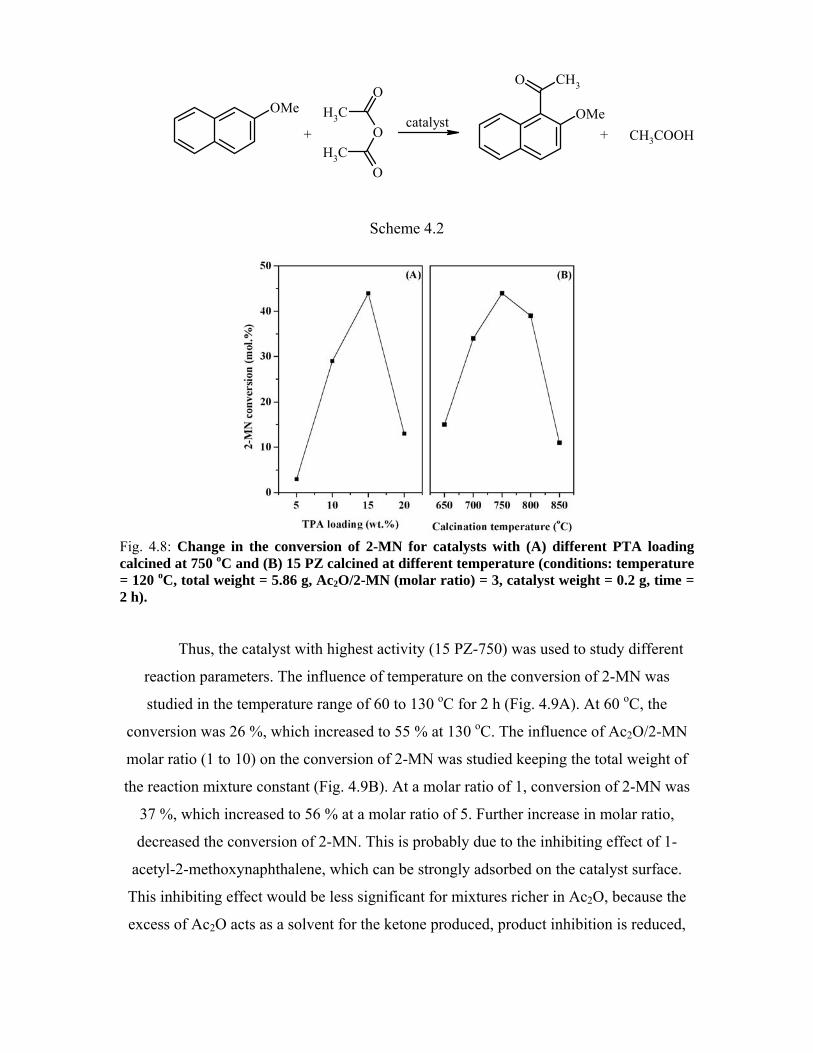
OMe
+CH3
OCH3
O
OOMe
CH3O
+ CH3COOHcatalyst
Scheme 4.2
Fig. 4.8: Change in the conversion of 2-MN for catalysts with (A) different PTA loading calcined at 750 oC and (B) 15 PZ calcined at different temperature (conditions: temperature = 120 oC, total weight = 5.86 g, Ac2O/2-MN (molar ratio) = 3, catalyst weight = 0.2 g, time = 2 h).
Thus, the catalyst with highest activity (15 PZ-750) was used to study different
reaction parameters. The influence of temperature on the conversion of 2-MN was
studied in the temperature range of 60 to 130 oC for 2 h (Fig. 4.9A). At 60 oC, the
conversion was 26 %, which increased to 55 % at 130 oC. The influence of Ac2O/2-MN
molar ratio (1 to 10) on the conversion of 2-MN was studied keeping the total weight of
the reaction mixture constant (Fig. 4.9B). At a molar ratio of 1, conversion of 2-MN was
37 %, which increased to 56 % at a molar ratio of 5. Further increase in molar ratio,
decreased the conversion of 2-MN. This is probably due to the inhibiting effect of 1-
acetyl-2-methoxynaphthalene, which can be strongly adsorbed on the catalyst surface.
This inhibiting effect would be less significant for mixtures richer in Ac2O, because the
excess of Ac2O acts as a solvent for the ketone produced, product inhibition is reduced,
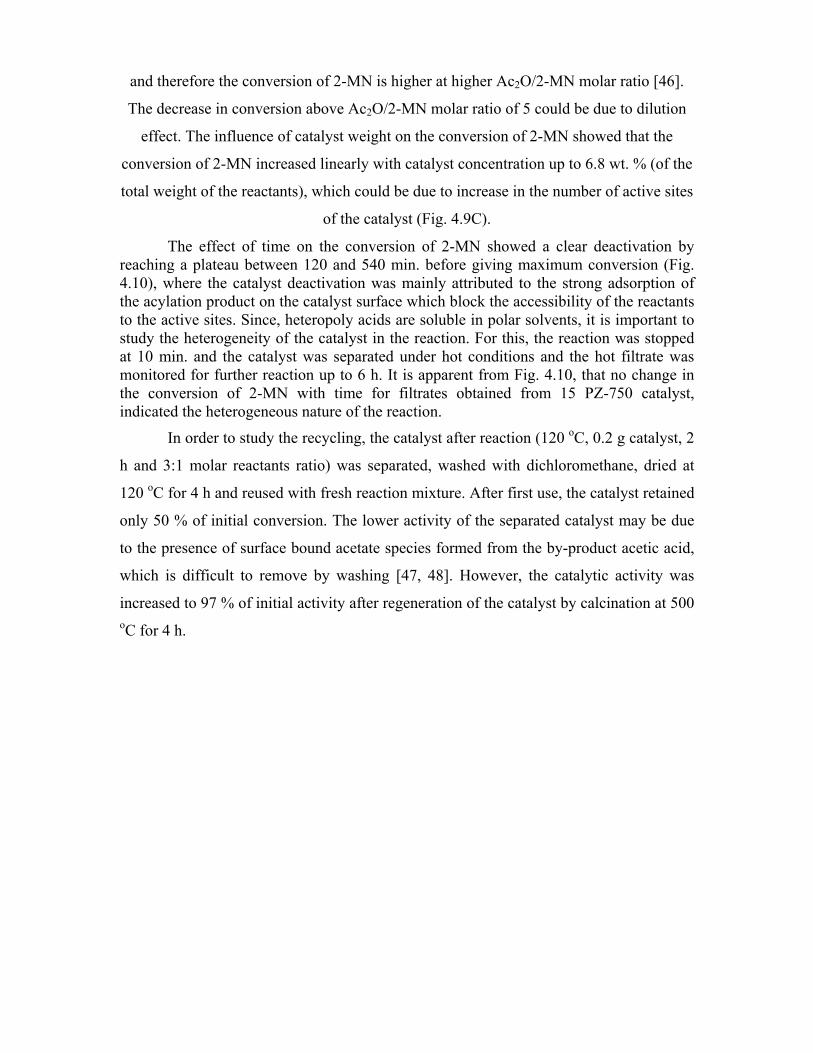
and therefore the conversion of 2-MN is higher at higher Ac2O/2-MN molar ratio [46].
The decrease in conversion above Ac2O/2-MN molar ratio of 5 could be due to dilution
effect. The influence of catalyst weight on the conversion of 2-MN showed that the
conversion of 2-MN increased linearly with catalyst concentration up to 6.8 wt. % (of the
total weight of the reactants), which could be due to increase in the number of active sites
of the catalyst (Fig. 4.9C).
The effect of time on the conversion of 2-MN showed a clear deactivation by reaching a plateau between 120 and 540 min. before giving maximum conversion (Fig. 4.10), where the catalyst deactivation was mainly attributed to the strong adsorption of the acylation product on the catalyst surface which block the accessibility of the reactants to the active sites. Since, heteropoly acids are soluble in polar solvents, it is important to study the heterogeneity of the catalyst in the reaction. For this, the reaction was stopped at 10 min. and the catalyst was separated under hot conditions and the hot filtrate was monitored for further reaction up to 6 h. It is apparent from Fig. 4.10, that no change in the conversion of 2-MN with time for filtrates obtained from 15 PZ-750 catalyst, indicated the heterogeneous nature of the reaction.
In order to study the recycling, the catalyst after reaction (120 oC, 0.2 g catalyst, 2
h and 3:1 molar reactants ratio) was separated, washed with dichloromethane, dried at
120 oC for 4 h and reused with fresh reaction mixture. After first use, the catalyst retained
only 50 % of initial conversion. The lower activity of the separated catalyst may be due
to the presence of surface bound acetate species formed from the by-product acetic acid,
which is difficult to remove by washing [47, 48]. However, the catalytic activity was
increased to 97 % of initial activity after regeneration of the catalyst by calcination at 500 oC for 4 h.
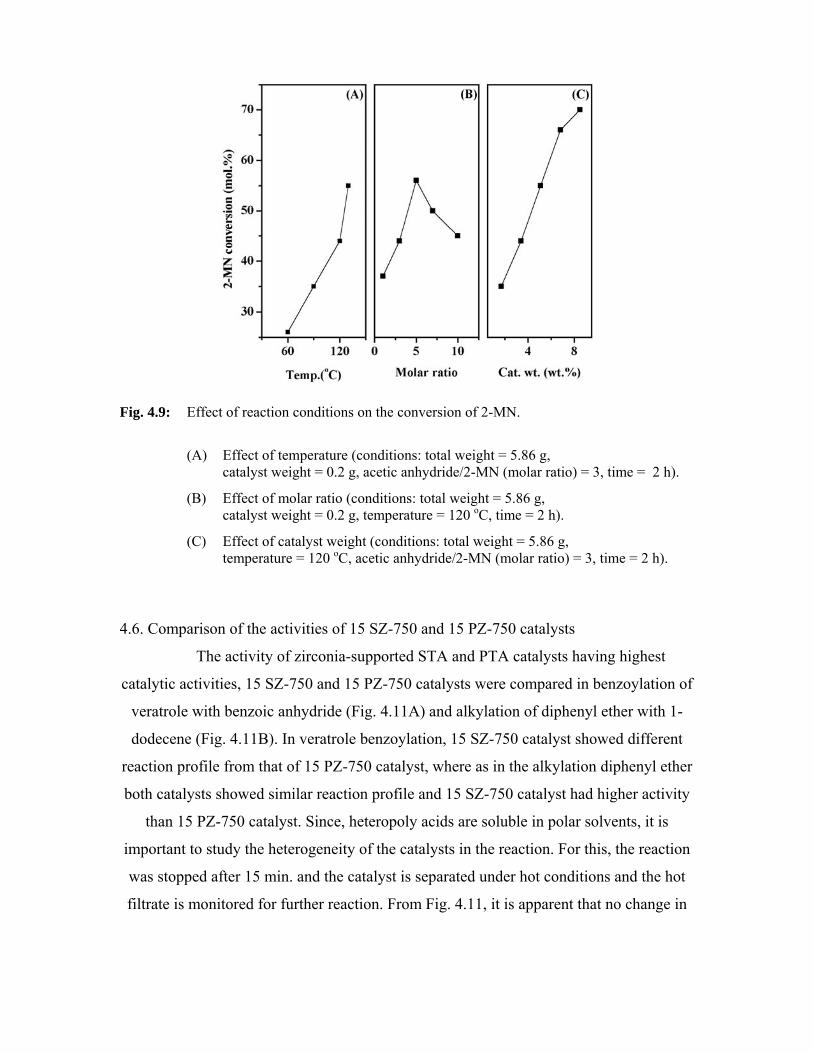
Effect of reaction conditions on the conversion of 2-MN.
(A) Effect of temperature (conditions: total weight = 5.86 g, catalyst weight = 0.2 g, acetic anhydride/2-MN (molar ratio) = 3, time = 2 h).
(B) Effect of molar ratio (conditions: total weight = 5.86 g, catalyst weight = 0.2 g, temperature = 120 oC, time = 2 h).
Fig. 4.9:
(C) Effect of catalyst weight (conditions: total weight = 5.86 g, temperature = 120 oC, acetic anhydride/2-MN (molar ratio) = 3, time = 2 h).
4.6. Comparison of the activities of 15 SZ-750 and 15 PZ-750 catalysts
The activity of zirconia-supported STA and PTA catalysts having highest
catalytic activities, 15 SZ-750 and 15 PZ-750 catalysts were compared in benzoylation of
veratrole with benzoic anhydride (Fig. 4.11A) and alkylation of diphenyl ether with 1-
dodecene (Fig. 4.11B). In veratrole benzoylation, 15 SZ-750 catalyst showed different
reaction profile from that of 15 PZ-750 catalyst, where as in the alkylation diphenyl ether
both catalysts showed similar reaction profile and 15 SZ-750 catalyst had higher activity
than 15 PZ-750 catalyst. Since, heteropoly acids are soluble in polar solvents, it is
important to study the heterogeneity of the catalysts in the reaction. For this, the reaction
was stopped after 15 min. and the catalyst is separated under hot conditions and the hot
filtrate is monitored for further reaction. From Fig. 4.11, it is apparent that no change in
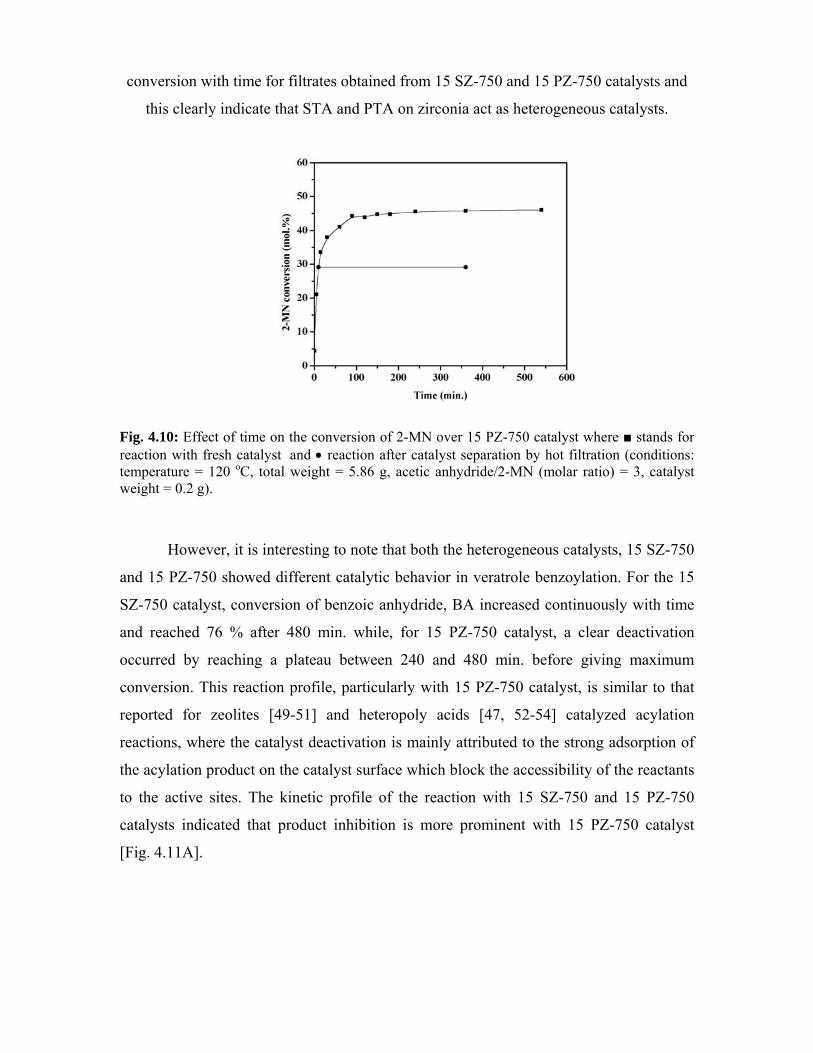
conversion with time for filtrates obtained from 15 SZ-750 and 15 PZ-750 catalysts and
this clearly indicate that STA and PTA on zirconia act as heterogeneous catalysts.
Fig. 4.10: Effect of time on the conversion of 2-MN over 15 PZ-750 catalyst where ■ stands for reaction with fresh catalyst and • reaction after catalyst separation by hot filtration (conditions: temperature = 120 oC, total weight = 5.86 g, acetic anhydride/2-MN (molar ratio) = 3, catalyst weight = 0.2 g).
However, it is interesting to note that both the heterogeneous catalysts, 15 SZ-750
and 15 PZ-750 showed different catalytic behavior in veratrole benzoylation. For the 15
SZ-750 catalyst, conversion of benzoic anhydride, BA increased continuously with time
and reached 76 % after 480 min. while, for 15 PZ-750 catalyst, a clear deactivation
occurred by reaching a plateau between 240 and 480 min. before giving maximum
conversion. This reaction profile, particularly with 15 PZ-750 catalyst, is similar to that
reported for zeolites [49-51] and heteropoly acids [47, 52-54] catalyzed acylation
reactions, where the catalyst deactivation is mainly attributed to the strong adsorption of
the acylation product on the catalyst surface which block the accessibility of the reactants
to the active sites. The kinetic profile of the reaction with 15 SZ-750 and 15 PZ-750
catalysts indicated that product inhibition is more prominent with 15 PZ-750 catalyst
[Fig. 4.11A].
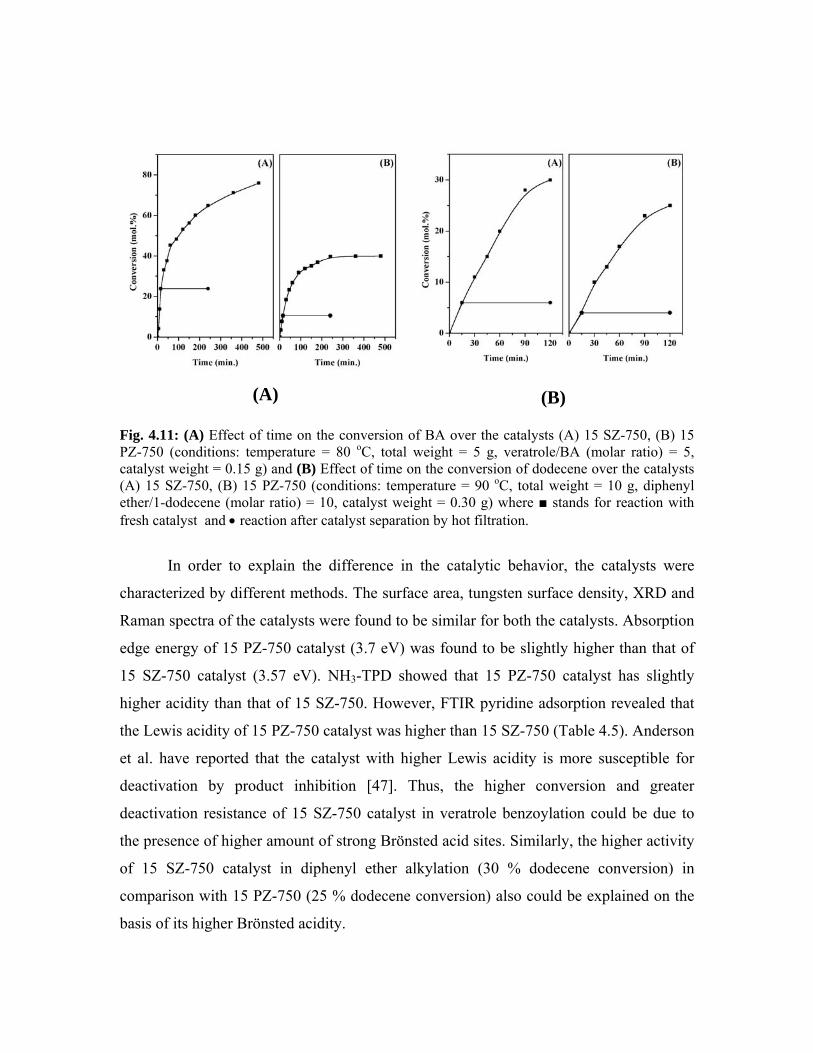
(A)
(B)
Fig. 4.11: (A) Effect of time on the conversion of BA over the catalysts (A) 15 SZ-750, (B) 15 PZ-750 (conditions: temperature = 80 oC, total weight = 5 g, veratrole/BA (molar ratio) = 5, catalyst weight = 0.15 g) and (B) Effect of time on the conversion of dodecene over the catalysts (A) 15 SZ-750, (B) 15 PZ-750 (conditions: temperature = 90 oC, total weight = 10 g, diphenyl ether/1-dodecene (molar ratio) = 10, catalyst weight = 0.30 g) where ■ stands for reaction with fresh catalyst and • reaction after catalyst separation by hot filtration.
In order to explain the difference in the catalytic behavior, the catalysts were
characterized by different methods. The surface area, tungsten surface density, XRD and
Raman spectra of the catalysts were found to be similar for both the catalysts. Absorption
edge energy of 15 PZ-750 catalyst (3.7 eV) was found to be slightly higher than that of
15 SZ-750 catalyst (3.57 eV). NH3-TPD showed that 15 PZ-750 catalyst has slightly
higher acidity than that of 15 SZ-750. However, FTIR pyridine adsorption revealed that
the Lewis acidity of 15 PZ-750 catalyst was higher than 15 SZ-750 (Table 4.5). Anderson
et al. have reported that the catalyst with higher Lewis acidity is more susceptible for
deactivation by product inhibition [47]. Thus, the higher conversion and greater
deactivation resistance of 15 SZ-750 catalyst in veratrole benzoylation could be due to
the presence of higher amount of strong Brönsted acid sites. Similarly, the higher activity
of 15 SZ-750 catalyst in diphenyl ether alkylation (30 % dodecene conversion) in
comparison with 15 PZ-750 (25 % dodecene conversion) also could be explained on the
basis of its higher Brönsted acidity.
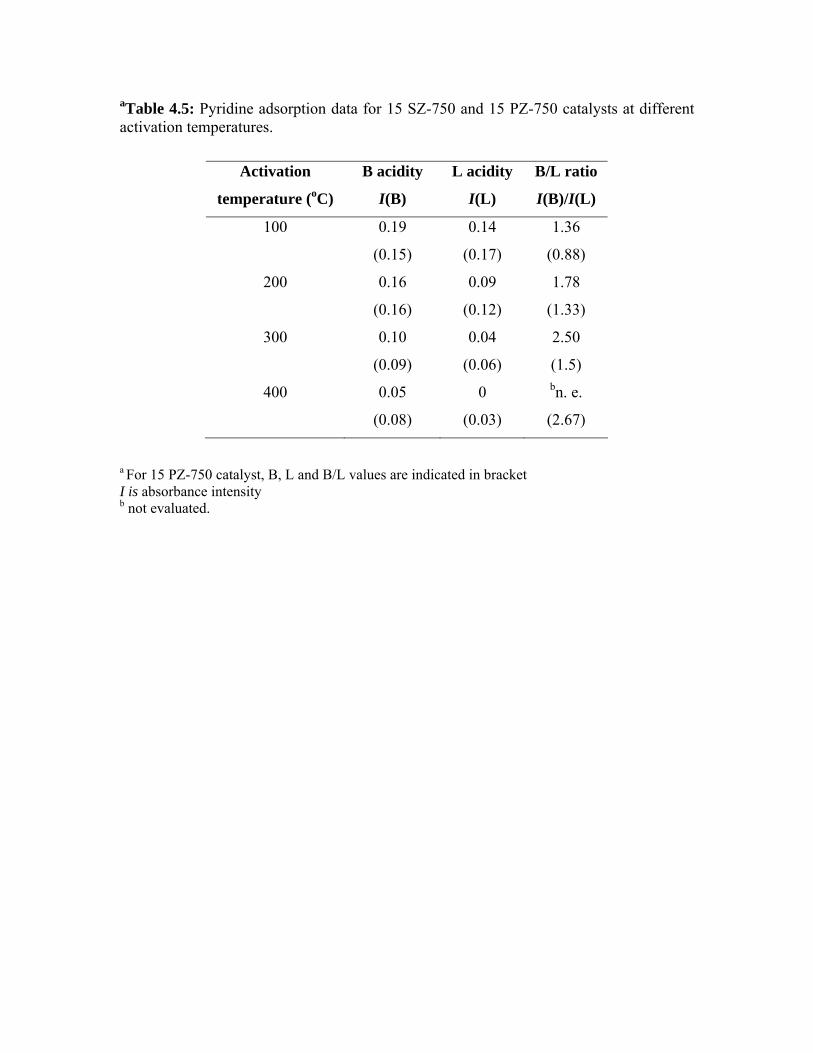
aTable 4.5: Pyridine adsorption data for 15 SZ-750 and 15 PZ-750 catalysts at different activation temperatures.
Activation
temperature (oC)
B acidity
I(B)
L acidity
I(L)
B/L ratio
I(B)/I(L)
100
0.19
(0.15)
0.14
(0.17)
1.36
(0.88)
200
0.16
(0.16)
0.09
(0.12)
1.78
(1.33)
300
0.10
(0.09)
0.04
(0.06)
2.50
(1.5)
400
0.05
(0.08)
0
(0.03)
bn. e.
(2.67)
a For 15 PZ-750 catalyst, B, L and B/L values are indicated in bracket I is absorbance intensity b not evaluated.
4.7. References 1. E. Lopez-Salinas, J.G. Hermandez-Cortez, I. Schifter, E. Torres-Garcia, J.
Navarrete, A. Gutierrez-Carrillo, T. Lopez, P.P. Lottici, D. Bersani,
Appl. Catal. A 193 (2000) 215.
2. A. Khodakov, J. Yang, S. Su, E. Iglesia, J. Catal. 177 (1998) 343.
3. JCPDS-International Center for diffraction data, 1990, Card 43-1035.
4. I.V. Kozhevnikov, Catalysts for Fine Chenical Synthesis. Vol. 2. Catalysis by
polyoxometalates, Wiley & Sons, Ltd., 2002. p. 15.
5. J.B. Moffat, Catalysis by Acids and Bases, Elsevier, Amsterdam, 1985, p. 157.
6. B.H. Davis, R.A. Keogh, S. Alerasool, D.J. Zalewski, D.E. Day, P.K. Doolin,
J. Catal. 183 (1999) 45.
7. M. Misono, Chem. Commun. (2001) 1141.
8. C.J. Dillon, J.H. Holles, R.J. Davis, J. A. Labinger, M.E. Davis,
J. Catal. 218 (2003) 54.
9. A. Ghanbari-Siahkali, A. Philippou, J. Dwyer, M.W. Anderson.
Appl. Catal. A 192 (2000) 57.
10. A. Molnar, T. Beregszaszi, A. Fudala, P. Lentz, J.B. Nagy, Z. Konya, I. Kiricsi
J. Catal. 202 (2001) 379.
11. S. Uchida, K. Inumaru, M. Misono, J. Phys. Chem. B 104 (2000) 8108.
12. B.M. Devassy, S.B. Halligudi, S.G. Hegde, A.B. Halgeri, F. Lefebvre,
Chem. Commun. (2002) 1074.
13. I.M. Smallwood, Handbook of organic solvent properties, Arnold, London
NW1 3BH, 1996.
14. C. Rocchiccioli-Deltcheff, M. Fournier, R. Franck, R. Thouvenot
Inorg. Chem. 22 (1983) 207.
15. M. Fournier, R. Thouvenot, C. Rocchiccioli-Deltcheff,
J. Chem. Soc. Faraday Trans. 87 (1991) 349.
16. G. Zukowska, J.R. Stevens, K.R. Jeffrey, Electrochem. Acta. 48 (2003) 2157.
17. Y. Hirano, K. Inumaru, T. Okuhara, M. Misono, Chem Lett. (1996) 1111.
18. A.A. Parks, Chem. Rev. 65 (1965) 177.
19. G.B. McGarvey, J.B. Moffat, J. Mol. Catal.69 (1991) 137.
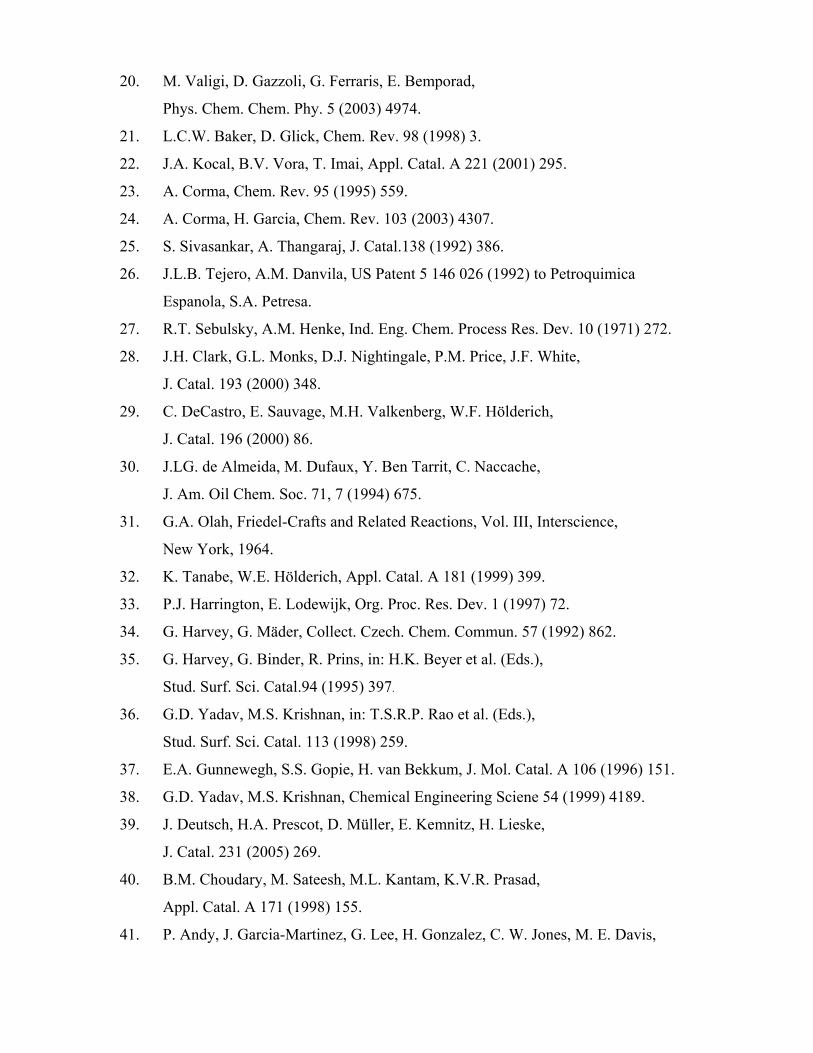
20. M. Valigi, D. Gazzoli, G. Ferraris, E. Bemporad,
Phys. Chem. Chem. Phy. 5 (2003) 4974.
21. L.C.W. Baker, D. Glick, Chem. Rev. 98 (1998) 3.
22. J.A. Kocal, B.V. Vora, T. Imai, Appl. Catal. A 221 (2001) 295.
23. A. Corma, Chem. Rev. 95 (1995) 559.
24. A. Corma, H. Garcia, Chem. Rev. 103 (2003) 4307.
25. S. Sivasankar, A. Thangaraj, J. Catal.138 (1992) 386.
26. J.L.B. Tejero, A.M. Danvila, US Patent 5 146 026 (1992) to Petroquimica
Espanola, S.A. Petresa.
27. R.T. Sebulsky, A.M. Henke, Ind. Eng. Chem. Process Res. Dev. 10 (1971) 272.
28. J.H. Clark, G.L. Monks, D.J. Nightingale, P.M. Price, J.F. White,
J. Catal. 193 (2000) 348.
29. C. DeCastro, E. Sauvage, M.H. Valkenberg, W.F. Hölderich,
J. Catal. 196 (2000) 86.
30. J.LG. de Almeida, M. Dufaux, Y. Ben Tarrit, C. Naccache,
J. Am. Oil Chem. Soc. 71, 7 (1994) 675.
31. G.A. Olah, Friedel-Crafts and Related Reactions, Vol. III, Interscience,
New York, 1964.
32. K. Tanabe, W.E. Hölderich, Appl. Catal. A 181 (1999) 399.
33. P.J. Harrington, E. Lodewijk, Org. Proc. Res. Dev. 1 (1997) 72.
34. G. Harvey, G. Mäder, Collect. Czech. Chem. Commun. 57 (1992) 862.
35. G. Harvey, G. Binder, R. Prins, in: H.K. Beyer et al. (Eds.),
Stud. Surf. Sci. Catal.94 (1995) 397.
36. G.D. Yadav, M.S. Krishnan, in: T.S.R.P. Rao et al. (Eds.),
Stud. Surf. Sci. Catal. 113 (1998) 259.
37. E.A. Gunnewegh, S.S. Gopie, H. van Bekkum, J. Mol. Catal. A 106 (1996) 151.
38. G.D. Yadav, M.S. Krishnan, Chemical Engineering Sciene 54 (1999) 4189.
39. J. Deutsch, H.A. Prescot, D. Müller, E. Kemnitz, H. Lieske,
J. Catal. 231 (2005) 269.
40. B.M. Choudary, M. Sateesh, M.L. Kantam, K.V.R. Prasad,
Appl. Catal. A 171 (1998) 155.
41. P. Andy, J. Garcia-Martinez, G. Lee, H. Gonzalez, C. W. Jones, M. E. Davis,
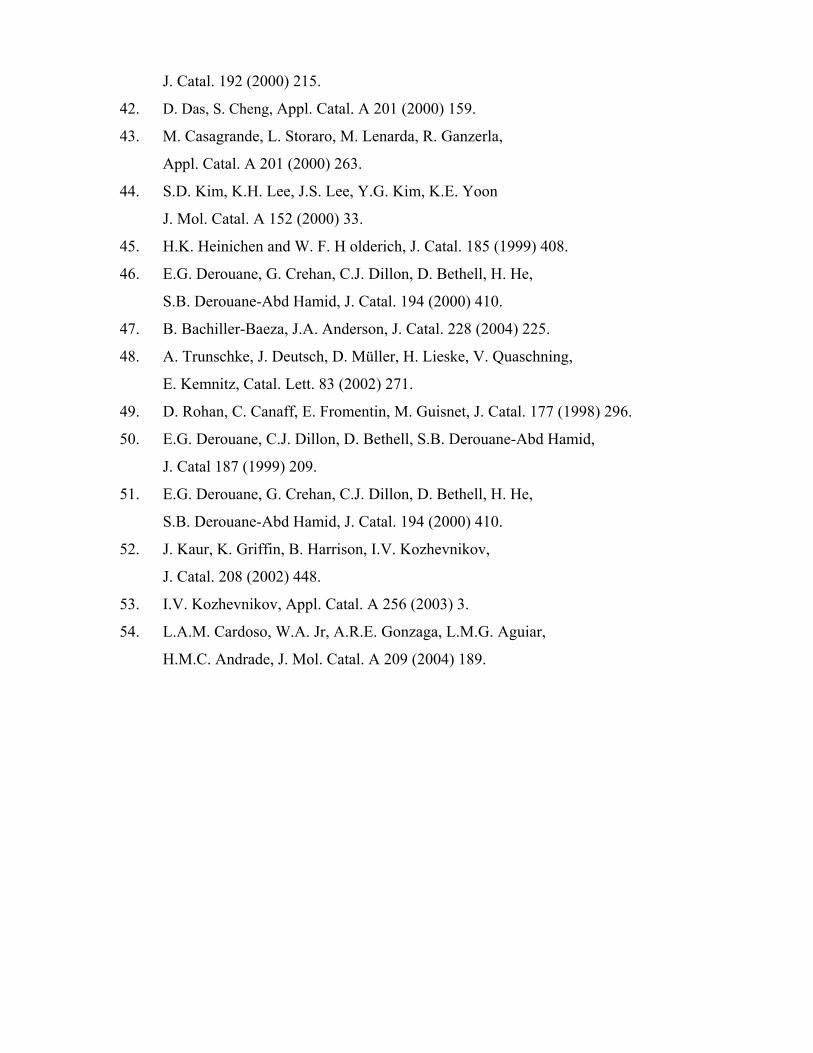
J. Catal. 192 (2000) 215.
42. D. Das, S. Cheng, Appl. Catal. A 201 (2000) 159.
43. M. Casagrande, L. Storaro, M. Lenarda, R. Ganzerla,
Appl. Catal. A 201 (2000) 263.
44. S.D. Kim, K.H. Lee, J.S. Lee, Y.G. Kim, K.E. Yoon
J. Mol. Catal. A 152 (2000) 33.
45. H.K. Heinichen and W. F. H olderich, J. Catal. 185 (1999) 408.
46. E.G. Derouane, G. Crehan, C.J. Dillon, D. Bethell, H. He,
S.B. Derouane-Abd Hamid, J. Catal. 194 (2000) 410.
47. B. Bachiller-Baeza, J.A. Anderson, J. Catal. 228 (2004) 225.
48. A. Trunschke, J. Deutsch, D. Müller, H. Lieske, V. Quaschning,
E. Kemnitz, Catal. Lett. 83 (2002) 271.
49. D. Rohan, C. Canaff, E. Fromentin, M. Guisnet, J. Catal. 177 (1998) 296.
50.
E.G. Derouane, C.J. Dillon, D. Bethell, S.B. Derouane-Abd Hamid,
J. Catal 187 (1999) 209.
51.
E.G. Derouane, G. Crehan, C.J. Dillon, D. Bethell, H. He,
S.B. Derouane-Abd Hamid, J. Catal. 194 (2000) 410.
52.
J. Kaur, K. Griffin, B. Harrison, I.V. Kozhevnikov,
J. Catal. 208 (2002) 448.
53. I.V. Kozhevnikov, Appl. Catal. A 256 (2003) 3.
54.
L.A.M. Cardoso, W.A. Jr, A.R.E. Gonzaga, L.M.G. Aguiar,
H.M.C. Andrade, J. Mol. Catal. A 209 (2004) 189.
Chapter 5
Zirconia-supported phosphomolybdic acid
5.1. Introduction
This section deals with the characterization of zirconia-supported phosphomolybdic acid (PMA) catalysts by X-ray diffraction, and 31P MAS NMR spectroscopy and the nature of acidic sites present in the most active catalyst by FTIR pyridine adsorption spectroscopy. These catalysts were used in the synthesis of linear alkyl benzenes by alkylation of benzene with higher linear alkenes such as 1-octene and 1-dodecene and alkylation of phenol with tert-butanol.
5.2. Preparation
The zirconia-supported phosphomolybdic acid catalysts were prepared by the procedure given in Section 2.2. These catalysts were represented by x MZ-T, where x represents wt. %, M represents PMA, Z represents zirconia and T denotes calcination temperature (oC).
For comparison, a catalyst with 15 % MoO3 on ZrO2 calcined at 700 oC (15 Mo-700) was prepared by wet impregnation of zirconium oxyhydroxide with an aqueous solution of ammonium heptamolybdate (s.d. fine chemicals), followed by drying and calcination.
5.3. Catalyst characterization - Results and discussion 5.3.1. X-ray diffraction
The XRD pattern of the catalysts with different PMA loading calcined at 700 oC
(Fig. 5.1A) showed the presence of PMA strongly influences the crystallization of
zirconium oxyhydroxide into zirconia. Pure zirconia calcined at 700 oC is mainly
monoclinic with small amount of the tetragonal phase. For catalysts with low PMA
loading calcined at 700 oC, the XRD pattern could be described as the sum of the
monoclinic and tetragonal phases of zirconia, this latter phase becoming dominant for
catalyst with 15 % PMA. This can be explained as the strong interaction of PMA with the
support reduces the surface diffusion of zirconia, inhibits sintering and stabilizes the
tetragonal phase of zirconia. It could be seen that up to a 15 % PMA loading, no
diffraction lines, which could be attributed to the polyacid or to its decomposition
products, were observed. The 20 MZ-700 catalyst showed the presence of new diffraction
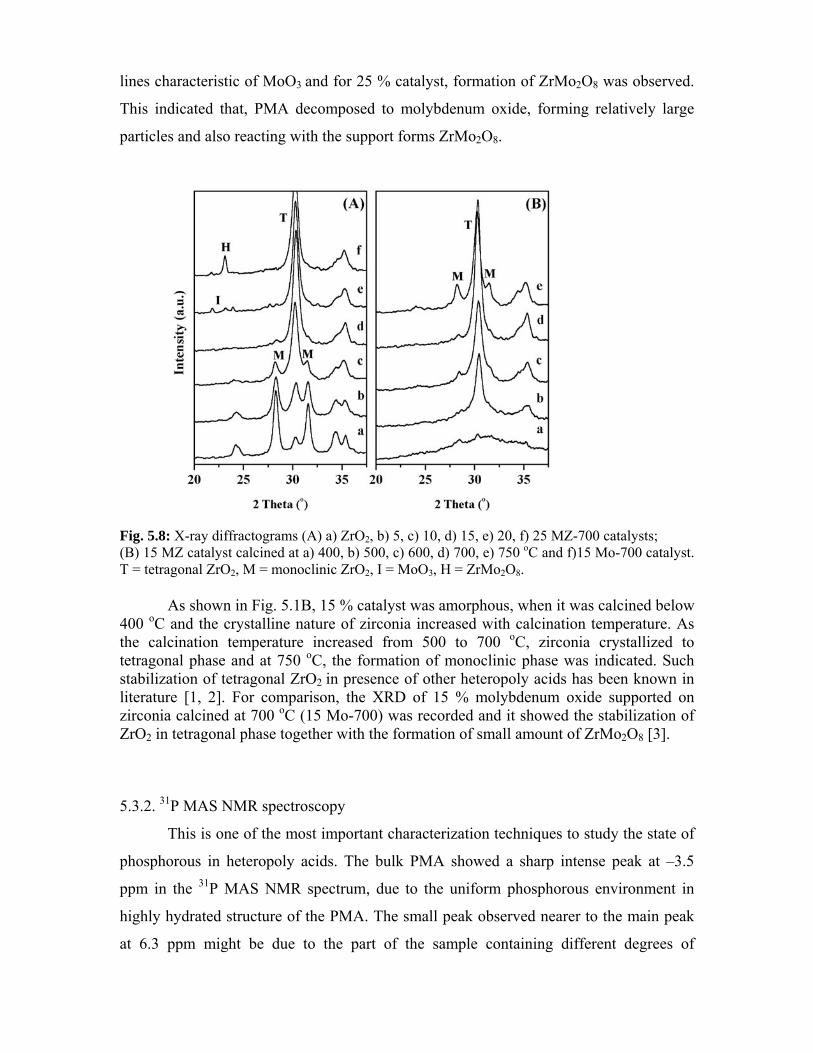
lines characteristic of MoO3 and for 25 % catalyst, formation of ZrMo2O8 was observed.
This indicated that, PMA decomposed to molybdenum oxide, forming relatively large
particles and also reacting with the support forms ZrMo2O8.
Fig. 5.8: X-ray diffractograms (A) a) ZrO2, b) 5, c) 10, d) 15, e) 20, f) 25 MZ-700 catalysts; (B) 15 MZ catalyst calcined at a) 400, b) 500, c) 600, d) 700, e) 750 oC and f)15 Mo-700 catalyst. T = tetragonal ZrO2, M = monoclinic ZrO2, I = MoO3, H = ZrMo2O8.
As shown in Fig. 5.1B, 15 % catalyst was amorphous, when it was calcined below 400 oC and the crystalline nature of zirconia increased with calcination temperature. As the calcination temperature increased from 500 to 700 oC, zirconia crystallized to tetragonal phase and at 750 oC, the formation of monoclinic phase was indicated. Such stabilization of tetragonal ZrO2 in presence of other heteropoly acids has been known in literature [1, 2]. For comparison, the XRD of 15 % molybdenum oxide supported on zirconia calcined at 700 oC (15 Mo-700) was recorded and it showed the stabilization of ZrO2 in tetragonal phase together with the formation of small amount of ZrMo2O8 [3].
5.3.2. 31P MAS NMR spectroscopy
This is one of the most important characterization techniques to study the state of
phosphorous in heteropoly acids. The bulk PMA showed a sharp intense peak at –3.5
ppm in the 31P MAS NMR spectrum, due to the uniform phosphorous environment in
highly hydrated structure of the PMA. The small peak observed nearer to the main peak
at 6.3 ppm might be due to the part of the sample containing different degrees of
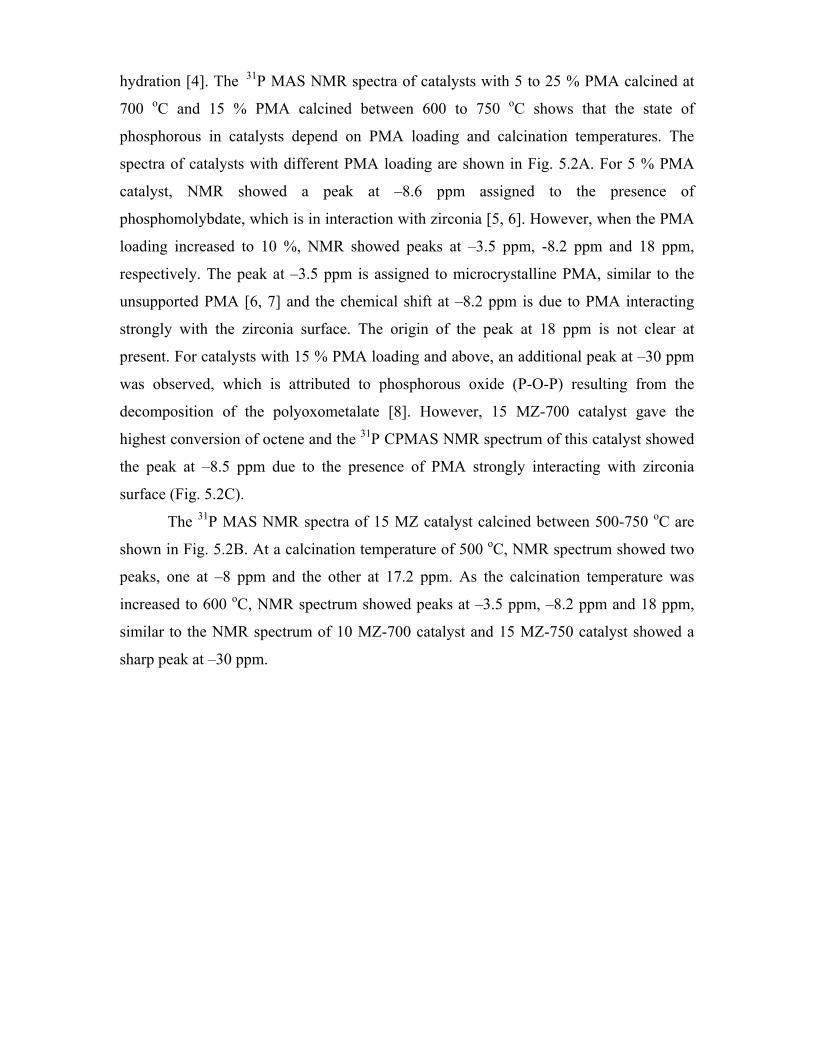
hydration [4]. The 31P MAS NMR spectra of catalysts with 5 to 25 % PMA calcined at
700 oC and 15 % PMA calcined between 600 to 750 oC shows that the state of
phosphorous in catalysts depend on PMA loading and calcination temperatures. The
spectra of catalysts with different PMA loading are shown in Fig. 5.2A. For 5 % PMA
catalyst, NMR showed a peak at –8.6 ppm assigned to the presence of
phosphomolybdate, which is in interaction with zirconia [5, 6]. However, when the PMA
loading increased to 10 %, NMR showed peaks at –3.5 ppm, -8.2 ppm and 18 ppm,
respectively. The peak at –3.5 ppm is assigned to microcrystalline PMA, similar to the
unsupported PMA [6, 7] and the chemical shift at –8.2 ppm is due to PMA interacting
strongly with the zirconia surface. The origin of the peak at 18 ppm is not clear at
present. For catalysts with 15 % PMA loading and above, an additional peak at –30 ppm
was observed, which is attributed to phosphorous oxide (P-O-P) resulting from the
decomposition of the polyoxometalate [8]. However, 15 MZ-700 catalyst gave the
highest conversion of octene and the 31P CPMAS NMR spectrum of this catalyst showed
the peak at –8.5 ppm due to the presence of PMA strongly interacting with zirconia
surface (Fig. 5.2C).
The 31P MAS NMR spectra of 15 MZ catalyst calcined between 500-750 oC are
shown in Fig. 5.2B. At a calcination temperature of 500 oC, NMR spectrum showed two
peaks, one at –8 ppm and the other at 17.2 ppm. As the calcination temperature was
increased to 600 oC, NMR spectrum showed peaks at –3.5 ppm, –8.2 ppm and 18 ppm,
similar to the NMR spectrum of 10 MZ-700 catalyst and 15 MZ-750 catalyst showed a
sharp peak at –30 ppm.
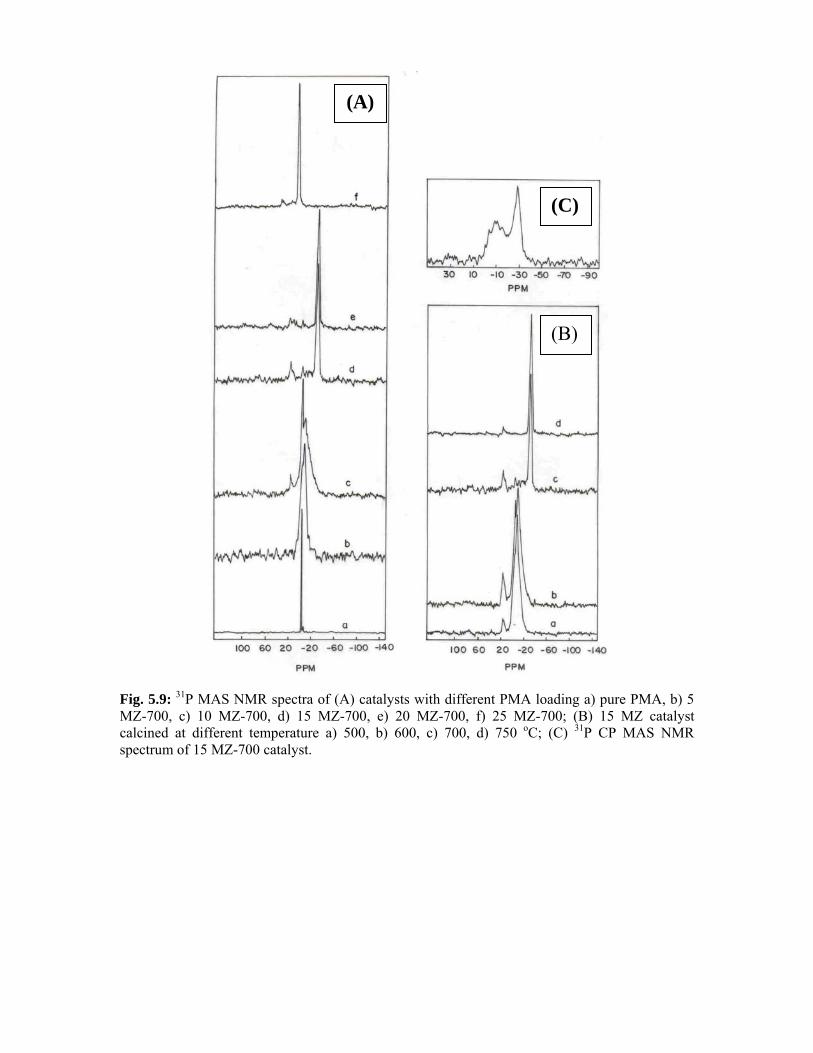
(A)
(B)
(C)
Fig. 5.9: 31P MAS NMR spectra of (A) catalysts with different PMA loading a) pure PMA, b) 5 MZ-700, c) 10 MZ-700, d) 15 MZ-700, e) 20 MZ-700, f) 25 MZ-700; (B) 15 MZ catalyst calcined at different temperature a) 500, b) 600, c) 700, d) 750 oC; (C) 31P CP MAS NMR spectrum of 15 MZ-700 catalyst.
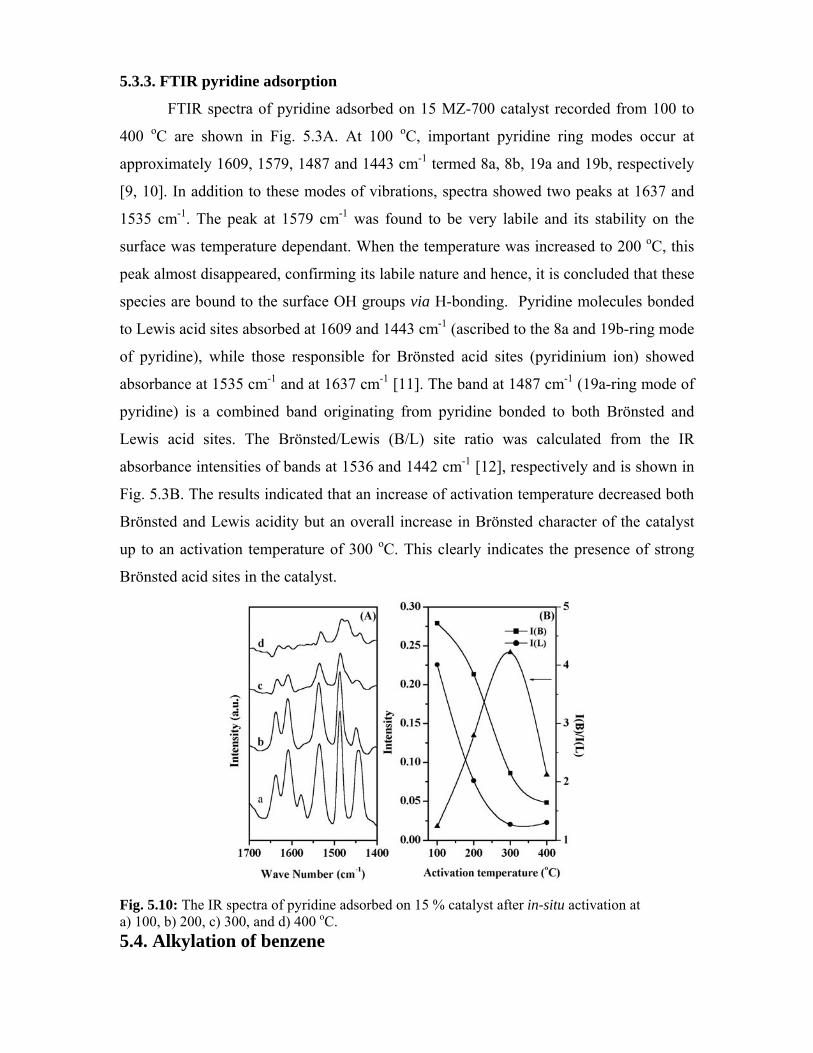
5.3.3. FTIR pyridine adsorption
FTIR spectra of pyridine adsorbed on 15 MZ-700 catalyst recorded from 100 to
400 oC are shown in Fig. 5.3A. At 100 oC, important pyridine ring modes occur at
approximately 1609, 1579, 1487 and 1443 cm-1 termed 8a, 8b, 19a and 19b, respectively
[9, 10]. In addition to these modes of vibrations, spectra showed two peaks at 1637 and
1535 cm-1. The peak at 1579 cm-1 was found to be very labile and its stability on the
surface was temperature dependant. When the temperature was increased to 200 oC, this
peak almost disappeared, confirming its labile nature and hence, it is concluded that these
species are bound to the surface OH groups via H-bonding. Pyridine molecules bonded
to Lewis acid sites absorbed at 1609 and 1443 cm-1 (ascribed to the 8a and 19b-ring mode
of pyridine), while those responsible for Brönsted acid sites (pyridinium ion) showed
absorbance at 1535 cm-1 and at 1637 cm-1 [11]. The band at 1487 cm-1 (19a-ring mode of
pyridine) is a combined band originating from pyridine bonded to both Brönsted and
Lewis acid sites. The Brönsted/Lewis (B/L) site ratio was calculated from the IR
absorbance intensities of bands at 1536 and 1442 cm-1 [12], respectively and is shown in
Fig. 5.3B. The results indicated that an increase of activation temperature decreased both
Brönsted and Lewis acidity but an overall increase in Brönsted character of the catalyst
up to an activation temperature of 300 oC. This clearly indicates the presence of strong
Brönsted acid sites in the catalyst.
Fig. 5.10: The IR spectra of pyridine adsorbed on 15 % catalyst after in-situ activation at a) 100, b) 200, c) 300, and d) 400 oC. 5.4. Alkylation of benzene
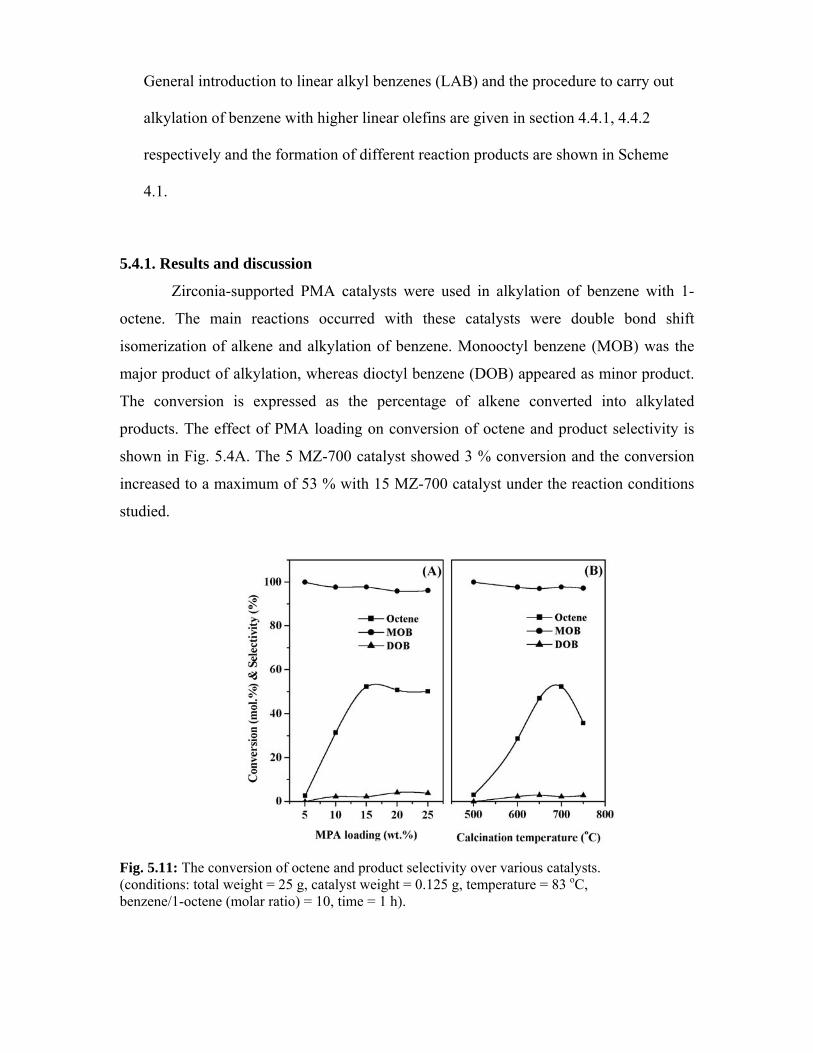
General introduction to linear alkyl benzenes (LAB) and the procedure to carry out
alkylation of benzene with higher linear olefins are given in section 4.4.1, 4.4.2
respectively and the formation of different reaction products are shown in Scheme
4.1.
5.4.1. Results and discussion
Zirconia-supported PMA catalysts were used in alkylation of benzene with 1-
octene. The main reactions occurred with these catalysts were double bond shift
isomerization of alkene and alkylation of benzene. Monooctyl benzene (MOB) was the
major product of alkylation, whereas dioctyl benzene (DOB) appeared as minor product.
The conversion is expressed as the percentage of alkene converted into alkylated
products. The effect of PMA loading on conversion of octene and product selectivity is
shown in Fig. 5.4A. The 5 MZ-700 catalyst showed 3 % conversion and the conversion
increased to a maximum of 53 % with 15 MZ-700 catalyst under the reaction conditions
studied.
Fig. 5.11: The conversion of octene and product selectivity over various catalysts. (conditions: total weight = 25 g, catalyst weight = 0.125 g, temperature = 83 oC, benzene/1-octene (molar ratio) = 10, time = 1 h).
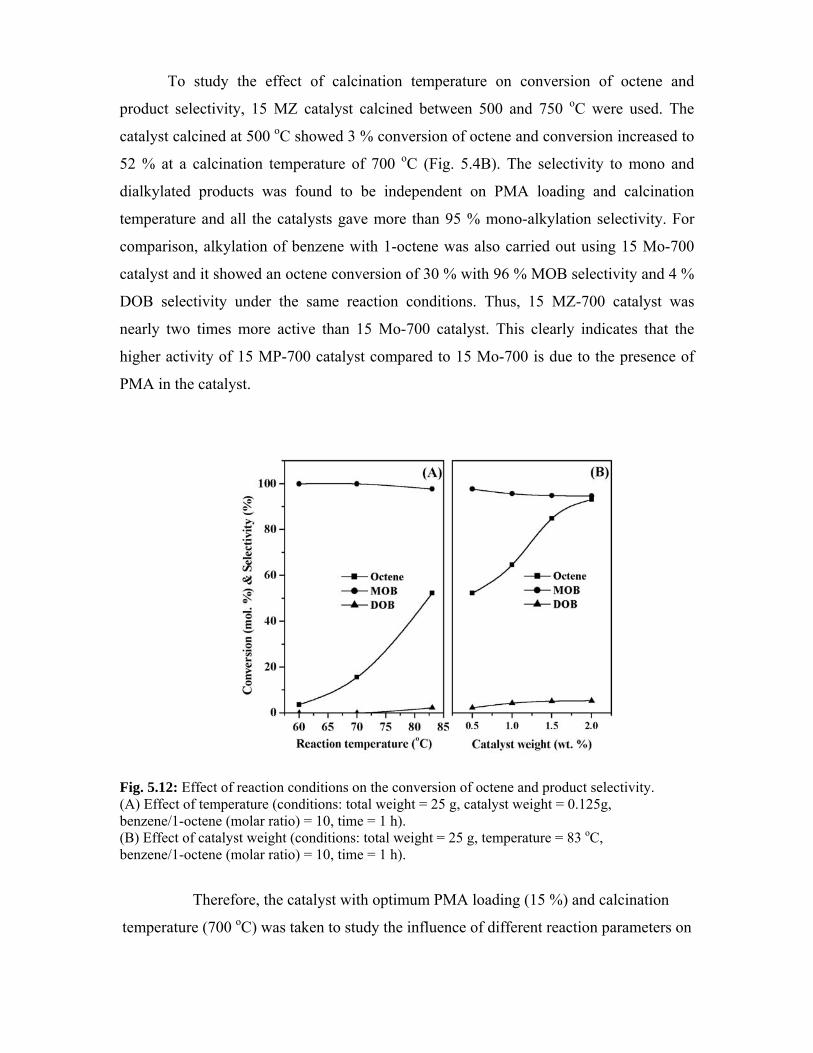
To study the effect of calcination temperature on conversion of octene and
product selectivity, 15 MZ catalyst calcined between 500 and 750 oC were used. The
catalyst calcined at 500 oC showed 3 % conversion of octene and conversion increased to
52 % at a calcination temperature of 700 oC (Fig. 5.4B). The selectivity to mono and
dialkylated products was found to be independent on PMA loading and calcination
temperature and all the catalysts gave more than 95 % mono-alkylation selectivity. For
comparison, alkylation of benzene with 1-octene was also carried out using 15 Mo-700
catalyst and it showed an octene conversion of 30 % with 96 % MOB selectivity and 4 %
DOB selectivity under the same reaction conditions. Thus, 15 MZ-700 catalyst was
nearly two times more active than 15 Mo-700 catalyst. This clearly indicates that the
higher activity of 15 MP-700 catalyst compared to 15 Mo-700 is due to the presence of
PMA in the catalyst.
Fig. 5.12: Effect of reaction conditions on the conversion of octene and product selectivity. (A) Effect of temperature (conditions: total weight = 25 g, catalyst weight = 0.125g, benzene/1-octene (molar ratio) = 10, time = 1 h). (B) Effect of catalyst weight (conditions: total weight = 25 g, temperature = 83 oC, benzene/1-octene (molar ratio) = 10, time = 1 h).
Therefore, the catalyst with optimum PMA loading (15 %) and calcination
temperature (700 oC) was taken to study the influence of different reaction parameters on
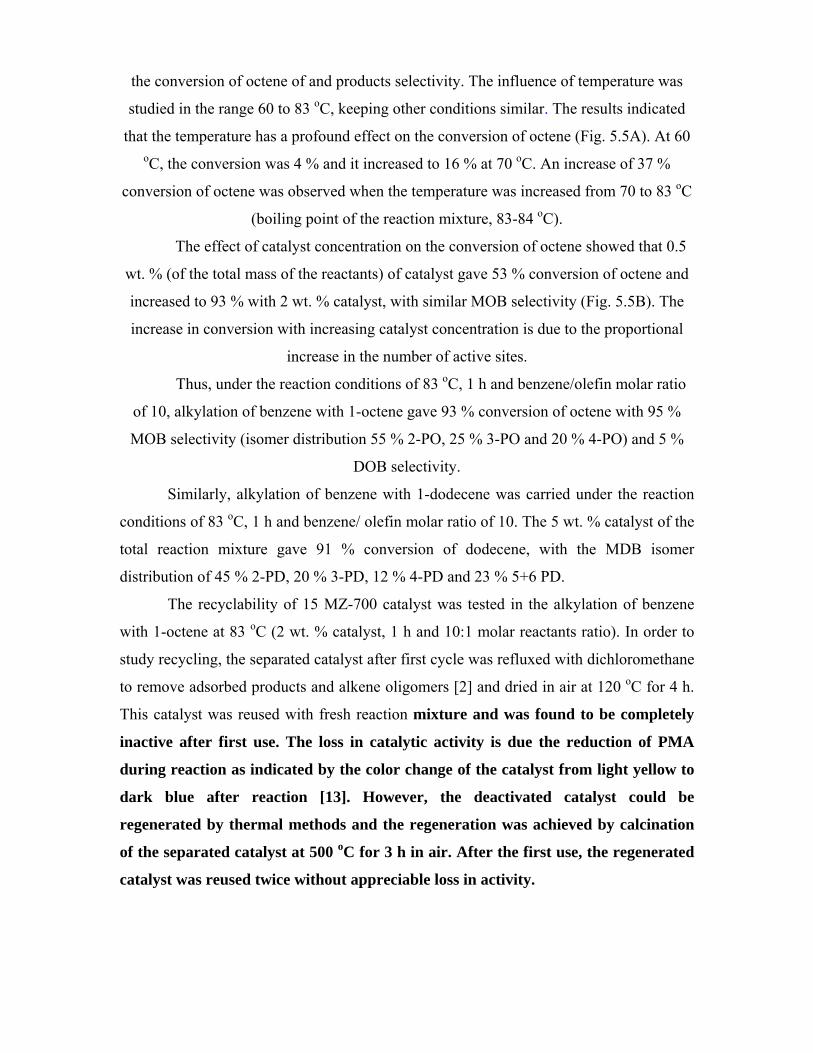
the conversion of octene of and products selectivity. The influence of temperature was
studied in the range 60 to 83 oC, keeping other conditions similar. The results indicated
that the temperature has a profound effect on the conversion of octene (Fig. 5.5A). At 60 oC, the conversion was 4 % and it increased to 16 % at 70 oC. An increase of 37 %
conversion of octene was observed when the temperature was increased from 70 to 83 oC
(boiling point of the reaction mixture, 83-84 oC).
The effect of catalyst concentration on the conversion of octene showed that 0.5
wt. % (of the total mass of the reactants) of catalyst gave 53 % conversion of octene and
increased to 93 % with 2 wt. % catalyst, with similar MOB selectivity (Fig. 5.5B). The
increase in conversion with increasing catalyst concentration is due to the proportional
increase in the number of active sites.
Thus, under the reaction conditions of 83 oC, 1 h and benzene/olefin molar ratio
of 10, alkylation of benzene with 1-octene gave 93 % conversion of octene with 95 %
MOB selectivity (isomer distribution 55 % 2-PO, 25 % 3-PO and 20 % 4-PO) and 5 %
DOB selectivity.
Similarly, alkylation of benzene with 1-dodecene was carried under the reaction
conditions of 83 oC, 1 h and benzene/ olefin molar ratio of 10. The 5 wt. % catalyst of the
total reaction mixture gave 91 % conversion of dodecene, with the MDB isomer
distribution of 45 % 2-PD, 20 % 3-PD, 12 % 4-PD and 23 % 5+6 PD.
The recyclability of 15 MZ-700 catalyst was tested in the alkylation of benzene
with 1-octene at 83 oC (2 wt. % catalyst, 1 h and 10:1 molar reactants ratio). In order to
study recycling, the separated catalyst after first cycle was refluxed with dichloromethane
to remove adsorbed products and alkene oligomers [2] and dried in air at 120 oC for 4 h.
This catalyst was reused with fresh reaction mixture and was found to be completely
inactive after first use. The loss in catalytic activity is due the reduction of PMA
during reaction as indicated by the color change of the catalyst from light yellow to
dark blue after reaction [13]. However, the deactivated catalyst could be
regenerated by thermal methods and the regeneration was achieved by calcination
of the separated catalyst at 500 oC for 3 h in air. After the first use, the regenerated
catalyst was reused twice without appreciable loss in activity.
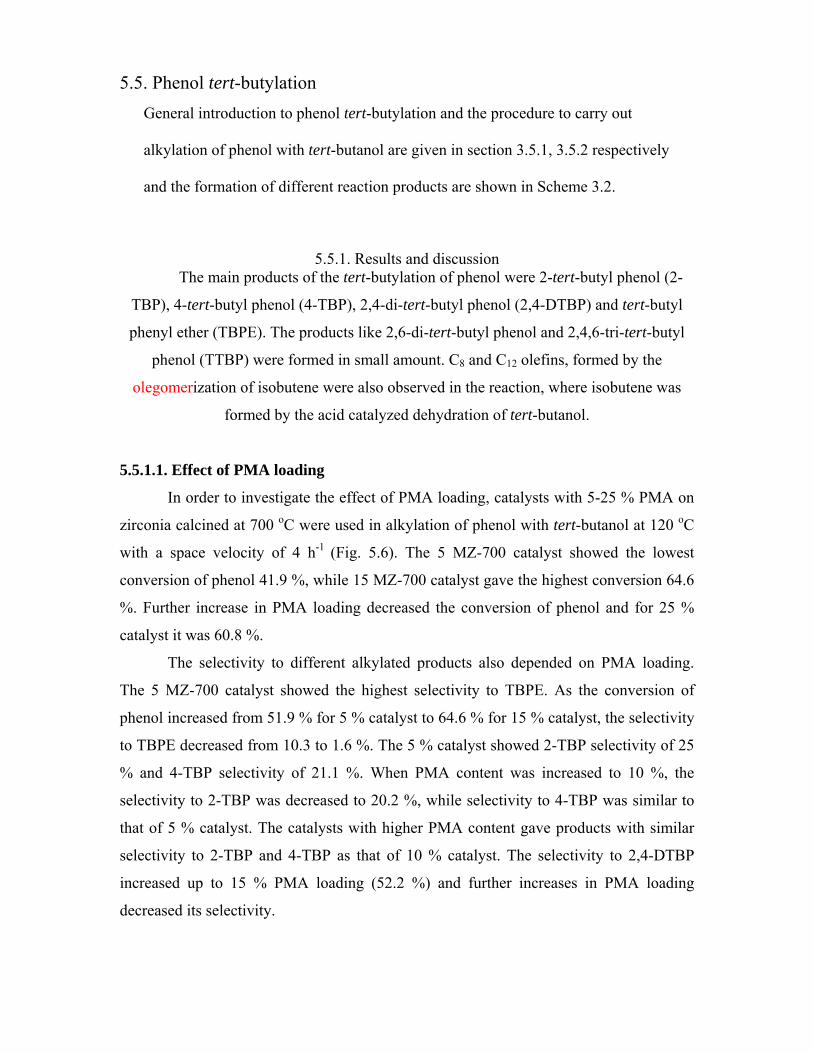
5.5. Phenol tert-butylation General introduction to phenol tert-butylation and the procedure to carry out
alkylation of phenol with tert-butanol are given in section 3.5.1, 3.5.2 respectively
and the formation of different reaction products are shown in Scheme 3.2.
5.5.1. Results and discussion The main products of the tert-butylation of phenol were 2-tert-butyl phenol (2-
TBP), 4-tert-butyl phenol (4-TBP), 2,4-di-tert-butyl phenol (2,4-DTBP) and tert-butyl
phenyl ether (TBPE). The products like 2,6-di-tert-butyl phenol and 2,4,6-tri-tert-butyl
phenol (TTBP) were formed in small amount. C8 and C12 olefins, formed by the
olegomerization of isobutene were also observed in the reaction, where isobutene was
formed by the acid catalyzed dehydration of tert-butanol.
5.5.1.1. Effect of PMA loading
In order to investigate the effect of PMA loading, catalysts with 5-25 % PMA on
zirconia calcined at 700 oC were used in alkylation of phenol with tert-butanol at 120 oC
with a space velocity of 4 h-1 (Fig. 5.6). The 5 MZ-700 catalyst showed the lowest
conversion of phenol 41.9 %, while 15 MZ-700 catalyst gave the highest conversion 64.6
%. Further increase in PMA loading decreased the conversion of phenol and for 25 %
catalyst it was 60.8 %.
The selectivity to different alkylated products also depended on PMA loading.
The 5 MZ-700 catalyst showed the highest selectivity to TBPE. As the conversion of
phenol increased from 51.9 % for 5 % catalyst to 64.6 % for 15 % catalyst, the selectivity
to TBPE decreased from 10.3 to 1.6 %. The 5 % catalyst showed 2-TBP selectivity of 25
% and 4-TBP selectivity of 21.1 %. When PMA content was increased to 10 %, the
selectivity to 2-TBP was decreased to 20.2 %, while selectivity to 4-TBP was similar to
that of 5 % catalyst. The catalysts with higher PMA content gave products with similar
selectivity to 2-TBP and 4-TBP as that of 10 % catalyst. The selectivity to 2,4-DTBP
increased up to 15 % PMA loading (52.2 %) and further increases in PMA loading
decreased its selectivity.
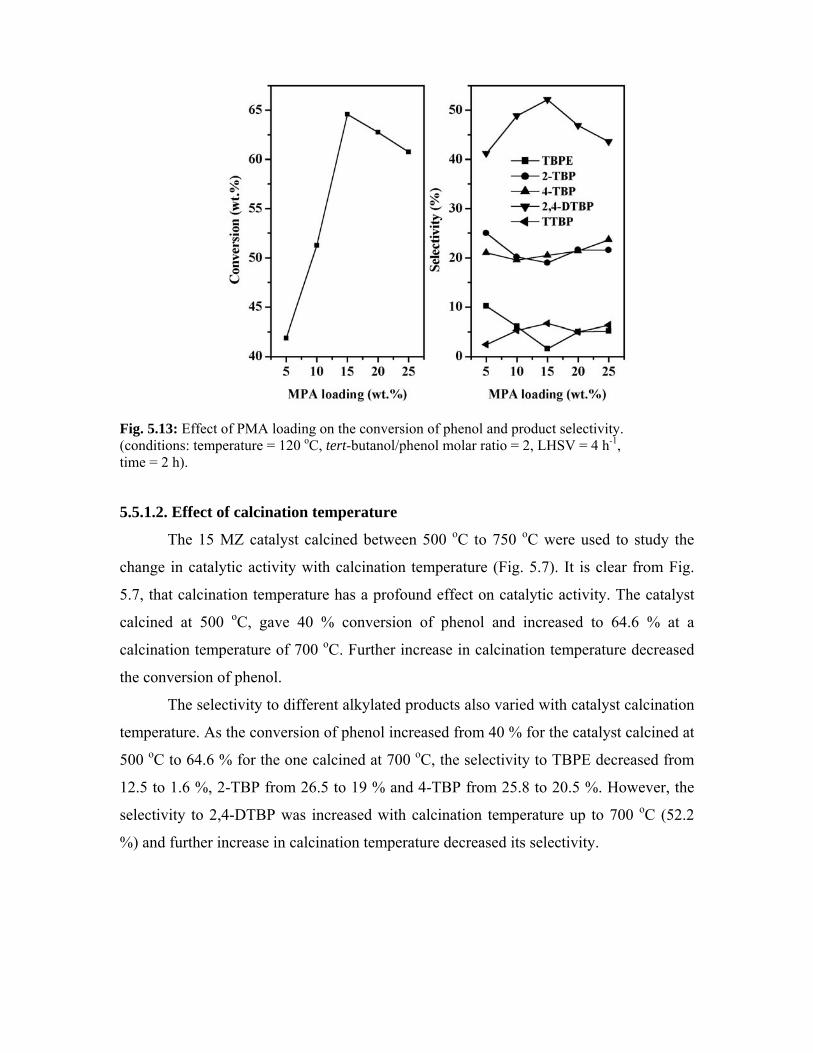
Fig. 5.13: Effect of PMA loading on the conversion of phenol and product selectivity. (conditions: temperature = 120 oC, tert-butanol/phenol molar ratio = 2, LHSV = 4 h-1, time = 2 h). 5.5.1.2. Effect of calcination temperature
The 15 MZ catalyst calcined between 500 oC to 750 oC were used to study the
change in catalytic activity with calcination temperature (Fig. 5.7). It is clear from Fig.
5.7, that calcination temperature has a profound effect on catalytic activity. The catalyst
calcined at 500 oC, gave 40 % conversion of phenol and increased to 64.6 % at a
calcination temperature of 700 oC. Further increase in calcination temperature decreased
the conversion of phenol.
The selectivity to different alkylated products also varied with catalyst calcination
temperature. As the conversion of phenol increased from 40 % for the catalyst calcined at
500 oC to 64.6 % for the one calcined at 700 oC, the selectivity to TBPE decreased from
12.5 to 1.6 %, 2-TBP from 26.5 to 19 % and 4-TBP from 25.8 to 20.5 %. However, the
selectivity to 2,4-DTBP was increased with calcination temperature up to 700 oC (52.2
%) and further increase in calcination temperature decreased its selectivity.
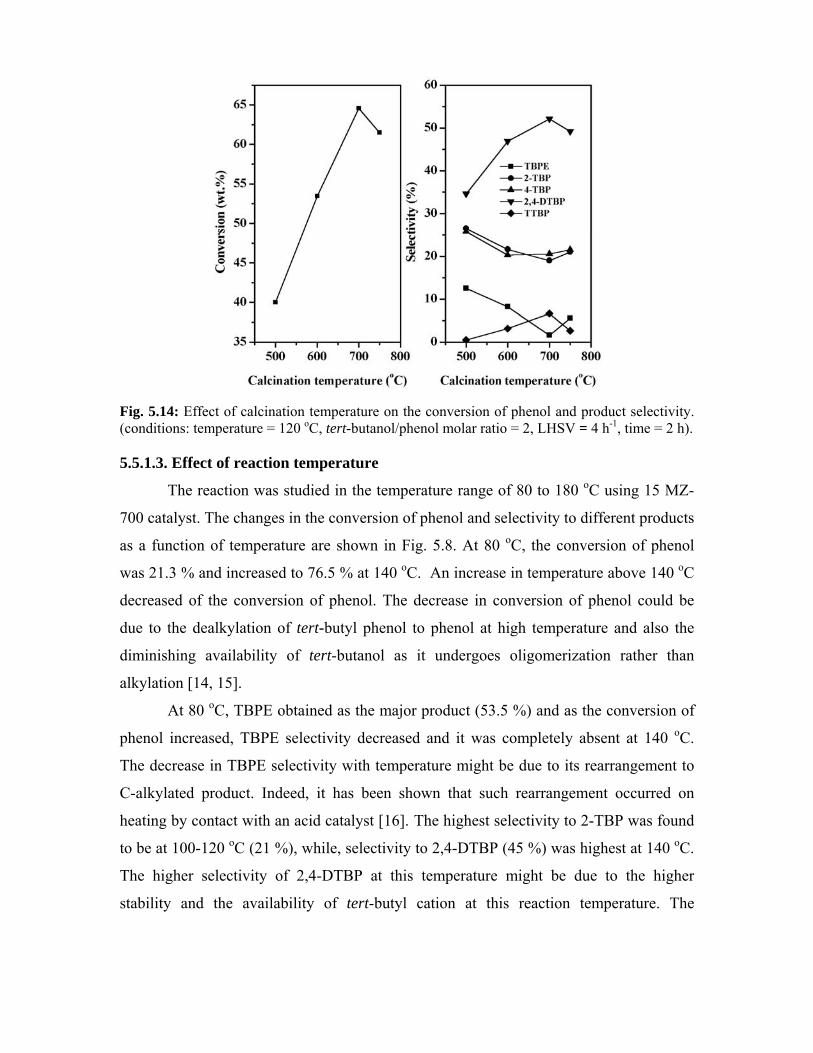
Fig. 5.14: Effect of calcination temperature on the conversion of phenol and product selectivity. (conditions: temperature = 120 oC, tert-butanol/phenol molar ratio = 2, LHSV = 4 h-1, time = 2 h). 5.5.1.3. Effect of reaction temperature
The reaction was studied in the temperature range of 80 to 180 oC using 15 MZ-
700 catalyst. The changes in the conversion of phenol and selectivity to different products
as a function of temperature are shown in Fig. 5.8. At 80 oC, the conversion of phenol
was 21.3 % and increased to 76.5 % at 140 oC. An increase in temperature above 140 oC
decreased of the conversion of phenol. The decrease in conversion of phenol could be
due to the dealkylation of tert-butyl phenol to phenol at high temperature and also the
diminishing availability of tert-butanol as it undergoes oligomerization rather than
alkylation [14, 15].
At 80 oC, TBPE obtained as the major product (53.5 %) and as the conversion of
phenol increased, TBPE selectivity decreased and it was completely absent at 140 oC.
The decrease in TBPE selectivity with temperature might be due to its rearrangement to
C-alkylated product. Indeed, it has been shown that such rearrangement occurred on
heating by contact with an acid catalyst [16]. The highest selectivity to 2-TBP was found
to be at 100-120 oC (21 %), while, selectivity to 2,4-DTBP (45 %) was highest at 140 oC.
The higher selectivity of 2,4-DTBP at this temperature might be due to the higher
stability and the availability of tert-butyl cation at this reaction temperature. The
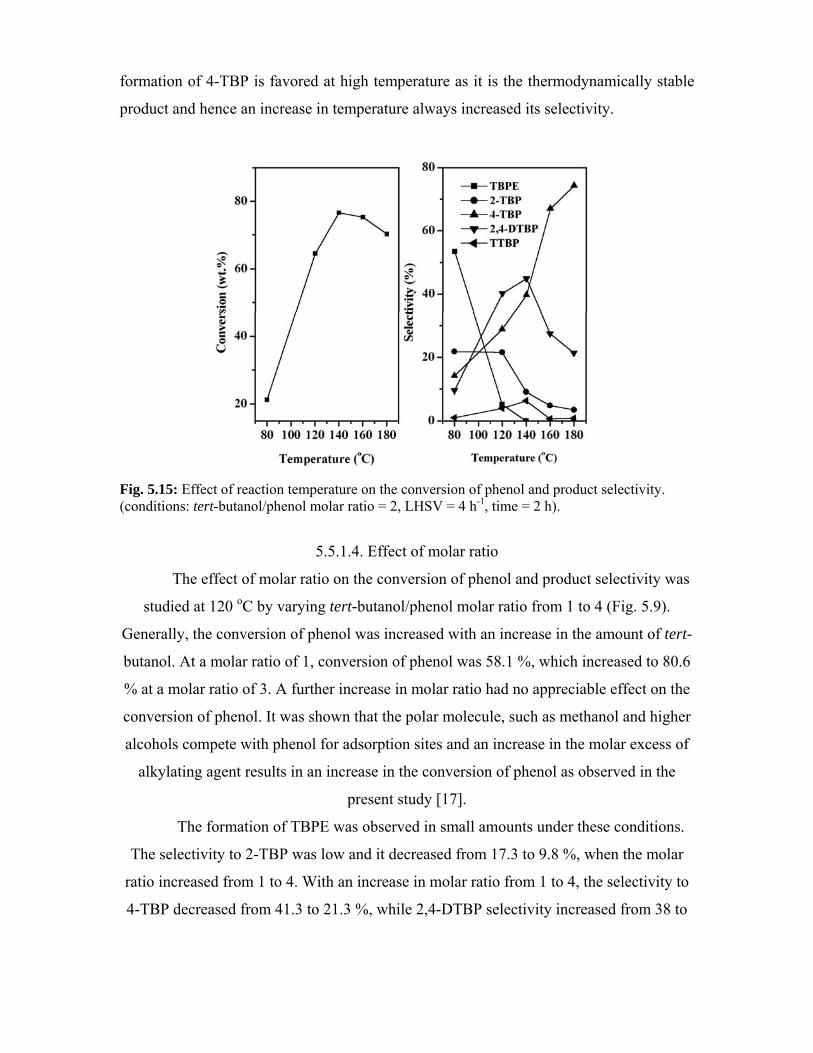
formation of 4-TBP is favored at high temperature as it is the thermodynamically stable
product and hence an increase in temperature always increased its selectivity.
Fig. 5.15: Effect of reaction temperature on the conversion of phenol and product selectivity. (conditions: tert-butanol/phenol molar ratio = 2, LHSV = 4 h-1, time = 2 h).
5.5.1.4. Effect of molar ratio
The effect of molar ratio on the conversion of phenol and product selectivity was
studied at 120 oC by varying tert-butanol/phenol molar ratio from 1 to 4 (Fig. 5.9).
Generally, the conversion of phenol was increased with an increase in the amount of tert-
butanol. At a molar ratio of 1, conversion of phenol was 58.1 %, which increased to 80.6
% at a molar ratio of 3. A further increase in molar ratio had no appreciable effect on the
conversion of phenol. It was shown that the polar molecule, such as methanol and higher
alcohols compete with phenol for adsorption sites and an increase in the molar excess of
alkylating agent results in an increase in the conversion of phenol as observed in the
present study [17].
The formation of TBPE was observed in small amounts under these conditions.
The selectivity to 2-TBP was low and it decreased from 17.3 to 9.8 %, when the molar
ratio increased from 1 to 4. With an increase in molar ratio from 1 to 4, the selectivity to
4-TBP decreased from 41.3 to 21.3 %, while 2,4-DTBP selectivity increased from 38 to
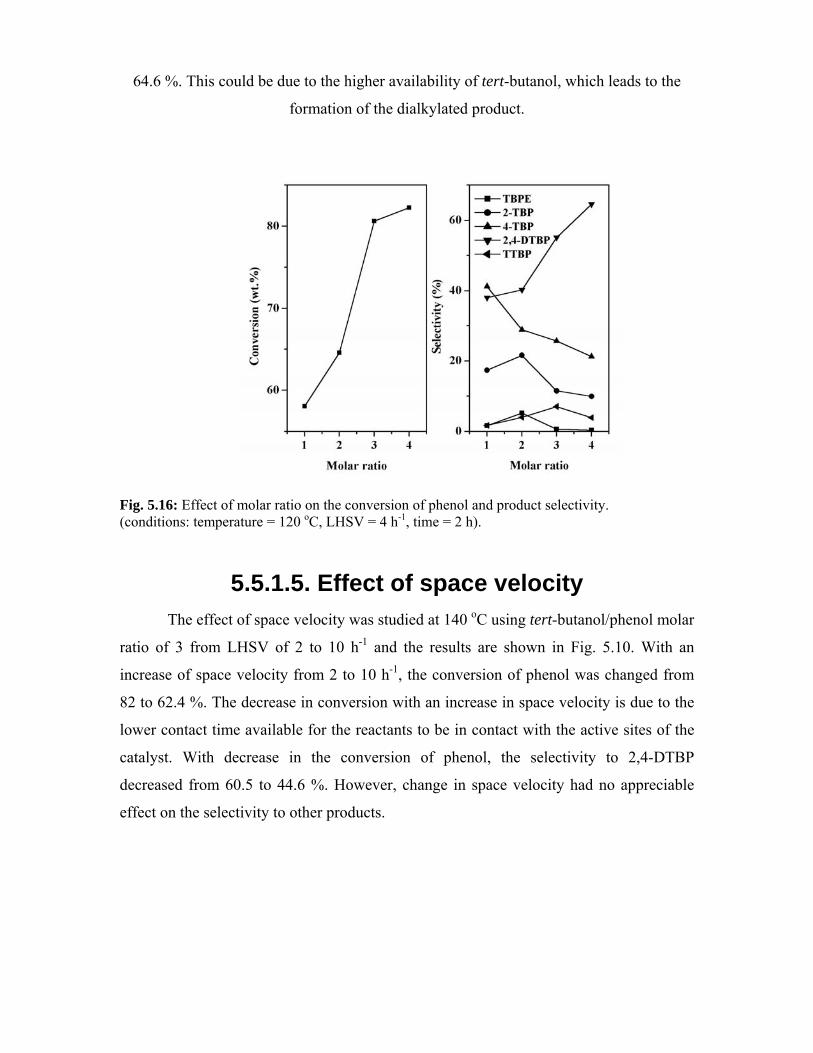
64.6 %. This could be due to the higher availability of tert-butanol, which leads to the
formation of the dialkylated product.
Fig. 5.16: Effect of molar ratio on the conversion of phenol and product selectivity. (conditions: temperature = 120 oC, LHSV = 4 h-1, time = 2 h).
5.5.1.5. Effect of space velocity The effect of space velocity was studied at 140 oC using tert-butanol/phenol molar
ratio of 3 from LHSV of 2 to 10 h-1 and the results are shown in Fig. 5.10. With an
increase of space velocity from 2 to 10 h-1, the conversion of phenol was changed from
82 to 62.4 %. The decrease in conversion with an increase in space velocity is due to the
lower contact time available for the reactants to be in contact with the active sites of the
catalyst. With decrease in the conversion of phenol, the selectivity to 2,4-DTBP
decreased from 60.5 to 44.6 %. However, change in space velocity had no appreciable
effect on the selectivity to other products.
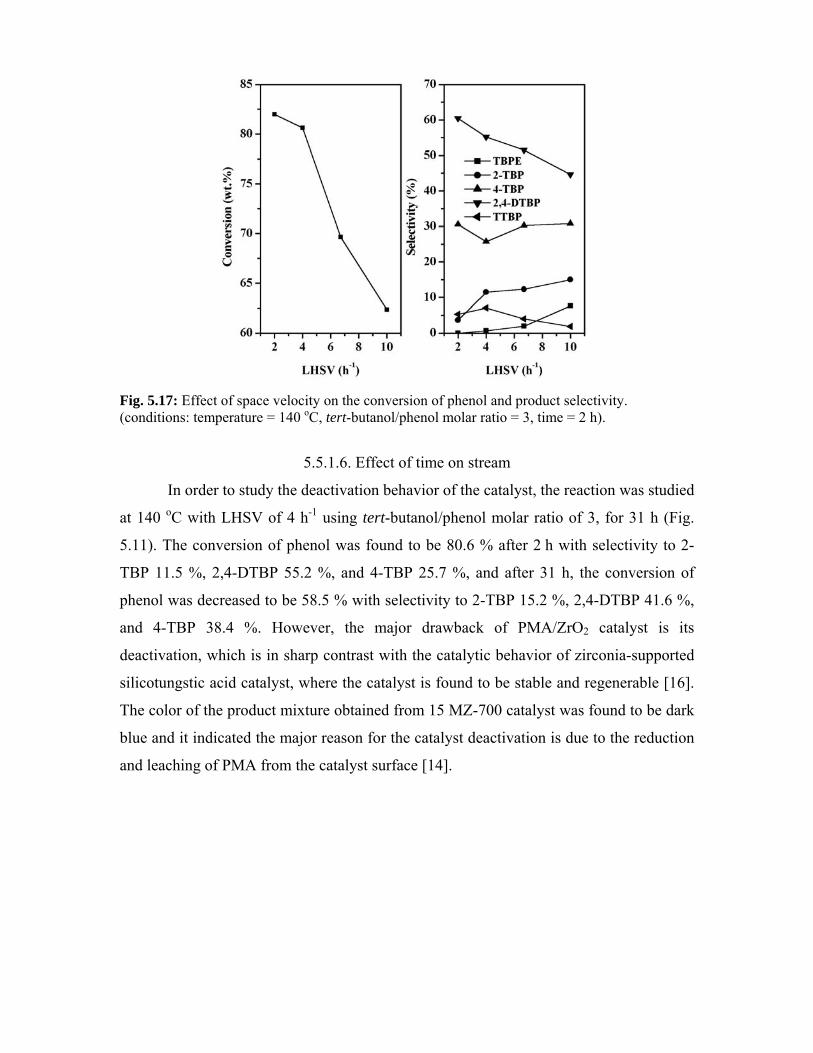
Fig. 5.17: Effect of space velocity on the conversion of phenol and product selectivity. (conditions: temperature = 140 oC, tert-butanol/phenol molar ratio = 3, time = 2 h).
5.5.1.6. Effect of time on stream
In order to study the deactivation behavior of the catalyst, the reaction was studied
at 140 oC with LHSV of 4 h-1 using tert-butanol/phenol molar ratio of 3, for 31 h (Fig.
5.11). The conversion of phenol was found to be 80.6 % after 2 h with selectivity to 2-
TBP 11.5 %, 2,4-DTBP 55.2 %, and 4-TBP 25.7 %, and after 31 h, the conversion of
phenol was decreased to be 58.5 % with selectivity to 2-TBP 15.2 %, 2,4-DTBP 41.6 %,
and 4-TBP 38.4 %. However, the major drawback of PMA/ZrO2 catalyst is its
deactivation, which is in sharp contrast with the catalytic behavior of zirconia-supported
silicotungstic acid catalyst, where the catalyst is found to be stable and regenerable [16].
The color of the product mixture obtained from 15 MZ-700 catalyst was found to be dark
blue and it indicated the major reason for the catalyst deactivation is due to the reduction
and leaching of PMA from the catalyst surface [14].
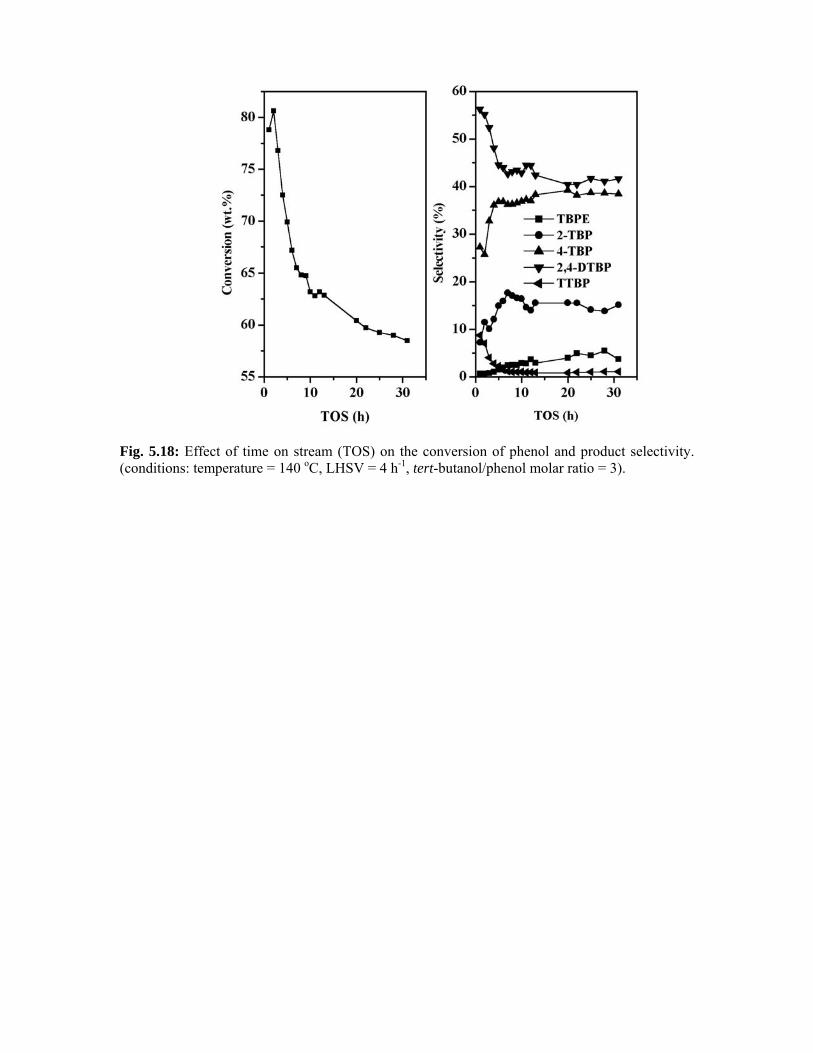
Fig. 5.18: Effect of time on stream (TOS) on the conversion of phenol and product selectivity. (conditions: temperature = 140 oC, LHSV = 4 h-1, tert-butanol/phenol molar ratio = 3).
5.6. References 1. B.M. Devassy, S.B. Halligudi, S.G. Hegde, A.B. Halgeri, F. Lefebvre,
Chem. Commun. (2002) 1074.
2. B.M. Devassy, F. Lefebvre, S.B. Halligudi, J. Catal. 229 (2005) 576.
3. L. Li, Y. Y. Yoshinaga, T. Okuhara, Phys. Chem. Chem. Phys. 1 (1999) 4913.
4. S. Damyanova, J.L.G. Fierro, I. Sobrados, J. Sanz, Langmuir 15 (1999) 469.
5. S. Kasztelan, E. Payen, J.B. Moffat, J. Catal. 125 (1990) 45.
6. Patricia G. Vázquez, Mirta N. Blanco, Carmen V. Cáceres,
Catal. Lett. 60 (1999) 205.
7. C. Rocchiccioli-Deltcheff, A. Aouissi, S. Launay, M. Fournier,
J. Mol. Catal. A 114 (1996) 331.
8. E. Lopez-Salinas, J.G. Hermandez-Cortez, I. Schifter, E. Torres-Garcia, J.
Navarrete, A. Gutierrez-Carrillo, T. Lopez, P.P. Lottici, D. Bersani,
Appl. Catal. A 193 (2000) 215.
9. C.H. Cline, J. Turkevich, J. Chem. Phys. 12 (1944) 300.
10. C. Morterra, A. Chiorino, G. Ghiotti and E. Garrone,
J. Chem. Soc. Faraday Trans. 75 (1), (1979) 271.
11. G. Busca, Catal. Today 41 (1998) 191.
12. B.H. Davis, R.A. Keogh, S. Alerasool, D.J. Zalewski, D.E. Day, P.K. Doolin,
J. Catal. 183 (1999) 45.
13. M.T. Pope, Heteropoly and Isopoly Oxometalates, Springer-Verlag, Berlin, 1983.
14.
S. Subramanian, A. Mitra, C.V.V. Satyanarayana, D.K. Chakrabarty,
Appl. Catal. A. 159 (1997) 229.
15. A. Sakthivel, S. K. Badamali, P. Selvam, Micropor. Mesopor. Mater. 39 (2000) 457.
16.
B.M. Devassy, G.V. Shanbhag, S.P. Mirajkar, W. Böhringer, J. Fletcher,
S.B. Halligudi, J. Mol. Catal. A. 233 (2005) 141.
17. R.F. Parton, J.M. Jacobs, D.R. Huybrechts, P.A. Jacobs, Stud. Surf. Sci. Catal. 46
(1989) 163.
Chapter 6
Summary and conclusions
This thesis describes the preparation, characterization and catalytic evaluation of
zirconia-supported Keggin heteropoly acids such as silicotungstic acid, phosphotungstic
acid and phosphomolybdic acid. This chapter present a brief summary of the work
described in previous chapters and general conclusions arrived from the work.
Chapter 1 gives a general introduction about heteropoly acids (HPAs), its
structure, classification, and catalytic properties. It also gives an introduction to
supported-heteropoly acids and the conventional supports used for the preparation of
supported-heteropoly acids. Further, this chapter gives an introduction to zirconia, its
properties, and zirconia based solid acids. Finally the aim of the thesis is given: to
explore the possibility of the preparation of stable supported heteropolyacid catalysts.
Chapter 2 describes the procedure for the preparation of zirconia-supported
heteropoly acids. The catalysts were characterized by different techniques such as surface
area, X-ray diffraction, Raman spectroscopy, TG-DTA, XPS, FTIR pyridine adsorption,
TPD of ammonia, DRUV-vis spectroscopy, 31P MAS NMR etc. Theory and experimental
procedure employed for each technique is discussed in this section.
Chapter 3 describe the preparation of zirconia-supported silicotungstic acid
catalyst with different STA loading (5-25 wt. %) and calcination temperature (600-850 oC), characterization by different techniques such as surface area, XRD, Raman
spectroscopy, DTA, XPS, NH3-TPD, FTIR pyridine adsorption, and DRUV-vis
spectroscopy and application in veratrole benzoylation with benzoic anhydride and tert-
butylation of phenol with tert-butanol. XRD results indicate that the presence of STA
retards the crystallization of zirconia and stabilizes ZrO2 in tetragonal phase.
Characterization of the catalyst with optimum STA loading (15 %) by Raman
spectroscopy showed the presence of zirconia-anchored mono-oxotungstate as the major
tungsten species up to 750 oC. The catalysts showed both Brönsted as well as Lewis
acidity and the catalyst 15 SZ-750 had the highest Brönsted acidity and total acidity.
Characterization of the catalysts by XPS shows that a monolayer of silicotungstate on
zirconia was attained for the catalyst 15 SZ-750
The activity of these catalysts depends on STA coverage and the catalyst with
monolayer of silicotungstate on zirconia (15 SZ-750) shows the highest activity.
Comparison of the catalytic activity of 15 SZ-750 with 15 SS-300 in veratrole
benzoylation showed that STA supported on zirconia act as efficient and stable solid acid
catalysts, while STA supported on silica gets leached into the reaction medium and
catalyze the reaction homogeneously. These catalysts were also found to be efficient for
tert-butylation of phenol. The deactivated catalyst could be regenerated by calcination
with out appreciable lose in activity and selectivity.
Chapter 4 describes the preparation of zirconia-supported phosphotungstic acid
catalysts with different PTA loading (5-20 %) and calcination temperature (650 to 850 oC), characterization by different techniques such as surface area, XRD, DTG-DTA,
FTIR pyridine adsorption, NH3-TPD and 31P MAS NMR spectroscopy measurements and
application in the synthesis of linear alkyl benzenes by the alkylation of benzene with 1-
octene and 1-dodecene and acylation of 2-MN with acetic anhydride. The catalyst with
optimum PTA loading and calcination temperature (15 PZ-750) was prepared in different
solvents and characterized by 31P MAS NMR spectroscopy. The XRD results indicate
that PTA stabilizes the tetragonal phase of zirconia. The catalysts show both Brönsted
and Lewis acidity and the catalyst 15 PZ-750 shows the highest acidity. 31P MAS NMR
spectra show two types of phosphorous species, one is phosphotungstate which is in
interaction with zirconia and the other is the decomposition product of PTA and the
relative amount of each depend on PTA loading, calcination temperature and the solvent
used for the catalyst preparation.
The activity of the catalyst in alkylation of benzene with 1-octene was found to
depend on the solvent used for the catalyst preparation and solvents like methanol and
DMF are the best for catalyst preparation. The catalyst with monolayer of PTA on
zirconia (15 PZ-750) prepared in methanol showed the highest activity. In acylation of 2-
MN, 15 PZ-750 catalyst showed deactivation due to product inhibition. The deactivated
catalyst could be regenerated by calcination without appreciable loss in its activity and
product selectivity.
Thus, 15 SZ-750 and 15 PZ-750 catalysts were found to be the most active
catalysts and the activities of these catalysts were compared in benzoylation of veratrole
with benzoic anhydride and alkylation of diphenyl ether with 1-dodecene. In
benzoylation of veratrole, 15 SZ-750 catalyst showed different reaction profile compared
to 15 PZ-750 catalyst, while in alkylation of diphenyl ether, both catalysts showed similar
reaction profiles and 15 SZ-750 catalyst has higher activity than 15 PZ-750 catalyst. The
kinetic profile of the reaction with 15 SZ-750 and 15 PZ-750 catalysts in veratrole
benzoylation indicated that product inhibition was more prominent with 15 PZ-750
catalyst. Thus, the higher conversion and greater deactivation resistance of 15 SZ-750
catalyst in benzoylation of veratrole and also its higher activity in alkylation of diphenyl
ether could be due to the presence of higher amount of strong Brönsted acid sites.
Chapter 5 describes the preparation of zirconia-supported phosphomolybdic acid
catalysts with different PMA loading (5-25 %) and calcination temperature (500 to 750 oC), characterization by XRD and 31P MAS NMR spectroscopy measurements and
application in the synthesis of linear alkyl benzenes by the reaction of benzene with 1-
octene and 1-dodecene and tert-butylation of phenol with tert-butanol. The XRD results
indicated that MPA stabilizes the tetragonal phase of zirconia. 31P MAS NMR spectra
showed the presence of three types of phosphorous species, phosphomolybdate in
interaction with zirconia, decomposition product of PMA and an unidentified species.
FTIR pyridine adsorption on 15 MZ-700 catalyst showed the presence both the Brönsted
and Lewis acidity.
The 15 MZ-700 catalyst showed the highest activity in alkylation of benzene with
1-octene and phenol with tert-butanol. In benzene alkylation, these catalysts deactivated
mainly due to the formation of carbonaceous deposits on catalyst surface and
phosphomolybdate reduction and the deactivated catalysts could be regenerated without
appreciable loss in its activity and product selectivity. These catalysts were also highly
active in tert-butylation of phenol but deactivated with time. In tert-butylation of phenol,
catalyst deactivation was mainly due to the reduction of phosphomolybdate and leaching
of PMA from the catalyst surface to the reaction medium.

Chapter 6 summarizes the conclusions made in this thesis.
Thus, the present work showed that heteropoly tungstic acids such as
silicotungstic acid and phosphotungstic acid supported on zirconia acts as efficient and
stable solid acid catalysts, while heteropoly molybdic acid such as phosphomolybdic acid
supported on zirconia leaches to the reaction medium in presence of polar reactants.
List of publications 1. 12-tungstophosphoric acid/zirconia-a highly active stable solid acid-comparison
with a tungstated zirconia catalyst B.M. Devassy, S.B. Halligudi, S.G. Hegde, A.B. Halgeri, F. Lefebvre, Chem. Commun. (2002) 1074.
2.
Zirconia-supported 12-tungstophosphoric acid as a solid catalyst for the synthesis of linear alkyl benzenes B.M. Devassy, F. Lefebvre, S.B. Halligudi, J. Catal. 231 (2005) 1.
3.
Alkylation of p-cresol with tert-butanol catalyzed by heteropoly acid supported on zirconia catalyst B.M. Devassy, G.V. Shanbag, F. Lefebvre, S.B. Halligudi,
J. Mol. Catal. A 210 (2004) 125.
4. Zirconia supported phosphotungstic acid as an efficient catalyst for resorcinol tert-butylation and n-heptane hydroisomerization B.M. Devassy, S.B. Halligudi, S.P. Elangovan, S. Ernst, M. Hartmann, F. Lefebvre, J. Mol. Catal. A 221 (2004) 113.
5.
Zirconia-supported phosphotungstic acid as catalyst for alkylation of phenol with benzyl alcohol B.M. Devassy, G.V. Shanbhag, F. Lefebvre, W. Böhringer, J. Fletcher, S.B. Halligudi, J. Mol. Catal. A 230 (2005) 113.
6.
Silicotungstate-modified zirconia as an efficient catalyst for phenol tert-butylation
B.M. Devassy, G.V. Shanbhag, S.P. Mirajkar, W. Böhringer, J. Fletcher,
S.B. Halligudi, J. Mol. Catal. A 233 (2005) 141.
7.
Kinetic study of vapor phase hydrodechlorination of halons by Pd supported catalysts S.B. Halligudi, B.M. Devassy, A. Ghosh, V. Ravikumar, J. Mol. Catal. A 184 (2002) 175.
8.
Liquid phase allylation of anisole using TPA/ZrO2 catalyst G.V. Shanbhag, B.M. Devassy, S.B. Halligudi, J. Mol. Catal. A 218 (2004) 67.
9.
Friedel–Crafts benzoylation of diphenyl oxide over zirconia supported 12-tungstophosphoric acid D.P. Sawant, B.M. Devassy, S.B. Halligudi, J. Mol. Catal. A 217 (2004) 211.
10.
Metal schiff-base compex catalyzed oxidation of p-xylene and methyl 4-methyl benzoate to carboxylic acids S.B. Halligudi, B.M. Devassy, K. Raj N.K, M.P. Degaonkar, S. Gopinathan, React. Kinet. Catal. Lett. 71, 2, (2000) 289.
11. Highly active and selective AlSBA-15 catalysts for the vapor phase tert-butylation of phenol
A. Vinu, B. M. Devassy, S.B. Halligudi, W. Böhlmann, M. Hartmann, Appl. Catal. A 281 (2005) 207.
12.
Selective production of orthoalkyl phenols on Cu0.5Co0.5Fe2O4: a study of catalysis and characterization T. Mathew, S. Shylesh, B.M. Devassy, M. Vijayaraj, C.V.V. Satyanarayana, B.S. Rao, C.S. Gopinath, Appl. Catal. A 273 (2004) 35.
13.
Vapor-phase methylation of pyridine with methanol to 3-picoline over Zn1-xCoxFe2O4 (x = 0, 0.2, 0.5, 0.8, 1.0) - type ternary spinels prepared via low temperature method K. Sreekumar, T. Mathew, M.D. Biju, R. Rajgopal, R. Vetrivel, B. S. Rao, Appl. Catal. A 205 (2001) 11.
14. Oxidative dehydrogenation of ethylbenzene over Zn1-xNixFe2O4 (x = 0, 0.2, 0.5, 0.8 and 1.0) type systems: Effect of composition on surface properties and catalytic activities. K. Sreekumar, M. Thomas, T.M. Jyothi, M.D. Biju, S. Sugunan, B.S. Rao, Polish J. Chem. 74, (2000) 509.
15.
Synthesis of linear alkyl benzenes over zirconia-supported 12-molybdophosphoric
acid catalysts.
B.M. Devassy, F. Lefebvre, W. Böhringer, J. Fletcher, S.B. Halligudi
J. Mol. Catal. A 236 (2005) 162.
16.
Tert-butylation of p-cresol over WOx/ZrO2 solid acid catalysts. S. Sarish, B.M. Devassy, S.B. Halligudi, J. Mol. Catal. A 235 (2005) 44.
17. Alkylation of phenol with long-chain olefins over WOx/ZrO2 solid acid catalysts S. Sarish, B.M. Devassy, W. Böhringer, J. Fletcher, S.B. Halligudi,
J. Mol. Catal. A 240 (2005) 123.
18. Zirconia-supported heteropoly acids: Characterization and catalytic behavior in liquid-phase veratrole benzoylation B.M. Devassy, G.V. Shanbhag, S.B. Halligudi, J. Catal (2005) In press.


