Embed Size (px)
Citation preview

Acetylphosphinate is the most potent mechanism-basedsubstrate-like inhibitor of both the human and E. coli pyruvatedehydrogenase components of the pyruvate dehydrogenasecomplex
Natalia S. Nemeria*,#, Lioubov G. Korotchkina†,#, Sumit Chakraborty*, Mulchand S. Patel†,and Frank Jordan*,‡*Department of Chemistry, Rutgers University, Newark, NJ 07102
†Department of Biochemistry, School of Medicine and Biomedical Sciences, State University of NewYork at Buffalo, Buffalo, NY, 14214.
AbstractTwo analogues of pyruvate, acetylphosphinate and acetylmethylphosphinate were tested as inhibitorsof the E1 (pyruvate dehydrogenase) component of the human and Escherichia coli pyruvatedehydrogenase complexes. This is the first instance of such studies on the human enzyme. Theacetylphosphinate is a stronger inhibitor of both enzymes (Ki< 1 μM) than acetylmethylphosphinate.Both inhibitors are found to be reversible tight-binding inhibitors. With both inhibitors and with bothenzymes, the inhibition apparently takes place by formation of a C2α-phosphinolactylthiamindiphosphate derivative, a covalent adduct of the inhibitor and the coenzyme, mimicking the behaviorof substrate and forming a stable analogue of the C2α-lactylthiamin diphosphate. Formation of theintermediate analogue in each case is confirmed by the appearance of a positive circular dichroismsignal in the 305-306 nm range, attributed to the 1',4'-iminopyrimidine tautomeric form of thecoenzyme. It is further shown that the αHis63 residue of the human E1 has a role in the formationof C2α-lactylthiamin diphosphate since the αHis63Ala variant is only modestly inhibited by eitherinhibitor, nor did either compound generate the circular dichroism bands assigned to differenttautomeric forms of the 4'-aminopyrimidine ring of the coenzyme seen with the wild type enzyme.Interestingly, opposite enantiomers of the carboligase side product acetoin are produced by the humanand bacterial enzymes.
Keywordshuman pyruvate dehydrogenase complex; Escherichia coli pyruvate dehydrogenase complex;acetylphosphinate; acetylmethylphosphinate; thiamin diphosphate; thiamin 2-thiothiazolonediphosphate; acetylphosphonate methyl ester; circular dichroism; mechanism-based inhibition;acetoin
1. IntroductionDuring the past few years, the Rutgers group has shown that the pyruvate analogue methylacetylphosphonate sodium salt (MAcPho), when added to the thiamin diphosphate(ThDP)-dependent enzymes yeast pyruvate decarboxylase (YPDC) and the E1 subunit (E1ec) of the
#These authors contributed equally to this work.‡To whom correspondence should be addressed: e-mail, [email protected]; tel, 973-353-5470; FAX, 973-353-1264.
NIH Public AccessAuthor ManuscriptBioorg Chem. Author manuscript; available in PMC 2007 January 29.
Published in final edited form as:Bioorg Chem. 2006 December ; 34(6): 362–379.
NIH
-PA Author Manuscript
NIH
-PA Author Manuscript
NIH
-PA Author Manuscript

E. coli pyruvate dehydrogenase complex (PDHc-ec) generates a new UVVIS and a positivecircular dichroism (CD) band in the wavelength range of 300-310 nm [1,2]. The same spectrumalso results when the preassembled C2α-phosphonolactylthiamin diphosphate (PLThDP,synthesized from thiamin diphosphate and MAcPho) is added to the apo form of E1ec (noThDP bound) [1]. This electronic transition was assigned to the 1',4'-iminopyrimidine tautomerof the ThDP coenzyme in the bound form on the basis of chemical model studies [3-5].Concurrently, high-resolution X-ray structure determinations on E1ec with the pre-assembledPLThDP [6], and on pyruvate oxidase from Lactobacillus plantarum with MAcPho added[7] showed that a tetrahedral adduct was being formed between the keto carbon of the MAcPhoand the C2 thiazolium atom. In view of these complementary observations, we concluded thatthe PLThDP when enzyme-bound exists in the 1',4'-iminopyrimidine tautomeric form. Thereaction scheme for PDHc is outlined in Scheme 1. Hence, MAcPho can indeed act as asubstrate analogue as shown in Scheme 2, but, once the reaction reaches the intermediate statecorresponding to LThDP, by virtue of the non-cleavable C-P bond in place of the usual C-Cbond, the adduct simply occupies the active center with very long lifetime. The UV and CDresults inform us that a consequence of the presence of this stable pre-decarboxylation analogueat the active site is that with the PLThDP in place of ThDP, the 1'.4'-iminopyrimidine tautomerof ThDP is the predominant tautomeric form rather than one of the other two forms on the left-hand side of Scheme 2.
These results encouraged us to synthesize and test two further electrostatic mimics of pyruvate,sodium acetyl phosphinate (AcPhi) and sodium acetyl methylphosphinate (AcMPhi). Thesecompounds possess the advantage over the phosphonate compound used previously in havingno ester group present. In this fashion, the –PO2
− group becomes a better steric and electrostaticmimic of pyruvate's –CO2
− group. Similarly to MAcPho, when bound to ThDP, AcMPhi andAcPhi can not be decarboxylated and form stable analogues of LThDP (Scheme 2). We herereport on the kinetics of binding and inactivation of E1ec (homodimer) and the human pyruvatedehydrogenase E1 (α2β2 heterotetramer) (E1h) by AcPhi and AcMPhi. Both substrateanalogues behave as tight-binding reversible inhibitors with micromolar values of Kd and Ki.Inactivation of E1ec and E1h resulted on addition of stoichiometric amounts of substrateanalogues. The formation of stable analogues of LThDP could be monitored by CDspectroscopy providing strong evidence regarding the mechanism of inhibition. We wish tocompare and contrast the inhibition experienced by the human and bacterial PDHc E1.
2. Materials and methodsMethods
2.1. Chemical synthesis—Synthesis of acetyl phosphinate was carried out according to thereported procedure by Baillie et al. [8].
Methyl phosphonousdichloride was purchased from Aldrich and was used without furtherpurification. NaI was dried at 70 °C under 0.1 mm/Hg overnight. Dry acetone was preparedwith dry NaI according to literature procedures. NMR spectra were recorded in a 500 MHzVarian INOVA spectrometer NMR instrument.
Synthesis of methyl (1,1-dimethoxyethyl)methylphosphinate: Methylphosphonousdichloride (5.0 g, 42.7 mmol) was added dropwise, with vigorous stirring totrimethyl orthoacetate (11.67 g, 97.2 mmol) at −30 °C under N2. After the addition wascomplete the temperature of the reaction mixture was maintained at −30 °C for one h, then thereaction mixture was allowed to warm to room temperature overnight. The excess trimethylorthoacetate was removed under reduced pressure. The pure product (b.p. 103 °C, 3.2 mm/Hg)was obtained by fractional distillation of the residual reaction mixture. Yield 6.337 g
Nemeria et al. Page 2
Bioorg Chem. Author manuscript; available in PMC 2007 January 29.
NIH
-PA Author Manuscript
NIH
-PA Author Manuscript
NIH
-PA Author Manuscript

(82%). 1H NMR (500 MHz, CDCl3/TMS): δ 3.801 (d, 3H, J=10.5 Hz,), 3.405 (d, 6H, J= 8Hz,), 1.490 (d, 3H, J= 3.5 Hz), 1.465 (d, 3H, J =1 Hz). MS (EI) 151, 109, 89, 77, 43.
Synthesis of sodium acetylmethylphosphinate: Methyl (1,1-dimethoxyethyl)methylphosphinate (500 mg, 2.75 mmol) was added to a solution of NaI (8.25 g, 55 mmol) in30 mL dry acetone under N2 in a sealed tube. The reaction mixture was heated at 70 °Covernight. After cooling to room temperature, the reaction mixture was evaporated to drynessand triturated with ethyl acetate. The crude product was recrystallized from absolute ethanol.Yield 134 mg (37.5 %). 1H NMR (500 MHz, D2O/DSS): δ 2.461 (d, 3H, J=3.5 Hz), 1.406 (d,3H, J=14 Hz). MS (ESI) 153 (M+ Na) +.
2.2. Protein expression and purificationBacterial strains and plasmids: E. coli strain JRG 3456 and plasmid pGS878 with aceE1gene encoding the E1ec subunit of PDHc-ec were from J. Guest (University of Sheffield, UK).A co-expression vector for E1h (pET-28b-PDHA1/PDHB) harboring coding sequences of bothhuman PDHc-E1α and PDHc-E1β subunits was constructed as described previously [9].
The E. coli strain JRG 3456 transformed with pGS878 was used for overexpression of theaceE gene encoding E1ec subunit of PDHc-ec according to reference [10] and purification ofE1ec followed the published procedure [11].
The E1h was overexpressed in E. coli BL21 cells harboring pET-28b-PDHA1/PDHB (acoexpression vector with coding sequences of both human E1α and E1β subunits) and purifiedusing Ni-NTA-agarose chromatography as described previously [9].
Recombinant human dihydrolipoamide acetyltransferase (E2h)-dihydrolipoamidedehydrogenase-binding protein (E3BPh) subcomplex and dihydrolipoamide dehydrogenase(E3h) were overexpressed in E. coli and purified as described elsewhere [12].
2.3.a. Activity measurements of E1ec—The E1ec activity was measured in the overallPDHc reaction. First E2ec and E3ec expressed independently were incubated for 1 h at a ratioof 1.0:1.0 (mg/mg) in 20 mM potassium phosphate buffer (pH 7.0) at 4 °C. The E1ec wasreconstituted with E2ec-E3ec subcomplex at a ratio of 1:1:1 (mg/mg/mg) with an additional10 min of incubation. The reaction medium contained (in 1 ml of test volume) 0.10 M TrisHCl (pH 8.0), 1 mM MgCl2, 2 mM sodium pyruvate, 2.5 mM NAD+, 0.20 mM ThDP, and 2.6mM dithiothreitol at 30 °C. The reaction was initiated by the addition of 0.20 mM CoA andPDHc-ec (1-1.5 μg of protein). Steady-state velocities were taken from the linear portion ofthe progress curve. One unit of activity is defined as the amount of NADH produced (μmol/min/mg of E1ec).
Activity measurements of E1h: Activity of E1h was determined by two assays: (i) PDHcassay, by the formation of NADH during overall PDHc reaction after reconstitution of E1hwith E2h-E3BPh subcomplex and E3h into PDHc; and (ii) by DCPIP assay, by the reductionof 2,6-dichlorophenolindophenol (DCPIP), an artificial electron acceptor, to measure the firstpartial reaction of E1h, the decarboxylation of pyruvate in the absence of the second substrate,lipoyl moieties of E2h, as described previously [12].
Protein content was measured by the Bradford method using bovine serum albumin as astandard [13].
2.3.b. Kinetic analysis of inhibition of E1h by AcPhi and AcMPhi—To study theinhibition of E1h by AcPhi and AcMPhi, E1h (5 μg) was incubated at room temperature in 50μl of 50 mM potassium phosphate buffer (pH 7.0) with 2 mM MgCl2, 0.2 mM ThDP and the
Nemeria et al. Page 3
Bioorg Chem. Author manuscript; available in PMC 2007 January 29.
NIH
-PA Author Manuscript
NIH
-PA Author Manuscript
NIH
-PA Author Manuscript

concentration of substrate analogues indicated. Three-four aliquots (1 μg of E1h each) werewithdrawn after 30 min and mixed into a cuvette containing 3 μg of E2h-E3BPh subcomplex,3 μg of E3h and all reagents necessary to measure PDHc activity except pyruvate. The entirecomplex was reconstituted for 1 min and the reaction was started by addition of pyruvate andwas monitored for 30 sec to record the initial velocity. To determine the inactivation of E1hand its αH63A variant by substrate analogues, 200 μg of E1h or E1h αH63A was incubated atroom temperature in 200 μl of 50 mM potassium phosphate buffer (pH 7.0) with 2 mMMgCl2, 0.2 mM ThDP and the indicated concentrations of substrate analogues. Three aliquots(25 μg for wild-type E1h and 50 μg for E1h αH63A) were taken after 30 min to measure theactivity of the E1h per se according to the DCPIP assay [12].
2.3.c. Reaction progress curve analysisE1ec: The progress of the overall PDHc reaction was monitored via the formation of NADHat 340 nm as a function of time (the reaction time was approximately 18 min). The reactionwas started by the addition of PDHc after the E1ec was reconstituted with E2-E3 subcomplex(total protein about 0.60 μg) and CoA. A family of progress curves was recorded in the presenceof 0.50 mM pyruvate and AcMPhi (0.1-4.5 μM) or AcPhi (0.05 –1..2 μM) and the values ofkapp were calculated as reported earlier [10]. The values of Kd were calculated form the plotof kapp vs concentration of substrate analogue according to Kitz and Wilson [14].
E1h: Progress curve analysis was used to determine the Ki for inhibition of wild-type E1h byAcPhi and AcMPhi [10,15]. The PDHc was reconstituted in the cuvette by mixing 0.3 μg ofE1h, 1 μg of E2h-E3BP and 1 μg of E3h. The reaction was initiated by addition of pyruvate(300 μM) along with different concentrations of AcPhi (0.4-1.8 μM) or AcMPhi (200-600μM) as indicated in the figure legends. The progress of the reaction was monitored for 5 min.Less than 5% of pyruvate was consumed under these conditions. The progress curves wereanalyzed according to equation 1:
P = vst + (vo − vs) ∕ k(1 − e−kt) (1)
where P is the product concentration at time t, vs is the steady-state reaction velocity, vo is theinitial velocity and k is the apparent pseudo-first-order rate constant. The dependence of kappon substrate analogue concentration was linear for both compounds, enabling calculation ofk1 and k−1, the rate constants for binding and dissociation of substrate analogue, respectively,were calculated from equation 2:
kapp = k1I0 ∕ (1 + S0 ∕ Km) + k−1 (2)
where I0 is the concentration of substrate analogue, S0 is the concentration of pyruvate usedand Km is the value of Km for pyruvate. The values of Ki were calculated from: Ki= k−1/k1.Regression coefficients were > 0.95.
2.4. Circular dichroism spectroscopyCircular dichroism titration of E1ec with sodium acetylphosphinate and sodiumacetylmethylphosphinate: The E1ec (1.50 mg/ml, concentration of active centers = 15.0μM) in 20 mM potassium phosphate buffer (pH 7.0) containing 2 mM MgCl2 and 0.20 mMThDP was titrated with 1-100 μM of AcPhi. For experiments with AcMPhi, E1ec (1.63 mg/ml, concentration of active centers = 16.2 μM) in 20 mM potassium phosphate buffer (pH 7.0)containing 0.20 mM ThDP and 2.0 mM MgCl2 was titrated with 1-150 μM of AcMPhi. Thedifference CD spectra with both substrate analogues were obtained on subtraction of the CDspectrum of E1ec in the presence of ThDP and MgCl2. The Kd for AcPhi or AcMPhi werecalculated from a plot of ellipticity at 317 nm vs. concentration of AcPhi or AcMPhi using a
Nemeria et al. Page 4
Bioorg Chem. Author manuscript; available in PMC 2007 January 29.
NIH
-PA Author Manuscript
NIH
-PA Author Manuscript
NIH
-PA Author Manuscript

quadratic equation [10]. CD spectra were recorded on an Aviv Model 202 CD or an AppliedPhotophysics Chirascan spectrometer at 30 °C.
Circular dichroism titration of E1h with sodium acetylphosphinate and sodiumacetylmethylphosphinate: The E1h (1.50 mg/ml, concentration of active centers = 19.6 μM)in 20 mM potassium phosphate buffer (pH 7.0) containing 1 mM MgCl2 and 0.20 mM ThDPwas titrated with 1-150 μM of AcPhi. For experiments with AcMPhi, E1h (1.06 mg/ml,concentration of active centers = 13.8 μM) in 20 mM potassium phosphate buffer (pH 7.0)containing 1 mM MgCl2 and 0.20 mM ThDP was titrated with 1-150 μM of AcMPhi. A plotof ellipticity at 305 nm vs. [AcMPhi] was constructed by subtracting the ellipticity of theenzyme at the same wavelength but recorded in the absence of AcMPhi. The values of Kd werecalculated using a quadratic equation [10].
3. ResultsKinetic analysis of the inhibition of E1ec by sodium acetyl phosphinate
As reported previously, the AcPhi behaves as a tight-binding reversible inhibitor of the PDHc-ec (Ki=0.15μM) and of the E1ec resolved from the complex (Ki=0.21μM) [16]. We studiedinhibition of the recombinant E1ec (concentration of active centers = 0.50 μM) bypreincubating it with 0.50-1000 μM AcPhi for 20 min at 25 °C and then measuring the activityafter reconstitution with its E2ec-E3ec subcomplex. The overall PDHc reaction was triggeredby adding CoA and PDHc to the reaction mixture. More than 90 % of E1ec activity was lostat a [AcPhi]/[E1ec] ratio of 1.4/1.0 (data not shown). These kinetic data are in good agreementwith a CD titration experiment. On addition of AcPhi to the E1ec, a broad CD band withmaximum at 317 nm was observed (Figure 1A). We assigned this band to the 1',4'-iminopyrimidine tautomer of phosphinolactyl-ThDP (iminophosphinolactylThDP), a stableanalogue of LThDP, on the basis of similar results obtained with MAcPho (Figure 2) andPLThDP [1]. The CD band at 317 nm reached saturation at a [AcPhi]/[E1ec] ratio of 1.3/1.0which correlates with the loss of 85% of E1ec activity measured in a parallel experiment (Figure1B). A Kd=0.062 μM was calculated for AcPhi. Inhibition by AcPhi was reversible accordingto the following results: (i) approximately 50 % of activity was recovered after overnightdialysis against 20 mM potassium phosphate buffer (pH 7.0) from a sample that had first beeninhibited to 95%; (ii) the amplitude of the CD band at 317 nm was reduced by 80% afterovernight dialysis (20% of the CD signal was retained on E1ec). These results suggest thatAcPhi behaves as a stoichiometric reversible inhibitor of the E1ec. The binding of AcPhi leadsto the formation of 1',4'-iminophosphinolactyl-ThDP, a covalent analogue of the LThDPintermediate clearly indicating mechanism-based inhibition.
Circular dichroism analysis of binding of sodium acetylmethylphosphinate to E1ecAddition of AcMPhi to the E1ec also resulted in a CD band with maximum at 317 nmsuggesting formation of 1',4'-imino,methylphosphinolactyl-ThDP. The maximum at 317 nmwas reached at a 1.0/1.0 ratio of [E1ec]/[AcMPhi] indicating stoichiometric binding of AcMPhi(Kd=0.10 μM) (Figure 3). After overnight dialysis approximately 80% of the CD intensity at317 nm was retained on the enzyme indicating that binding is partially reversible. However,on addition of 2 mM pyruvate, the AcMPhi was displaced from the E1ec, as indicated by theformation of (S)-acetoin according to the CD spectra after removal of protein (Figure 4).
Progress curve analysis of the inhibition of E1ec by sodium acetylphosphinate and sodiumacetylmethylphosphinate
The inhibition by AcPhi and AcMPhi was studied using reaction progress curve analysis aswe reported earlier [10]. The dependence of the pseudo first-order rate constant (kapp) on theconcentration of AcPhi or AcMPhi was hyperbolic, indicating saturation (Figures 5A and 5B)
Nemeria et al. Page 5
Bioorg Chem. Author manuscript; available in PMC 2007 January 29.
NIH
-PA Author Manuscript
NIH
-PA Author Manuscript
NIH
-PA Author Manuscript

leading to values of Ki of 0.76 μM for AcPhi and 3.33 μM for AcMPhi according to a Kitz-Wilson treatment [ref. 14;Table 1]. The data suggest that inhibition of E1ec by AcPhi orAcMPhi follows the mechanism presented in Scheme 3 for competitive tight-binding inhibitors[17]. The kinetic parameters for inhibition of E1ec by AcPhi and AcMPhi are presented inTable 1.
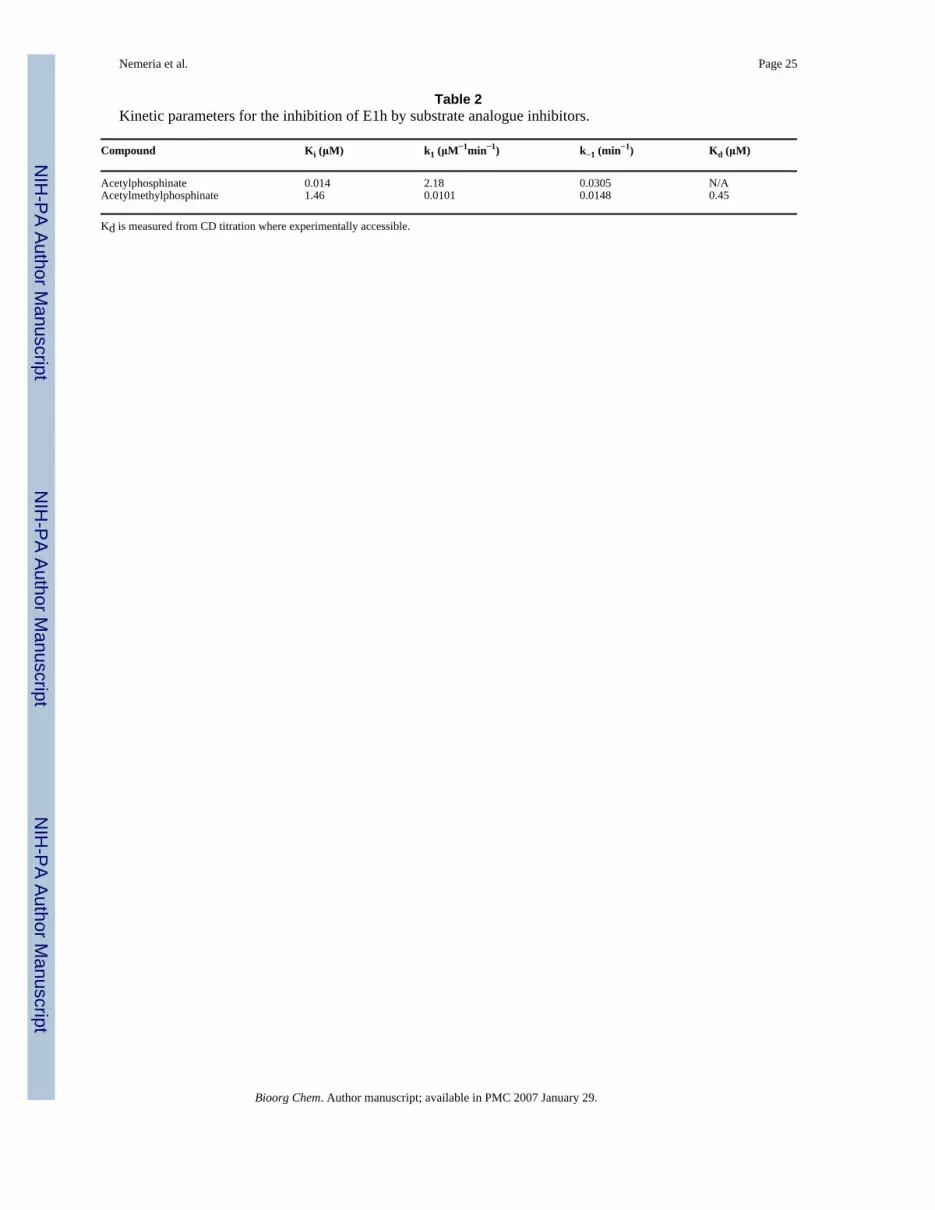
Kinetic analysis of inhibition of E1h by acetylphosphinate and acetylmethylphosphinateThe following results were obtained for inhibition of E1h by AcPhi: (i) full inhibition wasachieved with stoichiometric concentrations of AcPhi (Figure 6); (ii) inhibition by AcPhidisplayed time dependence, reaching its maximum at approximately 20 min (data not shown);and (iii) inhibition by AcPhi was partially reversible, judging by the partial restoration ofactivity when an aliquot of inactivated E1h was used in the overall PDHc assay and the reactionwas allowed to proceed for longer than 1 min. Kinetic analysis indicated that AcPhi is a tightslow-binding inhibitor of E1h [15]. Analysis of the progress curves of the overall PDHcreaction (E1h was reconstituted with E2h-E3BPh and E3h) in the presence of pyruvate andAcPhi enabled calculation of Ki= 0.014 μM, k−1 = 0.0305 min−1 and k1= 2.18 μM−1min−1
(Figure 7; Table 2).
The AcMPhi is a weaker inhibitor than AcPhi of E1h (Figure 6). Progress curve analysisindicated inhibition of E1h at higher concentrations of AcMPhi with Ki = 1.46 μM, k−1 =0.0148 min−1 and k1 = 0.0101 μM−1 min−1 (Figure 8; Table 2).
Kinetic analysis of inhibition by AcPhi and AcMPhi according to the DCPIP assay (measuringthe rate through the decarboxylation step) revealed similar patterns of inhibition: AcPhi was astronger inhibitor than AcMPhi (Figure 9). The stoichiometry of inhibition of E1h by AcPhiand AcMPhi when determined with the DCPIP assay was similar to the one determined withthe PDHc-h assay (compare Figure 6 to Figure 9 inset).
Both AcPhi and AcMPhi are much stronger inhibitors of E1h compared to MAcPho. MAcPhodid not result in more than 20% reduction in E1h activity even at 500-fold molar excess (datanot shown).
The E1h αH63A variant has undetectable activity when measured in the overall PDHc assayand about 17% when measured with the DCPIP assay. For that reason, inhibition of E1hαH63A could only be studied using the DCPIP assay. Only modest inhibition of E1h αH63Ais detected with both AcPhi and AcMPhi (Figure 9), indicating that E1h αH63 is necessary forthe interaction with both substrate analogues and is probably involved in the interaction withpyruvate during the decarboxylation reaction.
Circular dichroism titration of E1h with sodium acetylmethylphoshinateOn addition of 1-150 μM of AcMPhi to the E1h the positive band at 305 nm developed andreached the maximum intensity at a molar ratio of [AcMPhi] / [E1h active centers] equal to2.0/1.0 (Fig. 10). Similar spectra with CD maximum at 306 nm were obtained when AcPhiwas used with molar ratio of [AcMPhi ]/ [E1h] equal to 1.0/1.0 (data not shown). A Kd = 0.45μM was calculated for AcMPhi binding (the Kd for AcPhi is not available). The CD spectra ofE1h treated by AcMPhi and AcPhi were not affected by overnight dialysis indicating tightbinding. On addition of 5 mM pyruvate to either the E1h.AcPhi or E1h.AcMPhi complex, theCD band at 305-306 nm disappeared suggesting that pyruvate competes with the substrateanalogues at the active centers of the E1h, similarly to that seen with E1ec (data not shown).Removal of the enzyme from the incubation mixture revealed the presence of a species with anegative CD band with maximum at 278 nm corresponding to (R)-acetoin. This is in interesting
Nemeria et al. Page 6
Bioorg Chem. Author manuscript; available in PMC 2007 January 29.
NIH
-PA Author Manuscript
NIH
-PA Author Manuscript
NIH
-PA Author Manuscript
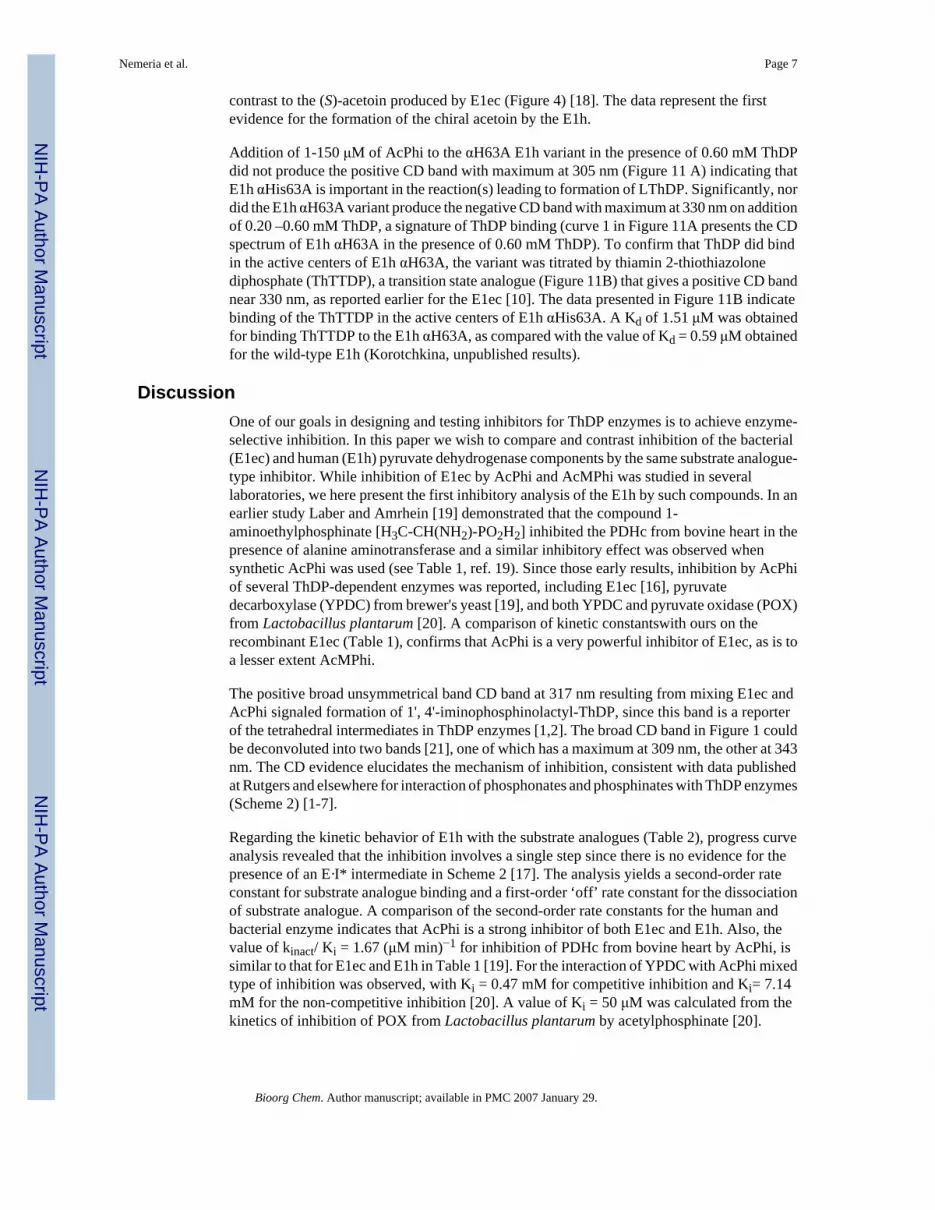
contrast to the (S)-acetoin produced by E1ec (Figure 4) [18]. The data represent the firstevidence for the formation of the chiral acetoin by the E1h.
Addition of 1-150 μM of AcPhi to the αH63A E1h variant in the presence of 0.60 mM ThDPdid not produce the positive CD band with maximum at 305 nm (Figure 11 A) indicating thatE1h αHis63A is important in the reaction(s) leading to formation of LThDP. Significantly, nordid the E1h αH63A variant produce the negative CD band with maximum at 330 nm on additionof 0.20 –0.60 mM ThDP, a signature of ThDP binding (curve 1 in Figure 11A presents the CDspectrum of E1h αH63A in the presence of 0.60 mM ThDP). To confirm that ThDP did bindin the active centers of E1h αH63A, the variant was titrated by thiamin 2-thiothiazolonediphosphate (ThTTDP), a transition state analogue (Figure 11B) that gives a positive CD bandnear 330 nm, as reported earlier for the E1ec [10]. The data presented in Figure 11B indicatebinding of the ThTTDP in the active centers of E1h αHis63A. A Kd of 1.51 μM was obtainedfor binding ThTTDP to the E1h αH63A, as compared with the value of Kd = 0.59 μM obtainedfor the wild-type E1h (Korotchkina, unpublished results).
DiscussionOne of our goals in designing and testing inhibitors for ThDP enzymes is to achieve enzyme-selective inhibition. In this paper we wish to compare and contrast inhibition of the bacterial(E1ec) and human (E1h) pyruvate dehydrogenase components by the same substrate analogue-type inhibitor. While inhibition of E1ec by AcPhi and AcMPhi was studied in severallaboratories, we here present the first inhibitory analysis of the E1h by such compounds. In anearlier study Laber and Amrhein [19] demonstrated that the compound 1-aminoethylphosphinate [H3C-CH(NH2)-PO2H2] inhibited the PDHc from bovine heart in thepresence of alanine aminotransferase and a similar inhibitory effect was observed whensynthetic AcPhi was used (see Table 1, ref. 19). Since those early results, inhibition by AcPhiof several ThDP-dependent enzymes was reported, including E1ec [16], pyruvatedecarboxylase (YPDC) from brewer's yeast [19], and both YPDC and pyruvate oxidase (POX)from Lactobacillus plantarum [20]. A comparison of kinetic constantswith ours on therecombinant E1ec (Table 1), confirms that AcPhi is a very powerful inhibitor of E1ec, as is toa lesser extent AcMPhi.
The positive broad unsymmetrical band CD band at 317 nm resulting from mixing E1ec andAcPhi signaled formation of 1', 4'-iminophosphinolactyl-ThDP, since this band is a reporterof the tetrahedral intermediates in ThDP enzymes [1,2]. The broad CD band in Figure 1 couldbe deconvoluted into two bands [21], one of which has a maximum at 309 nm, the other at 343nm. The CD evidence elucidates the mechanism of inhibition, consistent with data publishedat Rutgers and elsewhere for interaction of phosphonates and phosphinates with ThDP enzymes(Scheme 2) [1-7].
Regarding the kinetic behavior of E1h with the substrate analogues (Table 2), progress curveanalysis revealed that the inhibition involves a single step since there is no evidence for thepresence of an E·I* intermediate in Scheme 2 [17]. The analysis yields a second-order rateconstant for substrate analogue binding and a first-order ‘off’ rate constant for the dissociationof substrate analogue. A comparison of the second-order rate constants for the human andbacterial enzyme indicates that AcPhi is a strong inhibitor of both E1ec and E1h. Also, thevalue of kinact/ Ki = 1.67 (μM min)−1 for inhibition of PDHc from bovine heart by AcPhi, issimilar to that for E1ec and E1h in Table 1 [19]. For the interaction of YPDC with AcPhi mixedtype of inhibition was observed, with Ki = 0.47 mM for competitive inhibition and Ki= 7.14mM for the non-competitive inhibition [20]. A value of Ki = 50 μM was calculated from thekinetics of inhibition of POX from Lactobacillus plantarum by acetylphosphinate [20].
Nemeria et al. Page 7
Bioorg Chem. Author manuscript; available in PMC 2007 January 29.
NIH
-PA Author Manuscript
NIH
-PA Author Manuscript
NIH
-PA Author Manuscript

Among classes of inhibitors studied in our laboratories, the acetylphosphinate appears to bethe strongest inhibitor of E1ec and of E1h. This includes the three compounds mentioned inthis paper, thiamin 2-thiothiazolone diphosphate (ThTTDP) and thiamin 2-thiazolonediphosphate (ThTDP), and potential Michael acceptor 2-oxo-3-butynoic acid. The2-oxo-3-butynoic acid is an irreversible inhibitor and activity could not be regained by dilutionof inhibitor [22]; its site of reactivity is still not known, but we do know that it does not reactwith any of the six cysteines of E1ec [11]. The compounds ThTTDP and ThTDP are sometimesreferred to as transtion state analogues since the Ki values obtained are much lower than theKd for ThDP [10,23]. The nature of inhibition by these compounds has been clarified with thepublication of a crystal structure of its complex with E1ec [24].
The phosphonate/phosphinate class mimics the substrate and the cumulative evidence indicatesthat they inhibit via enzymatic synthesis of LThDP-like adducts (Scheme 2). While theseadducts certainly must have significant lifetime, the chemical bond between the keto carbonof the inhibitor and the C2 atom of thiazolium is formed reversibly and excess pyruvate orovernight dialysis (i.e., dilution of the inhibitor concentration) can reverse the inhibition. Thekoff appears to be slow for both enzymes.
At the same time, we point out that these phosphonate and phosphinate compounds have tunedout to be excellent mechanistic tools since their ThDP-bound adducts (Scheme 2) all giveevidence of the positive CD band in the 300-310 nm region (as well as in the UV spectrum)[21].
Another notable finding of our studies is that the two species of pyruvate dehydrogenase studiedE1h and E1ec lead to the formation of the opposite enantiomer of acetoin, a carboligase sideproduct of ThDP enzymes (Figure 4). This makes the E1ec truly unusual [produces the (S)enantiomer], since all other ThDP enzymes appear to produce (R)-acetoin as does E1h. As wasreasoned elsewhere, this implies that the pyruvate entering the enzyme presents a different face(re or si) to the enamine [18,25].
Finally, the results provide very strong support for the function of residue αH63 in E1h. It issuggested by the absence of the negative 330 CD band for the E1h αH63.ThDP complex, unlikewith the wild-type E1h, that the ThDP binding site is perturbed. However, the experimentswith ThTTDP indicate that this ThDP analogue can still bind to the active center. The absenceof the positive CD band at 305 nm on adding AcPhi to the E1h αH63.ThDP complex and thelow level of inhibition of E1h aH63A by AcPhi and AcMPhi confirm that the variant can nolonger form the C2α-phosphinolactylThDP (see Scheme 2), nor can it presumably formLThDP. The presence or absence of these CD bands provides a straightforward experimentalmethod to determine whether or not a particular residue is involved in the formation of LThDP,a common intermediate in all ThDP-dependent decarboxylases.
Acknowledgements
Supported at Rutgers by NIH-050380 and at SUNY-Buffalo by NASA Grant NAG8-1924.
AbbreviationsPDHc, pyruvate dehydrogenase complexPDHc-h, human pyruvate dehydrogenase complexPDHc-ec, Escherichia coli pyruvate dehydrogenase complexE1h, E2h, E3h, refer to the components of the human enzymeE3BPh, E3h-binding protein formerly known as protein XE1ec, E2ec, E3ec, refer to the subunits of the Escherichia coli enzymeThDP, thiamin diphosphate
Nemeria et al. Page 8
Bioorg Chem. Author manuscript; available in PMC 2007 January 29.
NIH
-PA Author Manuscript
NIH
-PA Author Manuscript
NIH
-PA Author Manuscript
MAcPho, sodium salt of acetylphosphonic acid methyl esterAcPhi, sodium salt of acetylphosphinic acidAcMPhi, sodium salt of acetylmethylphosphinic acidLThDP, C2α-lactylThDPPLThDP, C2α-phosphonolactylThDPThTTDP, thiamin 2-thiathiazolonediphosphate
References1. Jordan F, Nemeria NS, Zhang S, Yan Y, Arjunan P, Furey W. J. Am. Chem. Soc 2003;125:12732–
12738. [PubMed: 14558820]2. Nemeria N, Baykal A, Joseph E, Zhang S, Yan Y, Furey W, Jordan F. Biochemistry 2004;43:6565–
6575. [PubMed: 15157089]3. Jordan F, Zhang Z, Sergienko EA. Bioorg. Chem 2002;30:188–198. [PubMed: 12406703]4. Baykal AT, Kakalis L, Jordan F. Biochemistry 2006;45:7522–7528. [PubMed: 16768448]5. Jordan F, Nemeria NS. Bioorg. Chem 2005;33:190–215. [PubMed: 15888311]6. Arjunan P, Sax M, Brunskill A, Chandrasekhar K, Nemeria N, Zhang S, Jordan F, Furey W. J. Biol.
Chem 2006;281:15296–15303. [PubMed: 16531404]7. Wille G, Meyer D, Steinmetz A, Hinze E, Golbik R, Tittmann K. Nat. Chem. Biol 2006;6:324–328.
[PubMed: 16680160]8. Baillie, AC.; Wright, BJ.; Wright, K. U.S. Patent No 4,339,443. Jul 13. 1982 granted9. Korotchkina LG, Sidhu S, Patel MS. J. Biol. Chem 2006;281:9688–9696. [PubMed: 16436377]10. Nemeria N, Yan Y, Zhang Z, Brown AM, Arjunan P, Furey W, Guest JR, Jordan F. J. Biol. Chem
2001;276:45969–45976. [PubMed: 11583990]11. Nemeria N, Volkov A, Brown A, Yi J, Zipper L, Guest JR, Jordan F. Biochemistry 1998;37:911–
922. [PubMed: 9454581]12. Korotchkina LG, Patel MS. J. Biol. Chem 2001;276:5731–5738. [PubMed: 11092882]13. Bradford MM. Anal. Biochem 1976;72:248–254. [PubMed: 942051]14. Kitz R, Wilson IB. J. Biol. Chem 1962;237:3245–3249. [PubMed: 14033211]15. Morrison JF. Trends Biochem. Sci 1982;7:102–105.16. Schönbrunn-Hanebeck E, Laber B, Amrhein N. Biochemistry 1990;29:4880–4885. [PubMed:
2194562]17. Bieth JG. Methods Enzymol 1995;248:59–84. [PubMed: 7674947]18. Nemeria N, Tittmann K, Joseph E, Zhou L, Vazquez-Coll MB, Arjunan P, Hübner G, Furey W, Jordan
F. J. Biol. Chem 2005;280:21473–21482. [PubMed: 15802265]19. Laber B, Amrhein N. 1987;248:351–358.20. Spinka, M.; Hübner, G. Biochemistry and Physiology of Thiamin Diphosphate Enzymes. Bisswanger,
H.; Schellenberger, A., editors. A. u. C. Intemann, Wissenschaftlicher Verlag; Prien: 1996. p.186-194.
21. Nemeria N, Chakraborty S, Baykal A, Korotchkina L, Patel M, Jordan F. 2006submitted22. Brown A, Nemeria N, Yi J, Zhang D, Jordan WB, Machado RS, Guest JR, Jordan F. Biochemistry
1997;36:8071–8081. [PubMed: 9201955]23. Gutowski JA, Lienhard GE. J. Biol. Chem 1976;251:2863–2866. [PubMed: 770474]24. Arjunan P, Chandrasekhar K, Sax M, Brunskill A, Nemeria N, Jordan F, Furey W. Biochemistry
2004;43:2405–2411. [PubMed: 14992577]25. Baykal A, Chakraborty S, Dodoo A, Jordan F. 2006submitted
Nemeria et al. Page 9
Bioorg Chem. Author manuscript; available in PMC 2007 January 29.
NIH
-PA Author Manuscript
NIH
-PA Author Manuscript
NIH
-PA Author Manuscript

Scheme 3.
Nemeria et al. Page 10
Bioorg Chem. Author manuscript; available in PMC 2007 January 29.
NIH
-PA Author Manuscript
NIH
-PA Author Manuscript
NIH
-PA Author Manuscript

Figure 1.CD titration of E1ec by AcPhi: A. Difference spectra of E1ec on addition of AcPhi. Inset:Dependence of the ellipticity at 317 nm on the [AcPhi] / [E1ec active centers in homodimer]ratio. B. E1ec activity remaining with increasing [AcPhi] / [E1ec] ratio. Conditions underMaterials and Methods.
Nemeria et al. Page 11
Bioorg Chem. Author manuscript; available in PMC 2007 January 29.
NIH
-PA Author Manuscript
NIH
-PA Author Manuscript
NIH
-PA Author Manuscript

Figure 2.Difference CD spectra of E1ec on addition of MAcPho. E1ec (1.90 mg/ml, concentration ofactive centers = 19 μM) in 20 mM potassium phosphate buffer (pH 7.0) containing 1 mMMgCl2 and 0.20 mM ThDP was titrated by MAcPho (μM): spectrum 1 (1.0); 2 (3.0); 3 (5.0);4 (7.0); 5 (9.0); 6 (12.0); 7 (16.0); 8 (18.0); 9 (20.0); 10 (40.0); 11 (50.0); 12 (150.0). Thedifference CD spectra were obtained on subtraction of the spectrum of E1ec in the presence ofMgCl2 and ThDP. Inset: dependence of the ellipticity at 301 nm on [MAcPho] / [E1ec] ratio.
Nemeria et al. Page 12
Bioorg Chem. Author manuscript; available in PMC 2007 January 29.
NIH
-PA Author Manuscript
NIH
-PA Author Manuscript
NIH
-PA Author Manuscript
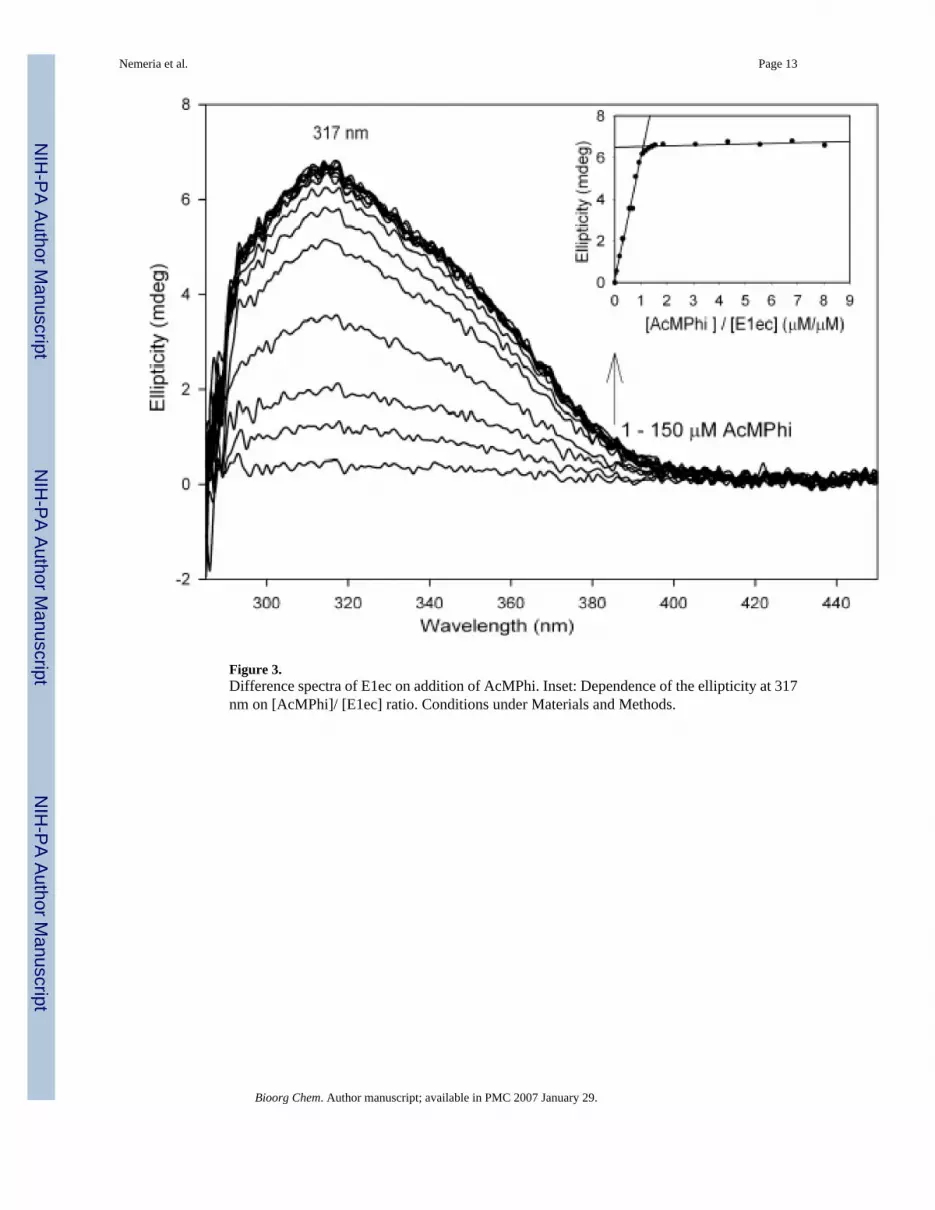
Figure 3.Difference spectra of E1ec on addition of AcMPhi. Inset: Dependence of the ellipticity at 317nm on [AcMPhi]/ [E1ec] ratio. Conditions under Materials and Methods.
Nemeria et al. Page 13
Bioorg Chem. Author manuscript; available in PMC 2007 January 29.
NIH
-PA Author Manuscript
NIH
-PA Author Manuscript
NIH
-PA Author Manuscript

Figure 4.Acetoin production by E1ec and E1h. E1ec titrated with AcMPhi (as in Figure 3.) was dialyzedovernight against 20 mM potassium phosphate buffer (pH 7.0). Then 2 mM MgCl2, 0.20 mMThDP and 2 mM pyruvate were added to the dialyzed E1ec and CD spectra were recorded atdifferent times. After 50 min of incubation of E1ec with 2 mM pyruvate the protein wasremoved by centrifugation using a Centricon 30 and the spectrum of the reaction mixture wasrecorded. A similar experiment was conducted with E1h.
Nemeria et al. Page 14
Bioorg Chem. Author manuscript; available in PMC 2007 January 29.
NIH
-PA Author Manuscript
NIH
-PA Author Manuscript
NIH
-PA Author Manuscript

Figure 5.Determination of Ki for inhibition of E1ec by AcMPhi and AcPhi from progress curve analysis.Dependence of kapp of inhibition of E1ec by different concentrations of AcMPhi (A) and AcPhi(B). Conditions in Materials and Methods.
Nemeria et al. Page 15
Bioorg Chem. Author manuscript; available in PMC 2007 January 29.
NIH
-PA Author Manuscript
NIH
-PA Author Manuscript
NIH
-PA Author Manuscript
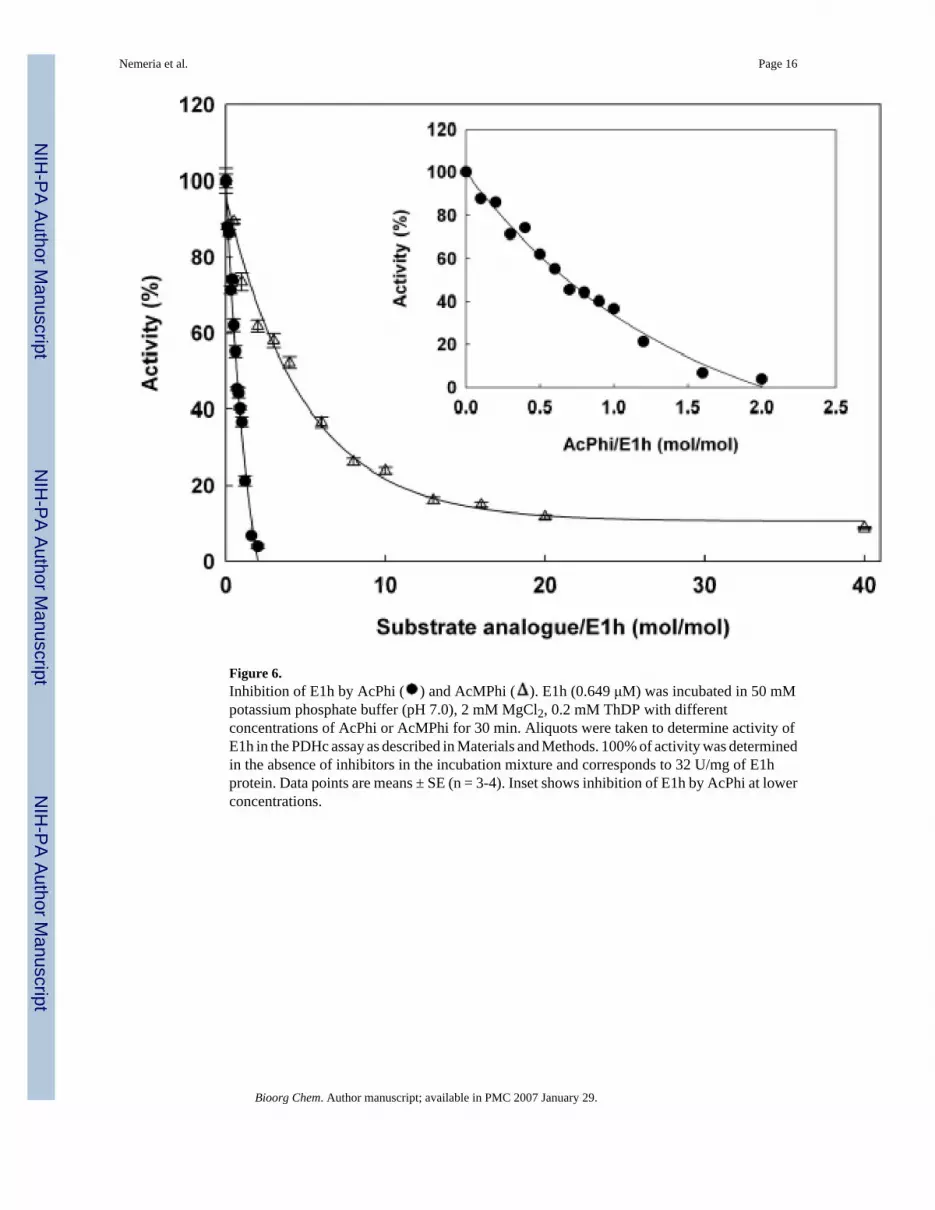
Figure 6.Inhibition of E1h by AcPhi ( ) and AcMPhi ( ). E1h (0.649 μM) was incubated in 50 mMpotassium phosphate buffer (pH 7.0), 2 mM MgCl2, 0.2 mM ThDP with differentconcentrations of AcPhi or AcMPhi for 30 min. Aliquots were taken to determine activity ofE1h in the PDHc assay as described in Materials and Methods. 100% of activity was determinedin the absence of inhibitors in the incubation mixture and corresponds to 32 U/mg of E1hprotein. Data points are means ± SE (n = 3-4). Inset shows inhibition of E1h by AcPhi at lowerconcentrations.
Nemeria et al. Page 16
Bioorg Chem. Author manuscript; available in PMC 2007 January 29.
NIH
-PA Author Manuscript
NIH
-PA Author Manuscript
NIH
-PA Author Manuscript
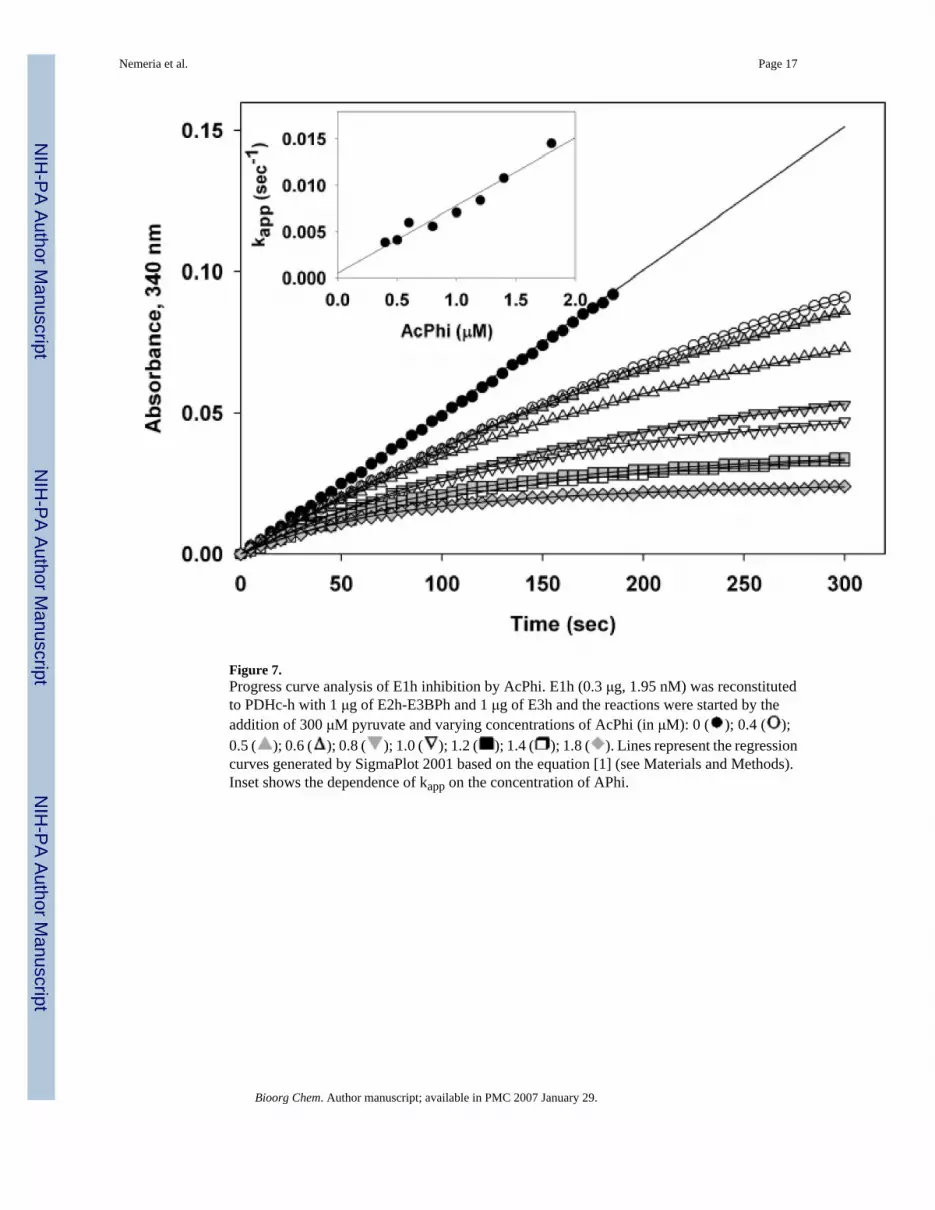
Figure 7.Progress curve analysis of E1h inhibition by AcPhi. E1h (0.3 μg, 1.95 nM) was reconstitutedto PDHc-h with 1 μg of E2h-E3BPh and 1 μg of E3h and the reactions were started by theaddition of 300 μM pyruvate and varying concentrations of AcPhi (in μM): 0 ( ); 0.4 ( );0.5 ( ); 0.6 ( ); 0.8 ( ); 1.0 ( ); 1.2 ( ); 1.4 ( ); 1.8 ( ). Lines represent the regressioncurves generated by SigmaPlot 2001 based on the equation [1] (see Materials and Methods).Inset shows the dependence of kapp on the concentration of APhi.
Nemeria et al. Page 17
Bioorg Chem. Author manuscript; available in PMC 2007 January 29.
NIH
-PA Author Manuscript
NIH
-PA Author Manuscript
NIH
-PA Author Manuscript
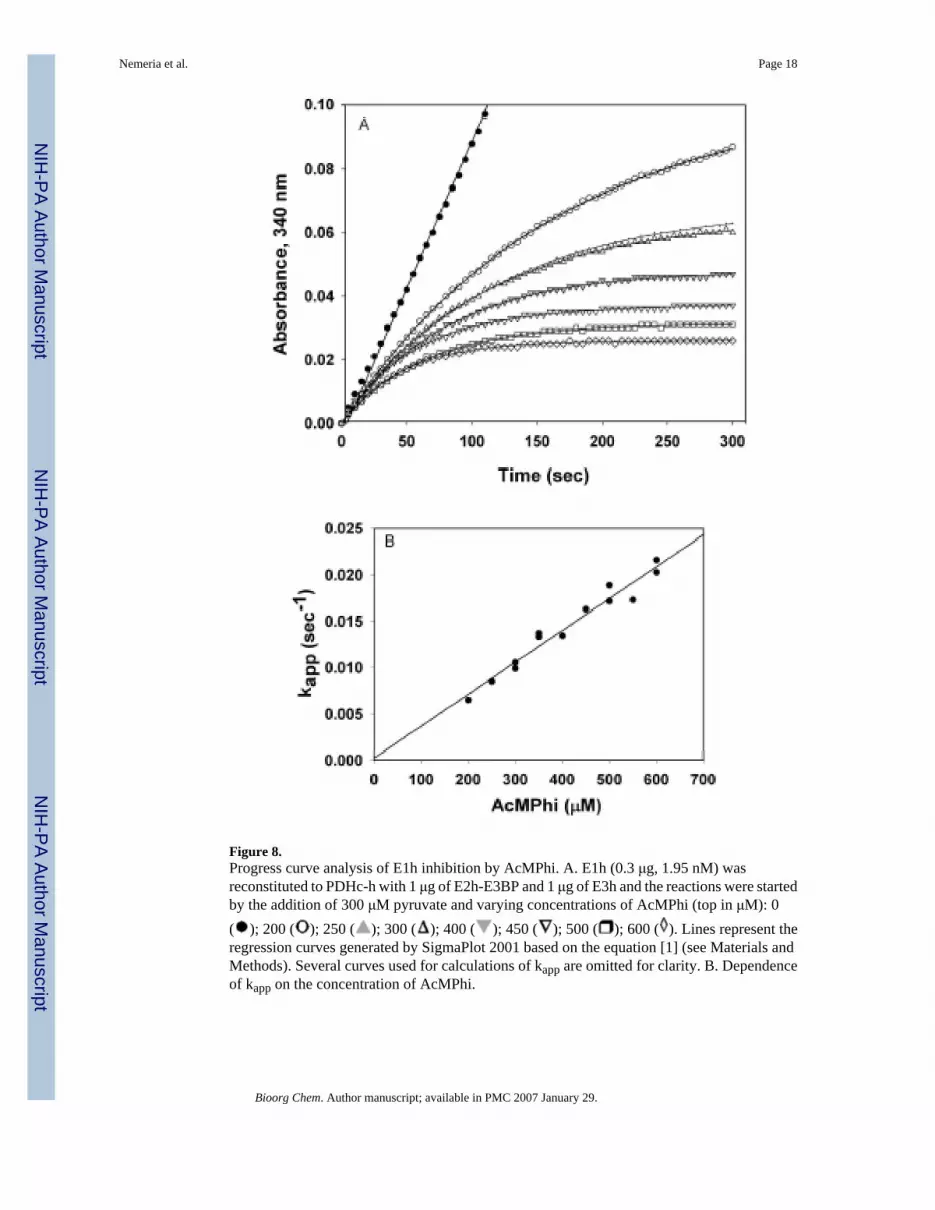
Figure 8.Progress curve analysis of E1h inhibition by AcMPhi. A. E1h (0.3 μg, 1.95 nM) wasreconstituted to PDHc-h with 1 μg of E2h-E3BP and 1 μg of E3h and the reactions were startedby the addition of 300 μM pyruvate and varying concentrations of AcMPhi (top in μM): 0( ); 200 ( ); 250 ( ); 300 ( ); 400 ( ); 450 ( ); 500 ( ); 600 ( ). Lines represent theregression curves generated by SigmaPlot 2001 based on the equation [1] (see Materials andMethods). Several curves used for calculations of kapp are omitted for clarity. B. Dependenceof kapp on the concentration of AcMPhi.
Nemeria et al. Page 18
Bioorg Chem. Author manuscript; available in PMC 2007 January 29.
NIH
-PA Author Manuscript
NIH
-PA Author Manuscript
NIH
-PA Author Manuscript

Figure 9.Inhibition of wild-type E1h and E1h αH63A by AcPhi and AcMPhi. Symbols are: wild-typeE1h inhibited by AcPhi ( ) and AcMPhi ( ); αH63A E1h inhibited by AcPhi ( ) andAcMPhi ( ). E1h (6.49 μM) or its αH63A variant was incubated in 50 mM KH2PO4 (pH 7.0),2 mM MgCl2, 0.2 mM ThDP and different concentrations of AcPhi or AcMPhi for 30 min.Aliquots were taken to determine the E1-specific activity according to the DCPIP assay asdescribed in Methods. 100% of the activity was determined in the absence of inhibitors in theincubation mixture and corresponds to 231 mU/mg of E1 protein. Data points are means ± SE(n = 3). Inset shows inhibition of the wild-type E1h by AcPhi ( ) and AcMPhi ( ) at lowerconcentrations.
Nemeria et al. Page 19
Bioorg Chem. Author manuscript; available in PMC 2007 January 29.
NIH
-PA Author Manuscript
NIH
-PA Author Manuscript
NIH
-PA Author Manuscript
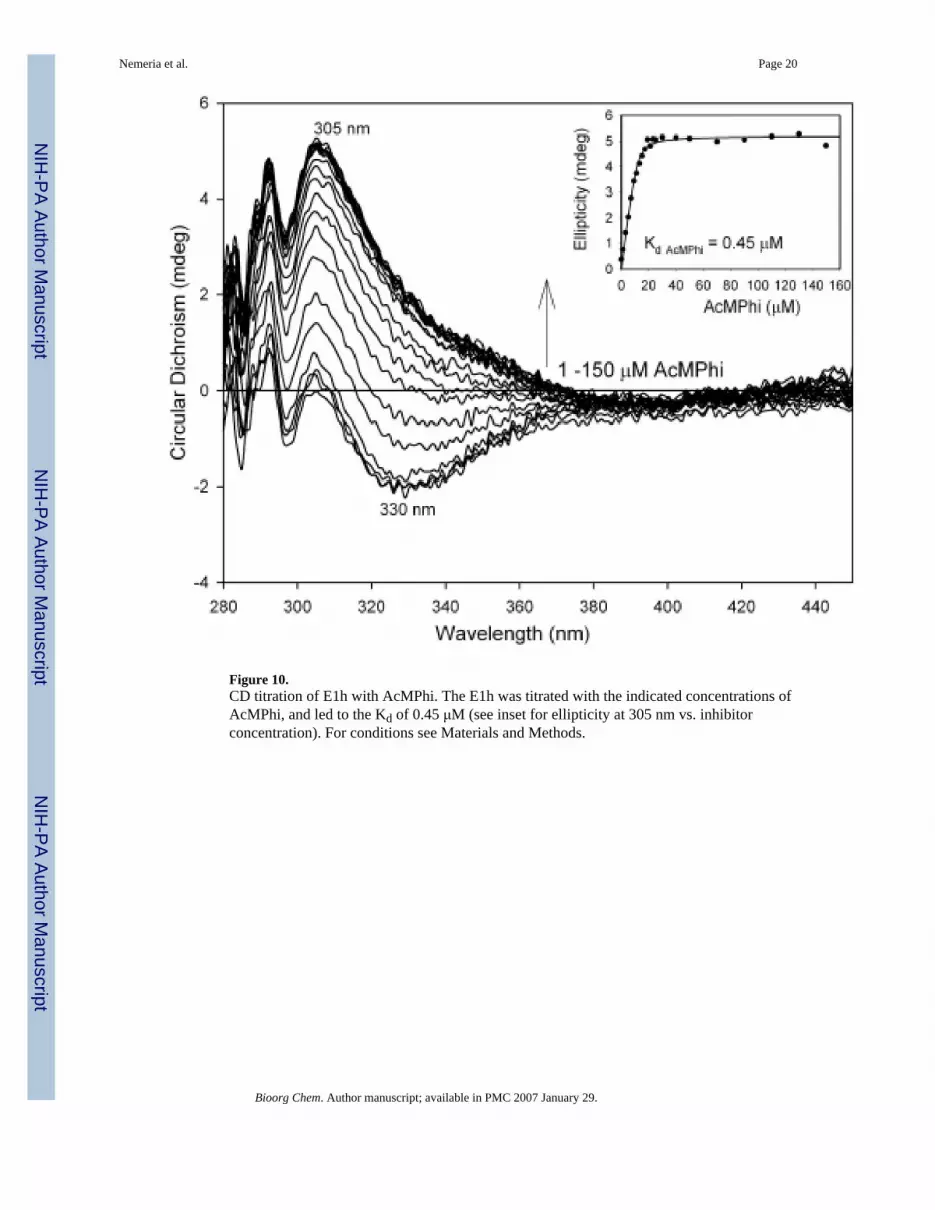
Figure 10.CD titration of E1h with AcMPhi. The E1h was titrated with the indicated concentrations ofAcMPhi, and led to the Kd of 0.45 μM (see inset for ellipticity at 305 nm vs. inhibitorconcentration). For conditions see Materials and Methods.
Nemeria et al. Page 20
Bioorg Chem. Author manuscript; available in PMC 2007 January 29.
NIH
-PA Author Manuscript
NIH
-PA Author Manuscript
NIH
-PA Author Manuscript
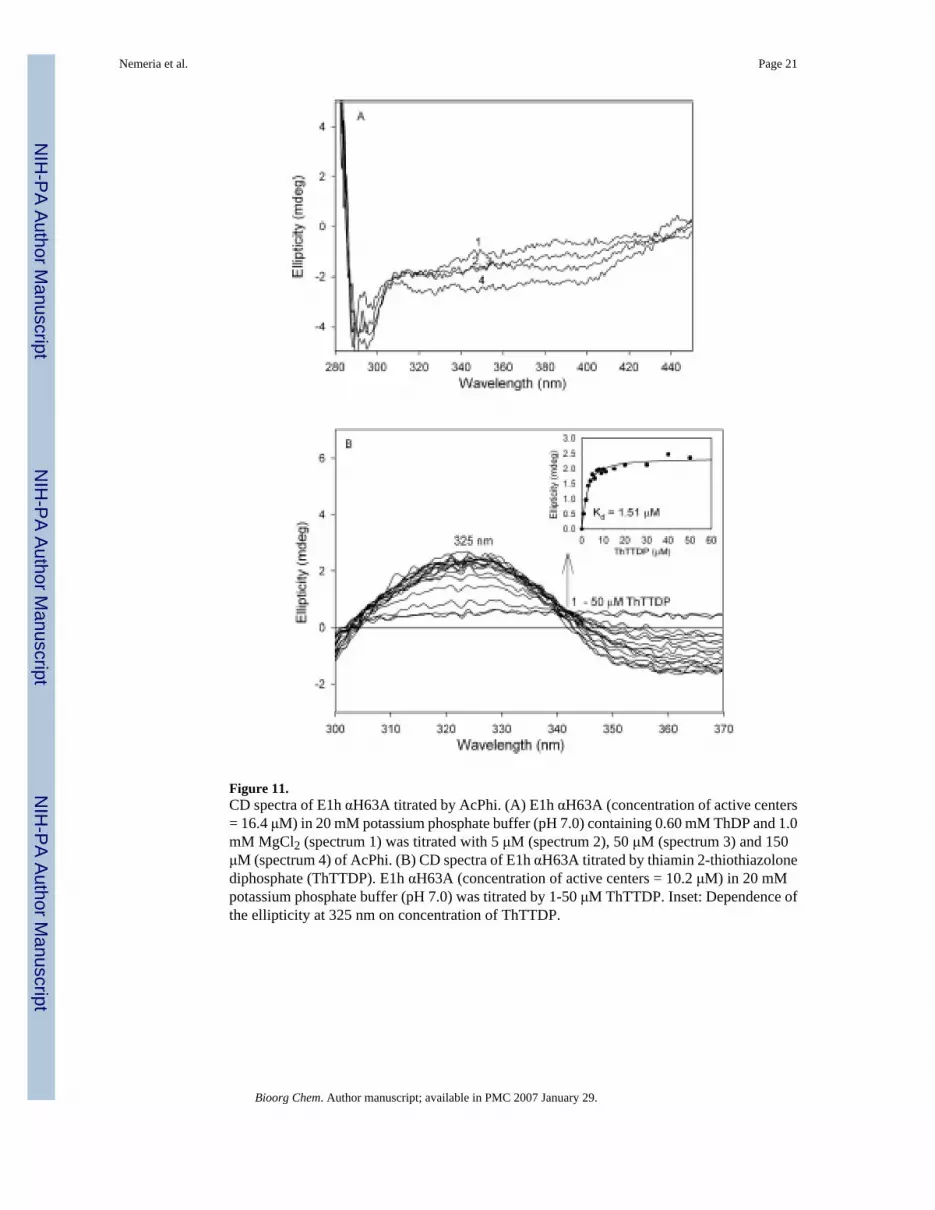
Figure 11.CD spectra of E1h αH63A titrated by AcPhi. (A) E1h αH63A (concentration of active centers= 16.4 μM) in 20 mM potassium phosphate buffer (pH 7.0) containing 0.60 mM ThDP and 1.0mM MgCl2 (spectrum 1) was titrated with 5 μM (spectrum 2), 50 μM (spectrum 3) and 150μM (spectrum 4) of AcPhi. (B) CD spectra of E1h αH63A titrated by thiamin 2-thiothiazolonediphosphate (ThTTDP). E1h αH63A (concentration of active centers = 10.2 μM) in 20 mMpotassium phosphate buffer (pH 7.0) was titrated by 1-50 μM ThTTDP. Inset: Dependence ofthe ellipticity at 325 nm on concentration of ThTTDP.
Nemeria et al. Page 21
Bioorg Chem. Author manuscript; available in PMC 2007 January 29.
NIH
-PA Author Manuscript
NIH
-PA Author Manuscript
NIH
-PA Author Manuscript

Scheme 1.Reactions of pyruvate dehydrogenase complexes
Nemeria et al. Page 22
Bioorg Chem. Author manuscript; available in PMC 2007 January 29.
NIH
-PA Author Manuscript
NIH
-PA Author Manuscript
NIH
-PA Author Manuscript

Scheme 2.Formation of LThDP and its phosphonate and phosphinate analogues
Nemeria et al. Page 23
Bioorg Chem. Author manuscript; available in PMC 2007 January 29.
NIH
-PA Author Manuscript
NIH
-PA Author Manuscript
NIH
-PA Author Manuscript

NIH
-PA Author Manuscript
NIH
-PA Author Manuscript
NIH
-PA Author Manuscript
Nemeria et al. Page 24
Table 1Kinetic parameters for the inhibition of E1ec by substrate analogues.
Compound Ki (μM) kinact (min−1) kinact/Ki (μM min)−1 Kd (μM)
Acetylphosphinate 0.76 3.34 4.40 0.060a
Acetylphosphinateb 0.12 1.30 10.83 0.005Acetylphosphinated 0.33 0.55 1.67Acetylmethylphosphinate 3.33 0.62 0.19 0.10aMethyl acetylphosphonate 0.199a
2-oxo-3-butynoic acidc 8.5 1.79 0.21 0.20
Ki is the dissociation constant for the initial reversible complex (from kinetic experiment) obtained in the presence of 0.50 mM pyruvate in the incubationmixture.
kinact is the rate constant for conversion of the reversible complex to irreversibly inactivated enzyme
kinact/Ki is the second order rate constant for inactivation
aKd is the dissociation constant obtained from CD analysis.
bDetermined from kinetic analysis of inhibition for E. coli PDHc from ref. 16.
cDetermined from kinetic analysis of inhibition for E. coli PDHc from ref. 11,22.
dDetermined from kinetic analysis of inhibition for PDHc from bovine heart from ref 19.
Bioorg Chem. Author manuscript; available in PMC 2007 January 29.
NIH
-PA Author Manuscript
NIH
-PA Author Manuscript
NIH
-PA Author Manuscript
Nemeria et al. Page 25
Table 2Kinetic parameters for the inhibition of E1h by substrate analogue inhibitors.
Compound Ki (μM) k1 (μM−1min−1) k−1 (min−1) Kd (μM)
Acetylphosphinate 0.014 2.18 0.0305 N/AAcetylmethylphosphinate 1.46 0.0101 0.0148 0.45
Kd is measured from CD titration where experimentally accessible.
Bioorg Chem. Author manuscript; available in PMC 2007 January 29.
![In vivo 13C spectroscopy in the rat brain using hyperpolarized [1-13C]pyruvate and [2-13C]pyruvate](https://img.dokumen.tips/doc/110x75/63588970a90bb46f52086ce7/in-vivo-13c-spectroscopy-in-the-rat-brain-using-hyperpolarized-1-13cpyruvate-and.jpg)


![Metabolic imaging in the anesthetized rat brain using hyperpolarized [1-13C] pyruvate and [1-13C] ethyl pyruvate](https://img.dokumen.tips/doc/110x75/6351c9730e796dacc000275f/metabolic-imaging-in-the-anesthetized-rat-brain-using-hyperpolarized-1-13c-pyruvate.jpg)


