Embed Size (px)
Citation preview
Accepted Manuscript
Finite Element analysis of Laser Shock Peening of 2050-T8 aluminum alloy
Neila Hfaiedh, Patrice Peyre, Hongbin Song, Ioana Popa, Vincent Ji, VincentVignal
PII: S0142-1123(14)00168-6DOI: http://dx.doi.org/10.1016/j.ijfatigue.2014.05.015Reference: JIJF 3395
To appear in: International Journal of Fatigue
Received Date: 10 September 2013Revised Date: 18 May 2014Accepted Date: 21 May 2014
Please cite this article as: Hfaiedh, N., Peyre, P., Song, H., Popa, I., Ji, V., Vignal, V., Finite Element analysis ofLaser Shock Peening of 2050-T8 aluminum alloy, International Journal of Fatigue (2014), doi: http://dx.doi.org/10.1016/j.ijfatigue.2014.05.015
This is a PDF file of an unedited manuscript that has been accepted for publication. As a service to our customerswe are providing this early version of the manuscript. The manuscript will undergo copyediting, typesetting, andreview of the resulting proof before it is published in its final form. Please note that during the production processerrors may be discovered which could affect the content, and all legal disclaimers that apply to the journal pertain.
1
Finite Element analysis of Laser Shock Peening of
2050-T8 aluminum alloy
Neila Hfaiedh1, a, Patrice Peyre1, b, Hongbin Song1, Ioana Popa2, Vincent Ji3, Vincent
Vignal2
1PIMM, UMR 8006 CNRS- Arts et Métiers Paris-Tech, 75013 PARIS, France
2ICB, UMR 5209 CNRS-University of Burgundy, 21078 DIJON, France
3ICMMO, University Paris-Sud, 91000 ORSAY, France
E-mail: [email protected]
Abstract
Laser shock processing is a recently developed surface treatment designed to improve the mechanical properties and fatigue performance of materials, by inducing a deep
compressive residual stress field. The purpose of this work is to investigate the residual
stress distribution induced by Laser shock processing in a 2050-T8 aeronautical aluminium
alloy with both x-ray diffraction measurements and 3D finite element simulation. The
method of x-ray diffraction is extensively used to characterize the crystallographic texture
and the residual stress crystalline materials at different scales (macroscopic, mesoscopic
and microscopic).
Shock loading and materials’ dynamic response are experimentally analysed using Doppler
velocimetry in order to use adequate data for the simulation. Then systematic experience
versus simulation comparisons are addressed, considering first a single impact loading, and
in a second step the Laser shock processing treatment of an extended area, with a specific
focus on impact overlap. Experimental and numerical results indicate a residual stress
anisotropy, and a better surface stress homogeneity with an increase of impact overlap.
A correct agreement is globally shown between experimental and simulated residual stress values, even if simulations provide us with local stress values whereas x-ray diffraction
determinations give averaged residual stresses. Keywords: Laser shock peening; Residual stress; Finite element analysis
1. Introduction
During the past 20 years, laser shock
processing (LSP) has been proposed as a
competitive alternative technology to
classical surface treatments for improving
fatigue, corrosion and wear resistance of
metals. It has recently been developed as a
practical process amenable to production
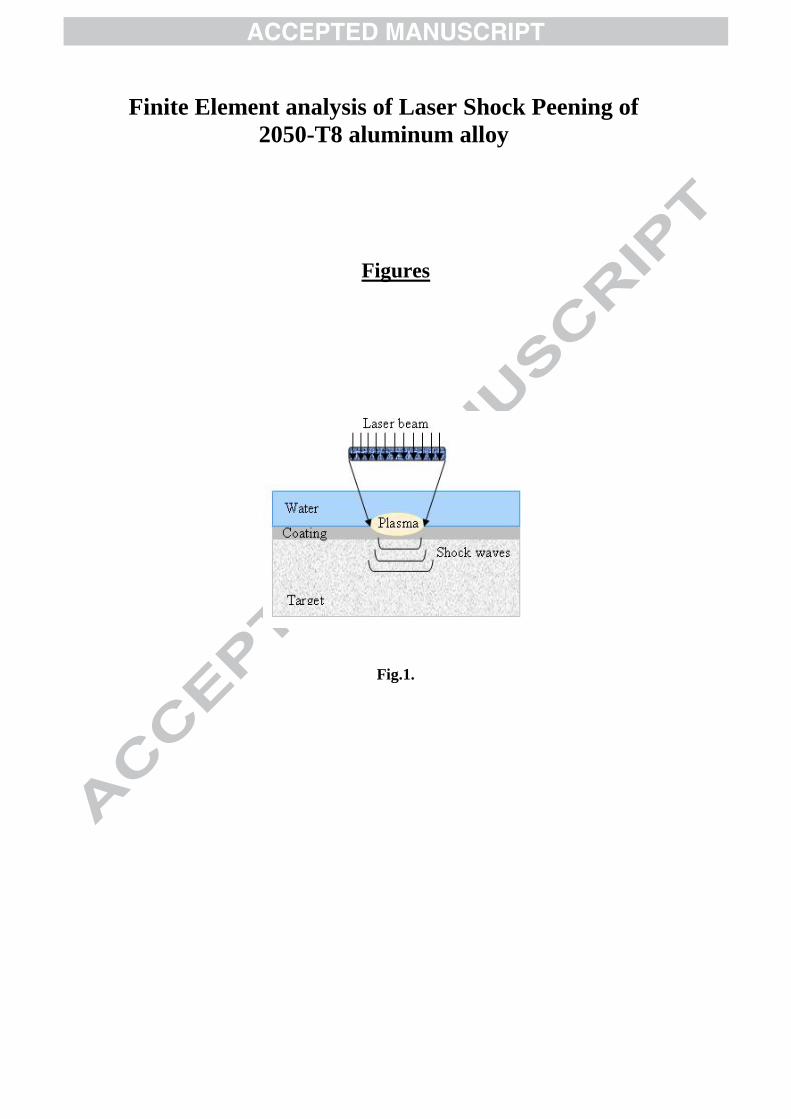
engineering. This process (Fig. 1) aims at introducing a deep (mm range) residual
compressive stress field on metallic targets. More precisely, LSP uses high energy
laser pulses (in the GW/cm2 range) to
impact the surface of a metal coated with a
protective film (organic paint, tape or thin
metallic film), and covered with a
transparent layer (usually water). As the
laser beam passes through the transparent
layer and hits the surface of the material, a
thin layer of the ablative layer is vaporized
(nearly 1µm/shot). The vapor continues to
absorb the remaining laser energy and is
heated and ionized into a high pressure
plasma. Due to the confining effect of the transparent layer, the plasma pressure is
amplified (up to several GPa), and the resulting pressure discontinuity propagates
into the material as a shock wave [1, 2]. This plasma confined regime, allows
obtaining maximum impact pressures of up
2
to 5-6 GPa in the 8-10 GW/cm² intensity
regime for 10-20 ns pulse duration, as
experimentally shown in [3].
In turn, the shock wave can cause
plastic deformation and compressive
stresses, provided the plasma pressure is of
sufficient magnitude to exceed the
Hugoniot Elastic Limit (HEL) of the metal.
Consequently, the specimen will undergo
extremely high strain-rate (greater than
106s
−1) during a short period of time (≅ 10-
20 ns in our case) and be dynamically
yielded.
Recent developments of industrial
systems have been proposed by some
companies [4-6] using either low output energy (around 1 J/pulse) or higher
energies (20-40 J/pulse) lasers [7, 8]. They have shown the feasibility of using LSP in
an industrial environment, with a large range of configurations (between 5 mm
and 10 µm diameters of impacts), materials and applications. The benefits of the
treatments versus other impact treatments
(shot-peening, ultrasonic peening, deep
rolling) are rather well known: a rather
good preservation of surface roughness,
large affected depths (superior to 1 mm),
and nearly the same amplitude of
compressive stresses at the surface of
metallic materials.
To predict the residual stress field and
optimize laser shock parameters, several
experimental and analytical formulations
have been reported in the literature,
starting by the early analytical work by Ballard et al. [9]. The Finite Element
Method (FEM) was first introduced by
Braisted and Brockman [10] to predict the
residual stresses induced by LSP on carbon
steels using Abaqus software, and a
combined explicit + implicit approach in
1999. From then on, several researchers
have used Abaqus to analyze laser shock
waves propagation into different metal materials, and the resulting residual
deformations and stresses [11-14]. Some of these simulations have shown a close
match with experimentally measured residual stresses. A recent work has also
developed a three-dimensional FEM model
to simulate a metal subjected to a square
laser spot [15] using the ANSYS code.
Last, we can mention the recent work by
Hirano [16] who has demonstrated for the
first time analytically, that residual stresses
induced by LSP could be anisotropic.
Most of these numerical works have
usually considered average in-depth
stresses induced by LSP, without really
addressing surface stress gradients, and
their dependence with LSP conditions such as overlapping rate, or spot diameters.
Moreover, the validation of pressure loading conditions P=f(x,y,t), or material’s
behavior under purely uniaxial shock conditions was not systematically
addressed. In the light of the above discussion, a
3D numerical model was developed with
different objectives : (1) identifying
pressure loading and shock yield stress
using both Doppler velocimetry, and single
impact analysis, (2) making systematic
comparisons between measured and
calculated residual stresses for different
LSP conditions, (3) investigating
numerically surface stress gradients, and
their dependence with overlapping rate, (4)
for the same overlapping rate, spot
diameter, and impact pressure,
investigating the influence of different LSP paths.
More precisely, the time and spatial distribution of the loading pressure
P=f(x,y,t) could be identified by checking surface deformations induced by a single
laser impact , using both 2D profilometry and numerical simulation, using an
analytical formulation for the pressure. In a
second step, the LSP treatment of an
extended area is considered, using up to 25
impact loading, and addressing different
LSP parameters such as laser spot sizes,
pressure amplitude, or overlapping rate.
2. The base 2050-T8 Al alloy
The material under investigation in this
paper is a 2050-T8 aluminium alloy (AA)
3
which is mainly composed of 3.5 Cu, 0.9
Li, 0.3 Mg, 0.4 Mn, 0.05 Fe and Al in
weight %. This material, recently
developed for structural aerospace
application, has a high elastic limit (0.51
GPa), due to Al2Cu nanometric
precipitation strengthening. In addition,
grain sizes ranging between 20 microns
and 500 microns were identified by EBSD
analysis, with a texture orientated along the
rolling direction [17]. The resulting
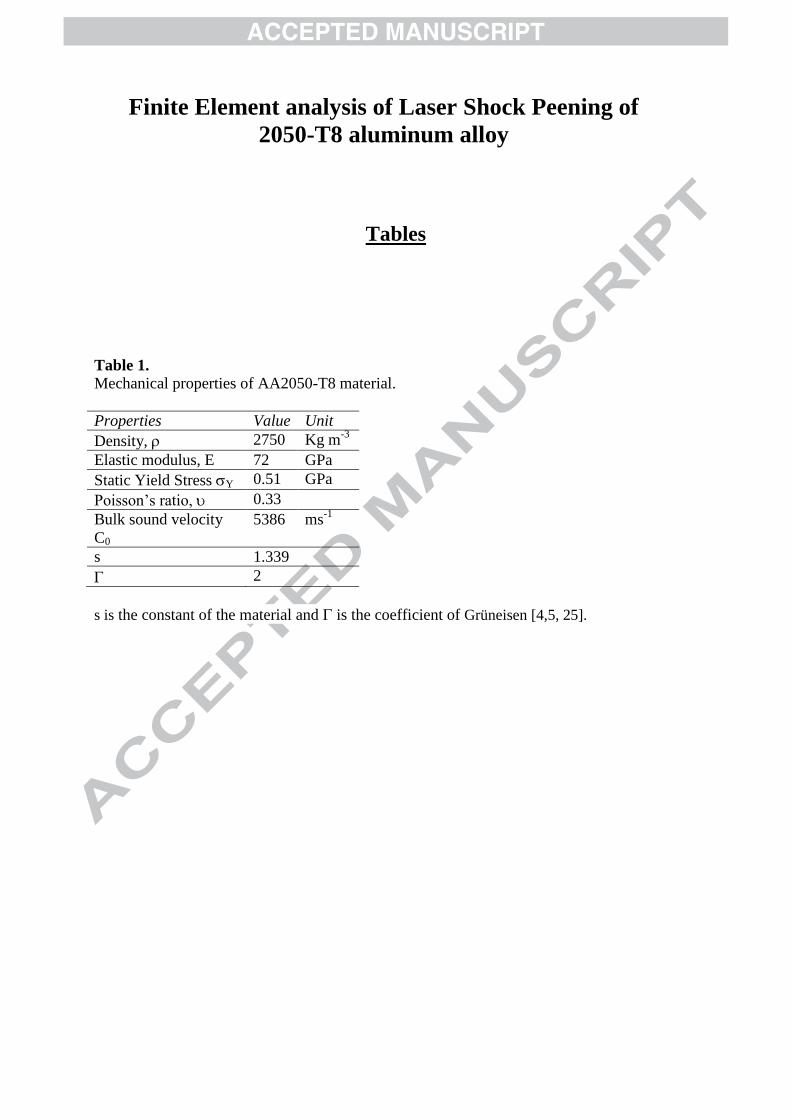
mechanical properties are illustrated in table 1.
3. Experimental setup and procedures
2.1. LSP conditions
The 2050-T8 alloy was laser-peened
with a Nd:YAG pulsed laser, producing 10
nanoseconds duration pulses with up to 1.5
J per pulse at 0.53 µm. The 0.53 µm
wavelength allowed us to use large water
thickness without generating extended
laser light absorption. Using our classical
LSP configuration, the target was
completely immersed in water (5-10 cm
thick), and a high pressure water nozzle
was used to remove ablation dusts.
Classically, 1 mm to 2 mm diameter
impacts were used, with intensities in the
3-8 GW/cm² range corresponding to estimated pressures in-between 2 GPa and
5 GPa using empirical equation
²)/(.65.1)( cmGWIGPaP = [18] and the
LSP treatment of extended areas could be
achieved by the overlap of successive spots
until the desired region was completely
covered. Prior to LSP treatment, 8 mm-
thick aluminium samples were protected
from thermal rise by a 80 µm-thick
aluminium adhesive, and a 10 µm organic
paint, to ensure a pure mechanical loading
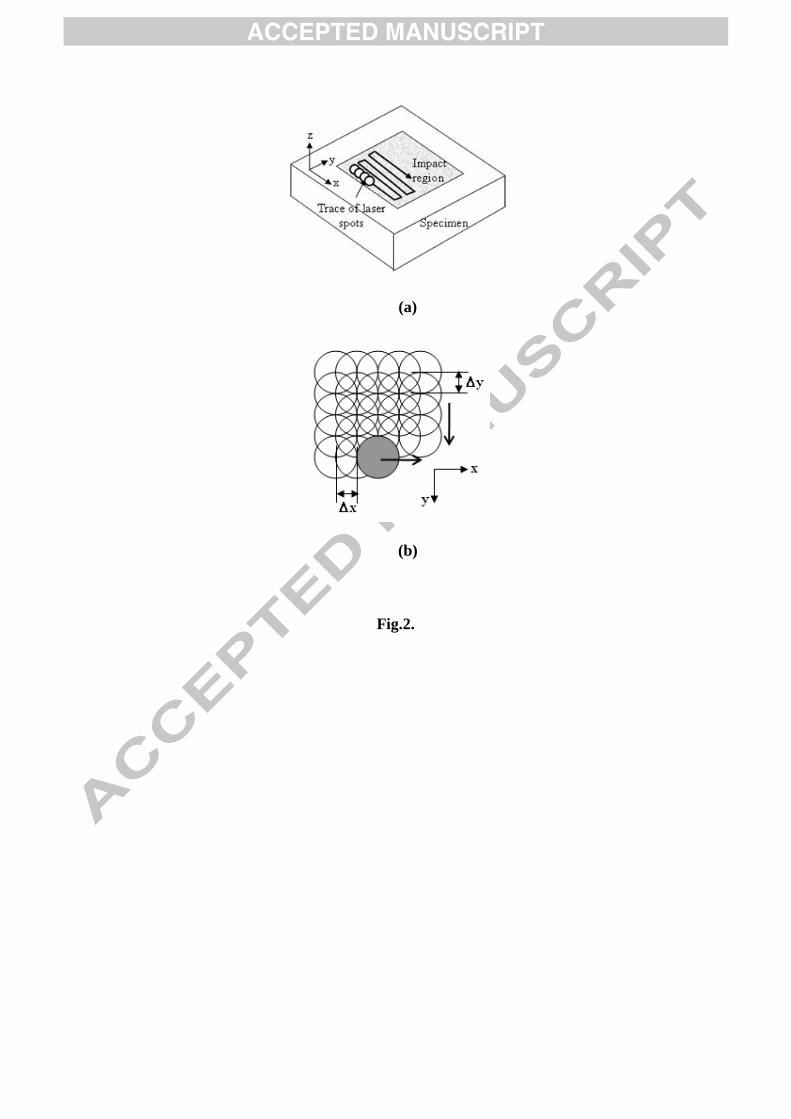
on targets. In this work, we imposed a fixed
number of identical and overlapped pressure pulse impacting a target material
successively as shown in Fig. 2. Two main
directions were considered: the σxx (≅ σ11)
stresses parallel to the LSP direction and
the σyy (≅ σ22) stresses perpendicular to the main LSP direction. In addition, the
overlapping rate R% was defined by
(=∆d/d with d=impact diameter and ∆d =
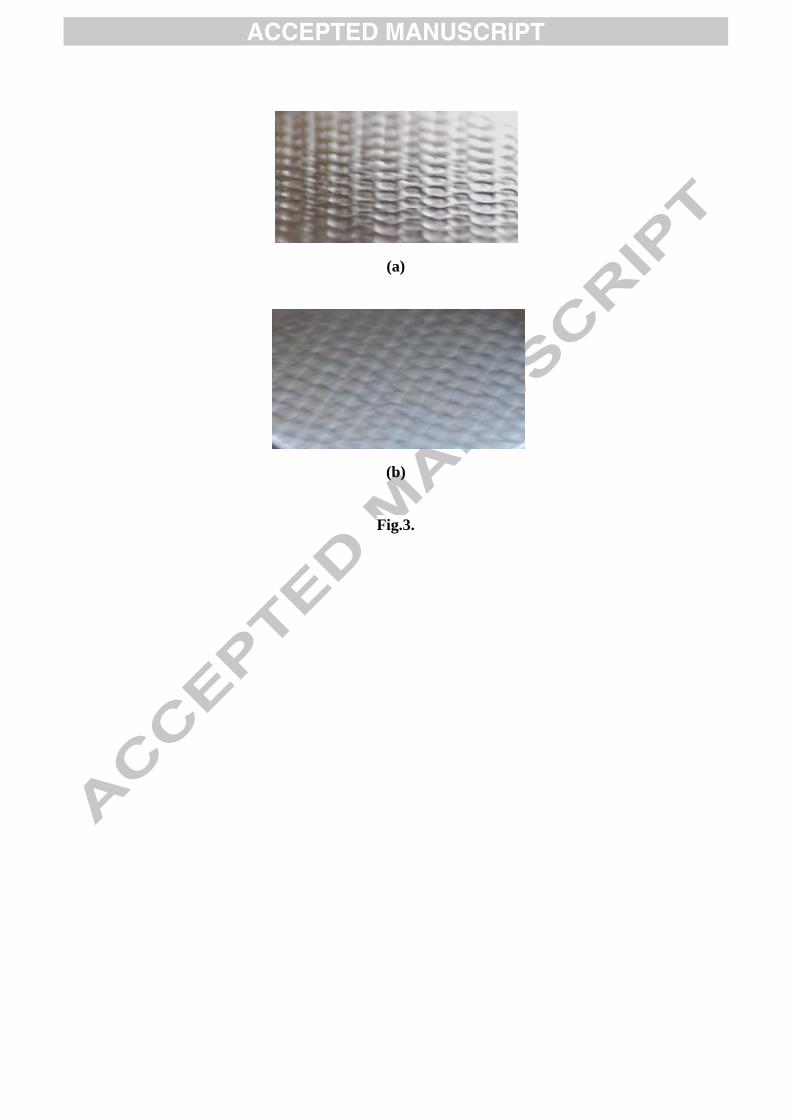
distance between two impacts). Different
overlapping rates will tend to modify
surface topography as shown in Fig. 3a
(33 % overlap) and Fig. 3b (50 % overlap).
2.2. VISAR determination of impact
pressures and elastic precursors
The measurement of impact pressure
and shock yield strengths were both carried out by VISAR (Velocity Interferometer
System for Any Reflector) Doppler velocimetry. This technique already used
successfully in the past 15 years [18, 19],
allowed us, by a simple measurement of
back free surface velocities UF (m/s)
behind thin foils to analyze shock wave
propagation, and deduce the P=f(t) profiles
on 1.5 mm diameter impacts, using
Hugoniot conservation equations (P=1/2
ρ.D.UF, with D=sound velocity (m/s), and
ρ=density (kg/m3))
1.
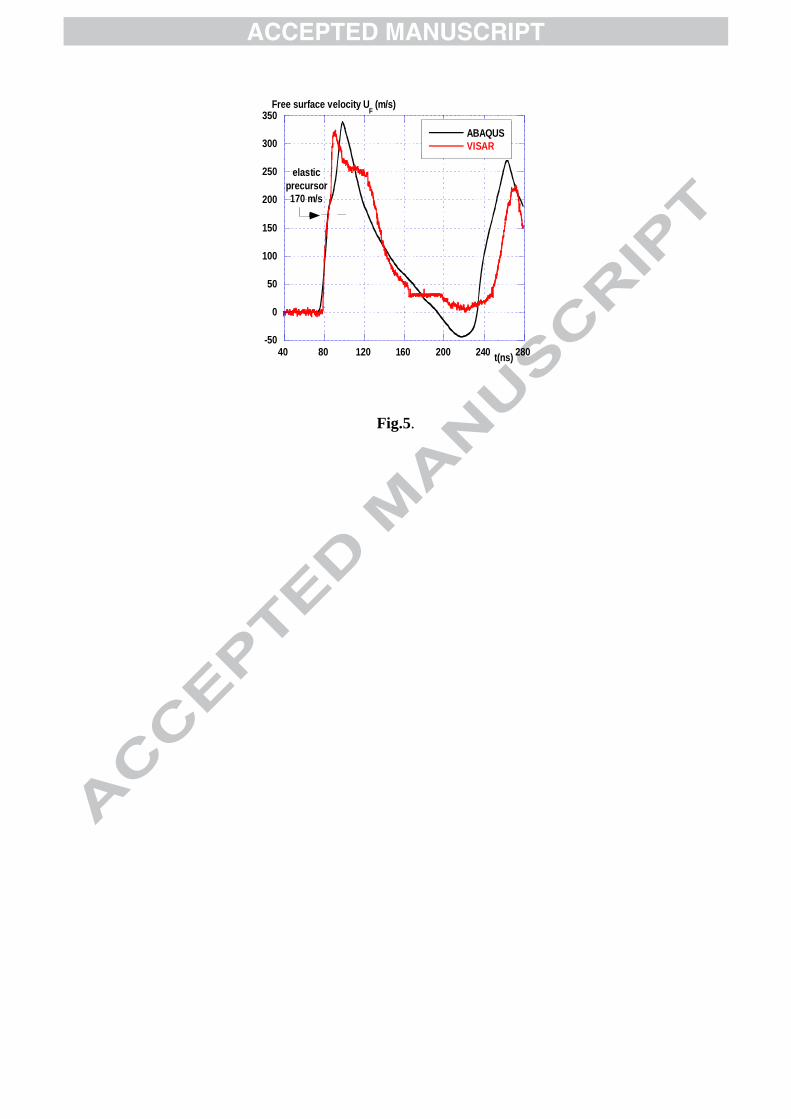
A back free velocity profile obtained
behind a 430 µm-thick 2050-T8 foil is
shown in Fig.5. The maximum velocity can be directly related to the pressure
amplitude 500 µm below the surface, whereas the inflexion evidenced in the
shock rise time is known as the elastic precursor, and corresponds to the elastic-
plastic transition under uniaxial shock loading. On Fig.5, a 170 m/s velocity level
is evidenced at the elastic-plastic transition,
which corresponds to a 1.38 GPa yield
stress under planar laser-shock loading (or
Hugoniot limit) PH (see equation 1).
FelH .U.C 2
1=P ρ (1)
With Cel = Elastic wave velocity = 6000
m/s, ρ= 2750 kg/m3
The determination of PH allows us to
determine the strain rate sensitivity as an
1 For more details about VISAR determinations,
please refer to [15-17]
4
input data for constitutive Johnson-Cook’s
equation (3) using the following formula:
dyn
YH 2-1
-1=P σ
υ
υ (2)
With ν = anisotropy Poisson’s coefficient
(0.33 on 2050-T8), σydyn
= dynamic Yield
stress at 106s
-1
In turn, using PH =1.38 GPa we obtain
a dynamic yield stress value σydyn equal to
0.7 GPa, and a strain rate sensitivity
coefficient C = 0.02 (for σY = 0.51 GPa).
The C value was estimated by checking the
elastic precursor (=PH) value with a
VISAR interferometer system [15].
Therefore, using VISAR measurements, P=f(t) profiles (Fig. 4), and shock yield
stress (Fig. 5) could be determined and used as input data in the numerical
simulation.
2.3. Residual stress determination
using the XRD technique
The residual stresses were measured using the well known X-ray diffraction,
using two different conditions, both corresponding to a 10-11 µm penetration
depth of x-rays. The X-rays patterns were first recorded using a SET-X device with a
20 kV voltage, a 5 mA intensity, and a 1.5 mm diameter x-ray spot. The classical
sin²ψ method was used to determine residual stresses, selecting {311} as a
diffracting plane because of a low
anisotropy effect of the material. The
corresponding diffraction conditions are
summarized in Table 2.
Recent developments based on micro
X-ray diffraction (µXRD) have allowed us to extend x-ray examination to a
microscopic level, using a 100 µm diameter probe x-ray beam. µXRD uses
specific optics to focus the excitation beam
to a small spot on the sample surface so
that very local areas can be analyzed on the
sample. The measurements have been
realized in ICB laboratory, using a Brucker
diffractometer, with a Cu source, theta-
theta geometry, Gobel mirror parallel
optics with 50-500 µm collimator, and a
2D detector (Table 3).
3. Initial conditions and work-
hardening levels
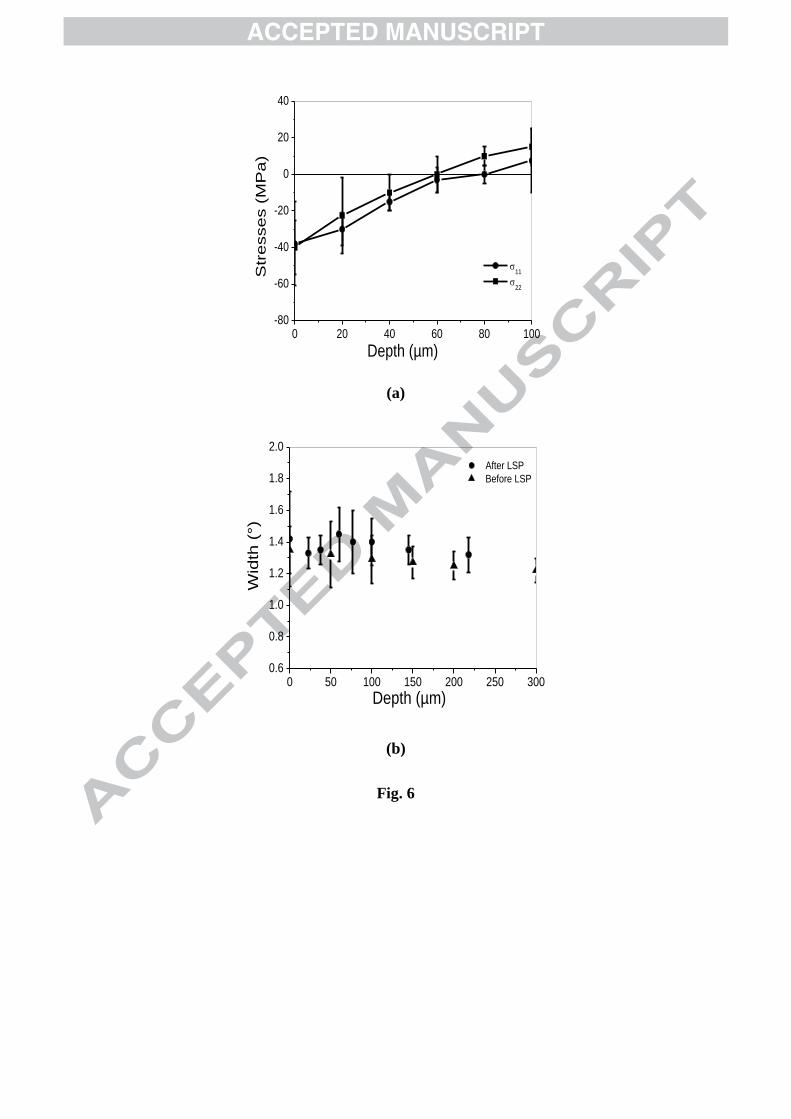
The surface analysis was carried out by
XRD on the surface of the sample before
and after LSP treatment. Before LSP
treatment (Fig. 6a), residual stresses
attributed to mechanical polishing have a low amplitude (-40 MPa), are
homogeneous and isotropic (σ11≈ σ22). In addition, the study of the integral
width of x-ray peaks provides useful information about work-hardening. In
Fig.6b, a small variation of peak width is evidenced after LSP (+5% to 20%), which
confirms the limited work-hardening
induced by LSP on 2050-T8 alloy (Fig. 7)
Vickers Hardness tests were also carried
out at the surface of impacted materials,
with a 25 g load resulting in nearly 20 µm
indent sizes, and 5 µm indented depths.
Results indicate rather similar hardness
variations (+35 %) than x-ray peaks
integral widths, from 1.2 GPa average
value for the as-polished condition, up to
1.6 GPa mean value after LSP treatment.
The scattering observed on Vickers
measurements may be attributed to grain orientations versus shock loading main
direction, that promote or not dislocation formation. Such limited work-hardening
levels are consistent with most of previous works on aluminum alloys after LSP
treatments [14, 21].
4. 3D simulation of the LSP process
4.1. Description of the numerical
model
In most of recent FEM analysis
procedures of LSP [11, 13, 15], two
distinct steps were considered to obtain an
absolutely stable residual stress field: (1) a
dynamic explicit analysis to investigate
5
shock wave propagation and (2) a static
analysis using an implicit algorithm to
calculate residual stress fields. In our case,
a single explicit dynamic calculation was
selected to estimate directly a quasi-
residual stress field, for a large number of
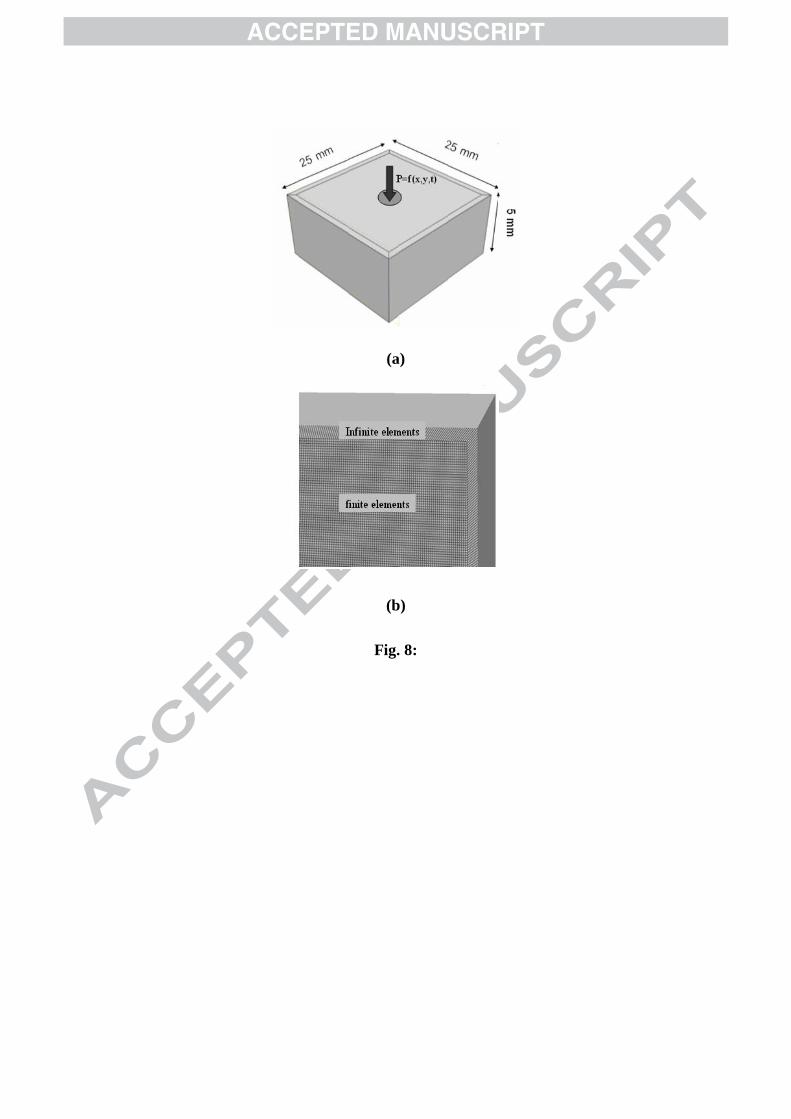
impact loadings. A 3D finite element
model was developed on ABAQUSTM 6.9
Explicit software to simulate the LSP
process, including for each impact shock
propagation and relaxation in a single step.
A schematic of the 3D model is shown in Fig. 8. Infinite elements have been
adopted as non-reflecting boundaries to avoid shock wave reflections on free
surfaces. Up to 2759918 continuum solid hexahedral linear elements were used to
mesh a 25 mm x 25 mm x 5 mm body, resulting, with the use of a BIAS
geometrical function allowing a mesh
refinement, in 100 µm x 100 µm x 10 µm
element sizes near the impacted surface.
The use of very thin elements, allowed
us to consider correctly the stress wave
propagation (at C0 speed) near the surface
for a 20 ns duration pressure pulse.
Before using the numerical description
of laser shocks, a convergence test was
carried out [11] in order to define optimal
integration times for the calculation (by
default, Abaqus Explicit provided us with an integration time of t0=8.6 ns for our
meshing conditions). At least a factor 4 reduction of this time (t0=2 ns) was shown
to provide constant stresses and deformations.
In addition, when simulating several impacts applied at different locations and
times, a minimum time interval between
successive impacts had to be selected to
ensure a quasi-residual stress field. Above
10-5
s time interval, the kinetic energy of
the 3D body was shown to turn to a near-
zero value (Fig.9), thus allowing us to
simulate multiple stabilized impacts. It has
to be mentioned that this time period for
the global calculation of one impact (shock
+ relaxation) appears to be much longer
than the pressure loading duration itself
(200 ns in Fig. 3).
Following this, the in-depth stress
wave attenuation could be checked
accurately (Fig. 10), for different
propagation times ti and positions –z (with
z=D.ti with D=sound velocity).
4.2.Constitutive material’s behaviour
Due to the high strain rate involved during LSP events (near 106 s-1), the
Johnson–Cook stain sensitive plasticity model is classically used for problems
where strain rates vary over a large range. If pε is the equivalent plastic strain, the
Von Mises flow stress, according to the
Johnson–Cook model, is given by:
(((( )))). m
nY p .
melt
T Tεσ= σ Kε C Ln
T Tε
−−−− + + −+ + −+ + −+ + − −−−−
0
00
1 1 (3)
Where σy, K, C, n, and m are material
constants (σy = yield stress, K and n
=work-hardening modulus and coefficient,
C strain rate sensitivity, Tmelt = fusion
temperature …).
For our experimental conditions,
preliminary investigations using fully
coupled thermo-mechanical-elements
DC3D8T confirmed that the thermal
contribution of equation.3 could be
neglected: on a single 4 GPa – 20 ns impact, the local thermal rise due to shock
wave propagation and plastic deformation was less than 40 K, and did not modify
significantly the residual stress field, even with a 100 % inelastic heat fraction.
Consequently, the thermal part of Johnson- Cook’s equation was omitted in our
simulation. Corresponding Johnson-Cook’s
coefficients for 2050-T8 are presented in
Table 4. The C=0.02 value was
experimentally determined by VISAR
measurements of dynamic Yield stress (see
3.2).
6
4.3. Simulation of a single laser impact
The simulation of a unique laser impact
and its validation using experimental data
has nearly never been addressed in the
literature. Our objective was twice: (1)
validating the pressure spatial distribution
P=f(x,y), (2) validating the model by
checking the residual stress field, using a µ
x-ray diffraction technique.
4.3.1. Identification of the spatial
pressure distribution P=f(x,y)
A fortran subroutine was used
(*VDLOAD type) to generate non-uniform spatial and temporal loadings P=f(x,y,t)
and locate precisely impact position. The P=f(x,y) distribution was adjusted to fit
exactly experimental surface deformations
u33=f(x) for a given laser intensity I
(W/cm²). Considering a single 1.5 mm
impact (r0 = 0.75 mm), and a maximum
available impact pressure P=5 GPa, the
best agreement with experimental results
(Fig. 11) was found for a near-spherical
spatial distribution of pressure (equation 4).
The corresponding maximum deformation
u33 induced by a single impact is shown to
be approximately -10 µm. This allowed us
validating the P=f(x,y,t) loading for the
calculation of a large number of laser impacts.
(((( ))))x y
P( x , y ,t ) P tr
++++= −= −= −= −
2 2
0 2
112
(4)
4.3.2. Determination of residual
stresses on a single 1.5 mm impact
In this section, we considered the
pressure dependence of residual stresses
for a single impact, together with an
experimental validation using the micro x-
ray diffraction technique [22], and the
classical 2θ= f(sin²Ψ) method. A 50 µm x-ray collimator was used at ICB-Dijon for
analyzing stress distributions,
corresponding, after beam divergence to a
100 µm XRD spot on the metal.
Simulations indicate an interesting and
important result: the stress drop at the
centre of circular impacts seems to be
promoted by the use of high pressures: a 3
GPa pressure provides less homogeneous
stress field than a 2 GPa pressure (as we
can see in Fig. 12). Indeed, for the case of
3GPa applied pressure, a pronounced stress
singularity appears.
The comparison between experimental and
simulated residual stress values was shown to indicate a 100 MPa overestimation of
residual stress amplitude (-300 MPa versus -200 MPa) using a 2 GPa impact pressure.
Two factors may explain why the experimental to numerical comparison is
not that satisfactory on one impact: (1) the
µXRD patterns are mostly obtained inside
grains on very small diffracting crystallites
that may not be representative for the
global aluminium diffraction constants, (2)
the experimental residual stress field is
overwhelmed by the central stress drop,
which is more pronounced and extended
than numerically predicted.
We analyzed the residual stresses in the
depth (see Fig. 13), we noted that the stress
field heterogeneity is focused to the surface of the material in a depth about 250
µm for P=2 GPa and 675 µm for P=3 GPa. The depth of compressive zone increase
with the applied pressure P. This is due to the plastic flow increasing with respect to
the applied pressure.
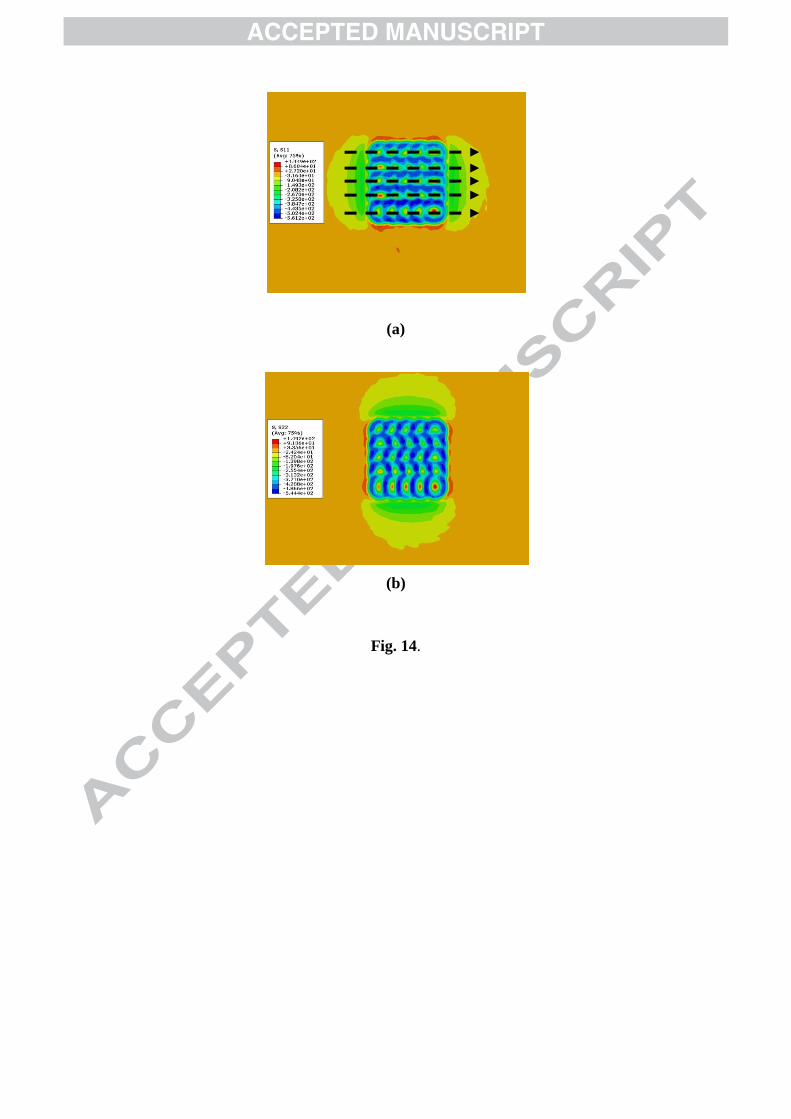
5.4. Simulation of 25 overlapped
impacts
Results of the simulations of 25
impacts on 2050-T8 are presented in Figs
14, 15, 16, for a classical LSP path (50 %
overlap and a continuous line by line y
increment: Fig.3), which corresponds to
the surface finish presented in Fig.3.b.
7
These simulations indicate a strongly
heterogeneous and periodic surface stress
field (Fig.14a and 14b), attributed both to
impact overlaps, and to the stress drops at
the centre of circular impacts.
Approximately 100 to 200 µm thick layers
are affected by this stress heterogeneity.
Below 200 µm in-depth, the stress field
becomes much more homogeneous.
The comparison of simulation with
experience was made using: (1) 2D
profilometry, (2) conventional surface X-ray diffraction (1.5 mm XRD spot), (3) in-
depth XRD diffraction using matter removal.
The experimental and numerical analysis of residual stresses on x and y axis
(with x = main LSP axis: cf Figs.3a and 3b), indicates an anisotropic stress
generation, already investigated
analytically by Hirano et al. [13].
The σ22 stresses (Figs.14b and 16b) are
always higher than σ11 stresses (Figs.14a
and 16a), independently of the initial
rolling direction of the base material. This
result has never been pointed out
experimentally by many authors except by
[23] on aluminium alloys. This result is
globally confirmed by simulations, where
local σ22 values are more compressive than
σ11 values.
The appearances of tensile stress, in red local area as we can see in Fig.14, are
harmful in fatigue. Fortunately, this critical problem is reduced by the overlap and
remains in the boarders of the LSP treated area. So to avoid this harmful problem we
just manage the LSP treated area in such
manner to move away these critical area
from the most mechanically stressed zones.
The comparison between simulated and
experimental surface deformations is
satisfactory (Fig. 15). The periodic
deformation, and its maximum amplitude
u33max is shown to be nearly the same (1.7
mm), even if finer meshes would have
possibly improved numerical data, and
more specifically the shape of peak
curvatures, which are shown to be sharper
on simulations than on experiments.
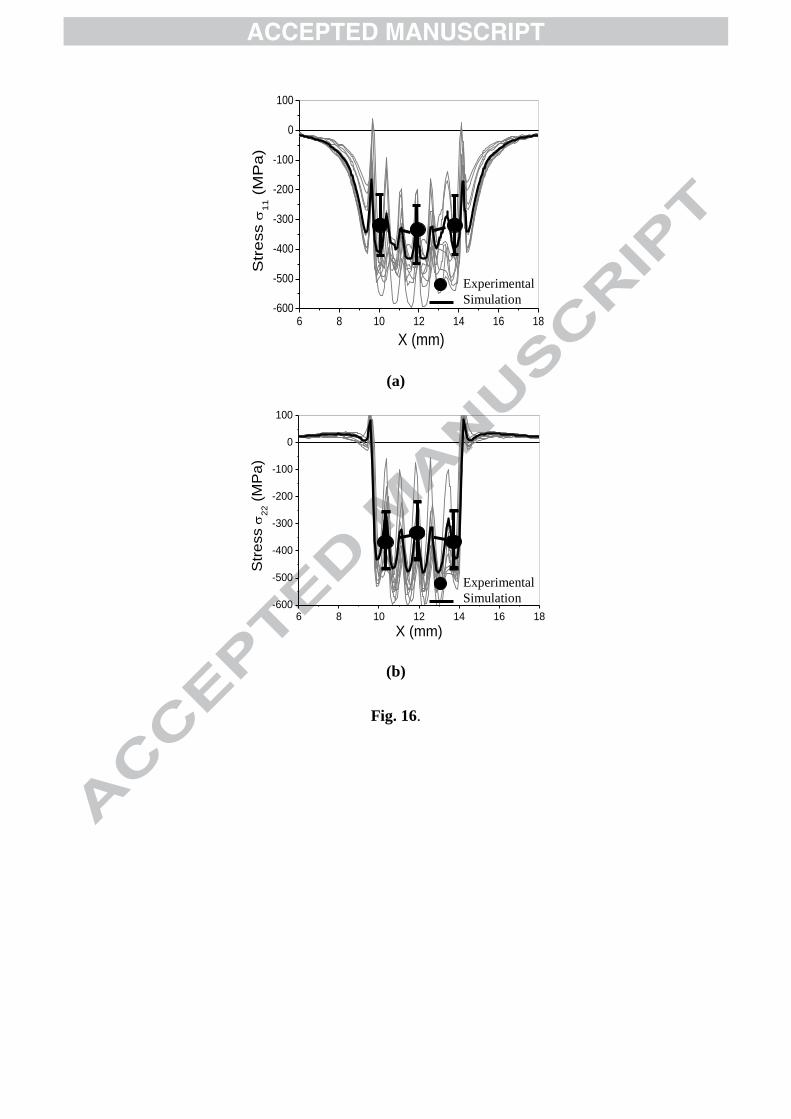
A comparison of numerical simulations
with XRD surface determinations, carried
out with 1.5 mm XRD spot diameters first
requires an averaging of σ11 and σ22
simulated profiles as shown in Fig.14a
(black arrows), to allow comparison at the
same scale. Similarly, in-depth simulated
stresses also correspond to averaged data,
considered using 12 in-depth lines located
inside a 1.5 mm diameter circle.
The corresponding surface averaged
values are shown in Figs. 16a and 16b
(black line) and compared with XRD determinations. For a 4-5 GW/cm² - 50 %
overlap condition, the comparison of σ11
values shows that experimental values (≅ -350 MPa) are found in-between higher and
lower simulated residual stresses values, but are approximately 100 MPa lower in
amplitude than average simulated values
(≅-350 MPa). If we now consider the non-
averaged simulated profiles (in grey lines
on Figs 16a and 16b), the oscillating aspect
of residual stress profile at 50 % overlap
provokes large local stress maximum
gradients (σ11max
–σ11min
/ ∆x), estimated to
0.5 MPa/µm.
The difference between averaged
simulated stresses and measured data is
nearly the same for σ22 values, but with even more pronounced simulated stress
gradients near 1.4 MPa/µm. Such sharp residual stress gradients, that would
necessitate to be confirmed by micro-x-ray
diffraction tests (but with extremely long
acquisition time), would play an active role
on surface reactivity in electrochemical
environment, by the formation of local
galvanic coupling phenomena [24].
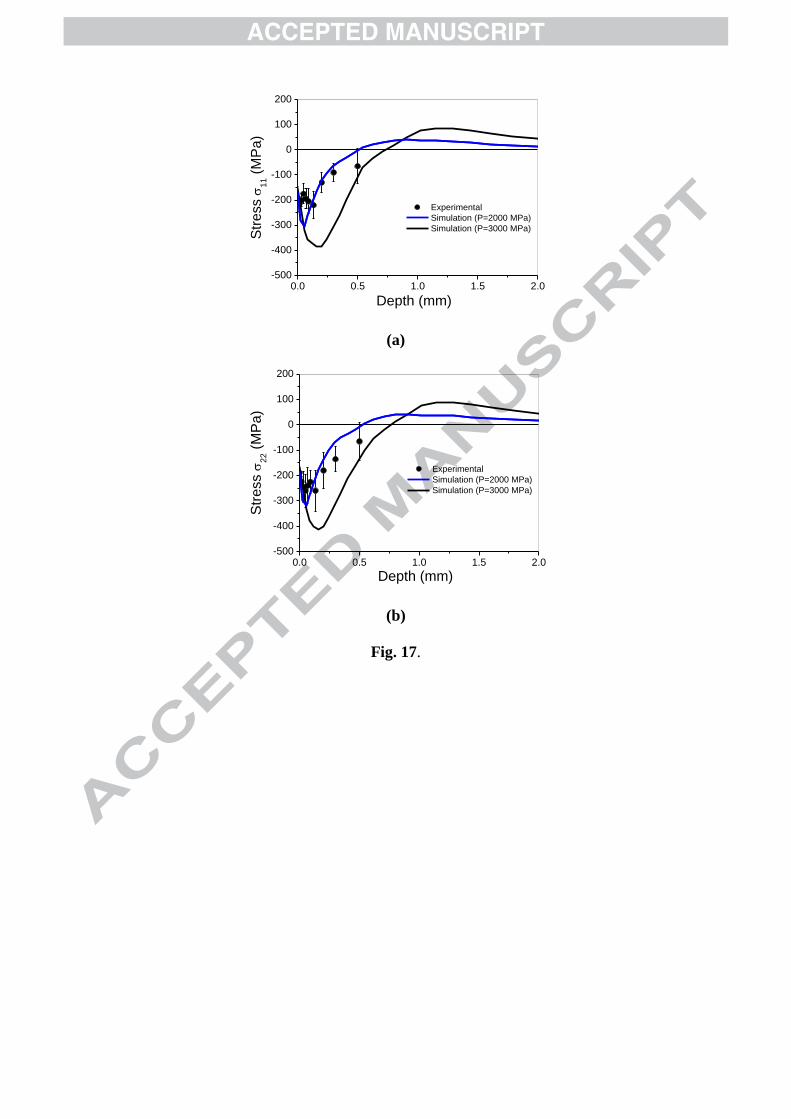
In-depth comparisons (Fig.17), using averaged profiles, indicate a rather good
correlation for impact pressures ranging between 2 GPa (3 GW/cm²) and 3 GPa (5
GW/cm²) as shown in Figs 16a and 16b.
They also indicate that anisotropy effects
(σ22–σ11) are mostly superficial and seem
8
to be restricted to the first 0.1-0.2 mm in
depth.
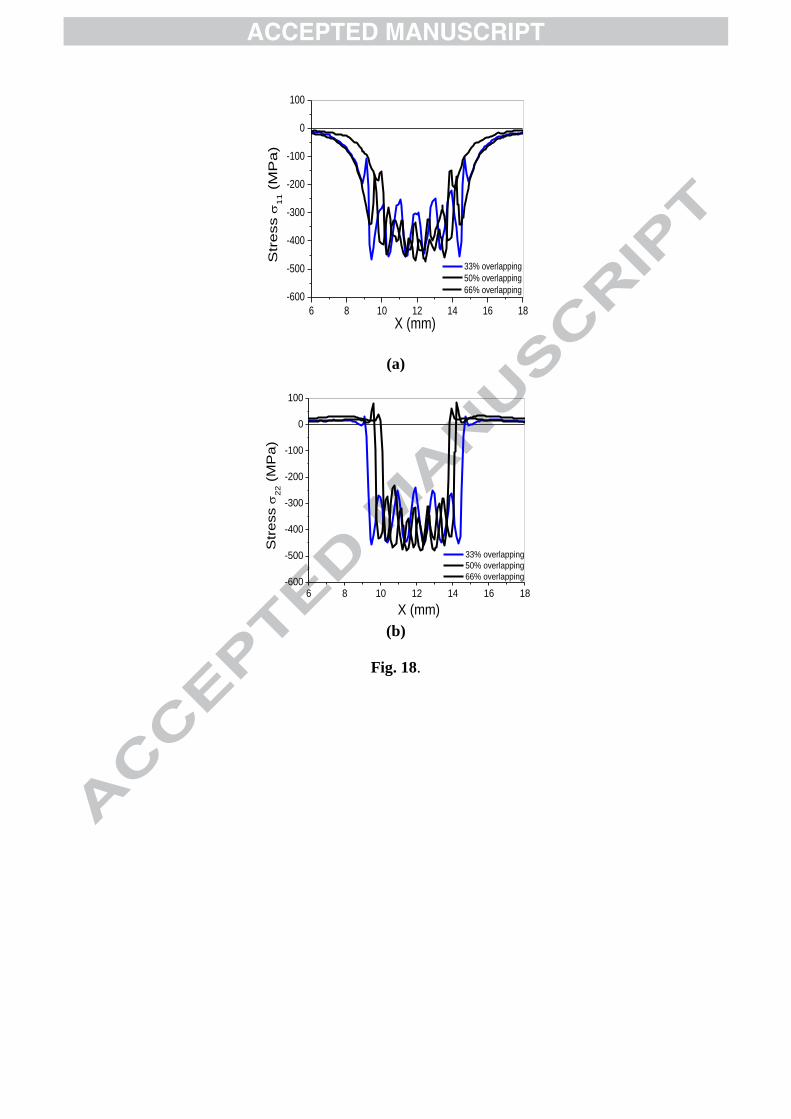
5.5 Influence of percentage overlap
If we now check the influence of different
percentage overlaps (A %), ranging
between 33 % and 66 %, on the surface
stress field, we can make the following
remarks :
(1) The average surface stress tends to
increase with A %: -340 MPa to -410 MPa for σ11, and -350 to -420 MPa for σ22.
(2) Increasing the percentage overlap rate A % (from 33 % overlap to 66 % overlap)
tends to reduce surface stress gradients (Fig. 18), and therefore favours surface
stress homogeneity by smoothing the residual surface stress field. This is shown
on average values in Fig.18, but is even
more pronounced considering maximum
stress gradients from local simulated
stresses (Table 5).
The geometrical effect of stress
concentration, which must be calculated
with the depth of the indentations and the
curvature radius. With LSP, this effect s is
significantly lower than the curvature
radius induced by shot peening.
5. Influence of different LSP strategies
Compared with a classical shot-peening treatment where beads randomly
impact surfaces, laser-shock peening allows programming not only the precise
position of each impact, but also the global -and possibly complex- time sequence of a
large number of impact loadings. In turn,
LSP can be considered as a deterministic
mechanical surface treatment, where
impact chronology relative to each other is
expected to play a significant role on local
stress amplitudes and gradients.
To confirm this assumption, another
LSP path (or strategy) was tested (Fig.19)
where LSP treatment is not geometrically
continuous, and where LSP lines are
progressively fulfilling a free space, from
two external lines, but with a similar 50 %
percentage overlap. The resulting
chronology of impacts is different.
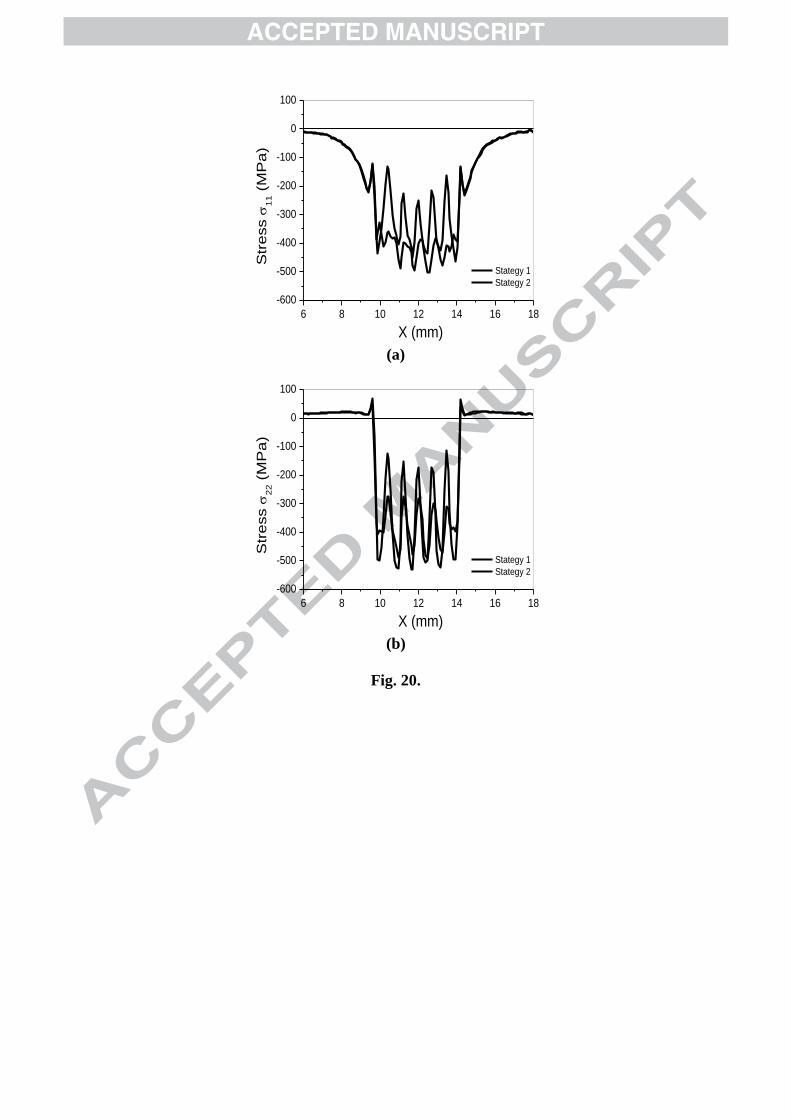
Simulation results indicate clearly that
such a change of LSP path does not modify
the global shape of residual stress field in
itself, but affects significantly local stress
amplitudes and gradients. On specific areas,
the 2nd strategy generates lower stress
amplitudes (Fig.20) than the classical
configuration. Consequently, these
preliminary results confirm that impact chronology, and more widely, the LSP
strategy can be considered as a non-negligible contributor to RS generation.
6. Discussion A 3-D model has been proposed for
simulating residual stresses induced by
LSP, with a particular focus on several
aspects:
- The use of experimental validations for
impact loading, shock yield stress, and
the XRD measurement of residual
stresses induced either by one single
impact, or by a large number of impact
overlaps;
- The FEM analysis of surface stress
distribution, and surface stress
gradients, which has never been
extensively considered in the past. The critical point to address concerning
this model came from the XRD validation of numerical simulations which provided
us with integrated values whereas simulations calculated local stresses. To
overcome this issue, we considered averaged simulation values to be compared
with XRD data, and this allowed us to
globally validate the complex and
heterogeneous residual stress field induced
by LSP.
An attractive solution would have
certainly been to make residual stress
mappings using the micro-diffraction
technique (0.1 mm spot), that we used for
analyzing one single impact. However, this
technique is extremely time consuming and
9
a global mapping of a large number of
impacts would have been impossible.
To obtain better experimental data on
residual stress local gradients, future
prospects should certainly use materials
with small grains, allowing using smaller
XRD collimators.
A last point to be mentioned is the
precise knowledge of LSP conditions: the
estimation of impact pressures was made
using an empirical model where pressure
can be directly calculated from the laser intensity value I (GW/cm²). This
necessitates a precise determination of impact diameter which is not that obvious
when impacts are small (1-2 mm). Indeed, laser spot diameter is somewhat different
(smaller) than impact diameter, due to lateral expansion of the plasma. In turn, a
1.5 mm diameter impact can be due to a
1.2 mm laser spot. This could explain why
laser intensities I (GW/cm²) presented in
this paper include a significant error bar,
because of an approximately 10-20 %
incertitude on impact diameter.
The anisotropy effect, predicted
analytically [16], and evidenced on 2050-
T8 alloy (and previously on another Al
alloy: 6056-T4 [25]), seems to be rather
specific to aluminium alloys, but should be
investigated more widely to understand the
singularity of such materials versus LSP treatment.
Last, numerical results indicate severe surface stress gradients due to impact
overlaps which could play a significant role on surface reactivity by generating
galvanic coupling between low and high amplitude local stress areas. The validation
of such a heterogeneous surface stress field
should require further experiments on
materials with much smaller grains
allowing determining more local stresses
with smaller XRD collimators (0.5 mm).
The use of microdiffraction, possible
on a single impact (each measurement
takes approximately 2 hours x-ray counting
time on each direction), cannot be
envisaged for characterizing a large peened
surface.
7. Conclusions
A 3D numerical model for laser shock
processing has been proposed, and
validated experimentally on 2050-T8 al
alloy. A tendency to residual stress
anisotropy, and large surface stress
gradients were shown to be the main
factors describing LSP-induced residual
stress fields. Future prospects should
consider materials with small grains to improve experimental versus calculation
comparisons.
Acknowledgements
Part of this work has been supported by
french ANR in the frame work of
CAPSUL project
(http://capsul.gerailp.fr/tiki/tiki-index.php).
References
[1] Fabbro R, Fournier J, Ballard P,
Devaux D and Virmont. J Physical Study
of laser Produced Plasma in Confined
Geometry , J. Appl. Phys, 1990, 68 775-
784.
[2] Clauer A H, Holbook J H and Fairand B P. Shock waves and high-strain-
rate phenomena in metals, Concepts and Appl., (Plenum New York), 1981, 675-702
[3] Peyre P, Berthe L, Fabbro R and A. Sollier. Experimental determination by
PVDF and EMV techniques of shock waves induced by 0.6 to 3 ns laser pulses
in confined regime with water J.Phys.D:
Applied Physics, 2000, 33 498-503. [4] Mannava S, McDaniel AE and
Cowie WD, General Electric Company
(Cincinnati, OH), US Patent; 1996; 5,492,447.
[5] Mannava S, McDaniel AE and
Cowie WD, General Electric Company (Cincinnati, OH), US Patent, 1997,
5,591,009.
[6] Casarcia DA, Cowie WD and Mannava S, (Cincinnati OH), General
10
Electric Company, US Patent, 1996,
5,584,586.
[7] Sano Y, Kimura M, Sato K, Obata M and Sudo A. Development and
Application of Laser Peening System to
Prevent Stress Corrosion Cracking of
Reactor Core Shroud Proceedings of the 8th
International Conference on Nuclear
Engineering (ICONE-8) (Baltimore, USA),
2000.
[8] Azer M and Scheidt D. on the
Applications of Lasers and Electro Optics
Proceedings of Icaleo’2004 (San Francisco,
USA), 2004.
[9] Ballard P. Contraintes résiduelles induites par impact rapide Application au
choc laser PhD thesis Ecole Polytechnique (France), 1991.
[10] Braisted W and Brockman R. Finite element simulation of laser shock peening
International Journal of Fatigue, 1999, 21 719–724.
[11] Ding K and Ye L. Three-dimensional dynamic finite element analysis of multiple
laser shock peening processes Surface
Engineering, 2003, 19 351–358. [12] Peyre P, Sollier A, Berthe L,
Bartnicki E, Fabbro R, I. Chaieb and Braham C 2003 FEM simulation of
residual stresses induced by laser Peening, EPJ Applied Physics 23 83–88.
[13] Zhang W, Yao Y L and Noyan I C. Microscale laser shock peening of thin
films, Part 1: experiment, modeling and
simulation Journal of Manufacturing
Science and Engineering Transactions of
the ASME, 2004. 126 10–17.
[14] Ocana J L, Morales M and
Molpeceres C Experimental assessment of
the influence of irradiation parameters on
surface deformation and residual stresses
in laser shock processed metallic alloys
Applied Surface Science, 2004, 238 501-
505.
[15] Hu Y, Yao Z and Hu J. 3-D FEM
simulation of laser shock processing Surface and Coatings Technology, 2006,
201 1426–1435. [16] Hirano K, Sugihashi A, Imai H and
Hamada N. Mecanism of Anisotropic
Stress Generation in Laser Peening
Processs, Proceedings of Icaleo’2006
conference (Miami, USA), 2006.
[17] Peyre P, Rouleau B, Song H, Vignal
V, Amar H and Baudin T. Characterization
of the mechano-electrochemical behavior
of a laser –shock peened 2050-T8
aluminum alloy at global and local scales
2nd
International conference on Laser
Peening, 2010.
[18] Berthe L, Fabbro R, Peyre P, Tollier
L and Bartnicki E. Shock waves from a water-confined laser-generated plasma J.
Appl Phys , 1997, 82 3550-3558 [19] Peyre P, Berthe L, Scherpereel X.
and Fabbro R. Laser Shock Processing of Aluminium Coated 55C1 Steel in Water
Confinement Regime, Characterization and Application to high Cycle Fatigue
Behaviour, J. of Mat Science, 1998, 33
1421-1429
[20] Barker L M and R E Hollenbach.
Laser interferometer for measuring high
velocities of any reflecting surface J. Appl
Phys, 1972, 43 4669-4678.
[21] Peyre P, Fabroo R and Merrien H B.
Laser Shock Processing of Aluminium
Alloys Application to Cycle Fatigue
Behaviour, Mat. Sci and Eng, 1996, A210
102-113.
[22] Vukelic S, Wang Y, Kysar J W and
Yao Y L. Comparative study of symmetric and asymmetric deformation on Al single
crystal using micro-scale shock-peening Journal of Mechanics of Materials and
structures, 2008, 4 89-105 [23] Ocaña J L, Morales M, Porro J A,
Molpeceres C, Blasco M, Guarneros O, Gonzalo L, Gómez-Rosas G and Rubio-
González C. Residual Stress Fields and
Associated Modification of Surface
Properties in Al and Ti Alloys Induced by
Q-switched, ns Pulse, Laser Shock
Processing 1st International conference on
Laser Peening (Houston, USA), 2008.
[24] Amar H, Vignal V, Kraweic H,
Heintz O, Josse C and Peyre P. Influence
of a laser –shock processing (LSP)
treatment on the microelectrochemical

11
behavior of AA2050-T8, Corrosion
Science, 53, 3215–3221, 2011.
[25] Song HB. Analyse expérimentale et
numérique de la distribution des
contraintes résiduelles induites par choc-
laser dans des alliages d’aluminium PHD
thesis in PIMM Arts et Métiers Paris-Tech
PARIS, France, 2010.
Finite Element analysis of Laser Shock Peening of
2050-T8 aluminum alloy
Tables
Table 1.
Mechanical properties of AA2050-T8 material.
Properties Value Unit
Density, 2750 Kg m-3
Elastic modulus, E 72 GPa
Static Yield Stress Y 0.51 GPa
Poisson’s ratio, 0.33
Bulk sound velocity
C0
5386 ms-1
s 1.339
2
s is the constant of the material and is the coefficient of Grüneisen [4,5, 25].

Table 2
Diffraction condition using Set-X diffractometer.
Cr anode k=0.229 nm
Filter V
Collimator 1.5 mm
Plans {hkl} {311}
Number of angles 15
Oscillations of +/-5
Acquisition time (s) 100 s

Table 3. Diffraction condition using Brucker difractometer.
Cu anode k=1.709 nm
Filter V
Collimator 0.5 µm
Plans {hkl} {311}
Number of angles 22
Oscillations of +/-5
Acquisition time (s) 100 s

Table 4. Johnson-Cook’s coefficients for 2050-T8.
yσ MPa 510
K MPa 200
n 0.45
C 0.02
0.01

Table 5 Influence of percentage overlaps A% on the maximum local surface stress gradients.
(11max
–11min
) / x
A=33 % 0.7 MPa/µm
A=50 % 0.5 MPa/µm
A=66 % 0.25 MPa/µm
Finite Element analysis of Laser Shock Peening of
2050-T8 aluminum alloy
Figures
Fig.1.
(a)
(b)
Fig.2.
(a)
(b)
Fig.3.
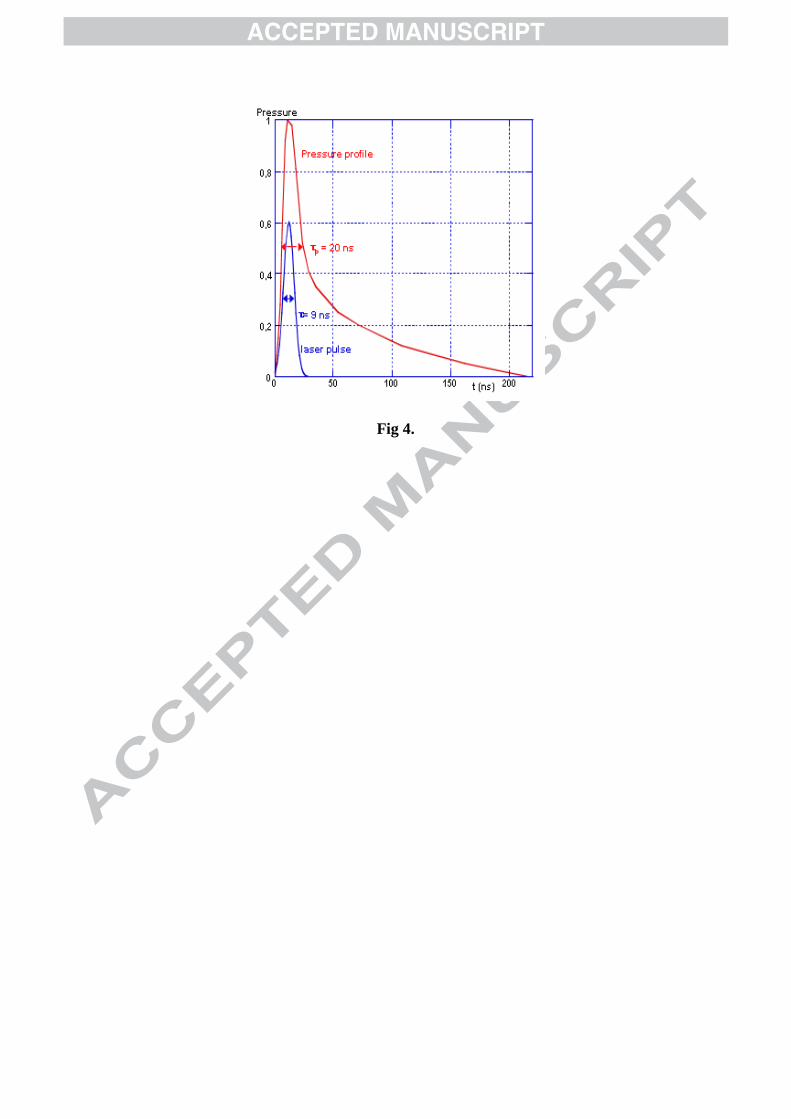
Fig 4.
-50
0
50
100
150
200
250
300
350
40 80 120 160 200 240 280
ABAQUS
VISAR
Free surface velocity UF (m/s)
t(ns)
elastic
precursor
170 m/s
Fig.5.
(a)
(b)
Fig. 6
0 20 40 60 80 100-80
-60
-40
-20
0
20
40
Str
esses (
MP
a)
Depth (µm)
11
22
0 50 100 150 200 250 3000.6
0.8
1.0
1.2
1.4
1.6
1.8
2.0
Wid
th (
°)
Depth (µm)
After LSP
Before LSP
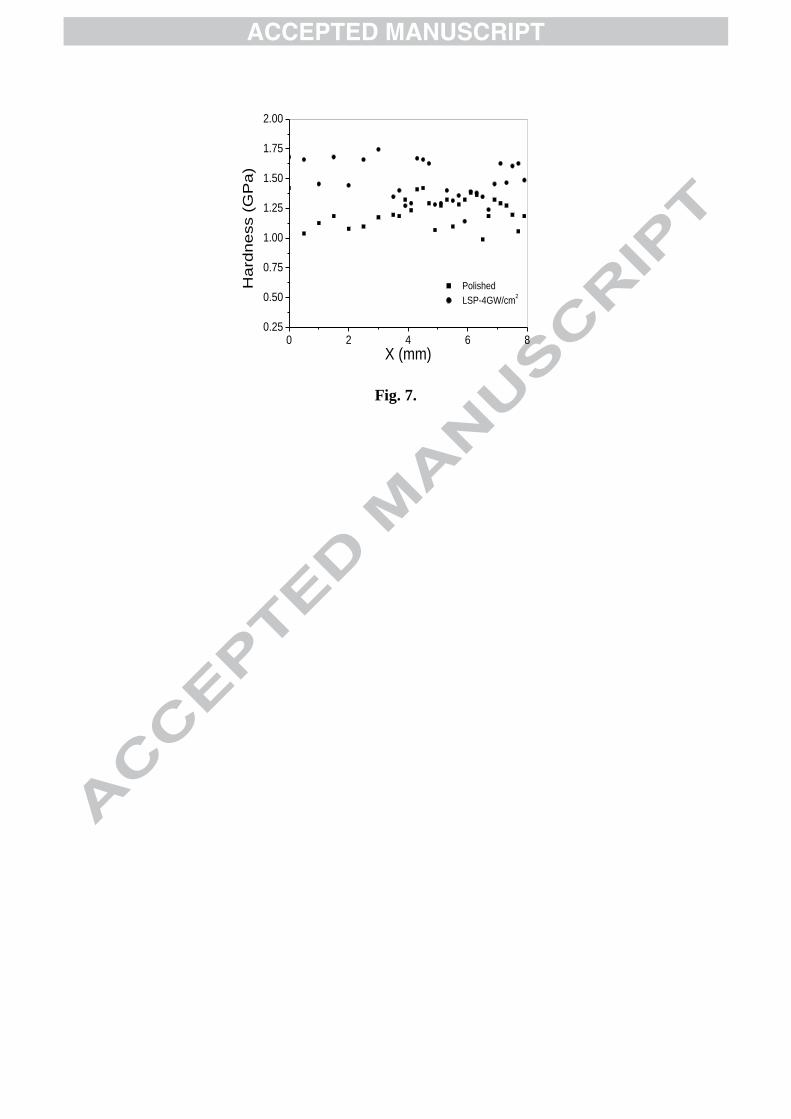
Fig. 7.
0 2 4 6 80.25
0.50
0.75
1.00
1.25
1.50
1.75
2.00
Ha
rdn
ess (
GP
a)
X (mm)
Polished
LSP-4GW/cm2
(a)
(b)
Fig. 8:
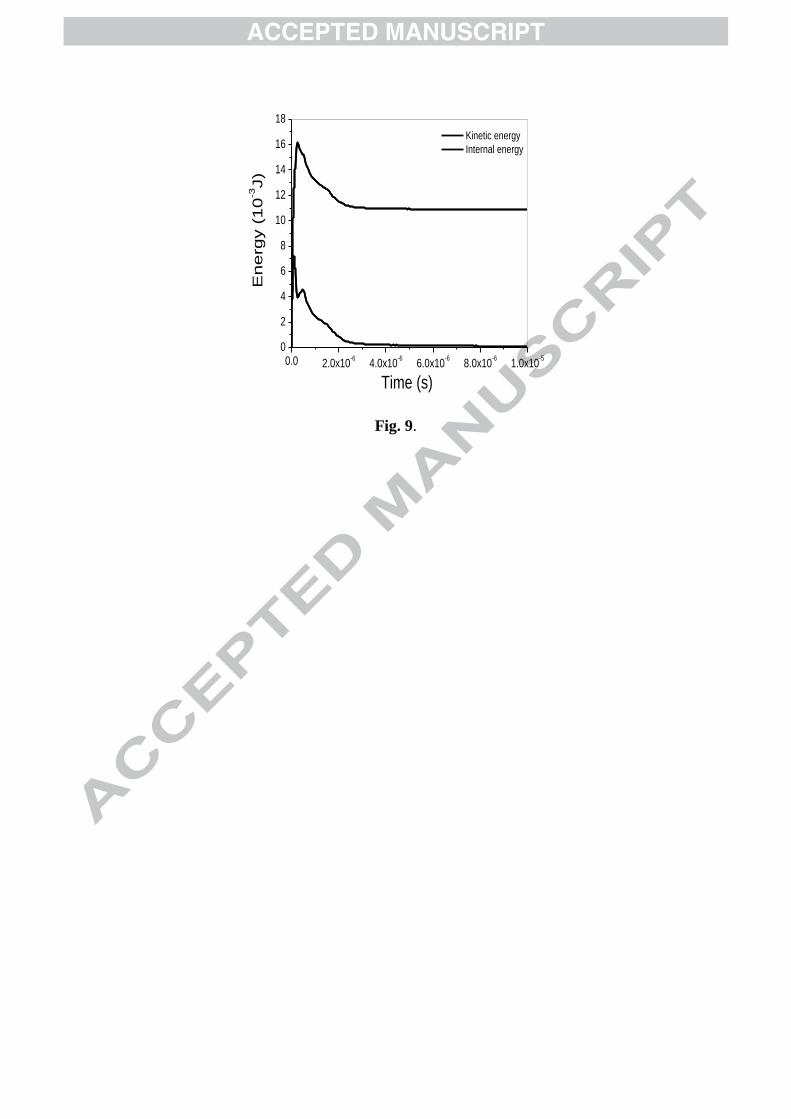
Fig. 9.
0.0 2.0x10⁻⁶
4.0x10⁻⁶
6.0x10⁻⁶
8.0x10⁻⁶
1.0x10⁻⁵
0
2
4
6
8
10
12
14
16
18
En
erg
y (
10
-3J)
Time (s)
Kinetic energy
Internal energy
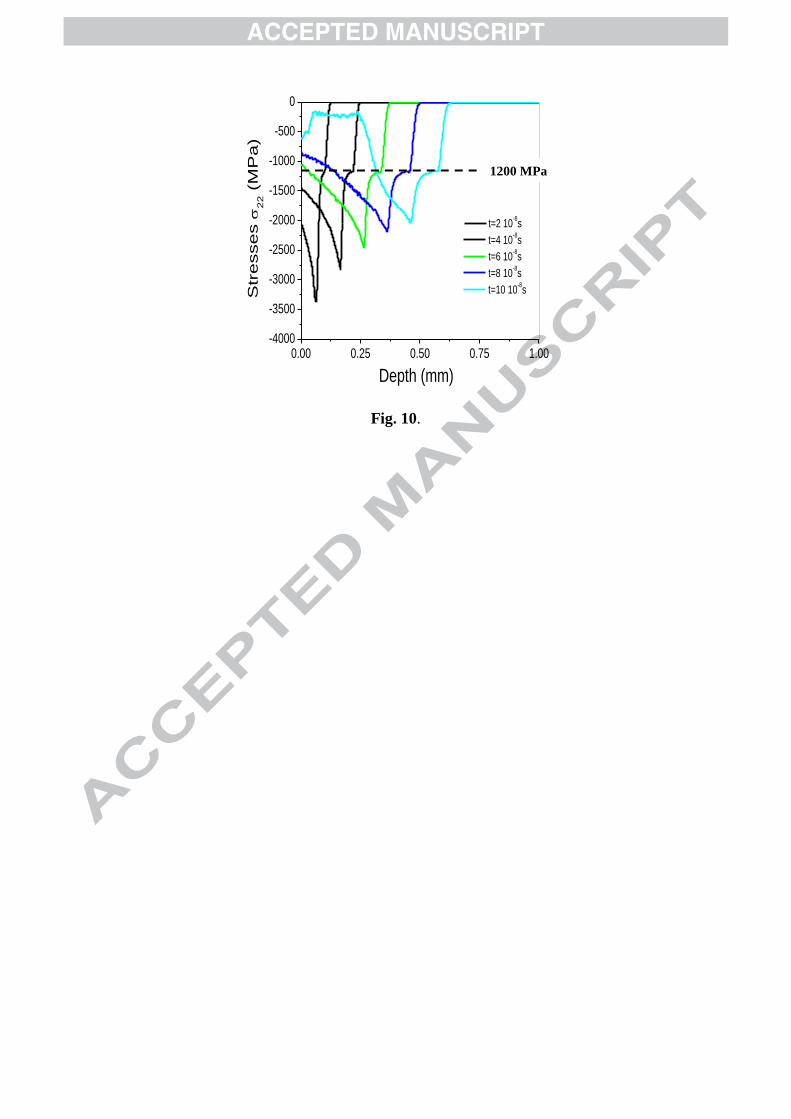
Fig. 10.
0.00 0.25 0.50 0.75 1.00-4000
-3500
-3000
-2500
-2000
-1500
-1000
-500
0
Str
esses
22 (
MP
a)
Depth (mm)
t=2 10-8s
t=4 10-8s
t=6 10-8s
t=8 10-8s
t=10 10-8s
1200 MPa
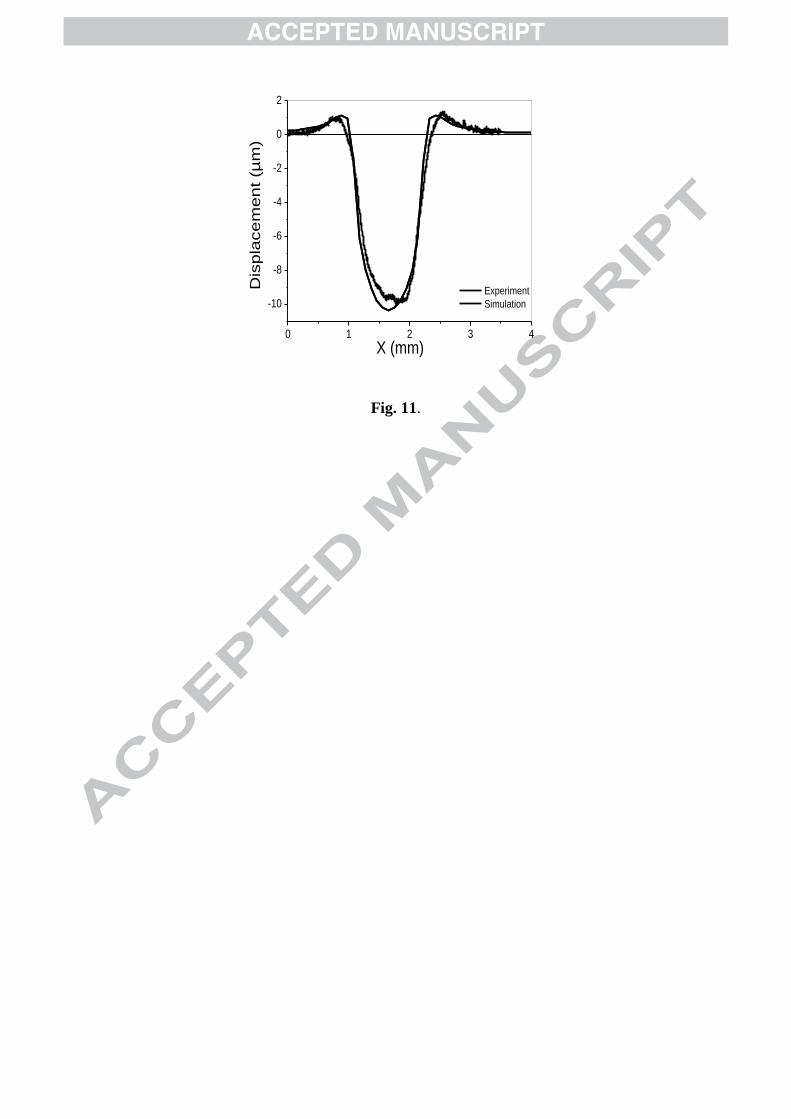
Fig. 11.
0 1 2 3 4
-10
-8
-6
-4
-2
0
2
Dis
pla
ce
me
nt
(µm
)
X (mm)
Experiment
Simulation
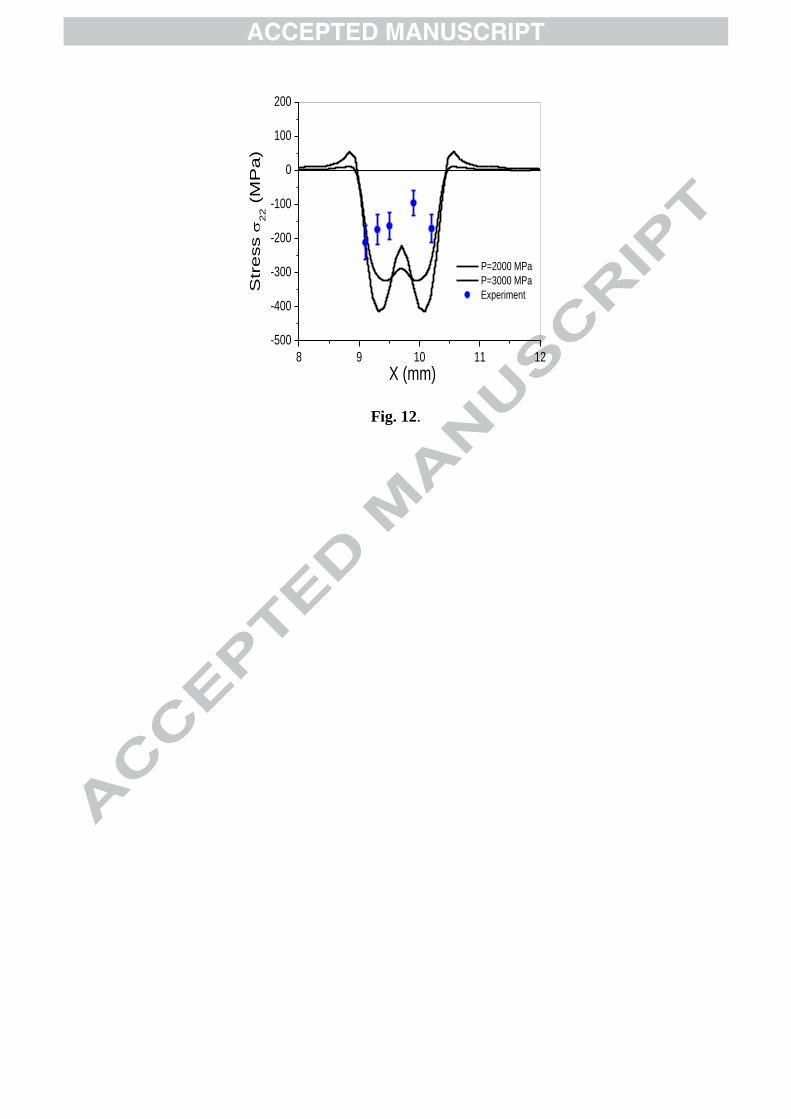
Fig. 12.
8 9 10 11 12
-500
-400
-300
-200
-100
0
100
200
Str
ess
22 (
MP
a)
X (mm)
P=2000 MPa
P=3000 MPa
Experiment
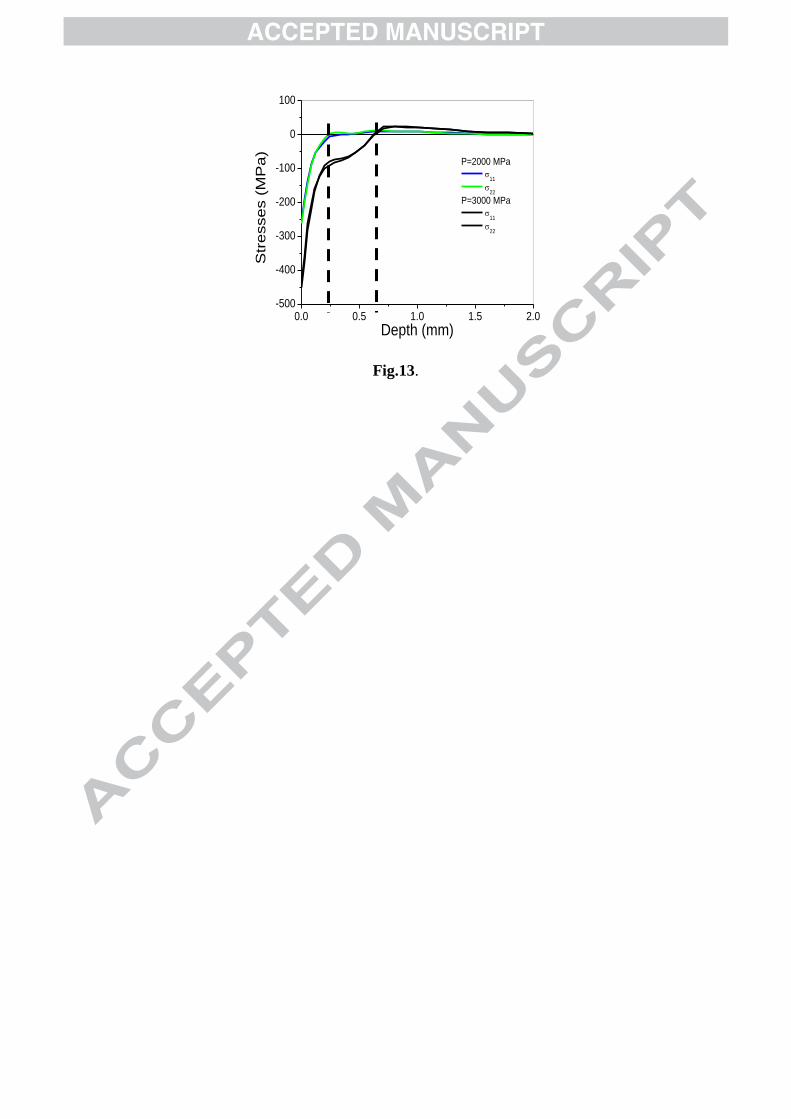
Fig.13.
0.0 0.5 1.0 1.5 2.0-500
-400
-300
-200
-100
0
100
Str
esse
s (
MP
a)
Depth (mm)
P=2000 MPa
11
22
P=3000 MPa
11
22
(a)
(b)
Fig. 14.
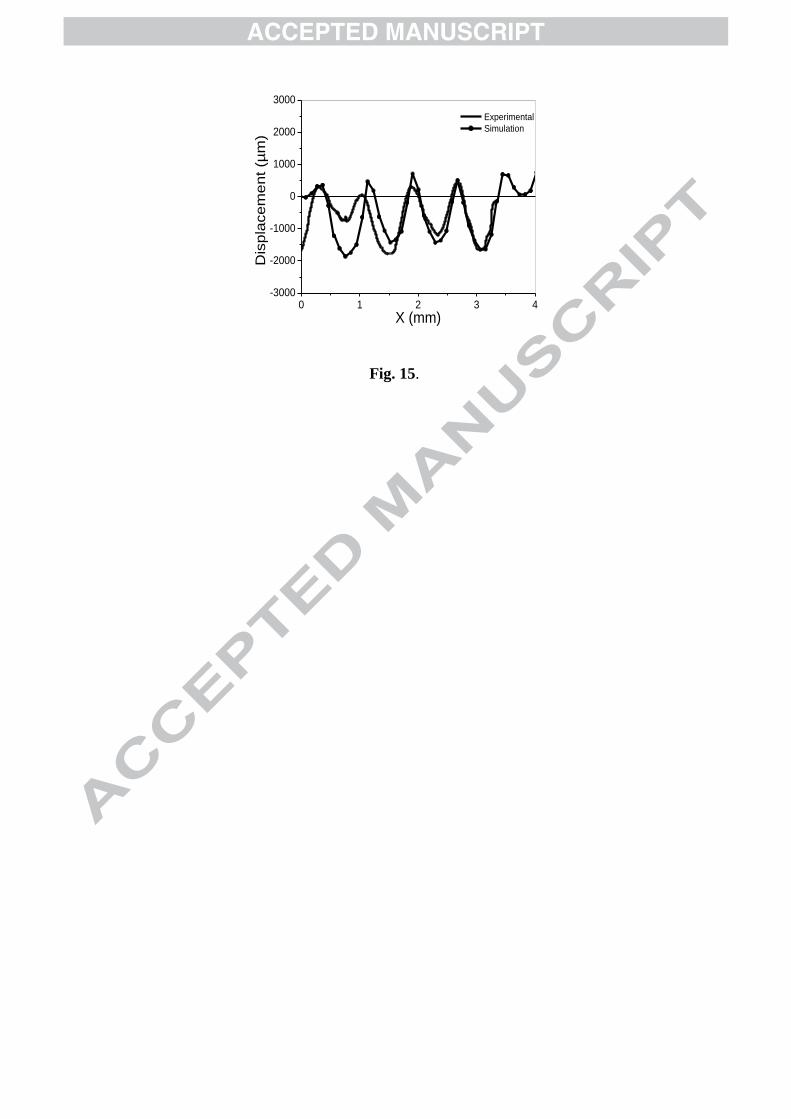
Fig. 15.
0 1 2 3 4-3000
-2000
-1000
0
1000
2000
3000
Dis
pla
ce
me
nt
(µm
)
X (mm)
Experimental
Simulation
(a)
(b)
Fig. 16.
6 8 10 12 14 16 18-600
-500
-400
-300
-200
-100
0
100
Str
ess
11 (
MP
a)
X (mm)
6 8 10 12 14 16 18-600
-500
-400
-300
-200
-100
0
100
Str
ess
22 (
MP
a)
X (mm)
Experimental
Simulation
Experimental
Simulation
(a)
(b)
Fig. 17.
0.0 0.5 1.0 1.5 2.0-500
-400
-300
-200
-100
0
100
200
Str
ess
11 (
MP
a)
Depth (mm)
Experimental
Simulation (P=2000 MPa)
Simulation (P=3000 MPa)
0.0 0.5 1.0 1.5 2.0-500
-400
-300
-200
-100
0
100
200
Str
ess
22 (
MP
a)
Depth (mm)
Experimental
Simulation (P=2000 MPa)
Simulation (P=3000 MPa)
(a)
(b)
Fig. 18.
6 8 10 12 14 16 18
-600
-500
-400
-300
-200
-100
0
100
33% overlapping
50% overlapping
66% overlapping
Str
ess
11 (
MP
a)
X (mm)
6 8 10 12 14 16 18-600
-500
-400
-300
-200
-100
0
100
33% overlapping
50% overlapping
66% overlapping
Str
ess
22 (
MP
a)
X (mm)

Fig. 19.
1
2
3
4
5
(a)
(b)
Fig. 20.
6 8 10 12 14 16 18
-600
-500
-400
-300
-200
-100
0
100
Stategy 1
Stategy 2
Str
ess
11 (
MP
a)
X (mm)
6 8 10 12 14 16 18
-600
-500
-400
-300
-200
-100
0
100
Stategy 1
Stategy 2
Str
ess
22 (
MP
a)
X (mm)
Figures Captions
Fig1. Laser peening process.
Fig.2. (a) the overlapping laser shock processing, (b) LSP treatment with 50 % overlapping
rate.
Fig.3. Surface topography after - (a) a 33 % overlap LSP, (b) a 50 % overlap LSP (1.5 mm
spot diameters, 5 GW/cm² power density).
Fig 4. Normalized pressure pulse induced by a 8-10 ns laser pulse (resulting in a 20 ns width
at half maximum) used in ABAQUS.
Fig.5. Determination of the elastic precursor (inflexion at 170 m/s) and shock yield stress
using back free velocity UF measurements on a 430 µm-thick 2050-T8 foil (I=5.5 GW/cm²,
surface pressure=3.8 GPa)-Comparison with Abaqus simulation.
Fig. 6. (a) initial residual stresses of AA2050-T8, σ11 (rolling direction) and σ22 (transverse
direction), (b) Influence of LSP on the integral widths of x-ray peaks (5 GW/cm² - 50 %
overlap).
Fig. 7. Vickers Hardness distribution after LSP treatment (5 GW/cm² - 50 % overlap).
Fig. 8: (a) the 3D model, (b) Detailed view of finite and infinite elements.
Fig. 9. Kinetic and internal energy from 10-5
s.
Fig. 10 Stress wave propagation for a P= 3 GPa incident pressure corresponding to =3.5
GW/cm².
Fig. 11. Comparison between experimental and simulated single laser impact: 1.5 mm – 8
GW/cm² impact (5 GPa) simulation with a spherical P=f(x,y) distribution.
Fig. 12. FEM simulation of residual stresses induced by a 1.5 mm impact for 2 and 3 GPa.
Comparison with µXRD measurements carried out on a single 3.5 GW/cm² impact.
Fig.13. FEM simulation of in depth residual stresses by 1.5 mm impact at 2 and 3 GPa
(simulations considered at r0/2).
Fig. 14. FEM simulation of residual stresses by 1.5 mm impacts at 3 GPa (3.5 GW/cm2),
overlapping 50% (a) σ11, (b) σ22.
Fig. 15. Experimental versus simulated surface deformation u33 induced by 25 laser impacts
(1.5 mm – 3.5 GW/cm² - 50 % overlap) - simulation with a spherical P=f(x,y) distribution and
P=3 GPa maximum pressure.
Fig. 16. XRD experiments vs simulations, 25 impacts, d= 1.5 mm at P=3 GPa, overlapping
50%) (a) σ11, (b) σ22.

Fig. 17. Influence of impact pressure on in-depth residual stress profile (d= 1.5 mm, 50%
overlap) (a) σ11, (b) σ22 (simulation results are averaged values using 12 in-depth profiles
considered inside a 1.5 mm diameter circular area similar to XRD spot).
Fig. 18. Influence of percentage overlap (33%, 50% and 66%) on the surface stress
distribution: (a) σ11, (b) σ22.
Fig. 19. Surface treatment with a non-continuous LSP path.
Fig. 20. Effect of LSP strategies on FEM simulation of average residual stresses (25 impacts,
d=1.5 mm, P= 3 GPa, 50 % overlap), (a) σ11, (b) σ22.


