Embed Size (px)
Citation preview

ARTICLE IN PRESS
Journal of Financial Economics 76 (2005) 369–399
0304-405X/$
doi:10.1016/j
$We appr
Klaus Fische
of this paper
helped impro
Laval, Memo
APFA/PACA
Association M
Development
indebted to
research assis
of the Social�Correspo
E-mail ad
www.elsevier.com/locate/econbase
Postprivatization corporate governance:The role of ownership structure and
investor protection$
Narjess Boubakria,�, Jean-Claude Cosseta, Omrane Guedhamib
aHEC Montreal, 3000 Cote-Sainte-Catherine, Montreal, Quebec, Canada H3T 2A7bFaculty of Business Administration, Memorial University of Newfoundland ,
St. John’s, Newfoundland, Canada A1B 3X5
Received 11 April 2003; accepted 17 May 2004
Available online 29 December 2004
Abstract
We investigate the role of ownership structure and investor protection in postprivatization
corporate governance. Using a sample of 209 privatized firms from 39 countries over the
period 1980 to 2001, we find that the government relinquishes control over time to the benefit
of local institutions, individuals, and foreign investors, and that private ownership tends to
- see front matter r 2004 Elsevier B.V. All rights reserved.
.jfineco.2004.05.003
eciate helpful comments and suggestions from Kodjovi Assoe, Martin Boyer, Sylvain Dessy,
r, Nandini Gupta, Anton Miglo, Oumar Sy, and Desire Vencatachellum on previous versions
. Special thanks to Bill Schwert (the editor), and an anonymous referee who considerably
ve the paper. We also received valuable comments from seminar participants at Universite
rial University of Newfoundland, University of Ottawa, University of Regina, the 2002
P/Financial Management Association Conference in Tokyo, the 2002 Northern Finance
eeting in Banff, the Conference on Privatization, Corporate Governance, and Stock Market
in Milan, and the 2002 Financial Management Association Meeting in San Antonio. We are
Mouafek Abada, Martin Desrochers, Souheil Hassine, and Meissa N’Dir for excellent
tance. All errors remain our responsibility. We gratefully acknowledge the financial support
Sciences and Humanities Research Council of Canada.
nding author. Tel.: +1 514 340 5648; fax: +1 514 340 5632.
dress: [email protected] (N. Boubakri).

ARTICLE IN PRESS
N. Boubakri et al. / Journal of Financial Economics 76 (2005) 369–399370
concentrate over time. Firm size, growth, and industry affiliation, privatization method, as
well as the level of institutional development and investor protection, explain the cross-firm
differences in ownership concentration. The positive effect of ownership concentration on firm
performance matters more in countries with weak investor protection.
r 2004 Elsevier B.V. All rights reserved.
JEL classifications: G32; G38
Keywords: Corporate governance; Privatization; Performance
1. Introduction
Corporate governance is defined as a response to the agency problems that arisefrom the separation of ownership and control in a corporation. In this paper, weexamine corporate governance within the context of privatization. Privatizationprovides an interesting setting in which to understand corporate governance, becauseit is a discrete event that often leads to a drastic change in the ownership structure.Thus, privatization is a natural experiment allowing us to examine how corporategovernance mechanisms evolve, interact, and affect firm performance (Denis andMcConnell, 2003).
In this study, we investigate the relation between ownership structure, investorprotection, and firm performance. We seek to answer the following questions:(1) What is the ownership structure that results from privatization and how does itevolve thereafter? (2) Does the level of investor protection influence thepostprivatization ownership structure? (3) Does the postprivatization ownershipstructure depend on other factors? (4) How do ownership structure and investorprotection relate to firm performance, and what explains this relation?
This paper addresses these important questions using a multinational sample of209 newly privatized firms headquartered in 25 emerging markets and 14industrialized countries. To our knowledge, our work is the first multinationalstudy that tracks the postprivatization ownership structure and its determinants.1
For several reasons, a multinational sample offers a valuable opportunity to studythe role of ownership and investor protection in postprivatization corporategovernance. First, national legal systems vary markedly across countries. Forexample, many countries suffer from a poor legal environment and a weakenforcement of laws (see, e.g., La Porta et al., 1998; Nellis, 2003). The deficiencies ofthis external governance mechanism offer an interesting opportunity to investigatewhether the ownership structure, an internal governance mechanism, plays animportant role and interacts with the legal system to address the manager/shareholder postprivatization agency problem. Third, governments in most emergingmarkets and industrialized countries undertook large-scale privatization programs in
1See Megginson and Netter (2001), Djankov and Murrell (2002), and Birdsall and Nellis (2002) for
comprehensive surveys of empirical studies on privatization.

ARTICLE IN PRESS
N. Boubakri et al. / Journal of Financial Economics 76 (2005) 369–399 371
the 1990s (Boubakri and Cosset, 1998; D’Souza and Megginson, 1999). With therecent trend towards globalization, documenting and understanding postprivatiza-tion corporate governance around the world takes on particular importance.
We describe the ownership structure that emerges from privatization and examinehow it evolves along two dimensions, the degree of ownership concentration and theidentity of owners. Our findings suggest that following privatization, privateownership tends to concentrate over time. We also show that on average,privatization results in the privatizing government relinquishing control. Thedecrease in the government share of ownership is mostly absorbed by localinstitutions, followed by individuals and foreign investors.
We then investigate the determinants of the postprivatization private ownershipconcentration. Building upon Demsetz and Lehn (1985) and La Porta et al. (1998)(LLSV hereafter), we include firm- and country-level explanatory variables and takeinto account the potential selection effects resulting from the privatization process.Based on panel data, our results show that both sets of explanatory variables areimportant. For example, we find that firm size, sales growth, and industry affiliationas well as investor protection and social and political stability explain the cross-firmdifferences in ownership concentration. We also show that privatizations throughprivate sales result in a more concentrated ownership.
We empirically examine Shleifer and Vishny’s (1997) theoretical claim thatownership concentration is an efficient governance mechanism in countries in whichinvestor protection is weak, and that such concentration therefore leads to anenhancement in firm performance. We find that ownership concentration issignificantly and positively related to postprivatization firm performance. Thiseffect is more (less) pronounced when the level of investor protection is low (high).Our investigation of the association between the identity of owners and firmperformance suggests that performance is higher when employees are involved inownership.
We complement the literature that examines the link between the design ofprivatization programs, postprivatization ownership structure, and investor protec-tion. Megginson et al. (2004) and Bortolotti et al. (2000) show that the choice ofprivatization methods (i.e., public share issues versus private asset sales) varies acrosscountries and is influenced, among other factors, by the national legal environment.Likewise, Dyck and Zingales (2004) show that privatizations are more likely to occurthrough private sales and that ownership is more concentrated in countries in whichprivate benefits of control are greater, i.e., countries with weak legal protection. Ourevidence complements their findings by showing that ownership concentration ishigher in countries in which investor protection is weak. This finding captures thefact that privatization occurs mainly through private sales in these countries.
The paper is organized as follows. Section 2 describes the relation betweeninvestor protection, privatization, and firm performance. Section 3 presents the dataused in the study. Section 4 documents the postprivatization evolution in ownershipstructure and investigates its determinants. Section 5 examines the link between theownership and performance of newly privatized firms. Section 6 summarizes ourfindings.

ARTICLE IN PRESS
N. Boubakri et al. / Journal of Financial Economics 76 (2005) 369–399372
2. Investor protection, privatization, and firm performance
The standard principal-agent problem arises when the owner of the firm (theprincipal) is not the same as the manager that controls the firm (the agent). Thisproblem is often put forward to explain the poor performance of state-owned enterprises (SOEs). In this case, the separation problem involves the public(owner or taxpayers) and bureaucrats (politicians). Shleifer and Vishny (1997)describe this relationship as a situation in which bureaucrats retain concentratedcontrol rights without cash flow rights, where the latter are dispersed among thetaxpayers of the country. In SOEs, the bureaucrats’ main concern is to achieve theirpolitical objectives, objectives which do not necessarily coincide with the profitmaximization objective. Privatization transfers ownership to outside investors, whoplace greater emphasis on profits and efficiency (Boycko et al., 1996; Shleifer andVishny, 1997).
Nevertheless, the ultimate success of privatization depends on the effectivenessof postprivatization corporate governance mechanisms. The literature generallydistinguishes between two types of governance mechanisms, internal and external.Internal mechanisms include, among other things, the ownership structure of thefirm (e.g., large blockholders). External mechanisms include the legal system, andthe labor and takeover markets. Several studies reviewed in Shleifer andVishny (1997) and Denis and McConnell (2003) examine the role of ownershipstructure and investor protection (internal and external mechanisms, respectively) inproviding efficient corporate governance. Unlike developed countries, manyemerging market countries lack an established institutional framework for efficientcorporate governance. Such deficiencies point to the possibility that internalmechanisms may substitute for external mechanisms in providing efficientgovernance.
In this paper, we focus on the role of two key dimensions of the ownershipstructure, the ownership concentration and the identity of owners. First,concentrated private ownership is more likely to ensure the success of privatizationin countries with low investor protection. Large shareholders, whose wealth dependsheavily on firm performance, have more incentives to monitor management andensure that their resources are not diverted. Further, when privatization leads to adiffused ownership structure, the agency costs associated with managerial controlmay increase even when the costs of political control fall (Boycko et al., 1996).
Second, the identity of owners is also likely to influence the performance of newlyprivatized firms (NPFs). For example, foreign investors require high informationdisclosure standards and, for reputational concerns, maintain a strict control ofmanagers’ actions (Dyck, 2001). Institutional investors also exert a high degree ofmonitoring of management activities to ensure superior returns (Boutchkova andMegginson, 2000).
We also examine the relationship between internal (ownership structure) andexternal (investor protection) governance and the subsequent performance of NPFs.To do so, we use a multinational sample of firms diversified across countries andlegal systems.
ARTICLE IN PRESS
N. Boubakri et al. / Journal of Financial Economics 76 (2005) 369–399 373
3. Data and variables
3.1. The sample of privatized firms
To investigate the relation between investor protection, ownership structure, andfirm performance, we use a sample of 209 firms privatized in 25 emerging marketsand 14 industrialized countries over the period 1980 to 2001. Our emerging marketssample countries are either ‘‘major’’ or ‘‘frontier’’ emerging markets (Emerging
Markets Data Base). Our sample does not include firms from the ex-communistcountries for two reasons. First, the traditional law system in these countries is basedon the Soviet law, which has undergone many changes in the transition period(La Porta et al., 2000). Second, the postprivatization ownership structure in thesecountries is mainly in the hands of insiders (managers and employees). Recentreferences on the experience of transition economies include Djankov and Murrell(2002) and Svejnar (2002).
Table 1 shows that the 209 firms are located in different geographical regionsas categorized by the World Bank. For example, 21% are from Africa and theMiddle East, 26% from East and South Asia and the Pacific, 27% from LatinAmerica, and 26% from Europe and Central Asia.2 The diversification acrossgeographic regions is important, because it comprises countries with different legaland institutional environments. As reported in Table 1, 35% of our sample comesfrom common law countries while 65% comes from civil law countries. Thisdiversification across legal origins allows us to examine whether the extent ofinvestor protection helps to explain the cross-firm differences in the postprivatizationownership structure.
Table 1 also shows that the sample is diversified across industries, with 30% inthe financial sector, 25% in the energy sector, and 9% in utilities. Furthermore, 80%of the privatizations occurred in the 1990s (including 2000 and 2001), compared to20% in the 1980s. These figures are largely drawn by the recent trend towards large-scale privatizations in emerging markets. Of importance, we note that 72% ofthe firms were privatized through share issues while 28% were privatized throughprivate sales. These private sales are implemented either through an auction or
2We use a sample that largely represents the population of privatized firms around the world. We have
two main sources of privatized firms’ listings: the World Bank privatization database for developing
countries, and Megginson’s (2003) continuously updated list of privatized firms in developed and
developing countries. When we examine the World Bank list of privatized firms, we find that 30.48% of the
firms are from Africa and the Middle East, 17.08% from East and South Asia and the Pacific, 42.35%
from Latin America, and 10.09% from Europe and Central Asia. We find that 20.52% of the firms are
from the financial sector and 15.97% are utilities. We also note that 80% of the privatization transactions
occurred in the 1990s. Finally, when we examine the legal origin in the World Bank list, the distribution
shows that 31.12% of the firms come from common law countries and 65.27% from civil law countries.
These figures are close to the ones discussed in the text about our sample. Similarly, our sample of
privatized firms from industrialized countries is largely drawn from Megginson’s (2003, appendix), which
is, to our knowledge, the most comprehensive record of privatization in these countries.
ARTICLE IN PRESS
Table 1
Description of the sample of newly privatized firms
This table provides some descriptive statistics for the sample of 209 privatized firms used in this study. We
report the distribution of privatizations in the countries included in the sample by year, industry, legal
origin, region, income, development level, and type of offering.
Distribution of privatizations
By year By industry
Year Number Percentage Industry Number Percentage
1980 1 0.48 Financial 63 30.14
1981 1 0.48 Utilities 18 8.61
1984 1 0.48 Telecommunication 22 10.53
1985 4 1.91 Energy 53 25.36
1986 4 1.91 Other industries 53 25.36
1987 3 1.44 Total 209 100
1988 3 1.44 By legal origin
1989 25 11.96 Category (countries) Number Percentage
1990 14 6.70 Common law countries (13) 73 34.93
1991 28 13.40 Civil law countries (26) 136 65.07
1992 23 11.00 Total (39) 209 100
1993 13 6.22 By regiona
1994 20 9.57 Region (countries) Number Percentage
1995 12 5.74 Africa and the Middle East (8) 43 20.57
1996 19 9.09 Latin America and the Caribbean (8) 56 26.79
1997 21 10.05 East and South Asia and the Pacific (10) 55 26.32
1998 6 2.87 Europe and Central Asia (13) 55 26.32
1999 4 1.91 Total (39) 209 100
2000 6 2.87 By incomea
2001 1 0.48 Region (countries) Number Percentage
Total 209 100 Low income (11) 78 37.32
Type of offering Low middle income (5) 17 8.13
Category Number Percentage Upper middle income (9) 64 30.62
Secondary 74 89.16 High income (14) 50 23.92
Primary 9 10.84 Total (39) 209 100
Total 83 100 By development level
Category Number Percentage
Industrialized countries (ICs) 50 23.92
Emerging markets (EMs) 159 76.08
Total 209 100
By privatization method
Method Number Percentage
Share issue privatization (SIP) 133 71.51
Private sale (PS) 53 28.49
Total 186 100
aWorld Bank country group classifications.
N. Boubakri et al. / Journal of Financial Economics 76 (2005) 369–399374
directly to private investors (particularly in developing countries). Readers arereferred to Klemperer (2002) for a thorough description of the important features ofa successful auction design. Moreover, 89% of the privatization transactions in thesample are secondary (no capital flows into the firm), while the remaining 11% are
ARTICLE IN PRESS
N. Boubakri et al. / Journal of Financial Economics 76 (2005) 369–399 375
primary.3 For the sake of robustness, we exclude the observations that involveprimary offerings from the analyses performed throughout the paper. Unsurpris-ingly, the results do not change.
3.2. Ownership variables
To examine the postprivatization ownership structure and its determinants, wefocus on two measures of private ownership concentration that are used in theliterature (e.g., Demsetz and Lehn, 1985; LLSV, 1998; Demsetz and Villalonga,2001), the percentage of shares held by the three largest private investors, L3, and anapproximation of the Herfindahl index (the sum of squared ownership shares by thethree largest private investors), H3. Following Demestz and Lehn (1985) andHimmelberg et al. (1999), we apply a logistic transformation to L3, using theformula log(L3/(1–L3)) to convert a bounded variable into an unbounded one, and alogarithmic transformation to H3.4 The resulting variables are LL3 and LH3.Throughout this paper, we focus on the LL3 measure of ownership concentration.However, our findings are robust to the use of LH3 as an alternative measure.
To describe the postprivatization ownership structure and its evolution over time,we identify five groups of investors: the government, local institutions, foreigninvestors, employees, and individuals. We define the date of privatization as thedate on which the government sold for the first time a certain amount of shares.We collect ownership data from several sources from year –1 to year +3 around theprivatization year. The main sources for privatization ownership data are theoffering prospectus and annual reports, but we also use additional sources such asWorldscope Disclosure, the Asian, Brazilian, and Mexican Company Handbooks, andthe Guide to Asian Companies.
3.3. Performance variables
We measure firm performance by the return on sales (net income to sales), thereturn on assets (net income to assets), and the return on equity (net income toequity) (Megginson et al., 1994; Boubakri and Cosset, 1998; D’Souza andMegginson, 1999; Dewenter and Malatesta, 2001). We obtain financial informationfrom the firms’ financial statements and web sites, and from databases such asWorldscope Disclosure, Global Vantage, and Moody’s International.
3A frequently asked question is related to managerial (organizational) changes around privatization as a
characteristic of the privatization process. Although not reported, our descriptive statistics show that
changes of CEO occurred in 33% (36/109) of the firms. Out of the 109 firms for which we have data on
CEO turnover, 33 come from industrialized countries. Among these 33 firms, only nine changed their CEO
ð27% ¼ 9=33Þ: As for privatized firms in emerging markets, CEO turnover occurred in 35.5% ( ¼ 27/76)
of our sample firms.4There are at least two reasons why we want to use the logistic transformation to L3 instead of merely
running OLS with this bounded variable as the dependent variable. First, this transformation will ensure
that the variable cannot be driven outside its admissible range. The second reason is to improve the
normality of the residuals so that standard econometric methods can be applied.

ARTICLE IN PRESS
N. Boubakri et al. / Journal of Financial Economics 76 (2005) 369–399376
Since we are examining the relation between postprivatization firm performanceand ownership structure, we compute the performance measures for a period of fiveyears (from one year before to three years after privatization including the year ofprivatization itself). To check whether privatization leads to performance improve-ments, we also report the three-year average performance before and afterprivatization.
4. Ownership structure
4.1. The evolution of ownership structure
Panel A of Table 2 reports descriptive statistics on the concentration of ownershipmeasured by the cumulative number of shares of the three largest private investorsand the Herfindahl index. The average number of shares, held by the three largestprivate shareholders, increases from 10.3% before privatization to 33.2% in the yearof privatization. Shareholdings continue to increase up to 40.9% after three years. Incomparison, LLSV (1998), using a sample of 49 developed (24) and developing (25)countries, report an average ownership of the three largest shareholders of 46% inthe 10 largest private nonfinancial firms.
We also report the evolution of the Herfindahl index of private ownershipconcentration. Our results show higher levels of ownership concentration afterprivatization. The average index increases from 3.1% before privatization to 16.3%in the year of privatization. It continues to increase to 19.4% by the end of the thirdyear. Overall, the results presented here show that the private ownership of NPFsbecomes more concentrated over time.
Panel B of Table 2 reports changes in ownership by type of owner. The resultsindicate a significant change in the ownership structure of the sample firms followingprivatization. The average government stake declines substantially after privatiza-tion. We find a shift of 41% in the average government ownership (from 77.0%before privatization to 35.8% in the privatization year). The average postprivatiza-tion government stake continues to decrease over the following three years to 21.9%.This finding is consistent with the predominance of partial, staggered sales (Perottiand Guney, 1993; Perotti, 1995). Although the government is the controllingshareholder (more than 50% of shares) in 81.8% of the sample firms beforeprivatization, this percentage drops to 37.1% in the privatization year and to 22.1%after three years. Those firms that remain under government control three years afterprivatization come primarily (44.4%) from strategic sectors, e.g., utilities,telecommunications, airlines, and banking,5 and from East and South Asia andthe Pacific region (69.4%), where partial privatizations are more common (see, e.g.,Gupta (2005) for a comprehensive study of the Indian partial privatizationprogram).
5In a comprehensive study of government ownership of banks around the world, La Porta et al. (2002)
show that government ownership is large and pervasive, particularly in emerging markets.

ARTICLE IN PRESS
Table 2
The evolution of ownership structure in newly privatized firms
This table presents summary statistics on the evolution of the ownership structure for a sample of 209
firms from 25 emerging markets and 14 industrialized countries privatized between 1980 and 2001. Panel A
describes the ownership concentration measured by the percentage of shares held by the three largest
private investors (L3) and the Herfindahl index (H3). Panel B describes the evolution of ownership by type
of investor. We consider five types of investors: the government, local institutions, foreign investors,
employees, and individuals. The preprivatization ownership data (one year before privatization) come
mainly from the offering prospectus, while the postprivatization data (year 0 to year 3) come from the
annual reports and additional sources such as Asian, Brazil, and Mexico Company Handbooks, Worldscope
Disclosure, and The guide to Asian Companies. All statistics are presented in percent and N refers to the
number of observations.
Type of investor Ownership share one
year before privatization
Ownership share after privatization (year relative to
privatization)
0 +1 +2 +3
Panel A: private ownership concentration
Cumulative share of the three largest investors (L3)
Mean 10.29 33.15 37.30 39.86 40.94
Median 0.00 30.00 34.07 37.17 37.53
N 159 160 170 165 132
Herfindahl index (H3)
Mean 3.11 16.28 17.84 19.11 19.42
Median 0.00 4.78 6.62 9.00 9.76
N 161 159 170 165 132
Panel B: type of investor
Government
Mean 77.01 35.78 31.13 26.06 21.85
Median 86.14 32.83 22.29 13.34 0.20
N 198 201 192 181 161
Local institutions
Mean 6.13 20.94 24.87 26.65 30.24
Median 0.00 6.33 14.33 15.00 19.54
N 127 126 144 145 111
Foreign investors
Mean 7.07 14.90 16.21 17.74 16.16
Median 0.00 0.90 4.68 6.83 5.50
N 141 151 159 155 127
Employees
Mean 1.27 3.90 3.93 3.50 3.22
Median 0.00 0.00 0.00 0.00 0.00
N 134 147 140 127 110
Individuals
Mean 4.16 16.36 17.04 17.37 17.05
Median 0.00 11.37 11.20 11.39 10.97
N 127 137 141 135 107
N. Boubakri et al. / Journal of Financial Economics 76 (2005) 369–399 377

ARTICLE IN PRESS
N. Boubakri et al. / Journal of Financial Economics 76 (2005) 369–399378
Local institutions absorb much of the decrease in state ownership. Their averagestake increases from 6.1% prior to privatization to 20.9% in the year of privatizationand continues to increase up to 30.2% in the third year. These results indicate theimportance of local institutions as key players in the ownership structure ofprivatized firms and complement Boutchkova and Megginson’s (2000) evidence fornewly privatized firms in developed economies.
Foreign investors’ average stake doubles in the year of privatization to 14.9% andcontinues to increase in the following three years to 16.2%. In a more detailedexamination unreported here, we find that on average, 60% of foreign investors areinstitutions. This finding could reflect the foreign ownership consolidation wave andthe inflow of foreign consortiums following the financial liberalization that precededor accompanied privatization in some developing countries, especially LatinAmerica.
To ensure employees’ support for the privatization policy, many governmentsallocate a fraction of the share issues (between 5% and 20%) to the firm’s employeesthrough Employee Stock Ownership Plans (ESOPs). The average employees’ stakeincreases from 1.3% before privatization to 3.9% in the privatization year. However,we observe a small decline in the average employees’ stake over the following threeyears. This result could be explained by the existence of firm policies that discourageemployees to sell their shares.
One objective of a privatization program is to widen ownership among individuals.In our sample of privatized firms, individuals’ average ownership increases from 4.2%before privatization to 16.4% in the year of privatization. At the end of the third yearpostprivatization, the average stake held by individuals is 17.1%. This result suggeststhat privatization helps create a certain ‘‘equity culture’’ and ensures a minimum levelof popular capitalism. For example, privatization in Malaysia and the U.K. has beendriven to a large extent by the government’s willingness to increase the ownershipshare of individuals in key sectors of the economy.
4.2. Investor protection and ownership structure
To examine the evolution of the ownership structure according to the origin ofcommercial laws, we divide the sample into two groups, firms from common lawcountries and those from civil law countries. The rationale behind this partition isthat common law countries provide better investor protection which may influencethe postprivatization ownership structure (LLSV, 1998).
Panel A of Table 3 presents the changes in private ownership concentration bylegal origin. Using both measures of ownership concentration, we show that thehighest postprivatization concentration levels are found in countries with poorinvestor protection (civil law countries). In the privatization year, the average stakeheld by the three largest shareholders is 37.9% for firms from civil law countries and23.6% for firms from common law countries. Three years after privatization, theaverage stake held by the three largest shareholders is 30.0% and 47.2% for commonlaw and civil law countries, respectively. These postprivatization differences betweenthe common law and civil law countries are statistically significant at the 1% level.

ARTICLE IN PRESS
Table 3
The evolution of the ownership structure in newly privatized firms by law origin
This table presents the evolution of the ownership structure for a sample of 209 firms from 25 emerging
markets and 14 industrialized countries privatized between 1980 and 2001 according to the law origin. In
Panel A, we focus on the ownership concentration measured by the percentage of shares held by the three
largest private investors (L3) and the Herfindahl index (H3). Panel B describes the evolution of ownership
by type of investor: the government, local institutions, foreign investors, employees and individuals. We
split the sample in two groups of firms, those from common law countries and those from civil law
countries. The preprivatization ownership data (one year before privatization) come mainly from the
offering prospectus, while the postprivatization data (year 0 to year 3) come from the annual reports and
additional sources such as Asian, Brazil, and Mexico Company Handbooks, Worldscope Disclosure, and
The guide to Asian Companies. The table also reports the p-value of the t-statistic for differences in means
(p-value1) and medians (p-value2) between common law and civil law countries. All statistics are presented
in percent. All tests have been conducted with at least 30 observations.
Type of investor Ownership share one year
before privatization
Ownership share after privatization (year relative to
privatization)
0 +1 +2 +3
Panel A: private ownership concentration
Cumulative share of the three largest investors (L3)
Common law countries
Mean 13.26 23.59 27.07 28.74 29.99
Median 0.00 22.50 31.38 32.00 32.10
Civil law countries
Mean 8.53 37.88 42.74 45.42 47.20
Median 0.00 30.83 40.47 49.16 52.68
Means difference 4.73 �14.28 �15.67 �16.68 �17.21
p-value1 0.114 0.007 0.003 0.001 0.002
p-value2 0.330 0.015 0.004 0.004 0.006
Herfindahl index (H3)
Common law
countries
Mean 4.34 7.19 7.96 8.49 8.54
Median 0.00 2.56 4.58 6.27 6.47
Civil law countries
Mean 2.40 20.70 23.09 24.42 25.63
Median 0.00 5.29 8.62 12.09 13.57
Means difference 1.94 �13.51 �15.13 �15.93 �17.09
p-value1 0.078 0.001 0.000 0.000 0.000
p-value2 0.301 0.015 0.003 0.004 0.004
Panel B: type of investor
Government
Common law countries
Mean 78.70 36.65 35.83 31.39 29.33
Median 98.72 32.83 35.47 30.00 29.10
Civil law countries
Mean 76.09 35.30 28.56 23.28 17.97
Median 85.55 32.40 14.64 4.60 0.00
N. Boubakri et al. / Journal of Financial Economics 76 (2005) 369–399 379
ARTICLE IN PRESS
Table 3 (continued )
Type of investor Ownership share one year
before privatization
Ownership share after privatization (year relative to
privatization)
0 +1 +2 +3
Means difference 2.60 1.35 7.27 8.11 11.36
p-value1 0.498 0.774 0.121 0.080 0.015
p-value2 0.414 0.806 0.154 0.078 0.009
Local institutions
Common law countries
Mean 4.44 10.41 14.65 15.93 18.59
Median 0.00 0.00 4.40 8.34 8.25
Civil law countries
Mean 7.12 26.40 30.48 32.11 37.33
Median 0.00 13.50 17.94 19.88 28.10
Means difference �2.67 �15.99 �15.83 �16.18 �18.74
p-value1 0.275 0.003 0.002 0.002 0.003
p-value2 0.086 0.001 0.004 0.006 0.013
Foreign investors
Common law countries
Mean 12.83 14.86 15.29 15.61 15.47
Median 0.00 1.73 5.95 7.00 9.02
Civil law countries
Mean 3.60 14.92 16.70 18.84 16.58
Median 0.00 0.51 4.49 5.85 4.99
Means difference 9.23 �0.06 �1.41 �3.23 �1.11
p-value1 0.000 0.988 0.685 0.395 0.782
p-value2 0.005 0.737 0.788 0.783 0.440
Employees
Common law countries
Mean 1.65 4.03 4.03 3.08 3.22
Median 0.00 0.01 0.00 0.00 0.00
Civil law countries
Mean 1.06 3.83 3.88 3.67 3.22
Median 0.00 0.00 0.00 0.00 0.00
Means difference 0.59 0.20 0.15 �0.59 0.01
p-value1 0.535 0.914 0.940 0.787 0.997
p-value2 0.508 0.645 0.624 0.914 0.723
Individuals
Common law countries
Mean 4.38 26.77 26.55 27.88 28.88
Median 0.00 19.65 21.21 22.39 23.91
Civil law countries
Mean 4.06 12.08 12.72 12.94 12.23
Median 0.00 10.00 9.01 9.00 7.81
Means difference 0.31 14.69 13.83 14.94 16.65
p-value1 0.861 o.0001 o.0001 o.0001 o.0001
p-value2 0.507 0.000 0.000 0.000 o.0001
N. Boubakri et al. / Journal of Financial Economics 76 (2005) 369–399380
ARTICLE IN PRESS
N. Boubakri et al. / Journal of Financial Economics 76 (2005) 369–399 381
Panel B of Table 3 shows how ownership by the government, local institutions,foreign investors, employees, and individuals changes and differs according to thelegal origin of a given country. The average government stake is 78.7% prior toprivatization for firms in common law countries and 76.1% for firms in civil lawcountries, but this difference is not statistically significant. In contrast, the averagegovernment stake after privatization is statistically lower in civil law countries thanin common law countries. The average government stake decreases by 42.1% in theprivatization year for common law countries to 29.3% in the third year. For firmsfrom civil law countries, the average government stake decreases by 40.8% in theprivatization year and continues to decrease to 18.0% in the third year. These resultssuggest that governments in civil law countries tend to sell higher stakes faster thando those in common law countries.
The evidence on the changes in local institutions’ ownership suggests significantlyhigher levels of institutional ownership in countries with relatively poor investorprotection (civil law countries) compared to countries with better investor protection(common law countries). For the subsample of firms from common law countries,the average stake is 18.6% in the third postprivatization year and 37.3% for thesubsample of firms from civil law countries. This result suggests that institutionalinvestors may play a key role in countries with low investor protection.
Before privatization, the average stake held by foreign investors is 12.8% for firmsfrom common law countries and 3.6% for firms from civil law countries. Thedifference is statistically significant at the 1% level. In the year of privatization, theaverage foreign stake increases by 2.0% for the first subsample and almost fivefoldfor the second subsample. Three years after privatization, the average stake is 15.5%for the common law countries subsample and 16.6% for the civil law countriessubsample. The difference is not statistically significant. These results suggest that,ceteris paribus, foreign investors are drawn to privatized firms, regardless of thedegree of legal protection in a country.
We also explore how employees’ ownership is affected by legal origin. Thepreprivatization employees’ average stake is higher for the subsample of firms fromcommon law countries compared to the subsample of firms from civil law countries.However, this difference is not statistically significant. Three years after privatiza-tion, the average stake held by employees is comparable across legal origin and nostatistical difference is reported.
We investigate the patterns of individuals’ ownership in both common law andcivil law countries. Before privatization, the average stake held by individuals is4.4% for firms from common law countries and 4.1% for firms from civil lawcountries. Three years after privatization, the average stake is 28.9% for the commonlaw subsample and 12.2% for the civil law subsample. The results indicate that incommon law countries, individuals own significantly higher stakes in the third yearfollowing privatization. Although we are unable to document the evolution in thenumber of shareholders, these results suggest that privatization is more likely tocreate a popular capitalism in common law countries than in civil law countries. Inother words, wherever investors are protected by law, we can expect an ‘‘equityculture’’ to emerge and we can expect individuals to have more incentives to invest.

ARTICLE IN PRESS
N. Boubakri et al. / Journal of Financial Economics 76 (2005) 369–399382
Overall, the results of Tables 2 and 3 indicate a high concentration of privateownership following privatization, providing support for Shleifer and Vishny’s(1997) and Dyck’ s (2001) contention that privatization should result in higher levelsof concentrated ownership in countries with poor investor protection.6
4.3. Privatization method and ownership structure
In this section we examine the impact of the privatization method on the evolutionof ownership structure.7 As pointed out in Bortolotti et al. (2004) and Megginsonet al. (2004), the method of privatization could affect the evolution of governmentownership since private sales generally involve smaller companies often privatizedfully whereas public offerings typically involve larger companies often sold partially.In the same vein, Bortolotti et al. (2002) show that governments in countries withweak legal protection are more likely to use international share issues in order toreassure investors who will, in turn, receive an additional protection through thecompliance to foreign exchanges’ requirements.
Table 4 shows that the privatization method has an impact on the level ofpostprivatization concentration of ownership. For example, as shown in Panel A, theaverage cumulative share of the three largest private shareholders in the third yearafter divestiture is significantly higher in private sale transactions (61.2%) comparedto 30.4% for share issued privatizations. Similarly, we observe, on average, higherresidual government stakes in share issued privatizations (28.2%) compared toprivate sales (11.5%). The difference is highly significant. Local investors also holdhigher average stakes after private sales (35.4%) compared to share issuedprivatizations (22.5%). The same results hold for foreign investors, although thedifference between the average three-year postprivatization levels of ownership is notsignificant across the methods of sale.
Of interest, we also note that there is a significant difference in the stake heldby individuals—22.2% in privatizations by share issues versus 9.2% in privatesales. This finding is consistent with the objective often put forward by govern-ments to develop popular capitalism and an equity culture through privatizations byshare issues.
4.4. The determinants of ownership concentration
Although the univariate results suggest that privatization yields higher levels ofprivate ownership concentration in countries with weak investor protection (civil law
6In unreported results available from the authors, we examine whether the results on the patterns of
ownership in Table 3 can be explained by the difference between ‘‘committed’’ versus ‘‘populist’’
governments as in Biais and Perotti (2002), rather than by the distinction between civil and common law
countries. We therefore distinguish between right- and left-wing governments on the grounds that right
wing governments are more committed. To do so, we use the new database on political institutions
compiled by the World Bank. Our results indicate that there is no significant difference in the patterns of
ownership between committed and populist governments.7We thank an anonymous reviewer for suggesting this analysis.

ARTICLE IN PRESS
Table 4
The impact of the privatization method on the evolution of the ownership structure in newly privatized
firms
This table presents the evolution of the ownership structure for a sample of 209 firms from 25 emerging
markets and 14 industrialized countries privatized between 1980 and 2001 according to privatization
method. In Panel A, we focus on the ownership concentration measured by the percentage of shares held
by the three largest private investors (L3) and the Herfindahl index (H3). Panel B describes the evolution
of ownership by type of investor: the government, local institutions, foreign investors, employees and
individuals. We split the sample in two groups of firms, those privatized via share issue privatizations (SIP)
and those privatized via private asset sale (PS). Data on the privatization method come from the World
Bank Privatization Transactions Database and from Megginson (2003). The preprivatization ownership
data (one year before privatization) come mainly from the offering prospectus, while the postprivatization
data (year 0 to year 3) come from the annual reports and additional sources such as Asian, Brazil, and
Mexico Company Handbooks, Worldscope Disclosure, and The guide to Asian Companies. The table also
reports the p-value of the t-statistic for differences in means (p-value1) and medians (p-value2) between
common law and civil law countries. All statistics are presented in percent. All tests have been conducted
with at least 30 observations.
Type of investor Ownership share after privatization (year relative to privatization)
0 +1 +2 +3
Panel A: private ownership concentration
Cumulative share of the three largest investors (L3)
SIP
Mean 23.64 27.40 30.10 30.37
Median 15.65 23.08 29.56 27.96
PS
Mean 52.05 56.71 59.06 61.18
Median 53.57 59.26 65.56 65.43
Means difference �28.41 �29.31 �28.96 �30.80
p-value1 o.0001 o.0001 o.0001 o.0001
p-value2 o.0001 o.0001 o.0001 o.0001
Herfindahl index (H3)
SIP
Mean 8.77 9.88 10.84 10.23
Median 2.10 3.50 4.71 4.67
PS
Mean 29.56 31.89 33.37 36.99
Median 18.64 26.42 26.01 26.01
Means difference �20.79 �22.02 �22.52 �26.76
p-value1 o.0001 o.0001 o.0001 o.0001
p-value2 o.0001 o.0001 o.0001 o.0001
Panel B: type of investor
Government
SIP
Mean 41.55 37.48 31.69 28.15
Median 48.80 39.10 30.00 19.18
PS
Mean 22.69 18.10 16.26 11.47
Median 5.87 0.00 0.00 0.00
N. Boubakri et al. / Journal of Financial Economics 76 (2005) 369–399 383

ARTICLE IN PRESS
Table 4 (continued )
Type of investor Ownership share after privatization (year relative to privatization)
0 +1 +2 +3
Means difference 18.86 19.38 15.43 16.68
p-value1 0.000 o.0001 0.001 0.000
p-value2 0.000 o.0001 0.001 0.001
Local institutions
SIP
Mean 16.53 19.94 22.75 22.48
Median 3.60 8.36 12.25 8.16
PS
Mean 23.58 30.14 28.32 35.44
Median 11.30 20.70 16.00 24.20
Means difference �7.05 �10.19 �5.57 �12.96
p-value1 0.222 0.077 0.331 0.082
p-value2 0.227 0.129 0.409 0.087
Foreign investors
SIP
Mean 12.83 14.50 15.52 15.38
Median 2.03 5.00 8.46 9.02
PS
Mean 21.81 22.03 25.73 22.19
Median 8.90 8.77 9.50 2.00
Means difference �8.98 �7.53 �10.21 �6.81
p-value1 0.050 0.089 0.039 0.258
p-value2 0.223 0.467 0.293 0.840
Employees
SIP
Mean 2.47 2.71 2.16 1.54
Median 0.01 0.00 0.00 0.00
PS
Mean 7.66 7.22 6.93 6.64
Median 0.00 0.00 0.00 0.00
Means difference �5.19 �4.50 �4.78 �5.10
p-value1 0.095 0.147 0.154 0.091
p-value2 0.537 0.812 0.950 0.640
Individuals
SIP
Mean 19.53 20.02 20.40 22.17
Median 15.00 15.40 18.50 21.03
PS
Mean 10.64 11.58 12.48 9.15
Median 7.34 10.00 10.00 6.65
Means difference 8.89 8.44 7.93 13.02
p-value1 0.004 0.005 0.015 0.000
p-value2 0.025 0.034 0.037 0.001
N. Boubakri et al. / Journal of Financial Economics 76 (2005) 369–399384

ARTICLE IN PRESS
N. Boubakri et al. / Journal of Financial Economics 76 (2005) 369–399 385
countries), they do not control for other potential determinants of ownershipconcentration.
Demsetz and Lehn (1985) investigate the determinants of ownership concentrationin the United States. The authors find: (1) a negative association between ownershipconcentration and firm size; (2) a positive association between ownershipconcentration and profit instability; and, (3) a lower ownership concentration inregulated firms (utilities and financial firms). Recent papers by Himmelberg et al.(1999), Demsetz and Villalonga (2001), and Palia (2001) extend the Demsetz andLehn analysis and show that managerial ownership is endogenously determined by aset of firm-level variables in the contracting environment.
LLSV (1998) use country-level explanatory variables to explain ownershipconcentration in a wide set of developed and developing countries. These authorsmeasure ownership concentration in each country by the average ownership stake ofthe three largest shareholders in the ten largest publicly traded companies. They useseveral measures of legal protection including the quality of law enforcement,shareholder rights, creditor rights, and legal origin dummies, and find a negativeassociation between the extent of legal protection and ownership concentration.
While Demsetz and Lehn (1985) and LLSV (1998) examine the determinants ofownership concentration of publicly traded firms, in this research we focus on thedeterminants of the postprivatization private ownership structure. We extend theempirical specifications of these papers by simultaneously including firm- andcountry-level explanatory variables, and we formulate our conjectures within theequation
LCONCit ¼ aþ bFLV it þ WCLVit þ gt þ �it; (1)
where LCONCit is the private ownership concentration measured by LL3, FLVit
represents firm-level variables, CLVit represents country-level variables, gt are yearfixed-effects (i.e., an indicator for each postprivatization year) included to captureunobservable changes at the firm- and country-level, and eit is a disturbance term.
Table 5 summarizes the firm-level and country-level variables we consider.Following Demsetz and Lehn (1985), we use the following firm-level variablesdisplayed in Panel A: Operating risk, for which we use as a proxy the standarddeviation of the annual return on equity ratios (RISK) during the three yearspreceding the privatization year; Growth, for which we use as a proxy the averageannual real sales growth rate (SALESGR) during the three years preceding theprivatization year; Firm size, for which we use as a proxy the natural logarithm oftotal sales (SIZE); and, Industry affiliation. We include a dummy variable for eachindustry: IND1 for the finance industry, IND2 for utilities, IND3 for telecommu-nication companies, IND4 for oil and gas, petrol/petrochemical, cement, and mining;and, IND5 for all other sectors.
In addition to the firm-level variables, we control for the timing of privatizationand the divestment method. To do so, we first include a dummy variable forprivatization timing (LATE) that takes the value of one if the sample-firm isprivatized after the median privatization date in the country, and zero otherwise.This variable captures the privatizing government’s preferences on the choice of the

ARTICLE IN PRESS
Table 5
Summary of the variables
This table describes the variables used in our regression analysis to investigate the determinants of the
postprivatization private ownership concentration.
Variables Definition
Panel A: firm-level variables
RISK The standard deviation of the annual return on equity ratios
SALESGR Real sales growth rate
SIZE The natural logarithm of total sales
IND1 A dummy variable equal to unity if the firm is a bank or insurance company
IND2 A dummy variable equal to unity if the firm is a utility
IND3 A dummy variable equal to unity if the firm is a telecommunication company
IND4 A dummy variable equal to unity if the firm belongs to oil and gas, petrol/
petrochemical, cement or mining
IND5 A dummy variable equal to unity if the firm belongs to other sectors
LATE A dummy variable equal to unity if the sample-firm is privatized after the median
privatization date in the country and zero otherwise
PS A dummy variable equal to unity for firms privatized through private sales
Panel B: country-level variables
LAW A dummy variable equal to unity for firms from common law countries
JUDICIAL LLSV’s (1998) index of the efficiency of the judicial system
GINI The United Nation’s index of income inequality
GS The ICRG assessment of a country’s government stability
ET The ICRG assessment of a country’s ethnic tensions
N. Boubakri et al. / Journal of Financial Economics 76 (2005) 369–399386
to-be-privatized firm and the extent of the stake sold. For example, because of bothsocial and political costs and fears of losing revenues, governments could bereluctant to sell higher stakes and relinquish state control at early exploratory stagesof the privatization program. Or, in an effort to attract private investors,governments might choose to relinquish control in the early stages. The empiricalresults will validate either one or the other of these arguments. We also control forthe method of privatization by including a dummy variable (PS) that is equal to oneif the firm is privatized through a private sale on the grounds that more concentratedownership should result from such sales compared to share issued privatizations(Megginson et al., 2004).
Panel B presents the country-level variables. Legal system refers to the legal originof the country. This is a dummy variable (LAW) that takes the value of one forcommon law countries and zero otherwise.8 In civil law countries, governments tendto sell higher stakes using private sales, which is more likely to yield a concentratedownership (Dyck, 2001; Bortolotti et al., 2000). Thus, we expect a negativeassociation between ownership concentration and ownership protection.
8The exogeneity of the legal origin dummy makes its use as a measure of investor protection appealing
in contrast to other measures of investor protection, such as the shareholder rights index, which might be
endogenous to ownership concentration (LLSV, 1998; Dyck, 2001).

ARTICLE IN PRESS
N. Boubakri et al. / Journal of Financial Economics 76 (2005) 369–399 387
As a proxy for legal enforcement, we use LLSV’s (1998) index of the efficiency ofthe judicial system (JUDICIAL). Strong legal enforcement could substitute for theweakness of rules since ‘‘active and well-functioning courts can step in and rescueinvestors abused by the management’’ (LLSV, 1998, p.1140). Thus, we expect anegative correlation between ownership concentration and legal enforcement.
As a proxy for income inequality, we use the Gini index (GINI). Demsetz (1997)contends that a society’s wealth and its distribution are likely to explain ownershipconcentration. Demsetz claims that wealthy people are more likely to buy largestakes while still enjoying diversification of their wealth. Therefore, we expect incomeinequality to have a positive impact on ownership concentration.
As a proxy for the stability of the political environment, we use the index ofgovernment stability (GS) provided by International Country Risk Guide (ICRG).This indicator measures the credibility and ability of the government to carry outdeclared economic reforms and privatization, which have the merit of reducingprivate investors’ worries about future policy reversals (Perotti, 1995; Perotti andvan Oijen, 2001). Therefore, we expect a positive association between privateownership concentration and political stability.
As a proxy for the stability of the social environment, we use the index of ethnictensions provided by ICRG (ET). This indicator measures the degree of tensionwithin a country that is attributable to cultural, racial, national, or linguisticdivisions. These factors are all likely to adversely affect the business environment,private investors’ confidence, and the willingness of investors to invest a largeportion of their wealth. Therefore, we expect a positive association between privateownership concentration and the stability of the social environment.
Some of the variables we describe above try to act as proxies for the extent ofselection effects inherent to the privatization process. In the context of privatization,we must deal with the likelihood that a government’s choices affect the resultingownership structure. Given the prevailing economic and institutional environment,the privatizing government may privatize (keep) or sell higher (lower) stakes inbetter-quality firms, which could result in a more (less) concentrated privateownership in these firms. Moreover, the government might be reluctant to relinquishcontrol in large firms and/or in sectors that it believes are economically andpolitically strategic. Finally, certain types of owners (e.g., local institutions,foreign investors) may be able to identify better-quality firms from countries withbetter economic perspectives and legal institutions. All these cases suggest that theprivate ownership concentration that emerges after privatization is likely to besystematically related to both unobservable and observable firm and countrycharacteristics.
We can control for unobservable firm and country heterogeneity in panel data.Since our study is multinational, and, given some of our main country-level variablesare invariant within firms and countries, we assume that we can capture firm(country) unobservable heterogeneity by introducing industry (and region) fixed-effects. We believe that a particular firm (country) exhibits the same characteristicsas the whole industry (region). Governments generally privatize firms fromparticular industries using the same timing and sales methods. These practices are

ARTICLE IN PRESS
N. Boubakri et al. / Journal of Financial Economics 76 (2005) 369–399388
also common to countries from a particular region. Therefore, we should be able tocapture any unobserved firm or country heterogeneity in the privatization context byindustry and region fixed-effects rather than firm and country fixed-effects.
Table 6 reports the regression results for estimating Eq. (1). Of particularimportance, the method of privatization (PS) is positively and significantly related toownership concentration (specification (2)). This expected result suggests thatprivatizations through private sales are more likely than share issued privatizationsto result in a more concentrated ownership. This result confirms those in Table 4(Panel A), as ownership concentration remains significantly higher when privatiza-tion occurs through private sales, even after controlling for firm and countrycharacteristics.
Further, we find that the growth variable SALESGR is positive and significantly(at the 1% level) related to ownership concentration. We also find a negative andsignificant (at the 1% level) relation between ownership concentration and firm size.
Our results also show significantly higher levels of ownership concentration forfinancial firms. One possible explanation for this finding is that the financialliberalization that accompanied or preceded privatization created a wave of foreignownership consolidation, particularly in Mexico and other Latin Americancountries. In addition, our results indicate significantly lower levels of ownershipconcentration for utilities and telecommunications. This evidence supports theprevious discussion on the monitoring role of regulation and the reluctance of thegovernment to fully privatize strategic industries. We note that neither the operatingrisk of the firm nor the privatization timing variable is significantly related toownership concentration. The coefficient of the timing variable is consistentlynegative across our specifications, although insignificant at conventional levels,suggesting that ownership concentration is higher in earlier privatizations.
At the country level, the results show several significant relations. Specifications(1) and (2) contain region fixed-effects. Specifications (3) through (5) containinteraction between regions and county-level variables. We find a negative andsignificant (at the 5% level) association between ownership concentration and thelevel of investor protection across all the specifications. Firms in civil law countriesexhibit a level of ownership concentration that is higher than that for firms incommon law countries. These results confirm those in Table 3 (Panel A) and suggestthat, after controlling for firm and country characteristics, ownership concentrationis significantly higher in civil law countries.
The legal enforcement variable JUDICIAL is not a statistically significantdeterminant of ownership concentration. One possible explanation for this result isthat legal enforcement may not substitute for the weakness of rules.9 We also findthat the measure of income inequality GINI is significantly related to ownership
9To examine whether this result is driven by the level of country development, we introduce the
interaction between JUDICIAL and the level of economic development in our specifications. We find that
JUDICIAL remains insignificant in all the specifications but the interaction term JUDICIAL� IC (where
IC is a dummy that equals one if the country is an industrialized country) is significant in specifications (1),
(3), (4), and (5).

ARTICLE IN PRESS
Table 6
The determinants of private ownership concentration
The table shows the regression results of private ownership concentration measured by the logistic
transformation of the percentage held by the three major shareholders (LL3) on the set of explanatory
variables indicated below. REGION1, REGION2, REGION3, and REGION4 refer to Africa, Latin
America, Asia, and Europe, respectively. VAR refers to ONE (Specifications (1) and (2)), GINI
(specification (3)), GS (specification (4)), and ET (specification (5)). All regressions include year fixed-effect
(coefficients estimates not reported). Heteroskedasticity robust p-values are reported in parentheses. A
constant term is included in each regression. Variable definitions for the acronyms are reported in Table 5.
Variable (1) (2) (3) (4) (5)
RISK 0.011 0.015** 0.012 0.015 0.010
(0.298) (0.011) (0.305) (0.266) (0.307)
SALESGR 0.325*** 0.387*** 0.336*** 0.343*** 0.344***
(0.000) (o.0001) (0.000) (0.000) (0.000)
SIZE �0.418***�0.327***
�0.410***�0.417***
�0.424***
(o.0001) (o.0001) (o.0001) (o.0001) (o.0001)
IND1 1.445*** 1.069*** 1.533*** 1.473*** 1.383***
(o.0001) o.0001) (o.0001) (o.0001) (o.0001)
IND2 �1.580***�1.275***
�1.660***�1.796***
�1.568***
(o.0001) (o.0001) (o.0001) (o.0001) (o.0001)
IND3 �0.676*�0.560*
�0.660*�0.588*
�0.681*
(0.057) (0.089) (0.061) (0.089) (0.060)
IND4 0.101 0.132 0.094 0.152 0.102
(0.693) (0.551) (0.713) (0.542) (0.690)
IND5 0.710*** 0.633*** 0.694*** 0.760*** 0.765***
(0.000) (0.000) (0.001) (0.000) (o.0001)
LATE �0.417 �0.242 �0.415 �0.556*�0.290
(0.155) (0.318) (0.166) (0.058) (0.309)
LAW �0.883**�1.124***
�1.643***�0.916**
(0.035) (0.009) (0.000) (0.023)
JUDICIAL �0.037 �0.018 0.037 �0.056
(0.616) (0.809) (0.624) (0.459)
GINI 0.053*** 0.068*** 0.042**
(0.009) (0.001) (0.046)
GS 0.123* 0.119 0.138*
(0.090) (0.102) (0.058)
ET 0.205** 0.189** 0.264***
(0.029) (0.041) (0.004)
PS 0.870**
(0.013)
VAR�REGION1 �1.461***�1.057*** 0.038*
�0.060 �0.097
(o.0001) (o.0001) (0.096) (0.488) (0.419)
VAR�REGION2 2.484*** 3.023*** 0.108*** 0.363*** 0.833***
(o.0001) (o.0001) (o.0001) (0.000) (o.0001)
VAR�REGION3 �0.660***�1.389*** 0.055** 0.056 0.107
(0.007) (o.0001) (0.012) (0.406) (0.283)
VAR�REGION4 �0.363 �0.577*** 0.058*** 0.006 0.178*
(0.165) (0.004) (0.005) (0.933) (0.079)
Adjusted R2 0.474 0.435 0.467 0.470 0.483
N 478 536 478 478 478
Significance at the 10%, 5%, and 1% level is noted by *, **, and ***, respectively.
N. Boubakri et al. / Journal of Financial Economics 76 (2005) 369–399 389

ARTICLE IN PRESS
N. Boubakri et al. / Journal of Financial Economics 76 (2005) 369–399390
concentration, which concurs with Biais and Perotti’s (2002) conjecture that incomeinequality may affect the design and the resulting ownership structure of privatizedfirms. Additionally, specification (3) shows that the impact of income inequality ispositive and significant across all geographical regions and especially in LatinAmerica and the Caribbean where income inequality is the highest.10
As predicted, we find that the government stability GS and ethnic tensions ET
variables are key determinants of private ownership concentration. This resultsuggests that private investors are more inclined to hold larger stakes of firms inmore stable political and social environments. Specifications (4) and (5) indicate thatthe interactions between regions and government stability GS, and between regionsand ethnic tensions ET, are positive and significant (at the 1% level) for LatinAmerica and both Latin America and Europe, respectively.
In all regressions, none of the year effects is significant. Overall, the results indicatethat firm- and country-level explanatory variables explain at least 43% of thevariation in ownership concentration. These results confirm the endogeneity ofprivate ownership concentration and the necessity to take it into account whentesting the ownership-performance relationship.
The results can also be related to the patterns of government ownership reportedin Panel B of Table 3, which show higher levels of postprivatization governmentownership for firms in common law countries. Governments in our sample countriesseem to privatize higher stakes when there is poor investor protection, which is morelikely to lead to a higher private ownership concentration. This result could alsoexplain why privatization methods tend to vary across countries.
The empirical evidence on the privatization methods appears to be mixed.Megginson et al. (2004) show that privatization through private sales is more likelywhen investor protection is better (common law countries), but Bortolotti et al.(2000) report a higher frequency of private sales in civil law countries. Dyck andZingales (2004) examine the effects of private benefits of control on the developmentof markets, particularly on the ownership structure of firms and the choice ofprivatization methods. The authors show that countries that exhibit higher benefitsof control, i.e., countries with weak legal protection, have more concentratedownership. In these countries, privatization is less likely to occur through publicofferings.
Our evidence concurs with this line of research by providing an alternativeperspective on the link between postprivatization ownership structure, method ofprivatization, and investor protection. We show that ownership concentration ishigher in privatizations that occur through private sales and in civil law countrieswhere investor protection is weak. This evidence captures the fact that privatizationoccurs mainly through private sales in these countries (e.g., in Africa and LatinAmerica).
10Over the 1980 to 2000 period, the average index of income inequality (GINI) for Latin America and
the Caribbean is 57, compared to 41 for Africa and the Middle East, 40 for Europe and Central Asia, and
38 for East and South Asia and the Pacific.

ARTICLE IN PRESS
N. Boubakri et al. / Journal of Financial Economics 76 (2005) 369–399 391
5. Ownership, investor protection, and performance
5.1. The operating performance of privatized firms
As proxies for the operating performance of NPFs, we use the return on sales(ROS), the return on assets (ROA), and the return on equity (ROE) ratios. Table 7reports the mean and median levels of performance from one year before to threeyears after privatization, and the mean and median change in performance from thepreprivatization (years �3 to �1) to the postprivatization (years +1 to +3) periods.
The performance measures tend to increase following privatization. For example,the mean (median) ROS increases from 9.1% (5.6%) for year �1 to 14.4% (8.7%)for year 0. Three years after privatization, the mean (median) ROS is 14% (8%).Furthermore, the changes in the performance measures over the window (�3, �1;+1, +3) are significant and positive. For example, the median changes in ROS andROE are, respectively, 3.2% and 3.2%, but the median change in ROA is 0.8%.These results are in line with previous multinational-multi-industry studies thatdocument operating performance improvements following privatization (Megginsonet al., 1994; Boubakri and Cosset, 1998; D’Souza and Megginson, 1999).11
5.2. The relation between ownership concentration, investor protection, and
performance
Ownership concentration, by establishing a strong relation between ownershipand control, helps mitigate the extent of agency problems in a firm and should yield asuperior performance (Shleifer and Vishny, 1997). A standard approach is toconduct a regression analysis of firm performance on ownership structure variables.However, this method can be misspecified if some of the unobserved determinants offirm performance (unobserved heterogeneity) also explain the ownership concentra-tion variables, leading to a spurious relation between ownership concentration andfirm performance. Several recent studies (e.g., Himmelberg et al., 1999; Palia, 2001)document the endogeneity nature of the ownership structure (predominantlymanagerial ownership) and stress the need to control for it by using instrumentalvariables for ownership. Accordingly, we estimate the following system of equations:
PERF it ¼ dþ y1 LCONCit þ y2 LCONCit � PROTECTION
þ b1FLV 1it þ W1CLV 1it þ gþ �1it; ð2aÞ
LCONCit ¼ aþ b2FLV 2it þ W2CLV 2it þ �2it; (2b)
where PERFit stands for the performance of firm i (ROS, ROA, ROE) at time t,LCONCit is the ownership concentration of firm i at time t as measured by LL3,FLV1it (firm size SIZE and industry dummies) and CLV1it (economic freedom
11Recent studies by Galiani et al. (2001) and Wallsten (2001) also show that efficiency gains associated
with privatization lead to improvements in water services and in telecommunications capacity,
respectively.

ARTIC
LEIN
PRES
S
Table 7
The performance of newly privatized firms
This table presents descriptive statistics on the performance of a sample of 209 firms from 25 emerging markets and 14 industrialized countries privatized
between 1980 and 2001. The performance measures are return on sales (ROS), return on assets (ROA), and return on equity (ROE). We report the mean and
median levels of performance from three years before to three years after privatization, and the mean and median change in performance from before to after
privatization. Panel A and Panel B report the unadjusted and market-adjusted performance measures, respectively. All statistics are presented in percent.
Performance
measures
Levels Changes
Before privatization Privatization After privatization
Before One year
before
Year 0 One year Two years Three years After Wilcoxon two
sample test Z-
statistic
(�1,�3) �1 0 +1 +2 +3 (+1,+3) (�1,�3;
+1,+3)
ROS
Mean 7.89 9.13 11.93 14.41 14.61 13.95 14.18 6.42
Median 4.67 5.64 8.24 8.70 8.34 8.01 7.98 3.19 4.028***
N 206 205 200 204 203 163 207 204
ROA
Mean 4.27 4.99 5.33 5.93 5.64 5.91 5.65 1.24
Median 2.44 2.88 3.82 4.14 3.41 3.95 3.91 0.80 3.349***
N 206 205 200 206 206 164 207 204
ROE
Mean 17.98 21.63 18.46 18.48 19.60 20.55 19.12 0.53
Median 9.18 11.38 12.09 13.78 12.42 12.37 13.40 3.21 2.764***
N 207 205 200 206 205 166 207 205
Significance at the 1% level is noted by ***.
N.
Bo
ub
ak
riet
al.
/J
ou
rna
lo
fF
ina
ncia
lE
con
om
ics7
6(
20
05
)3
69
–3
99
392

ARTICLE IN PRESS
N. Boubakri et al. / Journal of Financial Economics 76 (2005) 369–399 393
FREEDOM and real GDP growth GDPG) represent firm- and country-level controlvariables included in the performance equation.Including the real GDP growth inthe performance equation allows us to indirectly control for the possible impact ofeconomic reforms on firm performance (Bekaert et al., 2001). Including economicfreedom allows us to capture the cross-country differences in the institutionalenvironment. The terms gt are year dummies introduced to control for year-specificeffects, FLV2it and CLV2it represent firm- and country-level instrumental variables(Zit) included in the ownership concentration equation, and �1it and �2it are theerror terms.
The choice of the instruments is a crucial task since, while they must be highlycorrelated with ownership concentration, they must not determine firm performance.We use the set of instruments from specification (1) in Table 5 (RISK, SIZE, LATE,LAW, GINI, GS). These instruments must satisfy Eð�1it;ZitÞ ¼ 0: Since firm sizeexplains both ownership concentration and firm performance, we use the (logarithmof) total GNP on the grounds that larger economies have larger firms and therefore,lower ownership concentration (LLSV, 1998).12
The parameter y1 in Eq. (2a) measures the impact of ownership concentration onthe performance of privatized firms. We also introduce an interaction term betweenownership concentration and investor protection. If the effect of ownershipconcentration on performance is more pronounced in countries with poor investorprotection, then the coefficient of the interaction term ðy2Þ should be negative andsignificant. We measure investor protection using the PROTEC variable, whichrefers to a country’s law and order score from ICRG.
Within a two-stage least squares (2SLS) framework, we estimate Eqs. (2a) and(2b). In the first stage, we estimate the equation of the determinants of ownershipconcentration, LCONCit, and obtain the fitted (estimated) values (with industry andregion fixed-effects). In the second stage, we use these fitted values of ownershipconcentration as instruments for LCONCit (Eq. (2a)) to estimate the impact ofownership concentration on firm performance.
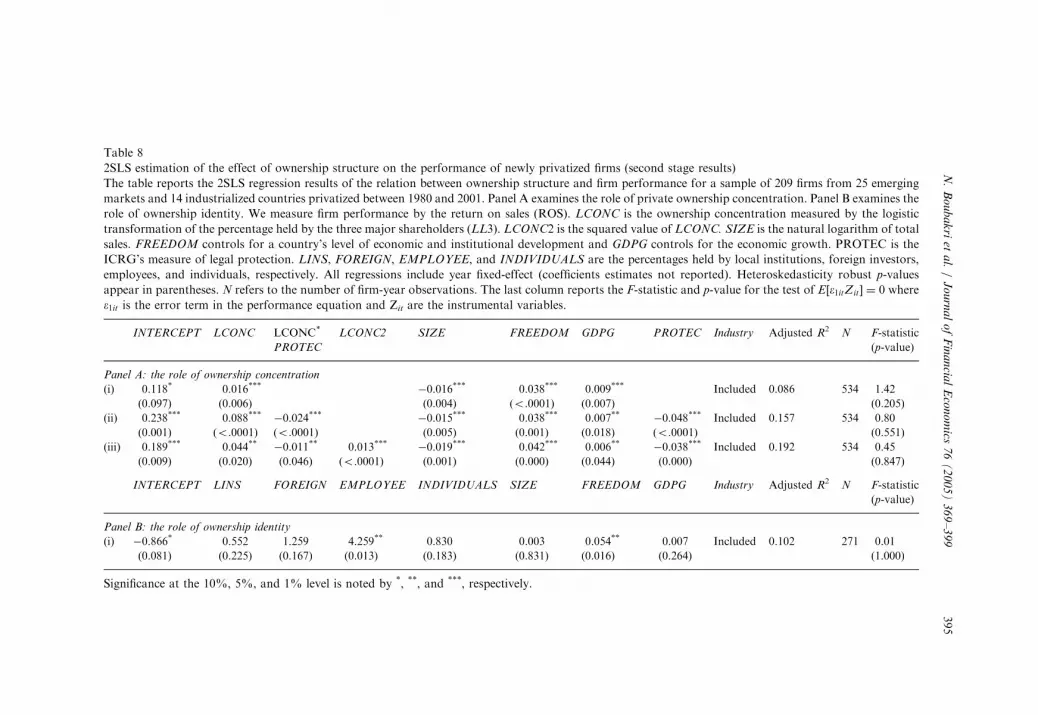
We estimate three specifications of Eq. (2a) and report the estimation results inTable 8. The results of the regression that restrains the parameter y2 to zero(specification (i)) suggest that after we control for firm size and industry, cross-country differences in the institutional environment, and economic growth,ownership concentration is significantly related to firm performance.13 This resultsupports Shleifer and Vishny’s (1997) contention that postprivatization diffusedownership structure (and thus an increase in the agency costs of managerial control)may lead to disappointing performance. Further, FREEDOM and GDP growth are
12We also use an alternative approach using the method of privatization as an instrument, since
ownership concentration could have an impact on performance through private sales. To do so, we use the
following set of instruments: PS, RISK, SIZE, and LATE. We drop LAW, GINI, and GS since Megginson
et al. (2004) show the endogeneity of the method of privatization to country-level institutional variables.
The results, unreported here, are identical to the ones we obtain with the other set of instruments and the
adjusted R2 remains the same.13We use ROS as our measure of firm performance. The results with ROA or ROE, which are available
from the authors, are qualitatively similar.
ARTICLE IN PRESS
N. Boubakri et al. / Journal of Financial Economics 76 (2005) 369–399394
positively and significantly correlated with performance. The positive effect ofFREEDOM suggests that firms achieve higher performance improvements whenthey are privatized in countries with better economic perspectives and legalinstitutions. The negative and significant coefficient estimate for SIZE suggests thatsmall SOEs are more likely to adapt to a change in the environment.
We also control for industry characteristics and year-specific effects. An F-test fortesting the null hypothesis of equal effects through industries shows a strongrejection for all specifications. An examination of industry effects indicates asuperior performance for noncompetitive firms (i.e., utilities and telecommunication)and for firms from the financial sector. None of the year effects is significant for thethree specifications.
We estimate an alternative specification (ii) of Eq. (2a) that does not restrain tozero the parameter y2 for an interaction between ownership concentration andinvestor protection. We note that performance and ownership concentrationcontinue to be positively and significantly correlated.
More important, we find that the interaction variable LCONC�PROTEC has anegative and significant impact on performance. This finding suggests that thepositive effect of ownership concentration on performance is stronger whereverinvestor protection is weaker. The result also supports the conjecture that ownershipconcentration (an internal governance mechanism) can substitute for investorprotection (an external governance mechanism) and provide effective monitoring.
We also show that PROTEC has a negative and significant effect on performance,suggesting that firms in countries with low investor protection perform better. Thisresult should be interpreted together with the previous findings on the impact ofownership concentration and its interaction with investor protection on firmperformance. To compensate for the lack of an efficient legal system, investors incountries with poor investor protection rely on governance structures that arebasically dominated by highly concentrated ownership. The variable SIZE has asignificant and negative effect on performance. The country-level control variablesindicate that FREEDOM and GDPG remain positive and significant.
Several authors provide evidence of nonlinearities in the ownership-performancerelation (Morck et al., 1988; McConnell and Servaes, 1990; Claessens and Djankov,1999; Himmelberg et al., 1999). To check for this possibility, we extend specification(ii) to include the instrumented LCONC and its squared variable (LCONC)2 inspecification (iii). We find that the estimated coefficient of the squared term(LCONC)2 is positive and significant at the 1% level.
Throughout the three specifications, we check whether the error term isuncorrelated with the instrumental variables Zit, , i.e. Eð�1itZitÞ ¼ 0: The F-statisticsreported in the last column of Table 8 imply that we cannot reject the null hypothesisof no correlation between the error terms and instruments, suggesting that oursystem of equations is properly identified.
The use of the instrumental variable approach might also suggest that we aremeasuring the effect of one or more particular instruments on firm performancerather than the effect of ownership concentration on firm performance (Palia, 2001).We check for this possibility by regressing firm performance on the instruments Zit.
ARTIC
LEIN
PRES
S
Table 8
2SLS estimation of the effect of ownership structure on the performance of newly privatized firms (second stage results)
The table reports the 2SLS regression results of the relation between ownership structure and firm performance for a sample of 209 firms from 25 emerging
markets and 14 industrialized countries privatized between 1980 and 2001. Panel A examines the role of private ownership concentration. Panel B examines the
role of ownership identity. We measure firm performance by the return on sales (ROS). LCONC is the ownership concentration measured by the logistic
transformation of the percentage held by the three major shareholders (LL3). LCONC2 is the squared value of LCONC. SIZE is the natural logarithm of total
sales. FREEDOM controls for a country’s level of economic and institutional development and GDPG controls for the economic growth. PROTEC is the
ICRG’s measure of legal protection. LINS, FOREIGN, EMPLOYEE, and INDIVIDUALS are the percentages held by local institutions, foreign investors,
employees, and individuals, respectively. All regressions include year fixed-effect (coefficients estimates not reported). Heteroskedasticity robust p-values
appear in parentheses. N refers to the number of firm-year observations. The last column reports the F-statistic and p-value for the test of E½�1itZit� ¼ 0 where
�1it is the error term in the performance equation and Zit are the instrumental variables.
INTERCEPT LCONC LCONC* LCONC2 SIZE FREEDOM GDPG PROTEC Industry Adjusted R2 N F-statistic
PROTEC (p-value)
Panel A: the role of ownership concentration
(i) 0.118* 0.016***�0.016*** 0.038*** 0.009*** Included 0.086 534 1.42
(0.097) (0.006) (0.004) (o.0001) (0.007) (0.205)
(ii) 0.238*** 0.088***�0.024***
�0.015*** 0.038*** 0.007**�0.048*** Included 0.157 534 0.80
(0.001) (o.0001) (o.0001) (0.005) (0.001) (0.018) (o.0001) (0.551)
(iii) 0.189*** 0.044**�0.011** 0.013***
�0.019*** 0.042*** 0.006**�0.038*** Included 0.192 534 0.45
(0.009) (0.020) (0.046) (o.0001) (0.001) (0.000) (0.044) (0.000) (0.847)
INTERCEPT LINS FOREIGN EMPLOYEE INDIVIDUALS SIZE FREEDOM GDPG Industry Adjusted R2 N F-statistic
(p-value)
Panel B: the role of ownership identity
(i) �0.866* 0.552 1.259 4.259** 0.830 0.003 0.054** 0.007 Included 0.102 271 0.01
(0.081) (0.225) (0.167) (0.013) (0.183) (0.831) (0.016) (0.264) (1.000)
Significance at the 10%, 5%, and 1% level is noted by *, **, and ***, respectively.
N.
Bo
ub
ak
riet
al.
/J
ou
rna
lo
fF
ina
ncia
lE
con
om
ics7
6(
20
05
)3
69
–3
99
395

ARTICLE IN PRESS
N. Boubakri et al. / Journal of Financial Economics 76 (2005) 369–399396
The results, not reported here but available from the authors, show that only theinstruments RISK and GINI are statistically significant at the 5% level. The adjustedR2 of 0.05 is very low compared to 0.40 obtained in the regression of ownershipconcentration on these instruments. When we conduct an F-test for the jointsignificance of the instruments, we cannot reject the hypothesis that the instrumentsare jointly zero for the performance regression (F-statistic ¼ 1.66, p-value ¼ 0.1977),though we can reject this hypothesis at the 1% level for the ownership concentrationregression (F-statistic ¼ 26.07, p-value ¼ o.0001). These results suggest that ourinstrumental variable approach mainly captures the effect of ownership concentra-tion on firm performance.
5.3. The relation between ownership Identity and performance
So far, we have examined only the relation between ownership structure and firmperformance along the ownership concentration dimension. However, the identity ofowners could also be relevant in analyzing the postprivatization ownership-performance relation (Boycko et al., 1996; Dyck, 2001). Different types of ownersmay have distinct incentives and abilities to control the postprivatization managers.Therefore, it is ultimately the extent of this control that determines the firm’sperformance. Thus, we assess the impact of the different types of owner, as identifiedin Section III, on the performance of NPFs.
To do so, we perform a multivariate regression analysis in which we use the sharesheld by various stakeholders while controlling for the firm’s size, and the country’sinstitutional environment and economic growth. We formulate the following set ofequations:
PERF it ¼ dþX
j
yjOWNijt þ b1FLV 1it þ W1CLV 1it þ gþ �1it; (3a)
OWNijt ¼ a2 þ b2FLV 2it þ W2CLV 2it þ �2it; (3b)
where OWNijt is the percentage of shares held by the owner of type j (j refers to thefour types of private shareholders, namely, local institutions, foreign investors,individuals, and employees) of firm i at time t.
To estimate the system of Eqs. (3a) and (3b), we instrument each type of ownerOWN using the same set of instruments as in Eq. (2b). The idea is that the percentageheld by certain types of owners could be endogenously determined by publicinformation released from the privatization process.
Panel B of Table 8 reports the results from the estimation of Eqs. (3a) and (3b).First, local institutions’ ownership has a positive, although insignificant, impact onthe firm’s performance, suggesting that local institutions may be an effectivemechanism of postprivatization corporate governance. We also show that ownershipby individuals has a positive influence on performance. Surprisingly, our resultssuggest no significant association between firm performance and ownership byforeign investors. At first sight, this result is puzzling, because it contradicts thetheoretical contentions of Boycko et al. (1996) and Dyck (2001) that foreign

ARTICLE IN PRESS
N. Boubakri et al. / Journal of Financial Economics 76 (2005) 369–399 397
investors are the source of better governance and higher performance. Yet, Frydmanet al. (1999) and Cull et al. (2002) find a similar result in that domestic outsiders dobetter than foreign investors in newly privatized firms in the Czech Republic. Theauthors argue that perhaps foreign owners are not initially at ease in an environmentthat is relatively unknown to them, and that the transfer of know-how may requiremore time than their sample period allows.
We also find a significant relation between the firm’s performance and employees’ownership. To some extent, this result disagrees with Boycko et al. (1996) predictionthat employees make poor stockholders/monitors. Among the control variables, thelevel of institutional development is positively related to firm performance, but noneof the time effects is significant.
6. Conclusion
In this paper, we investigate the relation between investor protection, ownershipstructure, and firm performance. To do so, we use a unique sample of 209 firms thatencompasses both emerging markets (25) and industrialized countries (14) that wereprivatized between 1980 and 2001. The detailed data on the firms’ ownershipstructure shows that privatization mostly benefited local institutions. Indeed, muchof the decrease in government ownership is absorbed by local institutions, followedby individuals and foreign investors. Over the three years following privatization,local institutions and foreign investors keep increasing their stakes while individuals’postprivatization ownership remains constant. As for employees, their smallparticipation declines over time.
Next, we examine the cross-firm differences in ownership concentration afterprivatization. Based on panel data, our results show that country-level variables(i.e., the level of investor protection, political and social stabilities) and variablesrelated to the privatization process (the method of sale) are key determinants of theextent of postprivatization ownership concentration. We also find that firm size,sales growth, and industry affiliation explain the cross-firm differences in ownershipconcentration.
Finally, using a methodology that controls for the endogeneity of ownership, weshow that firm ownership concentration is positively related to firm performance.We find that the effect of ownership concentration on firm performance is strongerin those countries in which investor protection is weaker. These results suggestthat ownership concentration is a key mechanism of corporate governance insuch countries.
Taken together, our results, obtained in the context of privatization, shed light onthe functioning of corporate governance, particularly the role of ownershipconcentration and investor protection. Our results should also provide a newperspective for the ongoing debate on corporate governance reforms. Althoughownership concentration is an effective internal mechanism of corporate governance,it marginalizes (as suggested by several researchers, e.g., Holmstrom and Tirole,1993) other external mechanisms of corporate governance (e.g., development of
ARTICLE IN PRESS
N. Boubakri et al. / Journal of Financial Economics 76 (2005) 369–399398
financial markets). Ownership concentration also impedes any effort to improve theefficiency of other institutions for corporate governance (e.g., legal institutions).
References
Bekaert, G., Harvey, C.R., Lundblad, C., 2001. Emerging equity markets and economic development.
Journal of Development Economics 66, 465–504.
Biais, B., Perotti, E., 2002. Machiavellian privatization. American Economic Review 92, 240–258.
Birdsall, N., Nellis, J., 2002. Winners and losers: assessing the distributional impact of privatization.
Center for Global Development Working Paper No. 6, Washington.
Bortolotti, B., Fantini, M., Siniscalco, D., Vitalini, S., 2000. Privatization and institutions: a cross-country
analysis. CESifo working paper series No. 375.
Bortolotti, B., Fantini, M., Scarpa, C., 2002. Why do governments privatize abroad? International Review
of Finance 3, 131–161.
Bortolotti, B., Fantini, M., Siniscalco, D., 2004. Privatization around the world: new evidence from panel
data. Journal of Public Economics, 305–332.
Boubakri, N., Cosset, J.-C., 1998. The financial and operating performance of newly privatized firms:
evidence from developing countries. Journal of Finance 53, 1081–1110.
Boutchkova, M.K., Megginson, W., 2000. The impact of privatization on capital market development and
individual share ownership. Financial Management 29, 67–77.
Boycko, M., Shleifer, A., Vishny, R., 1996. A theory of privatization. The Economic Journal 106, 309–319.
Claessens, S., Djankov, S., 1999. Ownership concentration and corporate performance in the Czech
Republic. Journal of Comparative Economics 27, 498–513.
Cull, R., Matesova, J., Shirley, M., 2002. Ownership and the temptation to loot: evidence from privatized
firms in the Czech Republic. Journal of Comparative Economics 30, 1–24.
Demsetz, H., 1997. The firm in economic theory: a quiet revolution. American Economic Review 87,
426–429.
Demsetz, H., Lehn, K., 1985. The structure of corporate ownership: causes and consequences. Journal of
Political Economy 93, 1155–1177.
Demsetz, H., Villalonga, B., 2001. Ownership structure and corporate performance. Journal of Corporate
Finance 7, 209–233.
Denis, D.K., McConnell, J.J., 2003. International corporate governance. Journal of Financial and
Quantitative Analysis 38, 1–36.
Dewenter, K.L., Malatesta, P.H., 2001. State-owned and privately owned firms: an empirical analysis of
profitability, leverage, and labor intensity. American Economic Review 91, 320–334.
Djankov, S., Murrell, P., 2002. Enterprise restructuring in transition: a quantitative survey. Journal of
Economic Literature, 739–792.
D’Souza, J., Megginson, W., 1999. The financial and operating performance of privatized firms during the
1990s. Journal of Finance 54, 1397–1438.
Dyck, A., 2001. Privatization and corporate governance: principles, evidence, and future challenges. The
World Bank Research Observer 16, 59–84.
Dyck, A., Zingales, L., 2004. Private benefits of control: an international comparison. Journal of Finance
59, 537–600.
Frydman, R., Gray, C.W., Hessel, M., Rapaczynski, A., 1999. When does privatization work? The impact
of private ownership on corporate performance in transition economies. Quarterly Journal of
Economics 114, 1153–1191.
Galiani, S., Gertler, P., Schargrodsky, E., 2001. Water for life: the impact of the privatization of water
services on child mortality. Working paper, University of California, Berkeley.
Gupta, N., 2005. Partial privatization and firm performance. Journal of Finance, forthcoming.
Himmelberg, C.P., Hubbard, G., Palia, D., 1999. Understanding the determinants of managerial
ownership and the link between ownership and performance. Journal of Financial Economics 53,
353–384.

ARTICLE IN PRESS
N. Boubakri et al. / Journal of Financial Economics 76 (2005) 369–399 399
Holmstrom, B., Tirole, J., 1993. Market liquidity and performance monitoring. Journal of Political
Economy 101, 678–709.
Klemperer, P., 2002. What really matters in auction design? Journal of Economic Perspectives 16,
169–190.
La Porta, R., Lopez-de-Silanes, F., Shleifer, A., Vishny, R., 1998. Law and Finance. Journal of Political
Economy 106, 1113–1150.
La Porta, R., Lopez-de-Silanes, F., Shleifer, A., Vishny, R., 2000. Investor protection and corporate
governance. Journal of Financial Economics 58, 3–27.
La Porta, R., Lopez-de-Silanes, F., Shleifer, A., 2002. Government ownership of banks. Journal of
Finance 57, 265–301.
McConnell, J., Servaes, H., 1990. Additional evidence on equity ownership and corporate value. Journal
of Financial Economics 27, 595–612.
Megginson, W., 2003. Appendix 1: details of share issue privatizations, 1961–2002. In: Megginson, W.L.
(Ed.), Financial Economics of Privatization. Oxford University Press, New York.
Megginson, W., Netter, J.N., 2001. From state to market: a survey of empirical studies on privatization.
Journal of Economic Literature 39, 321–389.
Megginson, W., Nash, R., van Randenborgh, M., 1994. The financial and operating performance of newly
privatized firms: an international empirical analysis. Journal of Finance 49, 403–452.
Megginson, W., Nash, R., Netter, J.N., Poulsen, A.B., 2004. The choice of private versus public capital
markets: evidence from privatization. Journal of Finance 59, 2835–2870.
Morck, R., Shleifer, A., Vishny, R., 1988. Management ownership and corporate performance: an
empirical analysis. Journal of Financial Economics 20, 293–315.
Nellis, J., 2003. Privatization in Africa: What has happened? What is to be done? Working paper. Center
for Global Development, Washington.
Palia, D., 2001. The endogeneity of managerial compensation in firm valuation: a solution. Review of
Financial Studies 14, 735–764.
Perotti, E., 1995. Credible privatization. American Economic Review 85, 847–859.
Perotti, E., Guney, S.E., 1993. Successful privatization plans: enhanced credibility through timing and
pricing of sales. Financial Management 22, 84–98.
Perotti, E., van Oijen, P., 2001. Privatization, market development, and political risk in emerging
economies. Journal of International Money and Finance 20, 43–69.
Shleifer, A., Vishny, R., 1997. A survey of corporate governance. Journal of Finance 52, 737–777.
Svejnar, J., 2002. Transition economies: performance and challenges. Journal of Economic Perspectives
16, 3–28.
Wallsten, S.J., 2001. An econometric analysis of telecom competition, privatization, and regulation in
Africa and Latin America. Journal of Industrial Economics 49, 1–19.


