Embed Size (px)
Citation preview
A&A 656, A63 (2021)https://doi.org/10.1051/0004-6361/202141146c© ESO 2021
Astronomy&Astrophysics
Tracking the evolution of the accretion flow in MAXI J1820+070during its hard state with the JED-SAD model
A. Marino1,2,3 , S. Barnier4, P. O. Petrucci4, M. Del Santo2, J. Malzac3, J. Ferreira4, G. Marcel5, A. Segreto2,S. E. Motta6, A. D’Aì2, T. Di Salvo1, S. Guillot7,8, and T. D. Russell2
1 Università degli Studi di Palermo, Dipartimento di Fisica e Chimica, via Archirafi 36, 90123 Palermo, Italye-mail: [email protected]
2 INAF/IASF Palermo, via Ugo La Malfa 153, 90146 Palermo, Italy3 IRAP, Université de Toulouse, CNRS, UPS, CNES, Toulouse, France4 Univ. Grenoble Alpes, CNRS, IPAG, 38000 Grenoble, France5 Institute of Astronomy, University of Cambridge, Madingley Road, Cambridge CB3 0HA, UK6 Istituto Nazionale di Astrofisica, Osservatorio Astronomico di Brera, via E. Bianchi 46, 23807 Merate (LC), Italy7 CNRS, IRAP, 9 avenue du Colonel Roche, BP 44346, 31028 Toulouse Cedex 4, France8 Université de Toulouse, CNES, UPS-OMP, 31028 Toulouse, France
Received 20 April 2021 / Accepted 31 August 2021
ABSTRACT
Context. X-ray binaries in outburst typically show two canonical X-ray spectral states (i.e., hard and soft states), as well as differ-ent intermediate states, in which the physical properties of the accretion flow are known to change. However, the truncation of theoptically thick disk and the geometry of the optically thin accretion flow (corona) in the hard state are still debated. Recently, theJED-SAD paradigm has been proposed for black hole X-ray binaries, aimed at addressing the topic of accretion and ejection and theirinterplay in these systems. According to this model, the accretion flow is composed of an outer standard Shakura-Sunyaev disk (SAD)and an inner hot jet emitting disk (JED). The JED produces both hard X-ray emission, effectively playing the role of the hot corona,and radio jets. The disruption of the JED at the transition to the soft state coincides with the quenching of the jet.Aims. In this paper we use the JED-SAD model to describe the evolution of the accretion flow in the black hole transientMAXI J1820+070 during its hard and hard-intermediate states. Unlike the previous applications of this model, the Compton re-flection component has been taken into account.Methods. We use eight broadband X-ray spectra, including NuSTAR, NICER, and the Neil Gehrels Swift Observatory data, providinga total spectral coverage of 0.8–190 keV. The data were directly fitted with the JED-SAD model. We performed the procedure twice,considering two different values for the innermost stable circular orbit (ISCO): 4 RG (a∗ = 0.55) and 2 RG (a∗ = 0.95).Results. Our results suggest that the optically thick disk (the SAD) does not extend down to the ISCO in any of the consideredepochs. In particular, assuming RISCO = 4 RG, as the system evolves toward the transitional hard-intermediate state, we find an innerradius within a range of ∼60 RG in the first observation down to ∼30 RG in the last one. The decrease of the inner edge of the SADis accompanied by an increase in the mass-accretion rate. However, when we assume RISCO = 2 we find that the mass accretion rateremains constant and the evolution of the accretion flow is driven by the decrease in the sonic Mach number mS , which is unexpected.In all hard–intermediate state observations, two reflection components, characterized by different values of ionization, are required toadequately explain the data. These components likely originate from different regions of the SAD.Conclusions. The analysis performed provides a coherent physical evolution of the accretion flow in the hard and hard-intermediatestates and supports a truncated disk scenario. We show that a flared outer disk could, in principle, explain the double reflectioncomponent. The odd results obtained for RISCO = 2 RG can also be considered as further evidence that MAXI J1820+070 harbors amoderately spinning black hole, as suggested in other works.
Key words. X-rays: binaries – accretion, accretion disks – ISM: jets and outflows – X-rays: individuals: MAXI J1820+070
1. Introduction
A black hole (BH) X-ray binary (XRB) is a binary system com-posed of a stellar mass BH accreting matter from a compan-ion star (see Done et al. 2007, for a general review). Almostall known black hole XRBs are transients (BHTs): they spendmost of the time in a quiescent state, at low X-ray luminosity(i.e., below ∼1031 erg s−1), but can display sudden episodes ofincreased X-ray activity called outbursts (with X-ray luminosityup to ∼1038−1039 erg s−1 at the peak). When in outburst thesesystems can be found in a variety of accretion states charac-terized by different broadband X-ray spectral shape and timingproperties (see Remillard & McClintock 2006; Dunn et al. 2010;
Belloni et al. 2016, for reviews). In particular, we distinguishbetween the hard and soft spectral states (HS and SS, respec-tively). The HS is characterized by a cutoff (around 100 keVwhen detected) power-law-like spectrum extending up to highenergies, and a cool (kTdisc ∼ 0.1−0.3 keV) multi-color diskblackbody. In the SS the spectra are dominated by a hotter multi-color disk blackbody component (kTdisc ∼ 0.8−1.0 keV), andsometimes an additional steeper hard tail is detected as well. Inall these states, a further contribution to the overall spectrum isgiven by the reflection component, a component thought to bedue to the hot photons emitted by the corona reprocessing on theaccretion disk (see below). The study of the reflection compo-nent, and in particular of the relativistically broadened Fe K line
Article published by EDP Sciences A63, page 1 of 15
A&A 656, A63 (2021)
at 6.4 keV, can be used as a powerful diagnostics tool to infer theinner radius and ionization of the accretion disk and the inclina-tion of the system, for example (see, e.g., Reynolds & Nowak2003, for a review).
The variety of spectral states in BHTs has traditionally beeninterpreted as being due to different physical properties andgeometry of the accretion flow around the BH. In the HS it isthought that the emission is due to thermal Comptonization bya hot optically thin electron plasma (corona). The source of softseed photons is the (possibly truncated) optically thick accretiondisk (Shakura & Sunyaev 1973). Conversely, in the SS such adisk is expected to extend down to the innermost stable circularorbit (ISCO, Bardeen et al. 1972) and only a marginal contribu-tion from the corona is observed. However, the consensus on thetruncated disk model is not global, and a number of counterargu-ments have been given as well (see, e.g., Zdziarski & De Marco2020, for an extensive discussion on the topic). Among the crit-ical issues, spectral modeling of seemingly broad Fe K lines inBHTs indicated that the optically thick disk was close or evencoincident with the ISCO well within the hard state (examplesof these can be found in Miller et al. 2006; Tomsick et al. 2008;García et al. 2015).
The controversies on the accretion flow geometry acrossspectral states is one of the open problems regarding BHTs.When transients rise from quiescence, their spectral evolutionusually follows a standard path: the system moves from qui-escence to the hard state, increasing in luminosity by severalorders of magnitude, then evolves through the hard-intermediate(HIMS) and soft-intermediate (SIMS) up to the soft state. There-after, the luminosity decreases and the source exhibits the sametransition in reverse but at a much lower luminosity. The com-mon behavior of BHTs in making transitions from hard to softand from soft to hard states at different luminosities is called hys-teresis (Miyamoto et al. 1995; Zdziarski et al. 2004). The originof this pattern is a matter of strong debate. It is also noteworthythat a relevant fraction of BH binaries (about 40%, Tetarenkoet al. 2016a) are “hard-only” or have displayed “failed transi-tion” outbursts (see, e.g., Hynes et al. 2000; Brocksopp et al.2004; Capitanio et al. 2009; Ferrigno et al. 2012; Del Santo et al.2016; Bassi et al. 2019; de Haas et al. 2021). BHTs are knownto launch mildly relativistic jets, which accounts for the emis-sion from these systems over radio and mid-IR frequencies. Jetsare observed only in the HS and HIMS, while they are quenchedaround the transition to the SS (Fender et al. 1999; Corbel et al.2000; Fender & Belloni 2004; Russell et al. 2020) and a short-lived transient jet can be launched (e.g., Fender & Belloni 2004;Fender et al. 2010; Rushton et al. 2017; Russell et al. 2019). Athird critical ingredient is represented by how the X-ray timingproperties (i.e., X-rays periodic and aperiodic variability) changeaccording to the accretion state of BHTs. In this context oneof the most intriguing challenges consists in the interpretationof quasi-periodic oscillations (QPOs), the peaks observed in theX-ray Fourier power density spectra of BHTs, which are corre-lated with the spectral evolution of the systems (see Ingram &Motta 2019; Motta et al. 2021, for recent reviews).
Much effort has been dedicated to interpreting the multi-wavelength spectral behavior and the timing properties of BHbinaries in outburst. However, taking into account the correlationbetween accretion and ejection has proven to be difficult. A firstattempt to describe globally such complex behavior was made byEsin et al. (1997), who proposed a multi-flow configuration forthe disk. According to these authors, the accretion flow aroundBHs would consist of an outer Shakura-Sunyaev accretion diskand an inner, less dense, and radiatively inefficient plasma phase,
called advection dominated accretion flow (ADAF, Narayan &Yi 1995; Yuan 2001). However, the model suffered several weak-nesses; in particular, it was not able to reproduce hard states atluminosities comparable to the Eddington limit (see the Intro-duction of Marcel et al. 2018b, for an extensive discussion on thetopic). In the following decade many updates were made to themodel (see, e.g. Yuan 2001; Meier 2005; Xie & Yuan 2012) tomake it more suitable to describe the increasing number of X-rayobservations of BHTs. However, the correlation between accre-tion flow and jets has not been addressed in any of the updatedversions of the model.
An attempt to connect accretion and ejection in a unifiedmodel has been recently reported in a number of papers (Ferreiraet al. 2006; Marcel et al. 2018a,b, 2019, 2020). This model con-nects the spectral evolution BHTs in outbursts to changes in themulti-flow configuration of the accretion disk, similarly to theapproach of Esin et al. (1997), among others. The main noveltyof this paradigm consists in its ability to also explain the appear-ance and disappearance of the jet and their correlation with theaccretion flow. According to this model, the accretion disk isthreaded with a large-scale vertical magnetic field BZ(R). Recentnumerical simulations have shown that such magnetic fieldsbecome stronger near the compact object (e.g., Liska et al. 2018).As a consequence, the accretion flow is also expected to becomemore magnetized as we approach the inner edge of the disk. In
the following we define the magnetization as µ(R) =B2
Z(R)µ0Ptot
, with
Ptot the total pressure (radiation plus gas). In the outer regions ofthe disk µ � 1, and particles are barely affected by the presenceof the vertical magnetic field. As a consequence, jet launching isinactive in this region of the disk. In order to launch magneto-centrifugally driven jets (Blandford & Payne 1982), it has beenshown that µ &0.1 must be achieved (Ferreira & Pelletier 1995;Ferreira 1997; Jacquemin-Ide et al. 2019). For µ < 10−3 orless, magnetic winds can be launched, possibly carrying awaya significant fraction of the mass. However, these winds exerta negligible torque on the underlying disk (Zhu & Stone 2018;Jacquemin-Ide et al. 2021). At these distances from the BH, par-ticles are only subject to the torque due to the internal turbulentviscosity, so that the disk can be nicely described with the classicShakura & Sunyaev (1973) model. The inner regions are insteadhighly magnetized, with µ beyond the 0.1 threshold, and power-ful jets can be launched. Jets carry away mass, energy, and angu-lar momentum, and thus exert an additional torque (see, e.g.,Ferreira & Pelletier 1993, 1995). Subsequently, accretion pro-ceeds here at supersonic velocity, much higher than in theShakura-Sunyaev accretion disk, and plasma in the internalregions of the accretion flow result more rarefied. In summary,the accretion flow surrounding the BH has a two-flow configu-ration. It is composed of a Shakura-Sunyaev disk in the outerregions of the flow, defined as a standard accretion disk (SAD),and an inner, less dense, and optically thin jet emitting disk(JED) (Ferreira et al. 2006). The JED shares the same physi-cal properties of the hot corona, but additionally it also drivesjets. Quite intuitively, each accretion state could be obtained bymixing these ingredients with different quantities, specificallywith a hybrid JED-SAD configuration where the two realmsextend over regions of different scale. In this sense, such aconfiguration is fundamentally determined by two main con-trol parameters: the transition radius RJ between the JED andthe SAD, and the inner mass accretion flow Min feeding theBH. A detailed description of the model has been presented inMarcel et al. (2018a,b) and we refer the reader to these papersfor more details. This spectral model has been successfully
A63, page 2 of 15
A. Marino et al.: Tracking the evolution of the accretion flow in MAXI
used to reproduce the X-ray spectral evolution of the BHTGX 339−4 during four outbursts between 2001 and 2011(Marcel et al. 2019, 2020). Moreover, using the RJ−Min pairsthat best described the X-ray spectra in a HS, these authorswere also able to reproduce the jet emission observed simultane-ously in the radio band. Finally, it has been recently shown thatsome timing features could be explained within the JED-SADparadigm framework. A direct proportionality has been observedbetween the Keplerian frequency of the transition radius RJand the type C QPO frequency in four different outbursts ofGX 339−4 (Marcel et al. 2020). According to these results, thisQPO type could originate at the interface between two regions ofdifferent values of µ, being then strictly related to the existenceof two different types of accretion flow in the HS and HIMS ofBHTs (Ferreira et al. 2021).
The JED-SAD paradigm has successfully explained muchof the observed accretion and ejection phenomenology inGX 339−4. However, the variety of different behaviors observedin three decades of BHT studies (see, e.g., Dunn et al. 2010;Tetarenko et al. 2016b, for observational reviews) demands othertests of this model. In this paper we report on the application ofthe JED-SAD model to the BHT MAXI J1820+070 (ASASSN-18ey), hereafter MAXI J1820, exploiting a broad X-ray data setincluding data from NuSTAR, the Neil Gehrels Swift Observa-tory (hereafter Swift) and the Neutron Star Interior CompositionExplorer (NICER). This is the first time the JED-SAD model isapplied directly to the data through spectral fits and that Comp-ton reflection process is taken into account. It therefore repre-sents a major test for the potentialities of such paradigm.
2. MAXI J1820+070
MAXI J1820 is a BHT that was observed for the first time in theoptical band by the All-Sky Automated Search for SuperNovaeASSAS-SN (Shappee et al. 2014) on 2018 March 3 (Tucker et al.2018), and one week later by MAXI in X-rays (Kawamuro et al.2018). Detailed studies of the optical counterpart revealed thatthe system hosts a stellar-mass black hole (∼8.5 M�) accretingfrom a ∼0.4 M� companion star (Torres et al. 2019, 2020). Sinceits discovery, the source has undergone a long (approximatelyone year) and bright outburst, becoming at its peak the secondbrightest object in the X-ray sky. Due to its brightness, the sys-tem was the object of an impressive multi-wavelength observ-ing campaign (see, e.g., Shidatsu et al. 2018; Paice et al. 2019;Hoang et al. 2019; Trushkin et al. 2018; Bright et al. 2020;Tetarenko et al. 2021) and of a large number of studies. The mostrecent and precise measure of the distance, determined via radioparallax, is 3.0± 0.3 kpc (Atri et al. 2020). Furthermore, the sys-tem shows X-ray dips (Kajava et al. 2019) but not eclipses, sug-gesting an inclination between 60◦ and 80◦. Other evidence ofthe high inclination of the system are provided by optical spec-troscopy (Torres et al. 2019) and by the estimate of the inclina-tion of the jet axis (Atri et al. 2020; Wood et al. 2021), which isabout 63◦. The orbital period of the system has also been esti-mated to be around 0.68 days (Patterson et al. 2018; Torres et al.2020). In X-rays, the outburst was studied in detail in HS (see,e.g., Bharali et al. 2019; Buisson et al. 2019; Zdziarski et al.2021), SS (see, e.g., Fabian et al. 2020) and in its final phase(see, e.g., Xu et al. 2020). The truncation of the disk during theHS is one of the most controversial aspects of the system. Onthe one hand, a number of spectral-timing works have pointedout that the disk reaches the ISCO already in HS, while a con-tracting lamppost corona is responsible for the hard X-ray emis-sion (Kara et al. 2019; Buisson et al. 2019; You et al. 2021; Wang
et al. 2021). On the other hand, a truncated disk scenario has alsobeen proposed on the basis of further spectral-timing analyses,even on the same sets of data (Zdziarski et al. 2021; De Marcoet al. 2021; Axelsson & Veledina 2021).
3. Observations and data reduction
In this paper we focus on the spectral analysis of the source inthe high luminosity hard state, i.e., from ≈ MJD 58190 until ≈MJD 58300. With the aim of modeling broadband X-ray spec-tra, we included data collected by Swift/XRT, NuSTAR, NICERand the Burst Alert Telescope (BAT) onboard Swift. In orderto obtain broad-band spectra from observations close in time,we selected only XRT, NuSTAR and NICER observations whichwere quasi-simultaneous, i.e., taken not more than one day apartfrom each other. Furthermore, in order to avoid any discrepancybetween BAT and NuSTAR due to the spectral variability of thesource, we extracted BAT spectra exactly over the duration ofeach NuSTAR observation. These criteria led us to narrow downthe list of the available NuSTAR data to eight epochs. We notethat this set of NuSTAR observations has been already analyzedand described by Buisson et al. (2019). In the following, we willrefer to these observations as epochs and we will label them withnumbers from 1 to 8 in chronological order. It is worth noticingthat NICER observations cover five out of eight epochs and thatthe BAT spectrum in epoch 6 has been extracted in a longer timeinterval, due to the low number of visits performed by Swift dur-ing the NuSTAR observation. Details on the selected epochs arereported in Table 1.
3.1. XRT
The 2018 outburst of the source was monitored regularly bythe XRT telescope on board Swift from MJD 58191 (2018,March 14) until MJD 58428 (2018, November 6), with a totalof 75 observations performed in Window Timing (WT) mode.The XRT data were first reprocessed with the task xrtpipeline,included in the software package heasoft (v. 6.26.1). Thesource extraction procedure from the cleaned event files was per-formed with ds9. Since all of the observations had a high count-rate, i.e., always well above the limit for the pile-up correction inWT (100 ct/s), we used an annulus region centered on the sourcecoordinates to extract spectra not affected by pile-up. The outerradius was always chosen as ∼47′′, while the inner radius of theannulus was selected based on the registered count-rate in accor-dance with the Swift/XRT guidelines1. In particular, we used a∼18′′ inner radius for epoch 1, a ∼24′′ inner radius for epochs 2,3, 5, 6 and a ∼28′′ inner radius for epochs 4, 7, and 8. Each spec-trum was re-binned with grppha in order to have 150 counts perbin, allowing the use of the χ2 statistics.
3.2. NuSTAR
Data were reduced using the standard Nustardas task, incor-porated in Heasoft (v. 6.26.1). We extracted high scien-tific products (light curves and spectra) using a circulararea of 100′′ radius centered at RA = 18:20:22.0702, andDec = +7:10:58.331, as source region. In order to take intoaccount any background non-uniformity on the detector, weextracted the background spectra using four circles of ∼50′′ radiiin different positions with negligible contamination from the
1 https://heasarc.gsfc.nasa.gov/lheasoft/ftools/headas/xrtgrblc.html
A63, page 3 of 15
A&A 656, A63 (2021)
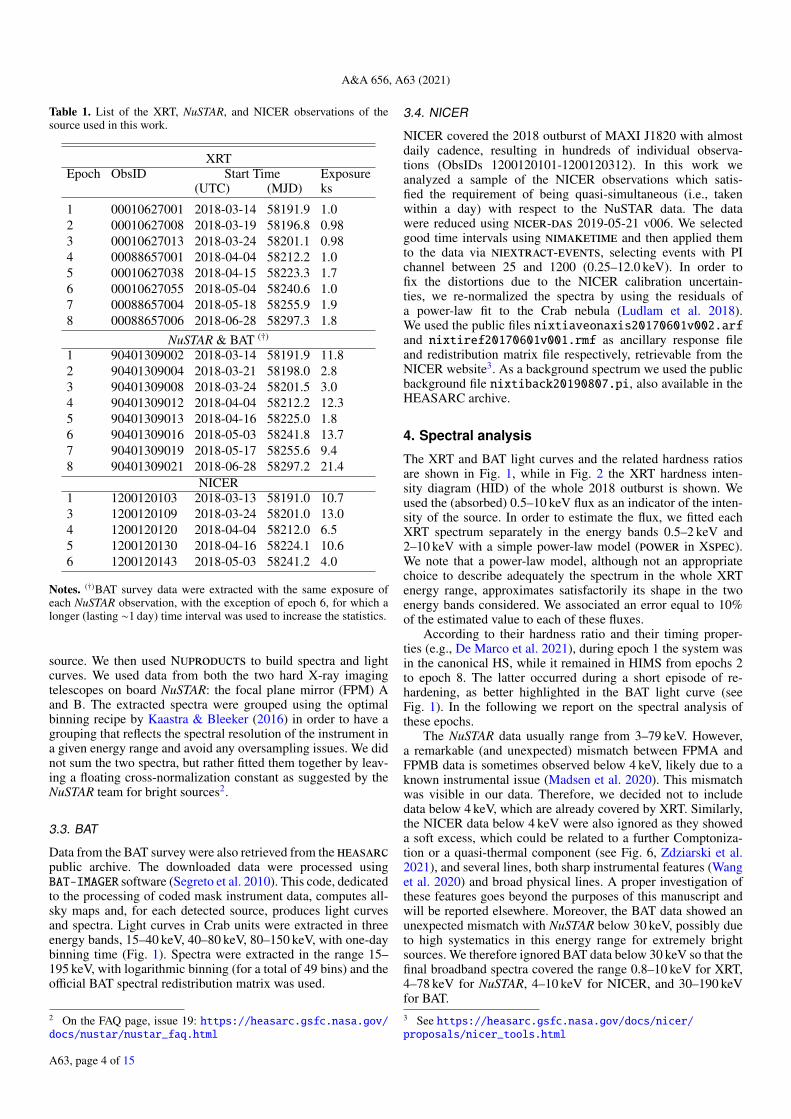
Table 1. List of the XRT, NuSTAR, and NICER observations of thesource used in this work.
XRTEpoch ObsID Start Time Exposure
(UTC) (MJD) ks
1 00010627001 2018-03-14 58191.9 1.02 00010627008 2018-03-19 58196.8 0.983 00010627013 2018-03-24 58201.1 0.984 00088657001 2018-04-04 58212.2 1.05 00010627038 2018-04-15 58223.3 1.76 00010627055 2018-05-04 58240.6 1.07 00088657004 2018-05-18 58255.9 1.98 00088657006 2018-06-28 58297.3 1.8
NuSTAR & BAT (†)
1 90401309002 2018-03-14 58191.9 11.82 90401309004 2018-03-21 58198.0 2.83 90401309008 2018-03-24 58201.5 3.04 90401309012 2018-04-04 58212.2 12.35 90401309013 2018-04-16 58225.0 1.86 90401309016 2018-05-03 58241.8 13.77 90401309019 2018-05-17 58255.6 9.48 90401309021 2018-06-28 58297.2 21.4
NICER1 1200120103 2018-03-13 58191.0 10.73 1200120109 2018-03-24 58201.0 13.04 1200120120 2018-04-04 58212.0 6.55 1200120130 2018-04-16 58224.1 10.66 1200120143 2018-05-03 58241.2 4.0
Notes. (†)BAT survey data were extracted with the same exposure ofeach NuSTAR observation, with the exception of epoch 6, for which alonger (lasting ∼1 day) time interval was used to increase the statistics.
source. We then used Nuproducts to build spectra and lightcurves. We used data from both the two hard X-ray imagingtelescopes on board NuSTAR: the focal plane mirror (FPM) Aand B. The extracted spectra were grouped using the optimalbinning recipe by Kaastra & Bleeker (2016) in order to have agrouping that reflects the spectral resolution of the instrument ina given energy range and avoid any oversampling issues. We didnot sum the two spectra, but rather fitted them together by leav-ing a floating cross-normalization constant as suggested by theNuSTAR team for bright sources2.
3.3. BAT
Data from the BAT survey were also retrieved from the heasarcpublic archive. The downloaded data were processed usingBAT-IMAGER software (Segreto et al. 2010). This code, dedicatedto the processing of coded mask instrument data, computes all-sky maps and, for each detected source, produces light curvesand spectra. Light curves in Crab units were extracted in threeenergy bands, 15–40 keV, 40–80 keV, 80–150 keV, with one-daybinning time (Fig. 1). Spectra were extracted in the range 15–195 keV, with logarithmic binning (for a total of 49 bins) and theofficial BAT spectral redistribution matrix was used.
2 On the FAQ page, issue 19: https://heasarc.gsfc.nasa.gov/docs/nustar/nustar_faq.html
3.4. NICER
NICER covered the 2018 outburst of MAXI J1820 with almostdaily cadence, resulting in hundreds of individual observa-tions (ObsIDs 1200120101-1200120312). In this work weanalyzed a sample of the NICER observations which satis-fied the requirement of being quasi-simultaneous (i.e., takenwithin a day) with respect to the NuSTAR data. The datawere reduced using nicer-das 2019-05-21 v006. We selectedgood time intervals using nimaketime and then applied themto the data via niextract-events, selecting events with PIchannel between 25 and 1200 (0.25–12.0 keV). In order tofix the distortions due to the NICER calibration uncertain-ties, we re-normalized the spectra by using the residuals ofa power-law fit to the Crab nebula (Ludlam et al. 2018).We used the public files nixtiaveonaxis20170601v002.arfand nixtiref20170601v001.rmf as ancillary response fileand redistribution matrix file respectively, retrievable from theNICER website3. As a background spectrum we used the publicbackground file nixtiback20190807.pi, also available in theHEASARC archive.
4. Spectral analysis
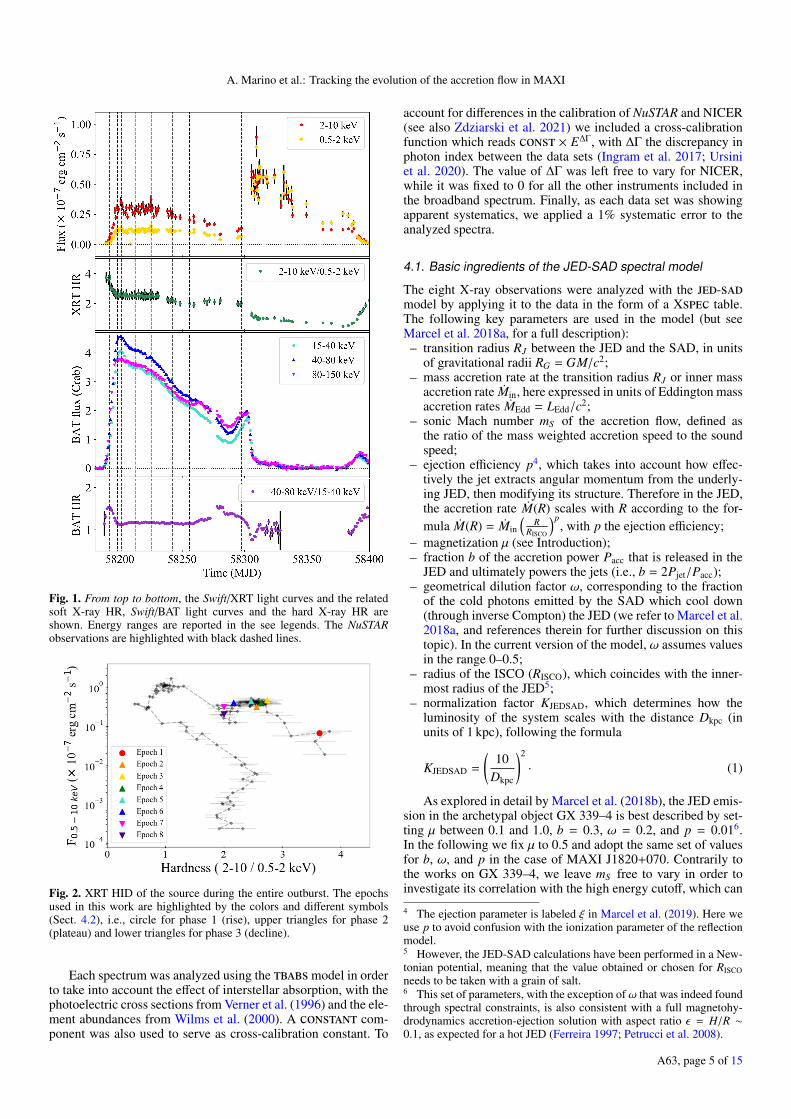
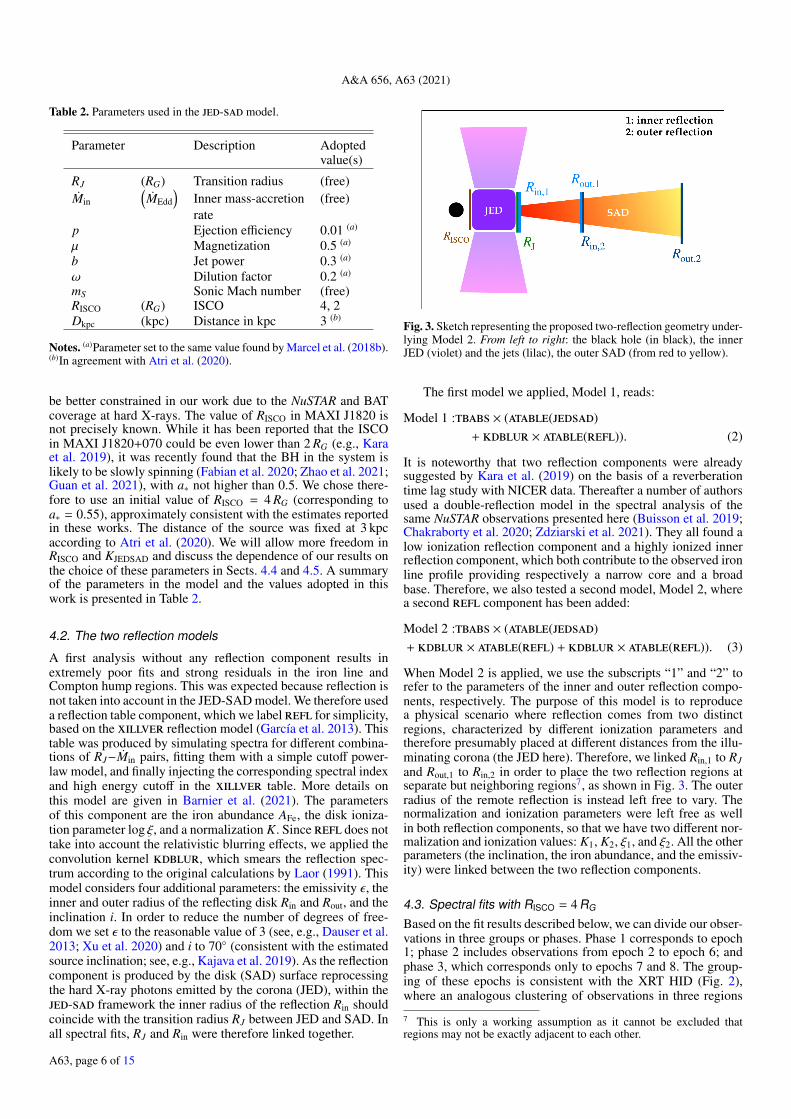
The XRT and BAT light curves and the related hardness ratiosare shown in Fig. 1, while in Fig. 2 the XRT hardness inten-sity diagram (HID) of the whole 2018 outburst is shown. Weused the (absorbed) 0.5–10 keV flux as an indicator of the inten-sity of the source. In order to estimate the flux, we fitted eachXRT spectrum separately in the energy bands 0.5–2 keV and2–10 keV with a simple power-law model (power in Xspec).We note that a power-law model, although not an appropriatechoice to describe adequately the spectrum in the whole XRTenergy range, approximates satisfactorily its shape in the twoenergy bands considered. We associated an error equal to 10%of the estimated value to each of these fluxes.
According to their hardness ratio and their timing proper-ties (e.g., De Marco et al. 2021), during epoch 1 the system wasin the canonical HS, while it remained in HIMS from epochs 2to epoch 8. The latter occurred during a short episode of re-hardening, as better highlighted in the BAT light curve (seeFig. 1). In the following we report on the spectral analysis ofthese epochs.
The NuSTAR data usually range from 3–79 keV. However,a remarkable (and unexpected) mismatch between FPMA andFPMB data is sometimes observed below 4 keV, likely due to aknown instrumental issue (Madsen et al. 2020). This mismatchwas visible in our data. Therefore, we decided not to includedata below 4 keV, which are already covered by XRT. Similarly,the NICER data below 4 keV were also ignored as they showeda soft excess, which could be related to a further Comptoniza-tion or a quasi-thermal component (see Fig. 6, Zdziarski et al.2021), and several lines, both sharp instrumental features (Wanget al. 2020) and broad physical lines. A proper investigation ofthese features goes beyond the purposes of this manuscript andwill be reported elsewhere. Moreover, the BAT data showed anunexpected mismatch with NuSTAR below 30 keV, possibly dueto high systematics in this energy range for extremely brightsources. We therefore ignored BAT data below 30 keV so that thefinal broadband spectra covered the range 0.8–10 keV for XRT,4–78 keV for NuSTAR, 4–10 keV for NICER, and 30–190 keVfor BAT.3 See https://heasarc.gsfc.nasa.gov/docs/nicer/proposals/nicer_tools.html
A63, page 4 of 15
A. Marino et al.: Tracking the evolution of the accretion flow in MAXI
Fig. 1. From top to bottom, the Swift/XRT light curves and the relatedsoft X-ray HR, Swift/BAT light curves and the hard X-ray HR areshown. Energy ranges are reported in the see legends. The NuSTARobservations are highlighted with black dashed lines.
Fig. 2. XRT HID of the source during the entire outburst. The epochsused in this work are highlighted by the colors and different symbols(Sect. 4.2), i.e., circle for phase 1 (rise), upper triangles for phase 2(plateau) and lower triangles for phase 3 (decline).
Each spectrum was analyzed using the tbabsmodel in orderto take into account the effect of interstellar absorption, with thephotoelectric cross sections from Verner et al. (1996) and the ele-ment abundances from Wilms et al. (2000). A constant com-ponent was also used to serve as cross-calibration constant. To
account for differences in the calibration of NuSTAR and NICER(see also Zdziarski et al. 2021) we included a cross-calibrationfunction which reads const × E∆Γ, with ∆Γ the discrepancy inphoton index between the data sets (Ingram et al. 2017; Ursiniet al. 2020). The value of ∆Γ was left free to vary for NICER,while it was fixed to 0 for all the other instruments included inthe broadband spectrum. Finally, as each data set was showingapparent systematics, we applied a 1% systematic error to theanalyzed spectra.
4.1. Basic ingredients of the JED-SAD spectral model
The eight X-ray observations were analyzed with the jed-sadmodel by applying it to the data in the form of a Xspec table.The following key parameters are used in the model (but seeMarcel et al. 2018a, for a full description):
– transition radius RJ between the JED and the SAD, in unitsof gravitational radii RG = GM/c2;
– mass accretion rate at the transition radius RJ or inner massaccretion rate Min, here expressed in units of Eddington massaccretion rates MEdd = LEdd/c2;
– sonic Mach number mS of the accretion flow, defined asthe ratio of the mass weighted accretion speed to the soundspeed;
– ejection efficiency p4, which takes into account how effec-tively the jet extracts angular momentum from the underly-ing JED, then modifying its structure. Therefore in the JED,the accretion rate M(R) scales with R according to the for-mula M(R) = Min
(R
RISCO
)p, with p the ejection efficiency;
– magnetization µ (see Introduction);– fraction b of the accretion power Pacc that is released in the
JED and ultimately powers the jets (i.e., b = 2Pjet/Pacc);– geometrical dilution factor ω, corresponding to the fraction
of the cold photons emitted by the SAD which cool down(through inverse Compton) the JED (we refer to Marcel et al.2018a, and references therein for further discussion on thistopic). In the current version of the model, ω assumes valuesin the range 0–0.5;
– radius of the ISCO (RISCO), which coincides with the inner-most radius of the JED5;
– normalization factor KJEDSAD, which determines how theluminosity of the system scales with the distance Dkpc (inunits of 1 kpc), following the formula
KJEDSAD =
(10
Dkpc
)2
· (1)
As explored in detail by Marcel et al. (2018b), the JED emis-sion in the archetypal object GX 339–4 is best described by set-ting µ between 0.1 and 1.0, b = 0.3, ω = 0.2, and p = 0.016.In the following we fix µ to 0.5 and adopt the same set of valuesfor b, ω, and p in the case of MAXI J1820+070. Contrarily tothe works on GX 339–4, we leave mS free to vary in order toinvestigate its correlation with the high energy cutoff, which can
4 The ejection parameter is labeled ξ in Marcel et al. (2019). Here weuse p to avoid confusion with the ionization parameter of the reflectionmodel.5 However, the JED-SAD calculations have been performed in a New-tonian potential, meaning that the value obtained or chosen for RISCOneeds to be taken with a grain of salt.6 This set of parameters, with the exception of ω that was indeed foundthrough spectral constraints, is also consistent with a full magnetohy-drodynamics accretion-ejection solution with aspect ratio ε = H/R ∼0.1, as expected for a hot JED (Ferreira 1997; Petrucci et al. 2008).
A63, page 5 of 15
A&A 656, A63 (2021)
Table 2. Parameters used in the jed-sad model.
Parameter Description Adoptedvalue(s)
RJ (RG) Transition radius (free)Min
(MEdd
)Inner mass-accretion (free)rate
p Ejection efficiency 0.01 (a)
µ Magnetization 0.5 (a)
b Jet power 0.3 (a)
ω Dilution factor 0.2 (a)
mS Sonic Mach number (free)RISCO (RG) ISCO 4, 2Dkpc (kpc) Distance in kpc 3 (b)
Notes. (a)Parameter set to the same value found by Marcel et al. (2018b).(b)In agreement with Atri et al. (2020).
be better constrained in our work due to the NuSTAR and BATcoverage at hard X-rays. The value of RISCO in MAXI J1820 isnot precisely known. While it has been reported that the ISCOin MAXI J1820+070 could be even lower than 2 RG (e.g., Karaet al. 2019), it was recently found that the BH in the system islikely to be slowly spinning (Fabian et al. 2020; Zhao et al. 2021;Guan et al. 2021), with a∗ not higher than 0.5. We chose there-fore to use an initial value of RISCO = 4 RG (corresponding toa∗ = 0.55), approximately consistent with the estimates reportedin these works. The distance of the source was fixed at 3 kpcaccording to Atri et al. (2020). We will allow more freedom inRISCO and KJEDSAD and discuss the dependence of our results onthe choice of these parameters in Sects. 4.4 and 4.5. A summaryof the parameters in the model and the values adopted in thiswork is presented in Table 2.
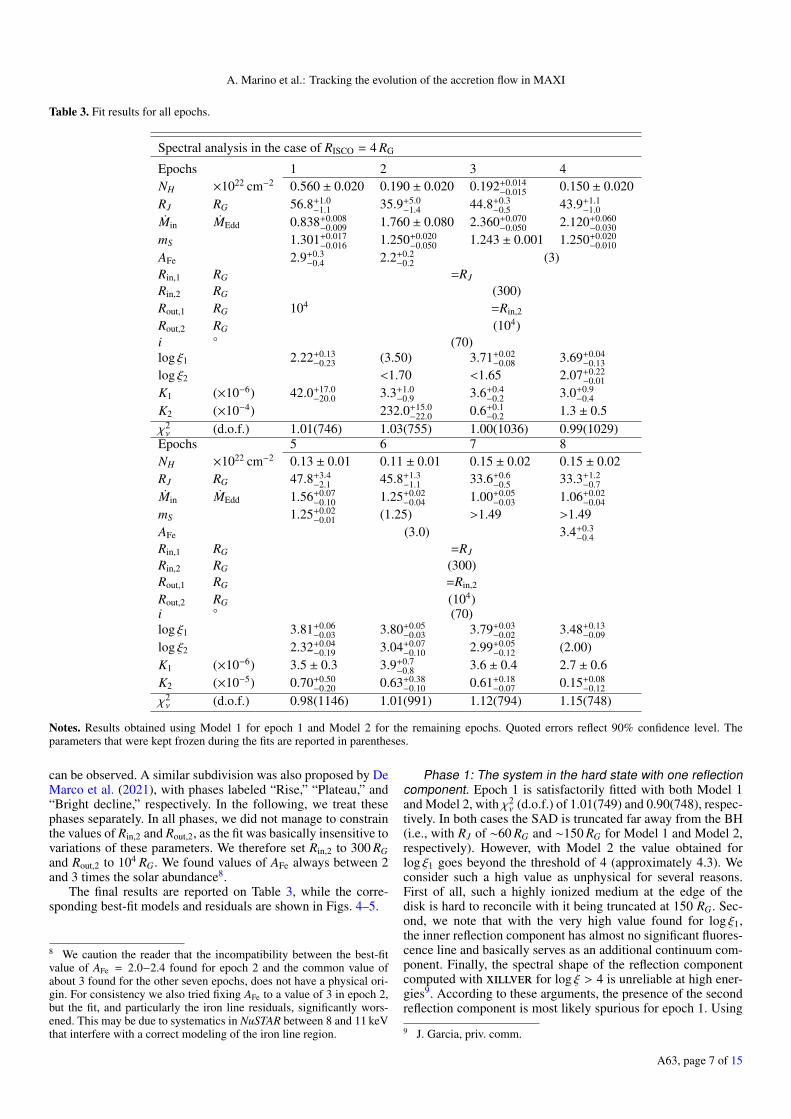
4.2. The two reflection models
A first analysis without any reflection component results inextremely poor fits and strong residuals in the iron line andCompton hump regions. This was expected because reflection isnot taken into account in the JED-SAD model. We therefore useda reflection table component, which we label refl for simplicity,based on the xillver reflection model (García et al. 2013). Thistable was produced by simulating spectra for different combina-tions of RJ−Min pairs, fitting them with a simple cutoff power-law model, and finally injecting the corresponding spectral indexand high energy cutoff in the xillver table. More details onthis model are given in Barnier et al. (2021). The parametersof this component are the iron abundance AFe, the disk ioniza-tion parameter log ξ, and a normalization K. Since refl does nottake into account the relativistic blurring effects, we applied theconvolution kernel kdblur, which smears the reflection spec-trum according to the original calculations by Laor (1991). Thismodel considers four additional parameters: the emissivity ε, theinner and outer radius of the reflecting disk Rin and Rout, and theinclination i. In order to reduce the number of degrees of free-dom we set ε to the reasonable value of 3 (see, e.g., Dauser et al.2013; Xu et al. 2020) and i to 70◦ (consistent with the estimatedsource inclination; see, e.g., Kajava et al. 2019). As the reflectioncomponent is produced by the disk (SAD) surface reprocessingthe hard X-ray photons emitted by the corona (JED), within thejed-sad framework the inner radius of the reflection Rin shouldcoincide with the transition radius RJ between JED and SAD. Inall spectral fits, RJ and Rin were therefore linked together.
Fig. 3. Sketch representing the proposed two-reflection geometry under-lying Model 2. From left to right: the black hole (in black), the innerJED (violet) and the jets (lilac), the outer SAD (from red to yellow).
The first model we applied, Model 1, reads:
Model 1 :tbabs × (atable(jedsad)+ kdblur × atable(refl)). (2)
It is noteworthy that two reflection components were alreadysuggested by Kara et al. (2019) on the basis of a reverberationtime lag study with NICER data. Thereafter a number of authorsused a double-reflection model in the spectral analysis of thesame NuSTAR observations presented here (Buisson et al. 2019;Chakraborty et al. 2020; Zdziarski et al. 2021). They all found alow ionization reflection component and a highly ionized innerreflection component, which both contribute to the observed ironline profile providing respectively a narrow core and a broadbase. Therefore, we also tested a second model, Model 2, wherea second refl component has been added:
Model 2 :tbabs × (atable(jedsad)+ kdblur × atable(refl) + kdblur × atable(refl)). (3)
When Model 2 is applied, we use the subscripts “1” and “2” torefer to the parameters of the inner and outer reflection compo-nents, respectively. The purpose of this model is to reproducea physical scenario where reflection comes from two distinctregions, characterized by different ionization parameters andtherefore presumably placed at different distances from the illu-minating corona (the JED here). Therefore, we linked Rin,1 to RJand Rout,1 to Rin,2 in order to place the two reflection regions atseparate but neighboring regions7, as shown in Fig. 3. The outerradius of the remote reflection is instead left free to vary. Thenormalization and ionization parameters were left free as wellin both reflection components, so that we have two different nor-malization and ionization values: K1, K2, ξ1, and ξ2. All the otherparameters (the inclination, the iron abundance, and the emissiv-ity) were linked between the two reflection components.
4.3. Spectral fits with RISCO = 4 RG
Based on the fit results described below, we can divide our obser-vations in three groups or phases. Phase 1 corresponds to epoch1; phase 2 includes observations from epoch 2 to epoch 6; andphase 3, which corresponds only to epochs 7 and 8. The group-ing of these epochs is consistent with the XRT HID (Fig. 2),where an analogous clustering of observations in three regions
7 This is only a working assumption as it cannot be excluded thatregions may not be exactly adjacent to each other.
A63, page 6 of 15
A. Marino et al.: Tracking the evolution of the accretion flow in MAXI
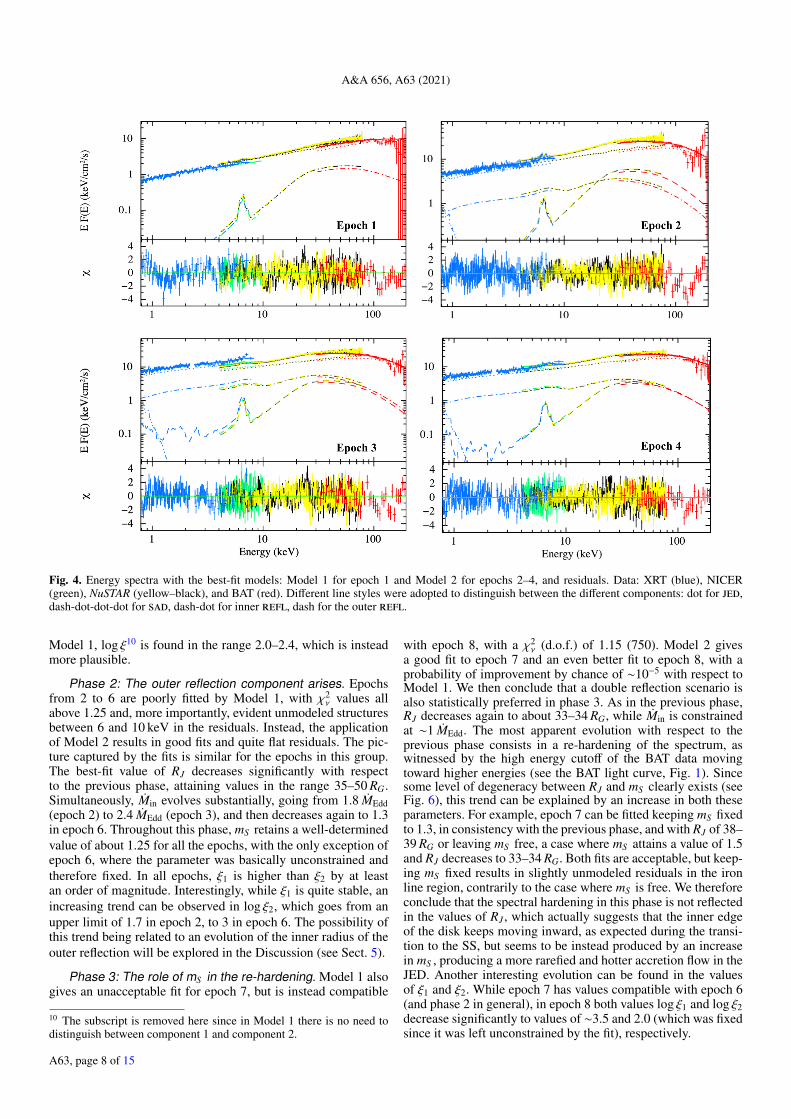
Table 3. Fit results for all epochs.
Spectral analysis in the case of RISCO = 4 RG
Epochs 1 2 3 4NH ×1022 cm−2 0.560 ± 0.020 0.190 ± 0.020 0.192+0.014
−0.015 0.150 ± 0.020RJ RG 56.8+1.0
−1.1 35.9+5.0−1.4 44.8+0.3
−0.5 43.9+1.1−1.0
Min MEdd 0.838+0.008−0.009 1.760 ± 0.080 2.360+0.070
−0.050 2.120+0.060−0.030
mS 1.301+0.017−0.016 1.250+0.020
−0.050 1.243 ± 0.001 1.250+0.020−0.010
AFe 2.9+0.3−0.4 2.2+0.2
−0.2 (3)Rin,1 RG =RJ
Rin,2 RG (300)Rout,1 RG 104 =Rin,2
Rout,2 RG (104)i ◦ (70)log ξ1 2.22+0.13
−0.23 (3.50) 3.71+0.02−0.08 3.69+0.04
−0.13log ξ2 <1.70 <1.65 2.07+0.22
−0.01K1 (×10−6) 42.0+17.0
−20.0 3.3+1.0−0.9 3.6+0.4
−0.2 3.0+0.9−0.4
K2 (×10−4) 232.0+15.0−22.0 0.6+0.1
−0.2 1.3 ± 0.5χ2ν (d.o.f.) 1.01(746) 1.03(755) 1.00(1036) 0.99(1029)
Epochs 5 6 7 8NH ×1022 cm−2 0.13 ± 0.01 0.11 ± 0.01 0.15 ± 0.02 0.15 ± 0.02RJ RG 47.8+3.4
−2.1 45.8+1.3−1.1 33.6+0.6
−0.5 33.3+1.2−0.7
Min MEdd 1.56+0.07−0.10 1.25+0.02
−0.04 1.00+0.05−0.03 1.06+0.02
−0.04mS 1.25+0.02
−0.01 (1.25) >1.49 >1.49AFe (3.0) 3.4+0.3
−0.4Rin,1 RG =RJ
Rin,2 RG (300)Rout,1 RG =Rin,2
Rout,2 RG (104)i ◦ (70)log ξ1 3.81+0.06
−0.03 3.80+0.05−0.03 3.79+0.03
−0.02 3.48+0.13−0.09
log ξ2 2.32+0.04−0.19 3.04+0.07
−0.10 2.99+0.05−0.12 (2.00)
K1 (×10−6) 3.5 ± 0.3 3.9+0.7−0.8 3.6 ± 0.4 2.7 ± 0.6
K2 (×10−5) 0.70+0.50−0.20 0.63+0.38
−0.10 0.61+0.18−0.07 0.15+0.08
−0.12χ2ν (d.o.f.) 0.98(1146) 1.01(991) 1.12(794) 1.15(748)
Notes. Results obtained using Model 1 for epoch 1 and Model 2 for the remaining epochs. Quoted errors reflect 90% confidence level. Theparameters that were kept frozen during the fits are reported in parentheses.
can be observed. A similar subdivision was also proposed by DeMarco et al. (2021), with phases labeled “Rise,” “Plateau,” and“Bright decline,” respectively. In the following, we treat thesephases separately. In all phases, we did not manage to constrainthe values of Rin,2 and Rout,2, as the fit was basically insensitive tovariations of these parameters. We therefore set Rin,2 to 300 RGand Rout,2 to 104 RG. We found values of AFe always between 2and 3 times the solar abundance8.
The final results are reported on Table 3, while the corre-sponding best-fit models and residuals are shown in Figs. 4–5.
8 We caution the reader that the incompatibility between the best-fitvalue of AFe = 2.0−2.4 found for epoch 2 and the common value ofabout 3 found for the other seven epochs, does not have a physical ori-gin. For consistency we also tried fixing AFe to a value of 3 in epoch 2,but the fit, and particularly the iron line residuals, significantly wors-ened. This may be due to systematics in NuSTAR between 8 and 11 keVthat interfere with a correct modeling of the iron line region.
Phase 1: The system in the hard state with one reflectioncomponent. Epoch 1 is satisfactorily fitted with both Model 1and Model 2, with χ2
ν (d.o.f.) of 1.01(749) and 0.90(748), respec-tively. In both cases the SAD is truncated far away from the BH(i.e., with RJ of ∼60 RG and ∼150 RG for Model 1 and Model 2,respectively). However, with Model 2 the value obtained forlog ξ1 goes beyond the threshold of 4 (approximately 4.3). Weconsider such a high value as unphysical for several reasons.First of all, such a highly ionized medium at the edge of thedisk is hard to reconcile with it being truncated at 150 RG. Sec-ond, we note that with the very high value found for log ξ1,the inner reflection component has almost no significant fluores-cence line and basically serves as an additional continuum com-ponent. Finally, the spectral shape of the reflection componentcomputed with xillver for log ξ > 4 is unreliable at high ener-gies9. According to these arguments, the presence of the secondreflection component is most likely spurious for epoch 1. Using
9 J. Garcia, priv. comm.
A63, page 7 of 15
A&A 656, A63 (2021)
Fig. 4. Energy spectra with the best-fit models: Model 1 for epoch 1 and Model 2 for epochs 2–4, and residuals. Data: XRT (blue), NICER(green), NuSTAR (yellow–black), and BAT (red). Different line styles were adopted to distinguish between the different components: dot for jed,dash-dot-dot-dot for sad, dash-dot for inner refl, dash for the outer refl.
Model 1, log ξ10 is found in the range 2.0–2.4, which is insteadmore plausible.
Phase 2: The outer reflection component arises. Epochsfrom 2 to 6 are poorly fitted by Model 1, with χ2
ν values allabove 1.25 and, more importantly, evident unmodeled structuresbetween 6 and 10 keV in the residuals. Instead, the applicationof Model 2 results in good fits and quite flat residuals. The pic-ture captured by the fits is similar for the epochs in this group.The best-fit value of RJ decreases significantly with respectto the previous phase, attaining values in the range 35–50 RG.Simultaneously, Min evolves substantially, going from 1.8 MEdd(epoch 2) to 2.4 MEdd (epoch 3), and then decreases again to 1.3in epoch 6. Throughout this phase, mS retains a well-determinedvalue of about 1.25 for all the epochs, with the only exception ofepoch 6, where the parameter was basically unconstrained andtherefore fixed. In all epochs, ξ1 is higher than ξ2 by at leastan order of magnitude. Interestingly, while ξ1 is quite stable, anincreasing trend can be observed in log ξ2, which goes from anupper limit of 1.7 in epoch 2, to 3 in epoch 6. The possibility ofthis trend being related to an evolution of the inner radius of theouter reflection will be explored in the Discussion (see Sect. 5).
Phase 3: The role of mS in the re-hardening. Model 1 alsogives an unacceptable fit for epoch 7, but is instead compatible
10 The subscript is removed here since in Model 1 there is no need todistinguish between component 1 and component 2.
with epoch 8, with a χ2ν (d.o.f.) of 1.15 (750). Model 2 gives
a good fit to epoch 7 and an even better fit to epoch 8, with aprobability of improvement by chance of ∼10−5 with respect toModel 1. We then conclude that a double reflection scenario isalso statistically preferred in phase 3. As in the previous phase,RJ decreases again to about 33–34 RG, while Min is constrainedat ∼1 MEdd. The most apparent evolution with respect to theprevious phase consists in a re-hardening of the spectrum, aswitnessed by the high energy cutoff of the BAT data movingtoward higher energies (see the BAT light curve, Fig. 1). Sincesome level of degeneracy between RJ and mS clearly exists (seeFig. 6), this trend can be explained by an increase in both theseparameters. For example, epoch 7 can be fitted keeping mS fixedto 1.3, in consistency with the previous phase, and with RJ of 38–39 RG or leaving mS free, a case where mS attains a value of 1.5and RJ decreases to 33–34 RG. Both fits are acceptable, but keep-ing mS fixed results in slightly unmodeled residuals in the ironline region, contrarily to the case where mS is free. We thereforeconclude that the spectral hardening in this phase is not reflectedin the values of RJ , which actually suggests that the inner edgeof the disk keeps moving inward, as expected during the transi-tion to the SS, but seems to be instead produced by an increasein mS , producing a more rarefied and hotter accretion flow in theJED. Another interesting evolution can be found in the valuesof ξ1 and ξ2. While epoch 7 has values compatible with epoch 6(and phase 2 in general), in epoch 8 both values log ξ1 and log ξ2decrease significantly to values of ∼3.5 and 2.0 (which was fixedsince it was left unconstrained by the fit), respectively.
A63, page 8 of 15
A. Marino et al.: Tracking the evolution of the accretion flow in MAXI
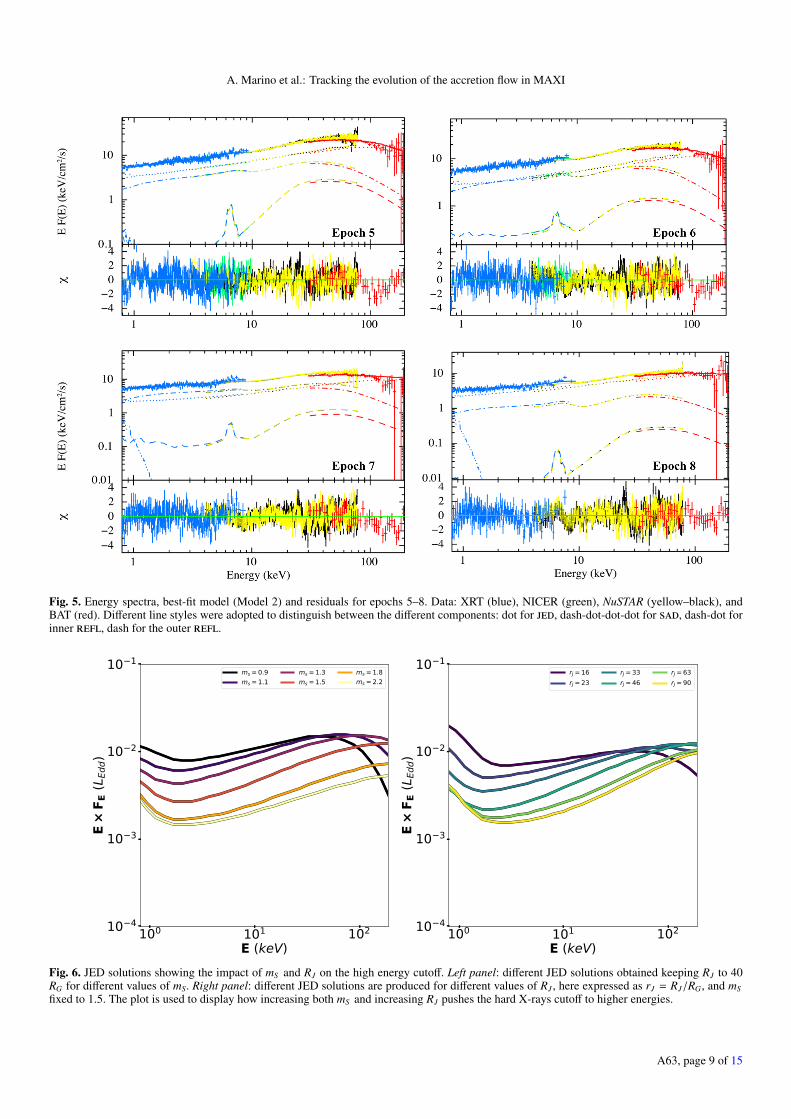
Fig. 5. Energy spectra, best-fit model (Model 2) and residuals for epochs 5–8. Data: XRT (blue), NICER (green), NuSTAR (yellow–black), andBAT (red). Different line styles were adopted to distinguish between the different components: dot for jed, dash-dot-dot-dot for sad, dash-dot forinner refl, dash for the outer refl.
100 101 102
E (keV)10 4
10 3
10 2
10 1
E×
F E (L
Edd)
ms = 0.9ms = 1.1
ms = 1.3ms = 1.5
ms = 1.8ms = 2.2
100 101 102
E (keV)10 4
10 3
10 2
10 1
E×
F E (L
Edd)
rJ = 16rJ = 23
rJ = 33rJ = 46
rJ = 63rJ = 90
Fig. 6. JED solutions showing the impact of mS and RJ on the high energy cutoff. Left panel: different JED solutions obtained keeping RJ to 40RG for different values of mS. Right panel: different JED solutions are produced for different values of RJ , here expressed as rJ = RJ/RG, and mSfixed to 1.5. The plot is used to display how increasing both mS and increasing RJ pushes the hard X-rays cutoff to higher energies.
A63, page 9 of 15
A&A 656, A63 (2021)
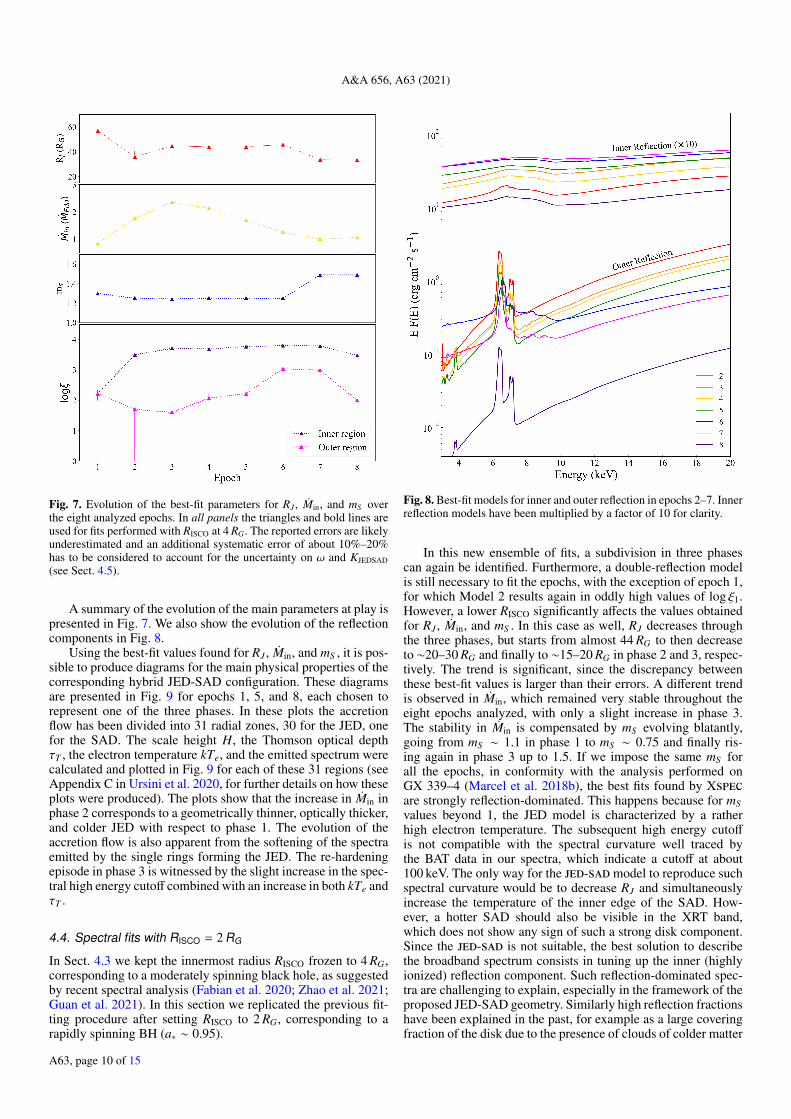
Fig. 7. Evolution of the best-fit parameters for RJ , Min, and mS overthe eight analyzed epochs. In all panels the triangles and bold lines areused for fits performed with RISCO at 4 RG. The reported errors are likelyunderestimated and an additional systematic error of about 10%–20%has to be considered to account for the uncertainty on ω and KJEDSAD(see Sect. 4.5).
A summary of the evolution of the main parameters at play ispresented in Fig. 7. We also show the evolution of the reflectioncomponents in Fig. 8.
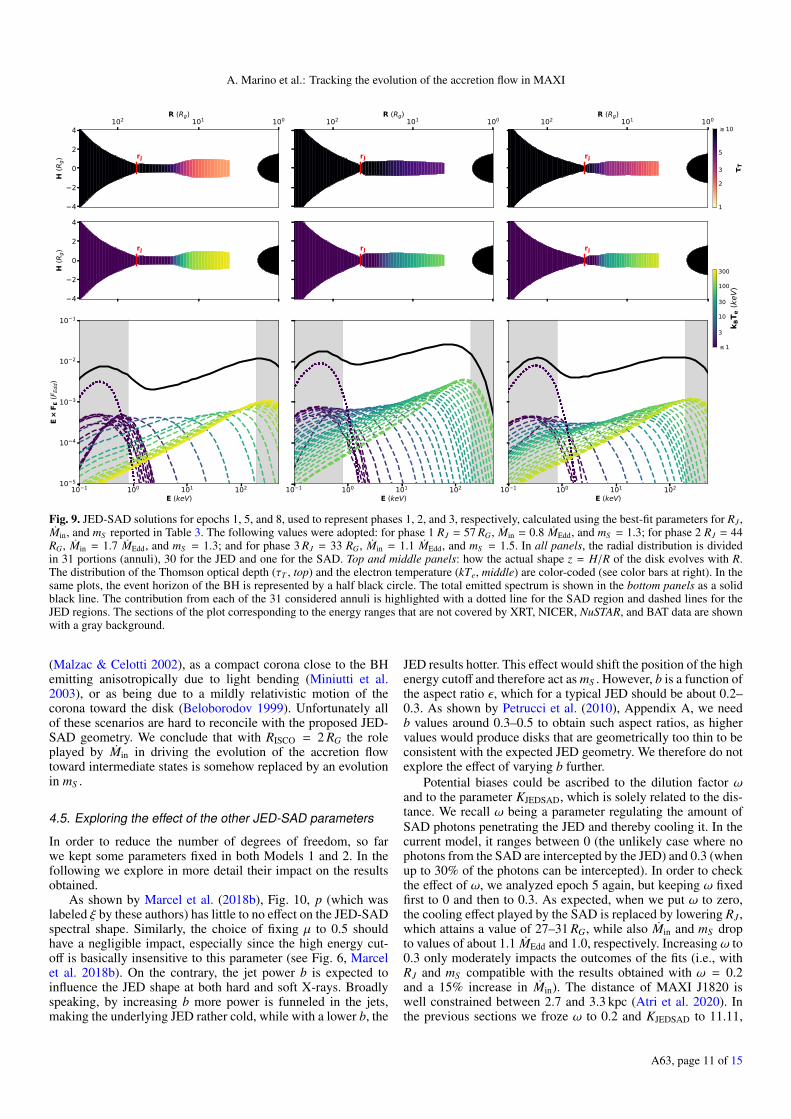
Using the best-fit values found for RJ , Min, and mS , it is pos-sible to produce diagrams for the main physical properties of thecorresponding hybrid JED-SAD configuration. These diagramsare presented in Fig. 9 for epochs 1, 5, and 8, each chosen torepresent one of the three phases. In these plots the accretionflow has been divided into 31 radial zones, 30 for the JED, onefor the SAD. The scale height H, the Thomson optical depthτT , the electron temperature kTe, and the emitted spectrum werecalculated and plotted in Fig. 9 for each of these 31 regions (seeAppendix C in Ursini et al. 2020, for further details on how theseplots were produced). The plots show that the increase in Min inphase 2 corresponds to a geometrically thinner, optically thicker,and colder JED with respect to phase 1. The evolution of theaccretion flow is also apparent from the softening of the spectraemitted by the single rings forming the JED. The re-hardeningepisode in phase 3 is witnessed by the slight increase in the spec-tral high energy cutoff combined with an increase in both kTe andτT .
4.4. Spectral fits with RISCO = 2 RG
In Sect. 4.3 we kept the innermost radius RISCO frozen to 4 RG,corresponding to a moderately spinning black hole, as suggestedby recent spectral analysis (Fabian et al. 2020; Zhao et al. 2021;Guan et al. 2021). In this section we replicated the previous fit-ting procedure after setting RISCO to 2 RG, corresponding to arapidly spinning BH (a∗ ∼ 0.95).
Fig. 8. Best-fit models for inner and outer reflection in epochs 2–7. Innerreflection models have been multiplied by a factor of 10 for clarity.
In this new ensemble of fits, a subdivision in three phasescan again be identified. Furthermore, a double-reflection modelis still necessary to fit the epochs, with the exception of epoch 1,for which Model 2 results again in oddly high values of log ξ1.However, a lower RISCO significantly affects the values obtainedfor RJ , Min, and mS . In this case as well, RJ decreases throughthe three phases, but starts from almost 44 RG to then decreaseto ∼20–30 RG and finally to ∼15–20 RG in phase 2 and 3, respec-tively. The trend is significant, since the discrepancy betweenthese best-fit values is larger than their errors. A different trendis observed in Min, which remained very stable throughout theeight epochs analyzed, with only a slight increase in phase 3.The stability in Min is compensated by mS evolving blatantly,going from mS ∼ 1.1 in phase 1 to mS ∼ 0.75 and finally ris-ing again in phase 3 up to 1.5. If we impose the same mS forall the epochs, in conformity with the analysis performed onGX 339–4 (Marcel et al. 2018b), the best fits found by Xspecare strongly reflection-dominated. This happens because for mSvalues beyond 1, the JED model is characterized by a ratherhigh electron temperature. The subsequent high energy cutoffis not compatible with the spectral curvature well traced bythe BAT data in our spectra, which indicate a cutoff at about100 keV. The only way for the jed-sadmodel to reproduce suchspectral curvature would be to decrease RJ and simultaneouslyincrease the temperature of the inner edge of the SAD. How-ever, a hotter SAD should also be visible in the XRT band,which does not show any sign of such a strong disk component.Since the jed-sad is not suitable, the best solution to describethe broadband spectrum consists in tuning up the inner (highlyionized) reflection component. Such reflection-dominated spec-tra are challenging to explain, especially in the framework of theproposed JED-SAD geometry. Similarly high reflection fractionshave been explained in the past, for example as a large coveringfraction of the disk due to the presence of clouds of colder matter
A63, page 10 of 15
A. Marino et al.: Tracking the evolution of the accretion flow in MAXI
Fig. 9. JED-SAD solutions for epochs 1, 5, and 8, used to represent phases 1, 2, and 3, respectively, calculated using the best-fit parameters for RJ ,Min, and mS reported in Table 3. The following values were adopted: for phase 1 RJ = 57 RG, Min = 0.8 MEdd, and mS = 1.3; for phase 2 RJ = 44RG, Min = 1.7 MEdd, and mS = 1.3; and for phase 3 RJ = 33 RG, Min = 1.1 MEdd, and mS = 1.5. In all panels, the radial distribution is dividedin 31 portions (annuli), 30 for the JED and one for the SAD. Top and middle panels: how the actual shape z = H/R of the disk evolves with R.The distribution of the Thomson optical depth (τT , top) and the electron temperature (kTe, middle) are color-coded (see color bars at right). In thesame plots, the event horizon of the BH is represented by a half black circle. The total emitted spectrum is shown in the bottom panels as a solidblack line. The contribution from each of the 31 considered annuli is highlighted with a dotted line for the SAD region and dashed lines for theJED regions. The sections of the plot corresponding to the energy ranges that are not covered by XRT, NICER, NuSTAR, and BAT data are shownwith a gray background.
(Malzac & Celotti 2002), as a compact corona close to the BHemitting anisotropically due to light bending (Miniutti et al.2003), or as being due to a mildly relativistic motion of thecorona toward the disk (Beloborodov 1999). Unfortunately allof these scenarios are hard to reconcile with the proposed JED-SAD geometry. We conclude that with RISCO = 2 RG the roleplayed by Min in driving the evolution of the accretion flowtoward intermediate states is somehow replaced by an evolutionin mS .
4.5. Exploring the effect of the other JED-SAD parameters
In order to reduce the number of degrees of freedom, so farwe kept some parameters fixed in both Models 1 and 2. In thefollowing we explore in more detail their impact on the resultsobtained.
As shown by Marcel et al. (2018b), Fig. 10, p (which waslabeled ξ by these authors) has little to no effect on the JED-SADspectral shape. Similarly, the choice of fixing µ to 0.5 shouldhave a negligible impact, especially since the high energy cut-off is basically insensitive to this parameter (see Fig. 6, Marcelet al. 2018b). On the contrary, the jet power b is expected toinfluence the JED shape at both hard and soft X-rays. Broadlyspeaking, by increasing b more power is funneled in the jets,making the underlying JED rather cold, while with a lower b, the
JED results hotter. This effect would shift the position of the highenergy cutoff and therefore act as mS . However, b is a function ofthe aspect ratio ε, which for a typical JED should be about 0.2–0.3. As shown by Petrucci et al. (2010), Appendix A, we needb values around 0.3–0.5 to obtain such aspect ratios, as highervalues would produce disks that are geometrically too thin to beconsistent with the expected JED geometry. We therefore do notexplore the effect of varying b further.
Potential biases could be ascribed to the dilution factor ωand to the parameter KJEDSAD, which is solely related to the dis-tance. We recall ω being a parameter regulating the amount ofSAD photons penetrating the JED and thereby cooling it. In thecurrent model, it ranges between 0 (the unlikely case where nophotons from the SAD are intercepted by the JED) and 0.3 (whenup to 30% of the photons can be intercepted). In order to checkthe effect of ω, we analyzed epoch 5 again, but keeping ω fixedfirst to 0 and then to 0.3. As expected, when we put ω to zero,the cooling effect played by the SAD is replaced by lowering RJ ,which attains a value of 27–31 RG, while also Min and mS dropto values of about 1.1 MEdd and 1.0, respectively. Increasing ω to0.3 only moderately impacts the outcomes of the fits (i.e., withRJ and mS compatible with the results obtained with ω = 0.2and a 15% increase in Min). The distance of MAXI J1820 iswell constrained between 2.7 and 3.3 kpc (Atri et al. 2020). Inthe previous sections we froze ω to 0.2 and KJEDSAD to 11.11,
A63, page 11 of 15
A&A 656, A63 (2021)
corresponding to a distance of 3 kpc. We then computed againthe best fits for epoch 5 freezing KJEDSAD first to 13.7 (2.7 kpc),and then to 9.2 (3.3 kpc). Analogously to ω, variations inKJEDSAD do not affect the overall physical scenario which wasidentified in this phase phase with KJEDSAD = 11.11, but theyresult in a slight fluctuation of the best-fit values of Min and RJ .For example, RJ goes from ∼41 RG at d = 2.7 kpc to ∼48 RGat d = 3.3 kpc, a range comparable with the estimated errors(about 2–5 RG). On the other hand, Min oscillates between ∼1.58and ∼1.70 MEdd (for the lower and higher edge of the distancerange, respectively), which is higher than the range of variabilityassociated with the errors. These results point out that some cau-tion must be taken when considering the best-fit values obtainedfor RJ and Min as face values.
5. Discussion
In the previous section we applied the physical model jed-sad to fit the XRT+NICER+NuSTAR+BAT observations of thesource MAXI J1820+070 in HS and HIMS. We included eitherone (Model 1) or two (Model 2) reflection components. Inthe latest model, which is more complex, the two reflectionspectra originate from different but neighboring regions of theSAD disk. In all the epochs analyzed, with the exception ofepoch 1 (the only one in full hard state), we found that onlya two-reflection solution gives acceptable fits. In the follow-ing we discuss the main results obtained in this work and theirinterpretation.
To fit our spectra we considered both a moderately (RISCO =4 RG) and rapidly (RISCO = 2 RG) spinning BH. We note that inthe case of a rapidly spinning BH the evolution of the system ismainly driven by variations in the sonic Mach number mS . Thissolution is different with respect to the modeling of GX 339–4,in which mS was fixed to 1.5 and the interplay between RJ andMin was sufficient to describe the data (Marcel et al. 2019). Weobserved that this trend is statistically significant, since imposingconstant values of mS results in unphysical reflection-dominatedscenario. A change in mS arises from a change in the torque dueto the jet (through the toroidal magnetic field). We see no clearreason for the jet torque to change on long timescales (>days),even if it is possible in principle. Although we discard this possi-bility here, one should nevertheless keep it in mind and look fortraces of any correlation between these rapid accretion (increasein mS ) events and any jet signature.
On the contrary, in the fits performed keeping RISCO equalto 4 RG, the mS values are (almost) constant and the interplaybetween RJ and Min again plays the main role. We therefore con-sider the fits performed in the moderately spinning BH scenariomore physically reliable. This evidence is in line with the esti-mation of the spin value obtained by Fabian et al. (2020) andGuan et al. (2021), among others. Nevertheless, even in the caseRISCO = 4 RG, a (slight) increase in mS is observed going fromphase 2 to phase 3 (i.e., from 1.25 to 1.50). Imposing mS to1.5 in epoch 6, in continuity with epoch 7, results in a signif-icantly worst fit where the reflection dominates over the directJED emission. While this is slightly different with respect to theresults obtained by Marcel et al. (2019, 2020), it is noteworthythat these authors did not have data above 40 keV and, moreimportantly, they did not directly perform spectral fits on thedata. In future applications of the JED-SAD model, the inclusionof high energy NuSTAR and especially BAT data might thereforebe necessary to highlight the role, if any, of mS in shaping thespectra of BHTs in hard state and, particularly, their high energycutoff.
5.1. The geometry of the accretion flow
The geometry of the accretion flow in the HS of MAXI J1820has been inspiring a vivacious debate since its discovery. Severalauthors have proposed that, when in HS, the hot corona of MAXIJ1820 contracts, while the accretion disk remains stable at theISCO. This scenario was proposed first by Kara et al. (2019) andrecently supported by Wang et al. (2021), based on NICER X-rayspectral and timing analysis. These results were also corrobo-rated by modeling the reflection component in NuSTAR spec-tra, adopting two lamppost corona models (Buisson et al. 2019;You et al. 2021). However, Zdziarski et al. (2021) proposed thatthe truncated disk scenario can still explain the HS and HIMSof MAXI J1820. According to their spectral analysis performedwith NuSTAR data on our epochs 1, 2, 3, and 4, the disk neverextends down to the ISCO. A scenario where the disk is not onlytruncated, but also the inner edge of the disk approaches the BHthroughout the hard state is also suggested by the spectral evolu-tion of the quasi-thermal component responsible for the thermalreverberation lags (De Marco et al. 2021) and the evolution ofthe characteristic variability frequencies observed in the iron line(Axelsson & Veledina 2021). It is noteworthy that a trend for anapproaching truncated inner disk is also qualitatively suggestedby Type C QPOs (Buisson et al. 2019).
Regardless of the choice for RISCO and of the uncertainty inKJEDSAD, all the fits performed by us show that the accretion diskin MAXI J1820+070 is truncated in hard state and its inner edgemoves inward during the transition to the intermediate state. ForRISCO = 4 RG, we found RJ to be about 50–60 RG in phase 1,35–45 RG in phase 2, and 30–35 RG in phase 3. A bit of cau-tion is required in taking these measurements at face value sincethe exact estimates of the truncation radius are instead criticallydependent on our choices for RISCO and KJEDSAD. Our spectralanalysis was performed on a data set which includes the data setof Zdziarski et al. (2021) and reaches a similar conclusion onthe geometry. However, our work includes four more observa-tions and provides a coherent picture of the spectral evolutionof the system, using a physical model. The calculated transitionradii RJ are consistent with the lower limits on the truncationradius estimated by De Marco et al. (2021) by analyzing thequasi-thermal spectral component arising from the disk due toX-ray irradiation from the corona (see in particular their Fig. 9).
Finally, a multi-zone corona was invoked on the basis ofboth spectral (Zdziarski et al. 2021) and temporal (Dziełak et al.2021) behavior of the system in the same observations. We high-light that the JED model is also a multi-zone model, as it takesinto account the single contribution for each ring of matter thatcomposes the JED, each with variable temperature and opti-cal depth. Therefore, our approach is in line with other works,where a single uniform plasma cloud was proven insufficient toadequately describe the spectrum of black hole X-ray binaries(Nowak et al. 2011; Basak et al. 2017). Moreover a multi-zonemodel can naturally produce a spectral shape that is not exactlya power law. In the energy range of the iron line this can havea direct impact on the broadness of the line, and could explainthe absence of extreme red wings that would require an accretiondisk down to the ISCO.
5.2. The nature of the second reflection component
In Kara et al. (2019) the line profile revealed by the NICERdata was clearly evolving across the HS and HIMS state, witha shrinking narrow core and a constant broad blurred base. Thishas been interpreted by invoking either a disk reaching the ISCO
A63, page 12 of 15
A. Marino et al.: Tracking the evolution of the accretion flow in MAXI
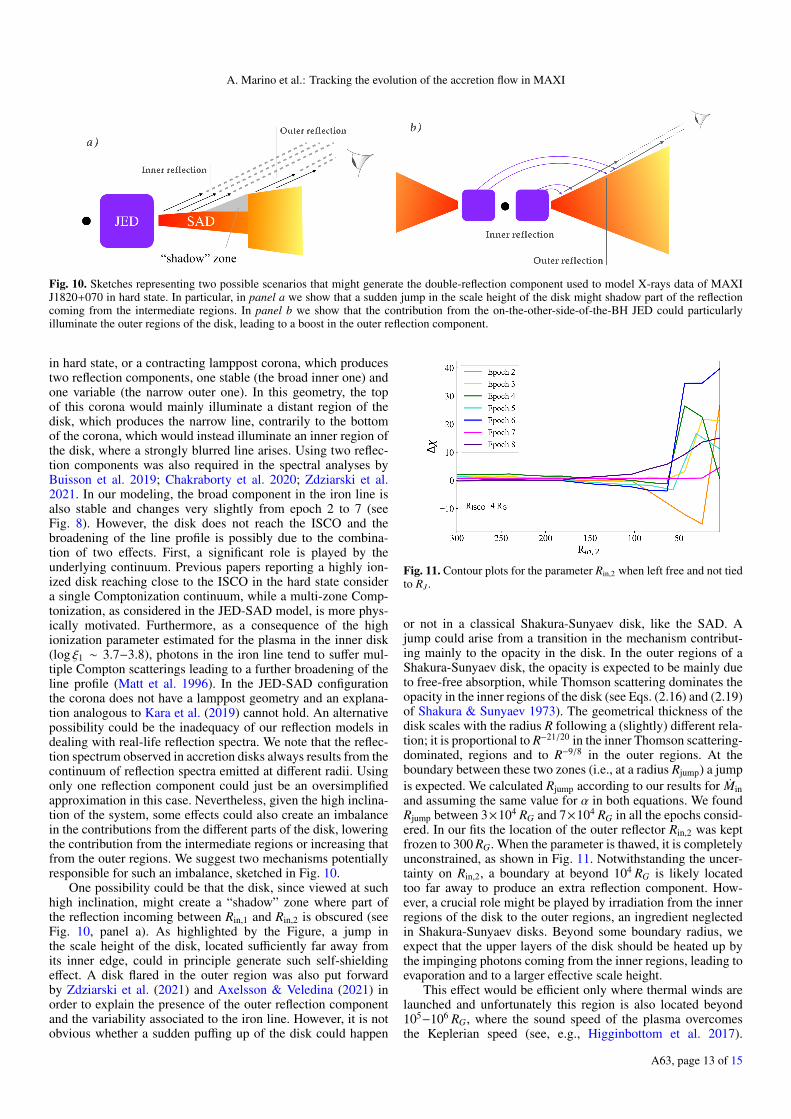
Fig. 10. Sketches representing two possible scenarios that might generate the double-reflection component used to model X-rays data of MAXIJ1820+070 in hard state. In particular, in panel a we show that a sudden jump in the scale height of the disk might shadow part of the reflectioncoming from the intermediate regions. In panel b we show that the contribution from the on-the-other-side-of-the-BH JED could particularlyilluminate the outer regions of the disk, leading to a boost in the outer reflection component.
in hard state, or a contracting lamppost corona, which producestwo reflection components, one stable (the broad inner one) andone variable (the narrow outer one). In this geometry, the topof this corona would mainly illuminate a distant region of thedisk, which produces the narrow line, contrarily to the bottomof the corona, which would instead illuminate an inner region ofthe disk, where a strongly blurred line arises. Using two reflec-tion components was also required in the spectral analyses byBuisson et al. 2019; Chakraborty et al. 2020; Zdziarski et al.2021. In our modeling, the broad component in the iron line isalso stable and changes very slightly from epoch 2 to 7 (seeFig. 8). However, the disk does not reach the ISCO and thebroadening of the line profile is possibly due to the combina-tion of two effects. First, a significant role is played by theunderlying continuum. Previous papers reporting a highly ion-ized disk reaching close to the ISCO in the hard state considera single Comptonization continuum, while a multi-zone Comp-tonization, as considered in the JED-SAD model, is more phys-ically motivated. Furthermore, as a consequence of the highionization parameter estimated for the plasma in the inner disk(log ξ1 ∼ 3.7−3.8), photons in the iron line tend to suffer mul-tiple Compton scatterings leading to a further broadening of theline profile (Matt et al. 1996). In the JED-SAD configurationthe corona does not have a lamppost geometry and an explana-tion analogous to Kara et al. (2019) cannot hold. An alternativepossibility could be the inadequacy of our reflection models indealing with real-life reflection spectra. We note that the reflec-tion spectrum observed in accretion disks always results from thecontinuum of reflection spectra emitted at different radii. Usingonly one reflection component could just be an oversimplifiedapproximation in this case. Nevertheless, given the high inclina-tion of the system, some effects could also create an imbalancein the contributions from the different parts of the disk, loweringthe contribution from the intermediate regions or increasing thatfrom the outer regions. We suggest two mechanisms potentiallyresponsible for such an imbalance, sketched in Fig. 10.
One possibility could be that the disk, since viewed at suchhigh inclination, might create a “shadow” zone where part ofthe reflection incoming between Rin,1 and Rin,2 is obscured (seeFig. 10, panel a). As highlighted by the Figure, a jump inthe scale height of the disk, located sufficiently far away fromits inner edge, could in principle generate such self-shieldingeffect. A disk flared in the outer region was also put forwardby Zdziarski et al. (2021) and Axelsson & Veledina (2021) inorder to explain the presence of the outer reflection componentand the variability associated to the iron line. However, it is notobvious whether a sudden puffing up of the disk could happen
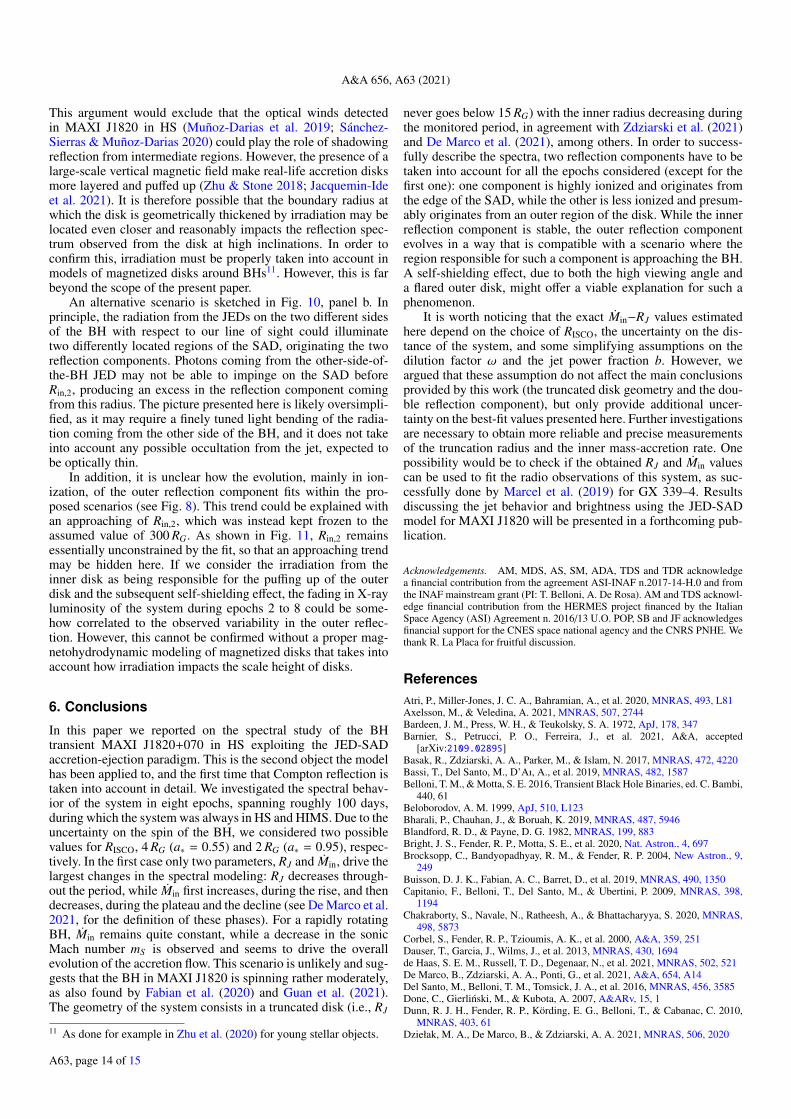
Fig. 11. Contour plots for the parameter Rin,2 when left free and not tiedto RJ .
or not in a classical Shakura-Sunyaev disk, like the SAD. Ajump could arise from a transition in the mechanism contribut-ing mainly to the opacity in the disk. In the outer regions of aShakura-Sunyaev disk, the opacity is expected to be mainly dueto free-free absorption, while Thomson scattering dominates theopacity in the inner regions of the disk (see Eqs. (2.16) and (2.19)of Shakura & Sunyaev 1973). The geometrical thickness of thedisk scales with the radius R following a (slightly) different rela-tion; it is proportional to R−21/20 in the inner Thomson scattering-dominated, regions and to R−9/8 in the outer regions. At theboundary between these two zones (i.e., at a radius Rjump) a jumpis expected. We calculated Rjump according to our results for Minand assuming the same value for α in both equations. We foundRjump between 3×10⁴ RG and 7×10⁴ RG in all the epochs consid-ered. In our fits the location of the outer reflector Rin,2 was keptfrozen to 300 RG. When the parameter is thawed, it is completelyunconstrained, as shown in Fig. 11. Notwithstanding the uncer-tainty on Rin,2, a boundary at beyond 104 RG is likely locatedtoo far away to produce an extra reflection component. How-ever, a crucial role might be played by irradiation from the innerregions of the disk to the outer regions, an ingredient neglectedin Shakura-Sunyaev disks. Beyond some boundary radius, weexpect that the upper layers of the disk should be heated up bythe impinging photons coming from the inner regions, leading toevaporation and to a larger effective scale height.
This effect would be efficient only where thermal winds arelaunched and unfortunately this region is also located beyond105−106 RG, where the sound speed of the plasma overcomesthe Keplerian speed (see, e.g., Higginbottom et al. 2017).
A63, page 13 of 15
A&A 656, A63 (2021)
This argument would exclude that the optical winds detectedin MAXI J1820 in HS (Muñoz-Darias et al. 2019; Sánchez-Sierras & Muñoz-Darias 2020) could play the role of shadowingreflection from intermediate regions. However, the presence of alarge-scale vertical magnetic field make real-life accretion disksmore layered and puffed up (Zhu & Stone 2018; Jacquemin-Ideet al. 2021). It is therefore possible that the boundary radius atwhich the disk is geometrically thickened by irradiation may belocated even closer and reasonably impacts the reflection spec-trum observed from the disk at high inclinations. In order toconfirm this, irradiation must be properly taken into account inmodels of magnetized disks around BHs11. However, this is farbeyond the scope of the present paper.
An alternative scenario is sketched in Fig. 10, panel b. Inprinciple, the radiation from the JEDs on the two different sidesof the BH with respect to our line of sight could illuminatetwo differently located regions of the SAD, originating the tworeflection components. Photons coming from the other-side-of-the-BH JED may not be able to impinge on the SAD beforeRin,2, producing an excess in the reflection component comingfrom this radius. The picture presented here is likely oversimpli-fied, as it may require a finely tuned light bending of the radia-tion coming from the other side of the BH, and it does not takeinto account any possible occultation from the jet, expected tobe optically thin.
In addition, it is unclear how the evolution, mainly in ion-ization, of the outer reflection component fits within the pro-posed scenarios (see Fig. 8). This trend could be explained withan approaching of Rin,2, which was instead kept frozen to theassumed value of 300 RG. As shown in Fig. 11, Rin,2 remainsessentially unconstrained by the fit, so that an approaching trendmay be hidden here. If we consider the irradiation from theinner disk as being responsible for the puffing up of the outerdisk and the subsequent self-shielding effect, the fading in X-rayluminosity of the system during epochs 2 to 8 could be some-how correlated to the observed variability in the outer reflec-tion. However, this cannot be confirmed without a proper mag-netohydrodynamic modeling of magnetized disks that takes intoaccount how irradiation impacts the scale height of disks.
6. Conclusions
In this paper we reported on the spectral study of the BHtransient MAXI J1820+070 in HS exploiting the JED-SADaccretion-ejection paradigm. This is the second object the modelhas been applied to, and the first time that Compton reflection istaken into account in detail. We investigated the spectral behav-ior of the system in eight epochs, spanning roughly 100 days,during which the system was always in HS and HIMS. Due to theuncertainty on the spin of the BH, we considered two possiblevalues for RISCO, 4 RG (a∗ = 0.55) and 2 RG (a∗ = 0.95), respec-tively. In the first case only two parameters, RJ and Min, drive thelargest changes in the spectral modeling: RJ decreases through-out the period, while Min first increases, during the rise, and thendecreases, during the plateau and the decline (see De Marco et al.2021, for the definition of these phases). For a rapidly rotatingBH, Min remains quite constant, while a decrease in the sonicMach number mS is observed and seems to drive the overallevolution of the accretion flow. This scenario is unlikely and sug-gests that the BH in MAXI J1820 is spinning rather moderately,as also found by Fabian et al. (2020) and Guan et al. (2021).The geometry of the system consists in a truncated disk (i.e., RJ
11 As done for example in Zhu et al. (2020) for young stellar objects.
never goes below 15 RG) with the inner radius decreasing duringthe monitored period, in agreement with Zdziarski et al. (2021)and De Marco et al. (2021), among others. In order to success-fully describe the spectra, two reflection components have to betaken into account for all the epochs considered (except for thefirst one): one component is highly ionized and originates fromthe edge of the SAD, while the other is less ionized and presum-ably originates from an outer region of the disk. While the innerreflection component is stable, the outer reflection componentevolves in a way that is compatible with a scenario where theregion responsible for such a component is approaching the BH.A self-shielding effect, due to both the high viewing angle anda flared outer disk, might offer a viable explanation for such aphenomenon.
It is worth noticing that the exact Min−RJ values estimatedhere depend on the choice of RISCO, the uncertainty on the dis-tance of the system, and some simplifying assumptions on thedilution factor ω and the jet power fraction b. However, weargued that these assumption do not affect the main conclusionsprovided by this work (the truncated disk geometry and the dou-ble reflection component), but only provide additional uncer-tainty on the best-fit values presented here. Further investigationsare necessary to obtain more reliable and precise measurementsof the truncation radius and the inner mass-accretion rate. Onepossibility would be to check if the obtained RJ and Min valuescan be used to fit the radio observations of this system, as suc-cessfully done by Marcel et al. (2019) for GX 339–4. Resultsdiscussing the jet behavior and brightness using the JED-SADmodel for MAXI J1820 will be presented in a forthcoming pub-lication.
Acknowledgements. AM, MDS, AS, SM, ADA, TDS and TDR acknowledgea financial contribution from the agreement ASI-INAF n.2017-14-H.0 and fromthe INAF mainstream grant (PI: T. Belloni, A. De Rosa). AM and TDS acknowl-edge financial contribution from the HERMES project financed by the ItalianSpace Agency (ASI) Agreement n. 2016/13 U.O. POP, SB and JF acknowledgesfinancial support for the CNES space national agency and the CNRS PNHE. Wethank R. La Placa for fruitful discussion.
ReferencesAtri, P., Miller-Jones, J. C. A., Bahramian, A., et al. 2020, MNRAS, 493, L81Axelsson, M., & Veledina, A. 2021, MNRAS, 507, 2744Bardeen, J. M., Press, W. H., & Teukolsky, S. A. 1972, ApJ, 178, 347Barnier, S., Petrucci, P. O., Ferreira, J., et al. 2021, A&A, accepted
[arXiv:2109.02895]Basak, R., Zdziarski, A. A., Parker, M., & Islam, N. 2017, MNRAS, 472, 4220Bassi, T., Del Santo, M., D’Aı, A., et al. 2019, MNRAS, 482, 1587Belloni, T. M., & Motta, S. E. 2016, Transient Black Hole Binaries, ed. C. Bambi,
440, 61Beloborodov, A. M. 1999, ApJ, 510, L123Bharali, P., Chauhan, J., & Boruah, K. 2019, MNRAS, 487, 5946Blandford, R. D., & Payne, D. G. 1982, MNRAS, 199, 883Bright, J. S., Fender, R. P., Motta, S. E., et al. 2020, Nat. Astron., 4, 697Brocksopp, C., Bandyopadhyay, R. M., & Fender, R. P. 2004, New Astron., 9,
249Buisson, D. J. K., Fabian, A. C., Barret, D., et al. 2019, MNRAS, 490, 1350Capitanio, F., Belloni, T., Del Santo, M., & Ubertini, P. 2009, MNRAS, 398,
1194Chakraborty, S., Navale, N., Ratheesh, A., & Bhattacharyya, S. 2020, MNRAS,
498, 5873Corbel, S., Fender, R. P., Tzioumis, A. K., et al. 2000, A&A, 359, 251Dauser, T., Garcia, J., Wilms, J., et al. 2013, MNRAS, 430, 1694de Haas, S. E. M., Russell, T. D., Degenaar, N., et al. 2021, MNRAS, 502, 521De Marco, B., Zdziarski, A. A., Ponti, G., et al. 2021, A&A, 654, A14Del Santo, M., Belloni, T. M., Tomsick, J. A., et al. 2016, MNRAS, 456, 3585Done, C., Gierlinski, M., & Kubota, A. 2007, A&ARv, 15, 1Dunn, R. J. H., Fender, R. P., Körding, E. G., Belloni, T., & Cabanac, C. 2010,
MNRAS, 403, 61Dziełak, M. A., De Marco, B., & Zdziarski, A. A. 2021, MNRAS, 506, 2020
A63, page 14 of 15
A. Marino et al.: Tracking the evolution of the accretion flow in MAXI
Esin, A. A., McClintock, J. E., & Narayan, R. 1997, ApJ, 489, 865Fabian, A. C., Buisson, D. J., Kosec, P., et al. 2020, MNRAS, 493, 5389Fender, R. 2010, ‘Disc-Jet’ Coupling in Black Hole X-Ray Binaries and Active
Galactic Nuclei, ed. T. Belloni, 794, 115Fender, R., & Belloni, T. 2004, ARA&A, 42, 317Fender, R., Corbel, S., Tzioumis, T., et al. 1999, ApJ, 519, L165Ferreira, J. 1997, A&A, 319, 340Ferreira, J., & Pelletier, G. 1993, A&A, 276, 625Ferreira, J., & Pelletier, G. 1995, A&A, 295, 807Ferreira, J., Petrucci, P. O., Henri, G., Saugé, L., & Pelletier, G. 2006, A&A, 447,
813Ferreira, J., Marcel, G., & Petrucci, P. O. E. A. 2021, A&A, submittedFerrigno, C., Bozzo, E., Del Santo, M., & Capitanio, F. 2012, A&A, 537, L7García, J., Dauser, T., Reynolds, C. S., et al. 2013, ApJ, 768, 146García, J. A., Steiner, J. F., McClintock, J. E., et al. 2015, ApJ, 813, 84Guan, J., Tao, L., Qu, J. L., et al. 2021, MNRAS, 504, 2168Higginbottom, N., Proga, D., Knigge, C., & Long, K. S. 2017, ApJ, 836, 42Hoang, J., Molina, E., Lopez, M., et al. 2019, in 36th International Cosmic Ray
Conference (ICRC2019), 36, 696Hynes, R. I., Mauche, C. W., Haswell, C. A., et al. 2000, ApJ, 539, L37Ingram, A., & Motta, S. 2019, Nat. Astron. Rev., 85, 101524Ingram, A., van der Klis, M., Middleton, M., Altamirano, D., & Uttley, P. 2017,
MNRAS, 464, 2979Jacquemin-Ide, J., Ferreira, J., & Lesur, G. 2019, MNRAS, 490, 3112Jacquemin-Ide, J., Lesur, G., & Ferreira, J. 2021, A&A, 647, A192Kaastra, J. S., & Bleeker, J. A. M. 2016, A&A, 587, A151Kajava, J. J. E., Motta, S. E., Sanna, A., et al. 2019, MNRAS, 488, L18Kara, E., Steiner, J. F., Fabian, A. C., et al. 2019, Nature, 565, 198Kawamuro, T., Negoro, H., Yoneyama, T., et al. 2018, Astron. Tel., 11399, 1Laor, A. 1991, ApJ, 376, 90Liska, M., Hesp, C., Tchekhovskoy, A., et al. 2018, MNRAS, 474, L81Ludlam, R. M., Miller, J. M., Arzoumanian, Z., et al. 2018, ApJ, 858, L5Madsen, K. K., Grefenstette, B. W., Pike, S., et al. 2020, ArXiv e-prints
[arXiv:2005.00569]Malzac, J., & Celotti, A. 2002, MNRAS, 335, 23Marcel, G., Ferreira, J., Petrucci, P. O., et al. 2018a, A&A, 617, A46Marcel, G., Ferreira, J., Petrucci, P. O., et al. 2018b, A&A, 615, A57Marcel, G., Ferreira, J., Clavel, M., et al. 2019, A&A, 626, A115Marcel, G., Cangemi, F., Rodriguez, J., et al. 2020, A&A, 640, A18Matt, G., Fabian, A. C., & Ross, R. R. 1996, MNRAS, 278, 1111Meier, D. L. 2005, Ap&SS, 300, 55Miller, J. M., Homan, J., Steeghs, D., et al. 2006, ApJ, 653, 525Miniutti, G., Fabian, A. C., Goyder, R., & Lasenby, A. N. 2003, MNRAS, 344,
L22Miyamoto, S., Kitamoto, S., Hayashida, K., & Egoshi, W. 1995, ApJ, 442,
L13Motta, S. E., Rodriguez, J., Jourdain, E., et al. 2021, New Astron. Rev., 93,
101618Muñoz-Darias, T., Jiménez-Ibarra, F., Panizo-Espinar, G., et al. 2019, ApJ, 879,
L4
Narayan, R., & Yi, I. 1995, ApJ, 452, 710Nowak, M. A., Hanke, M., Trowbridge, S. N., et al. 2011, ApJ, 728, 13Paice, J. A., Gandhi, P., Shahbaz, T., et al. 2019, MNRAS, 490, L62Patterson, J., Brincat, S., Stone, G., et al. 2018, Astron. Tel., 11756, 1Petrucci, P.-O., Ferreira, J., Henri, G., & Pelletier, G. 2008, MNRAS, 385, L88Petrucci, P. O., Ferreira, J., Henri, G., Malzac, J., & Foellmi, C. 2010, A&A, 522,
A38Remillard, R. A., & McClintock, J. E. 2006, ARA&A, 44, 49Reynolds, C. S., & Nowak, M. A. 2003, Phys. Rep., 377, 389Rushton, A. P., Miller-Jones, J. C. A., Curran, P. A., et al. 2017, MNRAS, 468,
2788Russell, T. D., Tetarenko, A. J., Miller-Jones, J. C. A., et al. 2019, ApJ, 883, 198Russell, T. D., Lucchini, M., Tetarenko, A. J., et al. 2020, MNRAS, 498, 5772Sánchez-Sierras, J., & Muñoz-Darias, T. 2020, A&A, 640, L3Segreto, A., Cusumano, G., Ferrigno, C., et al. 2010, A&A, 510, A47Shakura, N. I., & Sunyaev, R. A. 1973, A&A, 500, 33Shappee, B., Prieto, J., Stanek, K. Z., et al. 2014, Amer. Astron. Soc. Meet.
Abstr., 223, 236.03Shidatsu, M., Nakahira, S., Yamada, S., et al. 2018, ApJ, 868, 54Tetarenko, A. J., Bahramian, A., Sivakoff, G. R., et al. 2016a, MNRAS, 460, 345Tetarenko, B. E., Sivakoff, G. R., Heinke, C. O., & Gladstone, J. C. 2016b, ApJS,
222, 15Tetarenko, A. J., Casella, P., Miller-Jones, J. C. A., et al. 2021, MNRAS, 504,
3862Tomsick, J. A., Kalemci, E., Kaaret, P., et al. 2008, ApJ, 680, 593Torres, M. A. P., Casares, J., Jiménez-Ibarra, F., et al. 2019, ApJ, 882, L21Torres, M. A. P., Casares, J., Jiménez-Ibarra, F., et al. 2020, ApJ, 893, L37Trushkin, S. A., Nizhelskij, N. A., Tsybulev, P. G., & Erkenov, A. 2018, Astron.
Tel., 11539, 1Tucker, M. A., Shappee, B. J., Holoien, T. W. S., et al. 2018, ApJ, 867, L9Ursini, F., Petrucci, P. O., Bianchi, S., et al. 2020, A&A, 634, A92Verner, D. A., Ferland, G. J., Korista, K. T., & Yakovlev, D. G. 1996, ApJ, 465,
487Wang, J., Kara, E., Steiner, J. F., et al. 2020, ApJ, 899, 44Wang, J., Mastroserio, G., Kara, E., et al. 2021, ApJ, 910, L3Wilms, J., Allen, A., & McCray, R. 2000, ApJ, 542, 914Wood, C. M., Miller-Jones, J. C. A., Homan, J., et al. 2021, MNRAS, 505,
3393Xie, F.-G., & Yuan, F. 2012, MNRAS, 427, 1580Xu, Y., Harrison, F. A., Tomsick, J. A., et al. 2020, ApJ, 893, 42You, B., Tuo, Y., Li, C., et al. 2021, Nat. Commun., 12, 1025Yuan, F. 2001, MNRAS, 324, 119Zdziarski, A. A., & De Marco, B. 2020, ApJ, 896, L36Zdziarski, A. A., Gierlinski, M., Mikołajewska, J., et al. 2004, MNRAS, 351,
791Zdziarski, A. A., Dziełak, M. A., De Marco, B., Szanecki, M., & Niedzwiecki,
A. 2021, ApJ, 909, L9Zhao, X., Gou, L., Dong, Y., et al. 2021, ApJ, 916, 108Zhu, Z., & Stone, J. M. 2018, ApJ, 857, 34Zhu, Z., Jiang, Y.-F., & Stone, J. M. 2020, MNRAS, 495, 3494
A63, page 15 of 15


