Embed Size (px)
Citation preview

A Thesis
entitled
An Analysis of the Relationship Between Vegetation and Crime in Toledo, Ohio
by
Timothy J. Kosmyna
Submitted to the Graduate Faculty as partial fulfillment of the requirements for the
Master of Arts Degree in
Geography and Planning
___________________________________________
Dr. Yanqing Xu, Committee Chair
___________________________________________
Dr. Beth Schlemper, Committee Member
___________________________________________
Dr. Bhuiyan Alam, Committee Member
___________________________________________
Dr. Amanda C. Bryant-Friedrich, Dean
College of Graduate Studies
The University of Toledo
May 2020

© 2020 Timothy J. Kosmyna
This document is copyrighted material. Under copyright law, no parts of this document
may be reproduced without the expressed permission of the author.

iii
An Abstract of
An Analysis of the Relationship between Vegetation and Crime in Toledo, Ohio
by
Timothy J. Kosmyna
Submitted to the Graduate Faculty as partial fulfillment of the requirements for the
Master of Arts Degree in
Geography and Planning
The University of Toledo
May 2020
For several decades, urban crime has been a major problem for cities around the
world. There is much debate about whether the amount of vegetation in an urban area
leads to more or less crime. When studying this matter, geographic information systems
(GIS) and remote sensing play an important role in the analysis of this relationship. This
research draws from analytical methods found in contemporary literature as a means to
discover a relationship between crime and vegetation in Toledo, Ohio. Socioeconomic
factors are another aspect in this analysis, because vegetation is not the sole predictor of
crime. The research furthers the understanding of the need for community initiatives to
lower the impact of urban crime by highlighting a local neighborhood-based
organization, the Cherry Street Legacy Project, which incorporates Crime Prevention
Through Environmental Design (CPTED) principles into its work.

iv
Acknowledgements
I would like to thank my thesis committee for their guidance and assistance in the
completion of this project. Their input greatly benefits this work. Particular support goes
to committee chair, Dr. Yanqing Xu, for advice especially in the area of GIS analysis and
article recommendations. Acknowledgement and recognition is also attributed to Dr.
Beth Schlemper and Dr. Bhuiyan Alam for their support over the years.

v
Table of Contents
Abstract .............................................................................................................................. iii
Acknowledgements ............................................................................................................ iv
Table of Contents .................................................................................................................v
1 Introduction..............................................................................................................1
1.1 Overview............................................................................................................ 1
1.2 Study Area .........................................................................................................3
1.3 Problem Statement .............................................................................................4
1.4 Objectives .........................................................................................................5
2 Literature Review.....................................................................................................6
2.1 Positive Relationship .........................................................................................6
2.2 Psychological Benefits and Surveillance....................... ....................................7
2.3 Contemporary Studies ........................................................................................9
2.4 Crime Prevention Through Environmental Design .........................................14
3 Data and Methodology ...........................................................................................16
3.1 Data....................... ...........................................................................................16
3.2 Statistical Analysis ...........................................................................................24
3.3 Case Studies... ..................................................................................................28
3.4 Cherry Street Legacy Project... ........................................................................29
4 Results and Discussion ..........................................................................................33
vi
4.1 Results.............................................................................................................. 33
4.2 Discussion....................... .................................................................................37
5 Limitations and Conclusion ...................................................................................44
5.1 Limitations .......................................................................................................44
5.2 Conclusion .......................................................................................................47
References ..........................................................................................................................50

1
Chapter 1
Introduction
1.1 Overview
Several scholars have suggested that there is a correlation between crime and the
amount of vegetation in urban areas throughout the United States (U.S.); however, this
relationship has not been explored in Toledo, Ohio. Crime is a major problem for cities
in the U.S. and throughout the world. Crime Prevention Through Environmental Design
(CPTED) is a way that crime can be managed by proper design and use of the built
environment. A large amount of focus is placed on promoting changes in landscaping
and vegetation, such as modifying the amount, design, and type of vegetation in an area.
Implementing CPTED features can eventually lessen fear and incidence of crime in the
future (Jeffrey, 1971).
One example in Toledo, Ohio of a CPTED-based program in action is the Cherry
Street Legacy Project. This organization uses a data-driven approach to combat crime
and promote safety through environmental design projects in neighborhoods, such as
demolishing abandoned homes to create usable green space. These efforts are not
possible without partnerships between local agencies, such as the City of Toledo and
Lucas County Land Bank, which promotes a sense of community.

2
Some researchers have mixed views on the crime and vegetation relationship
based on certain aspects of vegetation. Dense vegetation in urban university campuses,
parking lots, and residential sites, have proven to change people’s perceptions of safety
and induce fear of crime by providing hiding places, or concealment, for potential
offenders and block barriers for victims to escape (Shaffer & Anderson, 1985; Nasar &
Fisher, 1993). On the contrary, high-nature, or vegetated common areas in the inner city
are said to improve psychological health and lower stress (Kaplan, 1995). These natural
environments also have the benefit of attracting large crowds of people, which increases
surveillance and thus deters people from committing criminal activities in areas with
more watchful “eyes on the street” (Coley, Kuo & Sullivan, 1997; Kuo & Sullivan,
2001a; Kuo & Sullivan, 2001b).
Geographic information systems (GIS) and remote sensing technologies have
provided more in-depth ways to explore the relationship between crime and vegetation.
This is conducted mostly through a multitude of regression analyses. A major theme of
this research is that socioeconomic and structural factors, such as income, race,
educational attainment, occupancy, population density, poverty, property hardening, and
security mechanisms, could be correlated with vegetation (Donovon & Prestemon, 2010;
Gilstad-Hayden, et al., 2015; Pearsall & Chistman, 2012; Snelgrove et al., 2004; Troy,
Grove & O’Neil-Dunne, 2012; Wolfe & Mennis, 2012). These variables are tested
through statistical modelling which can explain some of the observed effects that
vegetation, crime, and different types of crime may have on one another.
This study focuses on the city of Toledo, Ohio and utilizes the ideas presented in
contemporary studies from other cities as a basis to analyze whether a link exists between
3
crime and vegetation, along with comparing crime to sociodemographic variables by
utilizing statistical analysis methods. The paper furthers the understanding of a more
comprehensive approach to solving the urban crime dilemma through CPTED strategies
enacted by the Cherry Street Legacy Project, which is used as a case study.
1.2 Study Area
The geographic area of focus for this research is the city of Toledo, which is the
fourth most populous city in Ohio. Located in Northwest Ohio on the banks of the
Maumee River, it has a land area of 80.69 square miles and a city population of an
estimated 274,975 (U.S. Census Bureau, 2018). Boundaries were defined by 2016
Census block groups (N = 300). Although land use in Toledo is predominantly urban and
residential, the city is home to several natural areas, including 4 large metropolitan parks
and 136 city parks. Overall, Toledo's total crime rate is 52.13 crimes per 1,000 people, or
1.46 times the state rate and 1.84 times the national rate (U.S. Department of Justice,
2016). Violent crime occurs at a higher rate of 2.91 times the state rate and 3.09 times the
national rate, followed by property crime at 1.27 times the state rate and 1.64 times the
national rate. This makes Toledo rank as having the third highest crime rate in the state
behind Cleveland and Cincinnati.

4
Figure 1.1 Map of Toledo, OH with block group boundaries.
Source: Cartography by author using data from U.S. Census Bureau, Geography Division
1.3 Problem Statement
This thesis seeks to answer the primary question: Does a relationship exist
between vegetation and crime in Toledo, OH? Secondarily, are there significant
correlations between crime and other potentially confounding demographic and
socioeconomic factors? Understanding these relationships has implications for how
Toledo can work to prevent future crimes by focusing on environmental planning and
greening efforts.

5
1.4 Objectives
There are several objectives related to these research questions. The problems are
assessed by the following parameters:
1. Assess the current crime and socio demographic status in Toledo, OH.
2. Use analyses through remote sensing and GIS to determine whether a statistical
relationship exists between crime rate and the amount of vegetation in Toledo,
while also comparing correlations between crime and sociodemographic factors.
3. Determine how a local community planning initiative, the Cherry Street Legacy
Project, is working towards alleviating the impact of crime in Toledo through
Crime Prevention Through Environmental Design (CPTED).
4. Discuss the methodology used, its accuracy in the assessment of the crime and
vegetation, and whether changes could be made to improve future research.
6
Chapter 2
Literature Review
2.1 Positive Relationship
There is an immense amount of literature addressing the relationship between
vegetation and crime in urban areas throughout U.S. cities. Contemporary research
suggests that there is both a positive and negative relationship between vegetation and
crime. In addition, studies often include other socioeconomic and demographic variables
when comparing this correlation, because vegetation is not always the sole predictor of
crime in most cases. Geographic information systems (GIS) and remote sensing
technologies have significantly enhanced this type of research and have led to renowned
discoveries.
Although a majority of analyses reveals an inverse relationship, some recognize a
positive relationship and specifically identify the presence of vegetation relating to a
heightened fear of crime. A study in the year 1985 asked college students to rate the
level of security and attractiveness of 188 scenes of commercial and residential parking
lots throughout the cities of Athens and Atlanta, Georgia. The researchers concluded that
the presence of more natural, less maintained vegetation decreased the amount of security
felt by the students, thus increasing fear of crime (Shaffer & Anderson, 1985). Similar

7
findings were discovered from analyzing responses to site plans, on-site surveys, and
observations of pedestrian behavior at specific locations surrounding the Wexner Center,
an academic building at the Ohio State University in Columbus, Ohio (Nasar & Fisher,
1993). Results revealed that areas of high refuge, or concealment for a potential
offender, and limited prospect, or visibility for the victim, led to the most fear of crime.
Fear of crime was also heightened by lack of possibilities for escape, which was
characterized by heavy vegetation including tall, dense shrubs that inhibited line of sight.
These so-called crime “hot spots” also caused more difficulty for police to survey and
keep these locations secure and safe (Nasar & Fisher, 1993).
Not all vegetation reduces visibility or is view obstructing, however. A study
based on interviews with residents, housing authority administrators, and police at the
Robert Taylor Homes public housing development in Chicago, Illinois found that mature
trees generated less fear than bushes and shrubs (Kuo, Bacaicoa, & Sullivan, 1998).
Although these studies mentioned above focus on small-scale sites and do not address
actual crime data, there is a realization that urban vegetative landscape features can affect
the fear of crime felt by citizens.
2.2 Psychological Benefits and Surveillance
The other side of the discussion claims that vegetation helps to deter crime. This
idea is supported by both theoretical and empirical evidence. In fact, the power of the
natural environment, such as wooded and grassy areas, to influence mental health, human
behavior, and surveillance is well documented. The activities of people living in two
urban public housing complexes in Chicago, for example, were observed to determine

8
whether natural elements played a role in the use of outdoor spaces. After over a month
of observing residents’ behavior at these facilities and computing the data, results showed
that the presence of trees in outdoor areas attracted nearly three times more people than
those areas that were treeless (Coley, Kuo, & Sullivan, 1997). One way in which this
particular preference can be explained is by the work of Stephen Kaplan who suggested
that exposure to nature, which is trees in this case, has the potential to reduce mental
fatigue, or directed attention fatigue, and provide other restorative benefits (Kaplan,
1995). This is because nature and natural landscapes, such as vegetated areas in a busy,
fast-paced urban setting, can effortlessly engage one’s attention and eliminate the need to
think so much about problems at work or home, traffic, and complex decision-making,
which consumes most of our lives on a daily basis, especially for inner-city inhabitants.
Mental fatigue is related to the symptoms of irritability, inattentiveness, and decreased
control over impulses, which are linked to violence (Kaplan, 1987). Vegetation is not
only effective in reducing mental fatigue; it also mitigates aggression and inhibits the
potential for criminal behavior, thus lowering levels of crime.
Besides lowering aggressive behavior, vegetation also increases both informal and
implied surveillance (Kuo & Sullivan, 2001a). Informal or actual surveillance is related
to the use of vegetated outdoor spaces rather than open, barren spaces. With more people
present in natural settings, vegetation draws more eyes on the street and thus deters
criminals away from well-used spaces. Implied surveillance relates to the maintenance
and care shown to landscaping and vegetation in neighborhoods, where attractive
landscaping is known as a “cue to care” and a territorial marker (Kuo & Sullivan, 2001b).
For example, if the vegetative features of a home are well maintained, this implies that

9
the resident pays attention to their property and acts as a physical cue to a potential
intruder that they would be noticed and caught.
This idea of maintenance and care is highlighted by the broken windows theory in
that criminals are more attracted to areas that seem more poorly maintained. The theory
was formed out of a mid-1970s policing effort that assigned officers to walk in
neighborhoods and maintain order instead of patrolling from their patrol cars. The basic
premise of the broken windows theory is that if a window in a building is broken and is
left unrepaired, the rest of the windows will soon be broken (Wilson & Kelling, 1982).
Broken windows points to lack of a care and social order in a community that could
influence criminals to commit more crimes there and not care about any repercussions.
Similarly, areas where vegetation is left overgrown or unmaintained can suggest to
criminals that it is okay to commit a crime there.
2.3 Contemporary Studies
Given the many psychological benefits and vigilance due to the presence of
vegetation, the link between vegetation and a reduction in actual crimes is also
sufficiently supported by many more recent research studies. GIS and remote sensing
serve as important tools to analyze the negative, or inverse, relationship between
vegetation and crime through a number of techniques. An important study conducted by
(Kuo & Sullivan, 2001b) was one of the first to observe the relationship of vegetation and
police crime reports. Aerial photographs taken by helicopter and ground-level views for
each of the 98 apartment buildings at the Ida B. Wells public housing development in
Chicago were rated based on the level of tree canopy cover and grass surrounding them

10
(Kuo & Sullivan, 2001b). Other potential predictor variables assessed were occupancy,
vacancy rates, building height, income levels and educational attainment of residents. By
running the variables through a multivariate ordinary least squares (OLS) regression,
results revealed that areas with high vegetation attributed to half as many crimes
compared to low vegetation areas. The confounding variables, however, did not hold
strong predictive power as vegetation proved to be the strongest predictor of crime. This
finding made a unique contribution by being the first study to use actual crime reports to
indicate a negative association between vegetation and crime in an inner-city setting.
Building on the work of Kuo and Sullivan (2001b), Donovan and Prestemon
(2012) focused on a residential scope, specifically the characteristics of trees, along with
property and neighborhood characteristics in relation to crime data. Donovan and
Prestemon (2012) analyzed a neighborhood in Portland, Oregon with a high proportion of
single-family homes by taking site visits to each home. The tree variables were related to
the size of trees on each respective lot, street, and block by measuring the crown of the
trees from aerial photographs. Other variables considered were housing attributes, level
of barriers to the property, alarm systems, street lighting, presence of porches, and
neighborhood watches (Donovan & Prestemon, 2012). A Poisson regression count
model was used to generate results, which proved that trees located along residential
streets, and those with larger crowns on private lots were associated with less crime. This
is because larger trees have higher crowns and are therefore less view obstructing for
residents, compared to smaller trees or shrubs on a private lot, which provide more cover
for criminals and therefore more crime occurrences. Although surveillance mechanisms
and structural characteristics may influence the motivation of a potential perpetrator, this

11
study found that large trees and trees along public right-of-ways provided the strongest
negative relationship between tree cover and crime.
Tree canopy cover was used in other studies with larger scopes. For example,
Gilstad-Hayden et al. (2015) used tree canopy cover as a measure of vegetation in the
mid-sized city of New Haven, Connecticut. A 30-meter land cover data was calibrated
from the National Land Cover Database (NLCD) with 1-meter aerial imagery, which
allowed the tree crowns to be isolated and geo-located and converted into percentage per
block group (Gilstad-Hayden, et al., 2015). Crime rates for violent crime, property
crime, total crime, and socio-demographic control variables were run through a OLS
regression and spatial lag model. The lag model was chosen because of the presence of
spatial autocorrelation and it adjusts for that. Autocorrelation occurs when a variable in
one area is affected by characteristics within that area and another area, which can create
spillover and biased statistical errors, which violate OLS assumptions of the independent
variables. Results affirmed a negative correlation with every 10 percent increase in tree
canopy cover associated with a 15 percent decrease in violent crime rates, and a 14
percent decrease in both property and total crime rates (Gilstad-Hayden, et al., 2015).
There were also compelling results associated with the control variables as renter
occupied housing and lower population density related to higher crime rates, while
African Americans and Hispanics were associated with increased violent crime, but not
property or total crime.
Unfortunately, the methods used by Gilstad-Hayden et al. (2015) only measured
tree crowns and left other types of smaller vegetation unrepresented. This may have
affected the study’s effectiveness. Troy, Grove, and O’Neil-Dunne (2012) attempted to
12
solve this issue by combining the use of color infrared imagery and surface models
generated from light detection and ranging (LiDAR) data in Baltimore, Maryland. The
use of LiDAR proved to be valuable because it allowed for more accurate detection of
trees obscured by shadows and the differentiation between canopy trees versus low
woody vegetation known as shrubbery (Troy, Grove, & O'Neil-Dunne, 2012). The
variable created was the percentage of tree canopy cover by block group in public versus
private land. A crime index including robbery, theft, and shooting was set as the
dependent variable, while tree canopy cover was set as the independent variable, along
with a number of socioeconomic conditions. Based on results from a geographically
weighted regression (GWR) model, which is commonly used to explain local spatial
relationships better than an OLS regression and spatial lag model, the study found that
there was a 20 percent decrease in crime for every 10 percent increase in tree canopy
cover (Troy, Grove, & O'Neil-Dunne, 2012). This means that tree canopy cover is
significantly associated with a reduction in crime.
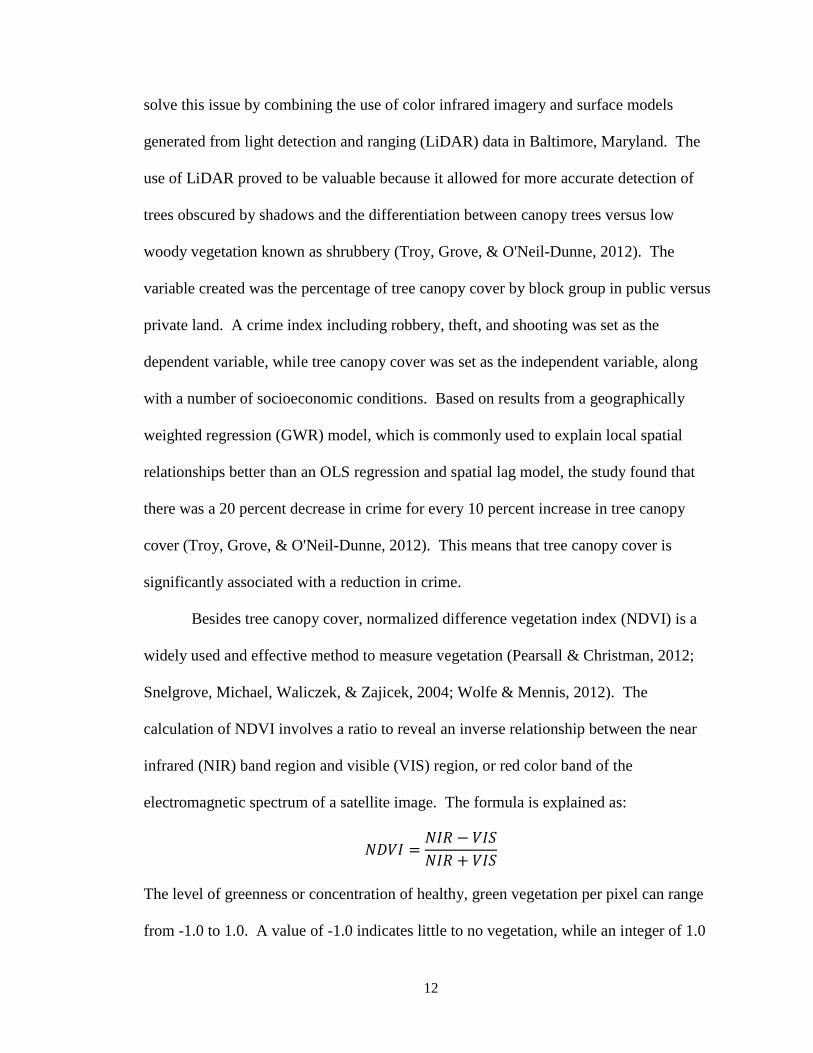
Besides tree canopy cover, normalized difference vegetation index (NDVI) is a
widely used and effective method to measure vegetation (Pearsall & Christman, 2012;
Snelgrove, Michael, Waliczek, & Zajicek, 2004; Wolfe & Mennis, 2012). The
calculation of NDVI involves a ratio to reveal an inverse relationship between the near
infrared (NIR) band region and visible (VIS) region, or red color band of the
electromagnetic spectrum of a satellite image. The formula is explained as:
𝑁𝐷𝑉𝐼 =𝑁𝐼𝑅 − 𝑉𝐼𝑆
𝑁𝐼𝑅 + 𝑉𝐼𝑆
The level of greenness or concentration of healthy, green vegetation per pixel can range
from -1.0 to 1.0. A value of -1.0 indicates little to no vegetation, while an integer of 1.0

13
contains 100 percent vegetation (Snelgrove, Michael, Waliczek, & Zajicek, 2004).
Snelgrove, Michael, Waliczek, and Zajicek (2004) incorporated mean NDVI values per
census tract into a GIS interface for Austin, Texas. Crime reports, indexed by severity
level, and income levels were included along with NDVI. The data was analyzed through
Pearson’s correlation coefficient to reveal its statistical significance, which revealed that
nearly 83 percent of all crimes occurred in areas lower than the mean greenness value for
Austin (34 percent) and a strong negative correlation between the number of crimes and
greenness was discovered (Snelgrove, Michael, Waliczek, & Zajicek, 2004). It was also
proven that crime severity, based on the type, was not affected by income level or
vegetation.
NDVI was utilized again by Wolfe and Mennis (2012) in their analysis that
compared the crime rates of assaults, robberies, burglaries, and thefts in relation to mean
NDVI values per census tract in Philadelphia, Pennsylvania. Additional explanatory
variables included poverty rate, educational attainment, and population density. Results
from an OLS and spatial lag model indicated that all of the crimes, besides theft, were
significantly associated with higher vegetation indices. Poverty was positively associated
with each crime type, which is common, as more crime tends to occur in impoverished
areas. Significant negative correlations, however, were found between population
density and aggravated assaults and burglaries meaning these crimes are tied to sparser
populations. Educational attainment was not significantly associated with crime.
Although OLS and GWR regression analyses may be at the forefront of a number
of the studies mentioned, it is important to note that those regressions did not account for
spatial autocorrelation, which was a common issue when dealing with crime and multiple

14
control variables. Spatial autocorrelation relates to the violation of the regression
assumptions of the independent error terms (Troy, Grove, & O'Neil-Dunne, 2012). For
example, crime in one geographic area could be affected by characteristics in that area
and in other areas, leading to spillover effects, biased assumptions and less accurate
results. Overall, this led researchers to test their data with several methods and spatially
adjusted methods to account for potential errors.
2.4 Crime Prevention Through Environmental Design
Given the aforementioned studies, there is a mostly negative relationship between
vegetation and crime in contemporary literature, which has spawned a number of
community planning initiatives that work to reduce crime and improve community health
which focus on vegetation and environmental design. CPTED is a concept that has
become a popular crime prevention strategy throughout Europe, North America,
Australia, and New Zealand, as well as in Asia and South Africa (Love, 2015). It looks
at how opportunities for crime can be reduced through the built urban form first coined
by criminologist Ray Jeffrey in 1971. The term was modernized more by Oscar
Newmann’s 1972 work, Defensible Space, which highlighted the need to make spaces in
urban communities and neighborhoods safer by providing practical design elements
based on architecture and the physical environment. Newmann’s four main design
elements included territoriality, surveillance, image and milieu, and environment. He
calls for communities to be controlled not by police, but by a community of people
sharing a common terrain (Newman, 1972). This can be done by improving visibility and

15
sight lines between buildings and homes, using appropriate lighting, and promoting
proper maintenance measures for vegetation.
Since the 1970s, CPTED’s ideas have been refined by researchers, policymakers,
and practitioners to focus more on social factors to create cohesion by supporting and
celebrating diversity. Community connectivity is another factor that makes it imperative
to develop partnerships with governmental and nongovernmental groups to coordinate
activities and programs that support CPTED initiatives. The residents and other
community members should also have the opportunity to participate and let their voices
be heard throughout the decision-making process. When the physical characteristics of a
crime-ridden neighborhood are altered through planning and community initiatives based
on CPTED principles, criminal activity can be reduced at these geographic hot spots and
establish a resurgence of a stronger sense of community over time.
Several substantial conclusions can be made regarding literature on the topic of
vegetation and crime. A majority of publications support the idea that vegetation and
crime are inversely related and that vegetation significantly reduces crime in urban
environments. Methods through remote sensing and GIS hold the keys to analyzing these
relationships by creating different ways to calculate vegetation and compare
sociodemographic data. Although it was found that few sociodemographic variables are
effectively correlated to crime, each study is unique and their predictive ability can
change based on the study area, geographic units and factors under investigation.
Advancements in the understanding and analysis of vegetation and crime can assist
communities to better plan for the future and figure out ways to reduce crime through
urban planning policies and environmental design.

16
Chapter 3
Data and Methodology
3.1 Data
Toledo’s crime, vegetation, and socioeconomic data were collected from various
sources for this study. Crime data was provided by the Toledo Police Department (TPD)
from the year 2016. The crime data is a list of incidents reported to TPD that included
the date, time, address, and type of offense. The only crime reports used for this study
were those that provided a valid address within the city of Toledo’s boundaries and
completely contained within a Census block group. In all there are 302 block groups in
Toledo; however, two block groups were removed which contained a shopping center,
Franklin Park Mall, and college campus, the University of Toledo (UT), reducing the
number of block groups to 300. The block group containing the mall had the highest
property crime count in the city due to it being a heavily trafficked commercial area,
which skewed the data. A majority of UT’s crime is reported to the campus police
department and not TPD, which means the crime counts there were inaccurate and
unusable. In total, there were 11,290 crime occurrences matched to addresses through the
geocoding process in ArcMap 10.6.1. Crimes were then separated into two categories as

17
a means to identify if certain crime types had varying degrees of association with
vegetation and sociodemographic factors. The crimes were categorized based on the
2016 FBI’s Uniform Crime Report, which defines which types of crimes are violent or
property-related. Violent crime accounts for murder/non-negligent manslaughter, rape,
robbery, and aggravated assault. Property crime includes burglary, larceny-theft, motor
vehicle theft, and arson. Total crime includes both violent and property crime combined.
The average total crime rate in Toledo was calculated at 47.97 crimes per 1,000 people.
There were 1,932 violent crimes and 9,358 property crimes, with crime rates of 8.71
violent crimes and 39.26 property crimes per 1,000 people. These three crime types
(violent, property, and total) were aggregated at the block group level (N = 300) as a
means to quantify the point data and keep homogeneity amongst the other data. The data
was then converted into crime rates per 1,000 people. Table 3.1 below gives a statistical
summary of Toledo’s crime rates, followed by Figure 3.1.2 presenting choropleth maps
of crime rates by block groups.
Table 3.1 Descriptive statistics of violent, property, and total crime in 2016
Variable Mean Std. Dev. Minimum Maximum
Violent Crime (per 1,000 people) 8.71 9.91 0.00 59.78
Property Crime (per 1,000 people) 39.26 29.28 0.00 205.13
Total Crime (per 1,000 people) 47.97 36.56 0.00 217.95
Source: Toledo Police Department Statistics, 2016

18
Figure 3.1.2 Darker shading indicates more crime. The maps suggest that violent crime
is more concentrated in the center of the city, while property and total
crime are dispersed throughout with less crime in the north and south.
Source: Cartography by author using Toledo Police Department Statistics, 2016
Vegetation data was gathered from an aerial satellite image covering Toledo, OH.
The image was obtained by the Sentinel-2 satellite, operated by the European Space
Agency, via the EO Browser website database. The 10-meter (m) resolution remotely
sensed infrared image was taken during the summer on June 29, 2016 to ensure that
vegetation was at peak greenness levels. The ArcGIS Image Analysis tool was utilized to
calculate the NDVI value for each pixel of the image.

19
The formula for NDVI is stated as follows:
𝑁𝐷𝑉𝐼 =𝑁𝐼𝑅 − 𝑉𝐼𝑆
𝑁𝐼𝑅 + 𝑉𝐼𝑆
where the near-infrared band (NIR) and visible light band (VIS), or red color band,
creates a ratio of the amount of vegetation per pixel. The resulting interval spans from -
1.0 to 1.0, in which a value greater than 0.5 indicates dense, healthy vegetation, while a
value near zero or below pertains to unhealthy vegetation, barren soil, rock or inanimate
objects such as buildings and roads (Wolfe & Mennis, 2012). The average NDVI per
block group was then computed through ArcMap’s Zonal Statistics tool, which calculated
the mean value of all the NDVI image pixels that fell within each block group. The mean
NDVI was then converted into a percentage to measure the mean greenness level, where
a value -1.0 received a 0% and a 1.0 received a 100% on the greenness scale. Overall,
Toledo’s land area consists of 37.29% average healthy vegetation. The vegetation data is
explained below in Table 3.1.3 and Figure 3.1.4.
Table 3.1.3 NDVI versus mean greenness values by block group. Overall, Toledo’s land
area consists of 37.28% healthy vegetation.
Mean Minimum Maximum
NDVI Values (-1 to +1) 0.37 -0.69 0.70
Mean Greenness (%) 37.29 12.69 55.59

20
Figure 3.1.4 The map on the left shows the raw NDVI values and the map on the right
shows mean greenness levels by block group. Green represents healthy
vegetation compared to orange and red, which are unhealthy vegetation.
There are higher concentrations of vegetation in the west and
northwest part of the city compared to the central, east and northeast
regions.
Source: Cartography by author using satellite imagery from EO Browser
Control, or explanatory variables, in the form of sociodemographic conditions
were another important aspect of this study. These factors were used to test the
association independently of vegetation over crime. The block group-level population
data was obtained through the U.S. Census Bureau’s American Factfinder website,
https://factfinder.census.gov/, from the 2012 to 2016 American Community Survey
(ACS). Four sociodemographic variables were chosen for this study based on previous
studies (Gilstad-Hayden, et al., 2015; Kuo & Sullivan, 2001b; Troy, Grove, & O’Neil-
Dunne, 2012; Wolfe & Mennis, 2012). They included vacancy rate (percent of vacant
housing units), race/ethnicity (percent of black population or nonwhite population), and
educational attainment (percent of population 25 years and older with less than a high
school degree), per capita income in the past 12 months which is the average income per
person, and population density (per square mile). Toledo’s block groups had an average

21
vacancy rate of 14.82%. Its black population was 28.66% and it had a high educational
attainment with only 3% of the population having less than a high school degree. Median
per capita income was measured at an average of $20,220, which is 1.61 times lower than
the national average of $32,620 (U.S. Census Bureau, 2018). Population density in
Toledo had a range between 353.88 and 18,725.96 people per square mile with a mean of
4,910.07. Table 3.1.5 and Figure 3.1.6 below explain this data in more detail.
Table 3.1.5 Descriptive statistics of socioeconomic variables in 2016
Variable Mean Std. Dev. Minimum Maximum
14.82 12.98 0.00 56.85
28.66 28.75 0.00 100.00
3.00 3.71 0.00 22.19
20.22 9.30 3.84 66.53
Vacancy Rate (%)
% Black Population
% With Less Than a High School Degree Per
Capita Income (in $1000's) Population Density
(per sq. mi.) 4910.07 2953.96 353.88 18725.96
Source: U.S. Census Bureau American Factfinder, 2012-2016 American Community
Survey (https://factfinder.census.gov/)

22
Figure 3.1.6 Choropleth maps of the socioeconomic variable by block group. Darker
shading indicates block groups with higher values of the variable.
Source: Cartography by author using data U.S. Census Bureau American Factfinder,
2012-2016 American Community Survey (https://factfinder.census.gov/)
Based on the maps in Figure 4.1.6, vacancy and the percent Black population are
similarly concentrated in the west-central part of the city, while lower educational
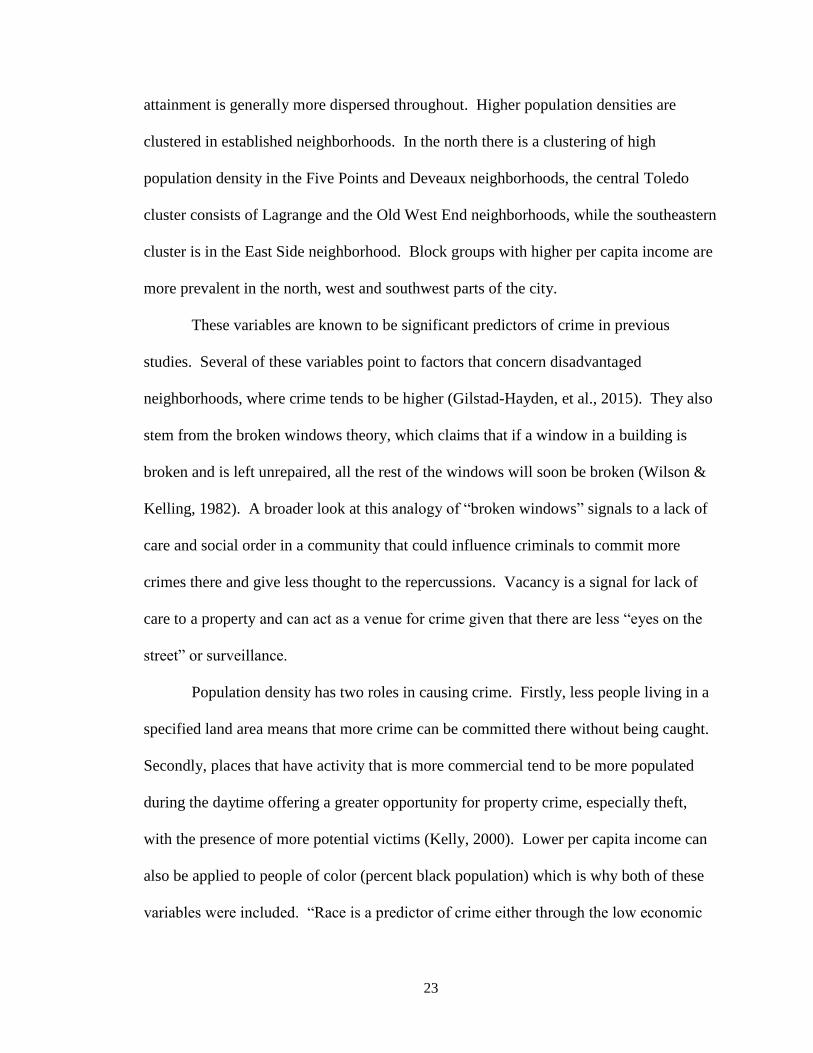
23
attainment is generally more dispersed throughout. Higher population densities are
clustered in established neighborhoods. In the north there is a clustering of high
population density in the Five Points and Deveaux neighborhoods, the central Toledo
cluster consists of Lagrange and the Old West End neighborhoods, while the southeastern
cluster is in the East Side neighborhood. Block groups with higher per capita income are
more prevalent in the north, west and southwest parts of the city.
These variables are known to be significant predictors of crime in previous
studies. Several of these variables point to factors that concern disadvantaged
neighborhoods, where crime tends to be higher (Gilstad-Hayden, et al., 2015). They also
stem from the broken windows theory, which claims that if a window in a building is
broken and is left unrepaired, all the rest of the windows will soon be broken (Wilson &
Kelling, 1982). A broader look at this analogy of “broken windows” signals to a lack of
care and social order in a community that could influence criminals to commit more
crimes there and give less thought to the repercussions. Vacancy is a signal for lack of
care to a property and can act as a venue for crime given that there are less “eyes on the
street” or surveillance.
Population density has two roles in causing crime. Firstly, less people living in a
specified land area means that more crime can be committed there without being caught.
Secondly, places that have activity that is more commercial tend to be more populated
during the daytime offering a greater opportunity for property crime, especially theft,
with the presence of more potential victims (Kelly, 2000). Lower per capita income can
also be applied to people of color (percent black population) which is why both of these
variables were included. “Race is a predictor of crime either through the low economic

24
success of black males or feelings of hopelessness in black communities” (Kelly, 2000).
These feelings of hopelessness, isolation, and despair can trigger minorities to partake in
criminal activities, such as stealing and violent offenses. It is likely that adults with less
than a high school education have less economic opportunity than those with a college
degree, which exacerbates this disadvantage and potential for crime.
3.2 Statistical Analysis
The quantitative portion of this research involved utilizing multiple regression
models to analyze the data. Qualitative methods were also employed by using a case
study to examine the phenomenon further. A multivariate ordinary least squares (OLS)
regression was employed in ArcMap 10.6.1 to determine the strength of explanatory
power that vegetation has on the three crime outcomes, while controlling for the four
sociodemographic variables. The OLS regression is expressed as:
yi = β0 + β1MEANi + β2VACi + β3RACEi + β4EDUi + β5INCi + β5POPDENi + εi
where yi is the crime rate for block group i, β0 is a constant, MEAN is mean greenness
percentage, followed by the four beta coefficients representing the socioeconomic factors
of vacancy rate (VAC), percent black population (RACE), educational attainment (EDU),
per capita income (INC), population density per square mile (POPDEN), and εi is the
error term. The p-value (p), or probability, determines the significance of the relationship
between crime rate and each predictor variable. A p-value that has a low value less than
0.01 (p < 0.01) at 99 percent confidence is meaningful to the model and indicates that you
can reject the null hypothesis, because essentially the null hypothesis is that the
coefficient is equal to zero. The strength and type of relationship is expressed in each
control variable’s coefficient (β). For example, if the coefficient for a variable is

25
negative, the relationship is negative, and if the p-value is also less than 0.01, the
independent variable has a statistically significant association with the dependent variable
by rejecting the null hypothesis. This means that the variable is a valuable predictor and
can add value to the model’s ability to explain the phenomenon.
Spatial autocorrelation is a common problem associated with regression analyses.
It accounts for the risk that the OLS assumptions of uncorrelated error terms and
independent observations were not met, since crime rates tend to be more similar and
biased among neighboring block groups than to distant block groups due to spillover
effects (Troy, Grove, & O'Neil-Dunne, 2012; Wolfe & Mennis, 2012). A Global
Moran’s I test was conducted in ArcMap to assess if the residuals of the dependent
variables had spatial autocorrelation. The tool measures spatial autocorrelation based on
both feature locations and their values simultaneously through several statistical
computations and generates the Moran’s Index, also known as the Observed Index (ESRI,
n.d.). This statistic ranges from -1.0 to 1.0, in which values below -1.0 represent negative
autocorrelation, or dispersion, while a positive number greater than -1.0 indicates positive
autocorrelation, or clustering. The test also generates z-scores, which are standard
deviations, and p-values, or probabilities, of which to evaluate the significance of the
Observed Index. Below are the result summaries and the standard normal distribution
curves associated with each crime type’s z-scores.

26
Violent Crime Rate Property Crime Rate
Total Crime Rate
Figure 3.1.7 The standard distributions tell us that the three crime rates have positive
Moran’s Index values, high z-scores, and a statistically significant p-
values, which indicates positive clustered spatial autocorrelation.
Violent crime rate had a Moran’s Index of 0.502, followed by property crime at 0.324,
and total crime with a value of 0.419. The crime data was experiencing positive spatial
autocorrelation with clustering of high-high and low-low crime rates, based on their
statistically significant p-values (p < 0.01), positive Moran’s Indexes, and high z-scores.
Because of this autocorrelation, two spatially adjusted regression models were
implemented in the GeoDa spatial modeling program – the spatial error and spatial lag
27
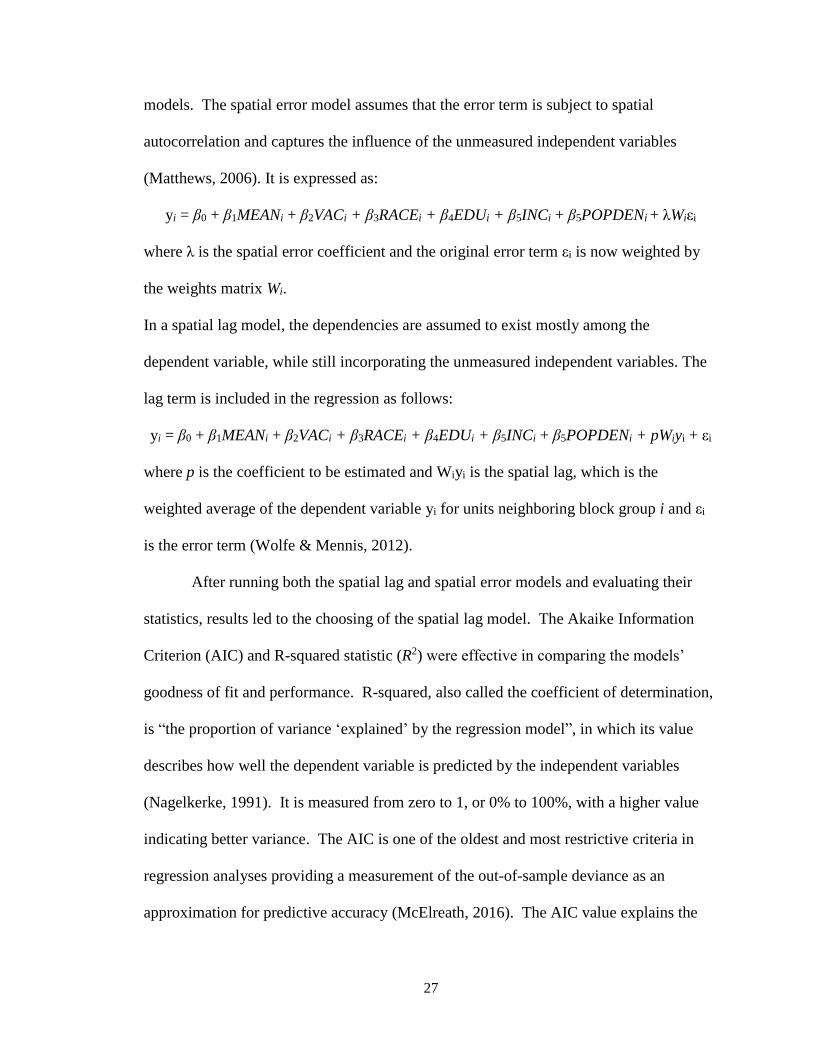
models. The spatial error model assumes that the error term is subject to spatial
autocorrelation and captures the influence of the unmeasured independent variables
(Matthews, 2006). It is expressed as:
yi = β0 + β1MEANi + β2VACi + β3RACEi + β4EDUi + β5INCi + β5POPDENi + λWiεi
where λ is the spatial error coefficient and the original error term εi is now weighted by
the weights matrix Wi.
In a spatial lag model, the dependencies are assumed to exist mostly among the
dependent variable, while still incorporating the unmeasured independent variables. The
lag term is included in the regression as follows:
yi = β0 + β1MEANi + β2VACi + β3RACEi + β4EDUi + β5INCi + β5POPDENi + pWiyi + εi
where p is the coefficient to be estimated and Wiyi is the spatial lag, which is the
weighted average of the dependent variable yi for units neighboring block group i and εi
is the error term (Wolfe & Mennis, 2012).
After running both the spatial lag and spatial error models and evaluating their
statistics, results led to the choosing of the spatial lag model. The Akaike Information
Criterion (AIC) and R-squared statistic (R2) were effective in comparing the models’
goodness of fit and performance. R-squared, also called the coefficient of determination,
is “the proportion of variance ‘explained’ by the regression model”, in which its value
describes how well the dependent variable is predicted by the independent variables
(Nagelkerke, 1991). It is measured from zero to 1, or 0% to 100%, with a higher value
indicating better variance. The AIC is one of the oldest and most restrictive criteria in
regression analyses providing a measurement of the out-of-sample deviance as an
approximation for predictive accuracy (McElreath, 2016). The AIC value explains the

28
relative amount of information that was lost by the model, so a lower number means the
model lost less information and therefore represents better quality for the dataset. The
spatial lag model was chosen because it produced a higher R-squared and a lower AIC
across all three crime outcomes when compared to the spatial error model. The spatial
weights matrix was calculated using the queen’s contiguity matrix.
3.3 Case Studies
The previous analysis methods aid in addressing the quantitative aspects by
objectively comparing crime to vegetation and sociodemographic variables; however,
another way to analyze the problem is by incorporating a qualitative method in the form
of a case study. A case study involves the study of a single instance or a small number of
people, such as an event, a process, institution, or a particular place, such as a crime-
ridden neighborhood, as a way to broaden the depth of understanding about a larger
phenomenon or a concrete problem (Baxter, 2016). It differs from a quantitative method
since it is not bounded by the study design or statistical parameters, and gives way to
more substantial findings in a real-life phenomenon. Case studies play a role in testing a
theory, by considering a case that supports or falsifies the concept under consideration, or
expanding a theory in that grounded theory and other forms of qualitative research, such
as interview and observation data, can be incorporated within a case study design. Cases
can be studied at one moment in time or across multiple instances leading to the case
being revisited in order to determine if the original explanations have endured over time.
“Statistical methods may identify deviant cases that can lead to new hypotheses,
but in isolation these methods lack any clear means of actually identifying new

29
hypotheses” (Flyvbjerg, 2011). Given that cases can be studied using different
investigative methods, this can identify left-out variables and have the potential to verify
previous discoveries and even support some statistical results. Overall, it is important to
note that the presumptions and outcomes developed through a case study are more often
due to the reality of the social phenomena studied versus the case study being used as a
research method.
3.4 Cherry Street Legacy Project
The Cherry Street Legacy Project was used as a case study for my research. It is
one of the only data-driven, neighborhood-based organizations in the nation with a
primary goal being to address crime and perception of crime by implementing CPTED-
based strategies, of which an aspect includes modifying the amount and type of
vegetation in specific areas. Although my statistical methods did not focus primarily on
neighborhood-level point-based crime data or vegetative data, Cherry Street Legacy has
identified the link between spatial and temporal crime patterns in order to assist in better
implementing CPTED principles to the built urban form. This small-scale example
supports and expands upon my research goals by providing a real-world application of
how crime is affected by the amount of vegetation in an urban setting, in which I could
potentially use to support assumptions made through my quantitative results.
Cherry Street Legacy is partnered with and headquartered at Mercy St. Vincent
Medical Center on Cherry Street in Toledo, OH. The neighborhood planning area, which
the project considers its Legacy Neighborhood and works to improve, is about a 2-mile
stretch along Cherry Street, bordered by Downtown, the Old West End, and the Old

30
North End. The area is diverse in that it offers a mix between commercial, institutional
and residential land uses. It has a high percentage of low-income housing, high vacancy
rates, and a large number of renter-occupied homes, leading to a heightened crime rate.
Institutional assets in this region include Central Catholic High School and Mercy St.
Vincent Medical Center.
Figure 3.1.8 This map shows the extent of the Cherry Street Legacy Plan Area.
Source: Cherry Street Legacy Plan, 2009
In 2009, the Cherry Street Legacy Project began working on its strategic plan to
revitalize the neighborhood by first gathering survey data from over 225 households,
which the Lucas County Land Bank extrapolated into a GIS database, to provide

31
information on whether a parcel was vacant, unoccupied, or a vacant lot. The TPD then
provided 5 years of point-based crime data to determine where crime hotspots were
located and which types of crime occurred there in order to decide on the best CPTED
features to implement and mitigate potential opportunities for crime. With the data
compiled, Cherry Street Legacy was able to devise a plan, the Cherry Street Legacy Plan,
to address blight, safety, business, and overall quality of life for the Cherry Street
corridor and surrounding neighborhoods. The development of the plan would not have
been possible without the collaboration with several community stakeholders, including
the Lucas County Land Bank, City of Toledo-Lucas County Plan Commission,
Department of Neighborhoods, Mercy Health Partners, and a number of non-profit
organizations.
In addition to using Cherry Street Legacy as a case study, I utilized other
qualitative research methods to collect data by conducting an in-person interview and
performing fieldwork. I interviewed the former coordinator of the organization, Karen
Rogalski, in August 2016, at her office in St. Vincent Mercy Medical Center. Rogalski is
also a trained CPTED professional with several years of knowledge in the field. I
observed the Legacy Neighborhood and its progress firsthand by following alongside her
as she and I walked the streets. Through the interview and walk, I collected information
on the organization and its role in making a stronger and safer community. I asked
questions pertaining to its efforts and their effectiveness in reducing crime, along with
how community engagement played a role in the longevity of the project. During our
walk, Rogalski showed me several environmental design changes and projects that took
place during the past few years. She explained Cherry Street Legacy’s efforts in detail as

32
I listened and recorded our discussion by using my cell phone and summarizing key
information by writing it down on a notepad. From there I had enough data collected to
discuss and compare these findings to my quantitative results.

33
Chapter 4
Results and Discussion
4.1 Results
There were several statistically significant results for the 300 block groups. Table
4.1 provides results from the OLS and spatial lag models predicting crime rates on the log
scale. Results were generally consistent between the OLS and spatial lag models, but the
spatial lag model had a slightly better fit for the data, given its lower AIC and higher R-
squared values for each crime outcome. For the spatial lag model, mean greenness had a
statistically significant negative relationship with violent crime (β = -0.343, p = <0.01),
property crime (β = -1.338, p = <0.01) and total crime (β = -1.664, p = <0.01), while
controlling for potential confounding variables. Based on the spatial lag model’s results
and its exponentiated coefficients, it is suggested that for every 5% increase in mean
greenness, there was an 82% decrease in violent crime rate [exp (-0.343 x 5) = 0.180].
Comparably, a 5% increase in mean greenness was associated with a 100% decrease in
property and total crime rates. These are notable results because they proved that a
greater amount of vegetation leads to much lower crime rates.

34
Significant findings were also associated with the control variables. Vacancy rate
proved to have a significant positive relationship with violent crime (β = 0.192, p =
<0.01), property crime (β = 0.599, p = <0.01) and total crime (β = 0.780, p = <0.01).
This means that higher rates of vacant housing units were associated with higher rates of
violent, property and total crime. There was also a positive correlation between percent
Black population and violent crime (β = 0.069, p = <0.01), but no association with
property or total crime rates. Educational attainment had a positive association with
property crime (β = 1.249, p = <0.01) and total crime (β = 1.302, p = <0.01), which
alluded to block groups with a less high school educated population being associated with
more crime. Lower population density was associated with higher rates of all crime
types, meaning more crime tends to occur in lesser-populated areas. The lone economic
variable per capita income did not have any significance when compared to the crime
data in either model. Overall, variance was highest in the violent crime model (R2 =
0.510), followed by total crime (R2 = 0.501), with more than half of violent and total
crime rates explained by the independent variables. Variance was lowest with property
crime (R2 = 0.429).
Table 4.1 These tables list the coefficients (β), standard errors (SE), and probabilities
(P) from OLS and spatial lag regression models predicting 2016 violent,
property and total crime rates among block groups (N = 300) in Toledo, OH.
Variable
OLS Model
Mean Greenness (%)
Vacancy Rate (%)
% Black Population
% With Less Than a High School Degree
Per Capita Income (in $1000's)
Population Density (per mi²)
Intercept
R-squared
AIC
Violent Crime Property Crime Total Crime
β SE P β SE P β SE P
0.067 <0.01 0.210 <0.01 0.247 <0.01
0.040 <0.01 0.125 <0.01 0.148 <0.01
0.017 <0.01 0.055 0.870 0.065 0.210
-0.402
0.239
0.082
0.095 0.117 0.462
-1.415
0.655
0.011
1.285 0.364 0.096
-1.817
0.894
0.092
1.380 0.429 0.100
-0.089 0.060 0.089 -0.275 0.188 0.145 -0.364 0.221 0.102
0.000 <0.01 -0.002 0.005 <0.01 -0.003 0.001 <0.01 -0.0004
21.370 2.787 <0.01 94.613 8.685 <0.01 115.982 10.222 <0.01
0.481 0.423 0.487
2047.15 2729.05 2826.80

35
Variable
Spatial Lag Model
Mean Greenness (%)
Vacancy Rate (%)
% Black Population
% With Less Than a High School Degree
Per Capita Income (in $1000's)
Population Density (per mi²)
Intercept
Lag Coefficient (Rho)
R-squared
AIC
By examining the relationship between vegetation and crime in the high crime
mid-sized city of Toledo, OH, there is sufficient evidence proving the important role that
vegetation plays in influencing crime rates. The negative association between vegetation
and crime was the strongest relationship above all of the sociodemographic factors.
These findings supported other research results from similar studies in large metropolitan
areas, such as Chicago, Portland, Baltimore, Philadelphia, and even smaller cities, like
New Haven, CT (Donovan & Prestemon, 2012; Gilstad-Hayden, et al., 2015; Kuo &
Sullivan, 2001; Troy, Grove, & O'Neil-Dunne, 2012; Wolfe & Mennis, 2012).
The associations between crime and some of the control sociodemographic
variables were not as strong with vegetation, but they were significant nonetheless. The
most reliable variable among the sociodemographic factors was vacancy rate, in which it
proved as a strong positive predictor of all crime types. This falls in line with the idea of
less “eyes on the street” giving way to more crime to take place (Coley, Kuo & Sullivan,
1997; Kuo & Sullivan, 2001a; Kuo & Sullivan, 2001b). Another striking observation
was that unlike the original expectation that higher populated areas would bring more
crime, population density had an inverse relationship with crime across all outcomes.
Violent Crime Property Crime Total Crime
β SE P β SE P β SE P
0.066 <0.01 0.211 <0.01 0.247 <0.01
0.040 <0.01
-1.338
0.599 0.125 <0.01 0.147 <0.01
0.018 <0.01 0.055 0.963 0.065 0.381
-0.343
0.192
0.058
0.057 0.112 0.610
-0.003
1.249 0.359 <0.01
-1.664
0.780
0.057
1.302 0.420 <0.01
-0.057 0.058 0.329 -0.230 0.186 0.217 -0.276 0.218 0.205
-0.001 0.0001 <0.01 -0.002 0.0004 <0.01 -0.003 0.001 <0.01
17.862 2.841 <0.01 87.473 9.757 <0.01 103.077 11.373 <0.01
0.272 0.123 0.182
0.510 0.429 0.501
2033.48 2725.99 2820.16

36
Although population density’s coefficients were low and this relationship was generally
weak, it coincides with the results of a negative relationship founded by (Gilstad-Hayden,
et al., 2015) and (Wolfe & Mennis, 2012). One possible explanation for this is how
spread out Toledo’s population density is across its block groups because of the lack of
permanent residents living downtown and higher densities situated in neighborhoods
outside of the center city. There are still temporary influxes of higher population in the
downtown block groups due to concerts, sporting events, and work, noted by generally
higher crime rates there, but a large number of residents living in close proximity is
generally lacking.
Other important realizations were the positive associations of race and educational
attainment with crime, which tied to disadvantaged neighborhoods. Higher rates of
violent crime were associated with a higher percent of black population. This supports
the idea of nonwhite individuals being more disadvantaged and more apt to commit
crimes due to potential feelings of hopelessness (Kelly, 2000). Greater percentages of
individuals with less than a high school education were attributed to higher rates of
property crime and total crime, which ties in with the idea of disadvantaged communities
living among areas of higher crime. Per capita income, the only economic variable used,
was insignificant with all crime types. There is no reasoning behind this lack of
significance but it does follow similar findings in other articles comparing crime and
vegetation (Gilstad-Hayden, et al., 2015; Snelgrove, Michael, Waliczek, & Zajicek,
2004).

37
4.2 Discussion
Although the statistical results reveal that the presence of more vegetation is a
clear indicator of lower crime rates, some of the sociodemographic relationships hold
clues as to the type of actions taken by the Cherry Street Legacy Project to mitigate the
impact of crime. Through my interview with Rogalski, she affirmed that blight,
particularly vacant properties, were the first items to be addressed by the organization.
This follows along with my findings of high vacancy rates being associated with higher
crime rates, and the fact the Cherry Street Legacy Project was making it a priority to
lower vacancies reassured this presumption. These actions also supported the concept
behind the “broken windows theory” because if a rundown property is transformed into
attractive greenery or landscaping, it lowers the chances for more houses to become
vacant nearby and for criminal activity to occur.
An example of a successful neighborhood-led crime reduction initiative took
place in the year 2016 on Mentor Drive off Cherry Street between Central Avenue and
Manhattan Boulevard. Mentor Drive was coined the name “Murder Alley” by residents
due to its association with violent crime and shootings. Mentor Drive was a cul-de-sac
consisting of 14 parcels, 11 of which were acquired by the Land Bank following tax
foreclosure. Four of those parcels were already vacant, while 7 were torn down.
Coordination between St. Vincent’s Cherry Street Legacy, the City of Toledo, the
Toledo-Lucas County Sustainability Commission, and a local non-profit farming group,
the Glass City Goat Gals, led to a unique solution of adaptive reuse for the 14 vacant
parcels by creating an urban farm, complete with goats, a butterfly house, and a vegetable
garden. Volunteers included high school students from Toledo’s Scott High School, who

38
were members of a summer youth program called the Green Team, and helped change
the street’s name to “Glory Road”. This illustrates that Cherry Street Legacy, along with
engagement and help from the community could create something new out of the street’s
former, violent past and change one’s perception of the once feared street.

39
Figure 4.1.2 These two photos represent an environmental change from a street that was
once filled with abandoned homes in August 2011 and crime (top) to one
that now has its own urban farm, taken from May 2019 (bottom).
Source: Google Earth Street View
Another successful project took place in 2013 involving a vacant nursing home,
Arbors at Toledo located on Cherry Street, with the help of the Land Bank, City of
Toledo, and Bronson Place Association. The building was demolished; the land was
cleared and then transformed into an arboretum filled with several different species of
trees and plants surrounded by fencing. The eyesore that was one the abandoned nursing
home is now a beautiful natural area that the public can utilize.
I was fortunate enough to walk with Rogalski to observe both Glory Road, the
Bronson Place arboretum, and the entirety of the Legacy Neighborhood as she explained
CPTED features and other projects along the way. There were numerous other areas in
the neighborhood where vacant homes were torn down and replaced with shrubs, trees

40
and green space. It was striking to me that simple changes to enhance sight lines
allowing residents to see across the street, along with creating opportunities to experience
nature and reducing crime opportunities, could have such a positive impact on the
community as whole and create a safer environment.
When I asked Rogalski about what types of crime were the most common in the
neighborhood at the start of the project, she said burglaries were the highest. After
CPTED features were put into place in several areas throughout the neighborhood, such
as planting shrubs 2 feet or lower and trimming trees to a height of 6 to 8 feet, she
claimed it helped decrease burglaries and property crimes in a period of three years. This
was mainly due to increasing line of sight and providing less ambush points (Rogalski,
2016). The Land Bank played an integral part in its ability to acquire and demolish
abandoned homes, which helped rid these areas once filled with crime and replacing them
with sustainable land for which residents could utilize. In making these once rundown
spaces usable again with attractive landscaping, it installed a sense of care and promoted
surveillance, which deters potential criminals away.
Another example that benefited the region in lowering vacancies involved the
help of NeighborWorks Toledo Region (NTR), a Toledo-based housing development and
redevelopment agency, and the Land Bank. In 2011, NTR collaborated with Cherry
Street Legacy to create a housing tax credit proposal known as Legacy Homes Project.
This program involved the Land Bank’s acquisition of a 40-lot area in Central Toledo. In
2013, 40 affordable single-family homes were constructed on these mostly vacant parcels
for low-income residents. The lease-purchase program allowed tenants to rent these
homes and eventually purchase them after 15 years. Overall, this project aided the region

41
in lowering vacancies by supplying more affordable housing options for low-income
residents in an otherwise blighted area. Building more homes also has potential to lower
crime due to increasing the amount of “eyes on the street”. This contradicts the statistical
finding, however, of lower population densities being associated with higher crime rates
since densities are being increased with new housing.
Using the Cherry Street Legacy Project as a case study presents a local example
of CPTED concepts on display through their work in the community that go beyond just
physical design. The effect of these projects does more than lowering the impact of
crime from these areas. Overall, these initiatives promote social cohesion, community
connectivity, community culture, and threshold capacity, which are second-generation
CPTED principles (Saville & Cleveland, 2006).
Social cohesion points to enhancing relationships between residents and
celebrating their diversity. This involves the collaboration of neighbors and other
community groups to establish the problems facing the community on which to apply
CPTED strategies to provide a long-term vision with a singular goal. This cohesion
began in 2009 by coordinating meetings with local government agencies, nonprofit
entities and neighborhood residents to establish a clear plan for what needs to change for
the community to prosper. The collaborative efforts with the City of Toledo allowed the
Cherry Street Legacy Plan to be adopted into the City of Toledo’s 20/20 Plan, which is
the city’s comprehensive master plan, making it an important part of the community
fabric.
This leads to the second concept of community connectivity, which states that
partnerships “are the foundation to coordinating activities and programs with and

42
between government and nongovernment agencies” (Love, 2015). The connectivity
developed through Cherry Street Legacy’s local partnerships are helpful in creating a
stronger sense and feeling of empowerment to the community. Nurturing these
relationships is detrimental to fulfilling many of its efforts. Since residents of the Legacy
Neighborhood feel that they are supported by other community groups in their efforts to
make a vibrant community, it instills a sense of pride that they have for their
neighborhood and makes them more apt to look out for others. This means they may feel
more inclined to report criminal behavior, take better care of their own property, and
support their fellow neighbors by reaching out to them in times of need.
Community culture is the next idea of new-age CPTED principles, which
establishes a sense of community by setting up events, such as festivals or cultural
celebrations. These things can make people’s perceptions of a community more positive
and encourage neighbors to look out for others’ well-beings. Even if it is a small
example, the creation of Glory Road’s urban farm gives the community a sense of culture
and optimistic outlook by allowing the residents to care for livestock, a vegetable garden,
and feel a sense of pride that otherwise was shadowed by fear of crime. The Goat Gals
have even had educational events after the establishment of the goat pasture in order to
create opportunities for the public to learn about and experience urban farming.
The last idea is threshold capacity alludes to neighborhoods as living ecosystems
with a certain amount of capacity for types of activities and land uses. Threshold
capacity speaks to incorporating social stabilizers, such as community gardens and
entertainments, while limiting crime generators, such as abandoned homes and bars. The
Cherry Street Legacy Project was cognizant of this threshold and created several social

43
stabilizers to offset its crime generators through its community gardens, arboretums, and
urban farm. Unfortunately, disorderly conduct, characterized by threats and menacing,
remains a major issue in the Legacy Neighborhood due to the amount of and proximity to
alcohol-related retail stores in the area, which include liquor stores and gas stations.
These establishments are not easy to eliminate from a community and are sometimes
unavoidable in the harm they cause. However, by continuing to implement these CPTED
strategies, overall perception of crime and wellbeing can improve over time.

44
Chapter 5
Limitations and Conclusion
5.1 Limitations
This study has some notable limitations. First, it is important to note that
statistical analyses utilizing aggregated data are subject to the modifiable areal unit
problem (MAUP), which means results may differ depending on the scale and shape of
the unit used to aggregate the data (Wong, 2009). In this case, 2016 Census block groups
were clipped to Toledo’s city limits, where crime point data was aggregated, along with
NDVI pixel data. The sociodemographic census data was already aggregated into block
groups also. Different variations of units, however, could skew the results in either
direction, which is cause for some concern. Overall, my results from the regression
models were consistent with several research papers whose units varied from census
tracts to block groups.
A second limitation is concern over the use of NDVI as a means to measure
vegetation. Although the measure of NDVI is accurate in assessing concentrations and
densities vegetation and has been widely applied to various studies as a strong predictor
of crime and other socioeconomic variables, it is a rather simple scalar measurement that

45
can potentially mask key variability in vegetation character that may moderate its
relationship with crime (Wolfe & Mennis, 2012). This variability includes NDVI’s
inability to identify the amount of specific types of vegetation and if they have an effect
on visibility as it pertains to criminal activity. The degree of maintenance and
management of a space, or cue to care, were terms mentioned throughout my research
that are speculative to assess when evaluating NDVI data. For instance, it is not possible
to determine whether a block group with a high NDVI value has several abandoned lots
that are unmaintained or if it contains a well-manicured lawn and is a frequented field for
recreational use. These land maintenance factors can adversely affect the rate of crime
occurrence, since lack of care can be a venue for criminal activity compared to a well-
kept lot (Kuo & Sullivan, 2001b). This would involve intricate data from various sources
to account for and accurately measure the degree of maintenance and vegetation type. It
would also be difficult to aggregate maintenance and measure vegetation type at the
block group level, which would prove more labor intensive given a citywide scale. It is
entirely possible, however, as Donovan and Prestemon (2012) analyzed the effect that the
number and size of trees had on crime at the parcel level in Portland, OR. Perhaps using
a smaller region or unit area could explain the situation more accurately, but my research
does an adequate job presenting a more holistic and broad view of the vegetation versus
crime relationship.
Although there was no clear evidence revealed through my research that
vegetation suppressed crime due to psychological factors, it would cause one to think that
crime would be displaced from one neighborhood to another with less vegetation since
lack of natural settings can cause precursors to violent behavior. Analyzing this would
46
require temporal crime and vegetation data from multiple years, which is entirely
possible. Wolfe and Mennis (2012) explained, however, that although crime patterns
may shift across different neighborhoods of a city over an order of several years,
concentration continues in mostly impoverished, disadvantaged neighborhoods. This
leaves me to wonder if I effectively analyzed factors concerning the relationship between
disadvantaged populations and crime. Poverty rate is the one variable I was hoping to
include, however, the pre-analysis phase led me to select per capita income to measure
economic stability based on the better fit and heuristics statistics garnered from the
results. Even though per capita income did not have significant association with crime, it
created better results when combined with the other control variables in the model.
Another shortcoming is that my research does not necessarily aid in the
application of CPTED features since it only views vegetation and crime from a citywide
lens and is not neighborhood-based. If I were to analyze the data from a closer
viewpoint, such as in the Legacy Neighborhood, I could potentially identify crime
hotspots and determine whether implementation of different types of vegetation and
landscaping could lower crime occurrences. Temporal studies of changes in crime
hotspots could be another part of future research to investigate whether the changes
created by Cherry Street Legacy Project actually influenced and lowered the number of
crimes in the neighborhood over time. Unfortunately, the project was inactive after the
year 2018 and I could not obtain concrete evidence and statistics involving real crime
reports from them. Despite these limitations, my quantitative research provides evidence
of a strong association between vegetation and crime rates in Toledo as a whole.

47
5.2 Conclusion
Despite these limitations, several important conclusions can be made from this
research. Toledo, OH is another example of a city whose vegetation was directly
associated with lower rates of violent, property, and total crime. The statistical evidence
in addition to the case study findings adds to the evidence that creating more attractive
vegetative environments in urban areas may contribute to a reduction in crime. As was
discussed through my case study, this depends on the type of vegetation, its placement,
and the degree of which it is maintained as big factors for how it will influence crime and
fear of crime. For example, an overgrown lot with dense shrubbery will not have the
same effect as a well-maintained garden or delicately landscaped property.
Sociodemographic factors also held weight in explaining the association with crime.
There was great significance between higher housing vacancies and increased crime
rates, along with lower population densities being associated with more crime. GIS
played a significant role in these findings and the Cherry Street Legacy Project’s efforts
supported these results through their efforts.
Using a mixed methods approach, in the form of regression analyses and a case
study, was an important aspect of this research. By attempting different statistical
methods from contemporary research studies, I discovered that the OLS regression alone
does not provide the best results since spatial autocorrelation was a common problem.
Utilizing spatially adjusted regressions (spatial error and spatial lag) to analyze my data
allowed me to determine that the lag model held the most predictive power. By including
the Cherry Street Legacy Project as a local example of an organization attempting to
lower crime through CPTED, it allowed my statistical findings to be verified and

48
compared to a real-world application. I found that a few variables, vacancy rate and
population density, were being addressed through Cherry Street Legacy’s efforts by
removing vacant houses and replacing them with usable green space to lower crime. It is
unclear what the exact impact of this has had, however, given the lack of quantitative
data from the organization, even though Rogalski stated property crimes were reduced
since the efforts began.
There is potential for these findings to provide insight into implications for
citizens and agencies throughout Toledo, OH and the region. The Cherry Street Legacy
Project exemplifies the strategy of community connectivity by establishing relationships
with agencies that have become assets for the organization, such as the City of Toledo,
Lucas County Land Bank, Glass City Goat Gals, and countless other nonprofit
organizations. These partnerships were beneficial in helping to plan and coordinate
events and activities, along with allowing Cherry Street Legacy to establish a stronger
sense of community through their work that goes beyond the Legacy Neighborhood.
Other cities that are struggling with urban crime in Northwest Ohio can look at this as a
model to follow if they want to tackle the same objectives and be more connected with
each other.
If it is proven that the actions taken by Cherry Street Legacy have indeed
decreased crime as previous research suggests, more people may want to move to these
areas over time if they have the perception of being safer. Additionally, this will have a
positive impact by increasing property values. If these residents have more pride for their
community, they may in turn want to maintain their own properties better given that the
surrounding areas have been transformed. This could even benefit nearby businesses as

49
the potential for greater population densities may increase the amount of people
frequenting stores, which may boost spending habits and thus positively affect the local
economy.
The projects shared by this local effort surround the concept of vegetation and its
importance in an urban setting to alleviate crime, which is the main point of this research.
It also demonstrates how cohesion with community partners, creating a greater sense of
connectivity, culture, and balance of activities and land uses can improve a community’s
wellbeing and create a positive outlook. Overall, this project explains the importance of
promoting more vegetation in cities as it has positive impacts that can help cities thrive
and become livable for future generations.

50
References
Baxter, J. (2016). Case studies in qualitative research. In I. Hay (ed.), Qualitative
Research Methods in Human Geography, Fourth Edition, 130-146. Canada:
Oxford University Press.
Coley, R. L., Kuo, F. E., & Sullivan, W. C. (1997). Where Does Community Grow?: The
Social Context Created by Nature in Urban Public Housing. Environment and
Behavior, (29)4:468-494.
Donovan, G. H., & Prestemon, J. P. (2012). The Effect of Trees on Crime in Portland,
Oregon. Environment and Behavior, 44(1): 3-30.
Flyvbjerg, B. (2011). Case Study. In N. K. Denzin and Y. S. Lincoln (eds.), The Sage
Handbook of Qualitative Research, 4th Edition, 301-316. Thousand Oaks, CA:
Sage.
Gilstad-Hayden, K., Wallace, L. R., Carroll-Scott, A., Meyer, S. R., Barbo, S., Murphy-
Dunning, C., & Ickovics, J. R. (2015). Research note: Greater tree canopy cover is
associated with lower rates of violent and property crime in New Haven, CT.
Landscape and Urban Planning, 143:248-253.
Jeffrey, R. C. (1971). Crime Prevention Through Environmental Design. American
Behavioral Scientist.
Kaplan, S. (1995). The Restorative Benefits of Nature: Towards An Integrative
Framework. Journal of Environmental Psychology, 15:169-182.
Kelly, M. (2000). Inequality and Crime. The Review of Economics and Statistics, 82(4),
530-539.
Kuo, F. E., & Sullivan, C. W. (2001). Environment and Crime in the Inner City: Does
Vegetation Reduce Crime? Environment and Behavior, 33(3), 343-367.

51
Kuo, F. E., & Sullivan, W. C. (2001). Aggression and Violence in the Inner City: Effects
of Environment via Mental Fatigue. Environment and Behavior, 33(4), 543-571.
Love, P. C. (2015). A Review and Current Status of Crime Prevention through
Environmental Design (CPTED). Journal of Planning Literature, 30(4):393-412.
Matthews, S. A. (2006, June 9). GeoDa and Spatial Regression Modeling. State College,
Pennsylvania, USA.
McElreath, R. (2016). Statistical Rethinking: A Bayesian Course with Examples in R and
Stan. Boca Raton: CRC Press.
Mercy Health Partners. (2009). The Cherry Street Legacy Plan.
Nagelkerke, N. (1991). A note on a general definition of the coefficient of determination.
Biometrica, 78(3), 691-692.
Nasar, J. L., & Fisher, B. (1993). ‘Hot spots’ of fear and crime: A multi-method
investigation. Journal of Environmental Psychology, 13(3):187-206.
Newman, O. (1972). Defensible Space: People and Design in the Violent City. London,
UK: Architectural Press.
Palmer, M., & Chelmu, N. (n.d.). The Cherry Street Legacy Project - Mercy St. Vincent
Medical Center. Retrieved from LocalWiki:
https://localwiki.org/toledo/The_Cherry_Street_Legacy_Project_%E2%80%93_
Mercy_St._Vincent_Medical_Center
Rogalski, K. (2016, October 17). Cherry Street Legacy Project. (T. Kosmyna,
Interviewer)
Sauter, M. B., Frohlich, T. C., & Comen, E. (2016, November 6). 25 Most Dangerous
Cities in America. Retrieved from 24/7 Wall St.: https://247wallst.com/special-
report/2017/11/06/25-most-dangerous-cities-in-america-2/7/

52
Saville, G., & Cleveland, G. (2006). CPTED and the social city: The future od capacity
building. In G. Saville, C. Genre, & M. Galeano, The CPTED Journal (pp. 1(2),
43-50). Millford, CT: Alternation.
Schrank, A. (2006). Case studies: Case-based research. In E. Perecman & S. R. Curran
(eds.), A handbook for social science field research: Essays & bibliographic
sources on research design and methods, 21-38. Thousand Oaks: Sage
Publications.
Shaffer, G. S., & Anderson, L. (1985). Perceptions of the security and actractiveness of
urban parking lots. Journal of Environmental Psychology, 5(4):311-323.
Snelgrove, A., Michael, J., Waliczek, T., & Zajicek, J. (2004). Urban Greening and
Criminal Behavior: A Geographic Information System Perspective.
HortTechnology, 14(1), 48-51.
Troy, A., Grove, J. M., & O'Neil-Dunne, J. (2012). The relationship between tree canopy
and crime rates across an urban-rural gradient in the greater Baltimore region.
Landscape and Urban Planning, 106:262-270.
U.S. Census Bureau. (2018). U.S. Census QuickFacts. Retrieved from U.S. Census
Bureau: https://www.census.gov/quickfacts/toledocityohio
U.S. Department of Justice. (2016). Offenses Known to Law Enforcement. Retrieved from
2016 Crime in the United States: https://ucr.fbi.gov/crime-in-the-u.s/2016/crime-
in-the-u.s.-2016/topic-pages/offenses-known-to-law-enforcement
Wilson, J. Q., & Kelling, G. L. (1982, March). Broken Windows. The Atlantic.
Wolfe, M. K., & Mennis, J. (2012). Does vegetation encourage or suppress urban crime?
Evidence from Philadelphia, PA. Landscape and Urban Planning, 108: 112-122.
Wong, D. (2009). Chapter 7: The Modifiable Areal Unit Problem (MAUP). In S.
Fotheringham, & P. A. Rogerson, The SAGE Handbook of Spatial Analysis (pp.
105-122). London: Sage Publications.


