Embed Size (px)
Citation preview

- 1 -
“A STUDY ON CAPITAL BUDGETING
AT
DR.REDDY’S LABORATORIES LIMITED”
A Project report submitted to Jawaharlal Nehru Technological University, Hyderabad, in
partial fulfillment of the requirements for the award of the degree of
MASTER OF BUSINESS ADMINISTRATION
By
G.HARATHI
Reg. No.: 10241E0016
Under the Guidance of
Mr. K SURYA NARAYANA
Associate Professor
Department of Management Studies
Gokaraju Rangaraju Institute of Engineering & Technology
(Affiliated to Jawaharlal Technological University, Hyderabad)

- 2 -
Hyderabad
2010-2012
CERTIFICATE
This is to certify that the project entitled “A STUDY ON CAPITAL BUDGETING” has
been submitted by Ms.G.HARATHI (Reg.No. 10241E0016) in partial fulfillment of the
requirement for the award of Master of Business Administration from Jawaharlal Nehru
Technological University, Hyderabad, the results embodied in the project has not been
submitted to any other University or Institution for the award of any Degree or Diploma.
(K.SURYA NARAYANA) (KVS Raju)
(Internal Guide) (Professor & HOD)
- 3 -
Associate Professor Department of Management Studies
Department of Management Studies GRIET
GRIET
(S. Ravindra Chary)
(Project Coordinator)
Associate Professor
Department of Management Studies
GRIET
DECLARATION
I hereby declare that the project entitled “A STUDY ON CAPITAL
BUDGETING AT DR.REDDY’S LABORATORIES LIMITED” submitted in partial

- 4 -
fulfillment of the requirements for award of the degree of MBA at Gokaraju
Rangaraju Institute of Engineering and Technology, affiliated to Jawaharlal
Nehru Technological University, Hyderabad, is an authentic work and has not
been submitted to any other University/Institute for award of any
degree/diploma.
G.HARATHI
(10241E0016)
MBA, GRIET
HYDERABAD

- 5 -
ACKNOWLEDGEMENT
Firstly I would like to express our immense gratitude towards our institution Gokaraju
Rangaraju Institute of Engineering & Technology, which created a great platform to attain
profound technical skills in the field of MBA, thereby fulfilling our most cherished goal.
I would thank my project guide, Mr. Ramesh , Finance Manager and Mr. Chandra Shekar ,
HR Manager of Dr. Reddy’s lab for given me this privilege of working under them and guiding
me with their expressive knowledge and providing me all the necessary information concerning
the project.
I am very much thankful to our Mr. K Surya Narayana (Internal Guide) for extending his
guidance and cooperation in doing this project.
I am also thankful to our project coordinator Mr. S. Ravindra Chary, for extending his
cooperation in completion of Project.
I wish you to express sincere gratitude to our Director Prof.P.S.Raju, Principal Dr.J.N.Murthy
and H.O.D Mr. K.V.S. Raju for providing the opportunity to pursue my management course in
this college.
I convey my thanks to my beloved parents and my faculty who helped me directly or
indirectly in bringing this project successfully.

- 6 -
G.HARATHI
(10241E0016)
- 7 -
INDEX
S. No: CONTENTS PAGE NO.
CHAPTER-1 1-9
Introduction
Objectives of the study
Need of the study
Scope of the study
Importance of the study
Limitations of the study
Methodology
CHAPTER-2 10-41
Review of Literature
CHAPTER-3 42-71
Industry profile &
Company profile
CHAPTER-4 72-94
Data Analysis and Interpretation
CHAPTER-5 95-99
Findings
Suggestions
Conclusion
Bibliography 100-102

- 8 -
CHAPTER – 1
INTRODUCTION
INTRODUCTION
- 9 -
Capital budgeting is an essential part of every company’s financial management.
Capital budgeting is a required managerial tool. One duty of financial manager is to
choose investment with satisfactory cash flows with high returns. Therefore a financial
manager must be able to decide whether an investment is worth undertaking and able to
decide and be able to choose intelligently between two or more alternatives.
Capital budgeting involves the planning and control of capital expenditure. It is
the process of deciding whether or not to commit resources to a particular long term
project whose benefits are to be realized over a period of time.
A capital budgeting decision is defined as the firms decision to invest its
current funds efficiently in the long-term assets in anticipation of an expected flow of
benefits over a series of years. The firm’s investment decisions would generally include
expansion, acquisition, modernization, and replacement of the long-term assets. They are
the assessment of future events, which are difficult to predict. It is really complex
problem to estimate the future cash flow of an investment.
The investment decision of a firm is generally know as Capital Budgeting or
Capital Expenditure Decision. Capital budgeting is also known as “Investment Decision
Making”, “Capital Expenditure Decisions”, “Planning Capital Expenditure” and
“Analysis of Capital Expenditure.
Capital budgeting is finance terminology for the process of deciding whether or not to
undertake an investment project.
- 10 -
A logical prerequisite to the analysis of investment opportunities is the creation
of investment opportunities. Unlike the field of investments, where the analyst more or
less takes the investment opportunity set as a given, the field of capital budgeting relies
on the work of people in the areas of industrial engineering, research and development,
and management information systems (among others) for the creation of investment
opportunities. As such, it is important to suggest that students keep in mind the
importance of creativity in this area, as well as the importance of analytical techniques.
Because a project is financially sound, it must be ethically sound, right? Well . . .
the question of ethical appropriateness is less frequently discussed in the context of
capital budgeting than that of financial appropriateness.
Budgeting requires the company to look ahead and formalize future goals. It is
the planning process used to determine whether an organization’s long term investments
such as new machinery, replacement machinery, new plants, new products, and research
development projects are worth pursuing. It is budget for major capital, or investment,
expenditures.
Capital budgeting techniques based on accounting earnings and accounting rules
are sometimes used - though economists consider this to be improper - such as the
accounting rate of return, and “return on investment.”
OBJECTIVES OF THE STUDY
- 11 -
• To know the important differences, that can arise in evaluating projects when
using Net Present Value (NPV), Internal Rate of Returns (IRR), Profitability
Index(PI).
• To analyze the strengths and weakness of existing Techniques in capital
budgeting.
• To evaluate capital projects using traditional methods of investment appraisal and
discounted cash flows methods.
• To make recommendations and to improve further process of capital budgeting
• To measure the profitability of the project by considering all cash flows.
NEED OF THE STUDY
- 12 -
• The project study is undertaken to analyze and understand the Capital Budgeting
process in Dr. Reddy’s Laboratories Ltd, which gives mean exposure to practical
implication of theory knowledge.
• To know about the company’s operations of using various capital budgeting
techniques.
• The financial department can implement and can get positive results by
maintaining proper financial reports.
• To analyze the proposal for expansion or creating additional capacities
• To make financial analysis of various proposals regarding capital investment so as
to choose the best out of many alternatives proposals.
SCOPE OF THE STUDY
- 13 -
“Preparation of capital budgeting is an important tool for efficient
and effective managerial decisions.”
So in every organization they have to examine the capital budgeting process,
therefore the financial manager must be able to decide whether an investment is worth
undertaking and able to decide and be able to choose intelligently between two or more
alternatives.
• The process by which company’s appraise investment decision, in particular by
which capital resources are allocated to specific projects.
• Capital budgeting requires firms to account for the time value of money and
project risk, using a variety of more or less formal techniques.
• Capital budgeting decisions affect the profitability in terms of interest of the firm.
They also have a bearing on the competitive position of the enterprise. It’s a
diversification burden
• Capital investment involves cost and the majority of the firms have scarce capital
resources.
• Capital budgeting is a complex process as it involves decisions relating to the
investment of huge resources for the benefit of achievement in future as it is
always uncertain.
• Understanding the importance of the capital budgeting in Dr. Reddy’s
Laboratories Ltd.
- 14 -
IMPORTANCE OF THE STUDY
Capital budgeting is of paramount important in financial decision making:
• Decisions affect the probability of the firm, as they also have a bearing on the
competitive positions of the enterprises.
• A capital expenditure decision has its effect over a long time and inevitable
affect’s the company future cost structure.
• The capital investments firm acquires the long-lived assets that generate the firm’s
future cash flows and determine its level of profitability.
• Proper capital budgeting analysis is critical to a firm’s successful performance
because capital investments decisions can improve cash flows.
• Capital investment involves cost of majority of the firms have scarce capital
resources.
• Capital decisions are not easily reversible, without much financial loss to the firm.
• To make financial analysis of various proposals regarding capital investment so as
to choose the best out of many alternatives proposals.
- 15 -
LIMITATION OF THE STUDY
• The study is conducted in short period. The time period of study has been limited
to less than 45days. The period is small to study the practical investment decision
of a company like Dr. Reddy’s Laboratories ltd.
• It does not consider all the new unapproved schemes.
• The study is conducted with the available data, gathered from annual reports of
Dr. Reddy’s Laboratories ltd.
• The formula has been used according to the availability of the data.
• All the techniques of capital budgeting presume that various investment proposals
under considerations are mutually exclusive which may not practically be true in
some particular circumstance.
• Uncertainty and risk pose the biggest limitation to the technique of capital
budgeting.
• Since the procedures and policies of the company does not allow disclosing of all
financial information and has to be completed with the available data collected
with the maximum effort.
- 16 -
METHODOLOGY OF THE STUDY
The data is collected from Dr. Reddy’s Laboratory with the help of Secondary sources.
This sources containing data that have been collected and compiled for another
purpose. The secondary sources consist of readily available compendia and already
compiled statistical statements and reports whose data may be used by researches for
their studies, e.g., census reports, annual reports and financial statements of companies,
Statistical statements, Reports of Government Departments, Annual Reports on currency
and finance and Financial Journals, newspapers, etc.
Secondary sources consist of not only published records and reports, but also
unpublished records. The latter category includes various records and registers
maintained by firms and organisations, e.g., accounting and financial records, personnel
records, register of members, minutes of meetings, inventory records, etc.
DATA ANALYSIS TECHNIQUES:
• Payback period
• Accounting Rate of Return
• Profitability Index
• Net Present Value
• Internal Rate of Return.

- 17 -
CHAPTER – 2
REVIEW OF LITERATURE
CAPITAL BUDGETING
- 18 -
Capital expenditure management or capital budgeting is concerned with planning and
control of capital expenditure. Capital budgeting is defined as the acquisition of durable
productive facilities in the expectations of future gains. To win the competitive edge,
every organization is much construction on the financial aspect of development. It
involves the current outlay of cash in return for an anticipated flow of future benefits and
these benefits are available in the long run. Therefore, capital budgeting refers to a long-
range investment programmes and is translated into annual budget outlay and may relate
to National Five Year Plans.
Capital budgeting is a crucial financial decision of a firm. It relates to the
selection of an asset or investment proposal for the lifetime of the project. Capital
budgeting is the allocation of available resources of the organization to the various
investment proposals, as the demand on resources is almost always higher than the
availability of resources.
Capital budgeting decisions are related to allocation of investible funds to
different long-term assets. They have long-term implications and affect the future growth
and profitability of the firm. For example: the decision to acquire special equipment may
require a large immediate outlay of funds. It also commits the company to the
maintenance and operations of the equipment for a long period of time.
- 19 -
Organization is frequently faced with capital budgeting decision. Any decisions that
require the use of resources or course of action whose benefits are likely to be available
in future over the lifetime of the project. Capital budgeting is more or less a continuous
process in any growing concern. Some of the decisions may directly affect the profit of
the firms whereas some other decisions may directly affect the profit by influencing the
operating costs. However, in all cases, the decisions have a long-term impact on the
performance of the organization.
Given the importance of capital budgeting, the decision regarding investment,
management faces the challenging task of allocating the limited available resources in a
matter that would maximize the profits or the objectives of the organization.
Financial management, in the modern sense of the term can be broken down in to
four decisions as function of finance, they are:-
• The investment or long-term asset- mix decision.
• Financing or capital – mix decision.
• Dividend or profit allocation.
• Liquidity or short-term asset – mix decision.
- 20 -
DEFINITION:
Charles T Horngreen has defined as “Capital budgeting is the long term planning
for making and financing proposed capital outlays.”
In other words of Lynch, “Capital budgeting is concerned with planning and development
of available capital for the purpose of maximization the long-term profitability of the
concern.”
MEANING:
Capital budgeting is the process of making investment decision and capital expenditure. It
also involves a non-flexible, long-term commitment of funds thus capital expenditure
decisions are also called as long-term Investment decisions.
FEATURES:
• It involves exchange of current funds for the benefits to be achieved in
future.
• Future benefits are expected to be realized over a series of years.
• They generally involve huge funds.
• They are irreversible decisions.
• They have long term and significant effect of probability of the concern.
• There is relatively high degree of risk.
- 21 -
GUIDELINES FOR BUDGET DEVELOPMENT
Establish cost guidelines and benchmarks to assist analysts in budget development.
• Clarify our understanding of funding constraints and conditions to make it easier
to correctly align project types with funding sources.
• By taking a more comprehensive approach to the budget development and
implementation cycle, eliminate low-value tasks and help all participants focus
on the most important issues.
• Improve tools for the budget processes to reduce the burden of administrative
tasks and increase time available for analysis and decision-making.
• Ensure better connections between the operating and capital budgets
• Improve the allotment and monitoring processes to reduce time spent on non-
value added tasks.
• Improve the guidance available for everyone involved in the capital budget
process.
• Make better use of information about facility needs and conditions for budget
development and monitoring.
• Streamline the budget bill process.
- 22 -
IMPORTANCE:
There are the several factors that make capital budgeting decisions among the critical
decisions to be taken by the management. The importance of capital budgeting can be
understood from the following aspects of capital budgeting decisions.
• By taking capital budgeting decision, a finance manager makes a commitment
into future. He is also committing to the future needs for funds of that project.
• The capital budgeting decisions generally involve large commitment of funds.
As a result, substantial portion of capital funds is blocked. Thus, relatively,
more attention is required for capital budgeting decisions.
• Most of the capital budgeting decisions are irreversible decisions. Once taken,
the firm may not be in a position to revert back unless it is ready to absorb
heavy losses which may result due to abandoning a project midway.
• Capital budgeting decisions affect the capacity and strength of a firm to face
competition. A firm may loose competitiveness if the decision to modernize
is delayed.
• A timely decision to take over a minor competitor may ultimately result even
in the monopolistic position of the firm. These decisions affect the future
position of the firm to a considerable extent.
- 23 -
DIFFICULTIES:
Capital budgeting decisions are not easy to take. There are number of factors responsible
for this. The problems in capital budgeting decisions may be as follows:
• Capital budgeting decisions involve long-term commitments. However,
there is a lot of uncertainty in the long-term. Therefore, an element of risk
is involved. The uncertainty may be with reference to cost of the project,
future expected returns, future competition, legal provisions, political
situation etc.
• The cost of benefits of a decision may occur at different time period. They
are not logically comparable because of the time value of money.
• The financial manager may face difficulties in measuring the cost and
benefits of projects in quantitative terms. It is very difficult in the extent
of impact as the sales of other products may also influence by these
factors other than the new products.
ASSUMPTIONS:
Capital budgeting decisions process is a multi-faceted and analytical process. A number
of assumptions are required to be made and evaluated in the financial aspects.
• The capital budgeting decisions are taken with a primary motive of
increasing the profit of the firm. No other motive influences the decision of
the financial manager.
• It is very difficult to estimate the cost and benefits (proposal beyond 2-3
years in future) which are reasonably accurate and certain.
• It assumes that a proposal will be accepted or rejected on the strength of its
merits alone. The proposal will not be considered in combination with other
proposals to consider the maximum utilization of available funds.
- 24 -
INVESTMENT DECISION:
The major second decision of the firm is Financing Decision. It is mainly
concerned with mobilization of funds. Here, the financial manager is concerned with
determining the best financing mix or capital structure for his firm. The management will
decide how much funds should be raised from outside public and financial institutions.
Investment decisions are expected to bring in additional revenue there by raising the
size
of firm’s total revenue. These decisions involved in acquisition of fixed assets.
SOURCES OF FINANCE:
• Equity Share Capital
• Preference Share Capital
• Debenture Capital
• Long term Loans from Financial Institutions.
• Public Deposits.
• Reserves and Surplus.
DIVIDEND DECISION:
Dividend refers to that portion of a firm’s net earnings, which are paid out to
the shareholders. Dividend decision had got two alternatives, one is declaring
immediately and issuing in the form of cash/bonus shares to the shareholders, or retailing
them with the firm for further investment proposals. Dividend decision will have impact
on the value of the firm and its objective is to maximize the shareholders wealth.
- 25 -
CAPITAL BUDGETING PROCESS
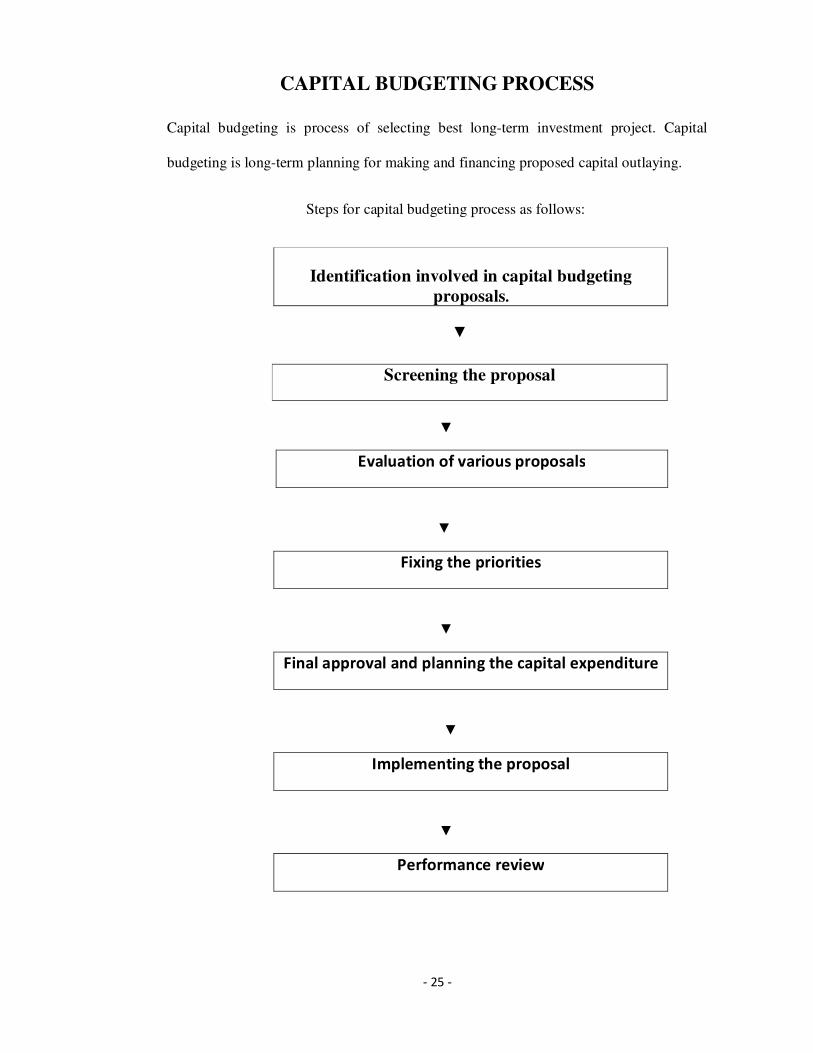
Capital budgeting is process of selecting best long-term investment project. Capital
budgeting is long-term planning for making and financing proposed capital outlaying. Steps for capital budgeting process as follows:
Identification involved in capital budgeting
proposals.
▼
▼
Evaluation of various proposals
▼
▼
Final approval and planning the capital expenditure
▼
Implementing the proposal
▼
Performance review
Screening the proposal
Fixing the priorities
- 26 -
Types of Capital Budgeting Decisions
Capital budgeting refers to the total process of generating, evaluating, selecting
and following up on capital expenditure alternatives. The firm allocates or budgets
financial resources to new Investment proposals. Basically, the firm may be confronted
with three types of capital budgeting decisions:
• Accept-Reject Decision.
• Mutually Exclusive Project Decision.
• Capital Rationing Decision.
� Accept-Reject Decision:
This is a fundamental decision in capital budgeting. If the project is accepted, the firm
would invest in it; if the proposal is rejected, the firm does not invest in it. By applying
this criterion, all independent projects are accepted. Independent projects are the projects
that do not compete with one another in such a way that the acceptance of one precludes
the possibility of acceptance of another.
� Mutually Exclusive Project Decision:
Mutually Exclusive Projects are those which compete with other projects
in such a way that the acceptance of one will exclude the acceptance of the other projects.
The alternatives are mutually exclusive and only one may be chosen. Thus, mutually
exclusive projects acquire significance when more than one proposal is acceptable under
the accept-reject decision.
- 27 -
� Capital Rationing Decision:
Capital rationing refers to a situation in which a firm has more acceptable
investments than it can finance. It is concerned with the selection of a group of
Investment proposals out of many investment proposals acceptable under the accept-
reject decision. The projects can be ranked on the basis of a pre-determined criterion such
as the rate of return. The projects are ranked in descending order of the rate of return.
SELECTION OF PROJECTS
Experience shows that many projects are recommended for inclusion in the
capital budget that despite of the apparent desirability, may not be necessary for the firm
or many not produce additional earnings commensurate with the capital involved. They
keep capital outlays within regional limits; capital budgets control producers should be
designed to ensure that more desirable project get the priority over others. The proposal
submitted by the operating divisions or departments for inclusions or the capital budget
can be classified under the following categories:
• Urgently essential to satisfactory operations.
• Replacement resulting from wear and tear or obsolescence.
• Desirable on an earnings basis and
• Desirable from the stand-point of logical expansion and development.
- 28 -
PRINCIPALS OF CAPITAL INVESTMENT:
Capital budgeting involves the generation of investment proposals; the estimate
of cash flows for the proposals, the evaluation of cash flows; the selection of projects
based upon an acceptance criterion; and finally, the continual revaluation of investment
projects after their acceptance.
Depending upon the firm involved investment proposals can emanate from a variety
of sources. For purposes of analysis, projects may be classified in to one of five
categories.
• New products or expansion of existing products
• Replacement of equipment or buildings
• Research and development
• Exploration
• Others.
Most firms screen proposals at multiple levels of authority. For a
proposal originating in the production area, the hierarchy of authority might
run from section chiefs to
• Plant managers to
• The vice-president for operations to
• A capital-expenditures committee under the financial manager to
• The president to
• The board of directors
- 29 -
The best procedure will depend upon circumstance where projects are approved at
multiple levels, it is very important that the same acceptance criterion be applied
objectively and consistently throughout the organization. Otherwise, capital is likely to be
misallocated in the sense that one division might accept a project that another would
reject.
COMPONENTS OF INVESTMENT ANALYSIS
The capital budgeting process requires an estimate of future events to be
expressed in a schedule of cash flows. At any given time, a company may be having a
number of alternative ways, termed as project to invest in funds and the purpose of a
capital budgeting procedure to obtain an indication of a value each might contribute to
the company. Before applying any method to evaluate the relative desirable of a project,
it is necessary to analyze the components effecting the projection of cash flows, both in
and out, related to the projects, together with the time dimension of each flow. The basic
components of investment analysis are:
• Amount of net capital investment.
• Operating cash flows.
• Choice of horizon.
- 30 -
OPERATING CASH FLOWS:
Operating cash flows are not identified with profits or income. It is essential to
recognize difficulties that arise in applying a cash flow analysis to investment proposals.
A charge in income can occur without any corresponding change in cash flow. The cash
flow procedure avoids difficult problems underlying the measurement of corporate
income, which usually accompany the accrued method of accounting.
ABSOLUTE AND RELATIVE CASH FLOWS:
A distinction should be made between absolute and relative cash flows. When
cash flows are compared with zero cash flows, they are known as absolute cash flows.
The cash flows of one project can be compared directly with that of in other project or
difference in cash flows of two projects can be determined. If this difference itself is
positive in a particular period, it can from another. Such cash flows are known as relative
cash flows.
CASH FLOWS AND UNCERTAINTY:
Each computation of cash flows is based on certain assumptions on the level of business
activity, nature of production, future availability of improved equipment, cost of factors
of production, future demand and the like.
The growing use of computers applications now enables the financial analyst to
take analysis of various levels of possible cash flows, return on investment and other
results of proposed outlay and obtain an estimate of the odds of each potential outcome.
Under the probability approach, estimates of variety of factors such as market size,
selling prices, market growth rate, share of the market, investment cost, can be varied.
- 31 -
IDENTIFYING RELEVANT CASH FLOWS:
• CASH FLOW VS ACCOUNTING PROFIT:
Capital budgeting is concerned with investment decisions, which yield a
return over a period of time in future. The foremost requirements to evaluate any capital
investment proposal are to estimate the future benefits accruing from the investment
proposals. Theoretically, two alternatives criteria are available to qualify the benefits:
� Accounting profit.
� Cash flows.
The difference in these measures of future profitability is primarily due to the
presence of certain non-cash expenditure in the profit and loss a/c. cash flows are
theoretically better measures of the net economic benefits or costs associated with a
proposed project.
• INCREMENT CASH FLOW:
The second aspect of the data required for budgeting relates to the basis on which the
relevant cash out flows associated with proposed capital expenditure are to be estimated.
The widely prevalent practice is to adopt increment analysis. Only difference is due to the
decision at hand.
- 32 -
TECHNIQUES OF CAPITAL BUDGETING
Capital budgeting decision process involves estimation of cost and benefits of a
proposal, estimation of required rate of return, and evaluation of different proposals in
order to select one. These cost and benefits are expressed in terms of cash flows arising
out of a proposal. Once the proposal completed we can discussed the various techniques
to arrive at the optimal investment decision.
The method of evaluation of capital expenditure proposal can be classified in to
two broad categories:
� Traditional or Non-Discounting Techniques.
� Discounted Cash Flows or Time Adjusted Techniques.
TRADITIONAL AND NON-DISCOUNTING TECHNIQUES:
� Pay Back Period Method.
• Post Pay Back Profitability Method.
• Pay back reciprocal Method.
� Rate of Return Method or Accounting Method (ARR).
DISCOUNTING CASH FLOWS OR TIME ADJUSTE TECHNIQUES:
� Net Present Value Method (NPV).
� Internal Rate of Return Method (IRR).
� Profitability Index or benefit cost ration Method (PI).
- 33 -
TRADITIONAL AND NON-DISCOUNTING TECHNIQUES:
The traditional techniques do not discount the cash flows to find out their present worth.
There are two such techniques available to find out. They are:
� PAY BACK PERIOD METHOD:
The pay back sometimes called as payout or pay off period method represents the length
of period of cash proceeds produce by the investment to be equal to the original cash
outlay, i.e. the time required for the project to pay for itself back within a certain period.
This method is a traditional method of evaluation of capital budgeting decisions.
PAY BACK PERIOD = INITIAL INVESTMENT
ANNUAL CASH INFLOWS
It is the ratio of the initial fixed investment over the annual cash inflows for the recovery
period.
ACCEPT – REJECT CRITERION:
The pay back method can be used as a decision criterion to accept or reject
investment proposal by the different alternatives. If single investment is being
considered, as line annual pay back period is less than the pre-determined pay back
period the project will be accepted, it not it would be rejected.
- 34 -
Projects are under consideration that they may be ranked regarding to the length of the
pay back period. However, the different proposals are to be ranked in order to priority,
and then the proposal with in shortest payback period will be first in the priority list.
MERITS:
• It is easy to calculate and simple to understand.
• It can be used even by a small firm having limited manpower that is not
trained in any other sophisticated techniques.
• Due to its short-term approach, this method is particularly suited to a firm
which has shortage of cash or whose liquidity position is not good.
• It is the best method in case of evaluation of single project.
DEMERITS:
• It completely ignores all cash flows after the pay back period.
• It completely ignores time value of money.
• It ignores the concept of rate of return.
• The payback period also ignores salvage value and total economic life of the
project.
• The payback period is not consistent with the maximization of the
shareholders wealth.
• It treats each asset individually in isolation with other assets, which is not
feasible in real practice.
In case the cash flows are unequal, the pay back period can be found by adding up the
cash flow until the total is equal to the initial cash outlay of the project.
- 35 -
• POST PAY BACK PROFITABILITY METHOD:
One of the drawbacks of payback period is that it does not taken into account the cash
inflows earned after one payback period and hence the true profitability of the project
cannot be assessed. Hence, an improvement over this method can be made by taking into
account the returns which are receivable beyond the payback period.
• PAYBACK RECIPROCAL METHOD:
Sometimes, Payback Reciprocal Method is employed estimate the internal rate of return
generated by a project. Payback Reciprocals can be calculated as:
(This can also be calculated in percentage by multiplying the above by 100.)
This method can be used under the following two conditions:
� Equal cash inflows are generated every year.
� The project under consideration has a long life which must be at
least twice the payback period.
POST PAY BACK PROFITABILITY INDEX = POST PAYBACK PROFITS ×
100
INVESTMENT
PAYBACK RECIPROCAL = ANNUAL CASH INFLOW
TOTAL INVESTMENT
- 36 -
� RATE OF RETURN METHOD:
This method takes into account the earnings expected from the investment
over their whole life. It is known as average rate of return method because under this
method the concept of accounting profit (Net Profits after tax and depreciation) is used
rather than cash inflows. The project with high rate of is selected as compared to the one
with lower rate of return.
The return on investment method can be used in several ways as follows:
AVERAGE RATE OF RETURN OR ACCOUNTING RATE OF RETURN(ARR):
Under this method average profit after tax and deprecation is calculated and then it is
divided by the total capital outlay or total investment in the project. In other words it
establishes the relationship between average annual profits to total investment.
ARR = AVERAGE ANNUAL PROFIT AFTER TAX × 100
AVERAGE INVESTMENT IN THE PROJECT
- 37 -
• RATE PER UNIT OF INVESTMENT METHOD:
This method is small variation of the average rate of return method. In this
method the profit after tax and deprecation is divided by the total investment.
RETURN PER UNIT OF INVESTMENT = TOTAL PROFIT (PADT)
× 100
NET INVESTMENT IN THE PROJECT
• RETURN ON AVERAGE INVESTMENT METHOD:
In this method the return on average investment is calculated. Using of average
investment for the purpose of return on investment is preferred because the original
investment is recovered over the life of the asset on account of deprecation charges.
• AVERAGE RETURN ON AVERAGE INVESTMEN METHOD:
This is the most appropriate method of rate of return on investment. Under this method,
average profit after deprecation and taxes is divided by the average amount of
investment.
AVERAGE RATE ON = AVERGAE ANNUAL AFTER DEPRECATION AND TAXES × 100
AVERAGE INVESTMENT
- 38 -
ACCEPT OR REJECT CRITERIA:
The actual rate of return is compared with pre-determined or minimum required rate of
return or cut off rate. If the actual average rate of return is higher than the minimum
desired average rate of return, then the proposal is to be accepted otherwise rejected. If
more then one alternative proposal is under consideration, the average rate of return may
be arranged in descending order of magnitude starting with the proposal with the highest
average of return.
MERITS:
� It is very simple to understand and easy to calculate.
� It uses the entire earnings of a project in calculating rate of return and
hence gives a true view of profitability.
DEMERITS:
� It ignores the time value of money.
� It does not take in to account the cash flows, which are more important
than the accounting profits.
� It does not take into consideration any benefits which can accrue firm
from the sale or abandonment of equipment which is replaced by new
investment.
The above-mentioned methods has to be used along with the discounted cash flow
method
(i.e., NPV, IRR) in order to take a right decision.
- 39 -
DISCOUNTING CASH FLOWS OR TIME ADJUSTE TECHNIQUES:
The distinguishing characteristic of the discounted cash flow capital budgeting
techniques is that they have taken into consideration the time value of money while
evaluating the cost and benefits of the project.
� NET PRESENT VALUE (NPV) METHOD:
The NPV method is a modern method of evaluating investment proposals. This method
takes into consideration the time value of money and attempts to calculate the return on
investment by introducing time element.
It may be defined as the summation of the present value of the cash proceeds in
each year minus the summation of the present values of net cash outflows in each year.
The NPV of all inflows and outflows of cash during the entire life of the project is
determined separately for each year by discounting these flows by the firm’s cost of
capital.
NPV = CF1 + CF2 - - - - - - - - - - - - - - - - - - - - - - - - - - - + CFN = e = CFt
(1 + K) 1 + (1 + K) 2 - - - - - - - - - - - - - - - - - - - - - - - - - ( 1 + K) n = t = 1 (1 + K) T
Where CF = Cash Flow for corresponding year.
K = Cost of capital
N = number of years.
- 40 -
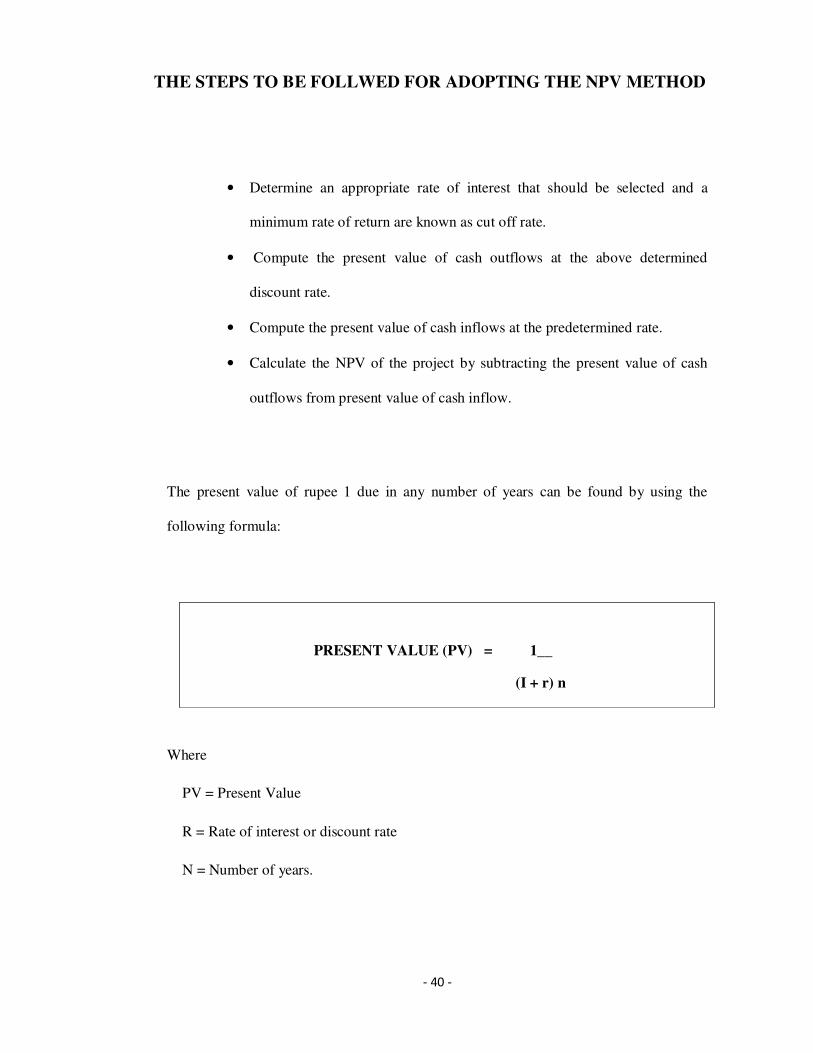
THE STEPS TO BE FOLLWED FOR ADOPTING THE NPV METHOD
• Determine an appropriate rate of interest that should be selected and a
minimum rate of return are known as cut off rate.
• Compute the present value of cash outflows at the above determined
discount rate.
• Compute the present value of cash inflows at the predetermined rate.
• Calculate the NPV of the project by subtracting the present value of cash
outflows from present value of cash inflow.
The present value of rupee 1 due in any number of years can be found by using the
following formula:
PRESENT VALUE (PV) = 1__
(I + r) n
Where
PV = Present Value
R = Rate of interest or discount rate
N = Number of years.
- 41 -
ACCEPT OR REJECT CRITERION:
If NPV is positive the project should be accepted and if NPV is negative the project
should be rejected i.e.
If NPV > Zero (ACCEPT).
If NPV < Zero (REJECT).
In case of a number of projects or more than one project select the project with greatest
NPV if there is more than one project giving positive NPV.
MERITS:
• It recognizes the time value of money.
• It is based on the cash flows rather than accounting profits.
• NPV calculations allow for a change in the discount rate. The NPV can be
computed by using time varying discount rates.
• It considers the total benefits arising out of the proposal over its lifetime.
• This method is very useful for selection of mutually exclusive projects.
DEMERITS:
• It is more difficult to understand and operate.
• It is an absolute measure.
• It is not easy to determine an appropriate discount rate.
• This method may not give satisfactory results in case of projects resulting in
case of projects having different effective lives.
- 42 -
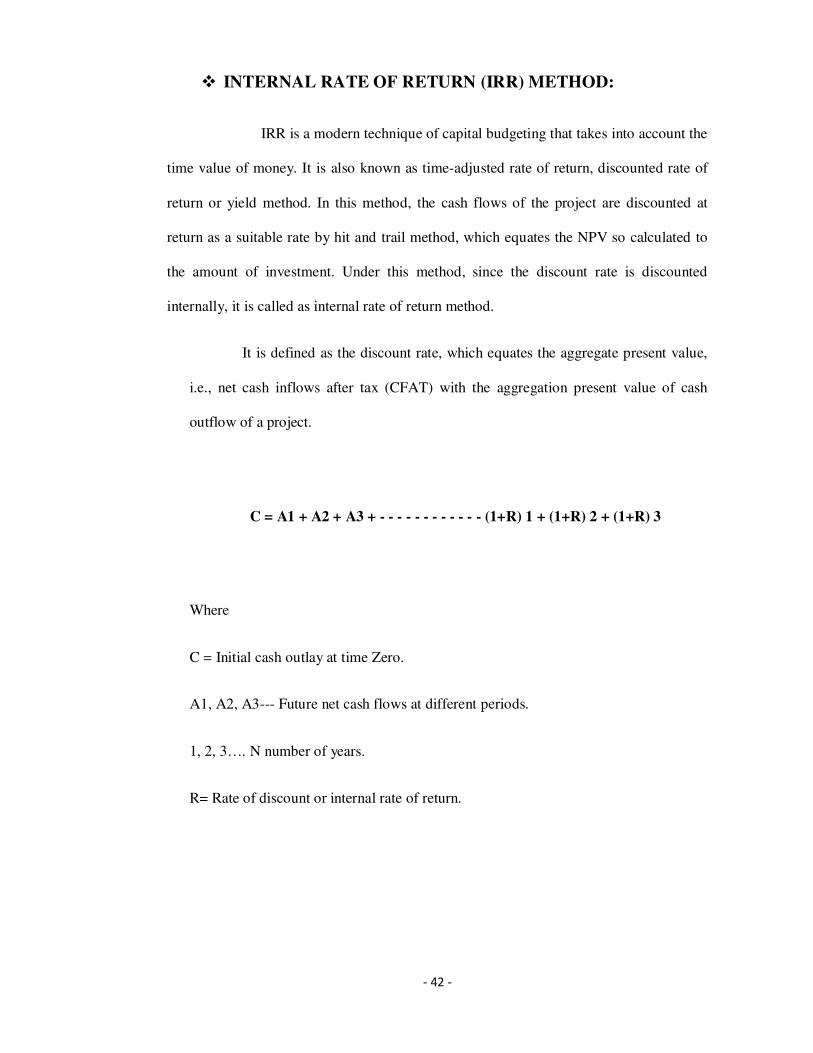
� INTERNAL RATE OF RETURN (IRR) METHOD:
IRR is a modern technique of capital budgeting that takes into account the
time value of money. It is also known as time-adjusted rate of return, discounted rate of
return or yield method. In this method, the cash flows of the project are discounted at
return as a suitable rate by hit and trail method, which equates the NPV so calculated to
the amount of investment. Under this method, since the discount rate is discounted
internally, it is called as internal rate of return method.
It is defined as the discount rate, which equates the aggregate present value,
i.e., net cash inflows after tax (CFAT) with the aggregation present value of cash
outflow of a project.
C = A1 + A2 + A3 + - - - - - - - - - - - - (1+R) 1 + (1+R) 2 + (1+R) 3
Where
C = Initial cash outlay at time Zero.
A1, A2, A3--- Future net cash flows at different periods.
1, 2, 3…. N number of years.
R= Rate of discount or internal rate of return.
- 43 -
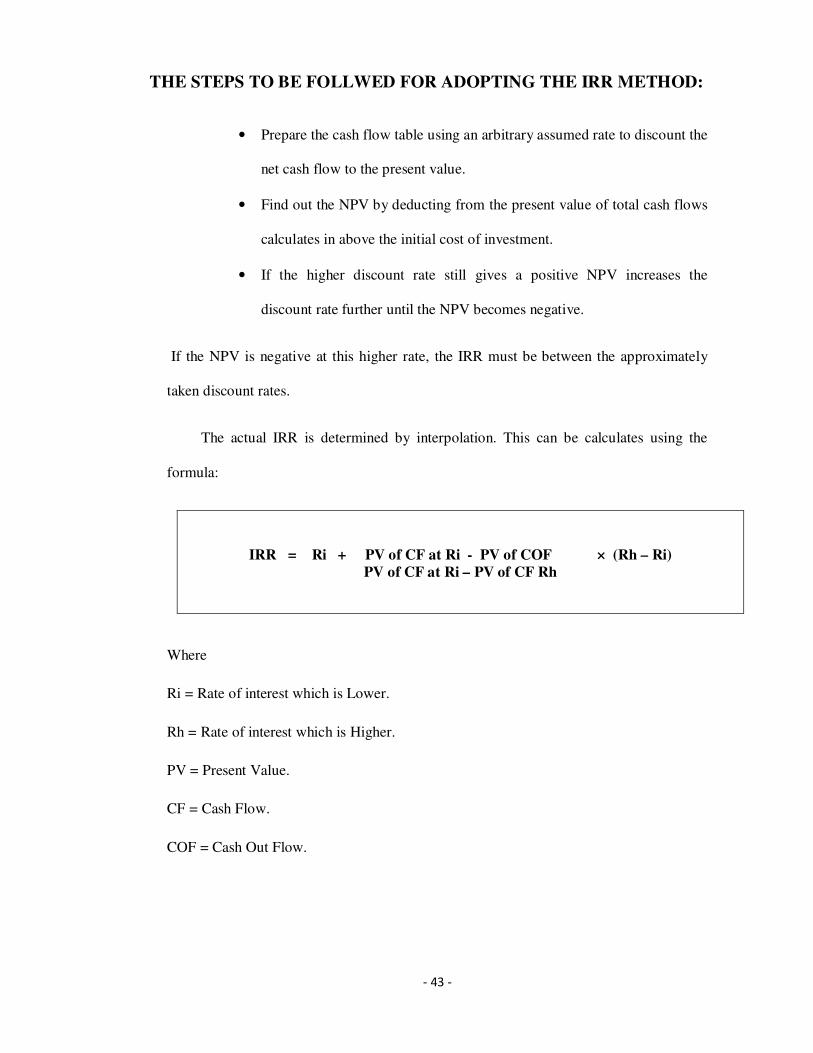
THE STEPS TO BE FOLLWED FOR ADOPTING THE IRR METHOD:
• Prepare the cash flow table using an arbitrary assumed rate to discount the
net cash flow to the present value.
• Find out the NPV by deducting from the present value of total cash flows
calculates in above the initial cost of investment.
• If the higher discount rate still gives a positive NPV increases the
discount rate further until the NPV becomes negative.
If the NPV is negative at this higher rate, the IRR must be between the approximately
taken discount rates.
The actual IRR is determined by interpolation. This can be calculates using the
formula:
IRR = Ri + PV of CF at Ri - PV of COF × (Rh – Ri)
PV of CF at Ri – PV of CF Rh
Where
Ri = Rate of interest which is Lower.
Rh = Rate of interest which is Higher.
PV = Present Value.
CF = Cash Flow.
COF = Cash Out Flow.
- 44 -
ACCEPT OR REJECT CRITERION:
Accept the proposal if the IRR is higher than or equal to minimum required rate i.e., the
discount or cut off otherwise reject.
If IRR > K (ACCEPT). If IRR < K (REJECT). Where K = Cost of Capital.
In case of alternative proposals, one which higher IRR has to be accepted as long as
the IRR is greater than the discount rate.
MERITS:
• It recognizes the time value of money.
• It is based on the cash flows rather than accounting profits over the life of the
project to calculate its rate of return.
• This method is also compatible with the objective of maximum profitability and
also consideration with the shareholder’s wealth.
DEMERITS:
• It is difficult to understand and operate; it gives misleading and inconsistent
results when the NPV of a project does not decline with discount rates.
• It also fails to indicate a correct choice between mutually exclusive under certain
situations.
• It is based on the assumption that the earnings are reinvested at the IRR for the
remaining life of the project. This is not a justified assumption.
- 45 -
� PROFITABILITY INDEX METHOD (OR) BENEFIT-COST RATIO:
It is also a time – adjusted method of evaluating the investment proposals. Profitability
Index is also called a Benefit- Cost Ratio or Desirability Factor is the relationship
between the present values of cash inflow at the required rate of return to the initial cash
outlay of the investment.The formula to calculate Benefit – Cost Ratio or Profitability
Index as follow:
PROFITABILITY INDEX (PI) = PV OF CASH INFLOWS
INTITAL CASH OUTLAY
ACCEPT OR REJECT CRITERION:
If PI > 1 (ACCEPT). If PI < 1 (REJECT).
In case of the alternative proposal, the project with higher PI has to be accepted.
MERITS:
• It recognizes time value of money.
• It is relative measure of the projects profitability. (Find out the ratio).
• Takes into consideration the objective of maximum profitability.
DEMERITS:
• It is difficult to understand.
• It is not easy to determine and appropriate discount rate.
• It involves more computation than traditional method.
• It may not give good result while comparing projects with unequal investment
funds.
- 46 -
RISK AND UNCERTAINITY IN CAPITAL BUDGETING:
Capital budgeting entails decisions to commit present funds in long term investment in
anticipation of future returns. The amount of investment and the returns from them
cannot be predicted with certainty due to certain variables like market for the product,
technology, government policies, etc.
The uncertainty associated with the investment and the returns is what makes
decision makers to consider probability distributions in their estimates, hence, making
capital budgeting to be considered under uncertainty and risk.
All the techniques of capital budgeting requires the estimation of future cash inflow
and cash outflow. The cash flow is estimated, based on the following factors:
� Capacity of the project.
� Depreciation cost.
� Rate of taxation.
� Future demand of the product.
� Expect economic life of the product. Etc.
But due to uncertainties about the futures, the estimates of demand, production, sales,
selling price, etc., cannot be exact. To evaluate and select among projects that will
maximize owner’s wealth, we need to assess the uncertainty associated with project’s
cash flows. In evaluating a capital project, we are concerned with measure of risk.
- 47 -
The uncertainty arises from different sources, depending on the type of investment
being considered, as well as the circumstances and the industry in which it operating.
Uncertainty may due to:
� Economic conditions.
� Market conditions.
� Taxes.
� Interest rates.
� International conditions.
STEPS INVOLVED:
Identifying the need of the project preparation of project report with respect to as
follows:
� Utilization.
� Efficiency.
� Capacity of the particular project.
� Loss of market.
� Loss of good will.
� Technological requirements.
� Justification based on money earnings.
- 48 -
FACTORS INFLUENCING CAPITAL EXPENDITURE DECISION:
There are many factors like financial as well as non-financial which influence the
capital expenditure decisions and profitability of the proposal.
They are:
� URGENCY:
Sometimes an investment is to be made due to urgency for survival of the firm or to
avoid heavy loses. In such circumstances, proper evaluation cannot be made through
profitability tests. Examples of such urgency are break down of some plant and
machinery, fire accidents etc.
� DEGREE OF UNCERTAINTY:
Profitability is directly with some lower profitability may be selected due to constraint
flow of income as compared to another project with an irregular and uncertain inflow of
income.
• Sometimes a project with some lower profitability may be selected due
to constant flow of income as compared to another project with an
irregular and uncertain inflow of income.
• INTANGIBLE FACTORS: Sometimes a capital expenditure has to be
made due to certain emotional and intangible factors such as safety and
welfare of the workers, prestigious project, social-welfare, goodwill of
the firm etc.,
• AVAILABILITY OF FUNDS: As the capital expenditure generally
requires large funds, the availability of funds is an important factor that
influences the capital budgeting decisions.

- 49 -
CHAPTER - 3
INDUSTRY PROFILE
- 50 -
PHARMACEUTICAL INDUSTRY PROFILE
The Pharmaceutical Industry develops, produces and markets drugs licensed for
use as medications. Pharmaceutical companies can deal in generic and/or brand
medications. They are subject to a variety of laws and regulations regarding the patenting,
testing and marketing of drugs. The main aim of a particular Pharmaceutical Industry is
to develop research and distr ibute drugs in order to provide health care for
the people in the society. The Pharmaceutical Industry like other industries
is subjected to follow certain rules and regulations.
“The Indian Pharmaceutical Industry is a
success story providing employment for
millions and ensuring that essential drugs
at affordable prices are available to the
vast population of the sub-continent”
Richand Gerster
- 51 -
The Pharmaceutical Industry needs to follow ru les about patent,
marketing as well as testing of drugs that are scheduled to come to the market
as medicines. Since the inauguration of the Pharmaceutical Industry in the 19th century, it
has covered a long way and now it has become one of the most influential and successful
industry in the world with both controversy and praise on its part.
Pharmaceutical Industry is very much dependent upon the developments and
discoveries that are made to search new types of drugs and also to search for new kind of
medicines. One can also differences within the industry regarding the same drug or report
and different companies within the Pharmaceutical Industry look to follow
d ifferent paths for the same thing. Drug Discovery and Drug Innovation are two very
aspects in the Pharmaceutical Industry:
DRUG DISCOVERY:
Drug Discovery is a process through which potential drugs are designed or
discovered. It has been observed in the past that most of the drugs were invented by
means of isolating the active component from remedies which are traditional in nature or
through another kind of discovery known as serendipitous discovery.
- 52 -
DRUG DEVELOPMENT:
This process is taken forward after the discovery is done and a thing is identified as
a potential drug. The development takes place immediately after that as the
component is turned into a medicine. So this is also considered as a very
important process and has great importance in the Pharmaceutical Industry. For the
first time ever, in 2006, global spending on prescription drug stopped $643 billion,
even as growth slowed somewhat in Europe and North America. The United
States accounts for almost half of the global pharmaceutical market, with
$289 billion in annual, sales followed by the EU and Japan. Emerging
markets such as China.
Russia, South Korea and Mexico outpaced that market, growing a huge81 percent.US
profit growth was maintained even whilst other top industries saw slowed or
no growth. Desp ite this, the pharmaceutical industry is —and has been for
years — the most profitable of all businesses in the U.S. In the annual
Fortune 500 survey, the pharmaceutical industry topped the list of the most
profitable industries, with a return of 17%on revenue.
Indian Pharmaceutical Industry today is the front runner of India’s science-based industry
with wide ranging capabilities in the complex field of drug manufacture and
technology. A highly organized sector, the Indian Pharmaceutical Industry is
estimated to be worth $4.5billion, growing at about 8to9persent annually. It
ranks very high in the world, in terms of technology, quality and range o f
med icines manufacture. From simple headache pills to sophisticated
a n t ib i o t i c s a n d c o mp l e x c a r d i a c com p o u nd s , a l mo s t e v e r y t yp e
o f medicine is now made indigenously.
- 53 -
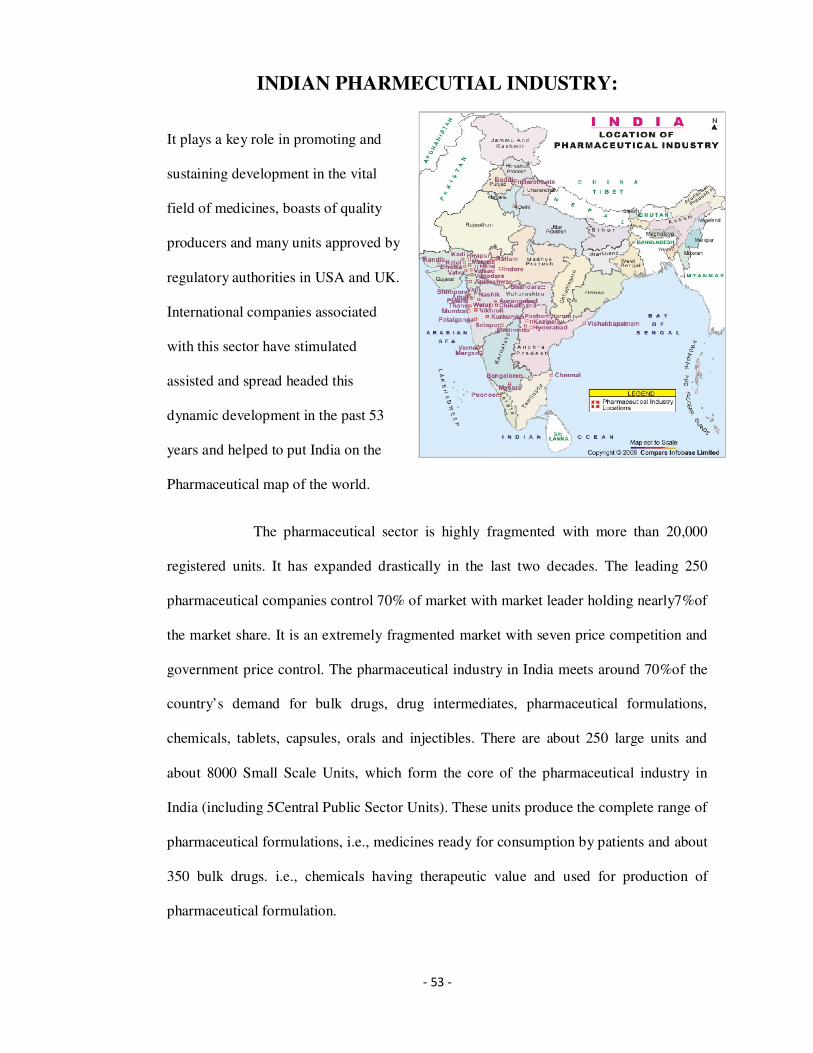
INDIAN PHARMECUTIAL INDUSTRY:
It plays a key role in promoting and
sustaining development in the vital
field of medicines, boasts of quality
producers and many units approved by
regulatory authorities in USA and UK.
International companies associated
with this sector have stimulated
assisted and spread headed this
dynamic development in the past 53
years and helped to put India on the
Pharmaceutical map of the world.
The pharmaceutical sector is highly fragmented with more than 20,000
registered units. It has expanded drastically in the last two decades. The leading 250
pharmaceutical companies control 70% of market with market leader holding nearly7%of
the market share. It is an extremely fragmented market with seven price competition and
government price control. The pharmaceutical industry in India meets around 70%of the
country’s demand for bulk drugs, drug intermediates, pharmaceutical formulations,
chemicals, tablets, capsules, orals and injectibles. There are about 250 large units and
about 8000 Small Scale Units, which form the core of the pharmaceutical industry in
India (including 5Central Public Sector Units). These units produce the complete range of
pharmaceutical formulations, i.e., medicines ready for consumption by patients and about
350 bulk drugs. i.e., chemicals having therapeutic value and used for production of
pharmaceutical formulation.
- 54 -
Manufactures are free to produce any drug duly approved by the Drug Control
Authority. Technologically strong and totally self-reliant, the pharmaceutical industry in
India has low costs of production, low R&D costs, innovative scientific manpower,
strength of national laboratories and an increasing balance of trade. The Pharmaceutical
Industry, with its rich scientific talents and research capabilities, supported by Intellectual
Property regime is well set to take on the international market.
US PHARMACEUTICAL INDUSTRY
The United States in the world’s largest market
for Pharmaceuticals and the world leader in
biopharmaceutical research. U.S. firms conduct
80 percent of the world’s research and
development in biotechnology and hold the
intellectual property rights to most new
medicines. In 2010, the pharmaceutical sector
employed approximately 272000 people and
according to the Pharmaceutical Research and
Manufactures of America (PhRMA), those
manufactures spent $67.4 billion on research and development in 2010.
The U.S. market is the world’s largest free-pricing market for
pharmaceutical and has a favorable patent and regulatory environment. Product success is
largely based on competition in product quality, safety and efficacy, and price. U.S.
government support of biomedical research, along with its unparalleled scientific and
research based innovative biotechnology sector, make the U.S market the preferred home
for growth in the pharmaceutical industry

- 55 -
PHARMACEUTICAL INDUSTRIES IN INDIA
Some of the below list of the Pharmaceutical industries in India are as follows:
• Dishman Pharmaceuticals
• Elder Pharmaceuticals
• J B Pharmaceuticals
• Torrent Pharmaceuticals
• Sun Pharmaceuticals
• Ranbaxy India
• Cadila Pharmaceutical Limited
• Wockhardt
• Strides Arcolab
• IPCA Laboratories
• Alembic
• Amrutanjan
• Virchow Laboratories
• Polydrug Laboratories
• Dr. Reddy?s Laboratories
• Aurobindo Pharma
• Jubilant Organosys
• Astrazeneca Pharma
• Divis Laboratories
• Merck Ltd.
- 56 -
ADVANTAGE INDIA:
� COMPETENT WORKFORCE:
India has a pool o f personnel with high managerial and
technical competence as also skilled workforce. It has an educated
work force and English is commonly used. Professional services are
available.
� COST-EFFECTIVE CHEMICAL SYNTHESIS:
Its track record of development, praticularly in the area of
improved cost-beneficial chemical synthesis for various drug
molecules is excellent. It provides a wide variety of bulk drugs and
exports sophisticated bulk drugs.
� LEGAL & FINANCIAL FRAMEWORK:
India has a 60 year old democracy and hence has a solid
legal framework and strong financial markets. There is already an
established international industry and business community.
� INFORMATION & TECHNOLOGY:
It has a good network o f world-classes educational
institutions and established strengths in Information Techno logy.
� GLOBALIZATION:
The country is committed to a free market economy and
globalization. Above all, it has a 70 million middle class market,
which is continuously growing.
- 57 -
CURRENT SCENARIO
THE GROWTH SCENARIO
India’s US$ 4.1 billion pharmaceutical industry is growing at the rate of 14
percent per year. It is one of the largest and most advanced among the
developing countries. Over 20,000 registered pharmaceutical manufactures
exist in the country. The domestic pharmaceutical industry output is
expected to exceed Rs.260 billion in the financial year 2002, which
accounts formerly 1.3% of the global pharmaceutical sector. Of this, bulk
drugs will account for Rs. 54 bn (21%) and formulations, the remaining Rs
210 bn (79%).
EXECUTIVE SUMMARY
This report has been made keeping in mind the Indian Pharmaceutical industry, its
growth rate as compared to the global Pharmaceutical Industry. India's US$ 3.1 billion
pharmaceutical industry is growing at the rate of 14 percent per year. It is one of the
largest and most advanced among the developing countries. The Indian Pharmaceutical
sector is highly fragmented with more than 20,000 registered units. It has expanded
drastically in the last two decades. The leading 250 pharmaceutical companies
control 70% of the market with market leader holding nearly 7% of the market share.
It is an extremely fragmented market with severe price competition and
government price control. Then, we look at the market and growth scenario of
Pharmaceutical companies in Ind ia which brings us to research on MATRIX
PHARMALABS
- 58 -
FUTURE PROSPECTS
The Indian Pharmaceuticals market is expected to reach US$55 billion in 2020 from
US$12.6 billion in 2009. This was started in a report title “Indian Pharma 2020:
Propelling access and acceptance, realizing true potential” by McKinsey & Company. In
the same report, it was also mentioned that in an aggressive growth scenario, the pharma
market has the further potential to reach US$70 billion by 2020.
Due to increase in the population of high income group, there is very likelihood that they
will open a potential US$ 8 billion market for multinational companies selling cost drugs
by 2015. This was estimated in a report by Emst & young. The domestic pharma market
is estimated to touch US$ 20 billion by 2015. The health care market in India to reach
US$ 31.59 billion by 2020.
The sale of all types of pharmaceutical drugs and medicines in the country stands at US$
9.61 billion, which is expected to reach around US$ 19.22 billion by 2012. Thus India
would really become a lucrative destination for clinical trials for global giants.
There was another report by RNCOS titled “Booming Pharma Sector in India” in which it
was projected that the pharmaceutical formulations industry is expected to prosper in the
same manner as the pharmaceutical industry. The domestic formulations market will
grow at an annual rate of around 17% in 2010 and 2011, owing to increase middle class
population and rapid urbanization.
- 59 -
Steps to strengthen the Industry:
• Indian companies need to attend the right product- mix for sustained future
growth.
• Core competencies will play an important role in determining the future of many
Indian Pharmaceutical companies in the post product-patents regime after 2005.
• The companies in an effort to consolidate their position will have to increasingly
look at merger and acquisition options of either companies or products.
• Research and development has always taken the back seat amongst Indian
Pharmaceutical companies.
• The Indian Pharmaceutical Industry also needs to take advantage of the recent
advance in biotechnology and information technology.

- 60 -
CHAPTER - 4
COMPANY PROFILE
.
- 61 -
ABOUT THE COMPANY
Dr. Reddy’s laboratories was founded by Dr. Anji Reddy, entrepreneur-scientist,
in 1984 the DNA of the company; is drawn from its founder and his vision to establish
India’s first discovery led global pharmaceutical company .in, fact, it is this spirit of
entrepreneurship that has shaped the company to become what it is today. The company
is focused on creating and delivering innovative and quality products to help people lead
healthier lives.
Dr. Reddy’s is the research based company with vertically integrated operations.
The company develops, manufactures and markets a wide range of pharmaceutical
products India and overseas. Dr. Reddy’s produces finished dosage forms, active
pharmaceutical ingredients, diagnostic, kits, critical are and biotechnology products. The
basic research program of Dr. Reddy’s focused on cancer diabetes, bacterial infections
and pain.
Since its inception in 1984, Dr. Reddy’s has chosen to walk the path of discovery
and innovation in health sciences R eddy’s has been a quests to sustain and improve the
quality of life, and they; heaves had nearly two decades of creating safe pharmaceutical
Solutions with the ultimate purpose of making the world a heather place. Dr. Reddy’s
create and deliver innovative pharmaceutical health care solutions that people enjoy
longer, healthier and more productive lives. Reddy’s generic formulations have also
become very popular in quality-conscious regulated markets such as the US and Europe.
We are all set to spread pure wings further and touch more lives across the globe
- 62 -
In 1973, after gaining six years of experience in the manufacturing and
implementation of new technologies in bulk drugs from public sector company IDPL,
Hyderabad. Dr Reddy’s decided to start up basic drugs unit at that time there were few
other players in the private sector at that end of the pharmaceutical value chain.
In 1975, Dr. Reddy’s started the construction of uniloids of which he was the
founder-managing director it was here that they made a move that was to become the
hallmark of the group in the years to come.
This move was first to construct and stat R&D laboratory ever before commencing
the construction of the plant. Based on the work done in these laboratories he constructed
a plant in 1976 to manufacture, for the first time in India, drug called ‘metrodinazole’ for
the treatment of amoebic dysentery the drug became a hit.
In 1981, as managing director of standard organics Ltd; Dr. Reddy’s aim was to
develop and manufacture a wide spectrum of bulk drugs to enable the pharmaceutical
industry to launch their formulations. Unfettered. There were only a couple of –
pharmaceutical company‘s at that time with the capacity to develop newer drugs bit they
would not sell the bulk to other formulators. Here, Dr. Reddy’s played a major role in
pioneering the technology and production of ‘sulphamethonazole ‘an anti bacterial in
India. Another dream was to do it on his own, because that was the time that his second
experiment with partnership was also crumbling. He realizes his dream shortly thereafter,
then the established Dr. Reddy’s laboratories in 1984. The process and production of
methyldopa was the ultimate challenge.
- 63 -
The company has several distinctions to its credit. Being the first pharmaceutical
company from Asia Pacific (outside Japan) to be listed on the New York Stock Exchange
(on April 11, 2001) is only one among then. And as always, Dr. Reddy’s chose to do it in
the most difficult of circumstances against widespread skepticism. Dr. Reddy’s came up
trumps not only having its stock oversubscribed but also becoming the best performing
IPO that year.
Dr. Anji Reddy’s is well known for his passion for research and drug
discovery. Dr Reddy’s started its drug discovery programmed in 1993 and within three
years it achieved its first break through by out licensing an anti –diabetes molecule to
Novo Nor disk in March 1997/ With this very small but significant step, the Indian
industry went through a paradigm shift in its image from being known as just
‘copycats’ to ‘innovators’! Through its success, Dr. Reddy’s pioneered drug discovery in
India. There are several such inflections points in the company’s evolution from a bulk
drug (API) manufacturer into a vertically integrated global pharmaceutical company
today.
Today , the company manufactures and markets API(Bulk Actives), Finished
Dosages and Biologics in over 100 countries worldwide, in addition to having a very
promising Drug Discovery Pipeline. When Dr. Reddy’s started its first big move in 1986
from manufacturing and marketing bulk actives to the domestic (Indian) market to
Manufacturing and exporting difficult-to-manufacture bulk votes such as Methyldopa to
highly regulated overseas markets, it had to not only overcome regulatory and legal
hurdles but also battle deeply entrenched mind-set issues of Indian Pharma being seen as
producers of ‘cheap’ and therefore ‘low quality’ pharmaceuticals.
- 64 -
Today, the Indian pharma industry, in stark contrast, is known globally for its
proven high quality-low cost advantage in delivering sage effective pharmaceuticals. This
transition, a tough and often-perilous one, was made possible thanks to the pioneering
efforts of companies such as Dr. Reddy’s Laboratories.
Dr. Reddy’s is a global, vertically integrated pharmaceutical company with a
presence across the value chain, producing and delivering safe, innovative, and high
quality finished dosage forms, active pharmaceutical ingredients and biological products.
Our products are marketed across the globe, with an emphasis on North America, Europe,
India, Russia and other emerging markets. We conduct NCE drug discovery research in
the areas of metabolic disorders and cardiovascular indications at our research facilities in
Atlanta (USA) and Hyderabad (India). Through our Custom Pharmaceutical Services
business unit, we provide drug substance and drug product development and
manufacturing services on a proprietary basis.
Today, Dr. Reddy’s continues its journey. Leveraging on its ‘Low Cost, High
Intellect” advantage. Foraying into new markets and new businesses. Taking on new
challenges and groaning stronger and more capable. Each failure and each success
renewing the sense of purpose and helping the company evolve with over 950 scientists
working across the globe, around the clock, the company continues its relentless march
forward to discover and deliver a breakthrough medicine to address an unmet medical
need and make a difference to people’s lives worldwide. And when it does that, it would
only be the beginning and yet it would be the most important step. As Lao Tzu wrote a
long time ago, ‘Even 1000mile journey starts with a single step.
- 65 -
DR.REDDY’S LTD IN INDIA:
Dr. Reddy’s originally launched in 1984 producing generic medications. In 1986,
Reddy’s started operations on branded formulations. Within a year Reddy’s had launched
Norilet, the company’s first recognized brand in India. Soon, Reddy’s obtained another
success with Omez, its branded omeprozole – ulcer and reflux oesophagitis medication –
launched at half the price of other brands on the Indian market at that time.
Within a year, Reddy’s became the first Indian company to export the achieve ingredients
for pharmaceuticals to Europe. In 1987, Reddy’s started to transform itself from a
supplier of pharmaceutical ingredients to other manufactures into a manufacture of
pharmaceutical products.
Dr. Reddy’s began as a supplier to Indian drug manufactures, but it soon started
exporting to other less-regulated markets that had the advantage of not having to spend
time and money on a manufacturing plant that would gain approval from a drug licensing
body such as the U.S. Food and Drug Administration. This allowed their movement into
regulated markets such as the US and Europe.
Dr. Reddy’s began as a supplier to Indian drug manufactures, but it soon started
exporting to other less-regulated markets that had the advantages of not having to spend
time and money on a manufacturing plant that would gain approval from a drug licensing
body such as the U.S. Food and Drug Administration.
- 66 -
OBJECTIVES:
� To creating a work environment that promotes safety, people training and
development and performance orientation in line with Dr Reddy’s values and
policies.
� To Improvement in supply and availability of utilities and time bound repair of
m/c and equipments (along with the relevant records as per site objectives).
� Ensure that the equipment and related systems (both old and new) are
(re)qualified / (re)validated as per schedule.
� Reduce utilities consumption in line with the site objectives. To identify and
implement energy conservation measures.
� To ensure that all the drawings and technical specifications of the equipment and
system in his/her area is updated.
� To ensure clean room performance (checks, calibration, qualification and
maintenance, along with documentation, of filters and other related equipments)
as per SOP.
� To reuse and recycle equipments, etc. where ever possible.
� Trouble shooting with an objective of finding permanent solution.
� To ensure the facility is as per site objectives at all times.
� To ensure the good upkeep of the department.
� Liaisoning (with peers and outside agencies) to meet business objectives.
- 67 -
COMPANY VISION
Our vision is to become a discovery-led global pharmaceutical company.
We will achieve this vision by building:
A work place that will attract, energise and help retain the finest
talent available. An organizational culture that is relentlessly focused on the speedy
translation of scientific discoveries into innovative products to make a significant
difference in people’s lives.
COMPANY MISSION:
To be the first Indian pharmaceutical company that successfully takes its products from
discovery to commercial launch globally.
We are on a tough mission and energies can easily dissipate unless there is
direction and dedication.
- 68 -
AWARDS:
The Dr. Reddy’s ltd has been a regular recipient of the awards for excellence in Pharma
sector, best employees and most respected company.
The Saumen Chakroborty- CFO of awarded to Dr. Reddy’s lab the Best Performance
Award sustained for CFO in the Pharma Sector for 2007 development of overseas
business.
D .Reddy’s lab also received the award in 2004 for the Most Respected Company award.
It also received the award in 2004 for the Best Employers in India.
For development of indigenous know-how, continued support is also necessary and a
detailed write up on R&D facilities is enclosed.
- 62 -
INSIGHT INTO VARIOUS DEPARTMENTS:
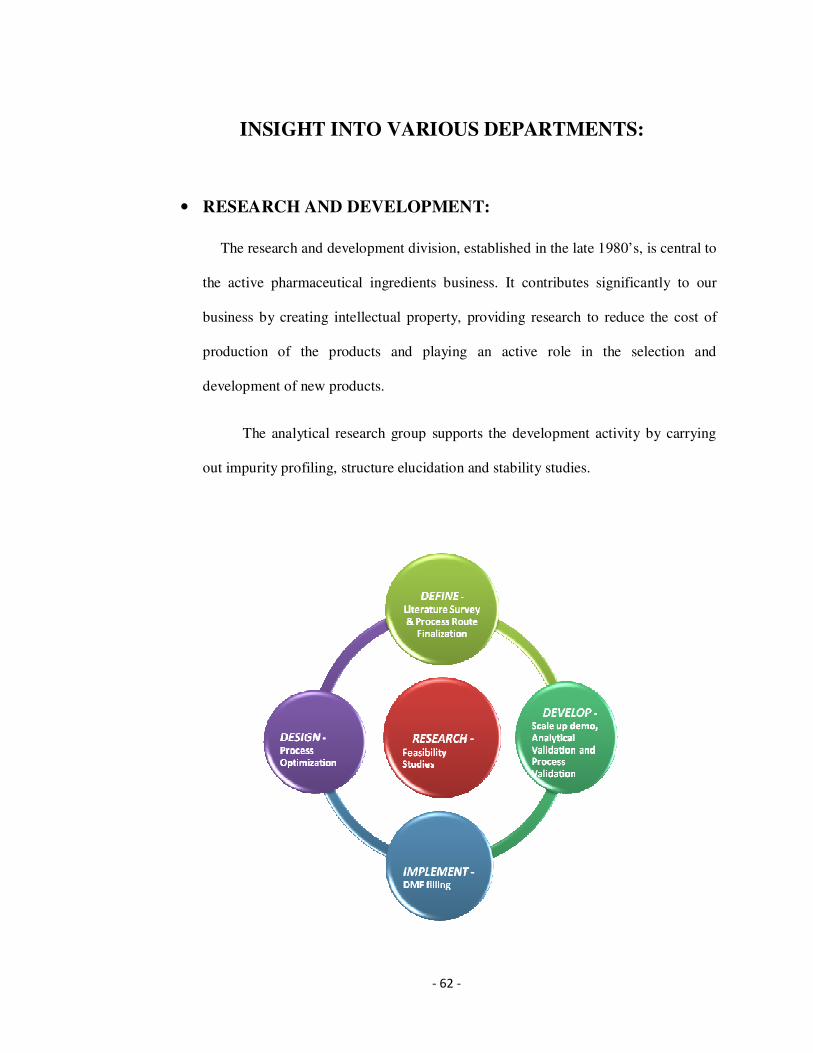
• RESEARCH AND DEVELOPMENT:
The research and development division, established in the late 1980’s, is central to
the active pharmaceutical ingredients business. It contributes significantly to our
business by creating intellectual property, providing research to reduce the cost of
production of the products and playing an active role in the selection and
development of new products.
The analytical research group supports the development activity by carrying
out impurity profiling, structure elucidation and stability studies.
- 63 -
• MANUFACTURING UNITS:
Cheminor drugs Ltd. Merged in to Dr. Reddy’s Labs in the year 2000-01
restructured as Strategic Business Units.
� Bulk
� Branded formulation
� Generics
� R&D emerging business
� Corporate center
Units: Strategic Business Units Bulk has 6units.
� 3 units in Bollarum
� 1 unit in Jeedimetla.
� 1 unit in Miryalaguda
� 1unit in PydiBhimavaram
• QUALITY POLICY:
Dr. Reddy’s is committed to provide customer’s products meeting or exceeding
exceptions consistently in terms of specifications, delivery, technical support,
regularity compliance & competitive.
- 64 -
Customer Focus:
We are committed to delight customers by providing products and services
that exceed expectations consistently in terms of quality, speed to market, delivery and
competitiveness
Execution Excellence:
We will constantly improve systems, technologies, infrastructure,
regulatory compliance and technical support.
Competency Building:
We will ensure high level of competency by attracting and retaining
talented personnel in all areas through continual education and development.
Beneficial Partnerships:
We will develop and maintain mutually beneficial relationships with all
business associates and provide lasting value to all stakeholders. Constantly improve the
procedure, technologies & infrastructure to continuously better the quality of products
produced. Ensure optimum training to all personnel accountable for quality related
activities. Maintain mutually beneficial relationship with vendors, enrich the quality of
life of employees & provide lasting value of shareholders.
- 65 -
• SOCIAL INITIATIVES:
We at Dr. Reddy’s take pride in the company’s mission – to help people lead
healthier lives. This objective is achieved by increasing access and affordability of
medicines through the company’s generics, API, and branded generics products, and by
addressing unmet medical needs by innovation through its Specialty and NCE businesses.
We see Social Initiatives as an integral component of Corporate Social
Responsibility. Our investments in the community have gone beyond the adhoc
disbursement of funds, to planned programs in capability building. We do this by
supporting the following organizations:
� Dr. Reddy’s Foundation
� The Naandi Foundation
� Dr. Reddy’s Foundation For Health Education (DRFHE)
� The Centre for Social Initiative & Management (CSIM)
Our Social Initiatives do not involve just the community, but employees as well by
including employees in our definition of Social Initiatives, the company ensures that the
initiators also figure among the beneficiaries.
- 66 -
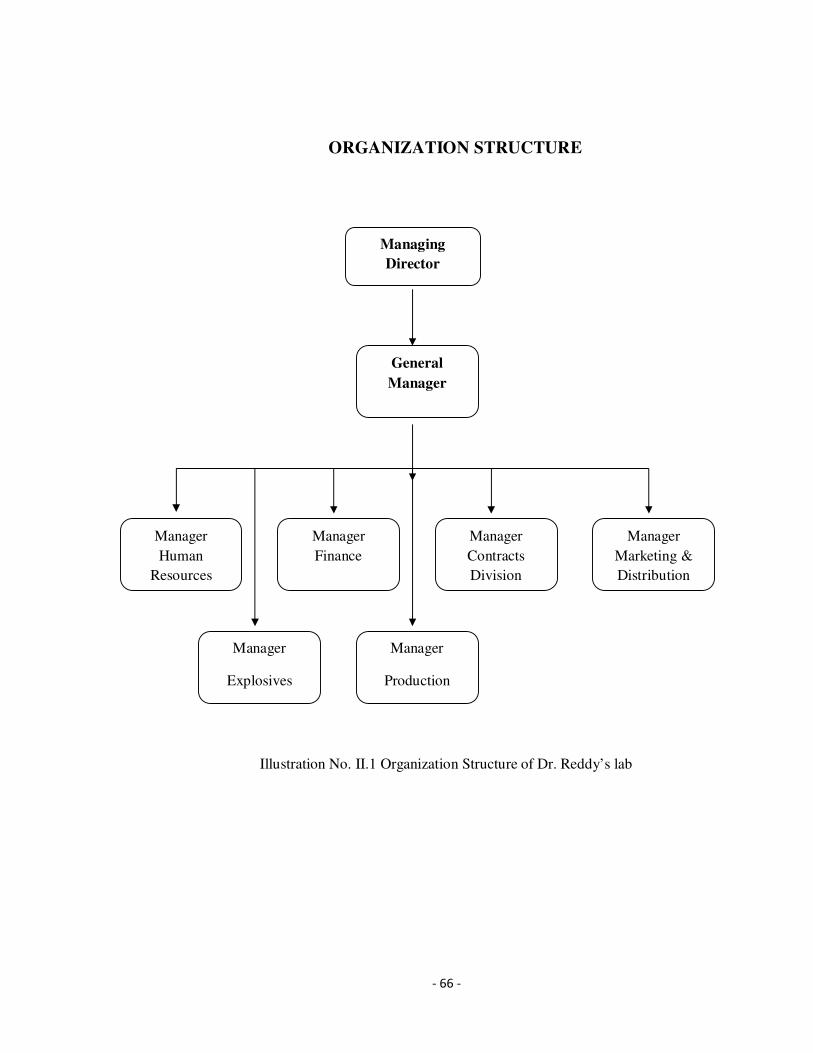
ORGANIZATION STRUCTURE
Illustration No. II.1 Organization Structure of Dr. Reddy’s lab
Managing
Director
Manager
Finance
Manager
Human
Resources
Manager
Marketing &
Distribution
Manager
Contracts
Division
Manager
Explosives
General
Manager
Manager
Production
- 67 -
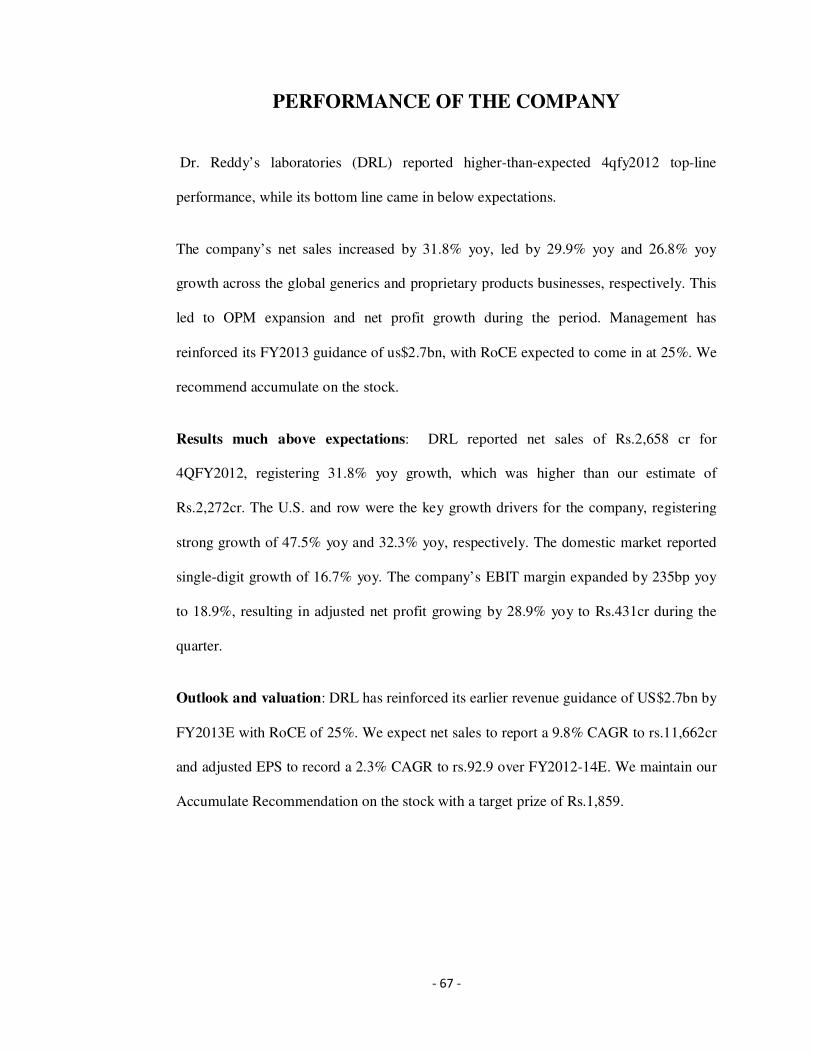
PERFORMANCE OF THE COMPANY
Dr. Reddy’s laboratories (DRL) reported higher-than-expected 4qfy2012 top-line
performance, while its bottom line came in below expectations.
The company’s net sales increased by 31.8% yoy, led by 29.9% yoy and 26.8% yoy
growth across the global generics and proprietary products businesses, respectively. This
led to OPM expansion and net profit growth during the period. Management has
reinforced its FY2013 guidance of us$2.7bn, with RoCE expected to come in at 25%. We
recommend accumulate on the stock.
Results much above expectations: DRL reported net sales of Rs.2,658 cr for
4QFY2012, registering 31.8% yoy growth, which was higher than our estimate of
Rs.2,272cr. The U.S. and row were the key growth drivers for the company, registering
strong growth of 47.5% yoy and 32.3% yoy, respectively. The domestic market reported
single-digit growth of 16.7% yoy. The company’s EBIT margin expanded by 235bp yoy
to 18.9%, resulting in adjusted net profit growing by 28.9% yoy to Rs.431cr during the
quarter.
Outlook and valuation: DRL has reinforced its earlier revenue guidance of US$2.7bn by
FY2013E with RoCE of 25%. We expect net sales to report a 9.8% CAGR to rs.11,662cr
and adjusted EPS to record a 2.3% CAGR to rs.92.9 over FY2012-14E. We maintain our
Accumulate Recommendation on the stock with a target prize of Rs.1,859.
- 68 -
BOARD OF DIRECTORS:
� Dr’s Anji Reddy, Chairman
� GV Prasad , Vice Chairman & CEO
� K. Satish Reddy, COO & MD
� Abhijit Mukharjee, President Global Genetics
� Dr. Cartikeya Reddy, Senior Vice-President & Head Biologics
� KB. Shankara Rao, Exicutive Vice-President IPDO
� Vilas bholye, Head – Formulations Manufacturing
� Dr. Raghav Chari, Senior Vice-President-Proprietary Products
� Prabir Jha, Senior Vice-President Global Chief HR.
� Amit Patel, Senior Vice-President & Head-NA Genetics
� Saumen Chakraborty, President-Corporate
� Umang Vohara, Chief Financial Officer
� VS Vasudevan, Head of Europe Operations.
- 69 -
COMPANY VALUES
Our business practices are guided by highest ethical standards of truth integrity and
transparency. To strive for excellence in everything they think, say and so. The values
that guide the thoughts and actions are:
• Quality:
Reddy’s are dedicated to achieving the highest levels of quality in everything we
do to delight customers, internal & external, every time.
• Respect for the individual:
We uphold the self-esteem and dignity of each other by creating an open culture
conducive for expression of views and ideas irrespective of hierarchy.
• Innovation & continuous learning:
We create an environment of innovation and learning that fosters, in each one of
us, a desire to excel and willingness to experiment.
• Collaboration & Teamwork:
Dr.Reddy’s seek opportunities to build relationships and leverage knowledge,
expertise and resources to create greater value across functions, businesses and
locations.
• Harmony & Social Responsibility:
Dr.Reddy’s take utmost care to protect our natural environment and serve the
communities in which they live and work.
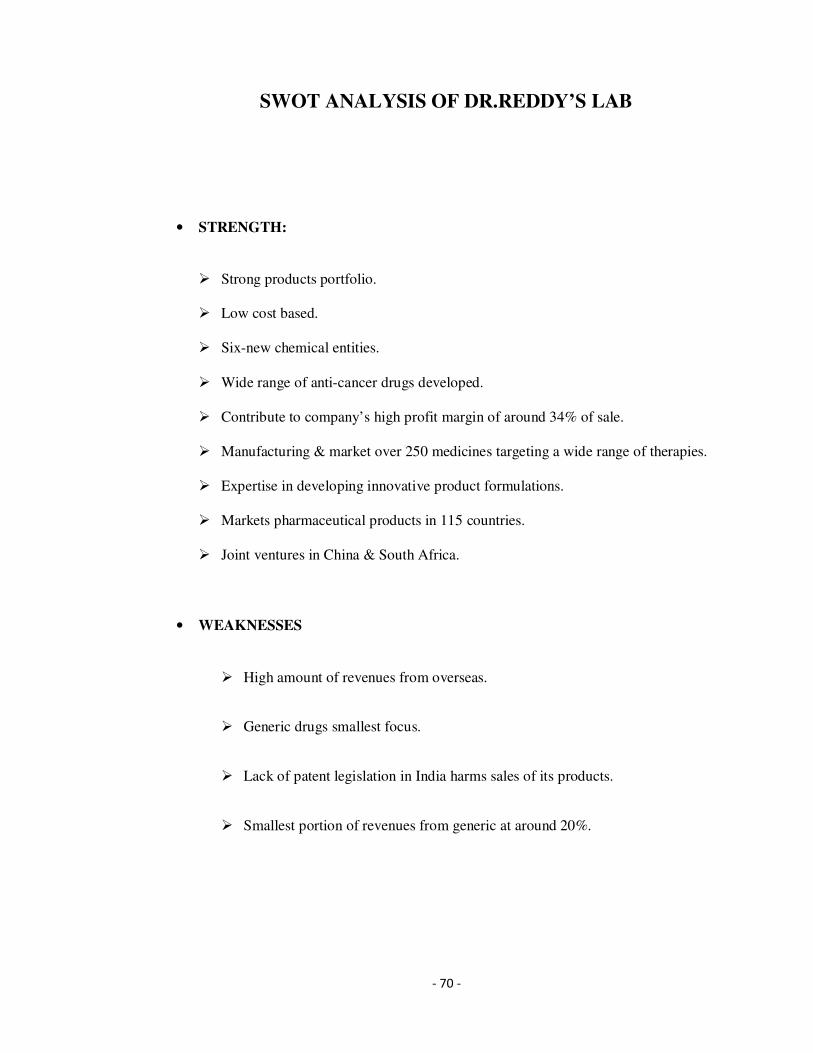
- 70 -
SWOT ANALYSIS OF DR.REDDY’S LAB
• STRENGTH:
� Strong products portfolio.
� Low cost based.
� Six-new chemical entities.
� Wide range of anti-cancer drugs developed.
� Contribute to company’s high profit margin of around 34% of sale.
� Manufacturing & market over 250 medicines targeting a wide range of therapies.
� Expertise in developing innovative product formulations.
� Markets pharmaceutical products in 115 countries.
� Joint ventures in China & South Africa.
• WEAKNESSES
� High amount of revenues from overseas.
� Generic drugs smallest focus.
� Lack of patent legislation in India harms sales of its products.
� Smallest portion of revenues from generic at around 20%.
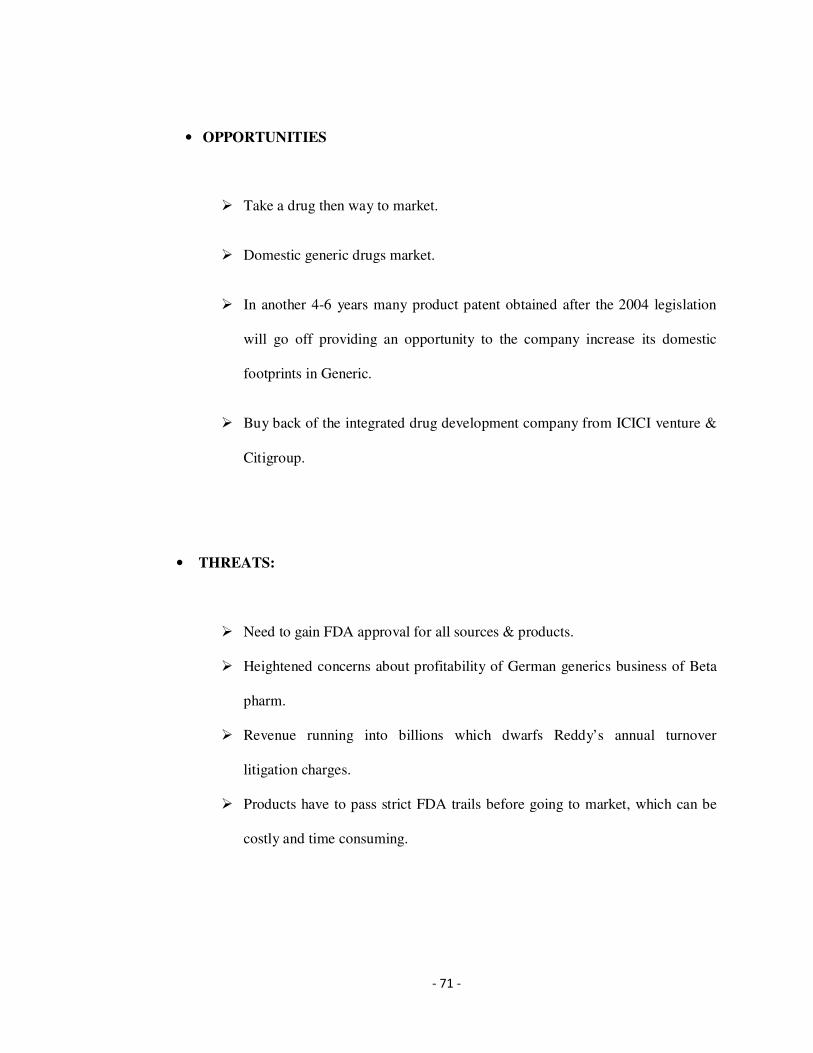
- 71 -
• OPPORTUNITIES
� Take a drug then way to market.
� Domestic generic drugs market.
� In another 4-6 years many product patent obtained after the 2004 legislation
will go off providing an opportunity to the company increase its domestic
footprints in Generic.
� Buy back of the integrated drug development company from ICICI venture &
Citigroup.
• THREATS:
� Need to gain FDA approval for all sources & products.
� Heightened concerns about profitability of German generics business of Beta
pharm.
� Revenue running into billions which dwarfs Reddy’s annual turnover
litigation charges.
� Products have to pass strict FDA trails before going to market, which can be
costly and time consuming.
- 72 -
CHAPTER - 5
DATA ANALYSIS AND
INTERPRETATION

- 73 -
PREPARING THE BUDGETING
As firms grow, the amount of control that a firm owner has on their firm
reduces significantly. It is therefore important that you remain in control of the firm by
budgeting to increase profits and performance. Consequently, budgeting allows you to
think ahead to control the management of your firm. As you will see, budgeting is based
largely on the objectives of the firm. To meet their firm’s objectives they need to prepare
the budgeting to estimate the forecast, so that they can coordinate the budget to help
achieve them.
Without budgeting, many businesses carry the threat of failure and for those that
do budget: failing to carry out the task correctly can have the same effect.
Many businesses overlook budgeting as they feel it is just more paperwork that
ties away time that can be used elsewhere: they can do without more work in their
already tight schedule. In fact, budgeting can help eliminate the pressure of time as it
prepares for the future and foresees problems before they occur.
“Budgeting prepares for the future and foresees problems before they occur”
Hopefully, after reading the article, you will learn that budgeting is an integral
process in business and realize that the way forward comes from successful planning.
Budgeting period has been determined (weekly, monthly, yearly, etc), the
manager needs to gather information to guide him when compiling the budgeting. This
will include past and current performance figures obtain from the cash flows and present
value factors. It can be very risky and uncertain.
- 74 -
CAPITAL BUDGET
Preparing a budget is vital to any company or business for a number of reasons. A capital
budget is needed to increase revenue while decreasing costs and expenses. Many
corporations normally plan an annual budget that will assist management in evaluating
the total performance of the organization. Capital budgets, on the other hand, focus more
on the long term investments. At the same time, management can examine and analyze
the costs of purchasing or upgrading equipment and other fixed assets.
A capital budget helps the management in:
� To examine the existing financial objectives and capital development goals and
determine what level the company is at.
� It helps in ranking of projects according to their true profitability.
� It helps to choose among mutually exclusive projects, that project with the
maximization of the shareholder’s wealth.
� Determining the future cash flows of the firm.
� Application of decision rule making a choice for long-term investments.
Capital budgeting main uses are:
� The formulation of long-term goals.
� The creative search for and identification of new investment opportunities.
- 75 -
� Classification of projects and recognition of economically and/or statistically
dependent proposals.
� The estimation and forecasting of current and future cash flows.
� A suitable administrative framework capable of transferring the required
information to the decision level.
� The controlling of expenditures and careful monitoring of crucial aspects of
project execution.
� A set of decision rules which can differentiate acceptable from unacceptable
alternatives is required.
Basic Steps of Capital Budgeting:
Step1: Estimate the cash flows
Step2: Assess the riskiness of the cash flows.
Step3: Determine the appropriate discount rate.
Step4: Find the PV of the expected cash flows.
Step5: Accept the project if PV of inflows > costs.IRR > Hurdle Rate and
pay<policy.
The capital budgeting will be analyzed the process of evaluating how we invest in capital
assets; i.e. assets that provide cash flow benefits for more than one year. Therefore, we
will focus much of our attention on present values so that we can understand how
expenditures today influence values in the future.
- 76 -
CAPITAL BUDGETING PREPARATION AT DR.REDDY LABS:
Dr. Reddy’s lab limited has been in business for 50 years. Over these years it has
diversified organically and inorganically. The Company has the advantage of its good
distribution network. It walks with an objective – by providing world class products and
services in explosives, initiating systems, mining and infrastructure projects with
special emphasis on safety events to total customer satisfaction.
To achieve this objective, “Preparation of capital budgeting is a key as it is
the roadmap to the financial success and independence of an organization. It also
helps in managerial decisions to an investment appraisal in a company and also in
financial decisions to earning their goals”.
The organization prepares a “Capital budgeting” for every financial year April 1st –
March 31st, before the commencement of the next financial year. The capital budgeting is
prepared by using the methods (PBP, NPV, ARR, PI, IRR).
The Finance Manager with the help of Planning & Development department is
responsible for preparing the capital budgeting, which looks after the capital budgeting
decisions for collection of data and had a discussion with the official’s engaged in the
capital budgeting process. The data that has been collected from the planning and
development department has been recast by me to present the same in an appreciable and
easily understandable manner.
The procedure with regard to the capital budgeting followed by Dr.
Reddy lab limited is explained in detail.
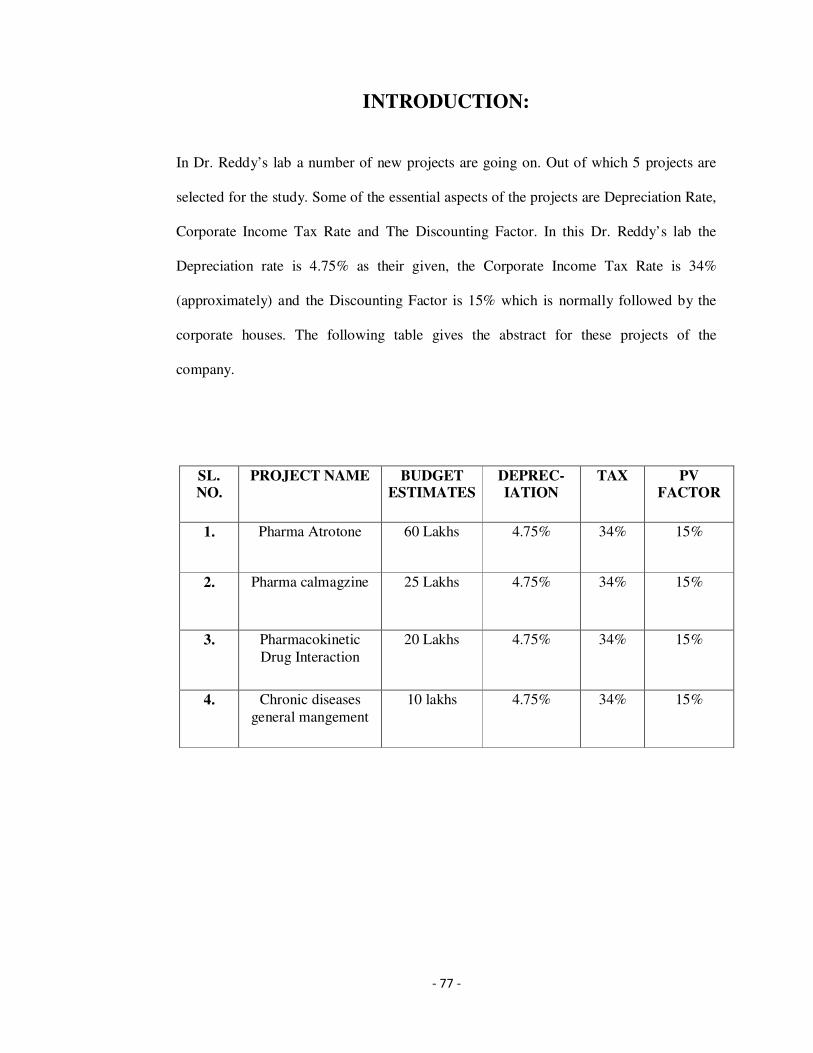
- 77 -
INTRODUCTION:
In Dr. Reddy’s lab a number of new projects are going on. Out of which 5 projects are
selected for the study. Some of the essential aspects of the projects are Depreciation Rate,
Corporate Income Tax Rate and The Discounting Factor. In this Dr. Reddy’s lab the
Depreciation rate is 4.75% as their given, the Corporate Income Tax Rate is 34%
(approximately) and the Discounting Factor is 15% which is normally followed by the
corporate houses. The following table gives the abstract for these projects of the
company.
SL.
NO.
PROJECT NAME BUDGET
ESTIMATES
DEPREC-
IATION
TAX PV
FACTOR
1. Pharma Atrotone 60 Lakhs 4.75% 34% 15%
2. Pharma calmagzine 25 Lakhs 4.75% 34% 15%
3. Pharmacokinetic Drug Interaction
20 Lakhs 4.75% 34% 15%
4. Chronic diseases general mangement
10 lakhs 4.75% 34% 15%
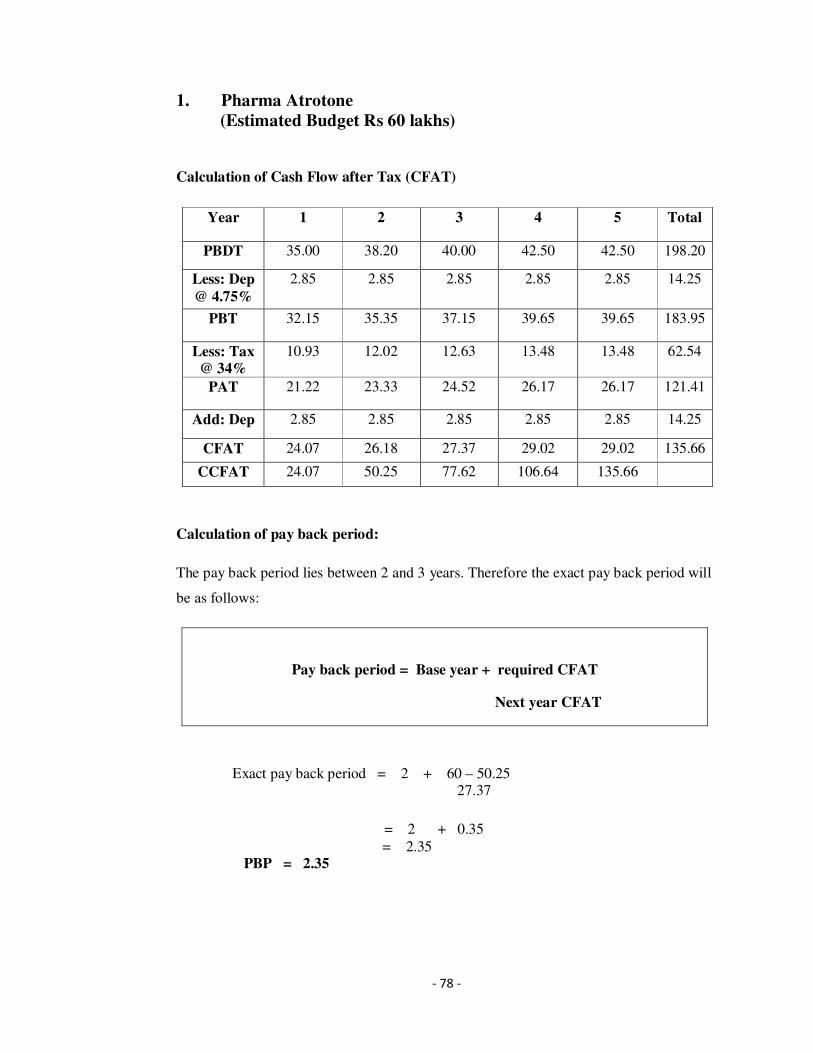
- 78 -
1. Pharma Atrotone
(Estimated Budget Rs 60 lakhs)
Calculation of Cash Flow after Tax (CFAT)
Calculation of pay back period:
The pay back period lies between 2 and 3 years. Therefore the exact pay back period will
be as follows:
Pay back period = Base year + required CFAT
Next year CFAT
Exact pay back period = 2 + 60 – 50.25 27.37
= 2 + 0.35 = 2.35 PBP = 2.35
Year 1 2 3 4 5 Total
PBDT 35.00 38.20 40.00 42.50 42.50 198.20
Less: Dep
@ 4.75%
2.85 2.85 2.85 2.85 2.85 14.25
PBT 32.15 35.35 37.15 39.65 39.65 183.95
Less: Tax
@ 34%
10.93 12.02 12.63 13.48 13.48 62.54
PAT 21.22 23.33 24.52 26.17 26.17 121.41
Add: Dep 2.85 2.85 2.85 2.85 2.85 14.25
CFAT 24.07 26.18 27.37 29.02 29.02 135.66
CCFAT 24.07 50.25 77.62 106.64 135.66
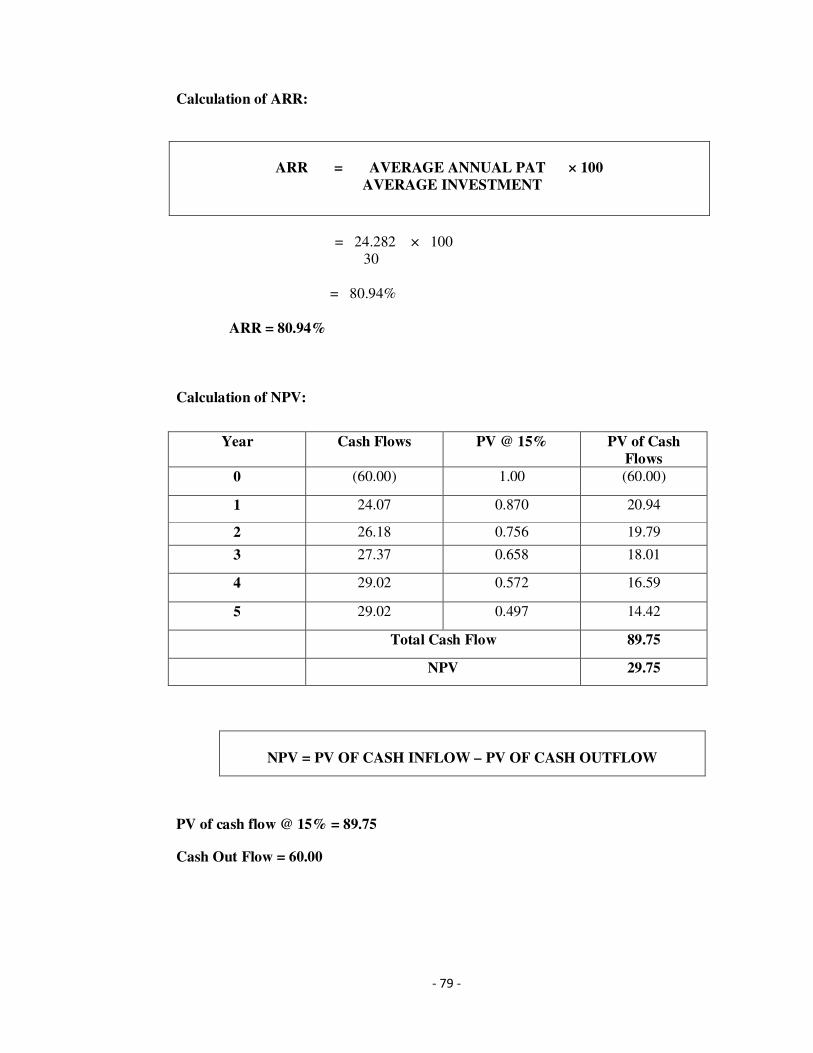
- 79 -
Calculation of ARR:
ARR = AVERAGE ANNUAL PAT × 100
AVERAGE INVESTMENT
= 24.282 × 100 30 = 80.94% ARR = 80.94%
Calculation of NPV:
PV of cash flow @ 15% = 89.75
Cash Out Flow = 60.00
Year Cash Flows PV @ 15% PV of Cash
Flows
0 (60.00) 1.00 (60.00)
1 24.07 0.870 20.94
2 26.18 0.756 19.79
3 27.37 0.658 18.01
4 29.02 0.572 16.59
5 29.02 0.497 14.42
Total Cash Flow 89.75
NPV 29.75
NPV = PV OF CASH INFLOW – PV OF CASH OUTFLOW
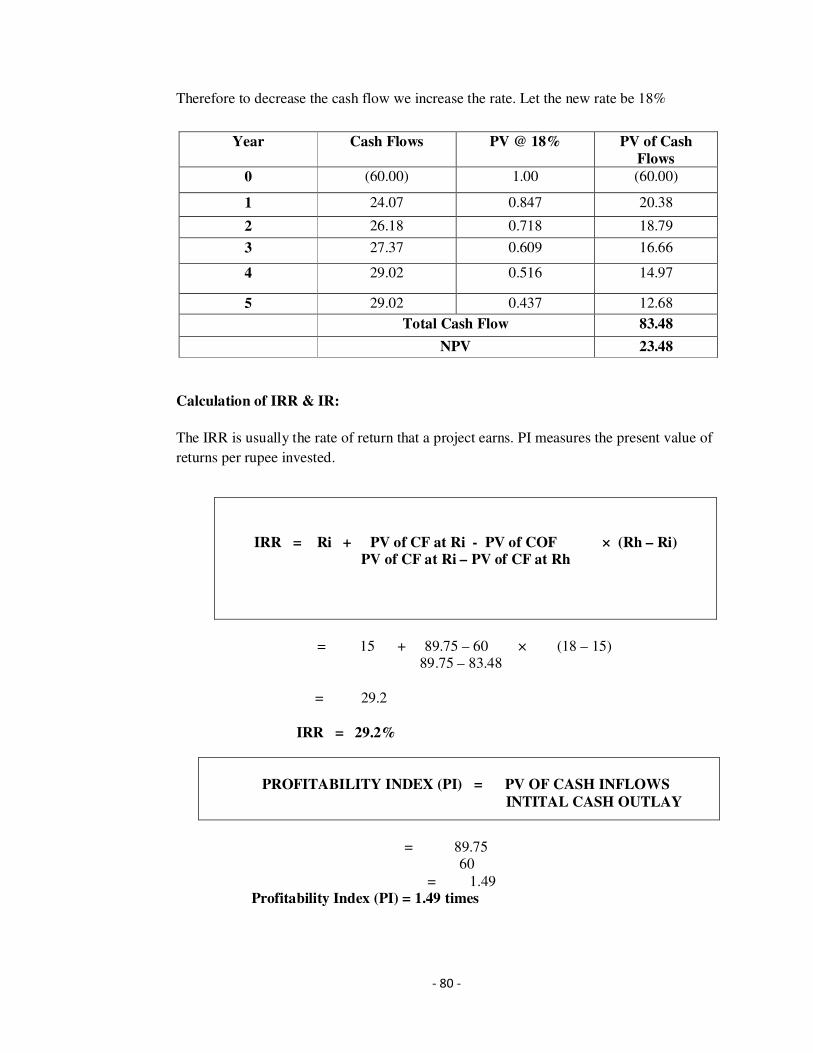
- 80 -
Therefore to decrease the cash flow we increase the rate. Let the new rate be 18%
Calculation of IRR & IR:
The IRR is usually the rate of return that a project earns. PI measures the present value of
returns per rupee invested.
IRR = Ri + PV of CF at Ri - PV of COF × (Rh – Ri)
PV of CF at Ri – PV of CF at Rh
= 15 + 89.75 – 60 × (18 – 15) 89.75 – 83.48 = 29.2 IRR = 29.2%
= 89.75
60 = 1.49 Profitability Index (PI) = 1.49 times
Year Cash Flows PV @ 18% PV of Cash
Flows
0 (60.00) 1.00 (60.00)
1 24.07 0.847 20.38
2 26.18 0.718 18.79
3 27.37 0.609 16.66
4 29.02 0.516 14.97
5 29.02 0.437 12.68
Total Cash Flow 83.48
NPV 23.48
PROFITABILITY INDEX (PI) = PV OF CASH INFLOWS
INTITAL CASH OUTLAY
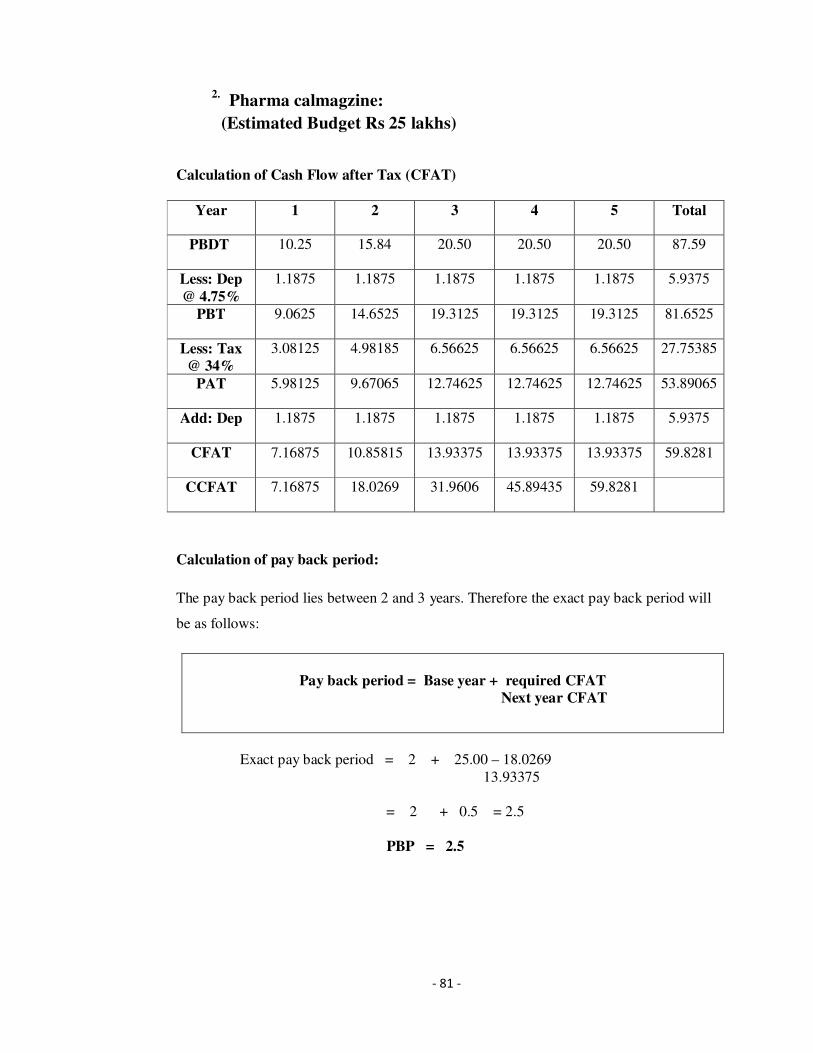
- 81 -
2. Pharma calmagzine:
(Estimated Budget Rs 25 lakhs)
Calculation of Cash Flow after Tax (CFAT)
Year 1 2 3 4 5 Total
PBDT 10.25 15.84 20.50 20.50 20.50 87.59
Less: Dep
@ 4.75%
1.1875 1.1875 1.1875 1.1875 1.1875 5.9375
PBT 9.0625 14.6525 19.3125 19.3125 19.3125 81.6525
Less: Tax
@ 34%
3.08125 4.98185 6.56625 6.56625 6.56625 27.75385
PAT 5.98125 9.67065 12.74625 12.74625 12.74625 53.89065
Add: Dep 1.1875 1.1875 1.1875 1.1875 1.1875 5.9375
CFAT 7.16875 10.85815 13.93375 13.93375 13.93375 59.8281
CCFAT 7.16875 18.0269 31.9606 45.89435 59.8281
Calculation of pay back period:
The pay back period lies between 2 and 3 years. Therefore the exact pay back period will
be as follows:
Pay back period = Base year + required CFAT
Next year CFAT
Exact pay back period = 2 + 25.00 – 18.0269 13.93375 = 2 + 0.5 = 2.5
PBP = 2.5
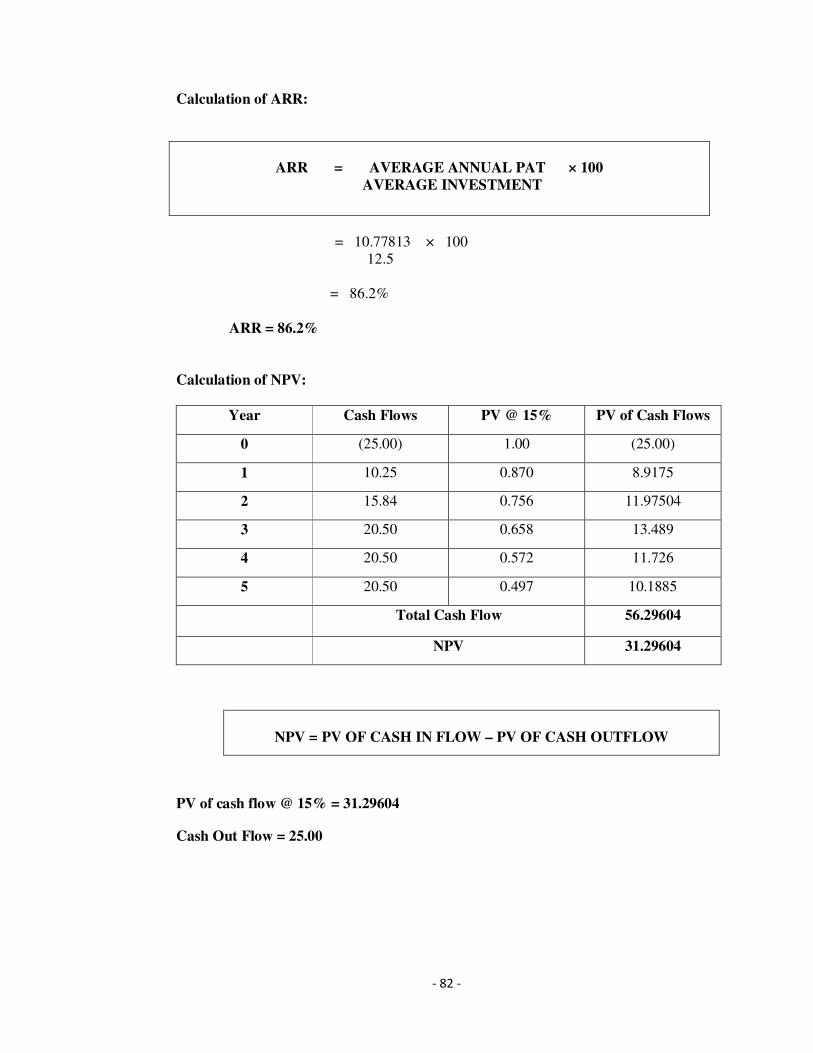
- 82 -
Calculation of ARR:
ARR = AVERAGE ANNUAL PAT × 100
AVERAGE INVESTMENT
= 10.77813 × 100 12.5 = 86.2% ARR = 86.2%
Calculation of NPV:
Year Cash Flows PV @ 15% PV of Cash Flows
0 (25.00) 1.00 (25.00)
1 10.25 0.870 8.9175
2 15.84 0.756 11.97504
3 20.50 0.658 13.489
4 20.50 0.572 11.726
5 20.50 0.497 10.1885
Total Cash Flow 56.29604
NPV 31.29604
PV of cash flow @ 15% = 31.29604
Cash Out Flow = 25.00
NPV = PV OF CASH IN FLOW – PV OF CASH OUTFLOW
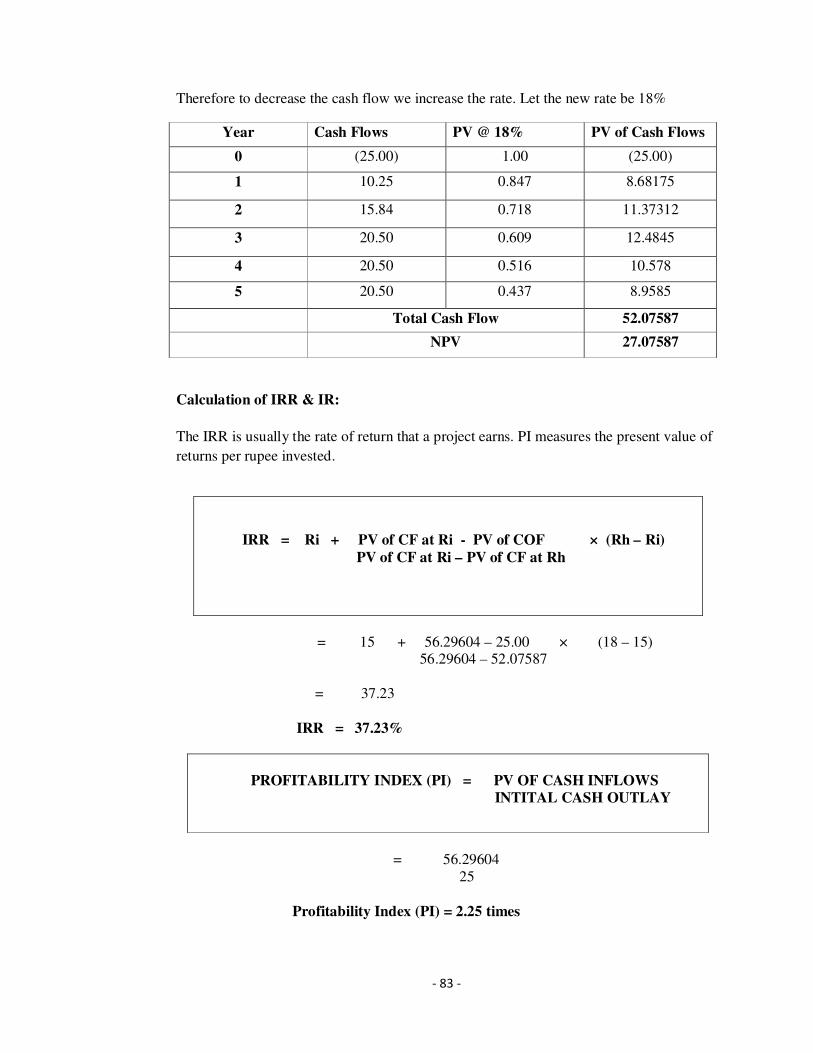
- 83 -
Therefore to decrease the cash flow we increase the rate. Let the new rate be 18%
Calculation of IRR & IR:
The IRR is usually the rate of return that a project earns. PI measures the present value of
returns per rupee invested.
IRR = Ri + PV of CF at Ri - PV of COF × (Rh – Ri)
PV of CF at Ri – PV of CF at Rh
= 15 + 56.29604 – 25.00 × (18 – 15) 56.29604 – 52.07587 = 37.23 IRR = 37.23%
= 56.29604
25
Profitability Index (PI) = 2.25 times
Year Cash Flows PV @ 18% PV of Cash Flows
0 (25.00) 1.00 (25.00)
1 10.25 0.847 8.68175
2 15.84 0.718 11.37312
3 20.50 0.609 12.4845
4 20.50 0.516 10.578
5 20.50 0.437 8.9585
Total Cash Flow 52.07587
NPV 27.07587
PROFITABILITY INDEX (PI) = PV OF CASH INFLOWS
INTITAL CASH OUTLAY
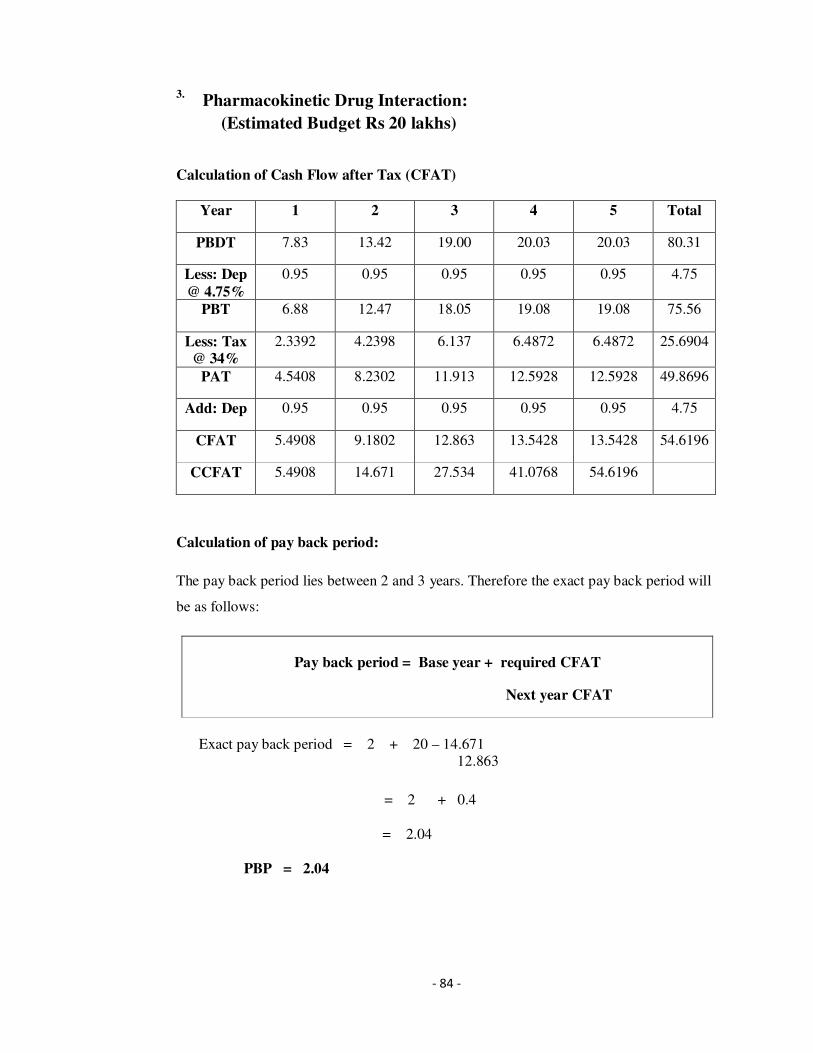
- 84 -
3. Pharmacokinetic Drug Interaction:
(Estimated Budget Rs 20 lakhs)
Calculation of Cash Flow after Tax (CFAT)
Year 1 2 3 4 5 Total
PBDT 7.83 13.42 19.00 20.03 20.03 80.31
Less: Dep
@ 4.75%
0.95 0.95 0.95 0.95 0.95 4.75
PBT 6.88 12.47 18.05 19.08 19.08 75.56
Less: Tax
@ 34%
2.3392 4.2398 6.137 6.4872 6.4872 25.6904
PAT 4.5408 8.2302 11.913 12.5928 12.5928 49.8696
Add: Dep 0.95 0.95 0.95 0.95 0.95 4.75
CFAT 5.4908 9.1802 12.863 13.5428 13.5428 54.6196
CCFAT 5.4908 14.671 27.534 41.0768 54.6196
Calculation of pay back period:
The pay back period lies between 2 and 3 years. Therefore the exact pay back period will
be as follows:
Pay back period = Base year + required CFAT
Next year CFAT
Exact pay back period = 2 + 20 – 14.671 12.863
= 2 + 0.4 = 2.04 PBP = 2.04
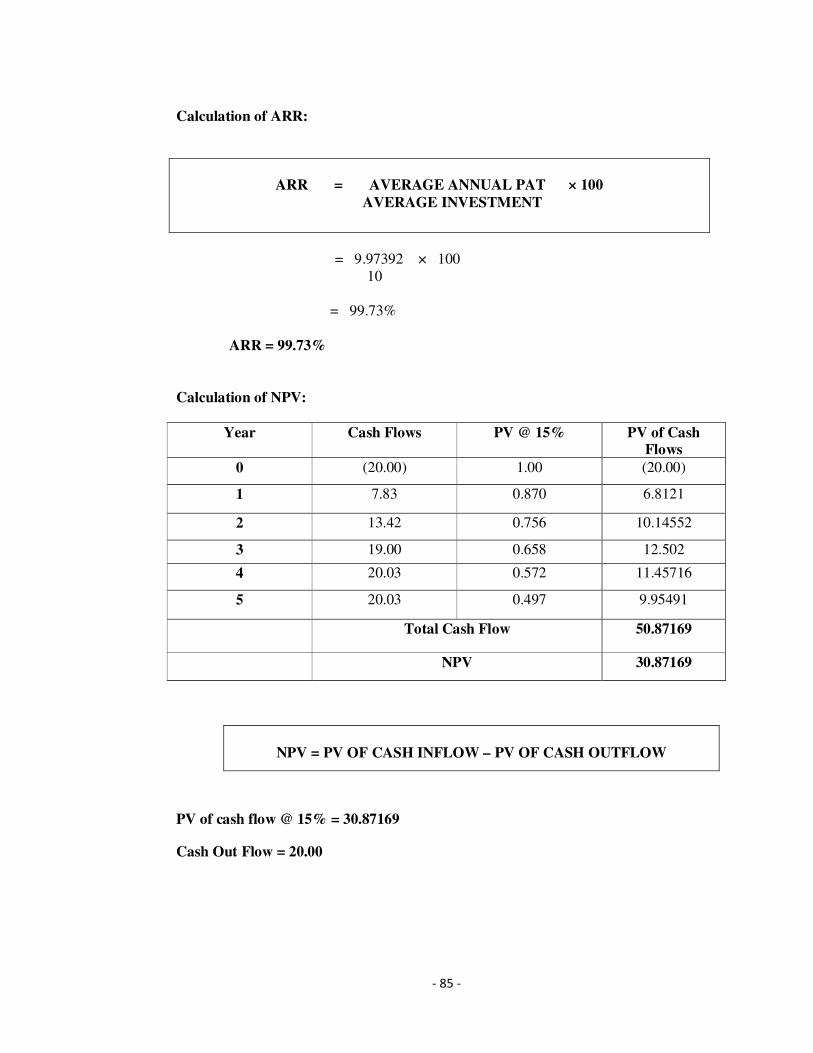
- 85 -
Calculation of ARR:
ARR = AVERAGE ANNUAL PAT × 100
AVERAGE INVESTMENT
= 9.97392 × 100 10 = 99.73% ARR = 99.73%
Calculation of NPV:
Year Cash Flows PV @ 15% PV of Cash
Flows
0 (20.00) 1.00 (20.00)
1 7.83 0.870 6.8121
2 13.42 0.756 10.14552
3 19.00 0.658 12.502
4 20.03 0.572 11.45716
5 20.03 0.497 9.95491
Total Cash Flow 50.87169
NPV 30.87169
PV of cash flow @ 15% = 30.87169
Cash Out Flow = 20.00
NPV = PV OF CASH INFLOW – PV OF CASH OUTFLOW
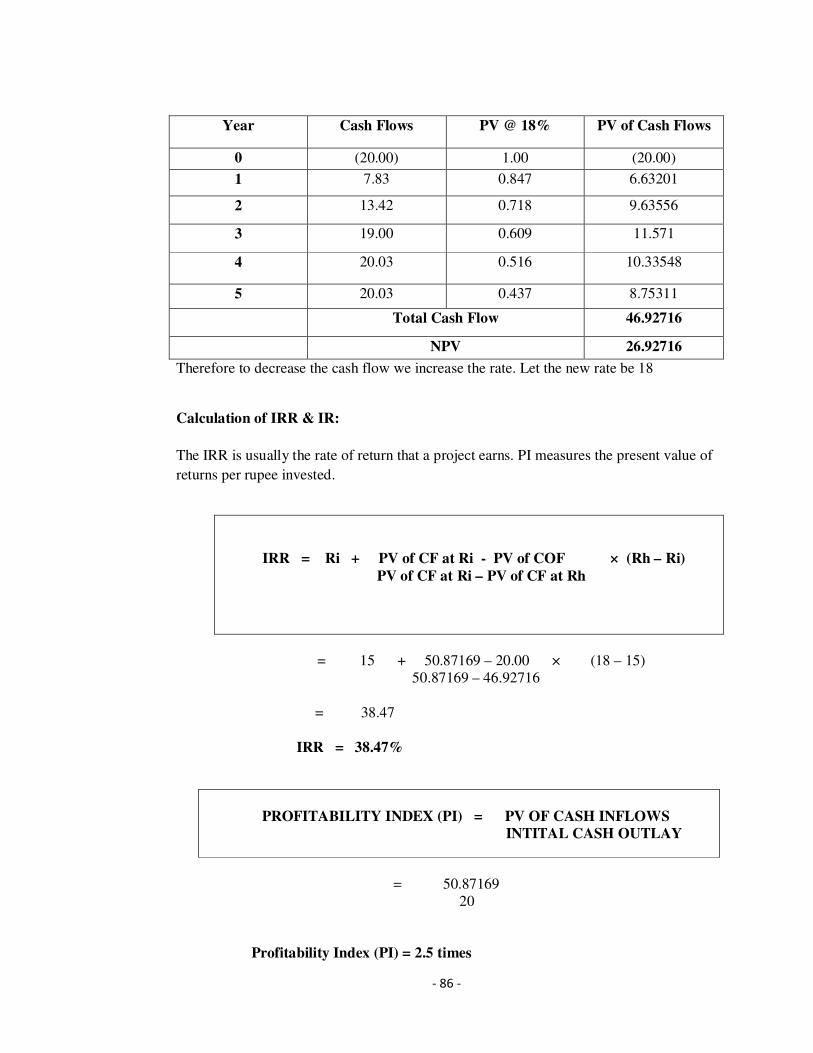
- 86 -
Therefore to decrease the cash flow we increase the rate. Let the new rate be 18
Calculation of IRR & IR:
The IRR is usually the rate of return that a project earns. PI measures the present value of
returns per rupee invested.
IRR = Ri + PV of CF at Ri - PV of COF × (Rh – Ri)
PV of CF at Ri – PV of CF at Rh
= 15 + 50.87169 – 20.00 × (18 – 15) 50.87169 – 46.92716 = 38.47
IRR = 38.47%
= 50.87169
20
Profitability Index (PI) = 2.5 times
Year Cash Flows PV @ 18% PV of Cash Flows
0 (20.00) 1.00 (20.00)
1 7.83 0.847 6.63201
2 13.42 0.718 9.63556
3 19.00 0.609 11.571
4 20.03 0.516 10.33548
5 20.03 0.437 8.75311
Total Cash Flow 46.92716
NPV 26.92716
PROFITABILITY INDEX (PI) = PV OF CASH INFLOWS
INTITAL CASH OUTLAY
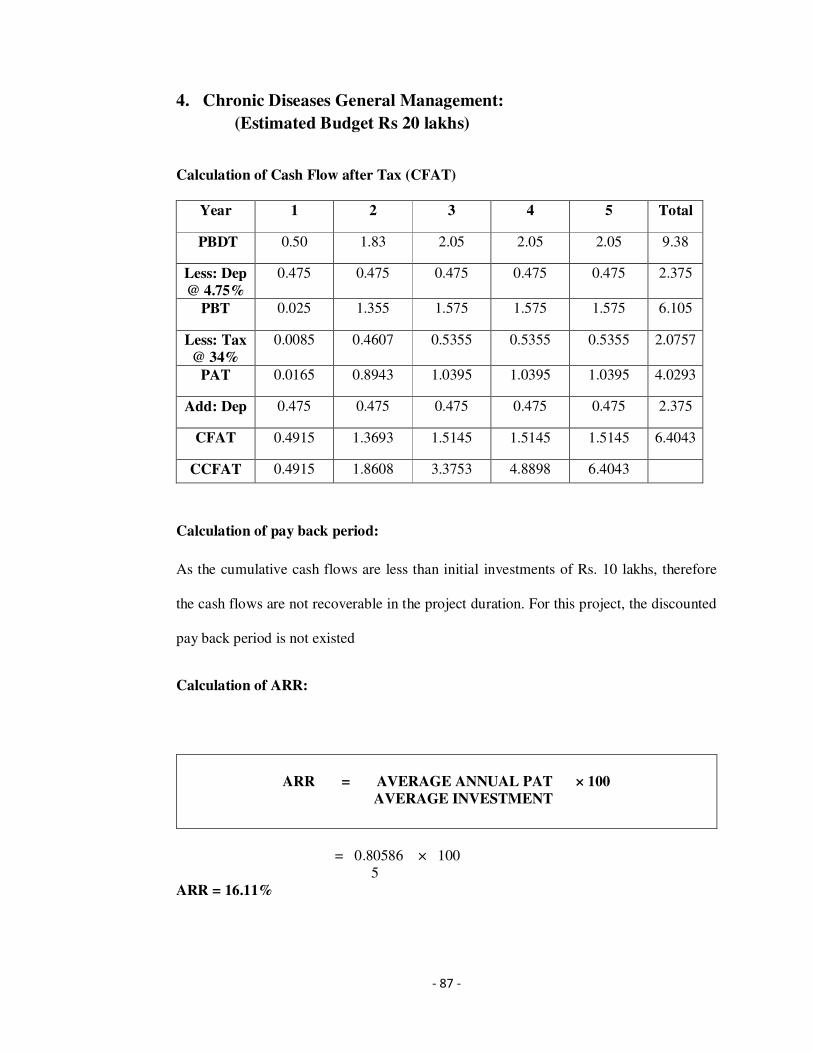
- 87 -
4. Chronic Diseases General Management:
(Estimated Budget Rs 20 lakhs)
Calculation of Cash Flow after Tax (CFAT)
Year 1 2 3 4 5 Total
PBDT 0.50 1.83 2.05 2.05 2.05 9.38
Less: Dep
@ 4.75%
0.475 0.475 0.475 0.475 0.475 2.375
PBT 0.025 1.355 1.575 1.575 1.575 6.105
Less: Tax
@ 34%
0.0085 0.4607 0.5355 0.5355 0.5355 2.0757
PAT 0.0165 0.8943 1.0395 1.0395 1.0395 4.0293
Add: Dep 0.475 0.475 0.475 0.475 0.475 2.375
CFAT 0.4915 1.3693 1.5145 1.5145 1.5145 6.4043
CCFAT 0.4915 1.8608 3.3753 4.8898 6.4043
Calculation of pay back period:
As the cumulative cash flows are less than initial investments of Rs. 10 lakhs, therefore
the cash flows are not recoverable in the project duration. For this project, the discounted
pay back period is not existed
Calculation of ARR:
= 0.80586 × 100
5 ARR = 16.11%
ARR = AVERAGE ANNUAL PAT × 100
AVERAGE INVESTMENT
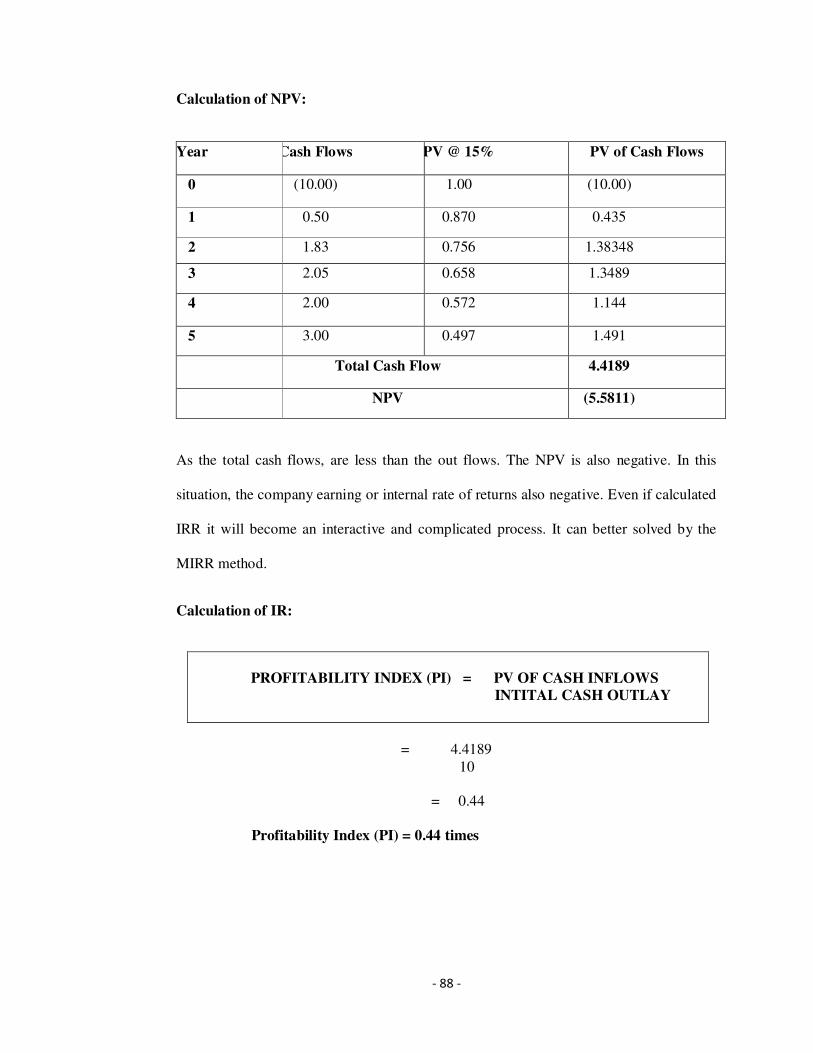
- 88 -
Calculation of NPV:
Year Cash Flows PV @ 15% PV of Cash Flows
0 (10.00) 1.00 (10.00)
1 0.50 0.870 0.435
2 1.83 0.756 1.38348
3 2.05 0.658 1.3489
4 2.00 0.572 1.144
5 3.00 0.497 1.491
Total Cash Flow 4.4189
NPV (5.5811)
As the total cash flows, are less than the out flows. The NPV is also negative. In this
situation, the company earning or internal rate of returns also negative. Even if calculated
IRR it will become an interactive and complicated process. It can better solved by the
MIRR method.
Calculation of IR:
= 4.4189
10
= 0.44 Profitability Index (PI) = 0.44 times
PROFITABILITY INDEX (PI) = PV OF CASH INFLOWS
INTITAL CASH OUTLAY
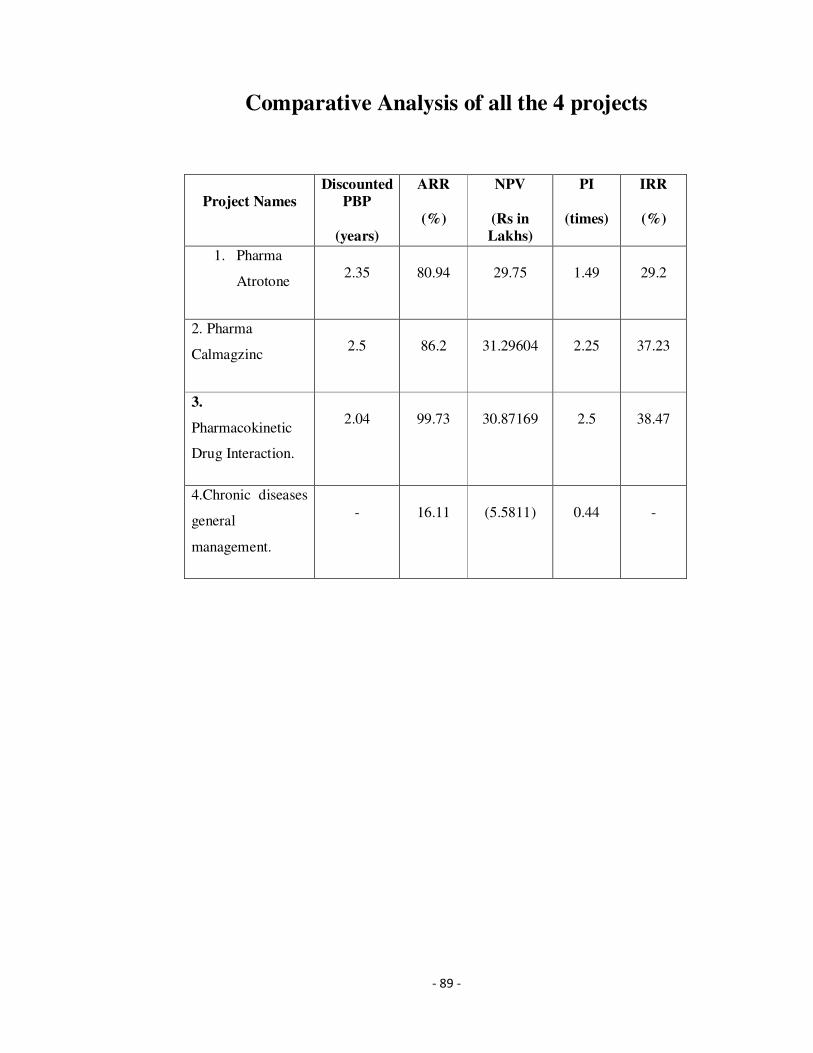
- 89 -
Comparative Analysis of all the 4 projects
Project Names
Discounted
PBP
(years)
ARR
(%)
NPV
(Rs in
Lakhs)
PI
(times)
IRR
(%)
1. Pharma
Atrotone
2.35
80.94
29.75
1.49
29.2
2. Pharma
Calmagzinc
2.5
86.2
31.29604
2.25
37.23
3.
Pharmacokinetic
Drug Interaction.
2.04
99.73
30.87169
2.5
38.47
4.Chronic diseases
general
management.
-
16.11
(5.5811)
0.44
-
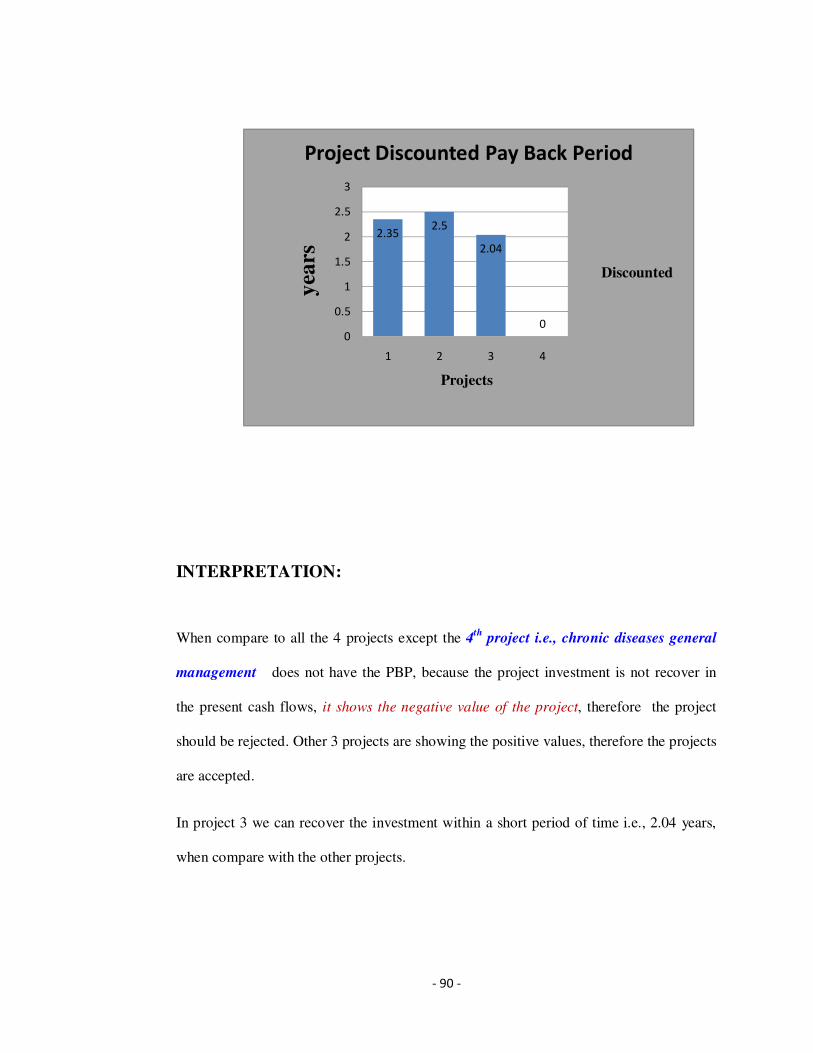
- 90 -
INTERPRETATION:
When compare to all the 4 projects except the 4th project i.e., chronic diseases general
management does not have the PBP, because the project investment is not recover in
the present cash flows, it shows the negative value of the project, therefore the project
should be rejected. Other 3 projects are showing the positive values, therefore the projects
are accepted.
In project 3 we can recover the investment within a short period of time i.e., 2.04 years,
when compare with the other projects.
2.352.5
2.04
00
0.5
1
1.5
2
2.5
3
1 2 3 4
Project Discounted Pay Back Period
Discounted
yea
rs
Projects
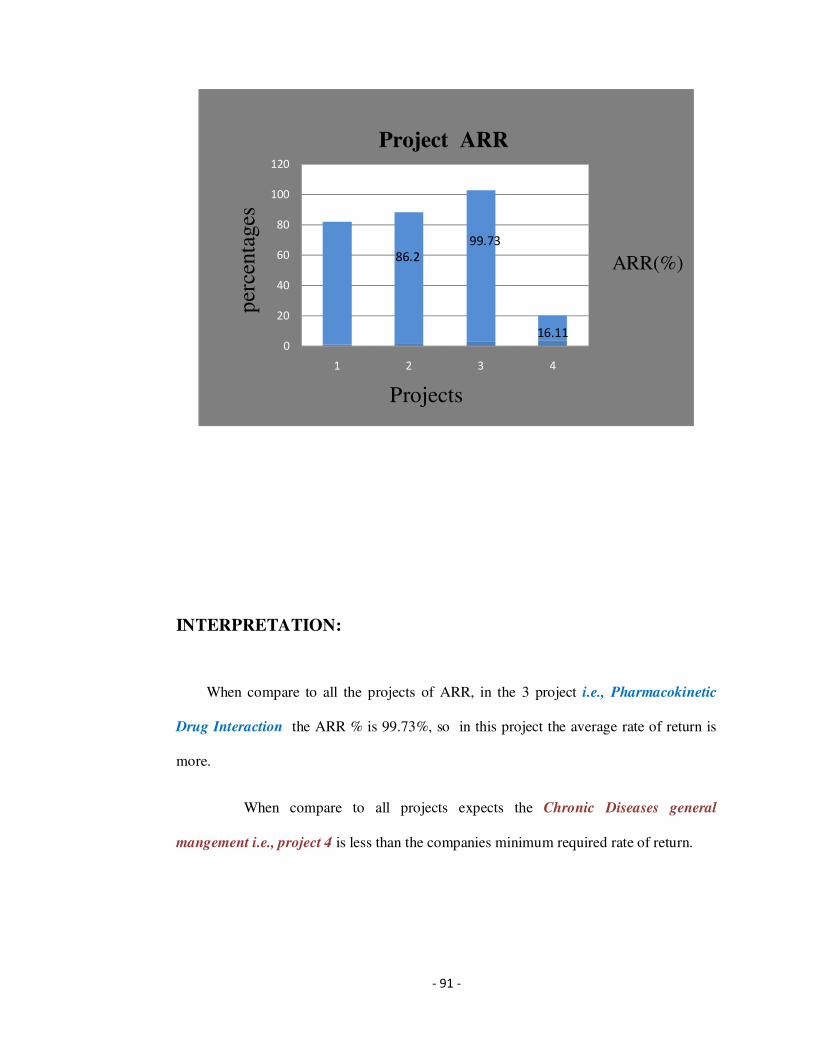
- 91 -
INTERPRETATION:
When compare to all the projects of ARR, in the 3 project i.e., Pharmacokinetic
Drug Interaction the ARR % is 99.73%, so in this project the average rate of return is
more.
When compare to all projects expects the Chronic Diseases general
mangement i.e., project 4 is less than the companies minimum required rate of return.
0
20
40
60
80
100
120
1 2 3 4
Project ARR
per
centa
ges
Projects
ARR(%)86.2
99.73
16.11
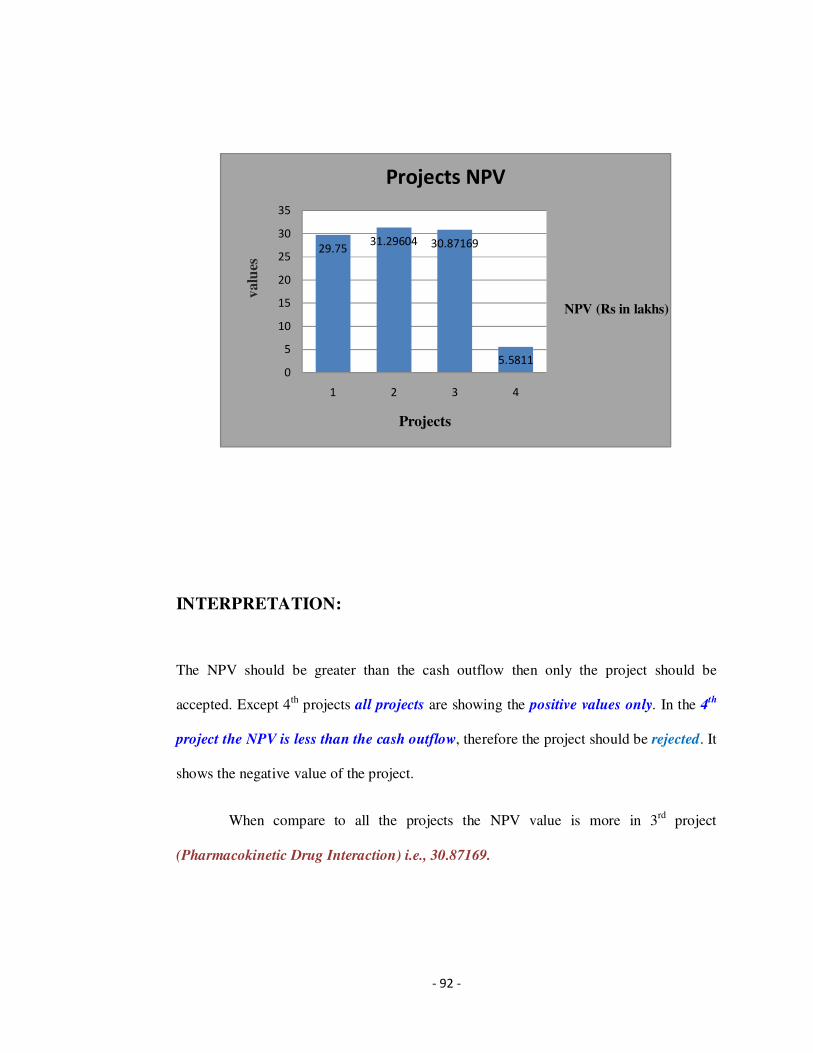
- 92 -
INTERPRETATION:
The NPV should be greater than the cash outflow then only the project should be
accepted. Except 4th projects all projects are showing the positive values only. In the 4th
project the NPV is less than the cash outflow, therefore the project should be rejected. It
shows the negative value of the project.
When compare to all the projects the NPV value is more in 3rd project
(Pharmacokinetic Drug Interaction) i.e., 30.87169.
29.7531.29604 30.87169
5.58110
5
10
15
20
25
30
35
1 2 3 4
Projects NPV
NPV (Rs in lakhs)
Projects
valu
es
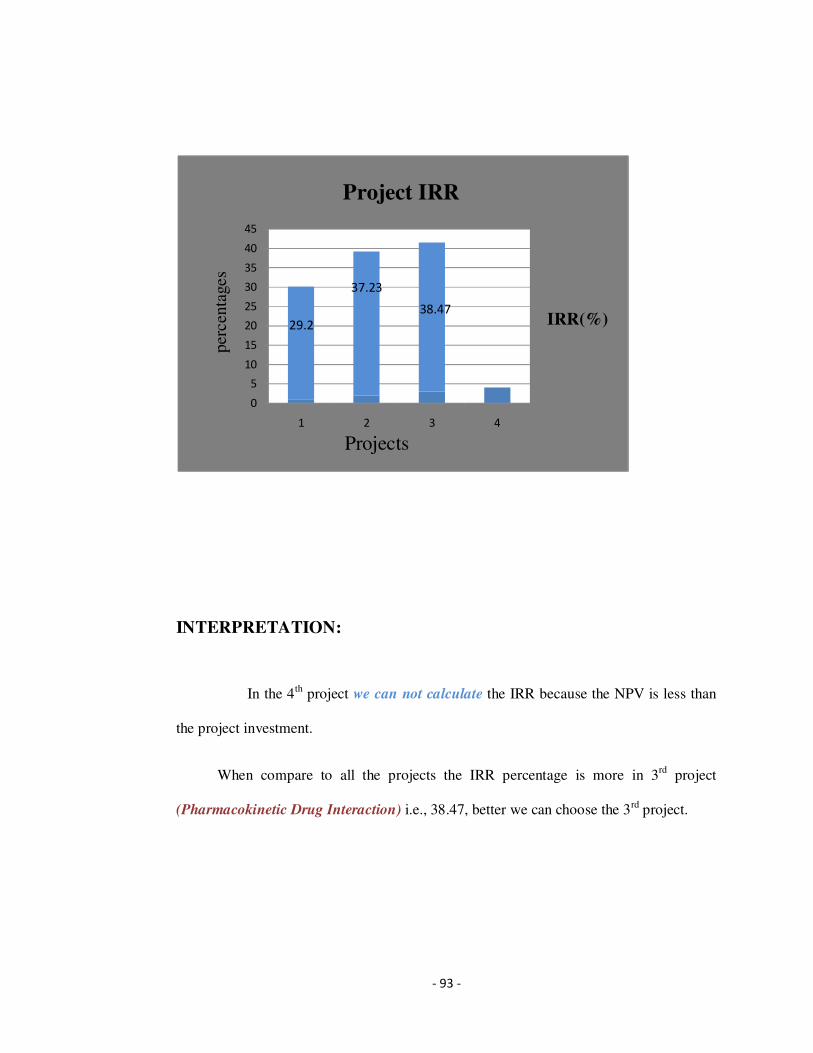
- 93 -
INTERPRETATION:
In the 4th project we can not calculate the IRR because the NPV is less than
the project investment.
When compare to all the projects the IRR percentage is more in 3rd project
(Pharmacokinetic Drug Interaction) i.e., 38.47, better we can choose the 3rd project.
0
5
10
15
20
25
30
35
40
45
1 2 3 4
Project IRR
IRR(%)
Projects
per
centa
ges
29.2
37.23
38.47
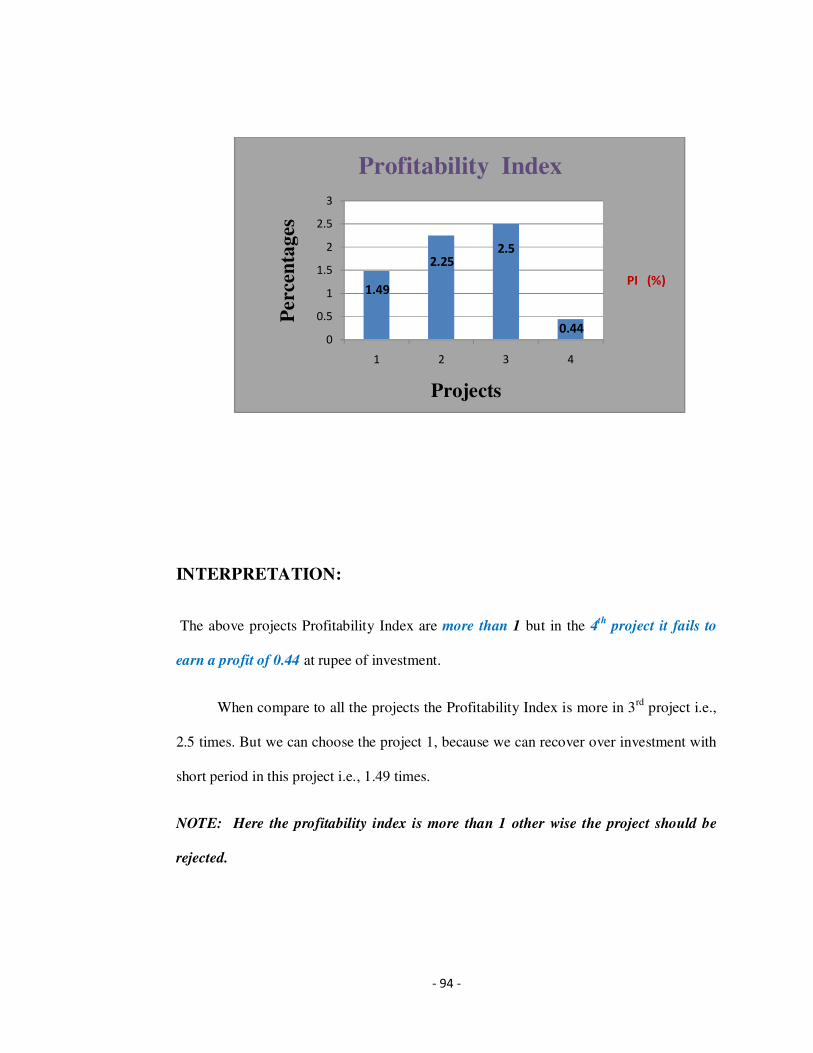
- 94 -
INTERPRETATION:
The above projects Profitability Index are more than 1 but in the 4th project it fails to
earn a profit of 0.44 at rupee of investment.
When compare to all the projects the Profitability Index is more in 3rd project i.e.,
2.5 times. But we can choose the project 1, because we can recover over investment with
short period in this project i.e., 1.49 times.
NOTE: Here the profitability index is more than 1 other wise the project should be
rejected.
0
0.5
1
1.5
2
2.5
3
1 2 3 4
PI (%)
Profitability Index
1.49
2.252.5
0.44
Projects
Perc
enta
ges

- 95 -
CHAPTER – 6
FINDINGS, SUGGESTIONS &
CONCLUSION
- 96 -
FINDINGS
The followings points were observed from the capital budgeting is as follows:
� The first project i.e., Pharma Atrotone is generating unequal cash flows for 5
years. The initial investment is Rs. 60 lakhs.
• The ARR is 80.94% which is greater than the company’s rate of
return.
• The discounted pay back period is 2.35 years.
• NPV and IRR are positive for the proposal.
• The Profitability Index (PI) is 1.49 > 1.
� Pharma Calmagzine for 1 stage crimping shops bldgs is experiencing the unequal
cash flows and the initial investment is Rs. 25 lakhs.
• The ARR is 86.2% more than required rate of return. Therefore,
accept on ARR basis (traditional method).
• NPV is positive for the project and the IRR > ARR.
• The discounted pay back period is 2.5 years.
• The Profitability of the project on every one rupee of its investment
is 2.25 times.
- 97 -
� The 3rd project is Pharmacoknetic Drug Interaction is also generating unequal
cash flows for 5 years. The initial investment is Rs. 20 lakhs.
• The ARR is 99.73% which is greater than the required rate of
return.
• The discounted pay back period is 2.04years.
• NPV and IRR are positive for the proposal.
• The Profitability Index (PI) is 2.5 times which is higher among all
projects. As its returns are high, the project is also risky.
� Chronic Diseases general mangement is the 4th project generating unequal cash
flows for 5 years. The initial investment is 10 lakhs. But in this the investment
will not recoverable in the project duration.
• The ARR is 16.11% which is less than the required rate of return.
• We cannot calculate the discount pay back period because in this
project the investment is not recoverable.
• NPV negative. If NPV negative then the project is not worthy or
in other words at present the company will not get profits if it
invest now.
• The Profitability Index (PI) is 0.4 which is less than 1 (0.4 < 1),
which is not good sign.
- 98 -
SUGGESTIONS AND RECOMMENDATIONS
Few of my suggestions are based on the results observed in four of the projects which
were as follows:
� In 1st project i.e., Pharma Atrotne is having a high Accounting Profit (ARR) no
80.94%, NPV, IRR and PI are also positive. This is risky project as its returns are
also high. Therefore, the project is accepted.
� Pharma Calmagzinc for 1 stage crimping shops bldgs is profitable in all contexts.
PBP, ARR, NPV, IRR and PI are positive. As it returns are positive, accept the
project.
� The 3rd project is Pharmacokinetic Drug Interaction is having a high Accounting
Profit (ARR) no 99.73% and remaining all techniques are positive, but this is a
risky project as its returns are high. Therefore, the project is accepted.
� Chronic Diseases General Management is not profitable project, it is generating
losses at present. Therefore the project is rejected.
- 99 -
CONCULSION
� When an organization is setting up a capital budgeting for the business, they are
planning for the outcome of the month. How involved the project budgeting is
individual will be depends on their investment decisions in a business.
� When making the capital budgeting decision, the financial manager effectively
analyzed the long term investment programmes, so that it will improve the
business over all.
� Many businesses ignore or forget the other half of the budgeting. Capital
budgeting are too often proposed, discussed and accepted. It can be used to
influence managerial action for long-term implications and affect the future
growth and profitability of the firm. Good management looks at what that
difference means to the business.
� Remember to keep the records that have been created. The company should have
capital budgeting records of the projects always on file, so that it gives the future
course of action for the investment proposal for long-term period.
� Organizations must make sure that, more attention should be paid upon the
investment proposal or course of action whose benefits are likely to be available
in future over the lifetime of the project, as the demand on resources is almost
always higher than the availability of resources.

- 100 -
BIBLIOGRAPHY

- 101 -
BIBLIOGRAPHY
Name of the books Authors Name
Financial Management I.M. Pandey (9th Edition)
Management Accounting M.Y. Khan, P.K. Jain
(2ndEdition)
Financial Management Prasanna Chandra
Financial Management
& Evgene. F. Brighan
Investment Analysis
Financial Management Dr. S.N. Maheshwari
Capital Budgeting Annual reports of Dr. Reddy’s
Lab

- 102 -
Websites:
www.google.com
www.drreddys.com
www.studyfinance.com
www.wikipedia.org/wiki/capital_budgeting
www.eximfm.com/training/capital budgeting.doc
http://educ.jmu.edu/~drakepp/principles/modules6/cbrisk.pdf