Embed Size (px)
Citation preview

A Simulation/Optimization Framework for
Locomotive Planning
Artyom Nahapetyan1, Ravindra Ahuja1, F. Zeynep Sargut1,Andy John2, and Kamalesh Somani2
1 Innovative Scheduling Inc.Gainesville Technology Enterprise Center (GTEC)
2153 SE Hawthorne Road, Suite 128Gainesville, FL 32641, USA
2 Locomotive Management - CSX Transportation3019 Warrington Street
Jacksonville, FL 32254, USA
Abstract. In this paper, we give an overview of the Locomotive Simu-later/Optimizer (LSO) decision support system developed by us for rail-roads. This software is designed to imitate locomotive movement acrossa rail network, and it simulates all four major components of the system;trains, locomotives, terminals, and shops in an integrated framework. Itincludes about 20 charts that allow evaluating system performance usingstandard measures. LSO can be used by locomotive management to per-form “)-1(what-if” analysis and evaluate system performance for differentinput data; it provides a safe environment for experimentation. We havetested the software on real data and output showed that the softwareclosely imitates day-to-day operations. We have also performed differ-ent scenario analysis, and reports illustrate that the software correctlyreflects input data changes.
1 Introduction
All US Class I railroads companies have a centralized group of managers respon-sible for assigning specific locomotives to specific trains around the clock, 365days per year. Each manager is responsible for trains originating in a particulargeographic region. A director presides over the managers and is responsible forthe entire system. Class I railroads typically have thousands of train origina-tions per day, and the managers must assign several thousands of locomotivesto those trains. Locomotive assignment consists of assigning sets of locomotivesto trains and developing routings for all locomotives while satisfying pullingpower requirements of all trains and maintenance and fueling requirements oflocomotives.
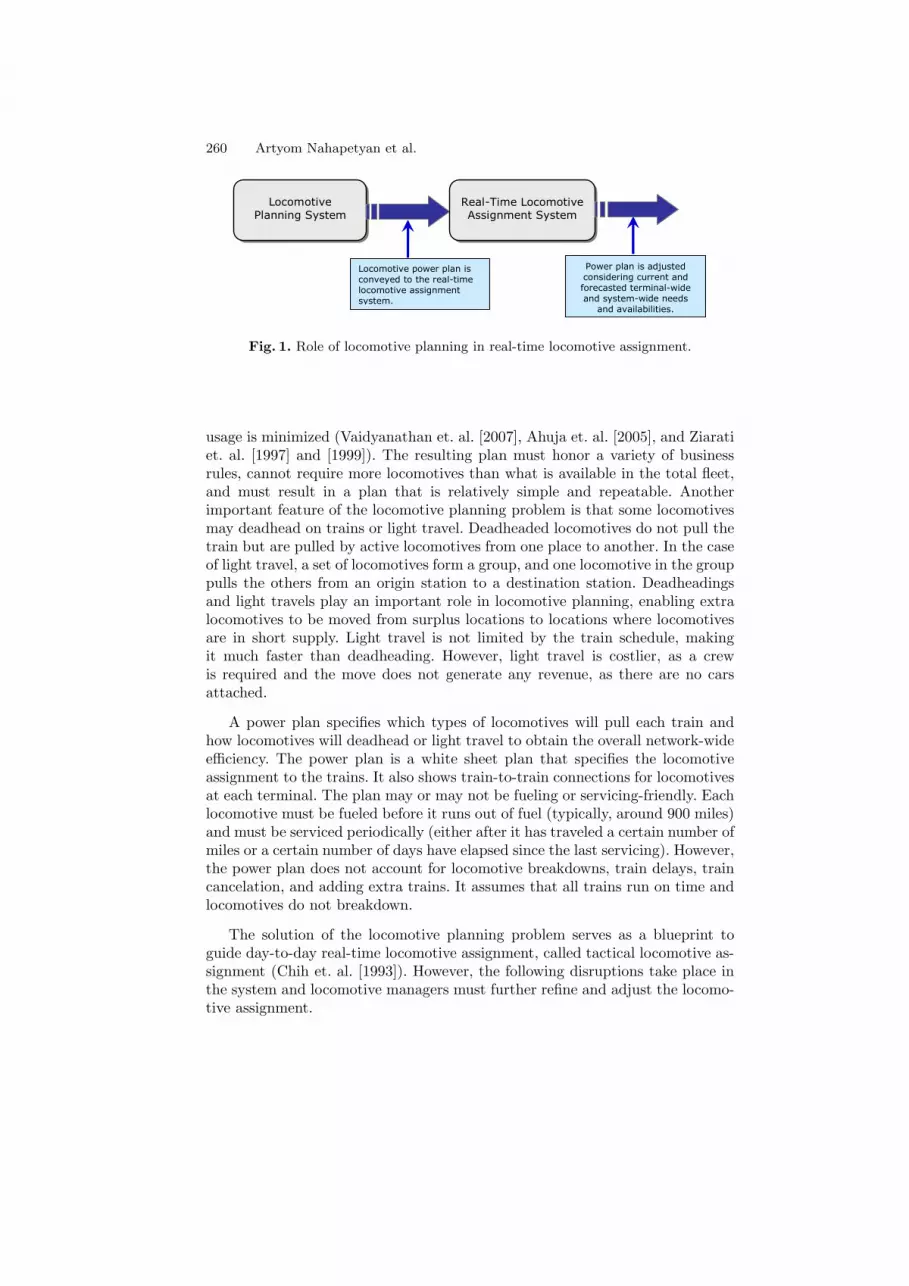
Many railroads use plan-based locomotive assignment as shown in Figure1. The locomotive planning problem assigns sets of locomotives to each trainin a preplanned weekly train schedule so that each train in the weekly trainschedule receives sufficient power to pull its load and the total cost of locomotive
ATMOS 2007 (p.259-276)7th Workshop on Algorithmic Approaches for Transportation Modeling, Optimization, and Systemshttp://drops.dagstuhl.de/opus/volltexte/2007/1182
260 Artyom Nahapetyan et al.
Locomotive Planning System
Real-Time Locomotive Assignment System
Locomotive power plan is conveyed to the real-time locomotive assignment system.
Power plan is adjusted considering current and forecasted terminal-wide and system-wide needs and availabilities.
Fig. 1. Role of locomotive planning in real-time locomotive assignment.
usage is minimized (Vaidyanathan et. al. [2007], Ahuja et. al. [2005], and Ziaratiet. al. [1997] and [1999]). The resulting plan must honor a variety of businessrules, cannot require more locomotives than what is available in the total fleet,and must result in a plan that is relatively simple and repeatable. Anotherimportant feature of the locomotive planning problem is that some locomotivesmay deadhead on trains or light travel. Deadheaded locomotives do not pull thetrain but are pulled by active locomotives from one place to another. In the caseof light travel, a set of locomotives form a group, and one locomotive in the grouppulls the others from an origin station to a destination station. Deadheadingsand light travels play an important role in locomotive planning, enabling extralocomotives to be moved from surplus locations to locations where locomotivesare in short supply. Light travel is not limited by the train schedule, makingit much faster than deadheading. However, light travel is costlier, as a crewis required and the move does not generate any revenue, as there are no carsattached.
A power plan specifies which types of locomotives will pull each train andhow locomotives will deadhead or light travel to obtain the overall network-wideefficiency. The power plan is a white sheet plan that specifies the locomotiveassignment to the trains. It also shows train-to-train connections for locomotivesat each terminal. The plan may or may not be fueling or servicing-friendly. Eachlocomotive must be fueled before it runs out of fuel (typically, around 900 miles)and must be serviced periodically (either after it has traveled a certain number ofmiles or a certain number of days have elapsed since the last servicing). However,the power plan does not account for locomotive breakdowns, train delays, traincancelation, and adding extra trains. It assumes that all trains run on time andlocomotives do not breakdown.
The solution of the locomotive planning problem serves as a blueprint toguide day-to-day real-time locomotive assignment, called tactical locomotive as-signment (Chih et. al. [1993]). However, the following disruptions take place inthe system and locomotive managers must further refine and adjust the locomo-tive assignment.

A Simulation/Optimization Framework for Locomotive Planning 261
– If a locomotive is due for a regular maintenance, then managers cannot assignit to a train that takes it too far from a shop, as it cannot return before itsmaintenance-due date.
– Locomotives also break down, and managers must substitute them.– While generating a locomotive plan, we assume that all trains run on time.
However, trains are often delayed and sometimes are canceled altogether. Asa result, terminals might not have enough locomotives to depart outboundtrains.
– There are usually unanticipated, unscheduled trains that require locomotivesnot listed in the blueprint.
– Other unplanned events that frequently occur and must be immediatelyaddressed as the data is communicated to the locomotive managers includetrain derailments, out-of-fuel locomotives, crew no-shows, severe weather,and holding outbound trains to capture priority shipments.
The decision problem faced by locomotive managers is how to change the planwith minimum disruption to the field operations while minimizing the impacton locomotive-related costs. As the operations unfold across the network, thelocomotive managers must assess each piece of new data and determine how theircurrent plan should be adjusted and locomotives be assigned to the outboundtrains. The managers constantly monitor and adjust daily tactical plans to ensureefficient use of resources while maximizing the on-time operations and protectingthe fluidity of the network.
In this paper, we discuss Locomotive Simulater/Optimizer decision supportsystem, which we henceforth refer to as LSO. This decision support system simu-lates the movement of locomotives across a railroad network. It simulates a real-life environment in which travel times are random variables, locomotives visitshops for quarterly maintenances, and locomotives break down and go to shopsfor repairs. LSO simulates all of the four major resources involved in locomotiveassignment: locomotives, trains, terminals, and shops. It uses the logic similar tothat used by locomotive managers and directors to assign locomotives to trains:it uses historical train data to model train delays, historical locomotive data tomodel locomotive breakdowns, and historical data of shops to model repair andmaintenance of locomotives at shops. LSO keeps track of the status, inventory,and detailed plans for individual trains by ID and date, individual locomotives,and individual terminals. As time progresses, LSO collects detailed statistics forlocomotives, trains, terminals, and shops. It simulates several months of loco-motive assignment in a matter of minutes. After several runs of simulation havebeen performed, it summarizes the results of these simulation runs and printsvarious reports and charts.
LSO is an invaluable tool for railroad locomotive management division tomake numerous planning and strategic decisions related to locomotive opera-tions. The ultimate goal of locomotive management is to achieve high levels oflocomotive productivity and reliable train operations at the lowest possible cost.To achieve this objective, locomotive management must understand (i) the im-pact of strategy changes on system performance, (ii) where to focus efforts in
262 Artyom Nahapetyan et al.
improving efficiency and effectiveness, (iii) how many resources are required for agiven level of system performance, and (iv) how to prepare for and recover fromrandom disruptions. LSO can assist locomotive management in making thesedecisions. Specifically, it allows testing the efficacy and robustness of the locomo-tive planning and real-time locomotive assignment systems by simulating a nearreal-life environment. LSO also enables senior executives, locomotive directors,and locomotive managers to test various management policies, priorities, busi-ness rules, and “what-if” strategic questions such as fleet sizing, shop closures,and on-time train performance. The simulation system will show the locomo-tive director or locomotive managers the downstream implications of changingthe system’s recommendation in terms of operating cost, train delay, locomotiveutilization, consist busting, missed repair commitments, mismatched power, etc.It will also assist locomotive departments in testing service design plans beforeaccepting them and publishing them to the rest of the organization. Indeed, LSOprovides a safe environment for experimentation before implementation.
Locomotive operation divisions usually use the following measures to evaluateoverall performance of the locomotive assignment procedure, and LSO has about20 reports and charts that address those measures and allow users to analyzethe effect of any strategic changes from different perspectives.
– Origination performance: The percentage of trains departing on time fromtheir origins per day.
– Arrival performance: The percentage of trains arriving at their destinationson time per day.
– Dwell time of locomotives: The amount of time a locomotive spends at aterminal or shop.
– Out-of-service (OOS) rate: The percentage of locomotives that cannot beassigned to a train due to breakdowns or maintenance.
– Setbacks trains: Percentage of trains held for power (or delayed) in a day.– Setbacks hours: Average delay time of trains due to insufficient power.– Consist power plan compliance: Percentage of trains departing with a set of
locomotives specified in the power plan.– Locomotive utilization: Percentage of time a locomotive actively pulls trains,
deadheading or light traveling per day.
2 LSO Components and their Relationship
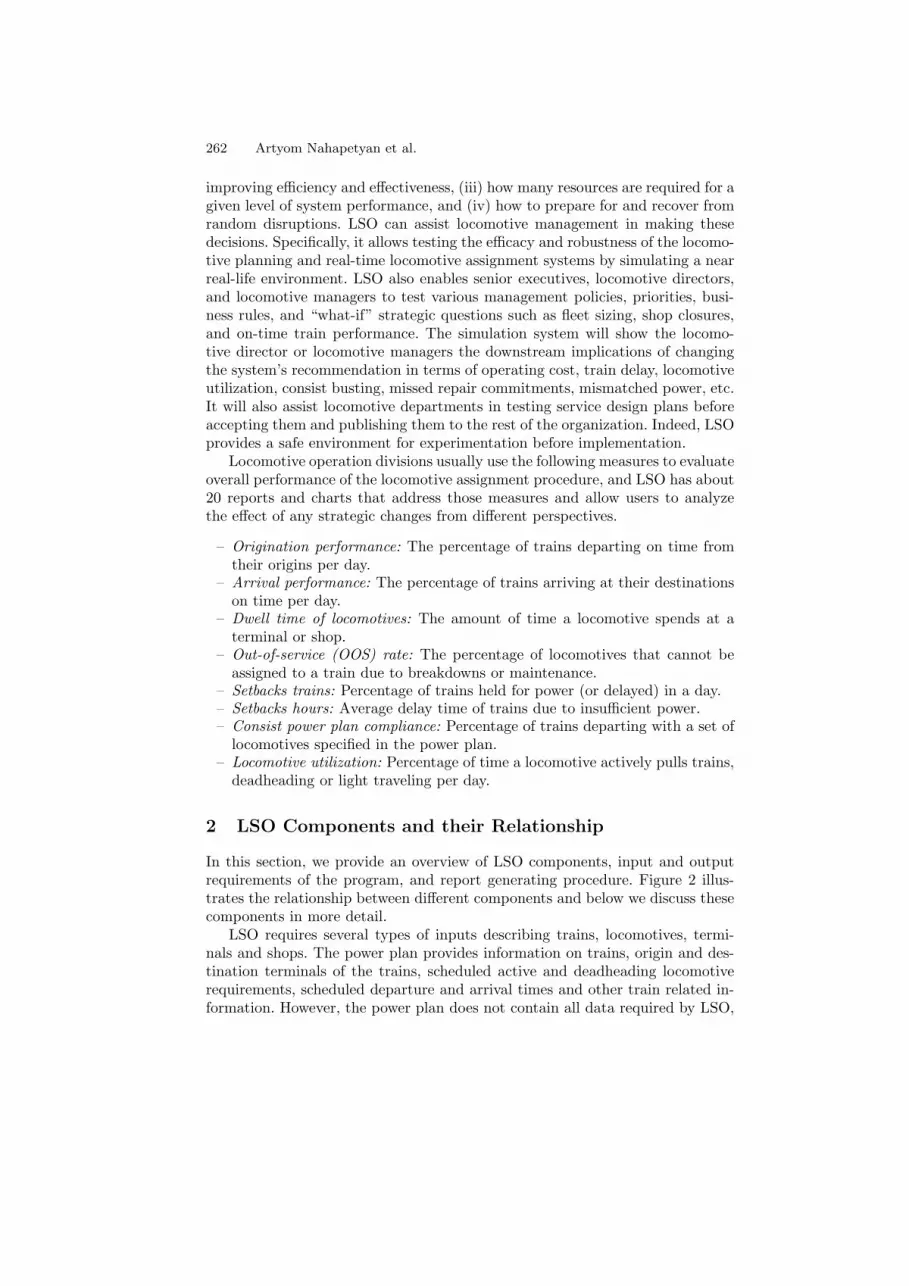
In this section, we provide an overview of LSO components, input and outputrequirements of the program, and report generating procedure. Figure 2 illus-trates the relationship between different components and below we discuss thesecomponents in more detail.
LSO requires several types of inputs describing trains, locomotives, termi-nals and shops. The power plan provides information on trains, origin and des-tination terminals of the trains, scheduled active and deadheading locomotiverequirements, scheduled departure and arrival times and other train related in-formation. However, the power plan does not contain all data required by LSO,
A Simulation/Optimization Framework for Locomotive Planning 263
Railroad
Information System
Input
Data Bridge
Core
Simulation Engine
Errors
Input
Sanity
Checking Routine
Parameters
Simulation Parameters
Railroad
Inputs Simulation
Inputs
Simulation
Parameters
Reports
& Charts
Output
Data Bridge
Railroad
Outputs
Fig. 2. Overview of LSO components.
and additional data such as properties of locomotive classes and their fleet size,description of the consist types used in the simulation, train consist priorities,probability of sending a locomotive to a shop from a specified terminal, histori-cal travel time of trains, terminal processing distribution, locomotive breakdownrates, etc., is supplied using Excel spreadsheets or Access databases. Using theinputs, LSO performs sanity checking and transforms the data into a formatconsistent with tables of LSO input database. If during this process the softwarefinds errors in the provided data then it writes corresponding massages into alog file.
After populating tables of the LSO input database, a user can specify sim-ulation parameters and start the simulation. In the beginning, LSO sets up theinitial state of the simulation and then executes events from the event list. Theevents imitate all activities, e.g., train arrivals and departures, locomotive fail-ures, consist busting and terminal processing, consist assignment, locomotivelight moves, shop repair procedure, etc., and record statistical data into corre-sponding tables in the LSO output database. During the simulation process, themodule also records all events in a log file for debugging purpose.
Based on the output data, the LSO creates reports describing the overallperformance of the system. Specifically, it retrieves data from the LSO outputdatabase, performs statistical analysis, and displays reports in Excel spread-sheets in the form of tables and charts. The current version of the engine gener-ates about 20 reports describing train arrival and departure performance, per-centage of delayed trains and average delay hours for each terminal, power plancompliance, out-of-service rate, events taking place at a specific terminal at aspecific week, details on inventory level of the selected terminal at each sim-ulation day, statistics on shop queue and repair time, details on light movesperformed between terminals, etc.

264 Artyom Nahapetyan et al.
3 Overview of Simulation Engine
Locomotive operations require the interplay of the following major resources:trains, locomotives, shops, and terminals. Figure 3 gives an overview for LSO,and its details are discussed next.
Train Events Locomotive Events
Event Generator
Decision Engines
Train Arrival Module
Shop Routing Module
Light Travel Module
Initial State
- Trains
- Terminals
- Locomotives - Shops
Reports,
Charts & Analysis
Loco Simulation
Decision Support System
Shop Events
Train Departure Module
Terminal Events
Fig. 3. Overview of LSO algorithmic logic.
We define the state of a system to be the collection of state variables associ-ated with its entities. An event is an instantaneous occurrence that may changesome state variables of the system. In the beginning of the simulation, LSO ispopulated (or seeded) with the current status of the trains, locomotives, termi-nals, and shops, which constitute the initial state variables. As events take placewith respect to the four entities, trains, locomotives, terminals, and shops, thestate of the system will change. The simulation engine generates train events ac-cording to the train schedule, locomotive events from the historical data of thelocomotives, and shop events from the historical data of shops. LSO employsdecision engines to assign locomotives to trains, route failed locomotives to theshops, and simulate light travels. It utilizes the locomotive plan as an input thatcould be generated either manually or using the optimal locomotive plan. As thesimulation runs, the engine collects detailed statistics for locomotives, trains,stations, and shops and prints various reports and charts. LSO keeps track ofthe status, inventory, and detailed plans for individual trains and locomotivesby ID, type and date, individual shops and terminals. The system runs on one-minute time increments and simulates trains being ordered, departed, operated
A Simulation/Optimization Framework for Locomotive Planning 265
over the line of road, and arriving at a destination. Each individual train is mod-eled deterministically. It is assumed that a particular train occurrence is readyto run at the stipulated time and takes the stipulated time to cross the line ofroad and arrive at the destination. If locomotives are available and ready by thescheduled departure time of the train, no locomotive delay is attributed to thattrain, even if it runs later than scheduled. If locomotives are not ready at thetime the train is ready, locomotive delay is calculated from the ready time untilthe train gets locomotives and departs the terminal according to the simulation.The system simulates locomotive breakdowns and the repairs of locomotives atshops. The locomotive simulation assigns locomotives to trains and repositionlocomotives via light engine moves.
The length of the simulation period is an input of the system, and the systemis designed to simulate pre-specified months of normal operations. Specifically,user can enter the start and end dates and time of the simulation and then run thesimulation for the specified time horizon. Users may want to repeatedly simulatethe specified time horizon to collect sufficient observations to see system-averageresults over an extended period of time. The simulation is provided with a fleetof locomotives that can be assigned to the trains. We realize that given theinitial state of the system, it requires some warm-up time to reach a steadystate before any observations can be taken. We thus need to account for somewarm-up period in the simulation, and when determining statistics, we shouldignore the data for the warm-up period.
4 Main Simulation Modules and Engines
In this section, we discuss main modules that are necessary to run LSO. We firstdescribe the initial state setup and then engines used in the simulation; subse-quent subsections provide a short description of the corresponding componentsand their functionality.
4.1 Initial State of LSO
Before proceeding to the simulation, LSO creates locomotive, train, terminal,and shop entities and initializes the state of the system and counters. We nextdiscuss each of these procedures in detail.
Entity Construction.
– Locomotives: LSO creates a certain number of locomotive entities accordingto the locomotive class fleet size. Each entity has different attributes describ-ing the locomotive ID, type, class, horsepower, axel count, manufacturer,average time between breakdowns, and other features of the locomotive.
– Terminals: LSO considers all origin and destination terminals of the trainsand creates corresponding entities. Each entity has attributes describing ter-minal ID and terminal processing and consist busting time distributions.

266 Artyom Nahapetyan et al.
– Trains: LSO creates a train entity for each train described in the train runtable. The attributes of the train describe the train ID, type, priority, ton-nage, origin and destination terminals, scheduled departure day and time,list of preferred and accepted consists, planned deadheading locomotives,travel time distribution, and other features of the train.
– Shops: LSO creates shop entities according to their location. Each shophas attributes describing the shop ID, type, number of spots, service timedistribution, and other features.
Initial State Setup.
– Locomotive Initial Location: LSO takes a snapshot of the power plan at aspecific time, e.g., Sunday midnight, and distributes the pool of availablelocomotives among terminals. Specifically, for all trains that are on the wayto their destination terminal it creates corresponding consists described inthe power plan, assigns them to those trains and triggers train arrival eventsfor the trains at appropriate times. Next it looks at the power plan to countthe number of consists at each terminal at the time of the snapshot. Theseconsists constitute the initial inventory at terminals. Finally, it randomlydistributes the remaining locomotives, if any, among terminals that haveshops.
– Populate List of Events: LSO maintains a list of events, which is sortedaccording to the time they should occur. Some events, e.g., tactical reposi-tioning events, should be triggered at certain points of the planning horizon,and others, e.g., train arrival events, are triggered by other events duringthe simulation. Before proceeding to the simulation, LSO populates the listby the following known events.
• Train departures• Train arrivals• Tactical repositionings• Locomotive Q-maintenances and breakdowns• Consist assignments
– Initialize Simulation Counters: LSO assigns initial values for all countersused in the simulation.
4.2 Main Modules of LSO
Train Arrival Module: Depending on the condition of active and deadhead-ing locomotives, train arrivals require different actions at the terminal. If nolocomotive in a consist fails upon arrival, then the consist can be assigned to anoutbound train. However, if at least one of the locomotives fails, the consist mustbe busted, the failed locomotives are sent to shops, and remaining locomotivesand consists can be used to pull other trains. Before a consist is assigned to anoutbound train, it also should go through certain terminal activities, which werefer to as terminal processing.

A Simulation/Optimization Framework for Locomotive Planning 267
LSO imitates locomotive breakdowns using certain locomotive failure rates.Locomotive Q-maintenance and Breakdown module assigns a “red” status tofailed locomotives and locomotives that are due for quarterly maintenance. TrainArrival module checks active and deadheading consists of the train up on arrival.If one of the locomotives in the consist fails, the module creates a consist bust-ing event, which will bust the consist and process failed and good locomotivesseparately, i.e., route failed locomotives to shops and send good locomotives toterminal processing. The time it takes to bust a consist can either be a randomnumber generated from a pre-specified distribution or a fixed time interval. If ar-riving locomotives do not have “red” status, then we imitate terminal processingof locomotives, i.e., main track, main line fueling, truck fueling, or servicing. Ter-minal processing takes a random amount of time generated from a pre-specifieddistribution. After terminal processing, locomotives are ready for train assign-ments, and they are stored at the terminal.
Consist Assignment Module: Consist assignment of outbound trains is per-formed by locomotive managers based on the availability of the preferred consist,availability of accepted consists, consist busting time, and priorities of the out-bound trains. Specifically, in the locomotive shortage environment, locomotivemanagers prefer assigning available locomotives to trains with higher priority.However, if a lower-priority train has been delayed for a certain time, then theytry to find a consist to depart the train. Train on-time departure also dependson the availability of the consist given in the power plan, and locomotive man-agers might delay the train for a certain time if the consist is not available.Mangers continuously monitor consist availability at terminals (i.e., consist in-ventory, arriving consists, and consist failure) and adjust consist assignment ofthe departing trains.
Consist Assignment module analyzes the locomotive availability at the termi-nal. Specifically, it considers all currently available locomotives and locomotivesthat have already departed on trains and will arrive at the terminal during acertain time horizon. Using collected data, the module tries to find a proper con-sist for selected trains. During this assignment process, it also takes into accounta user-specified amount of time a train can be delayed to assign the preferredconsist, i.e., the consist specified by power plan. If a proper consist has not beenfound for the train, the module considers the consist busting option, i.e., triesto create a consist from available locomotives. If a consist has been assignedto a train before its scheduled departure time, then the train departs on time;otherwise, the train is delayed until a proper consist is assigned to the train byfollowing runs of Consist Assignment module. The module also handles plannedlocomotive deadheading and light moves. Specifically, if a train has such require-ments, then module tries to assign those locomotives to the train. If the numberof available locomotives is insufficient, then the module departs the train on timewith the available set of locomotives.

268 Artyom Nahapetyan et al.
Train Departure Module: On-time departure of trains depends on the avail-ability of proper consists, and ideally each departing train should have a properconsist assignment prior to the scheduled departure time. However, if there arenot enough locomotives available to power all outbound trains, locomotive man-agers assign available consists to higher-priority trains and delay lower-prioritytrains. The managers usually make consist assignment decisions in advance, andat the scheduled departure time trains either have a consist to depart or theyshould be delayed.
Tactical Repositioning Module: During the real-time locomotive assignmentprocedure, locomotive imbalances at terminals are created; that is, some termi-nals may have surplus locomotives while other terminals may face locomotivedeficits. These imbalances are created due to various reasons including surplusand deficit locations designed in the power plan, locomotive breakdowns, whichcreate surpluses at shops and deficits at other terminals, train annulments, sec-ond section of trains, violation of power plan consist assignments, variance intrain travel times. etc. Locomotive managers employ unscheduled deadheadingand light travel options to move locomotives from surplus terminals to deficitterminals to restore locomotive balance in the network.
Since LSO imitates the real-time locomotive assignment process, it createslocomotive imbalance at terminals as well. Specifically, if there is an imbalancebetween the number of inbound and outbound locomotives at a terminal, thenthe terminal either accumulates certain types of locomotives or encounters ashortage of locomotives. Tactical Repositioning module looks ahead to analyzethe inventory level for a user-specified time horizon (from several hours to sev-eral days) and determines the surplus and deficit terminals. During this process,it imitates assignment of inbound locomotives to outbound trains using a logicsimilar to the Consist Assignment module. If a terminal has a shortage of loco-motives, LSO computes the demand of the terminal for each locomotive type.After identifying surplus and deficit locations as well as supply/demand of ter-minals, the module tries to satisfy the demand of deficit terminals by surplusesat surplus locations by solving a multicommodity network flow problem (Ahujaet. al. [1993]). Since speed is of critical issue in simulation, we solve the multi-commodity problem heuristically. The solution of this problem yields the tacticalrepositionings necessary to meet the demand.
Locomotive Q-Maintenance and Breakdown Module: Class I railroadsoperate thousands of locomotives, and each day some of them break down dueto mechanical or weather-related reasons. In the simulation, we assume thatlocomotives can fail whether they are active, i.e., pulling a train, or inactive,i.e., deadheading or waiting at a terminal. The locomotive failure rate describesthe number of times a locomotive class breaks down during a year, and it is aninput of the simulation. Although locomotive failures can occur on the way tothe destination terminal, locomotive managers can route a locomotive to a shoponly when the train arrives at its destination terminal.

A Simulation/Optimization Framework for Locomotive Planning 269
According to FRA requirements, each locomotive must undergo preemptivemaintenance at some designated shop on or before 92 days have elapsed sinceits last maintenance. Otherwise, the locomotive must be shut down and movedas a deadhead. This maintenance is also known as a quarterly maintenance orQ-maintenance. When the due date of the Q-maintenance is near (within 4-5days), locomotive managers try to assign the locomotive to a train that departsto one of the shops. Depending on the manufacturer of the locomotive, it shouldbe sent to an appropriate shop.
Shop Processing Module: Locomotive assignment to a shop is performedby locomotive managers based on (i) the type of repair it requires, (ii) traveltime to the shops, and (iii) the number of locomotives at the shops. Differentshops have different number of spots to perform repairs; therefore, the capacityand output rates of shops are different. Some shops maintain different spots forbroken locomotives and locomotives that are due for Q-maintenance. If the shopis congested, locomotives wait in a queue upon arrival.
In the simulation, we assume two types of repairs: breakdowns and Q–maintenance. After arriving at a shop, a locomotive should wait in the cor-responding queue to be processed. If the locomotive is due for Q-maintenance,then the module adds the locomotive at the end of the Q-maintenance queue.Otherwise, the locomotive joins the queue of broken locomotives. Both queuesare simulated according to first-in-first-out logic. In the simulation, we alloweach shop to maintain three types of spots, i.e., spots for broken locomotives,spots for Q-maintenance, and spots that can perform both repairs. When a spotis ready to seize the next repair request, this module checks the type of thespot and proceeds according to one of the following two cases: (i) the spot canperform only one of the repairs, and (ii) the spot can perform both repairs.After finishing the repair, the locomotive leaves the shop, goes through terminalprocessing, and joins the locomotive inventory at this terminal. In addition, themodule triggers the next Q-maintenance and breakdown events if necessary.
5 LSO Reports and Charts
During the simulation process, LSO records statistical data into output tables ofits database, and based on the collected data constructs various charts and tablesdescribing overall performance of the system. Current version of the softwaregenerates about 20 charts and tables using Excel spreadsheets, and in this sectionwe provide an overview of most important reports.
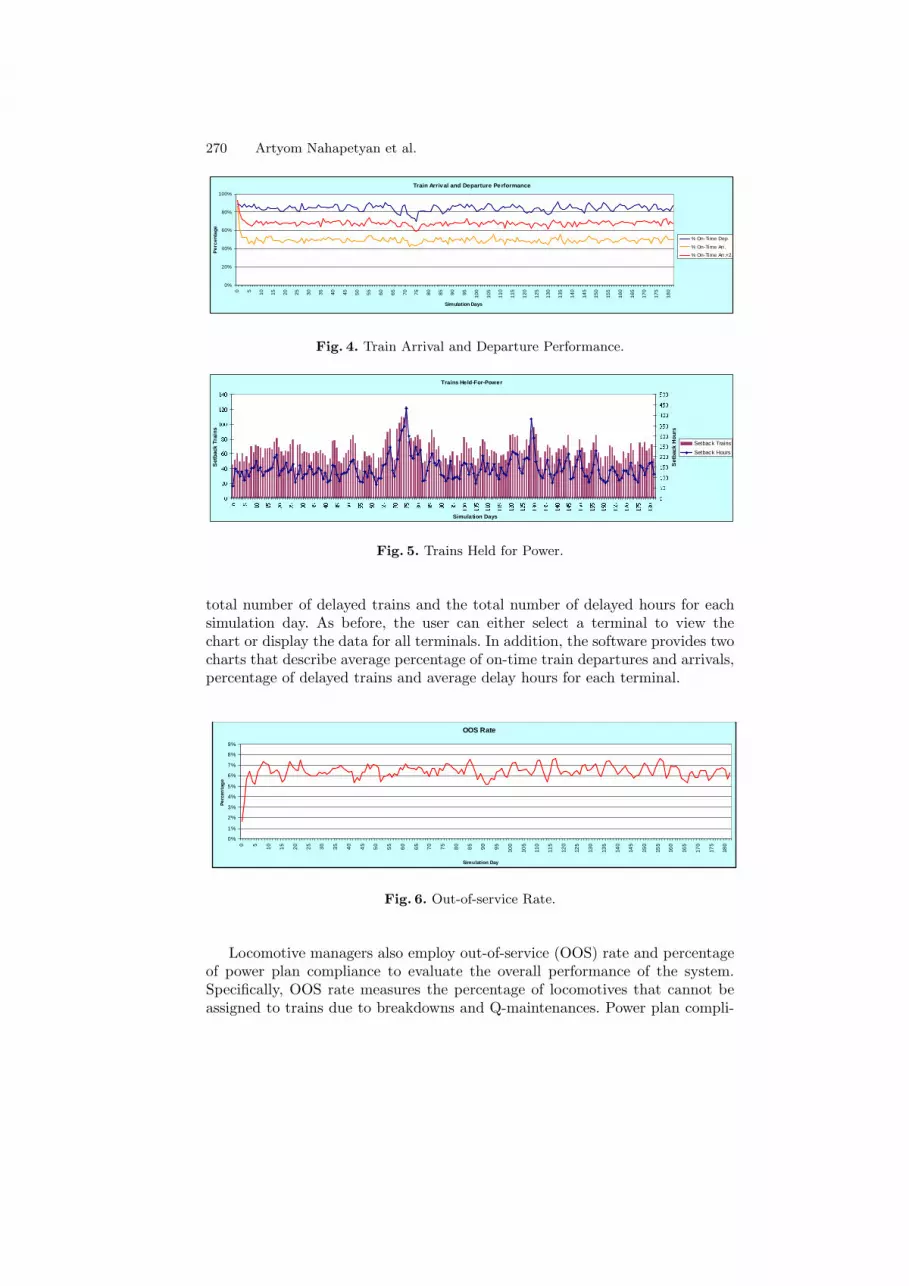
The train on-time performance is one of the most important statistics, andLSO provides several charts that allow analyzing the train on-time performancefrom different perspectives. The chart in Figure 4 describes the percentage ofon-time train departures and arrivals for each day of the simulation. A user caneither specify a terminal for which he/she would like to draw the chart or viewthe chart for all terminals. In the later case, we compute and display the averagepercentage over all terminals. Figure 5 describes another chart that shows the
270 Artyom Nahapetyan et al.
Train Arriv al and Departure Pe rformance
0%
20%
40%
60%
80%
100%
0 5
10
15
20
25
30
35
40
45
50
55
60
65
70
75
80
85
90
95
10
0
10
5
11
0
11
5
12
0
12
5
13
0
13
5
14
0
14
5
15
0
15
5
16
0
16
5
17
0
17
5
18
0
Simulation Days
Per
cent
age
% On-Time Dep.
% On-Time Arr.
% On-Time Arr.+2
Fig. 4. Train Arrival and Departure Performance.
Trains Held-For-Power
�� �� �� �� �� � �� � �� � �� � �� �� � � � � �� �� �� �� �� �� � � �� �� �� �� ��� ��� ��� ��� �� �� �� �� ��� ��� ��� ��� ��� ��� � � � � ���
Simulation Days
Set
back
Tra
ins �� �� � �� � �� � �� � �� � �� � �� � �� � �� � �
Set
back
Hou
rs
Setback Trains
Setback Hours
Fig. 5. Trains Held for Power.
total number of delayed trains and the total number of delayed hours for eachsimulation day. As before, the user can either select a terminal to view thechart or display the data for all terminals. In addition, the software provides twocharts that describe average percentage of on-time train departures and arrivals,percentage of delayed trains and average delay hours for each terminal.
OOS Rate
0%
1%
2%
3%
4%
5%
6%
7%
8%
9%
0 5
10
15
20
25
30
35
40
45
50
55
60
65
70
75
80
85
90
95
100
105
110
115
120
125
130
135
140
145
150
155
160
165
170
175
180
Simulation Day
Pe
rcen
tag
e
Fig. 6. Out-of-service Rate.
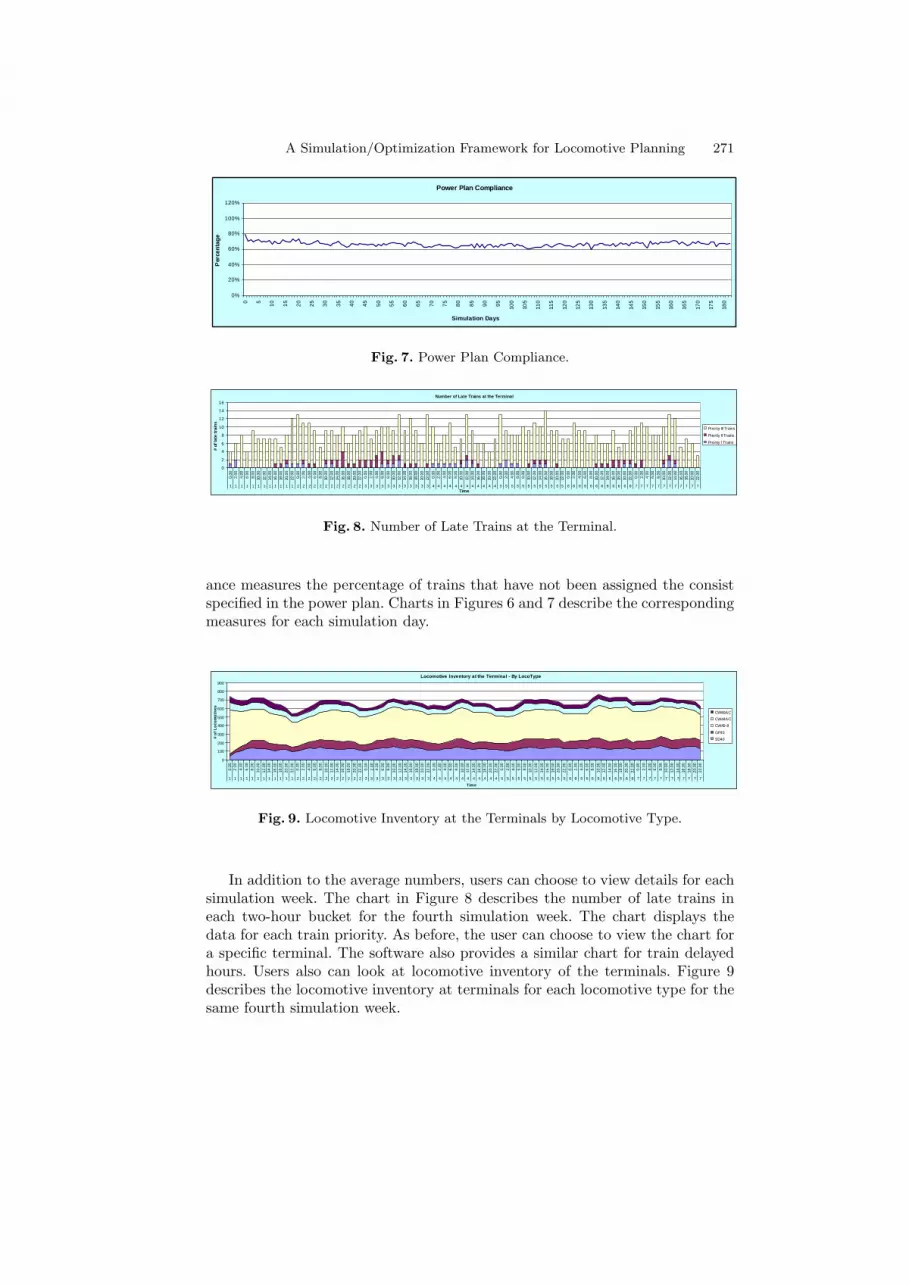
Locomotive managers also employ out-of-service (OOS) rate and percentageof power plan compliance to evaluate the overall performance of the system.Specifically, OOS rate measures the percentage of locomotives that cannot beassigned to trains due to breakdowns and Q-maintenances. Power plan compli-
A Simulation/Optimization Framework for Locomotive Planning 271
Power Plan Compliance
0%
20%
40%
60%
80%
100%
120%
0 5
10
15
20
25
30
35
40
45
50
55
60
65
70
75
80
85
90
95
100
105
110
115
120
125
130
135
140
145
150
155
160
165
170
175
180
Simulation Days
Per
cen
tag
e
Fig. 7. Power Plan Compliance.
Number of Late Trains at the Terminal
0
2
4
6
8
10
12
14
16
0.00
2.00
4.00
6.00
8.00
10.0
0
12.0
014
.00
16.0
018
.00
20.0
022
.00
0.00
2.00
4.00
6.00
8.00
10.0
0
12.0
014
.00
16.0
018
.00
20.0
022
.00
0.00
2.00
4.00
6.00
8.00
10.0
012
.00
14.0
0
16.0
018
.00
20.0
022
.00
0.00
2.00
4.00
6.00
8.00
10.0
0
12.0
014
.00
16.0
018
.00
20.0
022
.00
0.00
2.00
4.00
6.00
8.00
10.0
0
12.0
014
.00
16.0
018
.00
20.0
022
.00
0.00
2.00
4.00
6.00
8.00
10.0
012
.00
14.0
0
16.0
018
.00
20.0
022
.00
0.00
2.00
4.00
6.00
8.00
10.0
0
12.0
014
.00
16.0
018
.00
20.0
022
.00
1 1 1 1 1 1 1 1 1 1 1 1 2 2 2 2 2 2 2 2 2 2 2 2 3 3 3 3 3 3 3 3 3 3 3 3 4 4 4 4 4 4 4 4 4 4 4 4 5 5 5 5 5 5 5 5 5 5 5 5 6 6 6 6 6 6 6 6 6 6 6 6 7 7 7 7 7 7 7 7 7 7 7 7Time
# of
late
trai
ns
Priority III Trains
Priority II Trains
Priority I Trains
Fig. 8. Number of Late Trains at the Terminal.
ance measures the percentage of trains that have not been assigned the consistspecified in the power plan. Charts in Figures 6 and 7 describe the correspondingmeasures for each simulation day.
Locomotive Inventory at the Terminal - By LocoType
0
100
200
300
400
500
600
700
800
900
0.00
2.00
4.00
6.00
8.00
10.0
0
12.0
014
.00
16.0
018
.00
20.0
0
22.0
00.
002.
00
4.00
6.00
8.00
10.0
012
.00
14.0
016
.00
18.0
0
20.0
022
.00
0.00
2.00
4.00
6.00
8.00
10.0
0
12.0
014
.00
16.0
0
18.0
020
.00
22.0
0
0.00
2.00
4.00
6.00
8.00
10.0
012
.00
14.0
016
.00
18.0
0
20.0
022
.00
0.00
2.00
4.00
6.00
8.00
10.0
0
12.0
0
14.0
016
.00
18.0
020
.00
22.0
0
0.00
2.00
4.00
6.00
8.00
10.0
012
.00
14.0
0
16.0
018
.00
20.0
0
22.0
00.
00
2.00
4.00
6.00
8.00
10.0
0
12.0
0
14.0
016
.00
18.0
020
.00
22.0
0
1 1 1 1 1 1 1 1 1 1 1 1 2 2 2 2 2 2 2 2 2 2 2 2 3 3 3 3 3 3 3 3 3 3 3 3 4 4 4 4 4 4 4 4 4 4 4 4 5 5 5 5 5 5 5 5 5 5 5 5 6 6 6 6 6 6 6 6 6 6 6 6 7 7 7 7 7 7 7 7 7 7 7 7
Time
# o
f L
oco
mo
tive
s
CW60AC
CW44AC
CW40-8
GP40
SD40
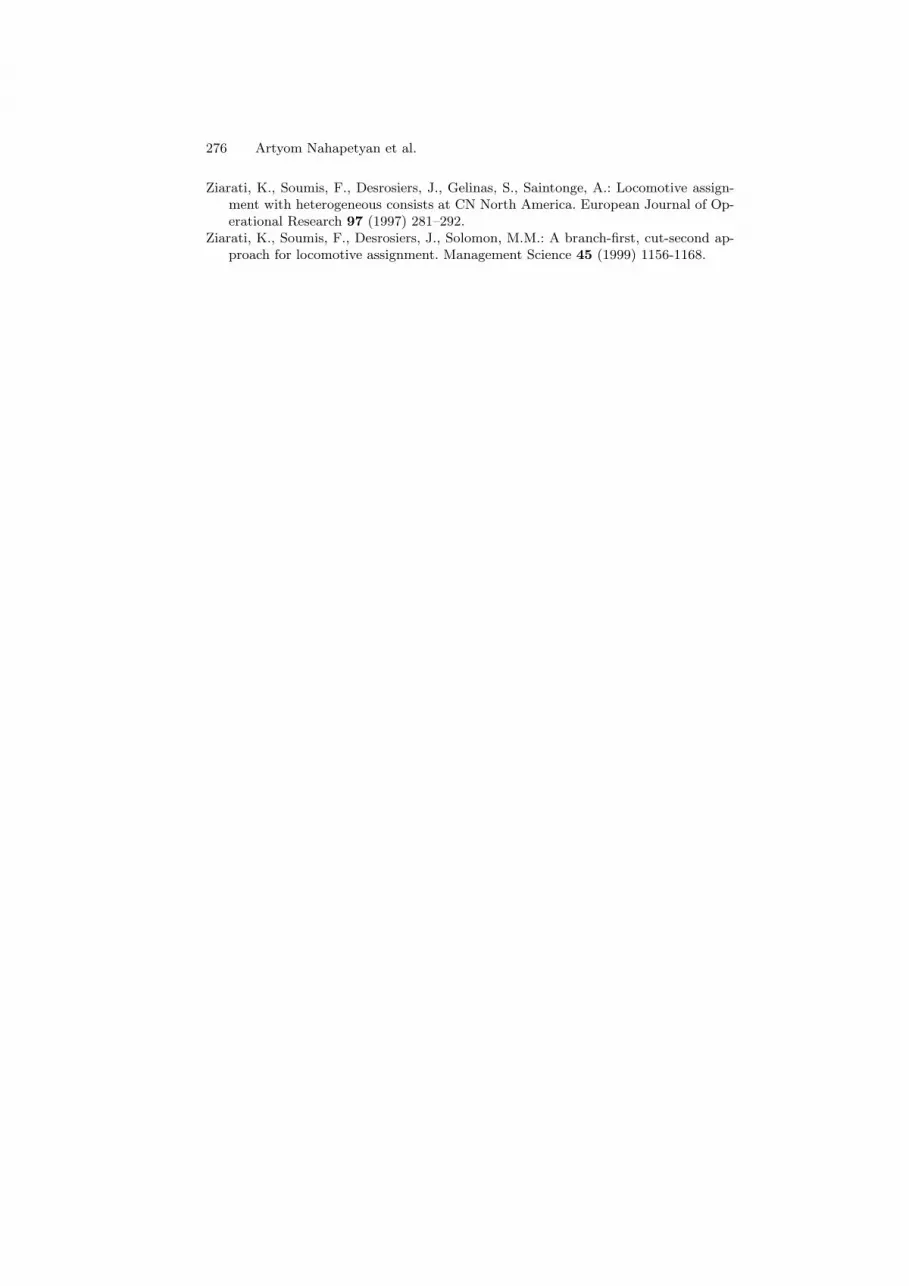
Fig. 9. Locomotive Inventory at the Terminals by Locomotive Type.
In addition to the average numbers, users can choose to view details for eachsimulation week. The chart in Figure 8 describes the number of late trains ineach two-hour bucket for the fourth simulation week. The chart displays thedata for each train priority. As before, the user can choose to view the chart fora specific terminal. The software also provides a similar chart for train delayedhours. Users also can look at locomotive inventory of the terminals. Figure 9describes the locomotive inventory at terminals for each locomotive type for thesame fourth simulation week.

272 Artyom Nahapetyan et al.
In addition to the charts above, LSO generates reports that describe all eventstaking place at a terminal during a specific week, light moves performed duringthe simulation, dwell time of locomotives at a terminal and at each simulationday, and statistics on shop repair and queue times.
6 Performing “What-If” Analysis Using LSO
In this section, we describe how the software can be used to perform “what-if”analysis on the system. To illustrate this, we have designed five scenarios thathelp to understand the influence of different parameters on key measures used bylocomotive managers to evaluate overall system performance. In each case, wesimulate the process by executing several runs and then present average resultsin the charts.� � � � � � � � � � � � � � � � � � � � � � � � � � � �
� �� � �� � �� � �� � �� � �� � �� � �� � �� � �� � � �� � � � � � � � � � � � � � � � � � � � � � � �� � � � � � ! �
On Time Arrival % On Time Departure %
� � � � � � � � � � � " � � � # � � $ � % # � � � � � � � &' ( � � ) � ) � � � � � � # * " � # # � �� � �� � �� � �� � �� � �� � �� � �� � �� � �� � �
� � � � � � � � � � � � � � � � � � � � � � � �� � � � � � ! � � �� � + �� �� � + �� �� � + �� �� � + �Power Plan Compliance % A vg Terminal Dwell Time (hrs)
Fig. 10. On-Time Train Performance, Power Plane Compliance and Average TerminalDwell Time for Different Locomotive Fleet Sizes.
In Scenario 1, we analyze the influence of locomotive fleet size on train on-time departures and arrivals, power plan compliance, and average terminal dwelltime. In this experiment, we proportionally change the locomotive fleet size forall five locomotive types used in the simulation. Charts in Figure 10 show thatby increasing the locomotive fleet size, we improve train on-time performance aswell as the power plan compliance. Since less locomotives are required to movebetween terminals to restore terminal imbalances, it also increases the terminaldwell time of locomotives.
When locomotive managers assign locomotives to outbound trains, theymight delay a train for several hours to assign the consist described in the powerplan. Scenario 2 is designed to capture the influence of delay hours on the samethree measures used in the previous scenario, i.e., train on-time performance,power plan compliance, and average terminal dwell time. In this experiment,

A Simulation/Optimization Framework for Locomotive Planning 273� � � � � � � � � � � � � � � � � � � � � � � � � � � �� �� � �� � �� � �� � �� � �� � �� � �� � �� � �� � � �
�� ��� � !" #$�%& '$�%&( )$�%&( *$�%&( +$�%&(, - . / . 0 1 2 . 3 4On Time Arrival % On Time Departure %
� � � � � � � � � � � 5 � � � 6 � � 7 � 8 6 � � � � � � � 9: ; � � < � < � � � � � � 6 = 5 � 6 6 � �� � �� � �� � �� � �� � �� � �� � �� � �
�� ��� � !" #$�%& '$�%&( )$�%&( *$�%&( +$�%&(, - . / . 0 1 2 . 3 4 ������ �� �� �Power P lan Compliance % A vg Terminal Dwell Time (hrs)
Fig. 11. On-Time Train Performance, Power Plan Compliance and Average TerminalDwell Time for Different Waiting Hours for Right Consist.
we employ the same delay hours for all three priority trains. In Figure 11, wecan see that by increasing the waiting time for the right consist, i.e., consistdescribed in the power plan, we improve power plan compliance but worsen on-time train performance. Note that we do not count these delays towards theterminal deficit; therefore, average number of light moves does not change andthe average terminal dwell time of locomotives remains the same.> ? @ A B C D E F G H C B D A I A J H D K @ L @ C M E C K B A ? @
N O PQ O PR O PS O PT O PU O PV O PW O O PX O Y V X O Y U X O Y T X O Y S X O Y R XZ [ \ [ ] [ ^ _ ` a b c _ d e f a g c ^ a
On Time Arrival % On Time Departure %
> ? @ A B C D E F G I I > h B i @ B A j k l @ C B m @ n o @ p pH D K @O Y O PW Y O Pq Y O PN Y O PQ Y O PR Y O PS Y O PT Y O P
X O Y V X O Y U X O Y T X O Y S X O Y R XZ [ \ [ ] [ ^ _ ` a b c _ d e f a g c ^ a W qW q Y RW NW N Y RW QW Q Y RW RW R Y ROOS Rate % Avg Terminal Dwell Time (hrs)
Fig. 12. On-Time Train Performance, Out-Of-Service Rate and Average TerminalDwell Time for Different Values of Locomotive Failure Rates.
In the next scenario, Scenario 3, we analyze the influence of locomotive failurerates on on-time train performance, out-of-service rate, and locomotive dwelltime at terminals. In this experiment, we proportionally change failure rates of

274 Artyom Nahapetyan et al.� � � � � � � � � � � � � � � � � � � � � � � � � � � �� �� � �� � �� � �� � �� � �� � �� � �� � �� � �� � � �
� � � � � � � � � � � � � � � � � � � � � �� � � ! " � # $ ! % & � ' ( !On Time Arrival % On Time Departure %
� � � � � � � � � � � ) � � � * � � + � , * � � � � � � � -. / � � 0 � 0 � � � � � � * 1 ) � * * � �� 2 � �� � 2 � �� � 2 � �� � 2 � �� � 2 � �� � 2 � �� � 2 � �� � 2 � �� � 2 � �
� � � � � � � � � � � � � � � � � � � � � �� � � ! " � # $ ! % & � ' ( ! ������ �� �� �� �� �Power Plan Compliance % Avg Terminal Dwell Time (hrs)
Fig. 13. On-Time Train Performance, Power Plan Compliance and Average TerminalDwell Time for Different Values of Train Travel Time.
all locomotive classes used in the simulation. Charts in Figure 12 show that bydeceasing the locomotive failure rate we reduce the OOS rate of locomotivesas it is expected. On the other hand, reducing locomotive failure rate increasesthe locomotive dwell time at terminals and slightly improves the train on-timeperformance.
Next, in Scenario 4, we analyze the influence of train velocity on systemperformance. Specifically, in this experiment, we increase or decrease the traintravel time by a certain percentage. Charts in Figure 13 depict that a highertravel time worsens the on-time train performance as well as the power plancompliance. If trains do not arrive on time, outbound trains do not have enoughlocomotives to depart. As a result, the module considers moving locomotive tothose location; therefore, it reduces the dwell time of locomotive at terminals.3 4 5 6 7 8 9 : ; < = 8 7 9 6 > 6 ? = 9 @ 5 A 5 8 B : 8 @ 7 6 4 5
C DE C DF C DG C DH C DI C DJ C DK C DL C DM C DC N E C D N F C D N G C DO P Q R S T U V R W P X Y O Q Y Q Z V [ \
On Time A rrival % On Time Departure %
3 4 5 6 7 8 9 : ; < > > 3 ] 7 ^ 5 7 6 _ ` a 5 8 b 7 b 5= 5 8 @ 9 6 7 c d e 5 c c = 9 @ 5C f C DF f C DH f C DJ f C DL f C DE C f C DE F f C DE H f C D
C N E C D N F C D N G C DO P Q R S T U V R W P X Y O Q Y Q Z V [ \ E E f HE E f JE E f LE FE F f FE F f HE F f JE F f LE GE G f FOOS Rate % Avg Terminal Dwell Time (hrs)
Fig. 14. On-Time Train Performance, OOS Rate and Average Terminal Dwell Timefor Different Shop Capacities.

A Simulation/Optimization Framework for Locomotive Planning 275
In the last scenario, Scenario 5, we run the simulation for different values ofshop capacities. In this experiment, we gradually reduce shop capacities of all10 shop locations we consider in the simulation. In Figure 14, we can see thata small change in shop capacities slightly changes the OOS rate and does notchange on-time train performance and dwell time of locomotives. However, whenthe capacities are reduced beyond a certain threshold, shops cannot repair allthe locomotives which accumulate in queues. As a result, the system shows ahuge jump in the OOS rate, reduction in locomotive dwell time at terminals andon-time train performance.
7 Summary and Conclusions
In the paper, we have discussed LSO software, which simulates the movementof locomotives across a railroad network. Specifically, it simulates the locomo-tive assignment to outbound trains, train arrivals and departures, locomotivebreakdowns and maintenances, locomotive repair procedure at shops, terminalprocessing, tactical repositioning, etc. We have tested the software on real dataobtained from CSX Transportation, one of the Class I railroads. The results showthat the statistical data of simulation is very close to the figures obtained fromday-to-day operations, and the software closely imitates the real-time locomotiveassignment and locomotive movement in the network. The software is able tosimulate six months of operations in about three minutes. All charts generatedin the reports show a very short warm-up period after which the system reachesa steady state.
We have designed several scenarios to test the software and analyze the in-fluence of different input parameters on the system performance. In the paper,we have presented some of these results. In all scenarios, the output data hascorrectly reflected the changes in the input parameters, and the software showsa stable performance in terms of running time, warm-up period and convergenceto a steady state.
References
Ahuja, R.K., Liu, J., Orlin, J.B., Sharma, D., Shughart, L.A.: Solving real-life locomo-tive scheduling problems. Transportation Science 39 (2005) 503–517.
Ahuja, R.K., Magnanti, T.L., Orlin, J.B.: Network Flows: Theory, Algorithms, andApplications. Prentice Hall, Englewood Cliffs, NJ (1993).
Chih, K.C., Hornung, M.A., Rothenberg, M.S., Kornhauser, A.L., 1990. Implemen-tation of a real time locomotive distribution system. In Computer Applicationsin Railway Planning and Management, T.K.S. Murthy, R.E. Rivier, G.F. List, J.Mikolaj (eds.), Computational Mechanics Publications, Southampton, UK, pp. 39-49.
Vaidyanathan, B., Ahuja, R.K., Orlin, J.B., and L.A. Shughart: Real-life locomotiveplanning: New formulations and computational results. To appear in Transporta-tion Research B (2007).
276 Artyom Nahapetyan et al.
Ziarati, K., Soumis, F., Desrosiers, J., Gelinas, S., Saintonge, A.: Locomotive assign-ment with heterogeneous consists at CN North America. European Journal of Op-erational Research 97 (1997) 281–292.
Ziarati, K., Soumis, F., Desrosiers, J., Solomon, M.M.: A branch-first, cut-second ap-proach for locomotive assignment. Management Science 45 (1999) 1156-1168.


