Embed Size (px)
Citation preview

Indian Journal of Medical Informatics, Vol 4, No 1 (2009)
HOME ABOUT USER HOME SEARCH CURRENT ARCHIVES IAMI
Home > Vol 4, No 1 (2009) > Paramasivam
Indian Journal of Medical Informatics. 2009; 4(1): 1
http://ijmi.org
Article
A Semi-Supervised Clustering by λ_Cut for Imputation ofMissing Data in Type II Diabetes Databases
Ilango Paramasivam1, Hemalatha Thiagarajan2 andNickolas Savarimuthu3
1PhD Research Scholar, Department of Computer Applications,
National Institute of Technology, Trichirappalli, India.
Assistant Professor, School of Computing Sciences,
VIT University, Vellore, India.
2Professor, Department of Mathematics,
National Institute of Technology, Trichirappalli.
3Assistant Professor, Department of Computer Applications,
National Institute of Technology, Trichirappalli.
Abstract:
Data mining is used extensively in healthcare to mine patient data to construct apredictive model that is sound, makes reliable predictions and helps physicians to improvetheir prognosis, diagnosis or treatment planning procedures. The pathological data inmedicine often produces missing data due to various reasons. Accurate and robustestimation methods of missing data are needed since the performance of the data miningalgorithms heavily depend on the quality of the dataset. In this paper, an imputationmethod, Semi-Supervised Clustering by λ-Cut (λ-CUT_CLUST) is proposed. In theproposed method, similar records are clustered using weight as similarity measure. A highdegree of intra cluster similarity is achieved by selecting those records with weights in thethreshold range 0.6 ≤λ≤1. The missing data is imputed by obtaining the mean value ofthe respective attributes of the cluster. The method is experimented on Pima Indian TypeII Diabetes dataset and the performance is compared with other imputation methods. Thecomparative analysis demonstrates that the method is able to impute the missing datawith less imputation error and produce stable results over different percentages of missingdata.
Keywords:
Paramasivam http://ijmi.org/index.php/ijmi/article/viewArticle/y09i1a1/18
1 of 10 7/8/2009 5:47 PM
Missing data, λ-Cut, Cluster, Imputation Error, Type II Diabetes Dataset.
I Introduction
Recent advancements in the healthcare industry have both necessitated and made feasible theadoption of tools for data analysis and knowledge discovery. Quality of data in medical databasecan enhance the quality of medical diagnosis to a major extent. The quality factors of data in thesedatabases include accuracy, completeness, suitability for usage and clarity. Quality of data canimpact the stages of retrieval, analysis and usage. In order to attain data quality, various tools areappropriately deployed, which would facilitate access and analysis, so that meaningful patternsemerge leading to knowledge discovery. Medical databases help in diagnosis, treatment andfollow-up and thereby support medical practitioners to make precise diagnosis, to providehealthcare, to monitor progresses and to advance clinical research [1]. Data mining in medicaldatabases facilitate the physician for quality diagnosis, especially in the presence of missing data,numerous features and parameters [2].
Knowledge discovered through data mining, aids interpretation of data about patients, so thathealthcare professionals are enabled to arrive at informed decisions regarding their clients' health.In practice, however, there are possibilities of human and systemic errors, owing to multiplicity ofdata sources and enormity of data size. These errors could render the required data to becomedeficient, `noisy' and contradictory. Errors happen to accumulate and result in a serious distortionof facts. It is thus seen that deriving knowledge through data mining is adversely impacted.Knowledge derived from inadequately processed raw data can not only be ineffective but alsocounterproductive. Hence, cleaning of data with an objective to enhance its reliability is a precursorto data mining. Data defectiveness remains unavoidable to an extent, particularly in large-scaleapplications [3]. It is indicated that the bulk of the time and efforts are being devoted to the taskof data preparation [4-6]. Similarly, a vast majority of over 80%, of data mining initiatives tend tofocus on getting the data ready for usage [7-9]. Procedures to refine data, strive to nullify thedisruptive aspects of the data and to spot and eliminate discrepancies. These procedures also aimat aptly substituting missing values. Therefore, data cleaning, which seeks to improve the qualityof the data and make the data more reliable for mining purposes, is an important preliminary stepin data mining. Data cleaning algorithms attempt to smooth noise in the data, identify andeliminate inconsistency, and remove missing values or replace them with values imputed from therest of the data.
Malfunctioning of equipments, non-realization of the significance of certain data, failures to enterdata, removal of vital data, are some of the causes cited to be the reasons for the existence ofmissing data in the medical databases. Due to the presence of missing values, there arepossibilities of bias and consequentially, the quality of the data mining process may bedeteriorated. The method of imputation is popular as a strategy. Its popularity is attributed to thefact that it predicts missing values by using as much information as feasible [10, 11]. Missing dataimputation is one of the challenges in data mining and such hurdles tend to bias the user andlower the quality of the data mining process [10,12]. Some of the existing algorithms are set toassume the absence of missing values and therefore are ill suited to certain domains ofapplications. Though there might be various methods to handle data with missing values, nosingle one could be judged as superior to others. An eluding issue in this context is regarding theestimation of missing values, whose erroneous treatment would lead to distorted results formethods such as hierarchical clustering and K-means clustering respectively.
Estimation of missing data could warrant voluminous, accurate data in order to make reliableimputations. Diagnostic quality depends on the worthiness of the imputed data. Hence, accurateand more consistent estimation of missing data is warranted in medical data mining. In this paper,we propose a method, λ-CUT_CLUST, to impute missing data, by grouping the similar set ofcomplete instances formulated as cluster for every incomplete patient record. The completedataset, Pima Indian Type II Diabetes dataset is taken up for evaluating the method. The imputedvalues are compared with the observed values and the average imputation error is estimated. Theperformance of the proposed method is compared with other imputation methods namely 10-NN,NORM, EMImpute Columns, LSImpute_Rows, Mean Imputation.
The background of the research work in imputation of missing data is given in section II. SectionIII describes the proposed problem, methodology and the dataset used for evaluating the proposedmethod. Section IV presents the results of the proposed method and compare with the otherimputation methods in terms of their imputation errors. Finally, Section V concludes with researchfindings.
II Background
Medical databases usually show a considerable amount of missing data, which may be missed dueto procedural errors, refusal of response or non-applicability of responses, lack of test results andequipment malfunctioning, among other things. Most healthcare datasets contain a lot of missingvalues, which occur mostly in conditional attributes.
Many approaches to deal with missing values have been described in the literature [11], includingthose of ignoring objects containing missing values, filling the missing value manually;
Paramasivam http://ijmi.org/index.php/ijmi/article/viewArticle/y09i1a1/18
2 of 10 7/8/2009 5:47 PM
substituting the missing values by the mean or mode of the respective conditional attribute; aglobal constant or getting the most probable value to fill in the missing values. Each of theseapproaches has its own shortcomings. While the first specified approach usually loses a great dealof useful information, the second one becomes too time-consuming and logically inconsistent,which makes the results irrelevant and not feasible with regard to most applications. The thirdapproach is a poor choice as it distorts other statistical properties of the data and does not considerthe dependencies between attributes. The fourth one assumes that all missing values are with thesame value, perhaps leading to considerable distortions in data distribution. Another approach is tocreate a new data which is akin to missing values to represent missing data in the dataset.However, this has the unfortunate negative impact that data mining algorithms may try to use"missing" as a legal value, which is likely to be inappropriate and it is found that it sometimes hasthe effect of artificially inflating the accuracy of some data mining algorithms on some datasets[13].
Conventional methods of imputing missing value include two major types - namely parametric andnon-parametric imputations. The former is considered to be better if a dataset can be adequatelymodeled parametrically, or if users can correctly specify the parametric forms for the dataset. Forinstance, the linear regression methods usually can treat well the continuous target attribute,which is a linear combination of the conditional attributes. However, when the exact relationbetween the conditional attributes and the target attribute is unknown, the performance of thelinear regression for imputing missing values is very poor. The imputation of missing data byregression uses the predicted values derived from a regression equation based on variables in thedataset that contain no missing data[14]. Regression imputation may not be performing well for alldatasets as it assumes the existence of a specific relationship between the attributes. In real-timeapplications, if the model is mis-specified and the distribution of the real dataset is unknown, theestimations of parametric method may be highly biased and the optimal control factor settings maybe miscalculated.
Techniques of imputation such as K-Nearest Neighborhood (KNN), LSImpute_Rows, andEMImpute_Columns have been used in many applications [15,16]. LSImpute_Rows andEMImpute_Columns are feature based extraction methods. While imputing the missing data usingK Nearest Neighborhood (KNN) method, all pairs of pairs of points in a dataset is assigned with thedistance. The Euclidean distance between two points delineates the distance between two points.The distance between all pairs of points (X,Y) constructs the distance matrix. Every data pointwithin the dataset holds a class from the set, C= {C1... Cn}. The K numbers of nearest data pointsare identified using the distance matrix. The most common class is identified out of the nearestdata points and is then assigned to the data point which is being analyzed. However, it results inrecursive process while two or more classes occur equally for a specific data point within thedataset. The least squares principle is used to estimate missing data in LSImpute method. It usesthe correlations between the reference record and other followed by minimizing the sum of squarederrors of a regression model. Hot-deck imputation to fill missing data in incomplete sample surveys[16]. It uses values from other rows of the database that are similar to the row with the missingdata and depends highly on measuring the similarity between the rows.
Different authors have recommended different methods such as machine learning including autoassociative neural network [17], decision tree imputation [18], case-wise deletion [19], `lazydecision tree' [13] and `dynamic path generation' [20]. Further, a few of the methods in machinelearning like C4.5 handle only the discrete value. In these methods, continuous attributes arebroken down into different intervals and the imputation result of those methods may nullify theoriginal distribution of dataset. However, as these methods tend to obliterate the original data setdistribution while imputing, they are not considered as perfect methods in handling the issue ofmissing values.
A usual approach to tackle missing data is the creation of data mining algorithms that "internally"handle missing data and still produce good results. For example, the CART decision-tree learningalgorithm internally handles missing data essentially using an implicit form of imputation based onregression [21]. Introduction of bias into the data and limitations in applicability are cited to be thefaults of some simple pre-processing methods of handling missing data [22].
Cluster analysis is used to identify homogeneous and well-separated groups of objects [23].Clustering is described as dividing of a dataset into subsets known as clusters, in such a mannerthat data belonging to each sub set would have commonalities [24, 25]. Under this method, adataset is subdivided and most similar elements are grouped into the same cluster while mostdissimilar groups are placed in different clusters. Similarity measures including those that havedistance as the basis such as Euclidean and Manhattan distances are used in many clusteringalgorithms. Generally, clustering methods fall under the categories namely, hierarchical, mixture-model, learning-network, objective-function-based and partition clustering. The proposed methodexploits the concept of grouping similar records into cluster.
III. Methodology
An imputation method, λ-CUT_CLUST measures the similarity of the complete records with theincomplete record by assigning weights. The method identifies the similar records and forms thecluster by considering the incomplete record as a centre point. The λ-Cut, indicates the optimalthreshold value applied to group the similar records while forming the cluster. Finally, missingvalues in the incomplete records will be obtained by the computing the mean value of the
Paramasivam http://ijmi.org/index.php/ijmi/article/viewArticle/y09i1a1/18
3 of 10 7/8/2009 5:47 PM

respective attribute(s) of the cluster. The experiments are performed on PIMA Indian Type IIDiabetes Dataset [26], which originally does not have any missing data. The dataset contains 768complete cases described by 8 attributes and a predictive class. The attributes are labeled asnumber of times pregnant, glucose tolerance test, diastolic blood pressure, triceps skin foldthickness, 2-hour serum insulin, body mass index, diabetes pedigree function and age. Thepredictive class value `1' is interpreted as "tested positive for diabetes" and class value `0' isinterpreted as "tested negative for diabetes". Class value `0' was found in 500 instances and 1 in268 instances. The dataset has only numerical attributes and each transaction is viewed as a multidimensional vector. Different percentages of missing data (from 5% to 80%) were generated usingrandom labeling with simulation. The method is evaluated by estimating the average imputationerror, the difference between the imputed value and the original value. The performance iscompared with other existing imputation methods namely 10-NN, NORM, EMImpute Columns,LSImpute_Rows, Mean Imputation.
The λ-CUT_CLUST method comprises of four phases.
1. In the first phase, testing dataset is formulated by randomly missing some of the attributes.
2. For cluster generation, weight is assigned to every record in the training dataset. Weightspecifies the number of similar attributes between a complete record in the training dataset and anincomplete record in the testing dataset. The greater the value of weight, the greater is thesimilarity between those records.
3. The weights are normalized using max-difference normalization so as to generalize the methodfor any dataset. To do more precise imputation, it is necessary that the records in the cluster arehighly similar. So, a threshold value λ is chosen and the records whose weights above thethreshold value λ are used for cluster generation. Clusters are generated on the training datasetwith records of testing dataset as centre points. Experiments are performed for different λ values,and the optimal threshold λ value is chosen.
4. Finally, the missing-attribute value is imputed with the mean value of the correspondingattribute(s) of the respective clusters.
The results are validated using the average imputation error. The pseudo code of the proposedalgorithm is given below.
Generation of testing dataset
In this phase, testing dataset is generated by grouping similar incomplete records into variousblocks in such a way that a block consists of records with same set of missing attributes. A
maximum of (2n - 2) blocks (where n is the number of attributes) will be created. The proposedmethod does the imputation process on these incomplete records. These records in every block isconsidered as centre points (reference points) to generate clusters on the training dataset.
Paramasivam http://ijmi.org/index.php/ijmi/article/viewArticle/y09i1a1/18
4 of 10 7/8/2009 5:47 PM

Weight generation
Cluster generation is an important phase. The performance of the proposed method solely dependson the intra cluster similarity among the records within the cluster. The similarity between acomplete record of the training dataset and an incomplete record of the testing dataset ismeasured in terms of weight, the number of similar attributes. An attribute in the complete recordof the training dataset is considered to be similar to the corresponding attribute in the incompleterecord of the testing dataset if and only if the attribute value lies in the range (attribute value ±0.5σ) where σ is the standard deviation of the respective attribute. The statistical reason for thisconsideration is given below. The statistical parameter which describes the spread of the values ina dataset is standard deviation (σ) [27]. It measures the spread of the data about the mean value.If a data distribution is normal then about 68.2% of the values are within one standard deviation(1σ) of the mean, about 95% of the values are within two standard deviations (2σ), and about99.75% lie within three standard deviations (3σ). To group similar records more precisely, theattribute values that lie in the range (attribute value±0.5σ) are considered to be similar. Theequation given below shows the formula for assigning weights to every record in the trainingdataset.
Where n is the number non-missing attributes of the records in the testing dataset, α is theattribute value of the incomplete record, β is the attribute value of the complete record in thetraining dataset, σ is the standard deviation of the respective attribute.
λ-Cut and Cluster generation
The generated weights are normalized using max-difference normalization. The advantage of usingnormalization is that the method can be applied to any dataset with any number of attributes. Theassigned weights are normalized by dividing the weights by (n - miss (a)).
Where `Weight of Train_Dataset' is the weight generated on the complete records of trainingdataset, `n' is the number of attributes in the dataset and `missing(a)' refers to the set of missingattributes.
The weight 0.5 is an uncertainty and the records with the weight < 0.5 indicate that those recordsare less similar to the incomplete record. When the similarity among the data points is not crisp, itcan be handled well by fuzzy clustering [28]. Fuzzy C-Means clustering is proposed by Dunn(1973) and modified by Bezdek (1981). The flexibility and robustness [29] of Fuzzy C-Meansclustering made it popular and it is also able to produce reliable and steady clusters. The datamining research desires to utilize these features [30]. In Fuzzy C-Means clustering, the data pointsare defined with the membership values with respect to the cluster centre and will be updatediteratively. In this paper, the incomplete record is assumed as the cluster centre and its similaritywith the complete record is measured using weight. When the weight is in uncertainty it can beresolved using Fuzzy C-Means clustering as extension of this work and the authors are working onthese issues.
The intra cluster similarity among the records of the cluster is important for effective imputation.So, the proposed method selects those complete records of the training dataset with weight ≥0.6for cluster generation and for the imputation process. The clusters are generated for each thresholdvalue of λ,0.6 ≤λ≤1.
Imputation of missing data
Clusters are generated with incomplete record as cluster center. The values of the missingattributes are imputed by computing the mean of the respective attributes in the cluster. Theaccuracy of the imputation process is evaluated using average Imputation Error. The clusters aregenerated for various threshold values of λ and the results are compared.
IV. Results and Discussion
The proposed method, λ-CUT_CLUST is experimented using MATLAB on the Pima Indian Type IIdiabetes dataset [26]. The experiments are conducted in two phases. In the first phase, clustersare generated for various threshold values of λ, namely 0.6, 0.7, 0.8, 0.9 and 1.0 and for differentsizes of missing data such as 5%, 10%, 15%, 20%, 25%, 30% and 35%. The imputation is doneand the average imputation error is estimated. The accuracy of the imputation process is thenanalyzed by comparing the average imputation error for the various threshold values of λ. The λvalue for which minimum imputation error is obtained is considered as optimal threshold value. In
Paramasivam http://ijmi.org/index.php/ijmi/article/viewArticle/y09i1a1/18
5 of 10 7/8/2009 5:47 PM
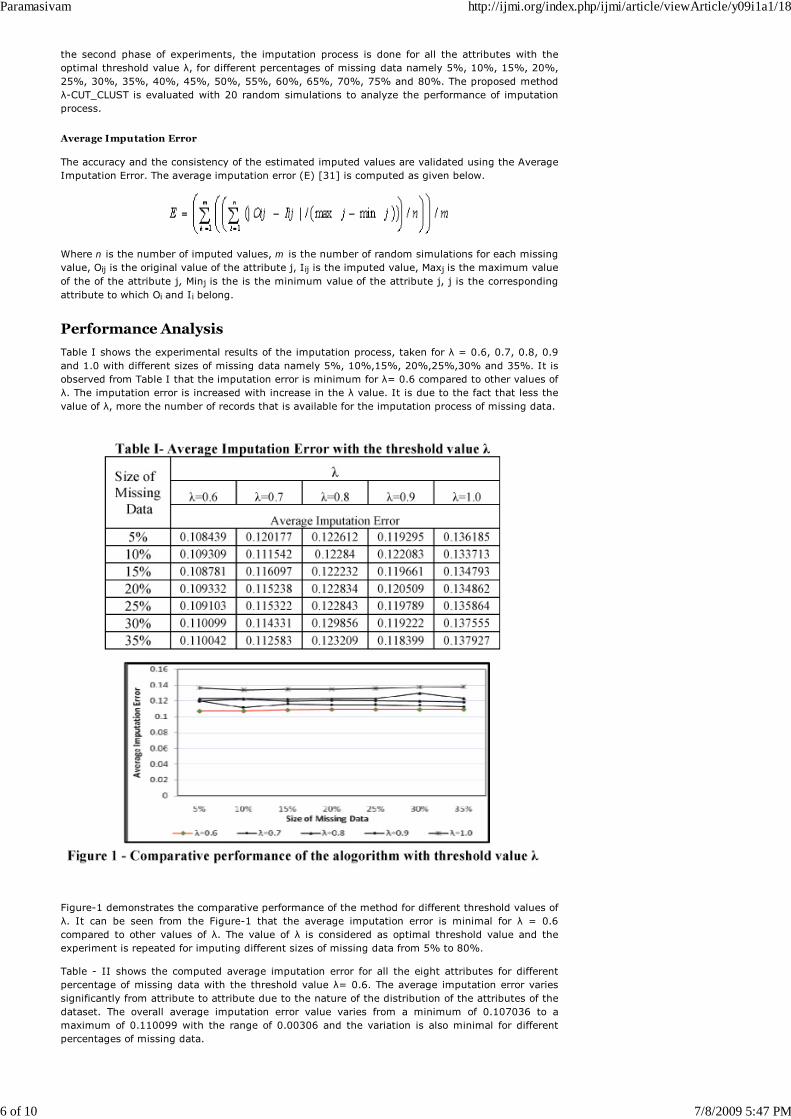
the second phase of experiments, the imputation process is done for all the attributes with theoptimal threshold value λ, for different percentages of missing data namely 5%, 10%, 15%, 20%,25%, 30%, 35%, 40%, 45%, 50%, 55%, 60%, 65%, 70%, 75% and 80%. The proposed methodλ-CUT_CLUST is evaluated with 20 random simulations to analyze the performance of imputationprocess.
Average Imputation Error
The accuracy and the consistency of the estimated imputed values are validated using the AverageImputation Error. The average imputation error (E) [31] is computed as given below.
Where n is the number of imputed values, m is the number of random simulations for each missingvalue, Oij is the original value of the attribute j, Iij is the imputed value, Maxj is the maximum valueof the of the attribute j, Minj is the is the minimum value of the attribute j, j is the correspondingattribute to which Oi and Ii belong.
Performance Analysis
Table I shows the experimental results of the imputation process, taken for λ = 0.6, 0.7, 0.8, 0.9and 1.0 with different sizes of missing data namely 5%, 10%,15%, 20%,25%,30% and 35%. It isobserved from Table I that the imputation error is minimum for λ= 0.6 compared to other values ofλ. The imputation error is increased with increase in the λ value. It is due to the fact that less thevalue of λ, more the number of records that is available for the imputation process of missing data.
Figure-1 demonstrates the comparative performance of the method for different threshold values ofλ. It can be seen from the Figure-1 that the average imputation error is minimal for λ = 0.6compared to other values of λ. The value of λ is considered as optimal threshold value and theexperiment is repeated for imputing different sizes of missing data from 5% to 80%.
Table - II shows the computed average imputation error for all the eight attributes for differentpercentage of missing data with the threshold value λ= 0.6. The average imputation error variessignificantly from attribute to attribute due to the nature of the distribution of the attributes of thedataset. The overall average imputation error value varies from a minimum of 0.107036 to amaximum of 0.110099 with the range of 0.00306 and the variation is also minimal for differentpercentages of missing data.
Paramasivam http://ijmi.org/index.php/ijmi/article/viewArticle/y09i1a1/18
6 of 10 7/8/2009 5:47 PM
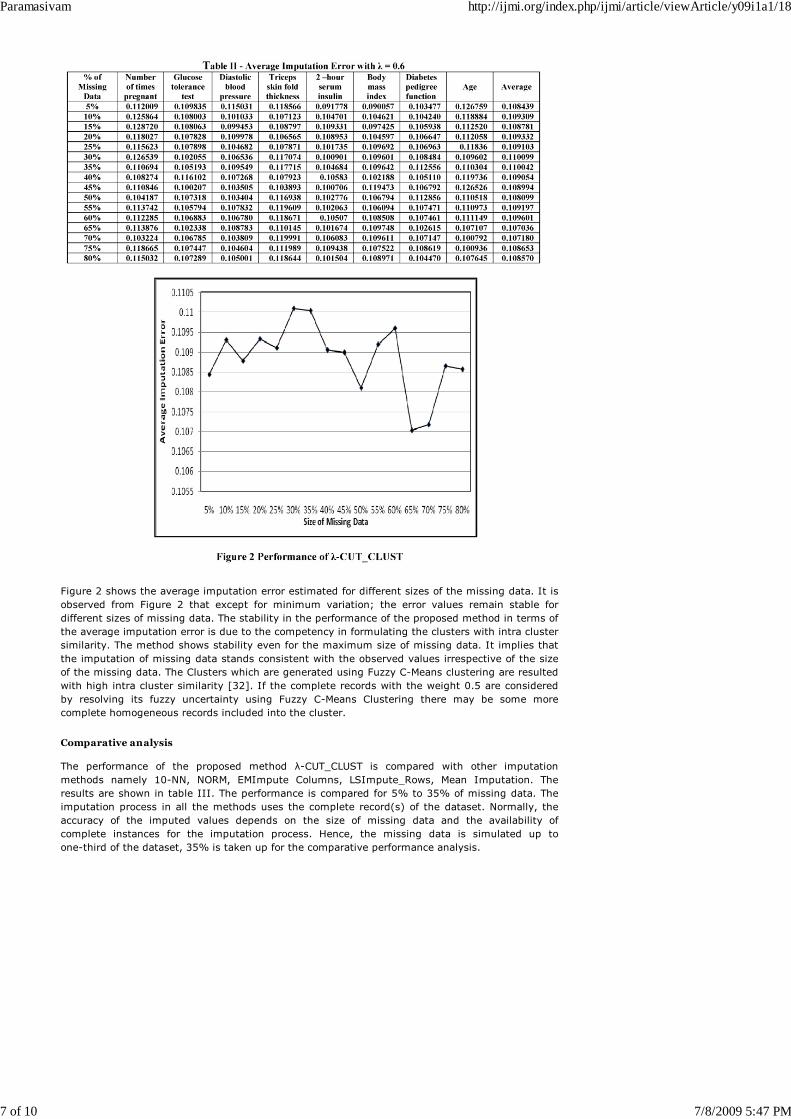
Figure 2 shows the average imputation error estimated for different sizes of the missing data. It isobserved from Figure 2 that except for minimum variation; the error values remain stable fordifferent sizes of missing data. The stability in the performance of the proposed method in terms ofthe average imputation error is due to the competency in formulating the clusters with intra clustersimilarity. The method shows stability even for the maximum size of missing data. It implies thatthe imputation of missing data stands consistent with the observed values irrespective of the sizeof the missing data. The Clusters which are generated using Fuzzy C-Means clustering are resultedwith high intra cluster similarity [32]. If the complete records with the weight 0.5 are consideredby resolving its fuzzy uncertainty using Fuzzy C-Means Clustering there may be some morecomplete homogeneous records included into the cluster.
Comparative analysis
The performance of the proposed method λ-CUT_CLUST is compared with other imputationmethods namely 10-NN, NORM, EMImpute Columns, LSImpute_Rows, Mean Imputation. Theresults are shown in table III. The performance is compared for 5% to 35% of missing data. Theimputation process in all the methods uses the complete record(s) of the dataset. Normally, theaccuracy of the imputed values depends on the size of missing data and the availability ofcomplete instances for the imputation process. Hence, the missing data is simulated up toone-third of the dataset, 35% is taken up for the comparative performance analysis.
Paramasivam http://ijmi.org/index.php/ijmi/article/viewArticle/y09i1a1/18
7 of 10 7/8/2009 5:47 PM
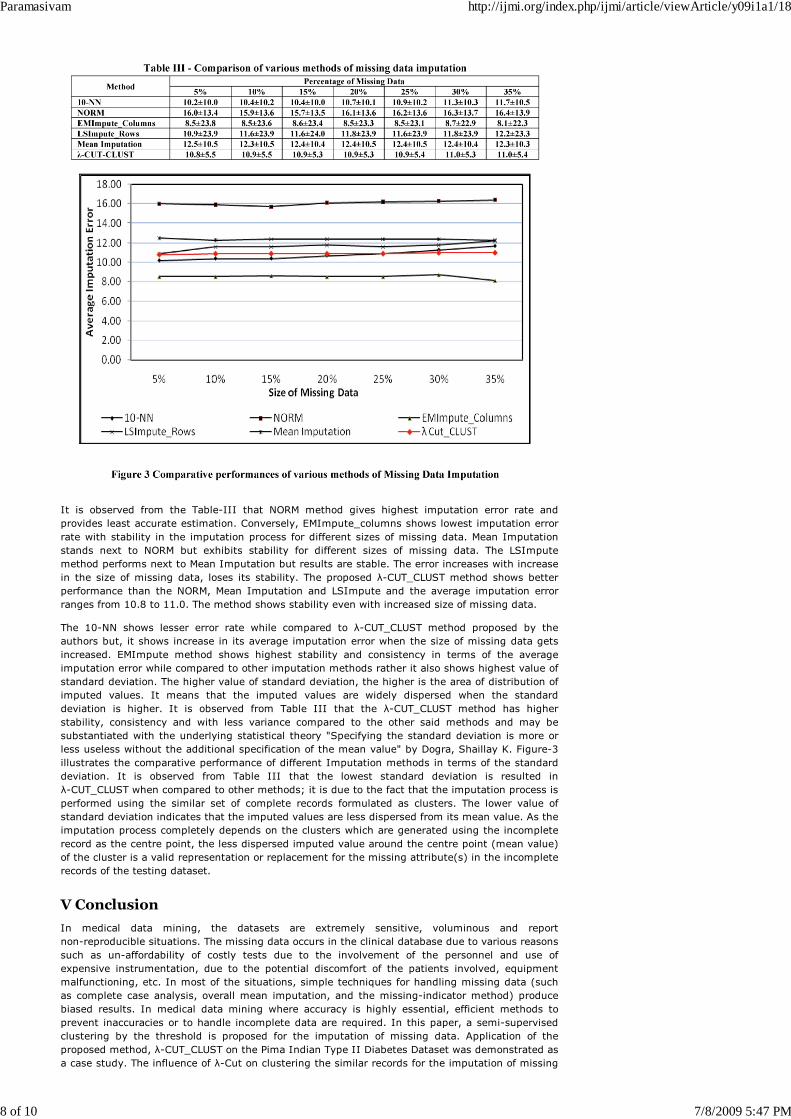
It is observed from the Table-III that NORM method gives highest imputation error rate andprovides least accurate estimation. Conversely, EMImpute_columns shows lowest imputation errorrate with stability in the imputation process for different sizes of missing data. Mean Imputationstands next to NORM but exhibits stability for different sizes of missing data. The LSImputemethod performs next to Mean Imputation but results are stable. The error increases with increasein the size of missing data, loses its stability. The proposed λ-CUT_CLUST method shows betterperformance than the NORM, Mean Imputation and LSImpute and the average imputation errorranges from 10.8 to 11.0. The method shows stability even with increased size of missing data.
The 10-NN shows lesser error rate while compared to λ-CUT_CLUST method proposed by theauthors but, it shows increase in its average imputation error when the size of missing data getsincreased. EMImpute method shows highest stability and consistency in terms of the averageimputation error while compared to other imputation methods rather it also shows highest value ofstandard deviation. The higher value of standard deviation, the higher is the area of distribution ofimputed values. It means that the imputed values are widely dispersed when the standarddeviation is higher. It is observed from Table III that the λ-CUT_CLUST method has higherstability, consistency and with less variance compared to the other said methods and may besubstantiated with the underlying statistical theory "Specifying the standard deviation is more orless useless without the additional specification of the mean value" by Dogra, Shaillay K. Figure-3illustrates the comparative performance of different Imputation methods in terms of the standarddeviation. It is observed from Table III that the lowest standard deviation is resulted inλ-CUT_CLUST when compared to other methods; it is due to the fact that the imputation process isperformed using the similar set of complete records formulated as clusters. The lower value ofstandard deviation indicates that the imputed values are less dispersed from its mean value. As theimputation process completely depends on the clusters which are generated using the incompleterecord as the centre point, the less dispersed imputed value around the centre point (mean value)of the cluster is a valid representation or replacement for the missing attribute(s) in the incompleterecords of the testing dataset.
V Conclusion
In medical data mining, the datasets are extremely sensitive, voluminous and reportnon-reproducible situations. The missing data occurs in the clinical database due to various reasonssuch as un-affordability of costly tests due to the involvement of the personnel and use ofexpensive instrumentation, due to the potential discomfort of the patients involved, equipmentmalfunctioning, etc. In most of the situations, simple techniques for handling missing data (suchas complete case analysis, overall mean imputation, and the missing-indicator method) producebiased results. In medical data mining where accuracy is highly essential, efficient methods toprevent inaccuracies or to handle incomplete data are required. In this paper, a semi-supervisedclustering by the threshold is proposed for the imputation of missing data. Application of theproposed method, λ-CUT_CLUST on the Pima Indian Type II Diabetes Dataset was demonstrated asa case study. The influence of λ-Cut on clustering the similar records for the imputation of missing
Paramasivam http://ijmi.org/index.php/ijmi/article/viewArticle/y09i1a1/18
8 of 10 7/8/2009 5:47 PM

data is discussed. The proposed λ-CUT_CLUST method exploits the concept of semi-supervisedclustering with the threshold value λ in grouping the similar records into clusters using weights assimilarity measure and imputes the missing values stirring in the process of diagnosis of thedisease. Normalization of weights ensures the applicability of the method to any datasetirrespective of the number of attributes. The method exhibits relatively better performance thanother methods as it produces lower imputation error rate with stability and less variance. It isconcluded that the proposed method λ-CUT_CLUST imputes the missing data with higher accuracywith consistency and there was no significant reduction in accuracy as the size of missing dataincreases.
References1. Travers D, Mandelkehr L. The Emerging Field of Informatics. N C Med J. 2008;69 : 127-131
2. Shaha SC, Kusiaka A, O'Donnell MA. Patient-recognition data-mining modelfor BCG-plus interferon immunotherapy bladder cancer treatment. Computersin Biology and Medicine. 2006; 36: 634_655.
3. Laurance J. Breast cancer cases rise 80% since Seventies. The Independent.[http://www.independent.co.uk/life-style/health-and-wellbeing/health-news/breast-cancer-cases -rise-80-since-seventies-417990.html] AccessedOctober 2006
4. Clifton C. Change detection in overhead imagery using neural networks. ApplIntell 2003; 18 : 215_234.
5. Hu X. A data mining approach for retailing bank customer attrition analysis.Appl Intell 2005; 22 : 47_60.
6. Kaya M, Alhajj R. Utilizing genetic algorithms to optimize membershipfunctions for fuzzy weighted association rule mining. Appl Intell 2006; 24 : 7_15 .
7. Cios K, Kurgan L. Trends in data mining and knowledge discovery. In: Pal N,Jain L, Teoderesku N (eds) Knowledge discovery in advanced informationsystems. New York: Springer-Verlag, 2002.
8. Zhang C, Yang Q, Liu B. Intelligent data preparation. IEEE Trans Knowl DataEng 2005; 17 : 1163_1165
9. Zhang C, Zhang S, Webb G. Identifying approximate itemsets of interest inlarge databases. Appl Intell 2003; 18:91_104.
10. Zhang, S.C., et al. "Missing is useful": Missing values in cost-sensitive decisiontrees. IEEE Transactions on Knowledge and Data Engineering. 2005; 17 :1689-1693.
11. Han, J., and Kamber, M. Data Mining: Concepts and Techniques. 2nd ed.Morgan Kaufmann, 2006.
12. Qin, Y.S. et al. Semi-parametric Optimization for Missing Data Imputation.Applied Intelligence. 2007; 27 : 79-88.
13. Friedman JH, Kohavi R, Yun Y. Lazy decision trees. In: Proceedings of 13thAAAI and 8th IAAI, 1996, pp. 717_724.
14. Beaumont JF. On regression imputation in the presence of nonignorablenonresponse. In: Proceedings of the Survey Research 570 Methods Section, ASA,2000, pp. 580_585.
15. Abdala OT, Saeed M. Estimation of Missing Values in Clinical LaboratoryMeasurements of ICU Patients Using a Weighted K-Nearest NeighborsAlgorithm. Computers in Cardiology 2004 ; 31 : 693-696
16. Ford BL. Incomplete data in sample surveys: An Overview of Hot-deckProcedures. Academic Press, 1983.
17. Pyle D. Data preparation for data mining. San Fransisco: Morgan Kaufmann,1999.
18. Quinlan JR. C4.5: Programs for machine learning. San Mateo: MorganKaufmann, 1993
19. Liu WZ, White AP, Thompson SG, BramerMA. Techniques for dealing withmissing values in classification. In: IDAL97, vol 1280 of Lecture notes, pp527_536.
20. White AP. Probabilistic induction by dynamic path generation in virtual
Paramasivam http://ijmi.org/index.php/ijmi/article/viewArticle/y09i1a1/18
9 of 10 7/8/2009 5:47 PM

trees. In: BramerMA(ed) Research and development in expert systems III.Cambridge, Cambridge University Press, 1987, pp 35_46.
21. Breiman L, Friedman JH, Olshen RA, Stone CJ. Classification and RegressionTrees, Chapman and Hall, 1984.
22. LittleRJA, Rubin DB. Statistical Analysis with Missing Data, John Wiley &Sons, Inc., USA, 1986.
23. Grossberg S. Adaptive Pattern Classification and Universal Recoding, I:Parallel Development and Coding of Neural Feature Detectors. BiologicalCybernetics. 1976; 23 : 121-134
24. Bradley PPS, Fayyad U, Reina C. Scaling clustering algorithms to largeDatabases. Proceedings of the International Conference on KnowledgeDiscovery in Databases, 1998.
25. Moth'd Belal, Al-Daoud. A New Algorithm for Cluster Initialization.Transactions on Engineering, Computing and Technology 2005; 4 : 74-77
26. Blake CL, Merz CJ. UCI Repository of machine learning databases,[http://www.ics.uci.edu/~mlearn/MLRepository.html]
27. Dogra, Shaillay K. Standard Deviation. QSARWorld—A Strand Life Sciences.[http://www.qsarworld.com/qsar-statistics-standard-deviation.php]
28. Klir GJ, Yuan B. Fuzzy sets and fuzzy logic: theory and applications. PatternRecognition. New Jersey: Prentice-Hall, 1995
29. Bezdek, JC. Cluster validity with fuzzy sets, J Cybernet. 1974; 3 : 58_71
30. Murase K, Nagayoshi M, Uenishi Y. Extraction of arterial input function formeasurement of brain perfusion index with 99mTc compound using fuzzyclustering. Nucl Med Commun. 2004; 25 : 299_303.
31. Giardina M, Huo Y, Azuaje F, McCullagh P. Harper R. A Missing DataEstimation Analysis in Type II Diabetes Databases. Proceedings of the 18th IEEESymposium on Computer-Based Medical Systems (CBMS'05) 1063-7125/05 2005IEEE.
32. Chattopadhyay S, Pratihar DK and De Sarkar SC. Some studies on fuzzyclustering of psychosis data. Int. J. Business Intelligence and Data Mining. 2007: 2 ; 143_159 .
Paper received on 03/02/2009; accepted on 04/05/2009
Correspondence:
Ilango Paramasivam
PhD Research Scholar, Department of Computer Applications,
National Institute of Technology, Trichirappalli, India.
Assistant Professor, School of Computing Sciences,
VIT University, Vellore, India.
This Open Access article is available at: http://ijmi.org/index.php/ijmi/article/view/y09i1a1
© 2009 Author(s); licensee Indian Journal of Medical Informatics under
Creative Commons Attribution-No Derivative Works 3.0 License .
Paramasivam http://ijmi.org/index.php/ijmi/article/viewArticle/y09i1a1/18
10 of 10 7/8/2009 5:47 PM