Embed Size (px)
Citation preview
arX
iv:a
stro
-ph/
0205
268v
1 1
6 M
ay 2
002
Mon. Not. R. Astron. Soc. 000, 1–?? (0000) Printed 26 December 2013 (MN LATEX style file v1.4)
A Search for6Li in Stars with Planets
Bacham E. Reddy,1 David L. Lambert,1 Chris Laws,2
Guillermo Gonzalez,3 Kevin Covey 2
1Department of Astronomy, University of Texas, Austin, Texas 787122Department of Astronomy, University of Washington, Seattle, Washington 981953Department of Physics and Astronomy, Iowa State University, Ames, Iowa, 50011
26 December 2013
ABSTRACTUsing very high-resolution (R∼ 125,000) and high quality (S/N ≥ 350) spectra, wehave searched for 6Li in stars hosting extra-solar planets. From detailed profile-fittingof the Li i resonance line at 6707.7 A, we find no significant amount of 6Li relativeto the 7Li for any of 8 planet bearing stars (6Li/7Li ≤ 0.0 - 0.03 ) with a strong Li ilines. In particular, we do not confirm the presence of 6Li with 6Li/7Li = 0.13 reportedby Israelian et al.(2001) for HD 82943, a star with two known planets. Several of the8 stars plus HD 219542 A, the planet-less primary of a binary, have been identifiedin the literature as possible recipients of accreted terrestrial material. For all of theplanet-hosting stars and an additional 5 planet-less stars, we find no 6Li.
Key words: stars: abundances – stars: Li isotopic ratios – stars: atmospheres – stars:extra-solar planets
1 INTRODUCTION
Observers studying the abundance of lithium in stars con-tinue to uncover novel results. A recent novelty concerningmain sequence stars was reported by Israelian et al. (2001)from measurements of the lithium isotopic ratio for HD82943, a star known to host giant planets, and HD 91889, astar similar to HD 82943 but lacking orbiting planets. ForHD 91889, analysis of the 6707 A Li i resonance line showed acomplete absence of 6Li (6Li/7Li = −0.002 ± 0.006, by num-ber) in agreement with theoretical expectation that 6Li butnot 7Li is thoroughly destroyed by protons in the pre-mainsequence phase when the star possesses a deep convectiveenvelope. The abundance of lithium, that is 7Li, at log ǫ(Li)= 2.52 is a typical value for a late F-type main sequencestar. In striking contrast, HD 82943, a star with a similartotal lithium abundance as HD 91889, showed a surprisingamount of 6Li: the ratio determined was 6Li/7Li = 0.126± 0.014. This extraordinary amount of 6Li was cited by Is-raelian et al. as probable ‘evidence for a planet (or planets)having been engulfed by the parent star’. Since lithium 6Liand 7Li – would presumably have been preserved in the un-fortunate planets, their ingestion added 6Li (and 7Li) to theatmosphere cleansed of 6Li in the pre-main sequence phase.
In this paper, we report measurements of the lithiumisotopic abundance ratio for 8 stars (including HD 82943)known to host extra-solar planets, and for several similarstars not known to have extra-solar planets. Our principalresult is that 6Li is not detected in HD82943 or other stars.
The next section describing our observations is followed bya thorough description of our method of analysis. We useHD 82943 as one of the stars with which to illustrate ourmethod. After presenting our results for the 6Li/7Li ratio,we discuss the implications of the non-detections of 6Li, aswell as offering a few remarks on the lithium abundance inthe atmosphere of stars which host extra-solar planets.
2 OBSERVATIONS
The observed stars listed in Table 1 fall into two categories:stars with extra-solar planets, and similar stars for whichthere are no reported planets. Chosen stars have a Li i 6707A line of a strength enabling a meaningful limit (or detec-tion) to be set on the lithium isotopic ratio. Sharp-linedstars were given priority. The star 16 Cyg B, a host forplanets but almost lacking in lithium, was observed in orderto check on lines that might blend with the Li i 6707 A fea-ture. Comparison stars of similar atmospheric parameterswere observed including HD91889 with others chosen fromsurveys for lithium abundances by Balachandran (1990) andChen et al. (2000).
All of our observations were obtained with the coudeechelle cross-dispersed spectrograph 2dcoude at the W.J.McDonald Observatory’s 2.7m Harlan J. Smith reflector(Tull et al. 1995). The spectrograph was used in its higherresolution mode. The recorded spectrum provides incom-plete coverage of 12 orders. The order containing 6707 A
c© 0000 RAS
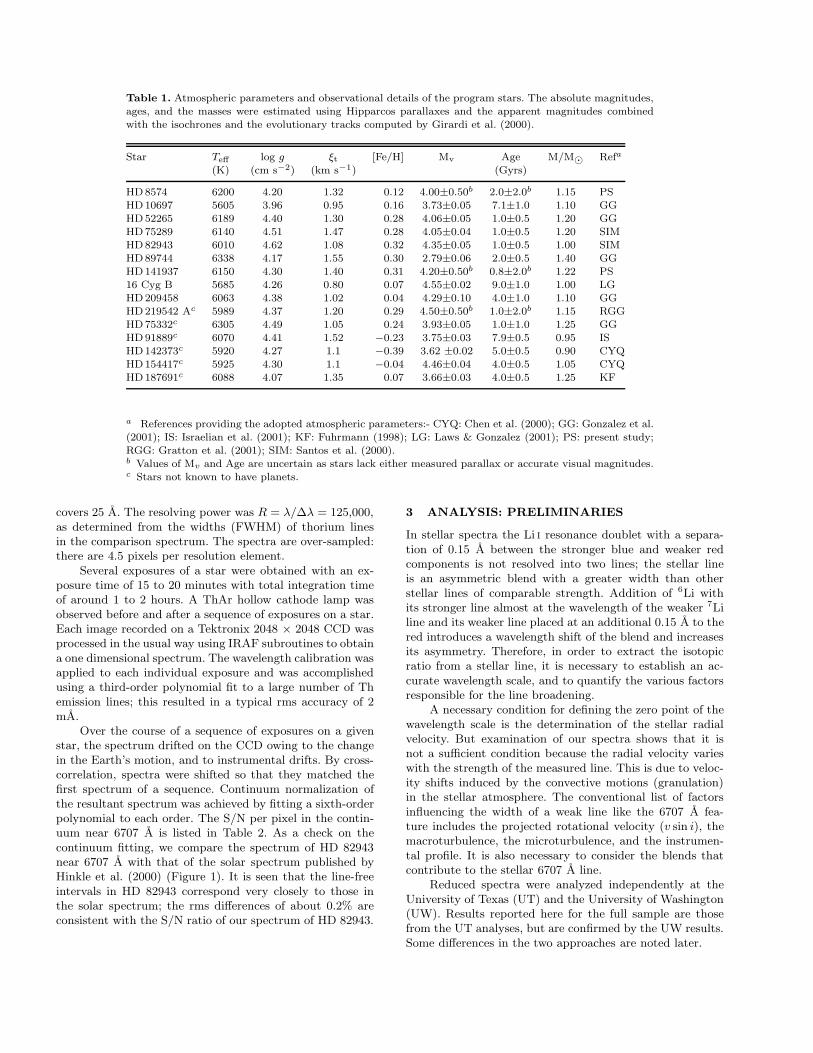
Table 1. Atmospheric parameters and observational details of the program stars. The absolute magnitudes,ages, and the masses were estimated using Hipparcos parallaxes and the apparent magnitudes combinedwith the isochrones and the evolutionary tracks computed by Girardi et al. (2000).
Star Teff log g ξt [Fe/H] Mv Age M/M⊙ Refa
(K) (cm s−2) (km s−1) (Gyrs)
HD8574 6200 4.20 1.32 0.12 4.00±0.50b 2.0±2.0b 1.15 PSHD10697 5605 3.96 0.95 0.16 3.73±0.05 7.1±1.0 1.10 GGHD52265 6189 4.40 1.30 0.28 4.06±0.05 1.0±0.5 1.20 GGHD75289 6140 4.51 1.47 0.28 4.05±0.04 1.0±0.5 1.20 SIMHD82943 6010 4.62 1.08 0.32 4.35±0.05 1.0±0.5 1.00 SIMHD89744 6338 4.17 1.55 0.30 2.79±0.06 2.0±0.5 1.40 GGHD141937 6150 4.30 1.40 0.31 4.20±0.50b 0.8±2.0b 1.22 PS16 Cyg B 5685 4.26 0.80 0.07 4.55±0.02 9.0±1.0 1.00 LGHD209458 6063 4.38 1.02 0.04 4.29±0.10 4.0±1.0 1.10 GGHD219542 Ac 5989 4.37 1.20 0.29 4.50±0.50b 1.0±2.0b 1.15 RGGHD75332c 6305 4.49 1.05 0.24 3.93±0.05 1.0±1.0 1.25 GGHD91889c 6070 4.41 1.52 −0.23 3.75±0.03 7.9±0.5 0.95 ISHD142373c 5920 4.27 1.1 −0.39 3.62 ±0.02 5.0±0.5 0.90 CYQHD154417c 5925 4.30 1.1 −0.04 4.46±0.04 4.0±0.5 1.05 CYQHD187691c 6088 4.07 1.35 0.07 3.66±0.03 4.0±0.5 1.25 KF
a References providing the adopted atmospheric parameters:- CYQ: Chen et al. (2000); GG: Gonzalez et al.(2001); IS: Israelian et al. (2001); KF: Fuhrmann (1998); LG: Laws & Gonzalez (2001); PS: present study;RGG: Gratton et al. (2001); SIM: Santos et al. (2000).b Values of Mv and Age are uncertain as stars lack either measured parallax or accurate visual magnitudes.c Stars not known to have planets.
covers 25 A. The resolving power was R = λ/∆λ = 125,000,as determined from the widths (FWHM) of thorium linesin the comparison spectrum. The spectra are over-sampled:there are 4.5 pixels per resolution element.
Several exposures of a star were obtained with an ex-posure time of 15 to 20 minutes with total integration timeof around 1 to 2 hours. A ThAr hollow cathode lamp wasobserved before and after a sequence of exposures on a star.Each image recorded on a Tektronix 2048 × 2048 CCD wasprocessed in the usual way using IRAF subroutines to obtaina one dimensional spectrum. The wavelength calibration wasapplied to each individual exposure and was accomplishedusing a third-order polynomial fit to a large number of Themission lines; this resulted in a typical rms accuracy of 2mA.
Over the course of a sequence of exposures on a givenstar, the spectrum drifted on the CCD owing to the changein the Earth’s motion, and to instrumental drifts. By cross-correlation, spectra were shifted so that they matched thefirst spectrum of a sequence. Continuum normalization ofthe resultant spectrum was achieved by fitting a sixth-orderpolynomial to each order. The S/N per pixel in the contin-uum near 6707 A is listed in Table 2. As a check on thecontinuum fitting, we compare the spectrum of HD 82943near 6707 A with that of the solar spectrum published byHinkle et al. (2000) (Figure 1). It is seen that the line-freeintervals in HD 82943 correspond very closely to those inthe solar spectrum; the rms differences of about 0.2% areconsistent with the S/N ratio of our spectrum of HD 82943.
3 ANALYSIS: PRELIMINARIES
In stellar spectra the Li i resonance doublet with a separa-tion of 0.15 A between the stronger blue and weaker redcomponents is not resolved into two lines; the stellar lineis an asymmetric blend with a greater width than otherstellar lines of comparable strength. Addition of 6Li withits stronger line almost at the wavelength of the weaker 7Liline and its weaker line placed at an additional 0.15 A to thered introduces a wavelength shift of the blend and increasesits asymmetry. Therefore, in order to extract the isotopicratio from a stellar line, it is necessary to establish an ac-curate wavelength scale, and to quantify the various factorsresponsible for the line broadening.
A necessary condition for defining the zero point of thewavelength scale is the determination of the stellar radialvelocity. But examination of our spectra shows that it isnot a sufficient condition because the radial velocity varieswith the strength of the measured line. This is due to veloc-ity shifts induced by the convective motions (granulation)in the stellar atmosphere. The conventional list of factorsinfluencing the width of a weak line like the 6707 A fea-ture includes the projected rotational velocity (v sin i), themacroturbulence, the microturbulence, and the instrumen-tal profile. It is also necessary to consider the blends thatcontribute to the stellar 6707 A line.
Reduced spectra were analyzed independently at theUniversity of Texas (UT) and the University of Washington(UW). Results reported here for the full sample are thosefrom the UT analyses, but are confirmed by the UW results.Some differences in the two approaches are noted later.
6706 6708 6710
0.7
0.8
0.9
1
6706 6708 6710
0.7
0.8
0.9
1
SUN
HD 82943
Figure 1. A comparison of the spectrum of HD 82943 and the Sun from 6705 A to 6710.25 A. Note the similar strengths and widthsof the several Fe i lines but the great difference in the Li i 6707.7 A feature.
3.1 Radial Velocity and Convective Velocity Shifts
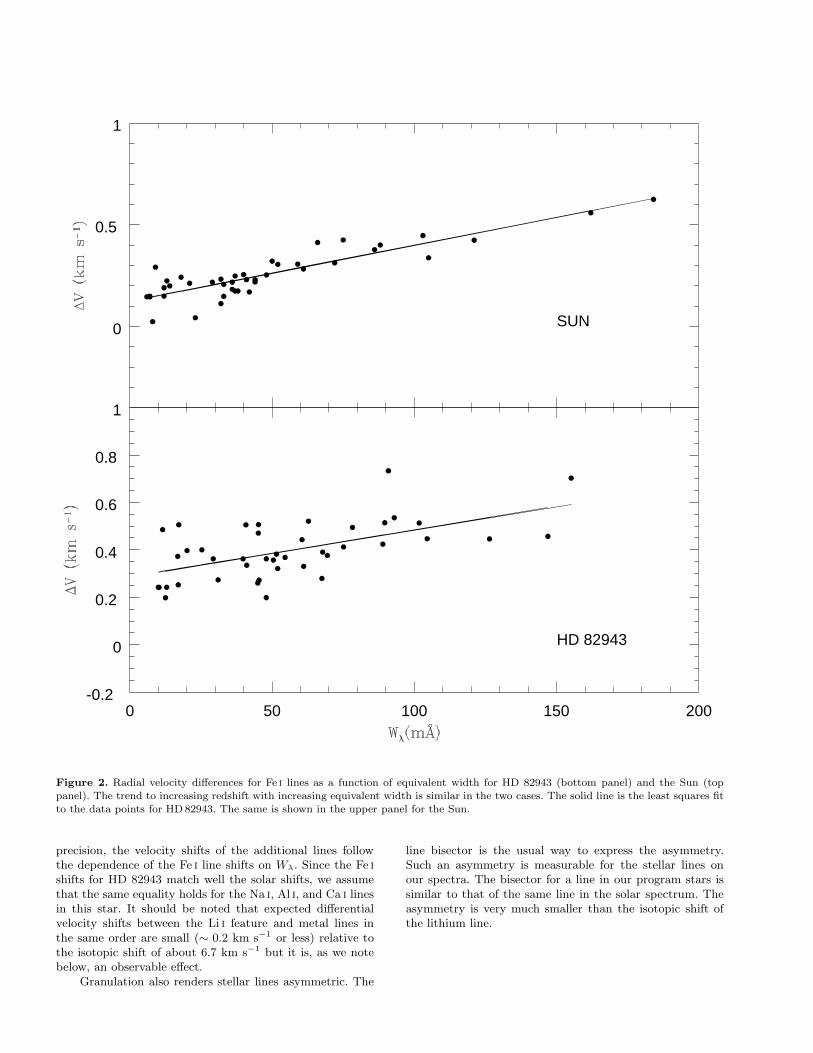
The stellar radial velocity was measured for a sample of un-blended Fe i lines using the accurate laboratory wavelengthsreported by Nave et al. (1994). There is a clear trend ofvelocity with equivalent width (Wλ) (Figure 2) in that theweaker lines are blue-shifted with respect to the strongerlines. This is a well known phenomenon attributed to gran-ulation – see the set of extensive measurements on Fe i linesin the Sun and Procyon reported by Allende Prieto & GarcıaLopez (1998) and Allende Prieto et al. (2002), respectively.
The parallel with the Sun is almost exact, as might be ex-pected from Figure 1. Velocities of the same Fe i lines havebeen measured from Hinkle et al.’s (2000) solar atlas (Figure2).
Convective shifts are expected to depend on the atom orion providing the line and on the line’s excitation potentialas well as its strength. In order to estimate the shift thatmight be expected of the Li i resonance line, we measuredthe solar shifts for lines in the red due to low excitationlines of Na i, Al i, and Ca i: there are few of these lines in thelimited bandpass of our stellar spectra. To a satisfactory
0
0.5
1
SUN
0 50 100 150 200-0.2
0
0.2
0.4
0.6
0.8
1
HD 82943
Figure 2. Radial velocity differences for Fe i lines as a function of equivalent width for HD 82943 (bottom panel) and the Sun (toppanel). The trend to increasing redshift with increasing equivalent width is similar in the two cases. The solid line is the least squares fitto the data points for HD 82943. The same is shown in the upper panel for the Sun.
precision, the velocity shifts of the additional lines followthe dependence of the Fe i line shifts on Wλ. Since the Fe i
shifts for HD 82943 match well the solar shifts, we assumethat the same equality holds for the Na i, Al i, and Ca i linesin this star. It should be noted that expected differentialvelocity shifts between the Li i feature and metal lines inthe same order are small (∼ 0.2 km s−1 or less) relative tothe isotopic shift of about 6.7 km s−1 but it is, as we notebelow, an observable effect.
Granulation also renders stellar lines asymmetric. The
line bisector is the usual way to express the asymmetry.Such an asymmetry is measurable for the stellar lines onour spectra. The bisector for a line in our program stars issimilar to that of the same line in the solar spectrum. Theasymmetry is very much smaller than the isotopic shift ofthe lithium line.

3.2 Stellar Atmospheric Parameters
Calculation of synthetic spectra requires a model atmo-sphere, and a line list. A model atmosphere was chosenfrom the grid provided by Kurucz (1995) according to theparameters Teff , log g, and [Fe/H] derived from publishedabundance analyses (see references given in Table 1. In thisanalysis we used an updated spectral analysis code MOOG(Sneden, 1973). The lithium isotopic analysis is insensitiveto the particular choice of parameters. This and the factthat the published analyses are comprehensive mean thatit is not necessary to derive afresh these parameters. Fortwo stars with extra-solar planets, HD8574 and HD141937,with atmospheric parameters unavailable in the literature,the parameters Teff , log g, ξt, and [Fe/H] were derived using50 well defined Fe i and 4 Fe ii lines with the required oscil-lator strengths (gf -values) for Fe i lines taken from Nave etal. (1994) and from Giridhar & Ferro (1995) for Fe ii lines.We estimate uncertainties of about ±150 K in Teff , ±0.25 inlog g, 0.25 km s−1 in ξt, and ±0.10 in [Fe/H].
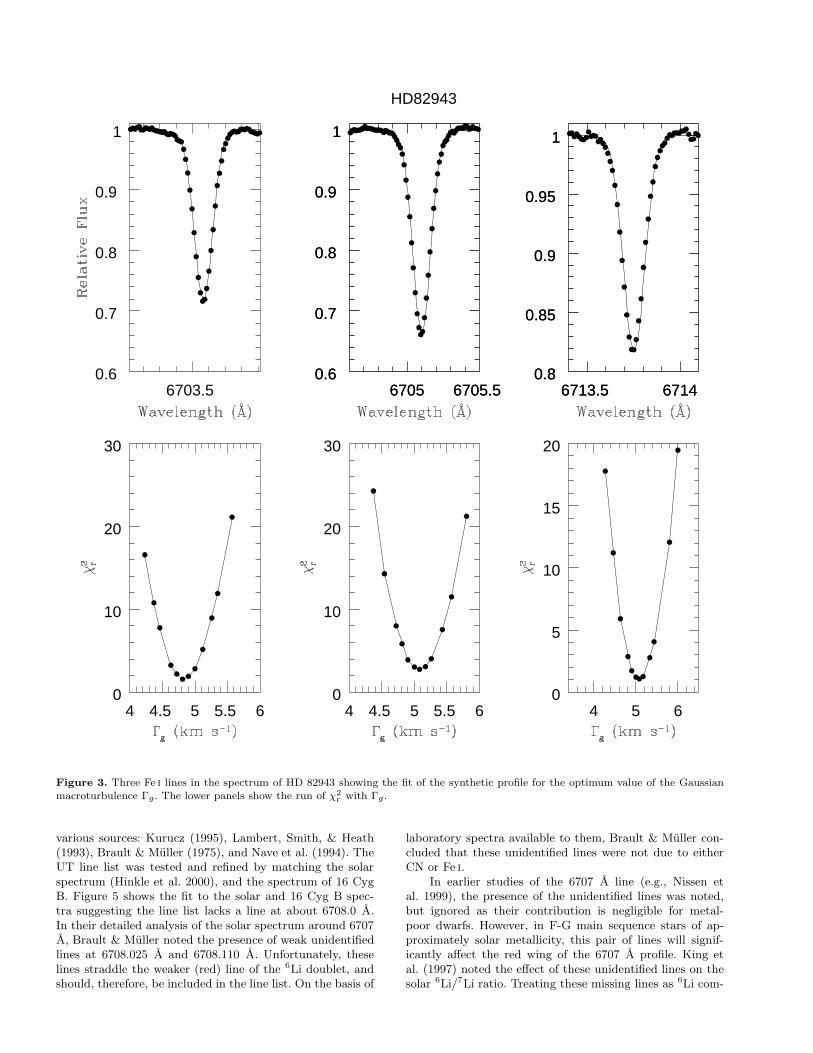
To match synthetic to observed spectra requires infor-mation on the various atmospheric effects that broaden thestellar profiles. The UT analysis considered three Fe i linesin the same echelle order as the Li i feature and of a simi-lar strength to it. They are the lines at 6703.5, 6705.1, and6713.7 A. Synthetic profiles were computed using the appro-priate model atmosphere, the iron abundance, and the mi-croturbulence to match a Fe i line’s equivalent width. Twoindependent schemes were then employed to fit the syntheticline to the observed line profile. In the first scheme, the syn-thetic profile was broadened by a Gaussian modeled macro-turbulence defined by Γg, representing the combined effectsof stellar rotation, macroturbulence, and the instrumentalprofile as provided by the thorium lines in the comparisonspectrum. In the second scheme, macroturbulence and rota-tional broadening were treated as different sources of broad-ening.
In the first scheme, the Γg was varied to match theobserved profile of a selected Fe i line with the best fit judgedby the reduced χ2
r where
χ2
r =1
d
n∑
1
(Oi − Pi)2
σ2(1)
where Oi and Pi respectively are the observed and pre-dicted relative fluxes at data point i across the line profile,σ is the rms error of the continuum, d = n − c (= 22 forFe i and 35 for Li i, typically) is the number of degrees offreedom in the fit, n is the number of observed data pointsinvolved in the fit, and c is the number of parameters to bedetermined from the computed line profile fit. Here, c is 3 forFe i lines (i.e., abundance, radial velocity, and the parameterΓg), and 4 for the Li i line with the isotopic 6Li/7Li ratio asthe additional parameter. The run of χ2 with Γg is plottedand the minimum value found.
The agreement between the predicted and the observedprofiles is quantified with the χ2-test. The fit is consideredvery good when the χ2
r ≃ 1 for the best fit (Bevington &Robinson 1992). For HD 82943, Figure 3 shows the threeFe i profiles and the run of χ2
r as a function of Γg in thefirst scheme. Two of the lines are fit with a minimum χ2
r
≃ 1, and the third with a slightly higher value. The threeresults are consistent with a mean value Γg = 5.03±0.12 km
s−1. Such a determination ignores the small line asymmetry.Rotational and instrumental broadening are subsumed intoΓg.
In the second scheme, all stars were also analyzed withv sin i and Vm as free parameters. The v sin i and Vm valuesare determined for a given Fe abundance (determined fromequivalent widths) such that the computed profiles best fit(i.e minimum χ2
r values) the observed Fe profiles. Figure 4shows the results for an Fe i line for HD 82943 along witha similar star HD 75289. The three Fe i lines were fitted inthis way. The quality of the fits to the observed profile isquite similar to that obtained just using Γg. Results for Γg,Vm and v sin i are given in Table 2 for all the program stars.
In the UW analysis, the Fe i lines at 5852.2, 6330.9,6703.5, and 6705.1, and 6715.4 A were employed to deter-mine the line broadening parameters v sin i and Vm. Instru-mental broadening was handled in the same manner as theUT group and the limb darkening coefficients were estimatedusing the work of Gray (1992). A linelist for 1 A regions sur-rounding each line was prepared via comparison of syntheticprofiles generated using the MOOG spectral synthesis code(Sneden, 1973) at 0.001 A resolution with both the SolarFlux Atlas (Kurucz et al. 1984) and spectra of 16 Cyg B.As in similar prior work by Gonzalez (1998) and Takeda(1995), we discovered that in order to achieve good fits tothese Fe i features using accurate atmospheric parametersand accepted values for solar rotational and macroturbulentvelocities, it was necessary to both reduce the microturbu-lent velocity, ξt, by a factor of 0.4 and allow for a 0.03 -0.05 dex offset in [Fe/H]. Applying this correction factor toξt results in a more accurate v sin i. However, adopting astandard value of ξt would still result in a good fit to theline profiles. Synthetic profiles were calculated for each lineusing Kurucz (1995) model atmospheres, selected accord-ing to published values of Teff , log g, and [Fe/H] (Table 1);accompanying estimates of ξt were adjusted in a mannerconsistent with that performed to fit the solar spectra. Ineach case, the precise placement of the continuum level wasset to minimize the reduced χ2
r values of fits to adjacentcontinuum regions, and the velocity offset ∆v was adjustedto minimize the difference between the centroids of the ob-served and synthesized Fe lines.
The UW analysis is based on 10-20 thousand synthe-sized profiles for each line at increments of 0.05 km s−1 inboth v sin i and Vm and 0.01 dex in [Fe/H]. Values of χ2
r
were calculated for each fit, resulting in 2-dimensional gridsof χ2
r as a function of v sin i and Vm for 4-7 values of [Fe/H].For each Fe i line, we adopt those values of v sin i and Vm
which yielded the minimum values of χ2r amongst all com-
peting fits. We take as our final solution for each star theaverage of the best-fit broadening parameters found fromeach line, and quote the standard deviation of their mean asan estimate of uncertainty. The final resulting broadeningparameters for the UW group are given in Table 2.
3.3 The Line List around 6707 A.
Atomic data - wavelengths and gf -values - for the Li i 6707 Adoublet and its isotopic and hyperfine splittings are of veryhigh quality (Smith, Lambert, & Nissen 1998; Hobbs, Thor-burn, & Rebull 1999). For the UT line list, potential blend-ing atomic and molecular (CN) lines were identified from
6703.50.6
0.7
0.8
0.9
1
4 4.5 5 5.5 60
10
20
30
HD82943
6705 6705.50.6
0.7
0.8
0.9
1
6705 6705.50.6
0.7
0.8
0.9
1
4 4.5 5 5.5 60
10
20
30
6713.5 67140.8
0.85
0.9
0.95
1
6713.5 67140.8
0.85
0.9
0.95
1
4 5 60
5
10
15
20
Figure 3. Three Fe i lines in the spectrum of HD 82943 showing the fit of the synthetic profile for the optimum value of the Gaussianmacroturbulence Γg. The lower panels show the run of χ2
r with Γg.
various sources: Kurucz (1995), Lambert, Smith, & Heath(1993), Brault & Muller (1975), and Nave et al. (1994). TheUT line list was tested and refined by matching the solarspectrum (Hinkle et al. 2000), and the spectrum of 16 CygB. Figure 5 shows the fit to the solar and 16 Cyg B spec-tra suggesting the line list lacks a line at about 6708.0 A.In their detailed analysis of the solar spectrum around 6707A, Brault & Muller noted the presence of weak unidentifiedlines at 6708.025 A and 6708.110 A. Unfortunately, theselines straddle the weaker (red) line of the 6Li doublet, andshould, therefore, be included in the line list. On the basis of
laboratory spectra available to them, Brault & Muller con-cluded that these unidentified lines were not due to eitherCN or Fe i.
In earlier studies of the 6707 A line (e.g., Nissen etal. 1999), the presence of the unidentified lines was noted,but ignored as their contribution is negligible for metal-poor dwarfs. However, in F-G main sequence stars of ap-proximately solar metallicity, this pair of lines will signif-icantly affect the red wing of the 6707 A profile. King etal. (1997) noted the effect of these unidentified lines on thesolar 6Li/7Li ratio. Treating these missing lines as 6Li com-

6705 6705.50.6
0.7
0.8
0.9
1
6705 6705.50.6
0.7
0.8
0.9
1
1 2 3 40
2
4
6
1 2 3 40
2
4
6
6705 6705.50.7
0.8
0.9
1
6705 6705.50.7
0.8
0.9
1
3 4 50
1
2
3
4
3 4 50
1
2
3
4
Figure 4. Determination of v sin i and Vm for HD82943 and HD75289
ponents they obtain 6Li/7Li = 0.10 for the Sun. This high Liisotopic ratio for the sun is very unlikely for obvious reasons,and they attributed the lines to Si I. In the solar spectrum,the 6708.025 A and 6708.110 A lines have equivalent widthsof Wλ = 1.4 mA, and < 0.5 mA, respectively. Our analysesof the solar and 16 Cyg B spectra give lithium (7Li) abun-dances consistent with previous analyses. For the Sun, ourline list with the Kurucz solar model gives log ǫ(Li) = 0.98and for 16 Cyg B we obtain log ǫ(Li) = 0.71 which are closeto the values of log ǫ(Li) = 1.05±0.06 and log ǫ(Li) ≤0.60,respectively, derived by King et al. (1997).
Our analysis of selected stars was made first without
the unidentified lines in the line list. Then, we repeated theanalysis on the assumption that they were neutral Ti lineswith a lower excitation potential of 1.88 eV and derived theirgf -values from a fit to the solar spectrum. As a check, wesynthesised the spectrum of 16 Cyg B and found that the(unidentified) Ti i lines matched the observed feature well(Figure 5). The star 16 Cyg B is cooler than most of ourprogram stars and is very deficient in lithium (King et al.1997).
Figure 5 shows that while the 7Li feature gets weaker,the missing feature at 6708.0 A is a little stronger in 16 CygB than in the solar spectrum. We have varied the assumed

Table 2. Lithium isotopic 6Li/7Li ratio results derived from 6707 A Li-profile. One-σ errors are quoted.
Star S/N Γg v sini Vm v sinia V am log ǫ(Li)b 6Li/7Lib χ2
minb
(km s−1) (km s−1) (km s−1) (km s−1) (km s−1) (dex)
HD 8574 300 7.22±0.16 3.30±0.20 4.65±0.10 3.60±0.26 5.30±0.30 2.71±0.05 0.03±0.05 1.02HD 10697 300 5.27±0.10 1.20±0.30 4.30±0.15 1.61±0.19 4.04±0.18 1.91±0.03 0.00±0.06 1.15HD 52265 450 7.39±0.08 3.10±0.25 5.50±0.13 3.88±0.11 4.81±0.16 2.76±0.01 0.01±0.03 1.05HD 75289 350 7.08±0.10 3.40±0.25 4.50±0.10 4.17±0.25 4.15±0.30 2.77±0.02 0.02±0.03 0.90HD 82943 450 5.03±0.12 1.60±0.20 3.65±0.10 2.09±0.19 3.73±0.13 2.43±0.02 0.00±0.02 1.06HD 82943c 530 5.00±0.14 1.55±0.13 3.73±0.15 ... ... 2.43±0.02 0.01±0.03 1.20HD 89744 550 13.54±0.20 7.60±0.28 8.00±0.20 8.02±0.13 7.71±0.32 2.11±0.01 0.00±0.03 1.20HD 141937 380 5.14±0.25 1.15±0.30 3.85±0.15 1.89±0.26 4.00±0.29 2.55±0.04 0.01±0.03 1.1216 Cyg B 600 4.79±0.10 1.60±0.25 3.30±0.18 1.64±0.16 3.49±0.16 0.71±0.02 0.00±0.03 1.30HD 209458 450 7.24±0.05 3.33±0.15 4.83±0.18 3.57±0.11 5.24±0.22 2.70±0.02 0.00±0.03 0.96HD 219542 A 300 4.50±0.20 1.55±0.25 3.55±0.10 2.24±0.16 3.66±0.12 2.26±0.03 0.03±0.04 1.06HD 75332 650 12.62±0.21 8.05±0.20 6.78±0.23 8.20±0.06 6.60±0.16 3.18±0.01 0.00±0.02 1.05HD 91889 600 6.63±0.12 2.20±0.30 5.15±0.16 2.89±0.26 4.49±0.14 2.46±0.02 0.00±0.02 0.98HD 142373 700 5.12±0.13 1.05±0.20 4.28±0.15 2.21±0.51 3.67±0.46 2.52±0.01 0.00±0.01 1.36HD 154417 600 8.68±0.18 3.95±0.32 6.35±0.18 4.90±0.06 5.10±0.12 2.68±0.01 0.00±0.01 1.18HD 187691 700 6.40±0.08 1.90±0.20 5.25±0.25 2.88±0.12 5.20±0.18 2.56±0.01 0.03±0.02 0.95
a Values independently derived by UW group.b Values computed using the single Gaussian broadening parameter Γg.c Two spectra of HD 82943 were obtained and independently analysed.
excitation potential of the Ti i lines, and tested to changesin Teff . We found a Ti i line with a LEP of 1.88 eV varieswith Teff by around 0.08 dex/100 K, and for a LEP of 0.0eV, the Ti i line strength varies by 0.12 dex/100 K. Thus,by adopting 1.88 eV lines of neutral Ti for the unidentifedlines, instead of 0.0 eV lines, we overestimate their strengthby around 0.10 dex for stars of Teff = 6400 K, the hotteststars in our sample. Higher LEP lines of Ti and lines ofhigher ionisation potential elements like Si and Mg also in-vestigated. Within our Teff range, the Teff effect on strengthof these lines does not have noticeble effect on 6Li/7Li ra-tios. Given that our programme stars are quite similar tothe Sun, identification of the pair as Ti i lines is not criticalto the analysis, but their inclusion is critical. The final linelist is given in Table 3.
4 THE 6Lı/7Lı RATIO
Addition of 6Li to the mix of lithium isotopes shifts the6707 A line to the red and increases the line’s asymmetry.For the meteoritic isotopic ratio (6Li/7Li ∼ 0.10), the center-of-gravity of the profile shifts redward by ∼ 710 m s−1 withrespect to the 7Li-only profile. Under ideal conditions, wherethe observed line shifts are independent of their strength andcarrier, it is straightforward to determine the wavelengthscale from Fe i and other lines and to estimate the 6Li contri-bution from the 6707 A line’s wavelength. Convective shiftsin the atmosphere introduce a trend in the relation betweena line’s wavelength and strength (Figure 2). In the case ofHD82943, the Fe i lines of strength Wλ ≈ 50 mA are shiftedby 120 m s−1 relative to lines of strength Wλ ∼ 10 mA. Thedifferential shift is evident from syntheses of the 6707 A re-gion. When all lines are given an identical radial velocity,it proved impossible to fit simultaneously the Li i line andthe adjacent weaker Fe i at 6707.433 A. While the latter line
was matched in strength and width, the wavelength separa-tion between it and the Li i line was not. When the stellarradial velocity is measured from the Fe i lines at 6703 A and6705 A, a pair of lines similar in strength to the Li line, theobserved wavelength of the deepest part of the Li i line is atthe predicted wavelength for 6Li/7Li = 0.0 to within about1 mA. This predicted wavelength is moderately sensitive tosmall amounts of 6Li, for example, the shift from 6Li/7Li =0.0 to 0.1 is 0.005 mA (∼ 220 m s−1), but use of the wave-length is compromised by the presence of convective shifts.
As our primary monitor of the lithium isotopic ratio,we use the profile of the 6707 A line. This is less affectedby the granulation. The Li abundance and the 6Li/7Li ra-tios for the program stars are derived with the followingprocedure by the UT group. Using the model parametersgiven in Table 2 and the line list given in Table 3, Li-profilesare computed for a given 6Li/7Li ratio by varying the Liabundance and the wavelength of the Li i line such that thepredicted profile fits best the observed profile. We also tookthe liberty to adjust the observed profile vertically withinthe rms error (∼ S/N−1) of the continuum. Abundances ofelements (C, N, Ti, V, and Fe) contributing lines that areblended with the Li-profile are taken from the sources whichprovided the atmospheric parameters (see Table 1 for refer-ences). Predicted profiles are first broadened with the singleGaussian parameter Γg and compared with the observedprofile. Then, the procedure is repeated but the predictedprofiles are broadened using the combination of v sin i, Vm,and the instrumental broadening.
Sample results are shown in Figure 6 for HD 82943 forthe case where rotation and macroturbulence are treatedas separate effects. Synthetic profiles for the case of Gaus-sian broadening parameter Γg alone are not discernibly dif-ferent. The agreement between the predicted and the ob-served profiles is quantified using χ2
r. The minimum values,χ2
min, obtained from χ2r analysis are given in Table 2. In Fig-

6706.5 6707 6707.5 6708 6708.50.9
0.92
0.94
0.96
0.98
1
16CygB
0.9
0.92
0.94
0.96
0.98
1
Sun
Figure 5. Observed and synthetic spectra around the Li i 6707 A feature for the Sun and 16 Cyg B. The contribution of the unidentifiedlines near the weaker 6Li line is given by the difference between the dashed and solid lines between 6707.9 A and 6708.2 A.
ure 6, the minimum χ2 variation values, ∆χ2, for HD82943obtained for different 6Li/7Li ratios are plotted. The ∆χ2
is computed by subtracting χ2r from the χ2
f ; where χ2
f iscomputed by dropping wavelength as a free parameter. Thewavelength is fixed for the minimum χ2
min value from theχ2
r analysis. Thus, by definition both the χ2r and χ2
f shouldhave the same minimum value of χ2
min. For HD82943, weobtained the abundance log ǫ(Li) = 2.435±0.005 and theratio 6Li/7Li = 0.00±0.03. The quoted 1-σ errors in the iso-topic ratios (Table 3) are obtained from the χ2 variation,the formal 1-σ, 2-σ, and 3-σ errors (Bevington & Robinson
1992) are indicated in Figure 6. The quoted errors in thelog ǫ(Li) are 1-σ errors obtained from the χ2 variation ofthe Li-profile fitting, and do not include errors arising fromthe choice of model atmosphere parameters, especially theeffective temperature.
In Table 2, we give the results for the lithium abundanceand isotopic ratio obtained in the UT analysis using the as-sumed single line broadening parameter Γg. Also, values ofχ2
min for the final best fit between the observed and the pre-dicted Li-profile are given in Table 2. The abundance andthe isotopic ratio show very weak dependence on how the

6707.5 67080.75
0.8
0.85
0.9
0.95
1
6707.5 67080.75
0.8
0.85
0.9
0.95
1
6707.5 67080.75
0.8
0.85
0.9
0.95
1
6707.5 67080.75
0.8
0.85
0.9
0.95
1
-0.05 0 0.05 0.1 0.150
10
20
30
6707.5 6708
0.75
0.8
0.85
0.9
0.95
1
6707.5 6708
0.75
0.8
0.85
0.9
0.95
1
6707.5 6708
0.75
0.8
0.85
0.9
0.95
1
6707.5 6708
0.75
0.8
0.85
0.9
0.95
1
-0.05 0 0.05 0.1 0.150
5
10
15
20
25
Figure 6. Computed synthetic profiles for different 6Li/7Li ratios are compared with the observed Li-profile. Computed profiles arebroadened with the broadening parameter Γg (top panel) and with the separated radial-tangential macroturbulence, rotational velocityand the instrumental profile (bottom panel). The χ2 variance ∆χ2 versus the Li isotopic ratio is shown for both the cases. The errors1-σ, 2-σ, and 3-σ are noted.
velocity broadening is assigned. Additional examples of ob-served and synthetic spectra and accompanying plots of χ2
are shown in Figures 7 & 8. Although the lithium abundanceis sensitive to the adopted model atmosphere – temperatureis the controlling influence – the isotopic ratio is quite in-sensitive to it. We repeated the analysis using models drawnfrom the MARCS grid (Gustafsson et al. 1975) and foundno noticeable difference in either the broadening parame-ters or the Li-isotopic ratio. Table 2 shows that, across the
sample of stars, the lithium is pure 7Li with no convincingdetection of 6Li. This result holds for stars with and withoutextra-solar planets.
Our analysis of the 6707 A line profile using standardmodel atmospheres obviously neglects the influence of thestellar granulation, which is responsible for the line shiftsand asymmetries. These can have only a slight effect on theresults. Stellar equivalents of sunspots and faculae mightcause the lithium line to be strengthened over a few localized

Table 3. Adopted linelist at the vicinity of the Li 6707A profile
λ Element LEP log gf
(A) (eV ) (dex)
6707.381 CN 1.83 -2.1706707.433 Fe i 4.61 -2.2836707.450 Sm ii 0.93 -1.0406707.464 CN 0.79 -3.0126707.521 CN 2.17 -1.4286707.529 CN 0.96 -1.6096707.529 CN 2.01 -1.7856707.529 CN 2.02 -1.7856707.563 V i 2.74 -1.5306707.644 Cr i 4.21 -2.1406707.740 Ce ii 0.50 -3.8106707.752 Ti i 4.05 -2.6546707.7561 7Li 0.00 -0.4286707.7682 7Li 0.00 -0.2066707.771 Ca i 5.80 -4.0156707.816 CN 1.21 -2.317
6707.9066 7Li 0.00 -1.5096707.9080 7Li 0.00 -0.8076707.9187 7Li 0.00 -0.8076707.9196 6Li 0.00 -0.4796707.9200 7Li 0.00 -0.8076707.9230 6Li 0.00 -0.1786708.025 Ti i 1.88 -2.2526708.0728 6Li 0.00 -0.3036708.094 V i 1.22 -3.1136708.125 Ti i 1.88 -2.8866708.280 V i 1.22 -2.1786708.375 CN 2.10 -2.252
regions of a stellar disk. Consider, for example, a strength-ening of the line in an area close to the receding limb of thestar. The result would be a red asymmetry to the lithiumline, and quite possibly a weaker asymmetry would be im-posed on the Fe i comparison lines used to set the broadeningparameters. In these circumstances, one might overestimatethe contribution of 6Li. Similary, if areas on the approach-ing limb carry undue weight in forming the profile, the 6Licontribution could be underestimated. If a major portion ofthe Li i line is formed in a few special areas, our theoreticalprofiles would fail to fit the observed profiles.
Our demonstration that excellent fits to the 6707 A pro-files are possible is a good indication that stellar spots andfaculae cannot play an important role. Israelian et al. rec-ognized that a false 6Li signal could arise from the neglectof the effects of localized regions on the formation of the6707 A line. They advanced cogent reasons - photometricand radial velocity stability - for rejecting this possibility inthe case of HD 82943. The fact that our observed profilesare very similar to their profile (see below) is additional ev-idence that the lithium line is not formed preferentially in afew areas.
4.1 The Case of HD 82943
Israelian et al. (2001) derived the high value of 6Li/7Li =0.126 ± 0.014 for HD82943. Our analysis (UT and UW)shows no indication of 6Li or 6Li/7Li = 0.0±0.03. One canthink of two possibilities for the discrepant results: a) a dif-
ference in the observed spectra, and b) differences in theanalyses.
Israelian et al.’s spectrum is of similar quality to ourswith respect to resolving power (R = 110,000 vs our 125,000)and S/N ratio in the continuum near the Li i line ( S/N∼ 500in both the studies). Comparison of their electronically pub-lished Li i profile for HD82943 with our profiles shows nearperfect agreement; the differences are much smaller thanthose between synthetic profiles for 6Li/7Li = 0.0 and 0.13.
Given that there is no difference between Israelian etal.’s and our spectra of a size sufficient to account for thedifferent 6Li/7Li ratios, the sources of the discrepancy mustlie in the methods of analysis. In seeking an explanation,we consider the adopted model atmospheres, the fitted linebroadening parameters, and the chosen line lists. We adoptthe model atmosphere parameters – Teff , log g, [Fe/H], and ξt
– used by Israelian et al. They do not explicitly indicate thesource of the model atmosphere but it is most improbablethat given the similarities between modern grids of modelatmospheres (see our test of a MARCS model) that an alter-native choice can lead to anything but a very small changein the recovered 6Li/7Li ratio.
In obtaining the broadening parameters, Israelian et al.used two of our three Fe i lines to obtain v sin i = 1.65 ±
0.05 km s−1 and Vm = 3.90 ± 0.2 km s−1. These com-pare well with our values v sin i = 1.60 ± 0.20 km s−1, andVm = 3.65± 0.10 km s−1, where we assumed the same formfor Vm as Israelian et al. Analysis of our spectrum usingtheir broadening parameters also gives 6Li/7Li = 0.01, not0.126. Our result is insensitive to the form adopted (Gaus-sian macroturbulence vs rotation and macroturbulence) forthe line broadening (Figure 9).
The inferred contribution from 6Li to the observed pro-file depends on the completeness and accuracy of the linelist. It would appear from their paper that Israelian et al.did not include the unidentified line at 6708.025 A in theirline list, and overlooked the weaker line at 6708.125 A. Theunidentified lines which we assign to Ti i play a role becausethey lie on either side of the weaker 6Li i line. Their com-bined strength in the solar spectrum is about 1.5 mA. Ina metal-rich star like HD 82943, their strength is greaterthan in the Sun. Given that the equivalent width of the6707 A feature is 50 mA for HD82943, the lines’ estimatedcontribution of 2.2 mA to the weaker 6Li line correspondsto 6Li/7Li ∼ 0.06. The linelist compiled independently atthe University of Washington differs very little from that inTable 3. Use of this linelist instead of that in Table 3 doesnot give significantly different synthetic spectra computedfor the same input data. Israelian et al. used HD91889 as acomparison star, but this is not necessarily a perfect foil foreliminating the effects of weak blends. This star is metal-poor with [Fe/H] = −0.23 or 0.55 dex down from HD82943.This relative metal deficiency plus slight differences in effec-tive temperature and surface gravity mean that unidentifiedlines like the supposed Ti i lines will be appreciably weakerin HD91889 than in HD82943. In contrast, our sample ofcomparison stars includes examples of similar metallicity toHD82943.
To investigate further the influence of the unidentifiedlines, we analysed the HD82943 profile with different Tiabundances assigned to the pair of unidentified lines. As theabundance is decreased, the drop in absorption from the Ti i

6707.5 67080.7
0.8
0.9
1
6707.5 67080.7
0.8
0.9
1
6707.5 67080.7
0.8
0.9
1
6707.5 67080.7
0.8
0.9
1
-0.05 0 0.05 0.1 0.150
5
10
15
20
6707.5 67080.7
0.8
0.9
1
6707.5 67080.7
0.8
0.9
1
6707.5 67080.7
0.8
0.9
1
6707.5 67080.7
0.8
0.9
1
-0.05 0 0.05 0.1 0.150
10
20
30
HD 52265
Figure 7. Determination of 6Li/7Li ratio by fitting the Li-profile for two stars with extra-solar planets: HD 75289 (top panel) andHD52265 (bottom panel). The χ2-test results are shown for both the stars.
lines is compensated for an increasing 6Li abundance, butthe quality of the fit to the observed line decreases steadily.This is well shown by Figure 10 where we plot the Ti abun-dance versus the derived 6Li/7Li that best fits the line. Theexercise was done for Ti i lines of 0.0 eV and 1.88 eV. Inthe latter case, the χ2 for the best fit is marked and clearlyincreases as the contribution of the unidentified lines is re-duced.
Our stellar sample include several other metal-richstars, including one not known to host planets. A plausibleassumption is that, if 6Li is present in these stellar atmo-
spheres, the 6Li/7Li ratio will vary from star-to-star, and islikely absent in the star without planets (HD75332). Incor-rect representation of the list of blending lines could biasthe 6Li/7Li determinations but is unlikely across this sam-ple of metal-rich stars to alter the spread in 6Li/7Li ratios.The fact that we find 6Li/7Li ≃ 0.00 in all cases suggeststhat 6Li is not present in these metal-rich stars, includingHD82943. Blends have a smaller effect on the more metal-poor stars. The best fits to the observed profiles are foundfor 6Li/7Li = 0.00 (i.e., non-negative) is a good indicationthat the blending lines have not been overestimated.
6707.5 67080.8
0.85
0.9
0.95
1
6707.5 67080.8
0.85
0.9
0.95
1
6707.5 67080.8
0.85
0.9
0.95
1
6707.5 67080.8
0.85
0.9
0.95
1
-0.05 0 0.05 0.1 0.150
1
2
3
4
5
6707.5 67080.75
0.8
0.85
0.9
0.95
1
6707.5 67080.75
0.8
0.85
0.9
0.95
1
6707.5 67080.75
0.8
0.85
0.9
0.95
1
6707.5 67080.75
0.8
0.85
0.9
0.95
1
-0.05 0 0.05 0.1 0.150
10
20
30
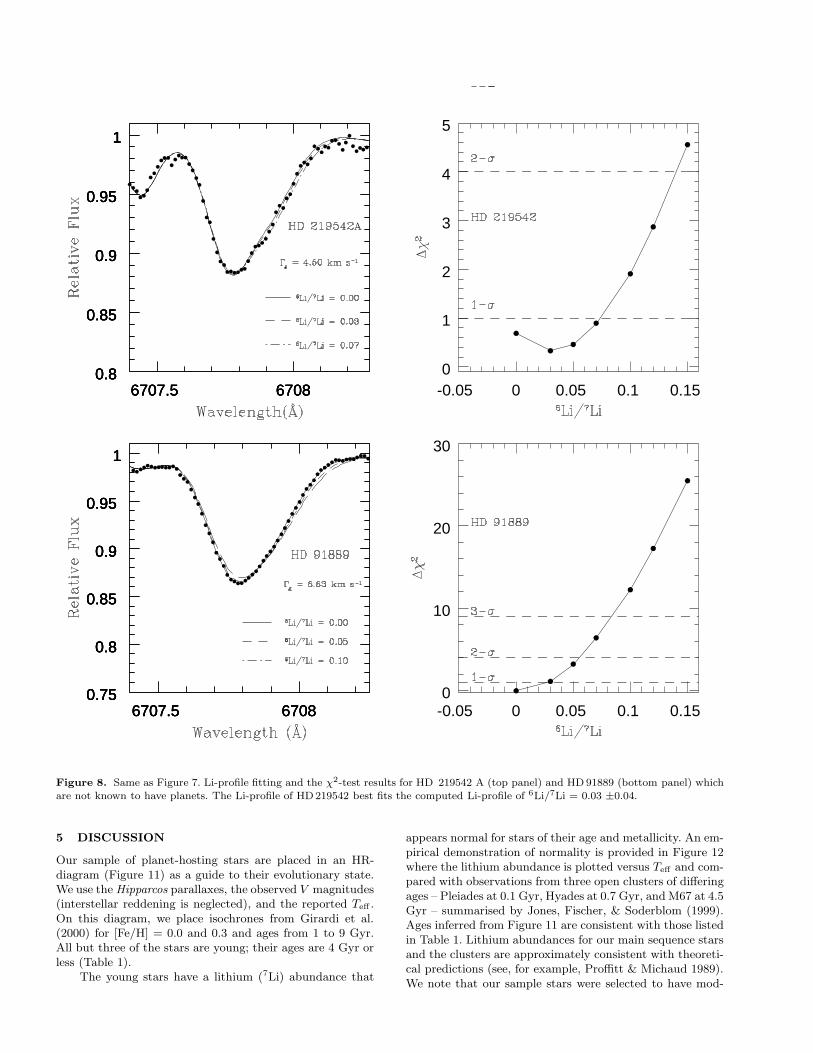
Figure 8. Same as Figure 7. Li-profile fitting and the χ2-test results for HD 219542 A (top panel) and HD 91889 (bottom panel) whichare not known to have planets. The Li-profile of HD219542 best fits the computed Li-profile of 6Li/7Li = 0.03 ±0.04.
5 DISCUSSION
Our sample of planet-hosting stars are placed in an HR-diagram (Figure 11) as a guide to their evolutionary state.We use the Hipparcos parallaxes, the observed V magnitudes(interstellar reddening is neglected), and the reported Teff .On this diagram, we place isochrones from Girardi et al.(2000) for [Fe/H] = 0.0 and 0.3 and ages from 1 to 9 Gyr.All but three of the stars are young; their ages are 4 Gyr orless (Table 1).
The young stars have a lithium (7Li) abundance that
appears normal for stars of their age and metallicity. An em-pirical demonstration of normality is provided in Figure 12where the lithium abundance is plotted versus Teff and com-pared with observations from three open clusters of differingages – Pleiades at 0.1 Gyr, Hyades at 0.7 Gyr, and M67 at 4.5Gyr – summarised by Jones, Fischer, & Soderblom (1999).Ages inferred from Figure 11 are consistent with those listedin Table 1. Lithium abundances for our main sequence starsand the clusters are approximately consistent with theoreti-cal predictions (see, for example, Proffitt & Michaud 1989).We note that our sample stars were selected to have mod-

6707.5 67080.75
0.8
0.85
0.9
0.95
1
6707.5 67080.75
0.8
0.85
0.9
0.95
1
6707.5 67080.75
0.8
0.85
0.9
0.95
1
6707.5 67080.75
0.8
0.85
0.9
0.95
1
HD 82943
0 0.05 0.10
2
4
6
8
0 0.05 0.10
2
4
6
8
0 0.05 0.10
2
4
6
8
Figure 9. Li-profile fitting for HD 82943 using three different forms of line broadening parameters (left panel): Γg = 5.03 km s−1),v sini = 1.60 km s−1, Vm = 3.65 km s−1 from the UT analysis and v sini = 2.09 km s−1, Vm = 3.73 km s−1 from the UW analysis.In the right panel we showed χ2
r -test analysis for each case. Note a very slight change in the quality of the fit but in all the three casesχ2
minis found for 6Li/7Li ≤ 0.01.
erate to strong Li lines. So, the plot is necessarily biasedtowards higher Li abundances.
Normal behaviour for 6Li must be defined on theoreti-cal grounds because there are no observations of this isotopein young stars. Standard models (Proffitt & Michaud 1989)predict effectively complete destruction of 6Li in the pre-main sequence phase. Destruction results when the convec-tive envelope exposes lithium to warm protons at its base.Little to no destruction of 7Li occurs; the (p,α) reactions
occur about 80 times more slowly for 7Li than for 6Li. De-struction of 7Li occurs on the main sequence, as revealed bythe lowering of the lithium abundance in the older clusters.Loss of lithium is more severe the lower the mass of the star.Since the lithium depletion is driven by exposure to protons,even minor reductions of the 7Li abundance below the valuein zero age main sequence stars must be accompanied byvery much larger reductions for 6Li.
Into this picture for lithium abundances of normal stars

0 0.05 0.1 0.152
3
4
5
0.980.82
1.11
2.39
5.81
HD 82943
Ti with LEP 1.88 eV
Ti with LEP 0.00 eV
0 0.05 0.1 0.152
3
4
5
Figure 10. Investigation of the effect of adopted Ti i abundance on the 6Li/7Li ratio for HD 82943. The dotted horizontal line is theobserved Ti i abundance for HD 82943. The numbers are χ2-values for the best fits for 1.88 eV case.
must be woven the suggestion that main sequence starsmay accrete one or more planets (or circumstellar material)which provide fresh lithium to the star’s convective envelopewith the largest effect being a replenishment of the 6Li abun-dance. After accretion, the 6Li/7Li ratio in the star’s atmo-sphere depends primarily on (i) the mass and compositionof ingested material relative to the mass and compositionof the stellar convective envelope, and (ii) the time elapsedsince ingestion. Montalban & Rebolo (2002) have provided auseful exploration of these dependencies. Their calculationsfor main sequence stars consider the accretion of 1 to 10 MJ
by main sequence stars of masses from about 0.7 M⊙ to 1.2M⊙ and of two compositions ([Fe/H] = 0.0 and 0.3). A ratio6Li/7Li ≃ 0.10 immediately following accretion is achieved,for example, when a giant planet of mass 10 MJ is accretedby a 1.2 M⊙ main sequence. The post-accretion isotopic ra-
tio decreases with decreasing mass of the star because themass of a main sequence star’s convective envelope increasesto lower masses. Accretion increases also the 7Li abundance,that is the ‘total’ lithium abundance. If lithium has not beendepleted prior to accretion, the abundance increase is small(about 0.2 dex for accretion levels providing 6Li/7Li ∼ 0.10),and, therefore, the total lithium abundance is not a sensitiveindicator of the occurrence of accretion.⋆
Survival of 6Li also determines its detectability. Withinthe constraints set by plausible assumptions about the ac-
⋆ Similarly, the beryllium abundance is a poor sensor of accre-tion. In fact, beryllium is largely undepleted in main sequencestars, even in stars showing lithium to be severely depleted. San-tos et al. (2002) measured Be abundances to find ‘no clear differ-ence’ between the abundances in stars with and without planets.

6500 6000 5500 50006
5
4
3
2
Gyrs: 1.0, 2.0, 3.2, 5.0, 7.1, 8.9
[Fe/H] = 0.00 (solid line)
[Fe/H] = 0.30 (broken line)
6500 6000 5500 50006
5
4
3
2
6500 6000 5500 50006
5
4
3
2
6500 6000 5500 50006
5
4
3
2
6500 6000 5500 50006
5
4
3
2
6500 6000 5500 50006
5
4
3
2
6500 6000 5500 50006
5
4
3
2
6500 6000 5500 50006
5
4
3
2
6500 6000 5500 50006
5
4
3
2
6500 6000 5500 50006
5
4
3
2
6500 6000 5500 50006
5
4
3
2
6500 6000 5500 50006
5
4
3
2
6500 6000 5500 50006
5
4
3
2
6500 6000 5500 50006
5
4
3
2
6500 6000 5500 50006
5
4
3
2
6500 6000 5500 50006
5
4
3
2
6500 6000 5500 50006
5
4
3
2
Figure 11. Age estimation using the isochrones computed by Girardi et al (2000) for program stars with planets.
cretion process and its benign effects on the structure of thestar, the calculations show that accreted 6Li (and 7Li) ispreserved for more than 3 Gyr in stars of mass greater thanabout 1.1 M⊙. This limit corresponds to the effective tem-perature range Teff ≥ 5900 K. Lithium-7 is predicted to becompletely preserved, a prediction at odds with the lithiumabundances for field and cluster stars (Figure 12). This dis-crepancy could be removed by using alternative models, see,for example, the predictions given by Proffitt & Michaud(1989). One can infer from observations summarized in Fig-ure 12 that accreted 6Li will be depleted more quickly thanpredicted by Montalban & Rebolo’s standard calculations:6Li seems likely to survive for only about 1 Gyr in main se-quence stars with Teff ≥ 6100 K. (For Teff ∼ 6600 K, lithiumis depleted to form the Boesgaard-dip [Boesgaard & Tripicco1986]), but both isotopes may be quite similarly depleted.)
In the light of Figure 12 and Montalban & Rebolo’scalculations, our failure to detect 6Li in the young planet-hosting main sequence stars does not admit of a simple de-cisive conclusion about accretion of planets. Our measure-ments allow the following possibilities: (i) accretion has notoccurred; (ii) accretion occurred but the accreted mass wasinsufficient to raise the star’s 6Li abundance above our detec-tion limit; and (iii) accretion occurred such that the post-accretion 6Li abundance exceeded the detection limit butsubsequent destruction of lithium depressed the 6Li abun-dance again below the detection limit. Montalban & Re-
bolo’s predictions of the survivability of 6Li in stars withM ≥ 1.1M⊙ and our failure to see 6Li may suggest thataccretion can rarely add more than a Jovian mass of ‘pri-mordial’ material to the star. (Accretion of terrestrial ratherthan Jovian planets can effect an increase in the lithiumabundances, but with a much smaller total mass for the ac-creted planets.)
Effects of accretion of planets on surface compositionsare not limited to the lithium abundance. Accretion of cir-cumstellar material has been invoked to account for themetallicity of planet-harbouring stars. There is now a gen-eral concensus that such stars are more metal-rich than sim-ilar stars without planets (Gonzalez et al. 2001; Santos etal. 2001; Reid 2002), but the origin of this difference is stilla matter of debate. Gonzalez (1997) suggested two possi-ble explanations for the metallicity difference: accretion ofH-poor matter (e.g., terrestrial planets, asteroids), and/or abias in the discovery of planets in radial velocity surveys aris-ing from a metallicity-dependent migration of giant planetstoward the star. Gonzalez (1998) added a third possibility:a high metallicity of the natal cloud as a prerequisite for for-mation of giant planets. Santos et al. (2001) favoured thislatter possibility. Combinations of these possibilities mayneed to be considered; for example, if high metallicity cloudsare favoured sites for stars with planets, such stars may ac-crete planets, and if these planets are terrestrial in nature,the metallicity of the star will be further increased.

6400 6200 6000 5800 5600
1
2
3
6400 6200 6000 5800 5600
1
2
3
6400 6200 6000 5800 5600
1
2
3
6400 6200 6000 5800 5600
1
2
3
6400 6200 6000 5800 5600
1
2
3Pleiades 0.1 Gyr
Hyades 0.7 Gyr
M67 4.5 Gyr
6400 6200 6000 5800 5600
1
2
3
6400 6200 6000 5800 56006400 6200 6000 5800 56006400 6200 6000 5800 5600
Figure 12. The derived Li abundances for planet hosting stars are compared with the Li abundances of Pleiades, Hyades and M67clusters. Ages of the clusters are noted. The stellar masses of planet hosting stars are indicated by the size of the filled circles.
Observational evidence in support of accretion as theorigin of the high metallicity of planet-hosting stars is lim-ited. Detection of 6Li in HD 82943 was claimed as supportingevidence. Our failure to confirm the presence of 6Li weakensthis claim, but, as we noted, accretion remains a possibilityas long as 6Li can be efficiently destroyed after the cessationof accretion. Accretion of giant planets will probably notchange the surface composition of a star very much; giantplanets are expected to have a composition similar to thatof their host star, except for lithium and, perhaps, berylliumand boron. Since the composition of a terrestrial planet isfar from a replica of the circumstellar material, the stellarcomposition will be changed by accretion of terrestrial plan-ets. One expects volatile elements (e.g., C, N, and O) to bereduced, and the abundance of non-volatiles (e.g., Fe-peakelements) to be increased by accretion. A signature of ac-cretion of terrestrial planets could be an abundance changecorrelated with an element’s condensation temperature (Tc),the temperature at which an element condenses into solidsas circumstellar gas cools in thermodynamic equilibrium.Gonzalez (1997) proposed this signature and searched for itin abundance analyses of two planet-hosting stars. Smith,Cunha, & Lazzaro (2001) noted that single (planet-less)metal-rich stars have a composition such that abundancedifferences, [X/H] (relative to solar values) for element (X)are quite well correlated with Tc. These differences are,
therefore, plausibly attributed to Galactic chemical evolu-tion, that is the net effect of nucleosynthesis by stars on thechemical composition of the interstellar medium. Stars host-ing planets show the same abundance – Tc correlation at agiven [Fe/H] indicating that accretion of terrestrial planetscan have more than a minor role in setting the stars’ sur-face composition (see Takeda et al. 2001). Smith et al. diddraw attention to a sample of five planet-hosting metal-richstars for which the [X/H] versus Tc correlation appearedunusually strong and suggested that accretion of terrestrialplanets might have occurred in these cases. Four of the fivestars are in Table 1.
Another example of a star which may have accreteddust, rocks, or terrestrial-like planets is HD219542 A, amain sequence star with a distant main sequence compan-ion. Gratton et al.’s (2001) differential abundance analysisfound HD219542 A overabundant relative to HD219542 Bin non-volatile elements but not in the volatile elements.The former were overabundant by about 0.07 dex. Grattonet al. remark that accretion of a few earth masses of rockymaterial by HD219542 A would suffice to account for thedifferential abundances, and might also explain the differ-ent lithium abundances in primary and secondary; lithium’scondensation temperature is similar to that of silicon andiron. HD219542 A is one of our programme stars and the Liabundance (Table 2) agrees well with that given by Gratton
et al. (HD219542 B is Li-poor, log ǫ (Li) < 1.0, accordingto Gratton et al.) The lithium abundance of HD219542 Ais ’normal’ for this young star.
If accretion occured and added lithium, the 6Li abun-dance corresponding to a 0.07 dex increase in the iron abun-dance would be approximately log ǫ(6Li) = −0.1, if the ac-creted material contained a ‘cosmic’ abundance of lithiumrelative to iron. The corresponding 7Li abundance is aboutlog ǫ(7Li) = 0.9 in the absence of lithium at the stellar sur-face prior to accretion. The observed abundance is consider-ably higher implying, as expected from Figure 12, that sub-stantial amounts of 7Li were present when accretion occured.Combining the observed 7Li abundance with the inferred 6Liabundance from the mass of accreted rocky material gives6Li/7Li = 0.04. We measure 6Li/7Li = 0.03 ± 0.04 whichis consistent with the inference but also with an absence of6Li. Inspection of the observed profile gives a tantalising im-pression of a break in the red wing due to 6Li (Figure 7).Higher S/N spectra will be sought.
6 CONCLUDING REMARKS
Our search for 6Li in the atmosphere of planet-hosting starproved unsuccessful, despite the intriguing earlier report ofsubstantial amounts of 6Li in HD 82943, a star known to hosttwo giant planets. A limit of approximately 6Li/7Li ≤ 0.03was set for eight planet-hosting stars including HD 82943.Detection of 6Li in a late F/early G-dwarf was recognized byIsraelian et al. (2001) as a possible signature of accretion ofplanets by a star. Non-detection of 6Li is less than watertightevidence against such accretion. Searches for planets shouldin the near future identify much larger numbers of planet-hosting stars. Accretion of circumstellar material may alsooccur onto stars without a planetary system. A continuedsearch for 6Li may yield a positive detection of 6Li.
ACKNOWLEDGMENTS
We thank Carlos Allende Prieto, Gajendra Pandey, and NilsRyde, for many spirited discussions, and UW group thanksVerne Smith for offering software. We thank Anita Cochran,Bill Cochran, Garek Israelian and Rafael Rebolo for theircomments. The research of the UT group has been sup-ported in part by National Science Foundation (grant AST96-18414) and the Robert A. Welch Foundation of Houston,Texas. The UW group’s research has been supported by aNASA Astrobiology Institute grant. This research has madeuse of the SIMBAD data base, operated at CDS, Strasbourg,France, and the NASA ADS service, USA.
REFERENCES
Allende Prieto, C., Asplund, M., Garcıa Lopez, R.J., & Lambert,D.L. 2002, ApJ, 567, 544
Allende Prieto, C & Garcıa Lopez, R.J. 1998, A&AS, 129, 41Chen, Y.Q., Nissen, P.E., Zhao, G., Zhang, H.W., and Benoni, T.
2000, A&AS, 141, 491Balachandran, S. 1990, ApJ, 354, 310Bevington, R.P., & Robinson, D.K. 1992, in ” Data Reduction
and Error Analysis for the Physical Sciences ”., 2nd Edition(WCB McGraw-Hill)
Boesgaard, A.M., & Tripicco, M.J. 1986, ApJ, 303, 724
Brault, J.W., & Muller, E.A. 1975, Solar Physics, 41, 43Brown, J.A., Sneden, C., Lambert, D.L., Dutchover, E. Jr. 1989,
ApJS, 71, 293Fuhrmann, K. 1998, A&A, 338, 161Girardi, L., Bressan, A., Bertelli, G., & Chiosi, C. 2000, A&A,
371Giridhar, S., & Ferro, A.A. 1995, Rev. Mex. Astron.Astrofis., 31,
23Gonzalez, G. 1997, MNRAS, 285, 403Gonzalez, G. 1998, A&A, 334, 221Gonzalez, G., Laws, C., Tyagi, S., Reddy, B. E. 2001, AJ, 121,
432Gratton, R.G., Bonanno, G., Claudi, R.U., Cosentino, R.,
Desidera, S., Lucatello, S., Scuderi, S. 2001, A&A, 377, 123Gray, D. F. 1992, The Observation and Analysis of Stellar Pho-
tospheres (Cambridge: Cambridge University Press)Gustafsson, B., Bell, R.A., Eriksson, K., Nordlund, A. 1975, A&A,
42, 407Hinkle, K., Wallace, L., Valenti, J., & Harmer, D. 2000 Visible and
Near Infrared Atlas of the Arcturus Spectrum 3727 - 9300 A(San Francisco: ASP)
Hobbs, L.M., Thorburn, J.A., & Rebull, L.M. 1999, ApJ, 523, 797Israelian, G., Santos, N.C., Mayor, M., & Rebolo, R. 2001, Nature,
411, 163Jones, B.F., Fischer, D., & Soderblom, D.R. 1999, AJ, 117, 330King, J.R., Deliyannis, C.P., Hiltgen, D.D., Stephens. A., Cunha,
K., & Boesgaard, A.M. 1997, AJ, 113, 1871Kurucz, R., Furenlid, I., and Brault, J. 1984, Solar Flux Atlas
from 296 to 1300 nm (New Mexico: National Solar Observa-tory)
Kurucz, R. 1995: http://cfaku5.harvard.eduLambert, D.L., Smith., V.V., & Heath, J. 1993, PASP, 105, 568Laws, C., & Gonzalez, G. 2001, ApJ, 553, 405Montalban, J., & Rebolo, R. 2002, A&A, 386, 1039Nave, G., Johansson, S., Learner, R.C.M., Thorne, A.P., &
Brault, J.W. 1994, ApJS, 94, 221Nissen, P.E., Lambert, D.L., Primas, F., & Smith, V.V. 1999,
A&A, 348, 211Proffitt, C.R., & Michaud, G. 1989, ApJ, 345, 998Reid, I.N. 2002, PASP, 114, 306Santos, N.C., Israelian, G., and Mayor, M. 2000, A&A, 363, 228Santos, N.C., Israelian, G., and Mayor, M. 2001, A&A, 373, 1019Santos, N.C., Garcıa Lopez, R.J., Israelian, G., Mayor, M., Re-
bolo, R., Garcıa-Gil., Perez de Taoro, M.R., & Randich, S.2002, A&A, 386, 1028
Smith, V.V., Lambert, D.L., & Nissen P.E. 1998, ApJ, 506, 405
Smith, V.V., Cunha, K., & Lazzaro, D. 2001, AJ, 121, 3207Sneden, C. 1973, Ph.D. thesis, Univ. Texas-AustinTakeda, Y. 1995, PASJ, 47, 337Takeda, Y. et al. 2001, PASJ, 53, 1211Tull, R.G., MacQueen, P.J., Sneden, C., & Lambert, D.L. 1995,
PASP, 107, 251