Embed Size (px)
Citation preview
Computers & Geosciences 37 (2011) 1192–1204
Contents lists available at ScienceDirect
Computers & Geosciences
0098-30
doi:10.1
� Corr
E-m
journal homepage: www.elsevier.com/locate/cageo
A relational rock mechanics database scheme with a hierarchical structure
Pantelis Liolios, George Exadaktylos �
Mining Engineering Design Laboratory, Department of Mineral Resources Engineering, Technical University of Crete, University Campus, GR-73100 Chania, Greece
a r t i c l e i n f o
Article history:
Received 11 February 2010
Received in revised form
9 November 2010
Accepted 11 November 2010Available online 12 March 2011
Keywords:
Relational database
Rock mechanics
Uniaxial compression test
Triaxial compression test
Tension test
Shear test
04/$ - see front matter & 2011 Elsevier Ltd. A
016/j.cageo.2011.02.014
esponding author. Tel.: þ30 28210 37690; fa
ail address: [email protected] (G. Exadak
a b s t r a c t
In this work a hierarchical rock mechanics database scheme is presented. The aim of this database is to
store and represent rock mechanics test data in a standardized and ‘‘transparent’’ manner (format) that
includes as much information as possible regarding rocks, sampling location and orientation, testing
procedures, experimental results, data reduction and model calibration methods. For brevity, in the first
presentation of the database only the first two hierarchical levels of analysis are presented. Initially, the
database structure is described and subsequently, the relations between different components of the
database are illustrated. A short description of each parameter stored for each type of test is also given.
Finally, a Web application scheme for the management of the database is proposed.
& 2011 Elsevier Ltd. All rights reserved.
1 http://www.matweb.com.2
1. Introduction
Nowadays numerical simulation codes are indispensable toolsfor the predesign and design of underground and surface excava-tions in rocks. However, the constitutive models used in thesenumerical codes usually require a large number of elastic, plastic,and strength parameters of rocks. In many cases, there are fewexperimental data available in the predesign phase, which can beused to estimate only a few of the required model parameters.These parameters are usually derived from several-element rockmechanics or index tests on rock cores extracted from exploratoryboreholes. Nowadays, some of these lab experiments are consid-ered to be standardized (e.g., uniaxial and triaxial compressiontests, shear and cylindrical disc tests), while other have beenproposed in order to overcome the weaknesses or disadvantagesof the standard ones (e.g., fracture mechanics, Schmidt hammer).Furthermore, the large number of laboratories performing rockmechanics testing on a routine basis, in conjunction with thelarge number of parameters that affect each test (e.g., size ofspecimen, rate of loading, boundary conditions, size and shape ofspecimens) and the different empirical models used to infer rockparameters from index tests, frequently lead to large dispersion ofthe data for the same rock types. Furthermore, some laboratoriesmay perform monotonic loading tests, while others conductunloading–reloading loops until the specimen fails and so forth.The International Society for Rock Mechanics (ISRM) has pub-lished suggested methods for standardizing the testing
ll rights reserved.
x: þ30 28210 37891.
tylos).
methodology, at least for the classical tests (Brown, 1981).However, a detailed description of the parameters that affectthe experiment results is often not given, and thus the datacannot be harmonized.
Several relational databases have been developed in an effortto collect the available mechanical and physical data on materials.However, most of these cases focus on engineering materials suchas polymers, ceramics, and metals. MatWEB,1 NIMS MaterialsDatabase,2 and MATBASE3 are some examples of such databases.Databases for natural materials such as rocks usually focuson geological and mineralogical information (e.g., petrographicdata, mineral composition, microstructure). Mindat4 is an exam-ple of such a database. Some engineering databases for rocks havebeen developed. For example, the program RockPro, developed byESG Solutions5 in Canada, is a rock mechanics database tool forrecording and reporting underground observations. This programis dedicated to data recording for specific projects, includingsupport evaluations, rockbursts, and pillar performance. A moregeneral rock mechanics database that stores mechanical para-meters for rocks is the RocProp Properties Database developed byRocScience.6 This database contains over 700 test records. Eachrecord includes basic information about the rock (rock type,country, location, unit weight, etc.), reference information, andthe actual test data. The test data are divided into four categories,
http://mits.nims.go.jp.3 http://www.matbase.com.4 http://www.mindat.org.5 http://www.esg.ca.6 http://www.rocscience.com.
P. Liolios, G. Exadaktylos / Computers & Geosciences 37 (2011) 1192–1204 1193
namely compressive data, tensile data, Hoek data, and velocitydata. Compressive data are information about uniaxial/triaxialcompression tests. Tensile data refer to direct uniaxial andindirect tension tests. Hoek data store the constants of the Hoekand Brown failure criterion (Hoek and Brown, 1980; Hoek et al.,2002). Finally, velocity data contain information on compressionand shear wave velocities. RocProp does not contain the raw dataof each experiment, which could be very useful for furtheranalysis (e.g., calculation of damage or plasticity parameters).Furthermore, information referring to the microstructure and themineral composition of each rock is not stored. Hence, the usercannot correlate the mechanical parameters with the rock’smicrostructure, and furthermore he or she cannot retrievemechanical parameters for rocks with similar composition andmicrostructure to his or her case.
The aim of this work is to create a relational rock mechanicsdatabase scheme of standard, as well as nonstandard tests, whichcould be used in a transparent manner for the collection,harmonization, and representation of the data among laboratoriesand for the calibration of elastic-damage-plasticity constitutivemodels for brittle rocks. By design the database includes as manyparameters of the tested rocks as possible, as well as informationconcerning the experimental procedure. In its present state thedatabase scheme proposed is able to store five different types oftests, namely uniaxial/triaxial compression tests, direct tensiontests, indirect (Brazilian) tension tests, direct shear tests, and therelative new and nonstandard microdrilling test (Exadaktyloset al., 2000; Stavropoulou, 2006). For these tests, a hierarchicalbottom-up data reduction methodology is proposed.
Rock mechanics experiments produce a certain number of rawdata. In order to extract the rock mechanics parameters fromthese data, a calculation process must be performed for each test.In the current form of the database, data are processed at twolevels, namely Level I and Level II. At Level I the direct experi-mental results are extracted from the raw data (e.g., failure stress,failure strain). At Level II, calculations are performed to evaluatebasic parameters such as the elastic moduli. The concept followedat Levels I and II is to use generic equations that correspond to thephysics of each test so they are not dependent on the specific rocktype. The plasticity parameters of the rock, as well as moreadvanced calculations (e.g., reproduction of test results throughparticle or distinct element modeling), can be performed subse-quently at higher levels of analysis (e.g., Levels III, IV, V). Forbrevity, only Levels I and II will be presented here. Raw data and
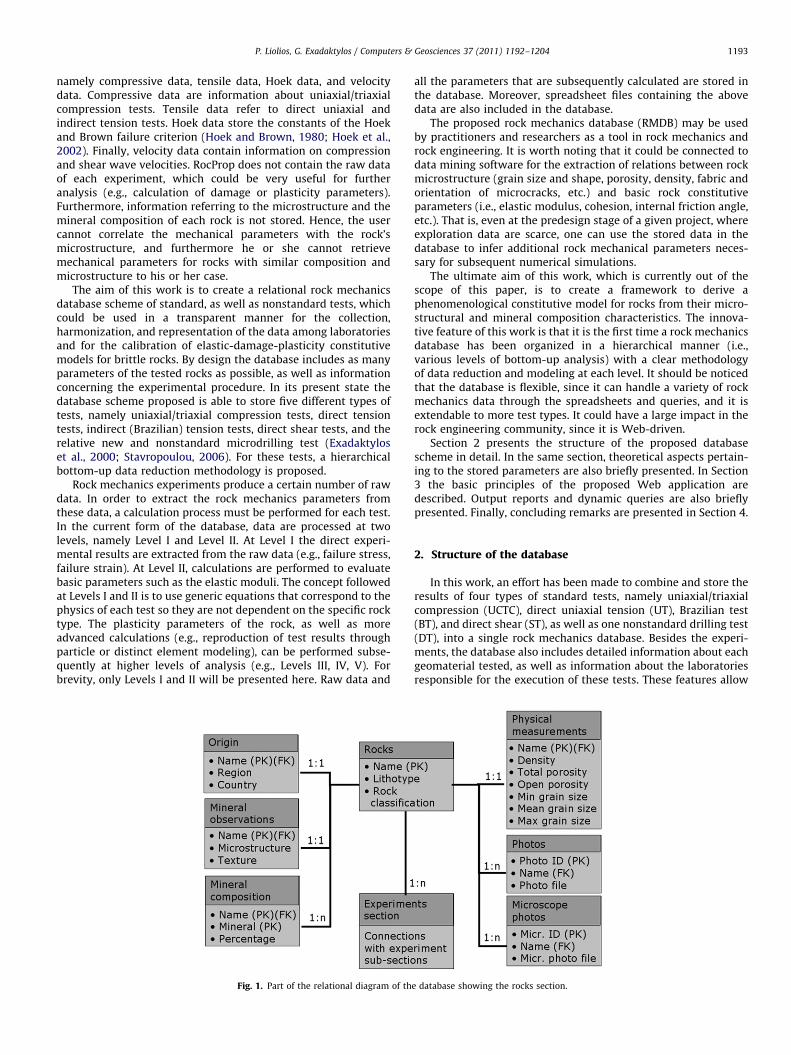
Fig. 1. Part of the relational diagram of th
all the parameters that are subsequently calculated are stored inthe database. Moreover, spreadsheet files containing the abovedata are also included in the database.
The proposed rock mechanics database (RMDB) may be usedby practitioners and researchers as a tool in rock mechanics androck engineering. It is worth noting that it could be connected todata mining software for the extraction of relations between rockmicrostructure (grain size and shape, porosity, density, fabric andorientation of microcracks, etc.) and basic rock constitutiveparameters (i.e., elastic modulus, cohesion, internal friction angle,etc.). That is, even at the predesign stage of a given project, whereexploration data are scarce, one can use the stored data in thedatabase to infer additional rock mechanical parameters neces-sary for subsequent numerical simulations.
The ultimate aim of this work, which is currently out of thescope of this paper, is to create a framework to derive aphenomenological constitutive model for rocks from their micro-structural and mineral composition characteristics. The innova-tive feature of this work is that it is the first time a rock mechanicsdatabase has been organized in a hierarchical manner (i.e.,various levels of bottom-up analysis) with a clear methodologyof data reduction and modeling at each level. It should be noticedthat the database is flexible, since it can handle a variety of rockmechanics data through the spreadsheets and queries, and it isextendable to more test types. It could have a large impact in therock engineering community, since it is Web-driven.
Section 2 presents the structure of the proposed databasescheme in detail. In the same section, theoretical aspects pertain-ing to the stored parameters are also briefly presented. In Section3 the basic principles of the proposed Web application aredescribed. Output reports and dynamic queries are also brieflypresented. Finally, concluding remarks are presented in Section 4.
2. Structure of the database
In this work, an effort has been made to combine and store theresults of four types of standard tests, namely uniaxial/triaxialcompression (UCTC), direct uniaxial tension (UT), Brazilian test(BT), and direct shear (ST), as well as one nonstandard drilling test(DT), into a single rock mechanics database. Besides the experi-ments, the database also includes detailed information about eachgeomaterial tested, as well as information about the laboratoriesresponsible for the execution of these tests. These features allow
e database showing the rocks section.
P. Liolios, G. Exadaktylos / Computers & Geosciences 37 (2011) 1192–12041194
users to cross-correlate information on experiments, rocks, andlaboratories. In order to achieve the latter, the database wasdeveloped on a relational database management system (RDBMS)(Codd, 1970) using the well-established structured query lan-guage (SQL) (Chamberlin and Boyce, 1974). As already mentioned,it comprises three distinct sections, namely the rocks section, theexperiments section, and the laboratories section, which are setsof data tables. An effort has been made to design the database byfollowing the third normal form (3NF) according to Codd (1970)in order to reduce the volume of the data stored, that is, toeliminate multiple storage of the same properties, as well as toincrease the flexibility and durability of the database (Maier,1983).
2.1. Rocks section
The part of the relational diagram of the database regardingthe rocks section is shown in Fig. 1. Each box in the figurerepresents a table. The name of each table is shown in its header(dark gray areas), while below the header appears the list of thestored properties (light gray areas).
The rocks section includes seven tables. The Rocks tablecontains mandatory information about the rocks that are storedin the database, and it is considered to be the primary table of thesection. As shown in the figure, the necessary information refersto the rock name, lithotype, and rock classification. This informa-tion should not be left empty when a new rock is inserted into thedatabase. The symbol (PK) next to the ‘‘rock name’’ field indicatesthat this property is the primary key of the table and identifies therecord. No duplicate primary keys are permitted, since eachstored rock is unique.
In addition to the primary table, there are six other secondarytables containing optional information about each rock. Thecategorized information stored in each table is shown in Fig. 1.Table Origin stores information about the origin of the rock,namely the country and the region it comes from. In the Mineral
Observations table, detailed descriptions regarding the fabric ormicrostructure and the texture of the rock are stored. Addition-ally, a list of the major minerals of the rock and their contentpercentage is stored into the Mineral Composition table. Otherimportant information pertaining to the measurements of thephysical properties of the rock are stored in the Physical Measure-
ments table. The density is also stored in this table, as well as thetotal and open porosities of each rock. Furthermore, the mini-mum, maximum, and mean grain size are stored there. Using
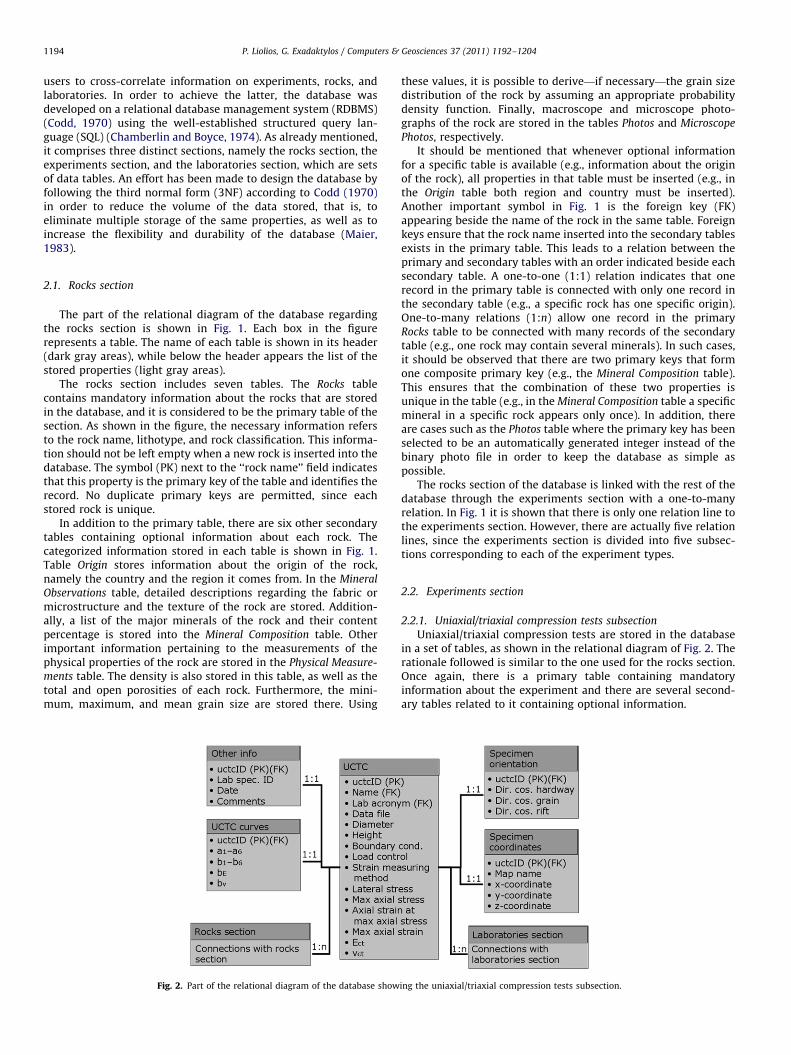
Fig. 2. Part of the relational diagram of the database show
these values, it is possible to derive—if necessary—the grain sizedistribution of the rock by assuming an appropriate probabilitydensity function. Finally, macroscope and microscope photo-graphs of the rock are stored in the tables Photos and Microscope
Photos, respectively.It should be mentioned that whenever optional information
for a specific table is available (e.g., information about the originof the rock), all properties in that table must be inserted (e.g., inthe Origin table both region and country must be inserted).Another important symbol in Fig. 1 is the foreign key (FK)appearing beside the name of the rock in the same table. Foreignkeys ensure that the rock name inserted into the secondary tablesexists in the primary table. This leads to a relation between theprimary and secondary tables with an order indicated beside eachsecondary table. A one-to-one (1:1) relation indicates that onerecord in the primary table is connected with only one record inthe secondary table (e.g., a specific rock has one specific origin).One-to-many relations (1:n) allow one record in the primaryRocks table to be connected with many records of the secondarytable (e.g., one rock may contain several minerals). In such cases,it should be observed that there are two primary keys that formone composite primary key (e.g., the Mineral Composition table).This ensures that the combination of these two properties isunique in the table (e.g., in the Mineral Composition table a specificmineral in a specific rock appears only once). In addition, thereare cases such as the Photos table where the primary key has beenselected to be an automatically generated integer instead of thebinary photo file in order to keep the database as simple aspossible.
The rocks section of the database is linked with the rest of thedatabase through the experiments section with a one-to-manyrelation. In Fig. 1 it is shown that there is only one relation line tothe experiments section. However, there are actually five relationlines, since the experiments section is divided into five subsec-tions corresponding to each of the experiment types.
2.2. Experiments section
2.2.1. Uniaxial/triaxial compression tests subsection
Uniaxial/triaxial compression tests are stored in the databasein a set of tables, as shown in the relational diagram of Fig. 2. Therationale followed is similar to the one used for the rocks section.Once again, there is a primary table containing mandatoryinformation about the experiment and there are several second-ary tables related to it containing optional information.
ing the uniaxial/triaxial compression tests subsection.
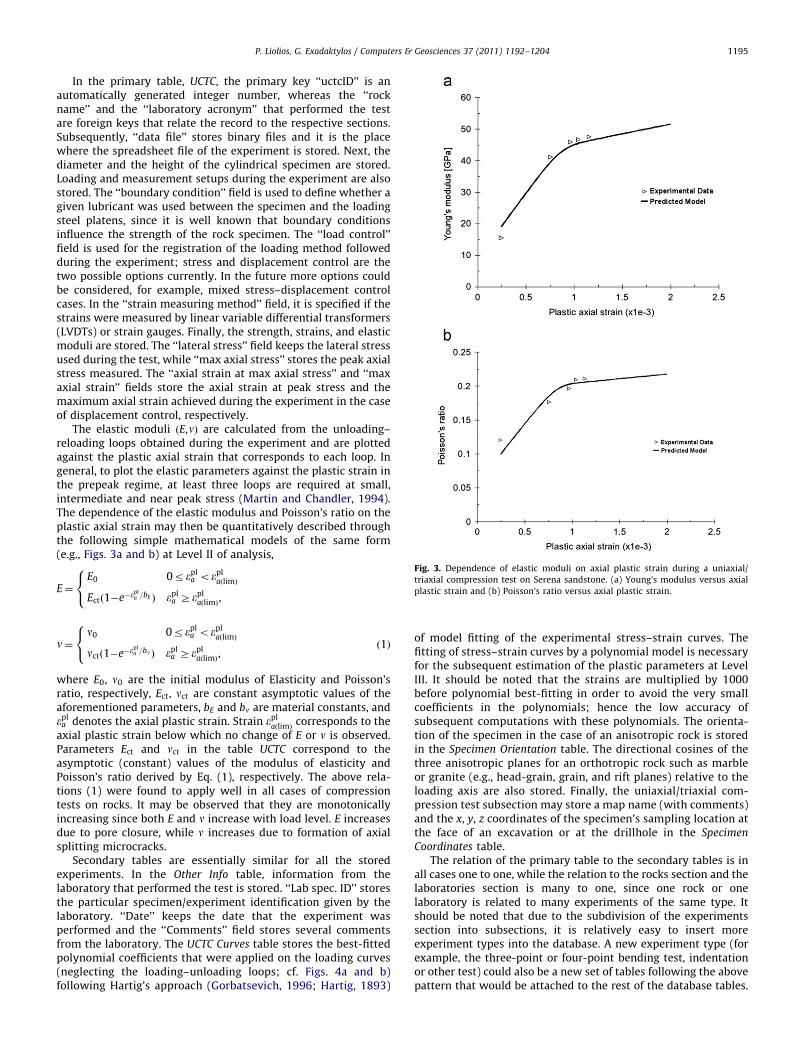
Fig. 3. Dependence of elastic moduli on axial plastic strain during a uniaxial/
triaxial compression test on Serena sandstone. (a) Young’s modulus versus axial
plastic strain and (b) Poisson’s ratio versus axial plastic strain.
P. Liolios, G. Exadaktylos / Computers & Geosciences 37 (2011) 1192–1204 1195
In the primary table, UCTC, the primary key ‘‘uctcID’’ is anautomatically generated integer number, whereas the ‘‘rockname’’ and the ‘‘laboratory acronym’’ that performed the testare foreign keys that relate the record to the respective sections.Subsequently, ‘‘data file’’ stores binary files and it is the placewhere the spreadsheet file of the experiment is stored. Next, thediameter and the height of the cylindrical specimen are stored.Loading and measurement setups during the experiment are alsostored. The ‘‘boundary condition’’ field is used to define whether agiven lubricant was used between the specimen and the loadingsteel platens, since it is well known that boundary conditionsinfluence the strength of the rock specimen. The ‘‘load control’’field is used for the registration of the loading method followedduring the experiment; stress and displacement control are thetwo possible options currently. In the future more options couldbe considered, for example, mixed stress–displacement controlcases. In the ‘‘strain measuring method’’ field, it is specified if thestrains were measured by linear variable differential transformers(LVDTs) or strain gauges. Finally, the strength, strains, and elasticmoduli are stored. The ‘‘lateral stress’’ field keeps the lateral stressused during the test, while ‘‘max axial stress’’ stores the peak axialstress measured. The ‘‘axial strain at max axial stress’’ and ‘‘maxaxial strain’’ fields store the axial strain at peak stress and themaximum axial strain achieved during the experiment in the caseof displacement control, respectively.
The elastic moduli ðE,nÞ are calculated from the unloading–reloading loops obtained during the experiment and are plottedagainst the plastic axial strain that corresponds to each loop. Ingeneral, to plot the elastic parameters against the plastic strain inthe prepeak regime, at least three loops are required at small,intermediate and near peak stress (Martin and Chandler, 1994).The dependence of the elastic modulus and Poisson’s ratio on theplastic axial strain may then be quantitatively described throughthe following simple mathematical models of the same form(e.g., Figs. 3a and b) at Level II of analysis,
E¼E0 0repl
a oeplaðlimÞ
Ectð1�e�epla =bE Þ epl
a ZeplaðlimÞ,
8<:
n¼n0 0repl
a oeplaðlimÞ
nctð1�e�epla =bn Þ epl
a ZeplaðlimÞ,
8<: ð1Þ
where E0, n0 are the initial modulus of Elasticity and Poisson’sratio, respectively, Ect, nct are constant asymptotic values of theaforementioned parameters, bE and bn are material constants, andepl
a denotes the axial plastic strain. Strain eplaðlimÞ corresponds to the
axial plastic strain below which no change of E or n is observed.Parameters Ect and nct in the table UCTC correspond to theasymptotic (constant) values of the modulus of elasticity andPoisson’s ratio derived by Eq. (1), respectively. The above rela-tions (1) were found to apply well in all cases of compressiontests on rocks. It may be observed that they are monotonicallyincreasing since both E and n increase with load level. E increasesdue to pore closure, while n increases due to formation of axialsplitting microcracks.
Secondary tables are essentially similar for all the storedexperiments. In the Other Info table, information from thelaboratory that performed the test is stored. ‘‘Lab spec. ID’’ storesthe particular specimen/experiment identification given by thelaboratory. ‘‘Date’’ keeps the date that the experiment wasperformed and the ‘‘Comments’’ field stores several commentsfrom the laboratory. The UCTC Curves table stores the best-fittedpolynomial coefficients that were applied on the loading curves(neglecting the loading–unloading loops; cf. Figs. 4a and b)following Hartig’s approach (Gorbatsevich, 1996; Hartig, 1893)
of model fitting of the experimental stress–strain curves. Thefitting of stress–strain curves by a polynomial model is necessaryfor the subsequent estimation of the plastic parameters at LevelIII. It should be noted that the strains are multiplied by 1000before polynomial best-fitting in order to avoid the very smallcoefficients in the polynomials; hence the low accuracy ofsubsequent computations with these polynomials. The orienta-tion of the specimen in the case of an anisotropic rock is storedin the Specimen Orientation table. The directional cosines of thethree anisotropic planes for an orthotropic rock such as marbleor granite (e.g., head-grain, grain, and rift planes) relative to theloading axis are also stored. Finally, the uniaxial/triaxial com-pression test subsection may store a map name (with comments)and the x, y, z coordinates of the specimen’s sampling location atthe face of an excavation or at the drillhole in the Specimen
Coordinates table.The relation of the primary table to the secondary tables is in
all cases one to one, while the relation to the rocks section and thelaboratories section is many to one, since one rock or onelaboratory is related to many experiments of the same type. Itshould be noted that due to the subdivision of the experimentssection into subsections, it is relatively easy to insert moreexperiment types into the database. A new experiment type (forexample, the three-point or four-point bending test, indentationor other test) could also be a new set of tables following the abovepattern that would be attached to the rest of the database tables.

Fig. 4. Primary loading branches of a uniaxial/triaxial compression test on Dionysos marble. (a) Axial stress versus axial strain and (b) radial (lateral) strain versus
axial strain.
Fig. 5. Part of the relational diagram of the database showing the uniaxial tension tests subsection.
P. Liolios, G. Exadaktylos / Computers & Geosciences 37 (2011) 1192–12041196
2.2.2. Uniaxial tension tests subsection
Fig. 5 illustrates the relational diagram for the uniaxial tensiontests. The methodology followed is similar to that of the uniaxial/triaxial compression tests. The major table UT stores first the
automatically generated ‘‘utID’’ primary key. The ‘‘rock name,’’‘‘lab acronym,’’ ‘‘data file,’’ ‘‘diameter,’’ ‘‘height,’’ and ‘‘strainmeasuring method’’ are similar to those in the uniaxial/triaxialcompression subsection. Subsequently, the maximum axial stress
P. Liolios, G. Exadaktylos / Computers & Geosciences 37 (2011) 1192–1204 1197
achieved is stored, as well as the axial strain that corresponds tothis stress. E0 and n0, as in Eq. (1), denote the initial elastic modulias they appear in the phenomenological equation:
E¼1
1=E0þbE
ffiffiffiffiffiffiepl
a
q
n¼ 1
1=n0þbn
ffiffiffiffiffiffiepl
a
q , ð2Þ
which works well in many cases and is calibrated in a fashionsimilar to Eq. (1). The parameters bE and bn are material constantsand epl
a is the axial plastic strain.The tables Other info, UT curves, Specimen orientation, and
Specimen coordinates are similar to these described in Section2.2.1. It must be noted that in the table UT curves the variablesa1 . . . a6 and b1 . . . b6 are best-fit polynomial coefficients on theprimary loading branches of the experiment and bE and bv arecoefficients that appear in Eq. (2).
2.2.3. Indirect tension (Brazilian) tests subsection
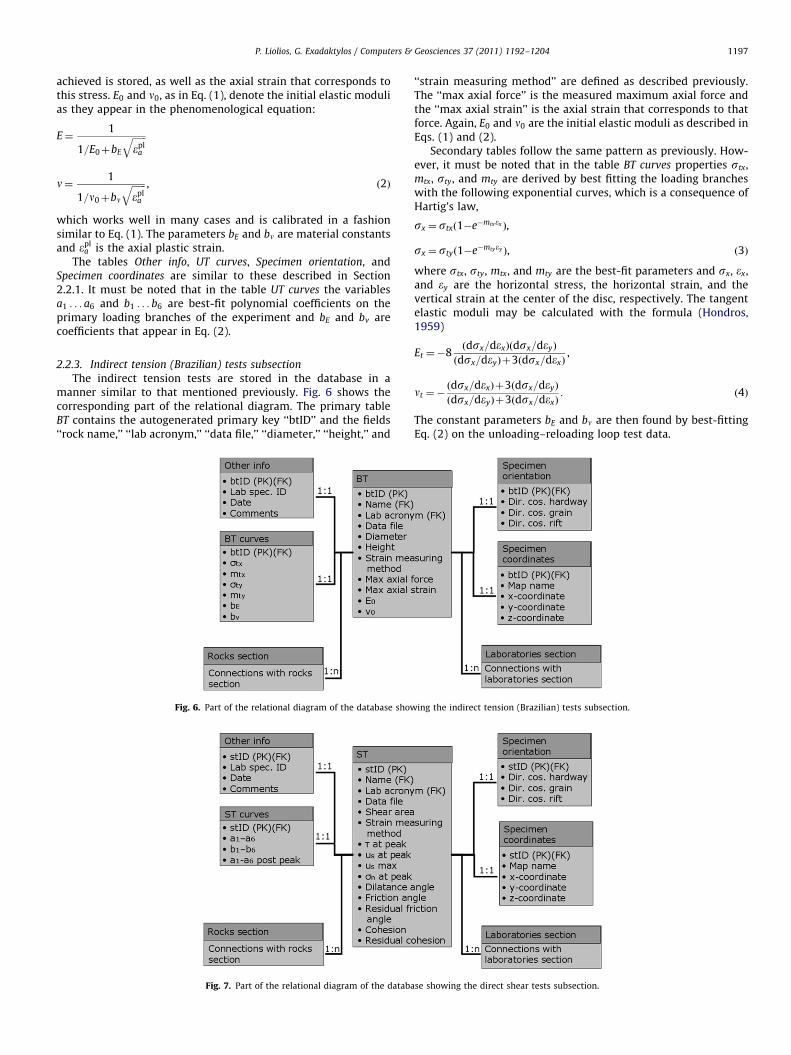
The indirect tension tests are stored in the database in amanner similar to that mentioned previously. Fig. 6 shows thecorresponding part of the relational diagram. The primary tableBT contains the autogenerated primary key ‘‘btID’’ and the fields‘‘rock name,’’ ‘‘lab acronym,’’ ‘‘data file,’’ ‘‘diameter,’’ ‘‘height,’’ and
Fig. 6. Part of the relational diagram of the database show
Fig. 7. Part of the relational diagram of the databa
‘‘strain measuring method’’ are defined as described previously.The ‘‘max axial force’’ is the measured maximum axial force andthe ‘‘max axial strain’’ is the axial strain that corresponds to thatforce. Again, E0 and n0 are the initial elastic moduli as described inEqs. (1) and (2).
Secondary tables follow the same pattern as previously. How-ever, it must be noted that in the table BT curves properties stx,mtx, sty, and mty are derived by best fitting the loading brancheswith the following exponential curves, which is a consequence ofHartig’s law,
sx ¼ stxð1�e�mtxex Þ,
sx ¼ styð1�e�mtyey Þ, ð3Þ
where stx, sty, mtx, and mty are the best-fit parameters and sx, ex,and ey are the horizontal stress, the horizontal strain, and thevertical strain at the center of the disc, respectively. The tangentelastic moduli may be calculated with the formula (Hondros,1959)
Et ¼�8ðdsx=dexÞðdsx=deyÞ
ðdsx=deyÞþ3ðdsx=dexÞ,
nt ¼�ðdsx=dexÞþ3ðdsx=deyÞ
ðdsx=deyÞþ3ðdsx=dexÞ: ð4Þ
The constant parameters bE and bn are then found by best-fittingEq. (2) on the unloading–reloading loop test data.
ing the indirect tension (Brazilian) tests subsection.
se showing the direct shear tests subsection.
P. Liolios, G. Exadaktylos / Computers & Geosciences 37 (2011) 1192–12041198
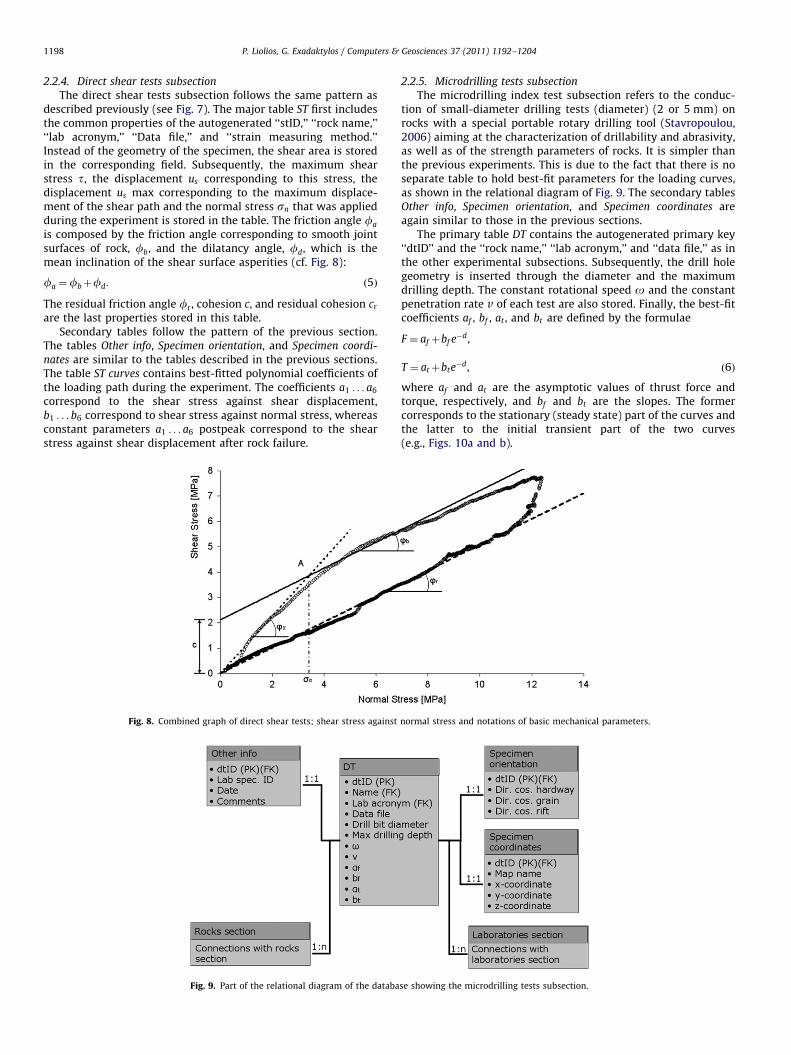
2.2.4. Direct shear tests subsection
The direct shear tests subsection follows the same pattern asdescribed previously (see Fig. 7). The major table ST first includesthe common properties of the autogenerated ‘‘stID,’’ ‘‘rock name,’’‘‘lab acronym,’’ ‘‘Data file,’’ and ‘‘strain measuring method.’’Instead of the geometry of the specimen, the shear area is storedin the corresponding field. Subsequently, the maximum shearstress t, the displacement us corresponding to this stress, thedisplacement us max corresponding to the maximum displace-ment of the shear path and the normal stress sn that was appliedduring the experiment is stored in the table. The friction angle fa
is composed by the friction angle corresponding to smooth jointsurfaces of rock, fb, and the dilatancy angle, fd, which is themean inclination of the shear surface asperities (cf. Fig. 8):
fa ¼fbþfd: ð5Þ
The residual friction angle fr, cohesion c, and residual cohesion cr
are the last properties stored in this table.Secondary tables follow the pattern of the previous section.
The tables Other info, Specimen orientation, and Specimen coordi-
nates are similar to the tables described in the previous sections.The table ST curves contains best-fitted polynomial coefficients ofthe loading path during the experiment. The coefficients a1 . . . a6
correspond to the shear stress against shear displacement,b1 . . .b6 correspond to shear stress against normal stress, whereasconstant parameters a1 . . . a6 postpeak correspond to the shearstress against shear displacement after rock failure.
Fig. 8. Combined graph of direct shear tests; shear stress against
Fig. 9. Part of the relational diagram of the databa
2.2.5. Microdrilling tests subsection
The microdrilling index test subsection refers to the conduc-tion of small-diameter drilling tests (diameter) (2 or 5 mm) onrocks with a special portable rotary drilling tool (Stavropoulou,2006) aiming at the characterization of drillability and abrasivity,as well as of the strength parameters of rocks. It is simpler thanthe previous experiments. This is due to the fact that there is noseparate table to hold best-fit parameters for the loading curves,as shown in the relational diagram of Fig. 9. The secondary tablesOther info, Specimen orientation, and Specimen coordinates areagain similar to those in the previous sections.
The primary table DT contains the autogenerated primary key‘‘dtID’’ and the ‘‘rock name,’’ ‘‘lab acronym,’’ and ‘‘data file,’’ as inthe other experimental subsections. Subsequently, the drill holegeometry is inserted through the diameter and the maximumdrilling depth. The constant rotational speed o and the constantpenetration rate v of each test are also stored. Finally, the best-fitcoefficients af , bf , at , and bt are defined by the formulae
F ¼ af þbf e�d,
T ¼ atþbte�d, ð6Þ
where af and at are the asymptotic values of thrust force andtorque, respectively, and bf and bt are the slopes. The formercorresponds to the stationary (steady state) part of the curves andthe latter to the initial transient part of the two curves(e.g., Figs. 10a and b).
normal stress and notations of basic mechanical parameters.
se showing the microdrilling tests subsection.
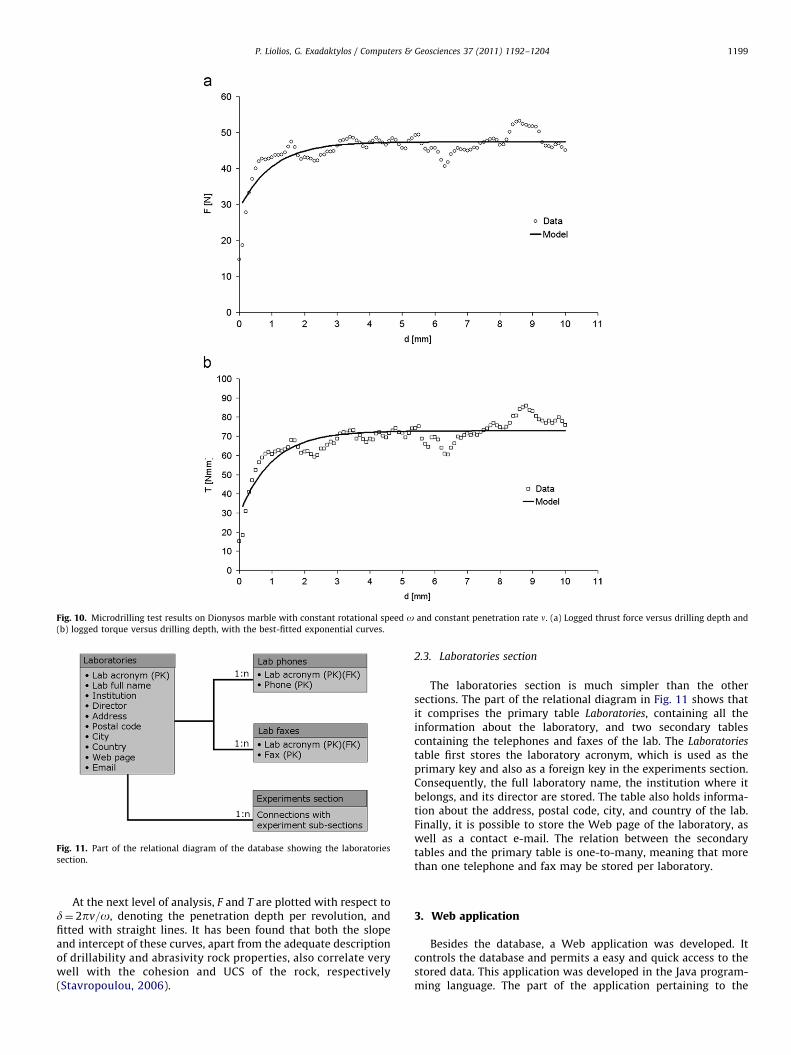
Fig. 10. Microdrilling test results on Dionysos marble with constant rotational speed o and constant penetration rate n. (a) Logged thrust force versus drilling depth and
(b) logged torque versus drilling depth, with the best-fitted exponential curves.
Fig. 11. Part of the relational diagram of the database showing the laboratories
section.
P. Liolios, G. Exadaktylos / Computers & Geosciences 37 (2011) 1192–1204 1199
At the next level of analysis, F and T are plotted with respect tod¼ 2pv=o, denoting the penetration depth per revolution, andfitted with straight lines. It has been found that both the slopeand intercept of these curves, apart from the adequate descriptionof drillability and abrasivity rock properties, also correlate verywell with the cohesion and UCS of the rock, respectively(Stavropoulou, 2006).
2.3. Laboratories section
The laboratories section is much simpler than the othersections. The part of the relational diagram in Fig. 11 shows thatit comprises the primary table Laboratories, containing all theinformation about the laboratory, and two secondary tablescontaining the telephones and faxes of the lab. The Laboratories
table first stores the laboratory acronym, which is used as theprimary key and also as a foreign key in the experiments section.Consequently, the full laboratory name, the institution where itbelongs, and its director are stored. The table also holds informa-tion about the address, postal code, city, and country of the lab.Finally, it is possible to store the Web page of the laboratory, aswell as a contact e-mail. The relation between the secondarytables and the primary table is one-to-many, meaning that morethan one telephone and fax may be stored per laboratory.
3. Web application
Besides the database, a Web application was developed. Itcontrols the database and permits a easy and quick access to thestored data. This application was developed in the Java program-ming language. The part of the application pertaining to the
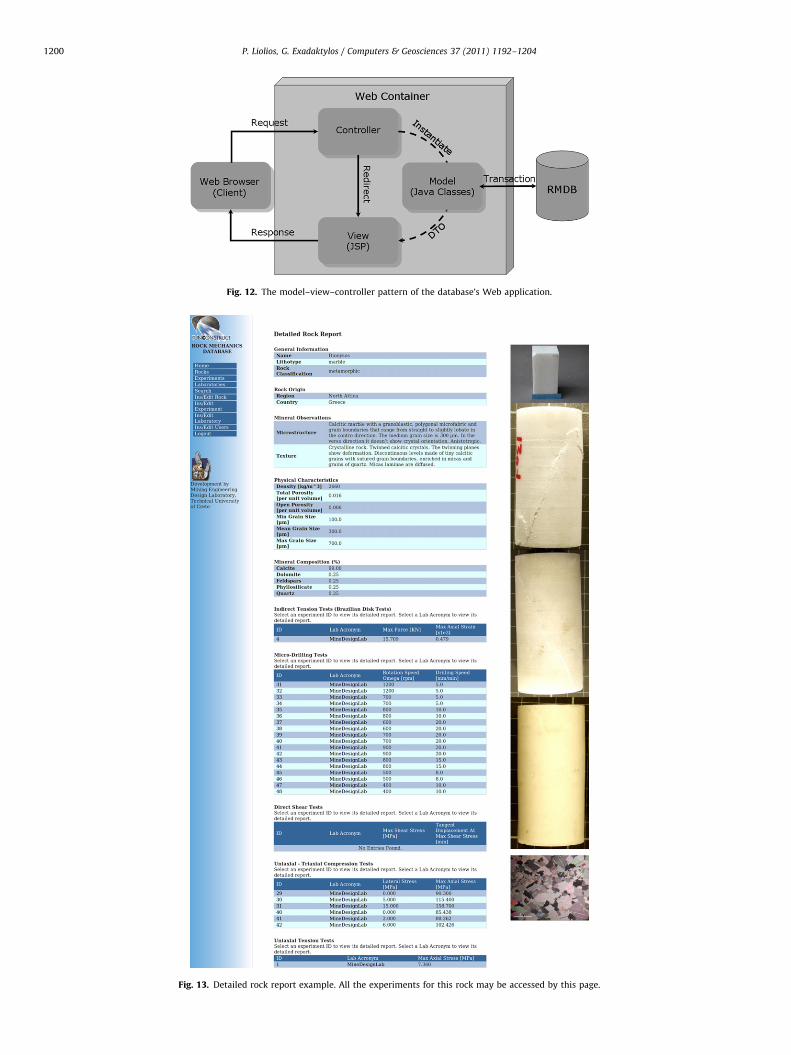
Fig. 12. The model–view–controller pattern of the database’s Web application.
Fig. 13. Detailed rock report example. All the experiments for this rock may be accessed by this page.
P. Liolios, G. Exadaktylos / Computers & Geosciences 37 (2011) 1192–12041200
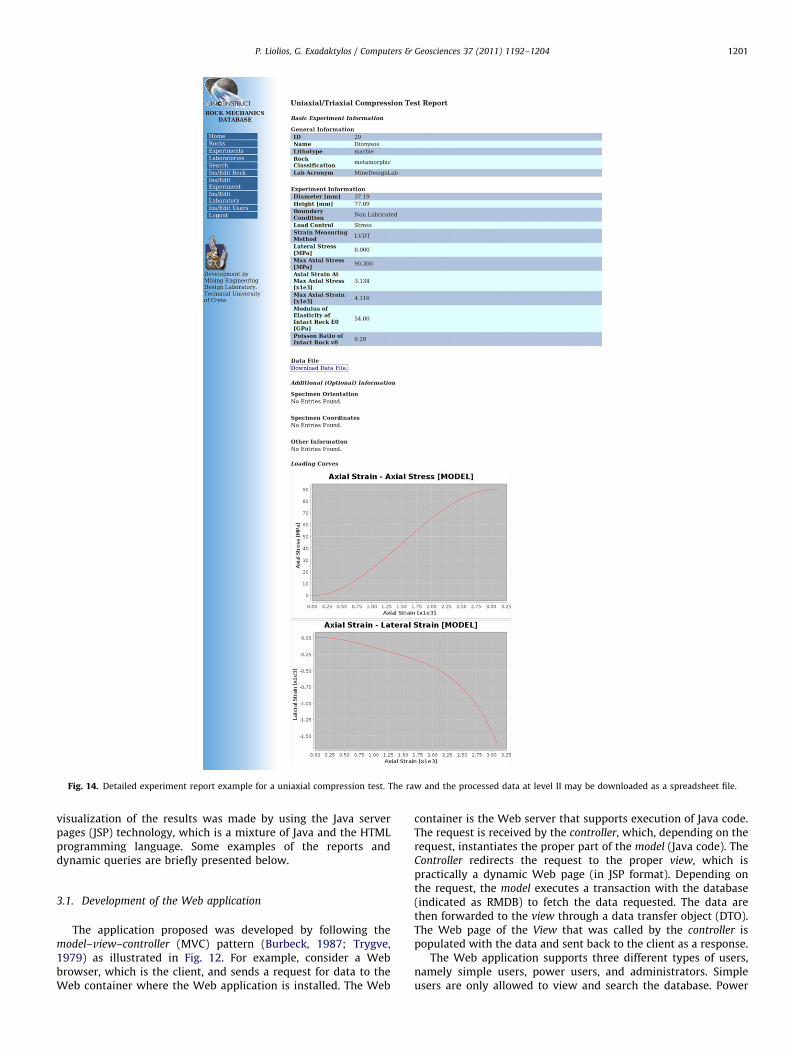
Fig. 14. Detailed experiment report example for a uniaxial compression test. The raw and the processed data at level II may be downloaded as a spreadsheet file.
P. Liolios, G. Exadaktylos / Computers & Geosciences 37 (2011) 1192–1204 1201
visualization of the results was made by using the Java serverpages (JSP) technology, which is a mixture of Java and the HTMLprogramming language. Some examples of the reports anddynamic queries are briefly presented below.
3.1. Development of the Web application
The application proposed was developed by following themodel–view–controller (MVC) pattern (Burbeck, 1987; Trygve,1979) as illustrated in Fig. 12. For example, consider a Webbrowser, which is the client, and sends a request for data to theWeb container where the Web application is installed. The Web
container is the Web server that supports execution of Java code.The request is received by the controller, which, depending on therequest, instantiates the proper part of the model (Java code). TheController redirects the request to the proper view, which ispractically a dynamic Web page (in JSP format). Depending onthe request, the model executes a transaction with the database(indicated as RMDB) to fetch the data requested. The data arethen forwarded to the view through a data transfer object (DTO).The Web page of the View that was called by the controller ispopulated with the data and sent back to the client as a response.
The Web application supports three different types of users,namely simple users, power users, and administrators. Simpleusers are only allowed to view and search the database. Power

P. Liolios, G. Exadaktylos / Computers & Geosciences 37 (2011) 1192–12041202
users can additionally insert, update or delete data. Finally,administrators can add or remove users. This type of administra-tion allows the effective remote control of the database.
3.2. Reports and dynamic queries
In this Web application the data can be browsed by rock,experiment type, or laboratory. When data are browsed by rock,the Web application returns a list with all the available rocks inthe database grouped by type or rock classification. For each rock,a detailed report is dynamically built (Fig. 13). This reportcontains all the information stored about this rock, macroscopicand microscopic photos, as a list of all the experiments performedon it, grouped by type. Accessed either by the rock report,experiments list, or laboratories list, experiment reports containall the information about the experiment and the spreadsheet fileavailable for retrieval. Fig. 14 shows an example of a uniaxialcompression test report. Experiment report also contains dyna-mically built charts of the curves that were described in theprevious sections. The charts are constructed using the coeffi-cients stored in the curves table in each experiment. A laboratoryreport contains information about the selected laboratory, as wellas lists of all the experiments that have been performed by thislab. It should be noted that the reports are linked between them.
Fig. 15. Dynamic query example: (a) find uniaxial compression tests fo
A user can thus view a rock report, through which he or she mayopen an experiment report for that rock, or the laboratory reportof the respective experiment, or the other way around.
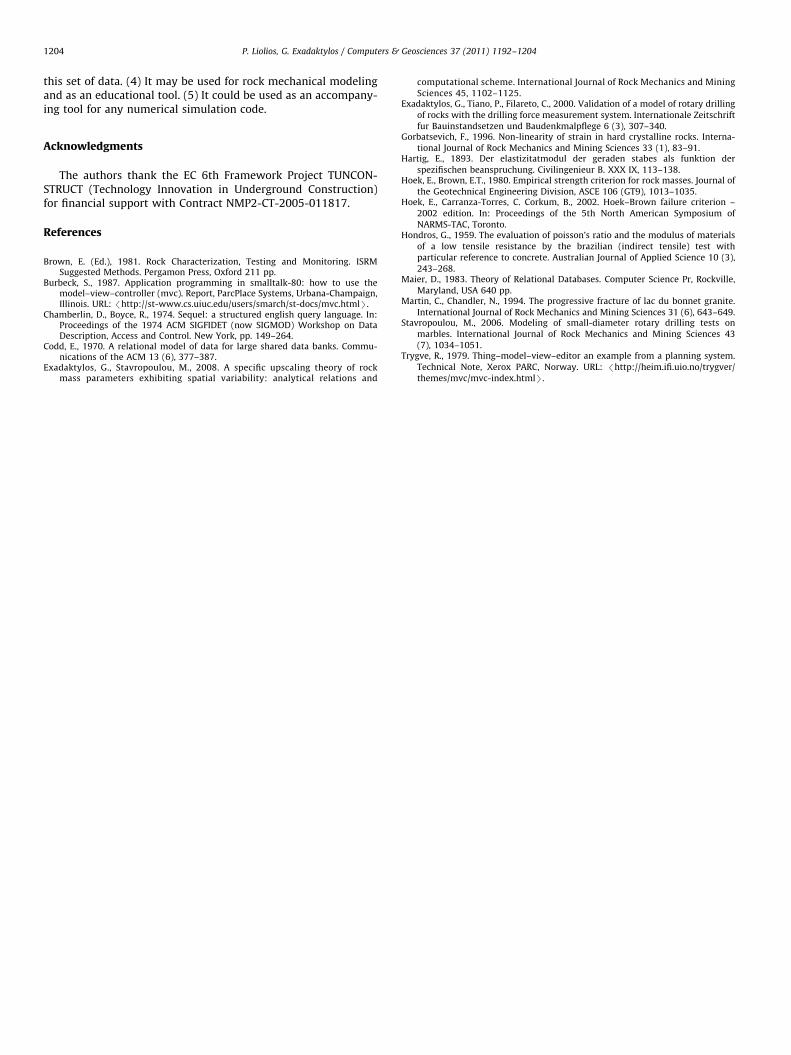
The database can be searched by building appropriate dynamicqueries. The user selects the experiment type and adds con-straints with the help of the database. For example, in Fig. 15a, werequest uniaxial compression tests (lateral pressure equal to zero)for rocks containing more than 30% quartz. The result is a list ofexperiments that fulfill these constraints (Fig. 15b). The experi-ment types may also be cross-related. For example, in Fig. 16a, werequest microdrilling index tests for metamorphic rocks whosemean grain size is between 200 and 300 mm and whose uniaxial/triaxial compression strength is above 60 MPa. Fig. 16b containsthe results of this query.
The creation of dynamic queries is an important feature of thisdatabase. For example, in the predesign stage of a project withscarce data on mechanical parameters of rocks, the RMDB couldbe used as a tool to search for similar rock types already stored inthe database and fully characterized in terms of their elastic,plastic, damage, and strength parameters. Similar rock types canthen be used to feed numerical simulation codes with a completelist of mechanical parameters at least approximately (for examplepeak plastic shear strain intensity or plastic volumetric strain,elastic moduli, dilatancy law).
r rocks that contain more than 30% quartz, and (b) query results.
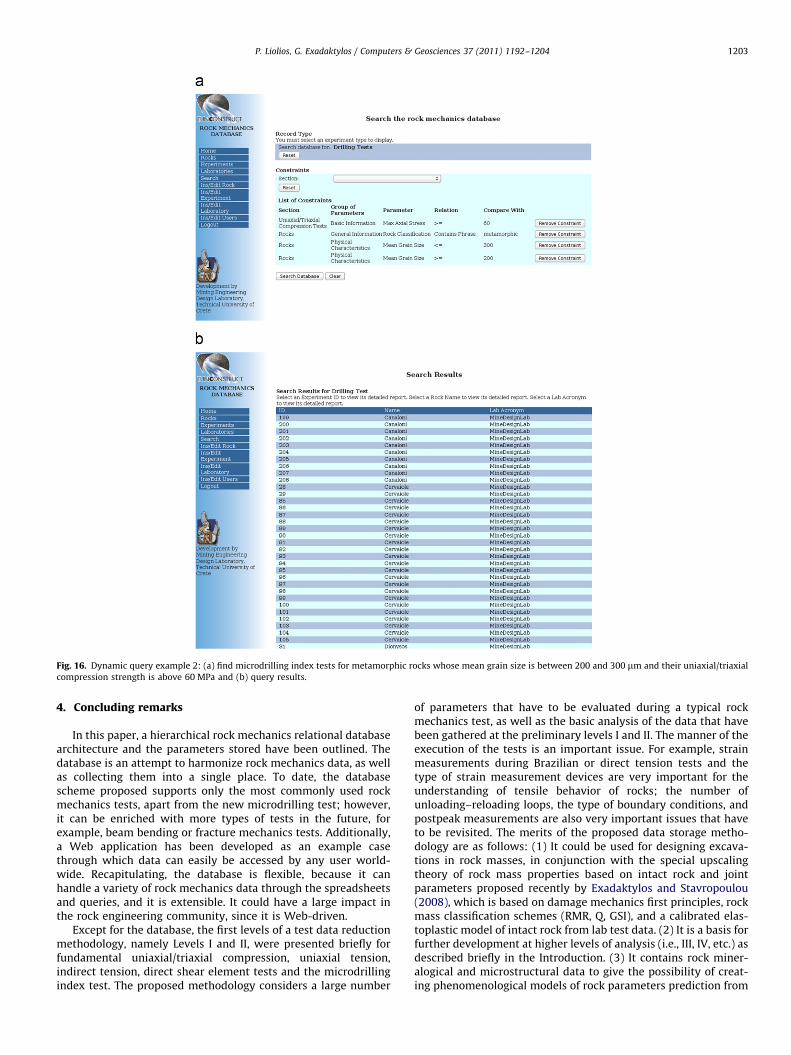
Fig. 16. Dynamic query example 2: (a) find microdrilling index tests for metamorphic rocks whose mean grain size is between 200 and 300 mm and their uniaxial/triaxial
compression strength is above 60 MPa and (b) query results.
P. Liolios, G. Exadaktylos / Computers & Geosciences 37 (2011) 1192–1204 1203
4. Concluding remarks
In this paper, a hierarchical rock mechanics relational databasearchitecture and the parameters stored have been outlined. Thedatabase is an attempt to harmonize rock mechanics data, as wellas collecting them into a single place. To date, the databasescheme proposed supports only the most commonly used rockmechanics tests, apart from the new microdrilling test; however,it can be enriched with more types of tests in the future, forexample, beam bending or fracture mechanics tests. Additionally,a Web application has been developed as an example casethrough which data can easily be accessed by any user world-wide. Recapitulating, the database is flexible, because it canhandle a variety of rock mechanics data through the spreadsheetsand queries, and it is extensible. It could have a large impact inthe rock engineering community, since it is Web-driven.
Except for the database, the first levels of a test data reductionmethodology, namely Levels I and II, were presented briefly forfundamental uniaxial/triaxial compression, uniaxial tension,indirect tension, direct shear element tests and the microdrillingindex test. The proposed methodology considers a large number
of parameters that have to be evaluated during a typical rockmechanics test, as well as the basic analysis of the data that havebeen gathered at the preliminary levels I and II. The manner of theexecution of the tests is an important issue. For example, strainmeasurements during Brazilian or direct tension tests and thetype of strain measurement devices are very important for theunderstanding of tensile behavior of rocks; the number ofunloading–reloading loops, the type of boundary conditions, andpostpeak measurements are also very important issues that haveto be revisited. The merits of the proposed data storage metho-dology are as follows: (1) It could be used for designing excava-tions in rock masses, in conjunction with the special upscalingtheory of rock mass properties based on intact rock and jointparameters proposed recently by Exadaktylos and Stavropoulou(2008), which is based on damage mechanics first principles, rockmass classification schemes (RMR, Q, GSI), and a calibrated elas-toplastic model of intact rock from lab test data. (2) It is a basis forfurther development at higher levels of analysis (i.e., III, IV, etc.) asdescribed briefly in the Introduction. (3) It contains rock miner-alogical and microstructural data to give the possibility of creat-ing phenomenological models of rock parameters prediction from
P. Liolios, G. Exadaktylos / Computers & Geosciences 37 (2011) 1192–12041204
this set of data. (4) It may be used for rock mechanical modelingand as an educational tool. (5) It could be used as an accompany-ing tool for any numerical simulation code.
Acknowledgments
The authors thank the EC 6th Framework Project TUNCON-STRUCT (Technology Innovation in Underground Construction)for financial support with Contract NMP2-CT-2005-011817.
References
Brown, E. (Ed.), 1981. Rock Characterization, Testing and Monitoring. ISRMSuggested Methods. Pergamon Press, Oxford 211 pp.
Burbeck, S., 1987. Application programming in smalltalk-80: how to use themodel–view–controller (mvc). Report, ParcPlace Systems, Urbana-Champaign,Illinois. URL: /http://st-www.cs.uiuc.edu/users/smarch/st-docs/mvc.htmlS.
Chamberlin, D., Boyce, R., 1974. Sequel: a structured english query language. In:Proceedings of the 1974 ACM SIGFIDET (now SIGMOD) Workshop on DataDescription, Access and Control. New York, pp. 149–264.
Codd, E., 1970. A relational model of data for large shared data banks. Commu-nications of the ACM 13 (6), 377–387.
Exadaktylos, G., Stavropoulou, M., 2008. A specific upscaling theory of rockmass parameters exhibiting spatial variability: analytical relations and
computational scheme. International Journal of Rock Mechanics and MiningSciences 45, 1102–1125.
Exadaktylos, G., Tiano, P., Filareto, C., 2000. Validation of a model of rotary drillingof rocks with the drilling force measurement system. Internationale Zeitschriftfur Bauinstandsetzen und Baudenkmalpflege 6 (3), 307–340.
Gorbatsevich, F., 1996. Non-linearity of strain in hard crystalline rocks. Interna-tional Journal of Rock Mechanics and Mining Sciences 33 (1), 83–91.
Hartig, E., 1893. Der elastizitatmodul der geraden stabes als funktion derspezifischen beanspruchung. Civilingenieur B. XXX IX, 113–138.
Hoek, E., Brown, E.T., 1980. Empirical strength criterion for rock masses. Journal ofthe Geotechnical Engineering Division, ASCE 106 (GT9), 1013–1035.
Hoek, E., Carranza-Torres, C. Corkum, B., 2002. Hoek–Brown failure criterion –2002 edition. In: Proceedings of the 5th North American Symposium ofNARMS-TAC, Toronto.
Hondros, G., 1959. The evaluation of poisson’s ratio and the modulus of materialsof a low tensile resistance by the brazilian (indirect tensile) test withparticular reference to concrete. Australian Journal of Applied Science 10 (3),243–268.
Maier, D., 1983. Theory of Relational Databases. Computer Science Pr, Rockville,Maryland, USA 640 pp.
Martin, C., Chandler, N., 1994. The progressive fracture of lac du bonnet granite.International Journal of Rock Mechanics and Mining Sciences 31 (6), 643–649.
Stavropoulou, M., 2006. Modeling of small-diameter rotary drilling tests onmarbles. International Journal of Rock Mechanics and Mining Sciences 43(7), 1034–1051.
Trygve, R., 1979. Thing–model–view–editor an example from a planning system.Technical Note, Xerox PARC, Norway. URL: /http://heim.ifi.uio.no/trygver/themes/mvc/mvc-index.htmlS.