Embed Size (px)
Citation preview
Economic Journal of Emerging Markets. Special Edition on Regional Economics. September 2009 © Faculty of Economics, Universitas Islam Indonesia
A Regional Development Strategy Approach in Indonesia’s Regional Autonomy Era (A Case Study on Bandung Barat Regency)1
Galuh Syahbana Indraprahasta* Center for Regional System Analysis, Planning, and Development (CRESTPENT),
Bogor Agricultural University *Email: [email protected]
ABSTRACT
Regional autonomy which has become one of the most emerging Indonesia’s 1998-reformation answers has pushed a new regional development orientation mainly in cities (kota) and regencies (kabupaten) planning. This new orientation has shifted the centralized and sector-based planning into regional-based planning. Against the previous perspective, this research tries to offer an approach for regional development in regional autonomy era. This research aims to identify leading sectors in local and provincial level, identify local leading places, identify institutional support, and analyse regional development strategy. The analytical methods used in this study are input-output (I-O) model, location quotient (LQ), shift-share analysis (SSA), Williamson index, principal component analysis (PCA), Theil index, focus group discussion (FGD), correspondence analysis, and Strengths Weaknesses Opportunities and Threats (SWOT) analysis.
Entertainment and recreation sector together with industrial sector are identified as leading sector, resulted by the multiplier input-output analysis, while agricultural sector remains economically not significant but still strategic. Almost 90% of regional disparity in Bandung Barat Regency is caused by economic sector disparities within districts (kecamatan), in which industrial sector has caused this state. As a consequence, the development of industrial sector un-spatially will cause regional disparities in spite of its huge economic contribution. The government of Bandung Barat Regency itself apparently does not adapt the new regional development orientation properly. As a result, it must be a clear approach of regional development in the regional autonomy era integrating sector and spatial development and supported by good government capacity. Keywords: regional development, regional autonomy, disparity, sector, spatial, institutional 1 A Part of Master Thesis
Important note! This paper has published in the original journal with different format Cite this paper: Indraprahasta, Galuh S. (2012) “A regional development strategy approach in Indonesia’s regional autonomy era (a case study on Bandung Barat Regency”, Economic Journal of Emerging Market. Special Edition on Regional Economics, September 2009: 31-42.
I. INTRODUCTION
Regional autonomy which has become one of the most emerging Indonesia’s 1998-reformation had issued Law 22/1999 about Regional Governance and Law 25/1999 about Fiscal Balance between National and Regional Government (which were later revised with Law 32/2004 and Law 33/2004). This era actually has shifted the orientation of regional development from the old centralized-sector-based into regional-based development
The current big challenge of every region (city and regency) in the era is then the ability to implement this regional development orientation shifting smoothly. The regional development which is offered in this study is focused on the importance of integration of sectoral, spatial, and institutional development. Anwar and Rustiadi (2000) argued that due to the limitation of resources availability, there should be a development priority set, mainly in the perspective of regional development in the regional autonomy era.
One of the new autonomy regions which has emerged recently (2007) is Bandung Barat Regency (Kabupaten Bandung Barat) which was a part of Bandung Regency (Kabupaten Bandung). As a new autonomy region, Bandung Barat Regency should also include and adapt the new regional development orientation to address the objective of regional autonomy to increase its citizen prosperity. The emergence of Bandung Barat Regency as a new autonomy region basically is related with the trend of regional proliferation. This option tends to occur and leave other choices such as public services improvement and economic disparity reducing, although there are no cultural differences between the people of Bandung Barat Regency and Bandung Regency. Nationally, there are 498 regencies and cities in year 2009 (Wikipedia, 2008); as a comparison, in year 1999 there are 339 regencies and cities in Indonesia (Bappenas, 2004). There are evidences showing that many autonomy regions have failed to establish on their own feet and they tend to waste regional finance both regionally and nationally. The fiscal structure of Bandung Barat Regency itself is still dependent highly on non-Regional Original Income (PAD or Pendapatan Asli Daerah) and it has big proportion for apparatus expenses. Apart from the external challenges, Bandung Barat Regency is also facing with internal challenges mainly on the dualism of economic sector between agricultural and industrial sector. The industrial sector contributes 42.92% of GDP, but only employs 16.61% of local labour. As a comparison, the agricultural sector contributes only 12.34% of GDP, but hires 34.03% of local labour. The domination of agricultural sector can also be seen physically by the domination of rural area (52.14%) and protected area (36.94%, which is dominated by protected forest). There are so many un-worked labours causing 17.21% open unemployment in year 2007. From a human quality point of view, Bandung Barat Regency’s HDI in year 2007 is 70.01; lower than the West Java Province of 70.71. Bandung Barat Regency has several well-known potential well-known districts (kecamatan) far before this regency proliferated, most notably Lembang for its natural landscape attractiveness, Padalarang for its mining activity, and Cililin for its home made traditional foods named wajik. The combination of previous challenges and potentials should be managed by a clear Bandung Barat Regency’s regional development strategy, which is able to adapt with the new regional development as an autonomous region. As a result, regional
development should not perceive as all-sector development, but should be developed based upon the sectoral priority and its linkage with the spatial and institutional aspects. (Anwar and Rustiadi, 2000) Against the previous background, six research questions proposed are: What are the leading sectors based on local perspective?; What are the leading sectors based on provincial perspective?; Where are the leading sectors located?; Are there any evidences of regional inequality, leakage, and sustainability?; Does the existing institutional support the regional development?; What regional development strategy offered for Bandung Barat Regency?
II. RESEARCH METHODOLOGY
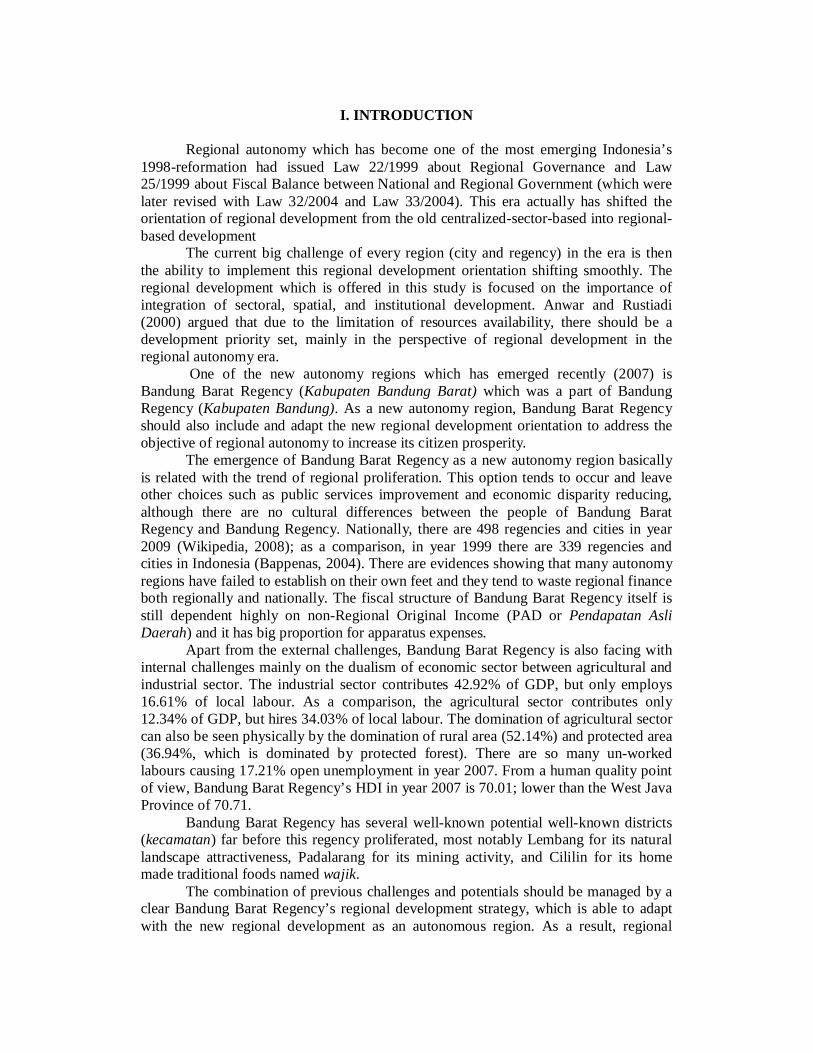
This research tries to answer the 6 research questions based on the regional development concept used, which is constructed from the integrity of sectoral, spatial, and institutional development aspects (Anwar and Rustiadi, 2000). The priority sector(s) is identified as a prime analysis mover of the 3 components. Identifying evidences of regional inequality, leakage, and sustainability is purposed to tackle 3 most important issues in regional development.
Figure 1 Analysis Approach Framework
III. RESULTS AND DISCUSSION
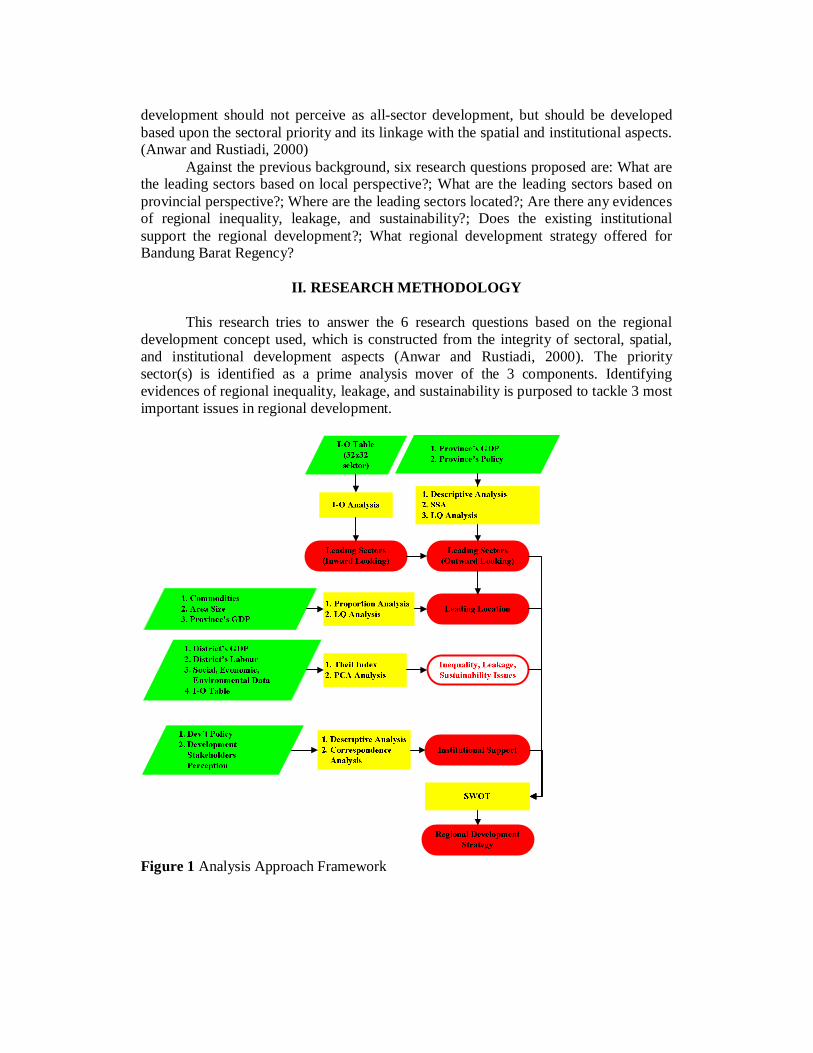
3.1 Macro Economic Structure Industrial sector contributes the biggest proportion of Bandung Barat Regency’s GDP, followed by commerce, hotel, and restaurant sector in the second place. There is a trend of agricultural and industrial sector which have decreased slightly year by year. This is an evidence of economic diversification into tertiary activities. The increasing contribution of tertiary sector is one of the most important indications of urbanization which has experienced in Bandung Barat Regency
47.23 47.1 47 46.9 46.61 46.7 46.85
18.16 18.24 18.25 18.51 18.48 18.45 18.67
11.0411.5511.511.3711.6411.7312.25
05
101520253035404550
2000 2001 2002 2003 2004 2005 2006
Year
Con
trib
utio
n (%
)
Industry Commerce, Hotel, Restaurant Agriculture
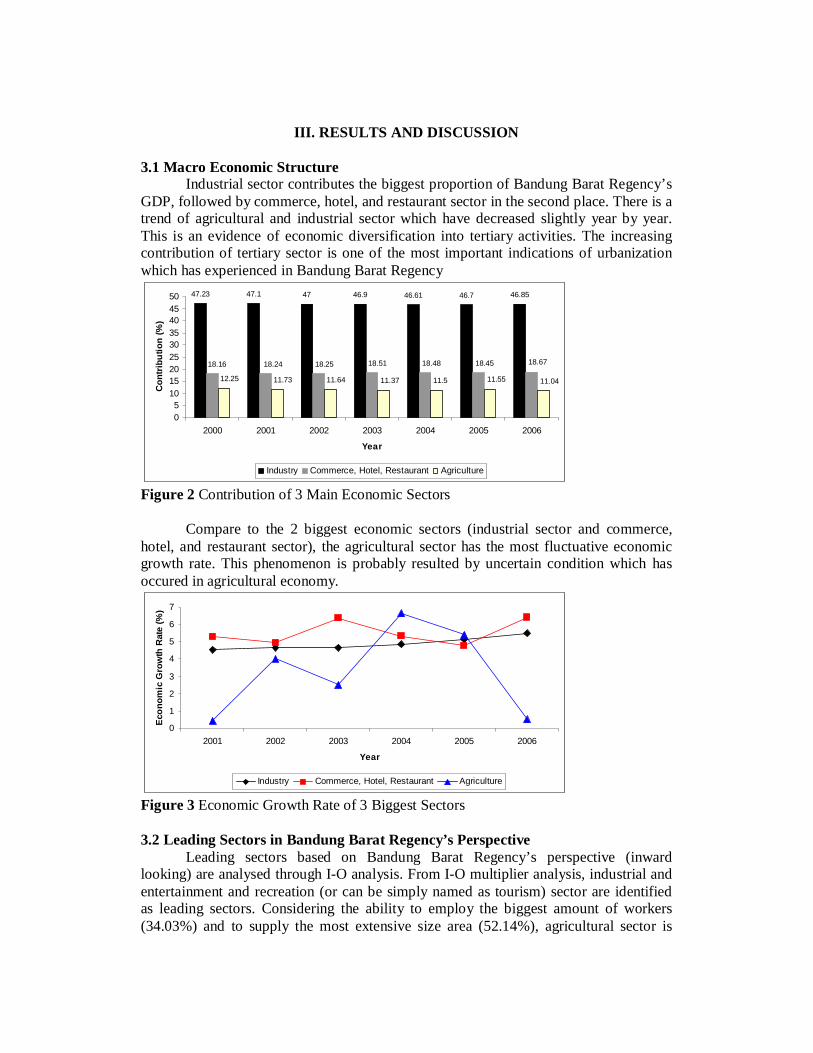
Figure 2 Contribution of 3 Main Economic Sectors Compare to the 2 biggest economic sectors (industrial sector and commerce,
hotel, and restaurant sector), the agricultural sector has the most fluctuative economic growth rate. This phenomenon is probably resulted by uncertain condition which has occured in agricultural economy.
0
1
2
3
4
5
6
7
2001 2002 2003 2004 2005 2006
Year
Econ
omic
Gro
wth
Rat
e (%
)
Industry Commerce, Hotel, Restaurant Agriculture
Figure 3 Economic Growth Rate of 3 Biggest Sectors 3.2 Leading Sectors in Bandung Barat Regency’s Perspective
Leading sectors based on Bandung Barat Regency’s perspective (inward looking) are analysed through I-O analysis. From I-O multiplier analysis, industrial and entertainment and recreation (or can be simply named as tourism) sector are identified as leading sectors. Considering the ability to employ the biggest amount of workers (34.03%) and to supply the most extensive size area (52.14%), agricultural sector is
identified as strategic sector. Furthermore, animal husbandry has the highest I-O multiplier values compare to the other agricultural sub-sectors.
Table 1 Sector with the Highest I-O Multiplier Values
Sector Multiplier
Output Income Surplus Tax Total Value-Added TOTAL Construction 1 1 1 1 1 5 Entertainment & Recreation 1 1 1 1 1 5 Industry 1 1 1 0 1 4 Railway Transportation 1 1 1 0 1 4 People Services 1 0 1 1 1 4 Enterprise Services 1 1 1 0 1 4 River & Lake Transportation 0 0 0 1 0 1 Building Rent 0 1 0 0 0 1 Electricity 0 0 0 1 0 1 Animal Husbandry 0 0 0 1 0 1 Source: Analysis, 2009 Note: 1 = related, 0 = not related 3.2 Leading Sectors in Perspective of West Java Province
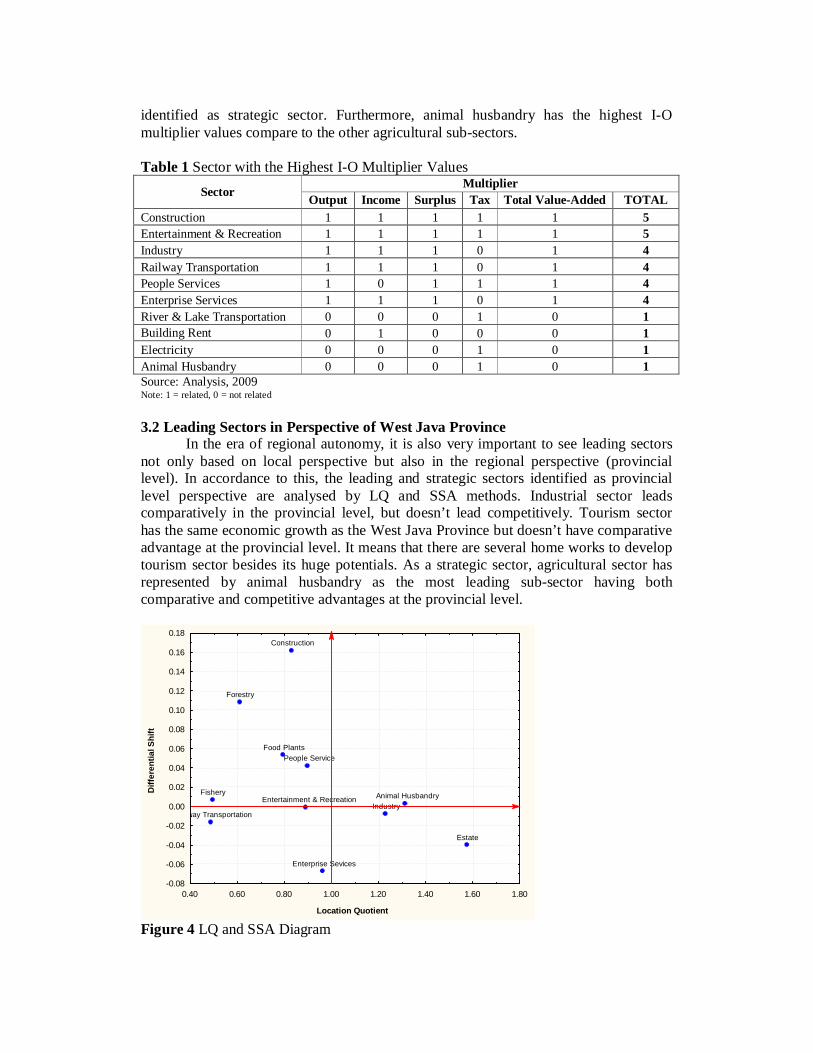
In the era of regional autonomy, it is also very important to see leading sectors not only based on local perspective but also in the regional perspective (provincial level). In accordance to this, the leading and strategic sectors identified as provincial level perspective are analysed by LQ and SSA methods. Industrial sector leads comparatively in the provincial level, but doesn’t lead competitively. Tourism sector has the same economic growth as the West Java Province but doesn’t have comparative advantage at the provincial level. It means that there are several home works to develop tourism sector besides its huge potentials. As a strategic sector, agricultural sector has represented by animal husbandry as the most leading sub-sector having both comparative and competitive advantages at the provincial level.
Food Plants
Estate
Animal Husbandry
Forestry
Fishery
IndustryEntertainment & Recreation
Construction
Railway Transportation
People Service
Enterprise Sevices
0.40 0.60 0.80 1.00 1.20 1.40 1.60 1.80
Location Quotient
-0.08
-0.06
-0.04
-0.02
0.00
0.02
0.04
0.06
0.08
0.10
0.12
0.14
0.16
0.18
Diff
eren
tial S
hift
Figure 4 LQ and SSA Diagram
3.3 Initial Identification of Leading Commodities Initial identification of leading commodities is conducted to give general
detection of leading commodities of leading and strategic sectors at provincial perspective. Industrial sector consists of small and medium-big enterprises. Textile industry is the leading commodity (30.32%) of medium-big enterprise, followed by non metal mining industry in the second place (16.13%), then non feather clothes in the third (14.19%). Furthermore, 80% of medium-big enterprises are non-agricultural enterprises. The composition of small enterprise differs from the medium-big enterprise. The most dominant small industry is food (38.74%) and cane work (34.42%) enterprises.
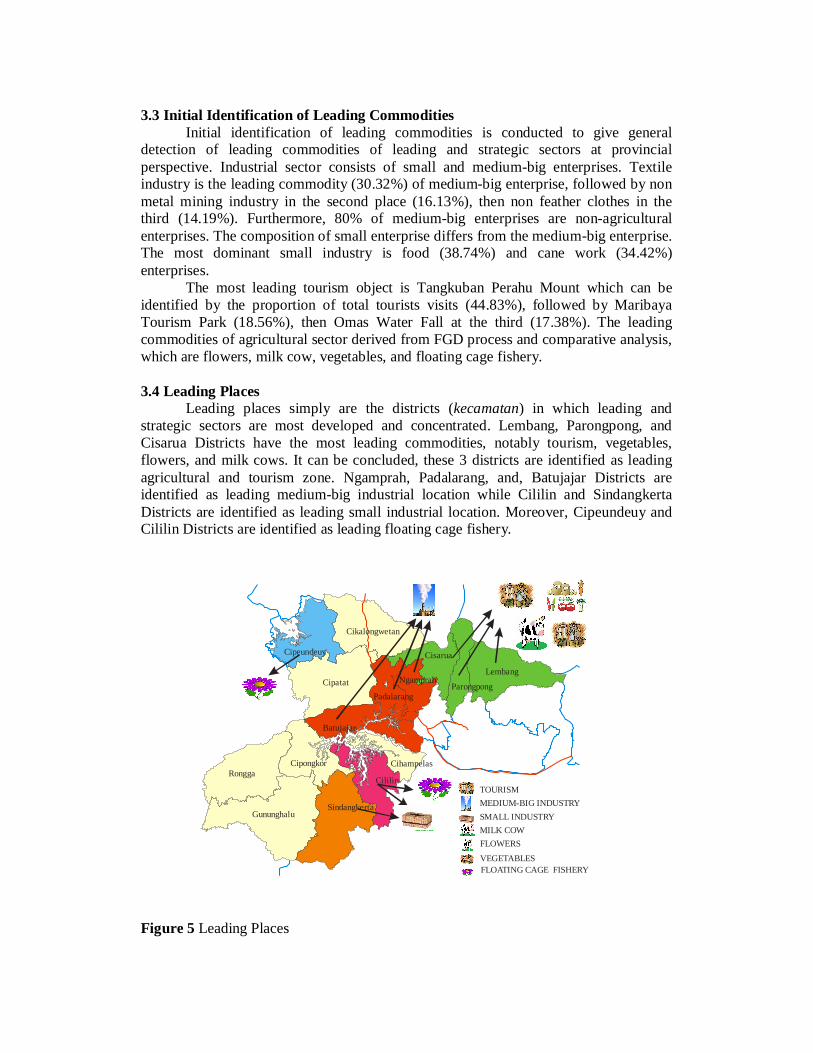
The most leading tourism object is Tangkuban Perahu Mount which can be identified by the proportion of total tourists visits (44.83%), followed by Maribaya Tourism Park (18.56%), then Omas Water Fall at the third (17.38%). The leading commodities of agricultural sector derived from FGD process and comparative analysis, which are flowers, milk cow, vegetables, and floating cage fishery. 3.4 Leading Places Leading places simply are the districts (kecamatan) in which leading and strategic sectors are most developed and concentrated. Lembang, Parongpong, and Cisarua Districts have the most leading commodities, notably tourism, vegetables, flowers, and milk cows. It can be concluded, these 3 districts are identified as leading agricultural and tourism zone. Ngamprah, Padalarang, and, Batujajar Districts are identified as leading medium-big industrial location while Cililin and Sindangkerta Districts are identified as leading small industrial location. Moreover, Cipeundeuy and Cililin Districts are identified as leading floating cage fishery.
Cipeundeuy Cisarua
Cikalongwetan
CipatatLembang
ParongpongNgamprah
Padalarang
Batujajar
Cililin
SindangkertaGununghalu
CipongkorRongga
Cihampelas
TOURISMMEDIUM-BIG INDUSTRYSMALL INDUSTRYMILK COWFLOWERS
VEGETABLESFLOATING CAGE FISHERY
Figure 5 Leading Places
3.5 Regional Inequality, Leakage, and Sustainability Regional Inequality
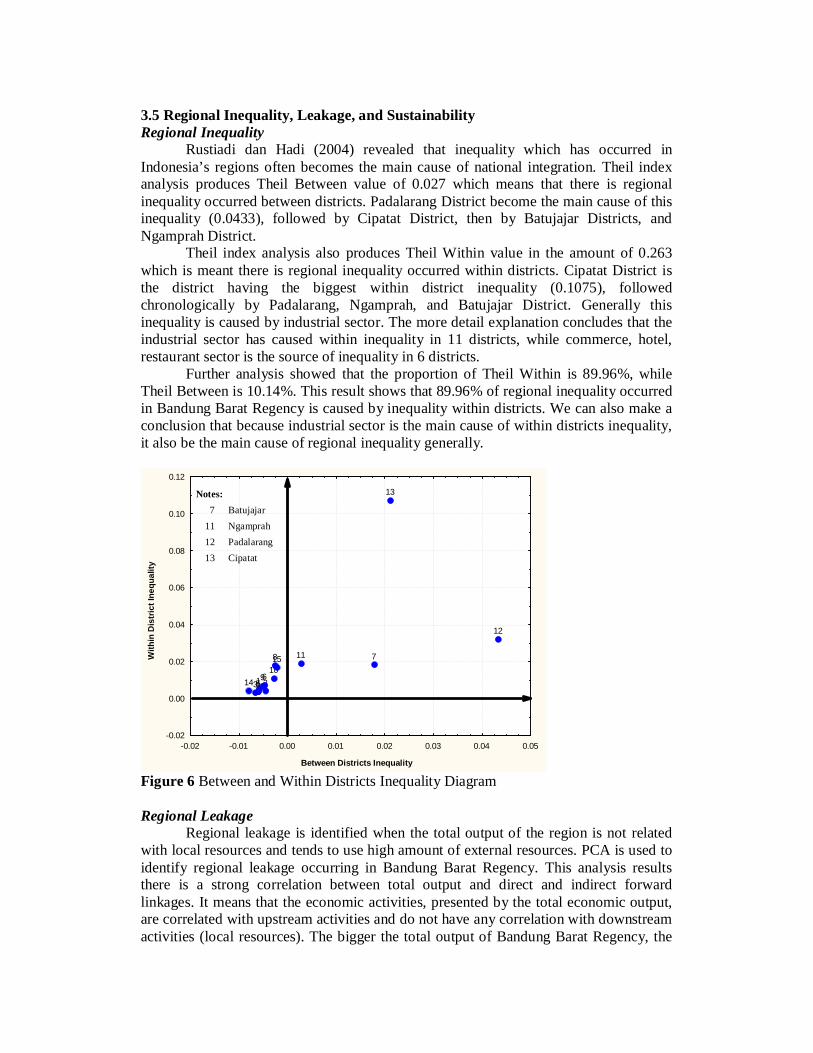
Rustiadi dan Hadi (2004) revealed that inequality which has occurred in Indonesia’s regions often becomes the main cause of national integration. Theil index analysis produces Theil Between value of 0.027 which means that there is regional inequality occurred between districts. Padalarang District become the main cause of this inequality (0.0433), followed by Cipatat District, then by Batujajar Districts, and Ngamprah District.
Theil index analysis also produces Theil Within value in the amount of 0.263 which is meant there is regional inequality occurred within districts. Cipatat District is the district having the biggest within district inequality (0.1075), followed chronologically by Padalarang, Ngamprah, and Batujajar District. Generally this inequality is caused by industrial sector. The more detail explanation concludes that the industrial sector has caused within inequality in 11 districts, while commerce, hotel, restaurant sector is the source of inequality in 6 districts.
Further analysis showed that the proportion of Theil Within is 89.96%, while Theil Between is 10.14%. This result shows that 89.96% of regional inequality occurred in Bandung Barat Regency is caused by inequality within districts. We can also make a conclusion that because industrial sector is the main cause of within districts inequality, it also be the main cause of regional inequality generally.
1 23456
78
910
11
12
13
14
15
-0.02 -0.01 0.00 0.01 0.02 0.03 0.04 0.05
Between Districts Inequality
-0.02
0.00
0.02
0.04
0.06
0.08
0.10
0.12
With
in D
istr
ict I
nequ
ality
Figure 6 Between and Within Districts Inequality Diagram
Regional Leakage
Regional leakage is identified when the total output of the region is not related with local resources and tends to use high amount of external resources. PCA is used to identify regional leakage occurring in Bandung Barat Regency. This analysis results there is a strong correlation between total output and direct and indirect forward linkages. It means that the economic activities, presented by the total economic output, are correlated with upstream activities and do not have any correlation with downstream activities (local resources). The bigger the total output of Bandung Barat Regency, the
Notes: 7 Batujajar
11 Ngamprah 12 Padalarang 13 Cipatat
bigger its correlation with external resources. On the other hand, all I-O multipliers- except import multiplier-are related with direct and indirect backward linkages. This is a phenomenon configuring that the downstream economic system is getting weaken compare to the upstream economic activities. The increasing of added value does not make the local economy stronger and tend to let the capital flow out. Table 2 Correlation between Economic Variable
Economic Variable Main Factors
1 2 3 Direct Backward Linkage 0.923 0.243 0.093 Direct & Indirect Backward Linkage 0.912 0.245 0.068 Direct Forward Linkage 0.196 0.974 -0.014 Direct & Indirect Forward Linkage 0.155 0.982 -0.028 Income Multiplier 0.847 0.243 0.133 Surplus Multiplier 0.808 0.033 0.094 Depreciation Multiplier 0.803 0.085 0.004 Tax Multiplier 0.649 -0.114 -0.398 Total Value-Added Multiplier 0.942 0.217 0.154 Import Multiplier 0.195 -0.132 0.900 Total Output 0.136 0.981 -0.086 Source: Study Analysis, 2009 (Varimax Method)
Regional Sustainability
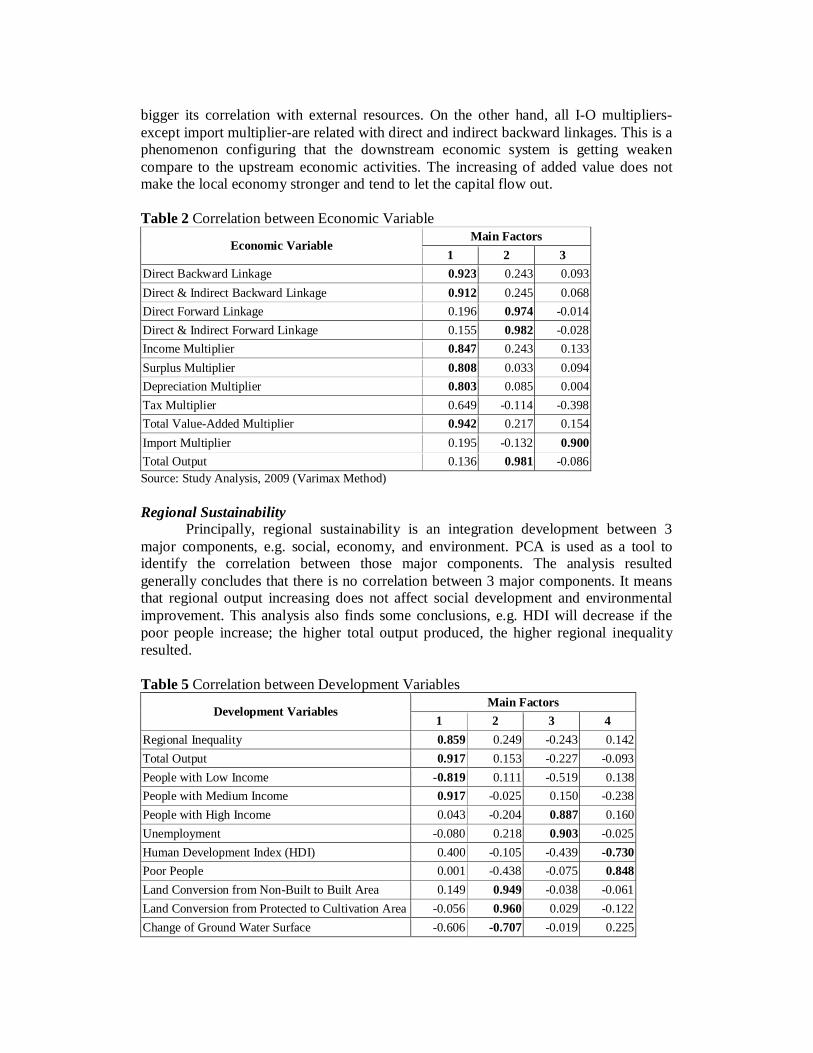
Principally, regional sustainability is an integration development between 3 major components, e.g. social, economy, and environment. PCA is used as a tool to identify the correlation between those major components. The analysis resulted generally concludes that there is no correlation between 3 major components. It means that regional output increasing does not affect social development and environmental improvement. This analysis also finds some conclusions, e.g. HDI will decrease if the poor people increase; the higher total output produced, the higher regional inequality resulted.
Table 5 Correlation between Development Variables
Development Variables Main Factors
1 2 3 4 Regional Inequality 0.859 0.249 -0.243 0.142 Total Output 0.917 0.153 -0.227 -0.093 People with Low Income -0.819 0.111 -0.519 0.138 People with Medium Income 0.917 -0.025 0.150 -0.238 People with High Income 0.043 -0.204 0.887 0.160 Unemployment -0.080 0.218 0.903 -0.025 Human Development Index (HDI) 0.400 -0.105 -0.439 -0.730 Poor People 0.001 -0.438 -0.075 0.848 Land Conversion from Non-Built to Built Area 0.149 0.949 -0.038 -0.061 Land Conversion from Protected to Cultivation Area -0.056 0.960 0.029 -0.122 Change of Ground Water Surface -0.606 -0.707 -0.019 0.225
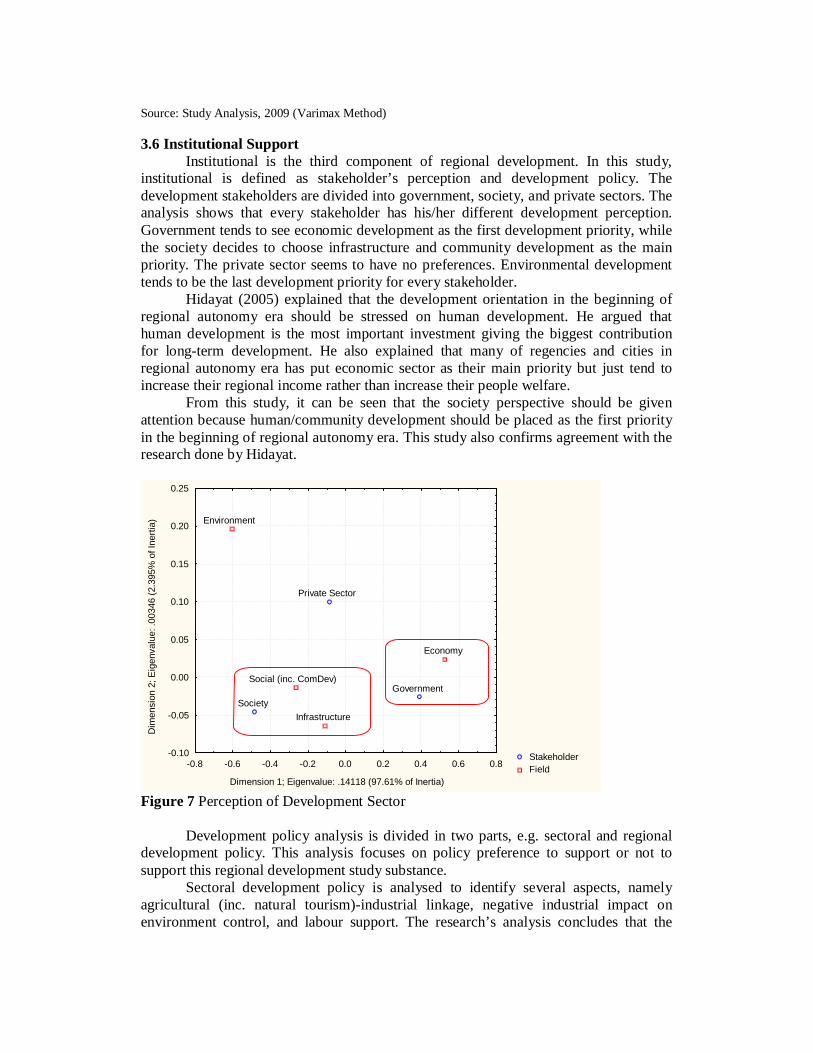
Source: Study Analysis, 2009 (Varimax Method) 3.6 Institutional Support
Institutional is the third component of regional development. In this study, institutional is defined as stakeholder’s perception and development policy. The development stakeholders are divided into government, society, and private sectors. The analysis shows that every stakeholder has his/her different development perception. Government tends to see economic development as the first development priority, while the society decides to choose infrastructure and community development as the main priority. The private sector seems to have no preferences. Environmental development tends to be the last development priority for every stakeholder.
Hidayat (2005) explained that the development orientation in the beginning of regional autonomy era should be stressed on human development. He argued that human development is the most important investment giving the biggest contribution for long-term development. He also explained that many of regencies and cities in regional autonomy era has put economic sector as their main priority but just tend to increase their regional income rather than increase their people welfare.
From this study, it can be seen that the society perspective should be given attention because human/community development should be placed as the first priority in the beginning of regional autonomy era. This study also confirms agreement with the research done by Hidayat.
StakeholderField
GovernmentSociety
Private Sector
Social (inc. ComDev)
Economy
Infrastructure
Environment
-0.8 -0.6 -0.4 -0.2 0.0 0.2 0.4 0.6 0.8
Dimension 1; Eigenvalue: .14118 (97.61% of Inertia)
-0.10
-0.05
0.00
0.05
0.10
0.15
0.20
0.25
Dim
ensi
on 2
; Eig
enva
lue:
.003
46 (2
.395
% o
f Ine
rtia)
Figure 7 Perception of Development Sector
Development policy analysis is divided in two parts, e.g. sectoral and regional
development policy. This analysis focuses on policy preference to support or not to support this regional development study substance.
Sectoral development policy is analysed to identify several aspects, namely agricultural (inc. natural tourism)-industrial linkage, negative industrial impact on environment control, and labour support. The research’s analysis concludes that the
increasing of Bandung Barat Regency’s total output (economic growth) will increase the regional leakage and inequality. Regional leakage and inequality are caused by lack of linkage between downstream-upstream economic activities. Due to this problem, there should be linkage developed between local potentials (natural resources) and industrial sector to minimize capital outflow. Nevertheless, this issue-based on the analysis-is not caught by sectoral development policy.
The major environmental issue occurred in Bandung Barat Regency is mainly caused by industrial activities. Unfortunately, this issue is not existed in sectoral development policy. The third issue is supporting workers, mainly for industrial, tourism, and agricultural sectors. This research’s analysis concludes there is no workers’ support policy for tourism and agricultural sector. On the contrary, there is workers support policy for industrial sector. It means that the government sector has not seen yet the tourism potentials and the abundant of agricultural labour.
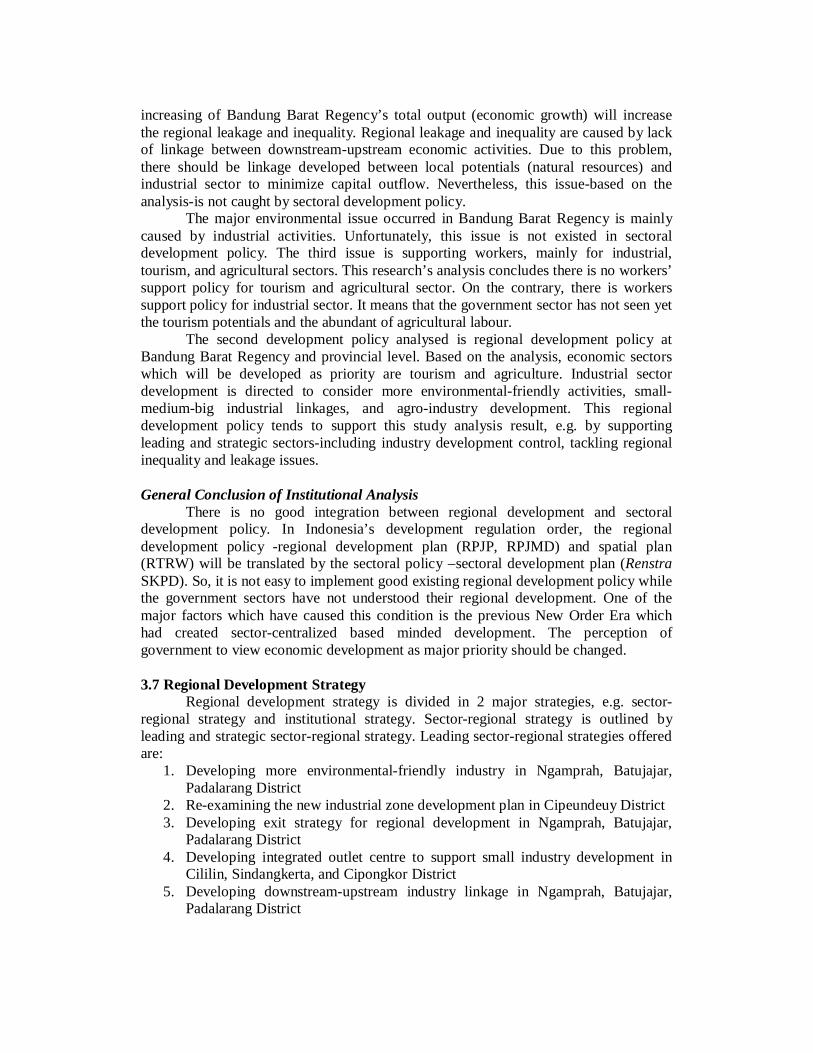
The second development policy analysed is regional development policy at Bandung Barat Regency and provincial level. Based on the analysis, economic sectors which will be developed as priority are tourism and agriculture. Industrial sector development is directed to consider more environmental-friendly activities, small-medium-big industrial linkages, and agro-industry development. This regional development policy tends to support this study analysis result, e.g. by supporting leading and strategic sectors-including industry development control, tackling regional inequality and leakage issues. General Conclusion of Institutional Analysis There is no good integration between regional development and sectoral development policy. In Indonesia’s development regulation order, the regional development policy -regional development plan (RPJP, RPJMD) and spatial plan (RTRW) will be translated by the sectoral policy –sectoral development plan (Renstra SKPD). So, it is not easy to implement good existing regional development policy while the government sectors have not understood their regional development. One of the major factors which have caused this condition is the previous New Order Era which had created sector-centralized based minded development. The perception of government to view economic development as major priority should be changed. 3.7 Regional Development Strategy Regional development strategy is divided in 2 major strategies, e.g. sector-regional strategy and institutional strategy. Sector-regional strategy is outlined by leading and strategic sector-regional strategy. Leading sector-regional strategies offered are:
1. Developing more environmental-friendly industry in Ngamprah, Batujajar, Padalarang District
2. Re-examining the new industrial zone development plan in Cipeundeuy District 3. Developing exit strategy for regional development in Ngamprah, Batujajar,
Padalarang District 4. Developing integrated outlet centre to support small industry development in
Cililin, Sindangkerta, and Cipongkor District 5. Developing downstream-upstream industry linkage in Ngamprah, Batujajar,
Padalarang District
6. Developing known-existing tourism destination in Lembang, Cisarua, and Parongpong District
7. Examining potential tourism objects in Cipatat, Ngamprah, Padalarang, Cikalongwetan District and Cirata Dam.
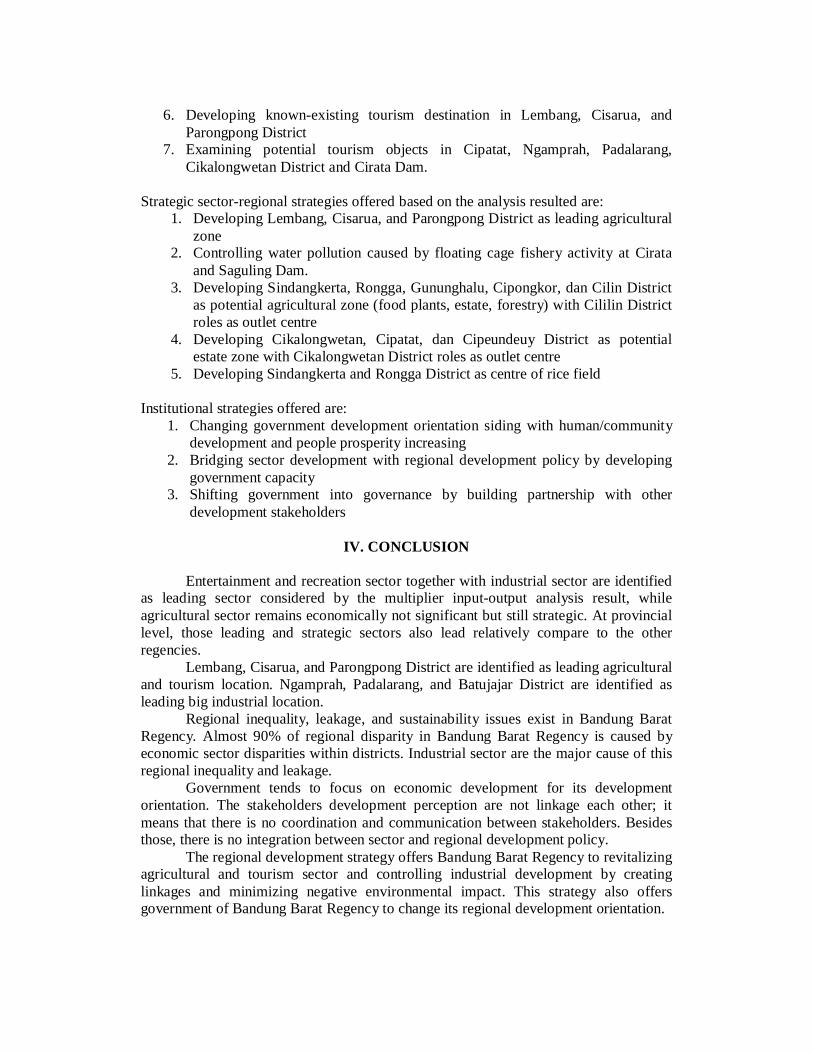
Strategic sector-regional strategies offered based on the analysis resulted are:
1. Developing Lembang, Cisarua, and Parongpong District as leading agricultural zone
2. Controlling water pollution caused by floating cage fishery activity at Cirata and Saguling Dam.
3. Developing Sindangkerta, Rongga, Gununghalu, Cipongkor, dan Cilin District as potential agricultural zone (food plants, estate, forestry) with Cililin District roles as outlet centre
4. Developing Cikalongwetan, Cipatat, dan Cipeundeuy District as potential estate zone with Cikalongwetan District roles as outlet centre
5. Developing Sindangkerta and Rongga District as centre of rice field Institutional strategies offered are:
1. Changing government development orientation siding with human/community development and people prosperity increasing
2. Bridging sector development with regional development policy by developing government capacity
3. Shifting government into governance by building partnership with other development stakeholders
IV. CONCLUSION
Entertainment and recreation sector together with industrial sector are identified
as leading sector considered by the multiplier input-output analysis result, while agricultural sector remains economically not significant but still strategic. At provincial level, those leading and strategic sectors also lead relatively compare to the other regencies.
Lembang, Cisarua, and Parongpong District are identified as leading agricultural and tourism location. Ngamprah, Padalarang, and Batujajar District are identified as leading big industrial location.
Regional inequality, leakage, and sustainability issues exist in Bandung Barat Regency. Almost 90% of regional disparity in Bandung Barat Regency is caused by economic sector disparities within districts. Industrial sector are the major cause of this regional inequality and leakage.
Government tends to focus on economic development for its development orientation. The stakeholders development perception are not linkage each other; it means that there is no coordination and communication between stakeholders. Besides those, there is no integration between sector and regional development policy.
The regional development strategy offers Bandung Barat Regency to revitalizing agricultural and tourism sector and controlling industrial development by creating linkages and minimizing negative environmental impact. This strategy also offers government of Bandung Barat Regency to change its regional development orientation.
REFERENCES
Bappenas [National Development Planning Body]. 2004. Provincial Role in the
Establishment of New Autonomous Region and Facilitation of New Autonomous Region Governance. Final Report of Directorate of Regional Autonomy Development. Jakarta: Bappenas. (in Indonesian)
BPS [Statistical Office of Bandung Regency]. 2005. Bandung Regency in Figure 2005. BPS: Bandung. (in Indonesian)
________________.2006. Bandung Regency in Figure 2006. BPS: Bandung. (in Indonesian)
________________.2007. Bandung Regency in Figure 2007. BPS: Bandung. (in Indonesian)
Anwar, Affendi and Ernan Rustiadi. 2000. Perspective of Rural Spatial Planning as a Means of Regional and Rural Development. Bogor: Bogor Agricultural University. (in Indonesian)
Hidayat, Syarif. 2005. “Hidden Autonomy. Understanding The Nature of Indonesia Decentralization on a Day-to-Day Basis”, in Erb, Maribeth, Priyambudi Sulistiyanto, and Carole Faucher. Regionalism in Post-Suharto Indonesia. RoutledgeCurzon: New York
Rustiadi, Ernan and Setia Hadi. 2004. Agropolitan Development as a Strategy for Balance Rural and Regional Balance. Paper presented at Workshop. (in Indonesian)


