Embed Size (px)
Citation preview

EUROPEAN LABORATORY FOR PARTICLE PHYSICS
CERN-EP/98-044March 20, 1998
A measurement of the
inclusive b! s branching ratio
The ALEPH Collaboration1
Abstract
The avour changing neutral current decay b ! s has been detected inhadronic Z decays collected by ALEPH at LEP. The signal is isolated inlifetime-tagged b�b events by the presence of a hard photon associated with
a system of high momentum and high rapidity hadrons. The backgroundprocesses are normalised from the data themselves. The inclusive branchingratio is measured to be
(3:11� 0:80stat � 0:72syst)� 10�4;
consistent with the Standard Model expectation via penguin processes.
Submitted to Physics Letters B
1See following pages for the list of authors.

The ALEPH Collaboration
R. Barate, D. Buskulic, D. Decamp, P. Ghez, C. Goy, J.-P. Lees, A. Lucotte, E. Merle, M.-N. Minard, J.-Y. Nief,
B. Pietrzyk
Laboratoire de Physique des Particules (LAPP), IN2P3-CNRS, F-74019 Annecy-le-Vieux Cedex, France
R. Alemany, G. Boix, M.P. Casado, M. Chmeissani, J.M. Crespo, M. Del�no, E. Fernandez,
M. Fernandez-Bosman, Ll. Garrido,15 E. Graug�es, A. Juste, M. Martinez, G. Merino, R. Miquel, Ll.M. Mir,
I.C. Park, A. Pascual, J.A. Perlas, I. Riu, F. Sanchez
Institut de F�isica d'Altes Energies, Universitat Aut�onoma de Barcelona, E-08193 Bellaterra (Barcelona),
Spain7
A. Colaleo, D. Creanza, M. de Palma, G. Gelao, G. Iaselli, G. Maggi, M. Maggi, S. Nuzzo, A. Ranieri, G. Raso,
F. Ruggieri, G. Selvaggi, L. Silvestris, P. Tempesta, A. Tricomi,3 G. Zito
Dipartimento di Fisica, INFN Sezione di Bari, I-70126 Bari, Italy
X. Huang, J. Lin, Q. Ouyang, T. Wang, Y. Xie, R. Xu, S. Xue, J. Zhang, L. Zhang, W. Zhao
Institute of High-Energy Physics, Academia Sinica, Beijing, The People's Republic of China8
D. Abbaneo, U. Becker, P. Bright-Thomas, D. Casper, M. Cattaneo, V. Ciulli, G. Dissertori, H. Drevermann,
R.W. Forty, M. Frank, R. Hagelberg, J.B. Hansen, J. Harvey, P. Janot, B. Jost, I. Lehraus, P. Mato, A. Minten,
L. Moneta,21 A. Pacheco, J.-F. Pusztaszeri,23 F. Ranjard, L. Rolandi, D. Rousseau, D. Schlatter, M. Schmitt,20
O. Schneider, W. Tejessy, F. Teubert, I.R. Tomalin, H. Wachsmuth
European Laboratory for Particle Physics (CERN), CH-1211 Geneva 23, Switzerland
Z. Ajaltouni, F. Badaud, G. Chazelle, O. Deschamps, A. Falvard, C. Ferdi, P. Gay, C. Guicheney, P. Henrard,
J. Jousset, B. Michel, S. Monteil, J-C. Montret, D. Pallin, P. Perret, F. Podlyski, J. Proriol, P. Rosnet
Laboratoire de Physique Corpusculaire, Universit�e Blaise Pascal, IN2P3-CNRS, Clermont-Ferrand, F-63177
Aubi�ere, France
J.D. Hansen, J.R. Hansen, P.H. Hansen, B.S. Nilsson, B. Rensch, A. W�a�an�anen
Niels Bohr Institute, DK-2100 Copenhagen, Denmark9
G. Daskalakis, A. Kyriakis, C. Markou, E. Simopoulou, I. Siotis, A. Vayaki
Nuclear Research Center Demokritos (NRCD), GR-15310 Attiki, Greece
A. Blondel, G. Bonneaud, J.-C. Brient, P. Bourdon, A. Roug�e, M. Rumpf, A. Valassi,6 M. Verderi, H. Videau
Laboratoire de Physique Nucl�eaire et des Hautes Energies, Ecole Polytechnique, IN2P3-CNRS, F-91128
Palaiseau Cedex, France
E. Focardi, G. Parrini, K. Zachariadou
Dipartimento di Fisica, Universit�a di Firenze, INFN Sezione di Firenze, I-50125 Firenze, Italy
M. Corden, C. Georgiopoulos, D.E. Ja�e
Supercomputer Computations Research Institute, Florida State University, Tallahassee, FL 32306-4052, USA13;14
A. Antonelli, G. Bencivenni, G. Bologna,4 F. Bossi, P. Campana, G. Capon, F. Cerutti, V. Chiarella, G. Felici,
P. Laurelli, G. Mannocchi,5 F. Murtas, G.P. Murtas, L. Passalacqua, M. Pepe-Altarelli
Laboratori Nazionali dell'INFN (LNF-INFN), I-00044 Frascati, Italy
L. Curtis, A.W. Halley, J.G. Lynch, P. Negus, V. O'Shea, C. Raine, J.M. Scarr, K. Smith, P. Teixeira-Dias,
A.S. Thompson, E. Thomson
Department of Physics and Astronomy, University of Glasgow, Glasgow G12 8QQ,United Kingdom10
O. Buchm�uller, S. Dhamotharan, C. Geweniger, G. Graefe, P. Hanke, G. Hansper, V. Hepp, E.E. Kluge, A. Putzer,
J. Sommer, K. Tittel, S. Werner, M. Wunsch
Institut f�ur Hochenergiephysik, Universit�at Heidelberg, D-69120 Heidelberg, Germany16
R. Beuselinck, D.M. Binnie, W. Cameron, P.J. Dornan,2 M. Girone, S. Goodsir, E.B. Martin, N. Marinelli,
A. Moutoussi, J. Nash, J.K. Sedgbeer, P. Spagnolo, M.D. Williams
Department of Physics, Imperial College, London SW7 2BZ, United Kingdom10
V.M. Ghete, P. Girtler, E. Kneringer, D. Kuhn, G. Rudolph
Institut f�ur Experimentalphysik, Universit�at Innsbruck, A-6020 Innsbruck, Austria18
A.P. Betteridge, C.K. Bowdery, P.G. Buck, P. Colrain, G. Crawford, A.J. Finch, F. Foster, G. Hughes,
R.W.L. Jones, N.A. Robertson, T. Sloan, M.I. Williams
Department of Physics, University of Lancaster, Lancaster LA1 4YB, United Kingdom10
I. Giehl, A.M. Greene, C. Ho�mann, K. Jakobs, K. Kleinknecht, G. Quast, B. Renk, E. Rohne, H.-G. Sander,
P. van Gemmeren, C. Zeitnitz
Institut f�ur Physik, Universit�at Mainz, D-55099 Mainz, Germany16
J.J. Aubert, C. Benchouk, A. Bonissent, G. Bujosa, J. Carr,2 P. Coyle, F. Etienne, O. Leroy, F. Motsch, P. Payre,
M. Talby, A. Sadouki, M. Thulasidas, K. Trabelsi
Centre de Physique des Particules, Facult�e des Sciences de Luminy, IN2P3-CNRS, F-13288 Marseille, France
M. Aleppo, M. Antonelli, F. Ragusa
Dipartimento di Fisica, Universit�a di Milano e INFN Sezione di Milano, I-20133 Milano, Italy
R. Berlich, W. Blum, V. B�uscher, H. Dietl, G. Ganis, H. Kroha, G. L�utjens, C. Mannert, W. M�anner, H.-G. Moser,
S. Schael, R. Settles, H. Seywerd, H. Stenzel, W. Wiedenmann, G. Wolf
Max-Planck-Institut f�ur Physik, Werner-Heisenberg-Institut, D-80805 M�unchen, Germany16
J. Boucrot, O. Callot, S. Chen, A. Cordier, M. Davier, L. Du ot, J.-F. Grivaz, Ph. Heusse, A. H�ocker,
A. Jacholkowska, D.W. Kim,12 F. Le Diberder, J. Lefran�cois, A.-M. Lutz, M.-H. Schune, E. Tourne�er,
J.-J. Veillet, I. Videau, D. Zerwas
Laboratoire de l'Acc�el�erateur Lin�eaire, Universit�e de Paris-Sud, IN2P3-CNRS, F-91405 Orsay Cedex, France
P. Azzurri, G. Bagliesi,2 G. Batignani, S. Bettarini, T. Boccali, C. Bozzi, G. Calderini, M. Carpinelli, M.A. Ciocci,
R. Dell'Orso, R. Fantechi, I. Ferrante, L. Fo�a,1 F. Forti, A. Giassi, M.A. Giorgi, A. Gregorio, F. Ligabue,
A. Lusiani, P.S. Marrocchesi, A. Messineo, F. Palla, G. Rizzo, G. Sanguinetti, A. Sciab�a, G. Sguazzoni,
R. Tenchini, G. Tonelli,19 C. Vannini, A. Venturi, P.G. Verdini
Dipartimento di Fisica dell'Universit�a, INFN Sezione di Pisa, e Scuola Normale Superiore, I-56010 Pisa, Italy
G.A. Blair, L.M. Bryant, J.T. Chambers, M.G. Green, T. Medcalf, P. Perrodo, J.A. Strong,
J.H. von Wimmersperg-Toeller
Department of Physics, Royal Holloway & Bedford New College, University of London, Surrey TW20 OEX,
United Kingdom10
D.R. Botterill, R.W. Cli�t, T.R. Edgecock, S. Haywood, P.R. Norton, J.C. Thompson, A.E. Wright
Particle Physics Dept., Rutherford Appleton Laboratory, Chilton, Didcot, Oxon OX11 OQX, United
Kingdom10
B. Bloch-Devaux, P. Colas, S. Emery, W. Kozanecki, E. Lan�con,2 M.-C. Lemaire, E. Locci, P. Perez, J. Rander,
J.-F. Renardy, A. Roussarie, J.-P. Schuller, J. Schwindling, A. Trabelsi, B. Vallage
CEA, DAPNIA/Service de Physique des Particules, CE-Saclay, F-91191 Gif-sur-Yvette Cedex, France17
S.N. Black, J.H. Dann, R.P. Johnson, H.Y. Kim, N. Konstantinidis, A.M. Litke, M.A. McNeil, G. Taylor
Institute for Particle Physics, University of California at Santa Cruz, Santa Cruz, CA 95064, USA22
C.N. Booth, C.A.J. Brew, S. Cartwright, F. Combley, M.S. Kelly, M. Lehto, J. Reeve, L.F. Thompson
Department of Physics, University of She�eld, She�eld S3 7RH, United Kingdom10
K. A�holderbach, A. B�ohrer, S. Brandt, G. Cowan, C. Grupen, P. Saraiva, L. Smolik, F. Stephan
Fachbereich Physik, Universit�at Siegen, D-57068 Siegen, Germany16
G. Giannini, B. Gobbo, G. Musolino
Dipartimento di Fisica, Universit�a di Trieste e INFN Sezione di Trieste, I-34127 Trieste, Italy

J. Rothberg, S. Wasserbaech
Experimental Elementary Particle Physics, University of Washington, WA 98195 Seattle, U.S.A.
S.R. Armstrong, E. Charles, P. Elmer, D.P.S. Ferguson, Y. Gao, S. Gonz�alez, T.C. Greening, O.J. Hayes, H. Hu,
S. Jin, P.A. McNamara III, J.M. Nachtman,24 J. Nielsen, W. Orejudos, Y.B. Pan, Y. Saadi, I.J. Scott, J. Walsh,
Sau Lan Wu, X. Wu, G. Zobernig
Department of Physics, University of Wisconsin, Madison, WI 53706, USA11
1Now at CERN, 1211 Geneva 23, Switzerland.2Also at CERN, 1211 Geneva 23, Switzerland.3Also at Dipartimento di Fisica, INFN, Sezione di Catania, Catania, Italy.4Also Istituto di Fisica Generale, Universit�a di Torino, Torino, Italy.5Also Istituto di Cosmo-Geo�sica del C.N.R., Torino, Italy.6Supported by the Commission of the European Communities, contract ERBCHBICT941234.7Supported by CICYT, Spain.8Supported by the National Science Foundation of China.9Supported by the Danish Natural Science Research Council.
10Supported by the UK Particle Physics and Astronomy Research Council.11Supported by the US Department of Energy, grant DE-FG0295-ER40896.12Permanent address: Kangnung National University, Kangnung, Korea.13Supported by the US Department of Energy, contract DE-FG05-92ER40742.14Supported by the US Department of Energy, contract DE-FC05-85ER250000.15Permanent address: Universitat de Barcelona, 08208 Barcelona, Spain.16Supported by the Bundesministerium f�ur Bildung, Wissenschaft, Forschung und Technologie, Germany.17Supported by the Direction des Sciences de la Mati�ere, C.E.A.18Supported by Fonds zur F�orderung der wissenschaftlichen Forschung, Austria.19Also at Istituto di Matematica e Fisica, Universit�a di Sassari, Sassari, Italy.20Now at Harvard University, Cambridge, MA 02138, U.S.A.21Now at University of Geneva, 1211 Geneva 4, Switzerland.22Supported by the US Department of Energy, grant DE-FG03-92ER40689.23Now at School of Operations Research and Industrial Engineering, Cornell University, Ithaca, NY 14853-3801,
U.S.A.24Now at University of California at Los Angeles (UCLA), Los Angeles, CA 90024, U.S.A.
1 Introduction
The avour changing neutral current decay b! s may proceed via an electromagnetic penguin
diagram in which the photon is radiated from either the W or one of the quark lines. The next-
to-leading order calculations are now available for this transition [1] and the Standard Model
predicts the inclusive b! s branching ratio to be (3:51 � 0:32) � 10�4 for measurements at the
�(4S) resonance and (3:76 � 0:30) � 10�4 at the Z peak [2]. Virtual particles in the loop may
be replaced by non-Standard Model particles, such as charged Higgs bosons or supersymmetric
particles. These additional contributions could either enhance or suppress the decay rate [3, 4]
making it sensitive to physics beyond the Standard Model.
The b ! s process is expected to be dominated by two-body (resonant) decays such as
B ! K� , and �nal states with soft gluon emission (non-resonant) which kinematically resemble
two-body decays [5, 6]. In this case, the photon energy in the b-hadron rest frame, denoted E? ,
has a spectrum which is peaked at approximately half the b-hadron mass. In contrast, charged
current radiative b decays such as b ! cW � and b ! uW � (where W � represents a virtual
W boson) produce photons with a spectrum resembling that from bremsstrahlung and hence
of much lower energy [7]. The decay b ! d can also be mediated by penguin diagrams but is
Cabibbo suppressed, with a predicted branching ratio � 2.8 � 10�5 [8]. In the ALEPH data
sample of 4.1 million hadronic Z decays, collected between 1991 and 1995, the Standard Model
predicts the production of � 660 b ! s decays. It is thus important, if a b ! s signal is
to be observed, that both the signal acceptance and background rejection be high and that E?
be accurately reconstructed. The latter requires precise determination of the parent b-hadron's
momentum and direction.
In the analyis described in this paper, b�b events are tagged by lifetime in one hemisphere.
The signal for the b ! s decay in the other hemisphere is characterised by the presence of a
hard photon associated with a system of high momentum and high rapidity hadrons, originating
from a displaced secondary vertex. The extraction of the signal is based on a Monte Carlo
simulation constructed using Heavy Quark E�ective Theory [5], and from measurements and
assumptions about exclusive decay rates.
2 The ALEPH detector
A detailed description of the ALEPH detector and its performance is given in [9, 10]. What
follows is a brief description of those parts of the detector relevant to this analysis. Charged
particles are detected in the central part of the detector, consisting of a high precision vertex
detector (VDET), a cylindrical multi-wire drift chamber (ITC) and a large time projection
chamber (TPC). The VDET consists of two concentric layers of double sided silicon detectors
surrounding the beam pipe, positioned at average radii of 6.5 and 10.8 cm covering 85% and 69%
of the solid angle, respectively. The intrinsic spatial resolution of the VDET is 12 �m for the
r� � coordinate and between 11 and 22 �m for the z coordinate, depending on the polar angle
of the charged particle. The ITC, at radii from 16 to 26 cm, provides up to eight coordinates
per track in the r � � view while the TPC measures up to 21 three-dimensional points per
track at radii between 40 and 171 cm. The TPC also serves to separate charged particle species
with up to 338 measurements of their speci�c ionization. The three detectors are immersed
in an axial magnetic �eld of 1.5 T and together provide a transverse momentum resolution of
�(1=pT ) = 0:6� 10�3 (GeV/c)�1 for high momentum tracks.
Electrons and photons are identi�ed and measured in the electromagnetic calorimeter
(ECAL) which is formed by a barrel surrounding the TPC, closed at each end by end-
cap modules. It consists of 45 layers of lead interleaved with proportional wire chambers.
The position and energies of electromagnetic showers are measured using cathode pads each
subtending a solid angle of 0.9� by 0.9� in � and � and connected internally to form projective
1
towers. Each tower is read out in three segments, known as storeys, with depths of 4, 9 and
9 radiation lengths. The inactive zones of this detector represent 2% of the solid angle in the
barrel and 6% in the end-caps. The iron return yoke of the magnet is instrumented with streamer
tubes to form a hadron calorimeter (HCAL), with a thickness of over 7 interaction lengths. It
is surrounded by two additional double layers of streamer tubes used for muon identi�cation.
An energy ow algorithm, which is described in [10], is used to improve the energy resolution
of events. The algorithm links charged tracks to calorimeter clusters and uses the resultant
redundancy in energy measurements to assign neutral particle energy. Particle identi�cation
methods are used in this algorithm to distinguish between particle species and the resulting
objects are labelled energy ow objects. The algorithm to identify photons in ECAL is also
described in detail in [10]. The clusters found by the algorithm are retained as candidate photons
if their energy is greater than 0.25 GeV and there is no charged track impact at a distance of
less than 2 cm from the cluster barycentre. The photons are detected with angular resolution of
��;� = (2:5=pE(GeV)+0:25) mrad and energy resolution of �E=E = (0:25=
pE(GeV)+0:009).
The detector's ability to resolve a �0 into two clusters decreases for energies greater than 10
GeV above which the two clusters overlap to form one larger cluster which tends to be more
elliptical than single clusters. A moments analysis of the energy sharing between neighbouring
detector elements within the cluster enables the length of the major axis of the shower ellipse,
�l, to be measured. This quantity is used in the analysis which follows to separate high energy
�0 mesons (�l > 2.3 cm) from single photons (�l < 2.3 cm).
3 Monte Carlo simulation
Monte Carlo events were generated using JETSET [11] with the ALEPH standard parameter
set. These events were processed through a detailed simulation of the ALEPH detector and the
ALEPH reconstruction program. A sample of 9.9 million hadronic Z decays | simulated without
the b! s decay and henceforth called the standardMonte Carlo | is used to model background
processes in this analysis. The rate of production of photons from �nal state radiation (FSR)
in the standard MC is reweighted by a factor 1.21 as required by the ALEPH measurements of
this process over the full kinematic range [12].
The composition of the signal (b ! s ) Monte Carlo event sample is based primarily
on predictions from Heavy Quark E�ective Theory for the exclusive ratios RK�� = �(B !
K�� )=�(B ! Xs ), where K�� is any particular K-resonance and the B meson is either
a Bu or Bd [5]. RK�(892) is taken as the ratio of the CLEO measurements of the exclusive
B ! K�(892) branching ratio [13] and the inclusive b ! s branching ratio [14], giving
RK�(892) = 18:1 � 6:8%. The �-resonances, produced in Bs penguin decays, are assumed to
be in the same relative proportions as the K-resonances. The exclusive ratios for resonant
decays are summed and the remaining inclusive branching ratio is completed with non-resonant
penguin decays, where Xs is a multi-body state involving a kaon and n pions, hadronised using
JETSET. The photon energy spectrum in the non-resonant decays is obtained from a fully
inclusive spectator model including gluon bremsstrahlung and higher order radiative e�ects [6].
The model parameters used were mq = 150 MeV/c2, where mq is the spectator quark mass,
and pF = 265 MeV/c, where pF is the Fermi momentum of the b quark in the hadron, taken
from CLEO �ts to the inclusive lepton spectrum in B ! Xl� decays [15]. Baryonic penguins
are modelled by one channel, �b ! � , where the �b is produced directly from hadronisation
or from the decay of a heavier b baryon. The resulting signal Monte Carlo composition is shown
in Table 1, where the b-hadron production fractions are taken to be : Bu(d) 75.6% ; Bs 11.2% ;
and �b 13.2% [16].
2

Exclusive decay channel Exclusive decay fraction, R(%)
Bu(d) ! K�(892) 13.6 � 5.1
Bu(d) ! K1(1270) 5.5 � 2.1
Bu(d) ! K1(1400) 7.2 � 2.6
Bu(d) ! K�(1410) 6.7 � 2.6
Bu(d) ! K�
2 (1430) 20.6 � 7.5
Bu(d) ! K(n�) 22.0 � 19.9
) 75.6
Bs ! �(1020) 2.0 � 0.8
Bs ! h1(1380) 0.8 � 0.3
Bs ! f1(1420) 1.1 � 0.4
Bs ! �(1680) 1.0 � 0.4
Bs ! f 02(1525) 3.0 � 1.1
Bs ! KK(n�) 3.3 � 3.0
) 11.2
�b ! �(1116) 13.2 � 4.1
Table 1: The composition of the inclusive b! s Monte Carlo sample.
4 Inclusive reconstruction of b! s decays
The event hemisphere opposite to a b ! s decay contains a typical b-hadron decay and is
used to `b-tag' events in a largely unbiased way. The b ! s hemisphere, in contrast, has low
multiplicity, a single displaced decay vertex, and contains a high energy photon. A dedicated
inclusive b! s reconstruction algorithm is used to assemble the hadronic system accompanying
the photon by distinguishing between objects from the b-hadron decay from those produced by
hadronisation at the primary vertex.
In each hemisphere containing a candidate photon, �0 and K0S mesons are searched for.
The �0 mesons are reconstructed from two candidate photons when the invariant mass is
compatible with the �0 mass. K0S mesons are reconstructed similarly from any two oppositely
signed charged tracks which form a vertex and have an invariant mass (assuming both charged
tracks are pions) consistent with the K0S mass. Each hemisphere then consists of reconstructed
�0 and K0S mesons and the remaining charged tracks and neutral electromagnetic and hadronic
clusters. Any neutral hadronic cluster is assumed to be a K0L and given the kaon mass. All
charged tracks are given the pion mass and, depending on the length of the major axis of its
shower ellipse, �l, a neutral electromagnetic cluster is given either zero mass (photon) or the
pion mass (unresolved �0).
The b ! s probability for each object is calculated as a function of its momentum, its
rapidity with respect to the b-hadron direction, and, if the object is a charged track with
VDET hits, its three-dimensional impact parameter signi�cance. The probability functions
were produced using signal Monte Carlo events. Plots (a) and (b) of Figure 1 show the
momentum-rapidity and impact parameter signi�cance distributions for charged tracks from
the b! s decay. Plots (c) and (d) of Figure 1 show the corresponding hadronisation charged
track distributions. The b ! s decay objects have a much harder momentum spectrum than
the hadronisation objects and possess larger rapidities. Similarly, due to the long lifetime of the
b-hadron, the signal objects have more signi�cant impact parameters than the hadronisation
objects, where the spectrum is dominated by the impact parameter resolution. In a given
3
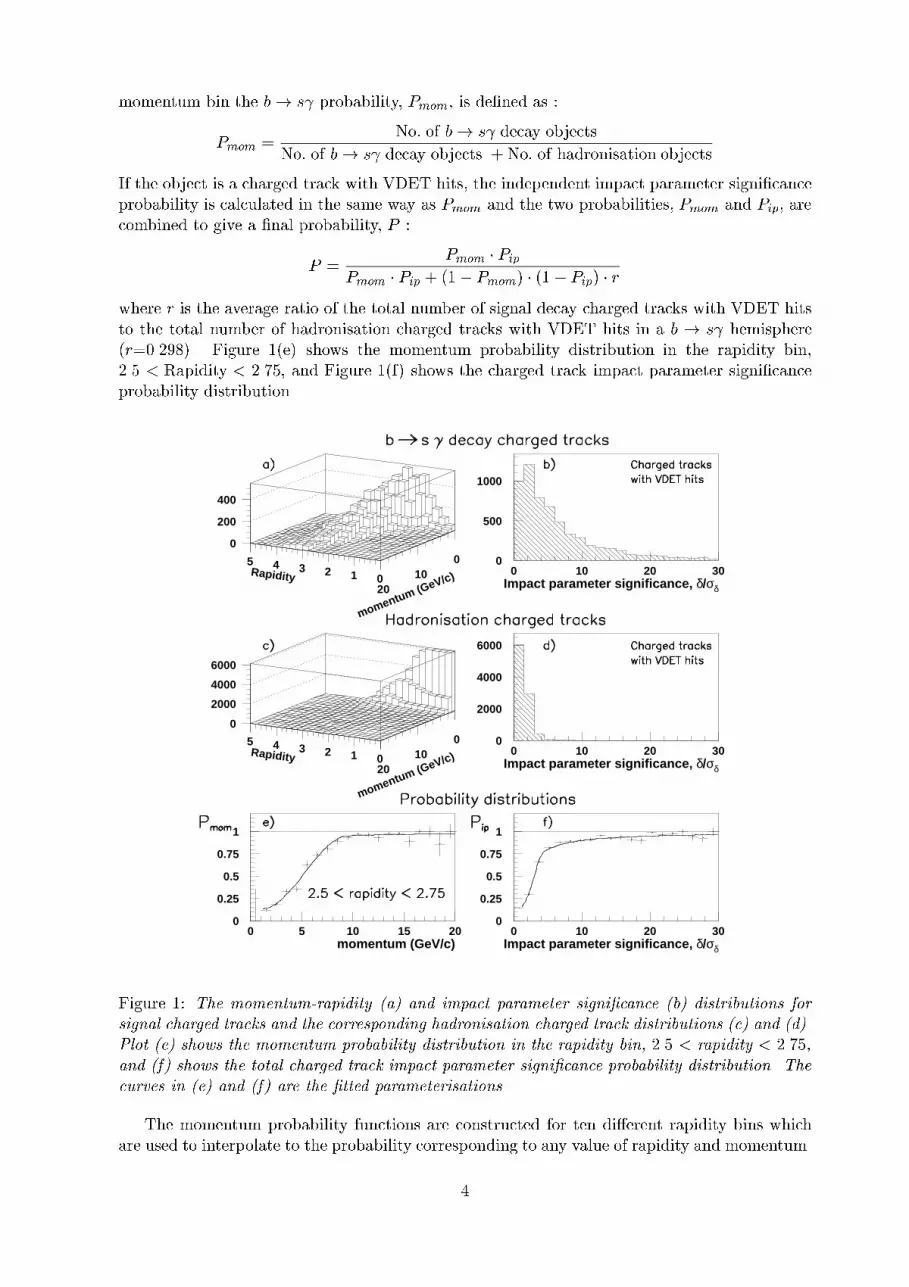
momentum bin the b! s probability, Pmom, is de�ned as :
Pmom =No: of b! s decay objects
No: of b! s decay objects + No: of hadronisation objects
If the object is a charged track with VDET hits, the independent impact parameter signi�cance
probability is calculated in the same way as Pmom and the two probabilities, Pmom and Pip, are
combined to give a �nal probability, P :
P =Pmom � Pip
Pmom � Pip + (1� Pmom) � (1� Pip) � r
where r is the average ratio of the total number of signal decay charged tracks with VDET hits
to the total number of hadronisation charged tracks with VDET hits in a b ! s hemisphere
(r=0.298). Figure 1(e) shows the momentum probability distribution in the rapidity bin,
2.5 < Rapidity < 2.75, and Figure 1(f) shows the charged track impact parameter signi�cance
probability distribution.
012345 010
20
0
200
400
0
500
1000
0 10 20 30
012345 010
20
0
2000
4000
6000
0
2000
4000
6000
0 10 20 30
0
0.25
0.5
0.75
1
0 5 10 15 200
0.25
0.5
0.75
1
0 10 20 30
Rapidity
momentum (GeV/c) Impact parameter significance, δ/σδ
Rapidity
momentum (GeV/c) Impact parameter significance, δ/σδ
momentum (GeV/c) Impact parameter significance, δ/σδ
Figure 1: The momentum-rapidity (a) and impact parameter signi�cance (b) distributions for
signal charged tracks and the corresponding hadronisation charged track distributions (c) and (d).
Plot (e) shows the momentum probability distribution in the rapidity bin, 2.5 < rapidity < 2.75,
and (f) shows the total charged track impact parameter signi�cance probability distribution. The
curves in (e) and (f) are the �tted parameterisations.
The momentum probability functions are constructed for ten di�erent rapidity bins which
are used to interpolate to the probability corresponding to any value of rapidity and momentum.
4

The probabilities are calculated separately for identi�edK0L andK
0S mesons and all other objects,
since kaons from the b ! s decay have a harder momentum spectrum than other Xs decay
products and can therefore be separated from hadronisation kaons more easily.
These probability functions are used in the jet reconstruction algorithm now described.
The reconstruction of an assumed b ! s decay begins with the candidate signal photon onto
which objects (K0S and �0 mesons, charged tracks and neutral calorimeter objects) in the same
hemisphere as the photon are added in order of decreasing b! s probability. The addition of
objects stops if, by adding the next highest probability object, the mass of the reconstructed jet
is further from the mean B meson mass of 5.28 GeV/c2 than it would be if the object had not
been added. This reconstruction is performed in two stages, as follows :
1. An initial estimate of the b-hadron ight direction is obtained by using only those objects
with rapidity with respect to the thrust axis greater than 1.0 and then calculating the
probabilities as a function of momentum and impact parameter signi�cance only.
2. The 4-momenta of the candidate photon and its accompanying high rapidity objects are
then summed and used as a new estimate of the b-hadron ight direction with which a
better estimate of the object rapidities can be made. The above process is then repeated
but with the rapidity cut removed and the momentum probability function replaced by a
2-dimensional momentum-rapidity probability function.
The resulting jets are accepted as possible b! s decays if the jet mass is within 0.7 GeV/c2
of the mean B meson mass of 5.28 GeV/c2; the mass of the hadronic system, Xs, is less than
4.0 GeV/c2; and the Xs object multiplicity (K0S and �0 mesons, charged tracks and neutral
calorimeter objects) is greater than one and less than eight. After this procedure, studies of
the signal Monte Carlo show that b ! s decays are well reconstructed with a resolution in
momentum of 1.5 GeV/c and angle of 0.3� [17].
5 Event selection and data analysis
A sample of 4.06 million hadronic Z decays is preselected according to the standard ALEPH
hadronic event selection [10]. To ensure the event is well contained within the detector volume,
the cosine of the polar angle of the thrust axis is required to be less than 0.9, where the thrust
axis is determined using all energy ow objects. To allow the calculation of variables used to tag
b events, jets are reconstructed using the JADE algorithm [18] with a ycut of 0.02, where each
event must have at least one track with VDET hits and a minimum of two jets with momentum
greater than 10 GeV/c and polar angle greater than 5.7� [19].
A set of cuts is used to produce a data sample enriched in b ! s events. To reduce
the background from �0 decays, events are selected with at least one electromagnetic cluster
containing a single candidate photon of energy more than 10 GeV that cannot be combined with
another candidate photon to make an invariant mass of less than 0.2 GeV/c2. The hemisphere
opposite to the candidate photon is required to be b-like with Popphem less than 0.1, where P
opphem is
the probability that all charged tracks in the hemisphere are consistent with having originated
from the reconstructed primary vertex [19]. In the Monte Carlo the hemisphere probabilities
are corrected using the impact parameter smearing algorithm described in [20] which improves
the agreement between data and Monte Carlo. In the remaining events, jets are reconstructed
and selected as described in section 4, and the decay objects | including the photon | are
transformed into the rest frame of their parent jet. The angle of the photon, �? , in this frame
relative to the jet direction, is required to have cos �? less than 0.55 since cos �? peaks at unity for
background processes whereas photons are emitted isotropically in b! s decays. Furthermore,
the boosted sphericity, Sb, in the jet's rest frame [21] is required to be less than 0.16, because
5
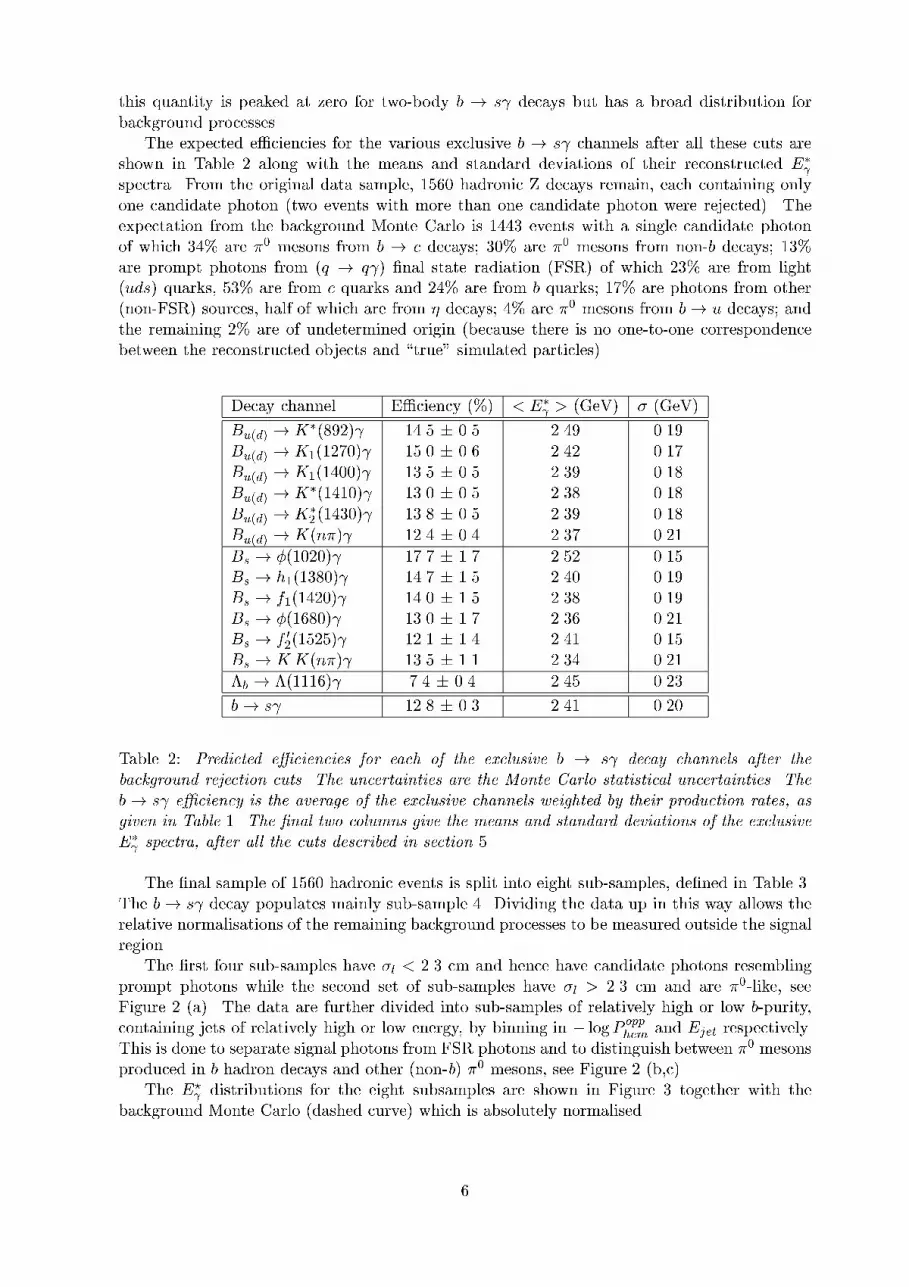
this quantity is peaked at zero for two-body b ! s decays but has a broad distribution for
background processes.
The expected e�ciencies for the various exclusive b ! s channels after all these cuts are
shown in Table 2 along with the means and standard deviations of their reconstructed E�
spectra. From the original data sample, 1560 hadronic Z decays remain, each containing only
one candidate photon (two events with more than one candidate photon were rejected). The
expectation from the background Monte Carlo is 1443 events with a single candidate photon
of which 34% are �0 mesons from b ! c decays; 30% are �0 mesons from non-b decays; 13%
are prompt photons from (q ! q ) �nal state radiation (FSR) of which 23% are from light
(uds) quarks, 53% are from c quarks and 24% are from b quarks; 17% are photons from other
(non-FSR) sources, half of which are from � decays; 4% are �0 mesons from b! u decays; and
the remaining 2% are of undetermined origin (because there is no one-to-one correspondence
between the reconstructed objects and \true" simulated particles).
Decay channel E�ciency (%) < E�
> (GeV) � (GeV)
Bu(d) ! K�(892) 14.5 � 0.5 2.49 0.19
Bu(d) ! K1(1270) 15.0 � 0.6 2.42 0.17
Bu(d) ! K1(1400) 13.5 � 0.5 2.39 0.18
Bu(d) ! K�(1410) 13.0 � 0.5 2.38 0.18
Bu(d) ! K�
2 (1430) 13.8 � 0.5 2.39 0.18
Bu(d) ! K(n�) 12.4 � 0.4 2.37 0.21
Bs ! �(1020) 17.7 � 1.7 2.52 0.15
Bs ! h1(1380) 14.7 � 1.5 2.40 0.19
Bs ! f1(1420) 14.0 � 1.5 2.38 0.19
Bs ! �(1680) 13.0 � 1.7 2.36 0.21
Bs ! f 02(1525) 12.1 � 1.4 2.41 0.15
Bs ! KK(n�) 13.5 � 1.1 2.34 0.21
�b ! �(1116) 7.4 � 0.4 2.45 0.23
b! s 12.8 � 0.3 2.41 0.20
Table 2: Predicted e�ciencies for each of the exclusive b ! s decay channels after the
background rejection cuts. The uncertainties are the Monte Carlo statistical uncertainties. The
b! s e�ciency is the average of the exclusive channels weighted by their production rates, as
given in Table 1. The �nal two columns give the means and standard deviations of the exclusive
E�
spectra, after all the cuts described in section 5.
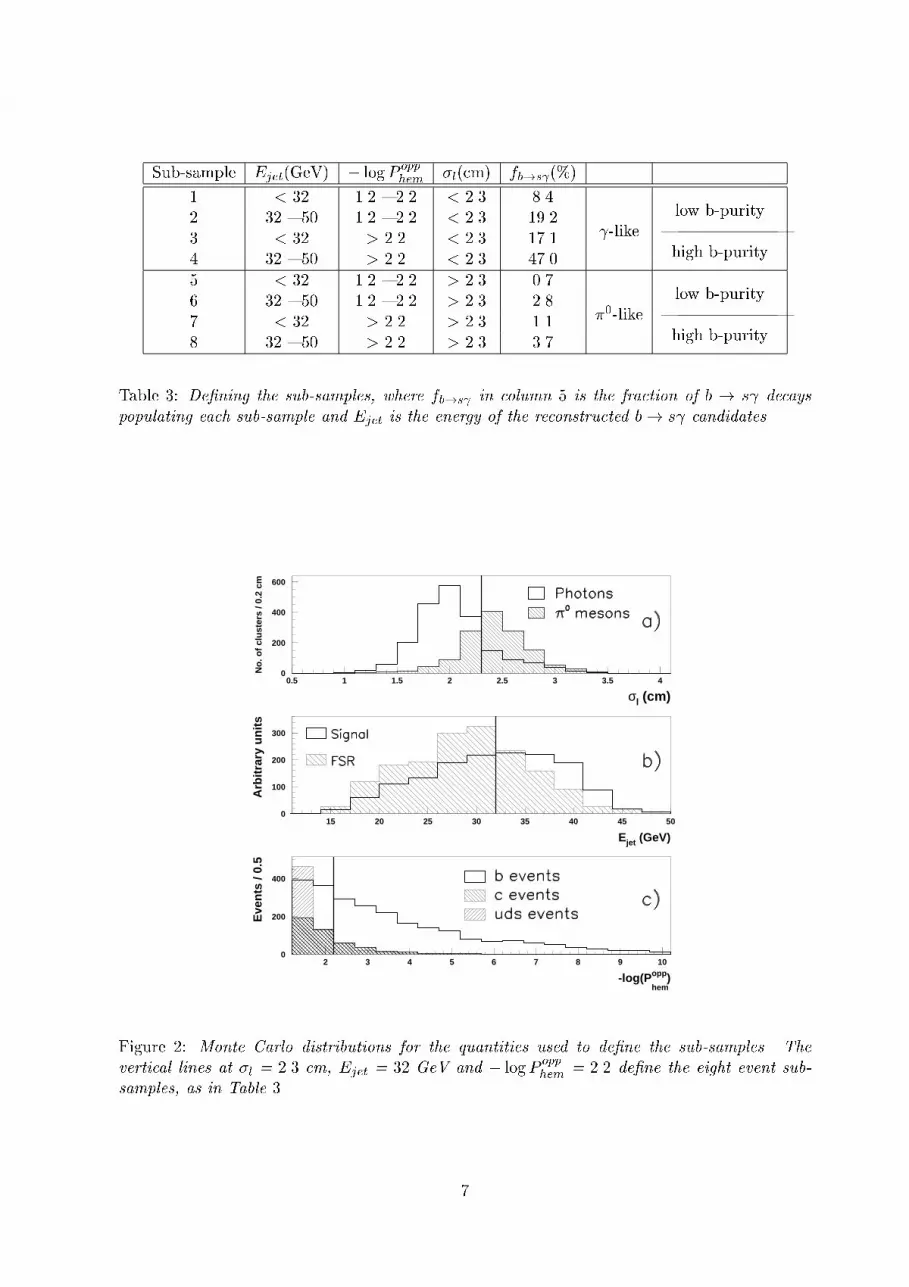
The �nal sample of 1560 hadronic events is split into eight sub-samples, de�ned in Table 3.
The b! s decay populates mainly sub-sample 4. Dividing the data up in this way allows the
relative normalisations of the remaining background processes to be measured outside the signal
region.
The �rst four sub-samples have �l < 2.3 cm and hence have candidate photons resembling
prompt photons while the second set of sub-samples have �l > 2.3 cm and are �0-like, see
Figure 2 (a). The data are further divided into sub-samples of relatively high or low b-purity,
containing jets of relatively high or low energy, by binning in � logPopphem and Ejet respectively.
This is done to separate signal photons from FSR photons and to distinguish between �0 mesons
produced in b hadron decays and other (non-b) �0 mesons, see Figure 2 (b,c).
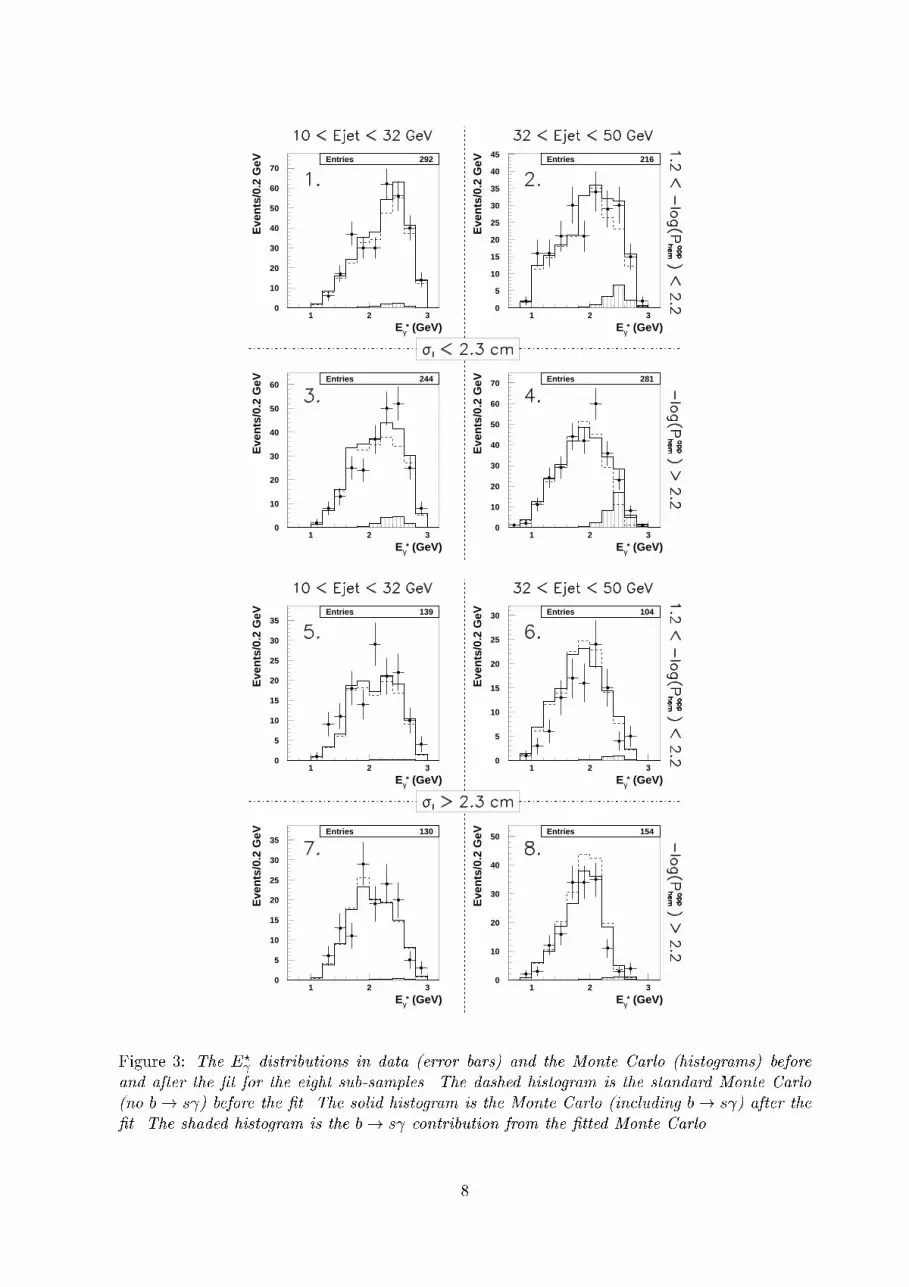
The E? distributions for the eight subsamples are shown in Figure 3 together with the
background Monte Carlo (dashed curve) which is absolutely normalised.
6
Sub-sample Ejet(GeV) � logPopphem �l(cm) fb!s (%)
1 < 32 1.2 { 2.2 < 2.3 8.4
2 32 { 50 1.2 { 2.2 < 2.3 19.2 low b-purity
3 < 32 > 2.2 < 2.3 17.1 -like |||||||
4 32 { 50 > 2.2 < 2.3 47.0 high b-purity
5 < 32 1.2 { 2.2 > 2.3 0.7
6 32 { 50 1.2 { 2.2 > 2.3 2.8 low b-purity
7 < 32 > 2.2 > 2.3 1.1 �0-like |||||||
8 32 { 50 > 2.2 > 2.3 3.7 high b-purity
Table 3: De�ning the sub-samples, where fb!s in column 5 is the fraction of b ! s decays
populating each sub-sample and Ejet is the energy of the reconstructed b! s candidates.
0
200
400
600
0.5 1 1.5 2 2.5 3 3.5 4
0
100
200
300
15 20 25 30 35 40 45 50
σl (cm)
No.
of c
lust
ers
/ 0.2
cm
Ejet (GeV)
Arb
itrar
y un
its
-log(Phem
opp )
Eve
nts
/ 0.5
0
200
400
2 3 4 5 6 7 8 9 10
Figure 2: Monte Carlo distributions for the quantities used to de�ne the sub-samples. The
vertical lines at �l = 2.3 cm, Ejet = 32 GeV and � logPopphem = 2.2 de�ne the eight event sub-
samples, as in Table 3.
7
0
10
20
30
40
50
60
70
1 2 30
5
10
15
20
25
30
35
40
45
1 2 3
0
10
20
30
40
50
60
1 2 30
10
20
30
40
50
60
70
1 2 3
Entries 292
Eγ* (GeV)
Eve
nts/
0.2
GeV
Entries 216
Eγ* (GeV)
Eve
nts/
0.2
GeV
Entries 244
Eγ* (GeV)
Eve
nts/
0.2
GeV
Entries 281
Eγ* (GeV)
Eve
nts/
0.2
GeV
0
5
10
15
20
25
30
35
1 2 30
5
10
15
20
25
30
1 2 3
0
5
10
15
20
25
30
35
1 2 30
10
20
30
40
50
1 2 3
Entries 139
Eγ* (GeV)
Eve
nts/
0.2
GeV
Entries 104
Eγ* (GeV)
Eve
nts/
0.2
GeV
Entries 130
Eγ* (GeV)
Eve
nts/
0.2
GeV
Entries 154
Eγ* (GeV)
Eve
nts/
0.2
GeV
Figure 3: The E? distributions in data (error bars) and the Monte Carlo (histograms) before
and after the �t for the eight sub-samples. The dashed histogram is the standard Monte Carlo
(no b! s ) before the �t. The solid histogram is the Monte Carlo (including b! s ) after the
�t. The shaded histogram is the b! s contribution from the �tted Monte Carlo.
8
The background Monte Carlo gives a reasonable representation of the data, but there is an
excess where the b! s signal is expected (sub-sample 4 in the range 2.2 GeV < E�
< 2.8 GeV).
Due to the b! s reconstruction algorithm, background events in which the jet contains a FSR
photon tend to produce peaks in the E? spectrum in the vicinity of the b ! s signal region.
From Monte Carlo studies it is found that the residual FSR E? peaks are most prominent in sub-
samples 1 and 3, and are almost absent in sub-samples 2 and 4 where the signal is greatest. Thus,
uncertainty in the FSR rate does not cause signi�cant uncertainty in the number of background
events in the b! s signal region. To measure the uncertainties in the background levels, and
improve the agreement of the Monte Carlo and the data, a multivariate �t is performed where
the normalisation of the four major backgrounds and the b ! s signal rate are allowed to be
free parameters.
A binned log-likelihood �t of the E? data distributions is performed for the eight sub-samples
using the corresponding distributions for the signal and background simulations, and the HMCMML
�tting package [22] which correctly incorporates uncertainties due to the �nite Monte Carlo
statistics in each bin. The �ve parameters in the �t are Nb!s , NFSR, N(b!c)�0 , N(non�b)�0
and Nother, which are, respectively, the total number of signal, FSR, (b! c)�0, (non�b)�0, and
`other' background events which make up the remaining data. The shapes of the E? distributions
are taken from the standard Monte Carlo. The sensitivity of the �t to b ! s enters mainly
through sub-sample 4 where there is little FSR expected and, according to Monte Carlo the b
purity is 96.6%.
6 Results
6.1 Extraction of the b! s signal
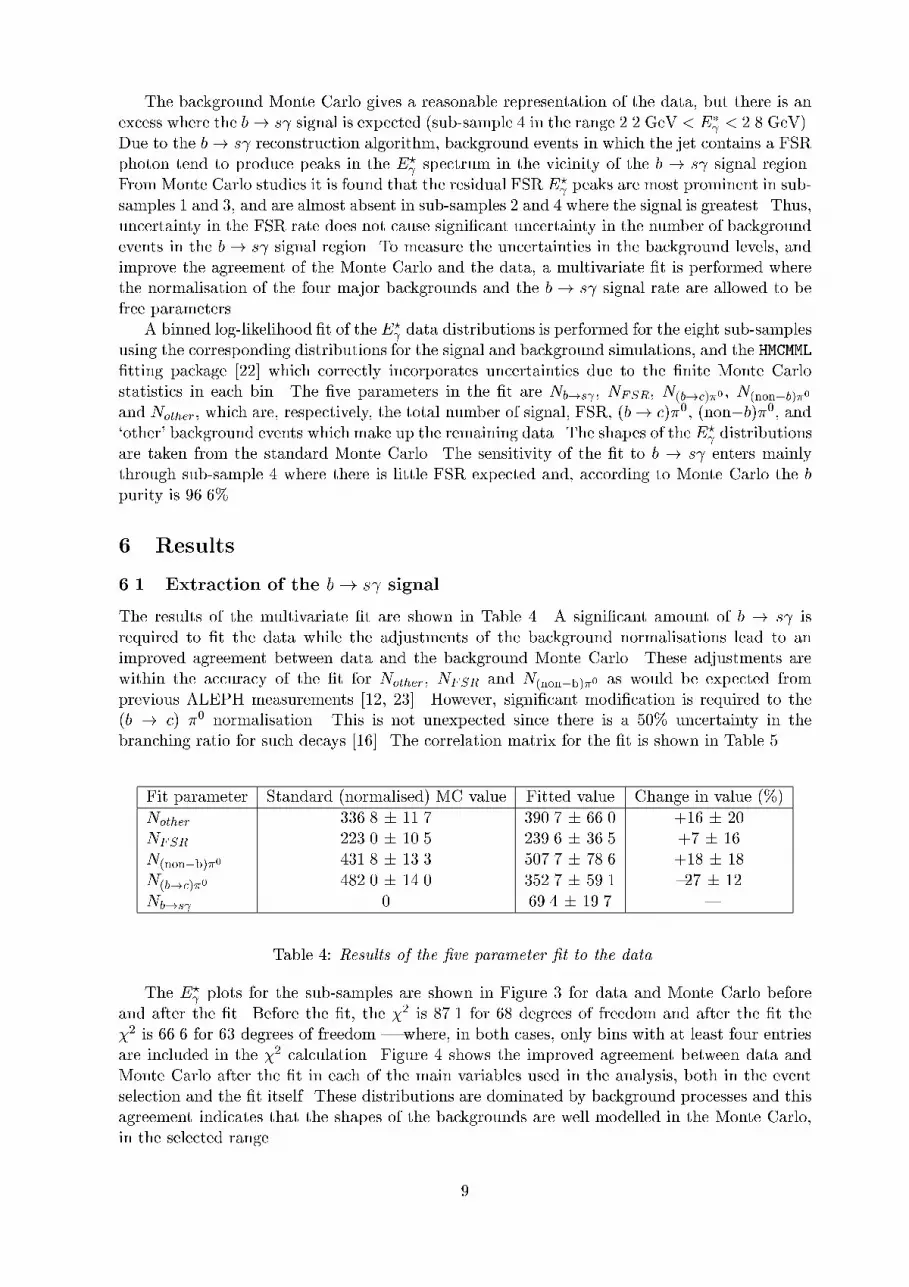
The results of the multivariate �t are shown in Table 4. A signi�cant amount of b ! s is
required to �t the data while the adjustments of the background normalisations lead to an
improved agreement between data and the background Monte Carlo. These adjustments are
within the accuracy of the �t for Nother, NFSR and N(non�b)�0 as would be expected from
previous ALEPH measurements [12, 23]. However, signi�cant modi�cation is required to the
(b ! c) �0 normalisation. This is not unexpected since there is a 50% uncertainty in the
branching ratio for such decays [16]. The correlation matrix for the �t is shown in Table 5.
Fit parameter Standard (normalised) MC value Fitted value Change in value (%)
Nother 336.8 � 11.7 390.7 � 66.0 +16 � 20
NFSR 223.0 � 10.5 239.6 � 36.5 +7 � 16
N(non�b)�0 431.8 � 13.3 507.7 � 78.6 +18 � 18
N(b!c)�0 482.0 � 14.0 352.7 � 59.1 {27 � 12
Nb!s 0 69.4 � 19.7 {
Table 4: Results of the �ve parameter �t to the data.
The E? plots for the sub-samples are shown in Figure 3 for data and Monte Carlo before
and after the �t. Before the �t, the �2 is 87.1 for 68 degrees of freedom and after the �t the
�2 is 66.6 for 63 degrees of freedom | where, in both cases, only bins with at least four entries
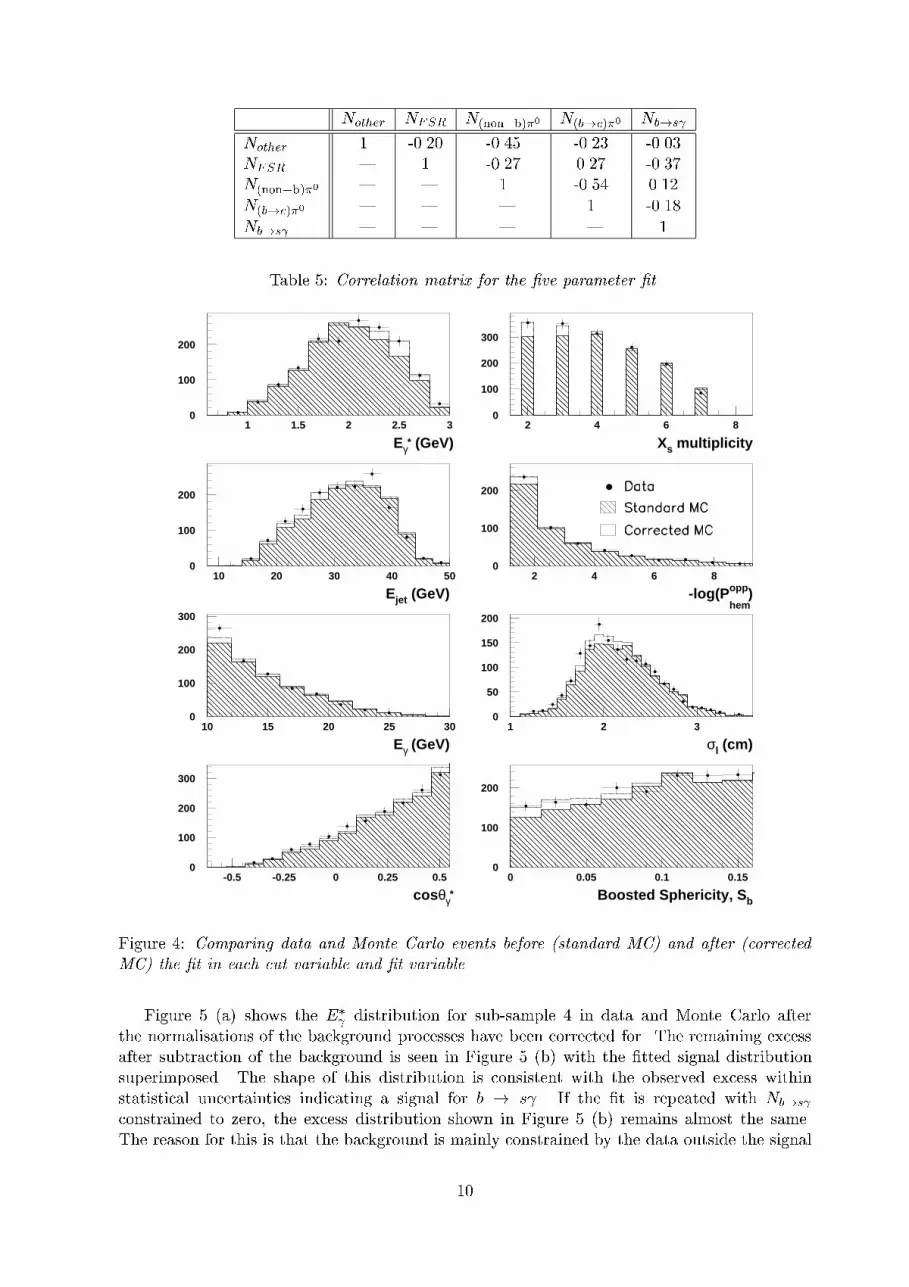
are included in the �2 calculation. Figure 4 shows the improved agreement between data and
Monte Carlo after the �t in each of the main variables used in the analysis, both in the event
selection and the �t itself. These distributions are dominated by background processes and this
agreement indicates that the shapes of the backgrounds are well modelled in the Monte Carlo,
in the selected range.
9
Nother NFSR N(non�b)�0 N(b!c)�0 Nb!s
Nother 1 -0.20 -0.45 -0.23 -0.03
NFSR { 1 -0.27 0.27 -0.37
N(non�b)�0 { { 1 -0.54 0.12
N(b!c)�0 { { { 1 -0.18
Nb!s { { { { 1
Table 5: Correlation matrix for the �ve parameter �t.
0
100
200
1 1.5 2 2.5 30
100
200
300
2 4 6 8
0
100
200
10 20 30 40 500
100
200
2 4 6 8
0
100
200
300
10 15 20 25 300
50
100
150
200
1 2 3
0
100
200
300
-0.5 -0.25 0 0.25 0.5
Eγ* (GeV) Xs multiplicity
Ejet (GeV) -log(Phem
opp )
Eγ (GeV) σl (cm)
cos θγ* Boosted Sphericity, S b
0
100
200
0 0.05 0.1 0.15
Figure 4: Comparing data and Monte Carlo events before (standard MC) and after (corrected
MC) the �t in each cut variable and �t variable.
Figure 5 (a) shows the E�
distribution for sub-sample 4 in data and Monte Carlo after
the normalisations of the background processes have been corrected for. The remaining excess
after subtraction of the background is seen in Figure 5 (b) with the �tted signal distribution
superimposed. The shape of this distribution is consistent with the observed excess within
statistical uncertainties indicating a signal for b ! s . If the �t is repeated with Nb!s
constrained to zero, the excess distribution shown in Figure 5 (b) remains almost the same.
The reason for this is that the background is mainly constrained by the data outside the signal
10

region (2.2 GeV < E�
< 2.8 GeV in sub-sample 4) and is hardly in uenced by the data in the
signal region. The excess in Figure 5 (b) is thus demonstrated to be insensitive to the details of
the �t.
0
10
20
30
40
50
60
0.75 1 1.25 1.5 1.75 2 2.25 2.5 2.75 3
Eγ*(GeV)
Eγ*(GeV)
-10
-5
0
5
10
15
20
25
0.75 1 1.25 1.5 1.75 2 2.25 2.5 2.75 3
Figure 5: The energy of the photon in the rest frame of the reconstructed jet. The top �gure shows
the data and Monte Carlo background events in sub-sample 4 (see section 5), after the correction
of the background processes' relative normalisations. The bottom �gure shows the excess in data
after subtraction of the corrected Monte Carlo background and the signal distribution resulting
from the multivariate �t. Also shown is the excess remaining in the data when a �t is performed
without b! s .
6.2 Consistency checks of the b! s hypothesis
For the purest sample of b ! s events (sub-sample 4) and in the signal region (2.2 GeV
< E? < 2.8 GeV) there is evidence in the remaining data events, after subtraction of the
corrected background, of lifetime in the same hemisphere as the photon. This is consistent with
that expected from b! s , see Figure 6(a,b).
In the signal region of sub-sample 4 there is seen to be an excess of high momentum kaons,
that is strangeness, in the data which is again consistent with b ! s , see Figure 6(c,d).
Charged kaons are required to have ionisation in the TPC within one standard deviation of the
kaon hypothesis and greater than two standard deviations away from either the electron or pion
hypothesis while the identi�cation of K0L and K0
S mesons was described in section 4. The data
distribution contains 38 kaon candidates (20 K0L mesons, 11 K0
S mesons and 7 charged kaons).
After the �t the Monte Carlo predicts a background of 20 kaons (9.9 K0L mesons, 3.4 K0
S mesons
and 6.8 charged kaons) and a signal of 16.2 kaons (5.4 K0L mesons, 5.0 K0
S mesons, and 5.8
charged kaons).
Finally, on combining sub-samples 4 and 8 for the E? signal region, the excess �l distribution
(Figure 6(e)) peaks at about 2 cm which is characteristic of single photons (which have
< �l > = 1.991 � 0.007 cm) rather than �0 mesons (which have < �l > = 2.251 � 0.034 cm).
11

This is well modelled by the �tted signal Monte Carlo, as shown in Figure 6(f). The mean �lfor data (2.062 � 0.033 cm) tends to be photon-like, and is 3.0 standard deviations less than
the mean �l for the background Monte Carlo (2.187 � 0.026 cm) which consists mainly of �0
decays. Hence the excess is not consistent with a uctuation of the �0 background.
0
10
20
30
40
0 2.5 5 7.5 10
0
10
20
0 2.5 5 7.5 10
0
5
10
15
0 10 20 30
0
5
10
0 10 20 30
0
10
20
30
40
1.5 2 2.5 3 3.5
0
10
20
1.5 2 2.5 3 3.5
-log(Phem
same ) -log(Phem
same )
Momentum of leading kaon in jet Momentum of leading kaon in jet
σl (cm) σl (cm)
Figure 6: Supporting evidence for the b ! s signal: (a) displays the impact parameter
hemisphere probability in the same hemisphere as the candidate photon for data and the corrected
background Monte Carlo, while the excess of data above the background, along with the �tted
signal distribution, are shown in (b); (c) and (d) show the leading kaon momentum distributions
for data, background Monte Carlo and signal Monte Carlo; (e) and (f) show the shower major
axis length distributions for data, background Monte Carlo and signal Monte Carlo. The events
are selected as described in the text.
6.3 The inclusive b! s branching ratio.
These observations show that the excess in Figure 5 is photon-like and tends to have a lifetime
distribution and a strangeness content consistent with the b ! s process. This evidence
supports the hypothesis that the excess is due to b! s decays. The inclusive b! s branching
ratio is then evaluated as follows:
Br(b! s ) =Nb!s
"b!s
�1
2Nhad Rb
12

where "b!s is the e�ciency with which inclusive b ! s decays pass the event selection and
is given in Table 2; Nhad is the number of hadronic Z decays in the data after the standard
ALEPH hadronic event selection; and Rb is the Z! b�b hadronic branching fraction which is set
to its Standard Model value of 0.2158 [25]. The resulting branching ratio and its total statistical
uncertainty is :
Br(b! s ) = (3:11 � 0:88) � 10�4:
7 Statistical and systematic uncertainties
Table 6 gives a breakdown of the statistical and systematic uncertainties on the branching ratio
measurement. The methods used to evaluate these uncertainties are described below, where
each uncertainty is referred to by its label in the table.
Source of uncertainty Uncertainty (�10�4)
�1 Signal Monte Carlo statistics 0.065
�2 Background Monte Carlo statistics 0.376
�3 Background Monte Carlo composition 0.185
�4 Background shapes 0.462
�5 Energy calibration uncertainties 0.182
�6 K0L detection e�ciency 0.031
�7 �l scale 0.097
�8 b! u decay rate 0.076
�9 Exclusive b! s branching fractions 0.169
�10 Fraction of baryonic b! s decays 0.200
�11 B meson production fractions 0.012
�12 b quark Fermi momentum 0.028
�13 Assumption for Bs ! Xs�s exclusive branching fractions 0.014
�stat Data statistics | �stat =q�2
fit �P2
i=1�2i 0.80
�sys Total systematic uncertainty =qP13
i=1�2i 0.72
�tot Total uncertainty =q�2
stat +�2sys 1.08
Table 6: Uncertainties on the Br(b ! s ) measurement. Note that �fit is the total statistical
uncertainty which comes from the multivariate �t.
The total Br(b ! s ) �t uncertainty (�fit) has a small contribution, �1, from the b! s
Monte Carlo statistics. The covariance matrix produced in the �t is used to extract the
uncertainties in the branching ratio for b! s due to uncertainties in the four other parameters
in the �t by adopting the method described in [24], giving a combined systematic uncertainty
of �2. The background normalisation uncertainty (�2) is added in quadrature to the signal
Monte Carlo statistical uncertainty (�1), and the remaining uncertainty in �fit is assumed to
be the statistical uncertainty on Br(b! s ) due to the �nite data statistics (�stat). As the �t
results give a background Monte Carlo composition which is di�erent from the standard ALEPH
Monte Carlo, a conservative systematic uncertainty (�3) is evaluated as follows. The b ! s
branching ratio is recalculated using the standard Monte Carlo prediction for the background
normalisations and allowing only Nb!s to vary in the �t; then �3 is taken to be the di�erence
between this branching ratio and the value derived in section 6. The �2 for this one parameter
�t is 72.4 for 67 degrees of freedom.
The accuracy of the �t depends on how well the Monte Carlo represents the shape of the
13

data in E? and on the relative proportion of each background source in each sub-sample. The
systematic uncertainty due to a possible imprecision of the Monte Carlo in this regard is assessed
by observing the change in the measured branching ratio as the boundaries between the eight sub-
samples are varied. In this way it is possible to vary the background in the signal region leaving
the signal itself approximately unchanged. For example, as the Ejet boundary is decreased it
is possible to increase the FSR background by up to a factor 3 and the other backgrounds
by a factor 2 leaving the signal approximately constant in sub-samples 2 and 4. Similarly
increasing the �l boundary allows the other backgrounds to increase by up to a factor of 1.7
leaving the FSR and the signal in regions 2 and 4 almost unchanged. As these changes are
made the branching ratio changes by �4 and this is taken as a systematic uncertainty, although
such changes are compatible with statistical uctuations. The branching ratio measurement is
found to be insensitive to variation of the cut values in the other variables, cos �? , Sb, E and
� logPopphem [17].
The total jet energy (Ejet) for candidate b hadrons is obtained by adding the energies
contributing to the jet of the charged tracks (�30% of the total energy on average); all neutral
hadronic clusters which are assumed to be K0L (� 4% on average); and electromagnetic clusters
(�66% on average). For those jets (1% of the total) which lie between cos � of 0.9 and 0.95
relative to the beam axis, where there are uncertain energy losses due to imperfections in the
detector coverage at these small angles, the calibration uncertainty is taken to be 10%. For
the remaining jets, the calibration uncertainty of the energy scale is taken to be 1.0% and
is obtained by weighting the calibration uncertainty of the ECAL (1.5%), the HCAL (4%) and
charged tracks (0.2%) by the average fraction of the energy in each, as given above. Varying Ejet
within these uncertainties, for the appropriate events, results in a shift in the �tted branching
ratio of �5. The uncertainty in the HCAL detection e�ciency for K0L mesons in HCAL is taken
to be 4% and since this a�ects a quarter of b ! s decays it corresponds to a 1% systematic
uncertainty on the branching ratio (�6).
A �t to the �l data distribution using Monte Carlo background �0 mesons and photons, for
which the mean �l values are allowed to vary in the �t, results in a negligible shift in the mean
�l for photons but a (+1.6 � 0.8)% shift for �0 mesons. The change in the b ! s branching
ratio measurement when the �l scale is increased by 1.6% for Monte Carlo �0 mesons is �7.
The remaining systematic uncertainties are evaluated by reweighting signal and background
Monte Carlo events to take into account modelling uncertainties, repeating the �t, and measuring
the resultant changes in the branching ratio measurement. The b ! u decay rate used in the
�t (1.5%) is varied over the range of its uncertainty (� 50%), giving a shift in the measurement
of �8. The systematic uncertainty due to theoretical uncertainty in the relative fractions of
exclusive penguin decays in the inclusive b ! s model (�9) is calculated by repeating the �t
with two extreme signal Monte Carlo compositions. Firstly the fractions of resonant penguins
are all increased to their upper limits | as shown in Table 1 | while the numbers of non-
resonant penguins are reduced to compensate; then the fractions of resonant penguins are all
decreased to their lower limits while the numbers of non-resonant penguins are increased to
compensate. The �t is also repeated with the fraction of baryonic b ! s decays set to zero,
giving a shift of �10. The production fractions of B mesons are varied within their experimental
limits [16] to give a combined uncertainty of �11. The central Fermi momentum value used in the
simulation of B ! K(n�), 265 MeV, is changed by its uncertainty, �25 MeV [15], which gives a
maximum shift of �12. Finally, a systematic uncertainty of �13 is evaluated to account for the
assumption that the exclusive Bs penguin decays are produced in the same relative fractions as
the exclusive Bu(d) penguin decays by measuring the e�ect of weighting the Bs penguin decay
branching fractions according to their spin multiplicity [26] instead of those given in table 1.
14

8 Conclusions
The inclusive b! s branching ratio is measured to be:
(3:11 � 0:80stat � 0:72syst)� 10�4:
This could include a small contribution from b ! d . The result is consistent with both the
Standard Model prediction of (3:76 � 0:30) � 10�4 [2] and the only previous measurement of
(2:32� 0:57� 0:35)� 10�4 by CLEO [14]. The L3 [27] and DELPHI [28] collaborations at LEP
have previously performed searches for radiative charmless b decays and placed 90% con�dence
level upper limits of 1:2 � 10�3 and 5:4� 10�4, respectively, on the branching ratio.
9 Acknowledgements
We wish to congratulate our colleagues in the CERN accelerator divisions for the excellent
performance of the LEP machine. We are grateful to the engineers and technicians at all the
collaborating institutions for their contribution to the success of ALEPH. Those of us from
non-member states are grateful to CERN for its hospitality. We would like to thank A. Ali, T.
Ohl and M. Neubert for helpful discussions, C. Greub for providing us with a b! s spectator
model program, and R. Poling for explaining the CLEO method for determining the b quark
Fermi momentum.
References
[1] Weak radiative B meson decay beyond leading logarithms, K. Chetyrkin et al., Phys: Lett:B
400 (1997) 206; B ! Xs in the Standard Model, C. Greub and T. Hurth, hep-ph/9708214
(1997); On the scale uncertainties in the B ! Xs decay, A. J. Buras et al., Phys: Lett: B
414 (1997) 157.
[2] Theory of rare B decays, A. Ali, DESY 97-192, To be published in the Proceedings of
the Seventh International Symposium on Heavy Flavor Physics, Santa Barbara, California,
(1997).
[3] Can b! s close the supersymmetric Higgs production window?, J. L. Hewett, Phys. Rev.
Lett. 70 (1993) 1045.
[4] Theoretical uncertainties and phenomological aspects of B ! Xs decay, A. J. Buras et al.,
Nucl: Phys: B 424 (1994) 374.
[5] Radiative rare B decays into higher K resonances., A. Ali et al., Phys: Lett: B 298 (1993)
195; Private communications with A. Ali.
[6] A pro�le of the �nal states in B ! Xs and an estimate of the branching ratio BR(B !
K� ), A. Ali and C. Greub, Phys: Lett: B 259 (1991) 182; Private communications with
C. Greub.
[7] Prompt photon energy spectra in B decays and determination of the CKM matrix elements.,
A. Ali and C. Greub, Phys: Lett: B 293 (1992) 226.
[8] Flavor changing neutral current processes in B decays, A. Ali, Nucl: Phys: Proc: Suppl:
59 (1997) 86.
[9] ALEPH: A detector for electron-positron annihilations at LEP, ALEPH Collaboration,
Nucl. Instr. and Meth. A 294 (1990) 121.
15
[10] Performance of the ALEPH detector at LEP, ALEPH Collaboration,
Nucl: Instr: and Meth: A 360 (1995) 481.
[11] High-energy physics event generation with PYTHIA 5.7 and JETSET 7.4, T. Sj�ostrand,
Comp. Phys: Comm: 82 (1994) 74.
[12] Measurement of prompt photon production in hadronic Z decays, ALEPH Collaboration,
Z: Phys: C 57 (1993) 17; First measurement of the quark to photon fragmentation function,
ALEPH Collaboration, Z: Phys: C 69 (1996) 365.
[13] Radiative penguin decays of the B meson, CLEO Collaboration, CLEO CONF 96-05,
Contributed paper to the International Conference on High Energy Physics, Warsaw, (1996)
[14] First measurement of the rate for the inclusive radiative penguin decay b ! s , CLEO
Collaboration, Phys: Rev: Lett: 74 (1995) 2885.
[15] Measurements of the inclusive semileptonic branching fraction of B mesons at the
Upsilon(4S) resonance, R. Wang, Ph.D. thesis, University of Minnesota (1994).
[16] Particles and �elds, Particle Data Group, Phys: Rev: D 54 (1996).
[17] A measurement of the inclusive branching ratio for b ! s with the ALEPH detector at
LEP, M.I.Williams, Ph.D. thesis, RAL-TH-97-019, University of Lancaster (1997).
[18] Experimental studies on multi-jet production in e+ e� annihilation at PETRA energies,
JADE Collaboration, Z: Phys: C 33 (1986) 23.
[19] A precise measurement of �(Z ! b�b)/�(Z ! hadrons), ALEPH collaboration, Phys: Lett:
B 313 (1993) 535.
[20] A measurement of Rb using a lifetime-mass tag, ALEPH Collaboration, Phys: Lett: B 401
(1997) 150.
[21] Determination of the average lifetime of bottom hadrons, TASSO Collaboration, Phys: Lett:
B 149 (1984) 524.
[22] Fitting using �nite Monte Carlo samples, R. Barlow and C. Beeston, Comp: Phys: Comm:,
77 (1993) 219.
[23] Inclusive production of neutral pions in hadronic Z decays, ALEPH Collaboration, Z: Phys:
C 74 (1997) 451; Studies of Quantum Chromodynamics with the ALEPH detector, ALEPH
Collaboration, Phys: Rept: 294 (1998).
[24] MINUIT, F. James, CERN program library long writeup D506 (1994) section 7.3.1.
[25] Precision calculations for the Z resonance, Eds. D. Bardin, W. Hollik and G. Passarino,
Report CERN-95-03 (1995).
[26] Private communications with T. Ohl.
[27] Inclusive search for the charmless radiative decay of the b quark (b! s ), L3 Collaboration,
Phys: Lett: B 317 (1993) 637.
[28] Study of rare B decays with the DELPHI detector at LEP, DELPHI Collaboration, Z: Phys:
C 72 (1996) 207.
16


