Embed Size (px)
Citation preview
A Guide to Sales ManagementA Practitioner’s View of Trade Sales Organizations
Massimo Parravicini
Selling and Sales Force Management CollectionBuddy LaForge and Thomas Ingram, Editors
A Guide to Sales ManagementA Practitioner’s View of Trade Sales OrganizationsMassimo ParraviciniIn many FMCG companies, the challenges for the sales function
are to develop effective sales strategies and to deliver excellent
sales operations in order to support the achievement of business
targets. The purpose of this book is to provide a practical guide to
sales management through the analysis of its key components:
route to market, sales strategy, key performance indicators,
organizational models, sales force management, customer busi-
ness planning, order to cash, and sales and operations planning.
For each of these topics, the content of this book is a balance of
theory, practical tips, and useful tools, keeping in mind not only
the “what,” but also the “how” of the implementation.
The reader will learn how to map sales channels, assess a
customer base, design a sales strategy, build a sales scorecard,
and organize a sales team’s frontline and back offi ce. The book
also covers how to structure trade category plans, customer busi-
ness plans, and customer negotiation plans and how to optimize
the sales team’s contribution to the company’s key fundamental
processes. It concludes with an overview of the future challenges
of sales management.
Massimo Parravicini holds an MA degree from Università
Cattolica del Sacro Cuore in Milan. He is a business consultant
specialized in sales and trade marketing of FMCG. He consolidated
over 20 years of line management experience working in Italy, in
the UK, and in the Netherlands, both in operating units and in
corporate headquarters. His responsibilities included a variety of
roles in account management, fi eld sales, category management,
fi eld marketing, sales operations, and customer service. As a
consultant and trainer, he had the privilege to work with both
manufacturers and retailers and to further develop his expertise
in the food, beverage, homecare, and health and beauty industries.A
GU
IDE TO
SALES M
AN
AG
EMEN
TPA
RR
AV
ICIN
I
Selling and Sales Force Management CollectionBuddy LaForge and Thomas Ingram, Editors
THE BUSINESS EXPERT PRESSDIGITAL LIBRARIES
EBOOKS FOR BUSINESS STUDENTSCurriculum-oriented, born-digital books for advanced business students, written by academic thought leaders who translate real-world business experience into course readings and reference materials for students expecting to tackle management and leadership challenges during their professional careers.
POLICIES BUILT BY LIBRARIANS• Unlimited simultaneous
usage• Unrestricted downloading
and printing• Perpetual access for a
one-time fee• No platform or
maintenance fees• Free MARC records• No license to execute
The Digital Libraries are a comprehensive, cost-eff ective way to deliver practical treatments of important business issues to every student and faculty member.
For further information, a free trial, or to order, contact:

A Guide to Sales Management

A Guide to Sales Management A Practitioner's View of Trade Sales Organizations
Massimo Parravicini, MA
A Guide to Sales Management: A Practitioner's View of Trade Sales Organizations
Copyright © Business Expert Press, LLC, 2015
All rights reserved. No part of this publication may be reproduced, stored in a retrieval system, or transmitted in any form or by any means—electronic, mechanical, photocopy, recording, or any other except for brief quotations, not to exceed 250 words, without the prior permission of the publisher.
First published in 2015 by Business Expert Press, LLC 222 East 46th Street, New York, NY 10017 www.businessexpertpress.com
ISBN-13: 978-1-63157-258-6 (paperback) ISBN-13: 978-1-63157-259-3 (e-book)
Business Expert Press Selling and Sales Force Management Collection
Collection ISSN: 2161-8909 (print) Collection ISSN: 2161-8917 (electronic)
Cover and interior design by S4Carlisle Publishing Services Private Ltd., Chennai, India
First edition: 2015
10 9 8 7 6 5 4 3 2 1
Printed in the United States of America.
Abstract
The sales function is becoming more and more strategic because (a) the customer base is rapidly evolving through internationalization, mergers, and acquisitions, and (b) the manufacturers’ marketing and supply chain func-tions are being progressively centralized, regionalized, and globalized. Mul-tinational companies develop most of their brands and activation programs with a global scope and feed their markets through international supply networks. As a result, their operating units—national or transnational—are asked to act as “selling machines,” which must be capable of both imple-menting global corporate strategies locally and providing structured feed-back to improve the efficacy of the international brand portfolio. In this context, the challenge for the sales function is to develop effective sales strat-egies and to deliver excellent sales operations.
The purpose of the book is to provide a practical guide to sales man-agement through the analysis of its key components: route to market, sales strategy, key performance indicators, organizational models, sales force management, customer business planning, sales and operations planning, and order to cash. For each of these topics, the content of the book is a balance of theory, practical tips, and tools, keeping in mind not only the “what,” but also the “how” of the implementation.
Keywords
Sales management, route to market, sales strategy, key performance in-dicators, sales organization, sales processes, customer business planning, sales and operations planning, order to cash, distributive strategy, sales channels, account management, trade terms, trade marketing, category management, shopper marketing, field marketing, sales operations, and customer service.

Contents
List of Figures ....................................................................................... xi Figure Credits ..................................................................................... xiii Foreword ............................................................................................. xv Preface .............................................................................................. xvii Acknowledgments ................................................................................ xxi Chapter 1 Trade Structure and Route to Market................................ 1
Retail outlets and sales channels ........................................ 1 Trade accounts and route to market .................................. 8 Trade account strategies and economics .......................... 13 Trade account pre-evaluation model ............................... 23 Takeaway points ............................................................. 26
Chapter 2 The Sales Strategy ........................................................... 29 Definitions of corporate strategy: a mini tour .................. 29 Sales strategy: definition, responsibility, and sources ........ 33 Market analysis: trade environment scan ......................... 34 Responding to customers’ strategies ................................. 34 Customer-satisfaction surveys as a strategic input and a
monitoring tool ........................................................ 35 Organization capabilities assessment and capability
building program ..................................................... 37 Corporate strategy: vision, strategic themes, and goals ..... 38 The definition of the sales strategy: strategic actions,
targets, and activities ................................................ 43 Communication and outputs of the sales strategy ............ 47 Takeaway points ............................................................. 47
Chapter 3 The Performance Indicators for Sales Management ......... 49 Why we need key performance indicators? ...................... 49 Financial indicators ......................................................... 49 Field sales efficacy indicators ........................................... 51 Customer-service indicators............................................. 52 Point of purchase indicators ............................................ 56 Joint business planning and customer indicators.............. 61 Utilizing KPIs: the sales team scorecard ........................... 62 Utilizing KPIs: identifying reasons and solutions ............. 63 Takeaway points ............................................................. 66
viii CONTENTS
Chapter 4 Organizational Roles and Responsibilities ....................... 69 The pillars of the organization of the sales function ........ 69 The multilevel customer interface: an example ............... 69 The front office roles ...................................................... 72 The back office roles ....................................................... 77 Takeaway points ............................................................. 99
Chapter 5 Organization Models, Recruitment, and Incentives ...... 101 The organization of the front office: alternative models .... 101 The organization of the back office: alternative models ..... 104 Job descriptions ............................................................ 109 Sizing, recruiting, training, and developing
the sales team......................................................... 112 Incentives, variable pay, reward, and recognition .......... 116 Takeaway points ........................................................... 119
Chapter 6 The Business Planning Process ..................................... 121 The business planning process in sales management ..... 121 Customer business plans: prerequisite and structure ..... 122 Trade category plans: prerequisite and structure ........... 131 Integrated business planning ........................................ 138 Customer audit ............................................................ 140 Integration matrix ........................................................ 143 The customer negotiation plan ..................................... 144 IT tools for business planning ...................................... 146 Takeaway points ........................................................... 148
Chapter 7 The Order to Cash Process ........................................... 151 The definition of order to cash ..................................... 151 The phases of the O2C cycle ........................................ 151 The golden rule and the principles of O2C .................. 154 Roles and responsibilities of the O2C cycle .................. 155 The performance indicators of the O2C cycle .............. 158 IT tools for O2C .......................................................... 160 O2C development and innovation ............................... 162 Takeaway points ........................................................... 164
Chapter 8 The Sales and Operations Planning Process .................. 167 The definition of sales and operations planning ............ 167 Why a sales director should care about S&OP?............. 168 The phases of the S&OP cycle ..................................... 169 The principles of S&OP ............................................... 177 The prerequisites of S&OP .......................................... 180
CONTENTS ix
Meetings supporting the S&OP process ........................ 183 The S&OP performance indicators ............................... 186 IT tools for S&OP ........................................................ 189 Takeaway points ........................................................... 189
Chapter 9 The Challenges of Sales Management ............................ 191 Changes will happen ..................................................... 191 Mergers and acquisitions ............................................... 191 An experience of merger ................................................ 194 Two theories on leading cultural change ........................ 198 A change checklist for the sales director ......................... 204 Customer consolidation and channels evolution ............ 208 Customer internationalization ....................................... 210 The future challenges of sales management .................... 212 Takeaway points ........................................................... 212
References ..................................................................................... 215 Index ..................................................................................... 221

List of Figures
Figure 1.1 Channel architecture: global—all markets 5 Figure 1.2 Channel architecture: health and beauty markets in Europe 6 Figure 1.3 Channel architecture: consumer electronics
(white and brown goods) in Europe 8 Figure 1.4 Trade accounts and channels: in home macrosector 9 Figure 1.5 Trade accounts and channels: out of home macrosector 10 Figure 1.6 Strategic planning framework 14 Figure 1.7 Example of channel/trade account pre-evaluation model 25 Figure 1.8 Example of pre-evaluation map 25 Figure 2.1 Strategic planning framework in detail 39 Figure 3.1 The fundamental KPIs for sales 50 Figure 3.2 Point of purchase indicators 57 Figure 3.3 Mapping categories and customer through
market shares 62 Figure 3.4 An example of sales team scorecard 63 Figure 3.5 An example of fishbone diagram to be completed
with responsibilities and solutions 65 Figure 3.6 An example of performance loss tree for weighted
distribution root cause analysis 66 Figure 4.1 National buying groups, national organizations,
and trade accounts in the Italian grocery market 71 Figure 4.2 Interface, escalation, and support roles in the
management of a multilevel customer structure 74 Figure 4.3 The eight-step category management model 82 Figure 4.4 An example of consumer decision tree for the
hair-care category 84 Figure 4.5 An example of stratogram for the hair-care category 87 Figure 4.6 The shopper conversion chain 90 Figure 4.7 Shopping trips 91 Figure 5.1 Example of horizontal territorial organization 101 Figure 5.2 Example of horizontal territorial organization
with centralized customers 102
xii LIST OF FIGURES
Figure 5.3 Example of organization combining vertical and horizontal customer approaches 103
Figure 5.4 Example of sales strategy and operations organization 105 Figure 5.5 Example of integrated marketing and category
management organization 106 Figure 5.6 Example of trade marketing team organization 108 Figure 5.7 Example of customer and shopper marketing
organization 108 Figure 5.8 Example of supply chain team organization 109 Figure 6.1 An example of ABC curve 122 Figure 6.2 An example of customer value assessment with
three customer groups 123 Figure 6.3 A FMCG example of business planning guidelines
for three customer groups 124 Figure 6.4 Customer business plan framework 125 Figure 6.5 Trade category plan framework 133 Figure 6.6 An example of category activity calendar 137 Figure 6.7 Business planning sequence in fragmented trade
and in case of channel differentiation 140 Figure 6.8 Business planning sequence in concentrated trade 140 Figure 6.9 Business planning—jobs to be done proposal 142 Figure 6.10 Example of integration matrix to map turnover
and promotional expenditure 143 Figure 6.11 An example of negotiation grid 145 Figure 6.12 An overview of the IT tools for business planning 148 Figure 7.1 An example of map of the O2C process 152 Figure 7.2 Sales team role in customer service: internal
communication 157 Figure 7.3 Sales team role in customer service: coordination
of the external interface 157 Figure 7.4 Overview of IT tools for the O2C process 162 Figure 8.1 Sales and operations planning key steps 171 Figure 8.2 An example of sales forecasting framework 172 Figure 8.3 Overview of the meetings supporting the S&OP cycle 186 Figure 9.1 Two theories on leading cultural change 203
Figure Credits
All the illustrations of this book have been prepared by the author with the following exceptions:
Figure 1.1 Channel architecture: printed with permission from David B. Easton.
Figure 3.5 Fishbone diagram: reprinted with permission from the Asian Productivity Organization. See Kaoru Ishikawa. 1972. Guide to Quality Control, Tokyo: Asian Productivity Organization.
Figure 4.3 The eight-step category management model: reprinted with permission from The Partnering Group Inc. and Roland Berger & Partners. See ECR North America. 1995. Category Management Report. Enhancing Consumer Value in the Grocery Industry, Cincinnati, OH: The Joint Industry Project on Efficient Consumer Response (Category Management Subcommittee) and The Partenering Group, Inc., and ECR Europe. 1997. Category Management Best Practices Report, Bruxelles: The Partnering Group Inc. and Roland Berger & Partners.
Figure 4.6 The shopper conversion chain: printed with permission from Neil Munro.
Figure 6.11 An example of negotiation grid: printed with permission from Carlos Esteban and Kantar Retail.

Foreword
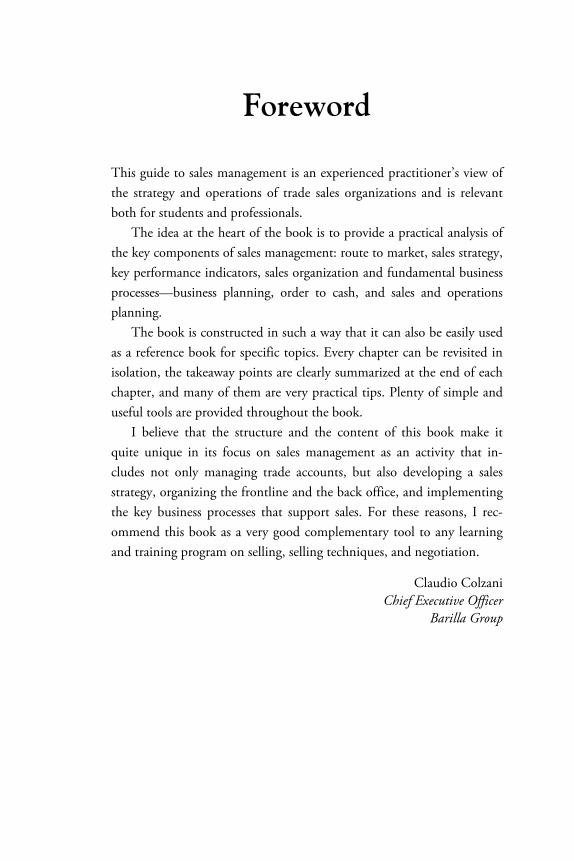
This guide to sales management is an experienced practitioner’s view of the strategy and operations of trade sales organizations and is relevant both for students and professionals.
The idea at the heart of the book is to provide a practical analysis of the key components of sales management: route to market, sales strategy, key performance indicators, sales organization and fundamental business processes—business planning, order to cash, and sales and operations planning.
The book is constructed in such a way that it can also be easily used as a reference book for specific topics. Every chapter can be revisited in isolation, the takeaway points are clearly summarized at the end of each chapter, and many of them are very practical tips. Plenty of simple and useful tools are provided throughout the book.
I believe that the structure and the content of this book make it quite unique in its focus on sales management as an activity that in-cludes not only managing trade accounts, but also developing a sales strategy, organizing the frontline and the back office, and implementing the key business processes that support sales. For these reasons, I rec-ommend this book as a very good complementary tool to any learning and training program on selling, selling techniques, and negotiation.
Claudio Colzani Chief Executive Officer
Barilla Group

Preface
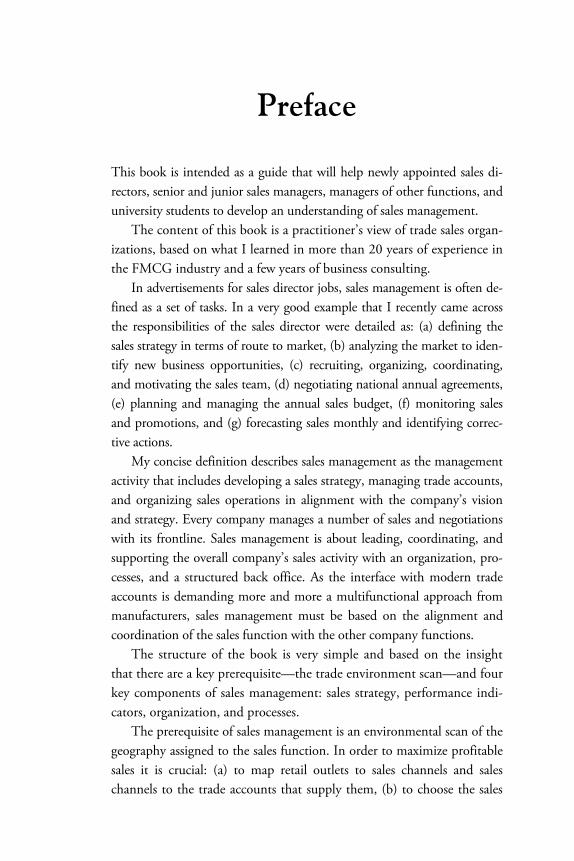
This book is intended as a guide that will help newly appointed sales di-rectors, senior and junior sales managers, managers of other functions, and university students to develop an understanding of sales management.
The content of this book is a practitioner’s view of trade sales organ-izations, based on what I learned in more than 20 years of experience in the FMCG industry and a few years of business consulting.
In advertisements for sales director jobs, sales management is often de-fined as a set of tasks. In a very good example that I recently came across the responsibilities of the sales director were detailed as: (a) defining the sales strategy in terms of route to market, (b) analyzing the market to iden-tify new business opportunities, (c) recruiting, organizing, coordinating, and motivating the sales team, (d) negotiating national annual agreements, (e) planning and managing the annual sales budget, (f) monitoring sales and promotions, and (g) forecasting sales monthly and identifying correc-tive actions.
My concise definition describes sales management as the management activity that includes developing a sales strategy, managing trade accounts, and organizing sales operations in alignment with the company’s vision and strategy. Every company manages a number of sales and negotiations with its frontline. Sales management is about leading, coordinating, and supporting the overall company’s sales activity with an organization, pro-cesses, and a structured back office. As the interface with modern trade accounts is demanding more and more a multifunctional approach from manufacturers, sales management must be based on the alignment and coordination of the sales function with the other company functions.
The structure of the book is very simple and based on the insight that there are a key prerequisite—the trade environment scan—and four key components of sales management: sales strategy, performance indi-cators, organization, and processes.
The prerequisite of sales management is an environmental scan of the geography assigned to the sales function. In order to maximize profitable sales it is crucial: (a) to map retail outlets to sales channels and sales channels to the trade accounts that supply them, (b) to choose the sales
xviii PREFACE
channels and the stores where we want our products to be sold, and (c) to select the trade accounts that we want to activate to reach our shoppers in the designated sales channels and stores, bearing in mind that there might be overlaps and therefore potential conflicts between trade ac-counts. The trade environment scan must be a very accurate and detailed piece of work as it supports the choice of the route to market, a key building block of our sales strategy choice. Trade structure, route to mar-ket, and retail economics are discussed in detail in Chapter 1.
The sales strategy is defined by the sales leader utilizing five sources: market analysis for the choice of the route to market (trade environment scan), customers’ strategies, customer-satisfaction surveys, assessment of the sales organization capabilities, and company’s business strategy. The sales strategy consists of strategic goals that are translated into a number of strategic actions, each with its own specific targets and activities. A well-prepared sales strategy becomes the input for developing aligned departmental and individual work plans and establishing effective sales policies. The five sources of the sales strategy and its definition and communication are discussed in Chapter 2.
The performance indicators to evaluate and improve the effectiveness of the sales team must include not only financial measures, but also indi-cators of field sales efficacy, customer service, in-store execution, and joint business planning with customers. The definition of the performance measures, the use of a sales team scorecard, and the methodology of root cause analysis of performance losses are the key topics of Chapter 3.
The organization of the sales function has two pillars: the front office managing the customer interface and the back office providing support to the frontline. The front office roles cover national account manage-ment, field account management, and field merchandising. The back office roles deal with sales operations, trade marketing—including visual merchandising, category management, customer marketing, and shopper marketing—customer service, and increasingly sales finance and strategy development. All the front and back office roles and responsibilities are analyzed in detail in Chapter 4.
There are a few alternative models for the organization of both the front office and the back office. The organizational structure of the frontline can be predominantly geographic- or customer-based depending on trade concentration, while the setup of the sales back office is heavily
PREFACE xix
influenced by the reporting lines of trade marketing, field marketing, and customer service. All the alternatives are discussed in Chapter 5 along with a methodology to prepare job profiles and some key aspects of the management of sales teams, such as sizing the sales force, recruiting, training, and rewarding.
The three fundamental processes for sales management are: business planning, order to cash (O2C), and sales and operations planning (S&OP).
Business planning is an integrated corporate activity in which the sales team is involved and responsible for the customer business plans and in some cases for the trade category plans. In Chapter 6, I discuss in detail the recommended structure for these plans and the interrelations between them and the brand marketing plans. I show how business planning must necessarily include customer negotiation plans to manage the annual round of negotiations with the customers and discuss the features of IT tools that can support business planning.
The O2C cycle starts when a deal has been closed and the customer places an order. In Chapter 7, I analyze all the phases of this process up to cash collection. I identify the key principles to deliver a competitive and effective O2C process, discuss roles and responsibilities, perfor-mance indicators, and IT tools to support and optimize it. I explain how customer-service improvements can be achieved both with internal ac-tivities (training sessions and workshops) and external customer-specific supply side projects.
The S&OP cycle starts when a sales period—typically a month—has been closed and the company needs to assess what must be done to support and reinforce its business plan on a 12 month (or more) rolling basis. In Chapter 8, I analyze all the phases of the S&OP process and discuss key principles, roles and responsibilities, performance indicators, and IT tools with the same approach used for the O2C cycle. I focus on the demand side of S&OP and therefore on sales forecasting and on planning activities to close the gaps between sales forecast and annual operations plan.
Finally, I analyze in Chapter 9 the changes such as mergers and ac-quisitions, channels evolution, customer consolidation, and customer internationalization that pose key challenges to sales management and drive change.
Across the board I make the point that the role of the sales director in relation to her peers of the company’s leadership team is to bring the
xx PREFACE
customer inside the organization. She will provide an understanding of customer strategies and customer needs, integrate the sales dimension in strategy formulation and implementation, choose the route to market, translate the company’s strategy into strategic actions and targets for the sales team, drive customer business planning, explain the drivers of sales performance, feedback on innovation, update the short term sales fore-cast, and recommend corrective actions to achieve the objectives of the company’s business plan.
I hope that reading this book you will learn something new about route to market, sales strategy, sales performance indicators, organiza-tion, and processes of the sales functions. At the end of each chapter, you find takeaway points, some of which are practical tips that you might find useful.
The book is disseminated with models, examples, frameworks, tem-plates, and checklists that might help you to prepare or review your trade account evaluation model, sales strategy statement, sales team scorecard, organograms, job descriptions, customer business plans, trade category plans, negotiation grids, etc. I hope you find them inspirational.
Acknowledgments
I considered writing this book an opportunity to organize, consolidate, and share the knowledge of sales management that I gathered as a prac-titioner, as a business consultant, and as a trainer in over 25 years.
I spent most of my working life at Unilever where I learnt a lot from outstanding people and in leading edge training courses. I would like to thank the following people:
- my line managers - my sales directors - my chairmen - my colleagues in Milan, London, Rotterdam, Port Sunlight,
Schaffhausen, and Rome - all the people that ever reported directly or indirectly to me.
Henriette Lundgren of Grange Partnership UK LLP encouraged me to write this book and supported me throughout the process. She re-viewed the chapters on order to cash and sales and operations planning.
Micole Bautista of EyeLevel Australia provided very precious advice on the structure, content and style of this book and reviewed the chap-ters on ruote to market, sales strategy, organization, business planning and future challenges of sales management.
Mike Price of Unilever reviewed the chapter on key performance in-dicators and provided many inputs about the organization of field sales and in-store execution.
Gianni Ingrassia of I&G Management gave me the opportunity to work with him and learn from a number of projects with leading manu-facturers and retailers.
Carlos Esteban asked me to become an associate of Kantar Retail and involved me in the development and delivery of innovative sales training programs for FMCG multinational companies.

CHAPTER 1
Trade Structure and Route to Market
Retail outlets and sales channels
The retail outlets of every market can be grouped into sales channels that are supplied and serviced by a multiplicity of trade accounts: retail-ers, distributors, and wholesalers. A sales channel is a cluster of retail outlets with similar selling proposition, physical characteristics, and tar-get shoppers. The first challenge for a newly appointed sales leader is to choose the combination of sales channels and trade accounts where she will sell her company’s brands—in other words, to select the path to reach out to her target shoppers, her route to market (RTM).
The identification and selection of sales channels is the first step to take in the definition of a RTM. We can describe a sales channel in de-tail focusing on its:
• Outlet characteristics. Stores can have a small or large sales surface, can have an urban or suburban location, can exclu-sively or predominantly offer either clerk or self-service, etc.
• Target shopper. Shoppers can be depicted in terms of their sociodemographic profiles, but also on the basis of the primary shopping mission that drives their choice of a sales channel.
• Outlet offering. The product and service assortment offered by the stores is a functional and emotional solution to the target shopper’s needs.
• Evidence and differentiators. The channel provides a reason to believe that it can meet the target shopper’s needs better
2 A GUIDE TO SALES MANAGEMENT
than other channels and has something special that makes it different in its shopper’s eyes.
• Specific requirements. The channel has strong preferences in terms of product sizes, point of purchase (POP) materials, secondary packaging, delivery methods (e.g., direct store delivery), etc.
• Trends. The channel is winning business from some channels and losing business to others. Its turnover evolution might not be the same in every product category as the drivers of change do not have the same impact on all the offering.
Any channel can be considered a specific answer to one of these ques-tions: (1) “Where is the consumer buying for immediate consumption?” and (2) “Where is the shopper purchasing for delayed consumption?” The answers to these questions help us to define for every market macrosectors and sectors into which we can group channels and to identify shopper-based channel definitions.
The “In Home” and “Out of Home” macrosectors, sectors, and
channels
If we want to identify the channel architecture of a target market, it really helps to start from the purchase and consumption behavior of consumers. Any channel architecture will have at its first hierarchical level the macrosectors of “out of home” consumption and “in home” use. Sometimes these macrosectors are also referred to as “on trade” and “off trade,” respectively—a terminology that is typical of the food and food service business.
In out of home (“on trade”), the key sectors are impulse, on premise, and vending machines. The impulse sector includes three channels: (a) confectionery shops, tobacconists, and newsagents (CTN), and kiosks; (b) convenience stores; and (c) petrol stations’ forecourts stores. The on-premise sector includes five channels: (a) café, bars, public houses, and licensed trade outlets that focus either on coffee-based or alcoholic beverages, but also offer some food for immediate consumption; (b) hotels; (c) restaurants; (d) catering; and (e) all the leisure out of home outlets, such
TRADE STRUCTURE AND ROUTE TO MARKET 3
as cinemas, theaters, and sport venues, where food and beverage offering is complementary. Most of the on-trade stores are supplied by concessionaires, specialist distributors, and wholesalers.
In “in home” (“off trade”), the key sectors are modern grocery dis-tribution (MGD), traditional grocery distribution, and specialist retail outlets (mostly nongrocery).
MGD includes all self-service channels, ranging from hypermarkets and superstores to supermarkets, superettes, and mini- and micromarkets. This classification is normally linked to the store sales surface and the mer-chandise on sale. In terms of sales surface, a simple store classification broadly based on AC Nielsen’s and Symphony IRI’s types is the following:
• Hypermarkets: sales area from 2.500 sqm • Superstores: sales area from 1500 to 2499 sqm • Supermarkets: sales area from 400 to 1499 sqm • Superette: sales area from 200 to 399 sqm • Mini- and micromarkets: sales area from 100 to 199 sqm.
The nongrocery offering is normally very limited in superstores and smaller stores, while hypermarkets also sell houseware, textiles, consumer electronics, domestic appliances, and car accessories, although with more restricted assortments than in the past. Superstores respond in the best way to the family need of a weekly one stop bulk shopping, offering a good balance of assortment, price competitiveness, and shopping time requirement, especially compared to the largest hypermarkets. Discounts used to be identified as self-service stores above 400 sqm not ranging branded goods and fresh produce, but today, it is better to distinguish between soft and hard discounts on the basis of the percentage of branded items that they list, whether above or below 20 and 25 percent of the as-sortment as a rule of thumb. Superettes and mini- and micromarkets are the modern grocery component of the in home convenience sector. The “brick and mortar” channels of MGD are complemented by the online direct-to-consumer channel, which, as far as grocery is concerned, is still a challenge for most retailers.
4 A GUIDE TO SALES MANAGEMENT
Traditional grocery distribution typically includes small independent self-service stores (supermarkets below 800 sqm, superettes, and mini- and micromarkets), clerk service stores from 25 to 100 sqm, including butchers, bakers and confectioners, and open market stalls stores from 10 to 25 sqm. Independent superettes, independent mini- and micro-markets, and clerk service outlets are the traditional grocery component of the in home convenience sector.
Specialist retail outlets include some food self-service stores (e.g., frozen food, and wine and spirits), drugstores, and nonfood outlets such as phar-macies and perfumeries, pet care specialists, clothing and footwear shops, consumer electronics, entertainment (books, music, videos, and games), do it yourself (DIY), and furniture stores. In this sector, the online direct-to-consumer channel is increasingly important especially in nonfood markets: Amazon is already ranked no. 15 among the global powers of retailing (Deloitte 2015) and is expected to enter the top 10 soon.
You will have noticed that the convenience or “C sector” is present across the two macrosectors of on trade and off trade. Convenience typically caters for the out of home consumption of soft drinks, snacks, sandwiches, ice creams, and confectionery, at the same time carrying the assortment of a small supermarket or superette for in home consumption. The C sector is the new battleground of retail, especially in Western Europe. While in some countries like Germany the top end of the market is saturated and there is an excess of large suburban outlets fighting to win the weekly bulk shopping trips, there seems to be space in every country for retailers to develop winning formulas to maximize their share of the daily top-up shopping trips.
Cash’n’carries are normally considered indirect trade accounts, ra-ther than a sales channel, because they serve traders, independent stores, hotels, restaurants, catering, etc. However, it should not be forgotten that a good slice of their business, especially in the western world, is represented by the so-called complementary business users (CBUs), the professionals that are buying for self-consumption as in home end con-sumers. Metro Makro is an example of a cash’n’carry chain that carries a specific assortment and runs ad hoc promotions targeting CBUs. For this part of their business, cash’n’carries can be considered a MGD channel.
TRADE STRUCTURE AND ROUTE TO MARKET 5
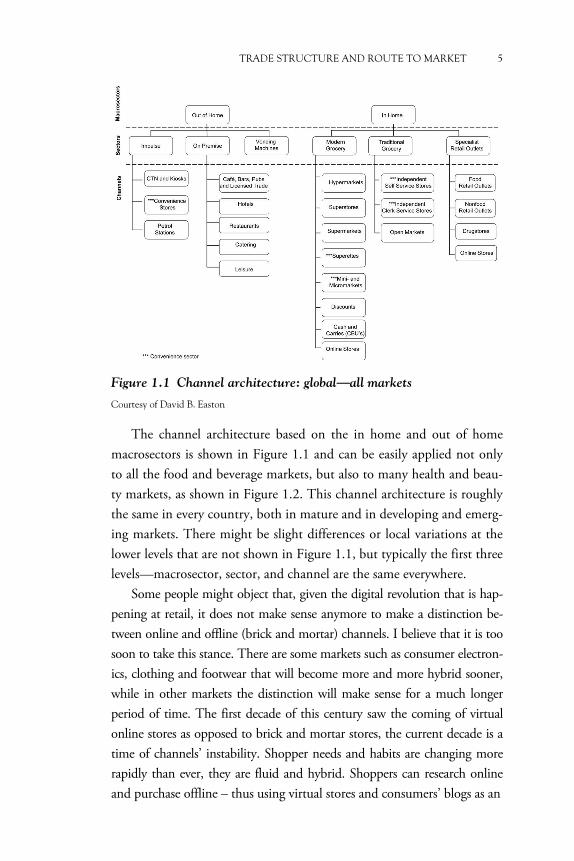
Figure 1.1 Channel architecture: global—all markets
Courtesy of David B. Easton
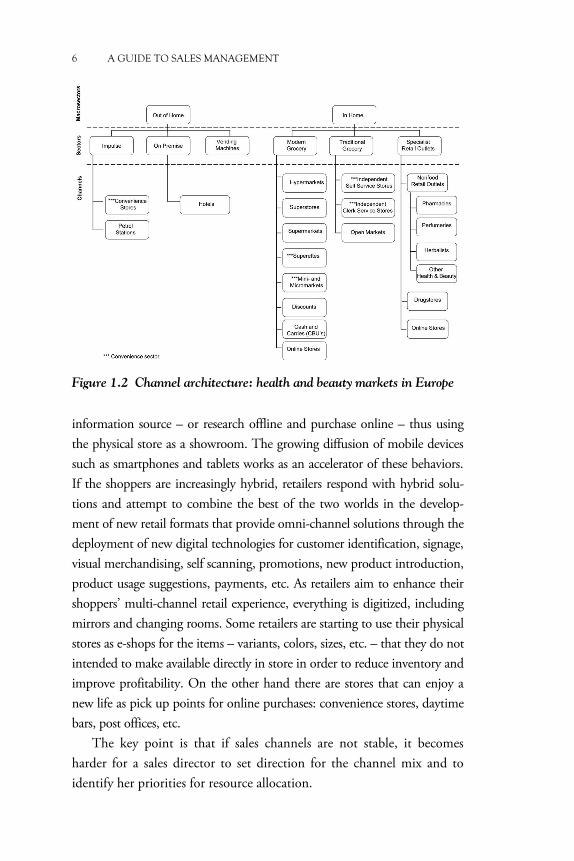
The channel architecture based on the in home and out of home macrosectors is shown in Figure 1.1 and can be easily applied not only to all the food and beverage markets, but also to many health and beau-ty markets, as shown in Figure 1.2. This channel architecture is roughly the same in every country, both in mature and in developing and emerg-ing markets. There might be slight differences or local variations at the lower levels that are not shown in Figure 1.1, but typically the first three levels—macrosector, sector, and channel are the same everywhere.
Some people might object that, given the digital revolution that is hap-pening at retail, it does not make sense anymore to make a distinction be-tween online and offline (brick and mortar) channels. I believe that it is too soon to take this stance. There are some markets such as consumer electron-ics, clothing and footwear that will become more and more hybrid sooner, while in other markets the distinction will make sense for a much longer period of time. The first decade of this century saw the coming of virtual online stores as opposed to brick and mortar stores, the current decade is a time of channels’ instability. Shopper needs and habits are changing more rapidly than ever, they are fluid and hybrid. Shoppers can research online and purchase offline – thus using virtual stores and consumers’ blogs as an
6 A GUIDE TO SALES MANAGEMENT
Figure 1.2 Channel architecture: health and beauty markets in Europe
information source – or research offline and purchase online – thus using the physical store as a showroom. The growing diffusion of mobile devices such as smartphones and tablets works as an accelerator of these behaviors. If the shoppers are increasingly hybrid, retailers respond with hybrid solu-tions and attempt to combine the best of the two worlds in the develop-ment of new retail formats that provide omni-channel solutions through the deployment of new digital technologies for customer identification, signage, visual merchandising, self scanning, promotions, new product introduction, product usage suggestions, payments, etc. As retailers aim to enhance their shoppers’ multi-channel retail experience, everything is digitized, including mirrors and changing rooms. Some retailers are starting to use their physical stores as e-shops for the items – variants, colors, sizes, etc. – that they do not intended to make available directly in store in order to reduce inventory and improve profitability. On the other hand there are stores that can enjoy a new life as pick up points for online purchases: convenience stores, daytime bars, post offices, etc.
The key point is that if sales channels are not stable, it becomes harder for a sales director to set direction for the channel mix and to identify her priorities for resource allocation.
TRADE STRUCTURE AND ROUTE TO MARKET 7
Macrosectors, sectors, and channels in the nonfood markets
There are industries that, unlike food and beverage, do not have at all or have a very little out of home macrosector. This is true for fast moving consumer goods markets like household care, health and beauty, and pet care, and it is even more relevant for macrocategories such as clothing, accessories and footwear, home improvement, furniture and DIY, electri-cal and office, and a part of leisure and entertainment—excluding video, music, and e-books downloads, and services in streaming that can be con-sidered on trade. For some of these categories, the lack of an out of home business is compensated for not only by the fast growing importance of online stores, but also by brick and mortar factory outlets, that are of little or no relevance to grocery, but are essential for the business and therefore the outlet mapping of clothing, accessories, and footwear.
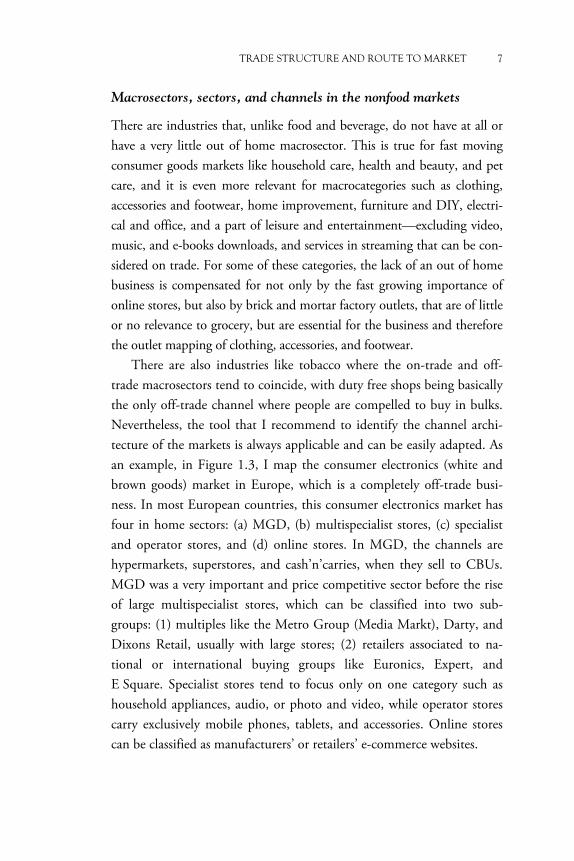
There are also industries like tobacco where the on-trade and off-trade macrosectors tend to coincide, with duty free shops being basically the only off-trade channel where people are compelled to buy in bulks. Nevertheless, the tool that I recommend to identify the channel archi-tecture of the markets is always applicable and can be easily adapted. As an example, in Figure 1.3, I map the consumer electronics (white and brown goods) market in Europe, which is a completely off-trade busi-ness. In most European countries, this consumer electronics market has four in home sectors: (a) MGD, (b) multispecialist stores, (c) specialist and operator stores, and (d) online stores. In MGD, the channels are hypermarkets, superstores, and cash’n’carries, when they sell to CBUs. MGD was a very important and price competitive sector before the rise of large multispecialist stores, which can be classified into two sub-groups: (1) multiples like the Metro Group (Media Markt), Darty, and Dixons Retail, usually with large stores; (2) retailers associated to na-tional or international buying groups like Euronics, Expert, and E Square. Specialist stores tend to focus only on one category such as household appliances, audio, or photo and video, while operator stores carry exclusively mobile phones, tablets, and accessories. Online stores can be classified as manufacturers’ or retailers’ e-commerce websites.
8 A GUIDE TO SALES MANAGEMENT
Figure 1.3 Channel architecture: consumer electronics (white and
brown goods) in Europe
Trade accounts and route to market
Once we are clear about the channel architecture of our target market, we need to understand which channels and stores we want to reach and how, whether directly or indirectly. For example, if we have been ap-pointed sales director in a developing and emerging market, we will map stores to channels and we will choose our company’s route to market upon an understanding of store visit costs, supply chain costs, and trade accounts margin requirements. In principle, we can decide to visit every outlet with our team of sales reps and to deliver directly to every store. In reality, we will not be allowed to do so by restrictions imposed by some customers, but we will also find out that it is not economically viable to call some stores on an ongoing basis and we will have to choose intermediaries that can do the job for us more efficiently.
The choice of the RTM is the selection not only of the sales channels where we want to sell our brands, but also of the trade accounts that will supply those channels and that we want to target as our customers. There are complementary and alternative paths that we can follow in order to
TRADE STRUCTURE AND ROUTE TO MARKET 9
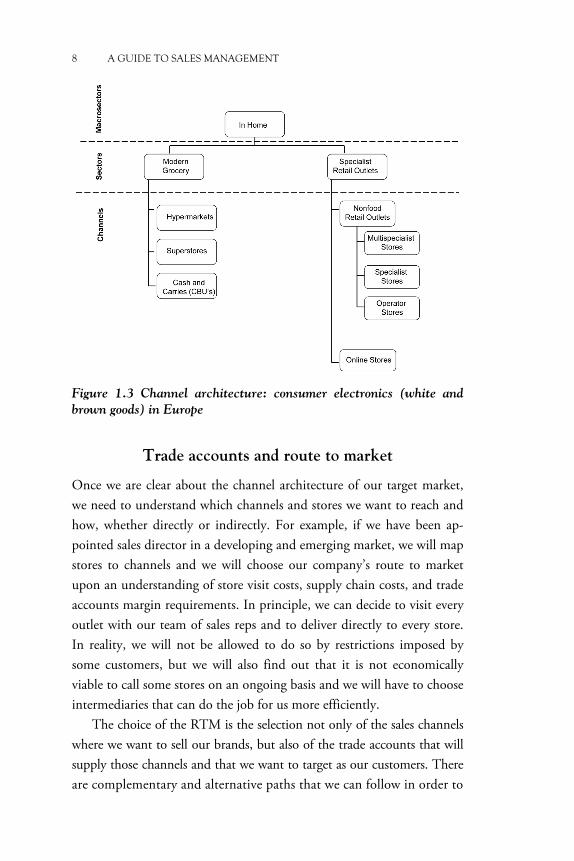
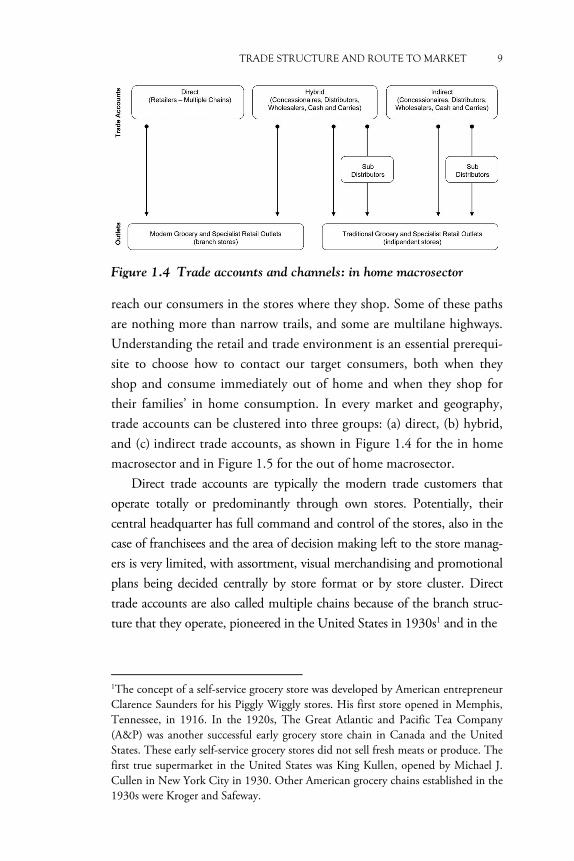
Figure 1.4 Trade accounts and channels: in home macrosector
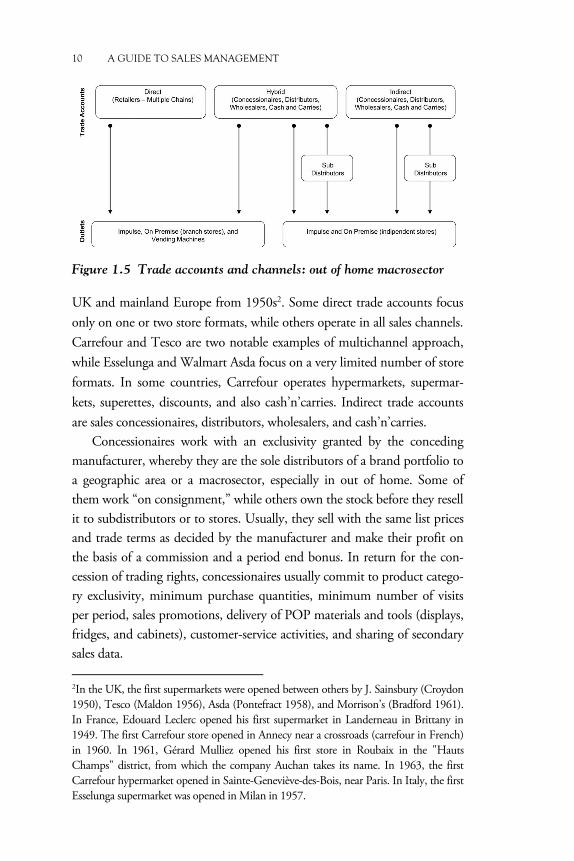
reach our consumers in the stores where they shop. Some of these paths are nothing more than narrow trails, and some are multilane highways. Understanding the retail and trade environment is an essential prerequi-site to choose how to contact our target consumers, both when they shop and consume immediately out of home and when they shop for their families’ in home consumption. In every market and geography, trade accounts can be clustered into three groups: (a) direct, (b) hybrid, and (c) indirect trade accounts, as shown in Figure 1.4 for the in home macrosector and in Figure 1.5 for the out of home macrosector.
Direct trade accounts are typically the modern trade customers that operate totally or predominantly through own stores. Potentially, their central headquarter has full command and control of the stores, also in the case of franchisees and the area of decision making left to the store manag-ers is very limited, with assortment, visual merchandising and promotional plans being decided centrally by store format or by store cluster. Direct trade accounts are also called multiple chains because of the branch struc-ture that they operate, pioneered in the United States in 1930s1 and in the
1The concept of a self-service grocery store was developed by American entrepreneur Clarence Saunders for his Piggly Wiggly stores. His first store opened in Memphis, Tennessee, in 1916. In the 1920s, The Great Atlantic and Pacific Tea Company (A&P) was another successful early grocery store chain in Canada and the United States. These early self-service grocery stores did not sell fresh meats or produce. The first true supermarket in the United States was King Kullen, opened by Michael J. Cullen in New York City in 1930. Other American grocery chains established in the 1930s were Kroger and Safeway.
10 A GUIDE TO SALES MANAGEMENT
Figure 1.5 Trade accounts and channels: out of home macrosector
UK and mainland Europe from 1950s2. Some direct trade accounts focus only on one or two store formats, while others operate in all sales channels. Carrefour and Tesco are two notable examples of multichannel approach, while Esselunga and Walmart Asda focus on a very limited number of store formats. In some countries, Carrefour operates hypermarkets, supermar-kets, superettes, discounts, and also cash’n’carries. Indirect trade accounts are sales concessionaires, distributors, wholesalers, and cash’n’carries.
Concessionaires work with an exclusivity granted by the conceding manufacturer, whereby they are the sole distributors of a brand portfolio to a geographic area or a macrosector, especially in out of home. Some of them work “on consignment,” while others own the stock before they resell it to subdistributors or to stores. Usually, they sell with the same list prices and trade terms as decided by the manufacturer and make their profit on the basis of a commission and a period end bonus. In return for the con-cession of trading rights, concessionaires usually commit to product catego-ry exclusivity, minimum purchase quantities, minimum number of visits per period, sales promotions, delivery of POP materials and tools (displays, fridges, and cabinets), customer-service activities, and sharing of secondary sales data. 2In the UK, the first supermarkets were opened between others by J. Sainsbury (Croydon 1950), Tesco (Maldon 1956), Asda (Pontefract 1958), and Morrison’s (Bradford 1961). In France, Edouard Leclerc opened his first supermarket in Landerneau in Brittany in 1949. The first Carrefour store opened in Annecy near a crossroads (carrefour in French) in 1960. In 1961, Gérard Mulliez opened his first store in Roubaix in the "Hauts Champs" district, from which the company Auchan takes its name. In 1963, the first Carrefour hypermarket opened in Sainte-Geneviève-des-Bois, near Paris. In Italy, the first Esselunga supermarket was opened in Milan in 1957.
TRADE STRUCTURE AND ROUTE TO MARKET 11
Distributors work as agents who supply the manufacturers’ goods to retailers. They are normally granted less exclusivity than concessionaires, but are also asked for less demanding agreements. What they tend to have in common with concessionaires is selling with the same list prices and trade terms as decided by the manufacturer.
Wholesalers are entrepreneurs that specialize in a broad category, such as beverages, wine and spirits, homecare, or health and beauty. They devel-op their volumes with the category best-selling items and optimize their margin through the sale of innovations and residuals. Depending on their product mix and customer base, they can be grouped into two types: stock-ists and redistributors. The former act as super wholesalers selling to sub-wholesalers and market stalls, the latter operate with a network of sales reps calling independent stores and modern trade associates that are not bound to exclusivity agreements. Wholesalers provide to manufacturers incremen-tal market penetration, quick new product distribution, volumes, obsolete management, and also a top-up service, especially when they are capable to replenish in less than 12 hours stores that would normally buy with longer lead times from MGD centers or directly from the manufacturers. In the western world, it has become very difficult for wholesalers to survive, espe-cially for stockists. Today, as the business environment is becoming tough-er also for redistributors, it is very common to come across wholesalers that have also developed as specialist retailers with a network of property and franchisee stores, sometimes exceeding 50 percent of their total turnover. This is the first example that we can provide of a hybrid trade account.
If we look at the development of modern trade, we see a number of horizontal and vertical alliances. The former are associations of independ-ent stores into buying groups, and the latter are groupings of retailers and wholesalers into voluntary chains. In both cases, there is a choice to join forces to achieve economies of scale in buying, advertising, and other phas-es of management. However, the opening of distribution centers providing marketing and buying services to their associates very often leads not only to establishing new companies, but also to creating a large sector of new “company owned stores.” As a result, today we find in many countries hybrid trade accounts that supply own stores, associates, independent
12 A GUIDE TO SALES MANAGEMENT
stores, and in some cases also operating cash’n’carries3. Understanding these hybrid customers is key to optimize the choice of route to market. To complete the picture, it must be said that consumers’ cooperatives tend to be more integrated and ultimately more similar to direct trade than hybrid accounts4.
In many geographies, the in home macrosector sooner or later ends up being dominated by direct trade accounts and large hybrid accounts. On the other hand, it is more common for the out of home macrosector to be in the hands of indirect trade accounts and to some degree hybrid accounts, although in the most advanced markets national chains of public houses, quick service restaurants, and hotels tend to be direct trade accounts.
The choice of trade accounts is a very strategic decision. Some FMCG manufacturers, for instance, do not want to sell their brands in discounts or open markets. There are health and beauty companies that restrict the distribution of their products to perfumeries and pharmacies and do not sell to drugstores and supermarkets. Some chocolate manu-facturers sell their products only to bars, confectioners, and bakeries, avoiding MGD. While the selection of direct trade accounts is to some degree a marketing decision, the choice of hybrid and indirect trade accounts is essentially a sales decision: these accounts must be picked very carefully to avoid or at least minimize territorial duplications and unwanted nonstore-based horizontal competition.
The distribution strategy for the launch of a new product is a choice of sales channels and trade accounts and therefore the selection of a RTM. An option could be to launch in every macrosector and in every channel at the same time. An alternative could be to select only one channel in the on-trade sector to test the product potential and build its brand image. Another alternative could be to launch in the out of home
3Important examples of hybrid trade accounts in Europe are Leclerc, Intermarché, and Systeme U in France; Spar, Edeka, and Markant in the D-A-CH area; Gruppo Vegé and Selex in Italy; and the Bijeen group and Superunie in the Netherlands. CBA is a buying group born in Hungary in 1990s that has quickly expanded in many CEE countries. The Metro Group and Rewe operate in the cash’n’carry channel with Metro and Selgros, respectively. 4Coop Group in Switzerland, Coop Italia, Co-operative Group in the UK, FDB Coop in Denmark, KF Coop in Sweden, NKL Coop in Norway, and SOK in Finland are all very important players in their countries.
TRADE STRUCTURE AND ROUTE TO MARKET 13
macrosector first, in order to build credibility and awareness and then to extend the product presence to the in home channels. This is motivated by the circumstance that the extension to MGD of a product that is a proven success in out of home will command lower listing fees and al-low the introduction of multiple or bigger pack sizes. This distribution strategy is very often used in a number of markets like soft drinks, ice creams, confectionery, and savory snacks.
It very likely that a company with a strong brand portfolio will end up choosing to target all potential direct trade accounts, some hybrid accounts, and a very limited number of indirect accounts. However, a company with a limited portfolio might choose to enter a small market only through an exclusive distributor. This, for instance, was the case of some FMCG companies entering former communist countries when they opened to market economy.
Periodically, a trade accounts review is carried out to confirm or re-view the strategic choice of business partners.
Trade account strategies and economics
The selection of trade accounts implies that if we want to develop a long lasting and win–win business relationship with them, we will have to develop a good understanding of their strategy and operations and also an appreciation of their economics and profitability.
Retail strategy
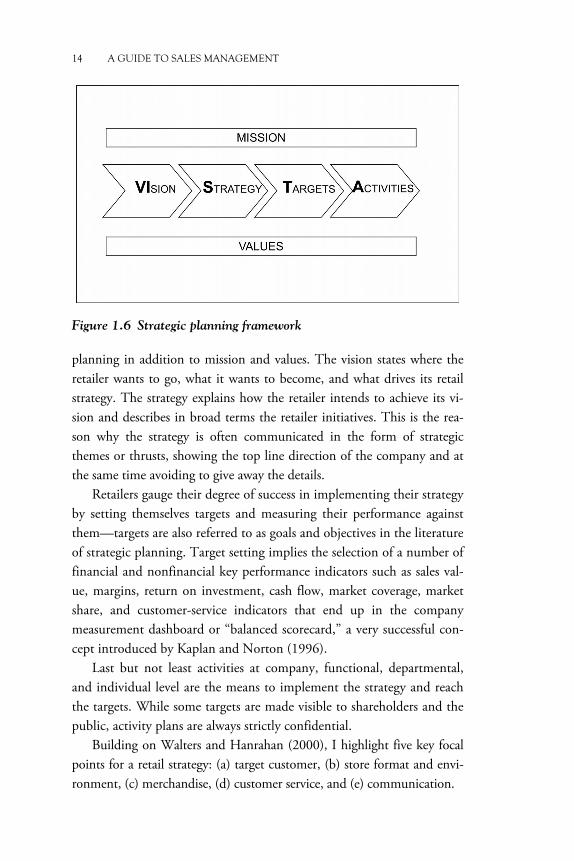
Many retailers do their strategic planning within a framework very similar to that shown in Figure 1.6. They have formalized statements of their mis-sion (what they are, what they do, the products and services they want to sell) and of their supporting core values (what is important to them), that are essential to their activity and corporate communication. Mission and values are sometimes also referred to as purpose and culture, respectively, and are normally in the public domain. This is not always the case for the long-term vision and the strategy that go along with them.
VI. S. T. A. is a very simple acronym that I suggest to remember that vision, strategy, targets, and activities are the key elements of strategic
14 A GUIDE TO SALES MANAGEMENT
Figure 1.6 Strategic planning framework
planning in addition to mission and values. The vision states where the retailer wants to go, what it wants to become, and what drives its retail strategy. The strategy explains how the retailer intends to achieve its vi-sion and describes in broad terms the retailer initiatives. This is the rea-son why the strategy is often communicated in the form of strategic themes or thrusts, showing the top line direction of the company and at the same time avoiding to give away the details.
Retailers gauge their degree of success in implementing their strategy by setting themselves targets and measuring their performance against them—targets are also referred to as goals and objectives in the literature of strategic planning. Target setting implies the selection of a number of financial and nonfinancial key performance indicators such as sales val-ue, margins, return on investment, cash flow, market coverage, market share, and customer-service indicators that end up in the company measurement dashboard or “balanced scorecard,” a very successful con-cept introduced by Kaplan and Norton (1996).
Last but not least activities at company, functional, departmental, and individual level are the means to implement the strategy and reach the targets. While some targets are made visible to shareholders and the public, activity plans are always strictly confidential.
Building on Walters and Hanrahan (2000), I highlight five key focal points for a retail strategy: (a) target customer, (b) store format and envi-ronment, (c) merchandise, (d) customer service, and (e) communication.
TRADE STRUCTURE AND ROUTE TO MARKET 15
The target customer is the desired shopper, described not only in socio-demographic terms, but also in terms of his/her shopping mode and shop-ping mission. For example, in Italy at Ipercoop, the target customers are young families with children, doing their planned grocery shopping on a weekly or fortnightly basis. Most retailers focus not only on the primary target, but also on a secondary target and on loyal customers. Because of the nature of their business, this is a must for the modern grocers.
The store format is defined by the average sales surface, the typical store location, be it high street, urban or suburban, the banner, the ex-ternal and the internal store design and decoration. Every retailer tries to add a touch of uniqueness to its store proposition working on the envi-ronmental details and the overall atmosphere.
Merchandise refers to assortments, promotions, retailer’s own brand development, and visual merchandising. Assortments vary in terms of width (= number of product categories) and depth (= number of items per category). Assortment depth normally implies broader price scales, with many price points being well represented. Another important assortment dimension is the local origin of products, especially in food. Promotions vary in quantity, measurable as percentage of volume sold on deal, but also in quality. Some retailers, for instance, want to be famous for promo-tional mechanics that they try to own by repeating them again and again. Retailer own brands have evolved from copy cats and super value offers to sophisticated brand architectures, which for some key categories are ar-ticulated in at least three price levels, with an entry point at discount price, a standard proposition generally no more than 20 to 25 percent cheaper than the market leader, and a substantially premium proposition. Visual merchandising is the combination of store layout, product presentation, tools and equipment, primary displays, secondary placements, and tempo-rary displays.
Customer service refers both to customer care as attention and assis-tance to customers and to additional and complementary services like parking, petrol station, laundry, travel office, post office, banking and insurance, and quick service restaurants. The loyalty card and the pro-grams connected to it are also customer-service tools.
Communication refers both to the advertisement of the value offered by the retailer in terms of assortment, price, promotions, events, and initiatives and to the retailer’s commitment to corporate social responsibility activities.
16 A GUIDE TO SALES MANAGEMENT
Store format and environment, merchandise, customer service, and communication reinforce each other in a retail mix that is ultimately in-fluencing the shopper choice to include the retailer in his shopping reper-toire. The effective trade account manager develops a deep understanding of his customer’s mission, values, and vision and is able to pin down the essentials of his customer’s retail strategy. This will be the result of asking the right questions during face-to-face meetings, observing the customer’s behavior, checking the customer’s communications to shoppers and shareholders, reading the customer annual reports and trade magazines, visiting the customer stores and specialist websites.
Retail economics
A traditional manufacturer’s point of view is that retailers simply want margin. This is a partial truth that is very influenced by the fact that the question “What do retailers want?” is normally asked to the trade accounts managers that interface the customer’s category buyers. However, any manufacturer who will make an effort to know more than the tip of the iceberg and who will seek to understand his customer’s supply chain, store operations, and financial management in the end will realize that the pic-ture is more complex and that, as stated by Walters and Hanrahan (2000), retailers are always pursuing a combination of profitability, productivity, and cash flow targets.
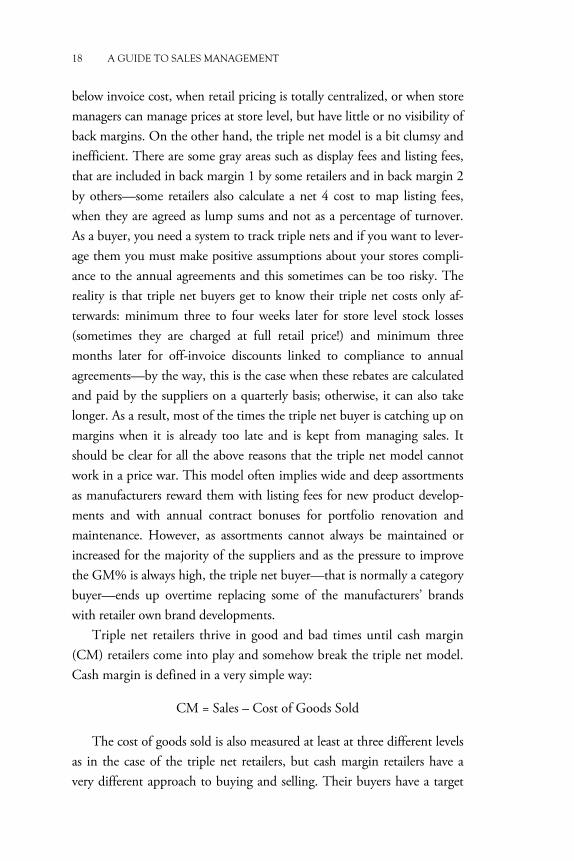
Let us start from the most common measure of trade profitability: gross margin (GM). GM% is defined as the ratio between sales minus cost of goods sold and sales, where all values are taken net of the value-added tax (VAT):
GM% = (Sales – Cost of Goods Sold)/Sales %
As the cost of goods sold can be measured at least at three levels, the GM model is also called the triple net model. The first level of cost cor-responds to the net on-invoice cost, that is, the supplier list price minus all the on-invoice discounts. If we use this level of cost to calculate the GM%, we obtain what is called the front margin (“marge avant” in French). The second level of cost is calculated considering also all the product-related off-invoice discounts, also called product rebates. These
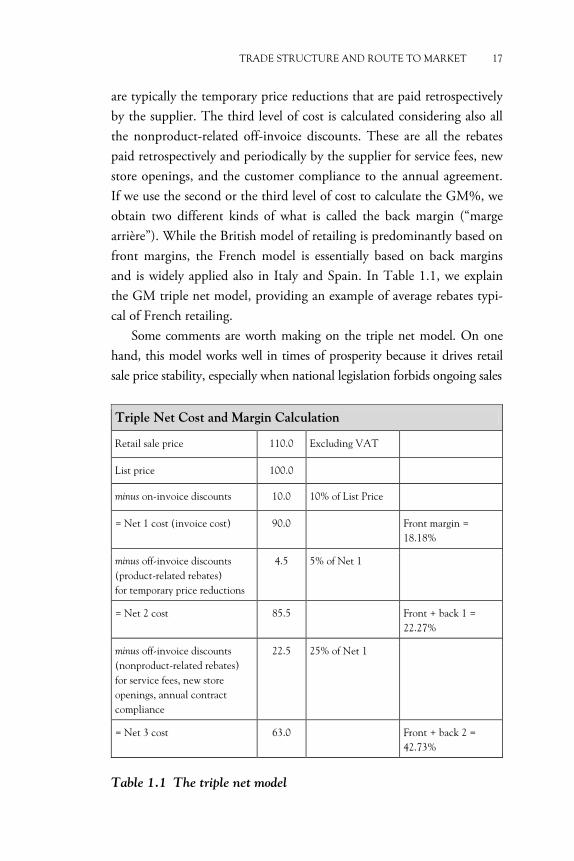
TRADE STRUCTURE AND ROUTE TO MARKET 17
are typically the temporary price reductions that are paid retrospectively by the supplier. The third level of cost is calculated considering also all the nonproduct-related off-invoice discounts. These are all the rebates paid retrospectively and periodically by the supplier for service fees, new store openings, and the customer compliance to the annual agreement. If we use the second or the third level of cost to calculate the GM%, we obtain two different kinds of what is called the back margin (“marge arrière”). While the British model of retailing is predominantly based on front margins, the French model is essentially based on back margins and is widely applied also in Italy and Spain. In Table 1.1, we explain the GM triple net model, providing an example of average rebates typi-cal of French retailing.
Some comments are worth making on the triple net model. On one hand, this model works well in times of prosperity because it drives retail sale price stability, especially when national legislation forbids ongoing sales
Triple Net Cost and Margin Calculation
Retail sale price 110.0 Excluding VAT
List price 100.0
minus on-invoice discounts 10.0 10% of List Price
= Net 1 cost (invoice cost) 90.0 Front margin = 18.18%
minus off-invoice discounts (product-related rebates) for temporary price reductions
4.5 5% of Net 1
= Net 2 cost 85.5 Front + back 1 = 22.27%
minus off-invoice discounts (nonproduct-related rebates) for service fees, new store openings, annual contract compliance
22.5 25% of Net 1
= Net 3 cost 63.0 Front + back 2 = 42.73%
Table 1.1 The triple net model
18 A GUIDE TO SALES MANAGEMENT
below invoice cost, when retail pricing is totally centralized, or when store managers can manage prices at store level, but have little or no visibility of back margins. On the other hand, the triple net model is a bit clumsy and inefficient. There are some gray areas such as display fees and listing fees, that are included in back margin 1 by some retailers and in back margin 2 by others—some retailers also calculate a net 4 cost to map listing fees, when they are agreed as lump sums and not as a percentage of turnover. As a buyer, you need a system to track triple nets and if you want to lever-age them you must make positive assumptions about your stores compli-ance to the annual agreements and this sometimes can be too risky. The reality is that triple net buyers get to know their triple net costs only af-terwards: minimum three to four weeks later for store level stock losses (sometimes they are charged at full retail price!) and minimum three months later for off-invoice discounts linked to compliance to annual agreements—by the way, this is the case when these rebates are calculated and paid by the suppliers on a quarterly basis; otherwise, it can also take longer. As a result, most of the times the triple net buyer is catching up on margins when it is already too late and is kept from managing sales. It should be clear for all the above reasons that the triple net model cannot work in a price war. This model often implies wide and deep assortments as manufacturers reward them with listing fees for new product develop-ments and with annual contract bonuses for portfolio renovation and maintenance. However, as assortments cannot always be maintained or increased for the majority of the suppliers and as the pressure to improve the GM% is always high, the triple net buyer—that is normally a category buyer—ends up overtime replacing some of the manufacturers’ brands with retailer own brand developments.
Triple net retailers thrive in good and bad times until cash margin (CM) retailers come into play and somehow break the triple net model. Cash margin is defined in a very simple way:
CM = Sales – Cost of Goods Sold
The cost of goods sold is also measured at least at three different levels as in the case of the triple net retailers, but cash margin retailers have a very different approach to buying and selling. Their buyers have a target
TRADE STRUCTURE AND ROUTE TO MARKET 19
percentage margin measured at net cost 2 level, but this target is usually well below the category market average, and after its achievement cash becomes the buyer’s focus, because his performance is measured on total cash margin at net 2 cost level. Net 2 and net 3 costs are visible to the stores and percentage margins are substantially capped.
This model is simpler, faster, and easier to run than the triple net model and is typical of everyday low price retailers and discounters of all sorts as opposed to premium and high/low price retailers. Aldi and Tesco are cash margin retailers, but also Carrefour move to a “mass de marge” approach in the first decade of this century can be seen as a shift of paradigm.
Most cash margin retailers are allergic to annual agreements as they need freedom of assortment and promotional plan. When a retailer moves to a cash margin model, it starts to talk about units, as it sees the equiva-lence between units and shopper activations, it looks for brands with elas-tic demand, it favors brand leaders and retail own brands, it starts to pre-fer volume challenges to any other kind of contractual counterpart, and it plans to attack price. In other words, it wants to start a virtuous circle in which lowering shelf prices results in increased unit sales and in turn in increased buying power that allows to get lower costs and to lower shelf prices furthermore. Its motto becomes: “More units, cheaper!”
Another possibility to get away from the triple net model is to bal-ance the GM% measure with an element of productivity as in the gross margin return on inventory (GMROI) model championed by Walmart, where gross margin is calculated in cash terms at net 2 cost and inventory is the net inventory, that is, inventory on hand (gross inventory) minus accounts payable:
GMROI = (Sales – Cost of Goods Sold)/Sales × Sales/Inventory = GM/Inventory
A more sophisticated model can be based on return on net assets (RONA), which is calculated as follows:
RONA = (Gross Margin – Operating Costs)/Investment Capital
In other words, RONA is a measure of operating income on net assets.
20 A GUIDE TO SALES MANAGEMENT
Less used are the trade profitability measures that focus on economic value added—that is, the difference between net operating profit after tax and the weighted average cost of the capital employed—or that consider direct product profitability, as resulting from the difference between gross margin and direct product costs calculated with activity-based costing methodologies.
Trade profitability is of utmost importance for the work of a trade ac-count manager. He must understand the model that his customer is adopting and all its implications and then utilize it in any customer presentation of the economic benefits of new product lines and new pro-motional activities. Furthermore, he will also look for ways to improve trade profitability without margin concession, such as changes to the product portfolio assortment.
Productivity is the second pillar of retail economics and it is the obses-sion of the retailer’s sales function, the store operations department. Produc-tivity can be measured as the ratio between sales or profit and assets as in
Assets Productivity = Sales/Assets or Profit/Assets
or as the ratio between sales or profit and costs as in
Personnel Productivity =Sales/Cost of Labor or Profit/Cost of Labor,
where the cost of labor is very often only the variable cost of direct and outsourced labor. Personnel productivity can also be calculated in terms of sales or profit per full time equivalent employee or per worked hours. Other relevant productivity measures are
Space Productivity = Sales/Sales Area or Profit/Sales Area
and
Inventory Productivity = Stock Turns
Cash flow is the third pillar of retail economics. The total cash flow of a business is the sum of the flows resulting from (a) operating activities, (b) investing activities, and (c) financing activities. The cash flow from operating activities is the combination of cash generated from operations
TRADE STRUCTURE AND ROUTE TO MARKET 21
(cash receipts from customers and cash paid to suppliers and employees), interest received, dividends received, income taxes, depreciation, and amor-tization. The cash flow from investing activities is generated by purchase or sale of assets (equipment, buildings, and securities), loans, and payments related to mergers and acquisitions. The cash flows from financing activi-ties is the combination of proceeds from issuing short- or long-term debt, interest payments, dividends and dividend tax payments, and repurchase of the company's stock. In other words total cash flow reflects the proceeds from operations and changes in the composition (working capital or fixed assets) and the nature (equity or debt) of the capital employed.
A category buyer can improve cash flow increasing gross margins (as he already does to improve trade profitability), buying fewer quantities with higher frequency, and negotiating longer payment terms. As a result, average payment days are often a target for category buyers in conjunction with other trade profitability measures.
Distributor strategy
Any sales concessionaire, distributor, or wholesaler without own stores will adopt a distributor strategy partially similar to a retail strategy. The components of a distributor strategy are: (a) target customer, (b) sales force, (c) merchandise, (d) customer service, and (e) communication.
The target customer of the distributor typically consists of subdis-tributors, subwholesalers, cash’n’carries, and small independent retailers. This is such a variety pack that distributors tend to specialize and end up focusing on a primary target, so that they can be grouped into two types: stockists and redistributors.
The sales force size and quality is very much a consequence of the tar-get customer choice. A super-wholesaler can operate with only a handful of account managers, while a redistributor will call his customers on a regular basis through his network of dozens of agents. Sometimes these are monocard agents, if not even direct employees, and very often there is an opportunity for suppliers to participate in the redistributor’s incentive plan for this personnel.
Merchandise refers to assortments, distributor own brand development, promotions, and some elements of visual merchandising. Distributor’s
22 A GUIDE TO SALES MANAGEMENT
assortments are narrow and tend to be limited to a few noncompeting suppliers or to a restricted number of macrocategories (e.g., wine and spirits), but on the other hand, they are very deep in terms of portfolio completeness or number of items per category. Pricing is either competitive or aggressive. Distributor own brands cover the most relevant market segments and in some cases have reached a level of sophistication very similar to the best examples of retailer own brands. Distributor’s promotions fall into two broad categories: purchase promotions and consumer promotions. In purchase promotions, the promotional advantage tends to end up partially or in full in the pockets of the target customer (e.g., additional free stock with a new line), while in the case of consumer promotions, the advantage is normally transferred in its totality to the end shopper (e.g., on pack instant coupons). Visual merchandising is limited to point of purchase materials, tools, and equipment that in most cases are provided by suppliers.
Customer service is a key to build customer loyalty, and therefore, distributors invest a lot in this area, especially toward their most valuable customers. Service is not only a matter of delivery on time and in full and impeccable administration, but also of very short lead times and very low minimum order quantities, that can justify an order even when some purchase prices are not the most competitive.
Communication refers to the distributor’s marketing and trade market-ing activities, its events and initiatives to increase sales and profitability through customer base expansion and customer loyalty consolidation.
Distributor economics
Distributors are always pursuing a combination of profitability, produc-tivity, and cash flow targets, so that from a qualitative point of view their economics are the same as retailers’. However, there are three very important differences between a distributor and a retailer to be taken into account: (a) fixed assets, (b) personnel cost, and (c) working capital.
A retailer must face many fixed costs for its headquarter, distribution centers, and stores, while a distributor has a lower asset cost base, pays a fixed cost for its headquarter, but can potentially variabilize every other cost, including warehousing, transportation, and sales force.
TRADE STRUCTURE AND ROUTE TO MARKET 23
Retailing is very personnel intensive, and a retailer normally out-sources only shelf replenishment and some warehousing operations, while a distributor needs only a very limited number of employees on its payroll.
A retailer sells for cash and buys with no less than 30 days of credit. This advantage, if combined with frequent purchases and maintenance of assortment efficiency, churning in innovation and deleting the tail, can deliver a negative working capital position. A distributor finds it more difficult to end up in this situation, because its customers never pay with less than a 30-day delay and its suppliers are reluctant to allow more than 30 days of payment term. As a result, a distributor cannot always fund its business operating with negative working capital, and to the contrary, it is sometimes forced to accept longer payment terms from its customers, thus generating a cash flow advantage for them. It is not a surprise within this framework that cash flow problems are the most recurring reason for dis-tributors’ bankruptcy.
Distributors and concessionaires usually sell with the same list prices and trade terms as decided by the manufacturer and make their profit on the basis of commissions and an end period bonus. When this is not the case, they measure their profitability in the same way as wholesalers, whose common profitability measures are GM% (same as retailers) and mark up (MU), defined as the ratio between sales minus cost of goods sold and cost of goods sold, where all values are taken net of VAT:
MU% = (Sales – Cost of Goods Sold)/Cost of Goods Sold %
In both indexes, sales can be measured either at invoice value or net of rebates such as end year bonuses that are paid retrospectively by the distributor to its customers. The cost of goods sold can be measured at least at three levels exactly as we have seen in the case of retailers.
The productivity measures adopted by distributors are focused on stock turns (inventory productivity) and warehousing costs (asset productivity), while the cash flow performance is monitored considering the average pay-ment days for both accounts payable and accounts receivable.
Trade account pre-evaluation model
Let us assume that we have identified the channel architecture of our mar-ket and that we have decided to be present with our portfolio in every
24 A GUIDE TO SALES MANAGEMENT
channel. Let us also assume that we have identified all the trade accounts that can feed those channels and that we know their strategy and their re-quirements. What we need to do next is to select and prioritize for resource allocation the trade accounts that we want to do business with. We can never fully assess customers until we have actually started to work with them, but a pre-evaluation is essential to avoid mistakes in a number of areas such as trade terms and trade marketing investments.
I propose a very simple trade account pre-evaluation model that can be customized and developed into a customer value assessment model to be used as a basis for business planning. It is grounded on the very simple idea to consider on one axis of an XY graph the trade account business oppor-tunity and on the other axis the cost and risk of serving that trade account.
The opportunity axis will reflect the customer size, growth, capabili-ties, retailer own brand development—in reverse as a high level of de-velopment implies less room for maneuver for the manufacturers—and relationship quality, while the cost and risk axis will indicate the ex-pected customer profitability as determined by customer-related costs for sales, marketing, logistics, and finance, as well as the customer buy-ing power and financial risk to serve.
In the opportunity axis, growth is the combination of actual midterm growth measured with the compound annual growth rate of the last three years and of the potential growth linked to new store openings and store format developments. Capabilities are both demand side capabilities such as in-store execution, shopper marketing, and loyalty programs, and sup-ply side and IT capabilities such as warehousing, distribution, automated store ordering, and degree of usage of electronic data interchange. Rela-tionship quality considers the ease of contact, the number of touch points and the customer speed of response. If we are comparing only retailers we can also include in the relationship dimension their degree of centraliza-tion and level of store discipline.
In the cost and risk axis, sales costs are all the contractual and discre-tionary trade terms, as well as all the sales administration costs, marketing costs are those incurred for POP materials, trade advertising, and comar-keting activities, while logistic and financial costs are all those customer-related costs that are not already reflected in trade terms, such as the cost of pallet interposition between product layers, pallet detopping, pallet
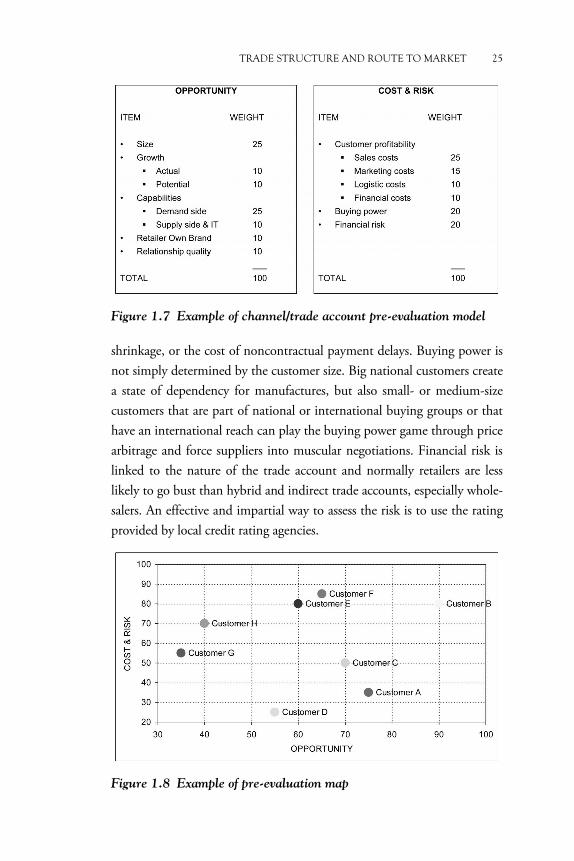
TRADE STRUCTURE AND ROUTE TO MARKET 25
Figure 1.7 Example of channel/trade account pre-evaluation model
shrinkage, or the cost of noncontractual payment delays. Buying power is not simply determined by the customer size. Big national customers create a state of dependency for manufactures, but also small- or medium-size customers that are part of national or international buying groups or that have an international reach can play the buying power game through price arbitrage and force suppliers into muscular negotiations. Financial risk is linked to the nature of the trade account and normally retailers are less likely to go bust than hybrid and indirect trade accounts, especially whole-salers. An effective and impartial way to assess the risk is to use the rating provided by local credit rating agencies.
Figure 1.8 Example of pre-evaluation map
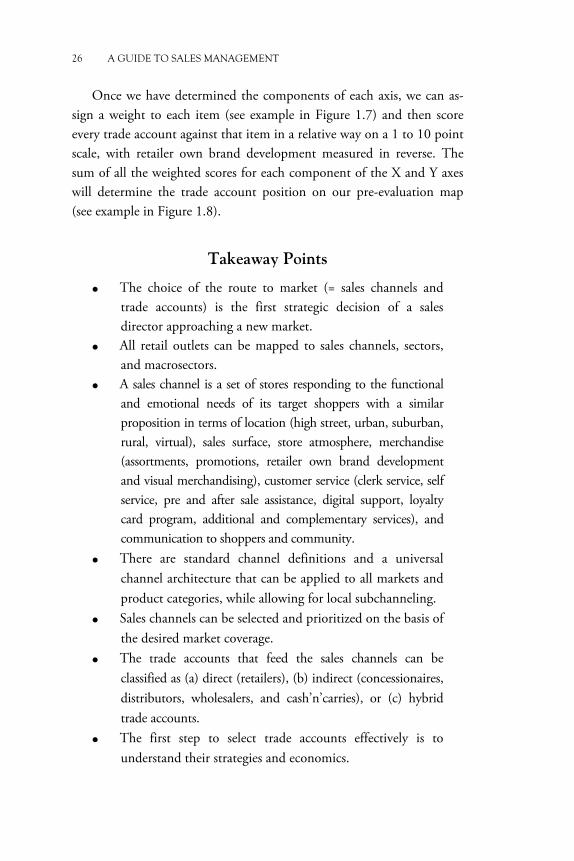
26 A GUIDE TO SALES MANAGEMENT
Once we have determined the components of each axis, we can as-sign a weight to each item (see example in Figure 1.7) and then score every trade account against that item in a relative way on a 1 to 10 point scale, with retailer own brand development measured in reverse. The sum of all the weighted scores for each component of the X and Y axes will determine the trade account position on our pre-evaluation map (see example in Figure 1.8).
Takeaway Points
• The choice of the route to market (= sales channels and trade accounts) is the first strategic decision of a sales director approaching a new market.
• All retail outlets can be mapped to sales channels, sectors, and macrosectors.
• A sales channel is a set of stores responding to the functional and emotional needs of its target shoppers with a similar proposition in terms of location (high street, urban, suburban, rural, virtual), sales surface, store atmosphere, merchandise (assortments, promotions, retailer own brand development and visual merchandising), customer service (clerk service, self service, pre and after sale assistance, digital support, loyalty card program, additional and complementary services), and communication to shoppers and community.
• There are standard channel definitions and a universal channel architecture that can be applied to all markets and product categories, while allowing for local subchanneling.
• Sales channels can be selected and prioritized on the basis of the desired market coverage.
• The trade accounts that feed the sales channels can be classified as (a) direct (retailers), (b) indirect (concessionaires, distributors, wholesalers, and cash’n’carries), or (c) hybrid trade accounts.
• The first step to select trade accounts effectively is to understand their strategies and economics.
TRADE STRUCTURE AND ROUTE TO MARKET 27
• Trade accounts must be selected and prioritized minimizing duplications and unwanted nonstore-based horizontal competition.
• A simple trade account pre-evaluation model can be based on a standardized measurement of the business opportunity and of the cost and risk associated to each account.

CHAPTER 2
The Sales Strategy
Definitions of corporate strategy: a mini tour
Strategy is a word of military origin and refers to the command of an army. The literature on corporate strategy has expanded rapidly from the 1960s introducing progressively new kinds of strategy definitions.
Alfred Chandler (1962) provided the first classic definition of corpo-rate strategy stating that strategy is “the determination of the basic long-term goals of an enterprise, and the adoption of courses of action and the allocation of resources necessary for carrying out these goals.”
Igor Ansoff (1965) was the first author to dedicate a book to corporate strategy. He believed that strategy development was about anticipating the future challenges posed to an organization by its external environment, and preparing strategic plans for responding to these challenges. He built a systematic approach to strategy formulation including tools like the gap analysis to understand the gap between where a company is and where it would like to be and then develop “gap reducing actions,” and the product–market growth matrix to map out generic strategies to grow a business with existing or new products, in existing or new markets: market penetration (existing product in existing market), market development (existing product in new market), product development (new product in existing market), and diversification (new product in new market). Market penetration is the low-growth and low-risk generic strategy, while diversification is the high-growth and high-risk generic strategy, requiring not only more analytical and planning effort, but also breaking with “past patterns and traditions” and developing new skills and techniques for “uncharted paths.”
Kenneth Andrews is the third author that must be credited for the in-troduction of the concept of corporate strategy. He wrote the text part of the groundbreaking book Business Policy: Text and Cases—see Learned, Christensen, and Andrews (1965)—that was eventually republished as
30 A GUIDE TO SALES MANAGEMENT
The Concept of Corporate Strategy. He presented a very rich and modern definition of corporate strategy:
Corporate strategy is the pattern of decisions in a company that de-termines and reveals its objectives, purposes, or goals, produces the principal policies and plans for achieving those goals, and defines the range of business the company is to pursue, the kind of eco-nomic and human organization it is or intends to be, and the na-ture of the economic and non-economic contribution it intends to make to its shareholders, employees, customers, and communities.
This definition introduced the concept of strategy as a pattern main-taining the focus on goals, policies, and plans, and anticipated the corpo-rate social responsibility theme. Andrews suggested that an explicit strate-gy should be formalized and adopted by the company’s leadership team, starting from an assessment of the market opportunities and threats and of the company’s strengths and weaknesses. In his view, an explicit strategy is a matter of duty and responsibility of the top managers toward their em-ployees (who must be told what their leaders intend to do), toward their shareholders (who must be reassured that the company’s purposes are worth pursuing in terms of profit outcomes), and toward society (that must be reassured that the company’s purposes are socially responsible).
Michael Porter (1980) made the competitive component of corporate strategy more explicit than it had ever been before. He identified the five forces that shape competition and require a deep analysis in strategic plan-ning (actual competitors, potential competitors, substitutes, suppliers, and customers) and the three broad generic strategies that a company can adopt to compete: (a) industrywide cost leadership (b) industrywide differentia-tion, and (c) focus on a particular market segment through cost leadership, differentiation, or a combination of the two. A company with a cost leader-ship strategy aims to be the low cost producer in its industry, a strategy via-ble for market leaders that can benefit from a cost advantage because of their size. A company with a differentiation strategy builds the uniqueness of its products or services through branding, design, technology, special features, customer service, or distribution channels. A company with a focus strategy concentrates its efforts on a product segment (variety-based positioning:
THE SALES STRATEGY 31
serving few needs of many customers), on a set of target buyers (needs-based positioning: serving broad needs of few customers), or on a geographic terri-tory (access-based positioning: serving broad needs of many customers in a narrow market).
Porter (1996) defined strategy as “the creation of a unique and valua-ble position, involving a different set of activities… making trade-offs in competing . . . creating fit among a company’s activities.” In other words, the selection of a strategic position essentially means: (a) choosing activi-ties that are different from rivals, (b) choosing what not to do, and (c) combining activities so that they reinforce one another. Porter essen-tially suggested to conduct a rational analysis, decide on the competitive position that a company wishes to occupy, develop the strategy to get there, and then execute. I believe that it is fair to say that he embraced competitive strategy both as a position and as a plan. In his writings, the dynamic aspect prevails over the static aspect of strategic positioning. In his introduction to “Competitive Strategy,” he noted that “a strategic po-sition is a path, not a fixed location” and in a way it can be argued that his concept of strategy as choice of a strategic position implies a dynamic plan to achieve, maintain, and develop the desired strategic position.
So far, we have analyzed the point of view of authors that conceive strategy as a deliberate choice and as the formulation of a high-level course of action to achieve an intended set of goals, allocating resources to execute actions under conditions of uncertainty about actual and potential competitors, customers, and suppliers: a strategy is designed starting from an analysis of the competitive environment and describes its goals and how they will be achieved by its means (resources, policies, and actions). Henry Mintzberg (1978) was not satisfied by this view of strategy as a plan and defined strategy as “a pattern in a stream of decisions.” He noted that strategy can either be intended or emerge as a pattern of activity (actions and behaviors at various organizational levels) as a company adapts to its environment to compete. When the realized pattern is differ-ent from the original intent, we can refer to the strategy as emergent. In his view, strategy as a plan is an “intended strategy,” while a “realized strategy,” that can coincide with an intended strategy or alternatively re-sult from an emerging strategy, can be considered to have formed when a sequence of a company’s decisions shows a consistency over time. There-

32 A GUIDE TO SALES MANAGEMENT
fore, strategy formation does not necessarily correspond to strategy formu-lation: a strategy may be formulated a priori through a conscious process before making any specific decision, or it may form gradually, even unin-tentionally and a posteriori as the decisions that are made one by one show behavioral consistency.
Mintzberg et al. (1998) identified five kinds of strategy definition add-ing perspective and ploy to plan, position, and pattern. Strategy as a perspec-tive is an “organization’s fundamental way of doing things,” while strategy as a ploy identifies maneuvring and tactics to outwit competitors. For Mintzberg et al., each of these five definitions is important, but none of them grasps the whole. Each is partly in the right and all are in the wrong as they focus on different aspects of strategy formation: they should all be considered together to define strategy and understand strategy formation.
Max McKeown (2011) developed an integrated approach to strategy combining what he identified as its analytical side (understanding what you are and what your competitors are) and creative side (identifying what you want to achieve and how). He suggested that strategy is not only about get-ting to “desirable ends with available means,” but also about “shaping the future,” and noted that “to shape the future requires a combination of thinking, planning, and reacting to events that emerge along the way.” In his view, the analytical and creative approaches must coexist and the use of their tools in strategy formation must be balanced depending on the level of market stability (more analytics) or market dynamism (more creativity).
Richard Rumelt (2011) underlined that “the core of strategy work is . . . discovering the critical factors in a situation and designing a way of coordinating and focusing actions to deal with those factors.” In his view, strategy is a “cohesive response to a challenge,” “a coherent set of analyses, policies, arguments, and actions that respond to a high-stakes challenge,” a type of problem solving, with trade-offs among various elements that must be arranged, adjusted, and coordinated. The underlying structure of a good strategy is a “kernel” composed by: (a) a diagnosis that defines or explains the nature of the challenge, (b) a guiding policy for dealing with the chal-lenge, and (c) coherent actions designed to carry out the guiding policy.
A sales director may be or may not be aware of this debate about the definition of strategy. Nevertheless, as a member of her company’s leader-ship team she will be involved in formulating and reviewing her company’s business strategy, that more often than not will look like a strategic plan or
THE SALES STRATEGY 33
the selection of a strategic position. Mintzberg et al. (1998) noted that “or-ganizations develop plans for the future and also evolve patterns out of their past” and there is no reason why a fine tuning, if not a review of a company’s business strategy should not take place every year. It is hard to conceive a strategy that is so perfect that it never needs to be corrected, re-visited, or reformulated during its implementation. At the end of the day, concepts of strategy as learning, adapting to change, and problem solving are not inconsistent with an approach based on strategic planning. We must simply acknowledge that strategic planning is static and about strate-gy formulation, while learning and adopting a pattern of behavior is dy-namic and about strategy formation.
Some sales directors might be better off than others, if their companies have developed a very clear and well understood “strategic principle.” Gadiesh and Gilbert (2001) defined as strategic principle “a memorable and actionable phrase that distils a company corporate strategy into its unique essence and communicates it throughout the organization.” For instance, Walmart’s strategic principle is “Low prices, every day.” There are food companies that define their strategic product range with a strate-gic principle: “Nutrition, health, and wellness” is broader than “100% health driven” and very different from “Small delicious moments.” A stra-tegic principle is strategy distilled in a phrase “to drive consistent strategic action”: it works as a filter “to test the strategic soundness of any particular action,” “it forces trade-offs between competing resource demands,” and “it sets clear boundaries within which employees can operate.”
Sales strategy: definition, responsibility, and sources
The sales strategy is a component of a company’s business strategy, in the same way as the marketing strategy, the supply chain strategy, the finance strategy, the IT strategy, and the human resource strategy. It is the choice of what you want to sell, where, and how, and therefore the set of decisions that you make about your route to market, your product portfolio, your organizational infrastructure, and your sales policies. It is an allocation and alignment of human, financial, and material resources to deliver the company vision. It is the functional high-level plan to achieve a number of strategic goals with limited resources.
34 A GUIDE TO SALES MANAGEMENT
The sales strategy is a formal document written by the sales leader and submitted to the company CEO and board of directors. Once approved it becomes a brief to the sales team: a set of themes, actions, guidelines. The mark of a good sales strategy is that it defines the challenge (critical fac-tors) and identifies solutions (resource allocation and actions) as Rumelt (2011) would say. The sales strategy has a life cycle of growth, maturity, and decline, and depending on where her strategy is on this cycle the sales director will have to make minor adjustments, introduce new initiatives, or embrace radical changes during her annual strategic review.
The sales director has five sources for the definition of her sales strategy: (a) market analysis for the choice of the route to market, (b) customers’ strategies, (c) customer-satisfaction surveys, (d) assessment of the sales organization capabilities, and (e) company’s corporate strategy.
Market analysis: trade environment scan
I suggest in Chapter 1 to carry out a scan of the trade environment with the objective to select a combination of sales channels and trade ac-counts that I call route to market (RTM) and that is the path to reach out to the target shoppers. This decision is the first strategic choice of a newly appointed sales director.
I recommend to start from the stores and map them to sales chan-nels, sectors, and macrosectors. As a second step, I suggest to understand the trade accounts that feed the channels in terms of their type, strategy, and economics. Finally, I advise to select and prioritize channels and trade accounts with a structured process in order to define the route to market. This exercise will also have an impact on the choice of some of the strategic goals and actions of our sales strategy, as, for instance, we might decide to prioritize investments in a channel or in a specific cus-tomer. Therefore, the scan of the trade environment is the first key source for the definition of the sales strategy.
Responding to customers’ strategies
Customers’ strategies are the second source of the sales strategy. Following our initial scan of the trade environment and its periodical updates, we
THE SALES STRATEGY 35
will have mapped our customers by opportunity and cost and risk and grouped them into some strategic clusters. It is very likely that we will have ended up with a bundle of very attractive customers (high oppor-tunity and high cost and risk), a number of valuable customers (mid-opportunity at variable cost and risk), and a tail of declining customers (low opportunity, regardless of cost and risk). There will also be a group of emerging customers who despite their relative small size are beating out every other customer for their growth rate.
The sales leader will focus on very attractive and emerging customers, understand their strategies, foresee their activities, and suggest to her company strategic actions to respond to, mirror, support, or contrast customer initiatives. This is true for every aspect of their retail strategies, including the launch of new store formats; the development of existing ones; supply chain improvements; and any change of merchandise, customer-service approach, and shopper communication. I will give more details about a recommended process to analyze customer strategies when I discuss customer business planning in Chapter 6.
Customer-satisfaction surveys as a strategic input and a monitoring tool
Customer-satisfaction surveys are the third source of the sales strategy. Manufactures appoint specialized agencies to interview a panel of their customers and assess their level of satisfaction, while retailers tend to fo-cus directly on their shoppers to evaluate their customer experience with different techniques, including mystery shopping.
Agency researchers normally begin customer interviews with broad preliminary questions about their vision of the category in terms of market development, growth potential and drivers, segmentation, and best performers—both manufacturers and retailers. Then, they submit a structured questionnaire that typically aims at exploring four key domains: (a) strategic area, (b) business development area, (c) operational area (logistics, customer service, and administration), and (d) customer interface area. For every subject area, there will be a number of items to consider. Customers will be asked to rate the performance of the company for each item (typically on a 1 to 4 scale) and then to rank the items in terms of their relative importance for them.
36 A GUIDE TO SALES MANAGEMENT
Items for the assessment of the strategic area will include market and consumer needs knowledge, communication of the company strategy, un-derstanding and adapting to customer strategy, trade terms clarity, brand strength, brand trade profitability, category management capabilities, ability to increase category size and profitability, and overall marketing program.
The business development area will explore product and primary packaging quality, new product development, product launch capabilities, product range optimization, promotion development, in-store execution, customer and shopper marketing capabilities, and advertising support.
Items for the analysis of the operational area will include lead times between order and delivery, order completeness, on-time deliveries, sec-ondary packaging and labeling, invoice accuracy, sales forecasting and stock optimization, customer care, and after sale support.
The customer interface area will consider the behaviors of the ac-count manager—demonstrating sense of urgency, meeting deadlines, giving accurate information about product attribute changes, helping in achieving commercial objectives—his empowerment to make decisions, the handling of administrative complaints, and the multifunctional con-tacts between the companies.
Interviewees will usually be category buyers and supply chain man-agers of the most important customers by turnover, or of recognized trade opinion leaders. A panel of as little as eight customers might be enough to collect good information, but it is better to target at least 12 customers to avoid the distortions generated by those that are positively biased and tend to adhere to the initiative first. In fragmented markets, it might even be necessary to increase the number to 20 customers to guarantee a significant coverage.
Some surveys are not company specific, but are run on a syndicated basis and are funded by a pool of competing companies. I believe that these studies are a valid option because they provide not only a feedback on our company’s performance, but also a benchmark—our competitors’ evaluation—that more than compensate for the depth of analysis that would be achieved through customization and ad hoc commissioning.
The results of the survey help the sales leader to identify some strate-gic actions, if not even some tailor-made activities to be included in her sales strategy.
THE SALES STRATEGY 37
In terms of balancing costs and benefits, I do not believe that it makes sense to run a customer-satisfaction survey more frequently than every sec-ond year, unless the company is undergoing a major transformation. How-ever, there is great value in repeating customer-satisfaction surveys at regular intervals, as they become a monitoring tool of our company progress.
Organization capabilities assessment and capability building program
The fourth source of the sales strategy is an assessment of our organiza-tion capabilities to do what we intend do. We must ask ourselves if we have an effective organization, a performance culture, lean and effective processes and subprocesses, and adequate IT tools. I suggest some areas that are worth investigating (the list is by no means exhaustive):
• Business planning. The capability to plan by category and by customer with a structured process.
• Sales and operations planning. The capability to plan across a rolling horizon (at least 18 months) with a clear process, taking into account sales and marketing ambitions, supply possibilities, customer needs, and financial goals, and balancing them to create a single, achievable plan.
• Customer and shopper marketing. The capability to generate actionable customer and shopper insights.
• Assortment and space optimization in category management. The capability to identify the optimal range of each category by customer and store format on the basis of volume, growth, and profitability, and to determine its optimal space allocation in store.
• Pricing. The capability of setting, getting, and tracking retail prices.
• Trade terms. The capability to design and implement an effective trade terms structure.
• Promotion optimization in category management. The capability to pre- and post-evaluate promotions with a consistent process and a tool that assesses their impact on sell out and their return on investment, generating learnings and insights.
38 A GUIDE TO SALES MANAGEMENT
• Customer service. Excellence in the order to cash process and capability to improve on-shelf availability.
• In-store execution. The capability to improve the efficiency and effectiveness of field sales store visits to track in-store performance, and rapidly resolve issues.
• Organization and performance culture. Clarity of roles, respon-sibilities, and decision-making process, quality of internal communication, result-oriented mindset, and behaviors.
If you normally run a customer-satisfaction survey, you probably already know what your customers think about your performance in most of these areas and do not need to do any additional work. However, it might be worth investigating also the perception of your sales team (if not of your company) personnel through an internal survey. This can take the form of a structured online questionnaire and it can be complemented by interviews to key stakeholders and opinion leaders. The results provide the sales leader with a platform to identify priorities for improvement and to formalize strategic actions for inclusion in her sales strategy.
Corporate strategy: vision, strategic themes, and goals
In our mini tour of the definitions of strategy, I indicated that corporate strategy can be defined as a plan to achieve goals under uncertainty and with limited resources. Strategy is one of the key components of the stra-tegic planning framework presented in Chapter 1 with the acronym VI.S.T.A to underline that vision, strategy, targets, and activities are the key elements of strategic planning in addition to company mission and values (also referred to as purpose and culture, respectively). This ap-proach is consistent with Vladimir Kvint’s (2009) view that a formal strat-egy “consists of a . . . forecast, mission statement, vision, and long-term objectives and goals with a particular scenario to be implemented via the strategic plan with a strategic system to monitor its implementation.”
The vision states where the company wants to go, its ambition, and what it wants to become. The strategy explains how the company intends to achieve its vision and it describes in general terms the company strategic initiatives. These broad statements are strategic themes (also referred to as
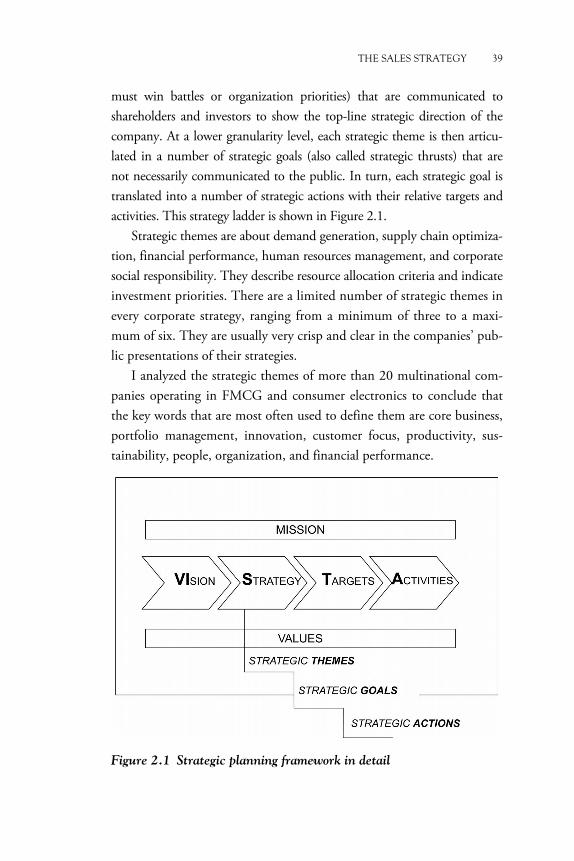
THE SALES STRATEGY 39
must win battles or organization priorities) that are communicated to shareholders and investors to show the top-line strategic direction of the company. At a lower granularity level, each strategic theme is then articu-lated in a number of strategic goals (also called strategic thrusts) that are not necessarily communicated to the public. In turn, each strategic goal is translated into a number of strategic actions with their relative targets and activities. This strategy ladder is shown in Figure 2.1.
Strategic themes are about demand generation, supply chain optimiza-tion, financial performance, human resources management, and corporate social responsibility. They describe resource allocation criteria and indicate investment priorities. There are a limited number of strategic themes in every corporate strategy, ranging from a minimum of three to a maxi-mum of six. They are usually very crisp and clear in the companies’ pub-lic presentations of their strategies.
I analyzed the strategic themes of more than 20 multinational com-panies operating in FMCG and consumer electronics to conclude that the key words that are most often used to define them are core business, portfolio management, innovation, customer focus, productivity, sus-tainability, people, organization, and financial performance.
Figure 2.1 Strategic planning framework in detail
40 A GUIDE TO SALES MANAGEMENT
The most recurrent strategic themes are variations of the following concepts: (a) strengthening the core business, (b) managing the company’s product portfolio, (c) winning through innovation and the development of core competences, (d) expanding the company’s business in new geog-raphies (regions, countries, and emerging markets) or in new coun-try/category combinations (“white spaces”), (e) expanding (or developing) the company’s activity in new business areas (e.g., B2C or B2B), new macrosectors (in home/out of home), sectors or channels (e.g., specialized stores, drugstores, and discounts), (f ) engaging with key customers and developing joint initiatives and business plans, (g) improving productivity through operational excellence, (h) embedding and integrating sustaina-bility, (i) developing people and capabilities, simplifying (harmonizing and restructuring) the organization and shaping a performance culture, and (j) delivering long-term superior profitability and shareholder equity.
Strengthening the core business is a very comprehensive strategic theme that sometimes includes some of the other themes in my list. It is often interpreted as prioritizing resources on the largest and most profit-able categories, on the most promising innovations, and on key markets.
Managing the product portfolio is based on segmenting the compa-ny’s categories or brands in three or more groups that will benefit from different levels of investment in return for different requirements of sales growth and profitability. In other words, the company will decide where to over invest, under invest, or divest on the basis of expected returns. This segmentation also drives decisions to acquire or to dismiss catego-ries or brands. The best-known tools for portfolio analysis are: (a) the Boston Consulting Group matrix that uses growth and relative market share data to identify star, question mark, cash cow and dog products, categories or businesses, and (b) the McKinsey matrix/GE business screen that uses the level of an industry (or market) attractiveness and a company’s relative strength in that industry to attribute to products, categories, or businesses a build, hold, harvest, or divest strategic role.
The innovation theme is usually product (brand) focused or process focused. True product innovation is very disruptive and creates a discon-tinuity in the marketplace. Alternatively, brands are improved through renovation, extended across price tiers entering value, premium or super premium segments, or stretched to adjacent categories. Process-focused
THE SALES STRATEGY 41
innovation prioritizes the development of marketing and sales capabilities such as brand activation, digital marketing, speed to market, in-store exe-cution, and media management.
Improving productivity through operational excellence links not only to focusing on cost efficiency and global sourcing, but also to standardizing processes, extending shared services, and adopting common IT solutions with a regional or global scope to deliver a more competitive cost structure. Productivity gains are often achieved through continuous improvement programs focused on the supply side, on the demand side, or on end-to-end optimization. This strategic theme is frequently combined with notions of fitness to compete, speed, agility, responsiveness, and simplification. It sometimes changes from a corporate strategy to another only in terms of the use of the expected savings: reinvestment in the business in quality and in-novation, distribution to shareholders, or a combination of the two.
Sustainability has become a must-have strategic theme to the point that many companies issue specific sustainability and social responsibility (citizenship) reports to communicate their programs and their progress. The most recurring components of the sustainability theme are: (a) limiting wa-ter consumption, (b) reducing the company’s carbon footprint, (c) reducing waste (e.g., less packaging), minimizing the company’s amount of waste that goes to landfill utilizing recyclable materials and transforming waste into a resource recycling materials, (d) focusing on health and safety, (e) promot-ing sustainable agriculture that respects natural ecosystems, produces healthy food and is competitive, and (f ) introducing forms of smart work-ing/agile working with benefits for the environment, the company and its personnel. Companies aim to embed and integrate sustainability in their way of working and to turn their specific sustainability activities into com-petitive advantages.
The people, organization, and culture theme includes talent management, training, capability development, consumer, shopper, and customer focus, fast decision making, best practice sharing, centralization of functions, best in class services, infrastructure development, organization restructuring both in terms of geographies (regions, clusters of countries) and divisions or business units, performance culture, and reduction of the cost of doing business.
A strategic theme can have a functional flavor, but normally, it is in-tended as multifunctional. It can be predominantly directed to a function,
42 A GUIDE TO SALES MANAGEMENT
but it is very seldom exclusive to that function; otherwise, the company would work in silos with each function focusing only on one strategic theme. This point becomes very clear when we analyze the strategic goals that substantiate well-crafted strategic themes.
Strategic themes are not static and evolve over time reflecting a com-pany’s environment, its achievements, and also its changes of leadership and vision. I use a multinational FMCG company as an example to illus-trate this point. In the first decade of this century, this company decided to simplify its organizational structure with a major transformation: it centralized its brand development activities at regional level (Europe, Americas, and Asia and rest of the world) and it grouped in every country all its businesses into integrated subsidiaries focused on brand activation. At that time, the strategic themes of this company’s strategy were focused on the concepts of winning key markets, creating power brands, winning with customers, changing into fit to compete, and becoming lively and dynamic. Once the transition was completed and the number of brands was reduced through migrations and disposals, the company’s leadership team identified a new opportunity for growth in the grouping of countries into geographical clusters such as DACH (Deutschland, Austria, and Confederatio Helvetica), BENELUX (Belgium, the Netherlands, and Luxembourg), etc., and in the further centralization at global level of all regional functions—not only brand development. A new business strategy document was introduced to set out a path for the company’s long-term growth. This new scheme included four strategic themes centered on winning with brands and innovations, winning in the marketplace, win-ning through continuous improvement, and winning with people. If we compare the two strategies we can notice some continuity in the focus on power brands and customers, an evolution in the shift from a theme of business fitness to one of continuous improvement, and also some discon-tinuity in the new emphasis on innovation and people.
Strategic themes are the “what” of the business strategy and must be articulated in strategic goals as a first step to determine and shape the “how” of the strategy. There are a limited number of strategic goals in every strategic theme, ranging from a minimum of three to a maximum of five. As the strategic themes range from three to six, the total number of strategic goals in a corporate strategy varies from nine to 30.
THE SALES STRATEGY 43
The FMCG company in our example expressed the strategic theme of winning with customers through the strategic goals of (a) optimizing trade investments, (b) building brands through customers, (c) develop-ing outstanding customer service, (d) winning in store, and (e) building world class sales capabilities and organizations. When the winning with customer theme evolved into the winning in the market place theme in the new strategy, it was expressed by new strategic goals: (a) becoming an end-to-end execution powerhouse, (b) leading market development through brand extension, and (c) developing key channels.
Although the winning with customers theme may appear as mostly di-rected to the sales function, a careful analysis of its strategic goals shows that other company functions are heavily involved in delivering its es-sence: optimizing trade investments links to finance, building brand through customers links to consumer and shopper marketing, developing outstanding customer service links to supply chain, winning in-store links to shopper marketing, and building world class sales capabilities and or-ganizations links to human resources. The same is true for the winning in the marketplace theme, as none of its strategic goals is exclusive to the sales function, not even developing key channels, where the support of the marketing and supply chain functions is essential.
The definition of the sales strategy: strategic actions, targets, and activities
The sales strategy will look like a set of strategic goals detailed in terms of strategic actions, targets, and activities.
As a first step, the sales director will develop some strategic actions building on her insights following the trade environment scan, the analy-sis of customers’ strategies, the results of the customer-satisfaction survey, and the capability assessment of her sales organization. Then, she will have to work out strategic actions to deliver the strategic goals that are part of the corporate strategy and link to the sales function. Finally, she will align and harmonize all the strategic actions and map them to the strategic goals, prepare a document, and present it to the company board of direc-tors for approval. On one hand, she will translate corporate strategic goals into strategic actions, whose responsibility rests with sales, and on the oth-er hand, she will use the other sources of the sales strategy as an input to craft strategic actions that fit with corporate strategic themes and goals. In
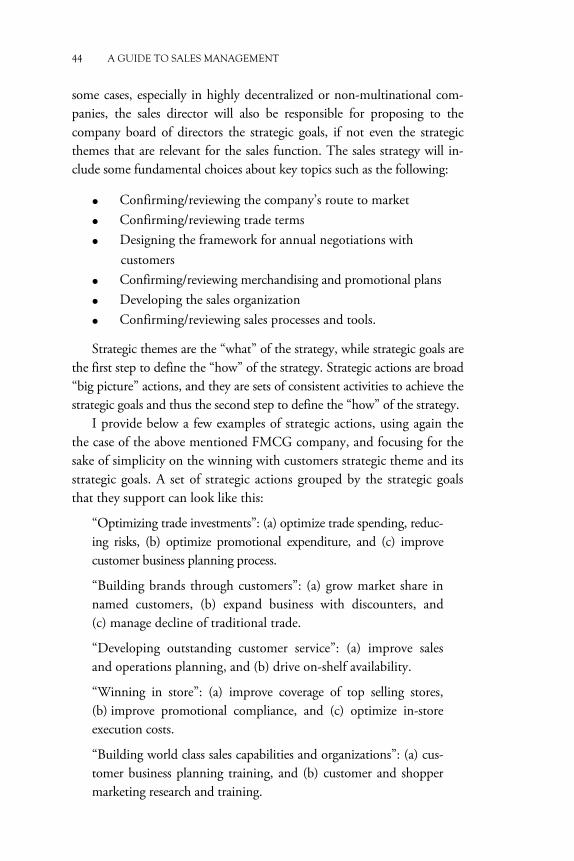
44 A GUIDE TO SALES MANAGEMENT
some cases, especially in highly decentralized or non-multinational com-panies, the sales director will also be responsible for proposing to the company board of directors the strategic goals, if not even the strategic themes that are relevant for the sales function. The sales strategy will in-clude some fundamental choices about key topics such as the following:
• Confirming/reviewing the company’s route to market • Confirming/reviewing trade terms • Designing the framework for annual negotiations with
customers • Confirming/reviewing merchandising and promotional plans • Developing the sales organization • Confirming/reviewing sales processes and tools.
Strategic themes are the “what” of the strategy, while strategic goals are the first step to define the “how” of the strategy. Strategic actions are broad “big picture” actions, and they are sets of consistent activities to achieve the strategic goals and thus the second step to define the “how” of the strategy.
I provide below a few examples of strategic actions, using again the the case of the above mentioned FMCG company, and focusing for the sake of simplicity on the winning with customers strategic theme and its strategic goals. A set of strategic actions grouped by the strategic goals that they support can look like this:
“Optimizing trade investments”: (a) optimize trade spending, reduc-ing risks, (b) optimize promotional expenditure, and (c) improve customer business planning process.
“Building brands through customers”: (a) grow market share in named customers, (b) expand business with discounters, and (c) manage decline of traditional trade.
“Developing outstanding customer service”: (a) improve sales and operations planning, and (b) drive on-shelf availability.
“Winning in store”: (a) improve coverage of top selling stores, (b) improve promotional compliance, and (c) optimize in-store execution costs.
“Building world class sales capabilities and organizations”: (a) cus-tomer business planning training, and (b) customer and shopper marketing research and training.
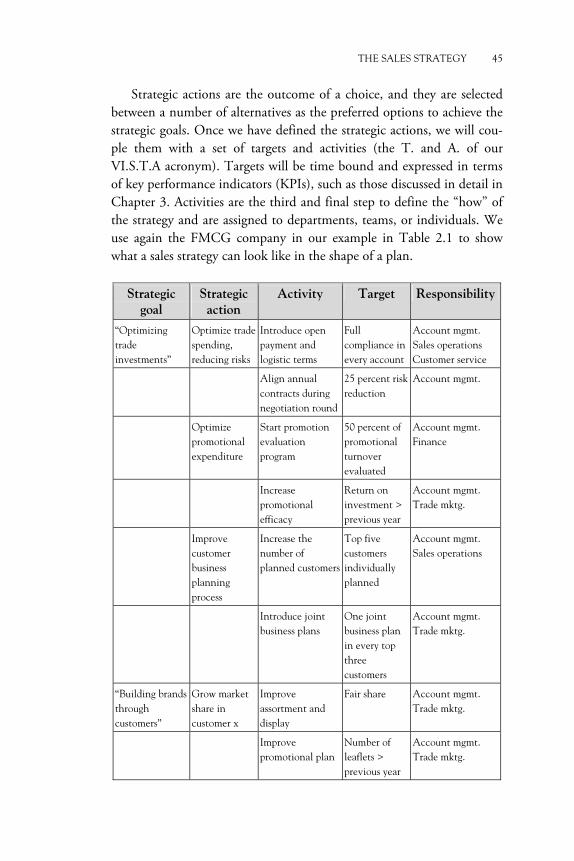
THE SALES STRATEGY 45
Strategic actions are the outcome of a choice, and they are selected between a number of alternatives as the preferred options to achieve the strategic goals. Once we have defined the strategic actions, we will cou-ple them with a set of targets and activities (the T. and A. of our VI.S.T.A acronym). Targets will be time bound and expressed in terms of key performance indicators (KPIs), such as those discussed in detail in Chapter 3. Activities are the third and final step to define the “how” of the strategy and are assigned to departments, teams, or individuals. We use again the FMCG company in our example in Table 2.1 to show what a sales strategy can look like in the shape of a plan.
Strategic goal
Strategic action
Activity Target Responsibility
“Optimizing trade investments”
Optimize trade spending, reducing risks
Introduce open payment and logistic terms
Full compliance in every account
Account mgmt. Sales operations Customer service
Align annual contracts during negotiation round
25 percent risk reduction
Account mgmt.
Optimize promotional expenditure
Start promotion evaluation program
50 percent of promotional turnover evaluated
Account mgmt. Finance
Increase promotional efficacy
Return on investment > previous year
Account mgmt. Trade mktg.
Improve customer business planning process
Increase the number of planned customers
Top five customers individually planned
Account mgmt. Sales operations
Introduce joint business plans
One joint business plan in every top three customers
Account mgmt. Trade mktg.
“Building brands through customers”
Grow market share in customer x
Improve assortment and display
Fair share Account mgmt. Trade mktg.
Improve promotional plan
Number of leaflets > previous year
Account mgmt. Trade mktg.
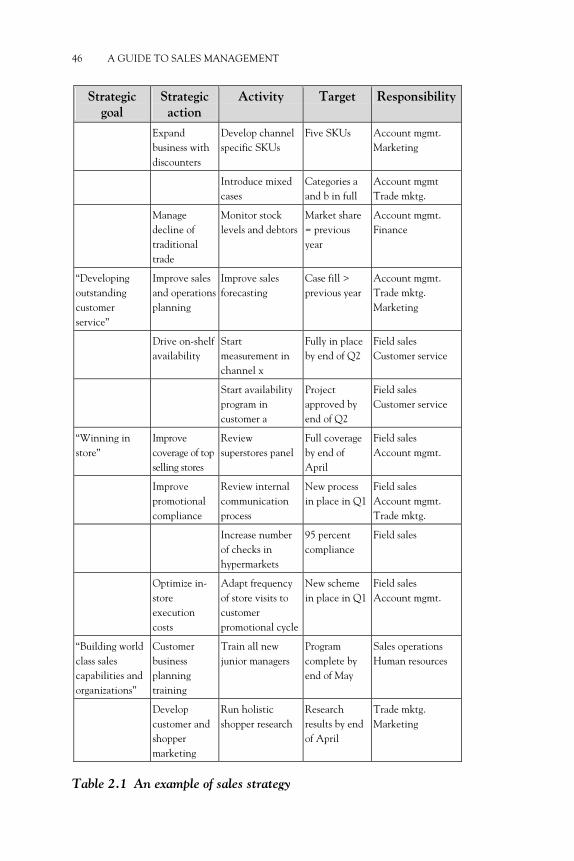
46 A GUIDE TO SALES MANAGEMENT
Strategic goal
Strategic action
Activity Target Responsibility
Expand business with discounters
Develop channel specific SKUs
Five SKUs Account mgmt. Marketing
Introduce mixed cases
Categories a and b in full
Account mgmt Trade mktg.
Manage decline of traditional trade
Monitor stock levels and debtors
Market share = previous year
Account mgmt. Finance
“Developing outstanding customer service”
Improve sales and operations planning
Improve sales forecasting
Case fill > previous year
Account mgmt. Trade mktg. Marketing
Drive on-shelf availability
Start measurement in channel x
Fully in place by end of Q2
Field sales Customer service
Start availability program in customer a
Project approved by end of Q2
Field sales Customer service
“Winning in store”
Improve coverage of top selling stores
Review superstores panel
Full coverage by end of April
Field sales Account mgmt.
Improve promotional compliance
Review internal communication process
New process in place in Q1
Field sales Account mgmt. Trade mktg.
Increase number of checks in hypermarkets
95 percent compliance
Field sales
Optimize in-store execution costs
Adapt frequency of store visits to customer promotional cycle
New scheme in place in Q1
Field sales Account mgmt.
“Building world class sales capabilities and organizations”
Customer business planning training
Train all new junior managers
Program complete by end of May
Sales operations Human resources
Develop customer and shopper marketing
Run holistic shopper research
Research results by end of April
Trade mktg. Marketing
Table 2.1 An example of sales strategy
THE SALES STRATEGY 47
Communication and outputs of the sales strategy
A well-formulated sales strategy is a powerful communication tool. The sales leader and her direct reports will use it to communicate the sales plan in every department of the sales team. It is easy to see that sales themes and key strategic actions are a better way to convey a holistic view of the sales strategy than a plain list of targets and activities. Strate-gy communication will be a key topic of every national and local sales meeting, especially of the annual sales conference of the sales team.
The sales strategy is also the input to all the work plans of the sales team, from departmental (account management, trade marketing, field sales, and sales operations) down to individual level. A careful imple-mentation of the sales strategy implies that every activity of the sales function finds a place in at least an individual work plan and at the same time that every individual activity of a sales team member is reflected in a strategic action of the sales strategy.
The sales strategy also informs all the sales policies of the company from the general terms and conditions of sale, to the new product listing policy, the promotional policy, the new store opening policy, the sam-pling policy, etc. Every sales policy will have to be consistent with the sales strategy and when necessary reviewed in light of the strategy development.
Takeaway Points
• Corporate strategy can be defined as a plan, a position, a pattern, a perspective, a ploy, and a problem solving. All definitions are true, but partial.
• The sales director as a member of her company’s leadership team will be involved in formulating and reviewing her company’s strategy, which more often than not will look like a strategic plan or the selection of a strategic position.
• The sales director is responsible for formulating the sales strategy that must be approved by the company CEO and board of directors.
48 A GUIDE TO SALES MANAGEMENT
• There are five sources for the definition of the sales strategy: market analysis (trade environment scan), customers’ strat-egies, customer-satisfaction surveys, assessment of the sales organization capabilities, and company’s corporate strategy.
• The sales strategy consists of strategic goals (strategic thrusts) that are translated into a number of strategic actions, each with its own specific activities, targets, and assigned responsibilities.
• Every strategic goal refers to at least one of the strategic themes (must win battles) that define the company’s corpo-rate strategy, showing its top-line direction.
• A well-prepared sales strategy becomes the input for developing aligned departmental and individual work plans and establishing effective sales policies.
CHAPTER 3
The Performance Indicators for Sales Management
Why we need key performance indicators?
The sales strategy is the sales functional component of the corporate strat-egy and is developed by the sales leader on the basis of market analysis, customers’ strategies, customer-satisfaction surveys, assessment of the sales organization capabilities, and company’s corporate strategy itself.
The sales strategy can be expressed in terms of strategic themes and stra-tegic goals that in turn must be translated into a set of strategic actions with associated objectives. Therefore, the sales leader needs to select for her sales strategy meaningful key performance indicators (KPIs) that will help her in setting targets for the sales team in alignment to what is done for the other functions of the company under the umbrella of the corporate strategy.
KPIs are not only instrumental to the preparation of the sales strategy, they also have a value in themselves as an expression of leadership and a means to foster a performance culture and develop a mindset of continu-ous improvement.
I believe that KPIs should reflect the financial performance of sales, but also express attention for a number of areas that highly influence fi-nancial results such as field sales efficacy, customer service, in-store exe-cution, and business planning. An overview of the fundamental KPIs for sales is shown in Figure 3.1.
Financial indicators
There is no sales team that operates without at least one financial indica-tor. If there is to be only one indicator, this will be a value measurement of turnover within a time bucket.
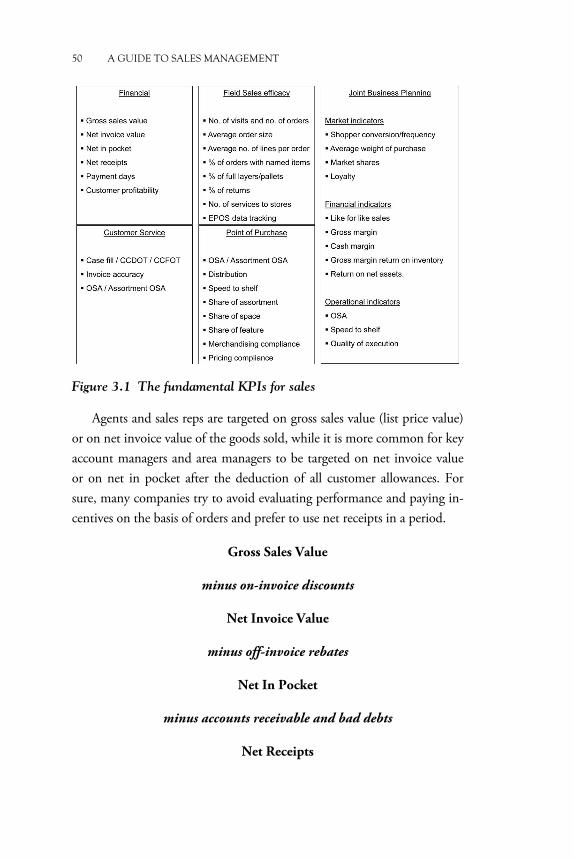
50 A GUIDE TO SALES MANAGEMENT
Figure 3.1 The fundamental KPIs for sales
Agents and sales reps are targeted on gross sales value (list price value) or on net invoice value of the goods sold, while it is more common for key account managers and area managers to be targeted on net invoice value or on net in pocket after the deduction of all customer allowances. For sure, many companies try to avoid evaluating performance and paying in-centives on the basis of orders and prefer to use net receipts in a period.
Gross Sales Value
minus on-invoice discounts
Net Invoice Value
minus off-invoice rebates
Net In Pocket
minus accounts receivable and bad debts
Net Receipts
THE PERFORMANCE INDICATORS FOR SALES MANAGEMENT 51
An additional KPI for key account managers and area managers is extra payment days, normally expressed as number of days of payment delay versus agreed payment terms.
Another possibility is to target managers also on customer profitabil-ity; therefore, taking into account not only the negotiated on- and off-invoice terms, but also discretionary customer-related expenses (e.g., POP materials, displays, and in-store theater) and changes of the mix of pur-chased products that they can influence throughout the year.
Net Receipts
minus cost of goods sold
minus other customer related expenses
Customer Profitability
minus sales overheads
Net Customer Profitability
A sales director is normally targeted on turnover, payments, custom-er profitability, and overhead costs generated by her sales team. She will share her targets with her direct reports that in turn will cascade them down to their senior and junior managers and sales reps as appropriate.
Field sales efficacy indicators
The efficacy of agents and sales reps is usually measured in terms of the quantity and the quality of sales that they can generate.
At the end of every sales period supervisors can evaluate the quantity of sales analyzing indicators like the number of visits, the number of or-ders and the average order size of every sales rep. The quality of sales can be read through indicators like the number of lines per order and the number of orders containing one or more new items. In some cases, it can also be relevant to measure the weight of full layers and full pallets on total ordered cases.
In the food industry returns are a very important indicator of field sales efficacy and their minimization is very often a component of incen-tive schemes.
52 A GUIDE TO SALES MANAGEMENT
The efficacy of field merchandisers can be measured taking into ac-count the number of visits per period, the number of services delivered to the stores (e.g., promotion set ups or merchandising material placements), and also a selection of the point of purchase (POP) indicators that we ana-lyze in this chapter. When electronic point of sale (EPOS) data are availa-ble for the stores visited by the field merchandiser, his performance can also be tracked in terms of sales growth or market share gain.
Customer-service indicators
A restrictive view is to apply customer-service indicators only to evaluate the performance of the customer-service and care team. This is a very short sighted decision, because it is well known that functions like mar-keting, sales, and supply chain all play a relevant role in the achievement of customer-service results.
For the sales team part, it is very clear how the timely communica-tion of changes in the customer assortments and promotional plans can make a difference in consolidating positive customer-service results. The respect of customer lead times and improvements in the forecast accura-cy of major promotional events and new product listings can also have a huge impact. It is therefore advisable to include some customer-service KPI in the scorecard of the managers of the sales function.
The basic customer-service indicator is case fill, defined as the ratio between dispatched cases and ordered cases
Case fill % = dispatched cases/ordered cases %
There are a few problems with this definition that are worth discussing. The first point is that with case fill time is of the essence and therefore any KPI must include an “on time” dimension, a reference to a time bucket. This slot can be defined as a week, a day, antemeridian, postmeridian, or even a couple of hours. Whatever the customer wants and we agree to become the on-time element of the KPI. The second issue is that between dispatch and delivery, things can go wrong, goods can be lost, stolen, or damaged, and normally, the responsibility for these inconveniences lies with the supplier or its third-party service provider and not with the customer.
THE PERFORMANCE INDICATORS FOR SALES MANAGEMENT 53
Therefore, it is by far better to measure our performance on delivery rather than on dispatch. The third and last point is which definition of ordered cases to use. Some practitioners argue that it is better to use only final orders as the result will show the proactivity of the customer-care and sales teams in anticipating issues and asking the customers to change their initial orders, when some items are temporarily unavailable. This consideration is questionable per se, but we must also remember that measuring with final orders would hide away from us all the changes that the customer did to the orders because of its own inefficiency, and we might want to keep track of these corrections. Therefore, it is better, if it is possible, to measure case fill with the quantities of the final order plus the absolute sum of all changes to the initial order.
Customer case dispatch on time (CCDOT) and customer case fill on time (CCFOT) are two commonly used case fill KPIs. Some compa-nies use only final orders and also do not include some errors as well as agreed product uplifts and returns in their calculations.
CCFOT % = no. cases delivered on time accepted by customer/ adjusted no. ordered cases%
An old FMCG adage is that customers want to receive their orders on time, in full and with no invoice error. Invoice accuracy is a key ele-ment of customer-service excellence. Some suppliers are measuring it as the ratio between number of credit notes issued for invoicing errors and number of invoices. This is relatively quick to calculate, but poses a number of questions. Credit notes sometimes are issued with reference to more than one invoice, and so, the KPI is under reporting the num-ber of anomalies and the lack of accuracy. On top of this it makes a big difference if an invoice contains only one error or many errors. On the basis of these observations, some companies prefer to utilize as accuracy KPI the ratio between invoices with errors and total issued invoices and when possible to calculate the percentage of invoice lines with errors on the total number of invoice lines.
Invoice accuracy (documents) % = (1 − invoices with errors/ total invoices) %
54 A GUIDE TO SALES MANAGEMENT
Invoice accuracy (lines) % = (1 − invoice lines with errors/ total invoice lines) %.
The third and last customer-service KPI that I want to introduce is on-shelf availability (OSA). A company can deliver the best case fill to its customers, but all its efforts can be frustrated by a low level of OSA. Out of stocks (OOS) as we all know by personal experience are a great disappointment for the end shopper, and they tend to be attributed to both the retailer and the supplier. There are many reasons to measure OSA periodically or on an ongoing basis:
• Evaluating the end to end performance of an extended supply chain, that is, from the manufacturer’s factory to the retailer’s store;
• Measuring store by store the replenishment performance of a retailer;
• Measuring store by store the assortment compliance of a retailer in order to understand to which degree it is respecting the agreements that we have negotiated;
• Quantifying the differences in operational performance of our customer base to decide where to invest when resources are limited.
If this is true, then it becomes clear that OSA is not only a customer-service indicator, but also the first and foremost POP indicator.
OSA can be defined in the most basic way as the presence in store of a stock-keeping unit (SKU). In this case, OOSs are the only comple-ment to OSA and given a selected panel of SKUs OSA is simply:
OSA% = 100% − OOS%.
OSA defined as the percentage number of in stock positions on total ob-servations is a good indicator especially for traditional trade and inde-pendent stores.
In modern trade, OSA definitions are a bit more sophisticated. First, the presence of the SKU is not simply defined as being in store, but as availability on the designated shelf (in the right fridge, freezer, etc.) with a standard shelf-edge label (SEL), containing the product description, its
THE PERFORMANCE INDICATORS FOR SALES MANAGEMENT 55
price, and other operational information such as units per case, facings on shelf, and shelf capacity. Second, the measurement is also about the store compliance to the assortment that has been agreed for that store between vendor and retailer. To put it simply:
Assortment OSA% = 100% − OOS% − Noncompliance%.
In this definition, there is a case of “Noncompliance” when a SKU that should be on shelf as a result of a listing agreement it is not, and it is not even signposted by its SEL. On the other hand, there is a case of OOS when a SKU is not on shelf, but its SEL is clearly visible.
The necessary condition to implement the measurement of “Assort-ment OSA” is the detailed knowledge of the assortment that should be in place in every store. Retailers decide assortments by store clusters and clusters very often are not the same across different categories. It is clear to see how this knowledge requirement can become a spur for customer account managers to learn more about their customers’ operations and to use that knowledge also in negotiations.
Some practitioners have also toyed with the concept of visual out of stock or nearly out of stock. It can be argued that a SKU is close to out of stock or even that it is visually out of stock when the number of its units on shelf is inferior to the number of facings that are allocated to the SKU in the customer’s planogram. To keep it simple, you can also define as nearly out of stock a SKU whose number of units on shelf is inferior to an absolute number that has been somehow identified for the category or the brand. The topic can be fascinating, but I have never seen measures of partial out stock go above the 1% threshold.
A more important discussion is about the time of the measurement of OSA. The assumption is that OOS will be more frequent at peak shopping time, especially if the amount of space on shelf dedicated to the SKU is limited. Some practitioners go as far as claiming that there is no point in measuring availability off peak, others are more relaxed about allowing a combination of on-peak and off-peak measurements. Whoever is right you end up with the problem of defining what is the on-peak time, and that realistically might vary across stores and store formats for many reasons. The practical tip is to record the date and
56 A GUIDE TO SALES MANAGEMENT
time of measurement, so that an analysis of OSA by day of the week or time of the day can be easily carried out whenever deemed necessary.
Another point normally debated is whether to go for physical meas-urement or utilize EPOS data to evaluate OSA. Physical measurement can be very expensive, and therefore, it will always be based on samples of stores, if not also samples of the product portfolio. On the other hand, OSA measurement based on EPOS data will be less expensive and can po-tentially allow full coverage of entire retail chains and of their assortments.
Some people are enthusiastic about OSA measurement based on EPOS data, but there are some cautions to consider.
Let us assume that we define a SKU as available in store if it is selling a certain amount of units per day. We still might find the same SKU out of stock during a physical check, because the SKU might have gone out of stock after selling for a few hours or because it might be out of stock on shelf while selling from a promotional or secondary placement or because it is missing now, but it will be replenished later, and therefore, it will sell before the end of the day. On the contrary, a SKU not selling today and therefore to be considered out of stock, might well be in stock, but simply not selling any unit because there is a competitor on promotion.
Noncompliance to the agreed assortment can be calculated with EPOS data on the hypothesis that what is not sold by the store is also not officially listed, but this could be a wrong assumption.
This is all to say that to avoid problems with OSA measurements based on EPOS data, there is a need to be very careful with definitions and with the algorithms utilized. Also, it makes little sense to use EPOS data with a frequency other than daily, which can leave us sometime with an amount of data that are very difficult to manage.
The practical tip here is to maintain always some OSA physical measurement, if only to validate the reliability of EPOS data-based measurements and to find ways to integrate the two measurements. Al-so, we should not forget that at the end of the day trends will be more important than absolute figures.
Point of purchase indicators
POP indicators focus on what happens in the stores in terms of availa-bility, distribution, speed to shelf, assortment, space, promotion, mer-chandising and pricing. We need at least an indicator for each of these
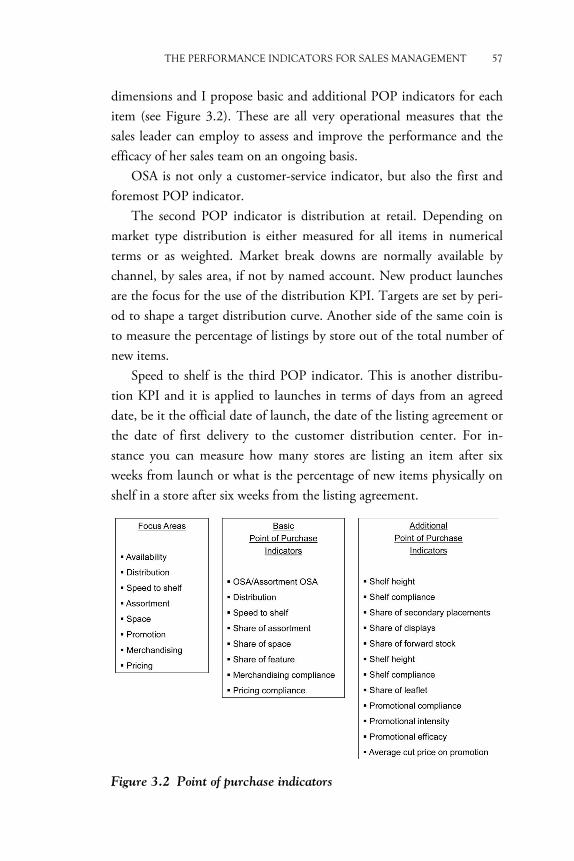
THE PERFORMANCE INDICATORS FOR SALES MANAGEMENT 57
dimensions and I propose basic and additional POP indicators for each item (see Figure 3.2). These are all very operational measures that the sales leader can employ to assess and improve the performance and the efficacy of her sales team on an ongoing basis.
OSA is not only a customer-service indicator, but also the first and foremost POP indicator.
The second POP indicator is distribution at retail. Depending on market type distribution is either measured for all items in numerical terms or as weighted. Market break downs are normally available by channel, by sales area, if not by named account. New product launches are the focus for the use of the distribution KPI. Targets are set by peri-od to shape a target distribution curve. Another side of the same coin is to measure the percentage of listings by store out of the total number of new items.
Speed to shelf is the third POP indicator. This is another distribu-tion KPI and it is applied to launches in terms of days from an agreed date, be it the official date of launch, the date of the listing agreement or the date of first delivery to the customer distribution center. For in-stance you can measure how many stores are listing an item after six weeks from launch or what is the percentage of new items physically on shelf in a store after six weeks from the listing agreement.
Figure 3.2 Point of purchase indicators
58 A GUIDE TO SALES MANAGEMENT
Share of assortment is the fourth and the most overlooked POP indicator. It is the ratio between the number of a company’s items in a category and the total number of items listed by the store for that category.
Share of space is the fifth POP indicator and the one beloved by mar-keters. It is the ratio between the linear or cubic space occupied on shelf by a company’s items in a category and the total linear or cubic space on shelf dedicated by the store to that category. Sometimes share of space is also measured in terms of relative number of facings, especially when the items on shelf are very similar in terms of physical dimensions. Share of space can also be calculated for the off-shelf space, like permanent second-ary placements or promotional displays. When the difference between on-shelf and off-shelf locations is not very clear, as in the case of traditional stores, another useful measure is the so-called (share of) “forward stock,” the total stock on display for sale.
It is very useful to work out the share of space to share of assortment ratio. When this ratio is above or equal to 1, our assortment is over or fairly exposed compared to our competitors, when it is below 1 our brands are underexposed and therefore have less opportunity to be seen than our competitors.
Marketers like to compare share of space to share of market, assum-ing that it is a must for the ratio to be above or equal to 1. This is the case of a relative statement made absolute for simplicity. While for a nondominant brand, with a value market share below 15 to 20 percent it is not unrealistic to set a share of space to share of market target at 100 percent or more, it is proven that the bigger the brand the smaller is the share of space to share of market ratio, to the point that in some cas-es a 75 to 80 percent proportion is already a challenging target. Let us face it, retailers do like efficient brands that can sell a lot from a relative-ly small slot and are very happy to free up some space for mid and slow movers with higher margins. This is particularly true for the largest stores like hypermarkets and superstores.
There are two other shelf measures that are worth considering, shelf height and shelf compliance.
Shelf height is the shelf-level position of our items. Fixtures have a number of shelves ranging from five to eight. These can be standardized
THE PERFORMANCE INDICATORS FOR SALES MANAGEMENT 59
into five positions that can be measured with a number from one to five, starting from the bottom and going to the top of the fixture. It is well-known that the selling potential of each level is quite different and it might be worth checking what our retailers are doing with our products, especially if we have agreed to pay some fee to be on shelf at eye level. Shelf height will be measured store by store for each SKU and a score from 1 to 5 will be assigned to each item regardless of the actual number of shelves, so that the calculation of averages and comparisons across stores and customers become possible.
Shelf compliance can be assessed in respect to the retailer planogram or to our company’s shelf standards. These can be our desired brand lo-cation on shelf, shelf height, flow of brands on shelf, and our placement relative to competition. This compliance measurement is quite complex, and it is recommended only for priority brands in priority customers.
The sixth POP indicator is the share of feature, which is the per-centage of promotional slots that we achieve on the total number of promotional activities that the retailer runs for the category in a period. Given the variety of promotional events, it might be very difficult to measure this indicator, and it is more practical to focus on the major events that are advertised in the customer folders and therefore track the so-called share of leaflet.
A store-based indicator of the quality of execution of the promotional activities is promotional compliance, measured considering the communi-cation of the promotional mechanic, the number of off-shelf display units, the in-store location, and the exclusivity of the activity.
Two other very important indicators are promotional intensity and promotional efficacy. The former is the measure of the volume sold on deal as a percentage of the total volume sold, and the latter is the measure of the so-called promotional uplift, the percentage increase in sales deter-mined by the promotional event. They can be both measured store by store or through EPOS data, but it is generally more practical to buy syn-dicated data, also in order to benchmark one’s performance to competi-tors and total market.
The seventh POP indicator is merchandising compliance that can be measured in terms of on-shelf visibility, that is, the presence on shelf of promotional POP materials, and in terms of extra space, that is, the presence in store of permanent secondary placements.
60 A GUIDE TO SALES MANAGEMENT
Last but not least, we need to discuss the eighth POP indicator, pricing compliance. The sales department will periodically receive from the marketing department a recommended retail price positioning for each item of the product portfolio. This will be expressed as a desired price point (e.g., € 1.99), but also as a ratio either to market average (e.g., 105 percent) or to one or two key competitors (e.g., 95 percent of competitor A and 110 percent of competitor B). We can measure the store compliance to these pricing indications comparing the actual prices on shelf (absolute or relative to competitors) to the recommended prices. The same thing can be done for promotional prices, and in this case, it can also be useful to measure the average cut price on deal, that is, a key not only to explain promotional efficacy, but also to understand how much of the temporary price reduction that we allow to customers is then passed on to shoppers.
In Europe, recommended selling prices and also the simple data col-lection of actual shelf prices carried out by manufacturers have become a sort of a taboo. Leading multinational companies are afraid of the heavy penalties implied by the infringement of the so-called European Competi-tion Law. A restrictive interpretation of this law considers the very fact of collecting data as a first step to agree with retail customers a resale price maintenance aimed at fixing a minimum price against the interests of the consumers, a kind of collusion that is illegal.1 I believe that this point of view is too extreme. Companies must be free to check retail prices with whatever means they believe appropriate. When they deem it necessary, they can choose one of the four legal ways to change retail prices:
1. List price increase: product cost driven or linked to product relaunch
2. Product size change: downsizing or upsizing with a dispropor-tionate price change
3. Range extension: introduction of cheaper or more expensive variants
4. Promotions: changing the depth of temporary price reductions and or the number of promotional activities.
1See articles 101 and 102 of The Treaty on the Functioning of the European Union. Also, in the United States, despite the so-called 2007 Leegin decision that implies that vertical price fixing is not illegal per se, manufacturers should not assume that they are free to impose minimum resale prices.
THE PERFORMANCE INDICATORS FOR SALES MANAGEMENT 61
Joint business planning and customer indicators
Some key customers are more and more asking suppliers for the prepara-tion of joint business plans ( JBPs) at least for the product categories where they have or want to develop a dominant or relevant position. These plans are normally formalized in documents including a number of performance indicators, many of which have already been discussed earlier. Along the same line of thought, the Jointly Agreed Growth model was presented at the Efficient Consumer Response (ECR) Europe conference in 2007.
There are three kinds of customer-specific indicators to consider: (a) market shares and related indicators, (b) operational indicators, and (c) financial indicators.
The customer category market share measures the customer strength in the market, but it can also indicate its untapped potential in a category. It is useful to compare the customer category market share to its total market share and assess whether the category is over, under or at “fair share” level. The customer category market share can also be seen as the result of the two fundamental shopper indicators, visit frequency, and av-erage weight of purchase, which in turn are influenced by shopper loyalty. Therefore, it is not uncommon to find category market shares, number of bills, average weight of purchase, and loyalty measures included in JBP scorecards.
The manufacturer not only wants to develop the customer category market share, but also to maximize its category market share at custom-er. It will compare its category market share at customer to its total market share, assess whether its position is over, under or at fair share position and will ask for its category market share at customer to be in-cluded as a target in the JBP scorecard. For resource allocation purposes, it can also be useful to draw graphs to map all categories in a customer or all customers in a category (see Figure 3.3). In the first case, we will record on the X axis the customer category market shares and on the Y axis the manufacturer category market share at customer to total mar-ket share ratios. In the second case, we will record on the X axis the cus-tomer category market share to total market share ratios and on the Y axis the manufacturer category market shares at customer.
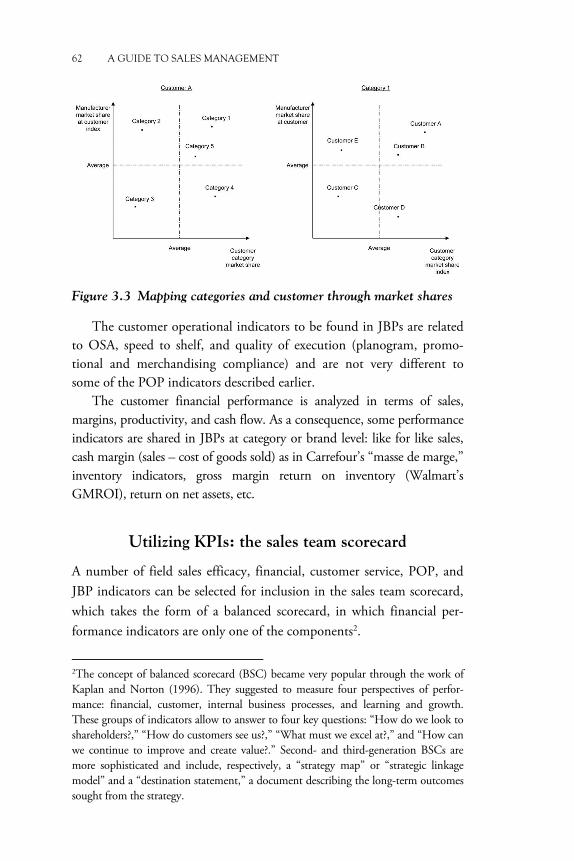
62 A GUIDE TO SALES MANAGEMENT
Figure 3.3 Mapping categories and customer through market shares
The customer operational indicators to be found in JBPs are related to OSA, speed to shelf, and quality of execution (planogram, promo-tional and merchandising compliance) and are not very different to some of the POP indicators described earlier.
The customer financial performance is analyzed in terms of sales, margins, productivity, and cash flow. As a consequence, some performance indicators are shared in JBPs at category or brand level: like for like sales, cash margin (sales – cost of goods sold) as in Carrefour’s “masse de marge,” inventory indicators, gross margin return on inventory (Walmart’s GMROI), return on net assets, etc.
Utilizing KPIs: the sales team scorecard
A number of field sales efficacy, financial, customer service, POP, and JBP indicators can be selected for inclusion in the sales team scorecard, which takes the form of a balanced scorecard, in which financial per-formance indicators are only one of the components2.
2The concept of balanced scorecard (BSC) became very popular through the work of Kaplan and Norton (1996). They suggested to measure four perspectives of perfor-mance: financial, customer, internal business processes, and learning and growth. These groups of indicators allow to answer to four key questions: “How do we look to shareholders?,” “How do customers see us?,” “What must we excel at?,” and “How can we continue to improve and create value?.” Second- and third-generation BSCs are more sophisticated and include, respectively, a “strategy map” or “strategic linkage model” and a “destination statement,” a document describing the long-term outcomes sought from the strategy.
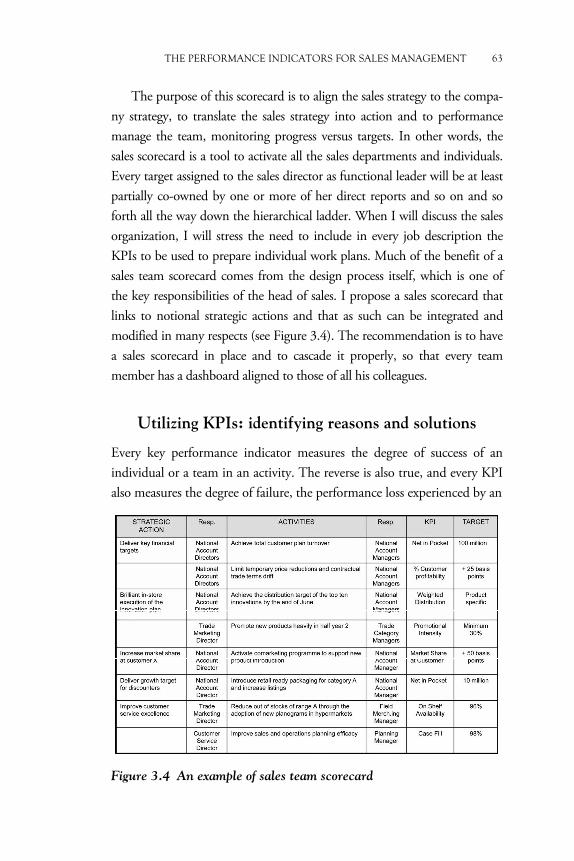
THE PERFORMANCE INDICATORS FOR SALES MANAGEMENT 63
The purpose of this scorecard is to align the sales strategy to the compa-ny strategy, to translate the sales strategy into action and to performance manage the team, monitoring progress versus targets. In other words, the sales scorecard is a tool to activate all the sales departments and individuals. Every target assigned to the sales director as functional leader will be at least partially co-owned by one or more of her direct reports and so on and so forth all the way down the hierarchical ladder. When I will discuss the sales organization, I will stress the need to include in every job description the KPIs to be used to prepare individual work plans. Much of the benefit of a sales team scorecard comes from the design process itself, which is one of the key responsibilities of the head of sales. I propose a sales scorecard that links to notional strategic actions and that as such can be integrated and modified in many respects (see Figure 3.4). The recommendation is to have a sales scorecard in place and to cascade it properly, so that every team member has a dashboard aligned to those of all his colleagues.
Utilizing KPIs: identifying reasons and solutions
Every key performance indicator measures the degree of success of an individual or a team in an activity. The reverse is also true, and every KPI also measures the degree of failure, the performance loss experienced by an
Figure 3.4 An example of sales team scorecard
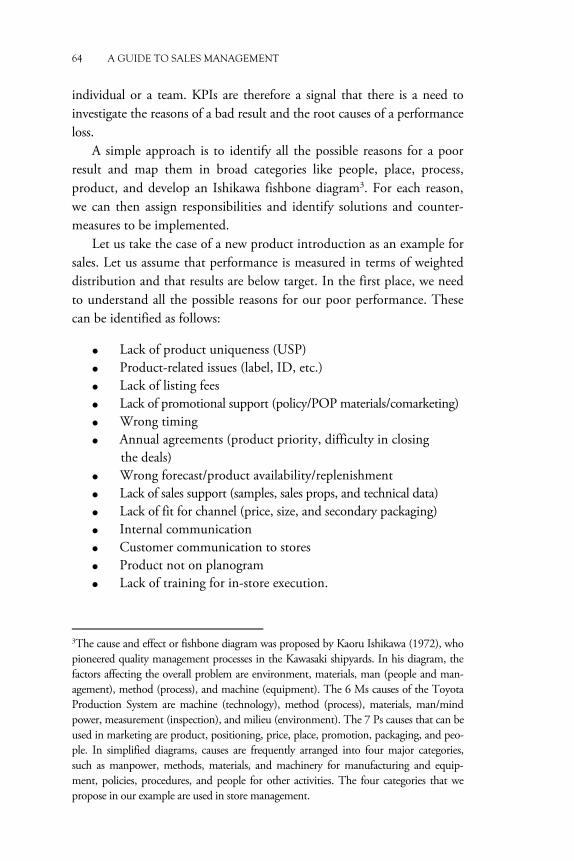
64 A GUIDE TO SALES MANAGEMENT
individual or a team. KPIs are therefore a signal that there is a need to investigate the reasons of a bad result and the root causes of a performance loss.
A simple approach is to identify all the possible reasons for a poor result and map them in broad categories like people, place, process, product, and develop an Ishikawa fishbone diagram3. For each reason, we can then assign responsibilities and identify solutions and counter-measures to be implemented.
Let us take the case of a new product introduction as an example for sales. Let us assume that performance is measured in terms of weighted distribution and that results are below target. In the first place, we need to understand all the possible reasons for our poor performance. These can be identified as follows:
• Lack of product uniqueness (USP) • Product-related issues (label, ID, etc.) • Lack of listing fees • Lack of promotional support (policy/POP materials/comarketing) • Wrong timing • Annual agreements (product priority, difficulty in closing
the deals) • Wrong forecast/product availability/replenishment • Lack of sales support (samples, sales props, and technical data) • Lack of fit for channel (price, size, and secondary packaging) • Internal communication • Customer communication to stores • Product not on planogram • Lack of training for in-store execution.
3The cause and effect or fishbone diagram was proposed by Kaoru Ishikawa (1972), who pioneered quality management processes in the Kawasaki shipyards. In his diagram, the factors affecting the overall problem are environment, materials, man (people and man-agement), method (process), and machine (equipment). The 6 Ms causes of the Toyota Production System are machine (technology), method (process), materials, man/mind power, measurement (inspection), and milieu (environment). The 7 Ps causes that can be used in marketing are product, positioning, price, place, promotion, packaging, and peo-ple. In simplified diagrams, causes are frequently arranged into four major categories, such as manpower, methods, materials, and machinery for manufacturing and equip-ment, policies, procedures, and people for other activities. The four categories that we propose in our example are used in store management.
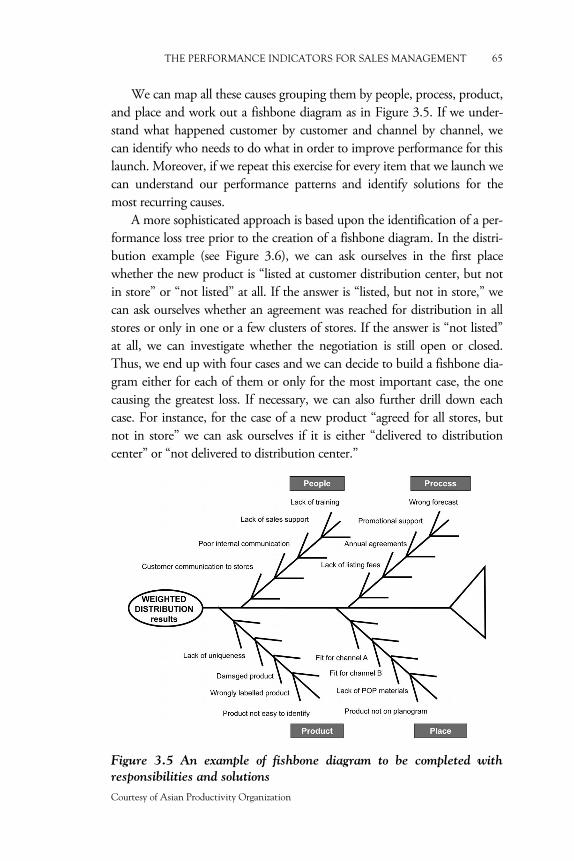
THE PERFORMANCE INDICATORS FOR SALES MANAGEMENT 65
We can map all these causes grouping them by people, process, product, and place and work out a fishbone diagram as in Figure 3.5. If we under-stand what happened customer by customer and channel by channel, we can identify who needs to do what in order to improve performance for this launch. Moreover, if we repeat this exercise for every item that we launch we can understand our performance patterns and identify solutions for the most recurring causes.
A more sophisticated approach is based upon the identification of a per-formance loss tree prior to the creation of a fishbone diagram. In the distri-bution example (see Figure 3.6), we can ask ourselves in the first place whether the new product is “listed at customer distribution center, but not in store” or “not listed” at all. If the answer is “listed, but not in store,” we can ask ourselves whether an agreement was reached for distribution in all stores or only in one or a few clusters of stores. If the answer is “not listed” at all, we can investigate whether the negotiation is still open or closed. Thus, we end up with four cases and we can decide to build a fishbone dia-gram either for each of them or only for the most important case, the one causing the greatest loss. If necessary, we can also further drill down each case. For instance, for the case of a new product “agreed for all stores, but not in store” we can ask ourselves if it is either “delivered to distribution center” or “not delivered to distribution center.”
Figure 3.5 An example of fishbone diagram to be completed with
responsibilities and solutions
Courtesy of Asian Productivity Organization
66 A GUIDE TO SALES MANAGEMENT
Figure 3.6 An example of performance loss tree for weighted distribution
root cause analysis
Takeaway Points
• The sales leader needs to select for her sales strategy meaningful key performance indicators (KPIs) that will help her in setting targets and monitoring performance of the sales team.
• KPIs are a means to foster a performance culture and develop a mindset of continuous improvement.
• A sales director is normally targeted on turnover, payments, customer profitability, and overhead costs generated by her sales team.
• Financial indicators need to be complemented by measures of the efficacy of field sales, customer service, in-store execution, and joint business planning.
• The efficacy of sales reps can be measured in terms of quantity generated by number of active customers, average visits per period, average orders per period, and average order size and in terms of quality looking at the number of lines per order and at the number of orders containing new items.
• The efficacy of field merchandisers can be measured in terms of number of visits per period, number of delivered services, and through a selection of the point of purchase (POP) indicators.
THE PERFORMANCE INDICATORS FOR SALES MANAGEMENT 67
• Case fill, invoice accuracy, and on-shelf availability (OSA) are the key measures of customer-service performance. OSA is an indicator of the end-to-end performance of the integrated (manufacturer and customer) supply chain.
• In-store execution can be assessed with POP indicators that focus on what happens in the stores in terms of availability, distribution, speed to shelf, assortment, space, promotion, merchandising, and pricing.
• Joint business planning with customers implies the adoption of three kinds of customer specific indicators: market shares, operational POP indicators, and financial indicators such as like for like sales, cash margin, and GMROI.
• The KPIs selected by the sales director are included in the sales team scorecard to align the sales strategy to the company strategy, to translate the sales strategy into action, and to performance manage the sales team.
• The sales scorecard is a tool to activate all the sales departments and individuals: every target assigned to the sales director is at least partially co-owned by one or more of her direct reports and so on and so forth all the way down the hierarchical ladder.
• When a KPI shows a poor performance we can identify all the possible reasons for the bad result, map them in broad categories, and develop an Ishikawa fishbone diagram, assigning responsibilities and identifying solutions and countermeasures to be implemented for each reason.
• Prior to the creation of a fishbone diagram we can build a performance loss tree to choose the most important areas where to focus our attention.

CHAPTER 4
Organizational Roles and Responsibilities
The pillars of the organization of the sales function
Every sales team is organized around two pillars: (a) a frontline or front office responsible for managing the customer interface and (b) a back office providing support to the frontline in a number of ways.
In the most fragmented markets, the customer base is made up by many independent stores and a few small independent trade accounts, which can be interfaced and managed by salesmen coordinated on a ter-ritorial basis by area sales managers reporting to the national sales direc-tor. In this case, the back office consists of a few people, sometimes only an assistant to the sales director. However, the reality of most markets is much more articulated and demands a variety of sales roles in the front-line ranging from merchandisers to national account directors. In the same way, the structure of the sales back office of companies operating in mature markets requires more expertise and sophistication for the de-velopment of relationships with the customers’ buying, marketing, store operations, and supply chain functions.
A discussion of the organization of the sales function must start from the roles and responsibilities of the front office and of the back office, from their components, and from the needs that they must respond to.
The multilevel customer interface: an example
The reality of most markets is not that of small independent stores or cus-tomers, but one of direct and indirect trade accounts that are more and more organized and integrated and associated into different levels of buy-ing organizations. As a consequence, the customer interface in FMCGs
70 A GUIDE TO SALES MANAGEMENT
and also increasingly in many other businesses cannot be managed only by a group of area sales managers coordinating salesmen on a territorial basis and it requires more sophistication and articulation.
In many countries like Germany, Italy, Spain, and to a lesser extent France, manufacturers are facing a marketplace where stores are controlled in various degree by customers that are members of national organiza-tions, that in turn are part of roof organizations or national buying groups, some of which are also part of international buying groups. This variety of contact points not only implies the need of different profiles of salesmen such as field merchandisers, field account managers, and nation-al account managers and their line managers, but also a remarkable effort in internal coordination and alignment in order to negotiate agreements at a number of levels, sell at customer level, and execute properly in store.
An example can help to explain the point. The Italian “in home” gro-cery market is acknowledged by many senior managers as the most complex case in the western world: the difficulty of managing a multilevel customer interface combined with a quality of in-store execution that is not world class makes it quite unique. On one hand, there are some very centralized customers like Esselunga and Bennet that negotiate national agreements with their suppliers only on one table and that are in complete control of their stores and can rely on excellent store discipline. These customers are an exception and can be effectively managed by national account managers with the help of field merchandisers. On the other hand, there are many national organizations like Coop Italia, Despar, Sigma, Citre, Conad, Selex, Agorà, Sun, Crai, Sisa, Coralis, and Vegé, each representing an average of ten trade accounts. Some of these national organizations are in turn mem-bers of one of the four Italian national buying groups: Centrale Conad-Finiper, Efficienza e Servizi per la Distribuzione (ESD) Italia, Centrale Auchan, and Aicube (see Figure 4.1). Coop Italia and Conad are members of the two most important European buying groups, Coopernic and Core, respectively1. These groups were born as a response to the growing buying power of international customers like Carrefour, Auchan, and Metro. They 1Leclerc, Delhaize, and Coop Italia constituted the new Coopernic buying group in January 2015, while Rewe, Colruyt, Coop Schweiz, Conad, and Système U formed the Core buying group. In June 2015 Rewe announced that it will move to Coopernic in 2016, while Delhaize announced a merger with Ahold.
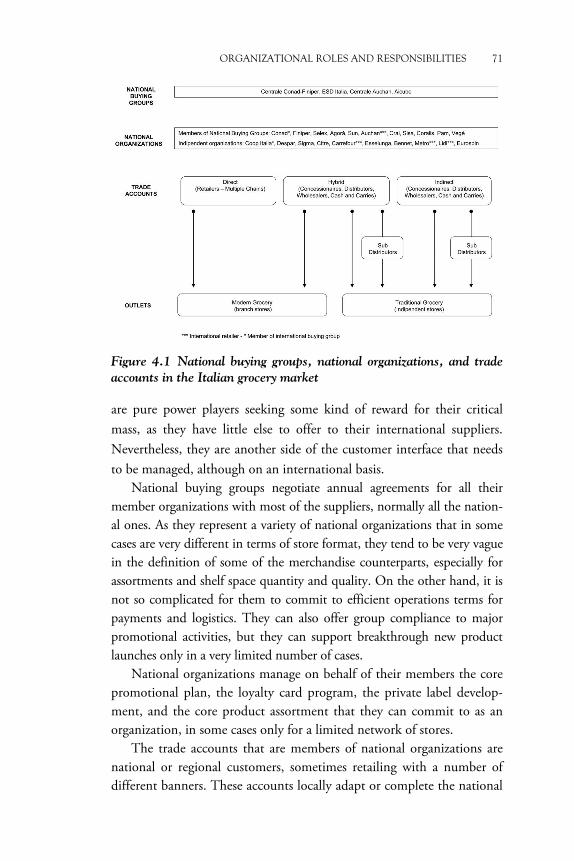
ORGANIZATIONAL ROLES AND RESPONSIBILITIES 71
Figure 4.1 National buying groups, national organizations, and trade
accounts in the Italian grocery market
are pure power players seeking some kind of reward for their critical mass, as they have little else to offer to their international suppliers. Nevertheless, they are another side of the customer interface that needs to be managed, although on an international basis.
National buying groups negotiate annual agreements for all their member organizations with most of the suppliers, normally all the nation-al ones. As they represent a variety of national organizations that in some cases are very different in terms of store format, they tend to be very vague in the definition of some of the merchandise counterparts, especially for assortments and shelf space quantity and quality. On the other hand, it is not so complicated for them to commit to efficient operations terms for payments and logistics. They can also offer group compliance to major promotional activities, but they can support breakthrough new product launches only in a very limited number of cases.
National organizations manage on behalf of their members the core promotional plan, the loyalty card program, the private label develop-ment, and the core product assortment that they can commit to as an organization, in some cases only for a limited network of stores.
The trade accounts that are members of national organizations are national or regional customers, sometimes retailing with a number of different banners. These accounts locally adapt or complete the national
72 A GUIDE TO SALES MANAGEMENT
promotional plan of their organizations and determine the full assort-ment that they will carry by store cluster.
Outlets are the space where in-store execution takes place and store personnel are another important level of the customer interface. De-pending on the size of the store, its staff will consist of a store manager and some department assistants or there might be a more articulated structure with an intermediate layer of sector managers supervising de-partment assistants and shelf replenishers.
Order collection normally takes place at trade account level. At store level, it is reserved to some fresh produce and seasonal items.
The front office roles
A multilevel customer interface of the kind described in our example implies some basic frontline sales roles:
a) National account manager - He/she manages the ongoing relationship with the category
buyers of a sales channel, of a group of national organiza-tions, or of a number of centralized national customers.
- The purpose of the job is to develop and execute channel/customer strategies and business plans that enable to reach the assigned business targets and to manage price, assortments, promotions, merchandising, and new store openings.
b) Field account manager - He/she manages the ongoing relationship with the category
buyers of a number of regional trade accounts. - The purpose of the job is to get the agreed assortments,
promotions, and merchandising and to manage the trade accounts from order taking to cash collection to reach the assigned business targets.
c) Field merchandiser - He/she manages the ongoing relationship with the person-
nel of a number of stores. - The purpose of the job is to guarantee in-store execution of
agreed assortments, promotions, and merchandising, to monitor the stores, and collect orders when necessary.
ORGANIZATIONAL ROLES AND RESPONSIBILITIES 73
These three profiles above are coordinated, respectively, by:
d) National account director - He/she manages the relationship with the buying directors
of a group of sales channels or national buying groups. - The purpose of the job is to lead (a) a national account man-
agement team, (b) channel/customer strategies and business plans development and execution, and (c) customer sales forecasting.
e) Area sales manager - He/she manages the relationship with the buying directors
and the category buyers of a number of trade accounts. - The purpose of the job is (a) to lead a field account
management team, (b) to drive second-level negotiations in alignment with national account management and maximizing counterparts (assortments, promotions, and merchandising), and (c) to manage trade accounts and field sales to reach the assigned business targets.
f ) Field merchandising manager - He/she manages the relationship with the senior store oper-
ations personnel of a number of trade accounts. - The purpose of the job is (a) to lead the field merchandising
team, (b) to guarantee nationwide in-store presence to company brands, and (c) to ensure best-in class in-store execution, supporting all trade marketing activities, trade projects, promotional events, and products launches.
Most sales teams have at least a national account director or an equiva-lent manager, responsible for all the national agreements. Only in the smallest companies, this role is carried out by the sales team leader in per-son. In large organizations, the area sales management team is often led by a field sales director. The management of the multilevel customer inter-face is not univocal with one job corresponding exclusively to the interac-tion with one level of the customer structure, as shown in Figure 4.2.
The interface of international buying groups
International buying groups want to leverage the combined scale of their members and ask for incremental rebates on top of national agreements.
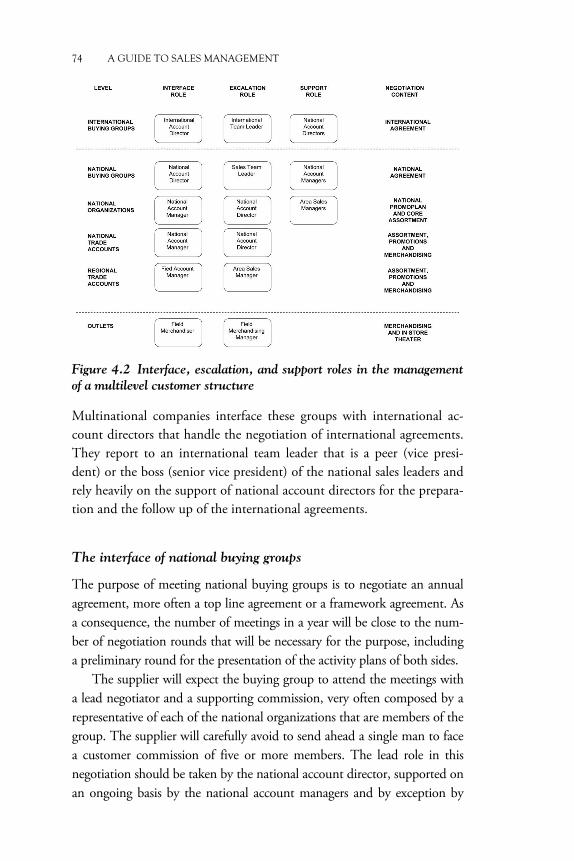
74 A GUIDE TO SALES MANAGEMENT
Figure 4.2 Interface, escalation, and support roles in the management
of a multilevel customer structure
Multinational companies interface these groups with international ac-count directors that handle the negotiation of international agreements. They report to an international team leader that is a peer (vice presi-dent) or the boss (senior vice president) of the national sales leaders and rely heavily on the support of national account directors for the prepara-tion and the follow up of the international agreements.
The interface of national buying groups
The purpose of meeting national buying groups is to negotiate an annual agreement, more often a top line agreement or a framework agreement. As a consequence, the number of meetings in a year will be close to the num-ber of negotiation rounds that will be necessary for the purpose, including a preliminary round for the presentation of the activity plans of both sides.
The supplier will expect the buying group to attend the meetings with a lead negotiator and a supporting commission, very often composed by a representative of each of the national organizations that are members of the group. The supplier will carefully avoid to send ahead a single man to face a customer commission of five or more members. The lead role in this negotiation should be taken by the national account director, supported on an ongoing basis by the national account managers and by exception by
ORGANIZATIONAL ROLES AND RESPONSIBILITIES 75
the sales team leader (sales vice president), that will be present at the opening round, but not necessarily attend all the other meetings. In some cases, the national account director may decide to empower one of his national account managers as negotiation lead. It is essential that all roles are clear before sitting at the negotiation table. Inevitably, there will be some role playing on both sides and the supplier will identify the hawks and doves on the other side of the table and decide a contact strategy for the time between the meetings.
The interface of national organizations
The purpose of meeting national organizations is to implement the agreement negotiated with the national buying group, building the joint national promotional plans and the core assortments.
The lead role in this contact should be taken by the national account manager, supported on an ongoing basis by one or more of the area sales managers that regularly visit the most important regional customers that are part of the national organization. The national account director will meet organizations only once or twice a year as part of the contact strat-egy designed for each organization, and will be directly involved in the discussion of assortments and promotions only by exception.
The interface of national and regional trade accounts
There are basically two reasons for meeting national or regional customers: management of the order to cash cycle (mostly, but not exclusively for order taking) and joint business planning. There is always the need to finalize the annual agreement previously discussed at national buying group and national organization level with a second- (or third-) level negotiation, that will result in a detailed assortment plan, a detailed merchandising plan, and a detailed promotional plan for the specific customer. Initiatives to support new store openings or customer special promotions will also be discussed. With national trade accounts, the lead role in this negotiation is taken by the national account manager and only by exception by the national account director. With regional trade accounts, the lead role is usually assigned to area sales managers, but in some cases, field account managers are empowered to lead and area sales managers intervene only by exception.
76 A GUIDE TO SALES MANAGEMENT
The interface of outlets: field marketing
Negotiations with national buying groups, national organizations, and national or regional customers are only the beginning of the story and the first part of a job that is not completed unless well executed in store. At this point, field marketing comes into play. The field marketing ac-tivities that a sales team can manage to make things happen in store can be grouped as follows:
1. Field merchandising: a program of direct (including order taking) or indirect store activation calls to guarantee in-store execution of agreed assortments, promotions, and merchandising.
2. Physical merchandising: the replenishment of permanent primary and secondary displays (rack jobbing) and the set up and replen-ishment of temporary promotional displays.
3. Promoting to store personnel: training shop assistants on the technical features and benefits of the product range with the aim to improve their recommendation rate to shoppers.
4. Promoting to shoppers: product tasting or sampling and offer-ing special deals including gift with purchase on new products or multiple buys.
5. Store audit: collecting store data to measure point of purchase performance indicators and check compliance to plans—this area may also include mystery shopping.
These five groups of activities require different job profiles and are carried out by different people and not necessarily in the same panel of stores. As most of these tasks are very often outsourced to variabilize their cost, there is a need to identify in the sales team a focal point re-sponsible for their definition, coordination, and integration. The main responsibilities of the field marketing area are the following:
• Define store visit procedures for merchandisers, rack jobbers, replenishers, promoters, and store auditors.
• Define store coverage for each initiative. • Select and brief sourcing agencies and recruit field marketing
personnel. • Define performance measurement methodologies and incentive
plans.
ORGANIZATIONAL ROLES AND RESPONSIBILITIES 77
• Monitor and improve field marketing team profiles through skills and competences training programs.
• Set field marketing team priorities and goals and track results. • Control all trade activities performed in the field and ensure
their full alignment to company strategies and guidelines. • Support all trade marketing activities, managing point of
purchase deployment and controlling fixed assets status when needed.
• Manage timing and logistic issues connected to field marketing materials.
• Collect field data and conduct ad hoc surveys. • Provide actionable weekly reports of field activities.
The back office roles
The sales back office traditionally plays three main roles: sales operations, trade marketing, and customer service. I will analyze each of them in de-tail along with sales finance and strategy development, a new emerging area linked to optimizing the management of trade spending.
Sales operations
The traditional role of the sales operations team is to provide analytical, practical, and technical support to all the members of the sales team, from sales vice president to field account managers and merchandisers. Therefore, the standard responsibilities of sales operations are as follows:
• Communication: managing and facilitating internal and external communication of trade terms, product specifications, product availability, portfolio changes, deadlines, meetings, and events.
• Sales analysis and reporting: preparing standard and ad hoc reports for all available internal and external sales data, including secondary sales, point of purchase, and EPOS data.
• Target setting: determining sales targets by period, by channel, customer, area and territory, and by category and brand.
78 A GUIDE TO SALES MANAGEMENT
• Sales incentives: developing and managing sales incentives programs.
• Sales control: checking compliance to trade terms policies. • Methods, systems, and IT tools: developing and managing
customer hierarchy, pricing procedure model, sales reporting model, sales technology and sales force automation tools, EPOS data management, and electronic interfaces with customers—electronic data interchange (EDI), vendor-managed inventory, collaborative planning, forecasting and replenishment (CPFR®), and e-catalogs.
• Sales aids: distributing catalogs, sales folders, and samples. • Training: identifying needs and rolling out training programs. • Meetings and events: organizing and facilitating all meetings
and events of the sales team. • Sales overheads: managing the sales team overheads, including
all the costs for travel, accommodation, cars, meetings and events, and sales incentives programs.
Trade marketing
Trade marketing is the activation of trade accounts, sales channels, and outlets with the aim to reach shoppers in store with an optimal mix of assortment, merchandising, pricing, and promotion. There are a few implications of this definition:
• Trade marketing has a dual target with accounts, channels, and stores coming first in sequential order, but second in terms of relevance.
• There is not an optimal mix for all stores, but an optimal mix for each store format: the same shopper will expect a different offering when he switches from a store format or a banner to another depending on his shopping mission.
• Trade marketing does not fully coincide with the so-called below the line activities2.
2Below the line activities include direct mailing, telemarketing, in-store promotions, leaf-lets, point-of-sale materials, collections, fidelity programs, and comarketing activities. The distinction between above the line (ATL) and below the line (BTL) activities is attributed
ORGANIZATIONAL ROLES AND RESPONSIBILITIES 79
• Trade marketing is both strategic and operational. • There is a lot of common ground for manufacturers and
trade accounts if they decide to focus on the shopper.
The evolution of trade marketing is the story of additional compo-nents and responsibilities: operational activities and support to sales force were progressively integrated by visual merchandising, category manage-ment, customer marketing, and shopper marketing. Basic trade marketing activities are organized either by category or by channel and are about:
• Supporting and monitoring new product introductions • Supporting and monitoring the execution of promotional
activities • Managing trade terms and special offers • Managing sales forecasting • Managing trade market development costs • Measuring and reviewing performance and profitability.
The support to sales force consists of information, market data, sales aids (catalogs, customer presentations, folders, product specifications, and samples), and basic point of sale materials.
Visual merchandising is usually the first development vector of trade marketing activities. At some point, normally when there is no easy ad-ditional gain available from additional distribution or promotion, the trade marketing team becomes increasingly aware of the importance of silent selling and starts to:
• Tailor promotional point of sale materials by channel or store format: over the counter displays, free standing units, ready to sell quarter/half/full pallets.
by Michael Baker (1987) to the top management of Procter and Gamble, that in 1954 allowed marketing agencies to charge a fee for mass advertising activities (television, cin-ema, radio, print, and outdoors) that were considered capital expenditure and ATL, but not for other marketing activities that were classified as current expenditure and BTL. Some practitioners today prefer to talk about an integrated communication approach, or through the line (TTL), where a mix of ATL and BTL are used to integrate efforts and optimize returns.
80 A GUIDE TO SALES MANAGEMENT
• Develop planograms by channel or store format to be recommended to store managers.
• Develop solutions to improve the category or brand visibility in permanent displays with tools like shelf ready packaging, shelf trays, vacuum formed trays, shelf dispenser trays, shelf banners, shelf talkers/stoppers, shelf edge strips, shelf carpets, header boards, and floor stickers.
• Develop ideas for merchandising augmentation like cross category merchandising, secondary placements, and store in store.
• Provide solutions for service augmentation delivering additional information like recipes (food), descriptions and matching suggestions (wines), usage recommendations (health and beauty), and technical specifications (consumer electronics) on educational leaflets, cards, or electronic supports.
• Prepare training programs for the sales force to underline the importance of store layouts, in-store communication, store equipment, and store displays and to enable them to become visual merchandising consultants for their stores.
In addition to this, manufacturers that sell through specialist stores (pharmacies, perfumeries, confectionery, etc.) also need to develop solu-tions for window displays and train their sales force accordingly. Visual merchandising is much more than this in the context of direct retail mar-keting, for instance, in brand fashion and luxury multiples, where every detail from window, store entrance, floor, ceiling, walls, layout, fixtures, signage, and displays to colors, textures, lines, shapes, lights, sounds, and fragrance is very carefully planned and periodically reviewed.
Visual merchandising can also be described as a process with the same structure of the attention, interest, desire, action (AIDA) method3 for writing advertising copy, where shopper attention (A) is sought through 3The AIDA acronym was first introduced by C. P. Russell (1921), but a similar con-cept had already been developed and progressively refined by Joseph Addison Rich-ards (1893), Elias St. Elmo Lewis (1903), Fred Macey of the Bissell Carpet Sweeper Company (1900), Frank Hutchinson Dukesmith (1904), Arthur F. Sheldon (1911)—who added satisfaction to the first four components and Harry D. Kitson (1920)—who added confidence after desire and satisfaction after action.
ORGANIZATIONAL ROLES AND RESPONSIBILITIES 81
shop windows, store layout, and display; shopper interest (I) is generated through assortment, illustration of product benefits, seasonal, and promo-tion displays; shopper desire (D) is aroused through merchandising and service augmentation, product trial and extending the product benefits with usage suggestions; shopper action (A) is facilitated by making the de-sired item easy to shop in terms of visibility and access to shelf.
Category management
In the context of manufacturing and retailing, category management is both an organizational model and a business process, a component of business planning. As a way of working, it is the second development vector of trade marketing activities.
The concept of category management was proposed in the late 1980s by Professor Brian F. Harris of the University of Southern California, who suggested that retailers could improve their performance focusing on the shopper and managing categories as strategic business units. In 1990, Harris founded the Partnering Group, a category management consultan-cy based in Cincinnati, Ohio, and in 1995, he developed the eight-step category management model, which was soon adopted by ECR organiza-tions throughout the world.4 I intend to show that the model is essentially a very useful business process that a manufacturer’s trade marketing team can follow to prepare, execute, and review category-focused business plans, which can be shared in various degrees with customers. The eight steps of the category management model (see Figure 4.3) in their sequen-tial order are as follows:
1. Category definition: determining the components and structure of the category.
2. Category role: assigning the strategic role that the category will play in the retailer’s portfolio.
3. Category assessment: measuring the category performance and identifying opportunities.
4I follow the version of the model contained in the ECR North America Category Management Report by The Joint Industry Project on Efficient Consumer Response (Category Management Subcommittee) and The Partenering Group, Inc. (1995). The same model later appeared with minor changes in the ECR Europe Category Management Best Practices Report by The Partnering Group and Roland Berger & Partners (1997), one of the most famous ECR Europe blue books. Influential cate-gory management books were also published by AC Nielsen in 1992 and 2006.
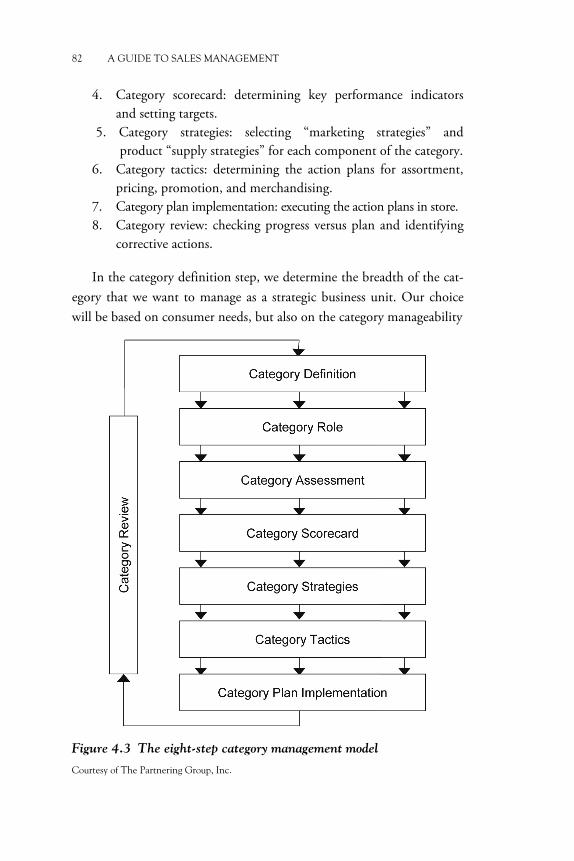
82 A GUIDE TO SALES MANAGEMENT
4. Category scorecard: determining key performance indicators and setting targets.
5. Category strategies: selecting “marketing strategies” and product “supply strategies” for each component of the category.
6. Category tactics: determining the action plans for assortment, pricing, promotion, and merchandising.
7. Category plan implementation: executing the action plans in store. 8. Category review: checking progress versus plan and identifying
corrective actions.
In the category definition step, we determine the breadth of the cat-egory that we want to manage as a strategic business unit. Our choice will be based on consumer needs, but also on the category manageability
Figure 4.3 The eight-step category management model
Courtesy of The Partnering Group, Inc.
ORGANIZATIONAL ROLES AND RESPONSIBILITIES 83
and measurability. For instance, we might decide to work on health and beauty or progressively narrow our focus down to personal care or hair-care. Assuming that we choose hair-care, we need to be very clear on the consumer needs that we want to satisfy with the products that we will include in the category. If we are too broad and generic in the definition of the consumer needs we can end up with a very broad, unmanageable and immeasurable category. If we say that the category will satisfy the need for nice looking hair, we might have to include in it not only the hair cleaning and care products, but also hair-care accessories and tools like combs, brushes, and hairdryers and hair-care services like those pro-vided by hairdressers and hairstylists. In a grocery store this might be simply too much and absolutely unmanageable. If we say that the cate-gory will satisfy the need for washing, caring, and enhancing our hair at home and exclude accessories and tools, as it is often the case with oral care and body care, there we are with a hair-care category made up by the shampoo, conditioner, hair styling, and hair colorants subcategories. You can always wash your hair with soap, bath foam, or shower gel, but that is not the primary need that these products are formulated to satis-fy. While it may seem very obvious that hair-care breaks down in the segments mentioned above, it is not always straightforward to answer how every segment is subsegmented, and to say, for example, which is the consumer decision tree for shampoo (see Figure 4.4). Retailers lack the knowledge and expertise to work out detailed consumer decision trees and rely heavily on the input of leading suppliers, expecting them to provide guidance, based on insights derived from market research. Every trade marketing team should very carefully prepare and periodi-cally review accurate customer facing category definitions for its major categories, as if it had to start joint category management projects5.
5Retailers are always keen to understand the articulation and the expected dynamics of the category. To put it in the terminology used by Glendinning–Kantar Retail they want to hear about the supplier’s category vision and category value drivers.
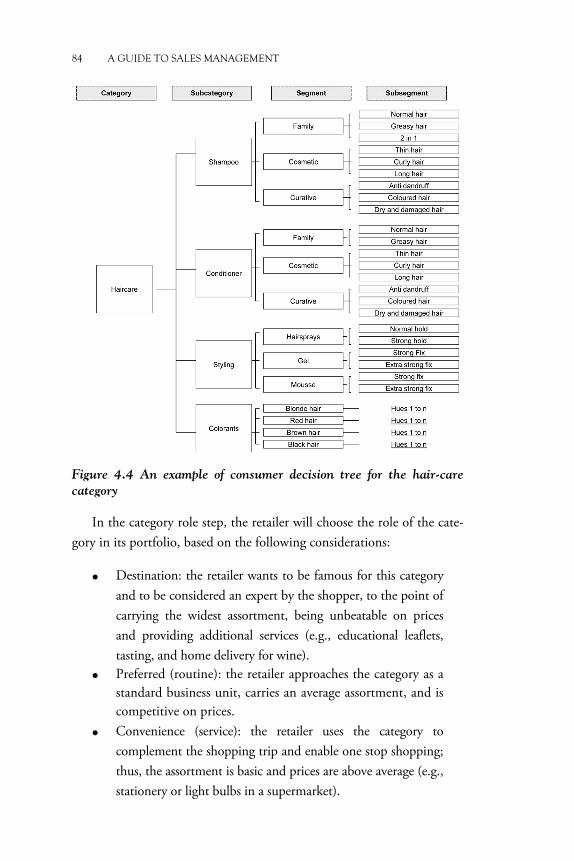
84 A GUIDE TO SALES MANAGEMENT
Figure 4.4 An example of consumer decision tree for the hair-care
category
In the category role step, the retailer will choose the role of the cate-gory in its portfolio, based on the following considerations:
• Destination: the retailer wants to be famous for this category and to be considered an expert by the shopper, to the point of carrying the widest assortment, being unbeatable on prices and providing additional services (e.g., educational leaflets, tasting, and home delivery for wine).
• Preferred (routine): the retailer approaches the category as a standard business unit, carries an average assortment, and is competitive on prices.
• Convenience (service): the retailer uses the category to complement the shopping trip and enable one stop shopping; thus, the assortment is basic and prices are above average (e.g., stationery or light bulbs in a supermarket).
ORGANIZATIONAL ROLES AND RESPONSIBILITIES 85
• Seasonal destination. • Seasonal convenience.
Retailers normally cannot afford to manage more than 5 to 10 percent of the categories as destination, less than 55 to 60 percent as routine, and more than 25 to 30 percent as convenience6. Suppliers should foresee the prevalent category role by channel or key customer and plan accordingly. They should also be very clear on the implications when recommending a category role.
In the category assessment step, the category performance is measured through the analysis of market data, retailer data, consumer and shopper data, and supplier data. The key questions to be answered are which seg-ments and brands are driving the market evolution, which are the leading channels and retailers, how is the shopper behaving in store, which are the consumption patterns, and who are most efficient and powerful suppliers. The purpose of the assessment is to identify the biggest improvement op-portunities for turnover, profit, and return on assets that exist in the cate-gory. As such, the assessment is not an additional piece of work to what a trade marketing team normally does for business planning; only, it might be more detailed if focused on a specific customer.
The category scorecard is a set of performance measures including fi-nancial, market share, productivity, shopper, and customer-service objec-tives, and providing an overview of the total category business performance.
In the category strategies step, “marketing strategies” and product “supply strategies” are selected and applied to each component of the cat-egory, be it an item or a subsegment or a segment, with the aim to deliver the category role and objectives. "Marketing strategies" have been stand-ardized as follows:
1. Traffic building: utilizing top of mind items that the shopper actively seeks in store.
2. Transaction building: utilizing bigger size items and special packs. 3. Share (turf) protecting: utilizing items determining the retailer’s
market share.
6Sometimes an intermediate positioning between destination and routine can be adopted by retailers that do not want to be too aggressive on pricing.
86 A GUIDE TO SALES MANAGEMENT
4. Profit generating: utilizing items with higher gross margin. 5. Cash generating: utilizing high rotation items with more favor-
able payment terms. 6. Excitement creating: utilizing innovations and renovations. 7. Image enhancing: utilizing premium and high value items.
The choice of “marketing strategies” is linked to and influenced by the selected category role, so that, for instance, we will very likely apply traffic building, transaction building, share protecting, excitement creating, and image enhancing strategies to a destination category and alternatively traffic building, profit generating, and cash generating strategies to a convenience category. The map showing the selected strategies and the items associated to each of them is often called stratogram (see Figure 4.5).
Product “supply strategies” are the supply chain techniques that are available for the category, such as direct store delivery, distribution center delivery, cross-docking, orders and invoices via electronic data interchange, vendor-managed inventory, minipallets, ready to sell items, etc. They can also be included in the stratogram when changes are required as part of the new plan.
In the category tactics step, we decide what to do in terms of assort-ment, pricing, promotions, and merchandising. Assortment can range from limited, to broad and to virtually complete; pricing can vary from acceptable, to competitive and to leading; promotions can be limited, competitive or aggressive; merchandising can be in a lesser location, an average location or a best location.
The choice of tactics is linked to and influenced by the selected category role, so that in a convenience category, we will plan a limited assortment, with acceptable pricing, limited promotions, and merchandising in a lesser location, while for a destination category, we will plan exactly the opposite. “Marketing strategies” also have an impact on our tactical choices, so that, for instance, transaction building implies a preference for an assortment of high value and bigger size items that are priced more aggressively, promoted more often and get more space off shelf than the rest of the category, while profit generating implies a preference for an assortment of high profit items that are priced as highly as possible within the limits of price sensitivity, never promoted with cut price offers and displayed in an average or lesser location.
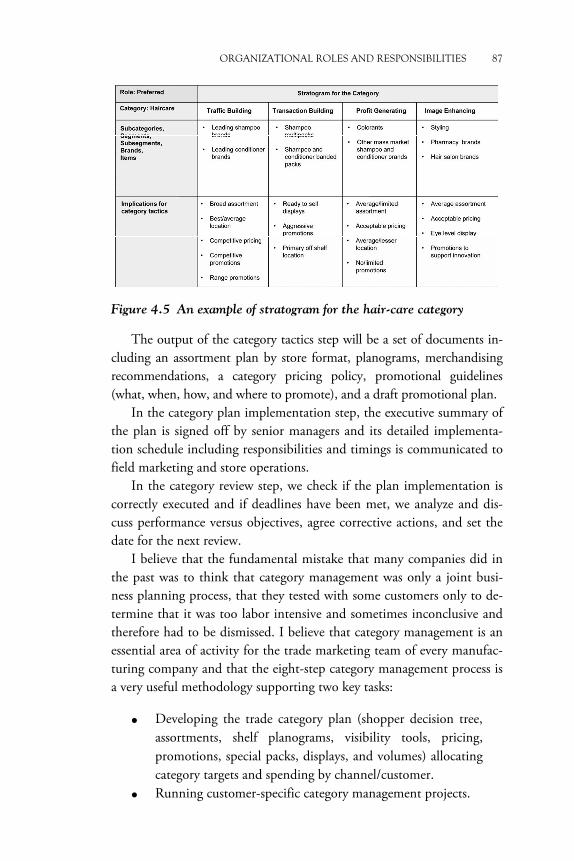
ORGANIZATIONAL ROLES AND RESPONSIBILITIES 87
Figure 4.5 An example of stratogram for the hair-care category
The output of the category tactics step will be a set of documents in-cluding an assortment plan by store format, planograms, merchandising recommendations, a category pricing policy, promotional guidelines (what, when, how, and where to promote), and a draft promotional plan.
In the category plan implementation step, the executive summary of the plan is signed off by senior managers and its detailed implementa-tion schedule including responsibilities and timings is communicated to field marketing and store operations.
In the category review step, we check if the plan implementation is correctly executed and if deadlines have been met, we analyze and dis-cuss performance versus objectives, agree corrective actions, and set the date for the next review.
I believe that the fundamental mistake that many companies did in the past was to think that category management was only a joint busi-ness planning process, that they tested with some customers only to de-termine that it was too labor intensive and sometimes inconclusive and therefore had to be dismissed. I believe that category management is an essential area of activity for the trade marketing team of every manufac-turing company and that the eight-step category management process is a very useful methodology supporting two key tasks:
• Developing the trade category plan (shopper decision tree, assortments, shelf planograms, visibility tools, pricing, promotions, special packs, displays, and volumes) allocating category targets and spending by channel/customer.
• Running customer-specific category management projects.
88 A GUIDE TO SALES MANAGEMENT
Customer marketing
There is no doubt that many manufacturers were disappointed by catego-ry management. Many projects with customers were started only to last for months and months without ever being implemented in store. Lack of top management endorsement and job rotations were the main root causes for projects ending up stuck. Losing momentum and commitment from the bosses were the most common risks for whoever engaged in spe-cific projects with customers. I was lucky enough to be involved in three joint projects that materialized in store with significant and beneficial changes in assortments and planograms, but I also enjoyed my fair share of frustration due to false starts, range reviews that were never signed off and new shelf displays that lasted only for a few months or were never implemented.
As a result, after the enthusiasm of the 1990s, many managers started to rethink category management and to become more cautious in the se-lection of potential partners. There was a tendency to develop lighter ver-sions of category management, very often limiting its scope to efficient assortment or efficient merchandising, and there was a search for new ways to collaborate with customers. This change is also reflected in the evolution of the content of the ECR Europe demand side blue books from the year 2000 onwards. After the proposal of “day to day category management” as a lighter version of the category management model, the focus was on other topics such as collaborative POS data management, collaborative consumer relationship management, shopper marketing, and joint business planning, while on the supply side the centers of attention became collaborative planning and forecasting, transport optimization, packaging design, and on-shelf availability.
All the ECR demand side topics are potential components of cus-tomer marketing, while all the supply side themes are integral parts of customer-service development.
Customer marketing is an advanced approach to trade marketing in which the activation of customers aims to reach shoppers in store with an optimal mix of assortment, merchandising, pricing, and promotion and is based on the development of strong relationships with the customers’ marketing departments, the deep understanding of the customers’ retail strategies and shoppers, and the usage of EPOS data and loyalty card data.
ORGANIZATIONAL ROLES AND RESPONSIBILITIES 89
The customer marketer will develop customer and shopper insights that will be the basis to prepare customer-specific solutions, such as spe-cial packs and displays, secondary packaging, in-store events, loyalty programs, and potentially even exclusive items.
A customer or shopper insight is in essence the same as Taylor and Nichols’s (2010) consumer insight: “a penetrating, discerning understand-ing that unlocks an opportunity.”
The convenience store close to my place is well aware that its key competitors are the open market on Wednesdays and the big box stores on Saturdays, when most shoppers do their bulk shopping. You can easily guess on which days they play the one day only unmissable offers orga-nized by their headquarter.
Shopper marketing
The conceptual limit of category management is in its definition and focus on categories. If the identification of categories as fundamental business units is very practical and convenient for the middle managers of both retailing and manufacturing, there is a broader scope that can-not be satisfied by category management, namely, the holistic shopper understanding.
The top executives of large retailers are keen to know who they shop-pers are, their level of loyalty, where else, how, when, and why they shop. They want to understand how much of their shopper reach (penetration) they are able to turn into shopper visits to their stores and then convert in-to actual sales. They want to understand the visit frequency and the average spend of their shoppers and the average number of macrocategories (e.g., health and beauty) and categories (e.g., hair-care) that end up in their baskets, in order to plan the strategic actions that will improve these results. On the other hand, the top executives of large manufacturers realize that they cannot content themselves with the knowledge of the lower levels of the shopper conversion chain (see Figure 4.6), where macrocategory pur-chases are translated into category, subcategory (in our example, shampoo, conditioner, styling products, and colorants) and brand purchases. They acknowledge that understanding the shopper profile, frequency of pur-chase, and average spend of macrocategories, categories, subcategories, and
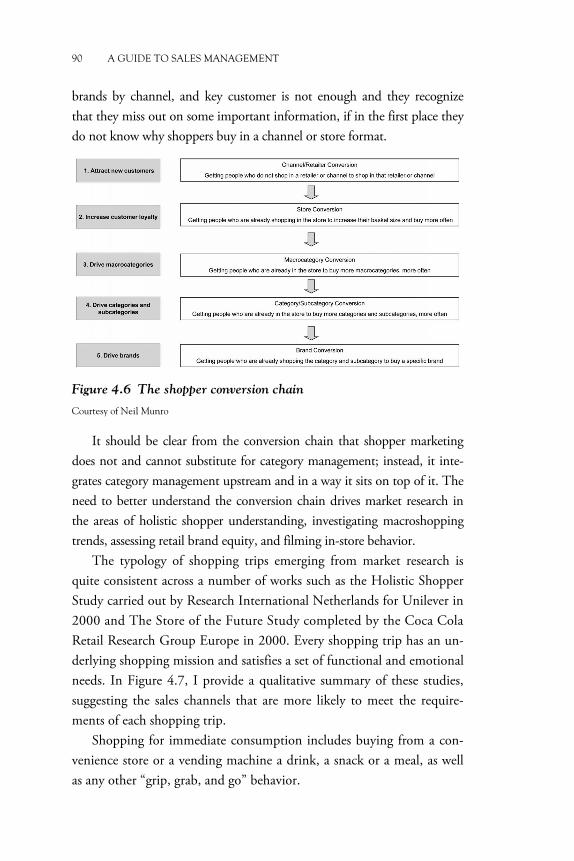
90 A GUIDE TO SALES MANAGEMENT
brands by channel, and key customer is not enough and they recognize that they miss out on some important information, if in the first place they do not know why shoppers buy in a channel or store format.
Figure 4.6 The shopper conversion chain
Courtesy of Neil Munro
It should be clear from the conversion chain that shopper marketing does not and cannot substitute for category management; instead, it inte-grates category management upstream and in a way it sits on top of it. The need to better understand the conversion chain drives market research in the areas of holistic shopper understanding, investigating macroshopping trends, assessing retail brand equity, and filming in-store behavior.
The typology of shopping trips emerging from market research is quite consistent across a number of works such as the Holistic Shopper Study carried out by Research International Netherlands for Unilever in 2000 and The Store of the Future Study completed by the Coca Cola Retail Research Group Europe in 2000. Every shopping trip has an un-derlying shopping mission and satisfies a set of functional and emotional needs. In Figure 4.7, I provide a qualitative summary of these studies, suggesting the sales channels that are more likely to meet the require-ments of each shopping trip.
Shopping for immediate consumption includes buying from a con-venience store or a vending machine a drink, a snack or a meal, as well as any other “grip, grab, and go” behavior.
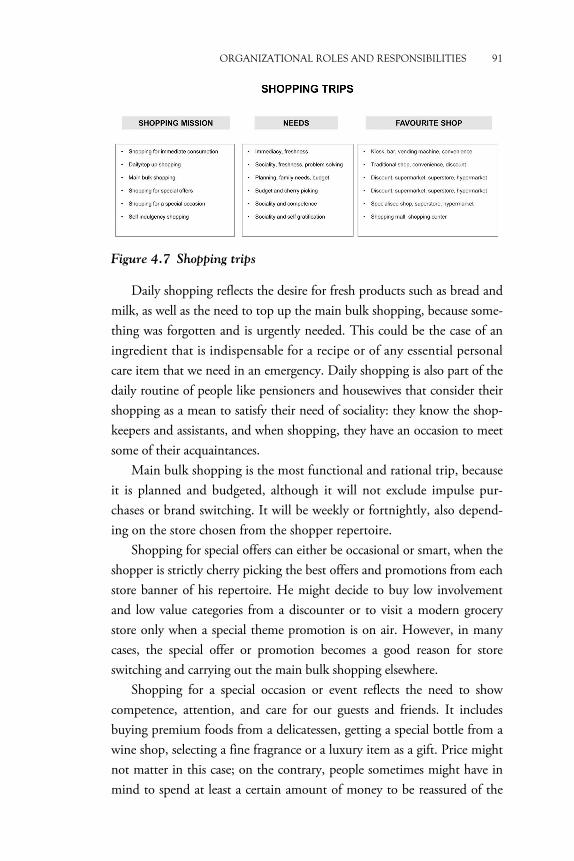
ORGANIZATIONAL ROLES AND RESPONSIBILITIES 91
Figure 4.7 Shopping trips
Daily shopping reflects the desire for fresh products such as bread and milk, as well as the need to top up the main bulk shopping, because some-thing was forgotten and is urgently needed. This could be the case of an ingredient that is indispensable for a recipe or of any essential personal care item that we need in an emergency. Daily shopping is also part of the daily routine of people like pensioners and housewives that consider their shopping as a mean to satisfy their need of sociality: they know the shop-keepers and assistants, and when shopping, they have an occasion to meet some of their acquaintances.
Main bulk shopping is the most functional and rational trip, because it is planned and budgeted, although it will not exclude impulse pur-chases or brand switching. It will be weekly or fortnightly, also depend-ing on the store chosen from the shopper repertoire.
Shopping for special offers can either be occasional or smart, when the shopper is strictly cherry picking the best offers and promotions from each store banner of his repertoire. He might decide to buy low involvement and low value categories from a discounter or to visit a modern grocery store only when a special theme promotion is on air. However, in many cases, the special offer or promotion becomes a good reason for store switching and carrying out the main bulk shopping elsewhere.
Shopping for a special occasion or event reflects the need to show competence, attention, and care for our guests and friends. It includes buying premium foods from a delicatessen, getting a special bottle from a wine shop, selecting a fine fragrance or a luxury item as a gift. Price might not matter in this case; on the contrary, people sometimes might have in mind to spend at least a certain amount of money to be reassured of the
92 A GUIDE TO SALES MANAGEMENT
quality and perceived value of what they buy. No wonder that this is the shopping mission that hypermarkets, superstores, and e-retailers try to steal from specialist and multispecialist stores.
Self-indulgency shopping includes “blowing out” to look for a special treat for ourselves, but also “breaking free” and killing time. Window shopping is not at all pointless; some people find it relaxing and very use-ful to look for ideas for future purchases or simply to keep themselves up to date with the trends. The key feature of self-indulgency shopping is the predominance of the self-gratification element, which makes it different from shopping for special occasions, where the social component is more relevant.
The key implication of this plurality of shopping trips is that they generate a variety of in-store behaviors and buying decisions as opposed to the one and only physical merchandising solution (layout, equip-ment, display, etc.) that a retailer can implement in a store, so that it becomes crucial to identify for every store the 20 percent of the shop-ping trips that generate 80 percent of the revenues and to work out how to respond to shopper behaviors in the best way in order to maximize the return from these shopping trips. In the western world, the decline of the relative weight of main bulk shopping can be the reason why some big box stores are in trouble, while the increase of weight of daily and top up shopping can explain why all major retailers are putting so much effort in optimizing their offering in the convenience sector.
Some authors like Paco Underhill, Herb Sorensen, and Siemon Scamell-Katz dedicated a lot of time and effort to understanding shop-per behavior, buying decisions, movements, traffic flow, migration pat-terns, and footfall in store with the aim to identify some basic rules to be followed to improve the shopping experience and to single out simple interventions that can have dramatic impact on sales.
Paco Underhill (1999) based his work on observing and tracking people in-store behavior. He moved from the realization that most re-tailers and marketers do not know much about their shoppers’ conver-sion rate, average time spent in store, and interception rate (= amount of contact with shop assistants) and about the root causes of these perfor-mance indicators. He explored (a) the mechanics, (b) the demographics, and (c) the dynamics of shopping and came up with a number of very
ORGANIZATIONAL ROLES AND RESPONSIBILITIES 93
practical tips for all kind of practitioners, from store designers to store managers: a set of golden rules that also a manufacturer’s sales team should be very familiar with.
The mechanics of shopping include the transition zone, the right handed bias, signs readability, and shoppers’ movements and needs.
When shoppers enter a store, they somehow need to decompress and adapt to the new environment; as a result, they will not pay much atten-tion to messages and displays and will experience the doorway and the landing strip (sometimes also the store window and the car park) purely as a transition zone, where they turn to a new mode and have no time to pay attention to external inputs.
People only have two hands, and as they are carrying something most of the times, they tend to leave their right hand free for grabbing, hence the right handed bias, which must be heeded for. People only have two hands and need a shopping aid, be it a cart, a basket or a tote, and they need to find it in the right place (just after store entrance and somewhere else inside the store) and at the right height, so that they do not have to bend over to pick it up.
Signs readability is not only a matter of right typeface, color, and layout, but also of location and timing: signs must be in the right place at the right time. Each store is a collection of zones and each zone is right for one kind of message, depending on what the shopper is most likely to be doing in that zone and the seconds that will be available to him to read the signs. To achieve maximum exposure “a sign should in-terrupt the natural existing sight lines in any given area.” When we de-vise our signage strategy we should consider when it is more likely that the shopper will have the right amount of time and the desire to read our message. In a waiting area or queuing at a counter, a shopper will consider messages for over five seconds and he is more inclined to read a sign on his way out from the bathroom, inside an elevator or when leav-ing the elevator and landing on a floor.
Underhill remarked that shoppers move like people: they do not “walk like an Egyptian,” they face and walk forward. The majority of them walk to the right, go through the store in loops, and tend to reach right, when they are in front of a shelf. These right leaning biases and flow patterns should be carefully considered when planning a store layout and
94 A GUIDE TO SALES MANAGEMENT
displays. Shoppers sometimes need to take a rest, be it a short pause inside the store by the fitting rooms, a medium-term break just outside the store or a long-term stop in a shopping mall. “A chair says we care” and in many stores sales would be increased by the addition of seating places. Shoppers like to test products and should be allowed to do so.
The demographics of shopping explore the needs and the differences between men, women, senior citizens, and kids. Men are hunters and love to do their shopping very quickly: they want “grab and go” zones. They shop less often, and therefore, their level of conversion can be higher and their attention to price can be lower than that of women, especially in some categories. Men do not ask for directions, they prefer to get infor-mation first hand. Women are gatherers and demand more than men of shopping environments. Ideally, they prefer to shop with a female friend and browse as much as possible: they want “dwell” zones, catchment ba-sins where they can feel comfortable. The traditional hardware store is their nightmare kind of shop. Senior citizens tend to have eyesight prob-lems and therefore prefer 12–13 point type text on the product packs, graphic images on signs, maximum contrast (e.g., dark, red, or black on white) to subtle gradations of color, and bright illumination, because their eye retinas receive less light. They prefer to avoid stooping, bending, and stretching to get the product they want, they prefer ramps to steps, they demand comfortable waiting areas, and would like to be instructed by their contemporaries. Kids go everywhere, they are the most tactile shop-pers, and normally have a very high media consumption that makes them strong and powerful influencers. The challenge for retailers is to balance not only child visibility and reach with child proof in display design, but also care for children needs with attention for their parents’ requirements. Last but not least the store layout will have to allow room for strollers and prams to move around the store.
The dynamics of shopping include what people like and dislike in the shopping interaction, the role of the five senses, the importance of prod-uct trial, the perception of the time spent in store, and customer service.
Shoppers love touching, mirrors, discovery, talking, recognition, and bargains; on the other hand, they hate too many mirrors, lines and queues, asking dumb questions, dipping and bending, out of stock’s, obscure price tags, and bad and intimidating service.
ORGANIZATIONAL ROLES AND RESPONSIBILITIES 95
Shopping is sensorial because many purchases are the result of the shopper seeing, touching, smelling, hearing, tasting, or testing a prod-uct. Shoppers build confidence through their senses and want to test the merchandise before they buy it; hence, the need for a good trial experi-ence and in the case of clothing for quality dressing rooms.
The time spent waiting in store will be perceived as bad time by the shopper. The perceived speed of transaction as anticipated watching a queue will influence the decision to stop or not at a newsstand, a kiosk, a quick service restaurant, or a fashion store. The retailer will then need to take some measures to bend waiting time like providing employee contact and interaction, organizing orderly cashier lines, and diverting attention to something else: a TV screen, samples, signage, and merchandising materials.
Customer service includes the location of the checkout counter, that should be neither at the store entrance nor in the middle of the shop floor and should be separated from any other “wrap,” “repair” and “return” ser-vice desk. Customer service is also about shopper education, providing in-formation about the product benefits as well as product usage suggestions.
Herb Sorensen (2009) realized that shoppers spend only 20 percent of their time in store selecting purchases, wasting the remaining 80 per-cent in transit. He suggested that retailers should help shoppers putting the products they need in their path, so that they can spend less time walking and more time buying.
Sorensen singled out three shopping patterns: the quick trip, the fill in, and the stock up. He noticed that while most retail stores are designed for large stock-up shopping trips, the majority of shopping trips are quick trips for only a few items that amount for a third of value sales. In addi-tion retailers offer thousands of items in their stores, but most households buy no more than 400 distinct items a year. Hence, there is a big oppor-tunity available to retailers in reducing the clutter and confusion in their shops, narrowing choices, and eliminating in-store navigation. Shoppers visiting the store for a quick shopping trip should be given the opportuni-ty to find most of what they need along a narrow loop in the shop as op-posed to the longer path followed by stock-up shoppers.
96 A GUIDE TO SALES MANAGEMENT
Sorensen noted that there are three moments of truth7 in the shopping process: reaching the shopper, stopping/holding the shopper, and closing the sale. In the first moment of truth, the customer visits, in the second, he shops, and in the third, he purchases. If he is in reach of a category, he is not necessarily shopping it, and if he is shopping it, he is not necessarily purchasing. When the customer visits, he can be exposed to a product or a display that is in his field of vision (happens to be in front of his eyes), but he is not necessarily engaged. When he shops he has been stopped and impressed and he is looking at and paying attention to a set of products to choose from. When he purchases, he makes a decision, he has been sold an item from the set that he considered. By the way, research suggests that fewer choices lead to higher sales. “Vision is at the center of the three moments of truth” as the eyes serve (a) as a pilot to navigate the store, (b) as a scanner of a category or set to choose from, and (c) as a feeder of the sales communication to the brain. The opportunity for the retailers that understand the three moments of truth is to “work with the shopper to expedite them”: fixtures and displays can be carefully prepared with the aim to facilitate and accelerate the shopping process.
Siemon Scamell-Katz introduced the use of eye tracking technology in store and conducted shopper research for Procter & Gamble, Unilever, Coca Cola, and major retailers. In his 2012 book, he described how he applied the shopper insights that he derived from his research work to the design of multimission stores able to respond effectively to a variety of
7The concept of “moment of truth” was introduced by Jan Carlzon (1987). It was ap-plied by A. G. Lafley (2013) to focus Procter & Gamble’s organization on winning two critical moments: the first moment of truth (3–7 seconds) that occurs in store when the shopper looks at the shelf and decides which brand and product to buy, and the second moment of truth that occurs out of store when the product is used and the consumer is delighted or not. Blackshaw (2008) of Nielsen Online suggested that there is a third moment of truth that occurs when the product experience is told by the consumer, when he advocates or not for the brand. This is the moment of reputation and credibility. Berkowitz (2011) noted that this moment of truth “is infinite in three ways: a consumer can share such experiences with a nearly infinite number of people directly and indirectly; there are infinite ways a consumer can share such experiences; and the consumer can share such experiences over an infinite period of time.” Lecinski (2011) singled out the zero moment of truth as the moment that occurs when the shopper is looking for prod-uct information online. Berkowitz (2011) remarked that the zero moment of truth of a shopper is fed by the third moment of truth of other shoppers in a kind of loop.
ORGANIZATIONAL ROLES AND RESPONSIBILITIES 97
shopping missions and gave very practical tips on the use of signage and the selection and in-store location of point of purchase materials that are meaningful for the shopper.
There are a few implications of the development of shopper marketing for a manufacturer’s sales team. Whoever is in charge of shopper market-ing will have to (a) develop familiarity with shopper data and shopper re-search findings on attitudes and behaviors, (b) understand the shopper DNA: what motivates the shopper, (c) generate shopper insights that are powerful enough to change the shopper behavior (better if they are unique insights), and (d) build plans to activate shoppers in store. The shopper marketing plan will suggest innovative displays, tailor-made promotions, comarketing activities, limited editions, and exclusive items, which are grounded in shopper understanding and answer more effectively to shop-ping needs in a channel or a banner.
Customer service
Customer-service activities can be grouped into two main areas: the man-agement of ongoing operations and the development of new initiatives.
Customer-service management includes the order to delivery process, after sale assistance and customer care. It might also include delivery to cash activities and credit management, as well as key preparatory steps of the order to cash (O2C) cycle, like master data management and the set-ting up of rebates in the enterprise resource planning (ERP) system.
O2C is the process of making a sale and then collecting the cash from this sale. It follows the sales process and it is about managing an order after a deal, fulfilling the order, delivering the goods, invoicing the customer, and collecting money, when the invoice is due for payment. The optimization of the O2C process delivers cost benefits and im-proves the company’s reputation as a result of improved customer satis-faction due to the reduction of operational issues.
Customer-service development consists both of internal and external ac-tivities. Many companies decide to focus internally when their customer-service results are poor and their personnel denote a lack of customer-service knowledge and proactivity. To respond to the need to change mindset and attitudes, they start training programs and workshops.
98 A GUIDE TO SALES MANAGEMENT
External activities are customer-specific projects that range from improving the way of working optimizing processes such as new product introduction and promotion management to sharing EPOS or secondary sales data, putting in place EDI, and efficient replenishment systems, optimizing transport, enhancing product packaging, and improving on-shelf availability.
Sales finance and strategy development
In the light of growing market development costs and trade marketing investments, many manufacturers dedicate more and more time, effort, and some back office resources to the analysis of their trade spending and the development of their sales strategy.
Sales finance can have both strategic and operational responsibilities. On a strategic level, it is in charge of the analysis of customer profitabil-ity, of the understanding of trade profitability, and of the pre- and post-evaluation of promotional events. Customer profitability is the customer contribution to the manufacturer’s profit as determined by trade terms, management costs, and product mix, while trade profitability is the manufacturer contribution to the customer’s profit as determined by volumes, front and back margins, and direct product costs8. The opera-tional responsibilities of sales finance are the management of rebates in the ERP system and the control of overdues, unless assigned to customer service.
Sales strategy development activities can include route to market analysis and retail strategy creation, customer-satisfaction surveys, chan-nel and customer mapping, the definition of trade terms strategy and structure, the coordination of pricing and the definition of the pricing procedure model, the preparation of the annual negotiation strategy, as well as any other activity to support the management of trade spending.
8Some retailers use direct product profitability or other SKU productivity measures as a guidance for their merchandising decisions.
ORGANIZATIONAL ROLES AND RESPONSIBILITIES 99
Takeaway Points
• Every sales team is organized around two pillars: (a) a frontline responsible for managing the customer interface and (b) a back office providing support to the frontline.
• The frontline is in charge of trade accounts and stores. Trade accounts are managed by field account managers and national account managers; stores are managed by field merchandisers.
• Area sales managers, national account directors, and field merchandising managers are the key coordinating roles of the frontline.
• When the customer structure is articulated in multiple levels the sales team needs to interface and negotiate with (a) the trade account, (b) its national organization, (c) its national buying group, and (d) its international buying group. In this case some of the frontline jobs have at the same time an interface, escalation, and support role.
• The back office plays three key roles: sales operations, trade marketing, and customer service.
• The sales operations team provides analytical, practical, and technical support to all the members of the sales team.
• The trade marketing team is in charge of the activation of trade accounts, sales channels, and outlets with the aim to reach shoppers in store with an optimal mix of assortment, merchandising, pricing, and promotion.
• The trade marketing role has evolved from basic support to the sales force to include visual merchandising, category management, customer marketing, and shopper marketing.
• Category management is essentially an eight-step process to develop and implement business plans that are consistent with the role (destination, preferred, and convenience) that the trade accounts attribute to the category in their portfolio.
• Customer marketing is based on the understanding of the customers’ retail strategies and shoppers to develop insights that drive the development of customer-specific solutions (promotions, packs, displays, loyalty programs, etc.)
100 A GUIDE TO SALES MANAGEMENT
• Shopper marketing focuses on the analysis of shopping trips and shopping missions that generate a variety of in-store behaviors and buying decisions.
• Shopper marketing is holistic and complementary to category management: the objective is to attract new shoppers to a store and to build their loyalty. Their conversion to more macrocategories and categories is left to category management.
• The findings of the authors that studied shopper in-store behavior have very practical implications any trade marketer should be familiar with.
• Customer-service activities can be grouped into two main are-as: the management of ongoing operations—all or part of the order to cash cycle—and the development of new initiatives.
• Sales finance and strategy development is an emerging role for the sales back office.
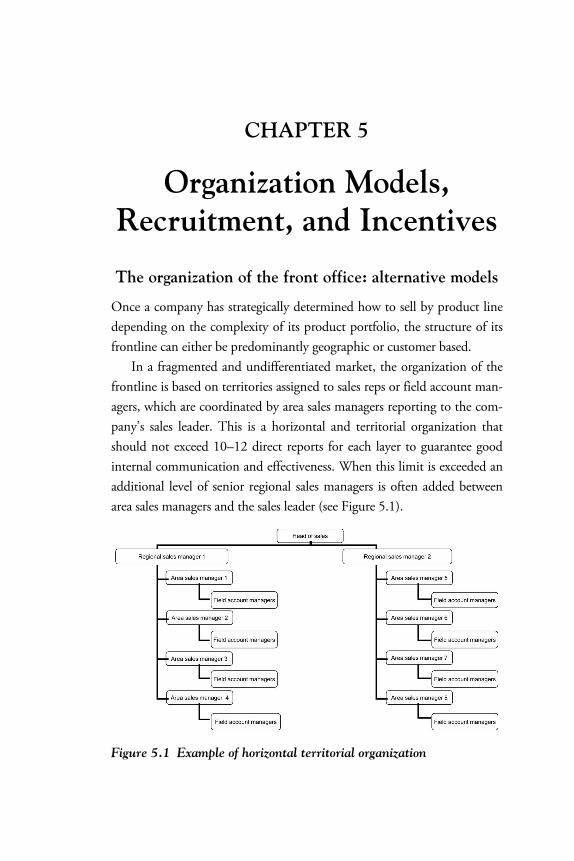
CHAPTER 5
Organization Models, Recruitment, and Incentives
The organization of the front office: alternative models
Once a company has strategically determined how to sell by product line depending on the complexity of its product portfolio, the structure of its frontline can either be predominantly geographic or customer based.
In a fragmented and undifferentiated market, the organization of the frontline is based on territories assigned to sales reps or field account man-agers, which are coordinated by area sales managers reporting to the com-pany’s sales leader. This is a horizontal and territorial organization that should not exceed 10–12 direct reports for each layer to guarantee good internal communication and effectiveness. When this limit is exceeded an additional level of senior regional sales managers is often added between area sales managers and the sales leader (see Figure 5.1).
Figure 5.1 Example of horizontal territorial organization
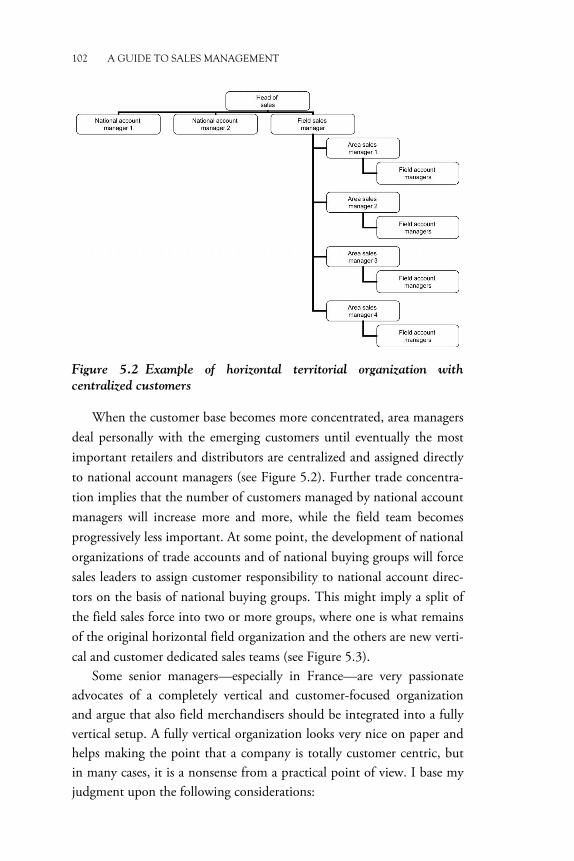
102 A GUIDE TO SALES MANAGEMENT
Figure 5.2 Example of horizontal territorial organization with
centralized customers
When the customer base becomes more concentrated, area managers deal personally with the emerging customers until eventually the most important retailers and distributors are centralized and assigned directly to national account managers (see Figure 5.2). Further trade concentra-tion implies that the number of customers managed by national account managers will increase more and more, while the field team becomes progressively less important. At some point, the development of national organizations of trade accounts and of national buying groups will force sales leaders to assign customer responsibility to national account direc-tors on the basis of national buying groups. This might imply a split of the field sales force into two or more groups, where one is what remains of the original horizontal field organization and the others are new verti-cal and customer dedicated sales teams (see Figure 5.3).
Some senior managers—especially in France—are very passionate advocates of a completely vertical and customer-focused organization and argue that also field merchandisers should be integrated into a fully vertical setup. A fully vertical organization looks very nice on paper and helps making the point that a company is totally customer centric, but in many cases, it is a nonsense from a practical point of view. I base my judgment upon the following considerations:
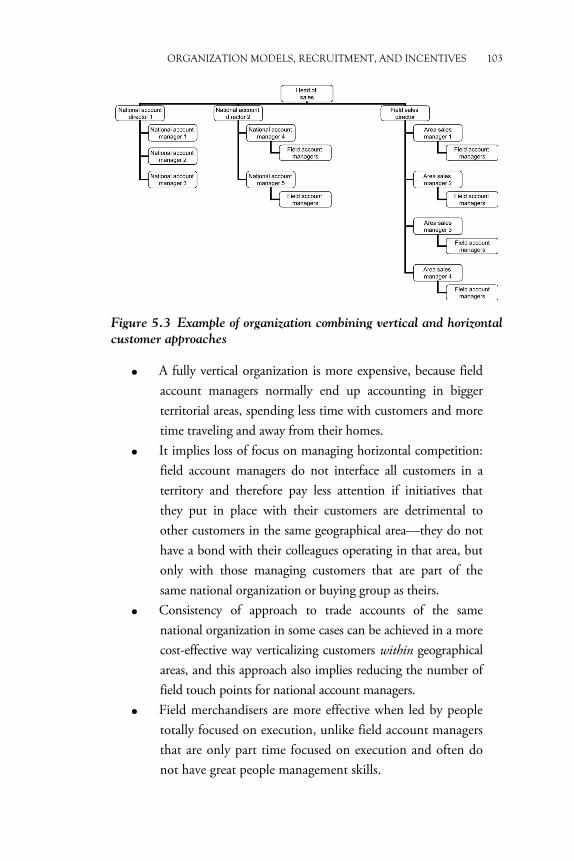
ORGANIZATION MODELS, RECRUITMENT, AND INCENTIVES 103
Figure 5.3 Example of organization combining vertical and horizontal
customer approaches
• A fully vertical organization is more expensive, because field account managers normally end up accounting in bigger territorial areas, spending less time with customers and more time traveling and away from their homes.
• It implies loss of focus on managing horizontal competition: field account managers do not interface all customers in a territory and therefore pay less attention if initiatives that they put in place with their customers are detrimental to other customers in the same geographical area—they do not have a bond with their colleagues operating in that area, but only with those managing customers that are part of the same national organization or buying group as theirs.
• Consistency of approach to trade accounts of the same national organization in some cases can be achieved in a more cost-effective way verticalizing customers within geographical areas, and this approach also implies reducing the number of field touch points for national account managers.
• Field merchandisers are more effective when led by people totally focused on execution, unlike field account managers that are only part time focused on execution and often do not have great people management skills.
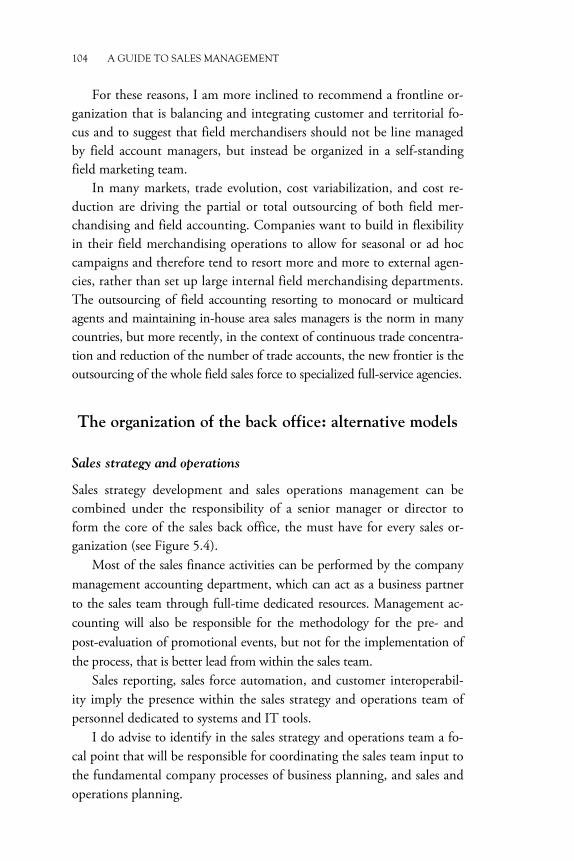
104 A GUIDE TO SALES MANAGEMENT
For these reasons, I am more inclined to recommend a frontline or-ganization that is balancing and integrating customer and territorial fo-cus and to suggest that field merchandisers should not be line managed by field account managers, but instead be organized in a self-standing field marketing team.
In many markets, trade evolution, cost variabilization, and cost re-duction are driving the partial or total outsourcing of both field mer-chandising and field accounting. Companies want to build in flexibility in their field merchandising operations to allow for seasonal or ad hoc campaigns and therefore tend to resort more and more to external agen-cies, rather than set up large internal field merchandising departments. The outsourcing of field accounting resorting to monocard or multicard agents and maintaining in-house area sales managers is the norm in many countries, but more recently, in the context of continuous trade concentra-tion and reduction of the number of trade accounts, the new frontier is the outsourcing of the whole field sales force to specialized full-service agencies.
The organization of the back office: alternative models
Sales strategy and operations
Sales strategy development and sales operations management can be combined under the responsibility of a senior manager or director to form the core of the sales back office, the must have for every sales or-ganization (see Figure 5.4).
Most of the sales finance activities can be performed by the company management accounting department, which can act as a business partner to the sales team through full-time dedicated resources. Management ac-counting will also be responsible for the methodology for the pre- and post-evaluation of promotional events, but not for the implementation of the process, that is better lead from within the sales team.
Sales reporting, sales force automation, and customer interoperabil-ity imply the presence within the sales strategy and operations team of personnel dedicated to systems and IT tools.
I do advise to identify in the sales strategy and operations team a fo-cal point that will be responsible for coordinating the sales team input to the fundamental company processes of business planning, and sales and operations planning.
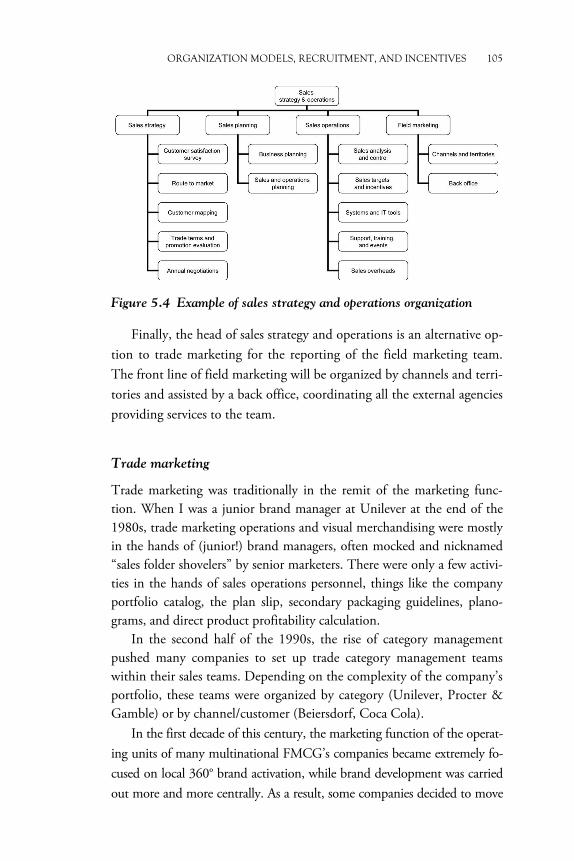
ORGANIZATION MODELS, RECRUITMENT, AND INCENTIVES 105
Figure 5.4 Example of sales strategy and operations organization
Finally, the head of sales strategy and operations is an alternative op-tion to trade marketing for the reporting of the field marketing team. The front line of field marketing will be organized by channels and terri-tories and assisted by a back office, coordinating all the external agencies providing services to the team.
Trade marketing
Trade marketing was traditionally in the remit of the marketing func-tion. When I was a junior brand manager at Unilever at the end of the 1980s, trade marketing operations and visual merchandising were mostly in the hands of (junior!) brand managers, often mocked and nicknamed “sales folder shovelers” by senior marketers. There were only a few activi-ties in the hands of sales operations personnel, things like the company portfolio catalog, the plan slip, secondary packaging guidelines, plano-grams, and direct product profitability calculation.
In the second half of the 1990s, the rise of category management pushed many companies to set up trade category management teams within their sales teams. Depending on the complexity of the company’s portfolio, these teams were organized by category (Unilever, Procter & Gamble) or by channel/customer (Beiersdorf, Coca Cola).
In the first decade of this century, the marketing function of the operat-ing units of many multinational FMCG’s companies became extremely fo-cused on local 360° brand activation, while brand development was carried out more and more centrally. As a result, some companies decided to move
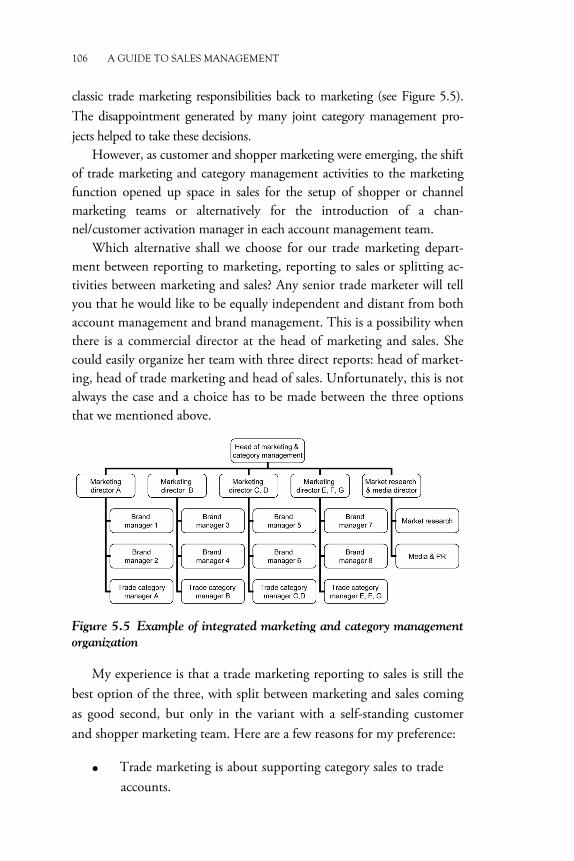
106 A GUIDE TO SALES MANAGEMENT
classic trade marketing responsibilities back to marketing (see Figure 5.5). The disappointment generated by many joint category management pro-jects helped to take these decisions.
However, as customer and shopper marketing were emerging, the shift of trade marketing and category management activities to the marketing function opened up space in sales for the setup of shopper or channel marketing teams or alternatively for the introduction of a chan-nel/customer activation manager in each account management team.
Which alternative shall we choose for our trade marketing depart-ment between reporting to marketing, reporting to sales or splitting ac-tivities between marketing and sales? Any senior trade marketer will tell you that he would like to be equally independent and distant from both account management and brand management. This is a possibility when there is a commercial director at the head of marketing and sales. She could easily organize her team with three direct reports: head of market-ing, head of trade marketing and head of sales. Unfortunately, this is not always the case and a choice has to be made between the three options that we mentioned above.
Figure 5.5 Example of integrated marketing and category management
organization
My experience is that a trade marketing reporting to sales is still the best option of the three, with split between marketing and sales coming as good second, but only in the variant with a self-standing customer and shopper marketing team. Here are a few reasons for my preference:
• Trade marketing is about supporting category sales to trade accounts.
ORGANIZATION MODELS, RECRUITMENT, AND INCENTIVES 107
• Customers want manufacturers to share their category knowledge and expertise, not their channel expertise—they know better.
• Customers want manufacturers to share their holistic shopping understanding and to provide actionable shopper insights.
• Category managers should spend a lot of time with sales colleagues, in store and with customers.
• Marketing managers normally lack working knowledge of trade marketing and customer management and therefore have a difficulty in leading the category managers integrated into their teams.
• Marketing managers and national account directors consider the category managers and the channel/customer activation managers in their teams as operational arms that should execute a brand or a customer strategy, rather than design a category strategy and execute it through customers.
• Integrating category management into brand management and channel/customer activation into account management is only apparently a leaner solution. In reality, the decision making chain becomes longer: brand manager—category manager—channel/customer activation manager—account manager, that is, four components rather than three.
• More budget holders imply by definition more sleeping money/hidden reserves.
• The integration of category managers with brand or customer management does not support the development of a holistic shopper marketing approach and expertise.
A trade marketing team reporting to sales will be organized by catego-ry, with the most important categories further split by channel and the less important categories bundled together (see Figure 5.6). When a trade marketing team is reporting to sales its head becomes also a valid alterna-tive option to the head of sales strategy and operations for the reporting of the field marketing team. Both category managers and field merchandisers will benefit from the integration under the same leadership, especially in
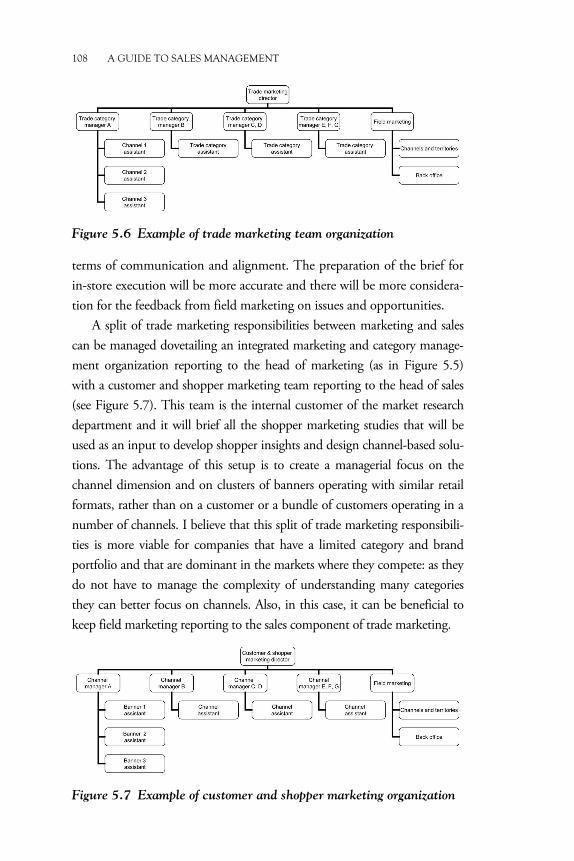
108 A GUIDE TO SALES MANAGEMENT
Figure 5.6 Example of trade marketing team organization
terms of communication and alignment. The preparation of the brief for in-store execution will be more accurate and there will be more considera-tion for the feedback from field marketing on issues and opportunities.
A split of trade marketing responsibilities between marketing and sales can be managed dovetailing an integrated marketing and category manage-ment organization reporting to the head of marketing (as in Figure 5.5) with a customer and shopper marketing team reporting to the head of sales (see Figure 5.7). This team is the internal customer of the market research department and it will brief all the shopper marketing studies that will be used as an input to develop shopper insights and design channel-based solu-tions. The advantage of this setup is to create a managerial focus on the channel dimension and on clusters of banners operating with similar retail formats, rather than on a customer or a bundle of customers operating in a number of channels. I believe that this split of trade marketing responsibili-ties is more viable for companies that have a limited category and brand portfolio and that are dominant in the markets where they compete: as they do not have to manage the complexity of understanding many categories they can better focus on channels. Also, in this case, it can be beneficial to keep field marketing reporting to the sales component of trade marketing.
Figure 5.7 Example of customer and shopper marketing organization
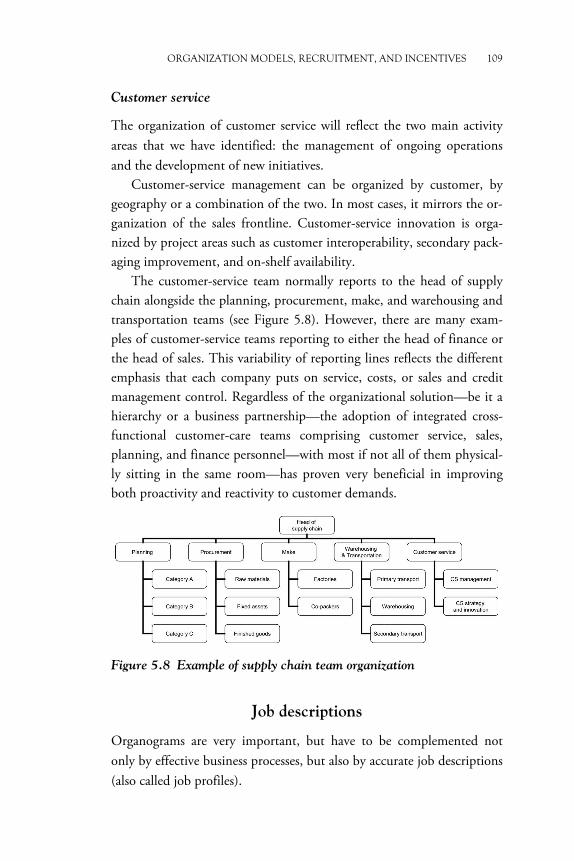
ORGANIZATION MODELS, RECRUITMENT, AND INCENTIVES 109
Customer service
The organization of customer service will reflect the two main activity areas that we have identified: the management of ongoing operations and the development of new initiatives.
Customer-service management can be organized by customer, by geography or a combination of the two. In most cases, it mirrors the or-ganization of the sales frontline. Customer-service innovation is orga-nized by project areas such as customer interoperability, secondary pack-aging improvement, and on-shelf availability.
The customer-service team normally reports to the head of supply chain alongside the planning, procurement, make, and warehousing and transportation teams (see Figure 5.8). However, there are many exam-ples of customer-service teams reporting to either the head of finance or the head of sales. This variability of reporting lines reflects the different emphasis that each company puts on service, costs, or sales and credit management control. Regardless of the organizational solution—be it a hierarchy or a business partnership—the adoption of integrated cross-functional customer-care teams comprising customer service, sales, planning, and finance personnel—with most if not all of them physical-ly sitting in the same room—has proven very beneficial in improving both proactivity and reactivity to customer demands.
Figure 5.8 Example of supply chain team organization
Job descriptions
Organograms are very important, but have to be complemented not only by effective business processes, but also by accurate job descriptions (also called job profiles).
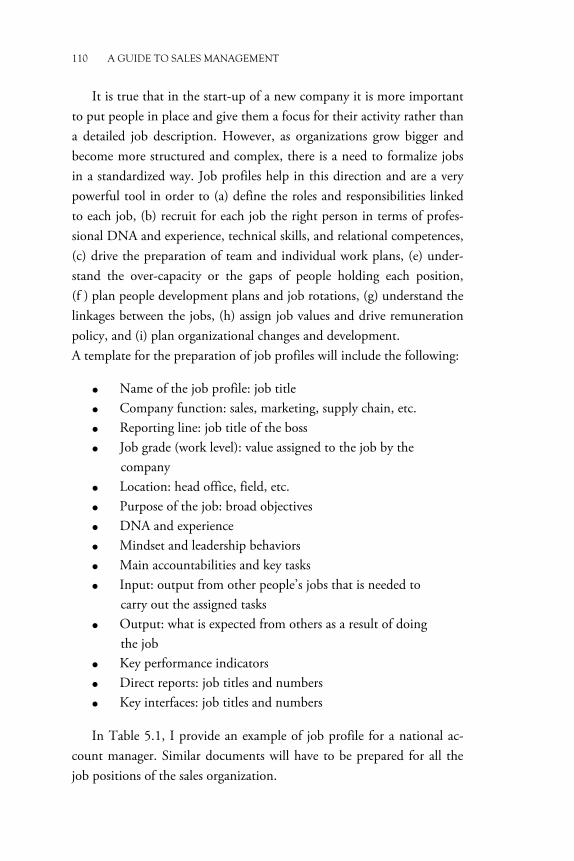
110 A GUIDE TO SALES MANAGEMENT
It is true that in the start-up of a new company it is more important to put people in place and give them a focus for their activity rather than a detailed job description. However, as organizations grow bigger and become more structured and complex, there is a need to formalize jobs in a standardized way. Job profiles help in this direction and are a very powerful tool in order to (a) define the roles and responsibilities linked to each job, (b) recruit for each job the right person in terms of profes-sional DNA and experience, technical skills, and relational competences, (c) drive the preparation of team and individual work plans, (e) under-stand the over-capacity or the gaps of people holding each position, (f ) plan people development plans and job rotations, (g) understand the linkages between the jobs, (h) assign job values and drive remuneration policy, and (i) plan organizational changes and development. A template for the preparation of job profiles will include the following:
• Name of the job profile: job title • Company function: sales, marketing, supply chain, etc. • Reporting line: job title of the boss • Job grade (work level): value assigned to the job by the
company • Location: head office, field, etc. • Purpose of the job: broad objectives • DNA and experience • Mindset and leadership behaviors • Main accountabilities and key tasks • Input: output from other people’s jobs that is needed to
carry out the assigned tasks • Output: what is expected from others as a result of doing
the job • Key performance indicators • Direct reports: job titles and numbers • Key interfaces: job titles and numbers
In Table 5.1, I provide an example of job profile for a national ac-count manager. Similar documents will have to be prepared for all the job positions of the sales organization.
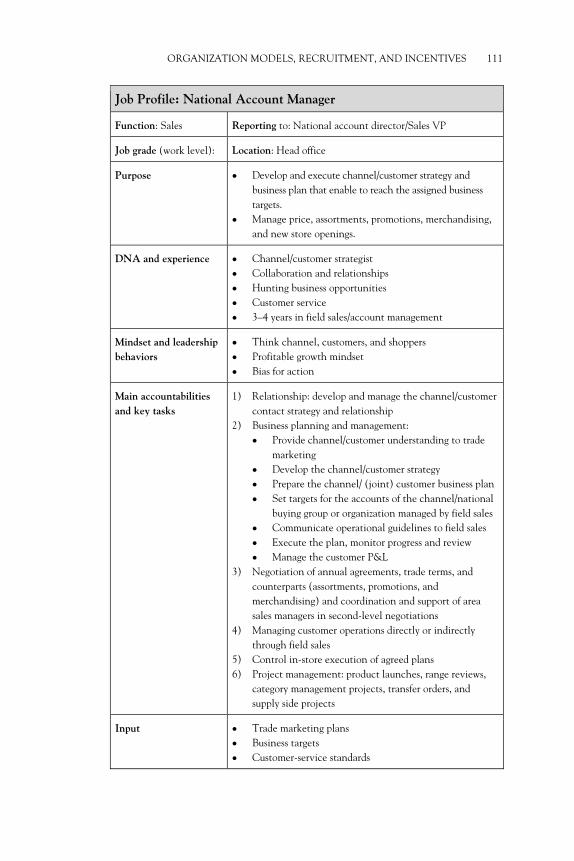
ORGANIZATION MODELS, RECRUITMENT, AND INCENTIVES 111
Job Profile: National Account Manager
Function: Sales Reporting to: National account director/Sales VP
Job grade (work level): Location: Head office
Purpose • Develop and execute channel/customer strategy and business plan that enable to reach the assigned business targets.
• Manage price, assortments, promotions, merchandising, and new store openings.
DNA and experience • Channel/customer strategist • Collaboration and relationships • Hunting business opportunities • Customer service • 3–4 years in field sales/account management
Mindset and leadership behaviors
• Think channel, customers, and shoppers • Profitable growth mindset • Bias for action
Main accountabilities and key tasks
1) Relationship: develop and manage the channel/customer contact strategy and relationship
2) Business planning and management: • Provide channel/customer understanding to trade
marketing • Develop the channel/customer strategy • Prepare the channel/ (joint) customer business plan • Set targets for the accounts of the channel/national
buying group or organization managed by field sales • Communicate operational guidelines to field sales • Execute the plan, monitor progress and review • Manage the customer P&L
3) Negotiation of annual agreements, trade terms, and counterparts (assortments, promotions, and merchandising) and coordination and support of area sales managers in second-level negotiations
4) Managing customer operations directly or indirectly through field sales
5) Control in-store execution of agreed plans 6) Project management: product launches, range reviews,
category management projects, transfer orders, and supply side projects
Input • Trade marketing plans • Business targets • Customer-service standards
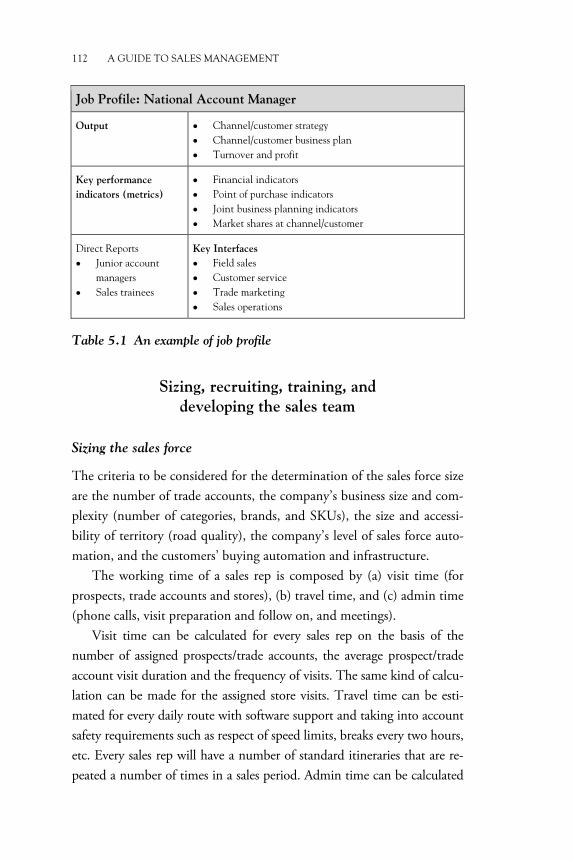
112 A GUIDE TO SALES MANAGEMENT
Job Profile: National Account Manager
Output • Channel/customer strategy • Channel/customer business plan • Turnover and profit
Key performance indicators (metrics)
• Financial indicators • Point of purchase indicators • Joint business planning indicators • Market shares at channel/customer
Direct Reports • Junior account
managers • Sales trainees
Key Interfaces • Field sales • Customer service • Trade marketing • Sales operations
Table 5.1 An example of job profile
Sizing, recruiting, training, and developing the sales team
Sizing the sales force
The criteria to be considered for the determination of the sales force size are the number of trade accounts, the company’s business size and com-plexity (number of categories, brands, and SKUs), the size and accessi-bility of territory (road quality), the company’s level of sales force auto-mation, and the customers’ buying automation and infrastructure.
The working time of a sales rep is composed by (a) visit time (for prospects, trade accounts and stores), (b) travel time, and (c) admin time (phone calls, visit preparation and follow on, and meetings).
Visit time can be calculated for every sales rep on the basis of the number of assigned prospects/trade accounts, the average prospect/trade account visit duration and the frequency of visits. The same kind of calcu-lation can be made for the assigned store visits. Travel time can be esti-mated for every daily route with software support and taking into account safety requirements such as respect of speed limits, breaks every two hours, etc. Every sales rep will have a number of standard itineraries that are re-peated a number of times in a sales period. Admin time can be calculated
ORGANIZATION MODELS, RECRUITMENT, AND INCENTIVES 113
through minimum standards such as time for preparation and for follow on of every visit, time for phone calls per day, days for internal meetings every month, time for non customer-specific desk work every month, etc.
The addition of visit time, travel time and admin time can give us information on the level of saturation on each sales rep and on the need to hire or lay off sales personnel.
Recruitment
There are plenty of opportunities and ways to recruit sales personnel, especially area sales managers and field account managers. How to re-cruit is not a problematic choice for the head of sales. If no suitable in-ternal resources are available to cover a vacancy, she will ask the compa-ny’s human resources department whether to select a panel of candidates directly or through head hunters or specialized agencies. Who to choose from a shortlist of applicants is less trivial and more challenging for a head of sales, especially if she is not recruiting on a regular basis. Very positive or very negative gut reactions can sometimes spare us lengthy searches or big mistakes, but they cannot be the only criteria to adopt for a selection: we need to map out the set of skills and the competence profile of the effective salesman that we are looking for.
The stereotype of the salesman is that of an open, friendly, amicable person that at the same time can spend a lot of time in contact with people when selling and on his own when moving from place to place. He is sociable, outgoing, and extrovert and knows how to deal with a buyer in every occasion. He is not at all touchy and prickly and knows how to take it, swallow, or eat humble pie. He is like a boxer that can take a big blow and stand on his feet until the end of the round of the match. He is hungry like a wolf and cunning like a wily old fox. He is smart and quick and knows what to talk about and what to avoid talk-ing about. Very often all of this is true, but it is not what defines the es-sence of an effective salesman. What do pioneering, exploring, fighting, planning, and diplomatic sales men have in common?
If we ask buyers which behaviors and attitudes they expect from an ideal salesman, they will portrait the effective sales representative as a person satisfying their job-related relational needs in a number of ways:
114 A GUIDE TO SALES MANAGEMENT
1. He is positive in his approach, open, and able to listen (= listening skills).
2. He can discover the customer reality and needs (= cognitive skills). 3. He can customize solutions, highlighting their benefits
(= problem-solving skills). 4. He proposes alternative choices to his counterpart, he can han-
dle objections, look for win–win solutions, close the deal, and share the output (= negotiation skills).
Positivity is expressed by a natural smile, a balanced tone of voice, and a correct body language. Listening is revealed by empathy and adoption of the buyer’s language and terminology. Discovery and problem solving are based on productive dialog, making open questions (who, what, when, where, why, and how), being clear, pragmatic, and getting to the point, using examples and taking notes. Handling objections is about understand-ing the hidden questions of the buyer and answering properly. Reaching an agreement follows recapping and summing up all the discussion points. Sharing the output of the meeting is based on checking comprehension with closed questions implying a yes or no answer and on correcting the meeting notes.
Training and developing the sales team
Once the sales team has been recruited, it will undergo a technical training on the company’s product portfolio and the in-use characteristics and benefits of every item, complemented by a wealth of commercial infor-mation about market evolution, consumer and shopper behavior, key players, distribution channels, and leading retailers. This program is nor-mally prepared internally by sales operations and trade marketing and re-leased during the team periodical sales meetings along with updates on list prices, trade terms, promotions, and new product introductions. It is basic and fundamental, but not sufficient to build an effective team.
Many companies will rightly ask their sales representatives to devel-op and adopt a common approach to customers and a style that will make the team recognizable and well reputed in the business. This ob-jective can be achieved through behavioral and relational training that
ORGANIZATION MODELS, RECRUITMENT, AND INCENTIVES 115
will include the development of the listening, cognitive, problem solv-ing, and negotiation skills that we have highlighted above. In terms of content development and delivery, this area is better left in the hands of specialist agencies, but coordination by sales operations and the head of sales is essential.
Both technical and behavioral training programs can include not only classroom courses, but also e-learning modules, reading, and practicing on the job. A good balance of all these components will help accommodate for every kind of learning style, from active participation to observation, reflection, and conceptualization. However, when it comes to behavioral training, a program without classroom courses does not stand a great chance to be very effective in the long run. It is only in a classroom that people can interact and interiorize the concepts and the techniques that their leaders want to see applied on the job. In the classroom, trainers will help the learning team to reflect on their way of working and to identify improvements through lectures, presentations, games, role plays, and breakout sessions. A training course should be perceived by participants as a working session aimed at finding solutions for the jobs to be done day in and day out in their working life. A basic sales training program for na-tional account managers, field account managers, sales agents, and field merchandisers will include topics such as time management, self-organization, store visit procedures, effective presentation, sales process management, and negotiation. An advanced sales training program will be aimed also to national account directors, area sales managers, and field merchandising managers and it will include leading and managing people, interpersonal styles, retail economics, customer business planning, new product launch management, promotion management, and evaluation.
The value of the classroom is the discussion and the exchange be-tween participants about the how of every topic. They all know very well what has to be done; in many cases, they have received very clear company instructions, but very often they need to understand how to adapt these instructions to different situations.
My suggestion is to make sure that trainees always come out of their training courses with a few useful tips, if not with a new simple tool that will help them to improve on what they already do. Three months after the training they will have forgotten most if not all of what has been said
116 A GUIDE TO SALES MANAGEMENT
during the session, but the tips and the tool will still be there, and that is why they should be preferably made available in a portable format, such as a card or an electronic file. There is nothing more powerful than a checklist, a template, or a procedure that is developed and discussed by participants during a training session, because they feel the ownership of these tools and the commitment to use them.
My second suggestion is to guarantee a good continuity to sales training. Not only there should always be a one day follow on session to each course, but training should be conceived as a continuous improve-ment program, updated and integrated every year. Good senior buyers undergo very intensive training and that should also be the case of good senior salesmen! Behavioral and technical training is not only an induc-tion routine, it is a process.
Internal sales meetings and formal training programs need to be com-plemented by accompanied field visits. A field account manager or a field merchandiser might be accompanied in his visits to customers and stores by a sales or marketing trainee, by another field account manager or field merchandiser in case of handover or by his boss (or even somebody higher in the hierarchical ladder). In the first two cases, he will act as a trainer for the people that accompany him, but in the third case, he will be to some extent the trainee! I suggest to any supervisor the following guidelines for accompanied field visits: (1) he will predominantly choose the customers and stores to be visited, (2) he will decide the timing of the visits, (3) he will not make concessions that would weaken the field person position, and (4) he will provide feedback on strengths and weaknesses after each visit and at the end of the period, thus reinforcing positive behaviors and highlighting improvement areas.
Incentives, variable pay, reward, and recognition
The variability of the total remuneration of sales personnel and its link to sales performance is taken for granted in most markets; nevertheless, it is worth discussing about the how of reward and recognition, bearing in mind the difference between sales agents and direct employees.
Sales agencies and independent agents normally require a contract that rewards their work and costs (car, petrol, administration, etc.) with a min-imum annual fee (unconditional advance payment) plus a commission expressed as a percentage of turnover (net receipts) that will depend on the
ORGANIZATION MODELS, RECRUITMENT, AND INCENTIVES 117
nature and continuity of the business and the quality of the sale—as a rule of thumb this percentage will range from a minimum of 2% for the gro-cery sector to a maximum of 20% for the consultancy business. A compa-ny hiring agents will have to compete for their services following market rules, but will have more flexibility in managing redundancies.
On the other hand, direct employees get a refund for their travel ex-penses and are rewarded with a fixed salary, benefits (car, personal com-puter, phone, and insurances) and incentives. The incentive plan and the underlying budget are one of the key operational responsibilities of the sales leaders. Here are some tips for building and managing the plan:
• Work out a performance incentive for every profile of your team
• Mind the target • Mind the time horizon • Differentiate • Work on a variety of performance indicators • Balance individual and team achievement • Reward team results • Plan and replan.
Every member of the sales team is contributing to the achievement of the sales targets and therefore deserves some kind of reward. It is obvious to think about field account managers as a key target for the incentive plan, less common to include in the plan field merchandisers, national account managers, area sales managers, trade category managers, and channel man-agers. Why not?
Every profile included in the plan will have a different time horizon and a different level of reward. Field account managers and field merchandisers need to be incentivized on short- and mid-term (month, sales cycle, and quarter) results, while national account managers and the other roles mentioned above can be targeted on mid- and long-term (half year and full year) objectives. As a rule of thumb, the incentives for field account managers and field merchandisers will add up to at least 25 percent of their total remuneration, while for other roles the amount can be limited to the 5 to 10 percent range and it might simply be a year-end bonus. One of the
118 A GUIDE TO SALES MANAGEMENT
biggest mistakes is to heavily incentivize national account managers on quarterly turnover targets: many customers would be happy to wait until the end of the quarter to be able to stock up at the lowest possible price!
As we adopt a variety of performance indicators, it would not be rea-sonable to utilize only turnover as a target for our incentives. We can well give a weight also to the achievement of targets expressed in terms of point of purchase, joint business planning, and customer indicators. In some circumstances, forecast accuracy and accrual accuracy can also be an option.
Salesmen know that their targets will mostly be individual, but good sales leaders know that sometimes targets might be very difficult to break down at field account manager level. As a result, they assign tar-gets knowing that there might be some inaccuracy at individual level, even though the total makes sense. In this case, it could be useful to set team targets that work as a parachute for individuals: for instance, if the individual did not reach his target, but the result was fully achieved at team level (area/channel/country) he can nevertheless get 80 percent of his individual prize. I believe that this kind of fallback positions help promote team spirit, solidarity, and cooperation.
Rewarding team results works in the same direction, but it can also have more of an emotional impact. It is not necessary to resort to monetary prizes or precious gifts, it might be enough to promise to hold the next national sales conference in an exciting location allowing enough time for leisure.
Beyond reward there is recognition, an act of very high moral value, and emotional impact. It is an acknowledgment of merits, of excellence, of an achievement, of an outstanding piece of work, of a service, of a “plus one,” of something delivered beyond expectations. It can apply to everyone in a sales organization, including sales agents and sales trainees. Recogni-tion is an act of leadership and it must be motivated and explained very clearly. It must be done properly, in public and by the person best placed to spend words of appreciation and praise for the recipient. It should not be done unexpectedly and the recipient should be informed beforehand. Recognition does not necessarily imply a great prize; a simple token will be enough to remember to the recipient the kudos of the moment.
ORGANIZATION MODELS, RECRUITMENT, AND INCENTIVES 119
Takeaway Points
• The structure of the sales frontline can either be predominantly geographic or customer based.
• In many cases, there are good reasons to choose a mixed solution for the organization of the frontline, balancing and integrating customer and territorial focus.
• Field merchandisers should not be line managed by field account managers, but organized in a self-standing field marketing team.
• Trade evolution, cost variabilization, and cost reduction are driving the partial or total outsourcing of both field merchandising and field accounting.
• Sales strategy development and sales operations management can be combined under the responsibility of a senior manager or director.
• Sales finance activities can be performed by the company management accounting department.
• The head of sales strategy and operations is an alternative option to trade marketing for the reporting of the field marketing team.
• Trade marketers prefer to be equally independent from account management and marketing, but this solution is possible only when there is a commercial director at the head of marketing and sales. In other cases, the alternatives are: (1) trade marketing reporting to marketing, (2) trade marketing reporting to sales, and (3) split of trade marketing activities between marketing and sales.
• Customer-service management often mirrors the organization of the sales frontline and can be organized by customer, by geography or a combination of the two.
• Customer-service innovation is organized by project areas such as customer interoperability, secondary packaging improvement, and on-shelf availability.
• Customer service can report to sales, supply chain, or finance.
120 A GUIDE TO SALES MANAGEMENT
• Customer-care teams comprising customer service, sales, planning, and finance personnel are very beneficial in improving both proactivity and reactivity to customer demands.
• Job profiles are a tool to formalize jobs in a standardized way.
• The criteria to be considered for the determination of the sales force size are the number of trade accounts, the company’s business size and complexity, the size and accessibility of territory, the company’s level of sales force automation, and the customers’ buying automation and infrastructure.
• In recruiting sales personnel mind listening skills, cognitive skills, problem-solving skills, and negotiation skills.
• Technical training must be dovetailed by behavioral and relational training and by accompanied field visits.
• A good incentive plan involves every direct employee, is based on a variety of performance indicators, and rewards team achievements.
• Public recognition of performance excellence has very high moral value and emotional impact.
CHAPTER 6
The Business Planning Process
The business planning process in sales management
The key activities of a sales team are developing and integrating business plans, negotiating with customers, collecting and processing orders, implementing plans, checking progress, and identifying corrective actions. These activities can be grouped into three fundamental processes with their respective supporting IT tools: (1) business planning, (2) order to cash, and (3) sales and operations planning. They are interrelated, but need to be analyzed separately for the sake of clarity.
Customers are the business planning units of the sales function, but when the trade environment is very fragmented distribution channels substitute customers as the planning dimension. In most markets, companies are planning their business as a combination of customer and channel plans: for this reason, we will use the acronym CBP to refer both to customer and channel business plans.
The CBP has a customer-specific content and includes three main activity plans: (1) the customer marketing plan for the demand side, (2) the customer operations plan for the supply side, and (3) the trade terms plan.
The CBPs are linked by the customer marketing plans to the trade category plans (TCPs), which in turn are connected to the brand marketing plans (BMPs). When the trade marketing department of a company is reporting to sales, TCPs become a responsibility of the sales function. We will discuss below prerequisites and recommended structure for both CBPs and TCPs and how to progressively integrate the two sets of plans between them and with the BMPs.
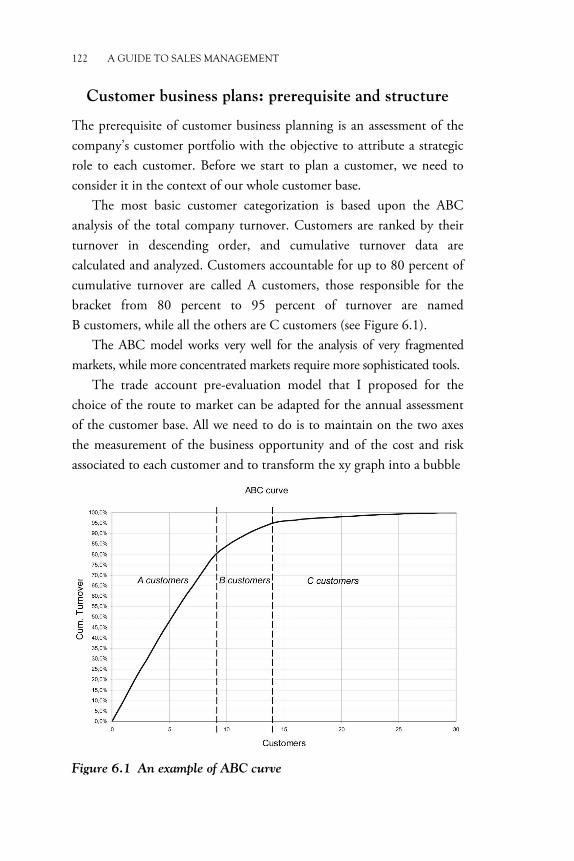
122 A GUIDE TO SALES MANAGEMENT
Customer business plans: prerequisite and structure
The prerequisite of customer business planning is an assessment of the company’s customer portfolio with the objective to attribute a strategic role to each customer. Before we start to plan a customer, we need to consider it in the context of our whole customer base.
The most basic customer categorization is based upon the ABC analysis of the total company turnover. Customers are ranked by their turnover in descending order, and cumulative turnover data are calculated and analyzed. Customers accountable for up to 80 percent of cumulative turnover are called A customers, those responsible for the bracket from 80 percent to 95 percent of turnover are named B customers, while all the others are C customers (see Figure 6.1).
The ABC model works very well for the analysis of very fragmented markets, while more concentrated markets require more sophisticated tools.
The trade account pre-evaluation model that I proposed for the choice of the route to market can be adapted for the annual assessment of the customer base. All we need to do is to maintain on the two axes the measurement of the business opportunity and of the cost and risk associated to each customer and to transform the xy graph into a bubble
Figure 6.1 An example of ABC curve
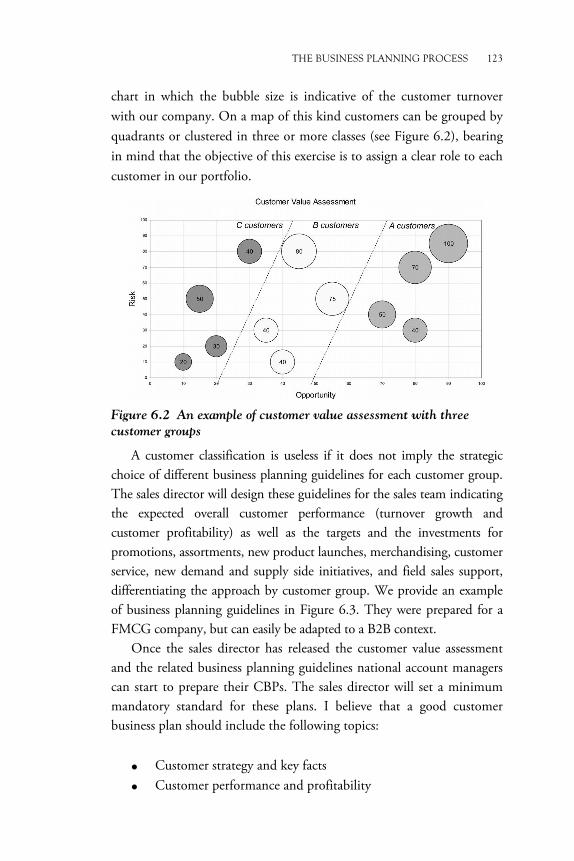
THE BUSINESS PLANNING PROCESS 123
chart in which the bubble size is indicative of the customer turnover with our company. On a map of this kind customers can be grouped by quadrants or clustered in three or more classes (see Figure 6.2), bearing in mind that the objective of this exercise is to assign a clear role to each customer in our portfolio.
Figure 6.2 An example of customer value assessment with three
customer groups
A customer classification is useless if it does not imply the strategic choice of different business planning guidelines for each customer group. The sales director will design these guidelines for the sales team indicating the expected overall customer performance (turnover growth and customer profitability) as well as the targets and the investments for promotions, assortments, new product launches, merchandising, customer service, new demand and supply side initiatives, and field sales support, differentiating the approach by customer group. We provide an example of business planning guidelines in Figure 6.3. They were prepared for a FMCG company, but can easily be adapted to a B2B context.
Once the sales director has released the customer value assessment and the related business planning guidelines national account managers can start to prepare their CBPs. The sales director will set a minimum mandatory standard for these plans. I believe that a good customer business plan should include the following topics:
• Customer strategy and key facts • Customer performance and profitability
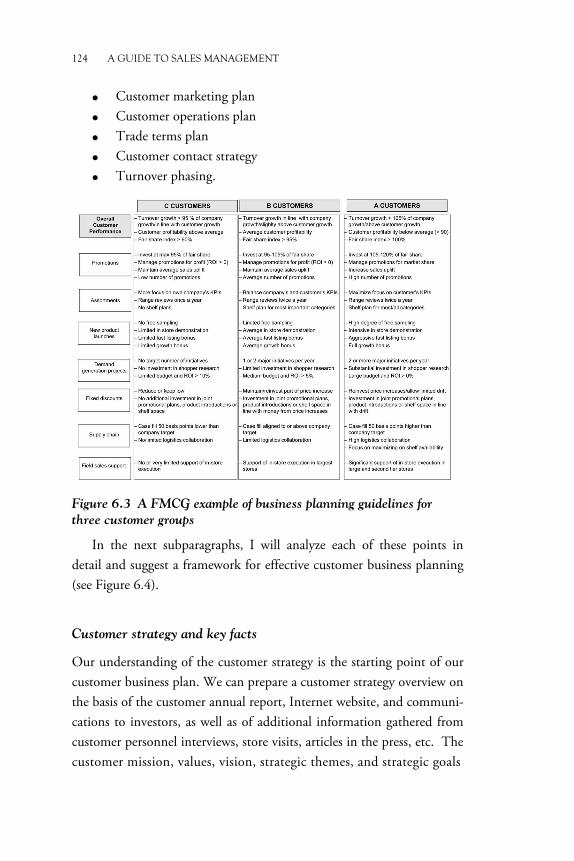
124 A GUIDE TO SALES MANAGEMENT
• Customer marketing plan • Customer operations plan • Trade terms plan • Customer contact strategy • Turnover phasing.
Figure 6.3 A FMCG example of business planning guidelines for
three customer groups
In the next subparagraphs, I will analyze each of these points in detail and suggest a framework for effective customer business planning (see Figure 6.4).
Customer strategy and key facts
Our understanding of the customer strategy is the starting point of our customer business plan. We can prepare a customer strategy overview on the basis of the customer annual report, Internet website, and communi-cations to investors, as well as of additional information gathered from customer personnel interviews, store visits, articles in the press, etc. The customer mission, values, vision, strategic themes, and strategic goals
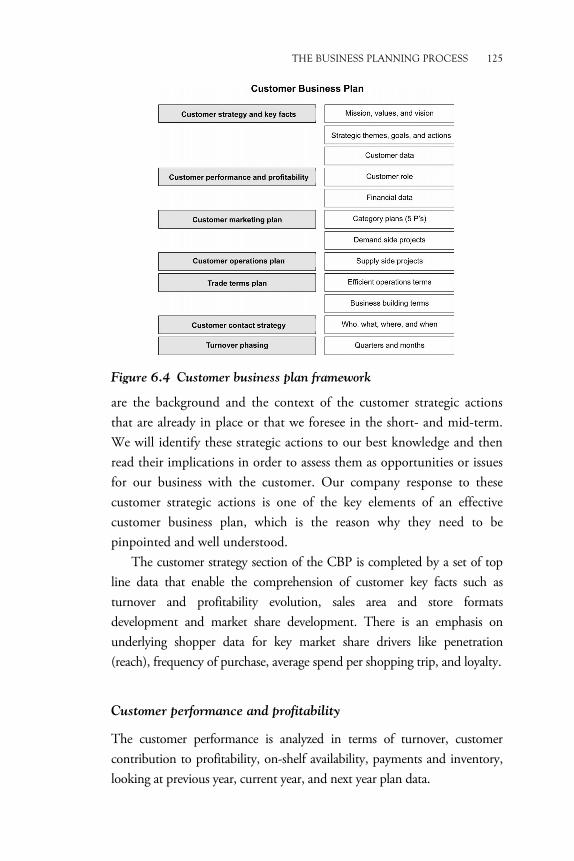
THE BUSINESS PLANNING PROCESS 125
Figure 6.4 Customer business plan framework
are the background and the context of the customer strategic actions that are already in place or that we foresee in the short- and mid-term. We will identify these strategic actions to our best knowledge and then read their implications in order to assess them as opportunities or issues for our business with the customer. Our company response to these customer strategic actions is one of the key elements of an effective customer business plan, which is the reason why they need to be pinpointed and well understood.
The customer strategy section of the CBP is completed by a set of top line data that enable the comprehension of customer key facts such as turnover and profitability evolution, sales area and store formats development and market share development. There is an emphasis on underlying shopper data for key market share drivers like penetration (reach), frequency of purchase, average spend per shopping trip, and loyalty.
Customer performance and profitability
The customer performance is analyzed in terms of turnover, customer contribution to profitability, on-shelf availability, payments and inventory, looking at previous year, current year, and next year plan data.
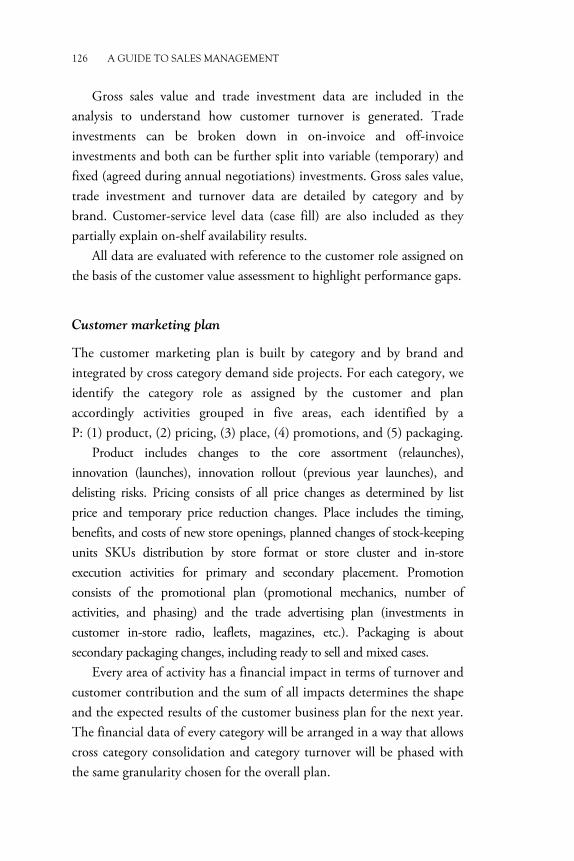
126 A GUIDE TO SALES MANAGEMENT
Gross sales value and trade investment data are included in the analysis to understand how customer turnover is generated. Trade investments can be broken down in on-invoice and off-invoice investments and both can be further split into variable (temporary) and fixed (agreed during annual negotiations) investments. Gross sales value, trade investment and turnover data are detailed by category and by brand. Customer-service level data (case fill) are also included as they partially explain on-shelf availability results.
All data are evaluated with reference to the customer role assigned on the basis of the customer value assessment to highlight performance gaps.
Customer marketing plan
The customer marketing plan is built by category and by brand and integrated by cross category demand side projects. For each category, we identify the category role as assigned by the customer and plan accordingly activities grouped in five areas, each identified by a P: (1) product, (2) pricing, (3) place, (4) promotions, and (5) packaging.
Product includes changes to the core assortment (relaunches), innovation (launches), innovation rollout (previous year launches), and delisting risks. Pricing consists of all price changes as determined by list price and temporary price reduction changes. Place includes the timing, benefits, and costs of new store openings, planned changes of stock-keeping units SKUs distribution by store format or store cluster and in-store execution activities for primary and secondary placement. Promotion consists of the promotional plan (promotional mechanics, number of activities, and phasing) and the trade advertising plan (investments in customer in-store radio, leaflets, magazines, etc.). Packaging is about secondary packaging changes, including ready to sell and mixed cases.
Every area of activity has a financial impact in terms of turnover and customer contribution and the sum of all impacts determines the shape and the expected results of the customer business plan for the next year. The financial data of every category will be arranged in a way that allows cross category consolidation and category turnover will be phased with the same granularity chosen for the overall plan.
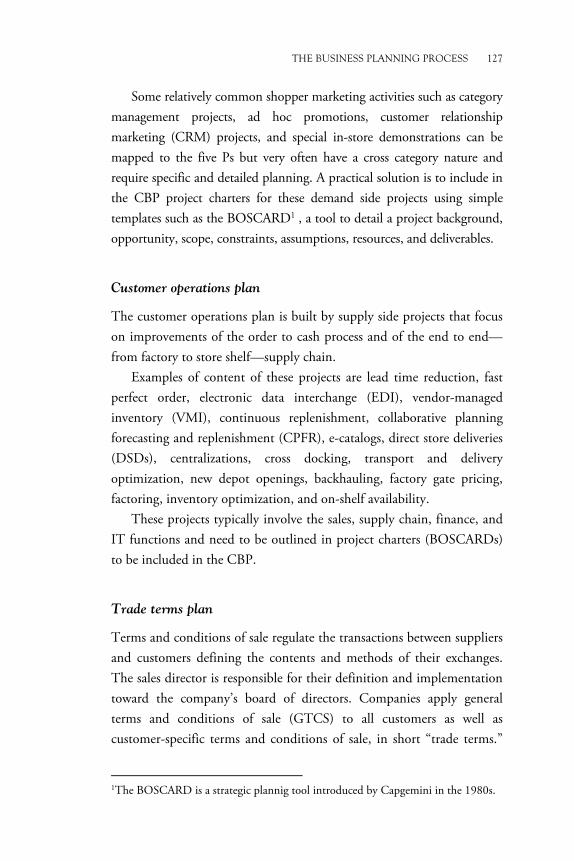
THE BUSINESS PLANNING PROCESS 127
Some relatively common shopper marketing activities such as category management projects, ad hoc promotions, customer relationship marketing (CRM) projects, and special in-store demonstrations can be mapped to the five Ps but very often have a cross category nature and require specific and detailed planning. A practical solution is to include in the CBP project charters for these demand side projects using simple templates such as the BOSCARD1 , a tool to detail a project background, opportunity, scope, constraints, assumptions, resources, and deliverables.
Customer operations plan
The customer operations plan is built by supply side projects that focus on improvements of the order to cash process and of the end to end—from factory to store shelf—supply chain.
Examples of content of these projects are lead time reduction, fast perfect order, electronic data interchange (EDI), vendor-managed inventory (VMI), continuous replenishment, collaborative planning forecasting and replenishment (CPFR), e-catalogs, direct store deliveries (DSDs), centralizations, cross docking, transport and delivery optimization, new depot openings, backhauling, factory gate pricing, factoring, inventory optimization, and on-shelf availability.
These projects typically involve the sales, supply chain, finance, and IT functions and need to be outlined in project charters (BOSCARDs) to be included in the CBP.
Trade terms plan
Terms and conditions of sale regulate the transactions between suppliers and customers defining the contents and methods of their exchanges. The sales director is responsible for their definition and implementation toward the company’s board of directors. Companies apply general terms and conditions of sale (GTCS) to all customers as well as customer-specific terms and conditions of sale, in short “trade terms.”
1The BOSCARD is a strategic plannig tool introduced by Capgemini in the 1980s.
128 A GUIDE TO SALES MANAGEMENT
GTCS are usually nonnegotiable and open (known to and applied to all customers on a performance basis), while trade terms are negotiated by customer and closed (unknown to other customers).
GTCS are usually published by the seller and describe many aspects of the sales transaction such as place of delivery, shipments and passing of risk, insurance costs, freight costs, extra packing costs, extra storage costs, delivery periods, partial deliveries, warranty, returns, limited liability, software rights, industrial property rights, copyrights, confidentiality, force majeure, place of jurisdiction, and governing law2. In some cases, minimum order size, logistic terms, payment terms, and retention of title clause are also included. Normally, in any document containing GTCS, there is a clause stating the need of the seller’s explicit written approval for the acceptance of any client’s general terms and conditions of purchase (GTCP) that are inconsistent with those of the seller. As GTCS are intended as valid for all customers regardless of their size or type, there is no scope in CBPs for discussing GTCS, unless the customer’s GTCP challenge directly the seller’s GTCS.
Trade terms agreed during negotiations are not necessarily the same in every agreement, although every sales director aims to have comparable trade terms structures across trade accounts. There are two broad categories of trade terms: efficient operations terms and business development terms.
Efficient operations terms are essentially linked to the order to cash cycle and reward positive customer behaviors. They can be mapped as logistic terms and payment terms. Logistic terms reward with an allowance the satisfaction of logistic conditions such as:
• Order size: minimum value or volume threshold • Order composition: full pallets and full layers • Adoption of advanced supply chain solutions:
• Delivery to central warehouse versus DSD • EDI • No returns clause
2See as an example documents available on Internet such as those by Carl Zeiss, Philips, Yokogawa, and Shell.
THE BUSINESS PLANNING PROCESS 129
• VMI • CPFR.
Payment terms reward with a discount the satisfaction of payment conditions such as:
• Prompt payment • Method of payment:
• Electronic payment • “Pay as billed.”
Business development terms support assortments, new product introduction, visual merchandising, and promotions. In the FMCG industry, examples of business development terms are as follows:
• On-shelf availability terms: allowances for compliance to planograms
• Off-shelf availability allowances for: • Promotional placement • Secondary placement (permanent or seasonal)
• New product introduction terms: listing fees and speed to shelf allowances
• Trade advertising allowances (for customer leaflets, maga-zines, etc.)
• Consumer price promotion terms (discounts for marked and unmarked price off, additional weight, coupons, and loyalty cards)
• Customer-specific terms (overriders, volume or growth targets).
Business development terms are usually closed, while efficient operations terms sometimes are left open and included in the GTCS.
The trade terms plan details all the efficient operations and business development terms, with a breakdown between on-invoice discounts and off-invoice rebates. As the majority of these terms are going to be the core of the negotiation of the annual agreement along with list price changes, the trade terms plan is a major input to the preparation of the negotiation rounds.
130 A GUIDE TO SALES MANAGEMENT
Payment terms are always included in annual agreements, while logistic terms are more likely to be discussed only for businesses with relatively high volumes and low unit value.
Business development terms for on-shelf availability, off-shelf availability, new product introduction, and customer-specific terms are normally part of annual negotiations. Customers often express a request of generic and unconditionally granted back margin, while suppliers tend to subordinate this margin to volume, assortment, and display counterparts. Trade advertising allowances and consumer price promotion terms are not always included in annual agreements. Ideally every supplier prefers to leave consumer price promotion terms out of the annual agreements in order to be able to play his temporary price reductions according to his business needs. On the other hand, there are at least three cases in which customer requests imply a degree of predetermination of consumer price promotion during the contract phase:
1. Request of minimum promotional cut price level: the customer
asks the supplier to commit to a minimum level of temporary price reduction during consumer promotions (e.g., 20 percent price off).
2. Request of net price negotiation: the customer does not want to discuss list prices and negotiate trade terms; he wants to agree a list of permanent net prices for every listed item. In this case, suppliers often need to play a part of their consumer price promotion budget to meet the net price requirements, but still end up with enough money left to be employed on promotions.
3. Request of everyday low pricing (EDLP): the customer does not intend to run promotions, but prefers to retail permanently at low prices (an “average” of promotional and non promotional retail prices) and asks for an extreme kind of net price negotiation that leaves very little money in the supplier’s pockets for additional investments during the year.
Case (1) and (2) are typical of high–low pricing retailing
environments like France and the UK, respectively, while EDLP is characteristic of Germany and the United States.
THE BUSINESS PLANNING PROCESS 131
Customer contact strategy
The interface of a modern and complex customer is necessarily based on multilevel and cross-functional relations, but also with relatively small customers, it is beneficial to follow a similar approach. The national account manager has no doubt weekly, if not daily contacts with his category buyers, but all other meetings between people of the two parties need to be carefully preplanned. For this reason, it is useful to prepare a list with the name and job title of all the customer personnel that periodically need to be seen, the desired frequency of these meetings, and the responsibility and supporting roles for each of them.
In addition to the contact list, we will also prepare a relations calendar indicating for every meeting the contact venue, the meeting objectives (e.g., business review, category review, joint business planning, innovation plan presentation, and negotiations), and the attendees.
Turnover phasing
There are a number of reasons to break down the overall turnover target resulting from customer business planning into smaller chunks, phasing it by quarter.
The CBP is like a photograph taken at a given moment in time and it is somehow static, while companies need to manage their business dynamically. Regardless of the yearly business planning exercise, companies assign targets to their sales team by month and quarter, update their sales forecast monthly through the sales and operations planning process and last but not least report externally they results on a quarterly basis. This is the reason why every annual target must be broken down by quarter and by month for the upcoming quarter.
Trade category plans: prerequisite and structure
TCPs are the link between brand-focused BMPs and customer-focused CBPs. TCPs are category-focused and align with a category approach all the retail activities that are included in the BMPs of each category
132 A GUIDE TO SALES MANAGEMENT
articulating them by channel or by key customer. TCPs explain how we plan to achieve our category goals and are the basis for customer-facing presentations of our category vision, strategy, and activity plan.
BMPs are the prerequisite of the TCP. The category manager must be aware of the objectives, strategies, and 360° activation plans of the brands comprised in his category to be able to prepare a TCP that is consistent with and reinforces the BMPs. The category manager is responsible for developing the trade and retail components of big brand activation ideas, utilizing concepts and visuals in store, in retail leaflets, and in customer magazines. This is the reason why he should be constantly updated on latest developments by his brand marketing colleagues. Ideally, the TCP should be developed as much as possible in parallel with the BMPs to maximize their alignment.
Also in the case of TCPs, it is recommendable for the sales director and the marketing director to require a minimum mandatory standard for these plans. In the light of using the TCPs both internally with account managers and externally with customers, I believe that a good TCP should include the following sections:
• Category definition and structure
• Market key facts
• Category role
• Category vision and value drivers
• Category strategy and objectives
• Category action plan
• Execution guidelines
• Category financials
• Turnover phasing.
In the next subparagraphs, I will analyze each of these points in detail and suggest a framework for effective trade category planning (see Figure 6.5).
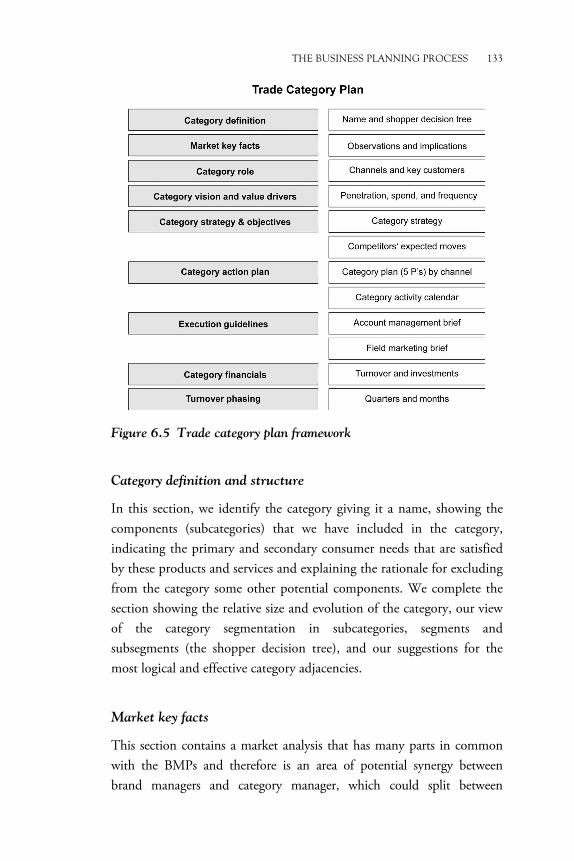
THE BUSINESS PLANNING PROCESS 133
Figure 6.5 Trade category plan framework
Category definition and structure
In this section, we identify the category giving it a name, showing the components (subcategories) that we have included in the category, indicating the primary and secondary consumer needs that are satisfied by these products and services and explaining the rationale for excluding from the category some other potential components. We complete the section showing the relative size and evolution of the category, our view of the category segmentation in subcategories, segments and subsegments (the shopper decision tree), and our suggestions for the most logical and effective category adjacencies.
Market key facts
This section contains a market analysis that has many parts in common with the BMPs and therefore is an area of potential synergy between brand managers and category manager, which could split between
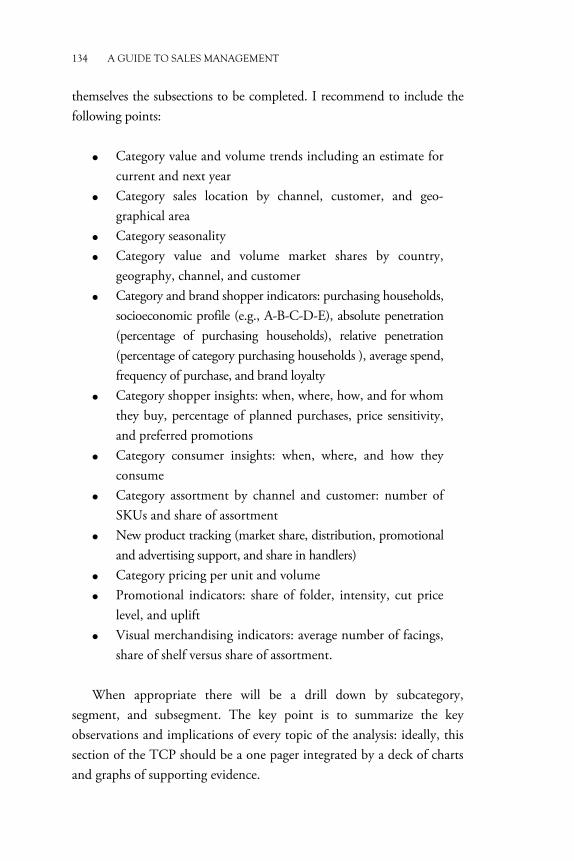
134 A GUIDE TO SALES MANAGEMENT
themselves the subsections to be completed. I recommend to include the following points:
• Category value and volume trends including an estimate for current and next year
• Category sales location by channel, customer, and geo-graphical area
• Category seasonality • Category value and volume market shares by country,
geography, channel, and customer • Category and brand shopper indicators: purchasing households,
socioeconomic profile (e.g., A-B-C-D-E), absolute penetration (percentage of purchasing households), relative penetration (percentage of category purchasing households ), average spend, frequency of purchase, and brand loyalty
• Category shopper insights: when, where, how, and for whom they buy, percentage of planned purchases, price sensitivity, and preferred promotions
• Category consumer insights: when, where, and how they consume
• Category assortment by channel and customer: number of SKUs and share of assortment
• New product tracking (market share, distribution, promotional and advertising support, and share in handlers)
• Category pricing per unit and volume • Promotional indicators: share of folder, intensity, cut price
level, and uplift • Visual merchandising indicators: average number of facings,
share of shelf versus share of assortment.
When appropriate there will be a drill down by subcategory, segment, and subsegment. The key point is to summarize the key observations and implications of every topic of the analysis: ideally, this section of the TCP should be a one pager integrated by a deck of charts and graphs of supporting evidence.
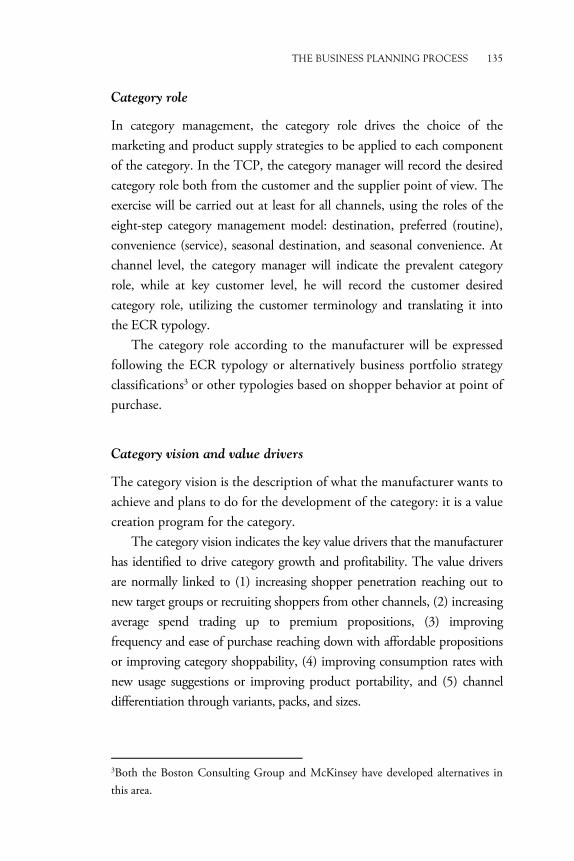
THE BUSINESS PLANNING PROCESS 135
Category role
In category management, the category role drives the choice of the marketing and product supply strategies to be applied to each component of the category. In the TCP, the category manager will record the desired category role both from the customer and the supplier point of view. The exercise will be carried out at least for all channels, using the roles of the eight-step category management model: destination, preferred (routine), convenience (service), seasonal destination, and seasonal convenience. At channel level, the category manager will indicate the prevalent category role, while at key customer level, he will record the customer desired category role, utilizing the customer terminology and translating it into the ECR typology.
The category role according to the manufacturer will be expressed following the ECR typology or alternatively business portfolio strategy classifications3 or other typologies based on shopper behavior at point of purchase.
Category vision and value drivers
The category vision is the description of what the manufacturer wants to achieve and plans to do for the development of the category: it is a value creation program for the category.
The category vision indicates the key value drivers that the manufacturer has identified to drive category growth and profitability. The value drivers are normally linked to (1) increasing shopper penetration reaching out to new target groups or recruiting shoppers from other channels, (2) increasing average spend trading up to premium propositions, (3) improving frequency and ease of purchase reaching down with affordable propositions or improving category shoppability, (4) improving consumption rates with new usage suggestions or improving product portability, and (5) channel differentiation through variants, packs, and sizes.
3Both the Boston Consulting Group and McKinsey have developed alternatives in this area.
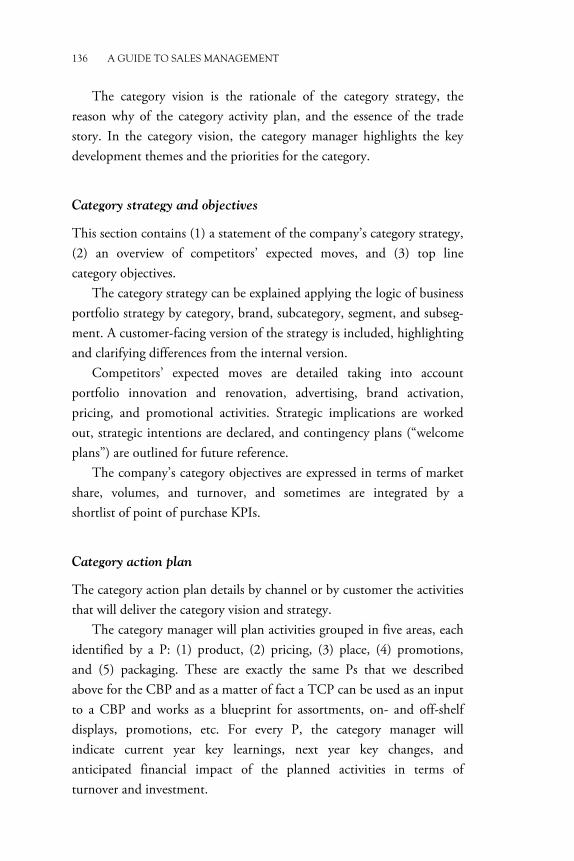
136 A GUIDE TO SALES MANAGEMENT
The category vision is the rationale of the category strategy, the reason why of the category activity plan, and the essence of the trade story. In the category vision, the category manager highlights the key development themes and the priorities for the category.
Category strategy and objectives
This section contains (1) a statement of the company’s category strategy, (2) an overview of competitors’ expected moves, and (3) top line category objectives.
The category strategy can be explained applying the logic of business portfolio strategy by category, brand, subcategory, segment, and subseg-ment. A customer-facing version of the strategy is included, highlighting and clarifying differences from the internal version.
Competitors’ expected moves are detailed taking into account portfolio innovation and renovation, advertising, brand activation, pricing, and promotional activities. Strategic implications are worked out, strategic intentions are declared, and contingency plans (“welcome plans”) are outlined for future reference.
The company’s category objectives are expressed in terms of market share, volumes, and turnover, and sometimes are integrated by a shortlist of point of purchase KPIs.
Category action plan
The category action plan details by channel or by customer the activities that will deliver the category vision and strategy.
The category manager will plan activities grouped in five areas, each identified by a P: (1) product, (2) pricing, (3) place, (4) promotions, and (5) packaging. These are exactly the same Ps that we described above for the CBP and as a matter of fact a TCP can be used as an input to a CBP and works as a blueprint for assortments, on- and off-shelf displays, promotions, etc. For every P, the category manager will indicate current year key learnings, next year key changes, and anticipated financial impact of the planned activities in terms of turnover and investment.
THE BUSINESS PLANNING PROCESS 137
Figure 6.6 An example of category activity calendar
The category action plan section will include a category activity calendar to summarize in one page all the major category activities including innovation, advertising support, and promotions by channel (see Figure 6.6).
Execution guidelines
The category manager will summarize all the activities planned for each of the five Ps in a number of documents that are useful to brief colleagues in account management and field marketing. I suggest to prepare the following papers:
• Assortment priorities—including channel assortment targets • Weighted distribution targets—phased by period and channel • Strategic pricing guidelines: price positioning relative to key
competitors for each brand, pack size, and variant • List prices, suggested retail prices, and front margins summary • Merchandising standards: in-store adjacencies, display
criteria, and standard planograms • Secondary placements plan • Merchandising tools for on-shelf display • Promotional strategy and objectives
138 A GUIDE TO SALES MANAGEMENT
• Promotional policy: promotional mechanics, promotional price and frequency by brand and SKU, detailed by channel, and phased by month and quarter
• Consumer offers plan • Special packs plan • Free standing unit and display pallet plan • In-store demo/animation plan • Secondary packaging plan: ready to sell and mixed cases.
At operational level, a company doing business in more than one category will have to prepare cross category and channel-specific versions of these documents both for field account managers and field merchandisers. These tasks are responsibilities of the sales operations and field marketing teams.
Category financials
Category financials summarize all brand data from gross sales value to net turnover. The category manager will follow the sales director trade investment and business planning guidelines and provide details for some components of trade investment such as consumer price promotion, new product introduction fees, and trade advertising allowances. He will also indicate the category promotional expenditures to be allocated below the net turnover line—these typically cover the cost for merchandising tools, displays, and in-store demonstrations.
Turnover phasing
Category turnover targets will have to be detailed by brand and phased by quarter for the same reasons already discussed for CBPs: a TCP is like a photograph taken at a given moment in time and it is somehow static, while companies need to manage their business dynamically.
Integrated business planning
Business planning is at the same time a functional and a cross-functional activity that demands and benefits from progressive integration.
THE BUSINESS PLANNING PROCESS 139
In a very fragmented market, BMPs can be the only component of a business planning exercise carried out before the beginning of the year and revised no more than once or twice during the year. As a market becomes more concentrated and channels and key customers start to emerge TCPs, and then CBPs, become a necessity. Most companies initially put these plans in a linear sequence, so that typically BMPs are an input to TCPs, which follow BMPs on the planning timeline and are an input to CBPs. The shortfall of this approach is that channel and customer-related opportunities and issues are not really reflected in the BMPs and emerge only at a later stage.
When channel differentiation becomes a must, some companies force their brand managers and category managers to prepare their BMPs and TCPs in parallel. A brief with all the necessary assumptions and business planning guidelines is assembled by the board of directors and passed on to the managers for the development of integrated BMPs–TCPs, that once approved become an input for CBPs. The sales director will contribute to this brief indicating channel priorities, amount and timing of list price increases, trade spending drift, etc., to be considered in the plans. Once CBPs are ready and approved, they might imply some feedback to and adjustment of the original BMPs and TCPs (see Figure 6.7).
When a market becomes very concentrated and a few customers are responsible for a very high share of the company turnover, channel planning is not enough anymore and CBPs need to be prepared and shared with the customers well in advance. In this case, some companies decide to brief brand managers, category managers and account managers to work on their BMPs, TCPs, and CBPs in parallel. In this event, the board of directors’ input will be more articulated and include also the main findings of a number of preworks such as category and brand audits, customer value assessment, (channel) customer audits, and supply chain audits—I discuss in detail the customer audit in the next paragraph. Once all the plans (BMPs, TCPs, and CBPs) have been completed they need to be adjusted, aligned, and integrated into a single plan to be signed off by the board of directors (see Figure 6.8).
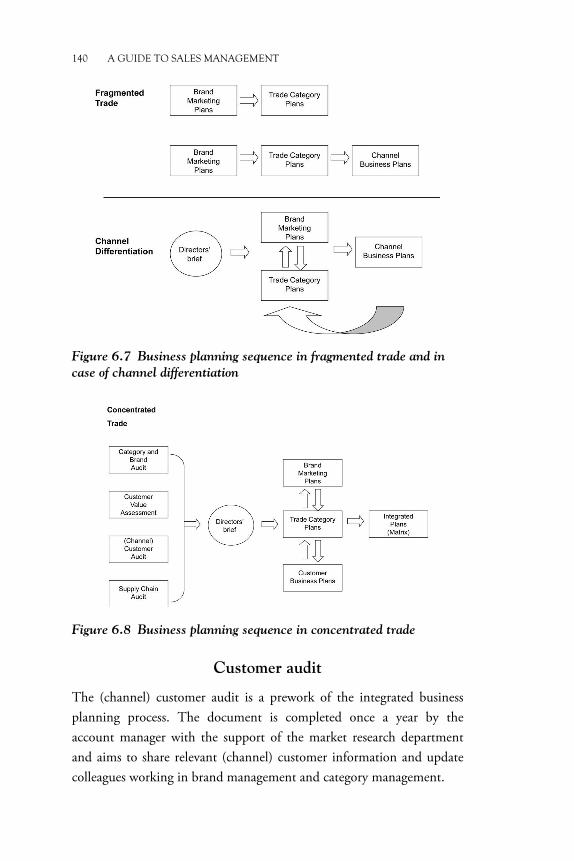
140 A GUIDE TO SALES MANAGEMENT
Figure 6.7 Business planning sequence in fragmented trade and in
case of channel differentiation
Figure 6.8 Business planning sequence in concentrated trade
Customer audit
The (channel) customer audit is a prework of the integrated business planning process. The document is completed once a year by the account manager with the support of the market research department and aims to share relevant (channel) customer information and update colleagues working in brand management and category management.
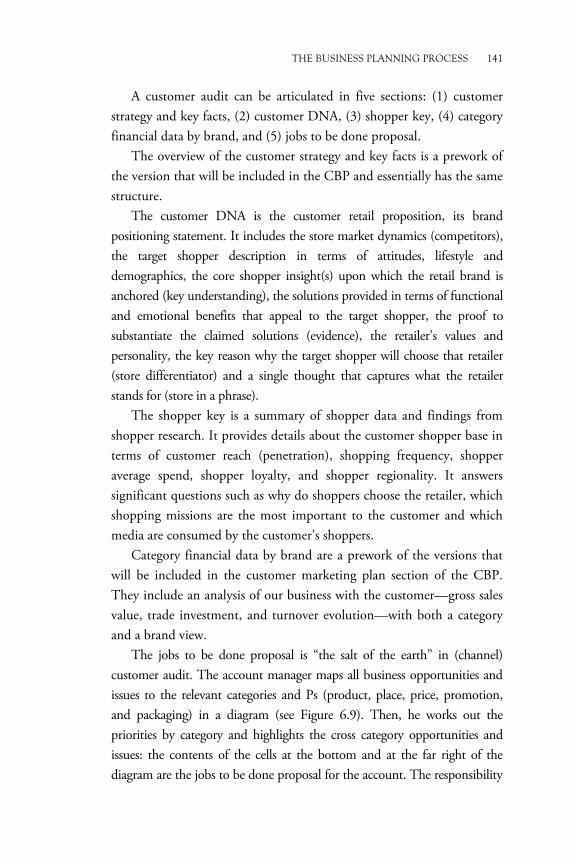
THE BUSINESS PLANNING PROCESS 141
A customer audit can be articulated in five sections: (1) customer strategy and key facts, (2) customer DNA, (3) shopper key, (4) category financial data by brand, and (5) jobs to be done proposal.
The overview of the customer strategy and key facts is a prework of the version that will be included in the CBP and essentially has the same structure.
The customer DNA is the customer retail proposition, its brand positioning statement. It includes the store market dynamics (competitors), the target shopper description in terms of attitudes, lifestyle and demographics, the core shopper insight(s) upon which the retail brand is anchored (key understanding), the solutions provided in terms of functional and emotional benefits that appeal to the target shopper, the proof to substantiate the claimed solutions (evidence), the retailer’s values and personality, the key reason why the target shopper will choose that retailer (store differentiator) and a single thought that captures what the retailer stands for (store in a phrase).
The shopper key is a summary of shopper data and findings from shopper research. It provides details about the customer shopper base in terms of customer reach (penetration), shopping frequency, shopper average spend, shopper loyalty, and shopper regionality. It answers significant questions such as why do shoppers choose the retailer, which shopping missions are the most important to the customer and which media are consumed by the customer’s shoppers.
Category financial data by brand are a prework of the versions that will be included in the customer marketing plan section of the CBP. They include an analysis of our business with the customer—gross sales value, trade investment, and turnover evolution—with both a category and a brand view.
The jobs to be done proposal is “the salt of the earth” in (channel) customer audit. The account manager maps all business opportunities and issues to the relevant categories and Ps (product, place, price, promotion, and packaging) in a diagram (see Figure 6.9). Then, he works out the priorities by category and highlights the cross category opportunities and issues: the contents of the cells at the bottom and at the far right of the diagram are the jobs to be done proposal for the account. The responsibility
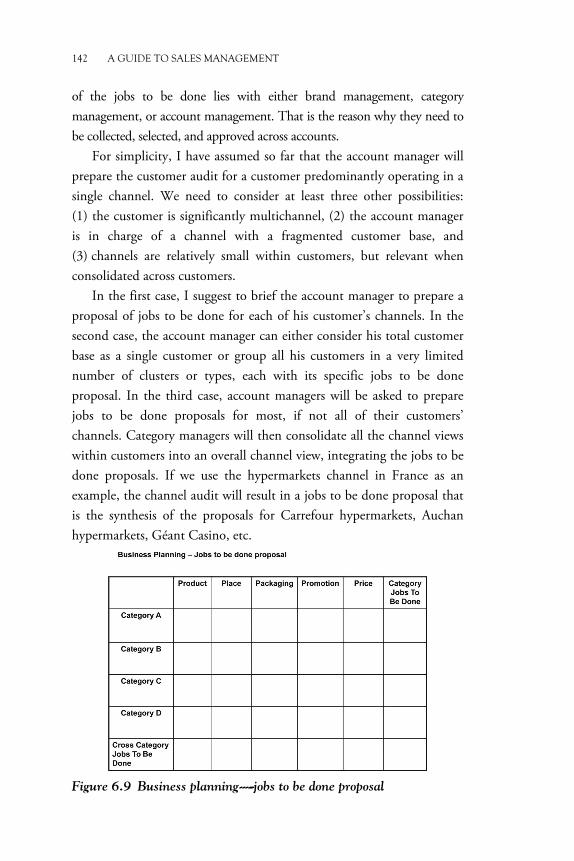
142 A GUIDE TO SALES MANAGEMENT
of the jobs to be done lies with either brand management, category management, or account management. That is the reason why they need to be collected, selected, and approved across accounts.
For simplicity, I have assumed so far that the account manager will prepare the customer audit for a customer predominantly operating in a single channel. We need to consider at least three other possibilities: (1) the customer is significantly multichannel, (2) the account manager is in charge of a channel with a fragmented customer base, and (3) channels are relatively small within customers, but relevant when consolidated across customers.
In the first case, I suggest to brief the account manager to prepare a proposal of jobs to be done for each of his customer’s channels. In the second case, the account manager can either consider his total customer base as a single customer or group all his customers in a very limited number of clusters or types, each with its specific jobs to be done proposal. In the third case, account managers will be asked to prepare jobs to be done proposals for most, if not all of their customers’ channels. Category managers will then consolidate all the channel views within customers into an overall channel view, integrating the jobs to be done proposals. If we use the hypermarkets channel in France as an example, the channel audit will result in a jobs to be done proposal that is the synthesis of the proposals for Carrefour hypermarkets, Auchan hypermarkets, Géant Casino, etc.
Figure 6.9 Business planning------jobs to be done proposal
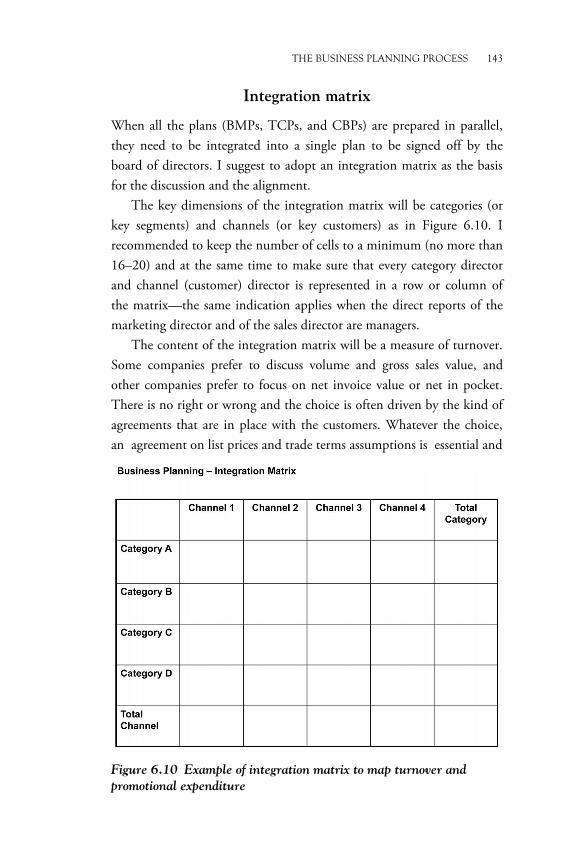
THE BUSINESS PLANNING PROCESS 143
Integration matrix
When all the plans (BMPs, TCPs, and CBPs) are prepared in parallel, they need to be integrated into a single plan to be signed off by the board of directors. I suggest to adopt an integration matrix as the basis for the discussion and the alignment.
The key dimensions of the integration matrix will be categories (or key segments) and channels (or key customers) as in Figure 6.10. I recommended to keep the number of cells to a minimum (no more than 16–20) and at the same time to make sure that every category director and channel (customer) director is represented in a row or column of the matrix—the same indication applies when the direct reports of the marketing director and of the sales director are managers.
The content of the integration matrix will be a measure of turnover. Some companies prefer to discuss volume and gross sales value, and other companies prefer to focus on net invoice value or net in pocket. There is no right or wrong and the choice is often driven by the kind of agreements that are in place with the customers. Whatever the choice, an agreement on list prices and trade terms assumptions is essential and
Figure 6.10 Example of integration matrix to map turnover and
promotional expenditure
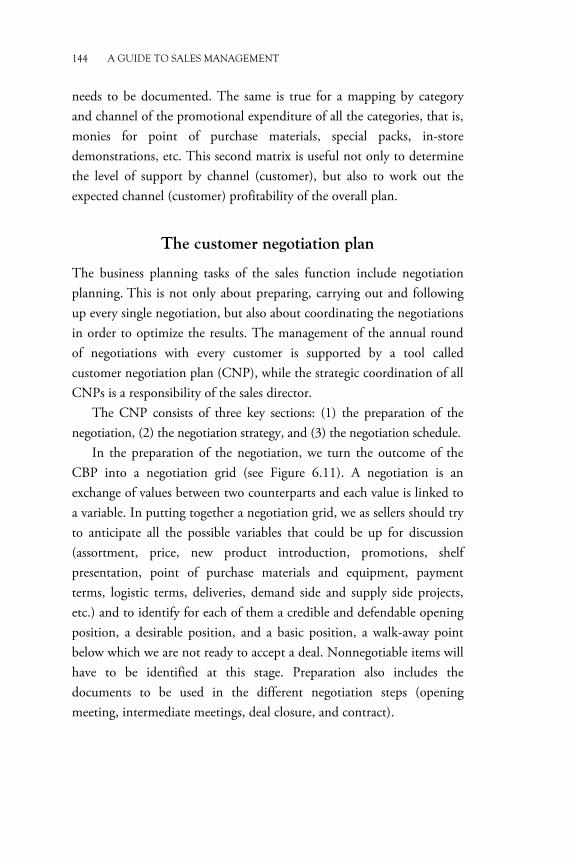
144 A GUIDE TO SALES MANAGEMENT
needs to be documented. The same is true for a mapping by category and channel of the promotional expenditure of all the categories, that is, monies for point of purchase materials, special packs, in-store demonstrations, etc. This second matrix is useful not only to determine the level of support by channel (customer), but also to work out the expected channel (customer) profitability of the overall plan.
The customer negotiation plan
The business planning tasks of the sales function include negotiation planning. This is not only about preparing, carrying out and following up every single negotiation, but also about coordinating the negotiations in order to optimize the results. The management of the annual round of negotiations with every customer is supported by a tool called customer negotiation plan (CNP), while the strategic coordination of all CNPs is a responsibility of the sales director.
The CNP consists of three key sections: (1) the preparation of the negotiation, (2) the negotiation strategy, and (3) the negotiation schedule.
In the preparation of the negotiation, we turn the outcome of the CBP into a negotiation grid (see Figure 6.11). A negotiation is an exchange of values between two counterparts and each value is linked to a variable. In putting together a negotiation grid, we as sellers should try to anticipate all the possible variables that could be up for discussion (assortment, price, new product introduction, promotions, shelf presentation, point of purchase materials and equipment, payment terms, logistic terms, deliveries, demand side and supply side projects, etc.) and to identify for each of them a credible and defendable opening position, a desirable position, and a basic position, a walk-away point below which we are not ready to accept a deal. Nonnegotiable items will have to be identified at this stage. Preparation also includes the documents to be used in the different negotiation steps (opening meeting, intermediate meetings, deal closure, and contract).
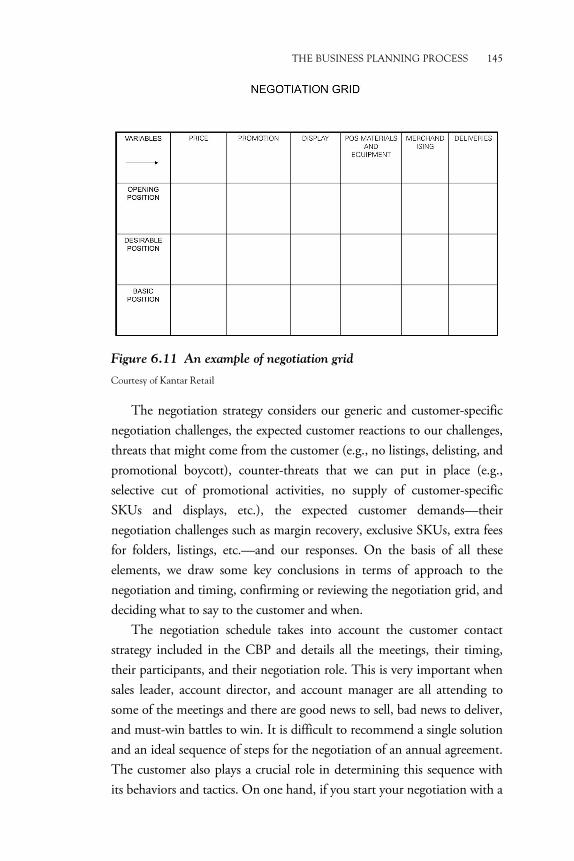
THE BUSINESS PLANNING PROCESS 145
Figure 6.11 An example of negotiation grid
Courtesy of Kantar Retail
The negotiation strategy considers our generic and customer-specific negotiation challenges, the expected customer reactions to our challenges, threats that might come from the customer (e.g., no listings, delisting, and promotional boycott), counter-threats that we can put in place (e.g., selective cut of promotional activities, no supply of customer-specific SKUs and displays, etc.), the expected customer demands—their negotiation challenges such as margin recovery, exclusive SKUs, extra fees for folders, listings, etc.—and our responses. On the basis of all these elements, we draw some key conclusions in terms of approach to the negotiation and timing, confirming or reviewing the negotiation grid, and deciding what to say to the customer and when.
The negotiation schedule takes into account the customer contact strategy included in the CBP and details all the meetings, their timing, their participants, and their negotiation role. This is very important when sales leader, account director, and account manager are all attending to some of the meetings and there are good news to sell, bad news to deliver, and must-win battles to win. It is difficult to recommend a single solution and an ideal sequence of steps for the negotiation of an annual agreement. The customer also plays a crucial role in determining this sequence with its behaviors and tactics. On one hand, if you start your negotiation with a
146 A GUIDE TO SALES MANAGEMENT
top-to-top meeting you are very likely to have to conclude it with a (formal) top-to-top deal closure meeting, after a few intermediate steps. On the other hand, a top-to-top meeting at the opening of the negotiation can be very effective to set the scene, to protect business fundamentals and nonnegotiables such as list prices and payment terms and to appeal to customers with growth initiatives.
All CNPs are strategically coordinated by the sales director with respect to the three key sections of preparation of the negotiation, negotiation strategy, and negotiation schedule. In terms of preparation, she will make sure that all intended deals are internally standardized according to an optimal deal structure with full transparency on terms and related counterparts. In terms of strategy, she will have to choose her battles across customers, deciding to avoid conflict, and potential boycott with some customers in order to focus her team efforts on other customers. She will also have to secure enough war money, calculating the turnover and profit impact of possible boycotts—based on worst-case scenarios such as full promotional embargo and refusal to list new products—and obtaining the commitment of the company’s board of directors to go all the way and hold out during some negotiations. In terms of schedule, she will ensure that a meeting calendar is set for each customer in such a way that allows to time the negotiation battles across customers, planning a different negotiation flow by customer, so that potential boycotts cannot take place at the same time and early deals with some customers can put extra pressure to close the deal on other customers.
Once the deals are all closed and the negotiation of annual agreements is completed, the sales director will feed back the results to the board of directors that will decide whether it is necessary to adjust the business plan immediately or not.
IT tools for business planning
I will not discuss the technical features of the IT architecture that most companies have in place—a database, an enterprise resource planning (ERP) system, a business intelligence (BI) tool, and a customer
THE BUSINESS PLANNING PROCESS 147
relationship management (CRM) system for marketing and sales activities. However, for a key process like business planning, it is necessary to clarify the sales management requirements that must be satisfied when developing or changing the IT system infrastructure.
Business planning in itself can be run with relatively simple excel, PowerPoint, or word templates, but to be able to feed these documents more quickly we need in the first place the support of IT systems and user-friendly tools that can help us to access and easily read both internal and external data. Business and competitive intelligence tools4 that provide dashboards, standard reports, and customized reports are essential to this purpose.
The second basic need is a cash up tool that enables to work out gross sales value and net invoice value starting from the planned volumes and taking into account list prices and on-invoice discounts (trade investments)5. This tool is very useful also to support an efficient sales and operations planning process.
The third basic need is a target setting tool that enables to work out individual sales quota for every national and field account manager and for every month and quarter, starting from the overall plan and on the basis of their assigned trade accounts.
A more sophisticated and advanced approach to customer management implies the need of other tools such as a budget allocation tool, a promotional management tool, and a profitability simulator.
In a fragmented trade environment, tracking and consolidating the actual off-invoice trade spending versus plan can be very time consuming and can slow down dynamic performance management through budget allocation planning and replanning. A repository where every national and field account manager must record the trade spending budget that he has committed to his customers and check his
4 Oracle Business Intelligence tools—starting from the glorious Oracle Sales Analyzer—and Microsoft/ProClarity tools such as Pyramid Analytics are probably the best-known solutions. 5Ideally, a cash up tool should also calculate turnover (net in pocket), considering also all the off-invoice rebates (trade investments). However, very often there is a trade-off between the tool completeness and its performance speed.
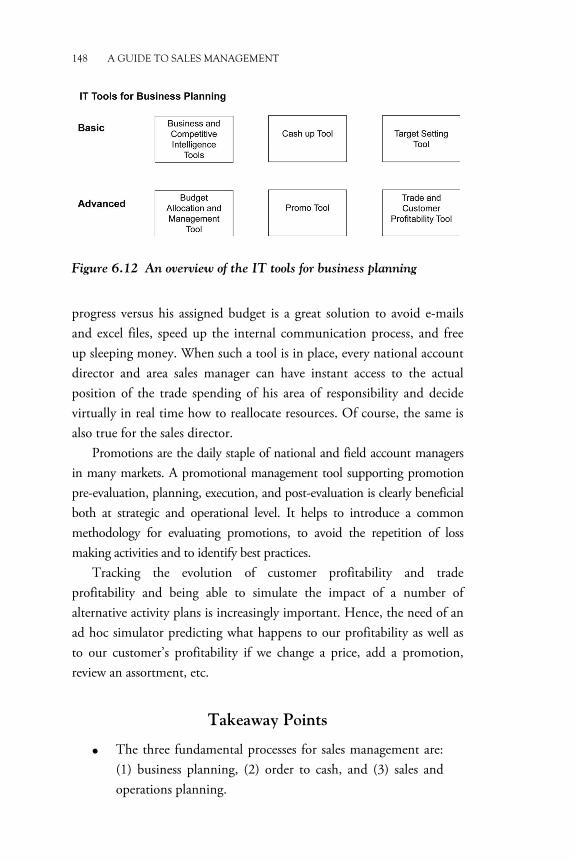
148 A GUIDE TO SALES MANAGEMENT
Figure 6.12 An overview of the IT tools for business planning
progress versus his assigned budget is a great solution to avoid e-mails and excel files, speed up the internal communication process, and free up sleeping money. When such a tool is in place, every national account director and area sales manager can have instant access to the actual position of the trade spending of his area of responsibility and decide virtually in real time how to reallocate resources. Of course, the same is also true for the sales director.
Promotions are the daily staple of national and field account managers in many markets. A promotional management tool supporting promotion pre-evaluation, planning, execution, and post-evaluation is clearly beneficial both at strategic and operational level. It helps to introduce a common methodology for evaluating promotions, to avoid the repetition of loss making activities and to identify best practices.
Tracking the evolution of customer profitability and trade profitability and being able to simulate the impact of a number of alternative activity plans is increasingly important. Hence, the need of an ad hoc simulator predicting what happens to our profitability as well as to our customer’s profitability if we change a price, add a promotion, review an assortment, etc.
Takeaway Points
• The three fundamental processes for sales management are: (1) business planning, (2) order to cash, and (3) sales and operations planning.
THE BUSINESS PLANNING PROCESS 149
• Customers (channels) are the business planning units of the sales function that is responsible for customer business plans (CBPs).
• Trade category plans (TCPs) are the link between CBPs and brand marketing plans (BMPs).
• Depending on the company’s organizational structure, the sales function may also be responsible for TCPs.
• A customer value assessment is the prerequisite of customer business planning.
• The sales director is responsible for designing business planning guidelines for each customer group identified in the customer value assessment.
• The CBP includes: (1) customer strategy and key facts, (2) customer performance and profitability, (3) customer marketing plan, (4) customer operations plan, (5) trade terms plan, (6) customer contact strategy, and (7) turnover phasing.
• Brand marketing plans (BMPs) or marketing-----trade marketing alignment are the prerequisite of the TCP.
• The TCP includes: (1) category definition and structure, (2) market key facts, (3) category role, (4) category vision and value drivers, (5) category strategy and objectives, (6) category action plan, (7) execution guidelines, (8) category financials, and (9) turnover phasing.
• Some companies do their business planning in a linear sequence: the BMPs are an input to TCPs, which in turn feed CBPs.
• In modern concentrated markets, some companies do their business planning in parallel: marketing and sales directors brief brand managers, category managers, and account managers whose plans are then compared and integrated.
• The (channel) customer audit is a prework of the integrated business planning process.
• The customer negotiation plan (CNP) is a tool to manage the annual round of negotiations that consists of: (1) the
150 A GUIDE TO SALES MANAGEMENT
preparation of the negotiation based on the CBP, (2) the negotiation strategy, and (3) the negotiation schedule.
• Once the negotiation of annual agreements is completed, the sales director feeds back the results to the board of directors that decides whether to confirm or adjust the business plan.
• The basic IT tools needed to support business planning are a business intelligence tool, a volume cash up tool, and a target setting tool. A more advanced approach to customer management implies the need of other tools such as a budget allocation tool, a promotional management tool, and a trade and customer profitability simulator.
CHAPTER 7
The Order to Cash Process
The definition of order to cash
In a very simple way, order to cash (O2C) can be defined as the process of making a sale and then collecting the cash from this sale. In a logical sequence, the O2C process follows the sales process, and it is about managing an order after a deal, fulfilling the order, delivering the goods, invoicing the customer, and collecting money, when the invoice is due for payment.
If we use the 7 Rs that very often recur in supply chain management literature, we can say that O2C is the process of collecting orders, delivering the right product, to the right place (customer), with the right price, at the right time, in the right quantity, in the right quality (condition and packag-ing), and with the right documents and finally getting payments in the right amount and at the right time. This detailed definition highlights how the O2C process combines an information (documentation) flow with a material flow and a cash flow.
The optimization of the O2C process not only delivers cost benefits, but also improves a company’s reputation and customer relationship management (CRM) as a result of improved customer satisfaction due to fewer operational issues, disputes, blocked orders, etc. An effective O2C is a very solid base from which to free up time to focus on selling and business building. These are all very good reasons why a sales director should care about O2C and push her team to support this process.
The phases of the O2C cycle
An analysis of the O2C process must necessarily start from its key building blocks, namely:
a. Preparation b. Order taking
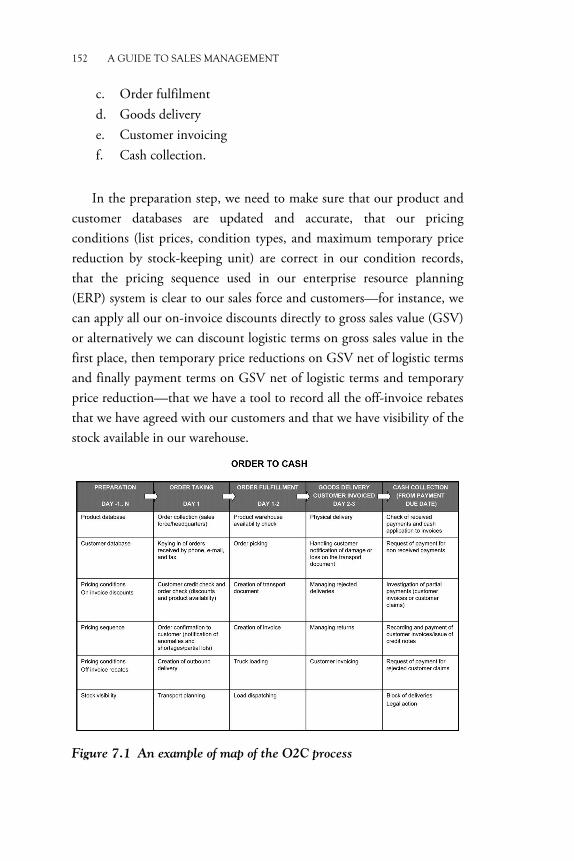
152 A GUIDE TO SALES MANAGEMENT
c. Order fulfilment d. Goods delivery e. Customer invoicing f. Cash collection.
In the preparation step, we need to make sure that our product and customer databases are updated and accurate, that our pricing conditions (list prices, condition types, and maximum temporary price reduction by stock-keeping unit) are correct in our condition records, that the pricing sequence used in our enterprise resource planning (ERP) system is clear to our sales force and customers—for instance, we can apply all our on-invoice discounts directly to gross sales value (GSV) or alternatively we can discount logistic terms on gross sales value in the first place, then temporary price reductions on GSV net of logistic terms and finally payment terms on GSV net of logistic terms and temporary price reduction—that we have a tool to record all the off-invoice rebates that we have agreed with our customers and that we have visibility of the stock available in our warehouse.
Figure 7.1 An example of map of the O2C process
THE ORDER TO CASH PROCESS 153
Orders are collected by the sales force or can arrive directly to the headquarters via EDI, phone, e-mail, or fax and therefore in some cases need to be keyed in by customer-care assistants. Customer credit is checked and orders are then controlled in terms of discounts and product availability and totally or partially confirmed to customers. Order confirmation is a standard EDI module, but most companies contact customers only in case of order nonconformity or expected shortages. Once the order is checked and cleared, customer care creates an outbound delivery in the ERP system to book a truck, so that the warehouse and transportation team can work at their transport planning.
Order fulfilment consists of checking product availability in the warehouse, order picking, creating a transport document and an invoice, truck loading, and dispatching to customer.
Goods delivery includes the physical delivery of goods in the agreed place and on the agreed day or delivery slot, handling any customer notification of damage or loss on the transport document, and managing rejected deliveries and returns. Customer invoicing simply follows goods delivery.
Cash collection starts when the invoice is due for payment. If payment is received in full on the agreed day, the O2C cycle is completed; otherwise, we need to investigate why we did not receive any payment or only a partial payment. In the first case, we will send a kind reminder or a formal request of payment to the customer—our choice will depend on the customer habitual behavior, on the number of outstanding payments and on the overall amount due. In the second case we will check if the customer has any right to withhold a part of the payment in compensation for any amount of money that we owe him for listing fees, promotional services, or any other reason: there might be customer invoices that we have not recorded yet on our ledger or credit notes that we will have to issue for faulty goods, etc. However, if we do not accept the reason for the partial payment, we will have to send a formal request of payment1. Cash collection in its most extreme forms also includes blocking deliveries2 and taking legal action against the customer.
1Pezza (2011) suggests that a formal distinction between cash collections, deductions management (dispute resolution) and cash applications to invoices is beneficial to the automation and integration of O2C. 2Blocking deliveries is unlawful in some countries.
154 A GUIDE TO SALES MANAGEMENT
In Figure 7.1, we map as an example all the key activities of an O2C process with an order to delivery lead time from 24 to 72 hours.
The golden rule and the principles of O2C
An efficient and effective O2C process can lead to a competitive advantage in customer service. Your competitors may guarantee better margins or even higher rates of sale than you do, but if you are the most responsive and reliable supplier, customers will come looking for you when they need a last minute promotion or a quick delivery. It is widely upheld by customer-service professionals that the golden rule of O2C is simply:
‘‘Always try to get things right first time!’’
This is undeniably true, but then the key question is “How can you do that?” The answer is the observance of the 12 key principles of O2C, the enablers of effective order management: 1. Ensure your master data are accurate: your list prices, products
specifications (dimensions, size, and weight), number of units per case, and number of cases per pallet must be correct.
2. Ensure your IT system is stable and reliable. 3. Adhere to your customer’s standard terms and conditions or obtain
early customer’s authorization of deviations from its standard terms: there is no use in hiding problems under the carpet, if terms and conditions of sale and terms and conditions of purchase are not aligned the O2C process cannot be efficient.
4. Understand your customers and their purchase to pay process: learn their order frequency, normal day of order and typical order size, their promotion management, their new product introduction process, their way of paying—if they pay as billed or deduct and compensate for monies that your company owes them.
5. Communicate promptly any change of code, packaging, product dimensions, and weight: manage the dynamic side of master data accuracy.
6. Agree upfront how annual agreements, price promotions, and list price changes will be managed in terms of start date, temporary
THE ORDER TO CASH PROCESS 155
price reductions, and refund method: it will save both parties a lot of time and effort.
7. Be always proactive and not reactive: anticipate potential issues and propose alternative solutions.
8. Issue credit notes on a regular basis: correct your invoicing and delivery mistakes quickly.
9. Handle your customer’s invoices effectively: make sure that they are recorded on the ledger as soon as possible.
10. Contact customers as soon as debts become overdue: when it comes to payments, let them prioritize your company as strict and demanding.
11. Offer early payment discounts to accelerate payments and improve your cash flow.
12. Build better relationships with your customers: organize regular reviews with their finance, administration, and logistic teams to drive O2C improvements.
Adherence to these principles will result in effective O2C
management and the creation of a solid base on which to build customer relationships.
Roles and responsibilities of the O2C cycle
The O2C cycle is at the heart of the management of ongoing customer-service operations together with after sale assistance and customer care. As the O2C cycle can be broken down into three main chunks—preparation (master data management, pricing conditions, sequence, etc.), order to delivery (order taking, order fulfilment, delivery, and invoicing), and delivery to cash (credit control and cash collection)—it is very likely that different people will be assigned to these tasks. In many cases (most of) preparation and order to delivery are in the hands of customer-service specialists, while delivery to cash is in the hands of finance specialists reporting to a different boss.
In some cases, the whole customer-service team reports to the head of supply chain, but there are also organizational solutions in the marketplace where the customer-service team reports either to the head of finance or to the head of sales. This variability of reporting lines
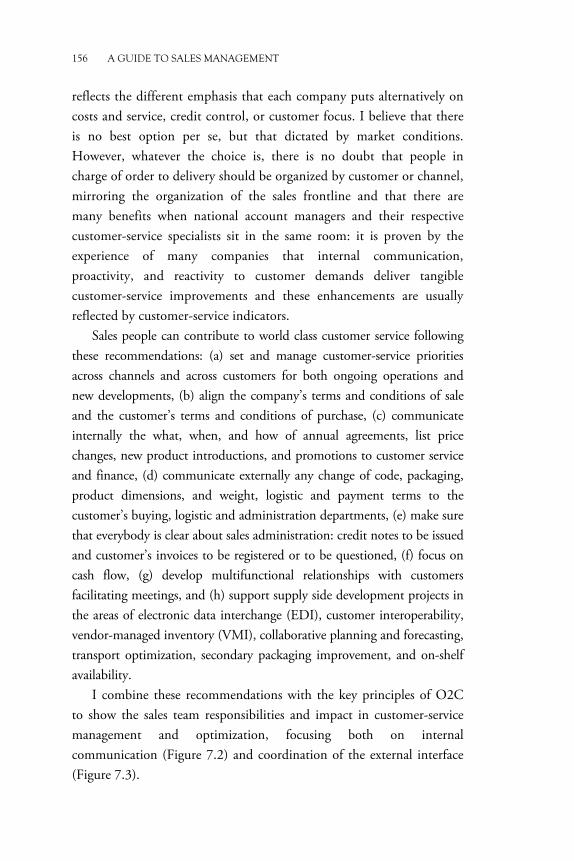
156 A GUIDE TO SALES MANAGEMENT
reflects the different emphasis that each company puts alternatively on costs and service, credit control, or customer focus. I believe that there is no best option per se, but that dictated by market conditions. However, whatever the choice is, there is no doubt that people in charge of order to delivery should be organized by customer or channel, mirroring the organization of the sales frontline and that there are many benefits when national account managers and their respective customer-service specialists sit in the same room: it is proven by the experience of many companies that internal communication, proactivity, and reactivity to customer demands deliver tangible customer-service improvements and these enhancements are usually reflected by customer-service indicators.
Sales people can contribute to world class customer service following these recommendations: (a) set and manage customer-service priorities across channels and across customers for both ongoing operations and new developments, (b) align the company’s terms and conditions of sale and the customer’s terms and conditions of purchase, (c) communicate internally the what, when, and how of annual agreements, list price changes, new product introductions, and promotions to customer service and finance, (d) communicate externally any change of code, packaging, product dimensions, and weight, logistic and payment terms to the customer’s buying, logistic and administration departments, (e) make sure that everybody is clear about sales administration: credit notes to be issued and customer’s invoices to be registered or to be questioned, (f) focus on cash flow, (g) develop multifunctional relationships with customers facilitating meetings, and (h) support supply side development projects in the areas of electronic data interchange (EDI), customer interoperability, vendor-managed inventory (VMI), collaborative planning and forecasting, transport optimization, secondary packaging improvement, and on-shelf availability.
I combine these recommendations with the key principles of O2C to show the sales team responsibilities and impact in customer-service management and optimization, focusing both on internal communication (Figure 7.2) and coordination of the external interface (Figure 7.3).
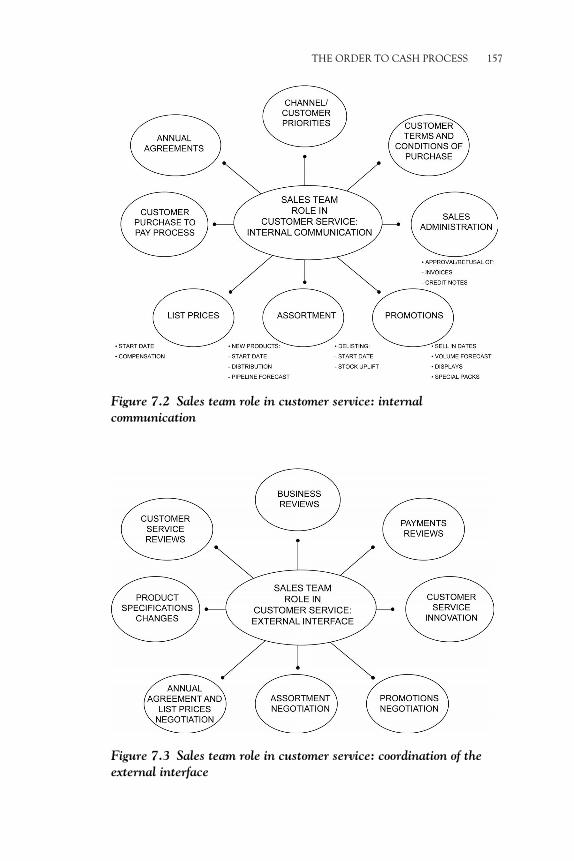
THE ORDER TO CASH PROCESS 157
Figure 7.2 Sales team role in customer service: internal
communication
Figure 7.3 Sales team role in customer service: coordination of the
external interface
158 A GUIDE TO SALES MANAGEMENT
The sales team role in the external interface is not only about negotiations and periodic business reviews with the customer category buying department, it is also about regular performance-based customer-service and payments reviews, which will involve as well the customer supply chain and finance departments. The same cross-functional approach will be applied to develop supply side and customer-service innovation programs.
The performance indicators of the O2C cycle
Like any other process the O2C cycle can be measured both in terms of its efficacy and efficiency.
The perfect order index (POI) is a supply chain metric that can be applied to measure O2C efficacy. There are a few variants of the index, depending on the type and number of components that are included in the calculation.
The simplest version of POI is OT-IF-NIE3, that considers an order to be perfect only if it is delivered on time (OT), complete/in full (IF), and with no invoice error (NIE). On time can be defined in many ways (e.g., on the requested day/on or before appointed time/1 hour from appointed time/30 minutes from appointed time) and the stricter the definition, the lowest will be the percentage of actual on-time orders.
The most common version of POI adds “free of damage” as another component after on time and in full and substitutes NIE with a more general “correct invoice and other documentation.” Further variants of this version can have “shipped on-time” rather than “delivered on-time” and/or “shipped free of damage” rather than “delivered free of damage.”
More advanced versions of POI also take into account efficiency measures of order entry accuracy, considering both orders that are not automatically blocked by the sales and distribution module of the ERP system and untouched orders that are not manually reworked after entering the system. If we consider also order entry accuracy, we can calculate the POI as follows:
3OT-IF is even simpler and it is somehow similar to customer case fill on time.
THE ORDER TO CASH PROCESS 159
% of orders not blocked by order management system e.g., 80 percent
× % of untouched orders 90 percent
× % of orders delivered on time 95 percent
× % of orders delivered in full 95 percent
× % of orders delivered free of damage 98 percent
× % of orders with correct invoice 95 percent
= Perfect Order Index 60 percent
If we considered only the last four items in our example, POI would be 84 percent, a very good result4.
Mukerij (2012) focuses on improving the management of accounts receivable (AR) and suggests a list of O2C key performance indicators including: (a) days sales outstanding (DSO), (b) cost of collections, (c) deductions as a percentage of collections, (d) percentage of dispute resolutions within a set number of days, (e) percentage of collections in electronic form (with auto application to invoices), (f) percentage accuracy of manual collections applied to invoices within a set number of days, and (g) unapplied cash as a percentage of cash collections. On the basis of best practices Mukerij suggests that the sales team should be targeted and incentivized on collections of AR.
The O2C cycle efficiency can also be measured through its cost to serve (CTS). There are a few definitions of CTS that can be used as examples:
• The Institute of Grocery Distribution describes CTS as a
supply chain analytical approach utilizing activity-based cost techniques that identifies the costs of servicing specific customers, with specific products, by allocating costs to customers, products, and channels.
• The Corporate Executive Board advisory company considers CTS as a component of the total delivered cost (TDC).
4See for comparison the studies of Retail Compliance Council (2005), Vitasek and Manrodt (April 2008), and Butner (2010).
160 A GUIDE TO SALES MANAGEMENT
TDC is the sum of all costs attributed to a customer order, from receipt of the order from the customer through delivery of the product to the customer, incorporating the cost of goods sold and cost to serve, including order-specific distribution, warehousing, manufacturing, customization, packaging, service, and handling costs.
• Unilever defines CTS as the sum of all business activity costs driven by customer behavior: from receipt of their order, through delivery of the product to the customer’s depots and where possible, to the customer’s shelf. CTS incorporates allocation of general business trading costs as well as order-specific, marketing, warehousing, transportation, manufactur-ing, customization, packaging, selling, and handling costs.
This last definition is probably one of the most complete, but it implies building a very articulated analytical model, whose components are the costs of sales, order, depot, delivery, payment, customer-specific investments, as well as nonprocess costs.
However, even a simplified CTS model can deliver a number of benefits. It helps to move away from an approach focused on average costs based on volume. It enables to distinguish profitability in individual customers, based on allocating the costs incurred in meeting their particular business needs. This may include customer behaviors that generate high costs, such as customers frequently rescheduling a delivery. Visibility of these high costs enables the manufacturer to understand the real cost to serve and identify the customer’s behaviors that impact their profitability. A CTS model allows a company to select the customers to be included in its portfolio, to make decisions based on the return on investment of a particular service offering and to choose whether or not to implement trade terms in order to change customer behaviors.
IT tools for O2C
The O2C cycle is very demanding in terms of the business requirements that it implies and that must be satisfied by the company IT system
THE ORDER TO CASH PROCESS 161
infrastructure. We can distinguish between a basic and an advanced level of tools that will answer to the following needs:
• Master data management (product and customer database) • Order entry and processing • Managing pricing conditions (on-invoice discounts and off-
invoice rebates), condition types (percentages and lump sums), and pricing sequence
• Stock visibility and inventory management • Creation of deliveries, transport documents, and invoices • Managing customer notifications of loss or damage, rejected
deliveries, and returns • Payment checks • Sales analysis • Sales force automation (SFA) • Trade spending allocation and management • Promotion management and pre- and post-evaluation • Booking of special items, in-store promoters, and merchandisers • Store monitoring.
At the basic level, a company will need a reliable ERP system—the
sales and distribution module and the finance and accounting module are key for the O2C cycle—EDI capabilities and a basic SFA system5.
All the stages of the sales process can be supported by a SFA system. In its basic form, a SFA system consists of a sales lead tracking module, a contact management module, an order entry and management module, sales reports, and a product knowledge section. The sales lead tracking module contains a directory of potential customers that have been identified on the basis of some specific criteria. The contact management module tracks all the contacts that have been made with a given customer and records the purpose of each contact and the actions needed as a follow on.
5Research works by Pezza (2011) and the Harvard Business Review Analytic Services (2013) prove the impact of process automation and master data management on best practice in O2C management.
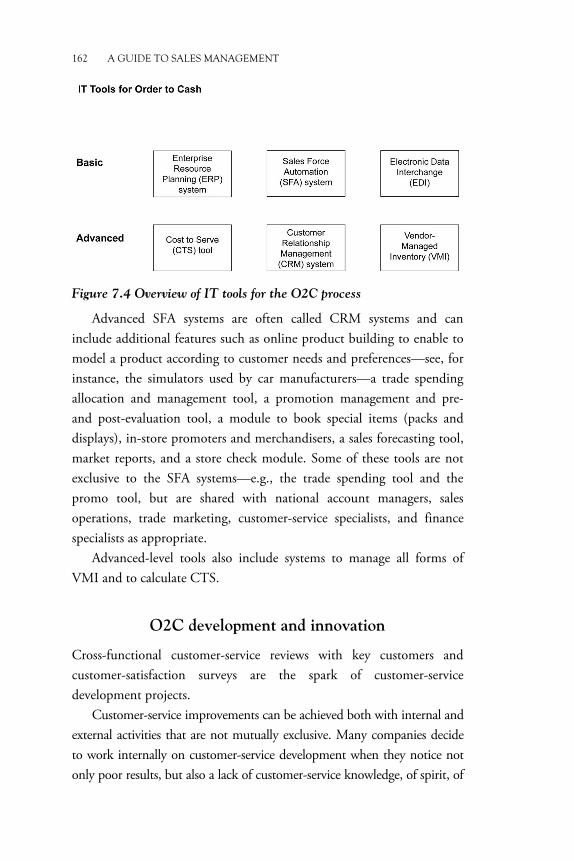
162 A GUIDE TO SALES MANAGEMENT
Figure 7.4 Overview of IT tools for the O2C process
Advanced SFA systems are often called CRM systems and can include additional features such as online product building to enable to model a product according to customer needs and preferences—see, for instance, the simulators used by car manufacturers—a trade spending allocation and management tool, a promotion management and pre- and post-evaluation tool, a module to book special items (packs and displays), in-store promoters and merchandisers, a sales forecasting tool, market reports, and a store check module. Some of these tools are not exclusive to the SFA systems—e.g., the trade spending tool and the promo tool, but are shared with national account managers, sales operations, trade marketing, customer-service specialists, and finance specialists as appropriate.
Advanced-level tools also include systems to manage all forms of VMI and to calculate CTS.
O2C development and innovation
Cross-functional customer-service reviews with key customers and customer-satisfaction surveys are the spark of customer-service development projects.
Customer-service improvements can be achieved both with internal and external activities that are not mutually exclusive. Many companies decide to work internally on customer-service development when they notice not only poor results, but also a lack of customer-service knowledge, of spirit, of
THE ORDER TO CASH PROCESS 163
enthusiasm and proactivity in their personnel and thus start programs to respond to a need to change mindset and attitudes. These include training sessions and workshops sponsored by the board of directors and aimed at emphasizing the importance of customer service, building confidence, and identifying improvement areas. As a practitioner, I am very supportive of these initiatives because they do work in energizing and empowering people, boosting their morale.
External activities take the shape of customer-specific collaborative supply side projects with various degrees of multifunctional involvement. These initiatives range from improving the way of working by mapping and optimizing processes—for instance, new product introductions or promotion management—to putting in place efficient replenishment systems, optimizing transport, enhancing product packaging, improving on-shelf availability, and sharing electronic point of sale or secondary sales data—the last one being a key enabler of other projects.
Efficient replenishment is based on the concept of minimizing costs and optimizing product availability at the customer warehouse or in store, involving some of the supplying manufacturers. The key element of efficient replenishment is the recording of sales data in an inventory control system of which suppliers have a good degree of visibility. Sales data and stock data are the basis on which suppliers are asked to prepare themselves the orders to be shipped to their customers. Efficient replenishment is normally regulated by an agreement in which the supplier accepts to operate a continuous replenishment service, respecting stock targets expressed as minimum and maximum number of days on hand, that reflect the customer’s safety stocks and cash flow objectives. In return, the supplier obtains access to customer sales data, adherence to its own order size and order composition rules, a guaranteed preferential delivery slot, etc. There are a few variants of the efficient replenishment concept that go under the names continuous replenishment program, VMI, and the more comprehensive collaborative planning, forecasting and replenishment.
Transport optimization includes a number of cost saving solutions from efficient unit loads to reusable transport items, multidrop deliveries, factory gate pricing, back-hauling, and cross docking.
164 A GUIDE TO SALES MANAGEMENT
Primary and secondary product packaging can be enhanced to respond to a number of needs from shrinkage (loss of product inventory caused by theft or damage) prevention, to meeting requirements for optimal shelf/retail ready packaging (SRP/RRP)6 to economic, environmental, and social sustainability.
On-shelf availability can be improved not only increasing the case fill rates from manufacturer warehouse to customer depots and from customer depots to stores, but also applying a total productive maintenance (TPM) approach to the management of the store backroom, to the organization of the shop floor and its layout, displays and planograms and to the upkeep of the store reordering system.
Takeaway Points
• The O2C process cycle starts when a deal has been closed and the customer places an order.
• The key building blocks of O2C are: (a) preparation, (b) order taking, (c) order fulfilment, (d) goods delivery, (e) customer invoicing, and (f) cash collection.
• The golden rule of O2C is “Always try to get things right first time!” This objective can be achieved applying the 12 key principles of O2C.
• The O2C cycle is managed by customer-service and finance specialists.
• Customer-service specialists in charge of order to delivery should be organized by customer or channel and sit in the same room of national account managers.
• Sales people can have a huge impact in delivering world–class customer service if they focus both on internal communication and coordination of the external interface.
• The perfect order index is a supply chain metric that can be applied to measure O2C efficacy.
6ECR Europe and Accenture (2006) have identified five easy principles for optimal shelf ready packaging: easy to identify, easy to open, easy to shelf, easy to dispose, and easy to shop.

THE ORDER TO CASH PROCESS 165
• The O2C cycle efficiency can be measured through its cost to serve.
• The basic IT tools to support the O2C cycle are a reliable ERP system, a sales force automation system and EDI modules.
• Advanced IT tools also include a CRM system, a cost to serve tool, and VMI modules.
• Customer-service improvements can be achieved both with internal activities (training sessions and workshops) and external customer-specific supply side projects.

CHAPTER 8
The Sales and Operations Planning Process
The definition of sales and operations planning
Every company needs a form of integrated (cross-functional) dynamic performance management in the same way that it needs an integrated business planning framework. The solution is provided by a process called sales and operations planning (S&OP), which many good companies have in place, sometimes not knowingly or with a different name. I venture to say that if a business is doing well it must have some form of S&OP in place (a basis from which it can also improve its performance), and that on the contrary, if it is doing badly, one of the reasons must be the lack of an effective S&OP kind of approach1.
Once we have prepared our customer business plans and adjusted them following the negotiation of agreements with customers, the ball starts to roll, and as always, some activities will go according to plan, some actions will deliver more than anticipated, but others will fall short of the plan. This is in the nature of things and we need to manage the dynamics of our business plan.
Ling and Goddard (1988) say that “sales and operations planning is a dynamic process in which the company operating plan is updated on a regular monthly or more frequent basis.” Wallace (1999) essentially says that S&OP is a business process to balance demand and supply, to inte-grate marketing planning, sales planning, operational planning, and financial planning and to link the company strategic plans with its oper-ations. However, his formal definition is worth reporting in full because it contains very important details:
1Research data by APICS and IBF (2012) support this statement.
168 A GUIDE TO SALES MANAGEMENT
Sales & Operations Planning (S&OP) is a business process that helps companies keep demand and supply in balance. It does that by focusing on aggregate volumes – product families and groups – so that mix issues – individual products and customer orders – can be handled more readily. It occurs on a monthly cycle and displays information in both units and dollars. S&OP is cross-functional, involving General Management, Sales, Opera-tions, Finance and Product Development. It occurs at multiple levels within the company, up to and including the executive in charge of the unit e.g. division president, business unit general manager or CEO of a smaller corporation. S&OP links the com-pany’s Strategic Plans and Business Plan to its detailed processes – the order entry, master scheduling, plant scheduling, and purchasing tools it uses to run the business on a week-to-week, day-to-day and hour-to-hour basis. Used properly, S&OP enables the company’s managers to view the business holistically and gives them a window into the future.
This definition is very comprehensive and includes some of the princi-ples for effective S&OP that we will discuss in this chapter. I only want to give it more of a demand side flavor and add that S&OP helps com-panies achieve their business targets.
Why a sales director should care about S&OP?
There are very good reasons why a sales director should care about S&OP: (a) it is a means to reach the annual plan targets by systemati-cally checking progress, identifying gaps and planning corrective actions, (b) S&OP cannot be successful without sales input: customer intelligence must complement market intelligence, (c) “successful S&OP is not solely internal: customers notice” – see APICS and IBF (2012), and (d) the primary objectives of S&OP include not only balancing supply and demand, but also “maximizing revenue, minimiz-ing risk, improving customer service, responding quickly to market changes, and reducing inventory.” – see APICS and IBF (2012).
THE SALES AND OPERATIONS PLANNING PROCESS 169
A wise sales director will embrace S&OP and lead her team to play a very active role in it. She will align the sales team and discipline its par-ticipation to the process, she will lead the update of the short term fore-cast, and she will prioritize gap closing actions when necessary.
The phases of the S&OP cycle
Ling and Goddard (1988) summarize the key phases of the S&OP process noting that it:
Starts with the sales and marketing departments comparing actual demand to the sales plan, assessing the marketplace poten-tial and projecting future demand. The updated demand plan is then communicated to the manufacturing, engineering, and finance departments, which offer ways to support it. Any diffi-culties in supporting the sales plan are worked out, or the sales plans are altered in a process that concludes with a formal meet-ing chaired by the general manager.
This statement is more focused on the supply side of the S&OP pro-cess than on its demand side. When S&OP first came to the fore its main concern was to align sales and marketing plans with manufacturing, procurement, and finance plans in order to guarantee supply and custom-er service at an acceptable cost. This payoff of S&OP is now taken for granted, and the key benefit expected from running the S&OP process is hitting the company’s business targets in terms of sales and profit. In my working experience I learned that in order to achieve these two main objectives the key steps of an effective S&OP process are as follows: 1. Updating the sales forecasting system 2. Sales forecasting 3. Sense checking the sales forecast 4. Identifying gaps comparing the sales forecast to the annual opera-
tions plan 5. Planning gap filling activities 6. Checking feasibility and financial viability of gap filling activities
170 A GUIDE TO SALES MANAGEMENT
7. Gaining the company’s board of directors approval of the plan 8. Updating the planning system 9. Measuring process effectiveness 10. Identifying improvement areas.
This list shows that the S&OP process does not consists only of the formal S&OP meeting of the board of directors, but that it also implies a number of activities and preliminary functional and cross-functional meet-ings. As a consequence, many people are involved in the S&OP process, not only directors, but also middle managers, managers, and their aides.
Updating the sales forecasting system
There is a very annoying myth that says that S&OP can be done on a piece of paper. Well, if you are looking at six product families and 12 month rolling plus total year volume data that is already a piece of paper with 78 figures for sales forecasting only. If you add previous year data you end up with 156 numbers… What about another three or four product families? Do you also want to add value data?
The 78 figure one-page summary can be fine for the top manage-ment formal S&OP meeting, but clearly you need a system to record your sales forecast in volume or units and to cash it up quickly. On one hand, you need to be able to input your data by product family, subfam-ily, or even down to stock-keeping unit level, and on the other hand, you want to able to upload your forecast by sales channel or even by cus-tomer. The system needs to be regularly updated with actuals, list prices, on-invoice discounts, new product lines, and deleted items to enable the beginning of the S&OP cycle.
Sales forecasting
Sales forecasting is truly a multifunctional task. I will analyze how func-tions can contribute to build a robust company sales forecast, assuming a lead, a support, or a challenger role across the process time horizon. The adoption of an eight quarter (8Q) rolling horizon is a solution to get the right balance between short-, mid-, and long-term.
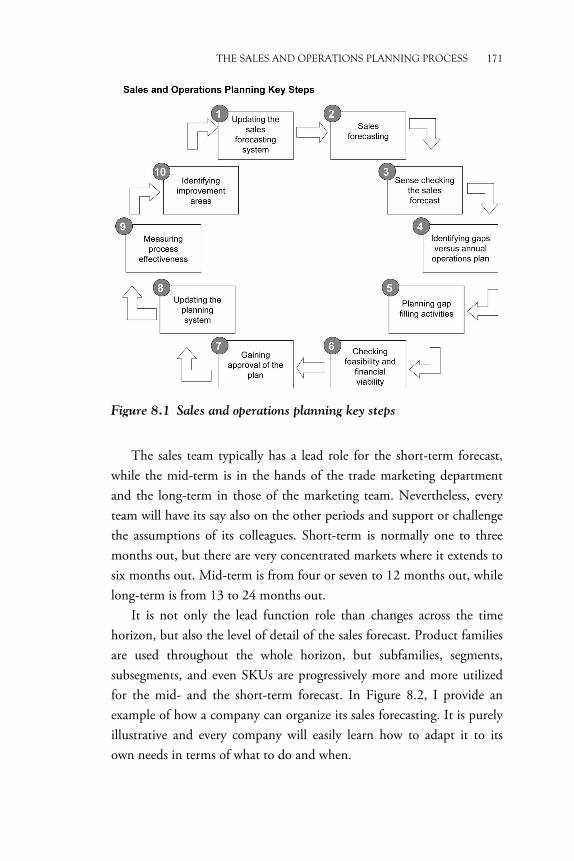
THE SALES AND OPERATIONS PLANNING PROCESS 171
Figure 8.1 Sales and operations planning key steps
The sales team typically has a lead role for the short-term forecast,
while the mid-term is in the hands of the trade marketing department and the long-term in those of the marketing team. Nevertheless, every team will have its say also on the other periods and support or challenge the assumptions of its colleagues. Short-term is normally one to three months out, but there are very concentrated markets where it extends to six months out. Mid-term is from four or seven to 12 months out, while long-term is from 13 to 24 months out.
It is not only the lead function role than changes across the time horizon, but also the level of detail of the sales forecast. Product families are used throughout the whole horizon, but subfamilies, segments, subsegments, and even SKUs are progressively more and more utilized for the mid- and the short-term forecast. In Figure 8.2, I provide an example of how a company can organize its sales forecasting. It is purely illustrative and every company will easily learn how to adapt it to its own needs in terms of what to do and when.
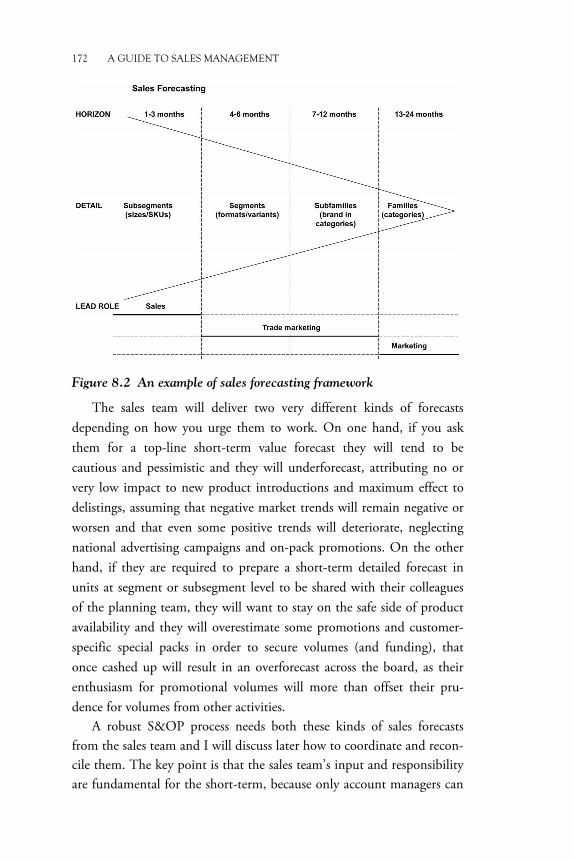
172 A GUIDE TO SALES MANAGEMENT
Figure 8.2 An example of sales forecasting framework
The sales team will deliver two very different kinds of forecasts depending on how you urge them to work. On one hand, if you ask them for a top-line short-term value forecast they will tend to be cautious and pessimistic and they will underforecast, attributing no or very low impact to new product introductions and maximum effect to delistings, assuming that negative market trends will remain negative or worsen and that even some positive trends will deteriorate, neglecting national advertising campaigns and on-pack promotions. On the other hand, if they are required to prepare a short-term detailed forecast in units at segment or subsegment level to be shared with their colleagues of the planning team, they will want to stay on the safe side of product availability and they will overestimate some promotions and customer-specific special packs in order to secure volumes (and funding), that once cashed up will result in an overforecast across the board, as their enthusiasm for promotional volumes will more than offset their pru-dence for volumes from other activities.
A robust S&OP process needs both these kinds of sales forecasts from the sales team and I will discuss later how to coordinate and recon-cile them. The key point is that the sales team’s input and responsibility are fundamental for the short-term, because only account managers can
THE SALES AND OPERATIONS PLANNING PROCESS 173
provide the customer intelligence—customer dynamics and customer activity plan for promotions, assortment, and merchandising—that is needed in S&OP.
The marketing team will provide the market intelligence—market dynamics and expected market share evolution based on advertising pres-sure, promotional pressure, and anticipated competitors’ activity. The marketing team’s input and responsibility are fundamental for the mid- and long-term, but marketers can also become good challengers of the sales team’s pessimistic short-term view. The marketing team’s sales forecast, regardless of the time horizon, will be biased on the optimistic side most of the times. However, it must be remarked that marketers that consolidate a good S&OP experience tend to become more realistic.
The planning team brings the supply side knowledge—capacity, lead times, time fences—to the S&OP process table. Sometimes planners propose to work out the sales forecast adding promotional volumes and new product introductions to the volume baseline that is precalculated by the planning system that they use2. In my working experience, I noticed that there are some difficulties with this approach, that apparently seems very logical, but that in reality can be very tricky and misleading. First of all, the baseline might contain unknown promotions, especially in markets that are very fragmented or dominated by traditional trade, or it might have been altered by a competitor’s shortage. Second, account managers are used to talking about total promotional volume or value and are not very familiar with the concept of promotional uplift—unless they directly interface with the customer’s supply chain—or with the amount of incremental volume generated by a promotion. In addition, as I have already noted above, they will overestimate some promotions and customer-specific special packs and displays in order to secure volumes. As a result, the sales forecast obtained adding promotional volumes to a baseline might very often represent the most optimistic outlook.
It should also be noted that the short-term sales forecasts of the plan-ning team and of the sales team are demanding and complicated in them-selves: working on many details is very difficult and adding small figures implies big mistakes, while adding big figures would imply smaller mistakes.
2This idea does not appear in the S&OP classic texts by Ling and Goddard (1988) and Wallace (1999).
174 A GUIDE TO SALES MANAGEMENT
The role of the trade marketing team in sales forecasting will depend on the company’s organization. When trade marketers are fully integrat-ed with the marketing team they might be responsible for the mid-term sales forecast, when they report to the sales director they are the chal-lengers of the account managers’ short-term forecast and of the market-ing team’s mid-term forecast.
The finance team will develop its own sales forecast to be compared with those of the other functions. They will normally utilize the value running rates resulting from sell in data and apply a pattern to forecast sales. As an example, they can decide to employ the following:
• The average of the last 52 weeks for A brands • The average of the last 26 weeks for B brands • The average of the last 13 weeks for C brands and new
product developments • The average of the last 4 weeks or ad hoc coefficients for
highly seasonal items.
The sales forecasting step of the S&OP process is concluded when all functions and departments involved—sales, marketing, planning, trade marketing, and finance—have prepared their forecasts and are ready to share, compare, and reconcile them into a consensus range forecast.
Sense checking the sales forecast
As we already mentioned before, the account managers of the sales team will have prepared two very different sales forecasts, one very optimistic to pass on to the planning team and one very pessimistic for their line managers. Both these forecasts need to be sense checked and the gap between them has to be minimized—the company will decide the max-imum percentage gap that it intends to accept and in doing so it will probably differentiate by product family and subfamily.
The sense check can be carried out comparing the sales forecasts of all the functions and departments and challenging their assumptions, which therefore must be clearly documented and visible.
THE SALES AND OPERATIONS PLANNING PROCESS 175
A company may also decide to build a cross-functional model to produce a forecast, challenge all the functional sales forecasts and carry out the sense check. As an example, this model can be based on the projection of sell in data for the short-term, on the use of growth coeffi-cients based on sell out data for the mid-term, and on expected market growth and market share ambition for the long-term.
The objective of this sense check is to agree a consensus range fore-cast of the company turnover at least at top level, that is, for a matrix representing all the product families and all the sales channels. There-fore, the sense check step of the S&OP process is concluded when a consensus range forecast is agreed and signed off by all the functional middle managers that are involved in the S&OP cycle.
Identifying gaps comparing the sales forecast to the annual
operations plan
The turnover matrix by product family and by sales channel produced by the sense check of the sales forecast must be compared with the com-pany business plan contained in the annual operations plan. There will be matches and mismatches even at top level, and the company’s middle managers will have to identify the areas of underperformance that call for corrective actions.
Planning gap filling activities
Once performance gaps have been singled out, there is a need to design solutions in the form of gap filling activities. This is typically a moment that can generate internal competition between brand managers and account managers in tackling product family or channel issues.
Trade marketing plays an important role in this step of the process, generating ideas, and coordinating inputs from both marketing and sales. The trade marketing director drives the selection and prioritization of alternatives to be further investigated in order to be presented to the board of directors.
Examples of gap filling activities include customer-specific promo-tions, bringing forward a new product launch, national promotions, and new special packs or displays.
176 A GUIDE TO SALES MANAGEMENT
Checking feasibility and financial viability of gap filling activities
There is no point in planning gap filling activities that cannot be sup-ported by manufacturing on time and in full or that are not financially appealing. Therefore, there are a number of checks that have to be per-formed before preparing a short list of gap filling activities, which can be submitted to the company’s board of directors in order to gain approval and to secure funding.
Gaining the company’s board of directors approval of the plan
The company’s functional directors convene in a formal S&OP meeting at least once a month. This engagement can also be an ad hoc section of the board meeting. The purpose is to review progress to date, to discuss the sales forecast, and to evaluate alternatives if there is a need to close a gap versus the annual operations plan. On this occasion, a synthesis of the previous steps of the S&OP process is presented to the company’s CEO together with a set of recommended corrective actions. The CEO will approve the proposal partially or in full and the outcome of the dis-cussion becomes the new plan and the new target for the following months and quarters.
Updating the planning system
The planning system is definitively updated on the basis of the decisions taken during the S&OP meeting. Before this final review, some compa-nies refresh data in the planning system as soon as they receive the short-term detailed forecast from the sales team and then again after the sense check of the sales forecast and the agreement of the consensus range forecast. Other companies prefer to wait and change data in the plan-ning system only after consensus has been reached.
Measuring process effectiveness
At the end of every S&OP cycle, performance is measured through a number of shared and easy to access metrics, not only those based on the comparison of actuals and sales forecasts.
THE SALES AND OPERATIONS PLANNING PROCESS 177
Identifying improvement areas
There is a critique of the process that is lead in the first place by the company’s board and that takes place at the end of every cross-functional meeting with the aim to identify improvements for the fol-lowing cycles.
The principles of S&OP
I suggest 12 principles to keep in mind for implementing and maintain-ing an effective S&OP process: 1. S&OP is an integrated cross-functional planning and decision making
process. The purpose of every S&OP cycle is to balance demand and supply and to come up with an update of the company business plan. S&OP is an integrated way of running the business and requires the participation of all functions. In a well structured S&OP pro-cess, everybody understands where and when decisions will be tak-en and there is a clear vertical and horizontal internal communica-tion. There is also a better management of conflicts, because deci-sions are made taking into account and balancing multiple views.
2. S&OP is led by the company’s CEO/general manager. The head of the business unit leads the S&OP process and takes on responsibility for its output with the full support of the leadership team. The company’s board requests on a regular basis an updated view of future plans and commits to the newly agreed business plan, which is promptly communicated to the organization. A board member is appointed S&OP sponsor and is accountable for driving the process and its quality improvement with the help of a dedicated cross-functional team. S&OP is integrated with any other existing decision making process in order to avoid any dupli-cation of tasks and meetings. The whole leadership team sets an example prioritizing time and resources to be dedicated to the S&OP process.
178 A GUIDE TO SALES MANAGEMENT
3. Sales and marketing own the sales forecast. The sales forecast is owned by sales and marketing, because they only can provide the customer and the market intelligence that is needed to update the demand plan. The other functions such as planning, manufacturing, engineering, and finance support or chal-lenge the sales forecast.
4. Sales forecast is unconstrained. The sales forecast in principle is unconstrained by capacity or mate-rial procurement limitations. Sales and marketing will prepare their forecast in a business as usual mode. This does not mean that there are no time fences in place for changing rates of output, but simply that foreseen risks, potential shortages, or manufacturing issues should not influence the sales forecast.
5. The forecast is not the target. One of the key benefits of the S&OP process is to give visibility to the gaps between the sales forecast and the company’s strategic tar-get represented by the annual operations plan. If gaps are not visi-ble, opportunities cannot be identified and corrective actions can-not be planned. In an effective S&OP process, people understand that their forecast by category and by period can hardly coincide with their target. They are encouraged by their line managers to highlight gaps and feel empowered to propose alternatives to fill them. The company has also in place a structured process to assess potential gap closing solutions and to select the business cases to be submitted for approval either to middle management or to the company’s board. The risk of confusing forecast and target, or I should say the conscious decision to confirm the achievement of a target notwithstanding the change of market conditions is more common in marketing teams than in sales teams. The reason for this is that marketers lead the mid- and long-term forecast and can be tempted to leave things as they are and wait until the next S&OP cycle. This behavior basically amounts to hiding a problem under the carpet and postponing the search for a solution. On the contrary, good S&OP marketers are those that we do not very of-ten hear say that they confirm the plan.
THE SALES AND OPERATIONS PLANNING PROCESS 179
6. Assumptions are documented and reviewed. It is more reasonable to challenge the assumptions rather than the numbers of a plan. As a number of plans are shared and compared during the S&OP process, it is highly recommended to document very clearly all the assumptions—for the sales plan, the manufac-turing plan, the finance plan, etc.—so that they can be periodically reviewed. This suggestion is even more important for the hypothe-ses of the new business plan that is agreed at the end of every S&OP cycle. A well run and integrated S&OP process results in aligned assumptions.
7. The outcome of the S&OP process is a range forecast. At the end of every S&OP cycle the company agrees a range forecast that is then used as a basis to generate the new business plan and targets. All the opportunities and risks of this plan will be recorded together with its assumptions for future reference and for compari-son with actual results to support learning and accountability.
8. S&OP is not about firefighting. In a good S&OP process the current month is a done deal and less time is spent discussing the next month than considering other months and quarters in the future. Focus is balanced across the short-, mid-, and long-term in order to tackle and resolve issues with an appropriate lead time. Middle management takes care of the short- and mid-term and deals with exceptions through an agreed process, while the board level of the organization focuses more on a longer horizon. The company avoids trade loading at month end, giving last minute discounts and creating a sales pat-tern that is repeated over and over each month.
9. S&OP prerequisites are in place. All the S&OP prerequisites—see below—are cross-functionally agreed in alignment meetings and everybody has the same under-standing of the process. Responsibilities are clear, product families, unit of measure, and planning horizon have been univocally de-fined and time is committed to the tasks and meetings required by the process.
180 A GUIDE TO SALES MANAGEMENT
10. S&OP is a disciplined process. An effective S&OP process requires the right type of mindset and behaviors. A teamwork mindset is encouraged by the leadership team and people feel trusted and empowered to take decisions and submit proposals to the board. On the other hand, leaders expect discipline and transparency. Meetings are held on time and attended by the right people—if necessary they delegate up and not down the organizational ladder. Meeting agenda and information packs are circulated in advance and reviewed by attendees prior to the meet-ings. Minutes are taken and promptly circulated and actions coming out of the meetings are clear. S&OP is in the workplans of all key participants with shared metrics and targets.
11. S&OP process metrics are in place. A set of cross-functionally agreed key performance indicators is in place to monitor the S&OP process performance. They are re-viewed as an integral part of the process itself and actions are taken on any issue with clear owners and a follow-up process.
12. S&OP is a continuous improvement process. S&OP is a live process and is supported by continuous improve-ment. Mindset, responsibilities, discipline, documentation, and overall quality of the process need to be periodically assessed and necessary changes agreed and actioned.
When I was working at Unilever the company had 8 broad S&OP
principles, other FMCG companies have 9 or more, depending on the level of detail that they choose for their internal communication. Never-theless, these sets of principles are all substantially similar and the plan-ning horizon is the only remarkable difference between them.
The prerequisites of S&OP
We have already mentioned that there are some prerequisites that are necessary to implement and maintain an effective S&OP process. They have to be cross-functionally brainstormed and agreed. It is now time to analyze them in detail:
THE SALES AND OPERATIONS PLANNING PROCESS 181
• Understanding of the S&OP process. All the stakeholders must have a clear understanding of the S&OP process, of what it is and how it works, of its princi-ples and benefits. S&OP must be formally established with a company S&OP policy released and signed by the board of directors and describing the purpose of the process and its schedules, participants, product families, time horizon, time fences, and review. Embedding S&OP in the organization requires a change management, educational and training effort. People will also learn a lot by doing, and therefore, it is recommended to kick-start S&OP piloting a couple of product families with very different characteristics before going at full blast.
• Assigned responsibilities. All managers, middle managers, and directors must know exactly what is expected of them and of their colleagues in terms of tasks, meeting preparation, attendance and follow-up during the S&OP cycle. Some companies benefit from developing a S&OP checklist3 describing the desired features and behaviors of the process and assigning responsibilities. In order to drive the implementation of S&OP, one of the directors will be appointed executive sponsor and support the S&OP project manager and the core implementation team. This team will include the middle managers that will be involved in all the steps of the S&OP process. They will set up S&OP demand planning and S&OP supply planning subteams, organize the meetings that support the S&OP cycle, prepare the S&OP policy, the education and training program, and the S&OP checklist to be approved by the board of directors. Once S&OP has been started and has become an established process rather than a new project, this team will take care of its review, maintenance, and improve-ments.
3Examples of S&OP checklists can be found in Ling and Goddard (1988) and Wallace (1999).
182 A GUIDE TO SALES MANAGEMENT
• Time commitment. People commit their time to S&OP and prioritize S&OP-related work for themselves and their direct reports. They recognize S&OP as the key dynamic performance manage-ment process of their company and understand the importance of meeting all the process deadlines. They acknowledge that the minimum frequency of the S&OP cycle is monthly.
• Product families and unit of measure. Product families for top-line sales forecasting that make sense for all the company functions must be agreed upfront. This can be a long and painful discussion, but it is essential to identify families that at the same time make sense in the customer facing dimension and allow the planning team to perform a rough cut capacity planning4. In an efficient S&OP process, you also want to avoid wasting time translat-ing data from one unit of measure to another, and therefore, you need to agree a common cross-functional unit of meas-ure for your business, be it units (our recommendation), cases, kilograms, liters, etc.
• Planning horizon. The planning horizon must allow a short-, a mid-, and a long-term view. The minimum recommended extent is a 12 month rolling horizon, but many companies work either with a six or an eight quarter rolling stretch and thus link S&OP to long-term financial and brand planning.
• Time fences. The rates of output of any supply plan can virtually be increased in any moment in time, but unfortunately not always economically, as capacity and materials might not be
4Rough cut capacity planning (RCCP) is a planning technique used by manufactur-ers to determine if sufficient capacity exists over broad time frames such as a month or a quarter. It compares demand requirements to the available capacity, taking into account machinery, labor, storage and suppliers capacity, and focusing on critical bottlenecks.
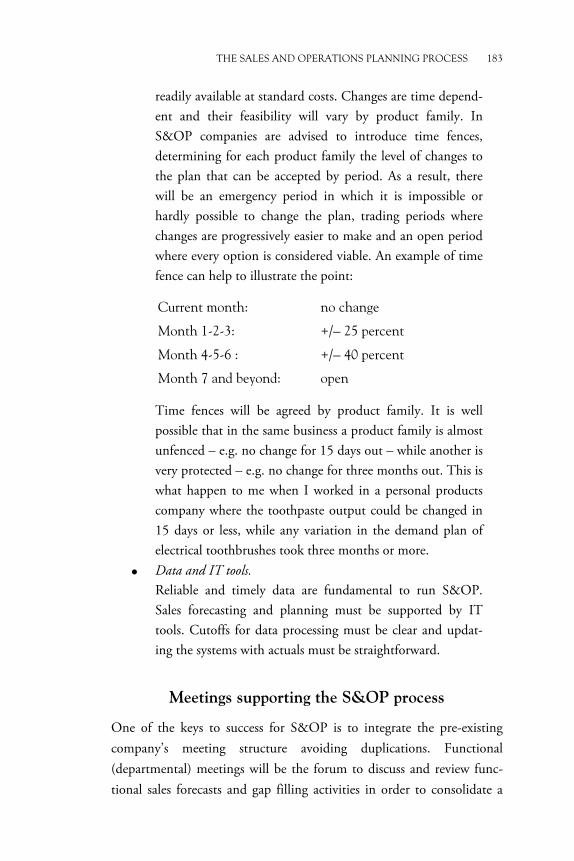
THE SALES AND OPERATIONS PLANNING PROCESS 183
readily available at standard costs. Changes are time depend-ent and their feasibility will vary by product family. In S&OP companies are advised to introduce time fences, determining for each product family the level of changes to the plan that can be accepted by period. As a result, there will be an emergency period in which it is impossible or hardly possible to change the plan, trading periods where changes are progressively easier to make and an open period where every option is considered viable. An example of time fence can help to illustrate the point:
Current month: no change
Month 1-2-3: +/− 25 percent
Month 4-5-6 : +/− 40 percent
Month 7 and beyond: open
Time fences will be agreed by product family. It is well possible that in the same business a product family is almost unfenced – e.g. no change for 15 days out – while another is very protected – e.g. no change for three months out. This is what happen to me when I worked in a personal products company where the toothpaste output could be changed in 15 days or less, while any variation in the demand plan of electrical toothbrushes took three months or more.
• Data and IT tools. Reliable and timely data are fundamental to run S&OP. Sales forecasting and planning must be supported by IT tools. Cutoffs for data processing must be clear and updat-ing the systems with actuals must be straightforward.
Meetings supporting the S&OP process
One of the keys to success for S&OP is to integrate the pre-existing company’s meeting structure avoiding duplications. Functional (departmental) meetings will be the forum to discuss and review func-tional sales forecasts and gap filling activities in order to consolidate a
184 A GUIDE TO SALES MANAGEMENT
functional view, but the nature of the S&OP process implies a number of cross-functional meetings. I recommend to support the S&OP pro-cess with the following sessions:
• Sales planning meeting
• Consensus meeting
• Activity planning meeting
• Executive S&OP meeting.
The first three of these meetings happen sequentially at middle management level and are preliminary to the executive S&OP meeting.
In the sales planning meeting, the sales forecast that the sales team (account managers) have loaded in the sales forecasting system is re-viewed and challenged. The purpose of this meeting is to work out a proposal for the upper limit of the range forecast, which will be present-ed to the company’s board. Attendees will include account managers, planners, category managers, and finance managers. The trade market-ing director and the planning director are the cochairmen of the meeting. The review will be carried out by product family to minimize the time that most people will spend attending the meeting.
In the consensus meeting, the sales forecast is further challenged and sense checked with the objective to agree a proposal for the lower limit of the range forecast and to highlight the gaps versus the annual opera-tions plan, which will be presented to the company’s board. Attendees will include channel directors, trade marketing director, marketing directors, planning director, and senior finance managers. The head of sales and the head of marketing are the cochairmen of the meeting. At the end of the session, a consensus range forecast will be agreed at top level for a matrix representing all the product families and all the sales channels. The team will also prioritize the product families and the channels that require gap filling activities. The consensus meeting is hold back to back to the sales planning meeting.
In the activity planning meeting brand managers, category managers, and account managers present alternative gap filling options that they
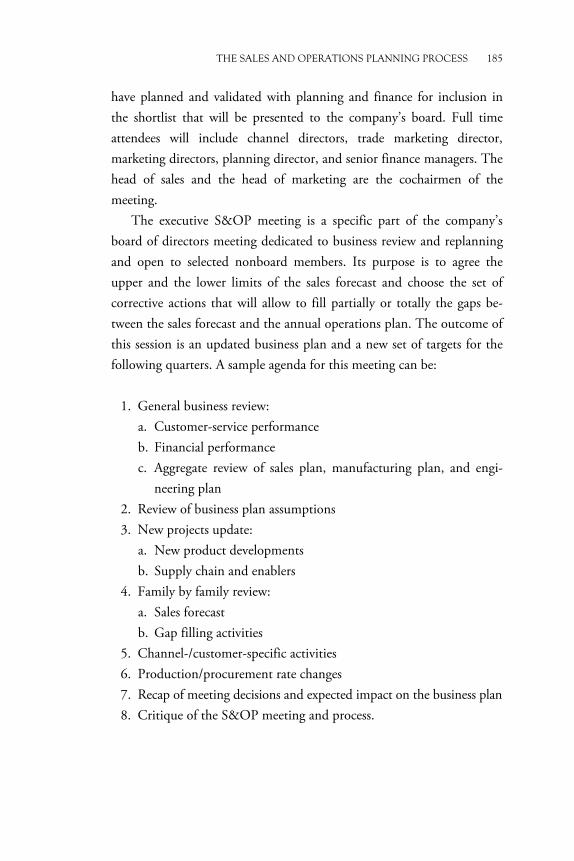
THE SALES AND OPERATIONS PLANNING PROCESS 185
have planned and validated with planning and finance for inclusion in the shortlist that will be presented to the company’s board. Full time attendees will include channel directors, trade marketing director, marketing directors, planning director, and senior finance managers. The head of sales and the head of marketing are the cochairmen of the meeting.
The executive S&OP meeting is a specific part of the company’s board of directors meeting dedicated to business review and replanning and open to selected nonboard members. Its purpose is to agree the upper and the lower limits of the sales forecast and choose the set of corrective actions that will allow to fill partially or totally the gaps be-tween the sales forecast and the annual operations plan. The outcome of this session is an updated business plan and a new set of targets for the following quarters. A sample agenda for this meeting can be:
1. General business review:
a. Customer-service performance b. Financial performance c. Aggregate review of sales plan, manufacturing plan, and engi-
neering plan 2. Review of business plan assumptions 3. New projects update:
a. New product developments b. Supply chain and enablers
4. Family by family review: a. Sales forecast b. Gap filling activities
5. Channel-/customer-specific activities 6. Production/procurement rate changes 7. Recap of meeting decisions and expected impact on the business plan 8. Critique of the S&OP meeting and process.
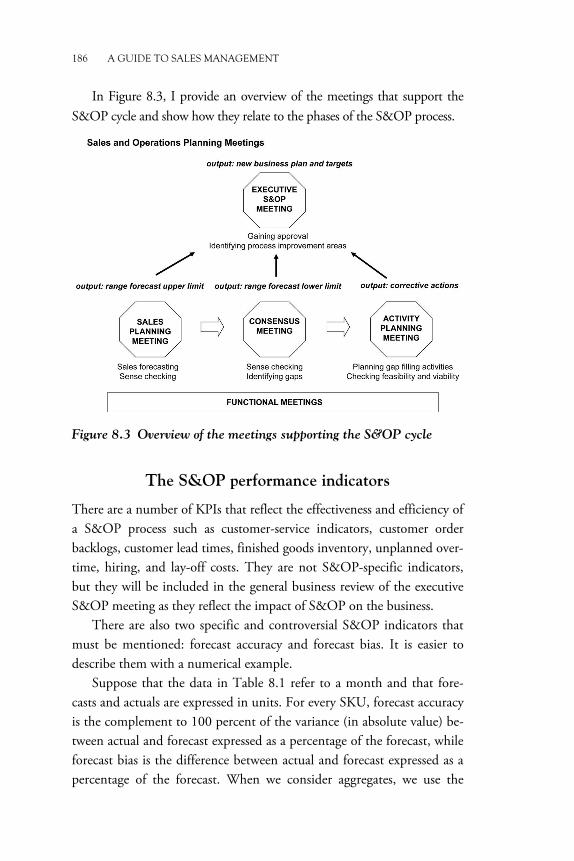
186 A GUIDE TO SALES MANAGEMENT
In Figure 8.3, I provide an overview of the meetings that support the S&OP cycle and show how they relate to the phases of the S&OP process.
Figure 8.3 Overview of the meetings supporting the S&OP cycle
The S&OP performance indicators
There are a number of KPIs that reflect the effectiveness and efficiency of a S&OP process such as customer-service indicators, customer order backlogs, customer lead times, finished goods inventory, unplanned over-time, hiring, and lay-off costs. They are not S&OP-specific indicators, but they will be included in the general business review of the executive S&OP meeting as they reflect the impact of S&OP on the business.
There are also two specific and controversial S&OP indicators that must be mentioned: forecast accuracy and forecast bias. It is easier to describe them with a numerical example.
Suppose that the data in Table 8.1 refer to a month and that fore-casts and actuals are expressed in units. For every SKU, forecast accuracy is the complement to 100 percent of the variance (in absolute value) be-tween actual and forecast expressed as a percentage of the forecast, while forecast bias is the difference between actual and forecast expressed as a percentage of the forecast. When we consider aggregates, we use the
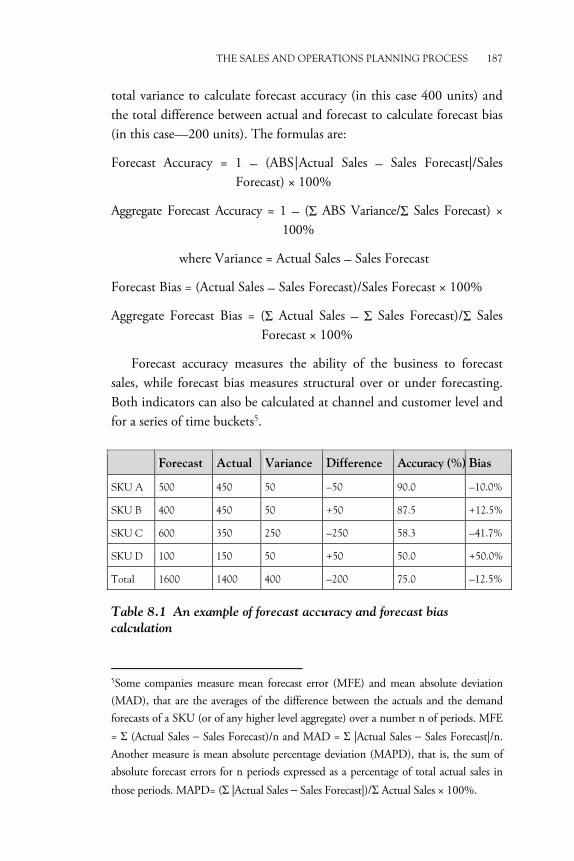
THE SALES AND OPERATIONS PLANNING PROCESS 187
total variance to calculate forecast accuracy (in this case 400 units) and the total difference between actual and forecast to calculate forecast bias (in this case—200 units). The formulas are:
Forecast Accuracy = 1 − (ABS | Actual Sales − Sales Forecast|/Sales Forecast) × 100%
Aggregate Forecast Accuracy = 1 − (� ABS Variance/� Sales Forecast) × 100%
where Variance = Actual Sales − Sales Forecast
Forecast Bias = (Actual Sales − Sales Forecast)/Sales Forecast × 100%
Aggregate Forecast Bias = (� Actual Sales − � Sales Forecast)/� Sales Forecast × 100%
Forecast accuracy measures the ability of the business to forecast sales, while forecast bias measures structural over or under forecasting. Both indicators can also be calculated at channel and customer level and for a series of time buckets5.
Forecast Actual Variance Difference Accuracy (%) Bias
SKU A 500 450 50 −50 90.0 −10.0%
SKU B 400 450 50 +50 87.5 +12.5%
SKU C 600 350 250 −250 58.3 −41.7%
SKU D 100 150 50 +50 50.0 +50.0%
Total 1600 1400 400 −200 75.0 −12.5%
Table 8.1 An example of forecast accuracy and forecast bias
calculation
5Some companies measure mean forecast error (MFE) and mean absolute deviation (MAD), that are the averages of the difference between the actuals and the demand forecasts of a SKU (or of any higher level aggregate) over a number n of periods. MFE = � (Actual Sales − Sales Forecast)/n and MAD = � |Actual Sales − Sales Forecast|/n. Another measure is mean absolute percentage deviation (MAPD), that is, the sum of absolute forecast errors for n periods expressed as a percentage of total actual sales in those periods. MAPD= (� |Actual Sales − Sales Forecast|)/� Actual Sales × 100%.
188 A GUIDE TO SALES MANAGEMENT
In his classic book, Wallace (1999) is very peremptory in pushing back the concept of forecast accuracy. He maintains that forecast accuracy is a “turnoff for the folks in Sales who will be called upon to do the forecasting” and that “talking about accuracy clouds and emotionally charges the issue.” He believes that forecasting is a process that should have the right outputs: forecasts that are reasoned, realistic, frequently reviewed, and that represent the total demand. He promotes good forecasts in which forecasters are working the process and doing the best job they can, but definitely does not like to talk about accurate forecasts. As a sales person, I can understand this point of view and I maintain that stressing and emphasizing the importance of forecast accuracy is a not a good idea when implementing S&OP for the first time. However, as the process is more and more embedded in the busi-ness, there is a clear benefit in measuring forecast accuracy and assigning improvement or maintenance targets by product family and by chan-nel/customer to be included in the workplan of brand managers, category managers, and account managers. This is also a way to signal to the whole marketing and sales organization how critical a good S&OP process is for the company.
On the other hand, I am far less enthusiastic of assigning targets re-lated to forecast bias. I do not like that kind of negative forecast bias (overforecast) reduction mania that is solely the reflection of supply chain and finance functional objectives and that can be very hardly bought in by marketing and sales. S&OP should support the achieve-ment of the company business plan and balance customer-service im-provement and stock reduction as its main benefits. Insisting too much on compressing the overforecast can be very dangerous and lead to un-pleasant situations. Unfortunately, I have seen it happen too often in too many companies.
Finally, beware of the risks implied by applying forecast accuracy measurement—let alone forecast bias—only to the short-term detailed forecast in units prepared by the sales team before the sales planning meeting, and not also to the consensus forecast and to the final range forecast agreed in the executive S&OP meeting.
THE SALES AND OPERATIONS PLANNING PROCESS 189
IT tools for S&OP
S&OP is about dynamic performance management and replanning. Therefore, most of the IT tools supporting the phases of this process are essentially those needed for business planning: tools providing business and competitive intelligence, a tool to cash up volumes, a tool to set in-dividual targets, a tool to allocate and manage budgets, a tool to evaluate promotions, and a profitability simulator.
The sales team needs a sales forecasting system to record for every month of the planning horizon its sales forecast in volume or in units. On one hand, they need to be able to input their data by product family, subfamily, or even down to SKU level; on the other hand, they must be able to upload their forecast by sales channel or by key customer. The sales forecasting system must allow a quick cash up of the sales fore-cast and must be accessible not only to account managers, but also to cat-egory managers, brand managers, finance managers, and planners in preparation of the sales planning meeting where the sales forecast is re-viewed and challenged.
The planning team needs a demand planning tool integrated in the company’s enterprise resource planning (ERP) system and with a set of functionalities around demand management, statistical forecasting, promotion management, and life-cycle planning. Many companies utilize the System Applications and Products in Data Processing (SAP) advanced planning and optimization (APO) tool and consider APO an integral part of their S&OP process.
The sales forecasting system must be interfaced with the demand planning and financial accounting modules of the ERP system to opti-mize the S&OP process.
Takeaway Points
• Sales and operations planning (S&OP) is a business process in which the company operating plan is updated on a regular basis. It helps a company keep demand and supply in balance and achieve its business targets.
190 A GUIDE TO SALES MANAGEMENT
• The key steps of an effective S&OP process are: (1) updating the sales forecasting system, (2) sales forecasting, (3) sense checking the sales forecast, (4) identifying gaps comparing the sales forecast to the annual operations plan, (5) planning gap filling activities, (6) checking feasibility and financial viability of gap filling activities, (7) gaining the company’s board of direc-tors approval of the plan, (8) updating the planning system, (9) measuring process effectiveness, and (10) identifying im-provement areas.
• An effective S&OP process can be implemented and maintained through adherence to 12 key principles.
• The prerequisites of S&OP are: (1) understanding of the S&OP process, (2) assigned responsibilities, (3) time commitment, (4) product families and unit of measure, (5) planning horizon, (6) time fences, and (7) data and IT tools.
• The cross-functional meetings supporting the S&OP process are: (1) sales planning meeting—to agree the upper limit of the range forecast, (2) consensus meeting—to agree the lower limit of the range forecast, (3) activity planning meeting—to identify corrective actions, and (4) executive S&OP meeting—to approve the new business plan and targets.
• The S&OP performance indicators are forecast accuracy and forecast bias. Other non-S&OP-specific indicators such as customer-service indicators, customer order backlogs, customer lead times, finished goods inventory, unplanned overtime, etc., reflect the effectiveness and efficiency of a S&OP process.
• The sales team needs a sales forecasting tool and the planning team needs a demand planning tool. The other IT tools supporting S&OP are the same that are needed also for business planning.
CHAPTER 9
The Challenges of Sales Management
Changes will happen
We have done an excellent job: we have designed our sales strategy, opti-mized our route to market, selected our sales KPIs, put in place an effec-tive sales organization, and implemented the fundamental processes for sales management. Our company is doing well and our business is grow-ing ahead of the market. Everything seems under control, and then all of a sudden, a change of circumstances with very serious implications for our business happens. Sooner or later we will have to react and adapt: changes are inevitable, they can be denied for a while, but not for too long.
Our company may decide to merge two or more divisions or to ac-quire a new business. Whatever the strategic fit of the product and service portfolios, there will be cultural differences reflected in the organizations and procedures of the two entities that will be brought together.
Some of our customers may dramatically change the way they oper-ate in the market or decide to buy other customers or some of their stores. They may also become more dependent on their international headquarters or join an international buying group. All these transfor-mations will have an impact and imply some changes for our operations, if not for our sales strategy.
Mergers and acquisitions
Business consolidation and changes of ownership are becoming the norm in our frantic world. Since the fall of the Berlin wall and the collapse of communist regimes in Central and Eastern Europe the accel-eration of change has been dramatic. Private equity firms have been able to collect and deploy capital in many different directions, buying,
192 A GUIDE TO SALES MANAGEMENT
streamlining, and then reselling an increasing number of businesses. Before the 2008 credit crunch, the speed of change was absolutely impressive. Nowadays, as the world economy is recovering, private equi-ty firms are picking up speed again in their continuous process of raising and investing funds.
In this kind of economic environment even large public companies are increasingly under pressure from their stakeholders and must continuously improve their profitability. They often endeavor to do so restructuring their concerns, combining their divisions, selling noncore ranges of products and services, and buying competing or complemen-tary businesses. As a result, it is hard today to find a manager with at least ten years of business experience that has not been involved to some degree in one kind or another of merger or acquisition.
As a long stayer at Unilever, I have experienced the acquisition of Chesebrough Ponds (Pond’s, Vaseline, Cutex, and Domestos) in 1987, of Calvin Klein Cosmetics and Fabergé in 1989, of Bestfoods (Knorr, Helmann’s, and Maizena), a division of the Corn Products Company (now Ingredion Incorporated) in 2000, the disposal of a long list of local and secondary brands with the aim to move from 1600 to 400 brands worldwide, the sale of the European frozen food business (Bird’s Eye and Iglo) to private equity group Permira in 2006 and of the olive oil business to Deoleo in 2008, as well as the acquisition of a number of important ice cream businesses (Breyers, Ben & Jerry, Inmarko, and Napoca) and of the personal care and European laundry business of Sara Lee Corporation in 2009.1
During the same period Procter & Gamble carried out two spectacu-lar acquisitions, buying Vick Chemical Company (Richardson-Vick’s
1In 1984, Unilever acquired Brooke Bond (PG Tips tea) in its first successful hostile takeover. In 1989, it also bought Elizabeth Arden to then sell it to FFI Fragrances in 2000. In 1996, it purchased Helene Curtis (Suave, Finesse, and Degree) to expand its presence in the United States personal care market. In 1997, it sold its speciality chemicals business (National Starch & Chemical, Quest, Unichema, and Crosfield) to ICI. Recently, Unilever is focusing its acquisitions in the ice cream (EVGA and Ingman) and personal care business (Alberto Culver) and it is disposing many of its noncore food brands.
THE CHALLENGES OF SALES MANAGEMENT 193
VapoRub, Oil of Olay, Clearasil, Pantene, and Vidal Sassoon) in 1985—significantly after a failed Unilever attempt—and Gillette (Gillette, Dura-cell, Braun, and Oral-B) in 2005.2 However, it did not manage to buy Beiersdorf (Nivea and Eucerin) as in 2003 a German public–private alli-ance orchestrated by the city of Hamburg and involving the Herz family ensured the retention of local ownership.
Nestlé acquired Carnation (Carnation Evaporated Milk, Coffee-Mate, and Friskies) in 1985, Rowntree Mackintosh confectionery (Kit Kat, Smarties, and Aero) in 1988, San Pellegrino waters in 1997, Spillers pet foods in 1998, and Ralston Purina and Chef America (Hot Pockets) in 2002. In the same year, Nestlé also started the acquisition of Dreyer’s (Edy’s) ice cream, which it concluded in 2006, when it took full owner-ship of the American company. Nestlé came close to purchasing Hershey’s confectionery business, but it did not close the deal. In 2007, it acquired the medical nutrition division of Novartis Pharmaceutical—including the milk-flavoring brand Ovomaltine—and Gerber baby-food.
Kraft Foods is one of the most fascinating case studies in the history of mergers and acquisitions. It was established as the end product of a very early example of roll-up strategy in the dairy industry. At the end of 1988, it was purchased by Philip Morris Companies and then merged with Philip Morris's General Foods unit into Kraft General Foods. In 1990, this new entity acquired Jacobs Suchard; in 1993, it bought R.J. Reynolds Nabisco's cold cereal business and sold its Breyers ice
2In 1982, Procter & Gamble acquired Norwich Eaton Pharmaceuticals (Pepto-Bismol). It consolidated its personal care business with a string of acquisitions, pur-chasing the Blendax range in 1987, the Noxell business (Noxzema) in 1989, Shulton’s Old Spice fragrances in 1990, the Max Factor and Ellen Betrix cosmetics and fragrances businesses in 1991, the German tissue and towel company VP Schickedanz and the fine fragrances business Giorgio Beverly Hills in 1994, the North American Baby Fresh wipes business in 1996, the female hygiene Tambrands (Tampax) in 1997, the Clairol hair-care business in 2001, and a controlling interest in Wella AG in 2003. In 1999 it acquired Iams from the Mathile family. In 2008 it sold Noxema to Alberto Culver. In 2009 it purchased Ambi Pur from Sara Lee. It exited the food business in 2012, when it sold its Pringles snack food business to Kellogg’s. In 2014 it has announced a plan to concentrate on its top 80 brands, dis-posing another 100.
194 A GUIDE TO SALES MANAGEMENT
cream division to Unilever. In 2000, it was merged by Philip Morris with Nabisco Holdings. In 2007, it became again a fully independent company, following its spin-off from Philip Morris and it purchased Groupe Danone's biscuit and cereal division. In 2010, it sold its North American frozen pizza business to Nestlé and it started a billionaire takeover of British confectionery group Cadbury. In 2012, it announced its split into two new companies, a North American grocery business called Kraft Foods Group and an international snack and confectionery business named Mondelēz International.3 In 2015, Heinz announced its merge with Kraft Foods Group into a new company to be named Kraft Heinz Company.
If we continued this analysis looking also outside of grocery and FMCG’s world, we would still find many examples of mergers and acquisitions in manufacturing. This is also true for the retail industry. An analysis of the evolution of the retail business— giants like Walmart, Carrefour, and Tesco are an example—shows that at home they grew more through acquisitions than organically, while abroad they devel-oped their presence through acquisitions, joint ventures, and franchising agreements. The implications for sales management of customer consol-idation and internationalization are discussed later on.
An experience of merger
Manufacturers change their structure not only through acquisitions, but also rearranging their existing divisions. At the end of the 1990s, Unile-ver decided to merge its home care (Lever) and personal care (Elida Gibbs) divisions into a single business unit in every market. In the first decade of this century, it first decided to group all of its divisions (foods, ice cream, and home and personal care) by country and then to merge its country-based operations in large subregional clusters. These kinds of changes imply a real transformation for a company and have a very deep impact on its culture.
3In 1990 Kraft Foods also acquired Freia Marabou in Scandinavia. In 1993 to 1994, it sold its frozen food business to Dean Foods (American Birds Eye brand) and H.J. Heinz (frozen dinners). In 1995, it disposed of its bakery, candy and table spread businesses as well as of its foodservice unit.
THE CHALLENGES OF SALES MANAGEMENT 195
I have experienced as a middle manager the creation of the Unilever home and personal care division in Italy and I will use it a case study to show the challenges of a merger. The home care business was larger in turnover size by 25%, but it was growing less rapidly and it was much less profitable than the personal care business. The home care division was leader in two categories, coleader in one category, and a big time loser in another one, while the personal care division was leader in two categories and coleader in the others. As a general trend, home care was struggling to maintain its overall market position, while personal care was gaining market shares. The two companies had the same customer base and were facing the same category buying director in large custom-ers and the same category buyer in medium- and small-size customers. On paper, it was a merger of equals, but the two units had a very differ-ent history, culture, and way of working.
Decision making processes, business planning, and sales and opera-tions planning were very different. In particular, the company innovation plan was always left open and free floating in home care, while in person-al care, it was usually locked early and new product launches always took place in two main slots—one in the first quarter of the year and another one in September. Leadership and management styles were also quite opposite—in one case being very centralized and bureaucratic and in the other being based on delegation and empowerment. In sales differences beat by and large similarities and could be easily found everywhere: in general conditions of sale, payment terms, logistic terms, minimum order size, order composition rules, delivery lead times, list price increase man-agement, promotional approach and policy, merchandising and rack jobbing, sales cycles, sales force incentives, and rewards. Among the very few commonalities, I can remember the category management approach and the lack of proper in-store execution teams.
The mantra of the new company’s board of directors was to go for the “best of both” parent companies in terms of market approach and procedures, but in most cases, it was always very difficult to choose the best practice. Both parties were convinced that their way of working was the right one and could not understand why their counterpart could not see what the right common solution should have been. Every choice that
196 A GUIDE TO SALES MANAGEMENT
was reflecting the practice of one side of the business met with resistance from the other side. People were ready to concede that the two businesses were very similar, but they always did it solely from their point of view, with little or no effort to put themselves in the shoes of their former cousins that were now supposed to become their brothers. The formal integration process of the two companies lasted four years with the fol-lowing milestones: Year 1 (1999): 1. Appointment of a joint HR VP that built a combined HR department 2. Appointment of a joint Commercial VP in charge of Finance, Supply
Chain, and IT and creation of combined Finance and IT departments 3. Appointment of a new joint CEO, formerly in charge of one of the
two division 4. Design of a new distribution strategy (capability for joint deliveries) 5. Creation of a joint media and market research team. Year 2 (2000): 6. Appointment of a joint Sales VP 7. Creation of a joint sales operations department 8. Creation of a joint trade marketing department 9. Appointment of two sales managers with both divisional and chan-
nel responsibilities 10. Design of a new sales strategy (go to market as one company). Year 3 (2001): 11. Negotiation of first round of home and personal care contracts
with customers 12. Unification of warehousing and distribution departments and
combination of national warehouses in the same locations 13. Upgrade of the ERP system to enable joint invoices 14. Launch of joint order taking and joint deliveries for national
accounts.
THE CHALLENGES OF SALES MANAGEMENT 197
Year 4 (2002): 15. Unification of field account teams 16. Change of Sales VP and appointment of channel directors 17. Unification of trade marketing and sales operations in one department 18. Appointment of a joint Marketing VP 19. Creation of a joint planning department 20. Reorganization of customer-service assistants into customer-care
teams 21. Appointment of a new CEO, formerly chairman of another Unile-
ver company.
All the joint teams started with a setup reflecting the home care–personal care business split to become progressively more and more integrated. The integration of sales strictly speaking took only two years from January 2000 to January 2002. A number of noncore brands were disposed along the way and the responsibility of the Italian factories was transferred to Unilever European category organizations. The whole process implied a gradual 50 percent personnel reduction at top and middle management level and redundancies around 40 percent for the rest of management, for staff employees and for sales reps.
You might ask me now why there was a need to appoint a new chairman at the end of the process, when the former had done such a great job at merging the two companies into one without compromising turnover and profitability growth. I am convinced that the main reason for the change was that there was a new and better company, but at the same time, there was still a need to transform two different cultures and their subcultures into a new culture.
At the end of the process, the home care approach had become dom-inant both in finance and logistics, while marketing had adopted the personal care way of working. In both cases, there were not many regrets from people originally coming from “the other side.” On the contrary, sales had not found a balance yet. The personal care approach was seen as a ruling culture as the majority of seats in the sales direction team were occupied by former personal care people, but the overall number of for-mer home care employees was very high in all the ranks of the sales team
198 A GUIDE TO SALES MANAGEMENT
and they did not buy into the new approach and somehow resented—rightly or not—the dominance of “the other side.” As a result, the deci-sion making process was very often slowed down, because middle man-agers had very different views on the activities to be put in place to deliv-er the strategic actions included in the sales strategy. Meetings very frequently overrun and went off-topic, there was lack of commitment to the decisions that had been taken and many discussions were reopened again and again. It was clear that the “best of both” approach, which had been fully applied only in the sales function, had not completely helped to shape a truly integrated new sales team with a new culture. This nega-tive situation generated uncertainty and also reverberated on the market-ing and sales relationship, resulting in a level of conflict between the two functions that was way above normal.
The upcoming chairman had previous experience of both home and personal care businesses, but could neither be seen as a home care or a personal care person—no original sin!—and therefore had a good chance to be accepted as a credible leader and an impartial arbitrator. He arrived at the end of the merger and he was in a good place to lead a cultural change: as Kotter (1996) remarks in a merger “cultural change comes last, not first.” He did so progressively challenging vice-presidents, directors and managers to performance excellence, driving the integration of strategic business planning, revitalizing sales and oper-ations planning, launching a world class field merchandising service, changing the company’s organization, disposing a historic brand, and launching the first new brand after years of range extensions.
Two theories on leading cultural change
The Unilever home and personal care case shows that merging the oper-ations of two companies into one does not imply creating a new corpo-rate culture. I will take some time now to define what corporate culture is and how it can be changed.
Edgar Schein (1999) noted that corporate culture is more than “the way we do things around here,” as employees would typically put it, it is also the set of “learned, shared, tacit assumptions” on which people base
THE CHALLENGES OF SALES MANAGEMENT 199
their daily behaviors.4 There is a tip of the iceberg that everybody can see, but there is also a hidden underwater portion that constitutes the essence of the company’s culture and is hard to grasp even for the com-pany’s employees5. Shared and tacit assumptions are learned over time in different internal and external environments and become a sort of residual by-product of the company’s success. They are deeply embed-ded, taken for granted, and so well integrated in the office dynamic that most employees are unconscious of them. They influence all aspects of the functioning of a business and trouble may arise when the values expressed and declared by the leadership team are not aligned with them. The knowledge of the nature and cause of these shared and tacit assumptions is vital to change a company's culture.
Edgar Schein developed Kurt Lewin’s idea of three stages of change (unfreeze—change—refreeze) into a comprehensive and detailed model that he called “cognitive redefinition.” The key assumption of this model of change is that prior learning has to be rejected and removed before it can be replaced by new concepts. In the first stage of the process change leaders need to unfreeze the situation and create the motivation to change, winning resistances. They will achieve their objective in three steps:
1. They will remove certainties, showing that old ways of working are
not effective anymore. This is the so-called disconfirmation of pre-vious beliefs and assumptions that drive the human behavior. There are many potential sources of this disconfirmation: personal dissatisfaction for not meeting personal goals, fear of losing market share, profits, power, competitive advantage or legal compliance, accidents and scandals, a merger, an acquisition, a new charismatic leader, and training and education on new themes such as corpo-rate social responsibility.
4Schein (1985) also defined culture as the “learned solution to making sense of the world, to stabilizing it, and to avoiding the anxiety that comes with social chaos.” 5The visible part of the iceberg includes two distinct levels: artifacts and espoused values. Artifacts are tangible or identifiable elements such as office layout, furniture, dress code, jergon, etc. Espoused values are public statements of the company’s core values, mission, vision and strategy. Inconsistencies between artifacts and espoused values are more a rule than an exception.
200 A GUIDE TO SALES MANAGEMENT
2. They will manage the resulting uneasiness and distress that they have generated. When previous beliefs are seen as invalid as a con-sequence of disconfirmation, survival anxiety and sense of guilt emerge and they need to be addressed.
3. They will create psychological safety to overcome learning anxiety and apprehension about changing. When learning anxiety is pre-sent, survival anxiety and sense of guilt may not be sufficient to prompt change. Learning anxiety triggers defensiveness and resistance to the painful unlearning of what had been previously regarded as true. Learning anxiety drives opposition behaviors such as denial—maintaining that data are not a valid and conclusive evidence—scapegoating and passing the buck—somebody else is guilty, somebody else must change—and maneuvering and negoti-ating to secure personal advantages in return of the change effort. It is necessary to overcome anxieties for change to progress and reducing learning anxiety is preferable to increasing survival anxiety and making it greater than learning anxiety. Ways to overcome learning anxiety include the development and communication of a new vision, formal an informal training on new ways of working, feedback on behaviors, the introduction of new role models, and the adoption of new recognition and reward systems.
The first stage is completed when a real desire to make some change
exists and people are motivated to learn new solutions and change their behaviors.
In the second stage, leaders change what needs to be changed and move to a new position. They define the objective of the change and provide a concise view of the new state, to show the gap between the present state and that being proposed. This stage involves learning new concepts and new meanings for old concepts. People will be encouraged to learn on their job by searching for new personalized solutions through trial and error and will be involved in structured training programs that typically revolve around the adoption of new role models and the psychological identification with them.
In the third stage leaders make the change permanent and refreeze the situation. This stage involves the internalization of new concepts and
THE CHALLENGES OF SALES MANAGEMENT 201
meanings. These are incorporated into a new self-concept, a new organi-zational identity, and new interpersonal relationships. They become part of the way things are done; they are the new culture and shape and establish new interpersonal relationships. Refreezing is the final stage, where new behaviors become habitual.
John Kotter developed an eight-step process for leading transforma-tional change with positive results. There are no shortcuts in the model and skipping a step will be an error resulting in a failure for the whole process. The eight steps6 as outlined on the www.kotterinternational.com website are:
1. Create a sense of urgency. Fight complacency and act with urgency.
Underline actual and potential problems, highlight unacceptable performance, challenge the status quo, set higher standards of per-formance, focus employees on corporate and not only on function-al goals, share the results of customer-satisfaction surveys, counter-act insider myopia with external data, and identify significant busi-ness opportunities as “a means for exciting people to sign up” for change. Even go so far as to create an artificial crisis. Get people to start telling each other “Let’s go for it!”
2. Build a guiding coalition. Find the right people, build the team cre-ating mutual understanding and trust, and develop a common goal for their teamwork. Assemble a group of highly credible people with the power, expertise, skills, and energy needed to “lead and support a collaborative change effort.”
3. Form a strategic vision and initiatives. Get the guiding team “to shape a vision to help steer the change effort and to develop strate-gic initiatives to achieve that vision.” Authoritarianism is unlikely to break resistance to change, while a sensible and appealing picture of the future can force people out of their comfort zone. The vision will be a direction for the future that is desirable, feasible, focused, flexible, and easy to communicate. It will provide clarity of direc-tion, call to action, and alignment.
4. Enlist a volunteer army. Communicate the change vision for buy-in and “raise a large force of people who are ready, willing and urgent
6The names of the steps are different in Kotter (1996).
202 A GUIDE TO SALES MANAGEMENT
to drive change.” Keep the communication simple, use metaphors, analogies, and examples, communicate in many different forums, don’t be afraid to repeat your message, walk the talk and lead by example, address seeming inconsistencies, and gather feedback.
5. Enable action by removing barriers. “Remove obstacles to change, change systems or structures that pose threats to the achievement of the vision” and empower employees to act on the vision. Make the organizational structure compatible with the vision, provide training on social and technical skills as needed, align management information systems and HR systems—performance appraisal, compensation, promotion, succession planning, recruitment—to the vision and confront supervisors who undercut needed change. Make people feel that they are able to act.
6. Generate short-term wins. Plan and deliver visible and unambiguous short-term results related to the change effort, which build momen-tum and lend credibility to the transformation: “Consistently pro-duce, track, evaluate and celebrate volumes of small and large accomplishments—and correlate them to results.” Short-term wins provide evidence that sacrifices are worthwhile, reward change agents for their work building morale, help the guiding coalition to fine tune vision and strategy, undermine skepticism and resistance, keep bosses on board providing evidence that transformation is on track, and build momentum turning more people into enthusiastic supporters of the change initiative.
7. Sustain acceleration. Build on changes and gain momentum, consolidate gains, leverage wins, and produce more change: “Use increasing credibility to change systems, structures and policies that don’t align with the vision; hire, promote and develop employees who can implement the vision; reinvigorate the process with new projects, themes and volunteers.” Do not let up, because the job is not done yet and regression may follow. Get people to make wave after wave of changes until the vision is fulfilled. Provide infor-mation; clarify vision, strategies, and priorities; and coordinate all the change projects, delegating leadership for specific projects and management of details.
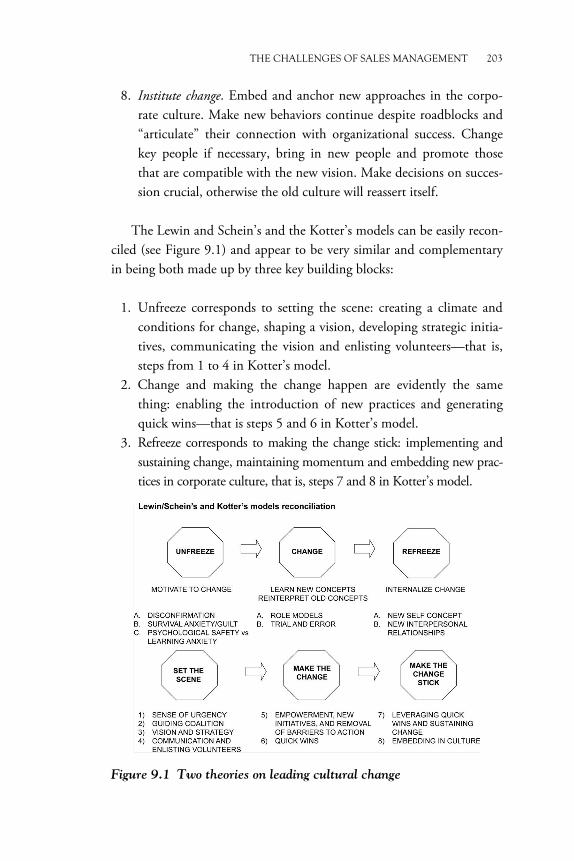
THE CHALLENGES OF SALES MANAGEMENT 203
8. Institute change. Embed and anchor new approaches in the corpo-rate culture. Make new behaviors continue despite roadblocks and “articulate” their connection with organizational success. Change key people if necessary, bring in new people and promote those that are compatible with the new vision. Make decisions on succes-sion crucial, otherwise the old culture will reassert itself.
The Lewin and Schein’s and the Kotter’s models can be easily recon-
ciled (see Figure 9.1) and appear to be very similar and complementary in being both made up by three key building blocks:
1. Unfreeze corresponds to setting the scene: creating a climate and
conditions for change, shaping a vision, developing strategic initia-tives, communicating the vision and enlisting volunteers—that is, steps from 1 to 4 in Kotter’s model.
2. Change and making the change happen are evidently the same thing: enabling the introduction of new practices and generating quick wins—that is steps 5 and 6 in Kotter’s model.
3. Refreeze corresponds to making the change stick: implementing and sustaining change, maintaining momentum and embedding new prac-tices in corporate culture, that is, steps 7 and 8 in Kotter’s model.
Figure 9.1 Two theories on leading cultural change
204 A GUIDE TO SALES MANAGEMENT
Lewin and Schein’s model better describes the creation of a sense of urgency through the disconfirmation of “learned, shared, tacit assump-tions” and underlines the need to create psychological safety to reduce learning anxiety. It can be seen as more conceptual, while Kotter’s model can be considered more operational and practical. I believe that they complement each other extremely well.
A change checklist for the sales director
Mergers and cultural transformation programs will be led by the company’s CEO, but some projects like the restructuring of the sales organization will be delegated to the sales director. We can refer to the real life example and to the theories that we have analyzed earlier to put together a change check-list for the sales director. When she leads the merger of two sales teams, she should observe the following sequence of steps: 1. Align HR systems for the sales team. 2. Appoint the new sales leadership team. 3. Update the sales strategy. 4. Merge the sales departments. 5. Deliver new outputs and solutions for sales. 6. Integrate sales with other company’s functions. 7. Sign up to the company’s cultural transformation program.
The alignment of HR systems for the sales function will include re-cruiting, training, appraisal, reward and recognition, and succession planning. It is also very useful to plan job rotations both for managers and trainees to focus the best people on the best resources and to breed a new generation of employees with a working experience of the whole new company portfolio.
The appointment of a new sales leadership team is a fundamental preparatory step to enable updating the sales strategy and driving the restructuring program. It is very unlikely that the two companies being merged have exactly the same approach to the marketplace and the same kind of relationships with customers. Therefore, the sales strategy will have to be updated in some respects: route to market, customer service, promotional policy, comarketing, etc.
THE CHALLENGES OF SALES MANAGEMENT 205
Sales departments must be merged moving from the inside to the outside of the company as follows:
1. Back office:
i. Sales operations ii. Trade marketing.
2. Front line: i. National accounts ii. Field accounts iii. Field merchandising.
The sales director must work on the back office first and then on the front line. There is no strict rule for putting sales operations or trade mar-keting first and they might also be merged in parallel. The unification of field merchandising can also take place as soon as joint sales operations and trade marketing are established, but in such a case, it is more compli-cated to manage, because there are still double touch points in place in account management. The cultural options for the merger are blending (“best of both” approach) and domination of a culture over the other7. Blending is very difficult, so it is very likely that the sales director will choose one culture and make it dominant. However, her team will also benefit from allowing some degree of contamination and from listening to hybrids8, the dissenters and the nonconformists of the losing culture. Merging departments will imply managing redundancies up to 50 percent of personnel in some areas, and it is therefore a very delicate step of the process that must necessarily be phased in and diluted over time to avoid disruptions. Layoffs will have a negative impact on morale and thus train-ing and team building initiatives such as outdoor activities, workshops, away days, etc., are deeply needed after every departmental merge. These activities can also be instrumental in the next step of the process.
New outputs and solutions are the consequence of merging depart-ments. Unless there is a full acquisition, it is very unlikely that a new
7Schein (1999) also considers the separation and conflict options, but in the first case there is no real merger, while in the second there is simply chaos. 8See Schein (1999) on the positive role of hybrids in mergers.
206 A GUIDE TO SALES MANAGEMENT
department created from a merger will adopt exclusively the way of working of one of the former units, avoiding any blending between the practices of its parents. As the merge is progressing from the inside to the outside of the company, we will see more and more new common out-puts and solutions appear: documents, meetings, functional processes, and procedures. These are the tangibles of the merge. What was very dif-ferent before now comes with the same look and feel, the same structure, the same content, and the same duration. The following artifacts are the most important examples of these new outputs and solutions:
1. Sales cycles 2. Sales targets setting 3. Incentive programs 4. Support materials 5. Trade category plans 6. Customer facing category strategies 7. Sales conferences and meetings 8. Customer audits 9. Customer business plans 10. Sales forecasting 11. Annual agreements 12. Sales force automation.
The head of each department will be responsible to lead the trans-formation of his area. In agreement with the sales leadership team he will decide and prioritize initiatives (the what and when) and appoint cross-departmental project teams to discuss the details and the delivery (the how).
Once a new sales organization is in place and a new functional decision making process is agreed, the sales director will focus the atten-tion of her leadership team on the integration of sales with the other company’s functions, both in the fundamental processes of business planning, order to cash and sales and operations planning, and in the overall cross-functional decision making process. This step often implies the development of new supporting tools.
THE CHALLENGES OF SALES MANAGEMENT 207
At the end of the merger, the sales director must expect to be involved by her CEO in a cultural transformation program that will challenge the “shared tacit assumptions,” the taboos and the sacred cows of the company. There is no need to add that the CEO could also decide to start a change program irrespectively of a merger or acquisi-tion. If the sales director feels the sense of urgency and buys into the change vision of the CEO, she should stay and jump on the train, or otherwise she should leave the company as soon as possible. In making her choice, she will have to take into account many aspects and answer yes to a few tough questions:
1. Is her leadership style resonant with the leader’s style in the same
way that her direct reports’ style must be with hers? 2. Is she willing to fire key people that do not want to accept change
and actively resist it? 3. Is she aware that a cultural transformation program will potentially
leave nothing unchanged and therefore affect leadership, strategy, organization, processes, tools and key performance indicators?
4. Is she comfortable with a shift from a command and control leader-ship style to an empower and delegate style?
5. Is she ready to simplify the current organization making it slimmer and flatter? Will she agree to minimize the potential silos—functions and departments—and the layers of the organization to create a more agile structure and to avoid duplications and overlaps?
6. Is she willing to embark on a long and difficult journey? 7. Is she ready to put up with external advisors and consultants?
An experienced CEO will carefully drive the change process follow-ing a pattern similar to Kotter’s eight-step model and he will expect support and contribution from the sales director at every stage, not least planning and delivering quick wins. This means that the sales director will also have to do her share of recruiting new people—from competi-tors, other industries, and customers—of coordinating the work of a number of project teams, and of organizing team building and training activities to develop new social and technical skills.
208 A GUIDE TO SALES MANAGEMENT
Customer consolidation and channels evolution
Managing customer consolidation and channels evolution are two key challenges for sales directors.
If we look at the history of the last 20 years of the British trade, the expansion of Tesco in Ireland in 1997 or Asda’s purchase of Netto stores in 2010 might not have been big surprises, but the Cooperative Group’s9 takeover of Somerfield10 in 2009 was surely a very impressive move and who ever expected Morrisons to make a successful offer to purchase Safeway in 2003?
Sales channels are constantly evolving. Hard discounts were almost unknown outside of Germany 20 years ago and hypermarkets seemed to be the winners in the future of modern trade. Nowadays many big box stores have an identity crisis and even standard superstores are forced to rethink their formula. Retailers are fighting a war to win in the conven-ience sector, and online businesses are giving a very hard time to brick and mortar category killers that looked unbeatable not very long ago. It’s enough to look at what is happening in the leisure and entertain-ment and consumer electronics markets to understand the point.
The implications of customer consolidation for sales management are mostly linked to the renewal of annual agreements. Customers will compare
9The Cooperative Group headquartered in One Angel square in Manchester developed over 165 years from the merger of cooperative wholesale and retail societies. At the end of the first decade of this century, it consolidated most of the UK cooperative world and it took over Somerfield to become a major UK retailer. It has survived the consequences of the 2013 Flowers banking scandal, reducing its debt by selling in 2014 some of its busi-nesses, including the Cooperative Pharmacy and the Cooperative Farms. 10Somerfield was a chain of small to medium sized supermarkets operating in the United Kingdom. The business was born as a grocery store at the end of the nineteenth century. It grew organically and through acquisitions and it became the Dee Corporation in 1983 and subsequently the Gateway Corporation in 1988 and finally Somerfield in 1994. It bought the former Carrefour UK stores in 1988, it took over rival Kwik Save discount food stores in 1998 and it acquired over 100 Safeway Compact stores from Morrisons in 2004. Somerfield started a store rationalization program in 2006. It sold the Kwik Save brand and over 170 stores to BTTF and more than 150 stores to other retailers. In 2007, it bought 140 Texaco petrol station shops that it converted to convenience stores. In 2009 it was taken over by the Cooperative Group.
THE CHALLENGES OF SALES MANAGEMENT 209
existing contracts and will be tempted to cherry pick. If the negotiation is based on net prices they will ask for the lowest prices in both contracts, if it is based on list prices and trade terms they will go for the most favorable terms of both. When this happens the supplier can open the negotiation declaring that he will not allow a discussion based on selective choices and invite the customer to choose one set of preacquisition terms or the other. He might also recommend the most favorable set of terms with reference to the customer’s bottom line, the trade profitability resulting from the com-bined volumes. If the supplier is not strong enough to stand firm, he will be forced to negotiate on the details of the new agreement and to allow some degree of cherry picking. At the end of the day, the more a supplier’s con-tracts are qualitatively and quantitatively misaligned, the more he is in a bad place in case of a merger. On the other hand, customers will be impressed by very similar contract structures and comparable commercial incomes and as a consequence the supplier’s credibility and negotiation strength will con-siderably increase. This is one of the key reasons why an annual agreement strategy based on contract alignment is such an important component of a sales strategy.
Customer consolidation will also imply lower order taking, sales administration, and physical distribution costs for the supplier and a part of these savings will be used to finance the increase of trade spend-ing generated by the new supply agreement or the adoption of improved customer-service standards. On the other hand, personnel redundancies are the downside of supplier’s cost reduction, especially when the number of acquisitions is very high and customer consolidation acceler-ates. In this case, mergers are bad news for sales reps, customer-care assistants, and to a lesser degree for account managers.
The implications of channels evolution for sales management extend beyond account management. Selling branded grocery goods in hard discounts or any other merchandise online might seem logical and natural today, but the decision to enter these new sales channels was not an easy one for many companies. There was some kind of fear of the unknown and apprehension to irritate existing customers. When hard discounts first emerged, few people judged that they were not willing to start price wars on branded goods and that they were keen to list leading
210 A GUIDE TO SALES MANAGEMENT
brands mainly to complete their offering and enhance their service and image. Companies that believed that it was better to go first, gain first mover advantage, and learn before their competitors soon consolidated market shares in the new channel.
The trade marketing implications of entering new channels are not en-tirely negligible: new secondary packaging solutions (e.g., mixed cases for hard discounts and subpacks for cash’n’carries), smaller or bigger pack sizes, new special packs, new free standing units and new types of promo-tional activities need to be developed. Field merchandising and in-store execution models also have to adapt to channel evolution. When hyper-markets and superstores are rapidly expanding, manufacturers invest in a variety of field merchandising services like shelf stacking, rack jobbing, store activation, and store monitoring, but they adopt radically different in-store execution models when they have to focus on the convenience sector.
Both in case of customer consolidation and channels evolution the sales director will have to manage very carefully her sales organization, especially field sales and field merchandising. In some cases, she will have to reduce personnel, and in other cases, she will have to invest in additional human resources. In the latter event, outsourcing a part of the work is a solution that allows to variabilize costs to a good degree.
Customer internationalization
Customers become international basically in two ways: either they enter foreign markets through acquisitions, joint ventures or franchising agreements, or they join international buying groups.
Walmart, Carrefour, and Tesco are examples of retailers that fol-lowed the first route, while the second option was increasingly adopted in Europe in the last ten years. ITM (Intermarché), Edeka, and Eroski joined forces in Alidis/Agenor in 2005. Leclerc, Delhaize, and Coop Italia constituted the new Coopernic11 buying group in January 2015, while Colruyt, Coop Schweiz, Conad, Système U, and Rewe12, formed the Core buying group. 11The original Coopernic buying group was established in 2006 and included Leclerc, Rewe, Colruyt, Coop Schweiz, and Conad. EMD and AMS are two other important European buying groups, but they are more focused on joint sourcing. 12Rewe has announced that it will rejoin Coopernic in January 2016.
THE CHALLENGES OF SALES MANAGEMENT 211
In both cases, international customers can ask for (1) international agreements and (2) international pricing of similar items.
In international agreements, customers and buying groups try to lever-age their combined volumes to get additional rebates, typically overriders that go on top of the existing national agreements. Buying groups generally have little to offer in return for extra investments, but volumes or turnover growth, while international customers can add data sharing, category cap-taincies, etc. On the other hand, suppliers want to minimize their additional trade spending by limiting the scope of the international contract and to increase the return on their investments by getting tangible additional coun-terparts. The core of the negotiation of an international agreement revolves around these two issues. International customers and buying groups want to use the sum of the turnover of all the countries as a base for calculating additional rebates, while suppliers ask to include in that base only the turn-over of their international brands, leaving out local brands. International customers and buying groups want to get additional and unconditional rebates as a reward for their critical mass, while suppliers demand additional counterparts such as growth targets, new product listings, shelf space, secondary placements, and promotions.
As a matter of fact, suppliers sell their products at different prices—both ongoing and promotional—in the national markets where they op-erate. The reason why this happens is twofold: the relative price posi-tioning of a brand may not exactly be the same in every market and the relative value of a category—its realization per unit sold—is not always the same in every country. Mineral water is premium to beer in some countries and an entry level drink in others. The retail price of a can of regular Coke or of a Big Mac varies significantly across Eurozone coun-tries and does not reflect currency exchange rates when comparing non Eurozone countries. Confectionery is cheaper in the UK than in other European markets, while cars and motorbikes tend to be more expen-sive. In the face of this situation international customers and buying groups can ask for an international pricing of the best-selling items, cherry picking the lowest net prices that they find in every market. This challenge is huge for international suppliers. Even when they manage to push back the requests of international customers, they cannot afford to avoid to keep under control the level of parallel trade of their brands.
212 A GUIDE TO SALES MANAGEMENT
As a minimum this implies the implementation of global or regional monitoring systems of their net prices and the coordination of action plans to balance net prices across countries.
The future challenges of sales management
Which other challenges should sales people expect from the future, other than more mergers and acquisitions, channels evolution, and further cus-tomer consolidation and customer internationalization?
Cost reduction and variabilization will very likely become even more important internal change drivers. The outsourcing of an increasing number of sales tasks will extend in various degrees from field merchan-dising and field accounting to national accounting and trade marketing. In a few years many field merchanding activities will be outsourced in most companies: the adoption of digital merchandising solutions and the resorting to crowd sourcing as a means of gathering KPI data in-store point in this direction. Cost reduction will also drive the centrali-zation of sales organizations. Some multinational companies will reduce the number of their national and subregional units and centralize their back offices, others will set up fully centralized regional sales organiza-tions, managing international customers centrally and local customers locally through country sales managers, in the same way that today they manage sales territories with area sales managers.
The emergence of global retailers determined to act globally will probably be the most important external change driver. These retailers will not necessarily have European or American roots—they could as well be Asian. They will be asking for global agreements and global pricing.
Third and last point: as it is always the case in retailing, expect the unexpected, some big, big, big surprise!
Takeaway Points
• Changes such as mergers and acquisitions, channels develop-ment, customer consolidation, and customer internationaliza-tion pose key challenges to sales management and drive change.
THE CHALLENGES OF SALES MANAGEMENT 213
• The integration of two sales departments into one can take up to two years. Still, at the end of the process, it is very likely that you do not have a new culture yet, because in a merger “cultural change comes last, not first.”
• Corporate culture is a set of “learned, shared, tacit assump-tions” on which people base their daily behaviors and that need to be challenged to drive change.
• Cultural change is led by the company’s CEO in three steps: (1) unfreeze the situation and create the motivation to change, shaping and communicating a vision, (2) make the change happen learning new concepts and reinterpreting old concepts and generating quick wins, and (3) refreeze the situation internalizing new concepts and meanings and making change stick.
• During the merger of two sales teams the sales director should follow these steps: (1) align HR systems for the sales team, (2) appoint the new sales leadership team, (3) update the sales strategy, (4) merge the sales departments, (5) deliver new outputs and solutions for sales, (6) integrate sales with other company’s functions, and (7) sign up to the company’s cultural transformation program.
• Sales departments should be merged moving from the inside to the outside of the company, working on the back office first (sales operations and trade marketing) and then on the frontline (national accounts, field accounts, and field merchandising).
• A sales director should either buy into the change vision of the CEO or leave the company as soon as possible.
• The implications of customer consolidation for sales management are a likely increase in trade spending (custom-ers will compare existing contracts and try to cherry pick the best terms) and a decrease in order taking, sales administra-tion, and physical distribution costs, that can fund the increase of trade spending or the adoption of improved customer-service standards.
214 A GUIDE TO SALES MANAGEMENT
• Channels evolution impacts not only account management, but also trade marketing (new pack sizes, secondary packaging, displays, promotions, etc.), field merchandising and in-store execution models.
• Customer internationalization implies the request of (1) international agreements and (2) international pricing of similar items.
• Other challenges that lay ahead for sales management are externally the emergence of new global retailers and internal-ly the pressure to reduce and variabilize costs with dramatic changes of the sales organizations.
References and Suggestions for Further Reading
Andrews, K.R. 1971. The Concept of Corporate Strategy. Homewood, IL: Dow Jones-Irwin.
Ansoff, H.I. 1965. Corporate Strategy. New York: McGraw Hill. APICS and IBF 2012. “2012 Sales and Operations Planning Insights and
Innovations. Exploring Real-World S&OP Practices in Supply Chain and Operations Management”, www.apics.org.
Arden, T.G., and S.E. Edwards. 2009. Best Practice Guide for Customer Service Managers: An Activity-based Workbook for Leaders of Teams That Strive for Service Excellence. Longbridge Deverill, Wiltshire: Customer 1st International.
Bowersox, D.J., and M.B. Cooper. 1992. Strategic Marketing Channel Management. New York: McGraw Hill.
Baker, M.J. 1987. The Marketing Book. London: Heinemann. Berkowitz, D. 2011. “The Infinite Moment of Truth,” www.mediapost.com. Blackshaw, P.2008. Satisfied Customers Tell Three Friends, Angry Customers Tell
3,000: Running a Business in Today's Consumer-Driven World. New York: Doubleday.
Blanchard, K.H., J. Ballard, and F. Finch. 2004. Customer Mania: It’s Never Too Late To Build A Customer-Focused Company. New York: The Free Press.
Butner, K. 2010. “The Grocery Manufacturers Association (GMA) 2010 Logistics Benchmark Report. Performance Reaches All-Time High During Economic Depression”, IBM Global Services, www.gmaonline.org.
Carlzon, J. 1987. Moments of Truth. Cambridge, MA: Ballinger Publishing Company.
Chandler, A. 1962. Strategy and Structure: Chapters in the History of Industrial Enterprise. Cambridge, MA: M.I.T. Press.
Coughlan, A.T., E. Anderson, L.W. Stern, and A. El-Ansary. 2006. Marketing Channels, 7th ed. Upper Saddle River, NJ: Prentice Hall (Pearson).
Cox, R., and P. Brittain. 2004. Retailing: An Introduction, 5th ed. Harlow, Essex: Financial Times/Prentice Hall.
Drucker, P. 1954. The Practice of Management. New York: Harper & Row. Dukesmith, F.H. January 1904. "Three Natural Fields of Salesmanship,"
Salesmanship, 2, no. 1, p. 14. Ebster, C., and M. Garaus. 2011. Store Design and Visual Merchandising: Creating
Store Space That Encourages Buying. New York: Business Expert Press.
216 REFERENCES
ECR Europe. 1996. Efficient Replenishment & EDI. Bruxelles: Roland Berger & Partners.
ECR Europe. 1997. Category Management Best Practices Report. Bruxelles: The Partnering Group Inc. and Roland Berger & Partners.
ECR Europe. 2000. The Essential Guide to Day to Day Category Management. Bruxelles: Andersen Consulting.
ECR Europe. 2000. Transport Optimisation. Bruxelles: Item HSG. ECR Europe. 2003. Optimal Shelf Availability - Increasing Shopper Satisfaction
at the Moment of Truth. Bruxelles: Roland Berger Strategy Consultants. ECR Europe. 2006. Shelf Ready Packaging (Retail Ready Packaging) – Addressing
the Challenge: A Comprehensive Guide for A Collaborative Approach. Bruxelles: ECR Europe and Accenture.
ECR Europe. 2008. Jointly Agreed Growth. Bruxelles: ECR Europe. ECR Europe, and GCI. 2005. ECR Global Scorecard, A Capability Assessment
Tool, ecr-all.org; www.ecr-europe.org; www.globalscorecard.net ECR North America. 1995. Category Management Report. Enhancing Consumer
Value in the Grocery Industry, Cincinnati, OH: The Joint Industry Project on Efficient Consumer Response (Category Management Subcommittee) and The Partenering Group, Inc.
Fisher, R., W. Ury, and B. Patton, ed. 2012. Getting To Yes. Negotiating An Agreement Without Giving In, 3rd revised ed. London: Random House.
Friedman, L. 2002. Go To Market Strategy: Advanced Techniques and Tools for Selling More Products to More Customers More Profitably. Oxford, Boston: Butterworth-Heinemann.
Gadiesh, O., and J.L. Gilbert. May 2001. “Transforming Corner-Office Strategy into Frontline Action.” Harvard Business Review, 79, no. 5, pp. 72–79.
Hamel, G., and C.K. Prahalad. 1994. Competing for the Future. Boston: Harvard Business School Press.
Harvard Business Review Analytic Services. 2013. “Delivering on the Promise of Great Customer Experiences”, research report, Harvard Business School Publishing, hbr.org/hbr-analytic-services.
Hax, A.C., and N. Majluf. 1991. The Strategy Concept and Process: A Pragmatic Approach. Englewood Cliffs, NJ: Prentice Hall.
Heskett, J.L., W.E. Sasser, Jr., and L.A. Schlesinger. 1997. The Service Profit Chain: How Leading Companies Link Profit and Growth to Loyalty, Satisfaction and Value. New York: The Free Press.
Ishikawa, K. 1972. Guide to Quality Control. Tokyo: Asian Productivity Organization.
Kaplan, R.S., and D.P. Norton. 1996. The Balanced Scorecard: Translating Strategy into Action. Boston: Harvard Business School Press.
REFERENCES 217
Kitson, H.D. 1920. Manual for the Study of the Psychology of Advertising and Selling. Philadelphia: J.B. Lippincott Company.
Kotter, J.P. 1999. On What Leaders Really Do. Boston: Harvard Business Review Press.
Kotter, J.P. 1996. Leading Change. Boston: Harvard Business Review Press. Kvint, V. 2009. The Global Emerging Market: Strategic Management and
Economics. New York: Routledge. Lafley, A.G. May 2009. “What Only the CEO Can Do.” Harvard Business
Review, 87, no. 5, pp. 54–62. Lafley, A.G., and R.L. Martin. 2013. Playing to Win: How Strategy Really Works.
Boston: Harvard Business Review Press. Lawrence, A. 1983. The Management of Trade Marketing. Aldershot,
Hampshire: Gower Publishing. Learned, E.P., C.R. Christensen, and K.R. Andrews. 1965. Business Policy: Text
and Cases. Homewood, IL: Richard D. Irwin. Lecinski, J. 2011. ZMOT: Winning the Zero Moment of Truth. Google Inc.,
www.thinkwithgoogle.com. Lewis, St. Elmo E. February 1903. “Catch-Line and Argument.” The Book-
Keeper, 15, p. 124 Ling, R.C., and W.E. Goddard. 1988. Orchestrating Success: Improve Control of
the Business with Sales and Operations Planning. New York: John Wiley & Sons.
Lundin, S.C., J. Christensen, and H. Paul. 2001. Fish! A Remarkable Way to Boost Morale and Improve Results. London: Hodder & Stoughton.
McKeown, M. 2011. The Strategy Book: How to Think and Act Strategically to Deliver Outstanding Results. Harlow, Essex: FT Prentice Hall.
Macey, F. March 1900. "The Bissell Prize Advertisement Contest." Hardware, p. 44
Mintzberg, H. May 1978. “Patterns in Strategy Formation.” Management Science, 24, no. 9, pp. 934–948.
Mintzberg, H., B.W. Ahlstand, and J. Lampel. 1998. Strategy Safari: A Guided Tour through the Wilds of Strategic Management. New York: The Free Press.
Mintzberg, H., and J.B. Quinn. 1988. The Strategy Process: Concepts, Contexts and Cases. Englewood Cliffs, NJ: Prentice Hall.
Morgan, T. 2008. Visual Merchandising: Window and In-Store Displays for Retail. London: Laurence King.
Mukerij, S. August 2012. “Order to Cash Cycle: Best Practices and Industry Trends”, On the Job, www.cfo-connect.com.
Nakajima, S. 1988. Introduction to TPM: Total Productive Maintenance. Cambridge, MA: Productivity Press.
218 REFERENCES
Nielsen Marketing Research. 1992. Category Management: Positioning Your Organisation to Win. Lincolnwood, IL: NTC Business Books.
Nielsen, A.C., J. Karolefski, and A. Heller. 2006. The Consumer-Centric Category Management: How to Increase Profits by Managing Categories Based on Consumer Needs. Hoboken, NJ: John Wiley & Sons.
Pegler, M.M. 1983. Visual Merchandising and Display. New York: Fairchild Publications.
Palmatier, G.E., and J.S. Shull. 1988. The Marketing Edge: The New Leadership Role of Sales & Marketing in Manufacturing. New York: John Wiley & Sons.
Palmatier, G.E., and C. Crum. 2013. The Transition from Sales and Operations Planning to Integrated Business Planning: Moving from Fundamental Demand and Supply Balancing to Strategic Management. New London, NH: Oliver Wight International.
Pezza, S. July 2011. “The Order to Cash Cycle. Enhancing Performance with Process Automation”, research report, Aberdeen Group, Inc., A Harte-Henks Company, www.esker.com
Porter, M.E. 1980. Competitive Strategy: Techniques for Analyzing Industries and Competitors. New York: The Free Press.
Porter, M.E. 1985. Competitive Advantage: Creating and Sustaining Superior Performance. New York: The Free Press.
Porter, M.E. November 1996. “What Is Strategy?” Harvard Business Review, 74, no. 6, pp. 61–78.
Randall, G. 1994. Trade Marketing Strategies: The Partnership Between Manufacturers, Brands and Retailers. Oxford, Boston: Butterworth-Heinemann.
Rangan, V.K. 2006. Transforming Your Go-To-Market Strategy: The Three Disciplines of Channel Management. Boston: Harvard Business School Press.
Retail Compliance Council. 2005. “Benchmarking the Perfect Order: A Comprehensive Analysis of the Perfect Order in the Retail Industry. 2005 Report”, www.werc.org.
Reynolds, J., and C. Cuthbertson. 2004. Retail Strategy: The View from the Bridge. Amsterdam–Boston: Elsevier Butterworth-Heinemann.
Richards, J.A. 1893. "Well Told is Half Sold." The United Service. A Monthly Review of Military and Naval Affairs, 9, p. 8.
Rumelt, R.P. 2011. Good Strategy/Bad Strategy. New York: Crown Business. Russell, C.P. June 1921. "How to Write a Sales-Making Letter." Printers' Ink,
June 2. Scamell-Katz, S. 2012. The Art of Shopping: How We Shop and Why We Buy.
London: LID Publishing. Schein, E.H. 1999. The Corporate Culture Survival Guide. San Francisco:
Jossey-Bass.
REFERENCES 219
Schein, E.H. 1985. Organizational Culture and Leadership. San Francisco: Jossey-Bass.
Selznick, P. 1957. Leadership in Administration: A Sociological Interpretation. Berkeley, CA: University of California Press.
Sheldon, A.F. 1911. The Art of Selling. Chicago: Sheldon School. Sheldon, D.J. 2006. World Class Sales & Operations Planning: A Guide to
Successful Implementation and Robust Execution. Fort Lauderdale, FL: J. Ross Publishing.
Sorensen, H. 2009. Inside the Mind of the Shopper: The Science of Retailing. Upper Saddle River, NJ: Wharton School Pub.
Stahlberg, M. 2010. Shopper Marketing: How to Increase Purchase Decisions at the Point of Sale. London: Kogan Page.
Taylor D., and D. Nichols. 2010. The Brand Gym: A Practical Workout to Gain & Retain Brand Leadership. Hoboken, NJ: John Wiley & Sons.
Underhill, P. 2008. Why We Buy: The Science of Shopping (revised edition). New York: Simon & Schuster.
Vitasek, K. and K. Manrodt. April 2008. “Benchmarking the Perfect Order 2008 Report. A Comparative Analysis of the Perfect Order in the Retail Industry”, Parsippany, NJ: VCF, www.compliancenetworks.com.
Wallace, T.F. 1999. Sales and Operations Planning: The How-to Handbook. Cincinnati, OH: T.F. Wallace & Co.
Walters, D., and J. Hanrahan. 2000. Retail Strategy: Planning and Control. Basingstoke, Hampshire: Palgrave Macmillan.
Websites
www.aguidetosalesmanagement.com www.customer1st.co.uk www.deloitte.com—see the reports Global Powers of Retailing 2014 Retail
Beyond begins and Global Powers of Retailing 2015 Embracing Innovation http://ecr-all.org www.ecr-europe.org www.herbsorensen.com www.instituteofcustomerservice.com www.kotterinternational.com www.pacounderhill.com www.asda.com www.carrefour.com www.esselunga.it www.groupe-auchan.com www.j-sainsbury.co.uk

220 REFERENCES
www.morrisons.co.uk www.mouvement-leclerc.com www.tescoplc.com corporate.walmart.com
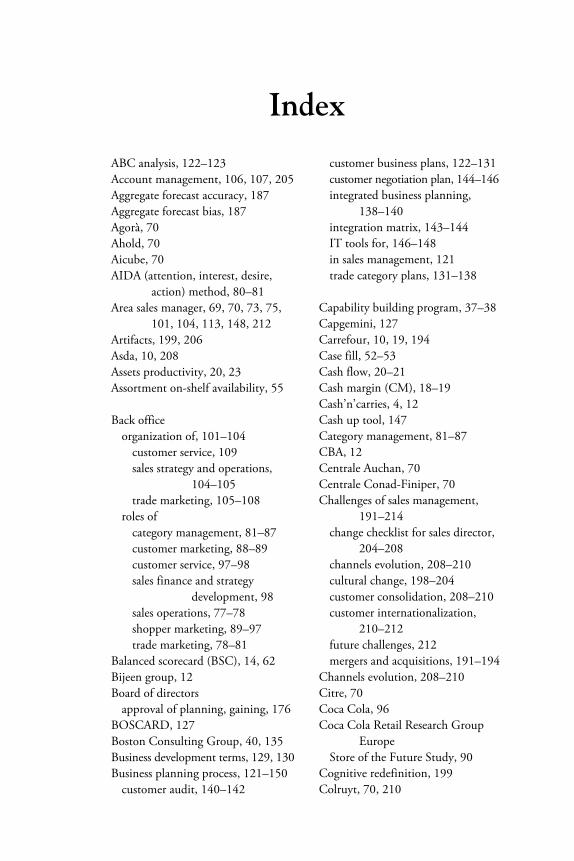
Index
ABC analysis, 122–123 Account management, 106, 107, 205 Aggregate forecast accuracy, 187 Aggregate forecast bias, 187 Agorà, 70 Ahold, 70 Aicube, 70 AIDA (attention, interest, desire,
action) method, 80–81 Area sales manager, 69, 70, 73, 75,
101, 104, 113, 148, 212 Artifacts, 199, 206 Asda, 10, 208 Assets productivity, 20, 23 Assortment on-shelf availability, 55 Back office
organization of, 101–104 customer service, 109 sales strategy and operations,
104–105 trade marketing, 105–108
roles of category management, 81–87 customer marketing, 88–89 customer service, 97–98 sales finance and strategy
development, 98 sales operations, 77–78 shopper marketing, 89–97 trade marketing, 78–81
Balanced scorecard (BSC), 14, 62 Bijeen group, 12 Board of directors
approval of planning, gaining, 176 BOSCARD, 127 Boston Consulting Group, 40, 135 Business development terms, 129, 130 Business planning process, 121–150
customer audit, 140–142
customer business plans, 122–131 customer negotiation plan, 144–146 integrated business planning,
138–140 integration matrix, 143–144 IT tools for, 146–148 in sales management, 121 trade category plans, 131–138
Capability building program, 37–38 Capgemini, 127 Carrefour, 10, 19, 194 Case fill, 52–53 Cash flow, 20–21 Cash margin (CM), 18–19 Cash’n’carries, 4, 12 Cash up tool, 147 Category management, 81–87 CBA, 12 Centrale Auchan, 70 Centrale Conad-Finiper, 70 Challenges of sales management,
191–214 change checklist for sales director,
204–208 channels evolution, 208–210 cultural change, 198–204 customer consolidation, 208–210 customer internationalization,
210–212 future challenges, 212 mergers and acquisitions, 191–194
Channels evolution, 208–210 Citre, 70 Coca Cola, 96 Coca Cola Retail Research Group
Europe Store of the Future Study, 90
Cognitive redefinition, 199 Colruyt, 70, 210
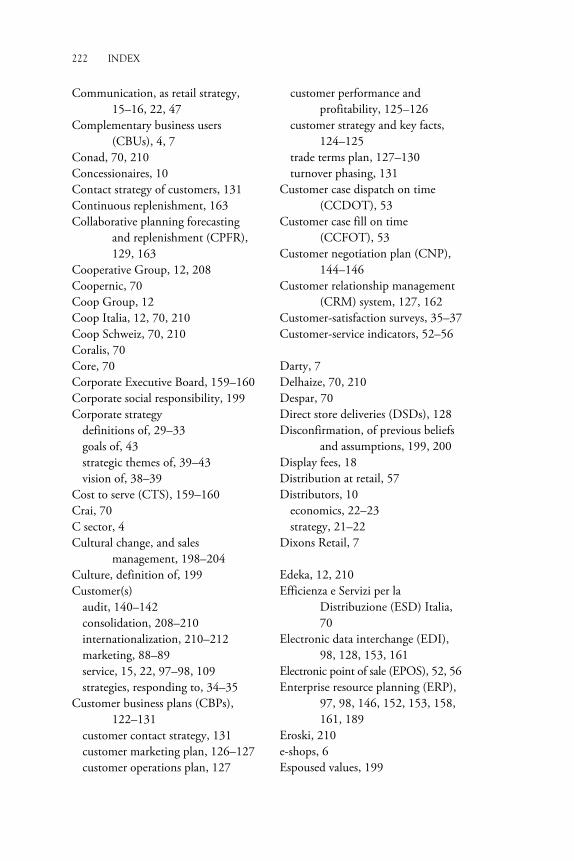
222 INDEX
Communication, as retail strategy, 15–16, 22, 47
Complementary business users (CBUs), 4, 7
Conad, 70, 210 Concessionaires, 10 Contact strategy of customers, 131 Continuous replenishment, 163 Collaborative planning forecasting
and replenishment (CPFR), 129, 163
Cooperative Group, 12, 208 Coopernic, 70 Coop Group, 12 Coop Italia, 12, 70, 210 Coop Schweiz, 70, 210 Coralis, 70 Core, 70 Corporate Executive Board, 159–160 Corporate social responsibility, 199 Corporate strategy
definitions of, 29–33 goals of, 43 strategic themes of, 39–43 vision of, 38–39
Cost to serve (CTS), 159–160 Crai, 70 C sector, 4 Cultural change, and sales
management, 198–204 Culture, definition of, 199 Customer(s)
audit, 140–142 consolidation, 208–210 internationalization, 210–212 marketing, 88–89 service, 15, 22, 97–98, 109 strategies, responding to, 34–35
Customer business plans (CBPs), 122–131
customer contact strategy, 131 customer marketing plan, 126–127 customer operations plan, 127
customer performance and profitability, 125–126
customer strategy and key facts, 124–125
trade terms plan, 127–130 turnover phasing, 131
Customer case dispatch on time (CCDOT), 53
Customer case fill on time (CCFOT), 53
Customer negotiation plan (CNP), 144–146
Customer relationship management (CRM) system, 127, 162
Customer-satisfaction surveys, 35–37 Customer-service indicators, 52–56 Darty, 7 Delhaize, 70, 210 Despar, 70 Direct store deliveries (DSDs), 128 Disconfirmation, of previous beliefs
and assumptions, 199, 200 Display fees, 18 Distribution at retail, 57 Distributors, 10
economics, 22–23 strategy, 21–22
Dixons Retail, 7 Edeka, 12, 210 Efficienza e Servizi per la
Distribuzione (ESD) Italia, 70
Electronic data interchange (EDI), 98, 128, 153, 161
Electronic point of sale (EPOS), 52, 56 Enterprise resource planning (ERP),
97, 98, 146, 152, 153, 158, 161, 189
Eroski, 210 e-shops, 6 Espoused values, 199
INDEX 223
E Square, 7 Esselunga, 10 Euronics, 7 European Competition Law, 60 Everyday low pricing (EDLP), 130 Expert, 7 FDB Coop, 12 Field account manager, 72, 75, 101,
103, 104, 116, 117, 138, 147, 148
Field marketing, 76–77 Field merchandiser, 52, 70, 72, 102,
104, 107, 116, 117, 138 Field merchandising manager, 73 Field sales efficacy indicators, 51–52 Financial indicators, 49–51 Fixed asset, 22 Forecast accuracy, 186, 187, 188 Forecast bias, 186, 187, 188 Front margin (FM), 16 Front office
organization of, 101–104 roles of, 72–77
international buying groups, interface of, 73–74
national and regional trade accounts, interface of, 75
national buying groups, interface of, 74–75
national organizations, interface of, 75
outlets, interface of, 76–77 Gap filling activities
checking feasibility and financial viability of, 176
planning, 175 General terms and conditions of
purchase (GTCP), 128 General terms and conditions of sale
(GTCS), 127–128, 129 Glendinning–Kantar Retail, 83
Great Atlantic and Pacific Tea Company (A&P), 9
Gross margin (GM), 16–17 Gross margin return on inventory
(GMROI) model, 19 Gross sales value (GSV), 152 Gruppo Vegé, 12 Hypermarkets, 3 Incentives, 117–118 In home macrosectors, 3–6
trade accounts, 9 Institute of Grocery Distribution, 159 Integrated business planning,
138–140 Integration matrix, 143–144 Intermarché (ITM), 12, 210 International buying groups, front
office as interface of, 73–74 Inventory productivity, 20, 23 Invoice accuracy, 53–54 Ishikawa fishbone diagram, 64–65 Job descriptions, 109–112 Job profiles. See Job descriptions Joint business planning and customer
indicators, 61–62 J. Sainsbury, 10 Key performance indicators (KPIs),
45, 49–67, 136, 186, 191, 212
customer-service indicators, 52–56 field sales efficacy indicators,
51–52 financial indicators, 49–51 joint business planning and
customer indicators, 61–62 need for, 49 point of purchase indicators, 56–60 reasons and solutions, identifying,
63–66 sales team scorecard, 62–63
224 INDEX
KF Coop, 12 King Kullen, 9 Kraft Foods
acquisitions, 193–194 Kroger (US), 9 Learning anxiety, 200 Leclerc, 12, 70, 210 Listing fees, 18 Logistic terms, 128–129 Macrosectors. See also Sectors
in home, 3–6, 9 in nonfood markets, 7–8 out of home, 2–3, 5–6, 10
Markant, 12 Market
analysis, 34 development, 29 penetration, 29
Marketing customer, 88–89 plan, customer, 126–127 shopper, 89–97 trade, 78–81
Mark up (MU), 23 McKinsey, 40, 135 Mean absolute deviation (MAD), 187 Mean absolute percentage deviation
(MAPD), 187 Mean forecast error (MFE), 187 Merchandising, 15, 21–22
compliance, 59 field, 76 physical, 76 visual, 79, 80–81
Merger, experience of, 194–198 Mergers and acquisitions, 191–194 Metro Group (Media Markt), 7, 12 Metro Makro, 4 Micromarkets, 3 Minimum promotional cut price
level, 130 Minimarkets, 3
Mission, 13 Modern grocery distribution
(MGD), 3, 7, 13 Moments of truth, 96 Morrisons, 10 Multilevel customer interface, 69–72 National account director, 73, 74,
75, 102 National account manager, 70, 72,
74, 75, 102, 110–112, 117, 123, 131, 156, 162
National buying groups, front office as interface of, 74–75
National organizations, front office as interface of, 75
Nestlé acquisitions, 193
Net price negotiation, 130 NKL Coop, 12 Nonfood markets
macrosectors, sectors, and channels in, 7–8
On-shelf availability (OSA), 54–56, 57
assortment, 55 stock-keeping unit, 54–55
Oracle Sales Analyzer, 147 Order to cash (O2C), 97, 151–165
definition of, 151 development and innovation,
162–164 golden rule of, 154 IT tools for, 160–162 performance indicators of, 158–160 phases of, 151–154 principles of, 154–155 roles and responsibilities of,
155–158 Organizational roles and
responsibilities, 69–100 multilevel customer interface, 69–72 sales function organization, pillars
of, 69
INDEX 225
Organization capabilities assessment, 37–38
OT-IF-NIE, 158 Out of home macrosectors, 2–3, 5–6
trade accounts, 10 Out of stocks (OOS), 54 Partnering Group, 81 Payment terms, 129, 130 Perfect order index (POI), 158–159 Personnel cost, 23 Personnel productivity, 20 Piggly Wiggly stores, 9 Point of purchase (POP) indicators,
52, 56–60 Portfolio analysis, 40 Pricing compliance, 60 Procter & Gamble, 96
acquisitions 192–193 Product
development, 29 diversification, 29 rebates, 16
Productivity assets, 20, 23 inventory, 20, 23 personnel, 20 space, 20
Promotional efficacy, 59 Promotional intensity, 59 Promotional uplift, 173 Pyramid Analytics, 147 Recognition, 118 Recruitment, sales personnel, 113–114 Research International Netherlands
for Unilever Holistic Shopper Study, 90
Retail economics, 16–21 Retail outlets, 1–8
specialist, 4 Retail ready packaging (RRP), 164 Retail strategy, 13–16 Return on net assets (RONA), 19 Reward, 116–117
Rewe, 12, 70, 210 Rough cut capacity planning
(RCCP), 182 Route to market (RTM), 1, 34
trade accounts and, 8–13
Safeway (US), 9 Safeway (UK), 208 Sales and operations planning
(S&OP), 167–190 definition of, 167–168 IT tools for, 189 meetings supporting, 183–186 performance indicators of, 186–188 phases of, 169–177 prerequisites of, 180–183 principles of, 177–180 sales directors care about, 168–169
Sales channels, 1–8, 26 architecture of, 5–6, 8 definition of, 1 in home macrosectors, 3–4 identification and selection of, 1–2 in nonfood markets, 7–8 out of home macrosectors, 2–3
Sales director change checklist for, 204–208 channels evolution, 208–210 customer consolidation, 208–210
Sales finance, 98 Sales force, 21 Sales force automation (SFA), 161–162 Sales forecasting, 170–174, 178
compared with annual operations plan, 175
sense checking, 174–175 system, updating, 170
Sales function organization, pillars of, 69
Sales management in business planning process, 121 challenges of, 191–214 performance indicators of,
49–67 Sales operations, 77–78, 104–105
226 INDEX
Sales processes, 161 Sales strategy, 29–48, 33–34, 104–105
activities of, 45–46 communication as, 47 definition of, 33 development, 98 output of, 47 responsibilities of, 34 sources of, 34 strategic actions of, 43–46 targets of, 45–46
Sales team recruitment, 113–114 sizing, 112–113 training and developing, 114–116
Sectors. See also Macrosectors in home, 3–6 in nonfood markets, 7–8 out of home, 2–3, 5–6
Selex, 12, 70 Self-edge label (SEL), 55–56 Self-service grocery store, 9 Sense checking, of sales forecasting,
174–175 Sense of guilt, 200 Share of assortment, 58 Share of feature, 59 Share of space, 58 Shelf compliance, 59 Shelf height, 58–59 Shelf ready packaging (SRP), 164 Shopper conversion chain, 90 Shopper marketing, 89–97 Shopping
bulk, 91 daily, 91 demographics of, 94 dynamics of, 94–95 for immediate consumption, 90 mechanics of, 93–94 moments of truth, 96 patterns of, 95 self-indulgency, 92 for special occasion, 91–92
for special offers, 91 trips
plurality of, 92 typology of, 90, 91
Sigma, 70 Sisa, 70 SOK, 12 Space productivity, 20 Spar, 12 Specialist retail outlets, 4 Speed to shelf, 57 Stock-keeping unit on-shelf availability
(SKU OSA), 54–55, 56 Store audit, 76 Store format, 15 Strategic themes, 39–43 Strategic thrusts, 39 Sun, 70 Superette, 3 Supermarkets, 3 Superstores, 3 Superunie, 12 Survival anxiety, 200 System Applications and Products in
Data Processing (SAP) advanced planning and
optimization (APO) tool, 189 Système U, 12, 70, 210 Target customer, 15, 21 Tesco, 10, 194, 208 Total delivered cost (TDC), 159–160 Total productive maintenance
(TPM), 164 Toyota Production System, 64 Trade accounts
direct, 9–10 hybrid, 11–12 indirect, 10–11 national/regional, front office as
interface of, 75 pre-evaluation model, 23–26 and route to market, 8–13 strategies and economics, 13–23
INDEX 227
Trade category plans (TCPs), 131–138 action plan, 136–137 category role, 135 definition and structure, 133 execution guidelines, 137–138 financials, 138 market key facts, 133–134 strategy and objectives, 136 turnover phasing, 138 vision and value drivers, 135–136
Trade marketing, 78–81, 105–108 Trade profitability, 16–20 Trade terms plan, 127–130 Traditional grocery distribution, 4 Transformational change with
positive results, leading, 201–203
Triple net model, 16–19 Turnover phasing
customer business plans, 131 trade category plans, 138
Unilever, 96 acquisitions, 192
Value added tax (VAT), 16 Values, 13 Variable pay, 116–117 Vegé, 70 Vendor managed inventory (VMI),
129, 162, 163 VI. S. T. A., 13–14, 38, 45 Walmart, 194 Wholesalers, 11 Working capital, 23

OTHER TITLES IN OUR SELLING AND SALES FORCE MANAGEMENT COLLECTION
Buddy LaForge, University of Louisville and Thomas Ingram,
Colorado State University, Collection Editors
• Sales Technology: Making the Most of Your Investment by Nikolaos Panagopoulos
• Effective Sales Force Automation and Customer Relationship Management: A Focus on
Selection and Implementation by Raj Agnihotri and Adam Rapp
• Competitive Intelligence and the Sales Force: How to Gain Market Leadership Through
Competitive Intelligence by Joël Le Bon
Announcing the Business Expert Press Digital LibraryConcise e-books business students need for classroom and research
This book can also be purchased in an e-book collection by your library as
• a one-time purchase,
• that is owned forever,
• allows for simultaneous readers,
• has no restrictions on printing, and
• can be downloaded as PDFs from within the library community.
Our digital library collections are a great solution to beat the rising cost of textbooks. E-books
can be loaded into their course management systems or onto student’s e-book readers.
The Business Expert Press digital libraries are very affordable, with no obligation to buy in future
years. For more information, please visit www.businessexpertpress.com/librarians. To set up a
trial in the United States, please contact [email protected]
• Lean Applications in Sales: How a Sales Manager Applied Lean Tools to Sales Processess
and Exceeded His Goals by Jaideep M otwani and Rob Ptacek
• Improving Sales and Marketing Collaboration: A Step-by-Step Guide
by Avinash
alshe M • Creating Effective Sales and Marketing Relationships by
• ey Account Management: Strategies to Leverage Information , Technology, and KRelationships to Deliver V alue to Large Customers by Joël Le Bon
and Wim Biemans
Kenneth Le Meunier-FitzHugh
and Leslie Caroline Le Meunier-FitzHugh
and Carl Herman

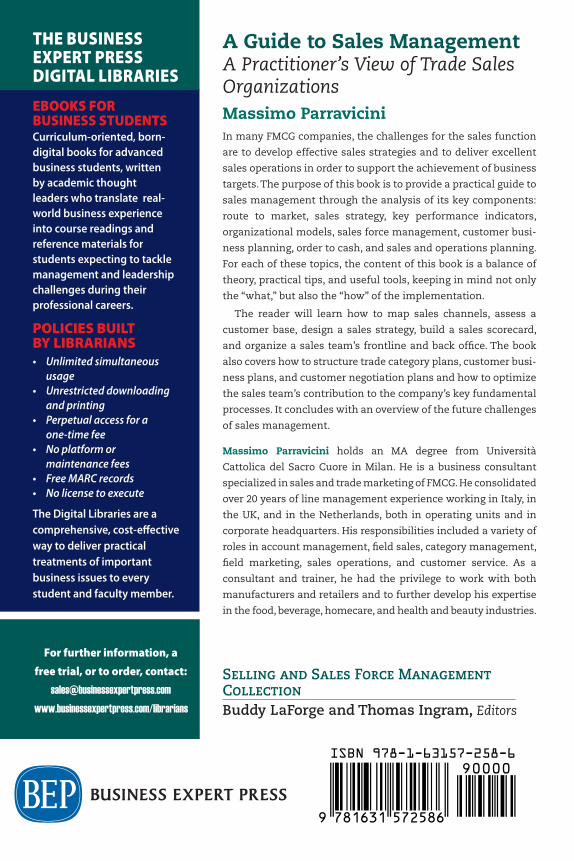
A Guide to Sales ManagementA Practitioner’s View of Trade Sales Organizations
Massimo Parravicini
Selling and Sales Force Management CollectionBuddy LaForge and Thomas Ingram, Editors
A Guide to Sales ManagementA Practitioner’s View of Trade Sales OrganizationsMassimo ParraviciniIn many FMCG companies, the challenges for the sales function
are to develop effective sales strategies and to deliver excellent
sales operations in order to support the achievement of business
targets. The purpose of this book is to provide a practical guide to
sales management through the analysis of its key components:
route to market, sales strategy, key performance indicators,
organizational models, sales force management, customer busi-
ness planning, order to cash, and sales and operations planning.
For each of these topics, the content of this book is a balance of
theory, practical tips, and useful tools, keeping in mind not only
the “what,” but also the “how” of the implementation.
The reader will learn how to map sales channels, assess a
customer base, design a sales strategy, build a sales scorecard,
and organize a sales team’s frontline and back offi ce. The book
also covers how to structure trade category plans, customer busi-
ness plans, and customer negotiation plans and how to optimize
the sales team’s contribution to the company’s key fundamental
processes. It concludes with an overview of the future challenges
of sales management.
Massimo Parravicini holds an MA degree from Università
Cattolica del Sacro Cuore in Milan. He is a business consultant
specialized in sales and trade marketing of FMCG. He consolidated
over 20 years of line management experience working in Italy, in
the UK, and in the Netherlands, both in operating units and in
corporate headquarters. His responsibilities included a variety of
roles in account management, fi eld sales, category management,
fi eld marketing, sales operations, and customer service. As a
consultant and trainer, he had the privilege to work with both
manufacturers and retailers and to further develop his expertise
in the food, beverage, homecare, and health and beauty industries.
A G
UID
E TO SA
LES MA
NA
GEM
ENT
PAR
RA
VIC
INI
Selling and Sales Force Management CollectionBuddy LaForge and Thomas Ingram, Editors
THE BUSINESS EXPERT PRESSDIGITAL LIBRARIES
EBOOKS FOR BUSINESS STUDENTSCurriculum-oriented, born-digital books for advanced business students, written by academic thought leaders who translate real-world business experience into course readings and reference materials for students expecting to tackle management and leadership challenges during their professional careers.
POLICIES BUILT BY LIBRARIANS• Unlimited simultaneous
usage• Unrestricted downloading
and printing• Perpetual access for a
one-time fee• No platform or
maintenance fees• Free MARC records• No license to execute
The Digital Libraries are a comprehensive, cost-eff ective way to deliver practical treatments of important business issues to every student and faculty member.
For further information, a free trial, or to order, contact: