Embed Size (px)
Citation preview

NASA Contractor Report 198464UM-MEAM-91-08
A Fundamental Study of NucleatePool Boiling Under Microgravity
Jamie S. Ervin and Herman Merte, Jr.
The University of Michigan
Ann Arbor, Michigan
March 1996
Prepared forLewis Research Center
Under Grant NAG3-663
National Aeronautics and
Space Administration

Final Report
A FUNDAMENTAL STUDY OFNUCLEATE POOL BOILING
UNDER MICROGRAVITY
by
Jamie S. Ervin
Herman Merte, Jr.
NASA Grant NAG3-663
Report No. UM-MEAM-91-08
Conducted under:
National Aeronautics and Space AdministrationLewis Research Center
Cleveland, Ohio
Grant NAG3-663

ABSTRACT
A FUNDAMENTAL STUDYOFNUCLEATEPOOL
BOILENGUNDERMICROGRAVITY
byJamieErvin
HermanMerte,Jr.
An experimentalstudyof incipientboiling in short-termmicrogravityandwith a/g
= + 1 for pool boiling was performed. Calibrated thin gold films sputtered on a smoothly
polished quartz surface were used simultaneously for thermal-resistance measurements and
heating of the boiling surface. The gold films were used for both transient and quasi-
steady heating surface temperature measurements. Two test vessels were constructed for
precise measurement and control of fluid temperature and pressure: a laboratory pool
boiling vessel for the a/g = + 1 experiments and a pool boiling vessel designed for the 131
m free-fall in the NASA Lewis Research Center Microgravity Research Facility for the
microgravity tests. Measurements included the heater surface temperature, the pressure
near the heating surface, the bulk liquid temperatures. High speed photography (up to
1,000 frames per second) was used in the experiments.
With high quality micro_avity and the measured initial temperature of the quiescent
test fluid, Rl13, the temperature distribution in the liquid at the moment of boiling
inception resulting from an imposed step in heat flux is known with a certainty not possible
previously. The types of boiling propagation across the large flat heating surface, some
observed here for the first time, are categorized; the conditions necessary for their
occurrence are described. Explosive boiling propagation with a striking pattern of small
scale protuberances over the entire vapor mass periphery not observed previously at low
heat flux levels (on the order of 5 W/cm 2) is described.
For the heater surface with a/g = -1, a step in the heater surface temperature of
short duration was imposed. The resulting liquid temperature distribution at the moment of
boiling inception was different from that obtained with a step in heat flux.
This report constitutes a major part of a dissertation submitted by the first author in
partial fulfillment of the requirements for the degree of Doctor of Philosophy in the
University of Michigan, 1991.
iii
TABLE OFCONTENTS
ABSTRACT ......................................... iii
LIST OFFIGURES.............................................. vii
LIST OFTABLES .............................................. xvi
LIST OF APPENDICES.......................................... xvii
NOMENCLATURE ............................................. xviii
CHAPTER
1 INTRODUCTION .......................................... 1
2 LITERATURE SURVEY .................................... 4
2.1 HomogeneousNucleation................................. 52.2 HeterogeneousNucleationandIncipientBoiling ................ 10
2.2.1 SurfaceMicrogeometry.............................. 132.2.2 SurfaceEnergy.................................... 152.2.3Liquid TemperatureDistribution ....................... 192.2.4 ExternallyForcedLiquid Motion ....................... 282.2.5 BuoyancyInducedLiquid Motion ...................... 30
2.3 Relationshipto ProposedResearch.......................... 31
3 EXPERIMENTAL APPARATUS .............................. 40
3.1 CommonExperimentalElements........................... 40
3.1.1 HeatTransferTestSurfaces........................... 413.1.2 HeaterSurfacePowerControllers...................... 433.1.3 TestFluid ........................................ 463.1.4 DataAcquisition Systems............................. 473.1.5 Thermocouples..................................... 493.1.6 Optics ............................................ 50
iv
3.1.7 Pressure Control System ..............................
3.1.8 Camera Synchronization .............................
3.1.9 Vessel Power Supply ................................
3.2 Laboratory Pool Boiling Vessel .............................
3.3 Drop Vessel ............................................
4 EXPERIMENTAL PROCEDURE ..............................
4.1 Common Procedures .....................................
4.2 Laboratory Pool Boiling Vessel .............................
4.2.1 Transient Heating Measurements .......................
4.2.1.1 Imposed Constant Heat Flux ....................
4.2.1.2 Imposed Constant Surface Temperature ............
4.2.2 Quasi-Steady Heating ................................
4.3 Drop Vessel ...........................................
4.4 Data Reduction .........................................
4.4.1 Spatial Mean Film Heater Surface Temperature ............
4.4.2 Metal Heater Spatial Mean Surface Temperature ...........
4.4.3 Bulk Liquid Temperature .............................
4.4.4 System Pressure ....................................
4.4.5 Heat Flux .........................................
5 EXPERIMENT,_L RESULTS .................................
5.1 Transient Boiling ........................................
5.1.1 Pool Boiling-Imposed Constant Heat Flux ................
5.1.1.1
5.1.1.2
5.1.1.3
5.1.1.4
5.1.1.5
Transient Heater Surface Temperature .............
Transient Liquid Temperature ...................
Transient Pressure Measurements ................
Transient Heat Flux Measurements ...............
Heater Surface Superheat at Boiling Inception .......
51
53
55
55
56
75
75
77
78
78
79
80
81
85
85
86
86
87
87
92
92
93
93
100
100
102
102
5.1.1.6 Incipient Boiling andBoiling Propagation..........
5.1.2 ImposedHeaterSurfaceTemperature....................
5.1.2.1Comparisonof MeasurementsandConductionPrediction...................................
5.2Quasi-SteadyHeating....................................
6 DISCUSSIONAND CONCLUSIONS..........................
6.1 ComputedSuperheatTemperatureDistributionsatBoilingInceptionImposedqr". ...................................
6.2 ComputedSuperheatTemperatureDistributionsatBoilingInception: ImposedTw...................................
6.3 Comparisonsof ComputedTemperatureDistributions: ImposedqT"andTw.............................................
6.4 Estimationof Changein InternalEnergy......................6.5 BubbleShapeatOnsetof RapidUnstableSpreadingin
Microgravity ...........................................6.6 ExplosiveBoiling Spreadin Microgravity .....................6.7 EmpiricalHeterogeneousNucleationFactor...................6.8 Conclusions............................................6.9 Recommendationsfor FutureStudy..........................
APPENDICES..................................................
BIBLIOGRAPHY ...............................................
107
115
115
118
183
183
186
189192
196198202206207
231
275
vi
LIST OFFIGURES
2.1
2.2a
2.2b
2.2c
2.2d
3.1
3.4
3.5
3.8
Gasbubbleat a solid-liquid boundary...........................
Pre-existingvapornucleusprotrudingfrom a cavity ................
Initial liquid temperaturedistribution ...........................
Liquid temperaturedistribution after heating,but below theequilibriumbubbletemperature,equation2.28 .............................
Liquid temperaturedistribution tangentto the equilibrium bubble tem-perature,andnucleusnow beginsto grow ........................
Influenceof convectiononmeanliquid temperaturedistributions......
Transientsurfacetemperaturefor gold film heaterin Rl13, horizontalup in a/g= 1andmicrogravity ................................
Thegoldfilm heatingsurfacefor transientandquasi-steadyexperiments..............................................
Copperblock heaterfor quasi-steadytests.......................
Conceptof imposedheatflux andimposedheatersurfacetemperature..
Seriesof stepsin q"Tasanapproximationof theanalyticalq"T for a stepincreasein surfacetemperature................................
Schematicof switchesandresistorsfor imposedheatersurfacetemperature........................................
Schematicof R113degassingunit .............................
Schematicof thevoltagemeasurementcircuit in thedeterminationof thegoldfilm temperature.................................
Schematicof thedropvesselcalibrationandpowercircuit ...........
35
36
36
36
36
37
38
59
6O
61
62
64
65
66
67
vii
3.9
3.10
3.11
3.12
3.13
3.14
3.15
4.1
5.1
5.2
5.3
5.4
5.5
5.6
5.7
Schematicof theoptical systemfor orthogonalviews in the laboratorypool boiling vesselandthedrop vessel.......................... 68
Schematicof thepressurecontrol system........................ 69
Drop vesselpneumaticdiagram............................... 70
Laboratorypoolboiling vessel................................ 71
Laboratorypool boiling vesseltemperaturecontrol system........... 72
Drop vessel............................................... 73
Drop vesseltemperaturecontrol system ......................... 74
Sequenceof eventsduring a free fall microgravity test in the NASALewis RC drop tower ....................................... 91
Gold film temperaturerise for one fourth of thefilm surfacefor q"T= 8W/cm2at onesecond(Ax=Ay=Az=0.79375mm) ................... 122
Thin gold film temperaturewith onsetof naturalconvection,a/g= +1.. 123
Predictedandmeasuredtime for theonsetof naturalconvection...... 124
Thin gold film temperaturewith onsetof naturalconvection,alg = -1.. 125
Thin gold film temperaturewith heatersurfacedryout,a/g= 10.5 ...... 126
Departure of measured surface temperature from the 1D semi-infinite
media prediction ........................................... 127
Effect of subcooling on the thin film surface temperature with a/g = +1. 128
viii
5.8
5.9
5.10
5.11
5.12
5.13
5.14
5.15
5.16
5.17
5.18
5.19
5.20a
5.20b
5.20c
5.20d
Effect of uncertaintyin thermocouplelocationon computedliquid tem-peraturewith measuredthermocoupletemperature.................
Representativepressuretransducermeasurementsfrom the laboratorypool boiling vessel.........................................
Representativepressuretransducermeasurementsfrom the drop vesselata/g --- 10-5 and a/g = + 1 ...................................
Representative measurements of the constant imposed total heat flux
from the laboratory and drop vessels ............................
Heater surface superheat at incxpient boiling with constant imposed heat
flux, surface Q-1 ...........................................
Heater surface superheat at incipient boiling with constant imposed heat
flux, surface Q-2 ...........................................
Heater surface superheat at incipient boiling with constant imposed heat
flux, surface Q-5 ...........................................
Heater surface superheat at incipient boiling with constant imposed heat
flux, surface Q-6 ...........................................
Incipient boiling delay time with constant imposed heat flux,
surface Q- 1...............................................
Incipient boiling delay time with constant imposed heat flux,
surface Q-2 ...............................................
Incipient boiling delay time with constant imposed heat flux,
surface Q-5 ...............................................
Incipient boiling delay time with constant imposed heat flux,
surface Q-6 ...............................................
Category A: appearance of the initial vapor bubble, time = 0.894 sec..
Category A: vapor bubbles immediately after the boiling propagation
has begun, time = 0.934 sec ..................................
Category A: convection cells with propagating vapor, time = 1.126 sec.
Category A: vapor propagating outward, time = 1.306 sec ...........
129
130
131
132
133
134
135
136
137
138
139
140
141
142
143
144
ix

5.20e
5.21a
5.21b
5.21c
5.21d
5.22a
5.22b
5.22c
5.22d
5.23a
5.23b
5.23c
5.23d
5.24a
5.24b
Category A: vapor covering nearly the entire heating surface. Large
bubbles visible from coalescing of smaller ones, time = 1.498 sec ..... 145
Category B: appearance of the initial vapor bubble with convection
cells, time = 0.237 sec ....................................... 146
Category B: boiling propagation with large bubble at the center of thin
vapor layer, time = 0.249 sec ................................. 147
Category B: the thin vapor layer has advanced outwardly radially, time= 0.257 sec 148
"''*'**'O'O°''I''O'O6.O.OO,.*...SI.., I....,....
Category B: heater surface is nearly covered by vapor mass and the
large bubble departs upward from the surface, time = 0.289 sec ....... 149
Category C: initial bubble with "smooth" interface growing with an-
other smaller bubble located at the site of origin of the initial bubble,
time = 0.335 sec ........................................... 150
Category C: the two bubbles growing and moving from their site of
origin, time = 0.419 sec ..................................... 151
Category C: the two bubbles have coalesced into one, time = 0.505 sec. 152
Category C: the single vapor bubble with a "wavy" interface remains at
the heated surface, time - 1.151 sec ............................ 153
Category D: the single bubble has ruptured at the periphery of the bub-
ble base and boiling propagation has started, time = 10.214 sec ....... 154
Category D: large-scale satellite interface bubbles with the vapor
pushed downward away from the heating surface, time = 10.226 sec... 155
Category D: the heater surface is nearly covered by vapor,
time = 10.238 see .......................................... 156
Category D: the single bubble remains at the heated surface with bub-
bles on parts of the larger bubble interface, time = 10.270 sec ........ 157
Category D: rupturing of the bubble interface is beginning,
time = 28.890 see .......................................... 158
Category D: vapor moves outward from bubble interface disturbance,
time = 28.894 sec .......................................... 159
5.24c
5.24d
5.25a
5.25b
5.25c
5.25d
5.25e
5.25f
5.25g
5.26a
5.26b
5.26c
5.26d
5.26e
5.27
CategoryD: smallerbubblesareon theoutwardlymoving vapormass,time= 28.910sec.......................................... 160
CategoryD: thevapor masswith interfacebubbleshasnearlycoveredtheheatersurface,time= 28.946sec........................... 161
CategoryE: thevapormasscoversnearly theentireheatersurface,time = 1.130sec........................................... 162
CategoryE: boiling at five different locations,time = 4.813sec...... 163
CategoryE: thevapormasscoversnearly theentireheatersurface,time= 4.818sec........................................... 164
CategoryE: the small scaleprotuberancesare more distinguishable,time= 4.820sec........................................... 165
CategoryE: the vapor masswith small scale interface disturbancesengulfsverticalthermocouplewires, time = 4.823sec.............. 166
CategoryE: largescaleprotuberancesarevisible, time = 4.828sec.... 167
CategoryE: liquid bulk momentumlifts thevapormassoff theheatingsurface,time = 4.973 sec.................................... 168
CategoryF: theinititial bubbleat theedgeof theheatersurface,time= 0.513sec........................................... 169
CategoryF: the initial bubblemovestoward the heatersurfacecenterwith two additonalbubblesformedat the initial boiling site,time= 0.628sec........................................... 170
CategoryF: more bubblesgrow from both sitesand move toward theheatersurfacecenter,time = 0.718sec.......................... 171
CategoryF: additonalbubblesfrom thetwo boiling sites,time = 0.920sec........................................... 172
CategoryF: onelarge vapor masscoversthe heatersurfaceand somevaporhasseparatedfrom this vapormassto form individual bubblesintheR113,time = 3.608sec................................... 173
Demonstration of transient thin gold film temperature measured with the
Codas and the CR7X systems ................................. 175
xi
5.28
5.29
5.30
5.31
5.32
5.33
Comparisonof predicted and measured step rise in surface temperature
for various levels of power input ............................... 176
Measured incipient boiling delay times with step change in surface
temperature ............................................... 177
Measured incipient boiling delay times and the corresponding surface
superheat temperature at boiling inception ....................... 178
Quasi-steady heating prior to incipient boiling for surface Q-2 with
horizontal up orientation ..................................... 179
Quasi-steady heating prior to incipient boiling for surface SH-2 with
horizontal up orientation ..................................... 180
Quasi-steady heating prior to incipient boiling for surface SH-2 withhorizontal down orientation .................................. 181
xii
5.34 Naturalconvectionheattransferresults.......................... 182
6.1 Computedliquid superheatm rmcrogravxtyfrom _mposedheat flux atboiling mcepnon,saturationconditions(surfaceQ-5) ............... 209
6.2 Computedliquid superheatm mmrogravlty from _mposedheat flux atboiling mcepnon,saturationconditions(surfaceQ-6) ............... 210
6.3 Computedliquid superheatm mxcrograwtyfrom _mposedheat flux atboiling mcepnon,2.8°Csubcooling(surfaceQ-5) ................. 211
6.4 Computedliquid superheatm rmcrograwty from _mposedheat flux atboiling mcepuon,2.8°Csubcooling(surfaceQ-6) ................. 212
6.5 Computedliquid superheatxnmmrogravxtyfrom imposedheat flux atboiling mceptmn,11.1oCsubcooling(surfaceQ-5) ................ 213
6.6 Computedliquid superheatm mxcrograwtyfrom xmposedheat flux atboiling mcepnon,11.1oC subcooling(surfaceQ-6) ................ 214
6.7 Theconceptsof superheatedthermalboundarylayerandthermalbound-ary layer ................................................. 215
6.8 Computedliquid superheatfrom imposedsurfacetemperatureat boilinginception,saturationconditions(surfaceQ-14) .................... 216
6.9 Computedliquid superheatfrom imposedsurfacetemperatureat boilinginception, 2.3°C subcooling(surfaceQ-14) ..................... 217
6.10 Computedliquid superheatfrom imposedsurfacetemperatureat boilinginception, 11.0°C subcooling(surfaceQ-14) .................... 218
6.11 Comparisonof computedimposedconstantheatflux and constantsur-face temperatureliquid temperaturedistributions,saturationconditions(surfaceQ-14) ............................................ 219
6.12 Comparisonof computedimposedconstantheatflux and constantsur-face temperatureliquid temperaturedistributions, 2.3 °C subcooling(surfaceQ-14) ............................................ 220
6.13 Comparisonof computedimposedconstantheatflux and constantsur-face temperatureliquid temperaturedistributions, 11.0 °C subcooling(surfaceQ-14) ............................................ 221
xiii
6.14
6.15
6.16
6.17
6.18
6.19
6.20
B.1
B.2
B.3
B.4
B.5
C.1
E.1
E.2
E.3
E.4
E.5
E.6
Comparisonof computed imposed constant heat flux and constant sur-
face temperature liquid temperature distributions, saturation conditions
(surface Q-6) ............................................. 222
Comparison of computed imposed constant heat flux and constant sur-
face temperature liquid temperature distributions, 2.8 °C subcooling(surface Q-6) ............................................. 223
Small bubble neglecting the liquid temperature distribution immediatelyprior to boiling propagation .................................. 226
Bubble shape at the onset of categories D and E in microgravity ...... 227
Comparison of measured bubble growth from test PBMT1101.600 with
the Rayleigh solution and thermal diffusion solution ................ 228
Definition of effective bubble radius ............................ 229
Empirical heterogeneous nucleation factor for three different pressures. 230
The copper fixture for gold film calibration ...................... 244
The voltage measurement circuit for gold film calibration ........... 245
Surface Q-2 gold film heater calibration ......................... 246
Schematic for pressure transducer calibration ..................... 247
Calibration for Heise pressure transducer-laboratory pool boiling vessel. 248
Comparison of the CR7X and the Sanborn dynamic voltage
measurement .............................................. 251
Main heater controller ....................................... 260
Heater controller ........................................... 261
Heater surface power controller for imposed step in temperature ...... 262
Pressure controller: part one .................................. 263
Pressure controller: part two .................................. 264
Pressure controller: part three ................................. 265
xiv
E.7
E.8
E.9
E.10
F.1
Drop vesselexternalheaterpowercontroller:part one.............. 266
Drop vesselexternalheaterpowercontroller:part two .............. 267
Drop vesselexternalheaterpowercontroller:part three............. 268
Drop vesselexternalheaterpowercontroller:part four .............. 269
Onedimensionalconductionto two connectingsemi-infinite mediawithenergygenerationat thecommonplane......................... 272
XV
LIST OF TABLES
Table
2.1
3.1
5.1
6.1
6.2
Transient experimental incipient boiling data ..................... 39
Power Schedule for Imposed Surface Temperature ................. 63
Summary of independent variables and resulting
measurements associated with observed incipient boiling
categories, pool boiling ..................................... 174
Comparison of surface temperature gradients between imposed heat flux
and imposed surface temperature tests for surface Q-14 ............. 224
Boiling propagation and estimates of change in internal energy
for 5" ................................................... 225
×vi
LIST OFAPPENDICES
Appendix
A. Data Tabulation ...........................................
A. 1 Constant Heat Flux: Pool Boiling ........................
A.2 Constant Heat Flux and Constant Surface Temperture:
Pool Boiling .........................................
B. Calibration ...............................................
B.1 Gold Film Heater Surface ...............................
B.2 Thermocouples .......................................
B.3 Pressure Transducers ..................................
C. CR7X and Codas Data Acquisition Systems ......................
Do Uncertainty Analysis ........................................
D. 1 Gold Film Temperature ................................
D.2 Thermocouple Temperature .............................
D.3 System Pressure ......................................
D.4 Total Heat Flux ......................................
E° Electronic Circuitry .......................................
E.1 Power Supply for Step in Heat Flux and Quasi-Steady Heating..
E.2 Power Supply for Step in Heater Surface Temperature .........
E.3 Pressure Controller ...................................
E.4 Drop Vessel Temperature Controller ......................
F° Analysis of Imposed Step in Temperature ........................
G. Analysis of Imposed Step in Heat Flux ..........................
H. Three Dimensional Conduction Numerical Analysis ................
232
232
239
241
241
242
242
249
252
252
254
255
255
257
257
257
258
258
270
273
274
xvii
NOMENCLATURE
A
a
B
b
Cp
C
Cl
F
G
Gr
gh
J
k
L
n
N
Nu
P
q"
R
r
Ra
Re
Ri
AT_
ATe,
T
t
U
Pre-exponential multiplier for equilibrium size distribution;Area
Acceleration
Empirical constant, equation 2.18
Bubble height
Specific heat
Empirical constant, equation 2.25
Empirical constant, equations 2.30 and 2.31
Heterogeneous nucleation factor
Gibbs free energy
Grashof number
Standard earth gravitational acceleration
Planck constant;
Enthalpy;
Convective heat transfer coefficient
Nucleation rate
Thermal conductivity;Boltzmann constant
Characteristic dimension
Molecular concentration
Number of spherical embryos of radius rNusselt number
Pressure
Heat flux
Distance defined in figure 2.1;
Resistance;
Bubble surface radius
Distance defined in figure 2.1
Raleigh number
Reynolds number
Richardson number
T w-T i
Tw-T,
TemperatureTime
Mean velocity
[3gL3AT/v 2
hL/k
_gL3AT/v2ct
uL/v
Gr/Re 2
m 2
m2/s
m
J/kg °C
m2/s
Js
kJ/kgW/m 2 oC
I/cm 3 s
W/moC
j/oK
m
kPa
W/cm 2
m
Ohms
m
m
oC
°C
o C
S
m/s
XVIII
V
X
Z
b
C
crit
fghet
horn
1
m_.x
rnin
n
nc
o
qtzS
sh
sup
sprT
v
w
8
8"
0
P
(_
V
Volume
Distance from heater surface
Distance defined in Figure 2.1
Superscripts
Boiling inception
Subscripts
Distance from heating surface to top of bubble nucleus
Cavity; Critical point propertyCritical
Liquid-to-vapor phase change
Heterogeneous nucleation
Homogeneous nucleationInitial
Liquid
Maximum
Minimum
Nucleus
Natural convection
Incipient boiling
Quartz
Saturation; Solid
Shunt
Superheated
Boiling propagationTotal
Vapor
Heater surface
Greek
Thermal diffusivity k/p%
Thermal boundary layer thickness
Superheated thermal boundary layer thickness
Temperature difference
Density
Surface tension
Defined in Equation 2.8
Kinematic viscosity IMp
Coefficient of volume expansion
m 3
m
m
m2/s
m
m
oC
kg/m 3
N/m
m2/s
lloC
xix

CHAPTER 1
INTRODUCTION
The design of power generation systems and the extra-terrestrial storage of
cryogenic fuels in microgravity for the U.S. space program require a knowledge of
boiling and nucleation of the vapor phase. Boiling in microgravity is fundamentally
different from boiling in earth gravity: the buoyancy force which induces liquid azxl
vapor motion in boiling with earth gravity is effectively eliminated in microgravity.
The study of boiling in microgavity can give some basic insight into the boiling
process in the earth and space environment.
Because of the sometimes imprecise use of terms in connection with boiling
research, it is desirable to clearly define a number of terms to be used here. The
following discussion is for a pure substance, one that has a homogeneous and
invariable chemical composition throughout.
Nucleation, pertinent to any discussion of boiling, is the formation of an
interface between an initial parent phase and a second phase. Nucleation is classified
as either homogeneous or heterogeneous. Homogeneous nucleation refers to
nucleation taking place within a pure liquid bulk in the absence of any foreign
particles or pre-existing phases at a uniform temperature as a result of local random
density fluctuations. These density fluctuations can result in agglomerations of a
sufficient number of molecules to form a nucleus of critical size such that subsequent
gowth can occur. (The thermodynamic requirements for this critical size will be
given in Chapter Two.) Heterogeneous nucleation occurs at the interface between the
2
fluid and other materials, usually solid. The conditions necessary for heterogeneous
nucleation to occur are not well understood, and may be quite different for disparate
interfaces, such as smooth rigid surfaces (glasses for example), liquid-liquid interfaces,
and non-smooth solid surfaces (crystalline metallic surfaces for example).
The terms incipient boiling, initiation of boiling, and onset of boiling all refer
to the appearance of the first observable vapor bubble. Incipient boiling can result
from either homogeneous or heterogeneous nucleation. The flu'st observable bubble
may be the consequence of growth from either a pre-existing nucleus or a newly
formed nucleus.
Nucleation and boiling of liquids generally takes place by heating the liquid at
a solid boundary, so that the liquid does not have a uniform superheat as under the
circumstances of a pressure decrease. The heating of a liquid to a critical superheated
state from a solid boundary until the onset of boiling occurs may be performed in a
transient or a quasi-steady manner. Transient heating is inherently unsteady, while
quasi-steady heating to the onset of boiling results from the application of a series of
incremental steps in heat flux to a system where a steady temperature distribution is
obtained following each of these steps until nucleation occurs. For example, a heated
flat surface facing upward in a liquid pool in standard gravity results in natural
convection, which permits a series of steady-state increments in heat flux before
boiling flu'st occurs. A quasi-steady heating process is not possible in the true absence
of gravity, and may or may not be possible in microgravity, depending on the imposed
heat flux level.
This is a study of incipient boiling in which body forces of a/g = _+ 1 and
microgravity are used as a means of varying the temperature distribution in the liquid
at the time of nucleation with all other parameters held constant. The liquid
temperature distribution in microgravity, since buoyancy induced liquid motion is
drastically reduced, is well defined relative to the liquid temperature distribution in a/g
= + 1. The conditions in microgravity existing at the moment of boiling inception will
be compared with those at standard earth gravity. This study is limited to short term
microgravity conditions, because of the practical limitations of achieving long term
microgravity at the present time.
Incipient pool boiling was investigated in an attempt to assess the influence of
liquid velocity under circumstances where buoyancy is anticipated to play a role.
Short duration microgravity was available only for the pool boiling experiments. An
imposed constant heat flux, constant surface temperature, and quasi-steady heating
constitute the three different boundary disturbances
experiments.
The principal objectives of this work are:
(1)
(2)
(3)
used in the pool boiling
To determine if known temperature distributions at the onset of boiling
can be used to characterize the incipient boiling process.
To examine how the onset of boiling is influenced by the method of
heating using an imposed heat flux, an imposed surface temperature,
and a quasi-steady heating procedure.
To explore the features of observed phase change dynamics, and to
characterize the parameters which produce particular types of vapor
motion.
CHAPTER2
LITERATURE SURVEY
Homogeneousnucleation in a pure liquid phase is unlikely in normal
engineeringapplicationsbecauseheterogeneousnucleationusually takesplacebefore
the large superheatsnecessaryfor homogeneousnucleationareattained. A metallic
heatingsurface,for example,hasnumerouspits whichnot only serveasreservoirsfor
trappedgases,but alsoexposemoregrainboundaryarea(gain boundariesarereNons
of higherenergy)to the liquid thanwouldotherwisebeavailableif therewereno pits
present.
For nucleationof a heatedliquid to be homogeneous,the probability for the
agglomerationof sufficiently energeticmoleculesto form a nucleusof critical sizein
the interior of the liquid must be greaterthan the probability for agglomerationof
energeticmoleculesat its surface. A necessaryconditionfor this to occur is that the
heatedliquid not bein contactwith anyvapor phase. According to Blander and Katz
(1975), another condition which is sufficient but not necessary for homogeneous
nucleation is that the liquid wet any other phase with which it is in contact. Jarvis et al
(1975) have shown that if a liquid has a zero contact angle with any body that it
contacts, then a bubble in the interior of the liquid is more stable than a similar size
bubble at the interface. Hence, homogeneous nucleation is more likely to take place
than heterogeneous nucleation. These conditions are met when the liquid is
completely enclosed by a smooth surface. Examples are glass or another liquid which
is non-volatile, as discussed in Blander ,and Katz (1975).
Homogeneousnucleationtheoryandits extensionto heterogeneousnucleation
is basicto any understandingof incipient boiling. A brief review of homogeneous
nucleationtheory will be presentedf'n'st,followed by a discussionof heterogeneous
nucleation.
2.1 Homogeneous Nucleation
Homogeneous nucleation may be considered from two perspectives. The first
is the classical theory, attributed to Gibbs (1928), Volmer (1945), and Becker and
Doring (1935), and refined by Frenkel (1955), and Zeldovich (1942). The second is
the statistical mechanical point of view, associated with Reiss (1952a) (1952b), Mayer
and Harrison (1938), Lothe and Pound (1966), and Abraham (1974), and others. The
motivation behind the development "-_ the latter perspective is that the assumption of
the applicability of macroscopic thermodynamic properties to a small vapor bubble
(which may be on the order of 25 molecules) was not deemed appropriate. However,
it is difficult to obtain numerical results with the statistical approach and to relate these
to experimentally measurable variables. As a way to circumvent these problems, some
workers have combined concepts from both macroscopic and microscopic
thermodynamics, bringing statistical thermodynamics into the classical expressions in
the form of a correction factor, as in Lothe and Pound (1962). However, disagreement
exists over the validity of this type of correction factor, as discussed in Reiss (1952),
Lothe and Pound (1966), Reiss (1970), Reiss and Katz (1967), and Lothe and Pound
(1968). The classical theory has been used successfully in predicting homogeneous
nucleation temperatures for many fluids, as in Skripov (1974), Springer (1978), and
Kotake and Glass (1981). Only the classical theory will be presented in the present
work, as it provides insight into the basic physics of homogeneous nucleation.
Homogeneousnucleationof the vapor phasein the absenceof solid surfaces,
impurities, or ionizing radiation occurswithin the bulk of the liquid as a result of
molecular fluctuations in an isothermal system. These fluctuations give rise to a
populationof vaporembryosor agglomerationsof moleculeswhich maybe described
by aBoltzmann-likedistributionof sizes,asdiscussedin Frenkel(1955):
f-AG(r)IN(r) = A exp (2.1)
N is the number of spherical embryos of radius r. AG is the change in the Gibbs free
energy of an isolated isothermal system associated with the formation of a spherical
vapor nucleus in the metastable superheated liquid. For the assumption of a spherical
vapor nucleus in a liquid of uniform temperature, the Laplace equation provides the
equilibrium pressure difference across a curved interface arising from the effect of
surface tension:
2cy
P_" P, = "7- (2.2)
With equation 2.2, an expression for AG can be derived:
AG=r" 2 4no [ [_,] 2-3[ _g] 3](2.3)
The f'nst term on the RI--IS of equation 2.3 represents the surface energy contribution
related to the formation of a spherical vapor liquid interface. The second term on the
RHS of equation 2.3 is associated with the formation of a volume of the vapor phase.
r* is the critical size of the embryo, above which spontaneous growth of the
7
agglomerationoccurs. Belowr*, however,theembryocollapses.Thesurfacetension
is assumedto be a function of T only, which may be valid for agglomerationsof
sufficient size,asexplainedin Springer(1978). For phasetransitions,the Gibbsfree
energyof thesystemis a minimum for stableequilibrium,while it is a maximumfor
metastableequilibrium sincetheGibbs free energyof the systemdecreasesfor either
an increaseor a decreasein the sizeof an embryo of critical size,as discussedin
Kottowski (1973). The secondderivativeof equation2.3 evaluatedat r* is negative,
demonstratingthata superheatedliquid is in a metastablestate. An embryoof critical
sizecorrespondsto a maximumAG, or AG* below. Hence, with r = r* in equation
2.3:
AG* = 4/3/_or .2 (2.4)
with equation 2.2:
16_ 3AG* - (2.5)
3(Pv - PI) 2
The nucleation rate, or the rate of formation of embryos of critical size is given
by Fisher (1948) as:
nkTr r-AG*I ]j = --fi--Lexp (2.6)
This expression for the nucleation rate neglects the term for the free energy of
activation of the motion of an individual molecule of liquid past its neighbors into or
away from the liquid-vapor interface. AG* may be considered as a thermodynamic
energy barrier for the liquid-to-vapor transition. In classical homogeneous nucleation
theory, vaporembryosare assumedto havethe macroscopicpropertiesof the liquid
bulk phase.Hence,thesurfacetensionin theaboveequationsis the macroscopicflat-
film surface tension. This assumption is often referred to as the capillary
approximation. Different versions analogous to equation 2.6 exist but provide similar
calculated results, as discussed by Skripov (1974). For simplicity, equation 2.6 will benkT
used in the present work to represent J. The pre-exponential factor, T ' is a large
number, on the order of the number of molecules in the volume of liquid considered.
T in equation 2.6 may be defined as the homogeneous nucleation temperature, denoted
by Tho m, for a critical range of J, as discussed in Skripov (1974) and Nghiem (1980).
Thom actually covers a very narrow range of T and varies little even for a large change
in the critical value of J. The maximum practical attainable superheat of a liquid is
limited by Thom. as discussed in Blander and Katz (1975) and Sinha (1980). It is
noted from equations 2.5 and 2.6 that the exponential term of equation 2.6 is
temperature dependent. As the temperature of a pure liquid is raised above its boiling
point, the surface tension decreases and the vapor pressure increases. Each of these
two factors leads to a decrease in the activation energy barrier, resulting in an increase
in the likelihood of vapor nucleation.
Experimental studies of homogeneous nucleation abound and the following are
selected as a representative sampling:
Simpson and Walls (1965-1966) used a pulsed wire technique to investigate
nucleation. Their homogeneous nucleation temperature measurements were within + 2
% of the theoretical homogeneous nucleation temperature of various organic fluids.
The experimental apparatus consisted of a thin platinum wire immersed in different
test fluids, including benzene, acetone, n-hexane, ethyl ether, and demineralized water
at atmospheric pressure. The wire was subjected to an intense current pulse of short
duration, so that nucleation would occur in the superheated thermal boundary layer of

the liquid nearthewire surface.The transientheatflux from the wire wasinterpreted
to beconvection-freeconductionto the liquid.
Skripov (1974)studiedhomogeneousnucleationin saturatedhydrocarbonsand
fluorohydrocarbonsby superheatingfloating dropletsof saturatedhydrocarbonsand
fluorohydrocarbonsin sulfuric acid in a temperaturegradienton the order of 0.1-0.5
oC/mm. Sincethe hydrocarbonswereimmiscible in the sulfuric acid, the nucleation
taking place approachedhomogeneousnucleation. The homogeneousnucleation
temperaturescalculated by classical homogeneousnucleation theory agreedwith
measurements(differencesweretypically lessthan1-2°C).
Skripov (1974) also studiedhomogeneousnucleationin an expandingliquid
achievedby meansof a rapid pressuredrop in a bubblechamber. He observedmean
homogeneousnucleationtemperatureswhich were within a few degreesCelciusof
thosepredictedby classicalhomogeneousnucleationtheory for n-pentane,n-hexane,
diethyl ether,benzene,andhexafluorobenzenefor varioussaturationpressures.
Derewnicki (1985)performedboiling testsusingpulsedplatinumwires (0.025
mm diameterby 10mm length)immersedin degassed,distilled water. He claimedto
find, by photographicmeans,homogeneousnucleationin the thermalboundarylayer
near the wire surface which becamehighly superheatedas a result of the fast
temperaturerise.
Sinha(1980)measuredthe homogeneousnucleationtemperaturefor Helium I
using a transientbismuth magnetoresistivethermometer. Homogeneousnucleation
temperaturesfor liquid nitrogenfor reducedpressures,P/Pc,rangingfrom 0.03 to 0.91
wereobtainedby pulseheatinga platinumwire (7 cm lengthby 0.102mm diameter).
The experimental temperaturemeasurementswere in good agreementwith the
classical nucleation theory. A corresponding state analysis for the case of
homogeneousnucleation in liquid noble gases,both classical and quantum, was
developed.
10
2.2 HeterogeneousNucleationandIncipientBoiling
Heterogeneous nucleation, which is more probable in most engineering
applications of boiling than homogeneous nucleation, is influenced by the geometrical,
chemical, and physical properties of the boiling surface. Heterogeneous nucleation in
boiling is extremely difficult to formulate mathematically as it is different for any
given liquid-surface combination and depends on fluid contact angles, surface cold
working (for metallic surfaces), grain boundary area (for metallic surfaces), and
surface chemadsorption. In addition, minute cavities which might not be entirely
wetted by a liquid may trap air or other gas molecules as potential centers for
nucleation.
Several models for heterogeneous nucleation which utilize the macroscopic
point of view based on the concept of surface tension have been proposed: Fisher
(1948), Hirth and Pound (1963), Sigsbee (1969), Boucher (1969), Cole (1974),
Zimmels (1976), Blander and Katz (1975), and Kotake and Glass (1981). The
discussion in Blander and Katz (1975) will now be summarized, presenting the basic
concepts of the macroscopic heterogeneous nucleation.
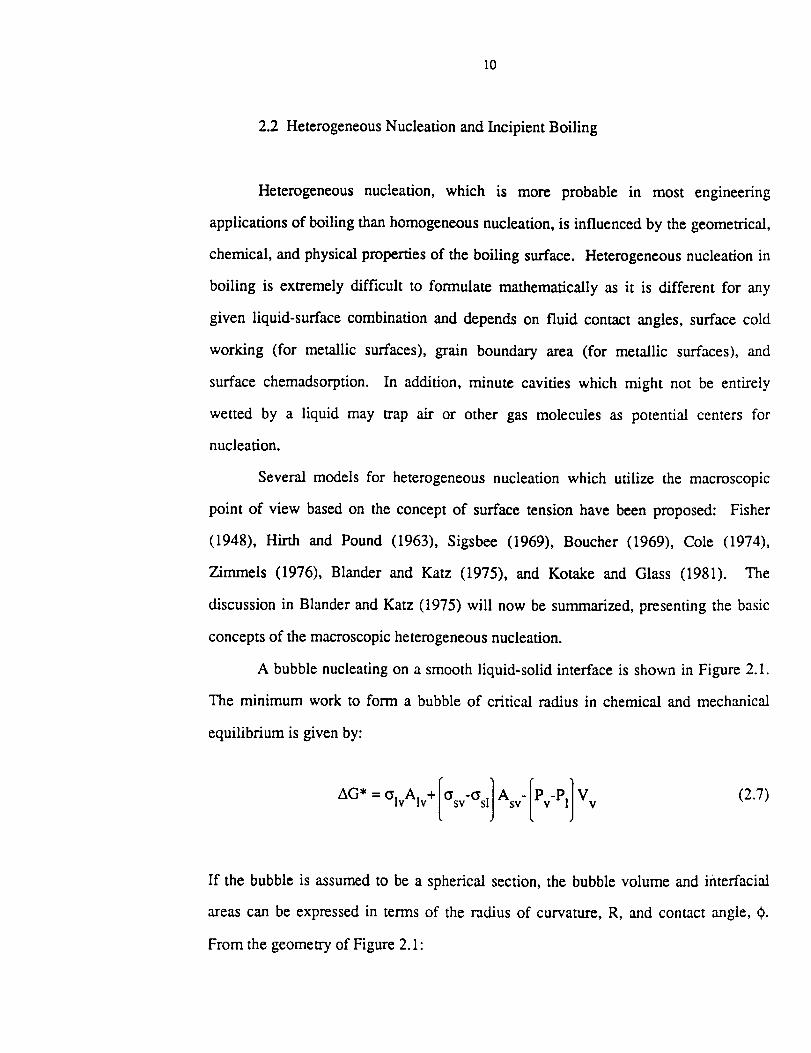
A bubble nucleating on a smooth liquid-solid interface is shown in Figure 2.1.
The minimum work to form a bubble of critical radius in chemical and mechanical
equilibrium is given by:
olvA1v+IosvOs,1 IPvPl/Vv (2.7)
If the bubble is assumed to be a spherical section, the bubble volume and interfacial
areas can be expressed in terms of the radius of curvature, R, and contact angle, 0.
From the geometry of Figure 2.1:
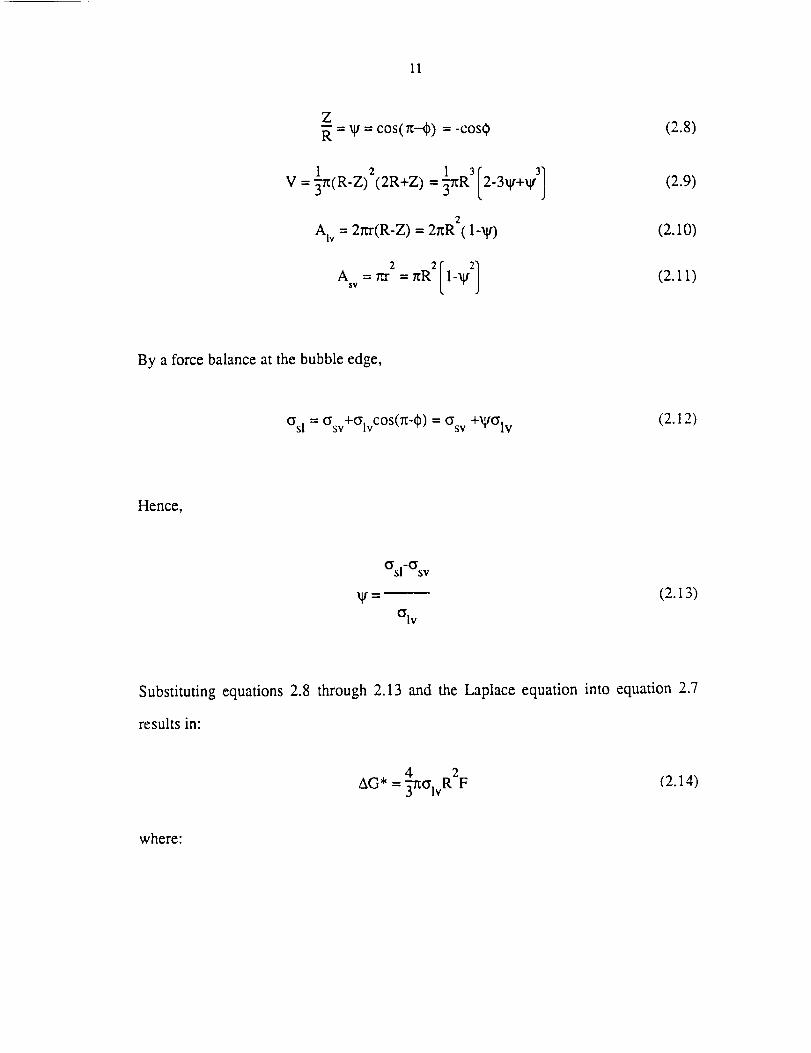
11
Z=_"=cos(_-_)=-cos_
1 2 1 31 ]V = "_x(R-Z) (2R+Z) = "_R 2-3V+V 3
2Air = 2for(R-Z) = 2r_R (l-V)
2 2(A =rcr =rcR 1-VSV
(2.8)
(2.9)
(2.10)
(2.11)
By a force balance at the bubble edge,
_sl = _sv+C_lv c°s(_'_b) = _sv +'qtCrlv (2.12)
Hence,
O'sl-Osv
V=_ (2.13)
OIv
Substituting equations 2.8 through 2.13 and the Laplace equation into equation 2.7
results in:
4 2AG* = .._-XCrlvRF (2.14)
where:
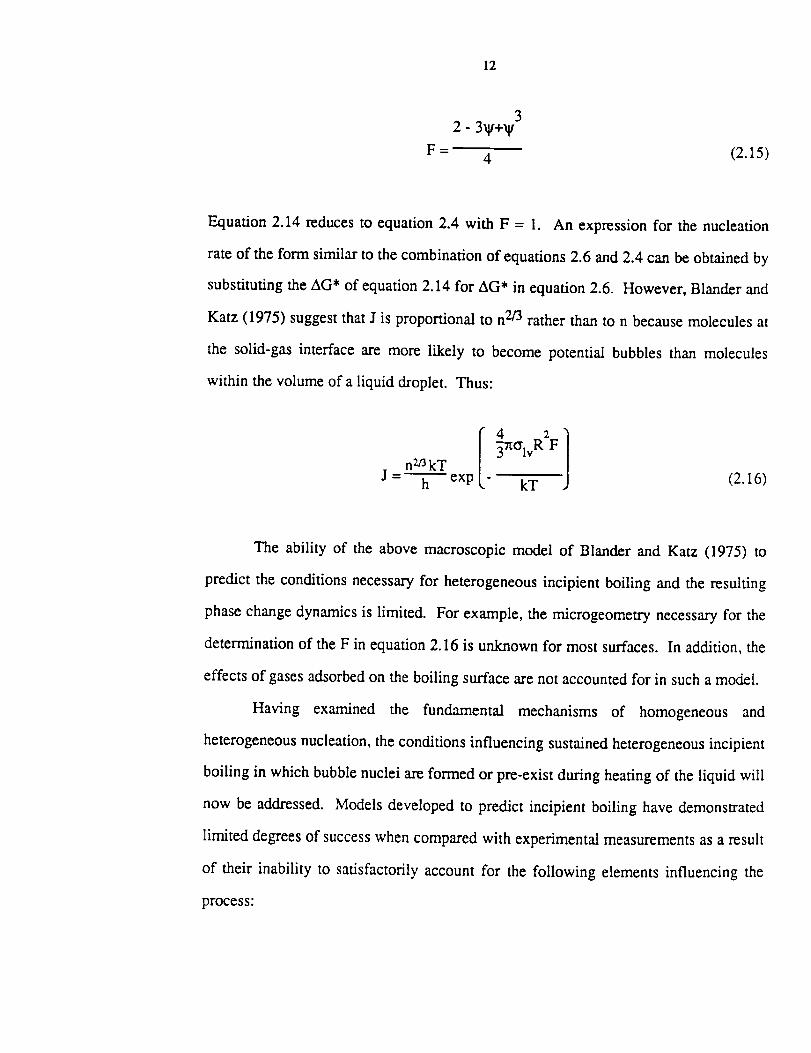
12
F - 4 (2.15)
Equation 2.14 reduces to equation 2.4 with F = 1. An expression for the nucleation
rate of the form similar to the combination of equations 2.6 and 2.4 can be obtained by
substituting the AG* of equation 2.14 for AG* in equation 2.6. However, Blander and
Katz (1975) suggest that J is proportional to n 2/3 rather than to n because molecules at
the solid-gas interface are more likely to become potential bubbles than molecules
within the volume of a liquid droplet. Thus:
n _ kT
J- h expI 4 2
•_Iv R F
kT (2.16)
The ability of the above macroscopic model of Blander and Katz (1975) to
predict the conditions necessary for heterogeneous incipient boiling and the resulting
phase change dynamics is limited. For example, the microgeometry necessary for the
determination of the F in equation 2.16 is unknown for most surfaces. In addition, the
effects of gases adsorbed on the boiling surface are not accounted for in such a model.
Having examined the fundamental mechanisms of homogeneous and
heterogeneous nucleation, the conditions influencing sustained heterogeneous incipient
boiling in which bubble nuclei are formed or pre-exist during heating of the liquid will
now be addressed. Models developed to predict incipient boiling have demonstrated
limited degrees of success when compared with experimental measurements as a result
of their inability to satisfactorily account for the following elements influencing the
process:
13
(1) Surfacemicrogeometry
(2) Surfaceenergy
(3) Liquid temperaturedistribution
(4) Externallyforcedliquid motion
(5) Buoyancyinducedliquid motion
The heatersurfacemicrogeometry,which is assumedto consistof microscopic
crevicesand pits, trapsvapor and gaseswhich becomebubble nuclei. The heater
surface energy affects the wettability of a surfaceby a liquid, and as a result,
influencestheability of thesurfacemicrogeometryto trapvaporandgases.Theliquid
temperaturedistributionat themomentof incipientboiling dependson thepresenceof
fluid motion,externallyforcedor resultingfrom densityvariationsin a gravity field.
Thesefive elementswill now beconsideredin somedetail.
2.2.1 SurfaceMicrogeometry
It is known, as indicated by the studiesbelow, that nucleation and initial
boiling arestrongly affectedby the surfacemicrogeometry.Bankoff (1958), Griffith
andWallis (1960),Lorenz(1974),Winterton (1977),andWebb (1981),for example,
purport that therole of microgeometryin incipient boiling is to trap gasesand vapor,
which then act as nuclei for bubbles. Howell and Siegel (1966) report that
photographsof water boiling from artificial sitesdrilled in stainlesssteel surfaces
showvaporremainingin thesiteaftera bubbledeparts.The highspeedphotographic
studiesof surfaceboiling of pentaneby Clark et al (1959) demonstratedthat active
nucleationsiteswerelocatedat pits andscratcheson the surface. Griffith and Wallis
(1960) showedthat the cavity mouth radius determinesthe superheatnecessaryfor
14
conditionsof isothermalincipient boiling, and that the shapeof thecavity determines
whetherboiling will persist,oncehavingbegun.
Coeling and Merte (1968)presentedexperimentaldata for naturalconvection
heattransferand for boiling inceptionof LH2 and LN2. The experimentalvariables
includedheatersurfacematerial, surfaceroughness,and orientation. Stainlesssteel
and coppersurfaceswere testedin both polishedand lappedconditions. A surface
coatedwith TFE teflon was also tested. Heater surfaceorientation,which included
horizontal up, vertical, and horizontal down with respect to the direction of earth
gravity, were test parameters. A stainlesssteel surface lappedwith a 600 grit
compoundwas found to be a moreeffective boiling surfacefor LH2 than the same
surfacewhetherpolishedor lappedwith a coarser280 grit compound. In terms of
vapor trapping in cavities, this experimentalresult indicated the existenceof an
optimum surfacemicrogeometryfor producing nucleateboiling with a minimum
heatersurfacesuperheat.More recentworksconcerningtherole of microgeometryin
incipient boiling andnucleateboiling will bediscussedbelow.
Webb (1981)presenteda surveyof theevolution of specialsurfacegeometries
that promote high performancenucleateboiling covering the period from 1931 to
1980. The surfacegeometriesdescribedwere designedwith the intent of trapping
vaporefficiently. Thesegeometriesincludedre-entrantcavities,porouscoatings,and
re-entrantgrooves.
Forest(1982)presenteda generalfree energyanalysisof the equilibrium and
stability of agas-vapornucleusinsideof a surfacecavity for a uniform temperaturein
the liquid. He demonstratedthat the spontaneousgrowth of a pre-existingnucleus
occurswhenthe radiusof curvaturereachesa minimum asthe gaseousvolumeof the
nucleusincreases.Thisconfirmedtheearlierwork of Griffith andWallis (1960).
Tong et al (1990)describedtheinfluenceof the dynamiccontactangleon the
liquid-gas trapping as related to boiling inception with highly wetting liquids.
15
Changesin thedynamiccontactanglewereshownto determinethe trappedvolumeof
gasin aheatersurfacecrevice.
The majorproblemencounteredin studyingtherole of surfacemicrogeometry
on incipient boiling for a "natural"boiling surfaceis how to satisfactorilyquantify, in
a collective manner,themicro-valleys,pits, and scratchespresenton sucha surface.
Surfaceroughnessmeasurementsaregrossmeasurementsfor the length scaleof the
cavities being considered,which are on the order of 10-7 m. Surfaceroughness
measurementsdo not necessarilydetect vapor trapping re-entrant cavities or
microscopicpits, while scanningthe boiling surfaceat discrete locationsmay not
revealsomepotentialboiling sites.
ChowdhuryandWinterton (1985)studiedthe effect of surfaceroughnessand
contact angle on nucleateboiling using a quenching techniquewith aluminum or
coppercylindersandsaturatedwateror methanol. Theyconcludedthat thenumberof
active sites, rather than the surface roughnessas measuredby a profilometer,
influencednucleateboiling. Consistenttechniquesfor rougheningdifferent surfaces
of the samematerialsproducedremarkablysimilar boiling curvesfor surface-liquid
combinationswith thesamemeasuredcontactangle.
2.2.2 SurfaceEnergy
The importanceof thesurfaceenergy,measuredin termsof the contactangle,
to the onsetof boiling has long beenknown. However,surfaceenergy is not well
understood. It is not known explicitly how surfaceenergyaffects the formation of
nuclei, nor how surfaceenergy affects the stability of nuclei in potential boiling
cavities. The contactanglebetweena solid anda liquid characterizesthe wettability
of a certain solid surfaceby a specific liquid. Parameterssuchas the volume of
trapped air or gas in a surface cavity, the critical bubble radius and the resulting
16
incipient superheatare influenced by surfacewettability. The description of this
wetting phenomenonis difficult, assolidsurfacesaresurmisedto havemicro crevices
and valleys of complex forms. In addition, chemicalreactionsmay take place at
liquid-solid interfacesand develop impurities which concentrateat the liquid-solid
interface. The following studiesexaminedthe relationshipbetweenthe contactangle
andboiling incipience.
Cornwell (1982) maintained that boiling incipience was caused by the
instability of pre-existing vapor-liquid interfaces in heater surface cavities. He
proposed that the micro-roughnessof the cavity walls results in a contact angle
hysteresis between the advancing and receding contact angles which cause the
meniscuswithin thecavity to invert from beingconvexto concaveon the vaporside.
This meniscusinversionprovidesan explanationfor the trappingof vapor andgases.
Surfaceheterogeneityin termsof spatiallyvaryingamountsof contaminants,including
organicfilms andoxide layers,waspurportedto play a partin thecontacthysteresis.
WintertonandBlake (1983)concludedthat the liquid-vapor interfacewithin a
boiling surfacecavity canadjustto externalchangesin liquid pressureon a time scale
of lessthanafew seconds.They purportedthatboiling incipienceon a heatedsurface
inducedby surfacevibrationcan beexplainedin termsof the hysteresisbetweenthe
advancingandrecedingcontactangles.
In a theoreticalinvestigation,Tong et al (1990) concludedthat for highly-
wetting fluids suchas R113,the nucleusfor boiling incipience lies below the cavity
mouth radius. Theyalsoconcludedthat for suchfluids, variationsin thecontactangle
during bubbleembryo formation and growth resulting from changesin the liquid-
vapor interface velocity explain the wide variation in measuredincipient superheat
values. A methodfor calculatingthewall temperatureat boiling incipiencewasgiven,
but dependedon unknownvaluesof th_ staticequilibrium contactangle, thedynamic
17
contactangle, and the cavity geometry. As these values could not be measured,
assumed values were used.
Because the heating surface microgeometry and surface energy are usually
unknown, some studies have lumped these two effects in an energy reduction factor as
a modification to classical expressions for homogeneous nucleation in order to predict
boiling inception.
Nghiem et al (1981) attempted to determine the necessary conditions for
transient incipient boiling with a step in power input using two test fluids, saturated
water and R113 at atmospheric pressure, and using three test surfaces: a platinum wire
(0.15 mm diameter x 24 mm length), a copper wire (0.2 mm diameter x 24 mm
length), and a thin gold film (20 mm x 2 mm x 400 angstroms thick). It was observed
that as the steady input heat flux was increased, the delay time for the onset of boiling
decreased. This decrease in delay time was accompanied by higher wall superheats at
the moment of boiling inception, up to 90 K at 0.9 sec for the R113. To incorporate
the influences of convection, fluid properties, surface energy, and microgeometry of
the heated surface on the delay time, an empirical factor was used in combination with
an expression resulting from homogeneous nucleation theory. This factor was defined
as:
F (2.17)
where AG*, the free energy required to form a vapor nucleus for the process of
homogeneous nucleation, was defined in equation 2.4. AGhe t was defined as the free
energy required to form a vapor nucleus under conditions corresponding to
heterogeneous nucleation. The expression of Fisher (1948) for the homogeneous
nucleation rate of bubbles of critical size, given as equation 2.6 above, was used to
18
relate the nucleation rate to the observed nucleation delay time. Nucleation is
considered to occur when a bubble of critical size forms and grows per unit volume in
a reasonable time, t seconds, after the onset of heating. This t was termed the
nucleation delay time, and J in equation 2.6 was taken as the inverse of this delay time,
as a first approximation. Since the heterogeneous nucleation appeared to take place in
the fluid immediately adjacent to the solid surface, the fluid temperature at the instant
of nucleation was taken to be the same as the wall temperature. For a given fluid-
surface combination, F was a function of the fluid properties and the measured heater
surface temperature at the moment of incipient boiling. This particular treatment of
incipient boiling will be considered in more detail in a later section.
A free energy reduction factor based on homogeneous nucleation theory
paralleling that of Nghiem et al (1981) was also presented in Gerum et al (1979),
where the value for the nucleation rate was taken as unity, using a form similar to
equation 2.6. Calculated values of this energy reduction factor, based on measured
quasi-steady heater surface temperatures at the onset of boiling, were correlated in
terms of:
F=A
Tcrit-T w
Tcrit
B
(2.18)
for a number of different fluids, including R12, LN 2, R114, LO 2, R22, ethyl ether, and
water. A and B were determined by curve fitting calculated values of F for a given
substance as a function of the dimensionless temperature in equation 2.18. Critical
heat flux heater surface temperature measurements were used in addition to the quasi-
steady incipient boiling heater surface temperature measurements, as it was felt that
the incipient boiling data alone were unreliable. However, this point is not clear.
19
2.2.3 Liquid TemperatureDistribution
The role that the liquid temperaturedistribution in the vicinity of the heater
surfacehason incipient boiling will now be considered. Incipient boiling models
which includetheliquid temperaturedistributionwill beexaminedfirst, followed by a
discussionof theeffectof themodeof heating.
Early modelsof initial boiling suchas that of Griffith andWallis (1960)and
Cony andFoust (1955)assumeda liquid of uniform superheat.The predictedheater
surface superheatat boiling inception by Griffith and Wallis agreed with the
measurementsonly for a surfaceimmersedin a uniformly heatedbath. Furthermore,
the two modelsreferredto aboveplacedno upper limit on the sizeof a potentially
activecavity. It wouldappearreasonablethata cavity sizemustexist beyondwhich it
could no longerbecomea nucleationsite, sincea cavity size largeenoughwould be
completelywetted.
Models for incipient boiling which attempt to incorporatethe influence of
liquid temperaturedistributionon theprocessassumea sphericallyshapedpre-existing
vapor nucleusat the entranceof a heater surfacecavity, and generally relate the
difference betweenthe internal vapor pressureof the nucleusand interface liquid
pressureto theradiusof curvaturebyequation2.2. As wasnotedearlier,equation2.2
is basedon theassumptionof a uniform liquid temperatureand a nucleusof spherical
geometry. Thispressuredifferenceis thenrelatedto the liquid superheatnecessaryby
theClausius-Clapeyronequation,which is basedon equilibrium conditions. Analyses
vary accordingto the equilibrium nucleusshapesassumedand the criteria necessary
for the nucleusto grow, including the liquid temperaturedistribution. The growth
criterion is usuallythat the local liquid superheatmustattain a value greaterthan the
saturationtemperatureof thevapornucleusat somedefinedlocation.
20
The model of Hsu (1962) predicts a size range of potentially active heater
surfacecavities and will be describedin somedetail here since it incorporatesthe
critical featuresof mostnucleationmodelsin varying temperaturefields,andwasone
of theearliestto bepresented.This modelassumestheexistenceof avapornucleusof
sphericalcross-sectiongeometrysitting atthemouthof a surfacecavity. Theorigin of
thenucleusis unclear.Theliquid in a slabof thickness5 adjacentto theheatersurface
is takento be heatedin a transientconductionprocessby the solid heatersurface. It
wasassumedthat the temperatureof the liquid at a distancegreaterthan8 from the
heatersurfaceremainedat To,. Figure 2.2apresentsthe coordinatesystemusedand
definedquantities.Themodelusesthefollowing form of theenergyequation:
(90 a28
•_t = O_x 2 (2.19)
where 0 = T - T**. The boundary and initial conditions for the constant temperature
case of a heater surface are:
0(x,0) = 0 (2.20)
O(0,t) = 0 (2.21)
0(8,t) = 0 w (2.22)
The well-known solution is:
0 o rtz...a nW
n=l
. f x] I-(:zt(nx)2]
s,n[=n jexp[ j (2.23)
21
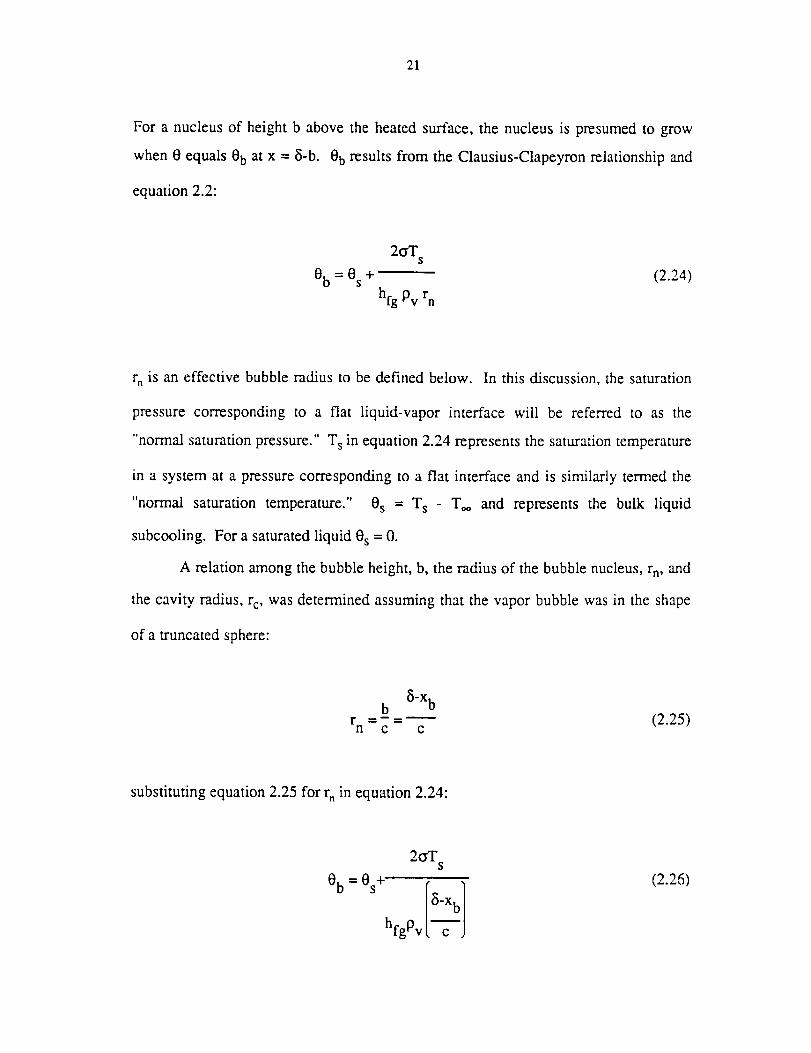
For a nucleusof heightb abovethe heatedsurface,the nucleusis presumedto grow
when0 equals0b at x = 5-b. 0bresultsfrom theClausius-Clapeyronrelationshipand
equation2.2:
2o'T$
0 b = 0 s + (2.24)
hfg Pv rn
rn is an effective bubble radius to be defined below. In this discussion, the saturation
pressure corresponding to a flat liquid-vapor interface will be referred to as the
"normal saturation pressure." T s in equation 2.24 represents the saturation temperature
in a system at a pressure corresponding to a flat interface and is similarly termed the
"normal saturation temperature." 0 s = T s - To. and represents the bulk liquid
subcooling. For a saturated liquid 0 s = 0.
A relation among the bubble height, b, the radius of the bubble nucleus, rn, and
the cavity radius, rc, was determined assuming that the vapor bubble was in the shape
of a truncated sphere:
b 5-Xbr (2.25)
n c c
substituting equation 2.25 for r. in equation 2.24:
2oTS
0 b = 0s+ [_5_Xb
hfgPv [-"_ -
(2.26)
22
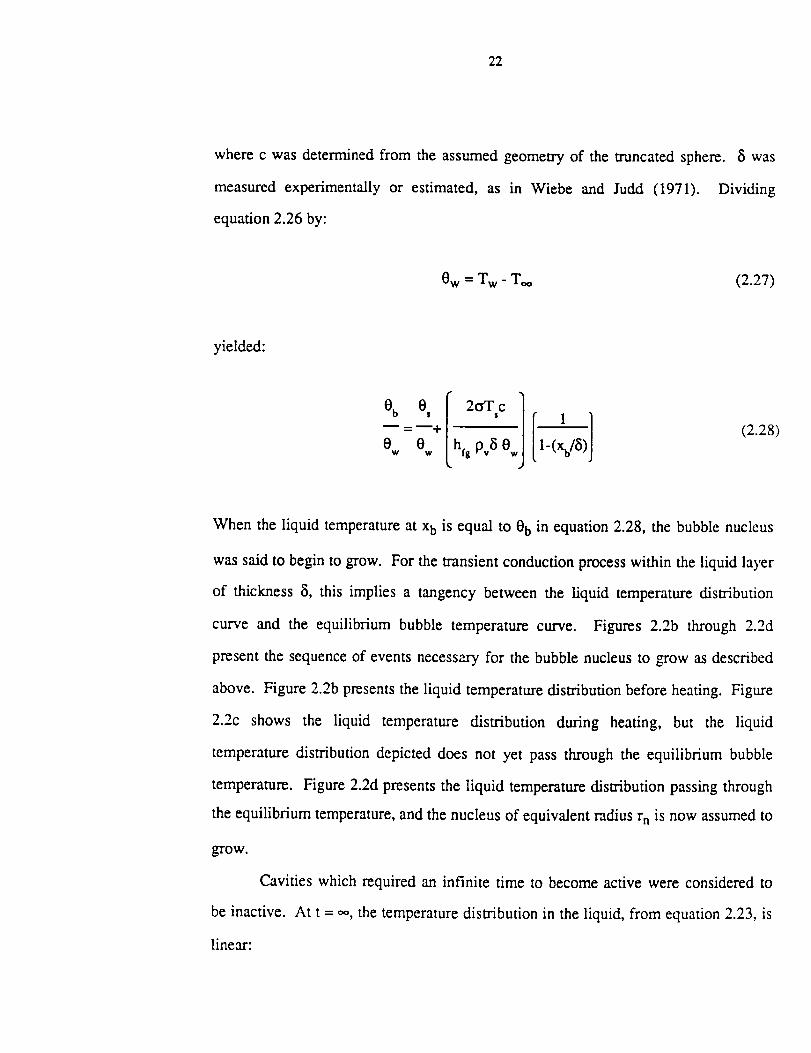
wherec wasdeterminedfrom the assumedgeometryof thetruncatedsphere. 5 was
measuredexperimentallyor estimated,as in Wiebe and Judd (1971). Dividing
equation2.26by:
0w = Tw- T** (2.27)
yielded:
m _ q_ , mmm , ,
0 W 0 w LhfgpvSO w 1-( /8
(2.28)
When the liquid temperature at xb is equal to e b in equation 2.28, the bubble nucleus
was said to begin to grow. For the transient conduction process within the liquid layer
of thickness 5, this implies a tangency between the liquid temperature distribution
curve and the equilibrium bubble temperature curve. Figures 2.2b through 2.2d
present the sequence of events necessary for the bubble nucleus to grow as described
above. Figure 2.2b presents the liquid temperature distribution before heating. Figure
2.2c shows the liquid temperature distribution during heating, but the liquid
temperature distribution depicted does not yet pass through the equilibrium bubble
temperature. Figure 2.2d presents the liquid temperature distribution passing through
the equilibrium temperature, and the nucleus of equivalent radius r n is now assumed to
grow.
Cavities which required an infinite time to become active were considered to
be inactive. At t = oo, the temperature distribution in the liquid, from equation 2.23, is
linear:

23
0 X
0w
(2.29)
When equations 2.28 and 2.29 are set equal to each other at x = _i-b, the upper and
lower limits for a range of cavities which can be active may be found:
r ='-'_--5 IIl-O ] +_[1-012-I , 8/sc-----_3 ]1c_,_2c, lhf_pvew_j(2.30)
r =--_-_ IIl-_l _IlOl 2 I 8°'T'c3 ]1Cmin 2Cl ° " -l.S_j
(2.31)
where:
c I = (1 +cosd?)/sinq_ (2.32)
and
c 3 = l+cos_ (2.33)
24
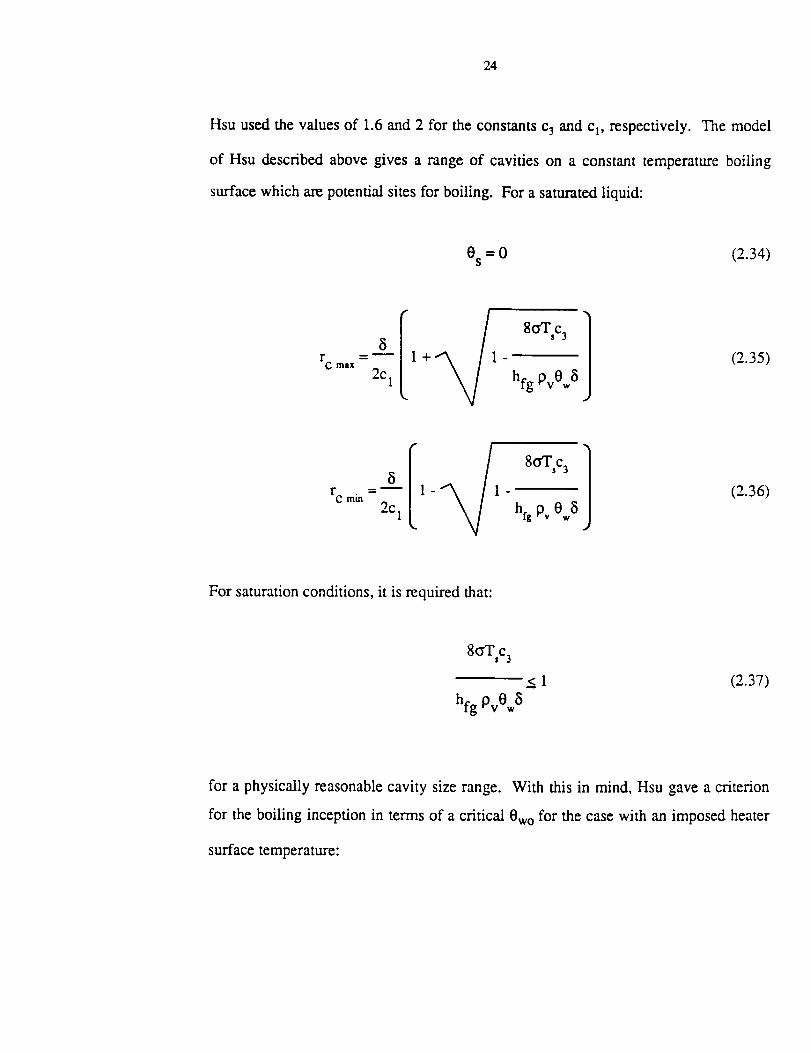
Hsuusedthe valuesof 1.6and2 for the constantsc3andc_,respectively. Themodel
of Hsu describedabovegives a rangeof cavities on a constanttemperatureboiling
surfacewhicharepotentialsitesfor boiling. For a saturatedliquid:
0s -- 0 (2.34)
=_ I+ 1- --_
re max 2Cl hfg pvew8(2.35)
=_ 1- 1- (2.36)
rc ,,in 2c 1 hrg p,, 0,,,8
For saturation conditions, it is required that:
8¢3"Tsc3
hfg Pv0w8
< I (2.37)
for a physically reasonable cavity size range. With this in mind, Hsu gave a criterion
for the boiling inception in terms of a critical 0wo for the case with an imposed heater
surface temperature:
25
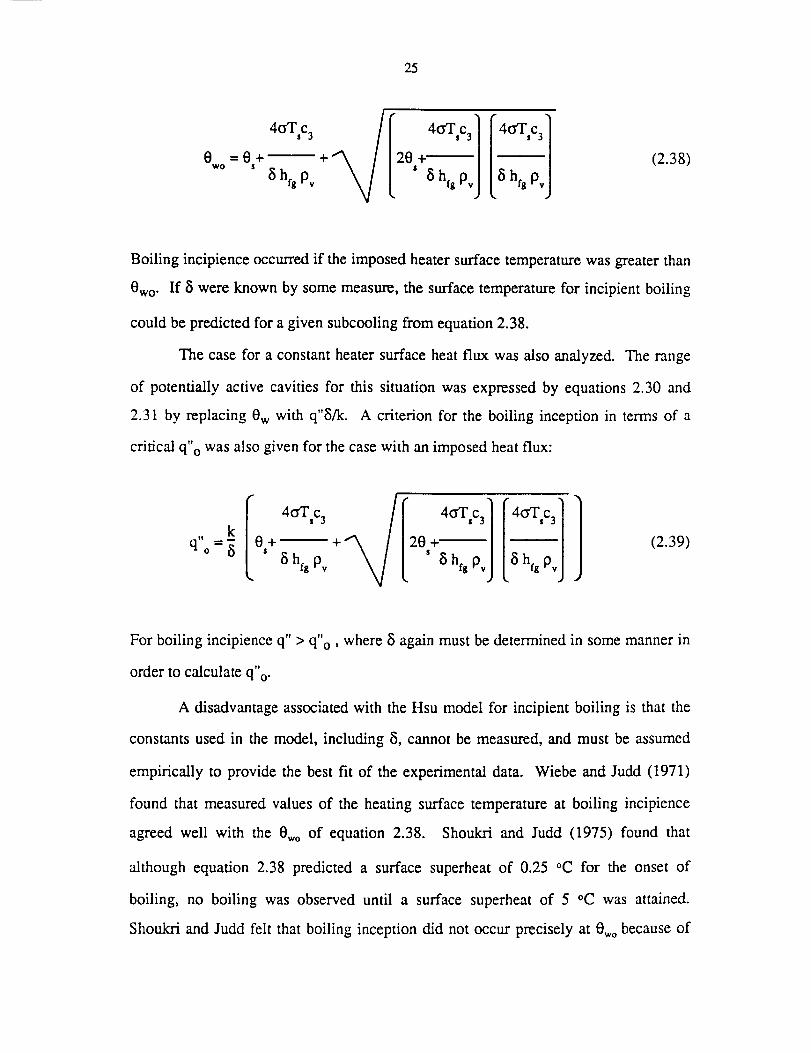
4 c3/[1r4 c318 8 28 ÷ 4°'T'c3= + + ...... (2.38)
"° ' 8h,,p, ' 8h,,p,J L,h .p,j
Boiling incipience occurred if the imposed heater surface temperature was greater than
0wo. If 5 were known by some measure, the surface temperature for incipient boiling
could be predicted for a given subcooling from equation 2.38.
The case for a constant heater surface heat flux was also analyzed. The range
of potentially active cavities for this situation was expressed by equations 2.30 and
2.31 by replacing 0 w with q"8/k. A criterion for the boiling inception in terms of a
critical q"o was also given for the case with an imposed heat flux:
tl O k[4 c3/[o+ + 20' 8 hrg p,
(2.39)
For boiling incipience q" > q"o, where 5 again must be determined in some manner in
order to calculate q"o-
A disadvantage associated with the Hsu model for incipient boiling is that the
constants used in the model, including fi, cannot be measured, and must be assumed
empirically to provide the best fit of the experimental data. Wiebe and Judd (1971)
found that measured values of the heating surface temperature at boiling incipience
agreed well with the 0wo of equation 2.38. Shoukri and Judd (1975) found that
although equation 2.38 predicted a surface superheat of 0.25 °C for the onset of
boiling, no boiling was observed until a surface superheat of 5 °C was attained.
Shoukri and Judd felt that boiling inception did not occur precisely at 0wo because of
26
thenonexistenceof sufficiently largecavities with theprerequisitetrappedgas. They
alsofound thatmeasuredboiling cavityradii datafell in the lower portion of therange
of cavity radii predictedby theHsumodel.
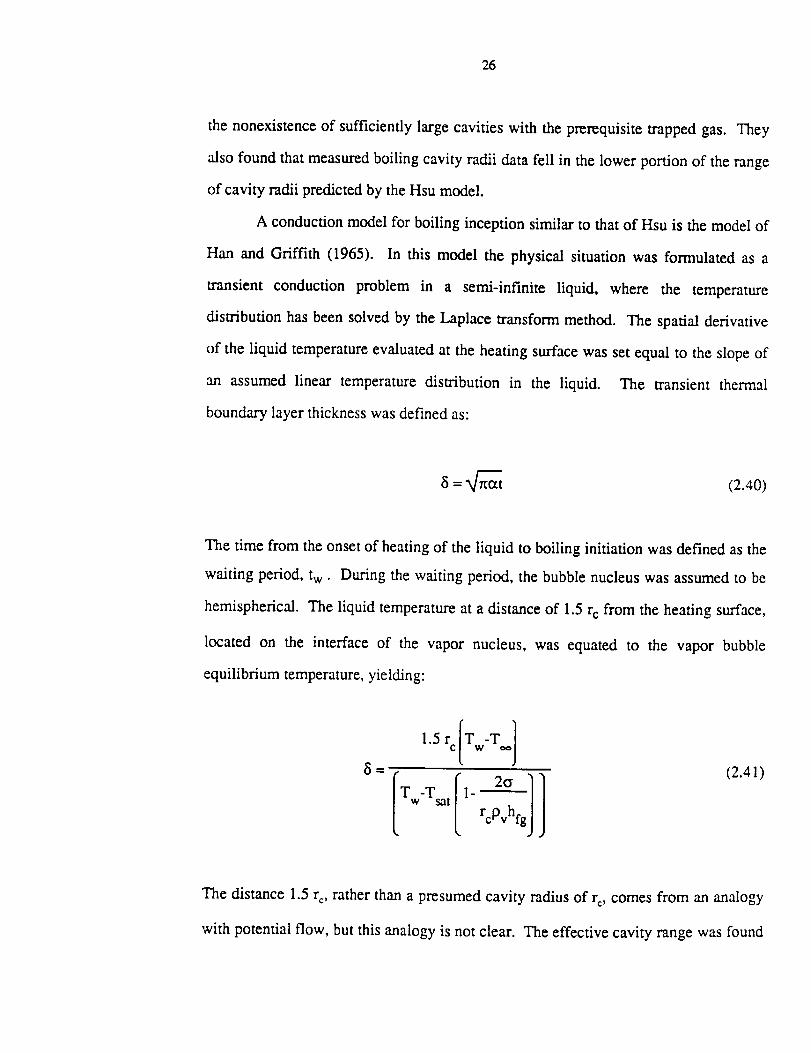
A conductionmodelfor boiling inceptionsimilar to that of Hsu is themodelof
Hart and Griffith (1965). In this model the physical situationwas formulatedas a
transient conduction problem in a semi-infinite liquid, where the temperature
distribution hasbeensolvedby theLaplacetransformmethod. The spatialderivative
of the liquid temperatureevaluatedat the heatingsurfacewassetequalto theslopeof
an assumedlinear temperaturedistribution in the liquid. The transient thermal
boundarylayer thicknesswasdefinedas:
8 = af_ (2.40)
The time from the onset of heating of the liquid to boiling initiation was defined as the
waiting period, tw . During the waiting period, the bubble nucleus was assumed to be
hemispherical. The liquid temperature at a distance of 1.5 rc from the heating surface,
located on the interface of the vapor nucleus, was equated to the vapor bubble
equilibrium temperature, yielding:
,Src/TwT18 = (2.41)P
Tw'Tsa t
The distance 1.5 r c, rather than a presumed cavity radius of rc, comes from an analogy
with potential flow, but this analogy is not clear. The effective cavity range was found

27
in amannersimilar to thatof Hsu (1962)and definedin termsof amaximumthermal
boundarylayer:
rC rtlilx (2.42)
For T w = "Is, rcmin and r em,x are both zero, which means that boiling does not occur.
The maximum thermal boundary layer thickness was considered to be capable
of being determined from convection correlations. A disadvantage of the Han and
Griffith model for the onset of boiling is the use of empirical constants, including rc or
5. The heater wall temperatures computed from the Han and Griffith model were
compared to the measured maximum transient wall temperatures in the work of Hall
and Harrison (1966). The measured maximum wall temperatures were 30-40 °C
higher than the computed wall temperatures at boiling incipience. Sakurai and Shiotsu
(1977) claimed that Hall and Harrison should not have compared the measured
maximum transient surface temperature with the incipient surface temperature as
calculated by the Han and Griffith model, but rather felt that the measured incipient
boiling surface temperature, which is not necessarily the maximum transient surface
temperature, would more closely follow the Han and Griffith model. Ibrahim and
Judd (1985) found that the Han and Griffith model does not correctly predict the
bubble waiting time at high degrees of subcooling.
28
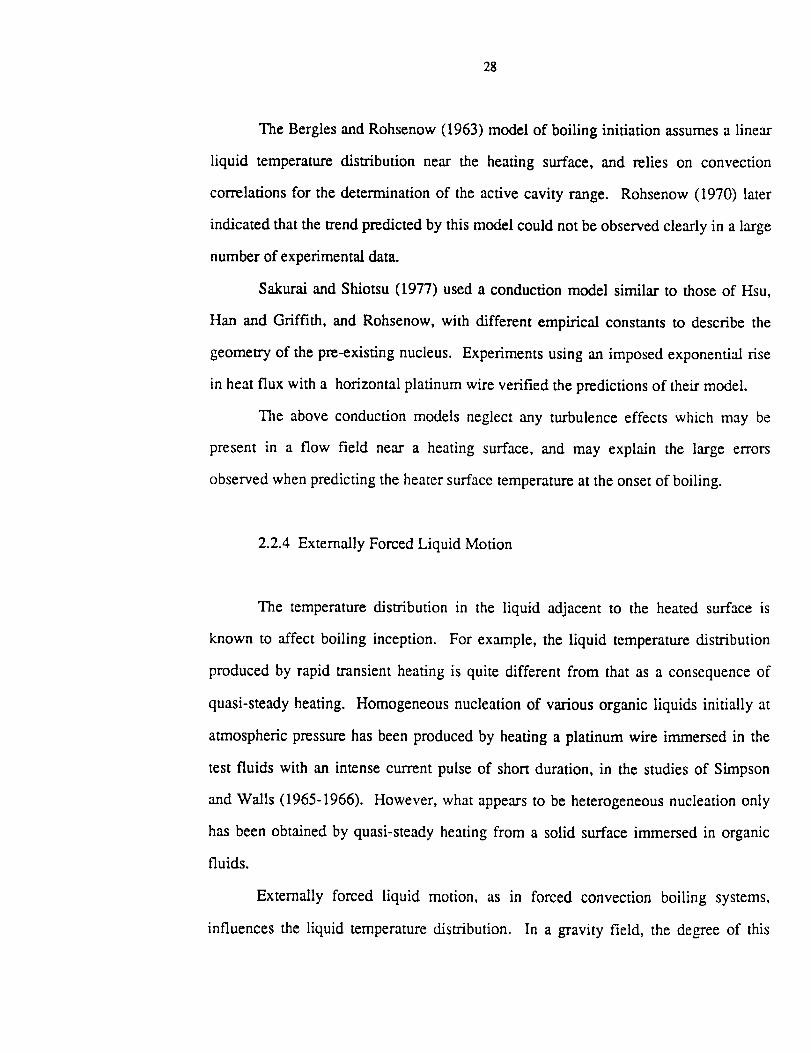
The BerglesandRohsenow(1963)model of boiling initiation assumes a linear
liquid temperature distribution near the heating surface, and relies on convection
correlations for the determination of the active cavity range. Rohsenow (1970) later
indicated that the trend predicted by this model could not be observed clearly in a large
number of experimental data.
Sakurai and Shiotsu (1977) used a conduction model similar to those of Hsu,
Han and Griffith, and Rohsenow, with different empirical constants to describe the
geometry of the pre-existing nucleus. Experiments using an imposed exponential rise
in heat flux with a horizontal platinum wire verified the predictions of their model.
The above conduction models neglect any turbulence effects which may be
present in a flow field near a heating surface, and may explain the large errors
observed when predicting the heater surface temperature at the onset of boiling.
2.2.4 Externally Forced Liquid Motion
The temperature distribution in the liquid adjacent to the heated surface is
known to affect boiling inception. For example, the liquid temperature distribution
produced by rapid transient heating is quite different from that as a consequence of
quasi-steady heating. Homogeneous nucleation of various organic liquids initially at
atmospheric pressure has been produced by heating a platinum wire immersed in the
test fluids with an intense current pulse of short duration, in the studies of Simpson
and Walls (1965-1966). However, what appears to be heterogeneous nucleation only
has been obtained by quasi-steady heating from a solid surface immersed in organic
fluids.
Externally forced liquid motion, as in forced convection boiling systems,
influences the liquid temperature distribution. In a gravity field, the degree of this
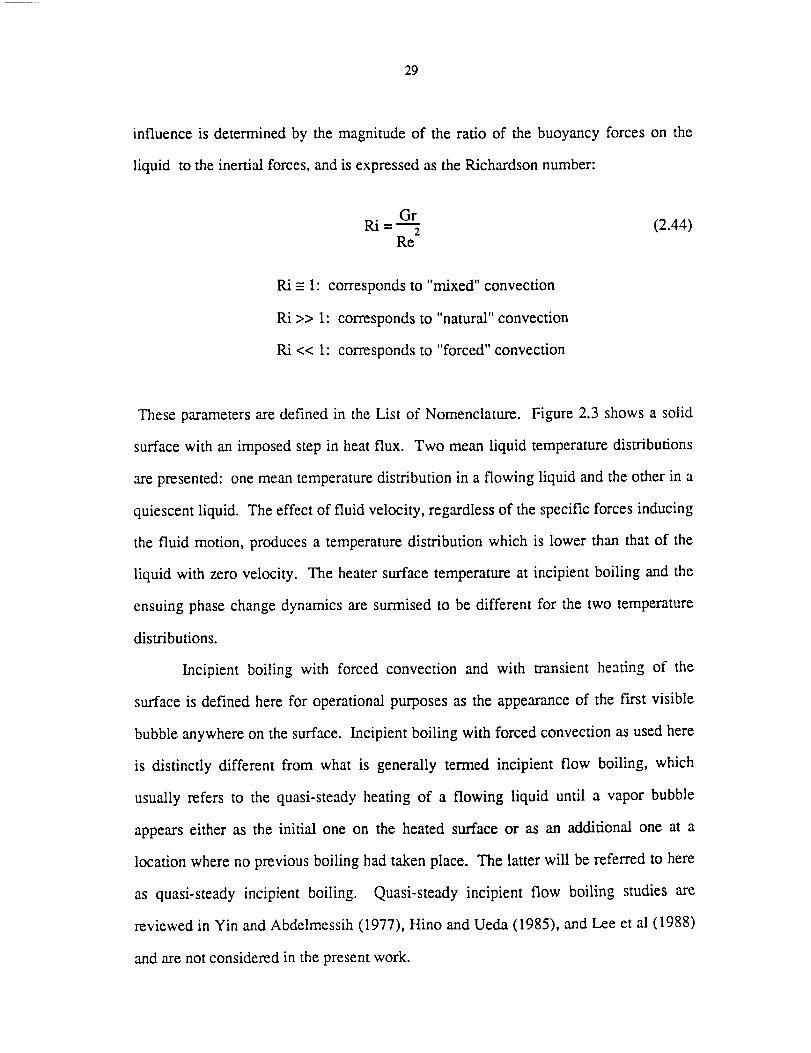
29
influenceis determinedby themagnitudeof the ratio of the buoyancyforceson the
liquid to the inertial forces,andis expressedastheRichardsonnumber:
Gr
Ri = _ (2.44)Re
Ri = 1: corresponds to "mixed" convection
Ri >> 1: corresponds to "natural" convection
Ri << 1" corresponds to "forced" convection
These parameters are defined in the List of Nomenclature. Figure 2.3 shows a solid
surface with an imposed step in heat flux. Two mean liquid temperature distributions
are presented: one mean temperature distribution in a flowing liquid and the other in a
quiescent liquid. The effect of fluid velocity, regardless of the specific forces inducing
the fluid motion, produces a temperature distribution which is lower than that of the
liquid with zero velocity. The heater surface temperature at incipient boiling and the
ensuing phase change dynamics are surmised to be different for the two temperature
distributions.
Incipient boiling with forced convection and with transient heating of the
surface is defined here for operational purposes as the appearance of the fin'st visible
bubble anywhere on the surface. Incipient boiling with forced convection as used here
is distinctly different from what is generally termed incipient flow boiling, which
usually refers to the quasi-steady heating of a flowing liquid until a vapor bubble
appears either as the initial one on the heated surface or as an additional one at a
location where no previous boiling had taken place. The latter will be referred to here
as quasi-steady incipient boiling. Quasi-steady incipient flow boiling studies are
reviewed in Yin and Abdelmessih (1977), Hino and Ueda (1985), and Lee et al (1988)
and are not considered in the present work.
30
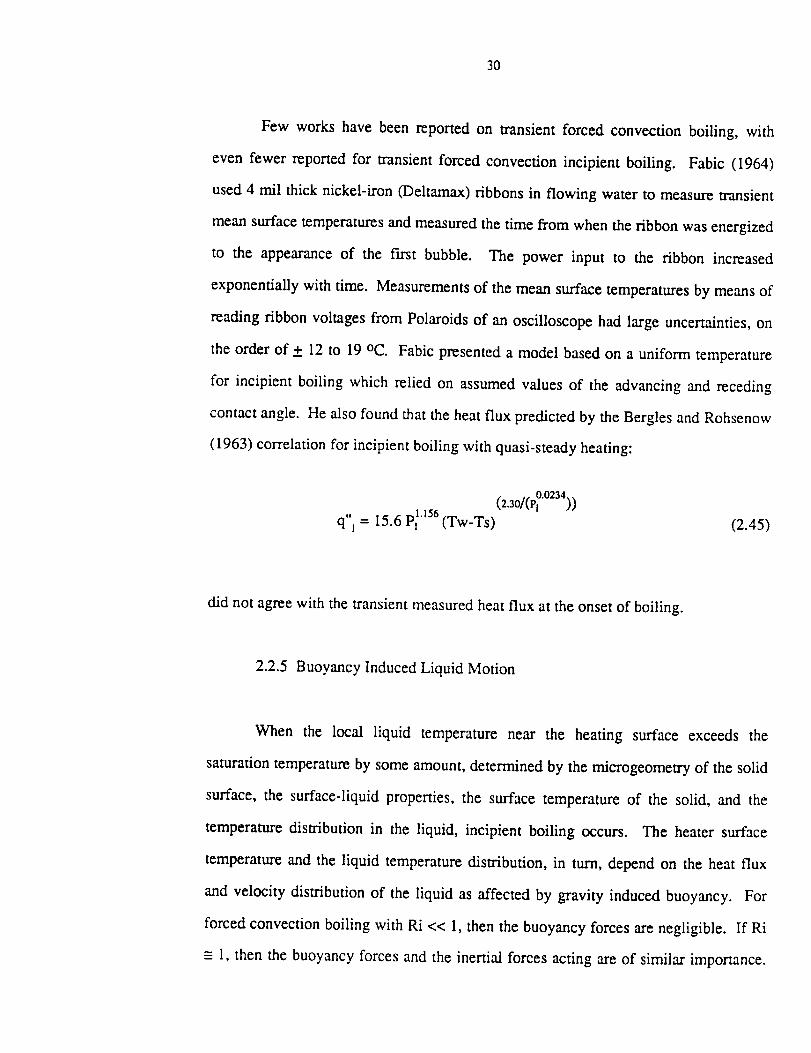
Few works havebeenreportedon transientforced convectionboiling, with
even fewer reportedfor transientforcedconvectionincipient boiling. Fabic (1964)
used4 rail thick nickel-iron (Deltamax)ribbonsin flowing waterto measuretransient
meansurfacetemperaturesandmeasuredthetimefrom whentheribbonwasenergized
to the appearanceof the first bubble. The power input to the ribbon increased
exponentiallywith time. Measurementsof themeansurfacetemperaturesby meansof
readingribbon voltagesfrom Polaroidsof anoscilloscopehad largeuncertainties,on
theorder of + 12 to 19 °C. Fabic presented a model based on a uniform temperature
for incipient boiling which relied on assumed values of the advancing and receding
contact angle. He also found that the heat flux predicted by the Bergles and Rohsenow
(1963) correlation for incipient boiling with quasi-steady heating:
(2.301(pi0"0234))
q"l"-15.6p_.156(Tw-Ts) (2.45)
did not agree with the transient measured heat flux at the onset of boiling.
2.2.5 Buoyancy Induced Liquid Motion
When the local liquid temperature near the heating surface exceeds the
saturation temperature by some amount, determined by the microgeometry of the solid
surface, the surface-liquid properties, the surface temperature of the solid, and the
temperature distribution in the liquid, incipient boiling occurs. The heater surface
temperature and the liquid temperature distribution, in turn, depend on the heat flux
and velocity distribution of the liquid as affected by gravity induced buoyancy. For
forced convection boiling with Ri << 1, then the buoyancy forces are negligible. If Ri
--- 1, then the buoyancy forces and the inertial forces acting are of similar importance.
31
Forcedconvectionstudiesinvolving boiling inception were describedabove in the
previoussection.
For pool boiling in earthgravity, the liquid is initially stagnant.Buoyancyis
theonly forceto initiate bulk liquid motionduring theheatingof the liquid with Ri >>
1. The onsetof singlephasenaturalconvectionis an instability phenomenoninduced
by buoyancyforces. Studieswith the onset of natural convection occurring before
boiling inception in a heated liquid pool at earth gravity or greater acceleration are
reviewed in Ulucakli (1987). Additional works concerning the transient heating of a
liquid pool in earth gravity include that of Oker and Merte (1978) and Nghiem (1980).
In Oker and Merte (1978), the departure of the measured transient gold film
temperature from the one dimensional conduction prediction was considered to be the
onset of natural convection. For a flat rectangular heater surface horizontal up in earth
gravity, a semi-empirical correlation for the onset of natural convection was found and
is referred to in Chapter 5. In Nghiem (1980), transient boiling in water and Rl13
with various heater surfaces was investigated experimentally with an imposed step in
heat flux. Prior to boiling, the onset of natural convection was observed with
holographic interferometry for heated wires and a narrow (20 mm x 2 mm) thin gold
film heater. Nghiem proposed an empirical heterogeneous nucleation factor which
also included natural convection effects, and was described above in section 2.2.2.
2.3 Relationship to Proposed Research
The influences of surface microgeometry, surface energy, liquid temperature
distribution, externally forced liquid motion, and buoyancy induced liquid motion in
previous studies have been presented above in section 2.2. Information lacking in
previous studies but pertinent to the objectives of this work is now discussed.
32
In Oker (1973),it was shownthat fluid velocity as a consequenceof gravity
inducedbuoyancycanaffect initial boiling andthe early motion of thenewly formed
vapor phase. In Figure 2.4, incipient boiling with transientheatingoccurredat a
considerablylarger surface temperaturefor the horizontal up orientation than with
microgravity, with all other test conditionsheld constant. This differencein surface
temperatureat initial boiling demonstratesthat the temperaturedistribution in the
liquid, which is effectedby thefluid velocity, influencesincipient boiling. The effect
of aknown liquid temperaturedistribution at themomentof boiling inceptionandthe
resultingphasechangedynamicshasnot beenpreviouslyexaminedandis anobjective
of thepresentstudy.
In transientpool boiling in theabsenceof buoyancy,an initially quiescentfluid
remainsstagnantuponheatinguntil theonsetof boiling. The transienttemperature
distribution at the momentof initial boiling in a motionlessfluid canbe determined
from a conductionheat transferanalysiswith a high degreeof certainty. A heated
liquid in microgravity does not have buoyancyinduced fluid velocities, and thus,
microgravityprovidesaknownliquid temperaturedistribution atboiling inception.
Microgravity conditions may be obtained with drop towers, aircraft in
parabolicflight trajectories,andsoundingrockets. Although theavailabletimein drop
towersis short, up to a maximumof five seconds,a high vacuumdrop environment
can provide high quality microgravity, down to a/g = 10-5. The time availablefor
reducedgravity in aircraft flying a parabolic trajectory is typically greaterthan the
time of microgravity in drop towers,up to 25 seconds. The quality of the reduced
gravity when comparedto microgravity conditions of a drop tower is considerably
less,on the order of a/g = 0.02. In addition, the initial quiescentstatesrequiredto
obtain a well definedtemperaturedistribution for studiesof incipient boiling arenot
possiblesince operationrequires large gravity fields precedingeach trajectory, in
additionto thenormaldisturbancesassociatedwith aircraft in flight. Soundingrockets
33
havebeenusedto achievehigh quality rnicrogravity,claimedto beon theorderof a/g
= 10-4 for up to 140 seconds. The small size inherent in suchvehicles requires
limitations in the size of the heating surfaceand in the ability to obtain precise
measurements.Repeatedrocket launchesare costly, and the possibility for non-
reproducibility of the experimentalconditionsbetweentestsis increased,particularly
if new testequipmentmust be fabricatedbecauseof damageduring retrieval. The
present study is concerned with incipient boiling, and Merte and Littles (1971)
presented a summary of incipient boiling work in microgravity.
Table 2.1 presents a survey of transient incipient boiling experimental studies.
Oker (1973) examined the results of initial boiling of saturated R113 and LN2 in a
drop tower (a/g = 0.004 for 1.4 seconds) using a semi-transparent gold film on pyrex
glass. Oker was the first to measure the transient heater surface superheat required for
boiling inception in microgravity and in earth gravity for various orientations. The
degree of initial temperature uniformity was unknown, and special consideration was
not taken to absorb the infrared radiation from the 200 watt mercury arc lamp used for
the high speed filming. In addition, the system pressure was not controlled.
Straub et al (1990) summarized the results of a German microgravity boiling
test program from the mid 1970s to the present which used sounding rockets and
parabolic aircraft flights. Many of the tests were performed using heated wires. The
diameters of these wires were of the same size as the thermal boundary layer
surrounding the heated wires and comparable to the size of the vapor bubbles which
nucleated on them. Surface tension effects on vapor motion were quite different for
wires as compared to flat surfaces. Often the wires were completely enveloped by
vapor at boiling inception, and subsequent surface tension effects maintained a
"pseudo film" boiling only because of the wire geometry. Straub et al concluded that
the effect of buoyancy on pool boiling was very small. This conclusion, however, was
based largely on the results of the small diameter wire experiments (Weinzierl (1982),

34
Zell et al (1984)). In addition to the small heated wires, Straub et al also used thin
film resistance surface heaters for boiling tests.
In transient heating, different boundary, disturbances result in different
temperature distributions. An imposed step increase in heat flux has a constant
temperature gradient at the heater surface and provides an elementary boundary
disturbance: all other boundary disturbances can be constructed from a series of steps
in heat flux. An imposed heater surface temperature is another elementary boundary
disturbance important in heat transfer and produces a temperature distribution in the
liquid quite different from that of a step increase in heat flux. In Table 2. I, it may be
noted that no previous study used an imposed surface temperature to study transient
incipient boiling, as was used in the work described here.
The present work is the first experimental study of incipient boiling with
transient heating in microgravity where the quiescent fluid had an initial known
uniform temperature, and the pressure of the system was precisely controlled for
various subcoolings. The microgravity tests involved a single step in heat flux
imposed on a large flat heating surface for a five second duration with a/g = 10-5. As a
result of the well defined initial conditions of the tests and the single step in heat flux,
the temperature distribution in the liquid near the heating surface was computed with
certainty not previously possible. The present study is also the first to utilize an
imposed surface temperature to specifically examine incipient boiling.
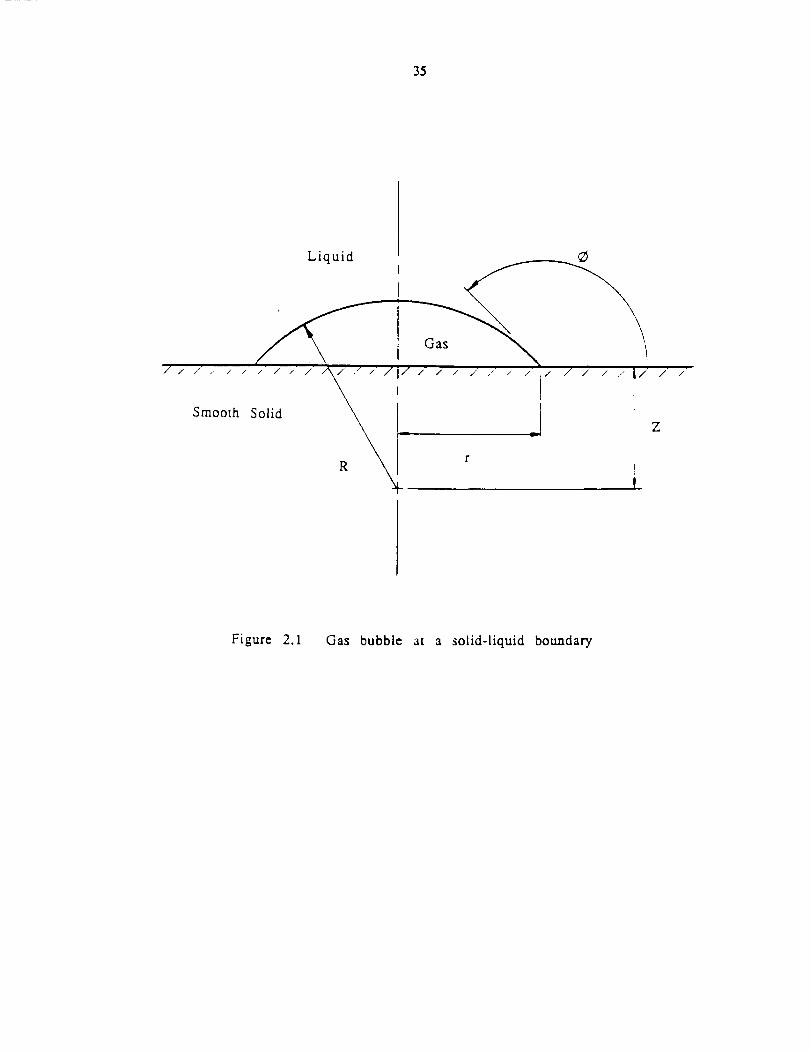
35
/ /
/ ., t i I t l" l _/ ,l i / / / 11
Smooth Solid
r
I ,, i I 1 / t t /l/ I I
I
_l z
Figure 2.1 Gas bubble at a solid-liquid boundary
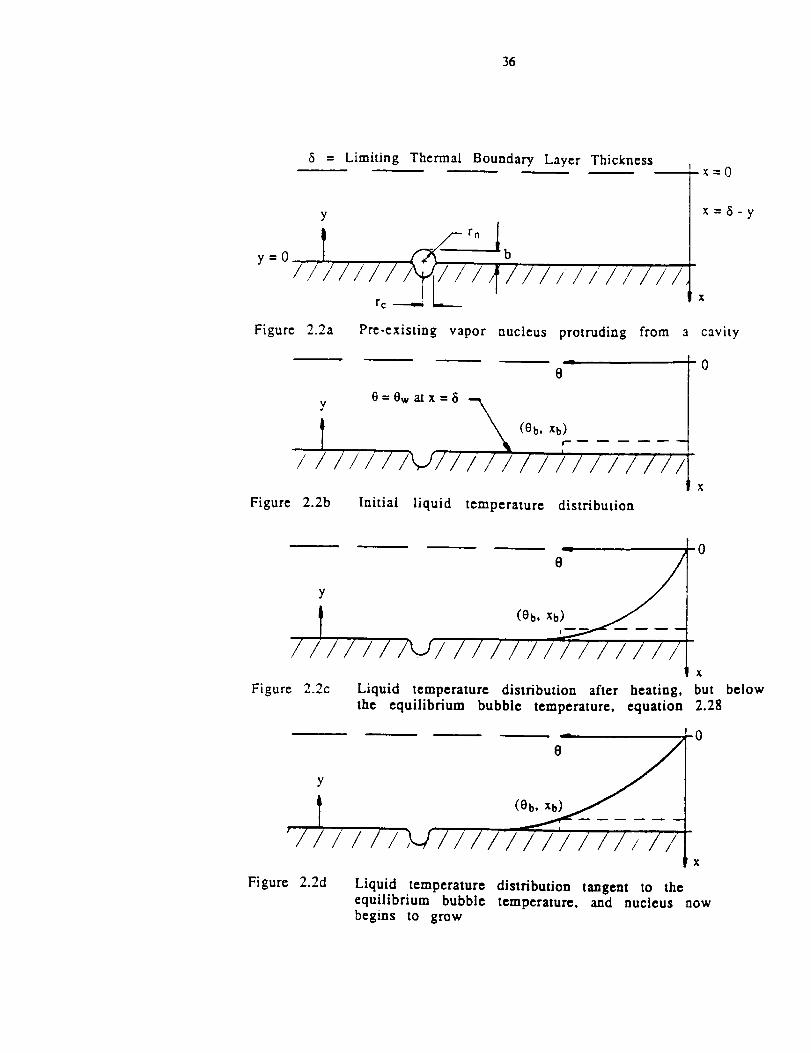
36
y=0
8 = Limiting Thermal Boundary Layer ThicknessI
y I x=8-Y
/////// /,f///////////rc ----_ _ l
Figure 2.2a Pre-existing vapor nucleus protruding from a cavity
0
O=0watx=8
t/ //////_-J?/ //)///////
Figure 2.2b Initial liquid temperature distribution
Y 0xh0)__
(Oh,/ /////_//////////////
Figure 2.2c
0
X
Liquid temperature distribution after heating, but
the equilibrium bubble temperature, equation 2.28
////////
Figure
Y
"//////,_../'//////
_0
2.2d
X
Liquid temperature distribution tangent to theequilibrium bubble temperature, and nucleus nowbegins to grow
below
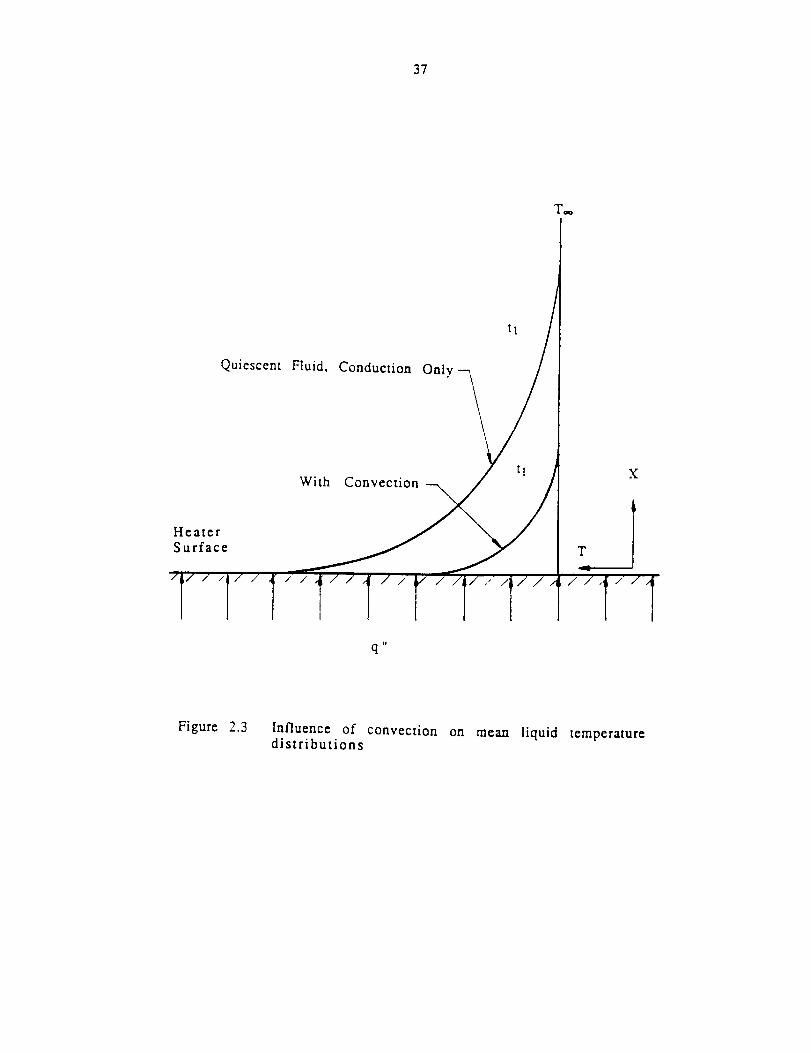
37
T_
Quiescent Fluid. Conduction Only
tl
HeaterSurface
tl XWith Convection
\ t
T
I
q I,
Figure 2.3 Influence of convection on mean liquid temperaturedistributions
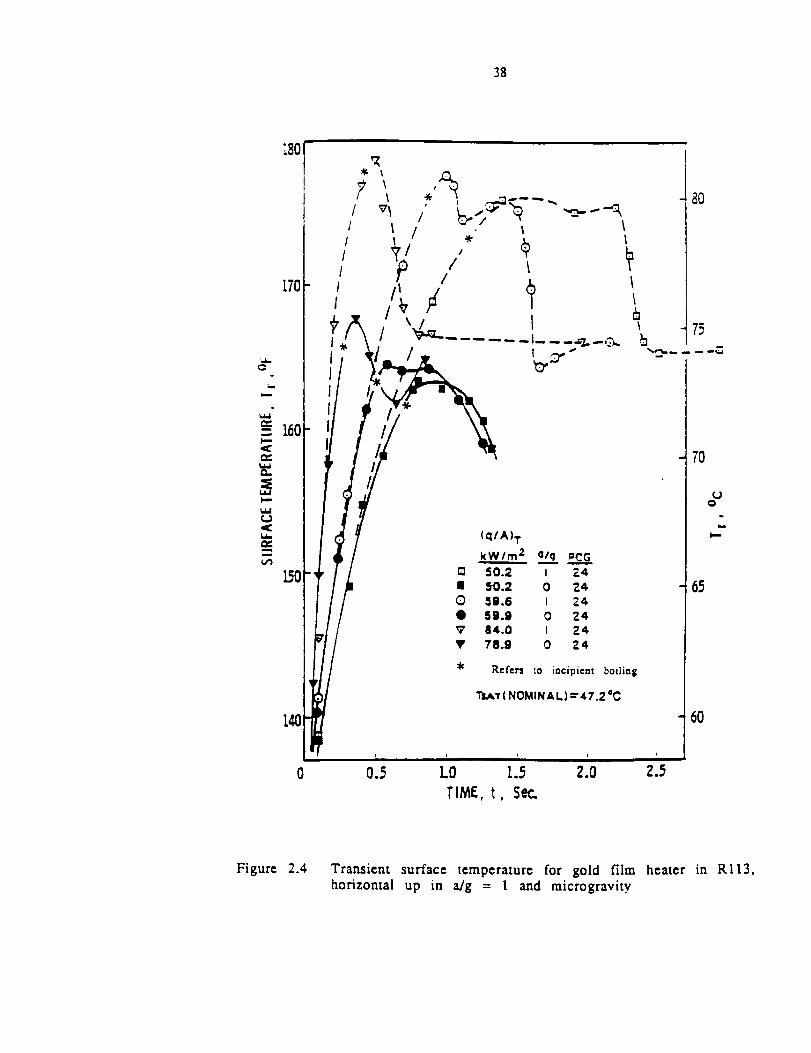
38
1801
170
140
_0
75
m o
7O
¢Jo
65
6O
Figure 2.4 Transient surface temperature for gold film heater in RI13,horizontal up in a/g = 1 and microgravity
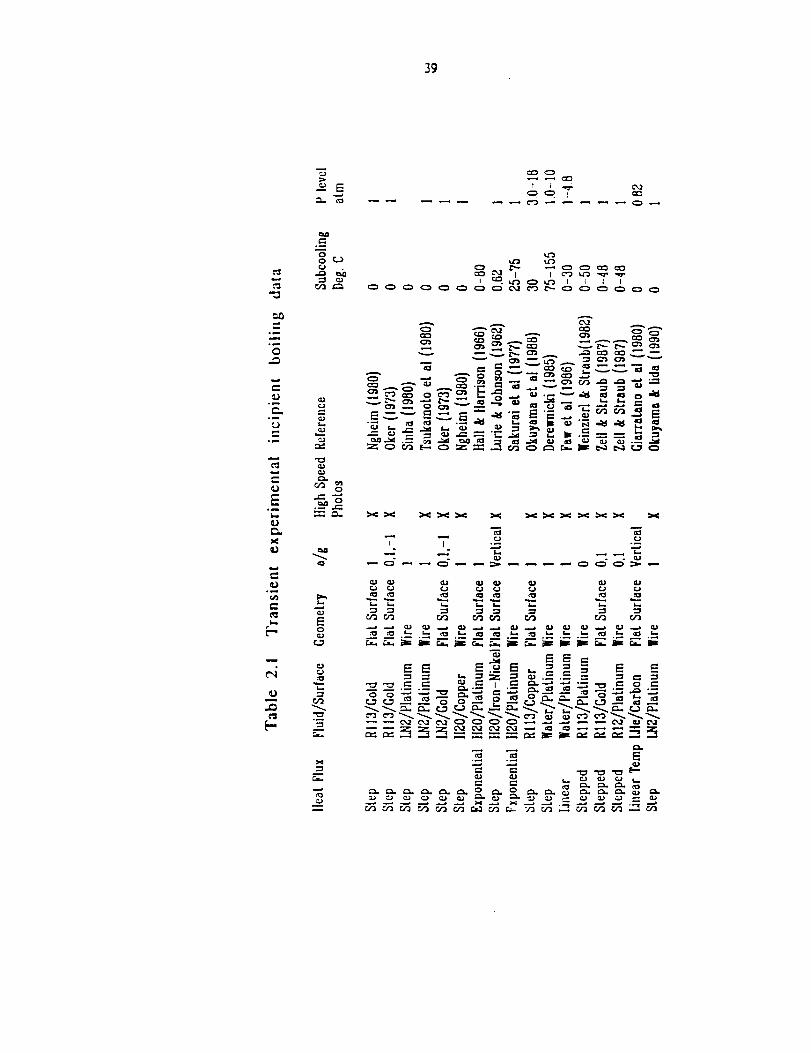
3g
c.) E
_0
°_
0
°_
°_
.m
m
E0_
L,
U
L.
E-
m
C'J
o
¢J
u
0J
0
E0
¢.3
>4
_X _X X _XX_X X
m
--_ .-_ L. _ .... _" e"
--N -N
._ ._ E
4O
CHAPTER 3
EXPERIMENTAL APPARATUS
This is an experimental study of incipient boiling with variable subcooling for
pool boiling. Pool boiling experiments were conducted in both earth gravity and
microgravity, Two different test vessels were used: a pool boiling vessel for earth
gravity studies (designated as the laboratory pool boiling vessel) and a pool boiling
vessel for microgravity tests in a drop tower (designated as the drop vessel). The heat
flux, heater surface temperature, pressure near the heating surface, and liquid bulk
temperature were measured in both test vessels. High speed video recordings for the
earth gravity experiments and high speed black and white movies for the microgravity
tests were obtained. The videos and movies were recorded using two orthogonal
views, across and through each test surface.
3.1 Common Experimental Elements
The heat transfer test surfaces, heater surface power controllers, test fluid, data
acquisition systems, thermocouples, optics, pressure control system, camera
synchronization, and vessel power supply were common to both of the test vessels and
will be discussed before the unique details of each of the individual vessels are given.
41
3.1.1 Heat Transfer Test Surfaces
Two different kinds of heating surfaces were used in the experiments: a thin
gold film deposited on a quartz substrate and a massive gold coated copper surface.
Two types of boiling tests were performed in this study, transient and quasi-steady.
The gold film heaters were used in both the transient and the quasi-steady tests, while
the large thermal mass of the copper heater restricted it to the quasi-steady heating
tests.
Figure 3.1 presents the concept of the gold film coated quartz heating surface.
A 400 angstrom thick gold film is sputtered on a quartz substrate which was pre-
sputtered with a 30 angstrom tantalum layer for improved gold adhesion. Before the
tantalum layer was applied, the surface was cleaned by ion bombardment to remove
about 10 angstroms of the quartz substrate. The thin film served simultaneously as a
heater and a resistance thermometer, and had a negligible time constant associated
with the transient temperature measurement. The temperature of the thin film thus is
identical to that of the surface of the quartz substrate. The quartz substrate was highly
polished by the manufacturer, using a 1.4 micron pitch polish. The semi-transparent
gold surface consisted of a rectangular shape 1.91 cm by 3.81 cm (0.75 inches by 1.5
inches), and was expected to be considerably larger than the size of the bubbles to be
formed above it. This semi-transparent gold surface had a higher resistance than the
10,000 angstrom thick gold surface near the power taps, which acted as the current
connection. The voltage measuring leads also consisted of 10,000 angstrom thick gold
films. Kovar screws passing through holes drilled in the quartz were used as power
and voltage taps. The low linear thermal expansion coefficient of Kovar closely
matched the linear thermal expansion coefficient of the quartz substrate, which was
mounted in a Teflon holder.
42
As in thework of Oker (1973, 1981),it wasfound that theelectricalresistance
of the gold surfacesvaried with time, but that the slopeof the linear relationshipof
surface resistanceand temperature,dR/dT, for each particular surface remained
constant. This resistancechangewas attributed to an aging effect. Following the
suggestionof Oker (1973), thesurfaceswere temperedat a temperatureof about275
°C for 20 minutes,which acceleratedthe aging to a stablelevel. It wasalsofound in
early testing that sputteredgold surfaceswere more durablethan thosedepositedby
vacuumevaporation. The temperature-electricalresistancerelation for eachthin gold
film surfacewasdeterminedby calibration,and thedetailsarepresentedin Appendix
B.1. On the day an experimentwas to be performed, the thin film heater was
calibratedin placewithin the testvesselbeforeheatingthevesselandthetest fluid to
the test temperaturelevel. This calibration is referred to here as the single point
calibration. The singlepoint calibrationconsistedof passinga small current,on the
orderof 20 milli-amps, acrossthethin film heaterto producenegligibleohmicheating
while simultaneouslymeasuringthe differential voltageacrossthe heatersurfaceand
the differential voltage across a heater shunt, which was in series. With the
differential voltageacrossthe heatersurfaceand the differential voltage acrossthe
shunt known, together with the calibrated shunt resistance, the heater surface
resistancewasdeterminedfrom Ohm's relationship. Sincethe test vesseland fluid
remainedat theambienttemperature,thetemperatureof the heatersurfaceduring the
resistancemeasurementwas known from the calibrated test vesselthermocouples.
Becausethe slopeof the linear temperature-resistancerelationshipremainedconstant
from previous calibration, this single measuredheater surface resistanceand
correspondingmeasuredfluid temperaturedeterminedthe constantrequiredfor the
temperature-resistancerelationship. Additional detailsof the singlepoint calibration
aregivenin section3.1.4.

43
Figure 3.2 showsthe designof the typical metal heaterusedfor the study of
initial boiling underquasi-steadyheating. Theheaterconsistedof a copperblock with
a film heaterimbeddedin a Stycastelectrical encapsulatingpotting compound. A
copperfoil, 0.00254cm (0.001inch) thick wassolderedto thecopperblock andto the
stainlesssteel holder to exposea continuoussurface to the heatedfluid, thereby
preventingpreferentialboiling at the crevice that would otherwisebe present. The
copper foil was sputteredwith gold to provide the identical heater surface-liquid
energy combination as the gold depositedon the quartz. A chromel-constantan
thermocouplewith abeadof 0.025incheswasinsertedinto a 0.030inch diameterhole
in thecopperheaterin orderto determinethetemperatureof thecopperfoil. Thehole
for the thermocouplewasfilled with a thermallyconductingcoppercompound. The
tip of the thermocouplewasabout0.030 inchesfrom the gold sputteredcopper foil
andwasessentiallyat the sametemperatureastheheatingsurface. To preventanyair
trappedbetweenthestycastandthefoil from expandinganddeforming thefoil during
the period when a vacuumwas imposedon the uppersurface(as requiredfor gold
depositionandfor thechargingof the testvesselwith the testfluid), it wasnecessary
to embedanevacuationtube passingthrough the stycastto a point just under the
copperfoil. Theotherendterminatedin a "quick-disconnect"fitting which could be
attachedto a vacuumpumpwhenrequired.
3.1.2 HeaterSurfacePowerControllers
Two modesof heatingwereusedin this study,transientandquasi-steady.For
the transient heatingstudiestwo different conditions were imposedon the heater
surface: a stepincreasein heat flux and a stepincreasein temperature. A heater
surfacecontrollerwasdesignedfor usewith both thestepincreasein heatflux andthe
44
quasi-steadyheating,anda differentheatersurfacecontroller wasdesignedto provide
thestepincreasein surfacetemperature.
The power supply for the step increasein heat flux and the quasi-steady
heating maintained a nominally constant voltage across the thin film surface for the
boiling tests. Since the resistance of the thin film test surfaces during heating changed
on the order of a few percent, the product of the current and voltage remained
essentially constant. The constant voltage power supply could accept either a
microprocessor input or a manual voltage pot signal as an input, and provided an
output signal to the base of the power transistors, which in turn powered the thin film
surface heater or copper block heater. The heater surface voltage was used as a
feedback signal, compared with the set point voltage, and the difference amplified to
furnish the appropriate signal to the power transistors. Details of the heater surface
controller circuit for the step in heat flux and quasi-steady heating are given in
Appendix E. 1.
The imposed step increase in surface temperature tests, performed only in the
laboratory pool boiling vessel, required a power supply different than that for the
constant voltage heater surface controller. With the heater surface inverted in earth
gravity for heating periods on the order of milliseconds, conduction heat transfer from
the heater surface to the liquid may be used to determine the transient heat flux
required to impose a constant heater surface temperature. The solution of equation
2.19, the one dimensional transient conduction equation, together with the boundary
condition of an imposed step in heater surface temperature for two semi-infinite media
with heat generation at their common plane, is well known. The result is a two
domain solution, a temperature distribution for each of the two media. The partial
derivative of the solution for each domain was evaluated at the common plane and
multiplied by the respective thermal conductivity to obtain the heat flux from the plane
of energy generation to each of the semi-infinite media. The transient heat flux to
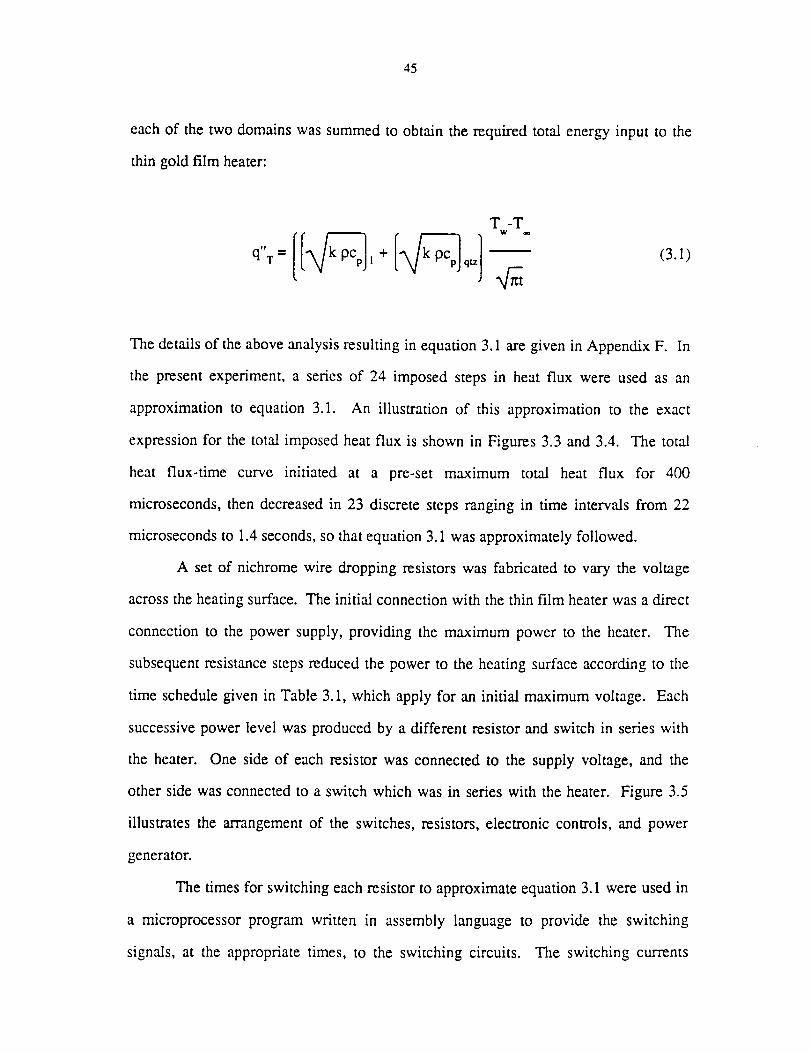
45
eachof the two domains was summed to obtain the required total energy input to the
thin gold film heater:
T-T
_0"T = +qtz
(3.1)
The details of the above analysis resulting in equation 3.1 are given in Appendix F. In
the present experiment, a series of 24 imposed steps in heat flux were used as an
approximation to equation 3.1. An illustration of this approximation to the exact
expression for the total imposed heat flux is shown in Figures 3.3 and 3.4. The total
heat flux-time curve initiated at a pre-set maximum total heat flux for 400
microseconds, then decreased in 23 discrete steps ranging in time intervals from 22
microseconds to 1.4 seconds, so that equation 3.1 was approximately followed.
A set of nichrome wire dropping resistors was fabricated to vary the voltage
across the heating surface. The initial connection with the thin film heater was a direct
connection to the power supply, providing the maximum power to the heater. The
subsequent resistance steps reduced the power to the heating surface according to the
time schedule given in Table 3.1, which apply for an initial maximum voltage. Each
successive power level was produced by a different resistor and switch in series with
the heater. One side of each resistor was connected to the supply voltage, and the
other side was connected to a switch which was in series with the heater. Figure 3.5
illustrates the arrangement of the switches, resistors, electronic controls, and power
generator.
The times for switching each resistor to approximate equation 3.1 were used in
a microprocessor program written in assembly language to provide the switching
signals, at the appropriate times, to the switching circuits. The switching currents
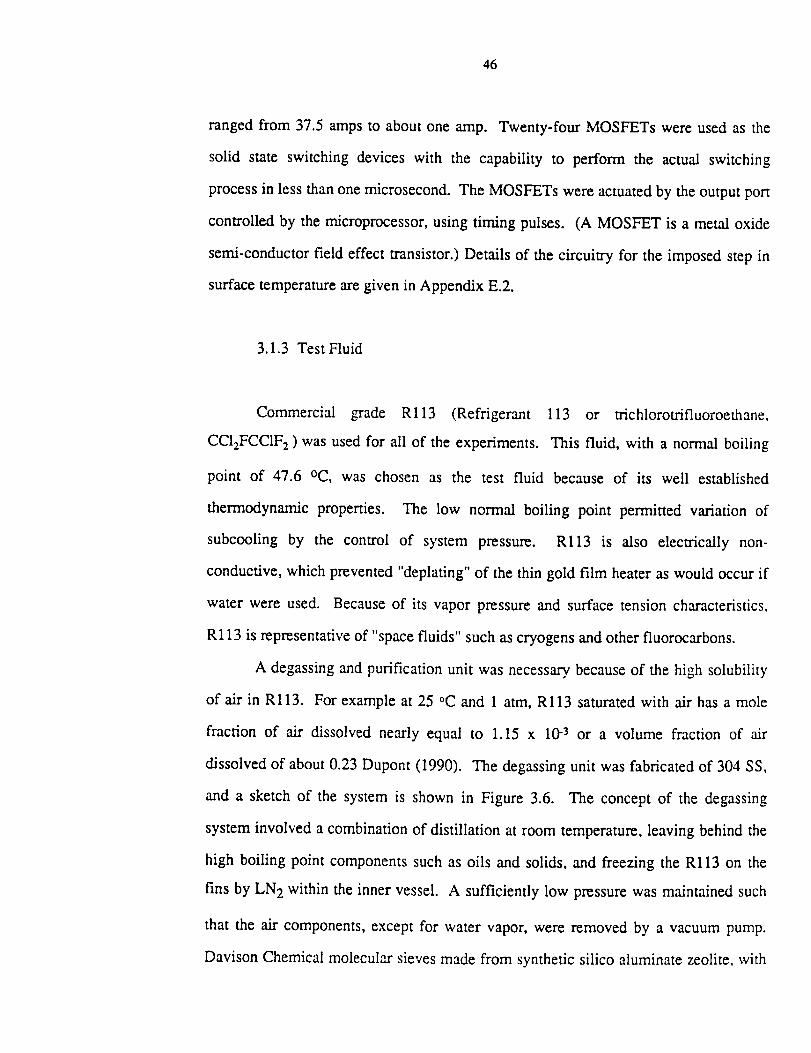
46
rangedfrom 37.5 ampsto aboutone amp. Twenty-four MOSFETswereusedasthe
solid state switching deviceswith the capability to perform the actual switching
processin lessthanonemicrosecond.The MOSFETswereactuatedby theoutputport
controlledby the microprocessor,usingtiming pulses. (A MOSFET is a metal oxide
semi-conductorfield effect transistor.)Details of thecircuitry for the imposedstepin
surfacetemperaturearegivenin AppendixE.2.
3.1.3 TestFluid
Commercial grade R113 (Refrigerant 113 or trichlorotrifluoroethane,
CC12FCCIFz) wasusedfor all of the experiments. This fluid, with a normal boiling
point of 47.6 oC, was chosen as the test fluid becauseof its well established
thermodynamicproperties. The low normal boiling point permitted variation of
subcooling by the control of system pressure. Rl13 is also electrically non-
conductive,which prevented"deplating"of thethin gold film heateraswouldoccur if
waterwere used. Becauseof its vapor pressureand surfacetensioncharacteristics,
R113is representativeof "spacefluids" suchascryogensandotherfluorocarbons.
A degassingandpurification unit wasnecessarybecauseof thehigh solubility
of air in Rl13. For exampleat 25 °C and 1 atm,Rl13 saturatedwith air hasa mole
fraction of air dissolvednearly equal to 1.15 x 10.3 or a volume fraction of air
dissolvedof about0.23Dupont(1990). The degassingunit wasfabricatedof 304SS,
and a sketchof the systemis shown in Figure 3.6. The conceptof the degassing
systeminvolved acombinationof distillation at room temperature,leavingbehindthe
high boiling point componentssuchasoils and solids,and freezingthe R113on the
fins by LN2within the innervessel. A sufficiently low pressurewasmaintainedsuch
that the air components,exceptfor water vapor, were removedby a vacuumpump.
DavisonChemicalmolecularsievesmadefrom syntheticsilico aluminatezeolite,with

47
a four angstromeffective pore size, were usedto remove the water vapor, and also
servedasamechanicalfilter.
3.1.4 DataAcquisition Systems
Becauseof thelargedifferencesrequiredfor therateof heatingin the imposed
constantheatflux experimentsandthe imposedsurfacetemperatureexperiments,two
differentvoltagemeasuringsystemswereusedfor dataacquisition: theCR7X andthe
Codassystem.
The Campbell Scientific Co. CR7X (Serial No. 1448) is a programmable
digital measuringandcontrollingdeviceusedto measuredifferential voltagesfrom the
thermocouplesandthepressuretransducerandacrosstheheatersurfaceandthe heater
shunt,in addition to sequencingeventsinvolving the drop vessel. The CR7X could
record data within eight voltage intervals from + 1.5 mV (with a resolution of 50
nanovolts) to + 5 V (with a resolution of 166 microvolts) at two different speeds,
designated as fast or slow. The CR7X sampled the voltage input channels sequentially
in time.
Four tests were performed to determine the performance characteristics of the
CR7X under various measuring conditions. The results of these tests are summarized
here, with the details given in Appendix C. The maximum uncertainty in voltage on
the fast sampling rate mode, the mode in which all tests were run, was + 0.6
microvolts. This maximum uncertainty in voltage readings corresponded to an
uncertainty in temperature as indicated by the thermocouples of about + 0.01 °C for
the 15, 50 and 150 mv ranges at the bulk liquid temperature level of 49 oC. The 15
mV and 50 mV voltage measurement ranges were the most desirable in terms of
stability and accuracy in the 20 to 60 °C ambient temperature range, and had the
smallest errors when compared to a standard reading from a potentiometer at the slow
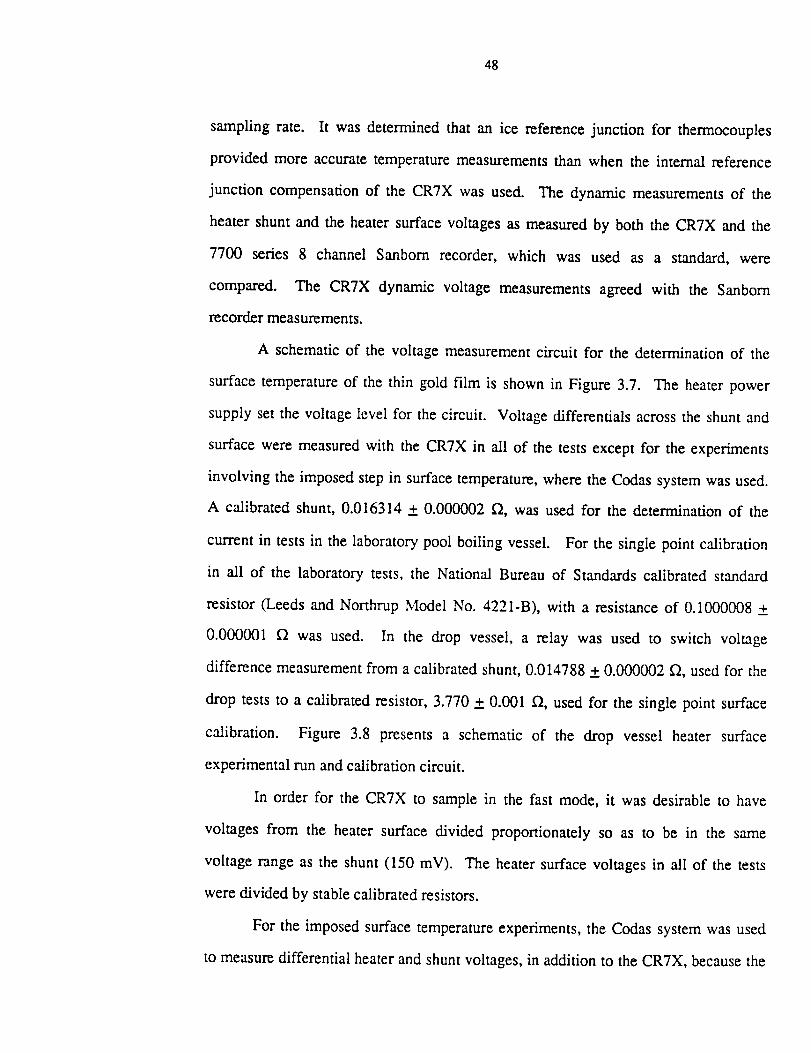
48
sampling rate. It wasdeterminedthat an ice referencejunction for thermocouples
provided more accuratetemperaturemeasurementsthan when the internal reference
junction compensationof the CR7X was used. The dynamicmeasurementsof the
heatershuntand the heatersurfacevoltagesasmeasuredby both the CR7X and the
7700 series 8 channel Sanborn recorder, which was used as a standard,were
compared. The CR7X dynamic voltage measurementsagreedwith the Sanborn
recordermeasurements.
A schematicof the voltagemeasurementcircuit for the determinationof the
surfacetemperatureof the thin gold film is shownin Figure 3.7. The heaterpower
supplysetthe voltagelevel for thecircuit. Voltagedifferentialsacrosstheshuntand
surfacewere measuredwith the CR7X in all of the testsexceptfor the experiments
involving the imposedstepin surfacetemperature,wherethe Codassystemwasused.
A calibratedshunt,0.016314+ 0.000002_, wasusedfor the determinationof the
current in testsin the laboratorypool boiling vessel. For the singlepoint calibration
in all of the laboratory tests, the National Bureauof Standardscalibratedstandard
resistor (Leedsand Northrup Model No. 4221-B), with a resistanceof 0.1000008_.+
0.000001 f2 was used. In the drop vessel, a relay was used to switch voltage
differencemeasurementfrom a calibratedshunt,0.014788+ 0.000002 _, used for the
drop tests to a calibrated resistor, 3.770 + 0.001 f2, used for the single point surface
calibration. Figure 3.8 presents a schematic of the drop vessel heater surface
experimental run and calibration circuit.
In order for the CR.7X to sample in the fast mode, it was desirable to have
voltages from the heater surface divided proportionately so as to be in the same
voltage range as the shunt (150 mV). The heater surface voltages in all of the tests
were divided by stable calibrated resistors.
For the imposed surface temperature experiments, the Codas system was used
to measure differential heater and shunt voltages, in addition to the CR7X, because the
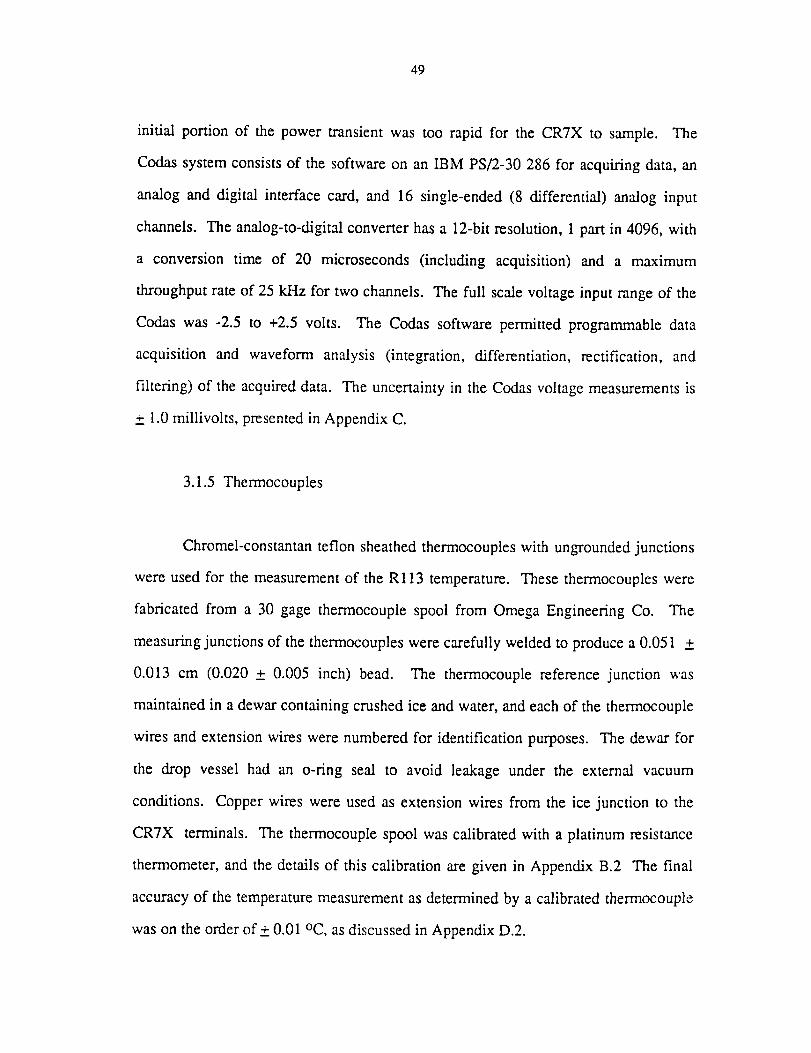
49
initial portion of the power transientwas too rapid for the CR7X to sample. The
Codassystemconsistsof the softwareon an IBM PS/2-30286 for acquiringdata,an
analog and digital interfacecard, and 16 single-ended(8 differential) analoginput
channels.The analog-to-digitalconvenerhasa 12-bitresolution,1part in 4096, with
a conversion time of 20 microseconds(including acquisition) and a maximum
throughputrateof 25kHz for two channels.Thefull scalevoltageinput rangeof the
Codaswas -2.5 to +2.5 volts. The Codassoftwarepermitted programmabledata
acquisition and waveform analysis (integration, differentiation, rectification, and
filtering) of theacquireddata. The uncertaintyin theCodasvoltagemeasurementsis
_+1.0millivolts, presentedin AppendixC.
3.1.5 Thermocouples
Chromel-constantanteflon sheathedthermocoupleswith ungroundedjunctions
wereusedfor themeasurementof the R113temperature.Thesethermocoupleswere
fabricatedfrom a 30 gagethermocouplespool from OmegaEngineeringCo. The
measuringjunctionsof thethermocoupleswerecarefullyweldedto producea0.051 _+
0.013 cm (0.020 + 0.005 inch) bead. The thermocouple reference junction was
maintained in a dewar containing crushed ice and water, and each of the thermocouple
wires and extension wires were numbered for identification purposes. The dewar for
the drop vessel had an o-ring seal to avoid leakage under the external vacuum
conditions. Copper wires were used as extension wires from the ice junction to the
CRTX terminals. The thermocouple spool was calibrated with a platinum resistance
thermometer, and the details of this calibration are given in Appendix B.2 The final
accuracy of the temperature measurement as determined by a calibrated thermocouple
was on the order of+ 0.01 oC, as discussed in Appendix D.2.
50
3.1.6 Optics
Two views of the heating surface were recorded in all of the transient
experimentsfor purposesof determiningthe incipientboiling time andfor observation
of phasechangedynamics. No imagesof the heatingsurfacewere recordedfor the
quasi-steadyheatingtests.
The optical arrangementfor the laboratorypool boiling vesseland the drop
vesselwereessentiallythesame.Figure3.9showstheopticalarrangementfor thetwo
orthogonalviews of the heatingsurface. Light passedacrossthe heatersurfaceand
simultaneouslythrough the surface for the two simultaneousviews. The light
sources, labelled L1 and L2, were 360 watt bulbs powered by a 110 volt a.c.
transformerto setthedesiredlight intensityin the caseof the laboratorypool boiling
vessel. For thedrop vessel,L1 andL2 were80 watt lights. It was found that neither
the 360 watt lights, setat their highestintensityin combinationwith the watercooled
infraredfilter (which containedwaterasan infraredabsorbingmedia)for usewith the
laboratorypool boiling vessel,nor the 80 watt lights, usedin combination with the
cold mirrors of thedrop vessel,producedanydetectableincreasein R113temperature
asmeasuredby the vesselthermocouplesover a 3 minuteperiod (a much longer time
period thananyof thetransienttests). Milk glassor groundglasswasusedto diffuse
the light to permit improvedimaging. Threemirrors, M2, M3, and M5, anda prism,
P1, directedthelight to the high speedcamera. A light block reducedthe amountof
light entering the cameraacrossthe heaterso as to producea picture of the same
brightnessasthe imageformed from the light which passedthroughthe surface. The
mirrors and prisms, fixed to a vessel-mountedframe,were adjustedso that the two
light pathswerenearlyequal.
The laboratorypool boiling vesseland the drop vesselhaddifferent imaging
cameras. The high speedcamerafor the laboratorypool boiling vesselwasa Kodak
51
Ektapro I000 Image System,which wasoperatedat speedsup to I000 framesper
second.This high speedcamerasystemmadevideorecordingswhich werestoredon
magnetictapecartridges. A D.B. Milliken high speedcamera(Model DBM 3A RFI,
28 volts d.c.) recorded boiling phenomena in the drop vessel on black and white film
at 400 pictures per second with timing marks at 100 Hz for reference.
3.1.7 Pressure Control System
A schematic of the pressure control system is shown in Figure 3.10, and was
essentially the same for both test vessels. The pressure system actively maintained and
measured the pressure level of the liquid within each of the test vessels, and consisted
of four main parts: a bellows, valves, electronic control circuits, and a pressure
transducer.
A seven inch diameter stainless steel bellows isolated the test fluid, located on
the inner side of the bellows, from the air (or nitrogen in the case of the drop vessel)
on the external side of the bellows. The valves, which opened or closed as directed by
signals from the electronic control circuits, admitted high pressure air to the bellows to
increase the system pressure or released air from the bellows to lower the system
pressure. The valves included two (four in the case of the laboratory pool boiling
vessel) pneumatic solenoid valves (Kip Inc. No. 0141013, 12 volts d.c.), a proportional
valve (Skinner valve No. BP2EV0035, 24 volts d.c. supply, 0-5 volts d.c. control), and
a needle valve.
A description of the electronic control circuits for controlling the pressure is
presented here, while the circuit diagrams are given in Appendix E.3. The pressure
control card received a set point either from a microprocessor, in the case of the drop
vessel, or from a manual input, for the laboratory pool boiling vessel and. The output
signal from the pressure transducer is also transmitted to the control card. The set

52
point voltage is comparedwith the actual pressuretransducersignal, and their
difference,suitablyconditioned,usedasinputsfor actuatingthevent andfill solenoid
valves and the proportional valve. While the proportional valve operated
continuously,the vent and fill solenoid valves were normally closed. They were
actuatedonly whenthepressureerrorexceededa pre-determinedvalue. The ventand
fill solenoidvalvescontrolledthelargepressuretransientswhile theproportionalvalve
controlled small pressurefluctuations. The vent and fill solenoidvalve controllers
openedthevalvesata givenerror level andcausedthemto remainopenuntil theerror
was reducedto half the original error. The proportional valve controller useda
combinationof proportional and integral controller modes. The proportionalmode
respondedto pressuretransientswhile the integral controllermodeattemptedto drive
the steadystateerror to zero. The proportional valve wasoperatedwithin its linear
rangeof operationby adjustingtheneedlevalve on the "fill side" sothat asvoltageto
the proportional valve was increasedor decreased,the flowrate from the bellows
changedin directproportionto thevoltage.
A HeiseModel 623pressuretransducerwasusedfor themeasurementandthe
pressurecontrol in the laboratorypool boiling vessel. The Heisepressuretransducer
had a maximumpressurerating of 344.74kPa (50 psia) and a sensitivity of 0.01724
kPa (0.0025 psi). The Heisepressuretransducerprovided a pressuremeasurement
with anuncertaintyof + 0.028 kPa _ 0.004 psi). The pressure level was controlled to
within + 0.172 kPa ( _.+0.025 psi) of the set point pressure, corresponding to _.+0.06 °C
0.1 °F) of the saturation temperature The pressure transducers were mounted
horizontally at the center of rotation on the laboratory pool boiling vessel so that
compensation for the change in hydrostatic pressure at the heater surface on test
package rotation took place requiring only a sign change, provided by the software
which translated the transducer signal into a pressure measurement.
53
The pressuresystemof the drop vesselwas similar to the laboratorydrop
vessel,exceptfor a few minor differences. The gasside of the bellows in the drop
vesselwaspressurizedby an on boardhigh-pressurenitrogentank supplyratherthan
by a building air supply as for the laboratory pool boiling vessel. Insteadof a
calibrated Heise 623 pressuretransducer,a calibrated Setra model 270 pressure
transducerwhich could withstanda 50 g impact wasmountedon the top vesselwall
andprovided pressuredeterminationwithin the desireduncertaintyrangeof + 0.172
kPa_ 0.025psi). In addition,asa guaranteeagainstthepossibledetrimentaleffects
of the droptowervacuum,theCR7X wasmountedin a pressurizedbox. A complete
pneumaticdiagramfor thedropvesselis shownin Figure3.11.
A discussion of the uncertainty estimates in the pressure transducer
measurementsis presentedin AppendixD.3. For pressurecalibrationof theHeiseand
Setrapressuretransducers,a RuskaPressureDeadWeight CalibrationSystem(2400
seriesdeadweightgage)wasemployed,andthedetailsof this calibrationaregivenin
Appendix B.3 TheRuskasystemwasalsousedfor calibratinga HeiseBourdontube
gagewhich in turn wasusedfor in-placeperiodic checkcalibrationsof the pressure
transducers.
3.1.8 CameraSynchronization
The camerawas synchronizedwith the powering of the heater surfacesto
establisha time referencefor the observationof incipient boiling phenomena.The
description of the synchronizationapparatusfor each of the vesselswill now be
presented,beginningwith the laboratorypool boiling vessel.
To synchronizethehighspeedvideosystemwith theswitchingonof theheater
power for the constantheat flux testsin the laboratorypool boiling vessel,a light
emittingdiodewasplacedin thefield of view of thecamera.Thelight emitting diode
54
was in parallel with a copperknife switch to the 24 volt power source. When this
knife switchwasclosed,thequartzheateranddiodeweresimultaneouslypowered. A
five millisecond delay exists until the light emitting diode provides sufficient
illumination for viewing by the camera. As a result of this delay, there was an
uncertainty of + 6 milliseconds in the time interval between heater powering and
visible light emitting diode illumination.
For the imposed step in surface temperature experiments in the laboratory pool
boiling vessel, a light emitting diode was placed in the field of view of the camera to
synchronize the camera with the powering of the thin gold film heater. The light
emitting diode, which was powered by a nine volt battery, was switched on by the
same signal that turned on the first MOSFET switch of the heater driver. The
uncertainty in the time interval between the powering of the heater and recording of
the light emitting diode at 1000 fps is + 1.5 ms. This uncertainty in the time interval is
smaller than that associated with the imposed step in surface heat flux because the
voltage switching for the diode was done by electronic components rather than by a
copper knife switch.
As in the case of the laboratory pool boiling experiments, a light emitting diode
was placed in the field of view of the camera for the synchronization of the high speed
camera with the powering of the thin film heater for the drop vessel experiments. The
CR7X powered the light emitting diode with a 5 volt signal 2.9 milliseconds after the
thin film heater was energized. The diode took 5 milliseconds to reach maximum
intensity. The uncertainty in the time interval between powering of the diode and of
the heater was + 7 milliseconds.
55
3.1.9 VesselPowerSupply
For the imposedstepin heat flux tests,with the lab pool boiling vesselan
essentiallynoise-free24 volt d.c. power supply consistingof two 12 volt batteries
connectedin serieswasused. A Sorensonthreephase240 volt a.c. powerconverter
suppliedup to 150 d.c. volts to the power heater supply for the step in surface
temperatureexperiments.The+ 5 and + 15 d.c. volts required for the control circuits
were supplied by a 110 volt a.c. converter. An additional 110 volt a.c. converter
supplied 12 volts for the operation of the solenoid valves.
The 24 volt d.c. power supply for the drop vessel heater and pressure controls
were provided by batteries mounted on the drop bus. The _.+5 and + 15 volt d.c. power
supply consisted of a 24 volt d.c. power converter mounted on the heater surface
controller cards. The 12 volt d.c. supply needed for the operation of the solenoid
valves was provided by batteries mounted on the drop bus.
3.2 Laboratory Pool Boiling Vessel
The laboratory pool boiling experiments were conducted at a/g = .4- 1. This
variation in body forces was achieved by inverting the test vessel from horizontal up
(a/g = + 1) to horizontal down (a/g = -1). Heat flux, liquid subcooling, surface type,
and orientation of heating surfaces were the test parameters.
The laboratory vessel shown in Figure 3.12 contained two heater test surfaces,
both located on the same surface of the vessel. Trunions located on opposite sides of
the vessel permitted rotation between the horizontal facing up and the horizontal
facing down orientations with respect to the earth body force direction. The laboratory
vessel was vacuum helium leak tested and was found to be leak free for the system
pressurized with R113.
56
The innerpartof the laboratoryvesselcontainingtheR113wassurroundedon
all sides,exceptwheretheheatingsurfaceandwindowswerelocated,by a circulated
mixture of waterandethyleneglycol (50% ethyleneglycol by volume). This mixture
was usedas it had desirableviscosity and heat transfercharacteristics. A precision
constanttemperaturebath (NeslabEndocal RTE-210) pumped the thermostatically
controlled water-ethylene glycol mixture through the laboratory vessel. The
temperature stability of the bath was + 0.02 oc. The temperature non-uniformity was
0.08-0.11 oC (0.15-0.20 °F) at the operating level of 49 oC, as determined by twelve
boiling chamber thermocouples. The circulation system of the laboratory pool boiling
vessel is shown in Figure 3.13.
The heating surface and viewing windows were surrounded by thick aluminum
walls to help provide uniform temperature conditions at the start of a test. The
viewing windows were made of optical quality quartz, and were enclosed by a glass
cover to minimize convection losses. Fins were located in the annular space between
the inner and outer sections of the laboratory vessel to promote heat transfer and to
guide the flow of the circulating water-ethylene glycol mixture. Fins were also welded
to the inner walls of the inner vessel to increase the heat transfer to the test fluid.
3.3 Drop Vessel
The drop vessel experiments were performed in the evacuated 132 meter drop
tower at the NASA Lewis Research Center, which provided 5.18 seconds of free fall at
accelerations of 10 .5 g. All of the experimental hardware associated with the drop
vessel were loaded on a one meter diameter "bus" for the drop. The drop chamber was
evacuated by a series of pumps to a final pressure near 10 .2 ton'. The bus was
decelerated in a 6.1 meter deep cylinder filled with polystyrene pellets.

57
radiation, which
stratificationtest,
heaters was less
stratificationtest.
Thedrop vesselandassociatedelectronicsweredesignedto takea 50 g impact
at the bottom of the drop towerunder the conditionsof a vacuum. The drop vessel
wasmadeof aluminum and of essentiallythe samedesignasthat of the laboratory
pool boiling vessel, except that the drop vessel was not double-walled and,
consequently,did not rely on external ethylene glycol and water circulation to
maintaina uniform Rl13 temperatureat the start of a test. Temperatureuniformity
wasachievedthroughthe useof film heatersmountedexternally to the drop vessel.
The drop vesselwasvacuumleak testedwith helium and found to be leak free for a
pressurizedsystem.An overviewof thedrop vesselis shownin Figure3.15.
Thedesireduniform temperatureof the testfluid beforethedrop wasachieved
by film heatersattachedto theexternalsurfacesof thetestvessel. A laboratory test to
determine the amount of temperature stratification in the liquid when using the
external wall film heaters was performed. After a time period of 5 hours following the
switching off of the external wall film heaters, the temperature stratification was 0.47
oC from the bottom surface to the top surface of the insulated vessel. A smaller
temperature stratification (about 0.2 °C) was expected for the vessel in the drop tower
before the drop, during the drop tower evacuation period for the following two
reasons: (1) the dominant mode of heat loss in the evacuated drop tower was
was less than the convective heat loss during the laboratory
(2) the time from the switching off of the drop vessel external film
than 2 hours, as compared to five hours for the laboratory
The temperature of the six sides of the vessel were controlled automatically
and independently: the temperature of the bottom surface was set with respect to the
ice thermocouple reference junction, while the temperatures of the other five surfaces
were controlled relative to the bottom surface. A thermopile summed the voltages of
the individual chromel constantan thermocouples distributed on the vessel wall. Mean
58
valuesof temperaturesfor a wall were obtainedby the averageof the thermocouple
voltageson the wall. Sinceeachof the vesselwalls washeatedwith respectto the
bottom wall, a differential thermopile measurementwas made using the bottom
surfaceas thereferencejunction. Powerwassuppliedto the wall film heatersby an
a.c.currentheaterdrive. A schematicof theexternalfilm heatingsystemis presented
in Figure3.15. Diagramsof theassociatedcircuitsappearin AppendixE.5.
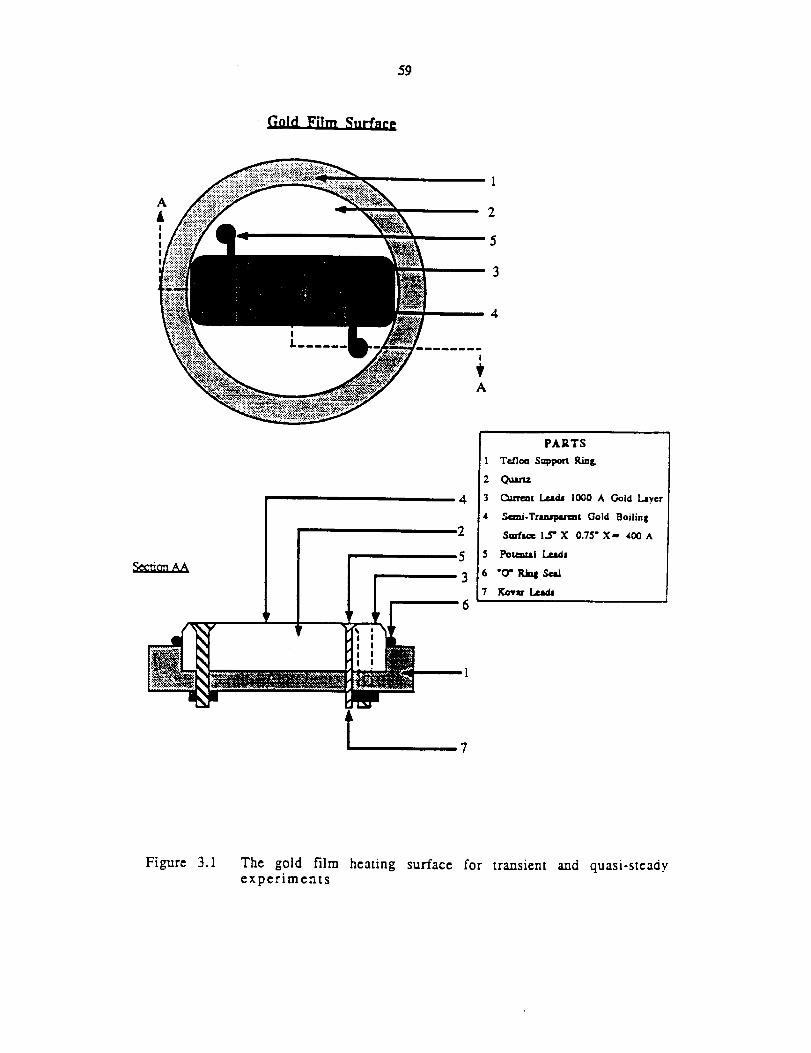
59
Gold Film Surface,
AtI
III
I
2
5
3
4
4
2
5
3
6
PARTS
I Te/lm Sappo_ Ping.
2 _mz
3 (_urrent l..eads 1000 A Gold Layer
4 5¢_.Trtasptrent Gold Boiling
Surf_e 1.5" X 0.'/5" X- +00 A
$ Pou_l L.r.mds
+ -o- mm,g,_=,1
7 ff_+ Le..a,_
I 7
Figure 3.1 The gold film heating surface for transient and quasi-steady
experiments
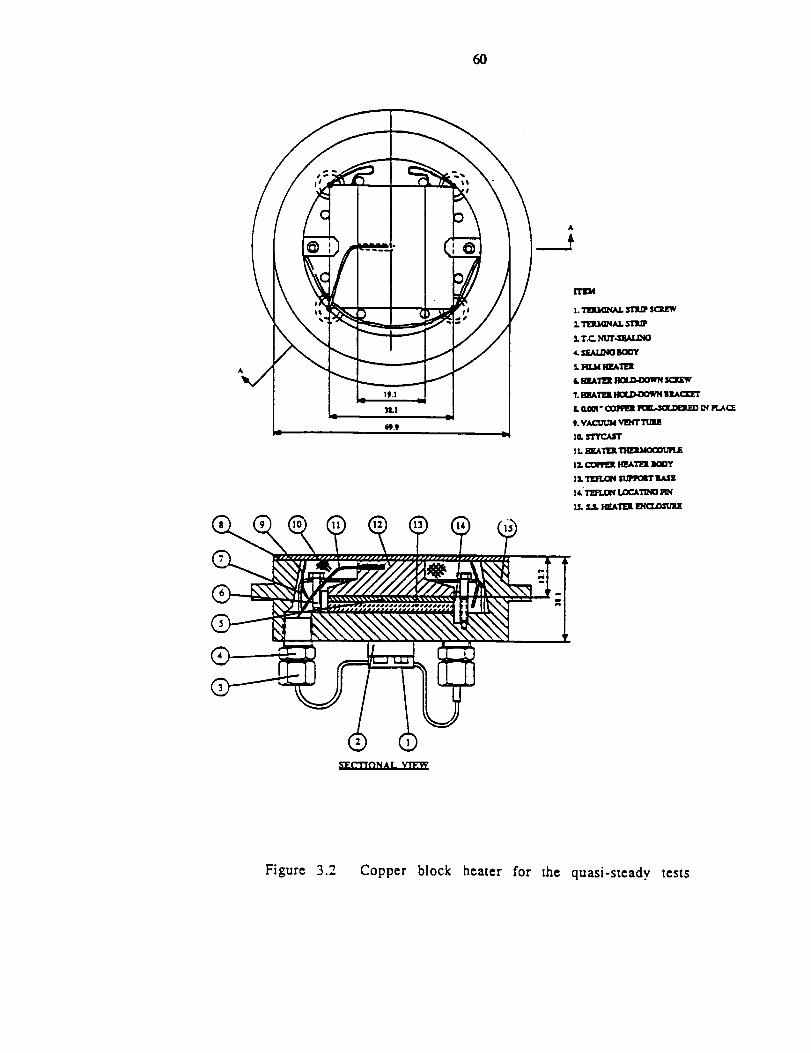
60
A
Figure 3.2 Copper block heater for the quasi-steady tests
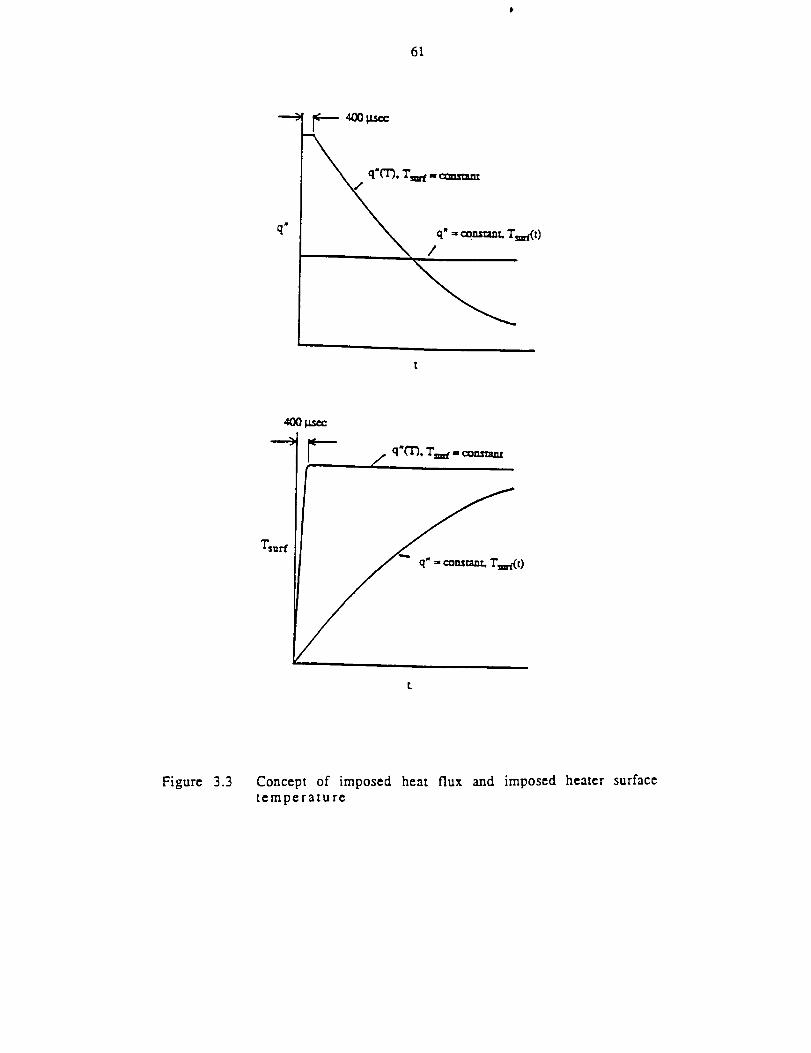
61
l
,t00 I.l.see
T_urt
q" _ contum_. T_'(O
Figure 3.3 Concept of imposed heat flux and imposed heater surface
temperature

62
Single step approximanon of q'T
q_
\
Figure 3.4 Series of steps in q"T as an approximation of the analytical q"T
for a step increase in surface temperature
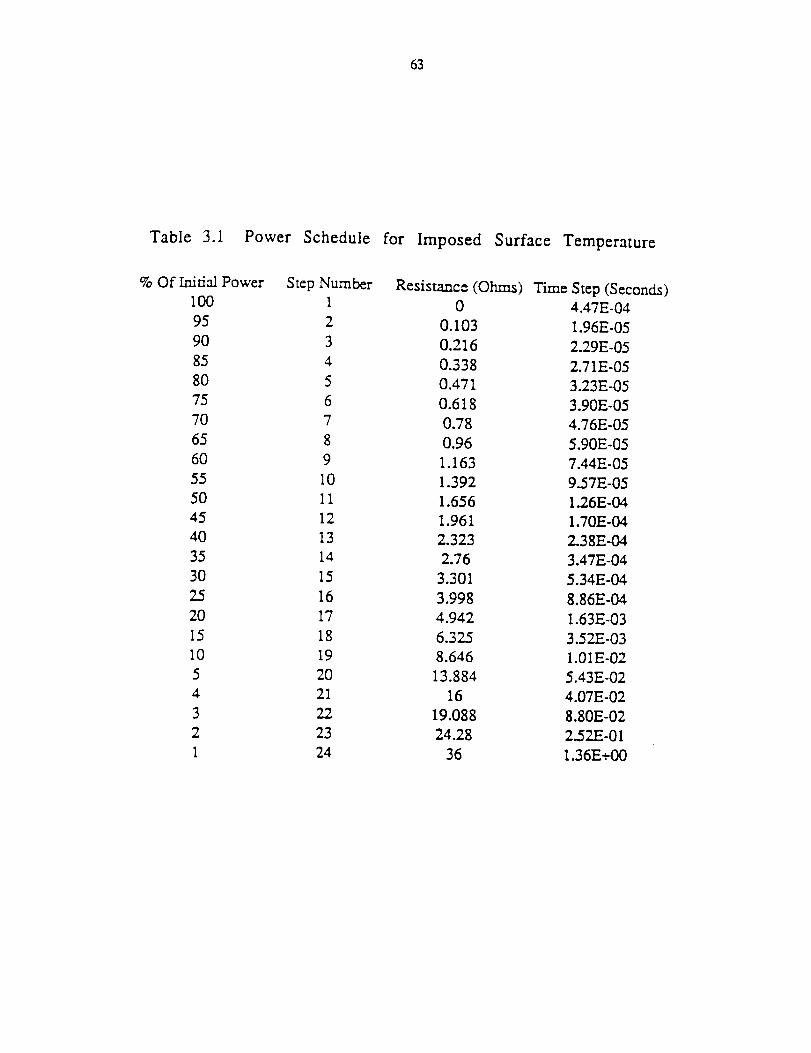
63
Table 3.1 Power Schedule for Imposed Surface Temperature
% Of Laida/Power Step Number Resistance (Ohms) Time Step (Seconds)
100 1 0 4.47E-04
95 2 0.103 1.96E-05
90 3 0.216 2.29E-05
85 4 0.338 2.71E-05
80 5 0.471 3.23E-05
75 6 0.618 3.90E-05
70 7 0.78 4.76E-05
65 8 0.96 5.90E-05
60 9 1.163 7.44E-05
55 10 1.392 9.57E-05
50 11 1.656 1.26E-04
45 12 1.961 1.70E-04
40 13 2.323 2.38E-04
35 14 2.76 3.47E-04
30 15 3.301 5.34E-04
25 16 3.998 8.86E-04
20 17 4.942 1.63E-03
15 18 6.325 3.52E-03
10 19 8.646 1.01E-02
5 20 13.884 5.43E-02
4 21 16 4.07E-02
3 22 19.088 8.80E-02
2 23 24.28 2.52E-01
1 24 36 1.36E+00
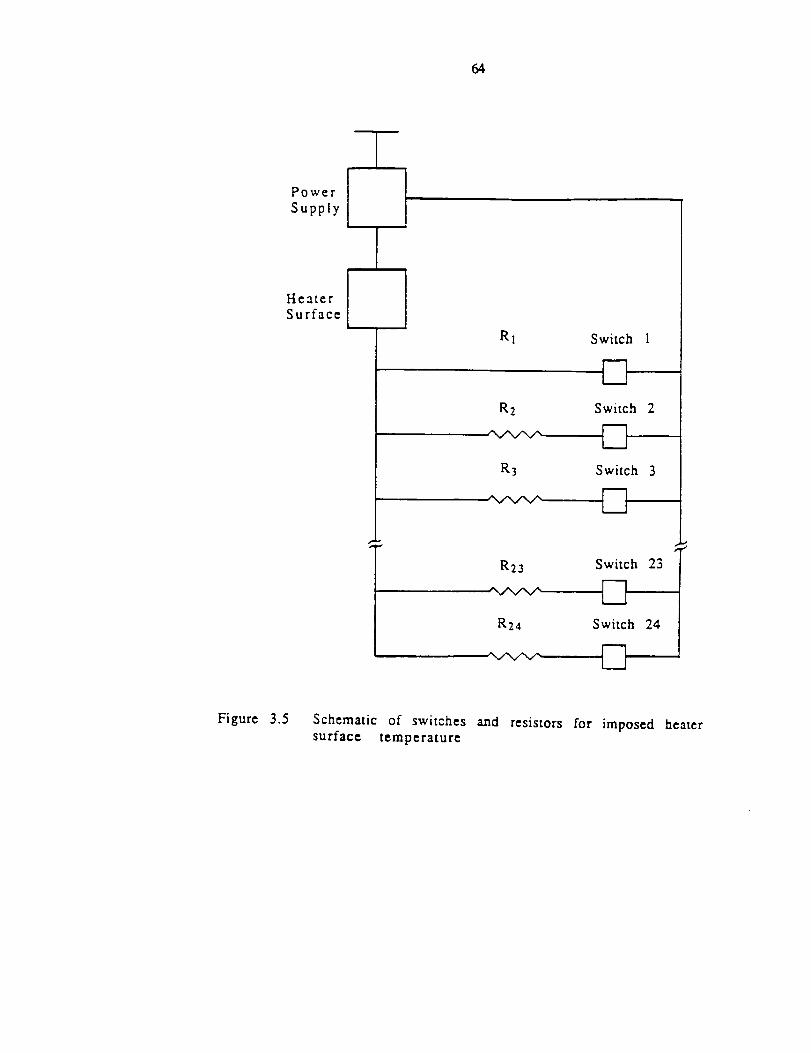
64
Power
Supply
He3.ter
Surface
R I Switch 1
R2 Switch 2
eN/N/N,_
R3 Switch 3
D
R23 Switch 23
R24 Switch 24
A
Figure 3.5 Schematic of switches and resistors for imposed heatersurface temperature
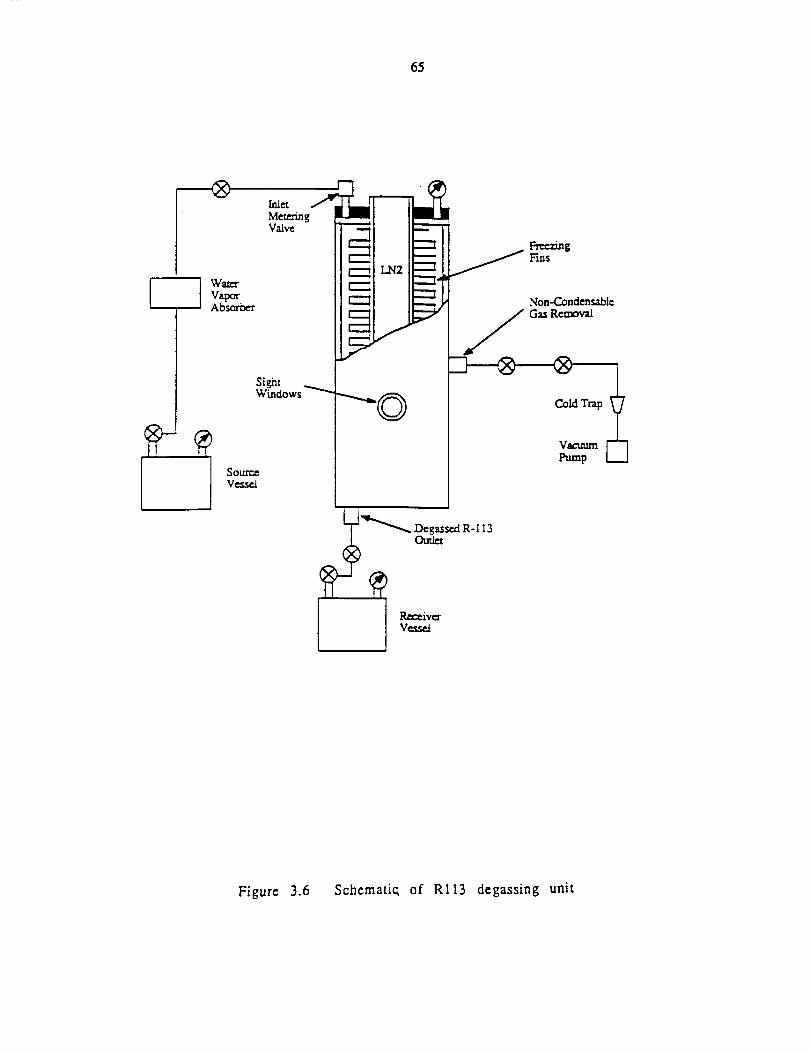
65
Wa.[¢=-
VaporAbsorber
Metro'ragValve
Windows
Sou/c_
Vessel
-
_'__ Deg,c_,,d R-113Outlet
I Receive="
Brcc_g
Fins
Non.Condensable
J G= Removal
Cold Trap
Figure 3.6 Schemati_ of RI13 degassing unit
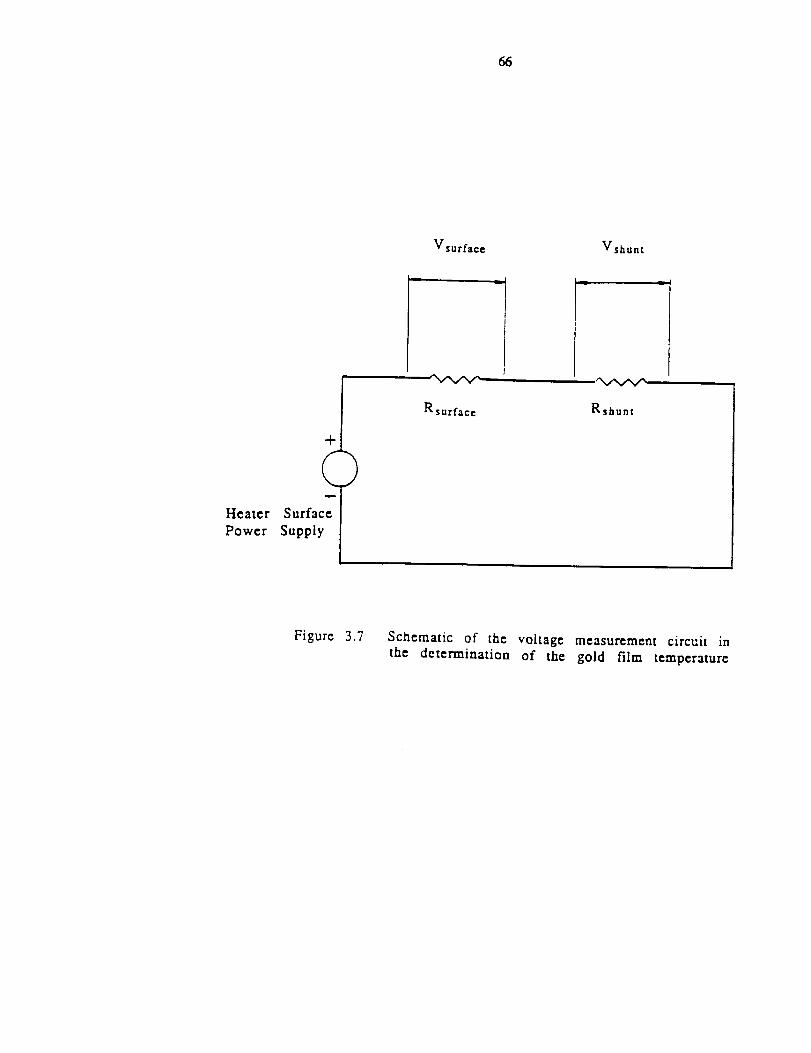
66
+
()Heater Surface
Power Supply
V surface Vshunt
Rsurface Rshunt
Figure 3.7 Schematic of the voltage measurement circuit in
the determination of the gold film temperature
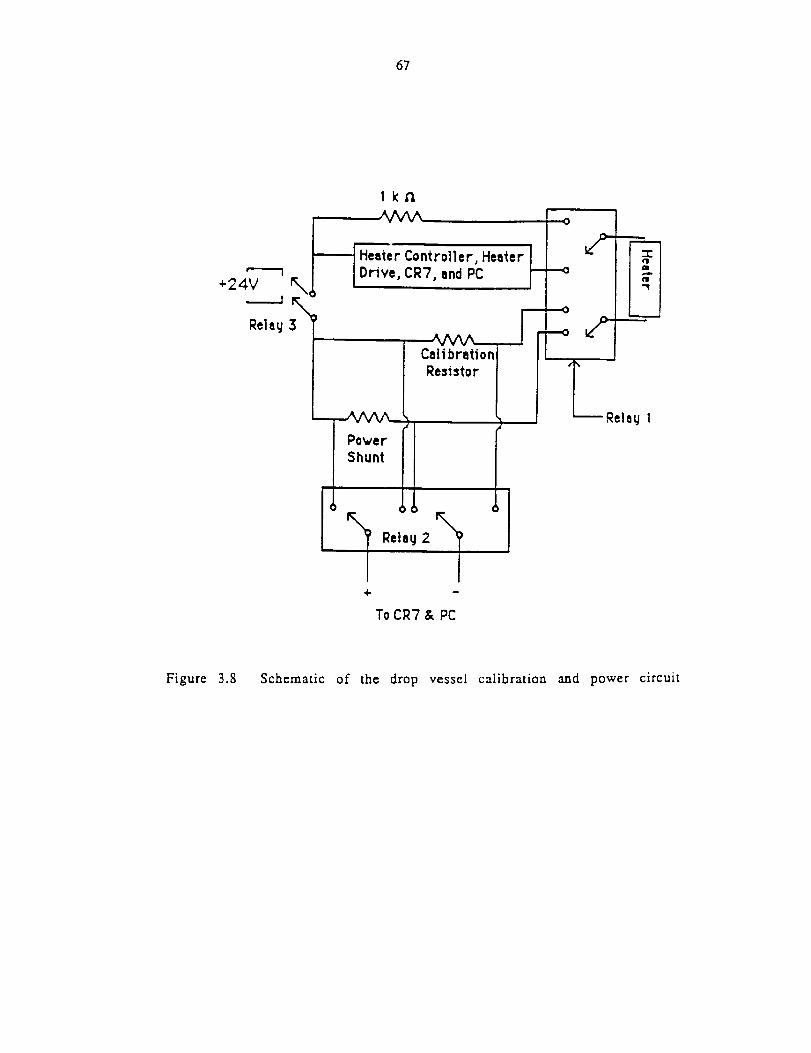
67
IkCX
HeaierController,Heater
Drive, CR7, end PC+24V r",x
- ,r,,,Reley 3
o
LRelng I
Shunt _._
4- -
To CR7 & PC
Figure 3.8 Schematic of the drop vessel calibration and power circuit
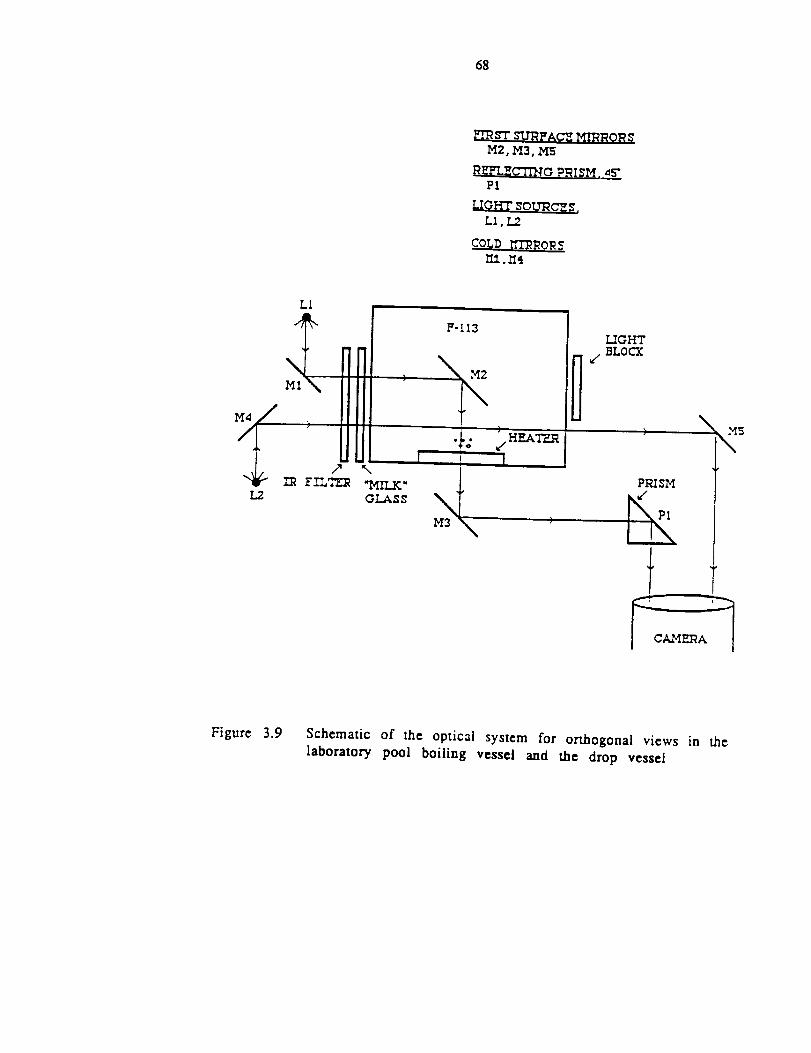
68
I'_ ST YdRFAC'Z MIRRO_,_M2, M3, M5
REFLE_G PRISM, ,15"P1
_USXZ_%9__tm__LI,L2
COLD nTRROR
I11.r1_
M4/
1.2
F-II3UGHT
_/BLOCX
_5
P_SM
Figure 3.9 Schematic of the optical system for orthogonal views in the
laboratory pool boiling vessel and the drop vessel
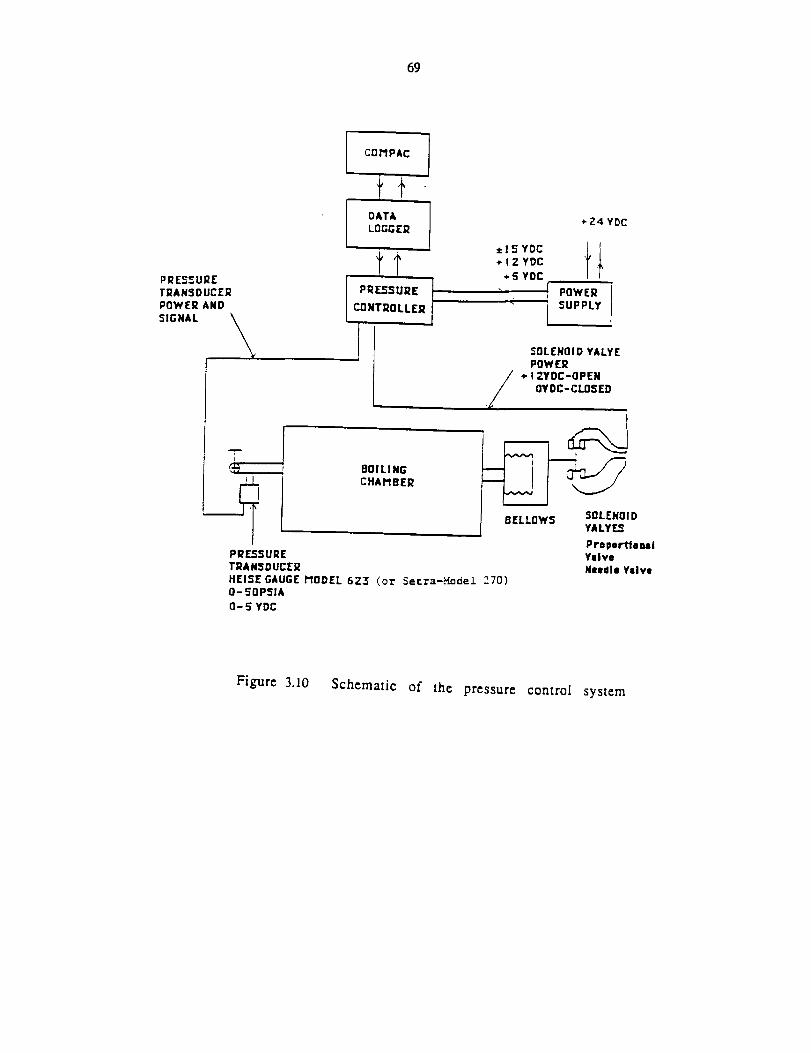
69
PRESSURE
TRANSDUCER
POWER AND
SIGNAL \
I COMPAC
I DATALaGGER
PRESSURE
I CONTROLLER
r._, BOILING
CHAMBER
PRESSURE
TRANSDUCER
HEISE GAUGE MODEL 6Z3 (oz" Set=a-._ede.L 270)
Q-5OPSIA
0-5" YDC
4";..4 Y0C
±1_ YOC 't 1_- I Z YDC
÷5" YOC
:' . !POWER i
i SUPPLY I
SOLENOID YALYE
POWER
/ * I ZYDC-OPENOYDC-CLDSED
BELLOWS SOLENOIDVALVES
?reper"tfen81Valve
Neeelle Valve
Figure 3.10 Schematic of the pressure control system
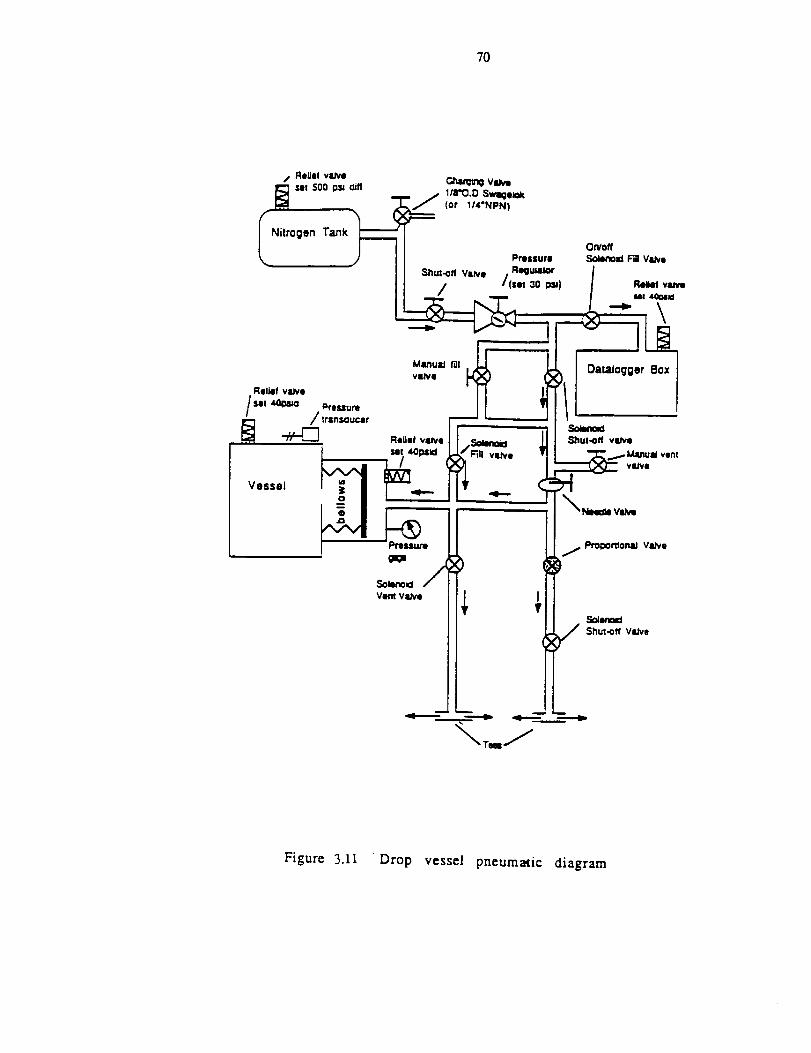
70
Nitrogen Tank
Shut-off VINe
/
DataJogger
Soiencxl
Shut-off Vs,'ve
_r
Figure 3.11 Drop vessel pneumatic diagram
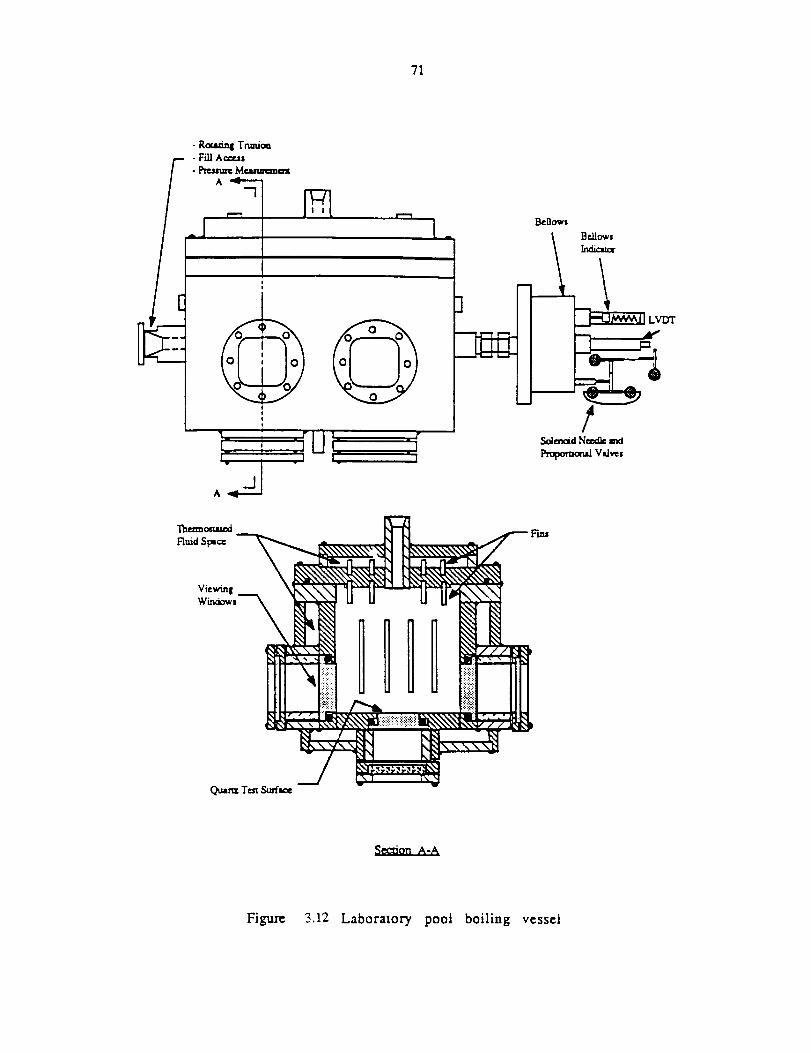
71
g
!i
"L rt- t ",11_," "',i" , "1 ," ;]
_ A
Benows
tPt_pa_otud Wlv_s
"l_ezmo_a_d
Fluid Spac_
/
Section A-A
Figure 3.12 Laboratory pool boiling vcsscl
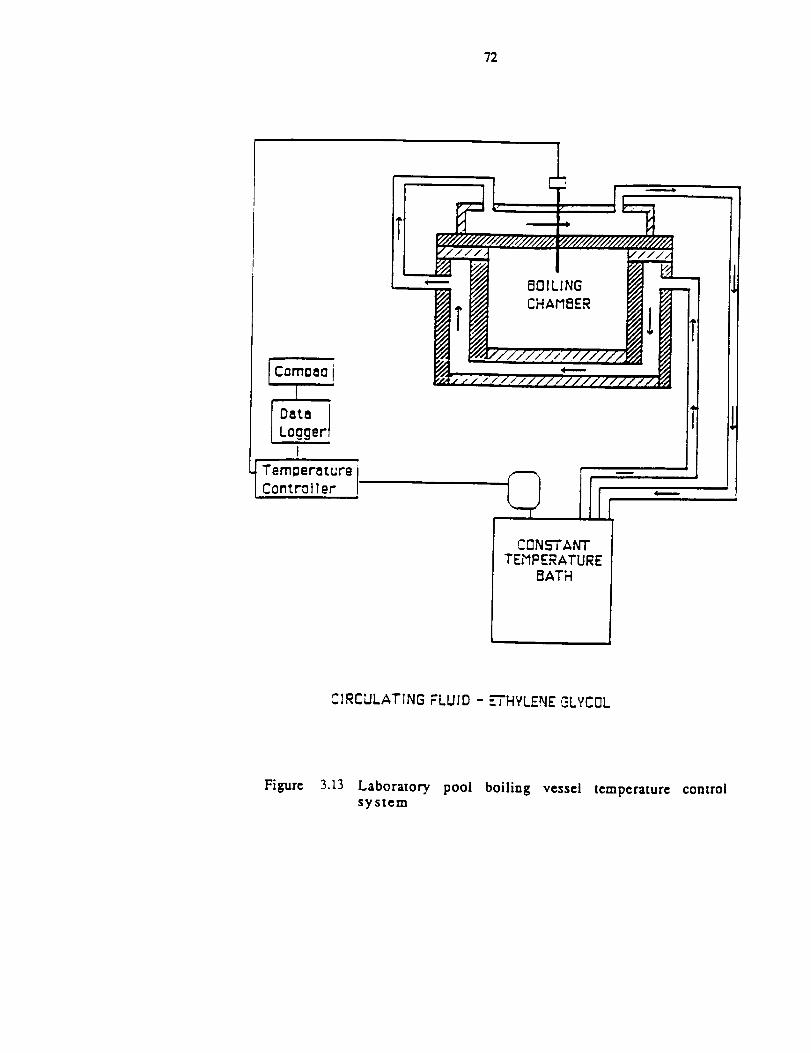
72
L
8OILING
CHAMBER
Comoo{_ i
t,Ost_ I
Logger!I
Temoerature iControl ler
CONSTANTTEMPERATURE
OATH
I
CIRCULATING FLUID - ETHYLENE GLYCOL
Figure 3.13 Laboratory. pool boiling vessel temperature controlsystem
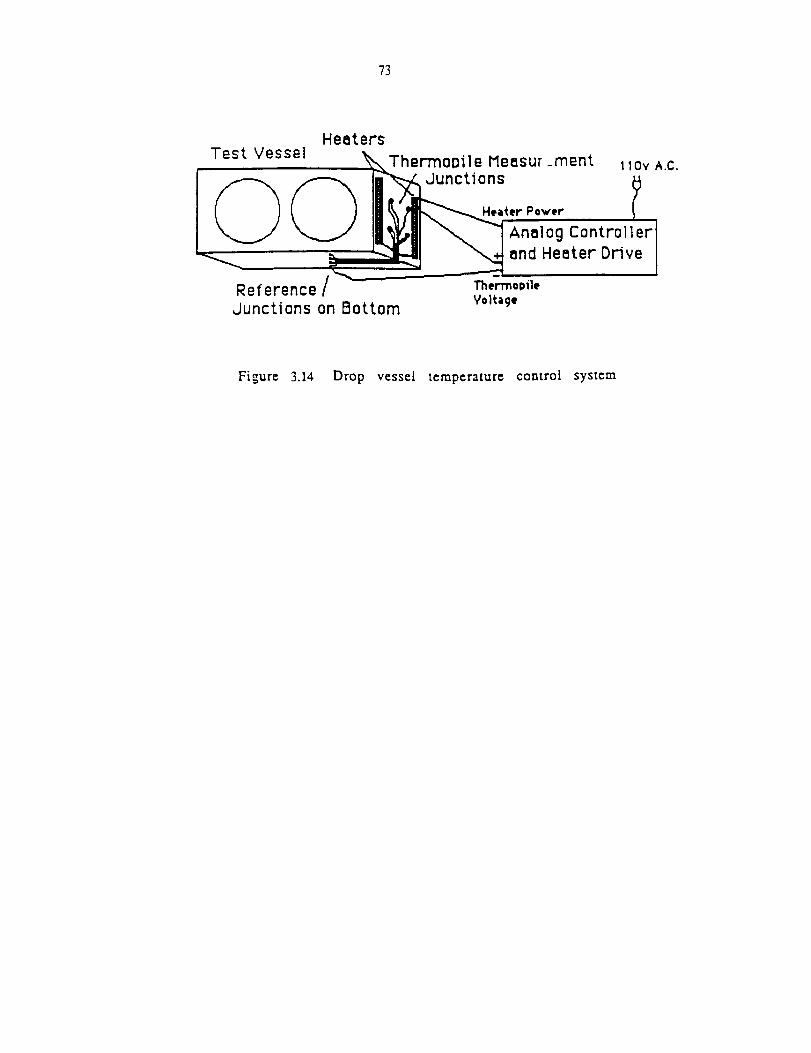
73
HeatersTest Vessel
Reference /
Junctions on Bottom
ThermoDile Measur _merit 11ov A.c.
Junctions IHeater Po_er
Analog Controll:rIand Heater Driv
ThermoDile
Voltage
Figure 3.14 Drop vessel temperature control system
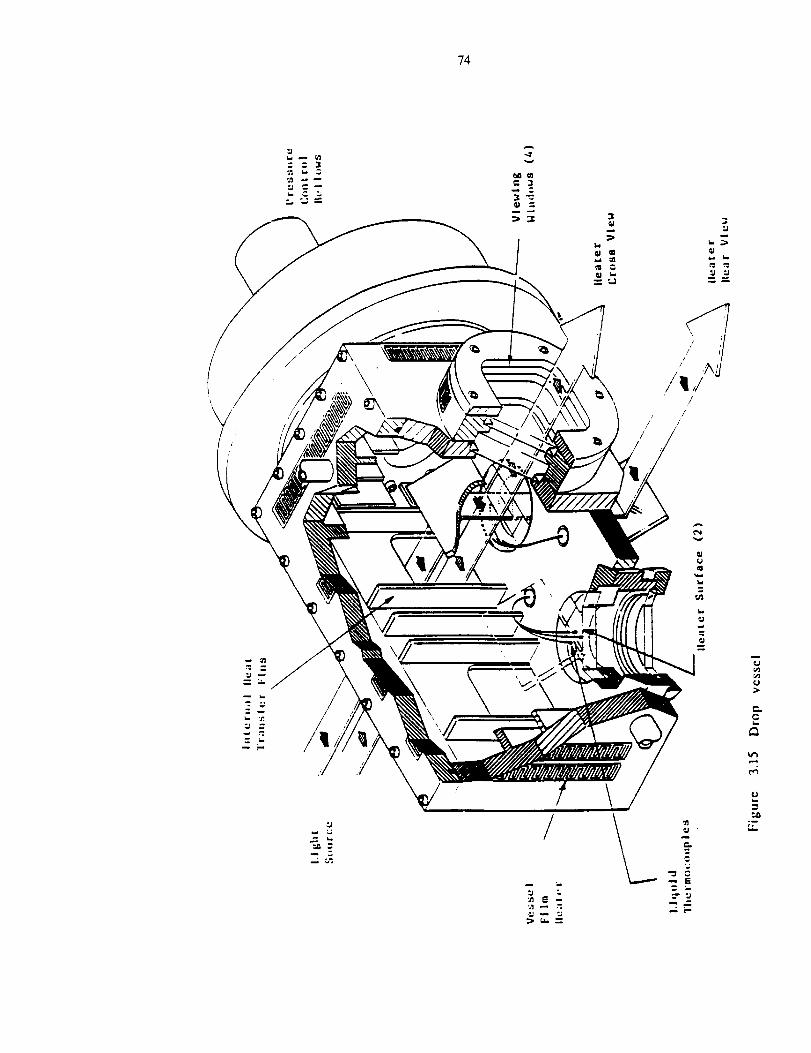
?4
\
._ --
\
!
E --
_,_ _
/
/7
/
\
_; _,.
i_,)
C.
_J
75
CHAPTER 4
EXPERIMENTAL PROCEDURE
The experimental procedures that were followed are described below. Several
of the test procedures are common to both test vessels used and are presented f'n'st: the
charging of the vessels and the calibration of the thin film heater surfaces. The filling
of the test vessels will be described first.
4.1 Common Procedures
Because of the high solubility of air in Rl13, precautions were taken in the
filling process to insure that no contact was permitted between the degassed R1 13 and
air. The description of the degassing system was given previously in Section 3.1.3. A
filling cart fabricated from angle iron held a vacuum pump, a valve system and
associated piping, and a pressure gage. The vacuum pump was used for the evacuation
of the test vessel and the connecting line to the test vessel. The piping connected the
test vessel to the tank holding the degassed R113, and the valve system permitted the
evacuation of the test vessel and piping without opening the valve of the Rl13
container. The vessel and associated piping and valves were evacuated with a vacuum
pump for eight hours to remove air and water vapor. The pressure gage provided an
approximate vacuum indication before the R113 was allowed to flow from the storage
container. In addition, this filling cart supported the elevated storage tank of the
degassed R1 13 which provided the hydrostatic pressure for filling the test vessel.
76
The storagecontainerwas irradiatedwith heat lamps to maintaina positive
pressurerelative to the atmosphere.When thepressuregagemountedon thestorage
container indicated a gage pressureof 34.47 kPa (5 psig), the valve betweenthe
storagecontainerandthestainlesssteellineswasopenedandR113flowed into thetest
vessel. The systemwas flushedwith R113vaporseveraltimesbeforefilling with the
liquid, to furtherremoveanypossibleresidualgases.To avoid contaminationof the
degassedRl13 by atmosphericair, the pressurein the boiling vesselswas always
maintainedabovethe ambient,either by the bellows actuatedpressuresystemor by
heating.
For every test, a single point calibrationof the thin film heatersurfacewas
performedbeforeheatingthetestfluid to theoperatingtemperatureof theexperiment.
As discussedin Section3.1.1, the linear temperature-resistancerelationshipchanged
with time, with observablechangesoccurringafter abouta week. However,the slope
of the temperature-resistancerelationshipremainedconstant,and hence,only a single
calibration point was necessaryfor the determinationof the new temperature-
resistancerelationship. Prior to the heatingof thetest fluid, the surfacetemperature
wasknown with certaintysince the entire testpackagewasat the accuratelyknown
ambienttemperature,determinedwith thecalibratedthermocouplesof thevessel.This
known surface temperaturewas determinedsimultaneouslywith the heater surface
resistancefor thecalibrationpoint data. The procedurefor the singlepoint calibration
of thegoldfilm heatingsurfacewasdescribedin detail in Section3.1.1.
Theexperimentalproceduresrequiredfor conductingtheexperimentswith the
laboratorypool boiling vesseland the drop vesselwere slightly different from one
anotherdue to the variation in vesselinstrumentation. Observationof the boiling
inception times, phasechangedynamics, and natural convectionphenomenawere
obtained with the high speed camera recordings in the transient experiments.
Subcooling in all of the tests refers to the difference between the saturation
77
temperaturecorrespondingto thesystempressureandthe bulk liquid temperature.In
the following experiments,the total heat flux, q"'r, refers to the total thermalpower
generatedin theheatingsurfacedividedby theareaof theheatersurface.
4.2 LaboratoryPool Boiling Vessel
Transientandquasi-steadyexperimentswereperformedin the laboratorypool
boiling vessel following the calibration of the thin film heating surface. The
laboratorypool boiling vesselrequiredtwo hoursto reacha steady-stateuniformR113
temperaturedistributionwithin thevessel,nominally48.5 °C (with a spatialvariation
of + 0.06 °C as indicated by the internal calibrated thermocouples), as ethylene glycol
and water circulated in the outer vessel jacket from the constant temperature bath. The
nominal operating temperature of 48.5 °C was selected since this is slightly above the
R113 saturation temperature (46.7 oC) corresponding to atmospheric pressure.
Subcooling can be obtained by one of two methods: (1) with a constant liquid
temperature by pressurizing the liquid above the saturation pressure corresponding to
the constant temperature or (2) with a constant pressure by cooling the liquid below
the saturation temperature corresponding to the constant liquid pressure. At the
beginning of a run, the desired liquid subcooling level of either 0, 2.8, or 11.1 °C, was
set by the former method with the pressure controller, with the pressure maintained
constant for each test.
After the desired subcooling was attained, the camera lights were switched on
with water circulating through the double-walled infrared water filter, necessary to
eliminate the heating of the R113. A cool-down period of 45 minutes between tests
provided the same reproducibility of the boiling inception surface temperature (within
5% of the previous value) as that obtained by waiting 36 hours. This cool-down
period allowed the heating surface to cool to the original liquid temperature before

78
energizationof the heater,and permitted the observablevapor bubblesto collapse.
The proceduresfor the transient heating measurementswill be presentedfix'st,
followed by thatfor quasi-steadyheating.
4.2.1 TransientHeatingMeasurements
The transient experimentsperformed in the laboratory pool boiling vessel
imposedeither a stepin the heatersurfaceheat flux or a stepin the heatersurface
temperature. The purposeof using thesetwo different typesof transientswas to
examinethe effect of the heatingrateon the incipient boiling process,asmanifested
by the heatersurfacetemperatureat the appearanceof the first vapor bubble,and by
theassociateddelaytime from theonsetof heating.
4.2.1.1 ImposedConstantHeatFlux
For the transientimposedconstantheatflux tests,a light emitting diode was
placedin thehigh speedvideocamerafield of view to synchronizethe time whenthe
thin film heaterwas energizedwith the operationof the camera. A copperknife
switchconnectedtheheatercontroller to theheatersurface. The 1.5volt diodewasin
parallelwith theknife switchsuchthatwhentheswitchwasclosed,thediodelighted.
A commandgiven to the CR7X dataacquisitionunit via a portablecomputer
initiated thedataacquisition,andthe camerawasthenswitchedon. At this point the
knife switch was closed,and the thin gold film heater and diode were energized.
Shortly after boiling was initiatedandthe datataken,the heatercircuit wasopenedat
theknife switch,andthevideorecordinganddataacquisitionterminated.
The independentvariables in the imposed heat flux tests were: surface
orientation,horizontal up and horizontal down with respectto earth gravity; surface

79
type, four different quartzsurfaces;bulk liquid subcooling,nominally 0, 2.8, or 11.1
°C; andtotal heatflux, nominallevelsof 2, 4, 6, and8 W/cm2. The total heatflux is
thepower input to theheaterdivided by the heatersurfacearea. The dependenttest
variableswere thevoltageacrossthe heatersurfaceand the voltageacrossthe heater
shunt, which provided the instantaneousmean heatersurfacetemperatureand heat
flux. Thebulk liquid temperatureneartheheatersurfaceandthesystempressurewere
alsorecorded.
4.2.1.2 ImposedConstantSurfaceTemperature
All tests conductedwith the step increase in surface temperaturewere
performedwith thethin film heatingsurfacein the horizontaldownorientation. With
heatingat a given heat flux in the horizontal down position, the onsetof natural
convectionis delayedfor a considerablylongerperiod of time than that for heating
with the identicalheatflux in thehorizontalup position.The temperaturedistribution
in both the liquid andthequartzsubstratecan thusbedeterminedfrom a conduction
analysiswith a reasonablecertainty, sinceeachexperimentis completedbefore the
onsetof naturalconvectionoccurs.This is discussedin detail in Oker(1973).
As statedin Section3.1.2,thesoftwarefor acquiringdatain the fastportion of
the power transient,togetherwith the analogand digital interfacecard and analog
input channels,arereferredto astheCodassystem. With themaximumsamplingrate
limited to 25 kHz per eachof two channels,the Codassystemwasprogrammedto
samplethedifferential voltagesacrossthe heatersurfaceandshuntsequentially. The
CR7X, aspreviouslydescribedin Section3.1.2, sampledtheshuntandheatersurface
voltagesonly for theslowpartof thepowertransient,butwith muchgreateraccuracy
than was possible with the Codassystem. The measurementaccuracy was thus
compromisedwith the useof the Codassystemfor the high samplingrate, while the
80
high sampling rate was compromised by using the CR7X for the measurement
accuracy. Details of the measurement accuracy are given in Appendices C and D1.
The pressure transducer voltage and bulk fluid temperature thermocouple voltages
were also recorded by the CR7X at the start and end of a given test. The onset of
boiling and initial vapor dynamics were recorded by the high speed video camera. The
imposed steps in heater surface temperature were in the range of 0.5-25 °C.
An experiment was initiated by turning the camera on, followed by execution
of the switching pro_am on the first computer, which caused a light emitting diode on
one of the circuit boards to flash, indicating that the heater surface would be powered
in one second. At the time of the one second warning, the Codas data acquisition
process began on the second computer. The test was terminated after heating for 1.8
seconds by the switching software, which opened the heating circuit automatically.
The independent variables in the imposed heater surface temperature tests
were: surface type, two different quartz surfaces; bulk liquid subcooling, nominally
0, 2.8, or 1 1.1 °C; and the initial heater surface voltage level, which governed the level
of the step increase in heater surface temperature. The dependent test variables ,,,.'ere
the voltage across the heater surface and the voltage across the heater shunt, which
provided the instantaneous mean heater surface temperature and heat flux. The bulk
liquid temperature and system pressure were also recorded.
4.2.2 Quasi-Steady Heating
Both the thin gold film heater on quartz and the solid metal heaters were used
for the quasi-steady measurements. The desired power setting was set, and the system
was allowed to reach a steadv-state surface temperature. If boiling inception did not
occur, the heater input voltage was increased by 10% of the previous level, and
another steady-state heating surface temperature was obtained. Following the point of
81
boiling initiation, the power was switched off and the surface allowed to cool for more
than 45 minutes. Power at a slightly lower level than that which produced the
previous boiling inception point was then applied to the surface to obtain a non-boiling
steady-state surface temperature. The power was then increased slightly again in
steps, until boiling occurred. This incremental approach was iterated to determine
more precisely the temperature and heat flux at which incipient boiling occurs.
Because of the large uncertainties as to when incipient boiling would take place
with quasi-steady heating, high speed photographs were not taken. The CR7X
recorded the shunt and heater surface voltages, for the calculation of the heat flux (and
mean heater surface temperature in the case of the gold film heater on quartz), the
pressure transducer voltage, for the determination of the pressure level, and the voltage
output of the thermocouple imbedded in the copper block near the heater surface for
the determination of the metal heater surface temperature. The bulk fluid temperature
increased by no more than 0.25 °C during any of the quasi-steady heating tests.
The independent test variables in the quasi-steady heating tests were: surface
orientation, horizontal up or horizontal down with respect to earth gravity; surface
type, quartz substrate or metallic surface; and bulk liquid subcooling, nominally 0, 2.8,
or 11.1 °C. The dependent test variables were the voltage across the heater surface,
the voltage across the heater shunt, and the metal heater thermocouple voltage, which
provided the mean heat flux and heater surface temperature. The bulk liquid
temperature and system pressure were also recorded.
4.3 Drop Vessel
Following charging with degassed R113, the drop vessel, cameras, lights, and
associated electronics were placed on the drop bus, which was then balanced with lead
82
weights. Only one of the two thin film heatersinstalledin the drop vesselwasused
for aparticulartest.
The day before a drop test, the singlepoint calibration of the heatersurface
resistance-temperaturewas performed, since the entire drop vessel was at the
accuratelyknown and uniform ambient temperature. The measuredshunt,surface,
andthermocouplevoltagesacquiredby theCR7X during the surfacecalibrationwere
storedin a portablecomputer. Thea.c. temperaturecontroller regulatingthepowerto
thethin film heatersmountedon theouterdrop vesselwalls wasswitchedon,and the
vesselwas then coveredwith an insulating blanket. The controller wasadjustedto
providea temperatureof approximately58°C whenthevesselwas to bepreparedfor
installationin thedroptoweron thefollowing day.
Preparationfor the drop test thenextday thenrequiredthat thea.c.heatersbe
disconnectedfrom the power source. The heat loss to the ambientat about 20 oC
during the 20 minuteperiod requiredto transferthevesselto the actualdrop location
andduring the two hour period requiredfor theevacuationof air from the drop tower
resultedin a decreasein temperatureof thetest vesselandits contentsfrom the initial
58 °C to thedesiredlevel of about47.7oC.
Three tests were performed sequentially in connection with each drop
experiment: a pre-droptest with the high speedphotography,a drop test with high
speedphotography,and a postdrop testwith no photography. The pre-droptestwas
identical to the drop test, using the drop tower control room circuitry, but was
conductedat earthgravity. This testprovidedadirect comparisonbetweentheboiling
processin earthgravity and boiling in microgravity, andincludedthe transientheater
surface temperature,heat flux, pressure,and photographic measurements. The
exposedfilm was removedfor developingafter completionof the pre-droptest,and
the datadownloadedfrom the CRTX to a portablecomputer. The camerawas then
reloadedfor thedrop test. After the testpackagewasdroppedandretrievedfrom the
83
bottom of the drop tower, the film wasagain removedfor processing,and the drop
datadownloadedfrom the CR7Xto a portablecomputer. The postdrop testwas then
performedto verify the proper operatingcondition of the circuitry and mechanical
hardwarefollowing a drop test,and was identical to the pre-droptestexceptthat no
movieswerefilmed.
The actual drop test procedurewill now be described in greater detail.
Following the pre-drop test, the camera was reloaded, the pre-drop data was
downloadedto the portable computer, and the batteries were recharged. Data
acquisitionandcontrol instructionsweretransferredfrom theportablecomputerto the
CR7X mountedon the drop bus. The software instructedthe CR7X to measurethe
bulk liquid temperatureand then set the specifiedsubcooling level, basedon this
measuredbulk liquid temperature,by adjusting the pressurelevel inside the vessel
throughactuationof the bellowspressurecontrol systemdescribedpreviously. The
CR7X also set the voltage level to be applied to the heatersurfaceto produce the
desiredheat flux. The CR7X control instructions also checkedthat appropriate
voltagesignalswerebeingreceivedfrom thedrop towercontrol roomby meansof the
drop busumbilical. Theprotectiveouter skinswereinstalledon thedrop bus,andthe
busplacedinto positionat thetopof thedroptower,atwhich timeevacuationbegan.
At the desiredtower vacuumlevel and R113 temperature,the control room
senta signal to thedrop vessel(calledtheenergizesignal)which causedthe CR7X to
setthe pressurelevel basedon the current vesseltemperaturein order to achievethe
desiredsubcooling level. The CR7X sampledthe pressuretransducersignal and
calculatedthepressurebasedon thepressuretransducercalibration. The pressureset
point (commandvoltage) was adjusteduntil the measuredpressurewas near the
desiredpressure.At this point, the CR7X transmitteda five volt signal to thecontrol
room, indicatingthattheR113in thevesselwasatthedesiredsubcooling.Thecontrol
roomthenswitchedon thecameralights andstartedthehigh speedcamera,which was
84
followed by the releaseof the drop busin the drop tower. The onsetof the free fall
thendisconnectedtheumbilical from thetestpackage,which in turn producedanopen
circuit signalcalledthedrop signal. The drop signalwasan indicationto theCR7X to
(1) power the heaterat the pre-determinedvoltagelevel by sendinga calibratedset
point signalbetweenzeroandfive volts to the heatercontrollerand to (2) begindata
acquisition. A diodepoweredby a threevolt digital signalfrom theCR7X in thefield
of view of the camerawasusedto synchronizetheapplicationof power to the heater
surfacewith thecameraoperation. After five seconds,the CR7X stoppedmeasuring
theshunt,heatersurfaceandpressuretransducervoltages,andterminatedpowerto the
heatersurface. In someof thedrops,thevoltageof a thermocouplein the liquid near
andover the centerof the heatersurfacewassampled.The cameracontinuedto film
during impact. An outlineof thefreefall dropsequenceis presentedin Figure4.1.
The independentvariablesin the drop vesseltestswere: surfacetype, two
different quartz surfaces;bulk liquid subcooling,nominally 0, 2.8, or 11.1 °C; and
total heat flux, nominal levels of 4, 6, and 8 W/cm 2. The low heat flux level of 2
W/cm z used in the laboratory pool boiling experiments was not used in the drop
experiments because it was observed that the time required for the onset of boiling at a
power input of 4 W/cm z in microgravity was apparently greater than the five second
microgravity period available in the drop tower. The dependent test variables were the
voltage across the heater surface, the voltage across the heater shunt, and the pressure
transducer voltage, which provided the mean instantaneous heater surface temperature,
heat flux, and system pressure. As will be noted in the results, short pressure
variations occurred during some of the more dynamic nucleation processes, although
attempts were made to maintain a constant pressure level. At times, a liquid
temperature measurement near the heater surface was also included.
85
4.4 Data Reduction
The procedures for the calculation of the thin film heater surface temperature,
the metal heater surface temperature, the bulk liquid temperature, the liquid pressure,
and the heat flux from the recorded data are presented below, along with the
uncertainties in the determination of these quantities.
4.4.1 Spatial Mean Film Heater Surface Temperature
The spatial mean thin gold fi!m heater surface temperature, T w, is determined
from the measured test surface resistance, Rw, the single point calibration resistance,
R c, with its corresponding calibration temperature, T C, and the slope of the calibration
dT.curve, _', m the following equation:
T w = T c R,-R c (4.1)
dTFor the constant heat flux tests, R w, Pc, To and _ were determined with
representative values and uncertainties of 2.9985 + 0.0008 fl, 2.6266 + 0.0002 D..,
20.00 4- 0.01 °C, and 214.83 + 0.23 °C/f2, respectively, as given in Appendix D.1. As
a result of the uncertainties in these quantities, the heater surface temperatures were
determined with an uncertainty of+ 1.0 oC, as described in Appendix D.1.
For the imposed step change in surface temperature tests using the Codas
system during the fast portion of the power generation curve discussed earlier, R T, PC,
dTT C, and _ were determined with representative values and uncertainties of 2.7989 4-
0.020 f2, 2.6266+ 0.0002 f2,20.00 4- 0.06 °C, and 214.83 + 0.23 °C/fl, respectively.
The calculation of these uncertainties is also described in Appendix D.I. As a result of
these uncertainties, the heater surface temperatures were determined with an
86
uncertainty of + 6 °C. When the CR7X was used during the slow portion of the power
generation curve, the heater surface temperature was determined with an uncertainty of
_+ 1 oC, as shown in Appendix D.1.
4.4.2 Metal Heater Spatial Mean Surface Temperature
The metal heater surface temperature was determined from the chromel-
constantan thermocouple imbedded in the copper heating block near the heater surface,
as shown in Figure 3.2. The error in assuming that the temperature at the location of
the thermocouple was equal to the surface temperature was estimated to be less than
0.002 oC, by assuming one dimensional conduction in the copper block and negligible
contact resistance between the soldered copper foil and the copper block. An error of
this magnitude is less than the uncertainty of + 0.01 oC associated with the
thermocouple temperature measurement and, as a result, was neglected.
4.4.3 Bulk Liquid Temperature
The liquid bulk temperature was measured by calibrated chromel-constantan
thermocouples, described in Chapter 3. The CR7X was used for all measurements of
bulk liquid temperature in all three vessels, and the uncertainty of + 0.6 microvotts for
the thermocouple voltage determination translates to a + 0.01 oC uncertainty in the
liquid bulk temperature. A detailed discussion of the estimate of this uncertainty in the
temperature determination from a thermocouple voltage measurement is in Appendix
D.2.
87
4.4.4 SystemPressure
The liquid pressurenearthe heatersurfacesin all threevessels was measured
by calibrated transducers. The ca.libration and resulting calibration equations of the
pressure transducers are described in Appendix B.3 The uncertainty of the pressure
measurement in the laboratory pool boiling vessel, the drop vessel, and the forced
convection boiling loop was less than the desired uncertainty of + 0.172 kPa _ 0.025
psi). The details of the estimate of the uncertainty in the pressure measurements are
given in Appendix D.3.
4.4.5 Heat Flux
The total power input per unit area, q"v, for both the quasi-steady heating tests
and the constant heat flux tests was calculated from:
VTVsh
q"T - (4.2)
A R h
The voltages were in volts, the resistance in ohms, the heater surface area in cm', and
q"T in W/cmL The maximum uncertainty in q"T was + 0.18 W/cmL The details of the
estimate in the uncertainty associated with q"T are presented in Appendix D.4.
The heat transfer to the liquid, q"l, could be calculated from the measured total
heat flux, q"T, under circumstances which permitted reasonable analytical assumptions.
For the transient constant heat flux tests in the pool boiling vessels q"l can be
determined by a one dimensional, semi-infinite media conduction analysis provided
two conditions were met. The first condition for a valid semi-infinite media
88
conductionanalysisis the absenceof significantnaturalconvectionwhile thefluid is
beingheated.This conditionwasmetfor all of themicrogravityboiling testsup to the
point of the onsetof boiling. The conductionanalysiswas valid for experiments
conductedin earthgravity whereboiling occurredin timeslessthan thatrequiredfor
the onsetof naturalconvection. The time for the onsetof naturalconvectionfor a
heatedsurfacehorizontal up in earthgravity wasgiven by Oker (1973) in a semi-
empirical equationfor thecombinationof a pyrex substrateandR-113 at atmospheric
pressure,whereq"v is in W/cm: andt,c is in seconds:

89
q"l 1
q"T q"qtz1+"
q"l
(4.4)
where
q"l _ klq"q= kq=
(4.5)
Evaluating the properties of quartz and R113 at a mean temperature of 70 cC, the
fraction of the total input heat flux to the liquid becomes, from equations 4.4 and 4.5:
II
qt= 0.175
q"Y
(4.6)
The heat flux to the test fluid is then evaluated from equation 4.6 using the
measurement of q"T" The uncertainty in the calculation of heat transfer to the liquid as
given by equation 4.6 comes from the uncertainties in the tabulated property values
and the uncertainty involved in using a representative mean temperature for the
selection of the tabulated properties. The total uncertainty in q"_ calculated from
equation 4.4 is + 4%. In the non-boiling portion of the quasi-steady tests q"_ is
computed from subtraction of the losses from the total power input to the heater. The
losses are estimated from the following natural convection correlations (Incropera and
Dewitt (1984)) for the test surfaces heated in air:
1
Nu = 0.15 Ra 3 (horizontal up) (4.7)

9O
!
Nu = 0.27 Ra 4 (horizontal down) (4.8)
The uncertainty in q"l results primarily from the uncertainty in the calculation of the
losses computed from the natural convection heat transfer correlations, which are on
the order of + 20%.

91
Drop Sequence
Initial State:
Program downloaded to CR7 damlogger
Commend voltage to hearer = 0 V
Pover (+Z_.)V to timer card
t=-5 Minutes: Ener_/ze li_rml (open contact)
I. Set preJsure basted on temperetc_e
to get lubcoolir_ by letti_ comzMnct
_ltage
-----)2. Set relay a3 to turnon÷24V for
preuure controller/instrumentation
"-> 3. Open shutoff vllvew
I _ 4. _ealure prellure, adjult corms.and_ltage until measured pressure is
clole to let _oint
t=O(Drop):/i Drop signal _ 5. Switch relayw 1 an_ 2 to switch from
t _e.nersted by calibration to teJt circuit
• • , c_..) 2. Acquire voltage data
t=5.0 sac (Impact):
Initiate activities
a/tar timer a_opJDstalo_er
_ii Stop takin_ data
• Turn off heater and diode
Switcl'.relayJ 1 argi 2CIose shuto_ v_lws
Switch relay" a3 turning.
o_f instrumentation
_ower
Figure 4. I Sequence of events during a free fall microgravity test
the NASA Lewis RC drop tower
in
92
CHAPTER 5
EXPERIMENTAL RESULTS
The experimental results obtained during the current study are presented
below. The transient experimental results are presented first, followed by the quasi-
steady heating results.
5.1 Transient Boiling
The transient boiling experiments were performed in both the laboratory pool
boiling vessel and the drop vessel. A step in heater surface heat flux was used in the
drop vessel. Both step increases in heat flux and in surface temperature were used in
the laboratory pool boiling vessel, as well as the quasi-steady heating process which
will be presented in Section 5.2 below. A step change in heat flux is the most
elementary form of imposed heat flux variation possible, as all other time varying
imposed surface heat fluxes can be constructed from a series of steps in heat flux.
These two basic and elementary, thermal boundary disturbances, step changes in heat
flux and in temperature, produce distinctly different liquid temperature distributions,
which determine the heater surface temperature at the moment of boiling inception and
the resulting phase change dynamics. The transient pool boiling results are presented
t'n'st, followed by the transient forced convection boiling results.
93
5.1.1 PoolBoiling-ImposedConstantHeatFlux
5.i. 1.1 TransientHeaterSurfaceTemperature
Since the resistanceof the gold film heater surfaceis computedfrom the
measuredcurrent and voltage drop acrossthe entire heater surface, the resulting
calculated surface temperatureis a spatially averaged temperature. The non-
uniformity of the surfacetemperaturewasestimatedby solving the threedimensional
transient conduction model for the quartz substrate-Rll3 system using a finite
differencesolutiontechnique.Theconductionassumptionwith R113is valid for short
times in earthgravity and in microgravity up to the point of incipient boiling. The
Crank-Nicholsonfinite differencemethodwasused,with a uniform spatialgrid sizeof
0.79375mm (0.03125inches). Theprocedureis describedin AppendixH. Figure5.1
showsthecomputedsurfacetemperaturerise for a total heatflux input of 8 W/cma at
one second,the approximatetime from the onsetof heating for boiling inception.
Becauseof symmetry,only onequarterof thefilm surfaceis shown,andthecomputed
surfacetemperatureis notedto bequiteuniform exceptneartheheatersurfaceedges.
In the remainder of this section, selected representativeheater surface
temperature-timeplots are presentedin order to demonstratethe distinguishing
featuresin commonfor thesamebodyforce magnitudeandorientation. The identical
heatersurface,designatedasQ-5, is usedin all of theresultspresentedhere.
The transientheatersurfacetemperaturefor Run 79 is shownin Figure 5.2,
alongwith a tabulationof thetestconditions,and appliesto thecasewheretheheater
surface is facing horizontal up in earth gravity. The onsetof natural convection,
appearsasanirregularityin thetemperature-timeplot. Thetime from theenergization
of the heaterto the onsetof natural convectionis designatedas t_c. Experimental
valuesfor this t_cwereobtainedby the appearanceof two independentphenomena,
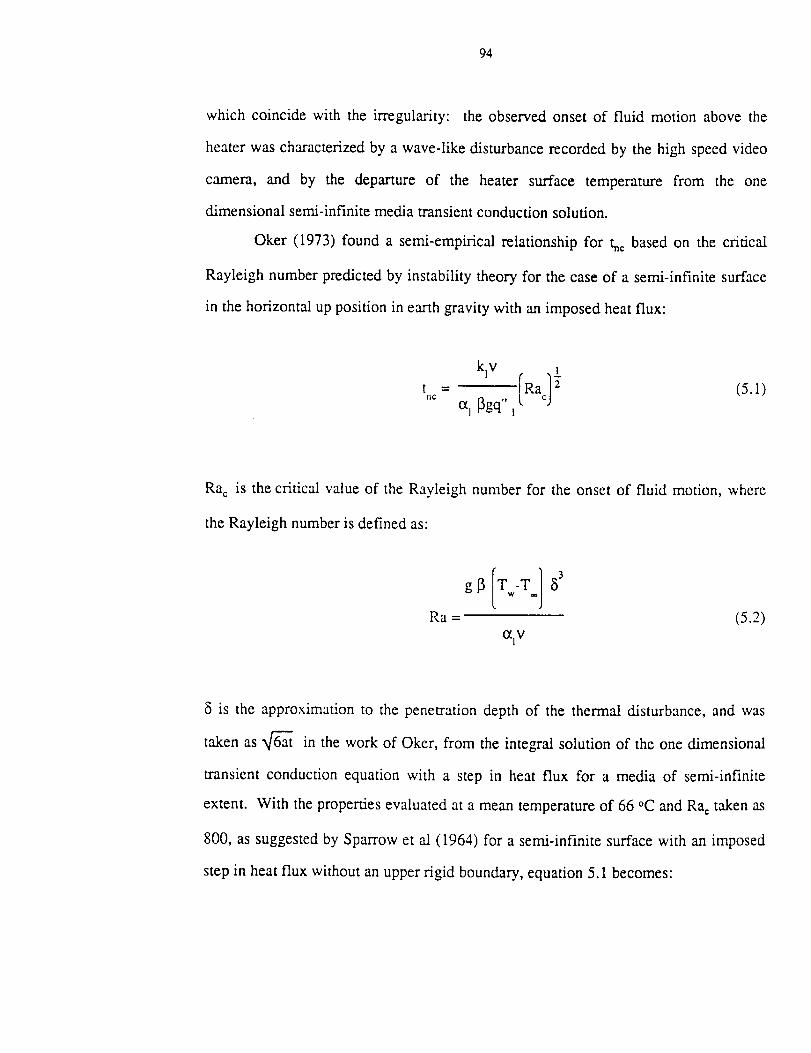
94
which coincide with the irregularity: the observedonsetof fluid motion abovethe
heaterwascharacterizedby awave-like disturbancerecordedby the high speedvideo
camera, and by the departureof the heater surface temperature from the one
dimensionalsemi-infinitemediatransientconductionsolution.
Oker (1973) found a semi-empiricalrelationshipfor t_cbasedon the critical
Rayleighnumberpredictedby instability theoryfor thecaseof a semi-infinite surface
in thehorizontaluppositionin earthgravitywith animposedheatflux:
klV 1t - Racnc col[3gq,,I
Rac is thecritical valueof the Rayleighnumberfor the onsetof fluid motion, where
theRayleighnumberis definedas:
Ra - (5.2)O_lV
8 is the approximationto the penetrationdepthof the thermal disturbance,and was
takenas_ in the work of Oker, from the integralsolutionof theonedimensional
transientconductionequationwith a stepin heat flux for a media of semi-infinite
extent. With thepropertiesevaluatedat ameantemperatureof 66 °C andRactakenas
800,assuggestedby Sparrowet al (1964) for asemi-infinite surfacewith an imposed
stepin heatflux without anupperrigid boundary,equation5.1becomes:
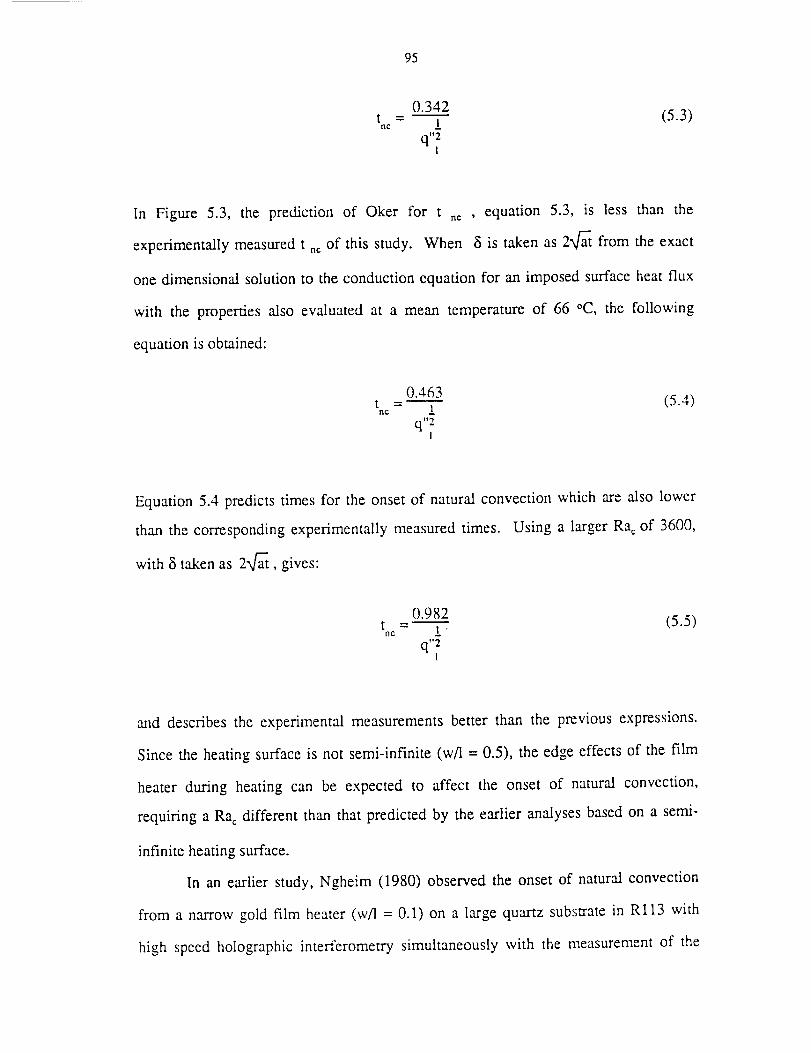
95
0.342t - (5.3)ne /
q"2I
In Figure 5.3, the prediction of Oker for tnc
experimentally measured t nc of this study. When
, equation 5.3, is less than the
5 is taken as 2"f_ from the exact
one dimensional solution to the conduction equation for an imposed surface heat flux
with the properties also evaluated at a mean temperature of 66 °C, the following
equation is obtained:
0.463t - l (5.4)
q"2I
Equation 5.4 predicts times for the onset of natural convection which are also lower
than the corresponding experimentally measured times. Using a larger Ra c of 3600,
with 5 taken as 2"k]'_, gives:
0.982t _
nC ! "
q"21
(5.5)
and describes the experimental measurements better than the previous expressions.
Since the heating surface is not semi-infinite (w/1 = 0.5), the edge effects of the film
heater during heating can be expected to affect the onset of natural convection,
requiring a Ra c different than that predicted by the earlier analyses based on a semi-
infinite heating surface.
In an earlier study, Ngheim (1980) observed the onset of natural convection
from a narrow gold film heater (wA = 0.1) on a large quartz subsTate in Rl13 with
high speed holographic interferometry simultaneously with the measurement of the
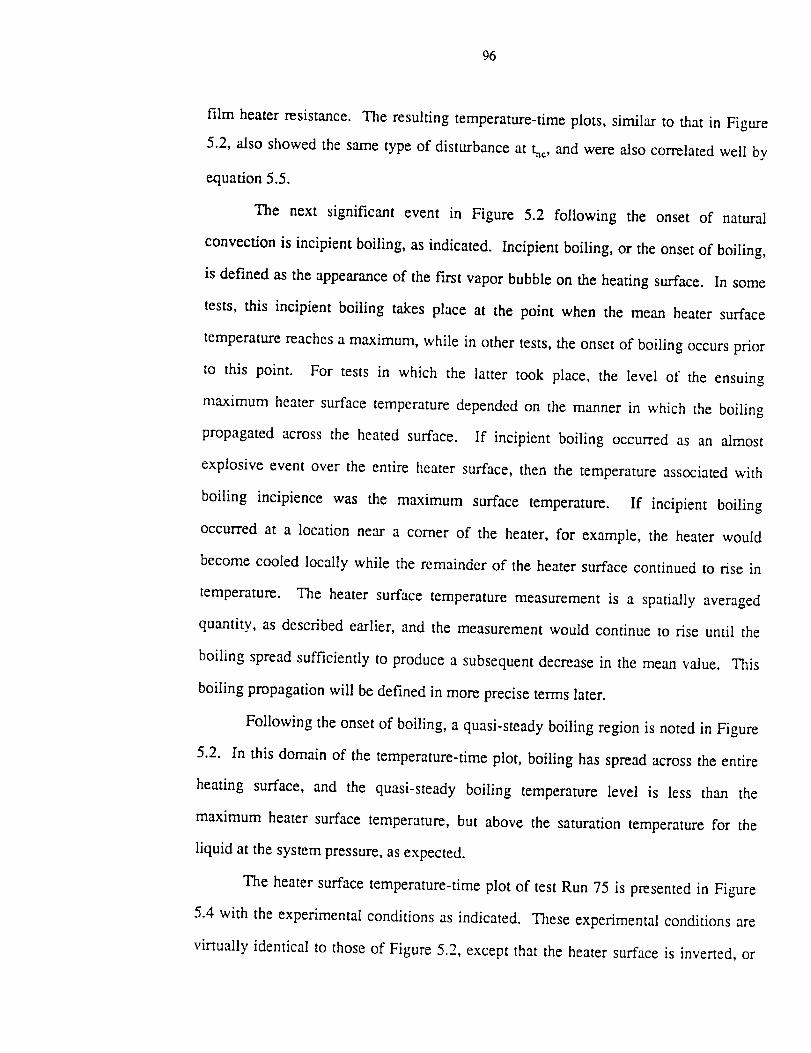
96
film heater resistance. The resulting temperature-time plots, similar to that in Figure
5.2, also showed the same type of disturbance at t_c, and were also correlated well by
equation 5.5.
The next significant event in Figure 5.2 following the onset of natural
convection is incipient boiling, as indicated. Incipient boiling, or the onset of boiling,
is defined as the appearance of the fin'st vapor bubble on the heating surface. In some
tests, this incipient boiling takes place at the point when the mean heater surface
temperature reaches a maximum, while in other tests, the onset of boiling occurs prior
to this point. For tests in which the latter took place, the level of the ensuing
maximum heater surface temperature depended on the manner in which the boiling
propagated across the heated surface. If incipient boiling occurred as an almost
explosive event over the entire heater surface, then the temperature associated with
boiling incipience was the maximum surface temperature. If incipient boiling
occurred at a location near a corner of the heater, for example, the heater would
become cooled locally while the remainder of the heater surface continued to rise in
temperature. The heater surface temperature measurement is a spatially averaged
quantity, as described earlier, and the measurement would continue to rise until the
boiling spread sufficiently to produce a subsequent decrease in the mean value. This
boiling propagation will be defined in more precise terms later.
Following the onset of boiling, a quasi-steady boiling region is noted in Figure
5.2. In this domain of the temperature-time plot, boiling has spread across the entire
heating surface, and the quasi-steady boiling temperature level is less than the
maximum heater surface temperature, but above the saturation temperature for the
liquid at the system pressure, as expected.
The heater surface temperature-time plot of test Run 75 is presented in Figure
5.4 with the experimental conditions as indicated. These experimental conditions are
virtually identical to those of Figure 5.2, except that the heater surface is inverted, or
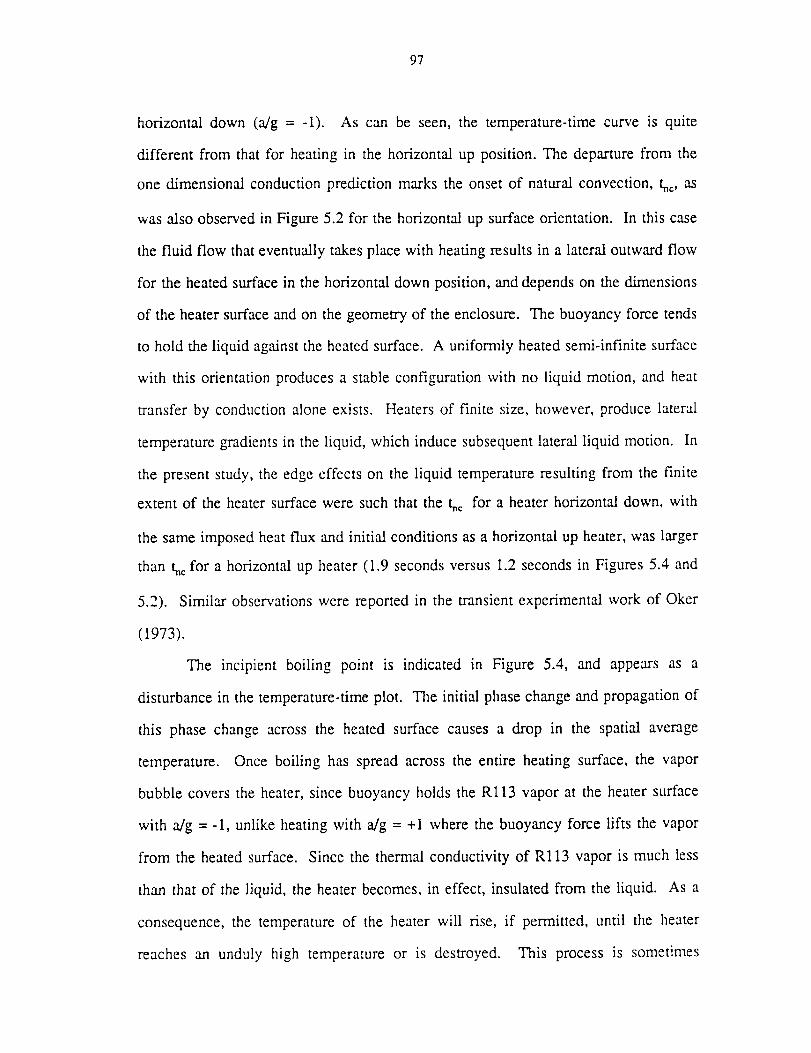
97
horizontal down (alg = -1). As can be seen,the temperature-timecurve is quite
different from that for heatingin the horizontalup position.The departurefrom the
one dimensionalconductionprediction marksthe onsetof naturalconvection,t_c,as
wasalsoobservedin Figure 5.2for the horizontalupsurfaceorientation. In this case
thefluid flow thateventuallytakesplacewith heatingresultsin a lateraloutwardflow
for the heatedsurfacein thehorizontaldownposition,anddependson thedimensions
of theheatersurfaceandon the geometryof theenclosure.The buoyancyforcetends
to hold the liquid againsttheheatedsurface. A uniformly heatedsemi-infinitesurface
with this orientationproducesa stableconfigurationwith no liquid motion,and heat
transfer by conductionaloneexists. Heatersof finite size, however,producelateral
temperaturegradientsin the liquid, which inducesubsequentlateralliquid motion. In
thepresentstudy,theedgeeffectson the liquid temperatureresulting from the finite
extentof theheatersurfacewere suchthat the t,c for a heaterhorizontaldown, with
thesameimposedheatflux andinitial conditionsasa horizontalup heater,waslarger
than t_cfor a horizontalup heater(1.9 secondsversus1.2secondsin Figures5.4 and
5.2). Similar observationswere reportedin the transientexperimentalwork of Oker
(1973).
The incipient boiling point is indicated in Figure 5.4, and appearsas a
disturbancein the temperature-timeplot. The initial phasechangeandpropagationof
this phasechangeacrossthe heatedsurfacecausesa drop in the spatial average
temperature. Once boiling has spreadacrossthe entire heating surface,the vapor
bubblecoversthe heater,sincebuoyancyholdsthe Rl13 vapor at the heatersurface
with a/g = -1, unlike heatingwith a/g = +1 wherethe buoyancyforce lifts the vapor
from the heatedsurface. Sincethe thermalconductivity of R113 vapor is much less
than that of the liquid, theheaterbecomes,in effect, insulatedfrom the liquid. As a
consequence,the temperatureof the heaterwill rise, if permitted, until the heater
reachesan unduly high temperatureor is destroyed. This processis sometimes
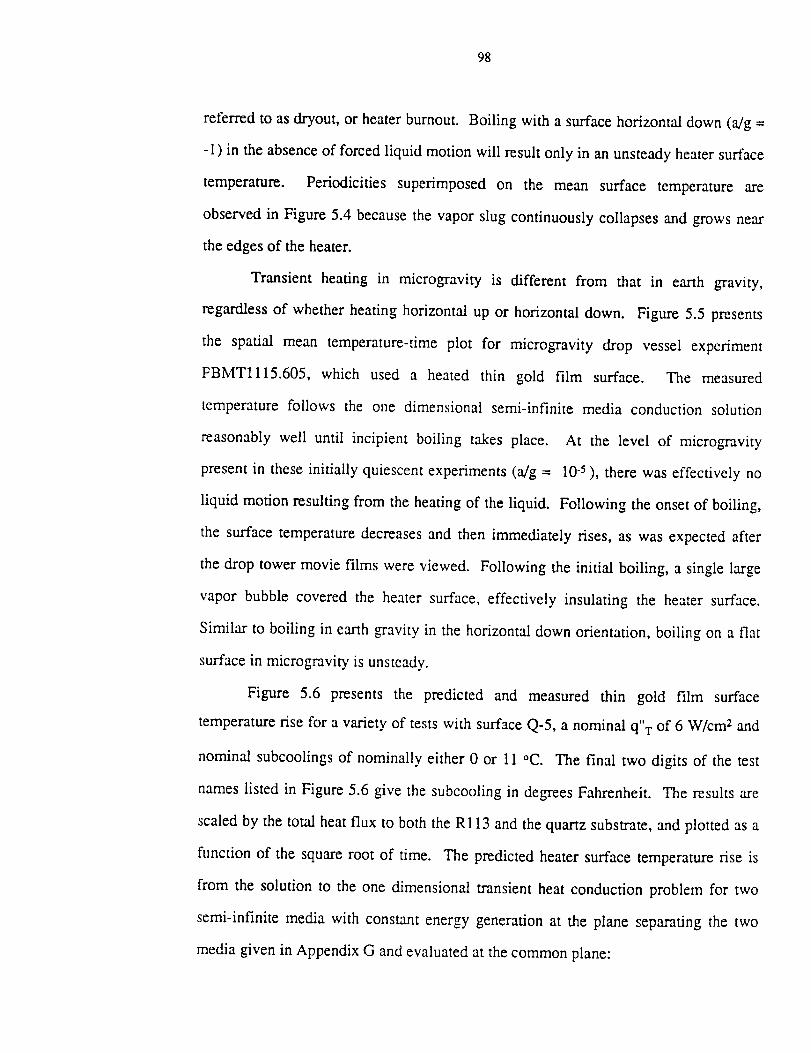
98
referredto asdryout,or heaterburnout. Boiling with a surfacehorizontaldown(a/g=
- 1) in the absence of forced liquid motion will result only in an unsteady heater surface
temperature. Periodicities superimposed on the mean surface temperature are
observed in Figure 5.4 because the vapor slug continuously collapses and grows near
the edges of the heater.
Transient heating in microgravity is different from that in earth gravity,
regardless of whether heating horizontal up or horizontal down. Figure 5.5 presents
the spatial mean temperature-time plot for microgravity drop vessel experiment
FBMTlll5.605, which used a heated thin gold film surface. The measured
temperature follows the one dimensional semi-infinite media conduction solution
reasonably well until incipient boiling takes place.
present in these initially quiescent experiments (a/g =
liquid motion resulting from the heating of the liquid.
At the level of microgravity
10 .5 ), there was effectively no
Following the onset of boiling,
the surface temperature decreases and then immediately rises, as was expected after
the drop tower movie films were viewed. Following the initial boiling, a single large
vapor bubble covered the heater surface, effectively insulating the heater surface.
Similar to boiling in earth gravity in the horizontal down orientation, boiling on a flat
surface in microgravity is unsteady.
Figure 5.6 presents the predicted and measured thin gold film surface
temperature rise for a variety of tests with surface Q-5, a nominal q"'r of 6 W/cm z and
nominal subcoolings of nominally either 0 or 11 °C. The final two digits of the test
names listed in Figure 5.6 give the subcooling in degrees Fahrenheit. The results are
scaled by the total heat flux to both the Rl13 and the quartz substrate, and plotted as a
function of the square root of time. The predicted heater surface temperature rise is
from the solution to the one dimensional transient heat conduction problem for two
semi-infinite media with constant energy generation at the plane separating the two
media given in Appendix G and evaluated at the common plane:

99
2q"TT -T - (5.6)w oo kl
Measurementsfrom testswith heatersurfaceorientationsof both horizontal up and
horizontal down in earthgravity are includedalongwith data from two microgravity
tests. Departurefrom the linear prediction results either from the onsetof liquid
motion arisingfrom thebuoyancyeffectsduring heatingor from theonsetof boiling.
Although heatingof thefilm surfaceis not truly one dimensional,the departurefrom
the one dimensionallinear prediction shown in Figure 5.6 providesa conservative
estimatefor the onsetof naturalconvectionwith a surfacein the horizontal up or
horizontaldown orientationin earthgravity, aswasdemonstratedin Figure5.2. For
themicrogravityexperimentsPBMT 1101.600andPBMT1121.620,thedeparturefrom
theconductionpredictedsurfacetemperaturewastheconsequenceof incipientboiling.
The lack of departure from the linear prediction earlier than at incipient boiling gave
credence to the technique used for heater surface temperature measurement.
Figure 5.7 presents the results of constant imposed heat flux tests in the
laboratory pool boiling vessel, with a surface orientation of horizontal up. The tests
were all conducted with the same heat flux but with three different levels of
subcooling. For the early times the curves are superimposed on one another, as
anticipated. However, at later times they were expected to separate because of the
differences in subcooling and delay times to incipient boiling. Figure 5.7 conf'mns
this expectation, and provides an indirect check on the heater surface temperature
measurement. Because of the difference in subcooling, the quasi-steady surface
boiling temperature is different for each of the surfaces by roughly the amount of the
liquid subcooling, as indicated.
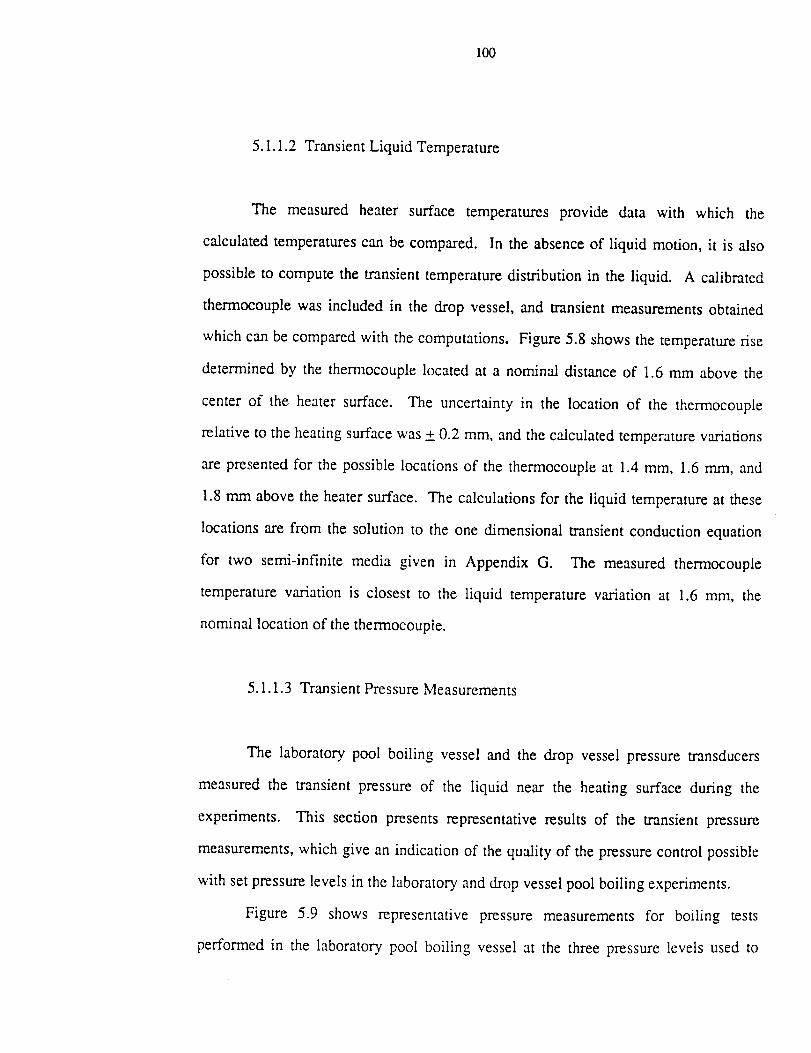
1o0
5.1.1.2 TransientLiquid Temperature
The measuredheater surface temperaturesprovide data with which the
calculatedtemperaturescanbecompared. In the absenceof liquid motion, it is also
possibleto computethetransienttemperaturedistribution in the liquid. A calibrated
thermocouplewas included in the drop vessel,and transientmeasurementsobtained
which canbecomparedwith thecomputations.Figure5.8 showsthetemperaturerise
determinedby the thermocouplelocatedat a nominal distanceof 1.6 mm abovethe
centerof the heatersurface. The uncertainty in the location of the thermocouple
relativeto theheatingsurfacewas+ 0.2 ram, andthecalculatedtemperaturevariations
arepresentedfor the possiblelocationsof the thermocoupleat 1.4ram, 1.6mm, and
1.8mm abovetheheatersurface. Thecalculationsfor the liquid temperatureat these
locationsare from the solution to the one dimensionaltransientconductionequation
for two semi-infinite media given in Appendix G. The measuredthermocouple
temperaturevariation is closest to the liquid temperaturevariation at 1.6 ram, the
nominallocationof thethermocouple.
5.1.1.3 TransientPressureMeasurements
The laboratorypool boiling vesseland the drop vesselpressuretransducers
measuredthe transientpressureof the liquid near the heating surfaceduring the
experiments. This section presentsrepresentativeresultsof the transientpressure
measurements,which give an indicationof thequality of thepressurecontrol possible
with setpressurelevels in the laboratoryanddrop vesselpool boiling experiments.
Figure 5.9 shows representativepressure measurementsfor boiling tests
performedin the laboratorypool boiling vesselat the threepressurelevels usedto
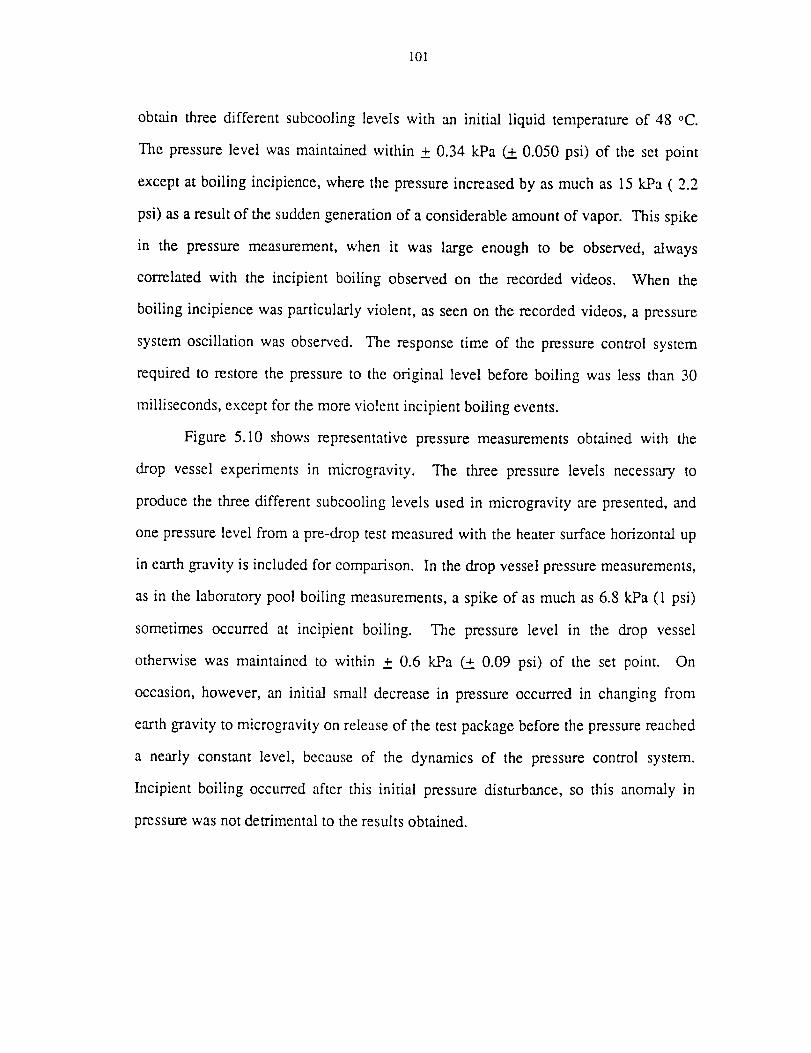
101
obtain three different subcooling levels with an initial liquid temperature of 48 °C.
The pressure level was maintained within _+ 0.34 kPa (_ 0.050 psi) of the set point
except at boiling incipience, where the pressure increased by as much as 15 kPa ( 2.2
psi) as a result of the sudden generation of a considerable amount of vapor. This spike
in the pressure measurement, when it was large enough to be observed, always
correlated with the incipient boiling observed on the recorded videos. When the
boiling incipience was particularly violent, as seen on the recorded videos, a pressure
system oscillation was observed. The response time of the pressure control system
required to restore the pressure to the original level before boiling was less than 30
milliseconds, except for the more violent incipient boiling events.
Figure 5.10 shows representative pressure measurements obtained with the
drop vessel experiments in microgravity. The three pressure levels necessary to
produce the three different subcooling levels used in microgravity are presented, and
one pressure level from a pre-drop test measured with the heater surface horizontal up
in earth gravity is included for comparison. In the drop vessel pressure measurements,
as in the laboratory pool boiling measurements, a spike of as much as 6.8 kPa (1 psi)
sometimes occurred at incipient boiling. The pressure level in the drop vessel
otherwise was maintained to within -4- 0.6 kPa _ 0.09 psi) of the set point. On
occasion, however, an initial small decrease in pressure occurred in changing from
earth gravity to microgravity on release of the test package before the pressure reached
a nearly constant level, because of the dynamics of the pressure control system.
Incipient boiling occurred after this initial pressure disturbance, so this anomaly in
pressure was not detrimental to the results obtained.
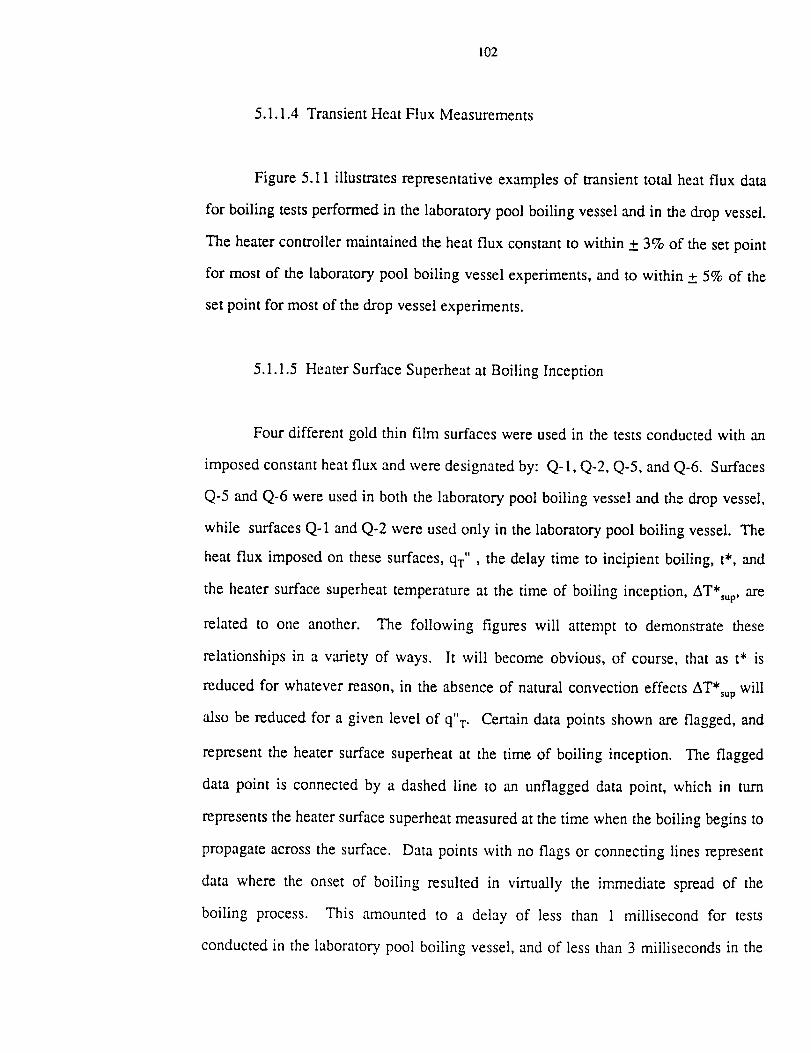
102
5.1.1.4 Transient Heat Flux Measurements
Figure 5.11 illustrates representative examples of transient total heat flux data
for boiling tests performed in the laboratory pool boiling vessel and in the drop vessel.
The heater controller maintained the heat flux constant to within + 3% of the set point
for most of the laboratory pool boiling vessel experiments, and to within + 5% of the
set point for most of the drop vessel experiments.
5.1.1.5 Heater Surface Superheat at Boiling Inception
Four different gold thin film surfaces were used in the tests conducted with an
imposed constant heat flux and were designated by: Q-I, Q-2, Q-5, and Q-6. Surfaces
Q-5 and Q-6 were used in both the laboratory pool boiling vessel and the drop vessel,
while surfaces Q-1 and Q-2 were used only in the laboratory pool boiling vessel. The
heat flux imposed on these surfaces, qT", the delay time to incipient boiling, t*, and
the heater surface superheat temperature at the time of boiling inception, AT*su p, are
related to one another. The following figures will attempt to demonstrate these
relationships in a variety of ways. It will become obvious, of course, that as t* is
reduced for whatever reason, in the absence of natural convection effects AT*_,p will
also be reduced for a given level of q"T" Certain data points shown are flagged, and
represent the heater surface superheat at the time of boiling inception. The flagged
data point is connected by a dashed line to an unflagged data point, which in turn
represents the heater surface superheat measured at the time when the boiling begins to
propagate across the surface. Data points with no flags or connecting lines represent
data where the onset of boiling resulted in virtually the immediate spread of the
boiling process. This amounted to a delay of less than 1 millisecond for tests
conducted in the laboratory pool boiling vessel, and of less than 3 milliseconds in the
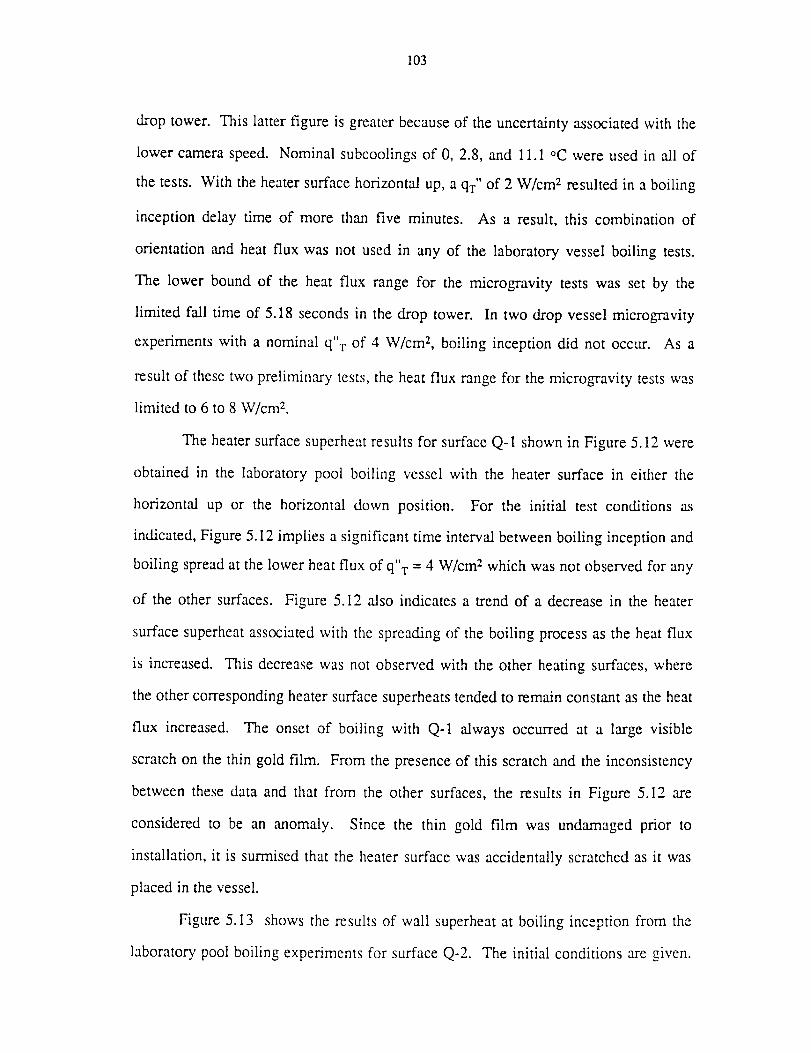
103
drop tower. This latter figure is greaterbecauseof the uncertaintyassociatedwith the
lower cameraspeed. Nominal subcoolingsof 0, 2.8, and 11.1°C wereusedin all of
thetests. With theheatersurfacehorizontalup,a qr" of 2 W/cm2resultedin a boiling
inception delay time of more than five minutes. As a result, this combinationof
orientationand heatflux was not usedin any of the laboratoryvesselboiling tests.
The lower boundof the heat flux rangefor the microgravity testswas set by the
limited fall time of 5.18 secondsin the drop tower. In two drop vesselmicrogravity
experimentswith a nominal q'"r of 4 W/cm2, boiling inception did not occur. As a
resultof thesetwo preliminarytests,theheatflux rangefor the microgravity testswas
limited to 6 to 8 W/cm2.
Theheatersurfacesuperheatresultsfor surfaceQ-I shownin Figure 5.12were
obtainedin the laboratorypool boiling vesselwith the heatersurfacein either the
horizontal up or the horizontal down position. For the initial test conditions as
indicated,Figure5.12impliesa significanttime intervalbetweenboiling inceptionand
boiling spreadat thelower heatflux of q"'r = 4 W/cm2which wasnot observedfor any
of the othersurfaces. Figure 5.12 alsoindicatesa trendof a decreasein the heater
surfacesuperheatassociatedwith the spreadingof the boiling processastheheatflux
is increased.This decreasewasnot observedwith theother heatingsurfaces,where
theothercorrespondingheatersurfacesuperheatstendedto remainconstantastheheat
flux increased. The onsetof boiling with Q-1 alwaysoccurred at a large visible
scratchon thethin gold film. From thepresenceof this scratchandthe inconsistency
betweenthesedataand that from the other surfaces,the results in Figure 5.12 are
consideredto be an anomaly. Since the thin gold film was undamagedprior to
installation,it is surmisedthat the heatersurfacewasaccidentallyscratchedasit was
placedin thevessel.
Figure 5.13 showsthe resultsof wall superheatat boiling inception from the
laboratorypool boiling experimentsfor surfaceQ-2. The initial conditionsaregiven.
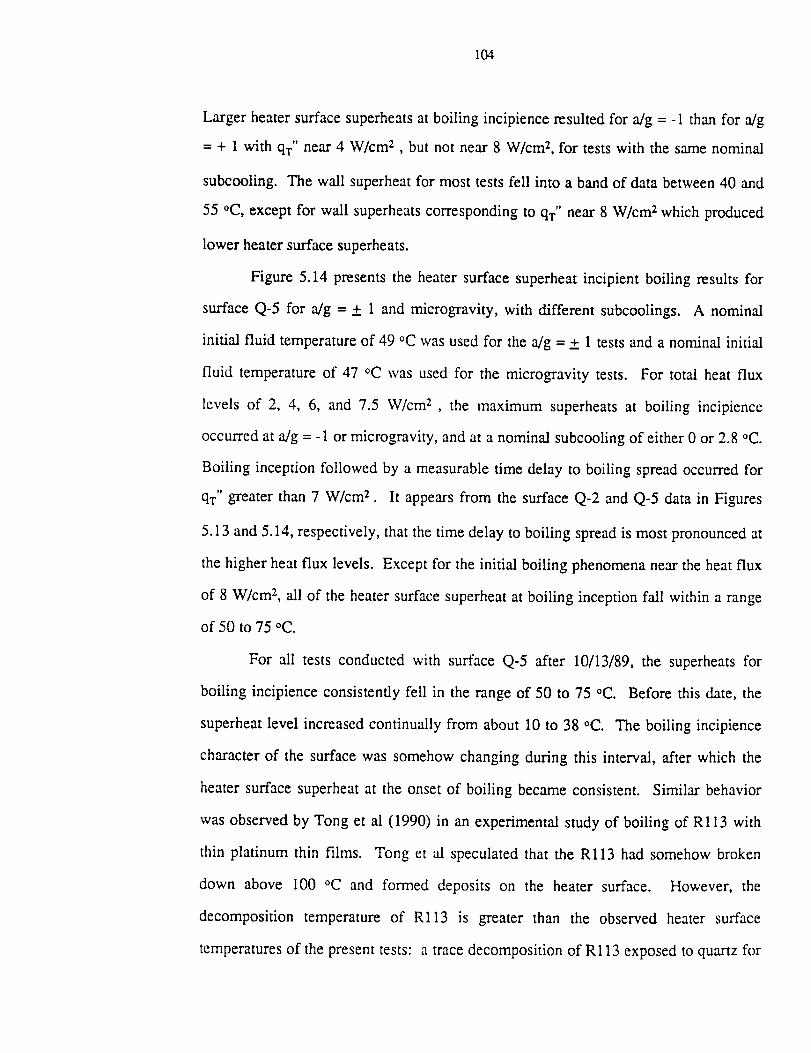
104
Larger heater surface superheats at boiling incipience resulted for a/g = -1 than for a/g
= + 1 with qT" near 4 W/cm 2 , but not near 8 W/cm 2, for tests with the same nominal
subcooling. The wall superheat for most tests fell into a band of data between 40 and
55 °C, except for wall superheats corresponding to q'r" near 8 W/cm 2 which produced
lower heater surface superheats.
Figure 5.14 presents the heater surface superheat incipient boiling results for
surface Q-5 for a/g = _+ 1 and microgravity, with different subcoolings. A nominal
initial fluid temperature of 49 °C was used for the a/g = _.+1 tests and a nominal initial
fluid temperature of 47 °C was used for the microgravity tests. For total heat flux
levels of 2, 4, 6, and 7.5 W/cm 2 , the maximum superheats at boiling incipience
occurred at a/g = -1 or microgravity, and at a nominal subcooling of either 0 or 2.8 °C.
Boiling inception followed by a measurable time delay to boiling spread occurred for
qT" greater than 7 W/cm z . It appears from the surface Q-2 and Q-5 data in Figures
5.13 and 5.14, respectively, that the time delay to boiling spread is most pronounced at
the higher heat flux levels. Except for the initial boiling phenomena near the heat flux
of 8 W/cm 2, all of the heater surface superheat at boiling inception fall within a range
of 50 to 75 °C.
For all tests conducted with surface Q-5 after 10/13/89, the superheats for
boiling incipience consistently fell in the range of 50 to 75 °C. Before this date, the
superheat level increased continually from about 10 to 38 °C. The boiling incipience
character of the surface was somehow changing during this interval, after which the
heater surface superheat at the onset of boiling became consistent. Similar behavior
was observed by Tong et al (1990) in an experimental study of boiling of R113 with
thin platinum thin films. Tong et al speculated that the Rl13 had somehow broken
down above 100 °C and formed deposits on the heater surface. However, the
decomposition temperature of Rl13 is greater than the observed heater surface
temperatures of the present tests: a trace decomposition of R113 exposed to quartz for

105
30 secondswas found to first occurat a temperatureof 299 °C in a testingdescribed
by E.I. DuPont de Nemours(1969). It is believedthat the surfacebecamemore
"regular" in incipientboiling characterafterthefirst few testsandtheresultingboiling
removedsomeof theadsorbedgasesandimpurities.
Figure 5.15showsthe heatersurfacesuperheatat incipient boiling for surface
Q-6 as a function of total heatflux with a/g = _+1 and microgravity with different
subcoolings. The testsat a/g = -1 were conductedin the laboratoryboiling vessel,
while those in microgravity were conductedfollowing the tests for surfaceQ-5.
SurfacesQ-5 andQ-6 wereinstalledin thedrop vesselat thesametime. The nominal
initial fluid temperaturefor the earth gravity testswas 49 °C and 47 °C for the
micro_avity experiments.Exceptnear8 W/cm2,theheatersurfacesuperheatslie in a
rangebetween48 and62°C. The lower level of this heatersurfacesuperheatrangeis
close to the lower rangeof heatersurfacesuperheatsfor surfaceQ-5. The heater
surfacesuperheatat incipientboiling is lower thanthat for theundamagedsurfacesQ-
2 andQ-5,at thehighheatflux levels.
The incipient boiling heatersurfacesuperheatlevels for surfacesQ-5 and Q-6
were similar, but greaterthan thoseof Q-1 andQ-2. The similarity of behaviorfor
surfacesQ-5 andQ-6, comparedto surfacesQ-1 andQ-2, is presumedto bedue to
their havingbeenfabricatedtogetherby sputtering,while surfacesQ-1 andQ-2 were
vacuumdepositedwith gold at the sametime. SurfaceQ-2 showsa moreconstant
superheatrangethan doesQ-l, most likely becauseof the presenceof the scratch
observedon Q-1. In all of theplots of AT*su p , the delay from incipient boiling to the
onset of boiling spread is most pronounced near the heat flux of 8 W/cm 2.
In the present pool boiling experiments with an imposed heat flux at the heater
surface, the subcooling level, from near saturation to 11 °C, had little influence on
AT*sup. As is shown below, the present subcooling range also had little effect on the
incipient boiling delay time, t*.
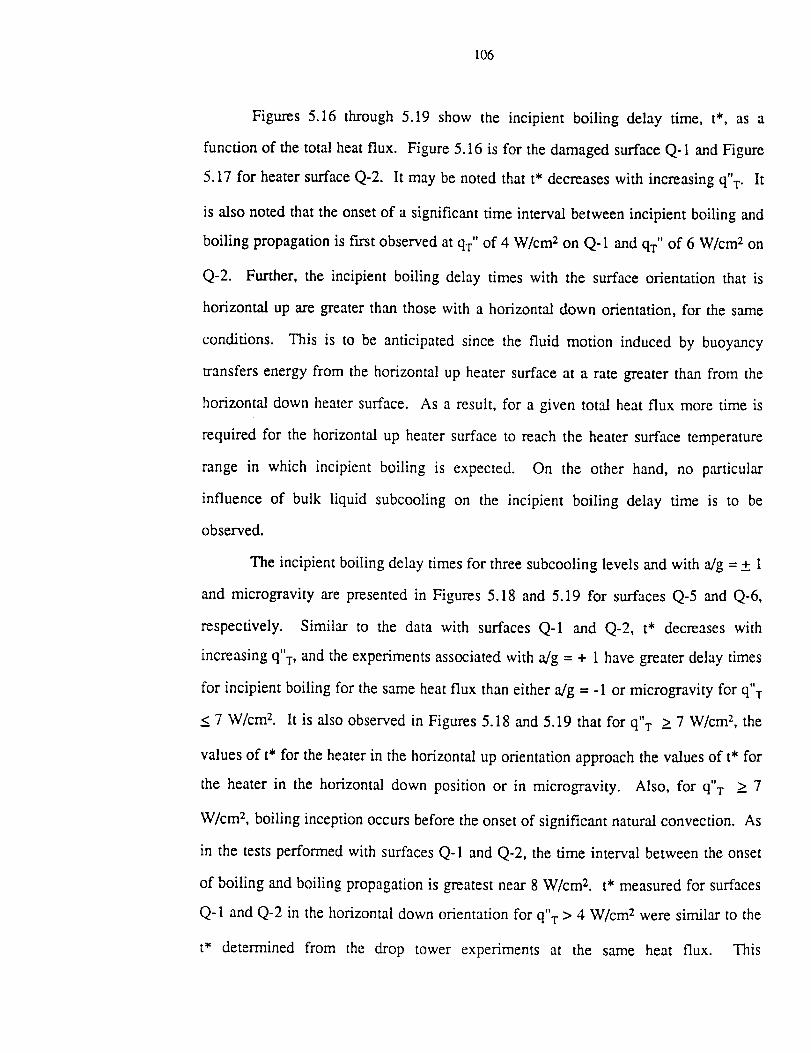
106
Figures 5.16 through 5.19 show the incipient boiling delay time, t*, as a
function of thetotal heatflux. Figure5.16is for thedamagedsurfaceQ-1 andFigure
5.17 for heatersurfaceQ-2. It may benotedthat t* decreaseswith increasingq"T" It
is also notedthat theonsetof a significanttime intervalbetweenincipient boiling and
boiling propagationis first observedat qT"of 4 W/cm2 on Q- 1 and qT" of 6 W/cm 2 on
Q-2. Further, the incipient boiling delay times with the surface orientation that is
horizontal up are greater than those with a horizontal down orientation, for the same
conditions. This is to be anticipated since the fluid motion induced by buoyancy
transfers energy from the horizontal up heater surface at a rate greater than from the
horizontal down heater surface. As a result, for a given total heat flux more time is
required for the horizontal up heater surface to reach the heater surface temperature
range in which incipient boiling is expected. On the other hand, no particular
influence of bulk liquid subcooling on the incipient boiling delay time is to be
observed.
The incipient boiling delay times for three subcooling levels and with a/g = + 1
and microgravity are presented in Figures 5.18 and 5.19 for surfaces Q-5 and Q-6,
respectively. Similar to the data with surfaces Q-1 and Q-2, t* decreases with
increasing q"T, and the experiments associated with a/g = + 1 have greater delay times
for incipient boiling for the same heat flux than either a/g = -1 or microgravity for q"T
< 7 W/cm 2. It is also observed in Figures 5.18 and 5.19 that for q"T > 7 W/cm 2, the
values of t* for the heater in the horizontal up orientation approach the values of t* for
the heater in the horizontal down position or in microgravity. Also, for q"T > 7
W/cm 2, boiling inception occurs before the onset of significant natural convection. As
in the tests performed with surfaces Q-1 and Q-2, the time interval between the onset
of boiling and boiling propagation is greatest near 8 W/cm 2. t* measured for surfaces
Q-1 and Q-2 in the horizontal down orientation for q"T > 4 W/cm 2 were similar to the
t* determined from the drop tower experiments at the same heat flux. This
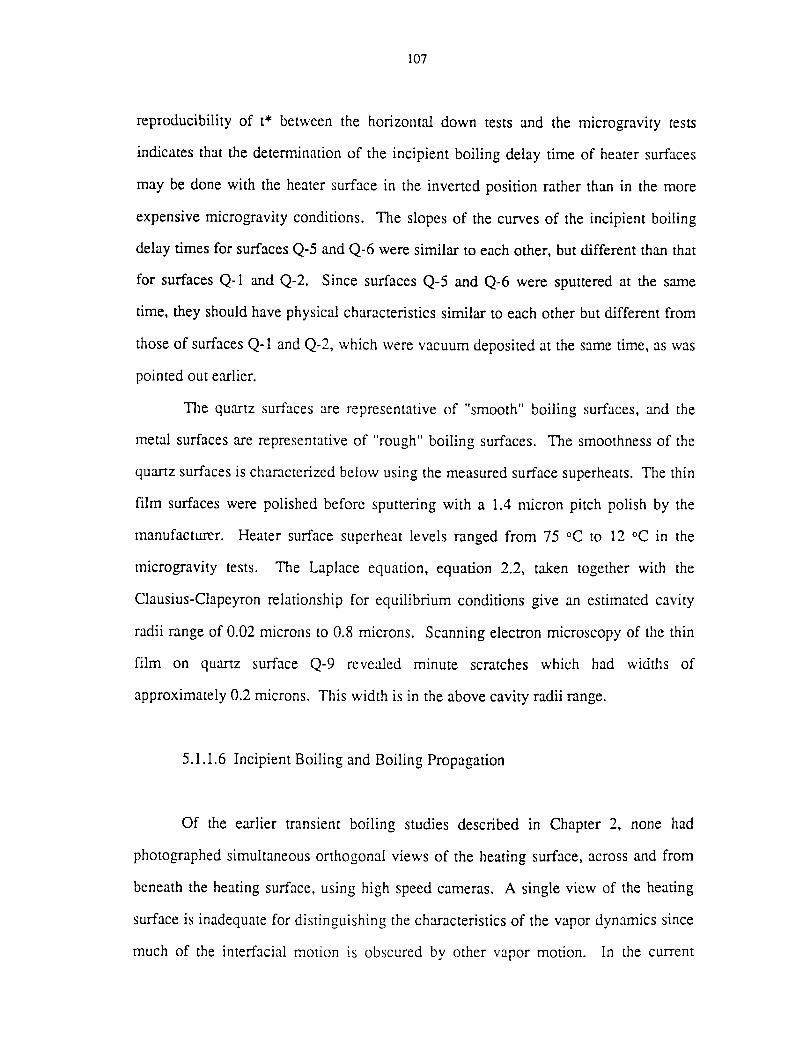
107
reproducibility of t* between the horizontal down tests and the microgravity tests
indicates that the determination of the incipient boiling delay time of heater surfaces
may be done with the heater surface in the inverted position rather than in the more
expensive microgravity conditions. The slopes of the curves of the incipient boiling
delay times for surfaces Q-5 and Q-6 were similar to each other, but different than that
for surfaces Q-1 and Q-2. Since surfaces Q-5 and Q-6 were sputtered at the same
time, they should have physical characteristics similar to each other but different from
those of surfaces Q-1 and Q-2, which were vacuum deposited at the same time, as was
pointed out earlier.
The quartz surfaces are representative of "smooth" boiling surfaces, and the
metal surfaces are representative of "rough" boiling surfaces. The smoothness of the
quartz surfaces is characterized below using the measured surface superheats. The thin
film surfaces were polished before sputtering with a 1.4 micron pitch polish by the
manufacturer. Heater surface superheat levels ranged from 75 °C to 12 °C in the
microgravity tests. The Laplace equation, equation 2.2, taken together with the
Clausius-Clapeyron relationship for equilibrium conditions give an estimated cavity
radii range of 0.02 microns to 0.8 microns. Scanning electron microscopy of the thin
film on quartz surface Q-9 revealed minute scratches which had widths of
approximately 0.2 microns. This width is in the above cavity radii range.
5.1.1.6 Incipient Boiling and Boiling Propagation
Of the earlier transient boiling studies described in Chapter 2, none had
photographed simultaneous orthogonal views of the heating surface, across and from
beneath the heating surface, using high speed cameras. A single view of the heating
surface is inadequate for distinguishing the characteristics of the vapor dynamics since
much of the interracial motion is obscured by other vapor motion. In the current
108
experiments,the boiling inceptionandthe resulting vapor motion was observed from
two orthogonal views: directly across the heater and through the bottom of the quartz
substrate. Distinctly different categories of vapor dynamics were observed in both the
laboratory and the drop vessel pool boiling experiments. This section will present
types of behavior, some previously unobserved, which will be referred to here as
boiling spread or boiling propagation. Boiling spread may be classified into two
distinct categories: (a) The first is the formation or nucleation of vapor ahead of a
moving liquid-vapor front, which is sometimes pushed ahead by this front and is at
other times absorbed into the front. (b) The second is the growth of an interface
similar to that of vapor bubble growth due to evaporation at the interface, regular in
some cases and in other cases chaotic, but without the formation of vapor bubbles
ahead of the interface. The parameters under which these differences in behavior
occurred will be described, but their detailed origins are as yet unknown.
The following discussion includes photographs which show the chronological
sequences of the behavior observed. The measured initial conditions, including the
applied power input, system pressure, bulk liquid temperature, a/g level, and
orientation are given in the first figure of each chronological sequence. Six different
categories of boiling spread are listed and then described below:
A. Advancement of vapor by irregular protuberances
B. Formation of mushroom-like vapor mass followed by spreading
C. Single pancake-like bubble with a "smooth" interface
D. Orderly growth followed by onset of interface disturbances
E. Explosive growth of a vapor mass
F. Marangoni motion of bubbles toward region of higher temperature
109
A. Advancementof vaporby irregularprotuberances
The first categoryof boiling propagationis the advanceof the vapor massby
irregularprotuberancesfrom bubbles,shownin the sequenceof Figures5.20athrough
5.20e."fine upper photo is through and from beneath the heating surface, and the lower
portion presents the view across the heating surface. In the first figure of this series, a
vapor bubble has already appeared. The onset of natural convection may be seen in
Figure 5.20a. in both the view through the bottom of the heating surface and in the
view across the heating surface. In the view across the heating surface, the onset of
natural convection is characterized by the newly formed thermal plumes, parallel to
and slightly above the heater surface. In the view from beneath the gold film heater, a
disturbance around the periphery of the heater surface is visible. In the next figure,
5.20b, three bubbles are now present, and the peripheral disturbance, a result of natural
convection, may be seen in the view from beneath the gold film heater. In Figure
5.20c, the boiling has spread over a large area of the heating surface, and bubbles
depart from the heating surface as a result of buoyancy as the boiling propagates over
the heating surface. The last figures of this boiling sequence are Figures 5.20d and
5.20e. In Figure 5.20e, boiling covers most of the heater surface, and bubbles coalesce
near the edge of the outwardly growing bubble front. This type of boiling spread was
observed only with the heating surface in the horizontal up position at a/g = +1, and
for the total power input to the gold film heating surface > 7 W/cm z.
B. Formation of mushroom-like vapor mass followed by spreading
The second category of boiling spread presented in Figures 5.21a through
5.21d shows the formation of a mushroom-like vapor mass in the center of a thin
vapor layer, which rises above the thin vapor layer due to buoyancy, while the thin
110
vapor layer movesoutward beneaththe large mushroom-likevapor mass. The ftrst
figure of this series, Figure 5.21a, shows the appearance of the fn'st bubble in both
views. The upper photo is through and from beneath the heating surface, and the
lower photo of the figure looks across the heating surface. Convective stagnation lines
are clearly observable in the lower portion of the photo. Figure 5.21b shows a thin
vapor layer surrounding the large mushroom-like bubble. The bubble in the center of
the thin outward growing vapor layer becomes larger in Figure 5.21c. The vapor layer
has vapor bubbles on its surface. Figure 5.21d shows that boiling has covered most of
the heater, and in the view across the heating surface, the large bubble is departing
from the heater surface. The upward bubble motion entrains liquid and causes more
disturbances over the outward growing vapor layer. This kind of spreading was
observed only for a/g = +I with 2 < q"x< 7 W/cm z.
Okuyama et al (1988) observed this type of vapor motion using a large step in
heat flux (q"l on the order of 20 W/cm z to 40 W/cm z ) applied to a 7 p.m thick copper
foil (0.4 cm wide by 4 cm long) that was laminated to an epoxy plate, in R113 at P <
0.5 MPa. A horizontal up heater orientation was used. In the present study, by
contrast, the heat flux to the liquid is considerably smaller, with the largest q"l on the
order of 1.4 W/cm 2.
C. Single pancake-like bubble with a "smooth" interface
A third category of boiling spread consists of a single pancake-like bubble with
a "smooth" interface. In Figures 5.22a through 5.22d, using the laboratory pool
boiling vessel, the heater surface orientation is horizontal down. The upper portion of
each figure is a view through the heater surface from above, and the lower portion of
each figure is a view across the heating surface. The initial bubble grew outward in an
orderly manner from one location near the edge of the heating surface. This initial
111
bubble eventuallymovedaway from the locationat which it first originated, and a
secondbubbleformedat this location,asshownin Figures5.22a and 5.22b. In the
undersideview of Figure 5.22b, the smallersecondbubble is in front of the larger
bubble (in the darker region of the heatersurface),but in the side view of Figure
5.22b, the smaller bubble is behind the larger one. Figure 5.22c showsonly one
bubble in both views. The larger bubbleof the previous two figures expendedthe
available thermal energy for both bubbles while growing, and this large bubble
eventuallycoalescedwith thesmallerbubble. The rateof growthof the largerbubble
varied linearly with thesquareroot of time, until the bubblereachedtheouteredgeof
theheater,an indicationthat thegrowthof thebubblewasthermallycontrolled. After
the bubblehad grown past theedgesof the film heateras shownin Figure 5.22d, it
collapsedat someperipherallocations,and the liquid rewettedthe gold film heater.
This categoryof boiling spreadwasobservedonly in earthgravity with the heating
surfaceorientedhorizontaldown, suchthat the upwardbuoyancyforce flattenedthe
bubbleandheldthevaporagainsttheheatingsurface.
D. Orderlygrowth followed by onsetof interfacedisturbances
The fourth categoryof boiling propagationconsistsof initially orderly growth
of eithera hemisphericaibubble,in thecaseof microgravity,or apancake-likeonefor
a/g = -1. This orderly growth then gives way to violent growth, for someas yet
unknownreason.Theinitially smoothbubbleinterfacewasobservedto ruptureeither
on the surfaceor at the baseof the bubble at the beginningof the violent growth.
Figures5.23athrough5.23dshowthehistoryof violent boiling spreadassociatedwith
the rupturingof the bubbleoccurringat the peripheryof thebubblebase. The bubble
was initially smooth,but this is not shown. The heater surfaceshown is in the
laboratory pool boiling vesselin the horizontal down position. The upper photo
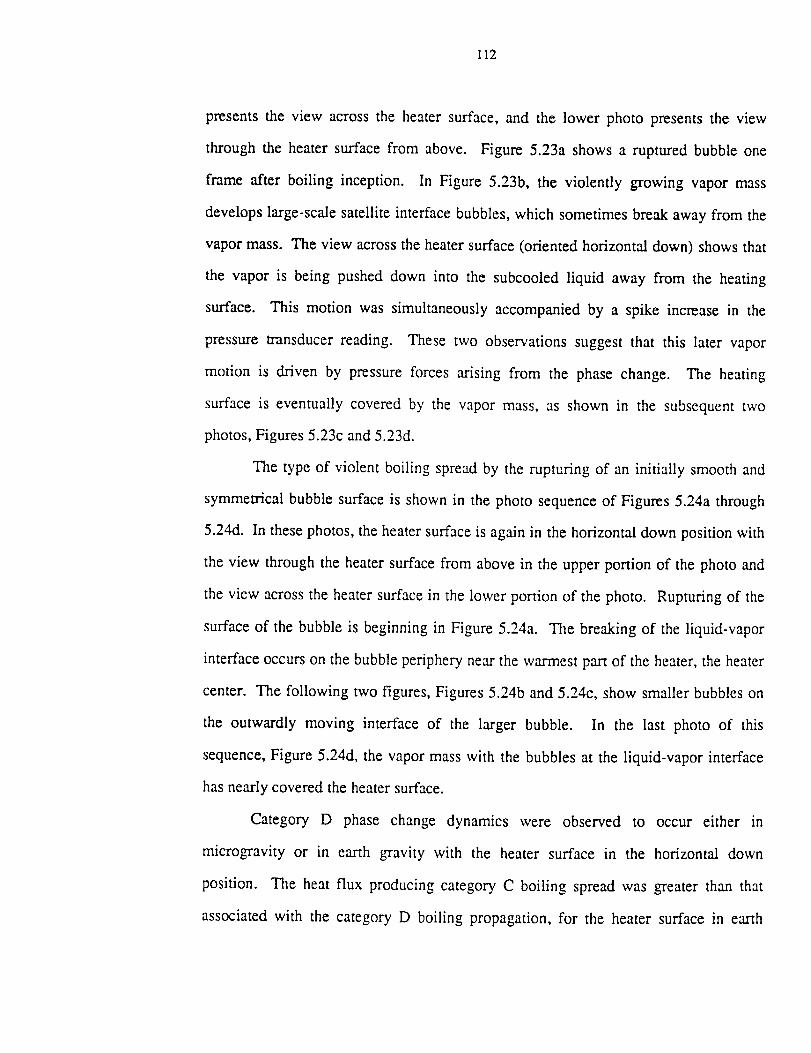
112
presents the view across the heater surface, and the lower photo presents the view
through the heater surface from above. Figure 5.23a shows a ruptured bubble one
frame after boiling inception. In Figure 5.23b, the violently growing vapor mass
develops large-scale satellite interface bubbles, which sometimes break away from the
vapor mass. The view across the heater surface (oriented horizontal down) shows that
the vapor is being pushed down into the subcooled liquid away from the heating
surface. This motion was simultaneously accompanied by a spike increase in the
pressure transducer reading. These two observations suggest that this later vapor
motion is driven by pressure forces arising from the phase change. The heating
surface is eventually covered by the vapor mass, as shown in the subsequent two
photos, Figures 5.23c and 5.23d.
The type of violent boiling spread by the rupturing of an initially smooth and
symmetrical bubble surface is shown in the photo sequence of Figures 5.24a through
5.24d. In these photos, the heater surface is again in the horizontal down position with
the view through the heater surface from above in the upper portion of the photo and
the view across the heater surface in the lower portion of the photo. Rupturing of the
surface of the bubble is beginning in Figure 5.24a. The breaking of the liquid-vapor
interface occurs on the bubble periphery near the warmest part of the heater, the heater
center. The following two figures, Figures 5.24b and 5.24c, show smaller bubbles on
the outwardly moving interface of the larger bubble. In the last photo of this
sequence, Figure 5.24d, the vapor mass with the bubbles at the liquid-vapor interface
has nearly covered the heater surface.
Category D phase change dynamics were observed to occur either in
microgravity or in earth gravity with the heater surface in the horizontal down
position. The heat flux producing category C boiling spread was greater than that
associated with the category D boiling propagation, for the heater surface in earth
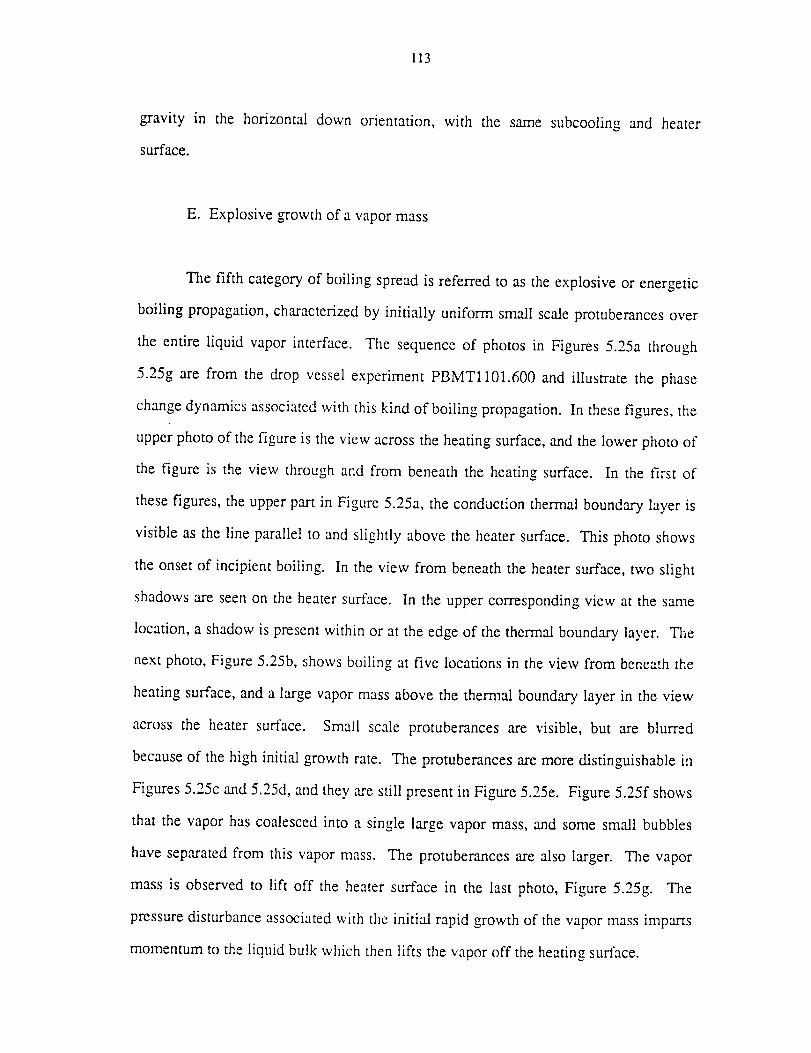
113
gravity in the horizontal down orientation, with the same subcooling and heater
surface.
E. Explosive growth of a vapor mass
The fifth category of boiling spread is referred to as the explosive or energetic
boiling propagation, characterized by initially uniform small scale protuberances over
the entire liquid vapor interface. The sequence of photos in Figures 5.25a through
5.25g are from the drop vessel experiment PBMT1101.600 and illustrate the phase
change dynamics associated with this kind of boiling propagation. In these figures, the
upper photo of the figure is the view across the heating surface, and the lower photo of
the figure is the view through and from beneath the heating surface. In the first of
these figures, the upper part in Figure 5.25a, the conduction thermal boundary layer is
visible as the line parallel to and slightly above the heater surface. This photo shows
the onset of incipient boiling. In the view from beneath the heater surface, two slight
shadows are seen on the heater surface. In the upper corresponding view at the same
location, a shadow is present within or at the edge of the thermal boundary layer. The
next photo, Figure 5.25b, shows boiling at five locations in the view from beneath the
heating surface, and a large vapor mass above the thermal boundary layer in the view
across the heater surface. Small scale protuberances are visible, but are blurred
because of the high initial growth rate. The protuberances are more distinguishable in
Figures 5.25c and 5.25d, and they are still present in Figure 5.25e. Figure 5.25f shows
that the vapor has coalesced into a single large vapor mass, and some small bubbles
have separated from this vapor mass. The protuberances are also larger. The vapor
mass is observed to lift off the heater surface in the last photo, Figure 5.25g. The
pressure disturbance associated with the initial rapid growth of the vapor mass imparts
momentum to the liquid bulk which then lifts the vapor off the heating surface.

114
It is believedthat the small scaleprotuberances,which may be the result of
local pressuredisturbancesrelated to instabilities, greatly increasethe liquid-vapor
interface surfacearea,which then results in a large massevaporationrate. The
pressuredisturbancesresulting from this large massflux createmore protuberances
which drive the unstablegrowth of the vapor massacrossthe heatingsurface. This
type of boiling spreadwasobservedonly in microgravity, and only near saturation
conditionswith q"T< 6.5 W/cmL A lower limit for this boiling propagation category
could not be established at this time because the time available in microgravity was too
short for boiling incipience to take place at the low heat flux level. In the drop tower
tests, a q"T of 4 W/cm z did not result in incipient boiling. A space experiment is
required to obtain information concerning the lower limit of total heat flux for this
explosive type of boiling spread. This category of boiling spread will be discussed in
more detail in Chapter 6.
F. Marangoni motion of bubbles toward region of higher temperature
The final type of boiling propagation observed in the pool boiling experiments
consisted of small bubbles forming and then moving toward the center of the thin film
heater, the warmest part, and coalescing there as shown sequentially in time in Figures
5.26a through 5.26e. In these figures, the upper part of the photo is the view across
the heater surface, and the lower part of the photo presents the view through the heater
surface from beneath. The following photos resulted from the drop vessel pool boiling
experiment PBMT0131.820, with the test conditions as given in the first figure. In
Figure 5.26a, the first bubble appears at the edge of the heater, and the thermal
boundary layer is not yet visible as in the case of Figure 5.26b. In Figure 5.26b, the
first bubble has moved away from the heater edge, and two more bubbles have formed
at the original incipient boiling location. Another location on the left side of the heater
115
surface has become activated as a boiling site with the thermal boundary layer now
visible. In the next photo, Figures 5.26c and 5.26d, a number of additional bubbles
have emanated from the two boiling locations. Some of the smaller bubbles have
coalesced with larger ones, and new bubbles form at the edges of the vapor mass. In
the last figure, Figure 5.26e, one large vapor mass finally results, which covers the
heater surface. Some vapor has separated from the vapor mass and formed individual
bubbles floating in the R113. The growth of these bubbles was orderly and slow. This
type of boiling spread was observed for micro_avity and for a/g = -1. q"T for _ese
instances was > 7.2 W/cm 2.
Table 5.1 summarizes the total heat flux ranges, subcooling levels, and body
forces which characterize the conditions necessary for the aforementioned types of
boiling propagation as known to date.
5.1.2 Imposed Heater Surface Temperature
5.1.2.1 Comparison of Measurements and Conduction Prediction
An imposed step in heater surface temperature, like an imposed step in surface
heat flux, provides a simple and known temperature distribution in the test fluid, in the
absence of buoyancy induced liquid motion. In order to obse_'e the effects of
different liquid temperature distributions on the resulting incipient boiling, these two
different elementary liquid temperature distributions were used. The results with the
imposed surface heat flux have been presented, and the results with a step increase in
heater surface temperature will now be presented. The theory behind the design of the
equipment for imposing a step in the heater surface temperature is presented in
Appendix F, and a description of this equipment was given previously in Chapter 3.
116
Two different gold film surfaces,Q-6 and Q-14 were used in the tests
conductedwith an imposed increasein surface temperature. Both surfaceswere
heatedin the horizontal down orientation, and the results from the two different
surfaceswere similar. Figure 5.27 presentsthe heater surface temperaturesand
uncertainties,asmeasuredby theCodassystemduring theinitial, rapid, portion of the
heaterpowertransient,and for the laterpartof theheaterpowertransientasmeasured
through the useof the CR7X. As discussedin Chapter3, this later portion of the
heaterpowertransientwaslongerthantheearlierportion. Becausetheinitial seriesof
stepsin heatflux comprisinganapproximationto the heatflux necessaryto imposea
constantheatersurfacetemperaturewereof shortdurationwhile the later stepswereof
much longerduration, two different measuringdeviceswere usedto verify that the
systemimposeda stepin heatersurfacetemperature.The lessaccurateCodassystem
measurementsindicatedthatthesurfaceresistancewasconstant,with anuncertaintyin
theresistancemeasurementsof + 2%. This uncertaintyin heaterresistancetranslates
as a largeuncertaintyin themeasuredheatersurfacetemperature,on theorder of_+7
°C, resulting from the small slope of the resistance-temperaturelinear relationship.
The CR7X providedmoreprecisionin the measuredheatersurfacetemperaturesfor
the slower portion of the heaterpower transient, on the order of _+2.5 °C. The
discussionconcerningthe estimationof the uncertaintiesin temperaturemeasurement
using the Codasand the CR7X is presentedin AppendicesC and D.1. The initial
liquid temperature,Ti, and the computed heater surface temperature are shown for
reference.
Figure 5.28 shows the comparison of the measured heater surface temperature
with the computed one dimensional conduction heater surface temperature prediction,
as presented in Appendix F. The measured heater surface temperatures for surface Q-
6 shown in this figure were determined with the CR7X, and follow the one
117
dimensionalprediction well until near the value of ETnput,/100 = 15. At this input
voltage level, the larger disagreement between the measured and predicted heater
surface temperature may be a result of multi-dimensional heating effects. The one
dimensional predicted heater surface temperatures are greater than the measured heater
surface temperatures, as would be expected, since the edge effects are neglected in the
one-dimensional prediction.
Figure 5.29 shows the incipient boiling delay times for the step increase in
heater surface temperature experiments performed in the laboratory pool boiling vessel
for surface Q-14. The initial system temperature was 49 °C, and the liquid was
subcooled by increasing the system pressure above the saturation pressure for R113
corresponding to 49 °C. As the initial voltage Einpu t , which corresponds to the
imposed step increase in heater surface temperature, was increased, the delay time
from the energization of the heater to the onset of boiling decreased somewhat. This
decrease in the delay time to incipient boiling is expected intuitively since more
energy goes into the liquid with a larger step in temperature. The delay times
associated with incipient boiling are similar in magnitude for both surfaces tested here.
Figure 5.30 presents a comparison between the incipient boiling delay times
and heater surface temperatures at incipience for both imposed surface temperatures
and imposed surface heat fluxes for surface Q-14. The initial system temperature was
49 °C, and the liquid was subcooled by increasing the system pressure to a value
greater than the saturation pressure corresponding to 49 °C. As demonstrated in
Figure 5.30, the constant surface temperature experiments always resulted in boiling
inception occurring at significantly lower surface temperatures and delay times when
compared to the corresponding values of the constant heat flux tests. It thus may be
concluded from these results that the manner of heating, and not merely the heater
surface temperature, as viewed by some, affects boiling inception. Although Figure
118
5.30 only showssurfacetemperaturesrather thansurfacesuperheattemperatures,the
temperaturedifferencesaregreaterthanthoserepresentedby different subcoolings.
The type of boiling propagationobservedwith the imposedheatersurface
temperatureexperimentsalwaysconsistedof a singlepancaketypebubble,categoryC,
describedin section5.1.1.6for boiling propagationobservedin theconstantheatflux
experiments.This observationis relatedto the consistentlysmall superheatedthermal
boundarylayer formedin the imposedsurfacetemperaturetestsandwill bediscussed
in Chapter6.
5.2 Quasi-SteadyHeating
Quasi-steadyheatingwasperformedin the laboratorypool boiling vesselusing
both the gold film heater,Q-2 and the copper block heater,SH-2. The liquid
temperaturein the laboratory pool boiling vessel was 49 °C and the liquid was
subcooled by increasing the liquid pressure above the saturation pressure
correspondingto 49 °C. The intent of thesetestswas to find the minimum heater
surfacetemperatureandheatflux for which theonsetof boiling wouldjust occur. The
following figures show the heat flux to the liquid as a function of the difference
betweenthe heatersurface temperatureand the bulk liquid temperature, q"t was
determined,asdiscussedin Chapter4, throughnaturalconvectioncorrelations.Figure
5.31 is for surfaceQ-2 in the horizontalup orientation. Figures5.32and 5.33are for
thequasi-steadyheatingtestsin thehorizontalupandthehorizontaldownorientations
involving thecopperblock heater,SH-2. Measurementsat subcoolingsof 1.23,3.19,
and 11.03 were obtained for the horizontal up orientation, and measurementsat
subcoolingsof 4.08and11.87wereobtainedfor thehorizontaldownposition.
For surfaceSH-2which hadthe gold-sputteredcopper foil exposedto the test
liquid, the heatersurfacesuperheattemperaturesassociatedwith theminimum power
119
input to the heaterat which incipient boiling would just occur were in the narrow
rangeof 39.0 to 44.8 °C for both the horizontalup and horizontaldown orientations
regardlessof the nominal subcoolinglevels of 1, 3, and 11 °C. The heatersurface
superheattemperaturesfor surfaceQ-2 correspondingto theminimum power input to
theheaterat thepoint whereincipient boiling wouldoccurwerein therangeof 32.0 to
39.6 °C irrespectiveof the nominal subcoolinglevelsof 1, 3, 11, and 16 °C. The
minimum heatersurfacesuperheatrange requiredfor incipient boiling was slightly
greaterfor themetalfoil surfacesratherthan for the"smoother"quartzsurfaces.This
might at first appearcontradictoryto previousobservationsasdescribedin Chapter2.
However, the measuredheater surfacetemperaturesof the presentexperimentsare
spatially averagedtemperatures,and the local heater surface temperaturesare
estimatedto vary by asmuch as25 °C from eachother, which can accountfor this
discrepancy. (This variation in local heatersurfacetemperaturein earthgravity with
the presenceof buoyancycanbecontrastedwith the variation in local heatersurface
temperaturein the microgravity testswith essentiallyno buoyancy. The local film
temperaturevariation in microgravitywasestimatedto be lessthan2 °C for locations
lmm inward from thefilm heateredge.) The testsusing thequartzsurfaceand the
metal foil surfacewere conductedwith the sameinitial conditions. Prior to the
experiments,both test surfaceswere placed togetherin the laboratorypool boiling
vesselasdescribedin Chapter3.
For heatersurfaceQ-2, the transienttestsusing an imposedstepin heatflux
resulted in largermeanheatersurfacetemperaturesat boiling inceptionfor heatflux
levels lessthan7 W/cm2 than in thecaseof quasi-steadyheatingfor the sameinitial
conditions. A stepin heat flux of lessthan 7 W/cm2 resultedin a meangold film
temperatureof surfaceQ-2 at incipient boiling in therangeof 42.0to 62.9 °C.
Figure5.34presentsnaturalconvectiondataobtainedbeforeboiling inception
during quasi-steadyheating. The Nu calculatedfrom theheatflux usingthe thin film
120
surfacehadlargeruncertaintiesthan thosecomputedfor the metal heater. This larger
uncertaintyin the Nu of the quartzsurfaceis a consequenceof the relatively gxeater
uncertainties in the correspondingheat loss estimates. The natural convection
correlationof MerteandClark (1961)describethemeasureddatabetterthanequation
4.7. Natural convection data is also shown for the metal heater surface in the
horizontaldownorientation. The Nu for the invertedmetalsurfacearequite different
from theNu of thehorizontaluporientation,asanticipated,becauseof the lateralfluid
motion whichresultsfrom buoyancyeffects.

121
Figures 5.1 - 5.34 follow.

122
Figur_ 5.1 Gold film temr)eramre rise for one fourth of the film
surface for q"T =" 8 W/cm 2 at one second
(ax=Ay=Az=0.79375 ram)
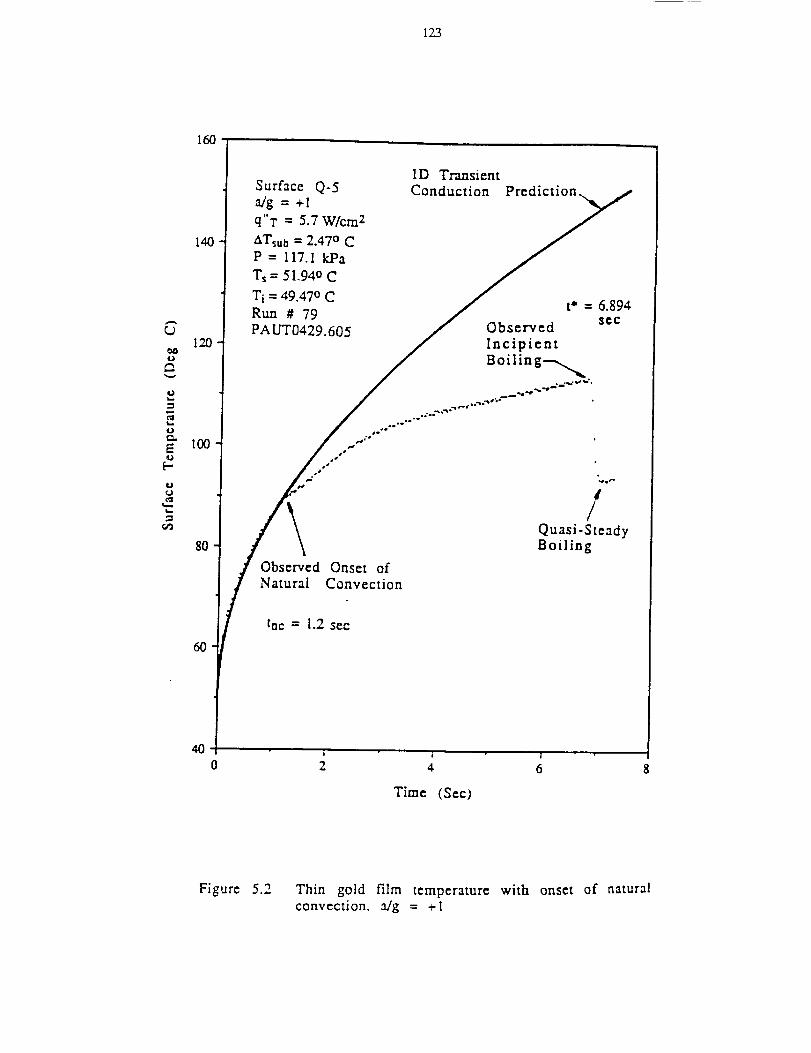
123
(J
9-s
E
t"
Cdl
t,,...
160
140
120
100
8O
6O
Surface Q-5a/g = +I
q"T = 5.7 W/cm 2
_Tsub = 2.47 ° CP = I17.1 kPa
Ts = 51.94 ° C
Ti = 49.47 ° CRun # 79
PAUT0429.605
1D TransientConduction 1_
Observed Onset of
Natural Convection
t* = 6.894See
" Q.
/Quasi-SteadyBoiling
the = 1.2 sec
2 4 6 8
Time (See)
Figure 5.2 Thin gold film temperature with onset of aaturalconvection. :fig = +l
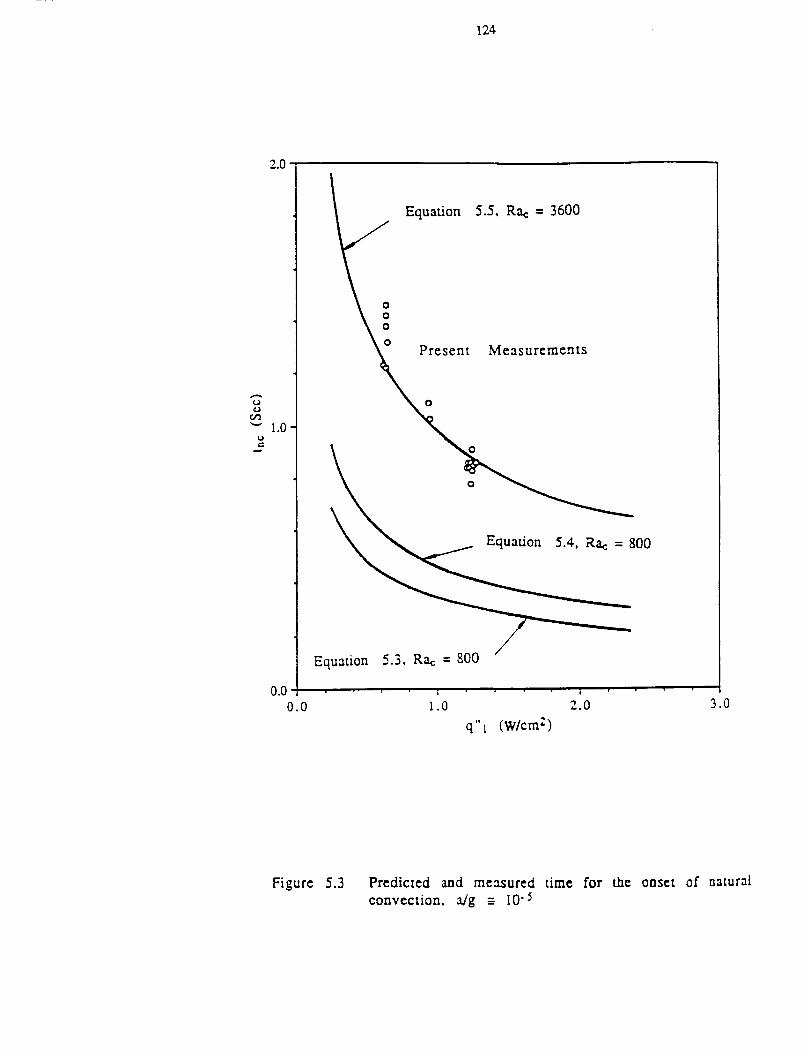
124
2.0
r.,,o
"-" 1.0-
Equation 5.5, Rae = 3600
ooo
oPresent Measurements
o
Equation 5.4, Rac = 800
Equation 5.3, Rac = 800
o0 1 l
0.0 1.0 2.0 3.0
q"l (W/cmz)
Figure 5.3 Predicted and measured time for the onset of natural
convection, a/g --- 10 .5
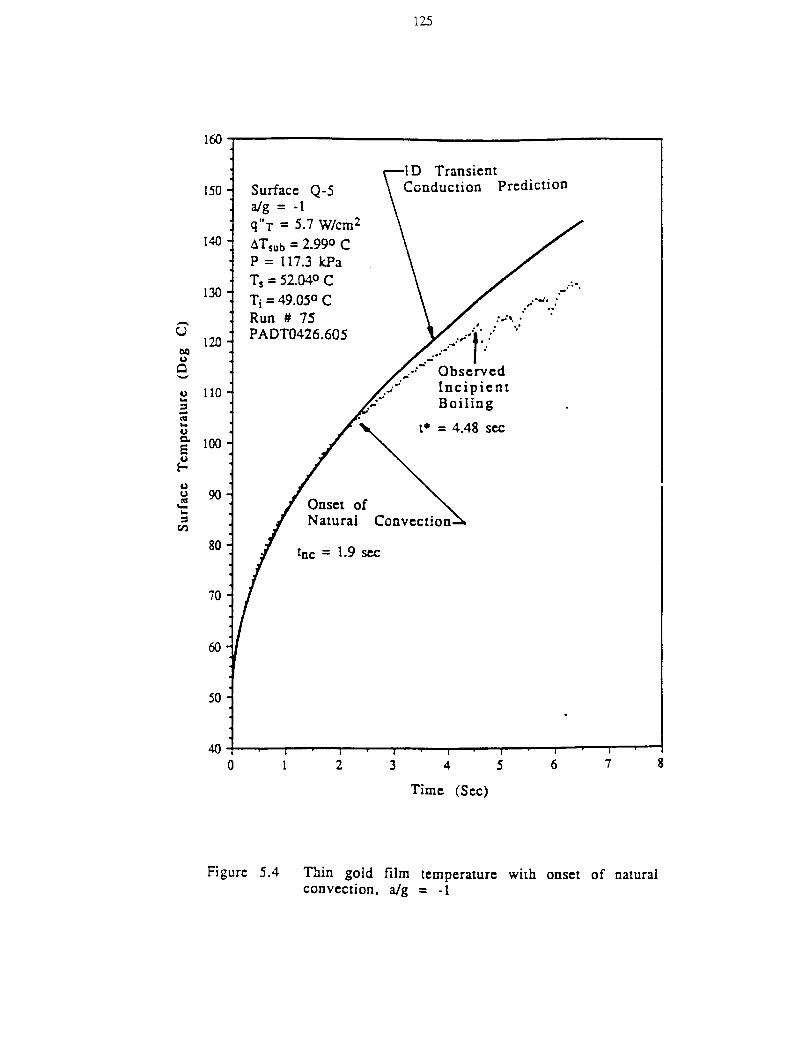
125
¢J
O
.oi
O
O[-
OO
-i
160
150
130
120
110
I00
9O
8O
70
6O
5O
,4.O
Surface Q-5
a/g = -I
q"T = 5.7 W/cm 2
ATsub = 2.99 ° C
P = 117.3 kPa
Ts = 52.040C
Ti = 49.05° C
Run # 75
PADT0426.605
TransientConduction Prediction
..°
Observed
IncipientBoiling
= 4.48 sec
Onset ofNatural Convection-_
tnc = 1.9 sec
I0
| •
1I ' i " i " I 1 i
2 3 4 5 6 7
Time (Sec)
Figure 5.4 Thin gold film temperature with onset of naturalconvection, a/g = -1
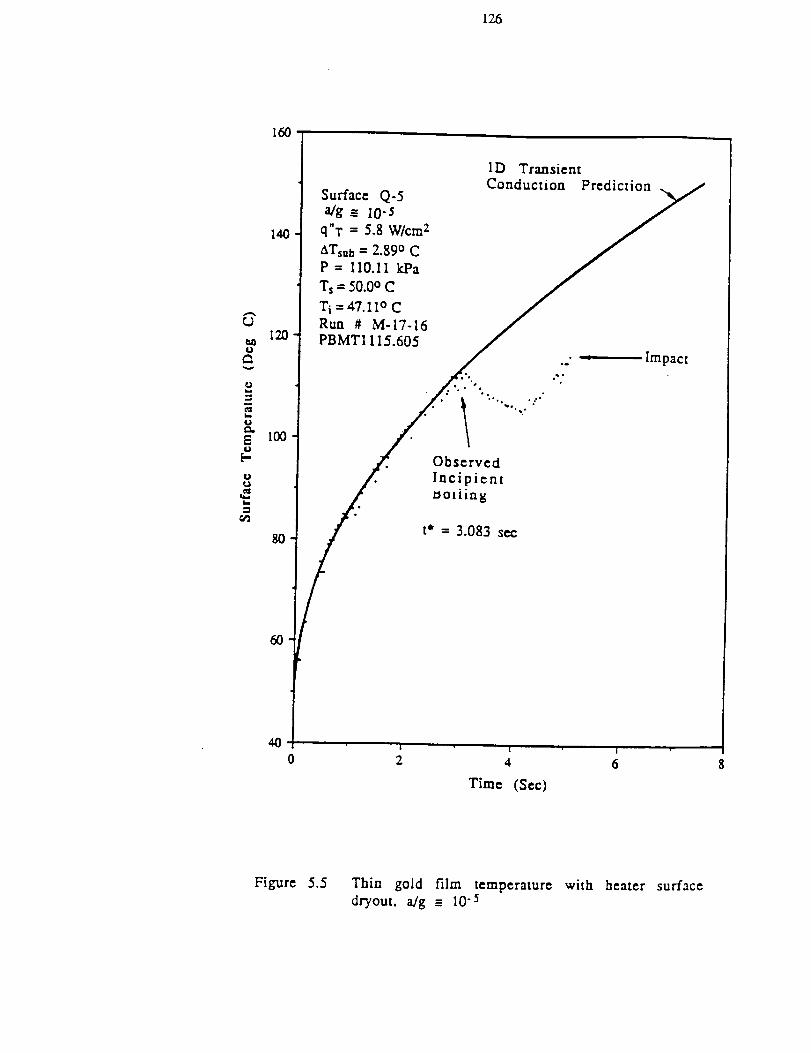
126
_0¢)
cn
k,J
¢}t-
U
160
140
120
t00
S0
6O
40
Surface q-5
a/g __ 10-5
q"T = 5.8 W/cm z
ATsub = 2.89° C
P = If0.11 kPa
T, = 50.0° C
Ti = 47.11° C
Run # M-17-16
PBMTI l15.605
I
0 2
ID Transient
Conduction Prediction
t" = 3.083 see
Impact
| I
4 6
Time (See)
Figure 5.5 Thin gold film temperature with heater surface
dr/out, a/g = 10 .5
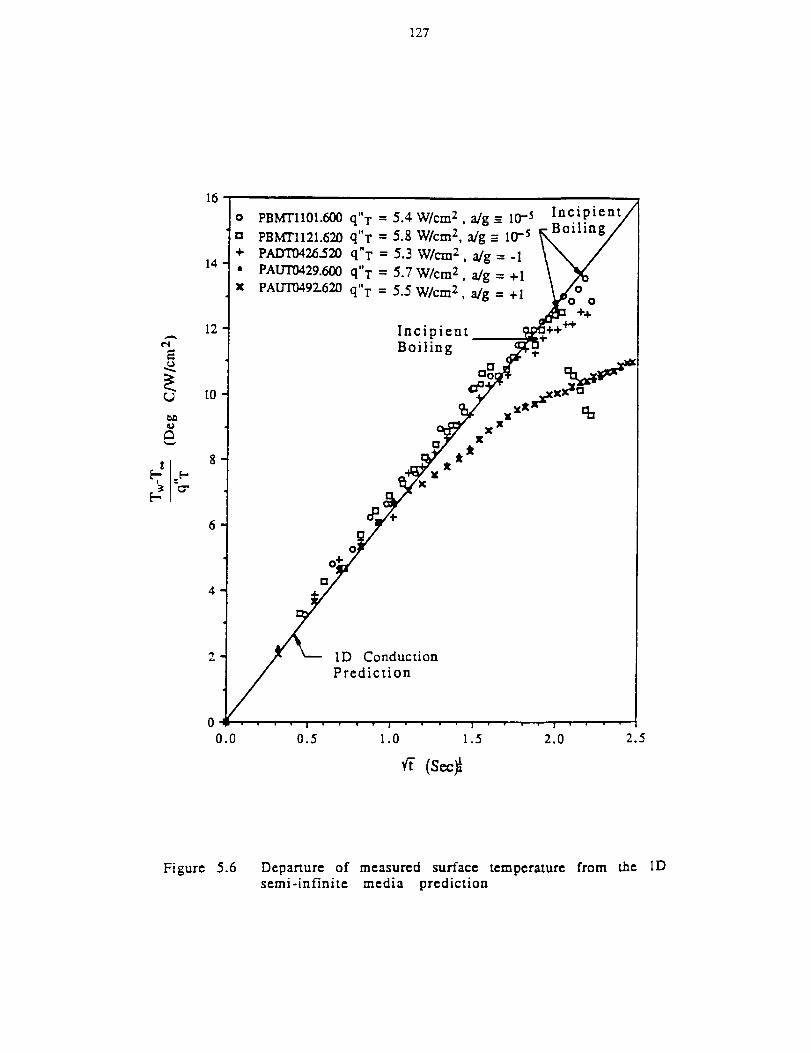
127
16
14
12
i IO
0
8
4
2
00.0
o PBMTII01.600 q"T = 5.4 W/cm 2 , a/g = 10--5
a PBMTII21.620 q"T - 5.8 W/cm 2, alg _= i0 -s
+ PADT0426._20 q'T = 5.3 W/cm 2 , a/g = -1
• PAU'fD429.600 q"T = 5.7 W/cm 2 ' a/g = +I
x PAUT0492.620 q"T = 5.5 W/cm 2 ' a/g = +I
IncipientBoiling
Incipient
Boiling
ID Conduction
Prediction
0,5 1.0 1.5 2.0 2.5
Figure 5.6 Departure of measured surface temperature from the IDsemi-infinite media prediction
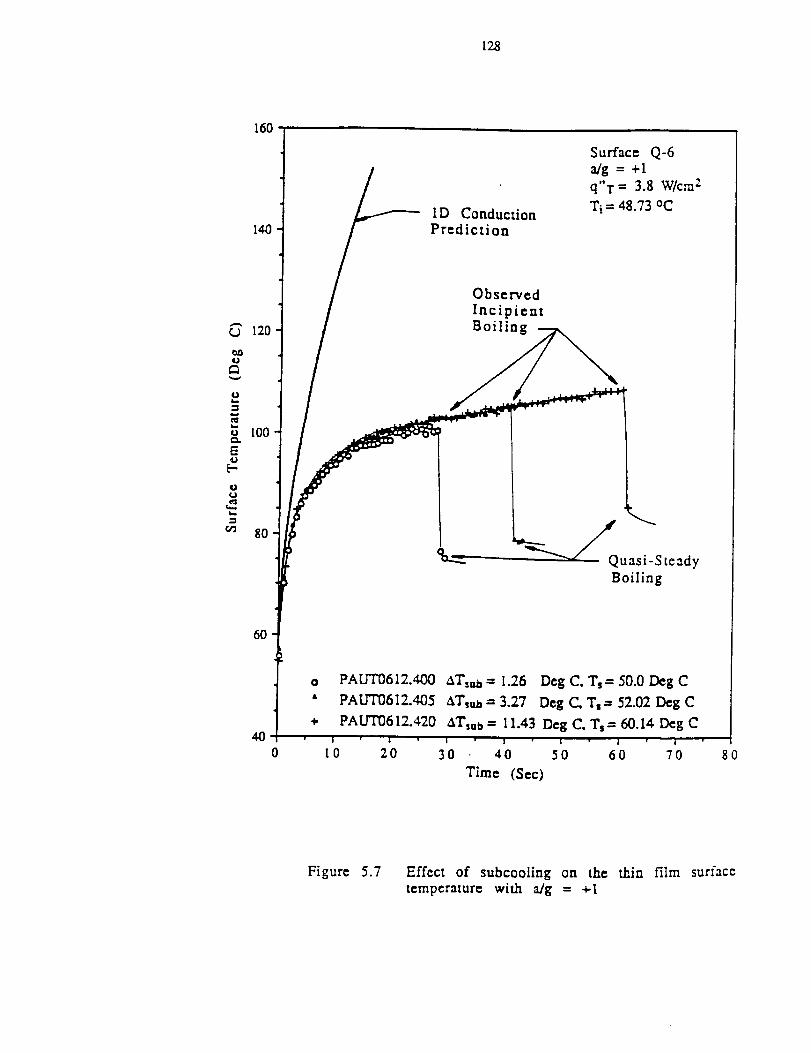
128
160
140ID Conduction
Prediction
Surface Q-6
a/g = +1
q"T = 3.8 W/cm 2
Ti = 48.73 °C
O
o,,,n1
t,I
EO
O
t=e
,-n
120
100
8O
Observed
IncipientBoiling
60
40
o PAUT0612.400
• PAUT0612.405
÷ PAU'I_612.420
I 1
I0 20
ATsun = 1.26 Deg C. "Is= 50.0 Deg C
AT_ua = 3.27 Deg C, Te = 52.02 Deg C
ATsub = 11.43 Deg C, Ts= 60.14 Deg CI I l |
30 40 50 60 70
Time (Sec)
80
Figure 5.7 Effect of subcooling on the thin film surfacetemperature with a/g = +I
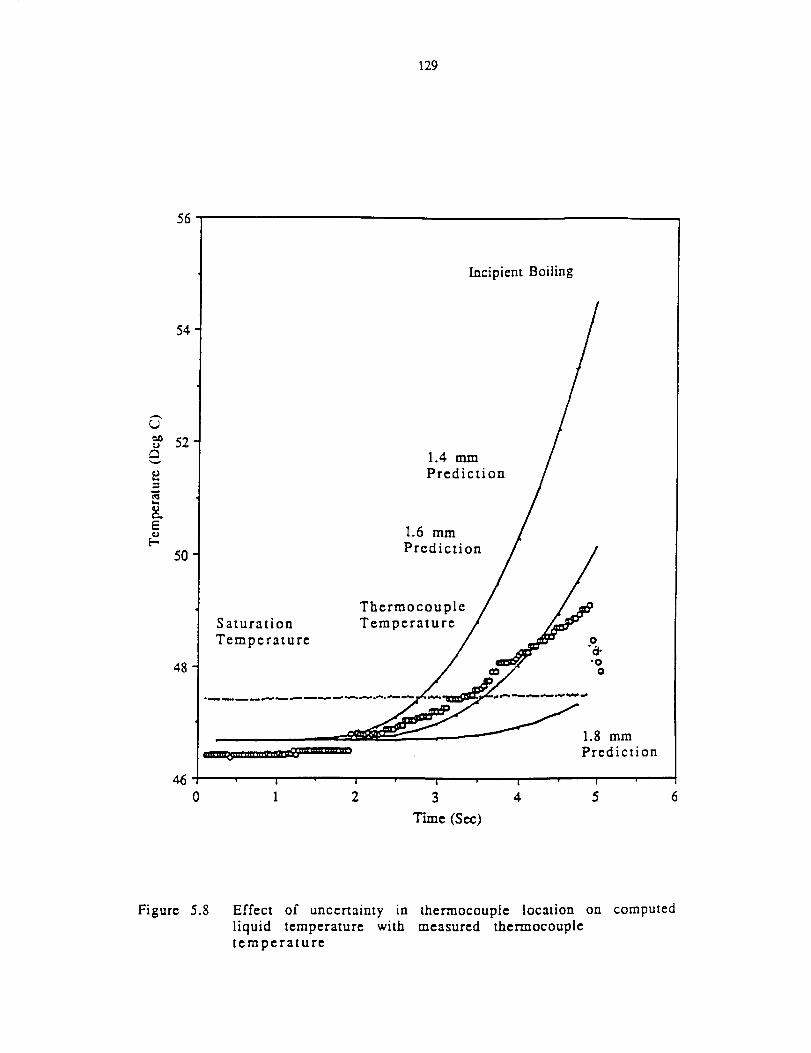
129
56
54
o 52_2
Eob'-
5O
48
46
0
Saturation
Temperature
Incipient Boiling
1.4 mmPrediction
1.6 mmPrediction
ThermocoupleTemperature
A
I | l I !
1 2 3 4 5
Time (See)
1.8 mmPrediction
Figure 5.8 Effect of uncertainty in thermocouple location on computed
liquid temperature with measured thermocoupletemperature
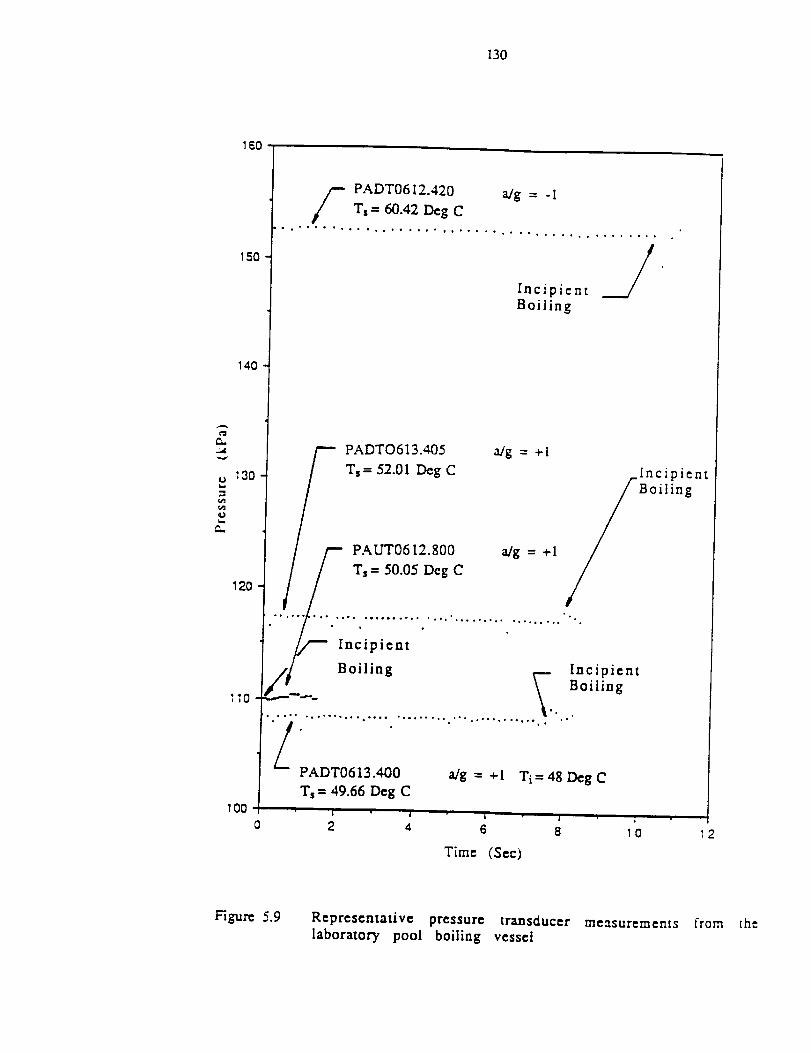
130
160
150
140
130
U
120
110
1O0
f PADT0612.420 a/g = -IT= = 60.42 Deg C
• . * - • • • • , • • . . • • • • • • i , • • • ° • = • m • ° o . . . . . . . , . , . . . .
Incipient ____'
Bailing
F PADTO613.405 a./g = +1
T== 52.01 Deg C Incipient]]ol "ling
/-- PAUT0612.800 a/g = +1Ts- 50.05 Deg C
/_ Boiling _. IncipientBoiling
o
,...i, .•...••,o,6o,.° .,°••.,..... °..•..,o•.j °
ZPADT0613.400
Ts = 49.66 Deg C
J
2 4
a/g = +1 T i=48DegC
6 8 10 12
Time (See)
Figure 5.9 Representative pressure transducer measurements from the
laboratory pool boiling vessel
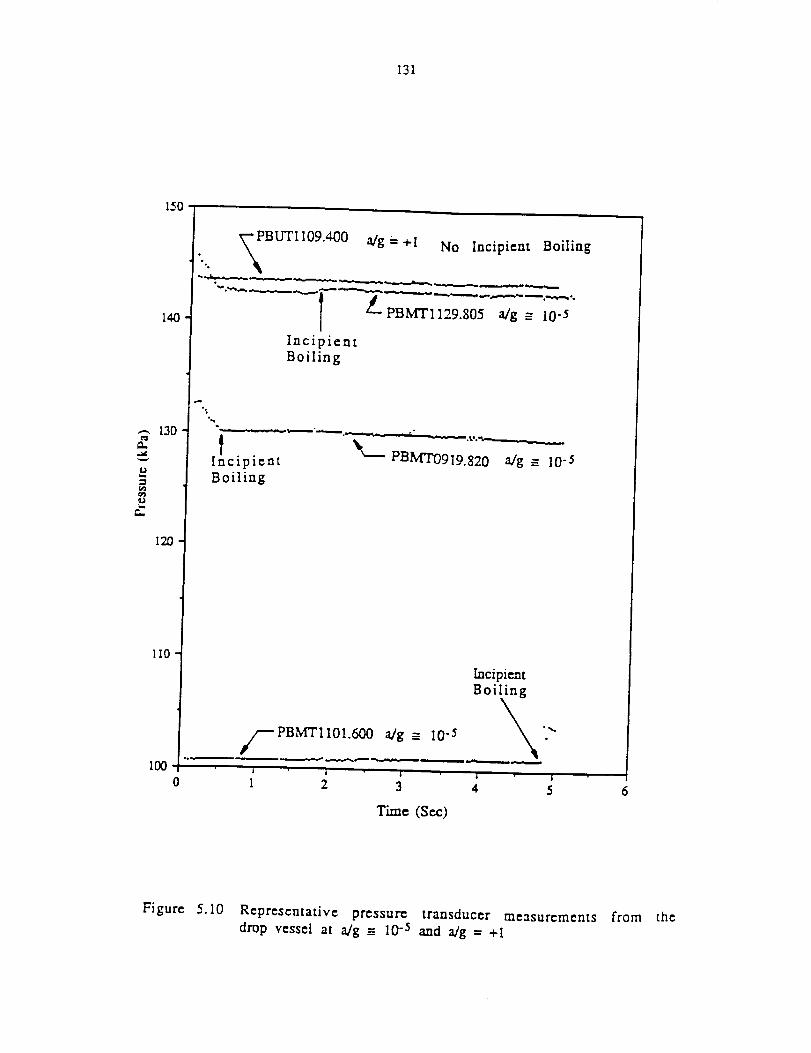
131
l_O
140
.--130
1211
110
100
_PBUTII09A00 a/g- +I No Incipient Boiling4 WQ
IncipientBoiling
"_°
PBMT0919.820 a/g = I0-5k___
I cipientBoiling
PBMTII01.d00 aig -- I0 -5
i |i| | • |
0 I 2 3
Time (S e.c)
Incipient
Boiling
',,..A
6
Figure 5.10 Representative pressure transducer measurements from the
drop vessel at a/g -= 10"_ and a/g = +1
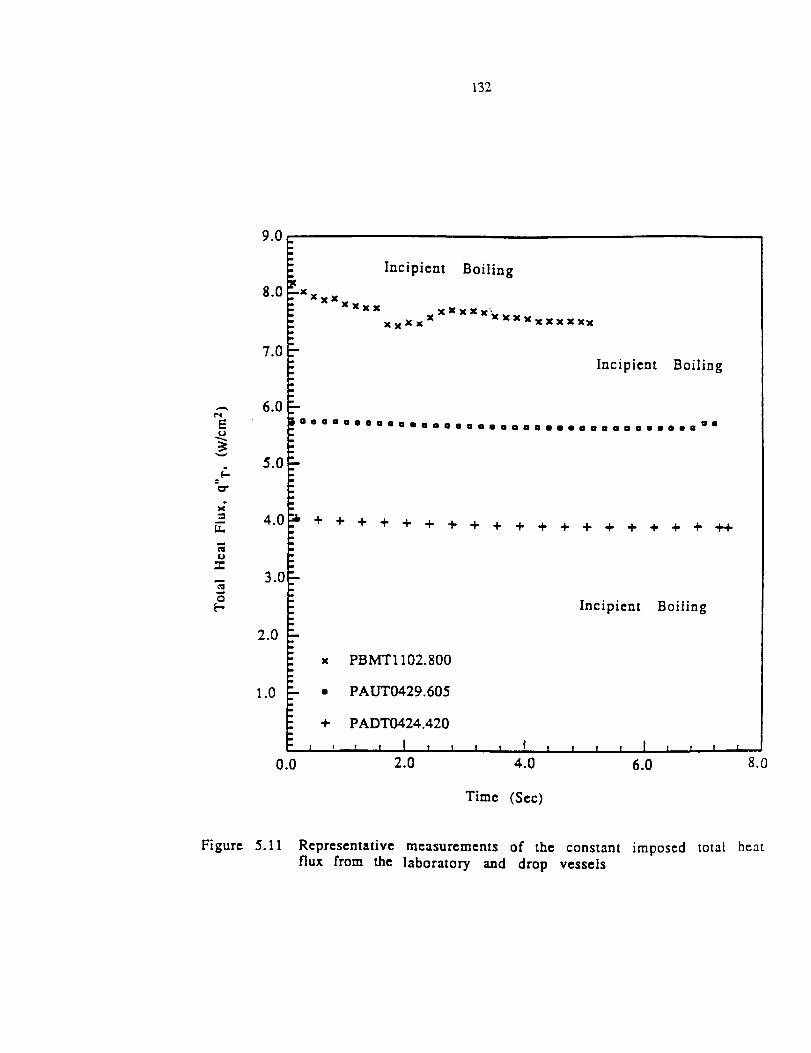
132
Incipient Boiling
¢..
EL
U
w0
[..-
8"0_XXxXxxxx
m
7.0
6.0
5.0
4.0
3.0
2.0
xxXxXx"XXXXxxxxxxxxXx
1.0
Incipient Boiling
O00000000000OO0000000000OO000000000000
+ + + + + + ÷ + + + ÷ ÷ ÷ ÷ ÷ + + ÷
x PBMTll02.800m
: • PAUT0429.605
Incipient Boiling
+ PADT0424.420
i , ' l I , I I , I I i l , I T , i ,
0.0 2.0 4.0 6.0 8.(
Time (Sec)
Figure 5.11 Representative measurements of the constant imposed total heatflux from the laboratory and drop vessels
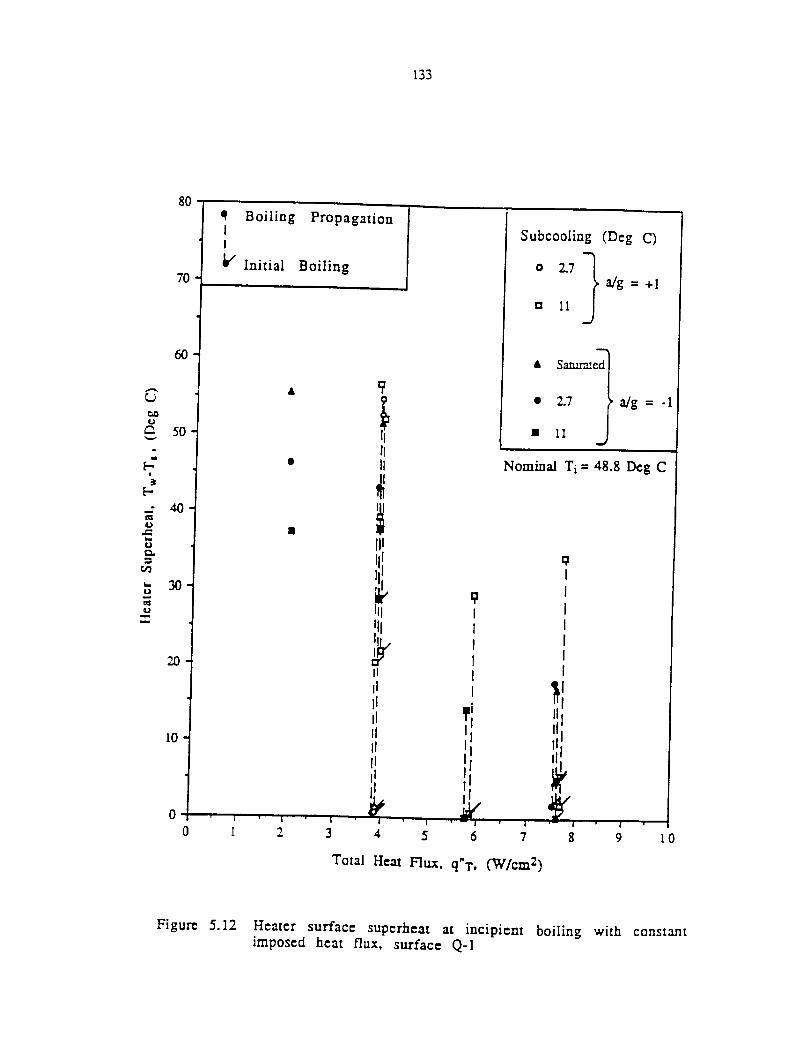
133
80
q Boiling PropagationII
Ig" Initial Boiling70
60
50
i
uex.
_- 30u
U
10
0 I ' i I I
0 I 2 3 5
IIII
!11
ilIIIId
IIfliI
4
9
II
6
Subcooling (Deg C)
o 2.7 l,a/g =+ Itl I1
• 2.7 _' a/g =
_J• I1
Nominal Ti = 48.8 Deg C
IIIIIIII
l I ' I '
7 8 9
Total Heat Flux, q"T, ('W/era 2)
-1
Figure 5.I2 Heater surface superheat at incipient boiling with constantimposed heat flux, surface Q-1
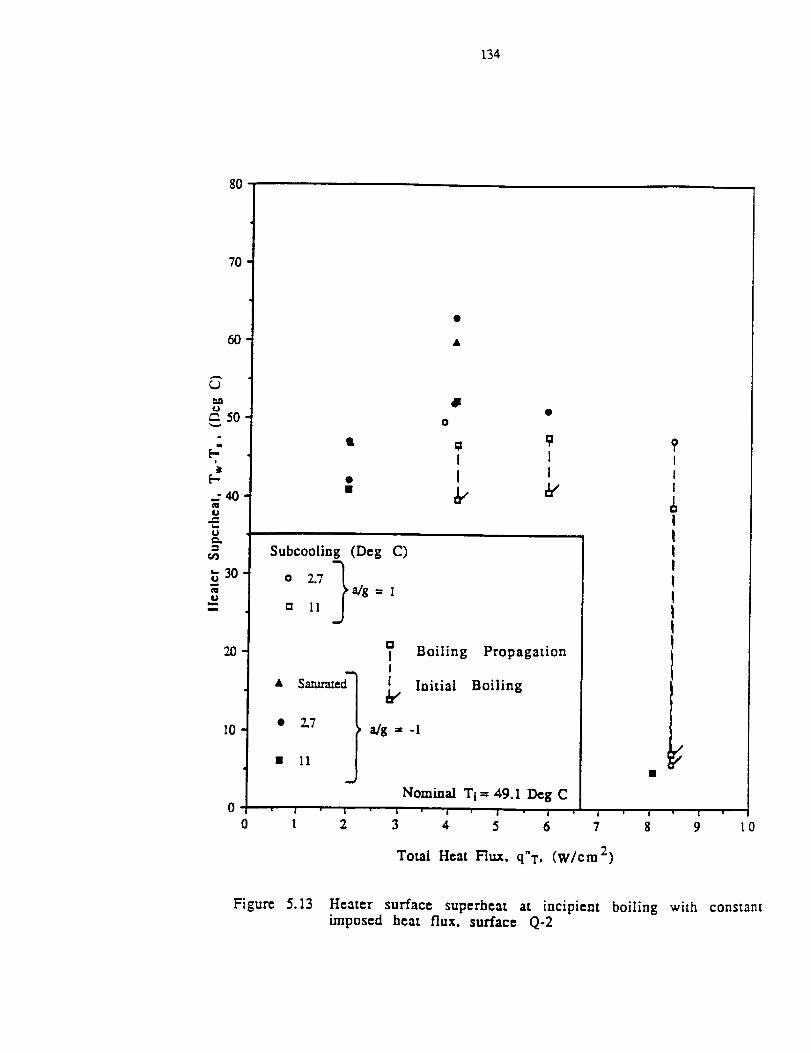
134
80
70
60
10
Subcooling (Deg C)
oo 2.711_a/g= I
• 2.7
• 11
DI Boiling PropagationI
I Initial Boiling
Nominal Ti = 49.1 Deg C
¢ ¢ ! , ]
0 1 2 3 4 5 6 7 8 9 10
Total Heat Flux, q"T, (W/cm 2)
Figure 5.13 Heater surface superheat at incipient boiling with constantimposed heat flux, surface Q-2
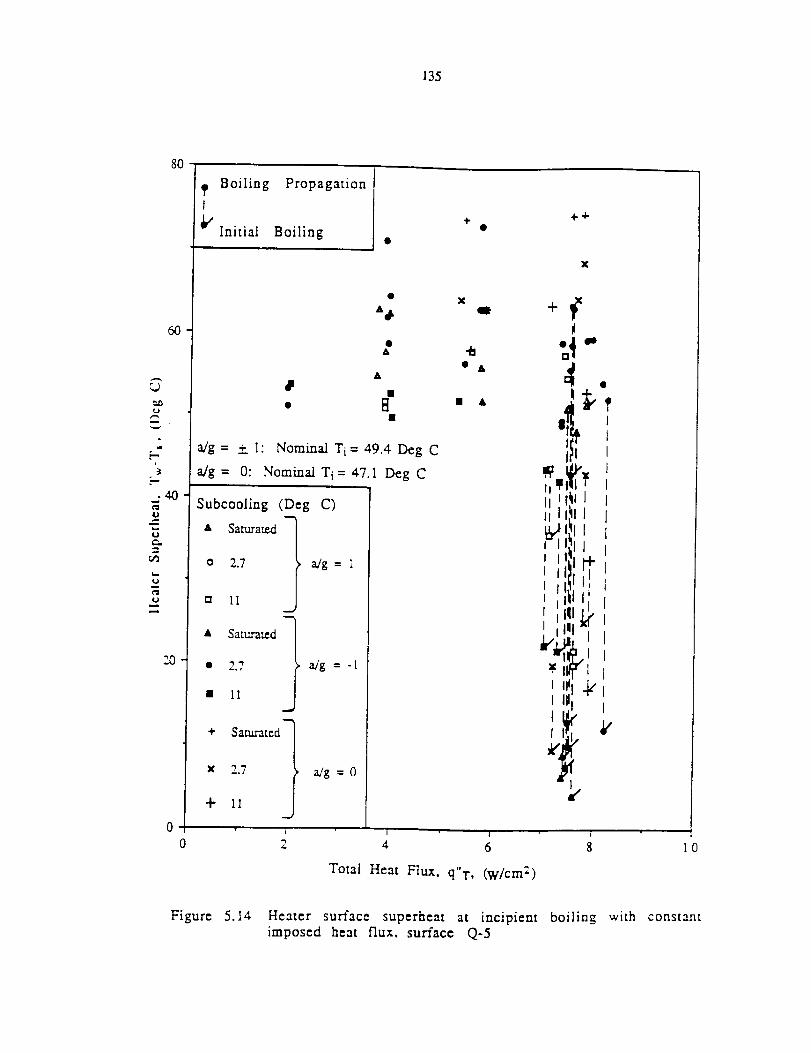
135
80
60
,.,ow
.404_U
b==U
o_
42
20
(D Boiling Propagation
I
k'Initial Boiling
'4-+4-
A,
A
A
dl
a,/g= +_ I: Nominal Ti= 49.4 Deg C
a/g= 0: Nominal Ti = 47.1 Deg C
Subcooling (Deg C)
& Saturated __ a,/g = 1
_J
a./g = -1
o 2.7
a 11
• Saturated
• 2.7
a/g =0
• 11
+ Saturated t
x 2.7
+ 11
L
2
xO
• &
ii I I
1
I iiI
I
:¢ IW_"1
I III ._
I1!1
i ! I
0 4 6 8
Total Heat Flux. q"T, (w/cm 2)
Figure 5. i4 Heater surface superheat at incipient boiling with constant
imposed heat flux, surface Q-5
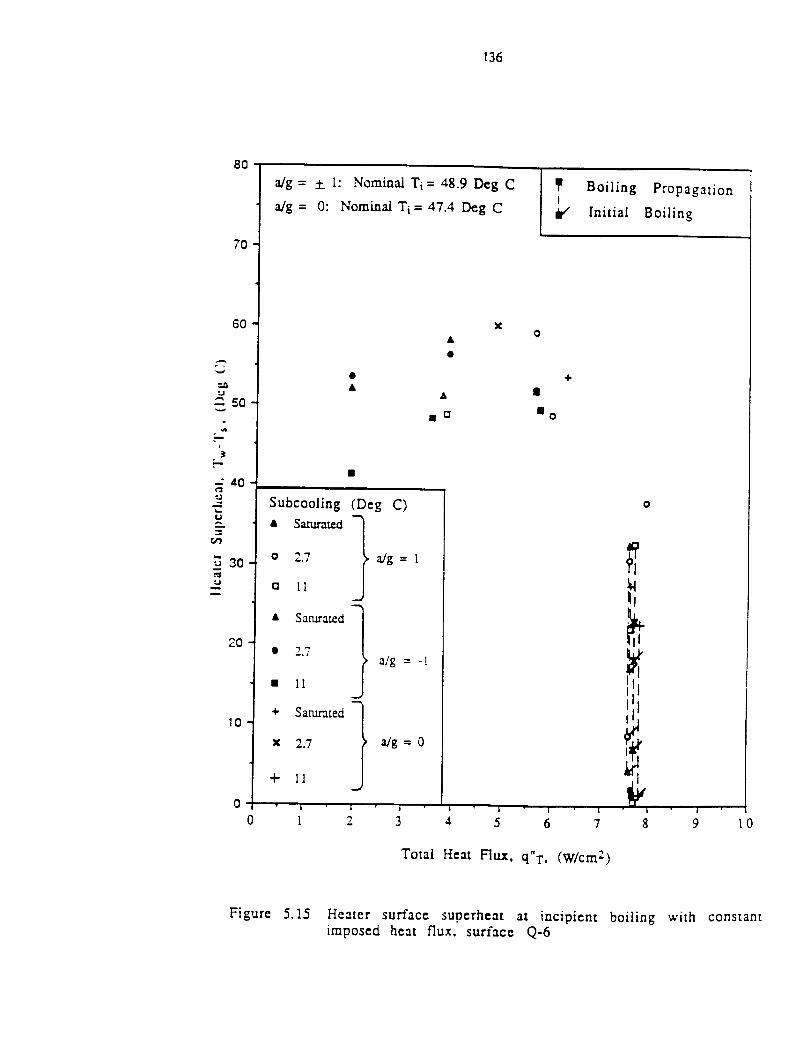
136
80
7O
6O
5O
,_ 40¢-jU
U
•3 3O
2O
10
a/g = + 1: Nominal Ti = 48.9 Deg C
aJg = 0: Nominal Ti = 47.4 Deg C
Boiling Propagationa
Initial Boiling
A
X0
0
Subcooling (Deg C)
• Sam_tcd I
o 2.7 . a,/g = 1
a 11
• Saturated t• 2.7 a/g = -!
• 11
÷ Saturated t
x 2.7 a/g = 0
4- I1
O
i
iIII
0 1 2 3 4 5 6 7 8 9 10
Total Heat Flux, q"T, (w/cm:)
Figure 5.15 Heater surface superheat at incipient boiling with constant
imposed heat flux, surface Q-6

137
100
I0
4. °w
d.lE
e-
.01
.001
.0001
* 1 "t = 67.083 exp(-0.605 q T)
_/Initial Boiling
Subcooling (Deg C)
o 2.7
El 11
• Z7
• 11.
a/g = +1
a/g = -1
i,
I
tI
I
I
k'II
k"
Nominal Ti= 48.8 Deg C• J ' I ' I " I ' _ ' J : I _ I • i
0 t 2 3 4 5 6 7 8 9
Total Heat Flux, q"'r, (w/cm:)
0
Figure 5.16 Incipient boiling delay time with constant imposed heat
flux, surface Q-I
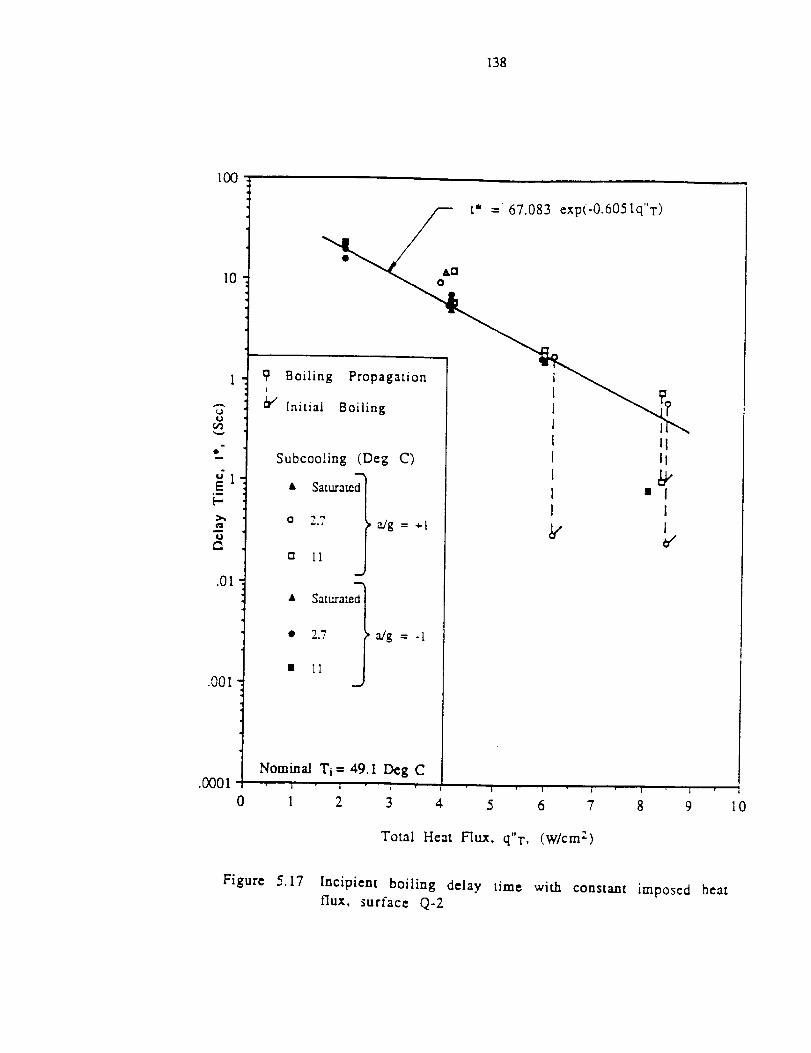
138
100
I0
s_
,..=#
V"
t.I
.01
.001
.oooi
t* = 67.083 exp(-0.6051q"T)
Botlmg PropagationInitial Boiling
Subcooling (Deg C)
• Saturated
o 2.7
ca 11J
• Saturated
• 2.7
m I1
a/g = -1
IIIt
• IIl¥'
Nominal Ti = 49.1 Deg C
0 1 2 3 4; 5 6 7 8 9
Total Heat Flux. q"T, (w/cm:)
10
Figure 5.17 Incipient boiling delay time with constant imposed heat
flux, surface Q-2
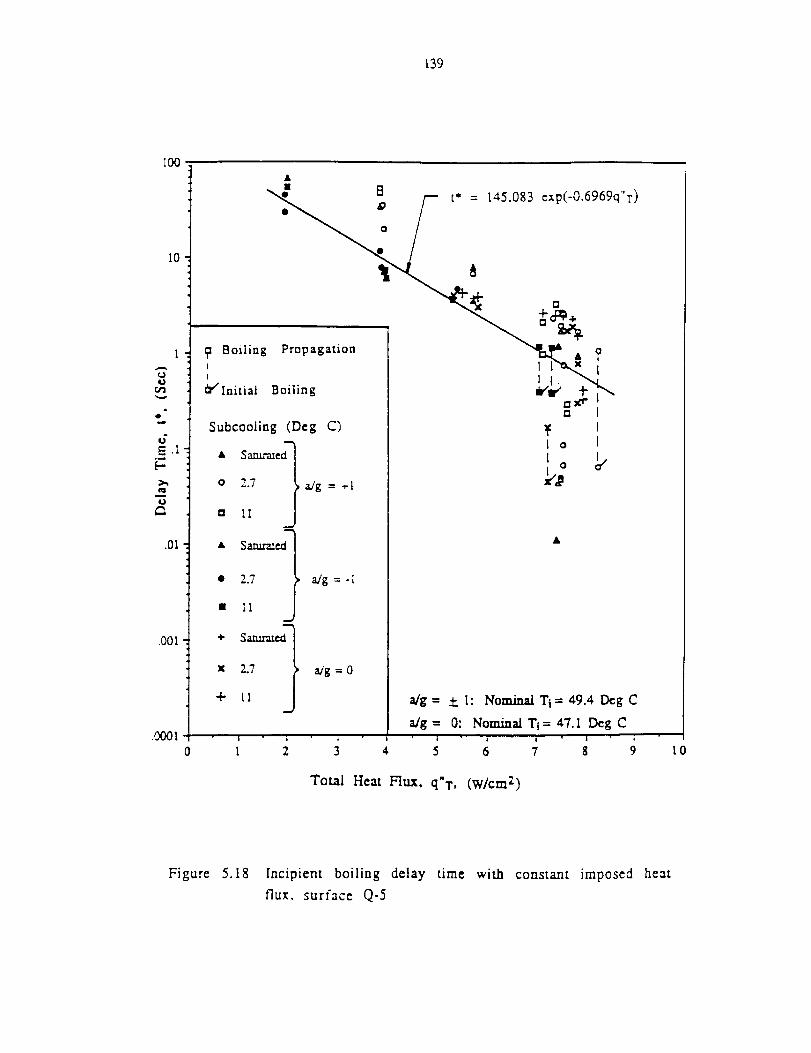
139
I00
I0
1
"6"U
@°w
dE.I
.i
"d
.01
.001
.0001
l:1 _ t" = 145.083 exp(-0.6969q'z)
, + oclla,
Boiling Propagation • ?
a I IO/Initial Boiling t,'_;'r.I
Subcooling (Deg C)
• Saturaed'_
2.7 a/g = -,-1
[] 11
• 2.7 a/g = - I
• I1
"ii IS_
x _ a/g =0
+
0 I 2 3
ta I
I o I
alg = + I: Nominal Ti= 49.4 Deg C
a/g= 0: NominalTi= 47.1 Deg C
4 5 6 7 8 9 I0
Total Heat Flux, q'T, (wlcm 2)
Figure 5.18 Incipient boiling delay time with constant imposed heat
flux. surface Q-5
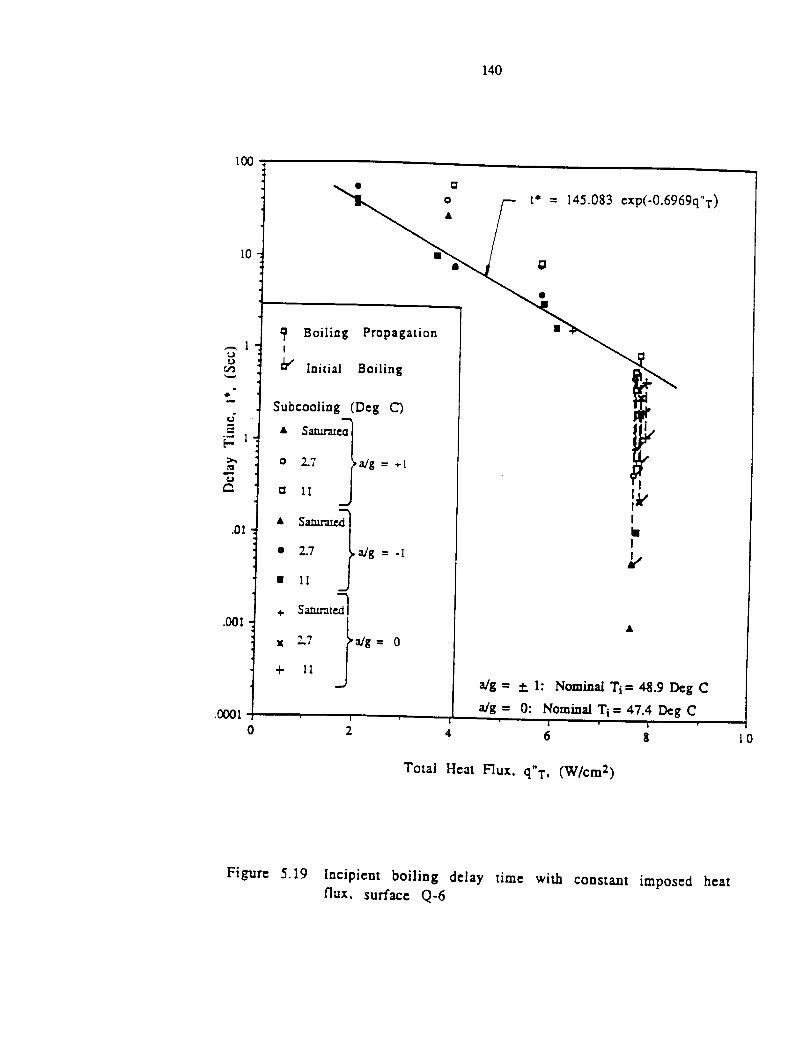
140
100
tO
,--,1
c,,'3
"Gr_
.01
.001
.000!
__ _-- t" = 145.083 exp(-0.6969q"T)
Boiling Propagation m _._
_1/ Initial Boiling _.
Subcooling (Deg C) _.
• /2., _,a/g = +t
J I
tt _
o
I3
" 1Saznai.ed
• 2.7
• 11
+ Samrated_
x 2.7
÷ 11 y
a/g = -I
a/g= 0
iI •
0 2 4
klI
k,
a/g = .+. 1: Nominal Ti = 48.9 Deg C
a/g = 0: Nominal Ti = 47.4 Deg C| L
6 8
Total Heat Flux, q"T, (W/cruz)
Figure 5.19 Iocipient boiling delay time with constant imposed heat
flux, surface Q-6
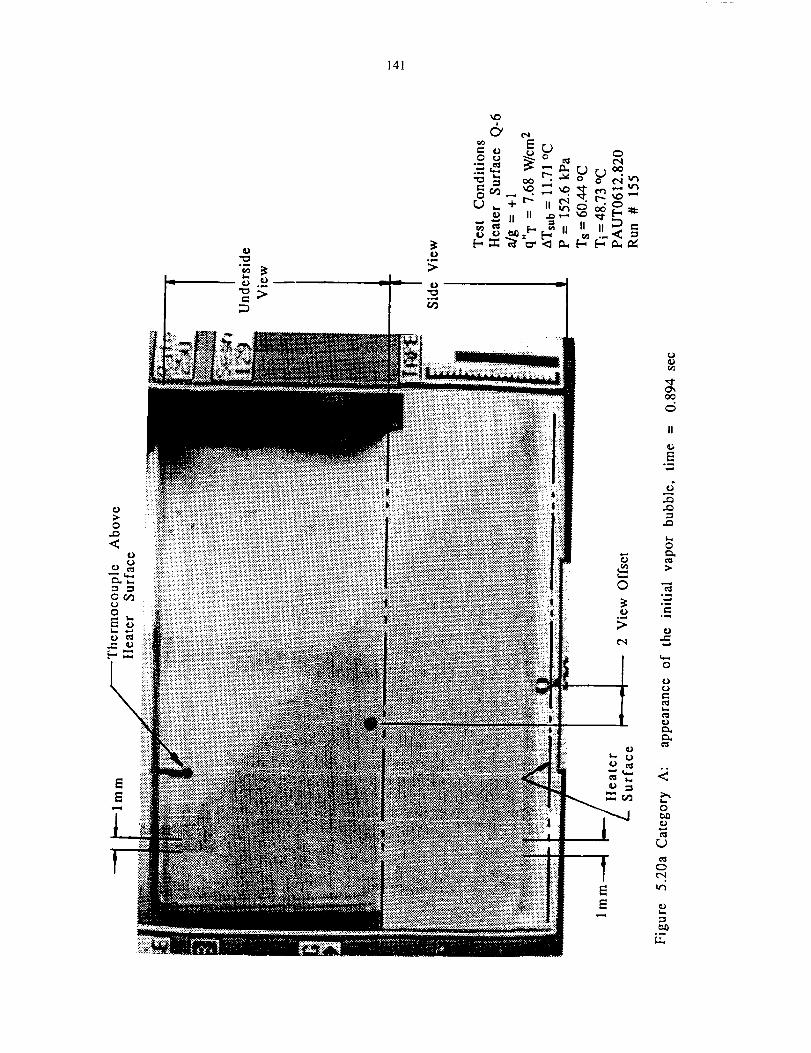
141
0
>
II
o_
e_
°_
o_
0
0
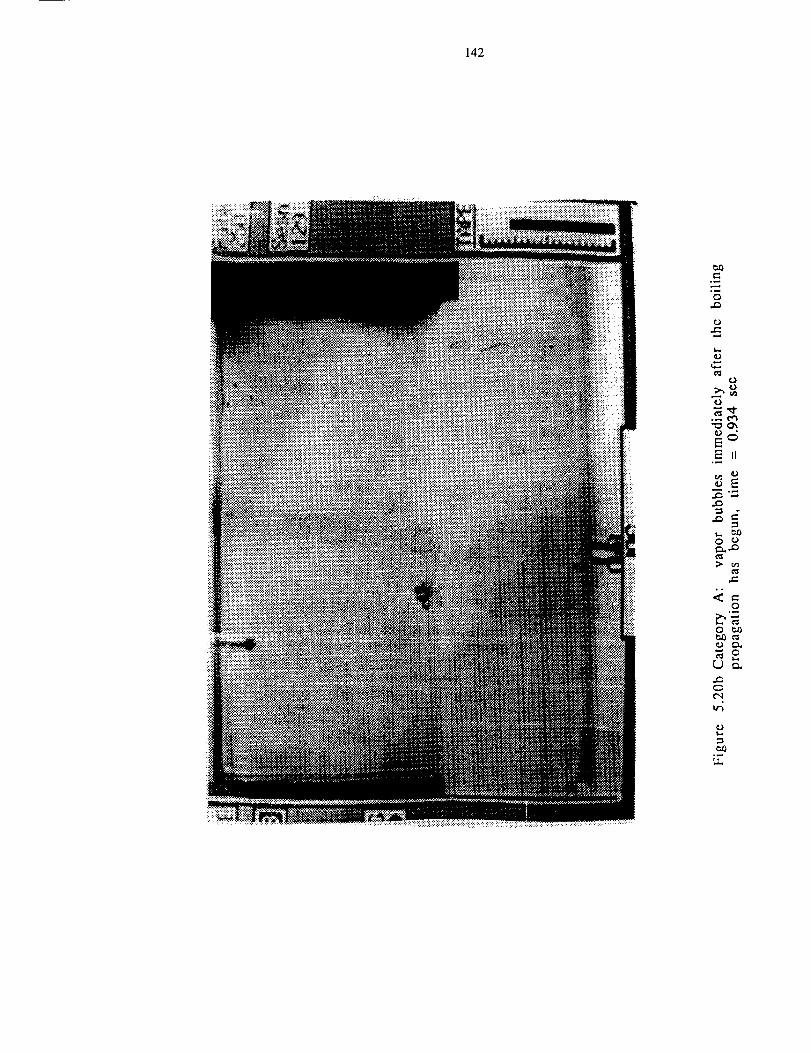
142
°_
0
0
..E_
0
E iI
_ °_
0 0
0
r...) _
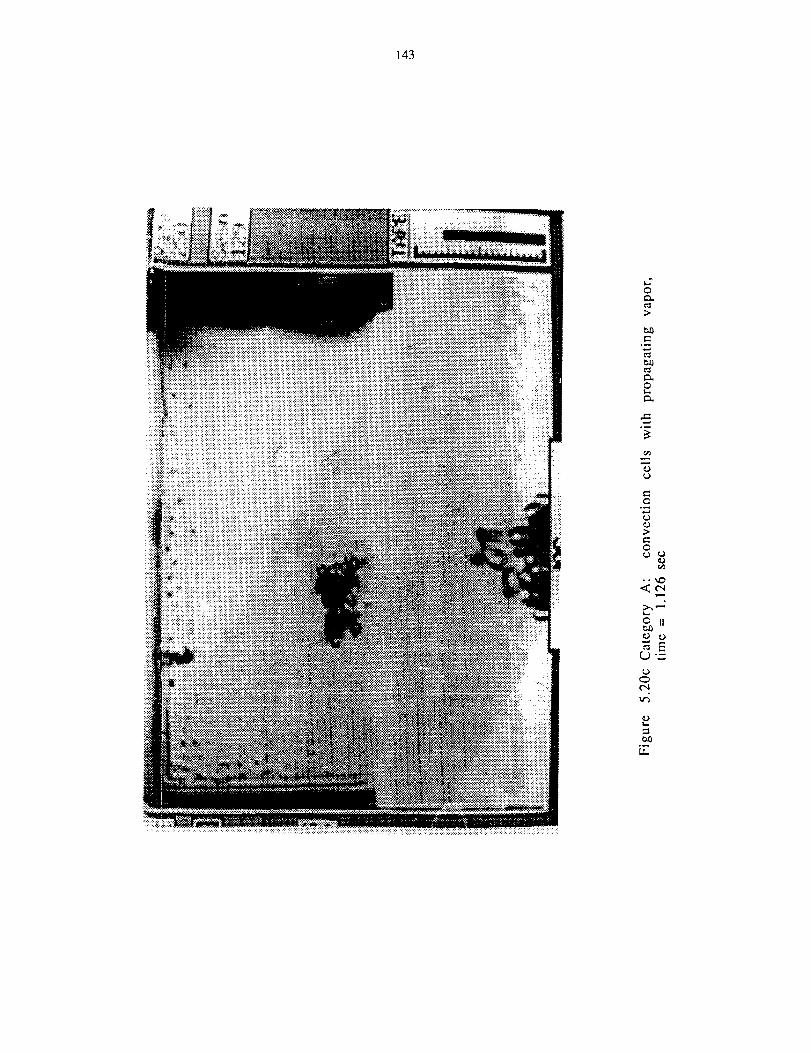
143
0e'_
e..Ot"-'
._
£
"-d
e-,0
°_
0
e',0
• ° _1_
o IIe.0
_E(..) "_
t'q
e_
rr
144
0
o_
H
E0_t.A
_5L
0
o_
¢-J
¢-J
o
0
0
°_
145
o
_o
e.., o°__, e-,
ej
o
o o
¢...)
o0.0o
0_J
e'_ m_,_ ._
,.O
0e.OlJ
r..) .a
0t',l
146
N
L.0
eU
o_°_
o_
_E°_
°0
e,I
147
N
r_
0'_1",.--, ¢"1
O
_E
0
..
0 e_
_o...,
O
¢'q
°_l.r.,

148
¢'d°_
L
Q
UI=
>,.
t_
L
m
t..,0
o_
r_
° o t.,._
t"q
_.,:5o II
r..) ._
t'q
_0
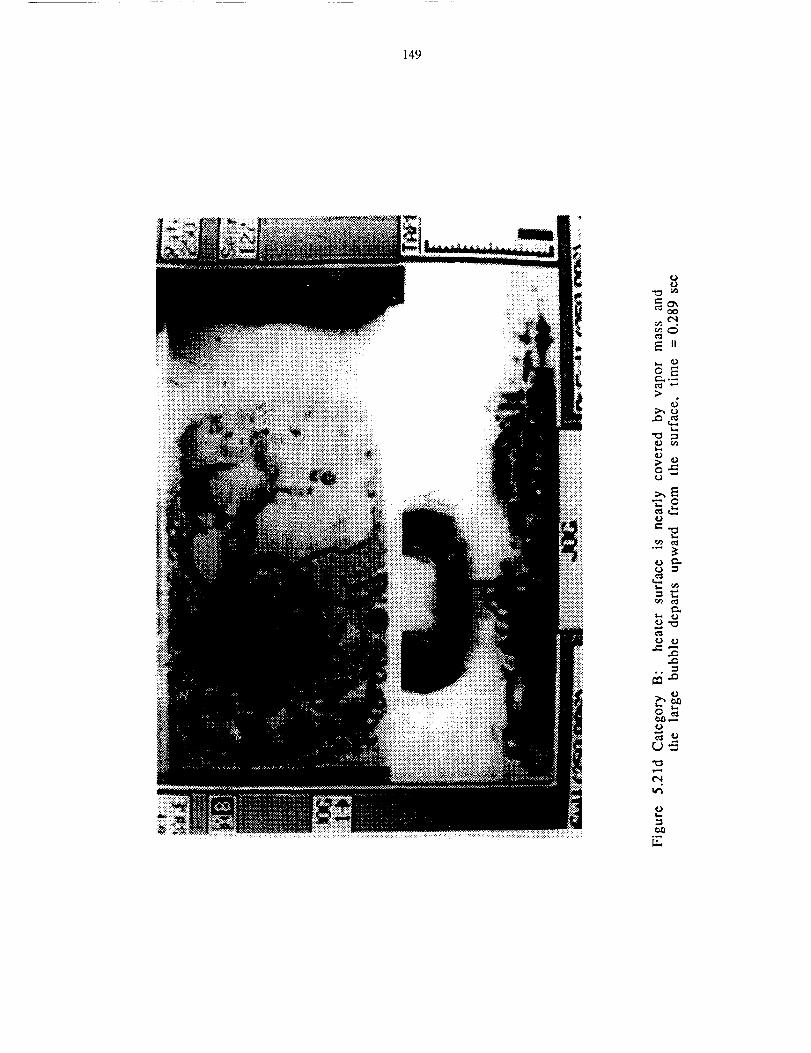
149
::2:::::::::::
t'l
_d
E II
&.E
d
0 ,,..
0
o_
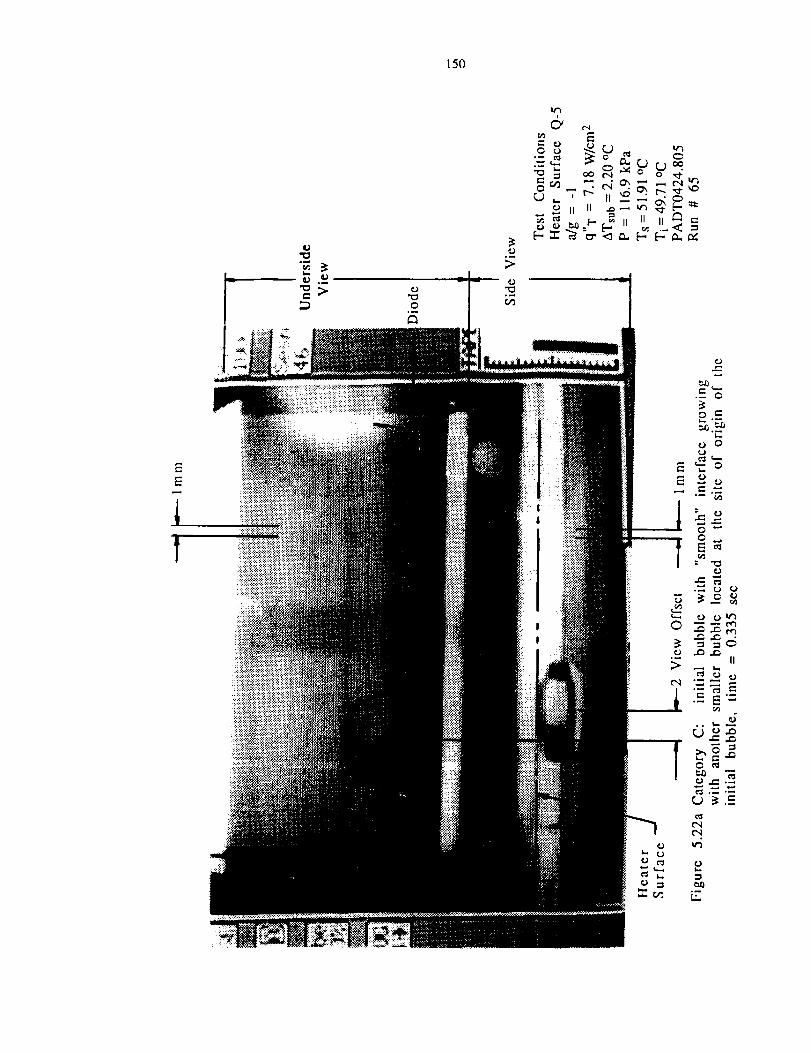
150
o_
;>
E
°_"" oC_ __
• "_" Ic_
1i_6 .v-
EE
f
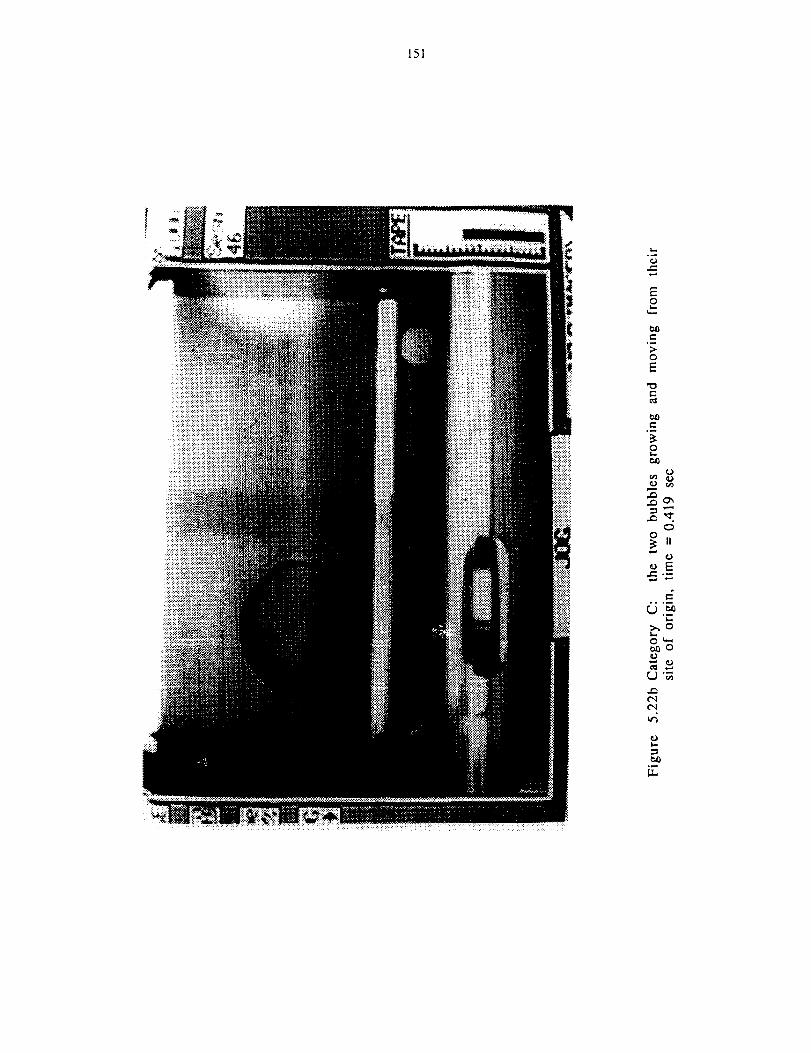
151
,_t..)
t--,
Eo
o
E
t.-,
oed_
=_c5
o
o t,..,
¢xlt"q
kr.,
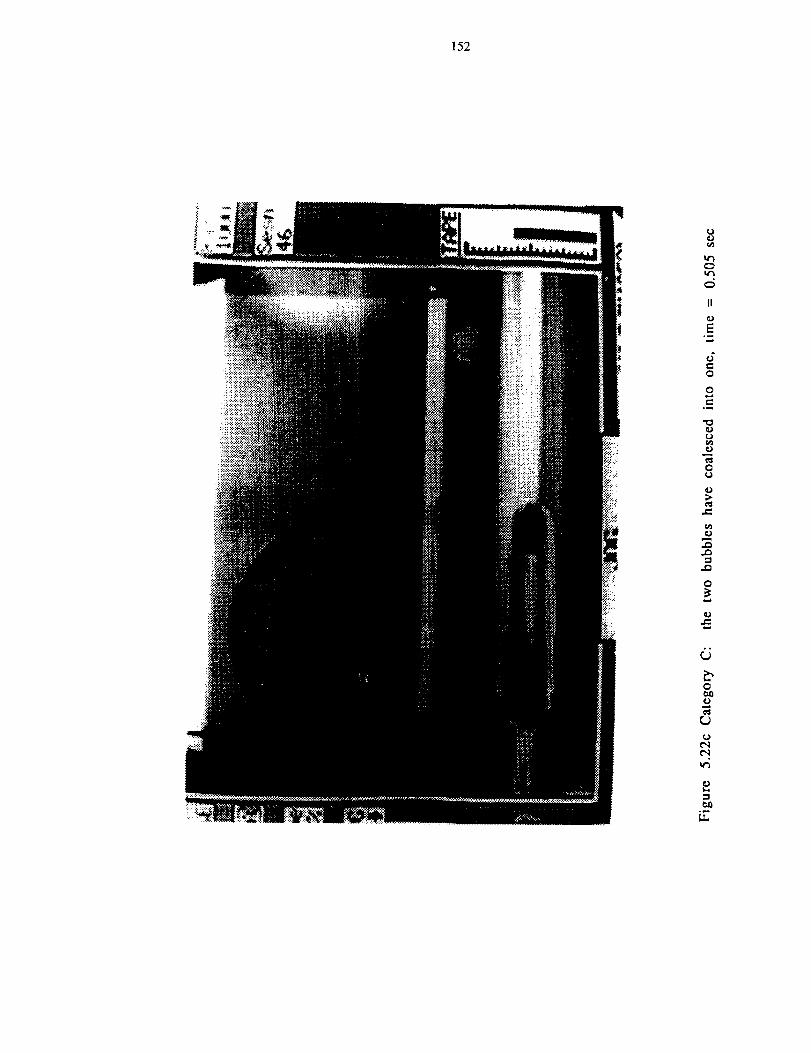
152
H
°_
d
Q
e"r
t,3
e_
O
_t
O
"2.
r5
O
_.o
t"qt"q
°_
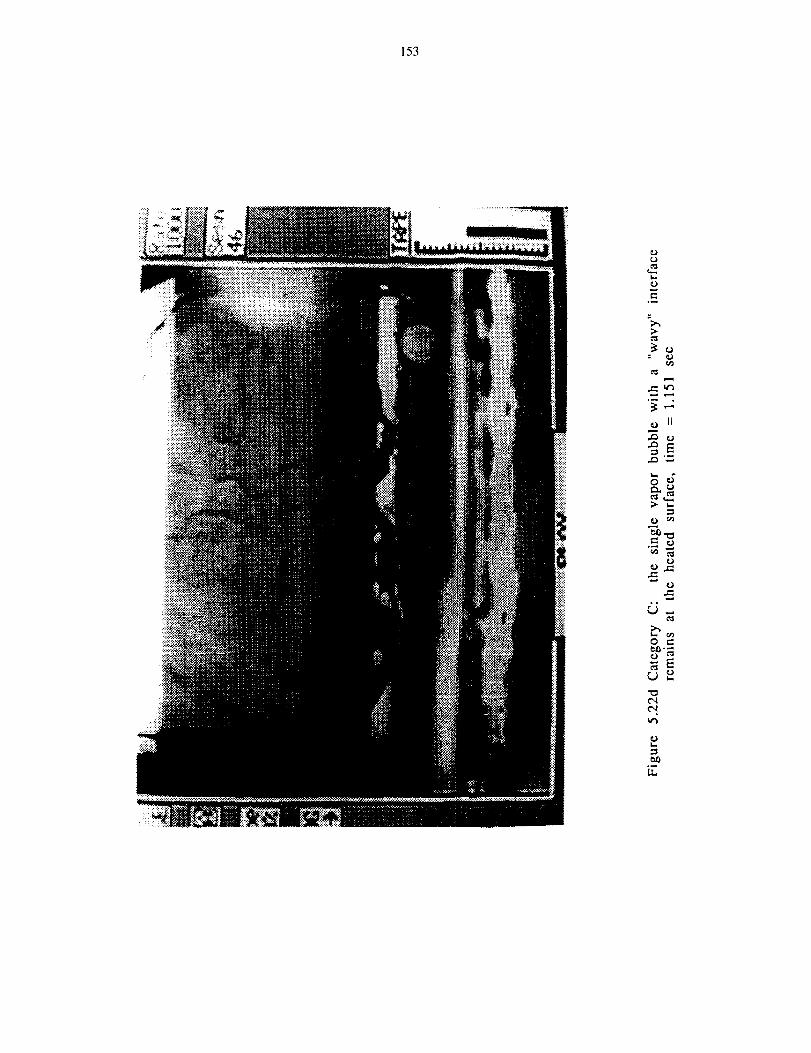
153
::i
t"o_
_- ed,
t_
.=_
_E
rS...
("4t"q
_0°_[.x.,
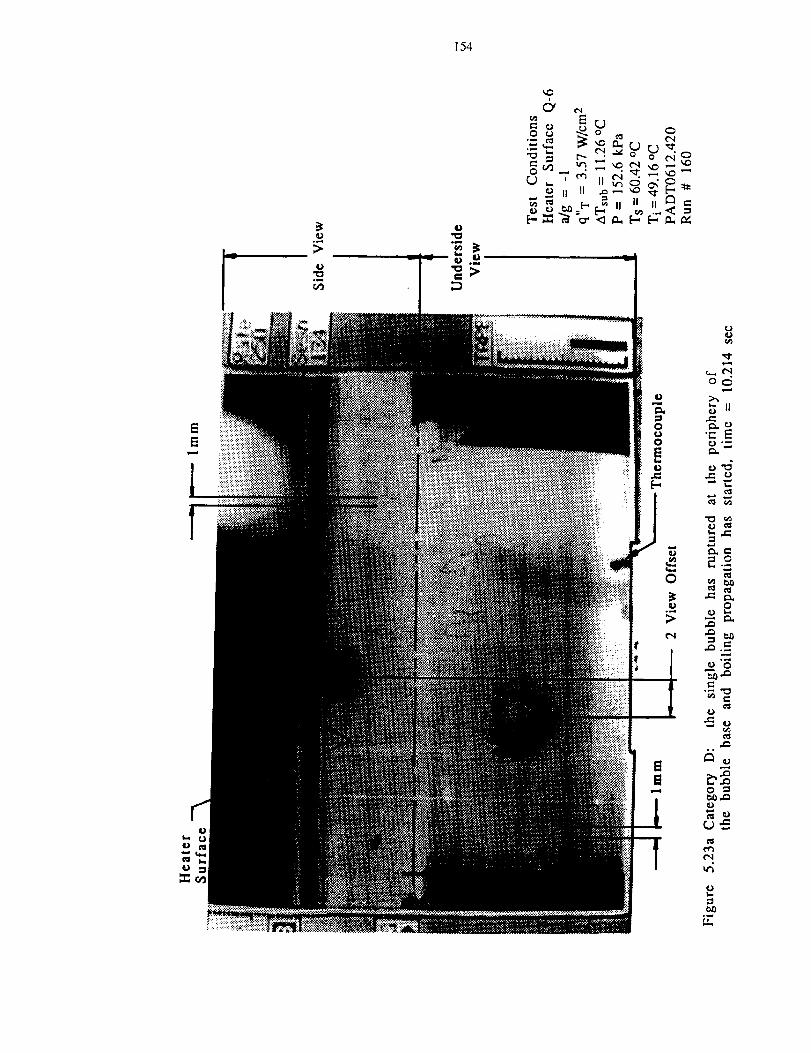
154
u0
O_
"" Eo_
,,= 0...._
c_
0
._.=_°_
0 0
e..
0
0
No
('1
0L_
°_
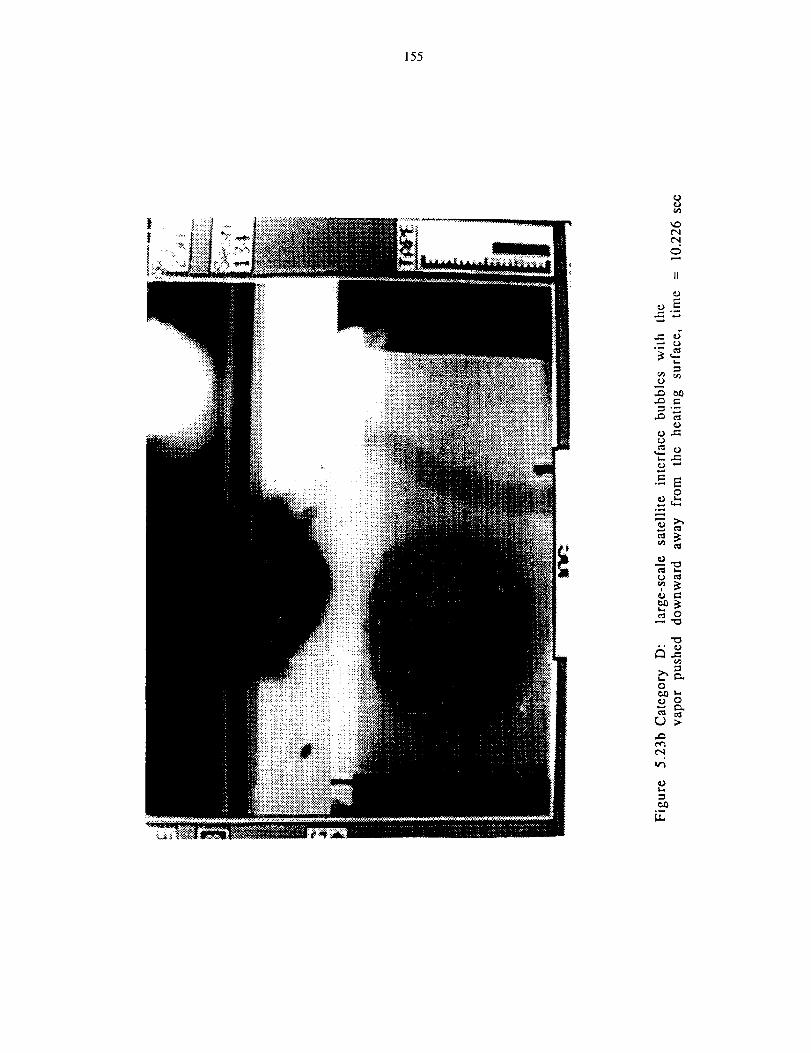
155
t"qC'q
0
H
oE
°_
•=- E0
°_
0e..O_
¢'_ t'_
t"q
°_
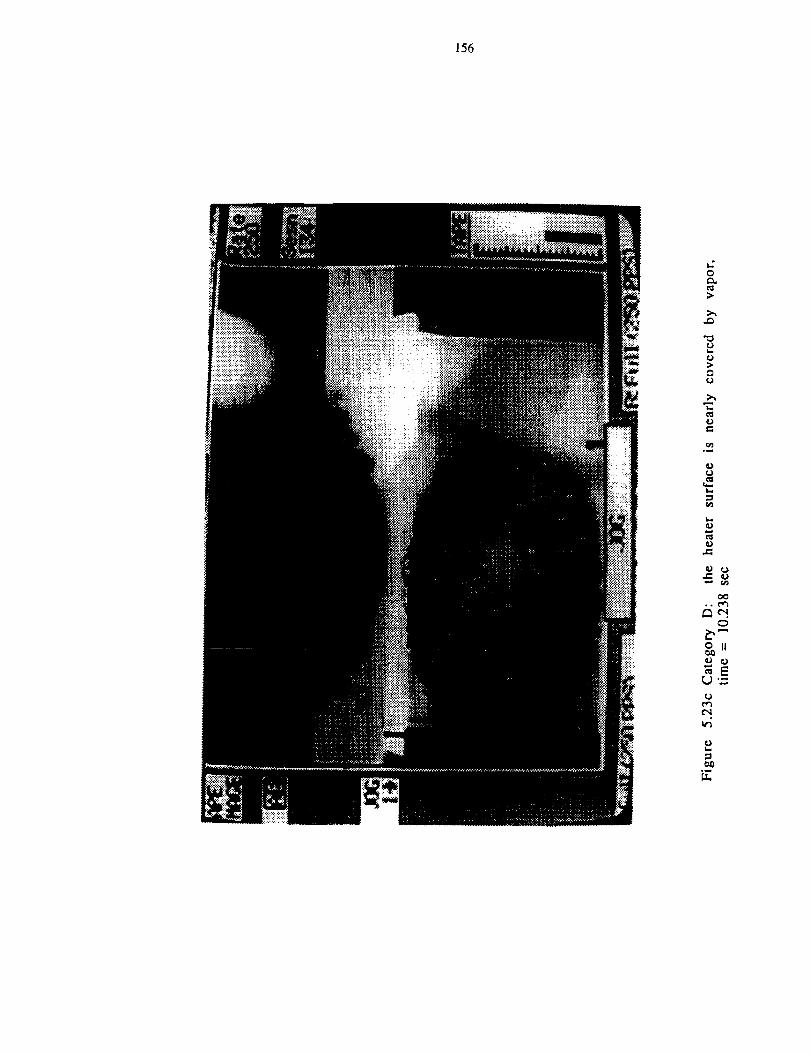
156
o
>,
t-,
U1>
0
U
Ue_
°_
eJ
t..,
t_.
0 II
C,.,) "_
U¢,_
t"q
e_t_
o_
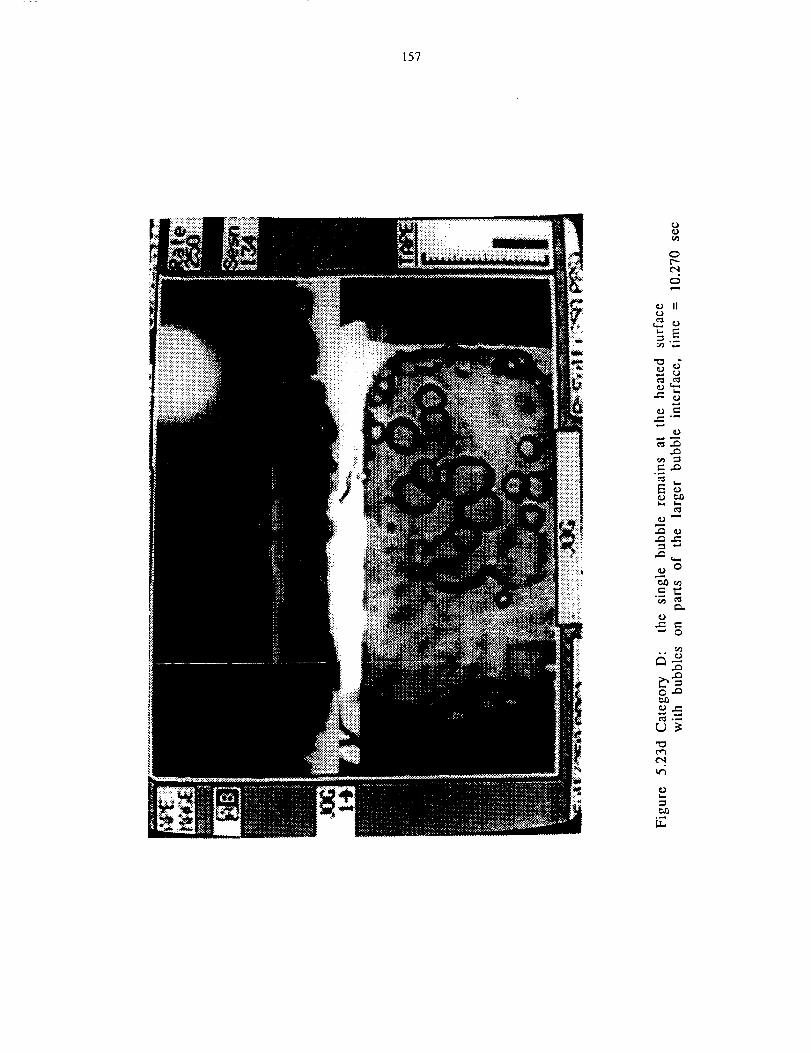
157
t"q
°_
o_
0
.._ t..-."" 0
,.Q
°_
t"q
e,O
b2
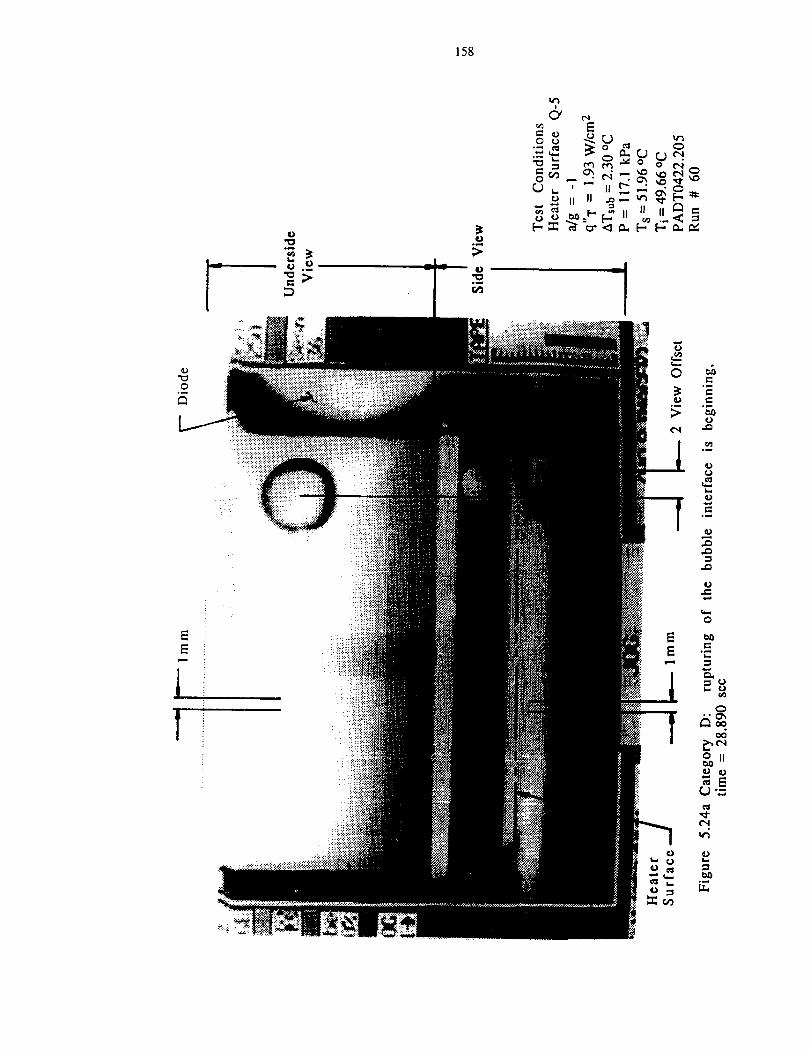
0
158
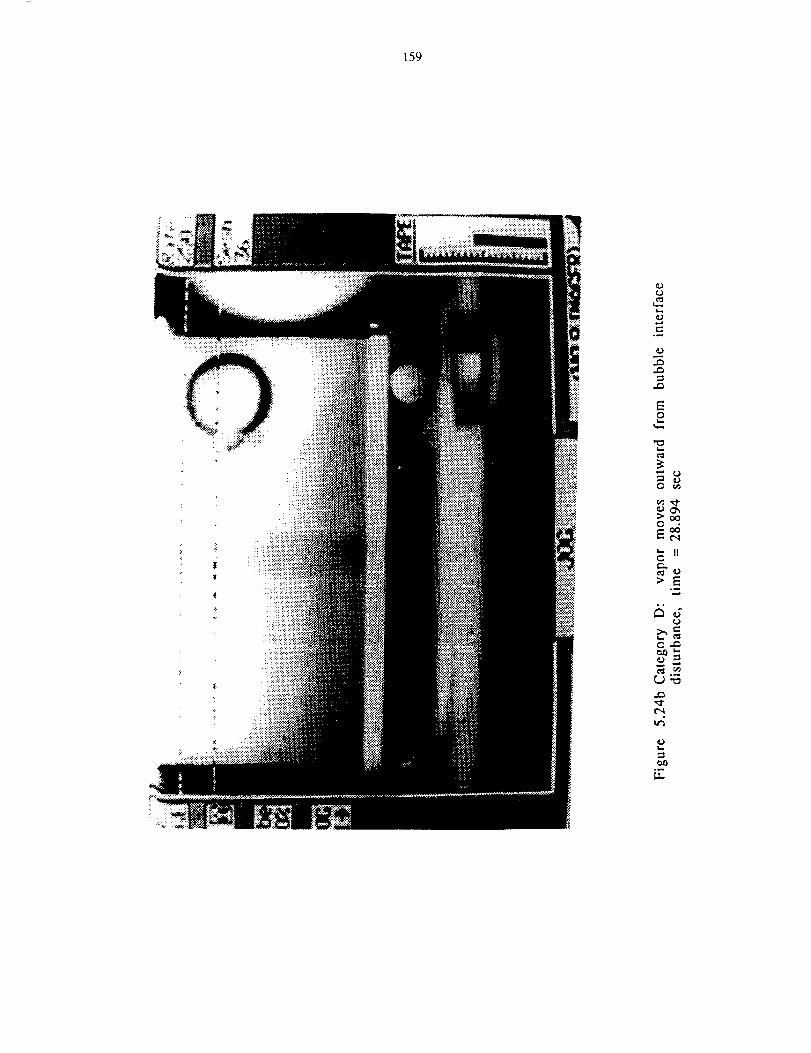
159
• i!
t.-.
,.Q
E
0E_H
0
°_
t'q
t_
°_t/..
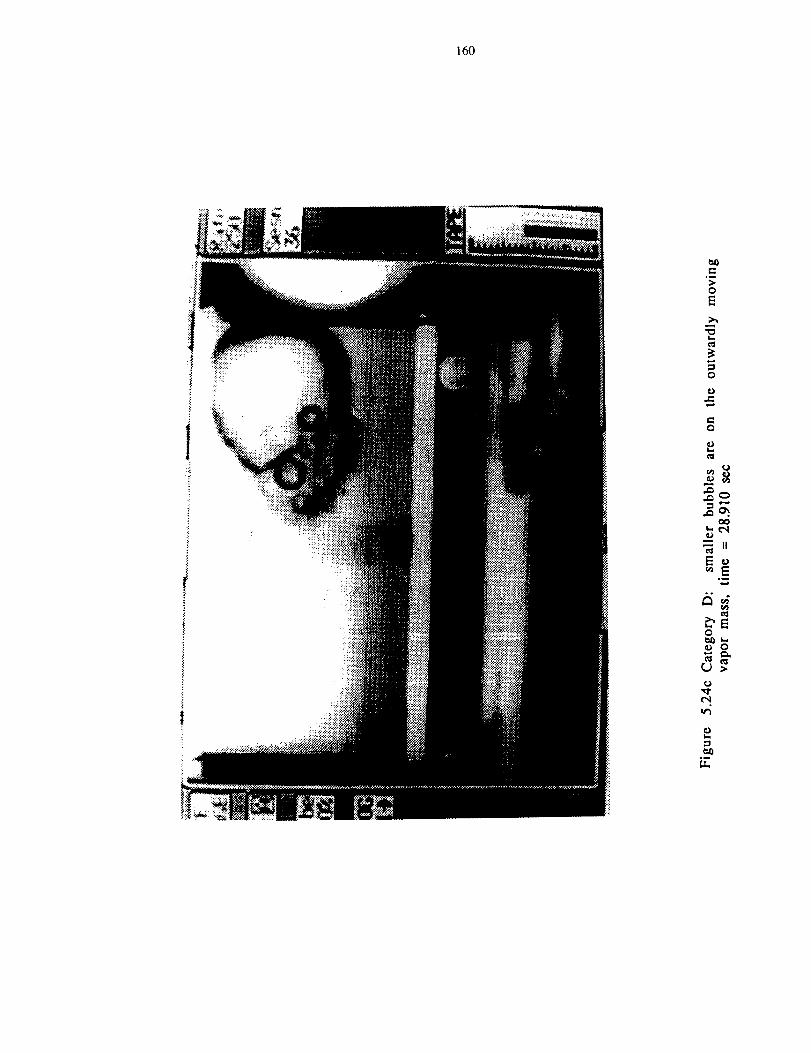
160
>0
E
0
0
0
,,0
_ I|
r,_
0
L--
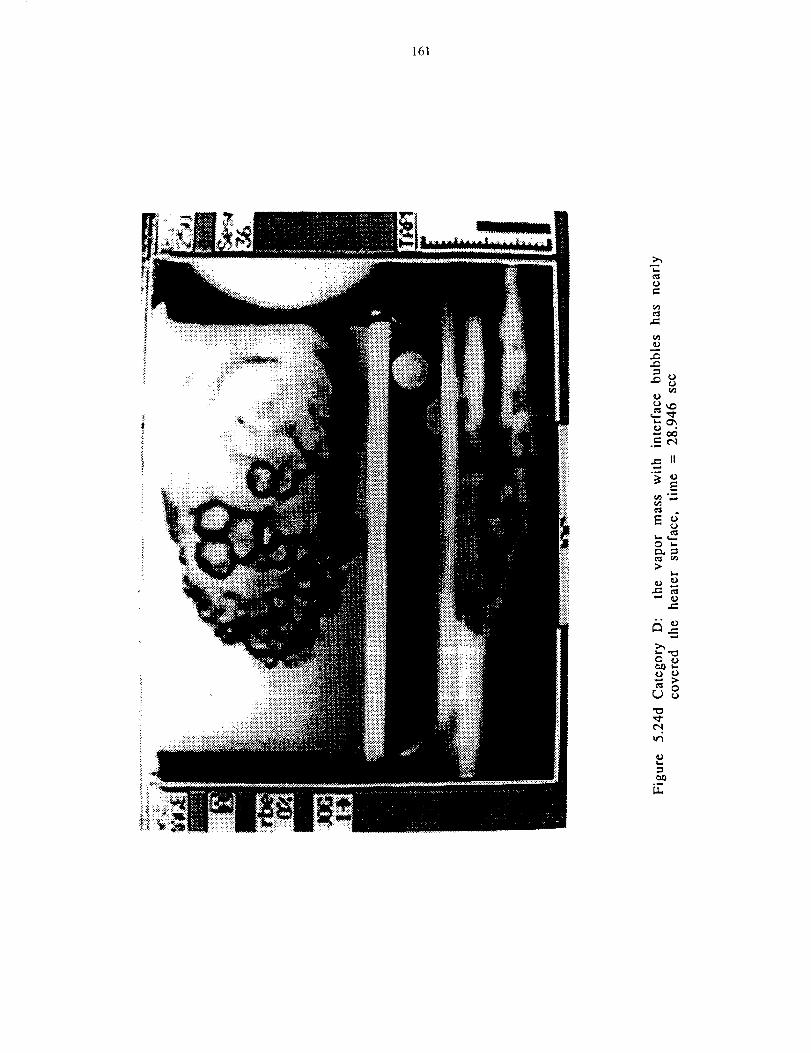
161
0
t_
_od._ c_
.m IJ°_
°_
E_
..t::: ¢_
0
0 0
_e"0
N

162
Thermal Boundary LayerThermocouple AboveHeater Surface
Sid_ View
Underside
View
lmm
Both Views
Test Conditions
Heater Surface Q-5
a/g = 10-5 Ts = 47.22 oC
q"T = 5.4 W/cm 2 Ti = 46.83 °C
ATsub = 0.39 °C PBMT1101.600
P = 100.53 kPa Run # M-17-12
Figure 5.25a Category E: incipient boiling in the presence of the conductionthermal boundary layer, time = 1.130 see
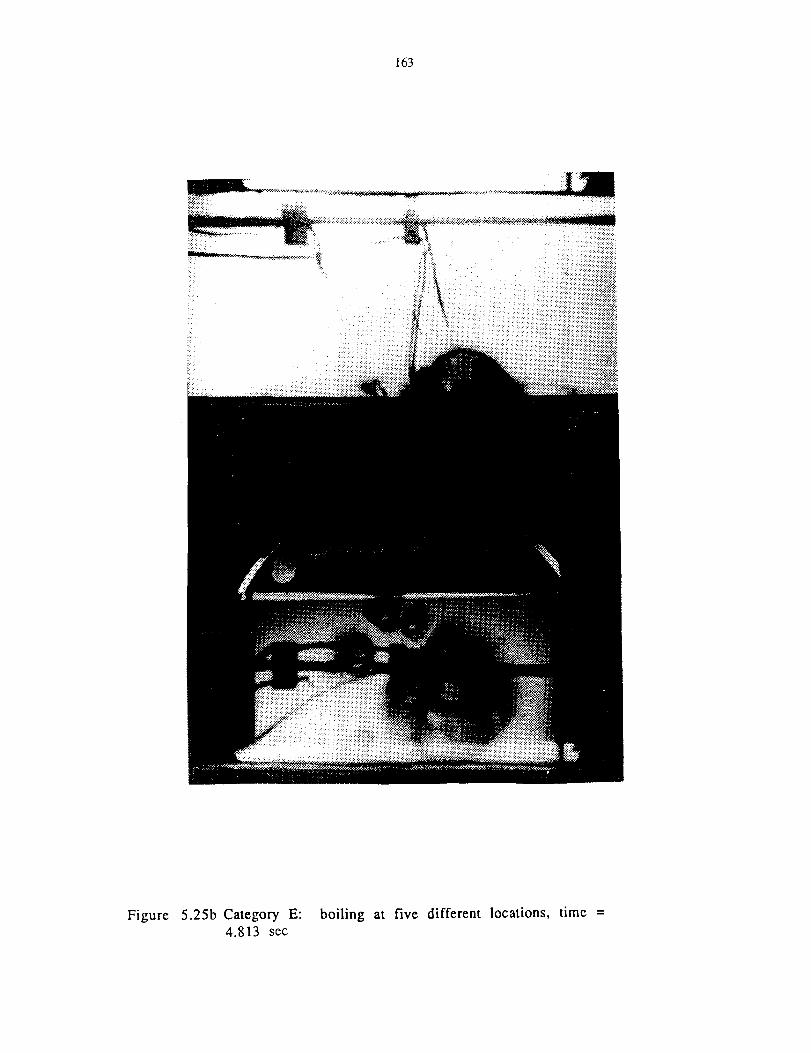
163
i-
Figure 5.25b Category E: boiling at five different locations, time =4.813 sec
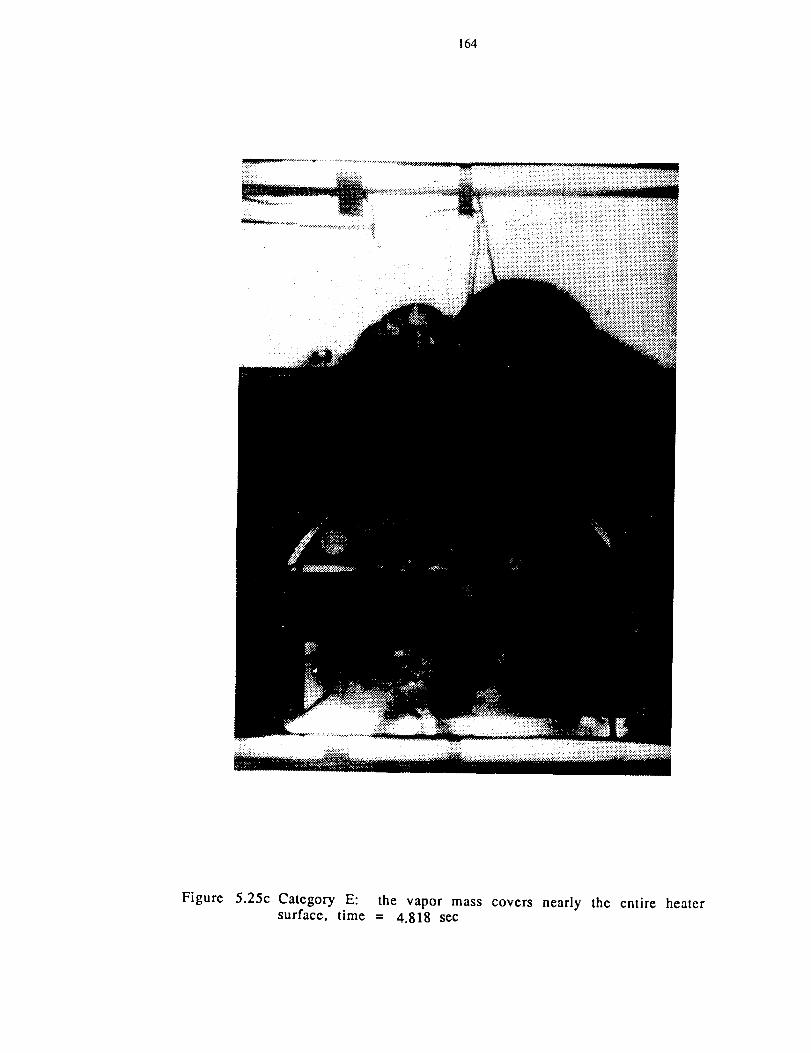
164
Figure 5.25c Category E: the vapor masscovers nearly the entire heatersurface, time = 4.818 sec
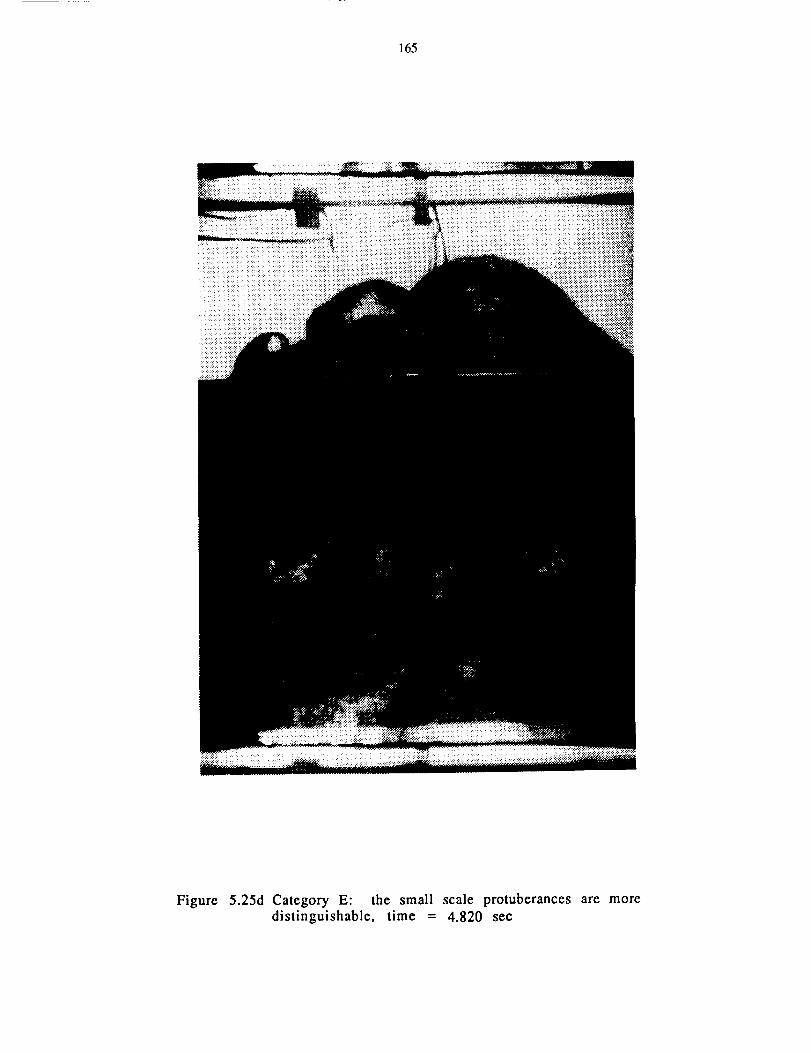
165
Figure 5.25d Category E: the small scale protuberances are moredistinguishable, time = 4.820 sec
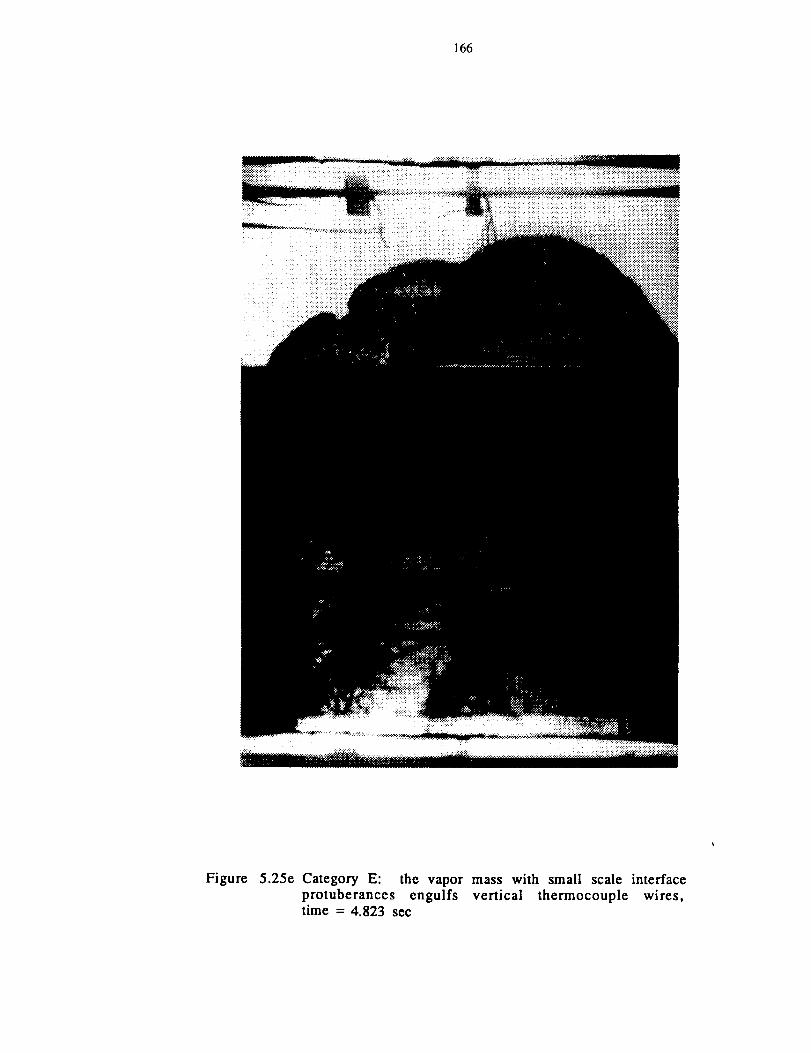
166
Figure 5.25e Category E: the vapor mass with small scale interfaceprotuberances engulfs vertical thermocouple wires,time = 4.823 see
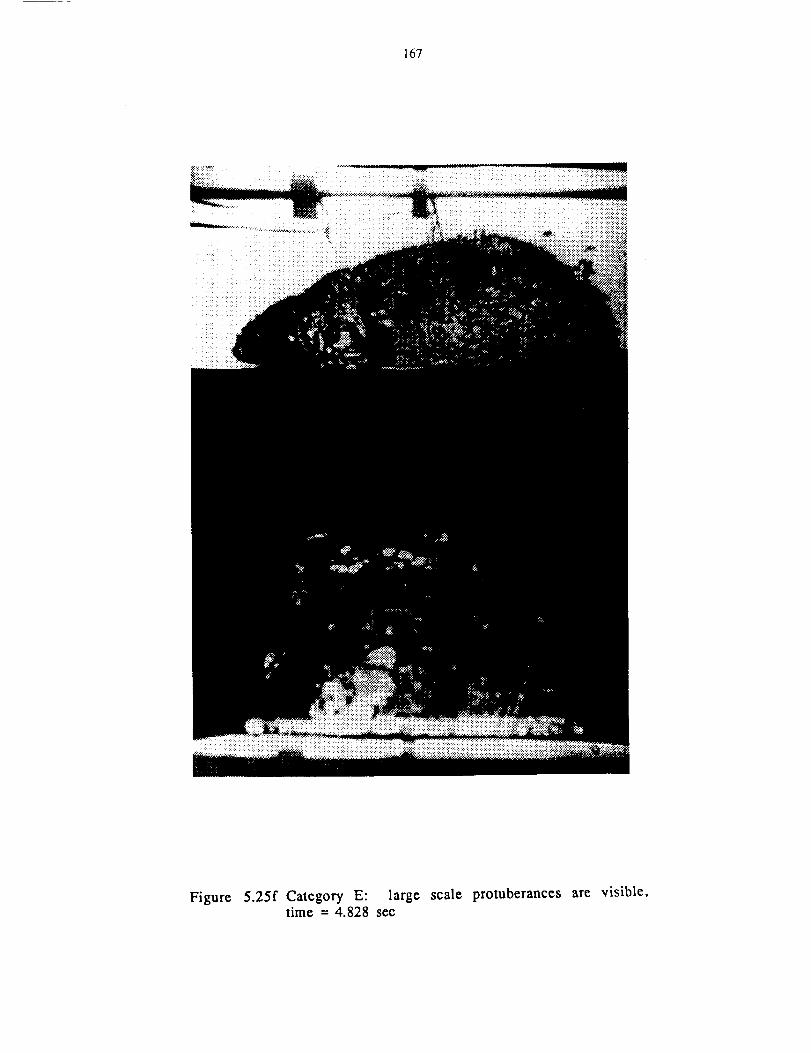
167
Figure 5.25f Category E: large scale protuberancesare visible,time = 4.828see
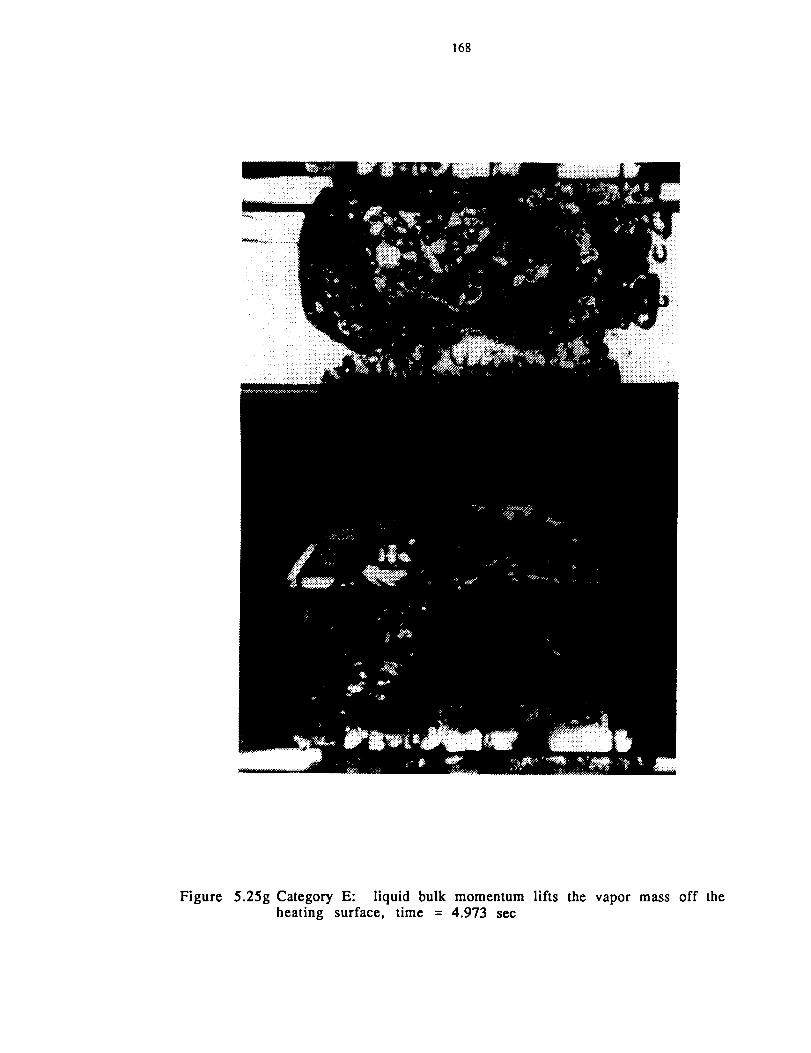
168
Figure 5.25g Category E: liquid bulk momentum lifts the vapor mass off the
heating surface, time = 4.973 sec
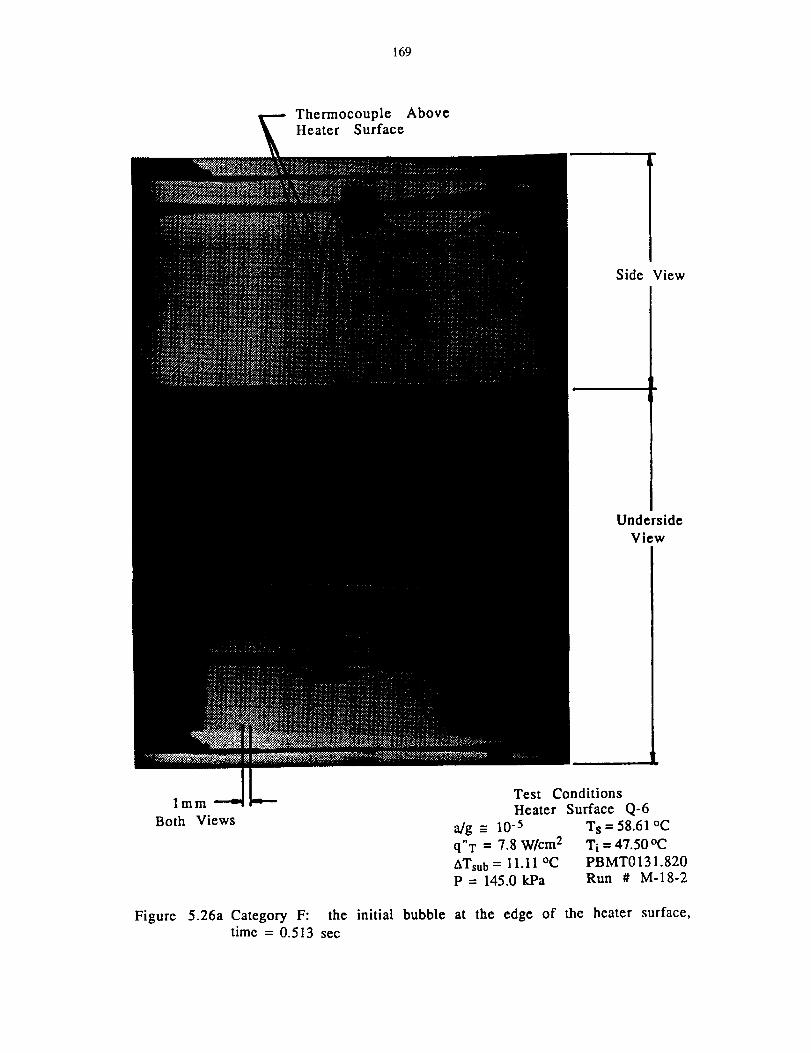
169
Thermocouple AboveHeater Surface
Side View
Underside
View
lmm
Both Views
Test ConditionsHeater Surface Q-6
a/g = 10 -5 Ts = 58.61 °C
q"T = 7.8 W/cm 2 Ti = 47.50 °C
ATsub = 11.11 °C PBMT0131.820P= 145.0kPa Run # M-18-2
Figure 5.26a Category F: the initial bubble at the edge of the heater surface,time = 0.513 sec
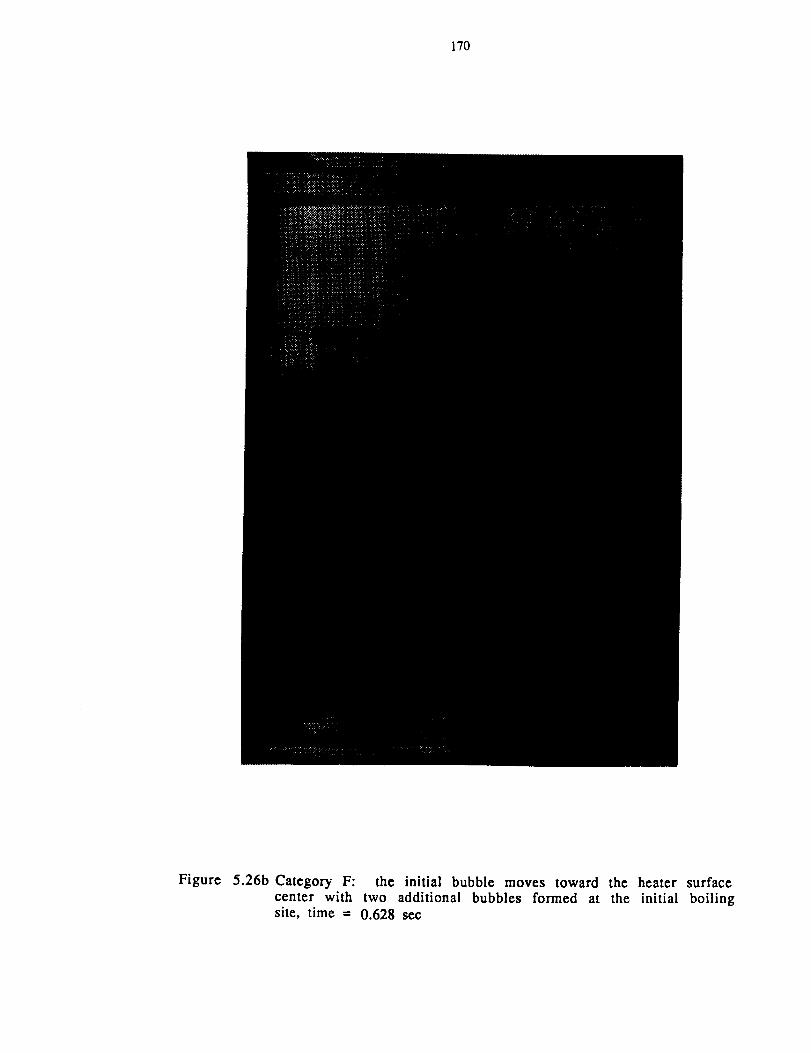
170
Figure 5.26b Category F: the initial bubble moves toward the heater surface
center with two additional bubbles formed at the initial boilingsite, time = 0.628 see
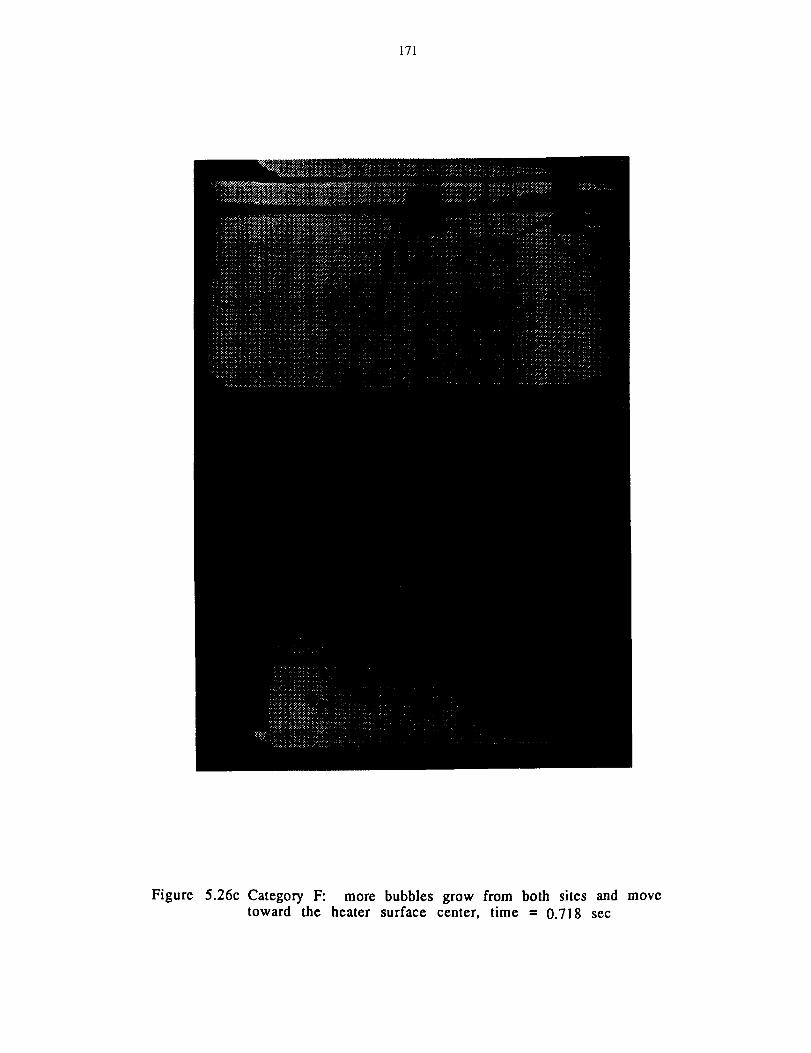
171
Figure 5.26c CategoryF: more bubbles grow from both sites and movetoward the heater surface center, time = 0.718 sec
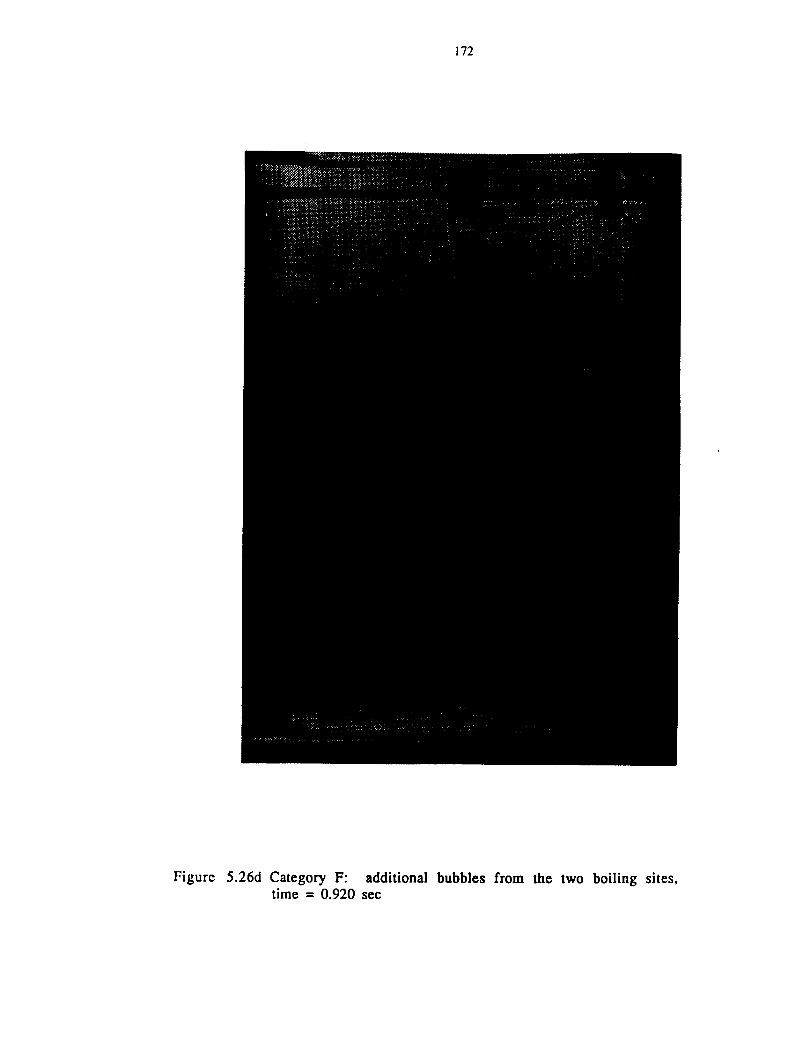
172
Figure 5.26d CategoryF: additional bubblesfrom the two boiling sites.time = 0.920see
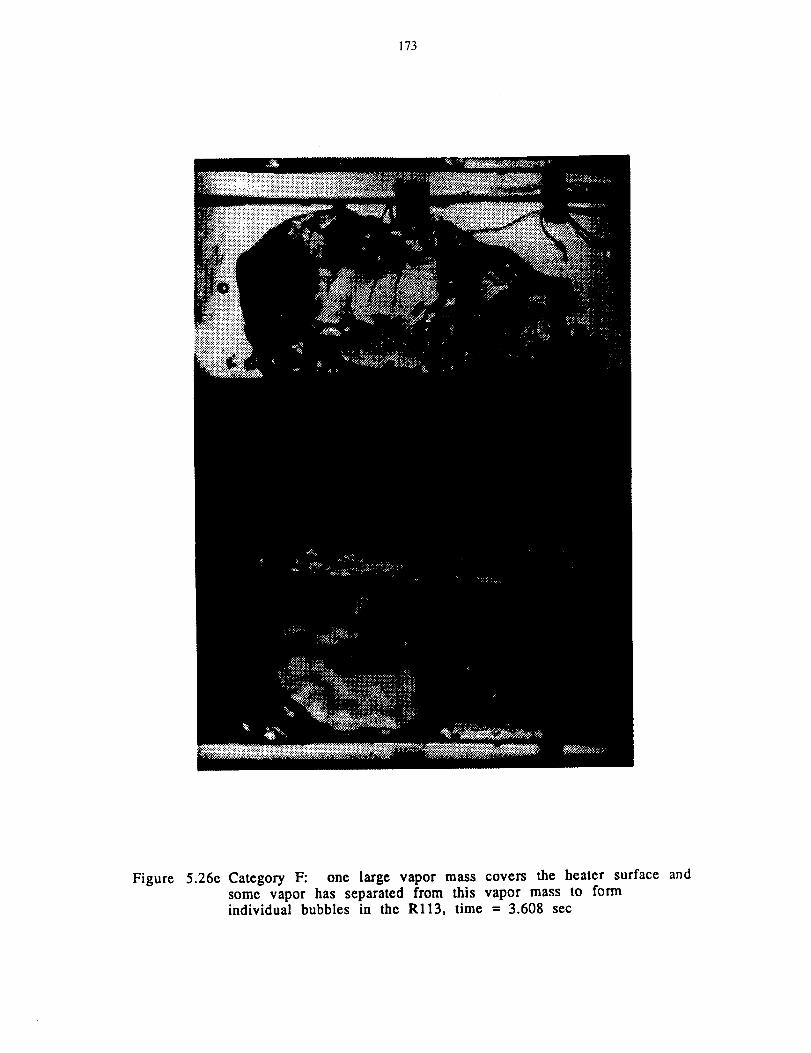
173
Figure 5.26e Category F: one large vapor mass covers the heater surface andsome vapor has separated from this vapor mass to formindividual bubbles in the Rl13, time = 3.608 sec
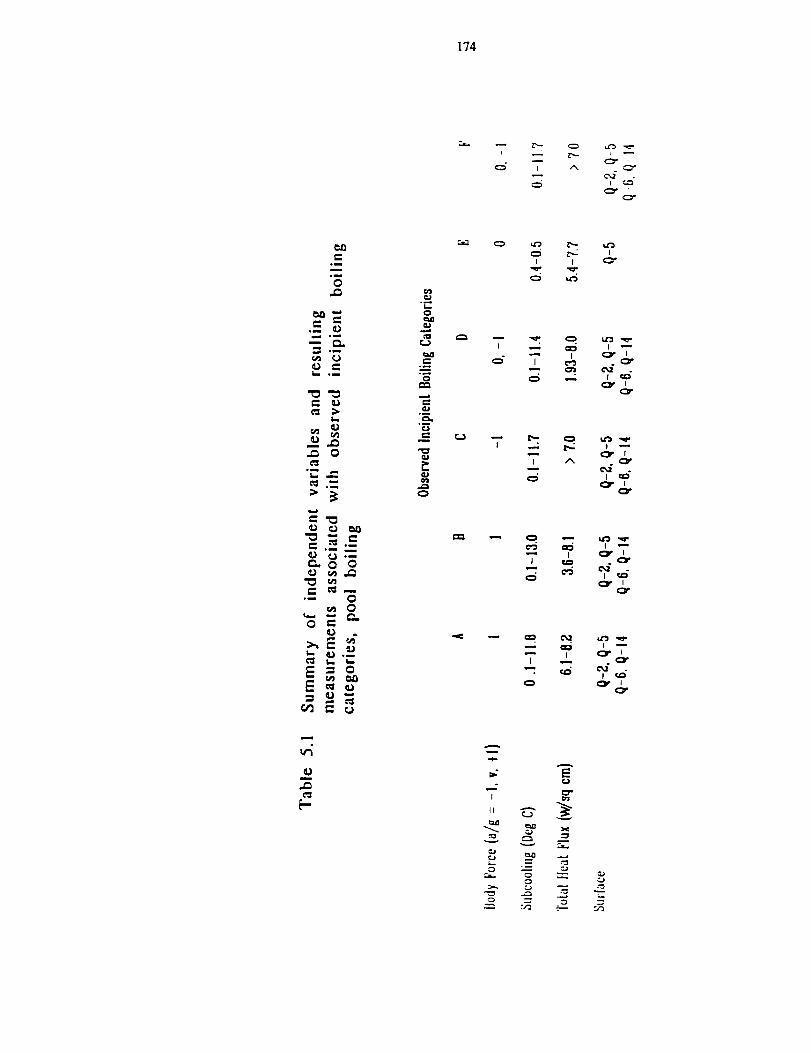
174
m
IE"...-
I
_0
t,.,-°_!
o
°_
i.... *m
t...
m
t... _ °_
L_O
t_
°_°_
O
-..d
°_
Q_
I
o"
I
I
I
"7
c_
O
"7"
I
w_
I
m
Q
A
I
I ,--,
I
ca"
"7.
m
-7A
._=
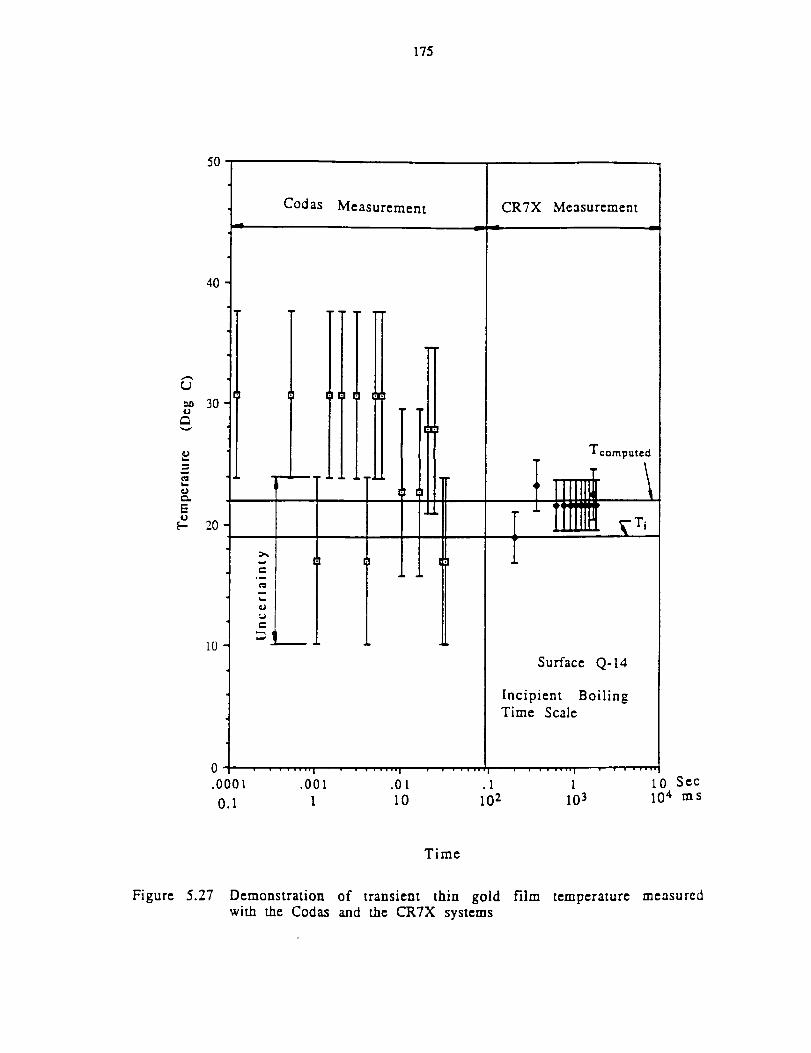
175
5O
40
30O
ow
O
en
EU
20
10
Codas Measurement
w
t_
O
C
13 13ral
i
i
I
!
I[
.I.L
CR7X Measurement
Tcomputed
Surface Q-14
Incipient BoilingTime Scale
..... "1 ' " '''"1 ' ' " "'"l ' ' "'''"
.0001 .001 .01 1 10 Sec
0.1 1 10 103 104 ms
Time
Figure 5.27 Demonstration of transient thin gold film temperature measuredwith the Codas and the CR7X systems
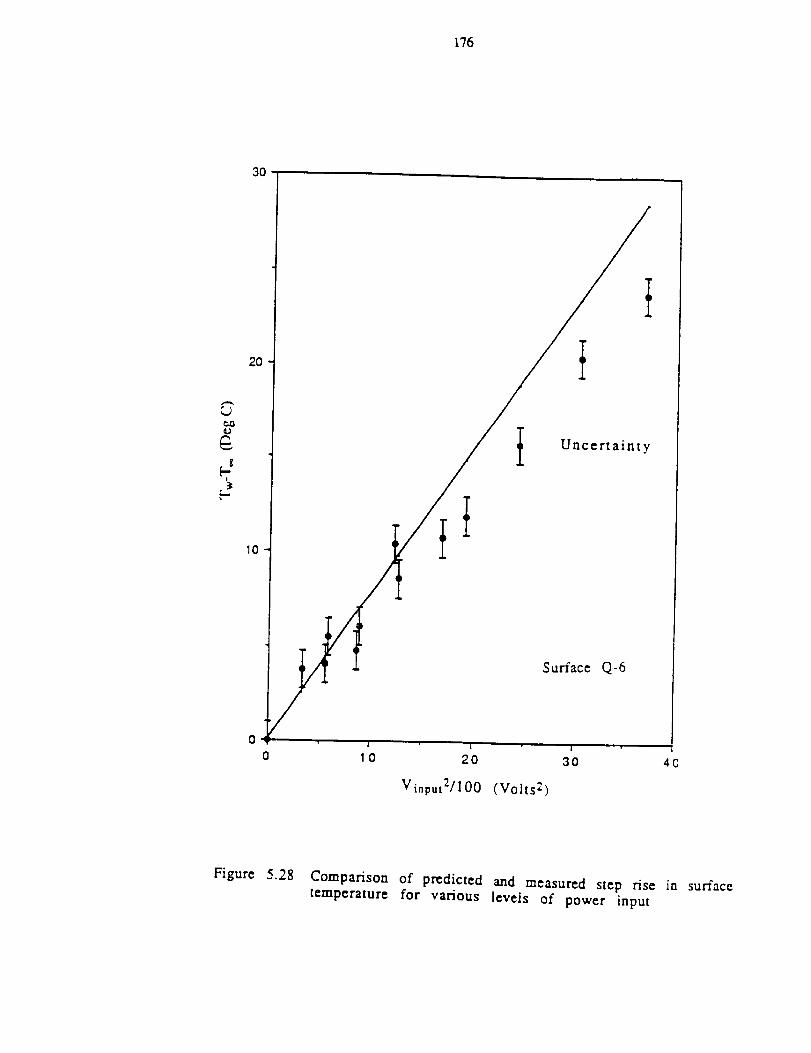
176
4
2O
I0
Uncertainty
Surface Q-6
0 10 2O
Vinput2/100 (Volts 2)
30 40
Figure 5.28 Comparison of predicted and measured step rise in surface
temperature for various levels of power input

177
20
15
." I0I.B
._
[...
Surface Q-14
Ti = 49.2 °C
Subcooling (Deg C)
o 0
• 2.3
x I1
* Minimum imposed surface superheatat which incipient boiling occurs fora given subcooling
41. *
X • • ._ X
0 0 • • 0 X
| I 1 [ I I
0 2 4 6 8 10 12 14
,ST*sup (Deg C)
Figure 5.29 Measured incipient boiling delay times with step change insurface temperature

178
lO0
10
1
&O
41,*
L;
,el
I
F
.01
.001
50
Surface Q-14
q"T = constant
O
l:]
m •
I:]
Tw = constant
1O
• X X
eo x x
| &
60 70
Ti = 4.9 Deg C
80 120
Subcooling (Deg C)
o O, Constant Temperature
• 2.3, Constant Temperature
x 11.0, Constant Temperature
• 0, Constant Heat Flux
• 2.3, Constant Heat Flux
m I1.2. Constant Heat'Flux
90 100 110
Surface Temperature (Deg C)
Figure 5.30 Measured incipient boiling delay times and the corresponciingsurface temperature at boiling inception
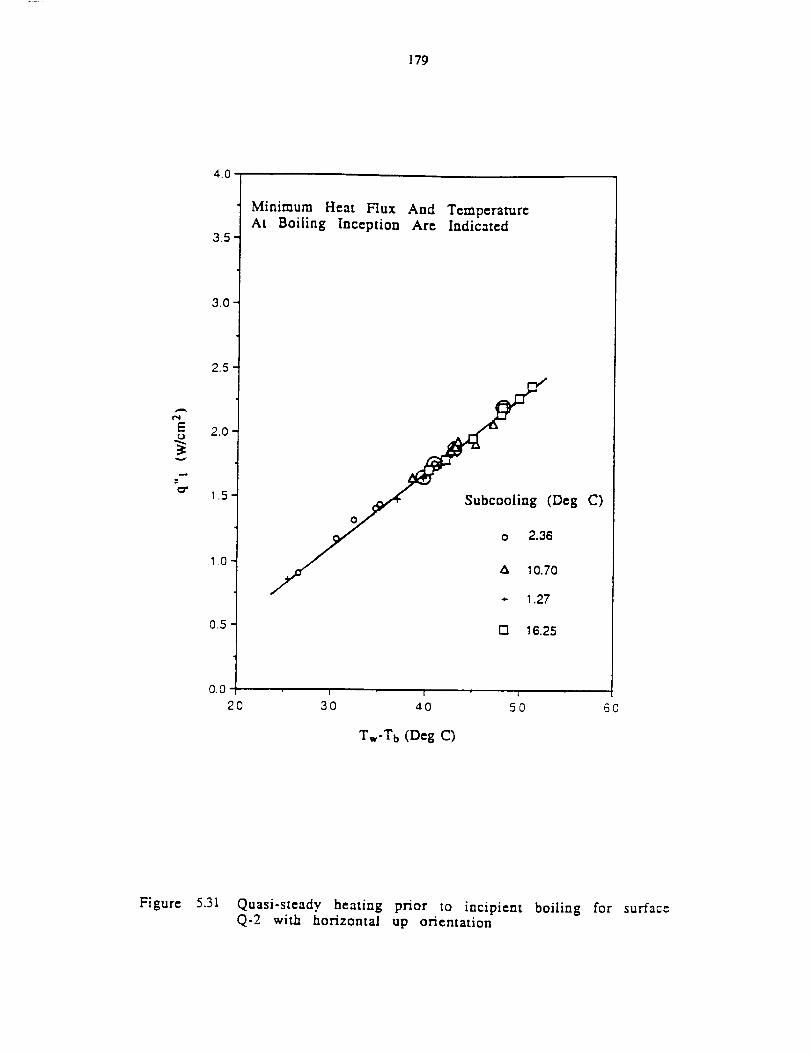
179
40
3.5
3.0
2.5
E 2.0
1.5
1.0
0.5
Minimum Heat Flux And TemperatureAt Boiling Inception Are Indicated
Subcooling (Deg C)
o 2.36
& 10.70
+ 1.27
[] 16.25
0.0 I I 1
20 3O 4O 5O
Tw-Tb (Deg C)
_o
Figure 5.31 Quasi-steady heating prior to incipient boiling for surfaceQ-2 with horizontal up orientation
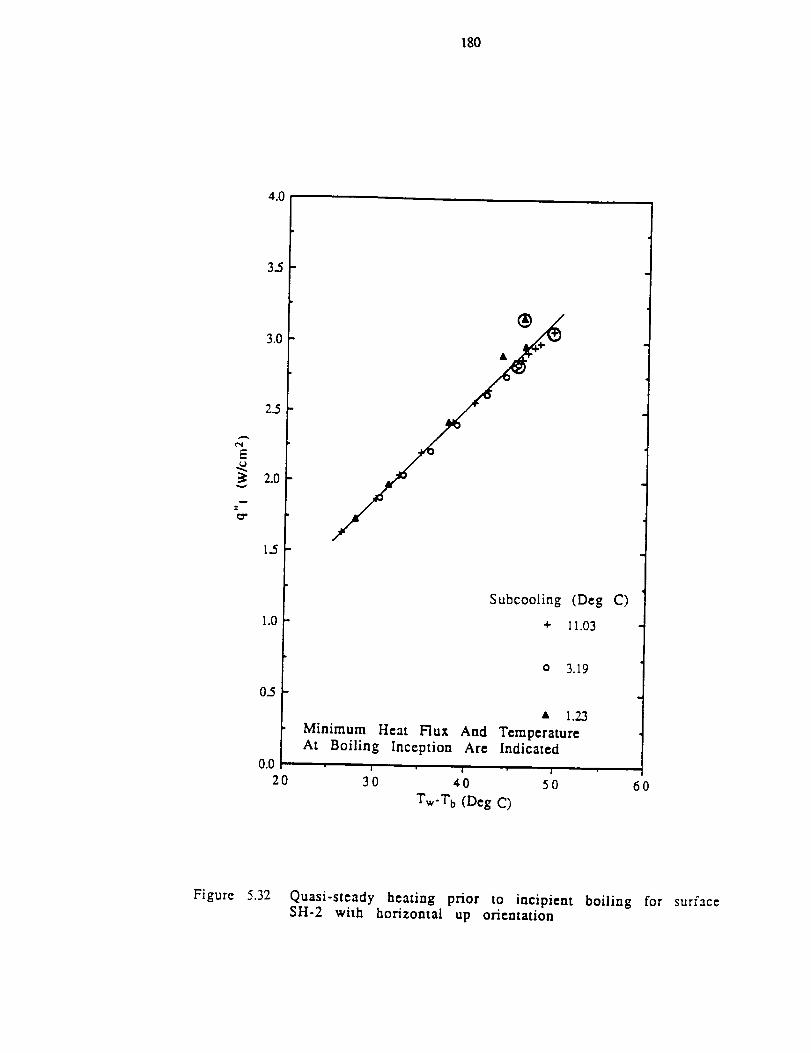
180
3.5
Subcooling (Deg C)
+ I1.03
0.02O
o 3.19
• 1.23
Minimum Heat Flux And TemperatureAt Boiling Inception Are Indicated
30 40 50
Tw'Tb (Deg C)
60
Figure 5.32 Quasi-steady heating prior to incipient boiling for surfaceSH-2 with horizontal up orientation
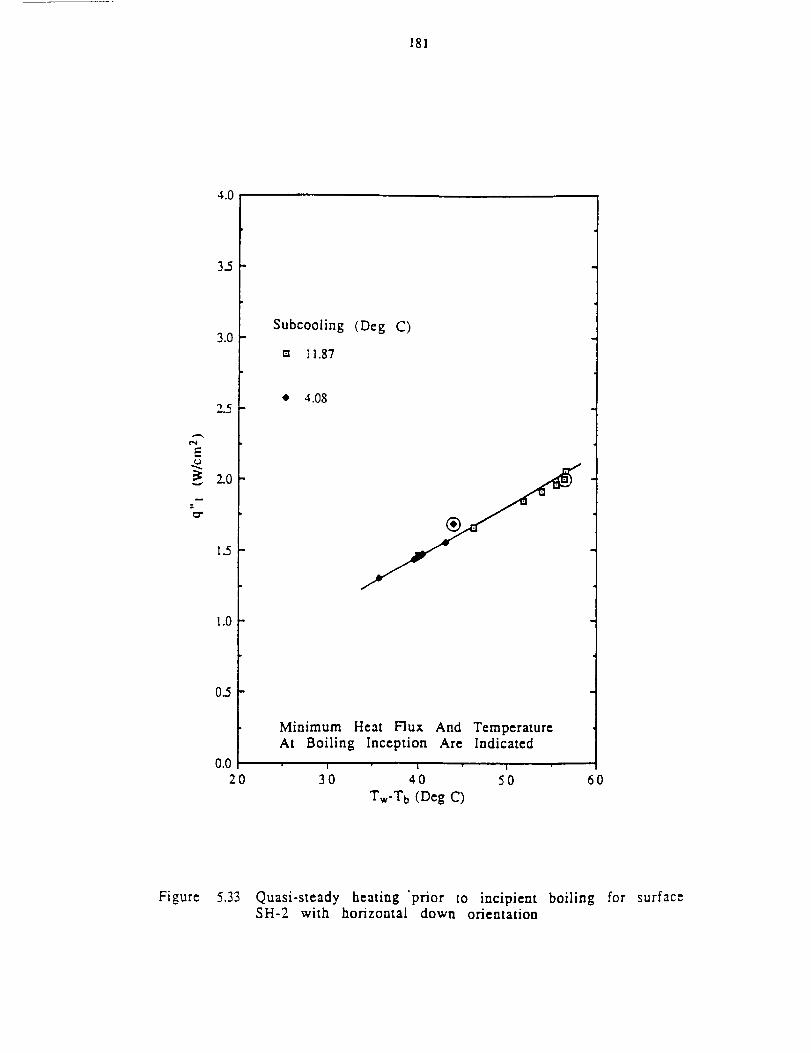
181
4.0
3.5
3.0
2.5
_: 2.0
m
I..5
1.0
0.5
Subcooling (Deg C)
= 11.87
• 4.08
Minimum Heat Flux And TemperatureAt Boiling Inception Are Indicated
0.0 J L i20 30 40 50 60
Tw-Tb (Deg C)
Figure 5.33 Quasi-steady heating 'prior to incipient boiling for surfaceSH-2 with horizontal down orientation

182
Z
50
40
3o
2O
Nu = 0.505 Ra 0"396
Merte and Clark (1961) _ •
++÷ /
A_Xo_ _ NU = 0.15 Ra I/3
Equation 4.7
Surface. ATsub a/g(Deg C)
SH-2 I 1 - l
÷ SH-2 11 +1
• SH'2 3 + 1
o SH-2 1 +1
x Q-2 2 +1
ta Q-2 10 +1
• Q-2 16 +1
A Q-2 1 +1
• SH-2 4 - 1
o
@@ II
10 l J
0.0 1.0 2.0
• I mi
3.0
Ra (* 107 )
Figure 5.34 Natural convection heat transfer results
183
CHAPTER 6
DISCUSSION AND CONCLUSIONS
In Chapter 5, measured transient surface temperatures were presented for two
different basic thermal disturbances at the heat transfer surface: a step increase in
imposed heat flux and a step increase in imposed temperature. In the absence of
convection, these permit the computation of the temperature distribution within the
liquid, using well-known mathematical techniques. The influence of the liquid
temperature distribution at the onset of boiling on the resulting phase change dynamics
will be demonstrated, using the calculated liquid temperature distribution, together
with the measured heater surface temperature, both at the moment of incipient boiling,
to explain the type of subsequent boiling propagation observed, especially the
explosive type of boiling propagation occurring at the low heat flux levels.
Additionally, an examination of previous concepts concerning an empirical
heterogeneous nucleation factor will be presented. In conclusion, the underlying
concepts of the present work will be summarized.
6.1 Computed Superheat Temperature Distributions at Boiling
Inception: Imposed qv"
Figures 6.1 through 6.6 present the computed liquid superheat temperature
distributions at the moment of incipient boiling together with the measured heater
surface superheat temperatures in microgravity conditions obtained with the drop
tower tests. The coincidence between the measured and computed heater surface

184
superheattemperaturesconf'Lrrnsthe accuracy of the calculated liquid superheat
temperaturedistributions. The superheattemperaturedistributions,using theknown
totalpowerflux input to thegold film, werecalculatedwith theonedimensionalsemi-
infinite mediasolution. For the caseof a known imposedheatflux to the liquid, the
expressionfor the transient one dimensionaltemperaturerise is obtained by the
Laplacetransformsolutionof equation2.19as:
2q"_ - x2 q"l X
(6.1)
The initial test conditions, which were nearly identical for tests with two different
surfaces, Q-5 and Q-6, are included in the figures in order to demonstrate how the
results obtained may differ with different test surfaces. The tests were conducted at
two or three levels of heat flux with three nominal subcooling levels, obtained by
increasing the system pressure above the saturation pressure corresponding to the
initial liquid temperature.
For a given figure, the largest calculated superheated thermal boundary layer
thickness at incipient boiling, 8", is denoted for illustrative purposes in addition to the
computed liquid temperature distributions at the time of boiling inception. _ the total
thermal boundary layer, or more simply the thermal boundary layer, is defined as a
layer of liquid near the heating surface in which there is a significant increase in the
liquid temperature above that far from the heating surface, with the liquid far from the
heating surface remaining at the initial temperature. 8 is always > 5*. The
superheated thermal boundary layer is the layer of liquid near the heater surface where
the liquid temperature is greater than the saturation temperature corresponding to the

185
systempressure. Both the thermal boundary layer and the superheatedthermal
boundarylayerareshownfor illustrativepurposesin Figure6.7.
Figures6.1 and 6.2 are for the Rl13 initially near saturationconditionsfor
surfacesQ-5 andQ-6, respectively. It may benotedthat in both testsPBMT1012.800
in Figure 6.1with a qT"of 7.4 W/cm2,andPBMT0125.800in Figure6.2with aqT" of
7.6 W/cm1, which were conducted at the high heat flux levels, the lowest superheat
distributions existed at incipient boiling. The superheated thermal boundary layer is
the region within the liquid adjacent to the heater surface where the liquid temperature
is above the saturation temperature corresponding to the initial, constant liquid
pressure level, and it can be observed from these two figures that the high heat flux
levels have the smallest superheated thermal boundary layers. The boiling spread
associated with these two tests was the "slow growth," category F type described
earlier in Chapter 5. Tests PBMT1025.800, PBMT1026.600, PBMT1102.800 with
qT" of 7.5, 5.7, 7.7, W/cm z respectively, in Figure 6.1 and Test PBMT0207.600 with a
qT" of 6.3 W/cm 2 in Figure 6.2 had the next larger liquid superheat distributions and
the next larger superheated thermal boundary layers. These tests were characterized
by the rapid unstable boiling spread pictured in Section 5.1.1.6, corresponding to
category D. Test PBMTll01.600 in Figure 6.1 with surface Q-5, was the most
violent of all of the microgravity tests and was referred to as violent or explosive
boiling propagation, category E, in Section 5.1.1.6.
surface superheat temperature at incipient boiling
PBMT1025.800 and PBMTll02.800, but with a
This test resulted in a heater
nearly equal to that of tests
liquid superheat distribution
considerably above these two tests and with the largest superheated thermal boundary
layer of all of the microgravity tests.
Figures 6.3 and 6.4 show the corresponding results using surfaces Q-5 and Q-6
in RI13, with a subcooling of approximately 2.8 °C. In Figure 6.3, tests
PBMT0914.805 and PBMT1013.805 had qT" of 7.8 and 7.2 W/cm 2 and in Figure 6.4,

186
both tests PBMT0201.805 and PBMT0223.805 had qa'" of 7.7 W/cm z . These four
experiments show the lowest superheat temperature distributions and the smallest
superheated thermal boundary layers at the onset of boiling, and the subsequent
boiling spread associated with these was of the "slow growth," category F type. On
the other hand, the remainder of the tests in Figures 6.3 and 6.4 have large heater
surface superheats and large superheated thermal boundary layers, and are
representative of the rapid unstable type of boiling spread, category D.
Figures 6.5 and 6.6 show the calculated liquid superheat temperature
distributions and the measured heater surface temperatures at the onset of boiling for
the microgravity pool boiling tests with the highest nominal subcooling of 11.1 °C, for
surfaces Q-5 and Q-6, respectively. PBMT0919.820 of Figure 6.5 with a qr" of 7.9
W/cm 2 and of Figure 6.6 with a qT" of 7.8 W/cm 2 show the lowest superheat
temperature distributions and the smallest superheated thermal boundary layers present
in these two figures, and correspondingly had the "slow growth," category F boiling
spread discussed earlier in Section 5.1.1.6. The remainder of the tests in Figure 6.5
demonstrate category D boiling spread. In Figures 6.1 through 6.6 for a given
subcooling, 8* associated with boiling propagation categories D and E are always
larger than the 5* corresponding to category F.
6.2 Computed Superheat Temperature Distributions at Boiling
Inception: Imposed T w
Figures 6.8 through 6.10 present the computed liquid superheat temperature
distributions and the measured heater surface superheat temperatures at the onset of
boiling for tests in the laboratory pool boiling vessel in the inverted position (a/g = -1)
only, in order to minimize convection effects and thus permit comparisons later with
the constant heat flux microgravity tests. Taking the Laplace transform of equation
187
2.19 with a known imposed constant surface temperature up to the moment of boiling
inception, the transient liquid temperature distribution can be computed according to:
T(x,t)-Tw
T.-Ti w
(6.2)
The tests conducted used three nominal subcooling levels, obtained by setting the
system pressure to the appropriate level above the saturation pressure corresponding to
the initial liquid temperature. The tests were all conducted with surface Q-14, and the
specific conditions of the tests are given in the figures. The type of boiling spread
observed in all of these experiments was always the single bubble pancake type,
category C, previously described in Section 5.1.1.6. q"T max of these figures is the
initial step in heat flux which is imposed for 400 microseconds until the heater surface
temperature is at the desired level, at which point q"T decreases.
Figure 6.8 presents calculated superheat temperature distributions for imposed
heater surface superheat temperatures of 4, 4, and 5 °C. The R113 was initially near
saturation conditions with a T s of 48.9 °C, corresponding to the liquid pressure of
these tests. A ATw, of 4 °C was the minimum level for which incipient boiling would
occur. This minimum surface superheat for incipient boiling was repeatable within 1
°C for the experiments shown here and in Figures 6.9 and 6.10. The _5" was 0.11 mm
for experiment T107, and was the largest 5" of the tests in Figure 6.8. For all of the
tests presented in Figure 6.8, the initial boiling always occurred at the same location,
as observed in the high speed video pictures.
Figure 6.9 presents calculated temperature distributions for imposed step
increases in heater surface superheat temperatures of 3, 4, 6, and 9 °C. The test liquid
was initially subcooled 2.3 °C at a nominal initial temperature of 49.1 °C. 3 °C was
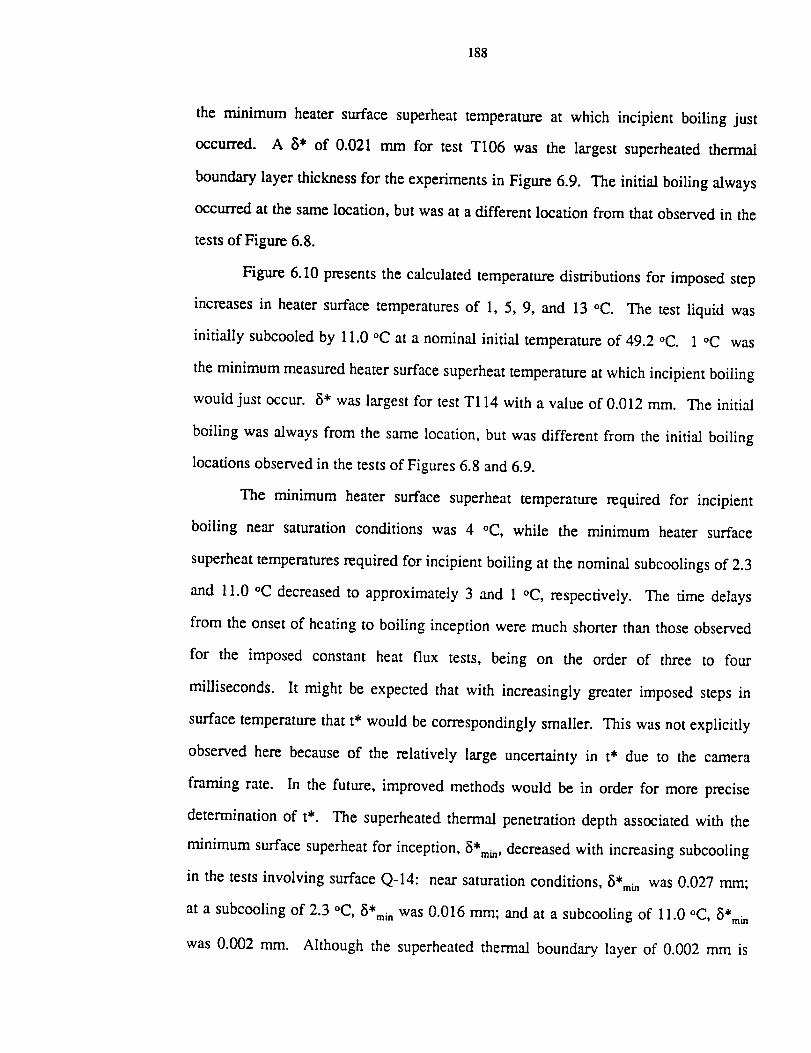
188
the minimum heater surface superheat temperature at which incipient boiling just
occurred. A 5" of 0.021 mm for test T106 was the largest superheated thermal
boundary layer thickness for the experiments in Figure 6.9. The initial boiling always
occurred at the same location, but was at a different location from that observed in the
tests of Figure 6.8.
Figure 6.10 presents the calculated temperature distributions for imposed step
increases in heater surface temperatures of 1, 5, 9, and 13 °C. The test liquid was
initially subcooled by 11.0 °C at a nominal initial temperature of 49.2 °C. 1 °C was
the minimum measured heater surface superheat temperature at which incipient boiling
would just occur. 5" was largest for test T114 with a value of 0.012 mm. The initial
boiling was always from the same location, but was different from the initial boiling
locations observed in the tests of Figures 6.8 and 6.9.
The minimum heater surface superheat temperature required for incipient
boiling near saturation conditions was 4 °C, while the minimum heater surface
superheat temperatures required for incipient boiling at the nominal subcoolings of 2.3
and 11.0 °C decreased to approximately 3 and 1 °C, respectively. The time delays
from the onset of heating to boiling inception were much shorter than those observed
for the imposed constant heat flux tests, being on the order of three to four
milliseconds. It might be expected that with increasingly greater imposed steps in
surface temperature that t* would be correspondingly smaller. This was not explicitly
observed here because of the relatively large uncertainty in t* due to the camera
framing rate. In the future, improved methods would be in order for more precise
determination of t*. The superheated thermal penetration depth associated with the
minimum surface superheat for inception, _*mi,, decreased with increasing subcooling
in the tests involving surface Q-14: near saturation conditions, 5*,,,t . was 0.027 mm;
at a subcooling of 2.3 °C, _i*mi. was 0.016 mm; and at a subcooling of 11.0 °C, 5*m_
was 0.002 ram. Although the superheated thermal boundary layer of 0.002 mm is
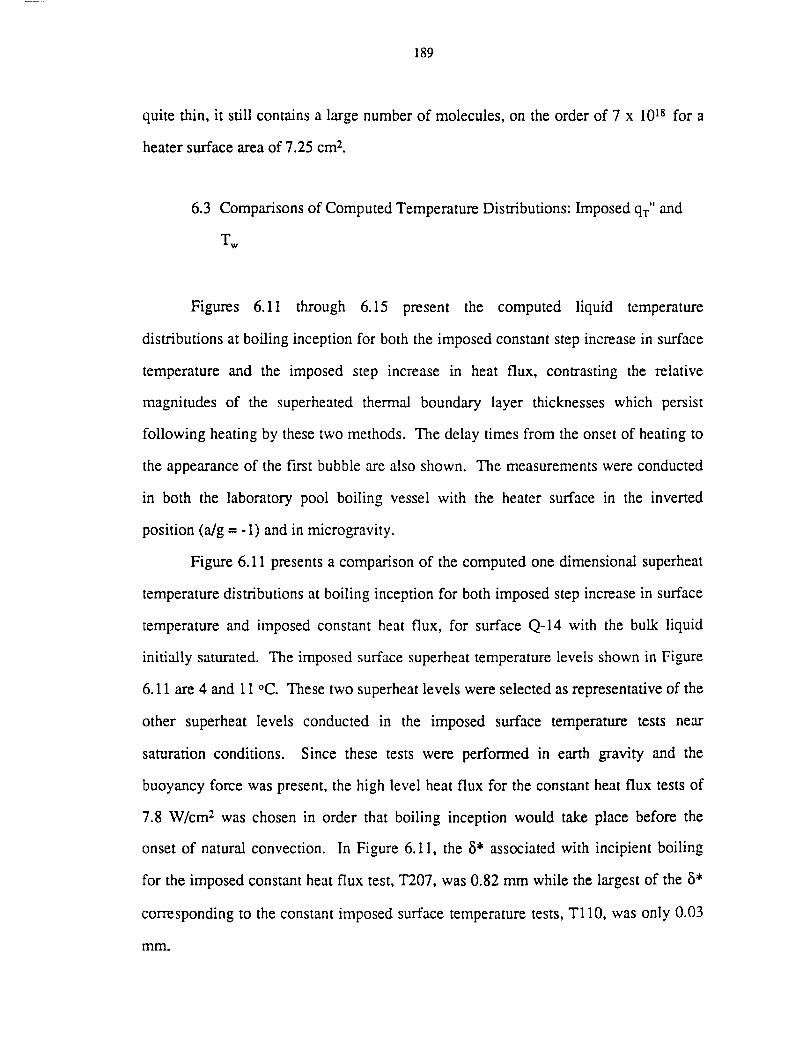
189
quite thin, it still containsa largenumberof molecules,on theorder of 7 x 10¹⁸for a
heatersurfaceareaof 7.25cm2.
6.3 Comparisonsof ComputedTemperatureDistributions:Imposedq'r" and
Tw
Figures 6.11 through 6.15 present the computed liquid temperature
distributionsat boiling inceptionfor both theimposedconstantstepincreasein surface
temperatureand the imposedstep increasein heat flux, contrasting the relative
magnitudesof the superheatedthermal boundary layer thicknesseswhich persist
following heatingby thesetwo methods.Thedelaytimesfrom theonsetof heatingto
the appearanceof thefirst bubblearealsoshown. The measurementswereconducted
in both the laboratory pool boiling vesselwith the heater surfacein the inverted
position (a/g= -1) andin microgravity.
Figure 6.11presentsa comparisonof the computedonedimensionalsuperheat
temperaturedistributionsat boiling inceptionfor bothimposedstepincreasein surface
temperatureand imposedconstantheat flux, for surfaceQ-14 with the bulk liquid
initially saturated.Theimposedsurfacesuperheattemperaturelevelsshownin Figure
6.11are4 and 11°C. Thesetwo superheatlevelswereselectedasrepresentativeof the
other superheatlevels conducted in the imposed surface temperaturetests near
saturationconditions. Since these tests were performedin earth gravity and the
buoyancyforcewaspresent,thehigh level heatflux for theconstantheatflux testsof
7.8 W/cm: was chosenin order that boiling inception would take place before the
onsetof naturalconvection. In Figure 6.11, the 5* associatedwith incipient boiling
for the imposedconstantheatflux test,T207,was0.82mm while the largestof the 5*
correspondingto theconstantimposedsurfacetemperaturetests,T110, wasonly 0.03
mm.
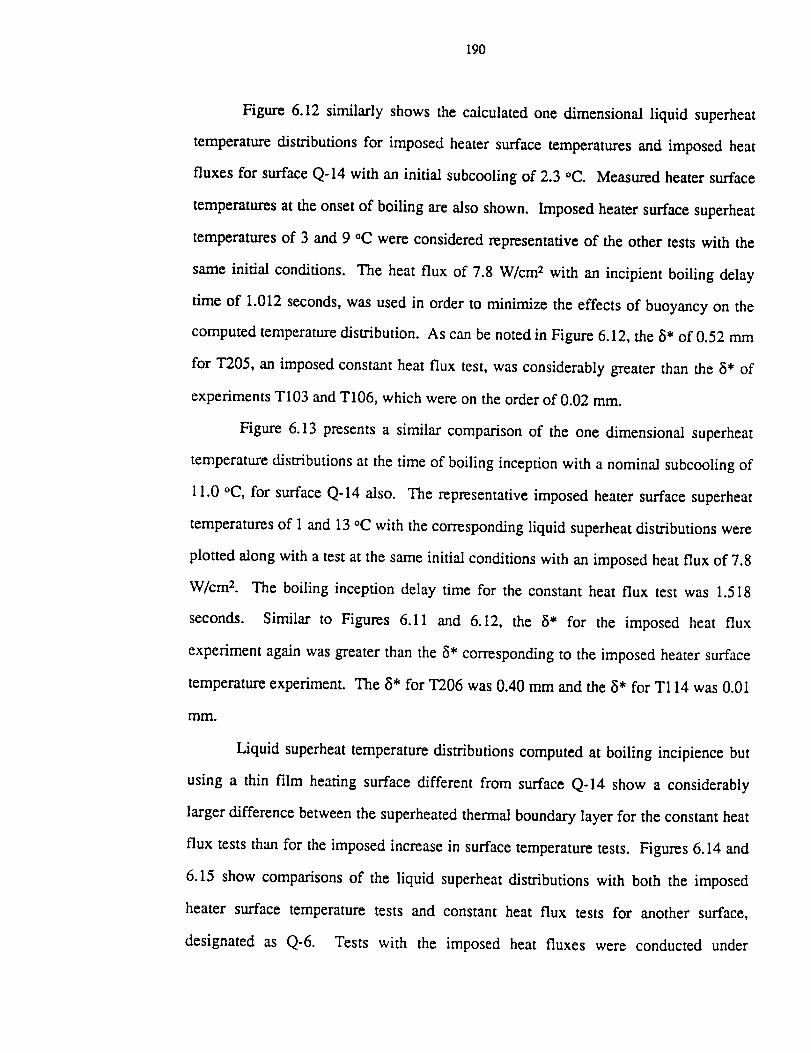
190
Figure 6.12 similarly shows the calculated one dimensional liquid superheat
temperature distributions for imposed heater surface temperatures and imposed heat
fluxes for surface Q-14 with an initial subcooling of 2.3 °C. Measured heater surface
temperatures at the onset of boiling are also shown. Imposed heater surface superheat
temperatures of 3 and 9 °C were considered representative of the other tests with the
same initial conditions. The heat flux of 7.8 W/cm 2 with an incipient boiling delay
time of 1.012 seconds, was used in order to minimize the effects of buoyancy on the
computed temperature distribution. As can be noted in Figure 6.12, the _i* of 0.52 mm
for T205, an imposed constant heat flux test, was considerably greater than the 5" of
experiments T103 and T106, which were on the order of 0.02 ram.
Figure 6.13 presents a similar comparison of the one dimensional superheat
temperature distributions at the time of boiling inception with a nominal subcooling of
11.0 °C, for surface Q-14 also. The representative imposed heater surface superheat
temperatures of 1 and 13 °C with the corresponding liquid superheat distributions were
plotted along with a test at the same initial conditions with an imposed heat flux of 7.8
W/cmL The boiling inception delay time for the constant heat flux test was 1.518
seconds. Similar to Figures 6.11 and 6.12, the 5" for the imposed heat flux
experiment again was greater than the 5" corresponding to the imposed heater surface
temperature experiment. The 5" for T206 was 0.40 mm and the 5" for T114 was 0.01
mm.
Liquid superheat temperature distributions computed at boiling incipience but
using a thin film heating surface different from surface Q-14 show a considerably
larger difference between the superheated thermal boundary layer for the constant heat
flux tests than for the imposed increase in surface temperature tests. Figures 6.14 and
6.15 show comparisons of the liquid superheat distributions with both the imposed
heater surface temperature tests and constant heat flux tests for another surface,
designated as Q-6. Tests with the imposed heat fluxes were conducted under
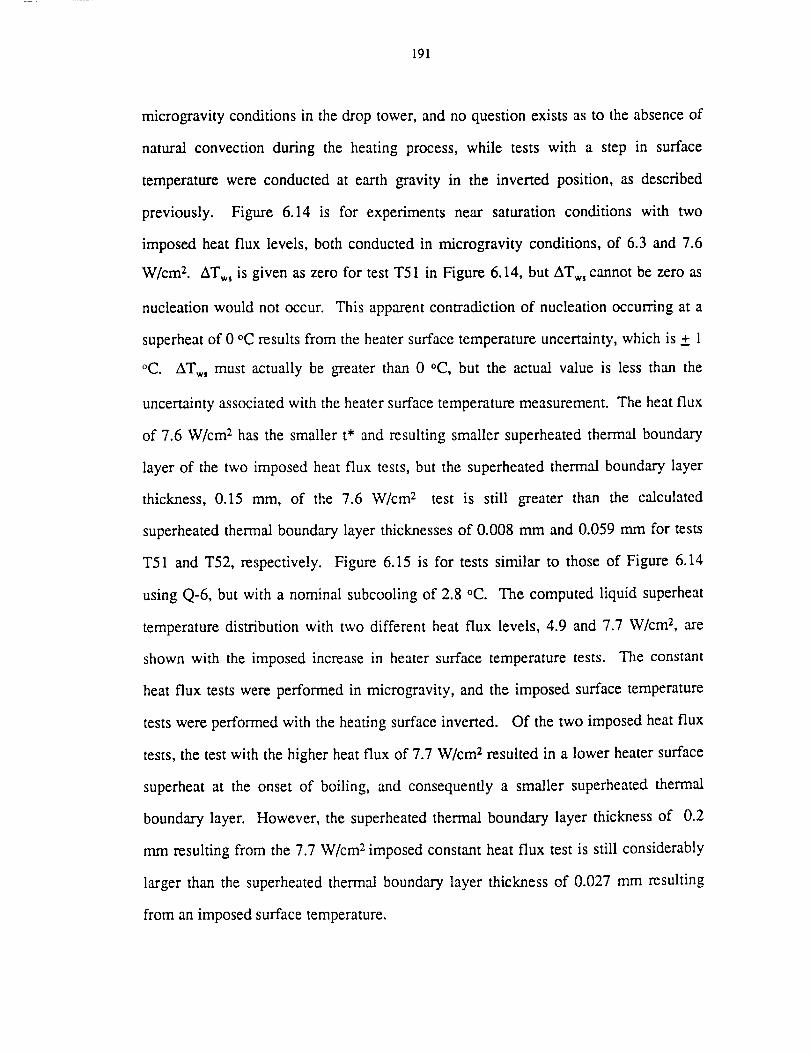
191
microgravity conditions in the drop tower, and no question exists as to the absence of
natural convection during the heating process, while tests with a step in surface
temperature were conducted at earth gravity in the inverted position, as described
previously. Figure 6.14 is for experiments near saturation conditions with two
imposed heat flux levels, both conducted in microgravity conditions, of 6.3 and 7.6
W/cm z. AT,,,, is given as zero for test T51 in Figure 6.14, but AT,,,, cannot be zero as
nucleation would not occur. This apparent contradiction of nucleation occurring at a
superheat of 0 °C results from the heater surface temperature uncertainty, which is + 1
°C. AT,,,, must actually be greater than 0 °C, but the actual value is less than the
uncertainty associated with the heater surface temperature measurement. The heat flux
of 7.6 W/cm 2 has the smaller t* and resulting smaller superheated thermal boundary
layer of the two imposed heat flux tests, but the superheated thermal boundary layer
thickness, 0.15 mm, of the 7.6 W/cm 2 test is still greater than the calculated
superheated thermal boundary layer thicknesses of 0.008 mm and 0.059 mm for tests
T51 and T52, respectively. Figure 6.15 is for tests similar to those of Figure 6.14
using Q-6, but with a nominal subcooling of 2.8 °C. The computed liquid superheat
temperature distribution with two different heat flux levels, 4.9 and 7.7 W/cm 2, are
shown with the imposed increase in heater surface temperature tests. The constant
heat flux tests were performed in microgravity, and the imposed surface temperature
tests were performed with the heating surface inverted. Of the two imposed heat flux
tests, the test with the higher heat flux of 7.7 W/cm 2 resulted in a lower heater surface
superheat at the onset of boiling, and consequently a smaller superheated thermal
boundary layer. However, the superheated thermal boundary layer thickness of 0.2
mm resulting from the 7.7 W/cm 2 imposed constant heat flux test is still considerably
larger than the superheated thermal boundary layer thickness of 0.027 mm resulting
from an imposed surface temperature.
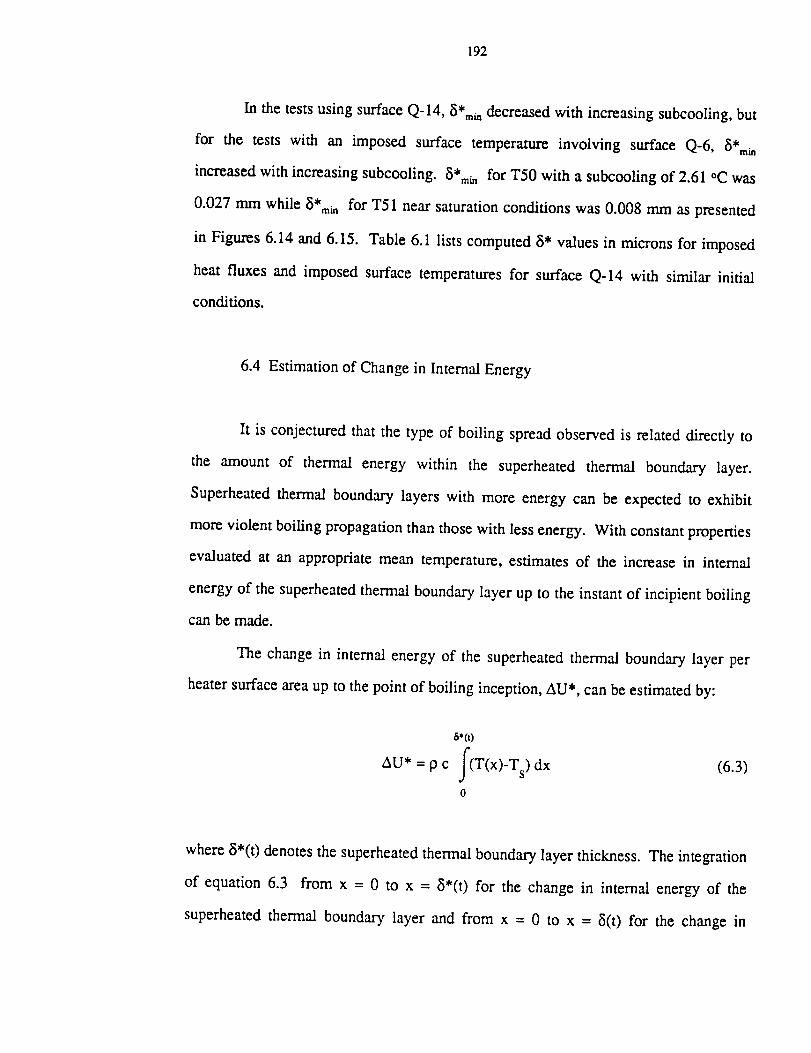
192
In thetestsusingsurfaceQ-14, 8*mi n decreased with increasing subcooling, but
for the tests with an imposed surface temperature involving surface Q-6, 8*ram
increased with increasing subcooling. 8*mi n for T50 with a subcooling of 2.61 °C was
0.027 mm while 8*mi _ for T51 near saturation conditions was 0.008 mm as presented
in Figures 6.14 and 6.15. Table 6.1 lists computed 8" values in microns for imposed
heat fluxes and imposed surface temperatures for surface Q-14 with similar initial
conditions.
6.4 Estimation of Change in Internal Energy
It is conjectured that the type of boiling spread observed is related directly to
the amount of thermal energy within the superheated thermal boundary layer.
Superheated thermal boundary layers with more energy can be expected to exhibit
more violent boiling propagation than those with less energy. With constant properties
evaluated at an appropriate mean temperature, estimates of the increase in internal
energy of the superheated thermal boundary layer up to the instant of incipient boiling
can be made.
The change in internal energy of the superheated thermal boundary layer per
heater surface area up to the point of boiling inception, AU*, can be estimated by:
8.(0
au* = c f(T(x)-Ts)dx (6.3)
0
where 8*(0 denotes the superheated thermal boundary layer thickness. The integration
of equation 6.3 from x = 0 to x = 8*(0 for the change in internal energy of the
superheated thermal boundary layer and from x = 0 to x = _(t) for the change in
193
internal energy of the thermal boundary layer were performed using Simpson's Rule,
using the appropriate analytical expressions for T(x) and values of 5*(0 and 5(t)
corresponding to the measured onset of boiling. The values of the superheated
penetration depth, internal energy change of the superheated boundary layer, total
internal energy change, the ratio of the change in internal energy of the superheated
thermal boundary layer to that of the total thermal boundary layer, and the type of
subsequent boiling spread observed are presented in Table 6.2 for the microgravity
tests where a constant heat flux was imposed.
The experiments in which the increase in internal energy of the superheated
thermal boundary layer was 19.150 kJ/m z or more at the moment of boiling inception
are those in which the boiling propagation was either the rapid unstable type, category
D, or the rapid violent type, category E. The rapid violent type of boiling propagation
occurred only for tests in which the liquid was initially near saturation conditions. The
tests with an increase in internal energy of the superheated thermal boundary layer of
6.815 kJ/m 2 or less are characterized by the slow marangoni type of spreading,
category F. Experiment PBMT1101.600, which was the most violent of all tests, had
the largest increase in internal energy of the superheated thermal boundary layer,
46.68 kJ/m 2, and also the largest ratio of increase in internal energy of the superheated
thermal boundary layer to the increase in energy of the thermal boundary layer,
0.9977. Two other microgravity experiments with category E type of boiling
propagation, PBMT1025.800, and PBMT1102.800, had a change in internal energy in
5" of 33.22 kJ/m 2 and 31.28 kJ/m 2 , respectively, and a ratio of the increase in internal
energy of 5 to _5" of 0.9974 and 0.9969, respectively. From the estimated change in
internal energy, it is observed that the energy content for the most explosive type of
boiling spread is the largest, 46.68 kJ/m z. The most rapid vapor bubble growth
occurred in the microgravity experiment with a heater surface temperature of 120 °C.
This experiment, PBMT1101.600, had one of the lowest temperature gradients at the
194
heatersurface,but hadthe largestsuperheatedthermalboundarylayerenergycontent
of all the microgravity tests. The boiling spreadthat occurredwith relatively small
increase in internal energy in the superheatedthermal boundary layers were
characterizedby categoryF spreading,while the boiling spreadthat occurredwith
relatively largeincreasesin internalenergyin the superheatedthermalboundarylayer
were of the rapid unstabletype, or on occasionfor very large increasesin internal
energyin thesuperheatedthermalboundarylayer,theexplosivetype.
As can also be noted from a detailed examinationof Table 6.2, the largest
ratios of increasein internalenergyof the superheatedthermal boundarylayerto the
increasein energyof thethermalboundaryoccurwith initially saturatedliquid, ascan
beanticipated. The last two digits of thefilenamesin Table 6.2 provide thenominal
liquid subcoolingsin degreesFahrenheit.
In the caseof the imposedsurfacetemperaturetests,incipient boiling began
before the superheatedthermal boundary layer thickness reached the values
correspondingto the imposedheatflux tests. Themorenon-equilibriumconditionsof
a steepertemperaturegradientand a smaller time scaleassociatedwith the imposed
heatersurfacetemperaturetestsmayhavemadetheliquid-vaporinterfaceof thenuclei
in the surfacecavitiesmoreunstablethanunder theconditionsof an imposedheater
surfaceheat flux. In Table 6.1, the boiling delay time and the liquid temperature
gradient at the surfaceboth for 400 microsecondsand the onset of boiling are
presented. It is notedthat at a time of 400 microsecondsthat the surfacetemperature
gradient tends to be larger than that associatedwith the imposed heat flux tests.
Particularly striking is thecontrastin magnitudeof theboiling delaytimesbetweenthe
imposedheat flux testsand the imposed surface temperaturetests. The surface
temperatureat incipient boiling wasalwaysgreaterfor an imposedheat flux than for
an imposedsurfacetemperaturefor similar initial conditions and the samesurface.
Furthermore,from examinationof theareaunderthe temperaturedistribution curves,
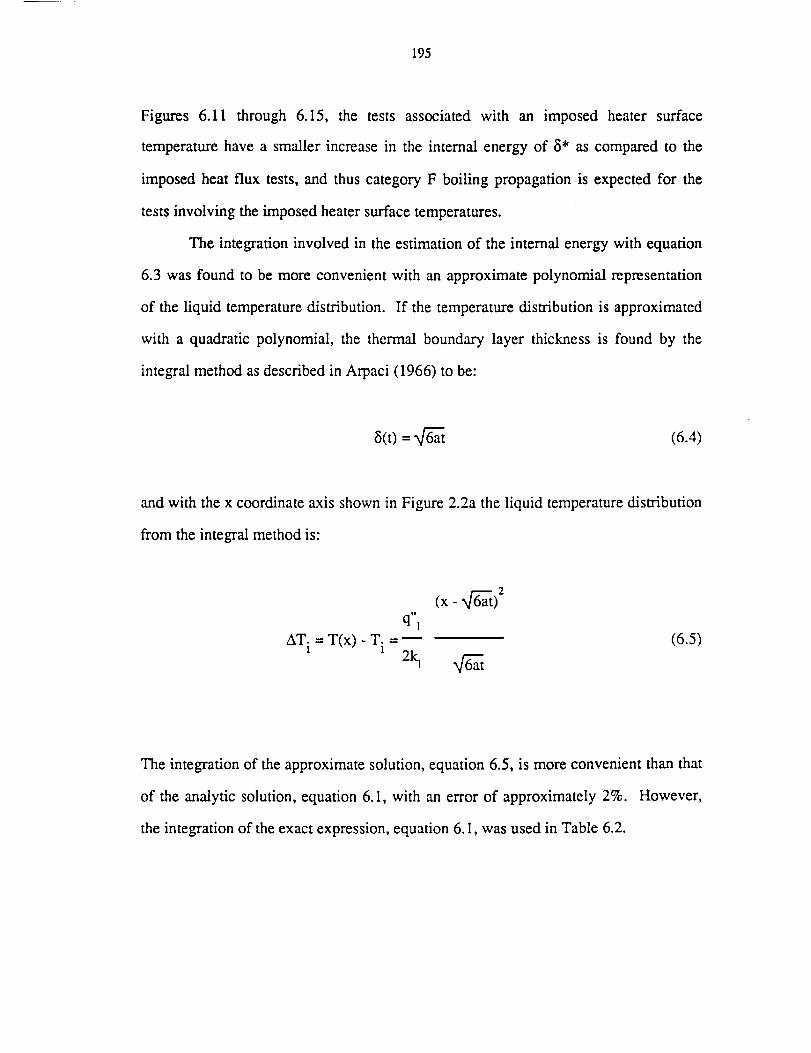
195
Figures 6.11 through 6.15, the tests associatedwith an imposed heater surface
temperaturehavea smaller increasein the internal energyof 5" ascomparedto the
imposedheat flux tests,and thuscategoryF boiling propagationis expectedfor the
testsinvolving theimposedheatersurfacetemperatures.
The integrationinvolvedin theestimationof the internalenergywith equation
6.3 was found to bemoreconvenientwith anapproximatepolynomial representation
of the liquid temperaturedistribution. If the temperaturedistribution is approximated
with a quadraticpolynomial, the thermal boundarylayer thicknessis found by the
integralmethodasdescribedin Arpaci (1966)to be:
5(0 = _ (6.4)
andwith thex coordinateaxisshownin Figure2.2a theliquid temperaturedistribution
from theintegralmethodis:
(x-IB
ql
AT. = T(x)- T. - (6.5)
1 x 2k I
The integration of the approximate solution, equation 6.5, is more convenient than that
of the analytic solution, equation 6.1, with an error of approximately 2%. However,
the integration of the exact expression, equation 6.1, was used in Table 6.2.

196
6.5 Bubble Shape at Onset of Rapid Unstable Spreading in Microgravity
From Figures 5.23 through 5.25, the photos for the microgravity tests in which
the imposed heat flux resulted in the rapid unstable and violent boiling spreading,
categories D and E respectively, the bubble was initially smooth and symmetrical
(This smooth and symmetrical bubble is not pictured here.), but later in time, Figures
24a and 24b for example, the bubble ruptures at the liquid-vapor interface and then
rapid spreading occurs. The correlation of the bubble shape at the moment of this
rupture in dimensionless form with the dimensionless heat flux is examined here.
For the physical situation in microgravity with no fluid motion, it is reasonably
assumed that one dimensional conduction describes the heat transfer from the heated
surface. For this situation the differential form of the energy equation is:
O_TaT 1
_x 2- at o_(6.6)
with the boundary condition:
(6.7)
From equation 6.6, in terms of the physical dimensions of the situation:
T T !or 8 ~ x2
82 ",(6.8)
where 8 is the diffusion length scale defined in terms of some characteristic
temperature difference, x is the characteristic time scale. Figure 6.16 shows a small
197
bubble with D, the largestdiameterparallel to the heatersurface,and with H, thex
coordinatedimension. The projectedareaof the bubbleover the heatingsurfaceis
much smaller than the total areaof the heatingsurface,and the effect of the bubble
presence,resultingin local cooling due to the phasechange,on the remainderof the
superheatedthermalboundarylayeris assumedto benegligible.
Fromconsiderationof theenergyequation6.6andequations6.7and6.8 it may
bededucedthat:
D = fl(T, q", 8, k, H) (6.9)
whereT is a characteristictemperature,q" is the heatflux, andk is the liquid thermal
conductivity. From the application of the Buckingham Pi theorem, three
dimensionlessgroupsarefound:
H=f tH 'kTJ (6.10)
H appearson both sidesof equation6.10, and it is desirableto have the dependent
variableson one sideof the dimensionlessrelationshiponly. The two dimensionless
groupson the RHS of equation6.10 are multiplied resulting in two dimensionless
groups:
D= f3 (6.1 1)I.kTJ
198
T is a characteristictemperaturewhich may bea temperaturedifference. With Tw-T,
as the characteristictemperaturein this situation, _ is taken as 5", the superheated
thermalboundarylayerat thetimejust prior to rupturing,and:
[:*l-- - (6.12)
H- f' [k(T:T)J
Measurements of D, H, and (T w - T s) were obtained at the onset of boiling for the
experiments conducted in microgravity, and combined with the corresponding values
of 5" in equation 6.12. The dimensionless shape of the bubble about to rupture was
correlated with the heat flux imposed at the heater surface, which was made
dimensionless in equation 6.12, and these quantities are plotted in Figure 6.17. The
boiling spread became more violent as the dimensionless heat flux increased, which
corresponds to the tests to the right of the dashed line. The lower limit of this
relationship is characterized by the slow, category F boiling spread.
6.6 Explosive Boiling Spread in Microgravity
Following the appearance of a single bubble on the heating surface at a low
heat flux level near saturation conditions, the explosive type of boiling spread,
category E, was observed for the first time in the present microgravity experiments as
described in Section 5.1.1.6, Figures 5.25a through 5.25g and briefly referred to in
section 6.5 in the discussion of the bubble shape and corresponding dimensionless heat
flux. The rapidly growing vapor-liquid interface was covered with small scale
disturbances which remained small at initial times, but these protuberances grew in
size with time, as seen in Figures 5.25a through 5.25g. The rapidly growing vapor
199
masswith the interfacedisturbancespushedinto the subcooledliquid locatedabove
the visible thermal boundary layer. Boiling inception was accompaniedwith a
momentaryspikein themeasuredpressureasindicatedin Figure5.10.
In classicalbubble growth theories,the bubble is assumedto grow from a
smoothsphericalvapor bubble in a uniformly superheatedliquid, and heat transfer
effectsareconsideredin the liquid but thermodynamicequilibrium is assumedfor the
vapor. Thesetheoriesdescribethreeconsecutivestagesof bubblegrowth: very early
surfacetensioncontrolled growth followed by inertia controlled growth which is, in
turn, followed by a heatdiffusion dominatedstage. An exampleof suchtheoriesare
presentedin ProsperettiandPlesset(1978). Figure6.18showstwo limiting conditions
for vapor bubblegrowth,alongwith the measuredgrowth rate of the vapor massin
microgravity for experimentPBMTll01.600. The Rayleigh solution for bubble
growth which is applicableto boiling, cavitation,andunderwaterexplosionsis shown
asthe upper limit on the growth rate. The Rayleigh solutionappliesto a spherical
bubble growing in an infinite fluid, and assumesthat the sphereexpandsradially
outward producing a purely irrotational radial flow through the action of pressure
forcesalone. Panton(1984) givesthe Rayleighsolutionusing the velocity potential
and continuity equationin sphericalcoordinateswith the Bernoulli equation. The
boundaryconditions specified that the fluid was stationary at infinity and that it
followed the spheremotion at the sphere surface,with the resulting differential
equationfor the interfacemotion:
2
P(R)-P_ d R 3 [dR]:=R --T +_ ldtJ (6.131
P dt
200
where R is the bubble surfaceradius and p is takenas a constant. If P(R), the
saturationpressurecorrespondingto the heatersurfacetemperatureat thetime of the
appearanceof the f'wstbubble,andP., areassumedconstantasa fh'st approximation,
thenR(t) and R'(t) arereadily determinedfrom equation6.13. The stepin pressure
from P. to the saturationpressurecorrespondingto the heatersurfacetemperatureis
consideredto provide a higher than expectedgrowth rate. The solution for R(t)
appearsin Figure 6.18. The otheranalytical solution is for heatdiffusion controlled
growth of the vapor bubble,and provides the lower limit. During early stagesof
bubble growth the pressureforcesare expectedto control growth and at later times
heatdiffusion is expectedto control growth. For the presentcase,neither of these
solutionsisclosely followed. The effectiveradiususedin themeasurementsof Figure
6.18 is definedin Figure6.19. Limitations in themeasurementsof thegrowthratesat
theearly time periodsexistdueto therelatively slow framing rateof the camera,400
fps,which areindicatedby thedatapointsin Figure6.18.
The type of boiling spreadshownin Figures5.25athrough5.25g is explosive
and hasnot beenpreviouslyobservedfor the conditionsof no liquid motion during
heatingprovided by microgravity. Thesephotographssuggestthat extremely large
evaporationrates occur during early stagesof the bubble growth which drive an
instability at the bubble interface. A wrinkling of the liquid-vapor interface occurs
which persistsfor some time after the vapor masshas covered the entire heating
surface,Figures5.25athrough5.25e. The patternof protuberancescovers theentire
liquid-vaporinterface,andtheregularityof thepatternis striking. It is speculatedthat
the presenceof thesmall scaleprotuberancesgreatly increasesthe areaof the liquid-
vapor interface, which significantly increasesthe massflux to the growing vapor
bubble,which in turn drives the instability. It is also speculatedthat the wrinkles
somehowarisefrom veryrapidevaporationat the interface.
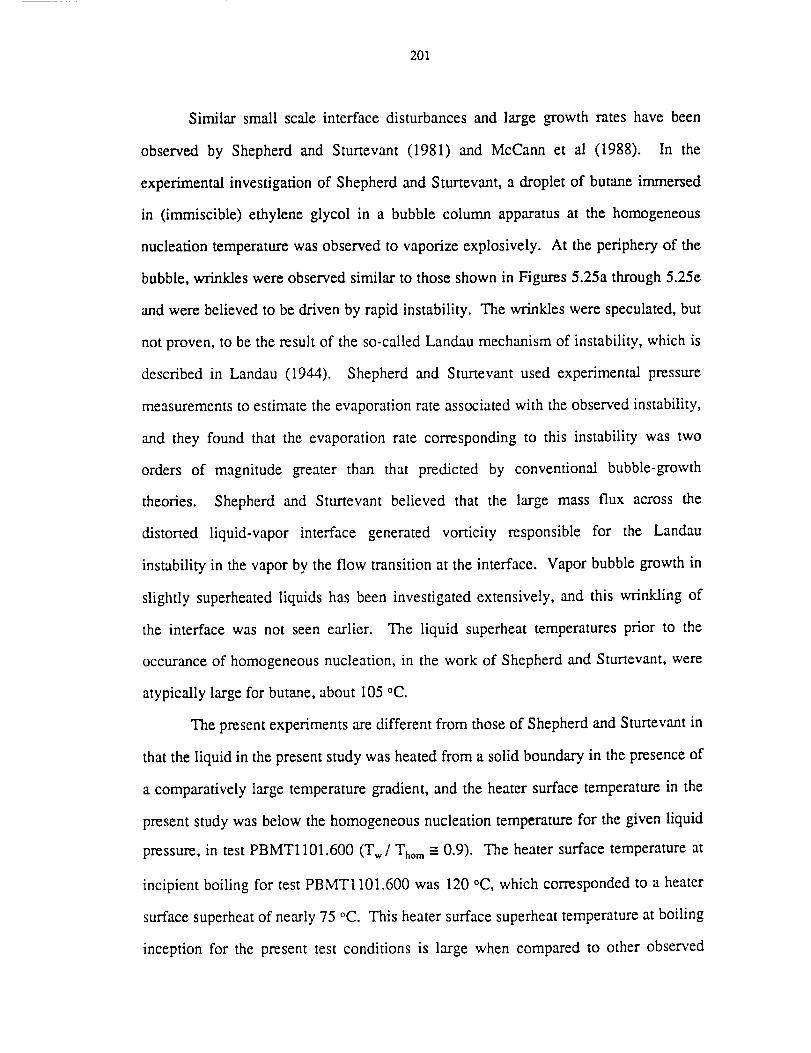
201
Similar small scaleinterfacedisturbancesand large growth rates have been
observedby Shepherdand Sturtevant(1981) and McCann et al (1988). In the
experimentalinvestigationof Shepherdand Sturtevant,a dropletof butaneimmersed
in (immiscible) ethyleneglycol in a bubble column apparatusat the homogeneous
nucleationtemperaturewasobservedto vaporizeexplosively. At theperipheryof the
bubble,wrinkleswereobservedsimilar to thoseshownin Figures5.25athrough5.25e
andwerebelievedto bedrivenby rapid instability. The wrinkleswerespeculated,but
notproven,to betheresultof the so-calledLandaumechanismof instability, which is
describedin Landau (1944). Shepherdand Sturtevantusedexperimentalpressure
measurementsto estimatetheevaporationrateassociatedwith theobservedinstability,
and they found that the evaporationrate correspondingto this instability was two
orders of magnitude greater than that predicted by conventional bubble-growth
theories. Shepherdand Sturtevantbelieved that the large massflux acrossthe
distorted liquid-vapor interface generated vorticity responsible for the Landau
instability in thevaporby theflow transitionat the interface. Vaporbubblegrowth in
slightly superheatedliquids hasbeeninvestigatedextensively,and this wrinkling of
the interface was not seenearlier. The liquid superheattemperaturesprior to the
occuranceof homogeneousnucleation,in the work of Shepherdand Sturtevant,were
atypicallylargefor butane,about 105°C.
Thepresentexperimentsaredifferent from thoseof ShepherdandSturtevantin
thatthe liquid in thepresentstudywasheatedfrom a solid boundaryin thepresenceof
acomparativelylargetemperaturegradient,and the heatersurfacetemperaturein the
presentstudywasbelow thehomogeneousnucleationtemperaturefor the givenliquid
pressure,in testPBMT1101.600(Tw/Thorn----0.9). The heatersurfacetemperatureat
incipientboiling for testPBMT1101.600was 120°C, which correspondedto a heater
surfacesuperheatof nearly75 °C. This heatersurfacesuperheattemperatureat boiling
inceptionfor the presenttest conditions is large when comparedto other observed
202
valuesof the heatersurfacesuperheattemperatureat incipient boiling for Rl13 on
glassin earthgravity,asdescribedin You et al (1990).
6.7 EmpiricalHeterogeneousNucleationFactor
As discussed previously in Chapter 2, the form of the homogeneous nucleation
rate used here was given by Fisher (1948):
nkT -AG*
J= "-ff--exp(--_) (6.14)
In the presence of a solid heating surface, AG* can be expected to be considerably
lower than that for homogeneous nucleation. This lowering of the thermal activation
energy has been incorporated into the description of heterogeneous nucleation in terms
of a dimensionless parameter defined as:
AGhe t
F=_AG*
(6.15)
F is a positive number varying between zero and unity: zero implies no nucleation
while unity corresponds to homogeneous nucleation. Kottowski (1973), Cole (1974),
and Blander and Katz (1975) defined F in terms of a specific cavity geometry. In most
situations, however, the actual cavity geometry and surface topography are seldom
known, since typical boiling surface cavities are extremely small (on the order of 10 -7
tO 10-9 m).
Since the cavity geometry is difficult to determine at present, Gerum et al
(1979) and Ngheim et al (1981) attempted to define F empirically, as discussed
previously in Chapter 2. Gerum calculated F values based on measured heater surface
203
temperaturesduringquasi-steadyheating,andincludedboiling crisis datain his work.
Ngheim et al also defined F empirically in terms of the measuredheatersurface
temperatureduring transientheatingat the instantof theappearanceof thefirst bubble.
Sincethe heterogeneousnucleationappearedto take place in the fluid immediately
adjacentto the heatersurface,the fluid temperaturewas takento be the sameasthe
heater surface temperature. The validity of using the measuredheater surface
temperatureandmeasuredsystempressureto determineF is re-examinedhere. Since
thepresentstudyis primarily concernedwith transientincipient boiling, the work of
Ngheimet al (1981)is discussedfirst, followed by a discussionapplicableto both the
work of Ngheimet al (1981)andGerumet al (1979).
In the work of Ngheim et al (1981), the dimensionlessheterogeneous
nucleationfactor,F, wascalculatedbasedon themeasuredheatingsurfacetemperature
at the instant of nucleation,and wasplotted againstthe dimensionlesstemperature
difference:
T-TW $
0 - (6.16)
Thom-T s
for various transient boiling nucleation data.
F may be written from equations 2.4, 2.5, and 2.16 as:
2
I nkTwt, ] 3kT_(P,,-PI)F = In (---'-_--)J 3 (6.17)16no
204
t*, as defined earlier, is the time delay from the onset of heating of the liquid to the
appearance of the f'urst vapor bubble. In the development of equation 6.17, J was taken
to be l/t* as a reasonable f'ast approximation. Pv was taken approximately as the
saturation pressure with a flat interface, corresponding to the heater surface
temperature at nucleation, c was evaluated at the heater surface temperature at
nucleation.
t* may be neglected as a parameter in equation 6.17 since it appears in the
logarithmic term. This can be demonstrated by expanding the logarithmic term as:
nkT t* nkTW W
In (---'_) = In (---_) + In t* (6.18)
The Fast term of the R/IS of equation 6.18 is the natural log of a quantity with a
typical magnitude of about 1030 seconds, but t* of the second term of the RHS of
equation 6.18 is much less than 1030 seconds for most boiling situations. (As a matter
of reference, 10 s seconds is about 100 years.)
To quantify this explicitly, consider R113 near saturation conditions initially at
a temperature of 310 K, and heated to a temperature of 320 K at the surface. With the
appropriate properties substituted into equation 6.17, F becomes:
-8
F=7xl0 (93+lnt*) (6.19)
t* may be varied by as much as 105 seconds with a resulting change of only 12% in F.
Similar behavior also occurs with liquid nitrogen and water. Hence, F, assumed to be
a measure of the liquid-heater surface character, is a strong function of the heater
surface temperature at nucleation, but a weak function of the delay time to nucleation,
205
andthenucleationdelaytime cannotnecessarilybeusedasa parameterto characterize
theheatersurface.Thust* maybeneglectedwhen:
In t*
nkTW
ln_h
<< 1 (6.20)
The condition of equation 6.20 is expected to hold for typical engineering boiling
applications for reasons given in connection with equation 6.18.
Both the work of Ngheim et al (1981) and of Gerum et al (1979) rely on the
concept that F, which results from the measured beater surface temperature and the
liquid pressure, are representative of the heater surface-fluid character. Because of the
exponential nature of J in equation 6.14, a narrow range of F may be calculated for a
large range in J (over several orders of magnitude). To demonstrate the consequences
of this behavior, J was set equal to 1 sec "t cm 3 (a reasonable value for the present
experimental study) and curves for F were calculated for R113 at three different liquid
pressure levels of 1, 2, and 3 atm. Figure 6.20 presents F, as defined in equation 6.17,
as a function of 0, defined in equation 6.16, for Rl13 for these three pressures. Thom
for each of the three pressure levels and the corresponding curves which show
calculated data points are also given in the figure. A distinctly different curve results
for each of the pressure levels, which implies that the relationship for F is property
dependent, and not universal. The F curves, by definition, approach unity as 0
approaches unity and approach zero as 0 approaches zero. F may indeed be a function
of the solid surface and liquid-surface character and is not described by nucleation
delay times, but perhaps from heater superheat temperature at nucleation, or some
related function, together with equation 6.17.
206
In thework of Ngheimet al (1981)andGerumet al (1979)andsimilar works,
it was thought that there might be a general relationship betweenF and the
dimensionlessheatersurfacetemperature,which was independentof the fluid type
becauseF datacalculatedfrom measuredheatersurfacetemperaturesfor water and
R113 heatedwith the sameheatersurfacefell approximatelyon a singlecurve. In
light of the presentdiscussion,it is fortuitous that the calculatedF valuesfell on a
single curve. Considerablework remains for the more precisedescription of the
nucleationcharacteristicsof solidsurfaces.
6.8 Conclusions
Themainpointsof thepresentstudyarenow summarized:
1. Known temperature distributions in the heated liquid at the moment of boiling
incipience, obtained in microgravity or for short times with the heater surface inverted
in standard earth gravity, were shown to characterize the subsequent boiling
propagation across the heated surface. Large superheated thermal boundary layers
formed in the conditions of microgravity and low heat flux levels on a "smooth"
surface are associated with a particularly explosive type of boiling spread previously
unobserved, which is believed to be the result of an interfacial instability driven by a
large mass flux across the wrinkled liquid-vapor interface.
2. Buoyancy was shown to greatly affect the phase change dynamics associated with
incipient boiling. Buoyancy, which produced fluid motion, affected the liquid
temperature distribution during heating and the subsequent boiling propagation.
Certain types of boiling spread, such as the explosive type of spreading, were observed
only in microgravity, and not in earth gravity for either the horizontal up or the
horizontal down heater surface orientations. Buoyancy induces convective motion
207
which reduces the energy of the superheated thermal boundary layer that would
otherwise be available for boiling propagation. The buoyancy force carried vapor
bubbles away from the heater surface when the heater surface was in the horizontal up
orientation in earth gravity, but held vapor bubbles at the heater surface for the
horizontal down orientation.
3. The method of heating the liquid determines the temperature distribution in the
liquid, which affects the resulting phase change dynamics significantly. The tests
conducted with an imposed heat flux resulted in larger superheated thermal boundary
layers than did the tests conducted with imposed step changes in surface temperature.
As a result, the boiling spread after boiling incipience was markedly different. The
temperature gradient in the fluid at the heater surface was greater with the imposed
step change in surface temperature than in the fluid with the imposed heat flux, but the
phase change dynamics with the imposed heat flux were more violent. In addition, the
onset of boiling with the imposed step change in surface temperature occurred at
significantly shorter delay times and lower heater surface temperatures than those for
imposed heat fluxes.
6.9 Recommendations for Future Study
Because of the physical limitations of the drop tower, the microgravity tests in
the present work were of short duration (about 5 seconds). For these tests, boiling
propagation categories D and E at the low heat flux levels, on the order of 5 W/cm 2,
were particularly striking. It would be desirable to perform microgravity incipient
boiling tests at lower heat flux levels, on the order of 0.5 to 2 W/cm 2, for longer times
than was possible with the drop tower experiments. As a result of the knowledge
gained from the present experiments, low level heat flux experiments are being
planned for a future space shuttle flight.

208
Figures 6.1 - 6.20 follow.
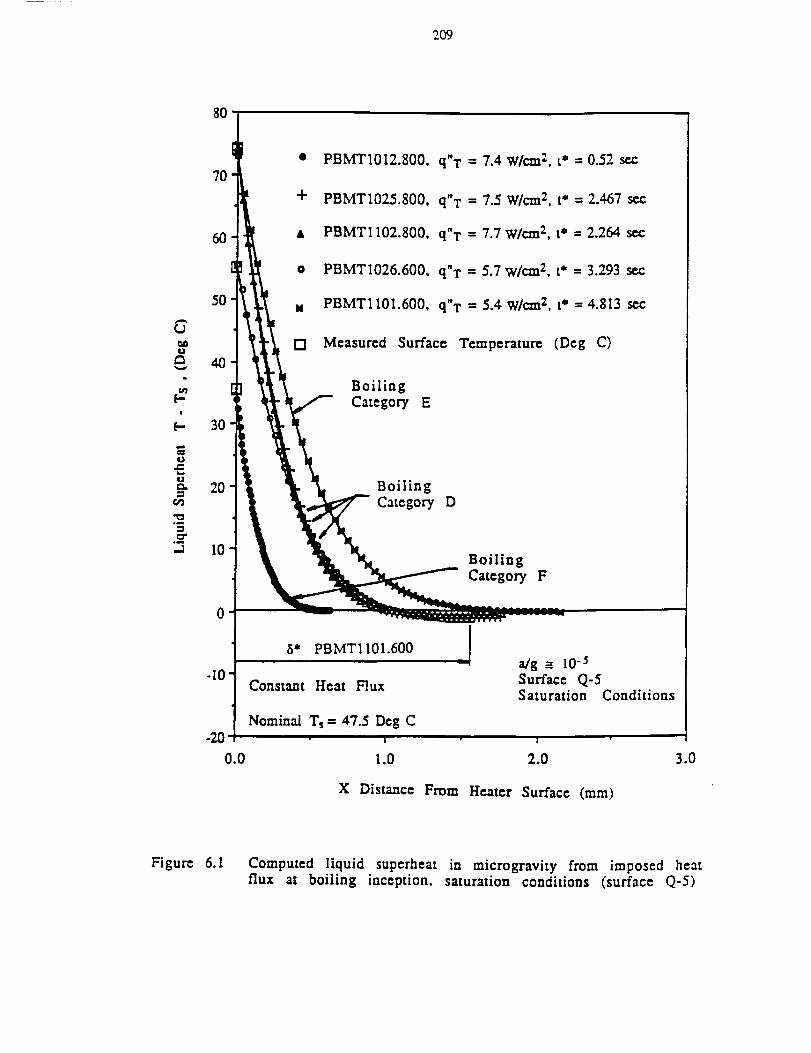
2O9
7O
emu
m
_eJ
t-!
[-
t_t_
.l
6O
5O
4O
30
20
10
• PBMTI012.800, q"T = 7.4 W/cm I, t* = 0.52 se.c
+ PBMTI025.800, q'T = 7.5 W/cm 2, t* = 2.467 sec
• PBMTII02.800, q"T ffi 7.7 W/cm I, t* = 2.254 sec
o PBMTI026.600, q"T = 5.7 w/cm 2, t* = 3.293 sec
w PBMT1101.600, q"T = 5.4 W/cm 2, t* = 4.813 sec
[=] Measured Surface Temperature (Deg C)
BoilingCategory E
BoilingCategory D
BoilingCategory F
-10
-20
0.0
S* PBMT1101.6O0 !Constant Heat Flux
Nominal Ts = 47.5 Deg Ct
1.0
X Distance From
a/g = I0 -5Surface Q-5Saturation Conditions
2.0 3.0
Heater Surface (ram)
Figure 6. I Computed liquid superheat in microgravity from imposed heatflux at boiling inception, saturation conditions (surface Q-5)
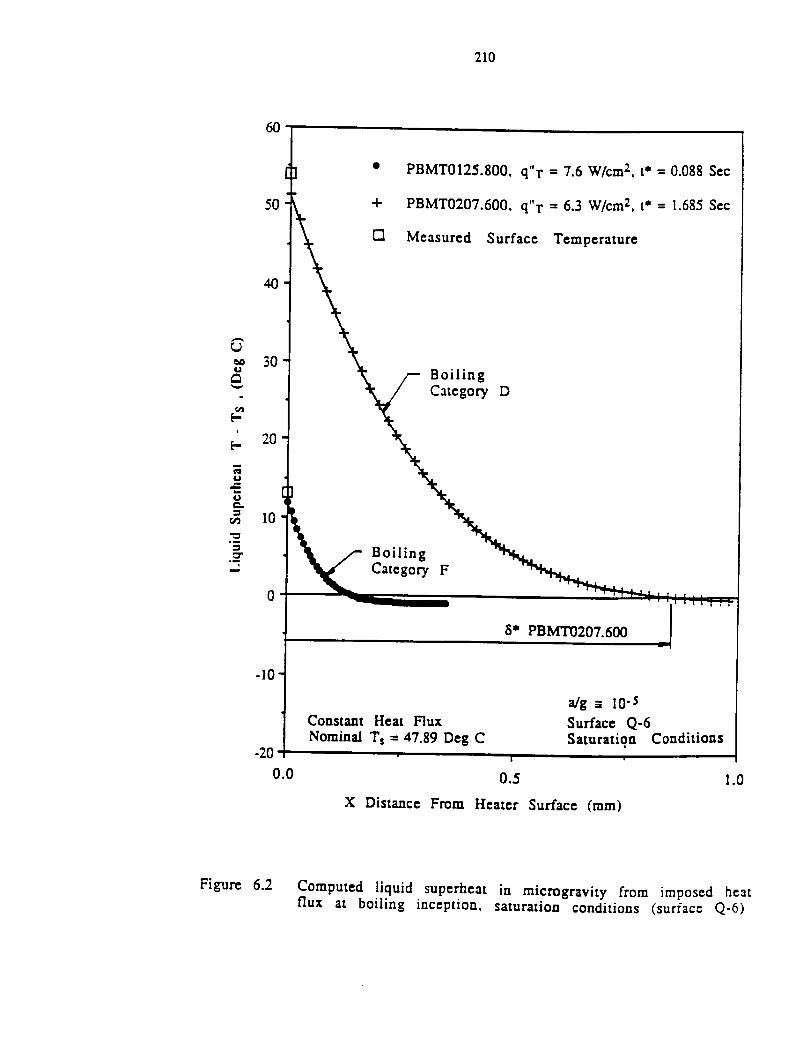
210
6O
5O
4O
G3O
£
I
2O
tO
0
-I0
-20
0.0
• PBMT0125.800, q"T = 7.6 W/cm 2,t* = 0.058 Sec
+ PBMT0207.600o q T = 6.3 W/cm 2,t* = 1.685Scc
Measured Surface Temperature
__ /_ Boiling
/- Boiling "_N,_
8* PBIVIT0207.600
Constant Heat Flux
Nominal Ts = 47.89 Dog C
a/g __.-I0-s
Surface Q-6Saturation Conditions
0.5
X Distance From Heater Surface (ram)
1.0
Figure 6.2 Computed liquid superheat in microgravity from imposed heatflux at boiling inception, saturation conditions (surface Q-b)

211
80
70
60
,.,50CJ
¢,)
"40r,¢)
t--!
t--
30
0
._ 2O°m
°_
.l
10
÷÷÷
• PBMT1013.805, q"T = 7.2 W/cm 2, t* = 0.045 See
÷ PBMT0914.805, q"T = 7.8 W/cm 2, t* = 0.300 Sec
[] PBMT1213.805, q"T = 7.6 W/cm 2, t* = 1.728 See
• PBMTl128.805, q"T = 7-7 W/cm2, t* = 1.918 See
• PBMTI 115.605, q"T = 5.8 W/cm 2, t* = 3.083 Sec
o PBMT1019.605, q"T = 5.3 W/cm 2, t* = 4.083 Sec
N Measured Heater Surface Temperature
BoilingCategory D
BoilingCategory F
0
,°t-20
0.0
8* PBMT1019.605
Constant Heat Flux
Nominal Ts = 48 Deg C
X Distance From
a/g = 10"5Sun'ace -- Q-5
Subcooling = 2.8 Deg C
!
1.0
Heater Surface (ram)
2.0
Figure 6.3 Computed liquid superheat in microgravity from imposed heat
flux at boiling inception, 2.8 °C subcooling (surface Q-5)
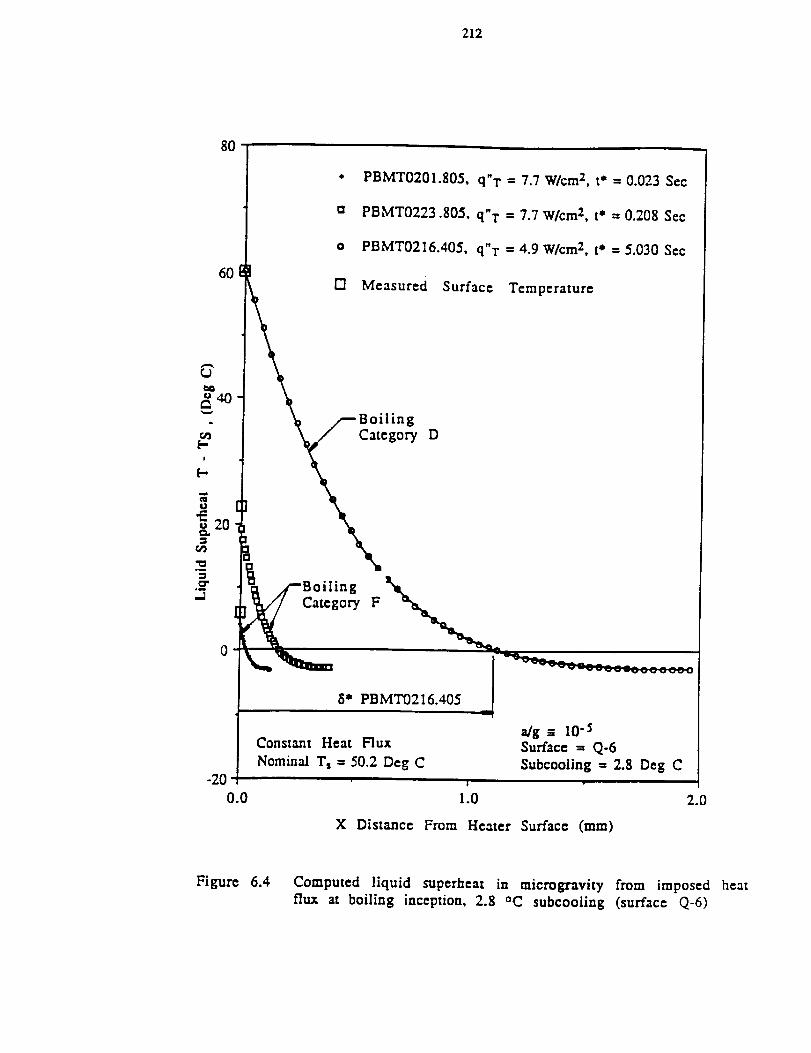
212
80
• PBMT0201.805, q"T - 7.7 W/cm 2. t" -- 0.023 Sec
a PBMT0223.805, q"T - 7.7 W/cm 2, t* = 0.208 Sec
o PBMT0216.405, q"T - '*.9 W/cm 2, t* " 5.030 Sec
60 [] Measured Surface Temperature
. _ _Boiling
.__ _ #'-'Boiling
0 ..... "'_..__
8* PBMT0216.405 _J
-20
0.0
a/g = 10 .5Constant Heat Flux Surface = Q-6
Nominal Ts = 50.2 Deg C Subcooling = 2.8 Deg C
I
i.0 2.0
X Distance From Heater Surface (me)
Figure 6.4 Computed liquid superheat in microgravity from imposed heat
flux at boiling inception, 2.8 °C subcooling (surface Q-6)
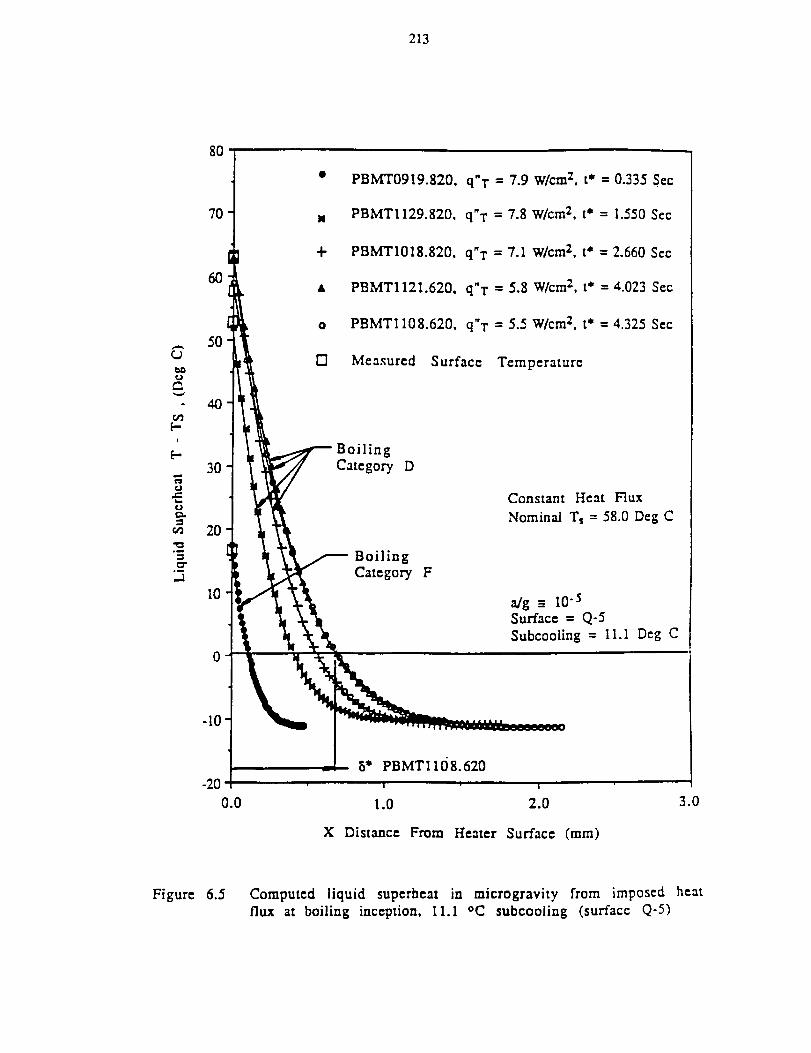
213
O
O_[-
i
t--
O
O
../r,t'2
"3om
.2
8O
70
60
50
4O
30
20
I0
0
• PBMT0919.820, q"l" = 7.9 W/cm 2, t* = 0.335 Sen
N PBMTl129.82D, q"T = 7.8 W/cm 2, t* = 1.550 Sec
+ PBMT1018.820, q"T = 7.1 Wlcm 2, t* = 2.660 Sec
A PBMT1121.620, q"T " 5.8 W/cm 2. t* = 4.023 See
o PBMTl108.620, q"T = 5.5 W/cm 2, t* = 4.325 Sec
r-I Measured Surface Temperature
BoilingCategory D
Boiling
Category F
Constant Heat Flux
Nominal Ts = 58.0 Deg C
a/g _= 10"5Surface = Q-5
Subcooling = 11.1 Deg C
5" PBMT11{J8.620
1.0 2.0
X Distance From Heater Surface (ram)
f.0
Figure 6.5 Computed liquid superheat in microgravity from imposed heat
flux at boiling inception, 11.1 °C subcooling (surface Q-5)
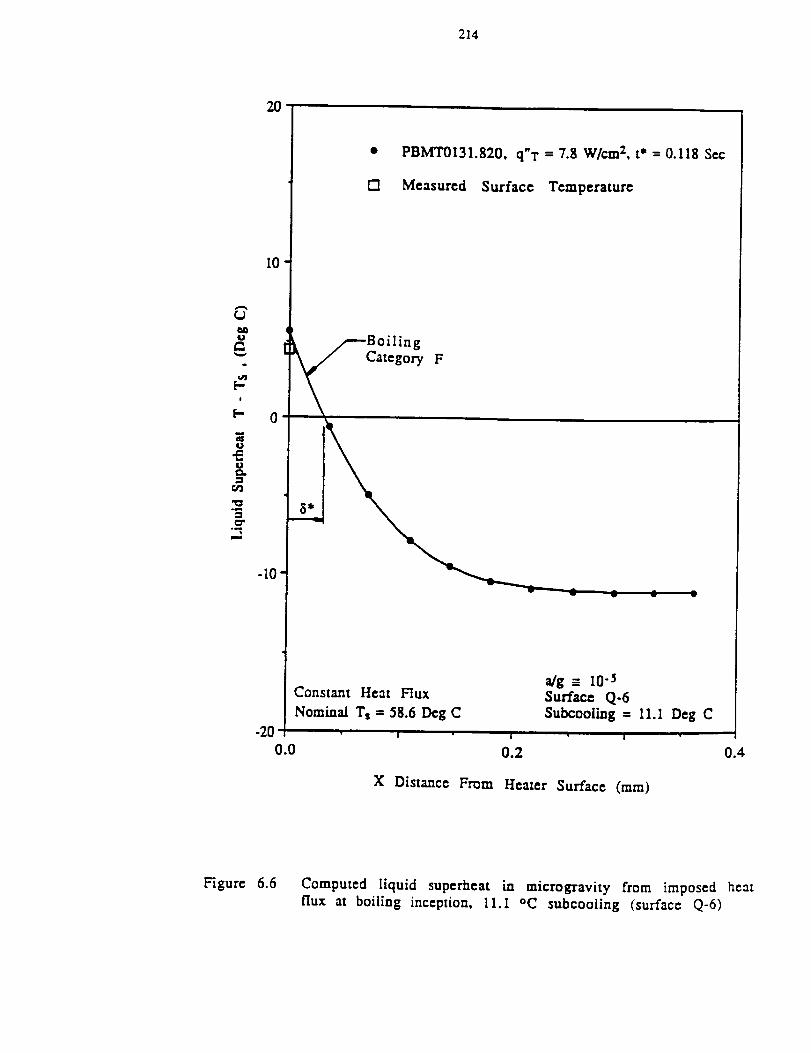
214
_JtJ
6
t*q
t-t
4.}
U
oa.,
20
I0
-I0
• PBMT0131.820. q"T = 7.8 W/cm 2, t* = 0.118 Set;
D Measured Surface Temperature
---Boiling
'/ Category F
Constant Heat Flux
Nominal T$ -- 58.6 Deg C
-20
0.0
a/g -- 10 .5Surface Q-6
Subcoollng = 11.1 Deg C
l 1
0.2 0.4
X Distance Fnam Heater Surface (mm)
Figure 6.6 Computed liquid superheat in microgravity from imposed heat
flux at boiling inception. 11.1 °C subcooling (surface Q-6)

215
O
'* TsO
es_
O
t--
"I'.
8nSuperheated Thermal
Boundary Layer"----'4
-_-- Liquid Temperature
stribution
X distance from theheated surface
Thermal BoundaryLayer
Figure 6.7 The concepts of superheated thermal boundary layer andthermal boundary layer
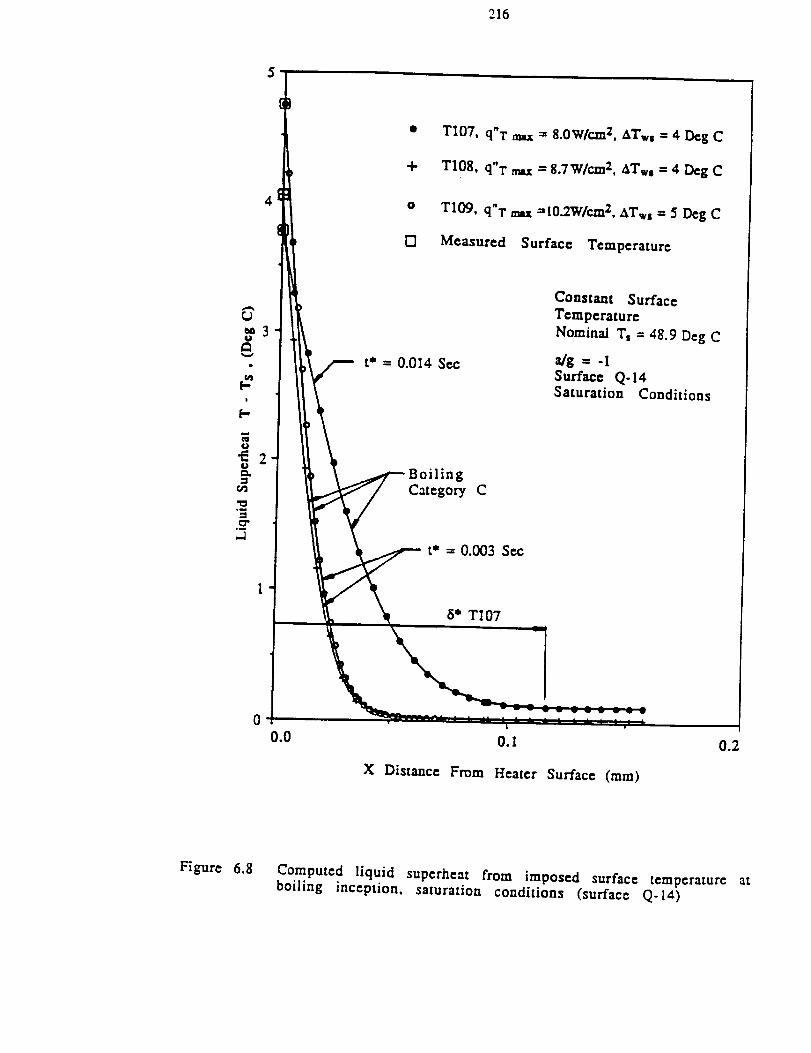
216
TI07. q"T max = 8-0Wlcm2, ATw, = 4 Dcg C
TI08. q"T nax = 8.7Wlcm 2,ATw, = 4 Dog C
T109, q'T mx =10.2W/cm 2, ATws = 5 Dog C
Measured Surface Temperature
u
I
u
ot_
om
,.d
t* = 0.014 See
BoilingCategory C
t* = 0.003 S_
Constant Surface
Temperature
Nominal Ts = 48.9 Deg C
0.0 0.1
X Distance From Heater Surface (ram)
0.2
Figure 6.8 Computed liquid superheat from imposed surface temperature atboiling inception, saturation conditions (surface Q-I_,)
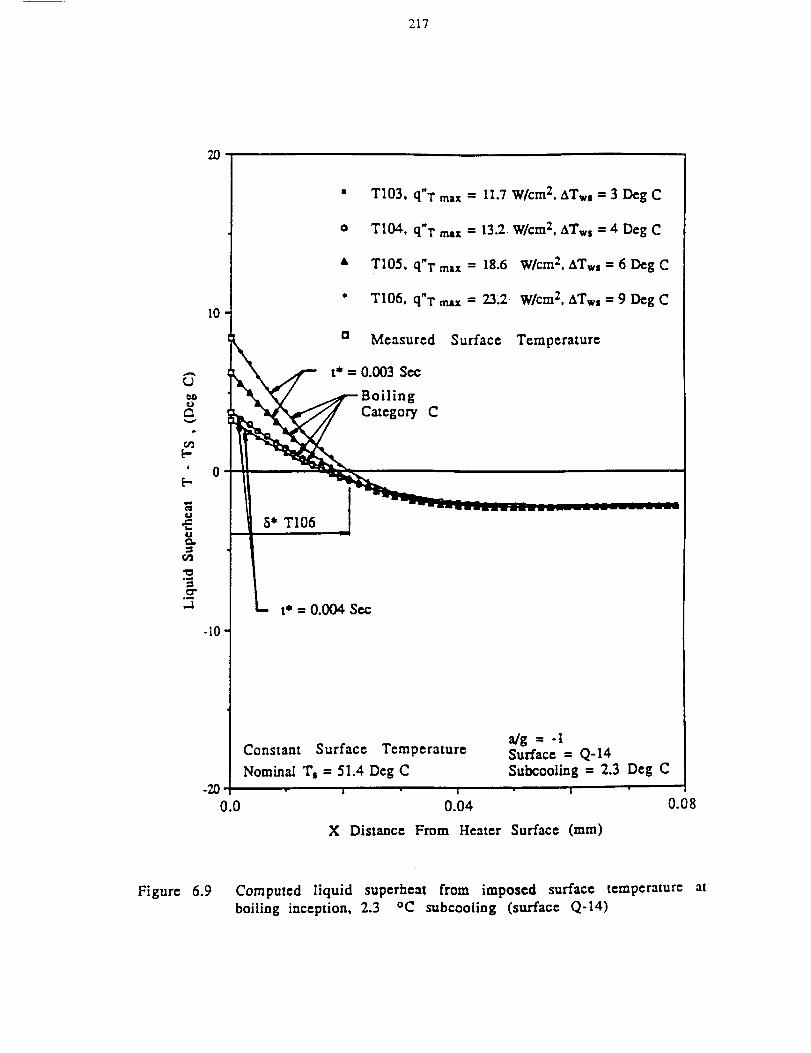
217
20
10
t-
' 0t--
0
U
°_
cr"o_
.1
-10"
0
TI03, q"T max = 11.7 W/cm 2. ATw, - 3 Dog C
TI04, q'T max = 13.2 W/cm 2, ATw= = 4 Deg C
Q
t*= 0.003 Scc
ingCategory C
t* = 0.004 S¢c
Constant Surface Temperature
Nominal T= = 51.4 Deg C
l I
0.04
TI05, q"T m=x = 18.6
TI06, q"T mzx = 23.2
Measured Surface
W/cm 2, ATws = 6 Deg C
W/cm 2, ATws = 9 Deg C
Temperature
X Distance From
a/g = -1Surface = Q-14
Subcooling = 2.3 Deg C
1
0.08
Heater Surface (mm)
Figure 6.9 Computed liquid superheat from imposed surface temperature at
boiling inception, 2.3 °C subcooling (surface Q-14)
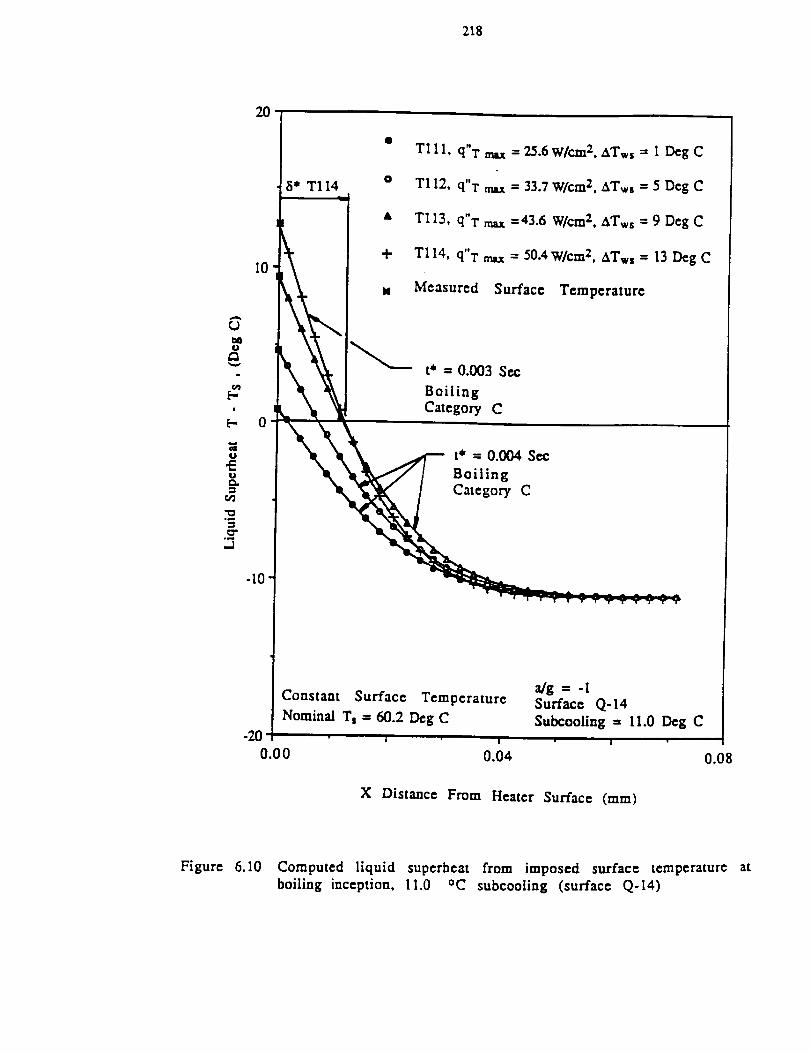
218
o
t_
[-!
o
o
.m
2O
10
0
-10
T111, q"T max = 25.6 Wlcm 2, aTws = 1 Deg C
o T112, q"T max = 33.7 W/cm 2, ATw, = 5 Deg C
• Tl13, q'T max =43.6 W/cm 2, aTws = 9 Deg C
+ T114, q"T max = 50.4 W/cm 2, ATws = 13 Deg C
M Measured Surface Temperature
t* -0.003 Sec
BoilingCategory C
t* -- 0.004 Sec
BoilingCategory C
Constant Surface Temperature
Nominal Ts = 60.2 Deg C
-2(]
0.00 0.04
a/g = -1Surface Q-14
Subcooling = 11.0 Deg C
0.08
X Distance From Heater Surface (ram)
Figure 6.10 Computed liquid superheat from imposed surface temperature at
boiling inception, ll.0 °C subcooling (surface Q-14)
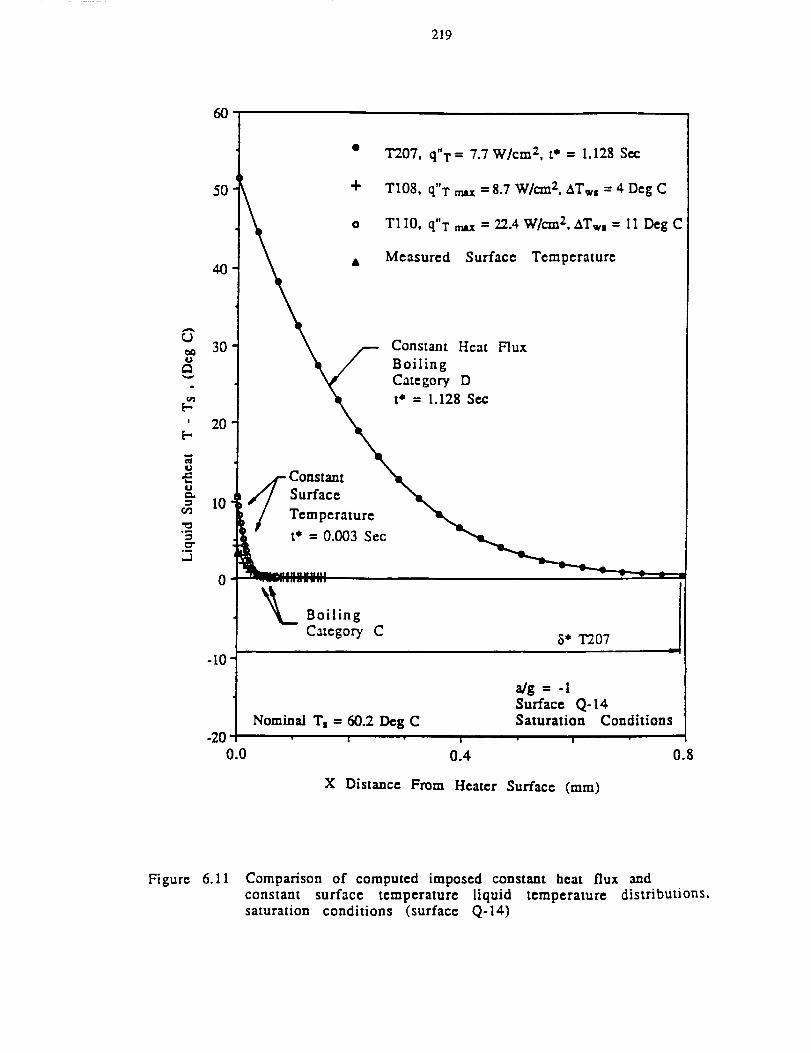
219
6O
50
4O
T2070q"T- 7.7W/cm2, t* = 1.128 Se¢
T108, q"T max = 8.7 W/cm20 ATws = 4 Deg C
Tl10, q"T rrax = 22.4 W/cm2, ATw_ = 11 Deg C
Measured Surface Temperature
L)30
o
t.n
' 20[-
U
O
= 10t#"}
o"
.J
0
-10
-20
0.0
Constant Heat Flux
Boiling
Category D
t* - 1.128 Set:
Constant
// Surface,//Temperature
t* = 0.003 Scc
, -.-:,.::..,
\ BoilingCatcgor7 C
5* T207
Nominal Ts = 60.2 Deg C
a#/g -- -|
Surface Q-14Saturation Conditions
| l I
0.4
X Distance From Heater Surface (ram)
1.8
Figure 6.11 Comparison of computed imposed constant heat flux andconstant surface temperature liquid temperature distributions.saturation conditions (surface Q-14)
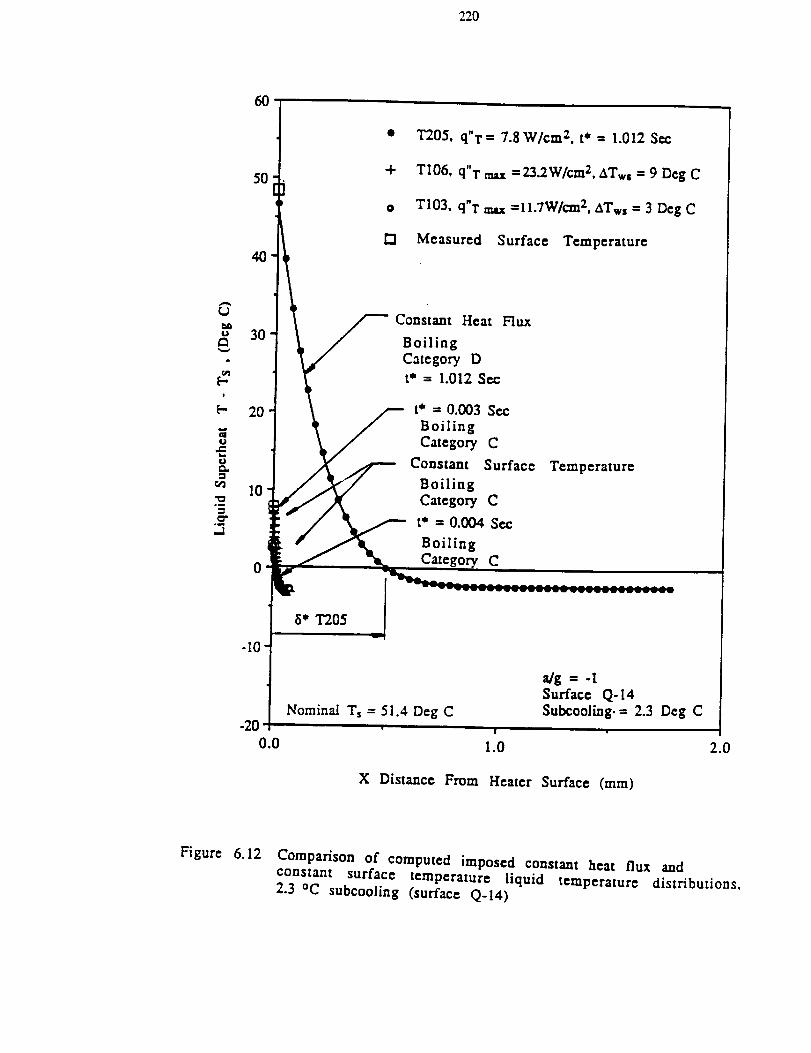
220
6O
5O
4O
• T205, q"T = 7.gWlcm 2,t* = 1.012 Sec
+ TI06, q"T max =23.2W/cm 2,ATws = 9 Deg C
o T103, q"T max =il.7W/cm2, ATws = 3 Dog C
r'1 Measured Surface Temperature
ue_
o
!
b..
o
oe_
.m
o"°u
30
20
10
0
-10
Constant Heat Flux
Boiling
Category D
t* = 1.012 Sec
t* = 0.003 Sec
BoilingCategory C
Constant Surface
BoilingCategory C
t* = 0.004 Sea:
BoilingCategor C
Temperature
Nominal Ts = 51.4 Deg C
a/g = -tSurface Q-14Subcooling. = 2.3 Deg C
mmmmT_
X Distance From Heater Surface (mm)
2.0
Figure 6.12 Comparison of computed imposed constant heat flux
constant surface temperature liquid temperature2.3 °C subcooling (surface Q-14)
anddistributions,
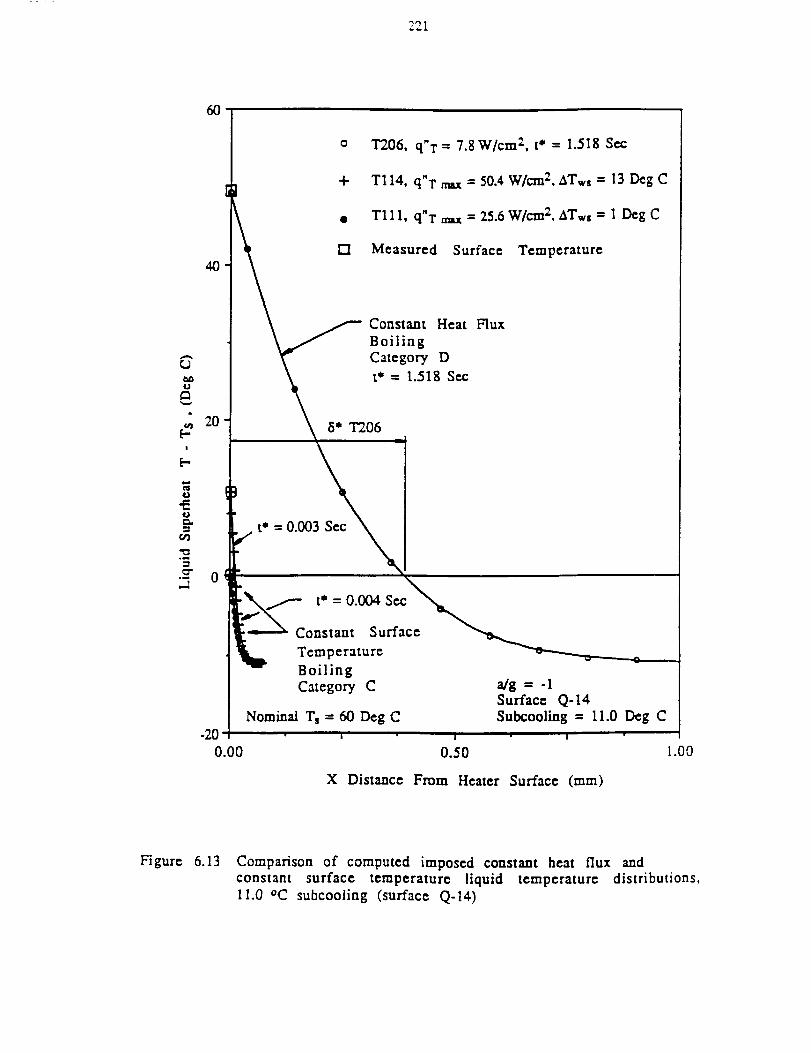
221
60
G
2o!
2 0
o "1"206, q"T = 7.8 W/cm 2, t* = 1.518 Scc
+ T114, q"T max = 50.4 W/cm 2, ATws = 13 Dog C
• T111, q"T mix = 25.6 W/cm a, aT,,, = 1 Dog C
r"t Measured Surface Temperature
Constant Heat Flux
BoilingCategory D
t* = 1.518 Scc
"I"206 -=
= 0.003 Sec_t*
t%.
j Boiling
Category C a/g = -1Surface Q-14
Nominal Ts = 60 I_g C Subcooling = 11.0 Dog C-20
0.00 0.50 1.00
X Distance From Heater Surface (ram)
Figure 6.13 Comparison of computed imposed constant heat flux andconstant surface temperature liquid temperature distributions,
ll.O oC subcooling (surface Q-14)
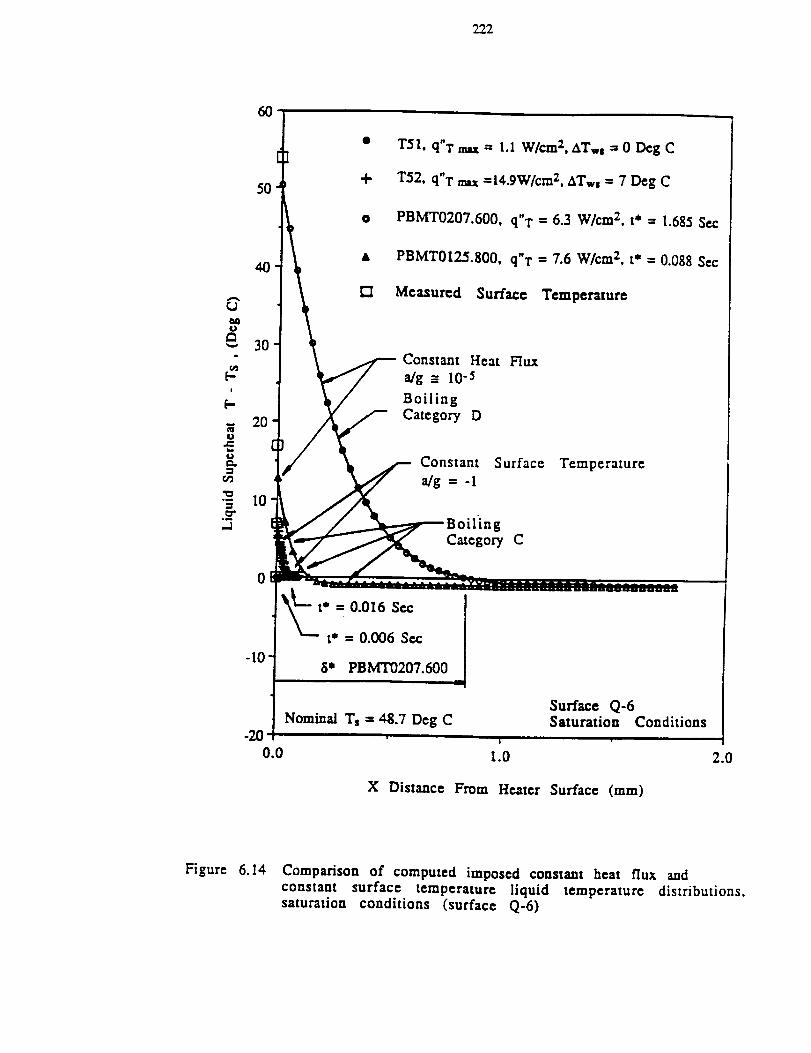
222
6O
5O
4O
_ooe_,-. 30
¢,nI-t
{-
20u
u
=
0
-10
+
0
-20
_t" 0.016 Sec=
t* = 0.006 Sec
I"51, q"T max = 1.I W/cm 2, ATws = 0 Deg C
I"52, q"T max =[4.9W/cm 2, ATw, = 7 Deg C
PBMT0207.600, q"T = 6.3 W/cm 2, t* = 1.685 Sec
FBMT0125.800, q"T = 7.6 W/cm 2, t" = 0.088 Sec
Mcasurcd Surface Temperature
8" PBMT0207.600
Nominal Ts = 48.7 Deg C
Constant Heat Flux
a/g _= I0-5
BoilingCategory D
Constant Surface Temperature
a/g = -1
ingCategory C
Surface Q-6Saturation Conditions
0.0 1.0 2.0
X Distance From Heater Surface (mm)
Figure 6.14 Comparison of computed imposed constant heat flux andconstant surface temperature liquid temperature distributions.
saturation conditions (surface Q-6)
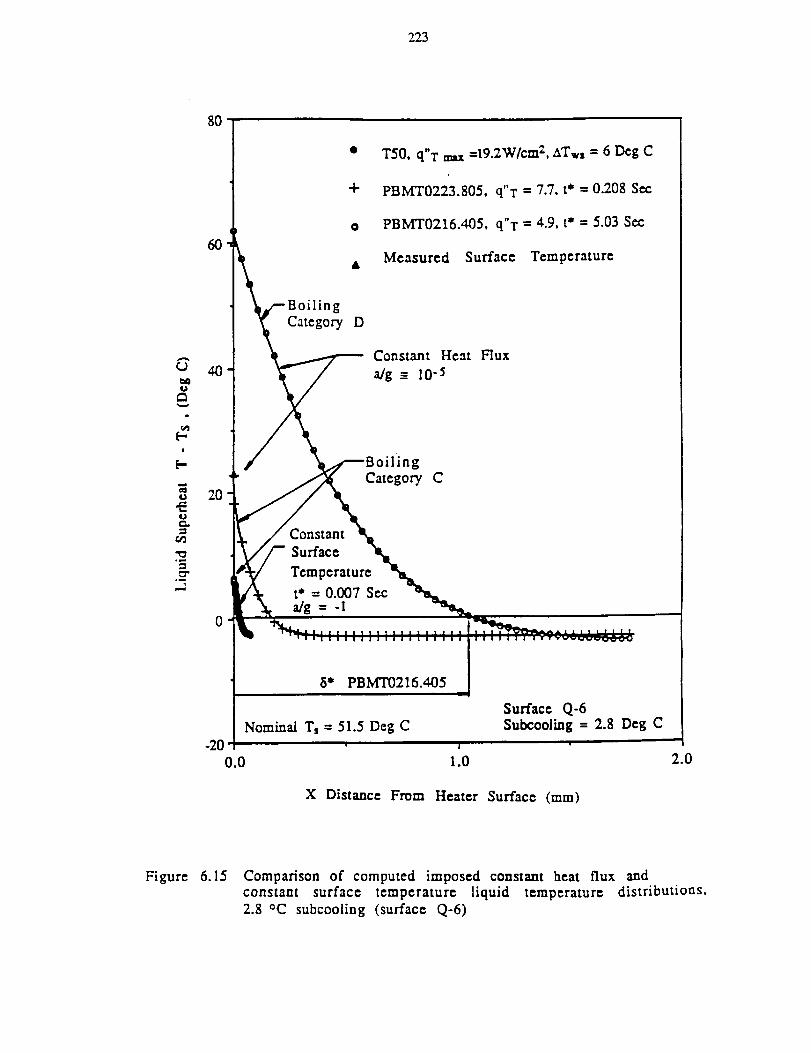
223
T50, q"T max =19-2W/cruz, ATws = 6 Dog C
60
+ PBMT0223.805, q"T = 7.7, t* = 0.208 See
PBMT0216.405, q"T = 4.9, t* = 5.03 See
Measured Surface Temperature
[-!
[-
U
U
°m
,..n
,.d
40
20
0
BoilingCategory D
Constant Heat Flux
a/g _.= 10-5
gCategory C
Constant
Surface
Temperature
t* = 0.007 Seea/g = -I
8* PBMT0216.405
Nominal Ts = 51.5 Deg C
-20 "
0.0
T
1.0
Surface Q-6Subcooling = 2.8 Deg C
2.0
X Distance From Heater Surface (ram)
Figure 6.15 Comparison of computed imposed constant heat fluxconstant surface temperature liquid temperature
2.8 °C subcooling (surface Q-6)
anddistributions,
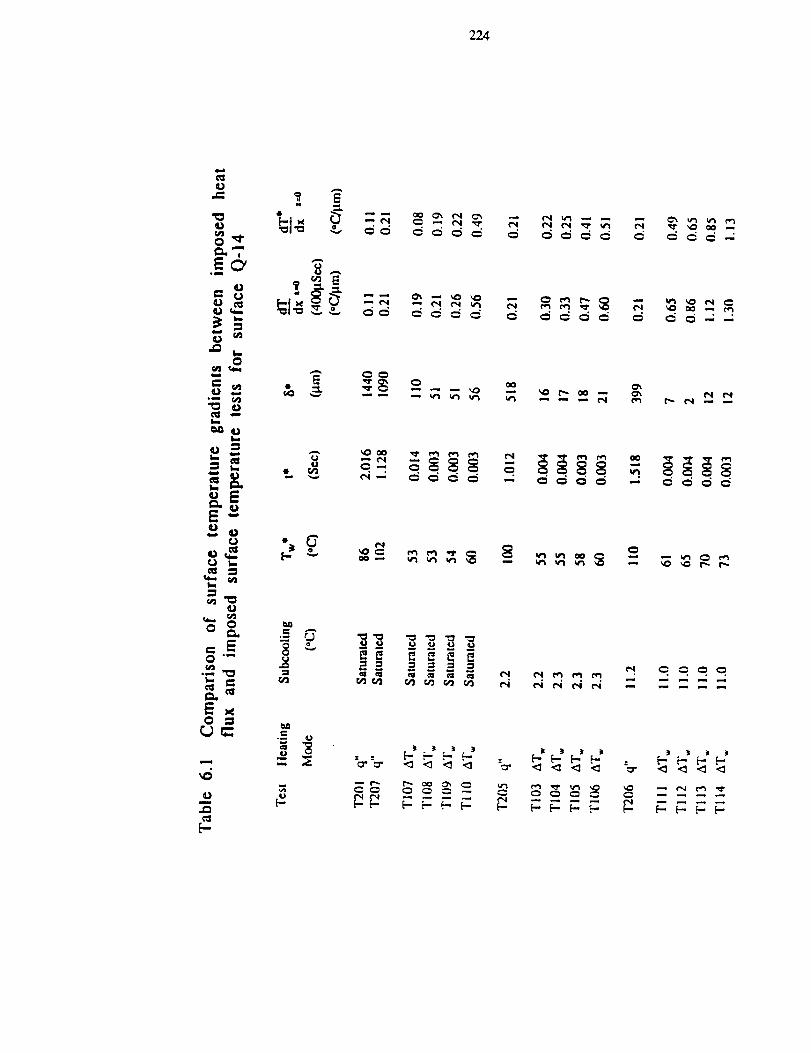
224
Ii
o'- ._ _-__ =_---_=
[--
31 3 3 33 3 3

m
c_
0w
o_
o_
_J
J_
0
o
E°_
0
0o_
Q
°_
m
C4
0
E-
o
owL'I
° _ _
"cO EE
o
o
°_
o.0o 00
0
°o00_0+_o0_oooo°°0_
0°o°_+o0._.o_o°oo_
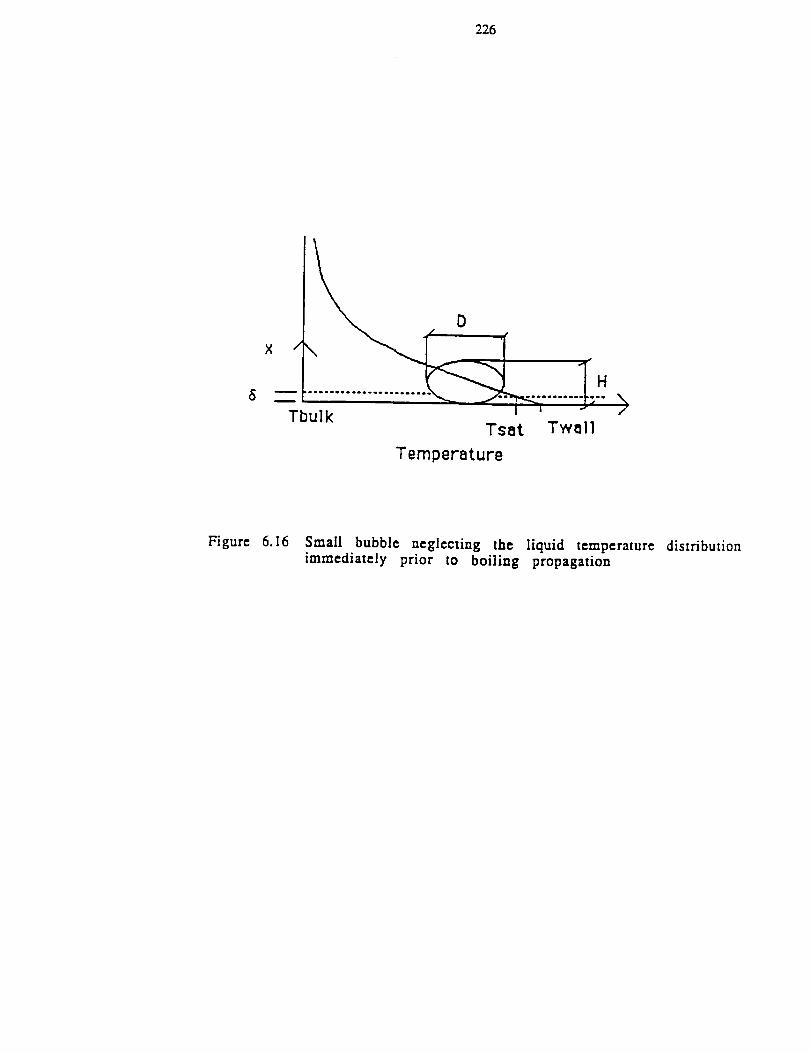
226
X /
_ \
Tbulk /"
./' D T¢'
Tsat Twall
Temperature
Figure 6.16 Small bubble neglecting the liquid temperature distributionimmediately prior to boiling propagation
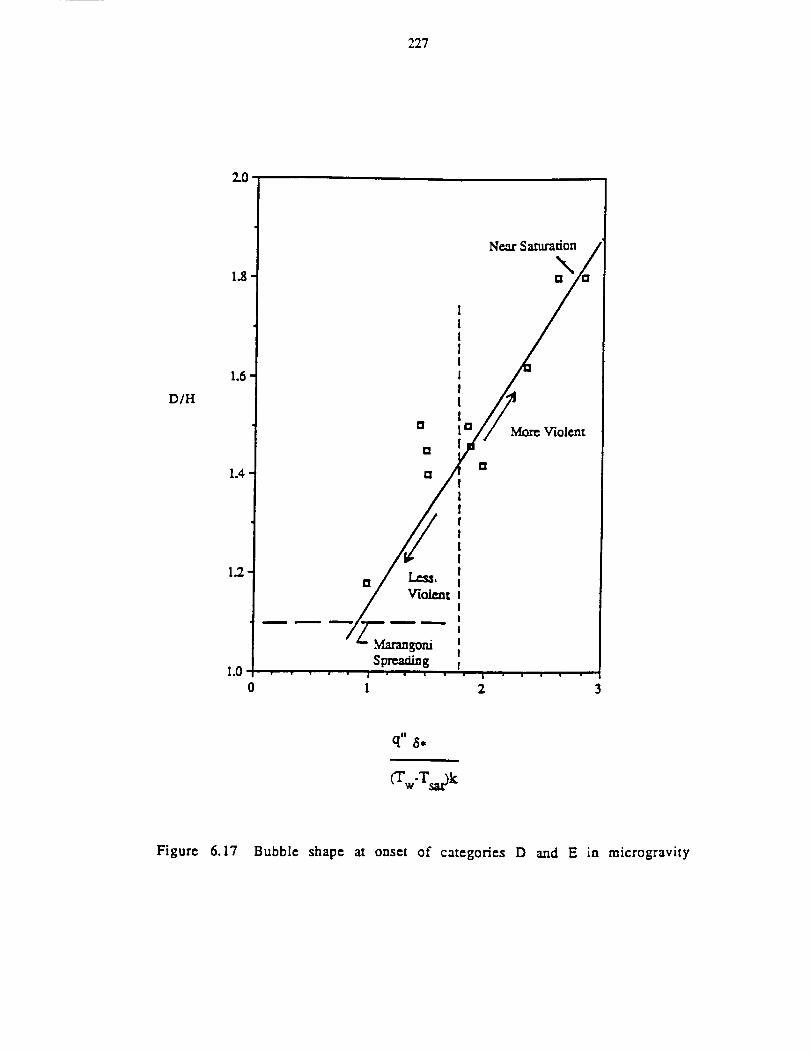
227
Neat" Saturanon
D/H
I a More Violent
[1
131.4 M
!If[I!I
1.2 _, I
Violent J!
!
!Marangoai ISpreading f
1.0
0 I 2 3
Figure 6.17 Bubble shape at onset of categories D and E in microgravity

228
Rayleigh Solution
PBMT1101.600 Measurements
0.0
0
Thermal Diffusion Solution
2 4 6
Time (reSet)
Figure 6.18 Comparison of measured bubble growth from test
PBMTll01.600 with the Rayleigh solution and thermal diffusionsolution

229
Liquid
/// //_
Heater Surface
_ apor
Mass
// // // / / / // // / /
Side View
Effective Radius of Figure 6.18 =2
Figure 6.19 Definition of effective bubble radius
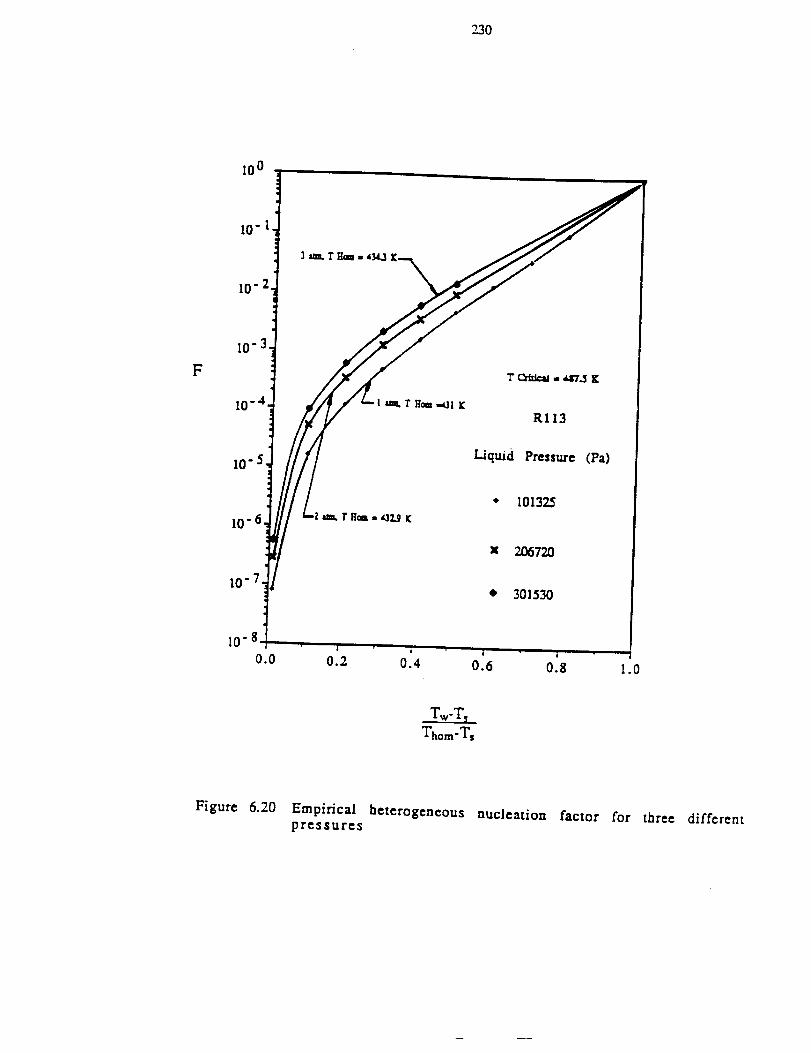
230
I0o
I0"2,
F
i0-3,
i0 -4.RII3
I0"5
i0"6,
I0"7
Liquid Pressure (Fa)
• 10132.5
• 301530
Tw-T:
Thom-Ts
Figure 6.20 Empirical heterogeneous nucleation factor for three different
pressures

231
APPENDICES
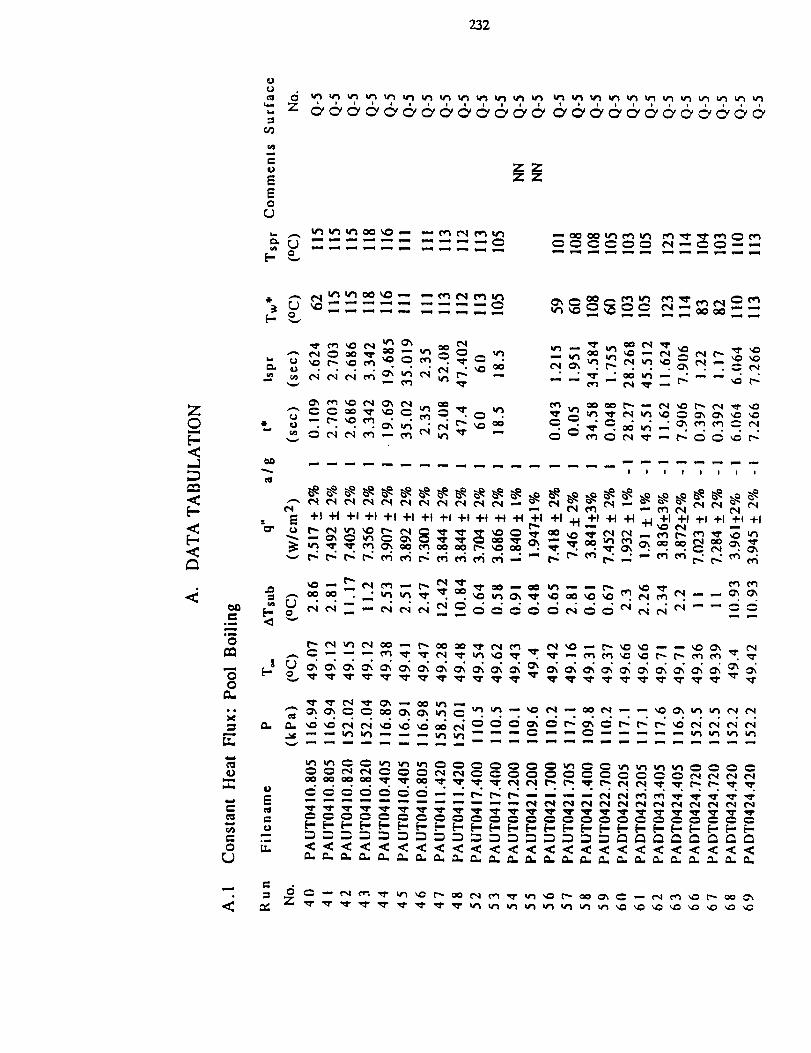
232
_'_ ......... =
• = Z
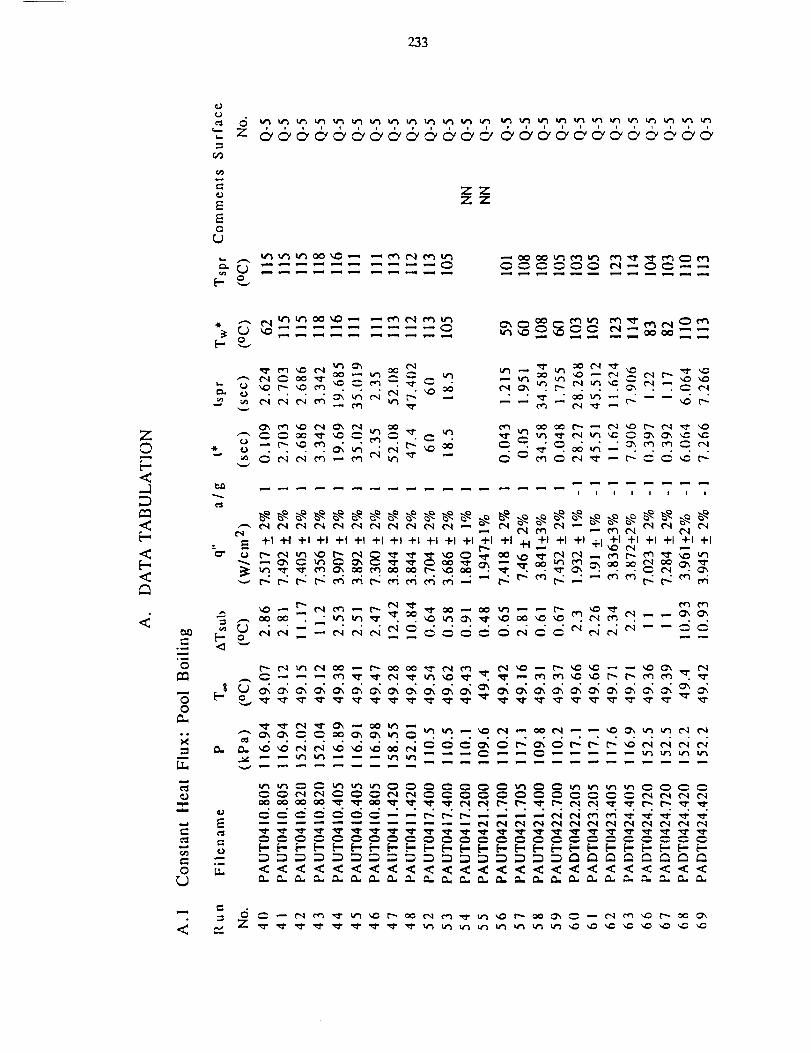
2.33
Z©
<,-]
<
<
<
[-.,
0
00
O.
,-j
r',.o
<
c::r.
IIIIIIII
+_ _ +1 +1 +1 +1 +1 +1 +1 +1 +1 +l +1 +1 _ +1 +1 _ +1 +1 +1 +1 +1 +l +t
_ _m_m__ . . ._ ....
E
LL
°........ .......
. • • ° ° ° . ° .
<<<<<<<<<<<<_<<<<<<<<<<<
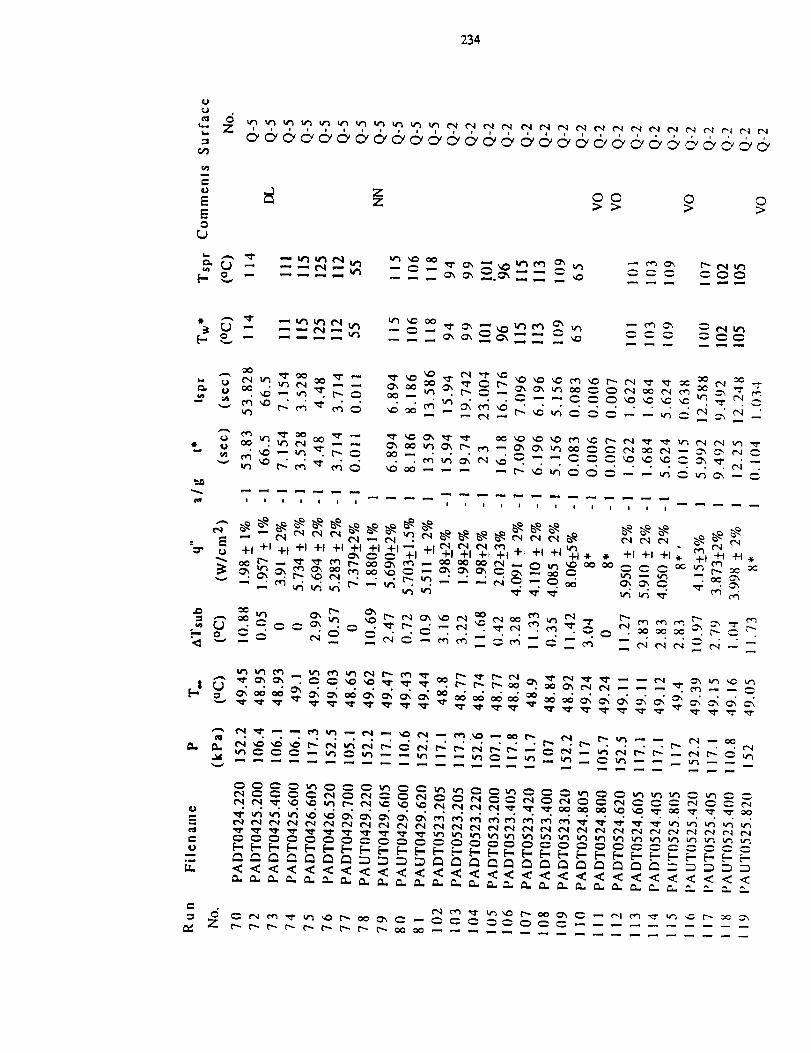
234
. --_ __
IIIIIII
:_ _ +i +I +i +I +I +I +I +I
_--__._ ..
_._..._
_ ° , • •
U
(,x.
lllllllllllll
o
_ I+_+_+,+,+ +_+_+_ +_+,+_, +_ .
....
• , ° ° o ° ° ° • • . • ° . ° • • ° ° , ...... o • ,

235
U
¢d,6z
EE0
M
¢.)
.n. _1
c,_
= E
¢#1
%-
l.}
it_
-, ciZ
___ .... ._ .......
IOllllllll
+' +'7, +' +,_+'+i_+'+' +' +' 7, +' +_+' +' +' * +, +I +,% _, _, &, +,% % +,
_ "__ ...... • • ._
-. . . ._-_ _ _ -.... _. _.
....... °ooo°ooo ....... • ......
< <<<<<<<<<<<<<< <<<<<<<<<<<<<<
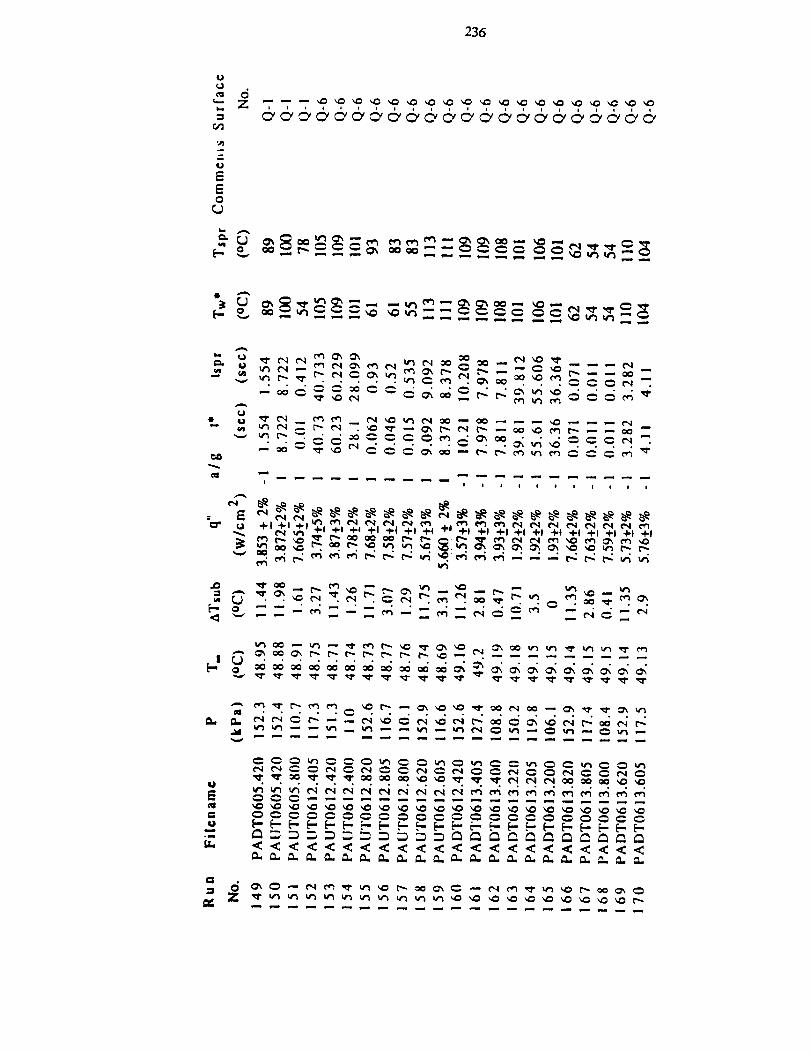
236
¢.JdZ
l.J
E
0
I
U 4-I 4-1 ÷1
_ _ • ,
e,.i m r'_
• • _--_
lllllllllll
• , • " • • " •
_L
Ill
[L
..... o .... • ..........
V
• ..... , ......... ° .....
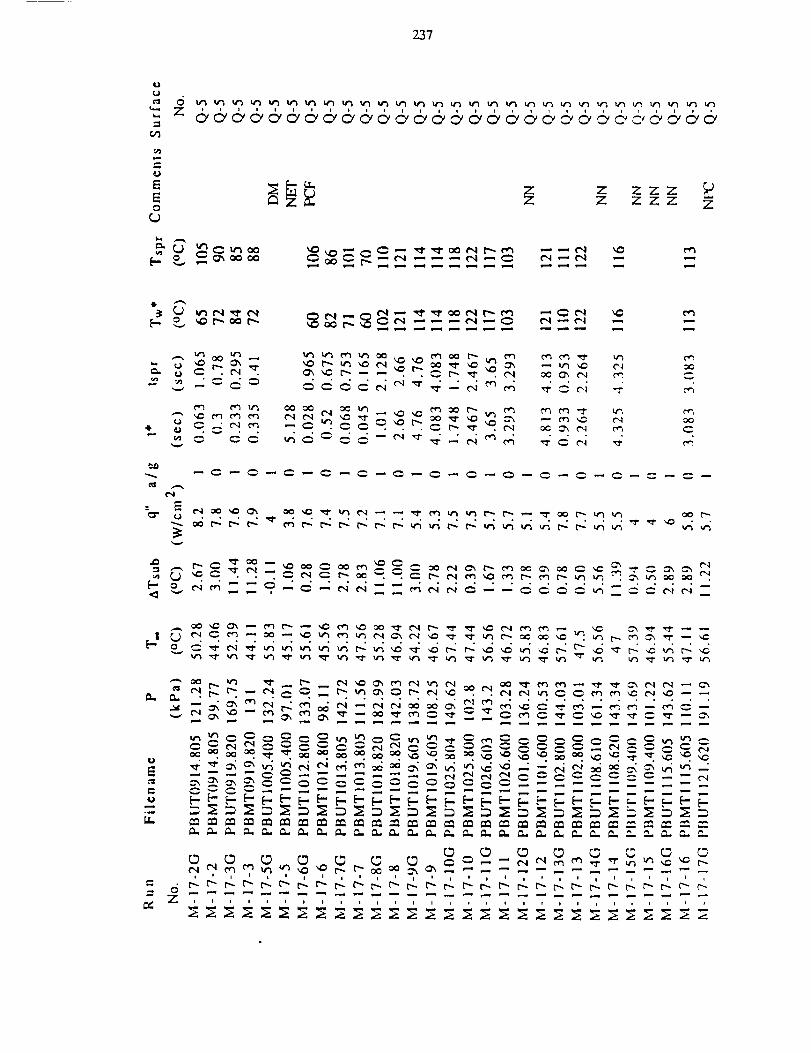
237
e.o
z,,-t
r._
U
E0
_ z z zzz ';2Z Z zzz Z
--, _ _ _,-_"_ ",,_ _... -- _, . .
° _ . ° ° ._._ _ _ C
---__ _ _ _
• ° • ° • ° ° ° ° ° ° ° ° ° ° ...... • .... o
! • ° . ° . • • .............. . ....
_L
t-
_ _ _ _ _ _ . ._ _ __ _ _ _ _
....... ............
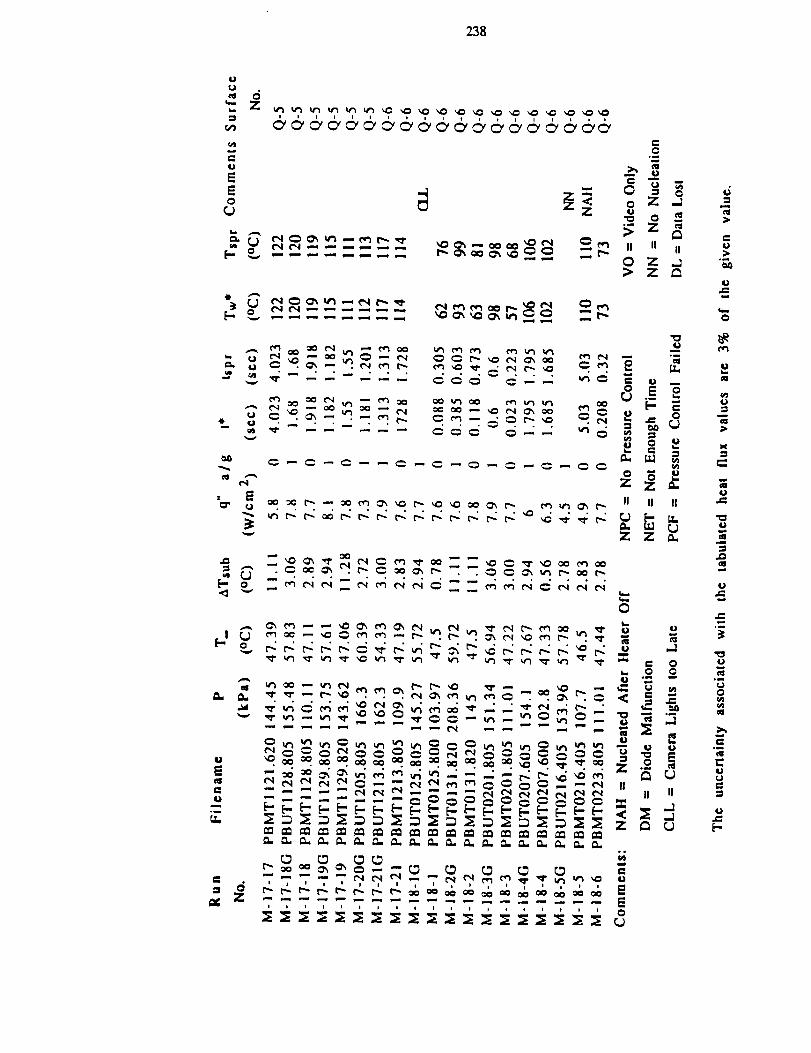
238
U
m.I
= --T s_s ii_ s
,m
0
e_°_
u
b,
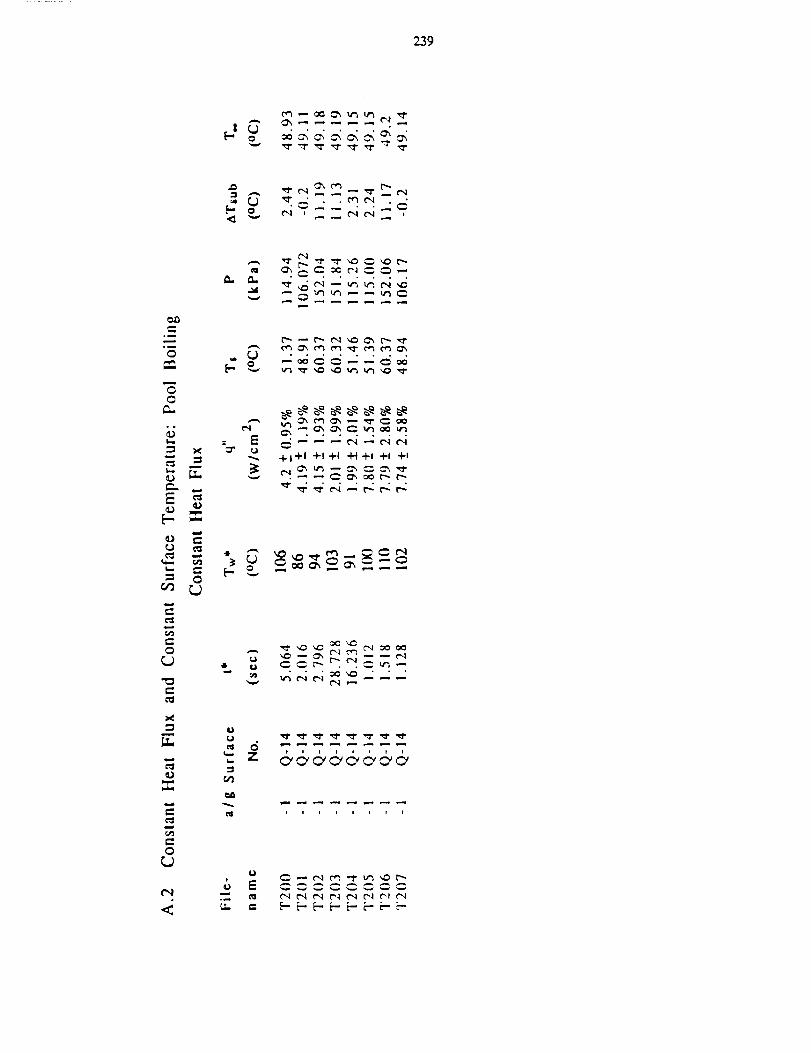
239
°_
0
m
0
0
I--.
I.. m
[-- --
m
÷i+I +I+I _ +I +I +i
0
r_
0
C,.,)
0
w
: z &&&&&&&&
IIIIIIII
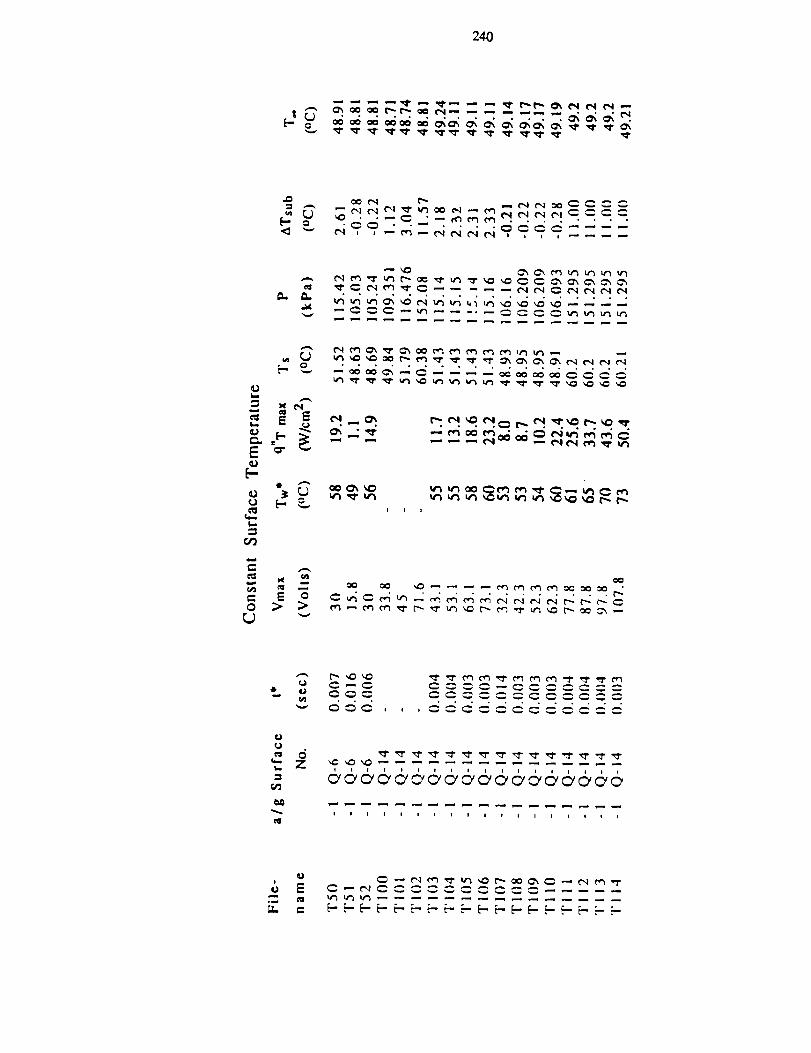
240
• • • . • ° , • . . * . ° , •
.0
• ._'__ .... ...."_ ....... 0_ _ ....
o.. .... o ...... ° ......
t-.
_=
[-.
m
¢-
r,,.) ""
* I
U
_ Z
$llillllllellltttl
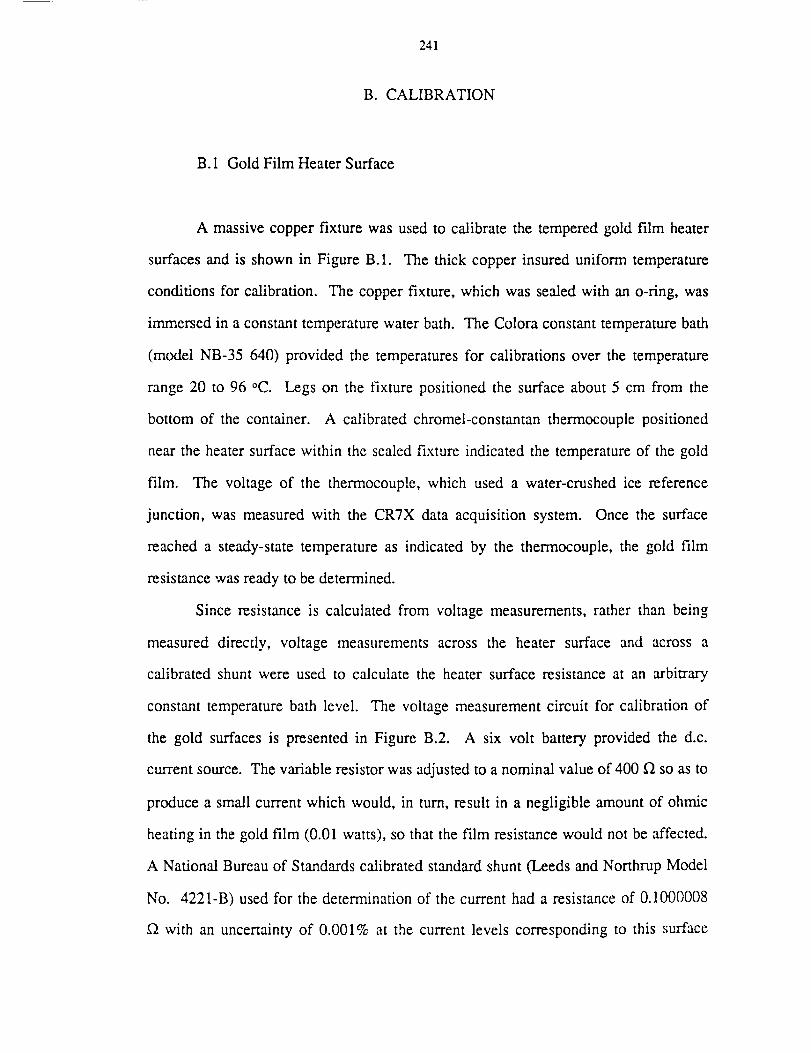
241
B. CALIBRATION
B.1 Gold Film Heater Surface
A massive copper fixture was used to calibrate the tempered gold film heater
surfaces and is shown in Figure B. 1. The thick copper insured uniform temperature
conditions for calibration. The copper fixture, which was sealed with an o-ring, was
immersed in a constant temperature water bath. The Colora constant temperature bath
(model NB-35 640) provided the temperatures for calibrations over the temperature
range 20 to 96 °C. Legs on the fixture positioned the surface about 5 cm from the
bottom of the container. A calibrated chromel-constantan thermocouple positioned
near the heater surface within the sealed fixture indicated the temperature of the gold
film. The voltage of the thermocouple, which used a water-crushed ice reference
junction, was measured with the CR7X data acquisition system. Once the surface
reached a steady-state temperature as indicated by the thermocouple, the gold film
resistance was ready to be determined.
Since resistance is calculated from voltage measurements, rather than being
measured directly, voltage measurements across the heater surface and across a
calibrated shunt were used to calculate the heater surface resistance at an arbitrary
constant temperature bath level. The voltage measurement circuit for calibration of
the gold surfaces is presented in Figure B.2. A six volt battery provided the d.c.
current source. The variable resistor was adjusted to a nominal value of 400 f2 so as to
produce a small current which would, in turn, result in a negligible amount of ohmic
heating in the gold film (0.01 watts), so that the film resistance would not be affected.
A National Bureau of Standards calibrated standard shunt (Leeds and Northrup Model
No. 4221-B) used for the determination of the current had a resistance of 0.1000008
f2 with an uncertainty of 0.001% at the current levels corresponding to this surface
242
calibration, as stated by the calibration certificate. The CR7X determined the voltages
across the thin film and the shunt. A typical gold film calibration is shown in Figure
B.3, and the coefficient of determination, described in Montgomery (1983), for this
linear fit of the resistance and temperature is unity.
B.2 Thermocouples
Sections of a chromel-constantan thermocouple spool were calibrated
individually. Copper extension wires were used between the thermocouple wires and
the water-crushed ice reference junction, both during calibration and during use. Each
set of thermocouple wire and extension wires were numbered for identification
purposes. A Colora constant temperature bath provided the variable temperature for
comparison with a platinum resistance thermometer, while a hypsometer at
atmospheric pressure provided the steam point. Using a Mueller Temperature Bridge
(Leeds and Northrup Model 8067) with a null detector, the resistance of the platinum
element was measured to an accuracy of + 0.0001 f_, which corresponds to an
uncertainty in the temperature of the platinum resistance thermometer of + 0.001 °C.
The output of the thermocouples were measured using a Leeds and Northrup K-5
potentiometer with a built-in null detector. The sensitivity in measuring this voltage is
within + 0.1 I.tV.
B.3 Pressure Transducers
A Ruska Pressure Dead Weight Calibration System (2400 Series dead weight
gage) was utilized in the calibration of the Heise pressure transducers used in the
laboratory boiling vessels and the Setra pressure transducer for the drop vessel. The
uncertainty in the pressure level provided by the Ruska system was + 0.0017 kPa (2.
243
0.0003 psi) for the pressure range of the present study: 96 to 172 kPa (14 to 25 psi).
A schematic of the Ruska system and measurement circuitry for the pressure
transducer calibration appears in Figure B.4. A representative calibration curve is
shown in Figure B.5. The Ruska system was also used for calibrating a Heise
Bourdon tube gage, which in turn was used for in-place periodic checks on the
pressure transducer calibration. In Figure B.4, a precision pressure regulator was
connected to the pressure transducer being calibrated, which was in turn connected to
the dead weight system. Since the mass of the weights were known accurately along
with an accurate determination of g, the pressure transducer signal measured by the
multimeter or K-3 potentiometer could be correlated with the known pressure from the
dead weight tester.
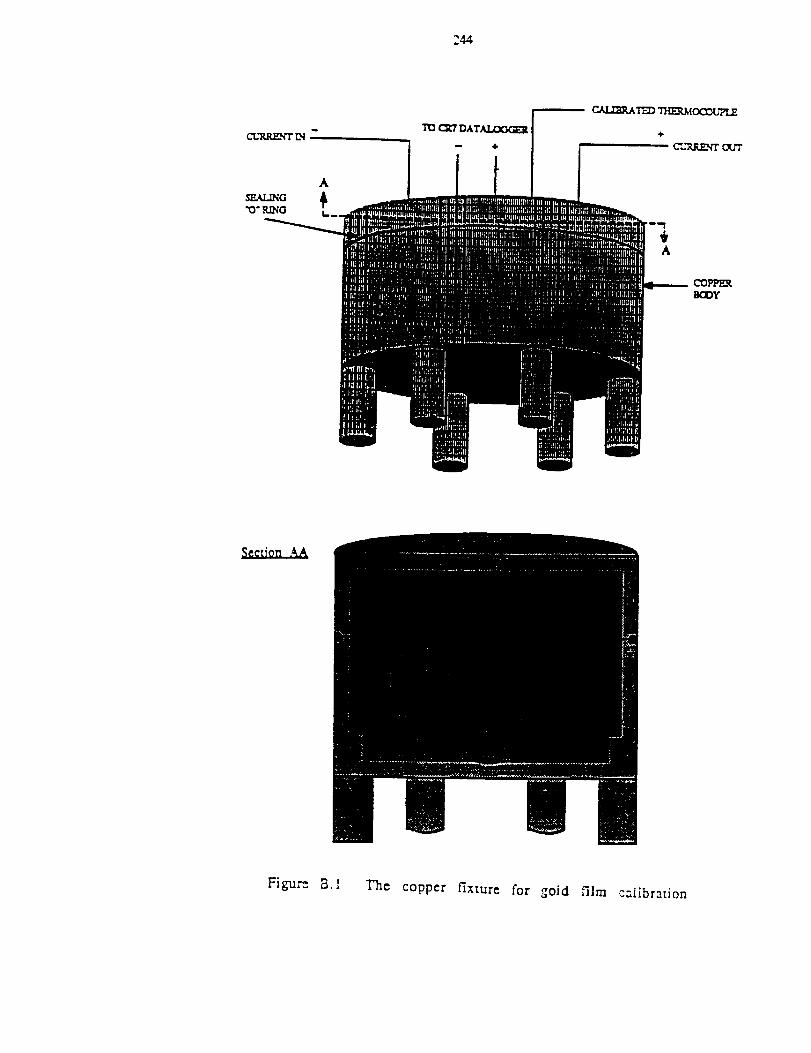
244
A
Figure B.I The copper fixture for _oid film calibration
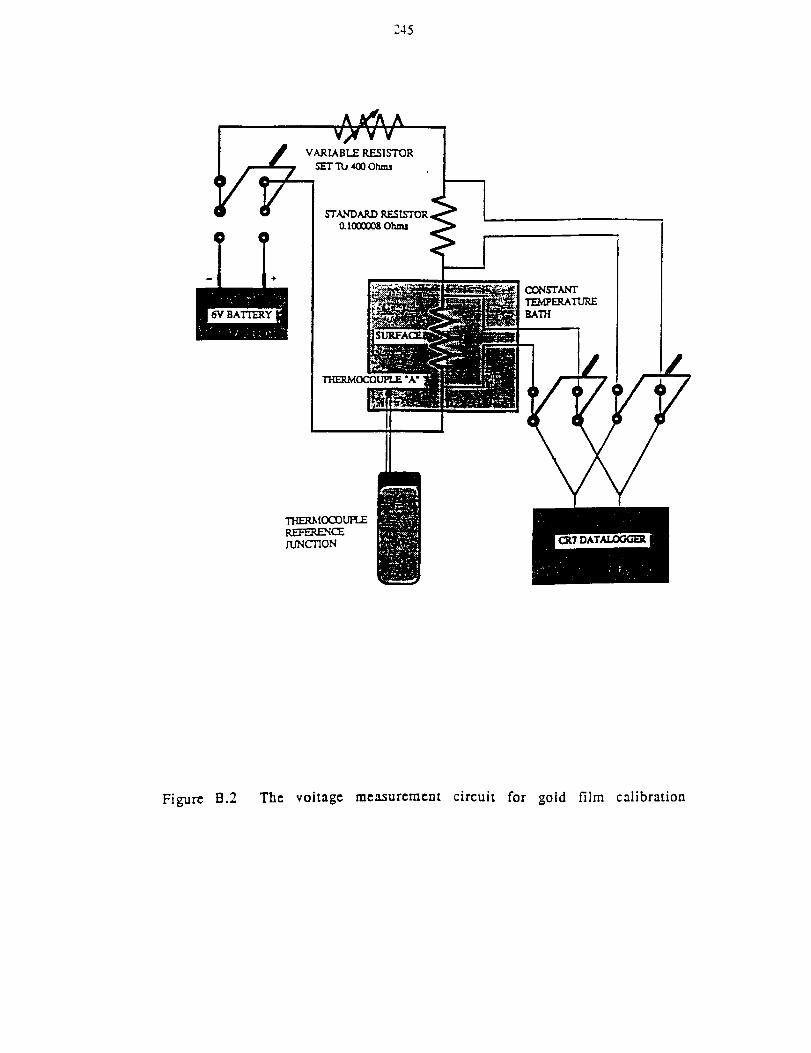
245
VARIABLE RESISTOR
0.I000008Olm_
TI-IERMOCOUPLE "A"
CONSTANTTEMPERATUREBATH
THERMOCOUR_RKF£Rm_
JUNCTION
Figur_ B.2 The voltage measurement circuit for gold film calibration
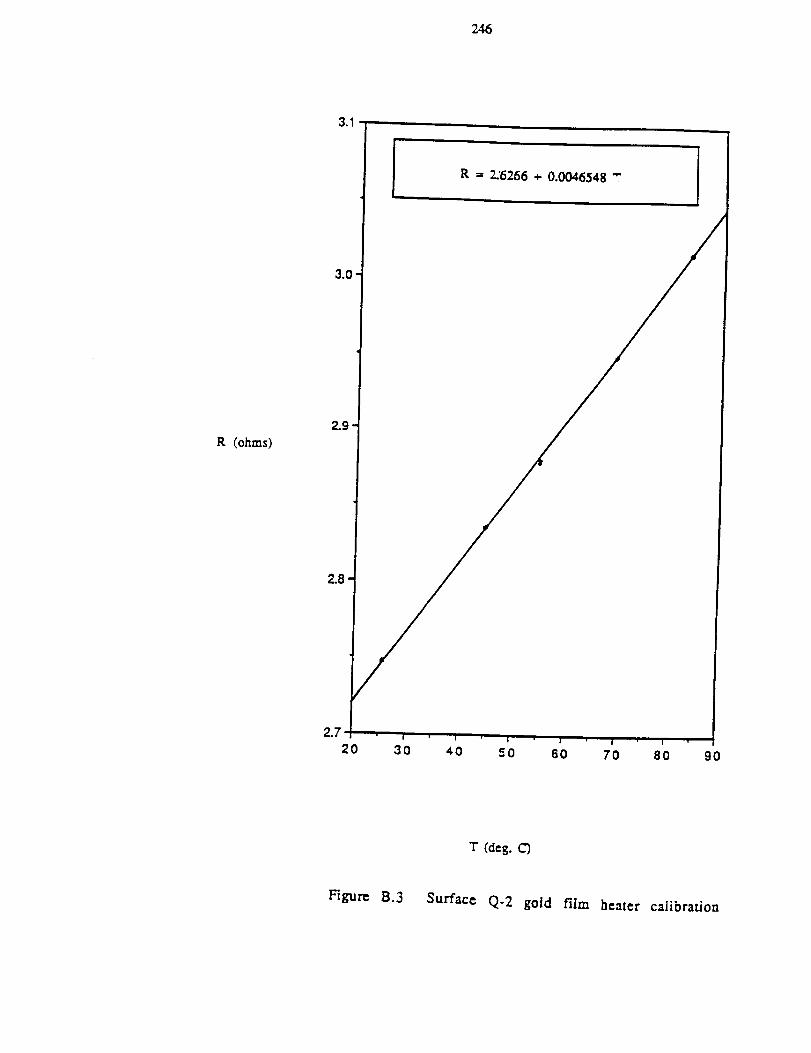
246
R = 2.'6266+ 0.0046548""
R (ohms)
2.7
20 30 40 50 60 70 80 go
T (deg.C)
Figure B.3 Surface Q-2 gold film heater calibrat/on
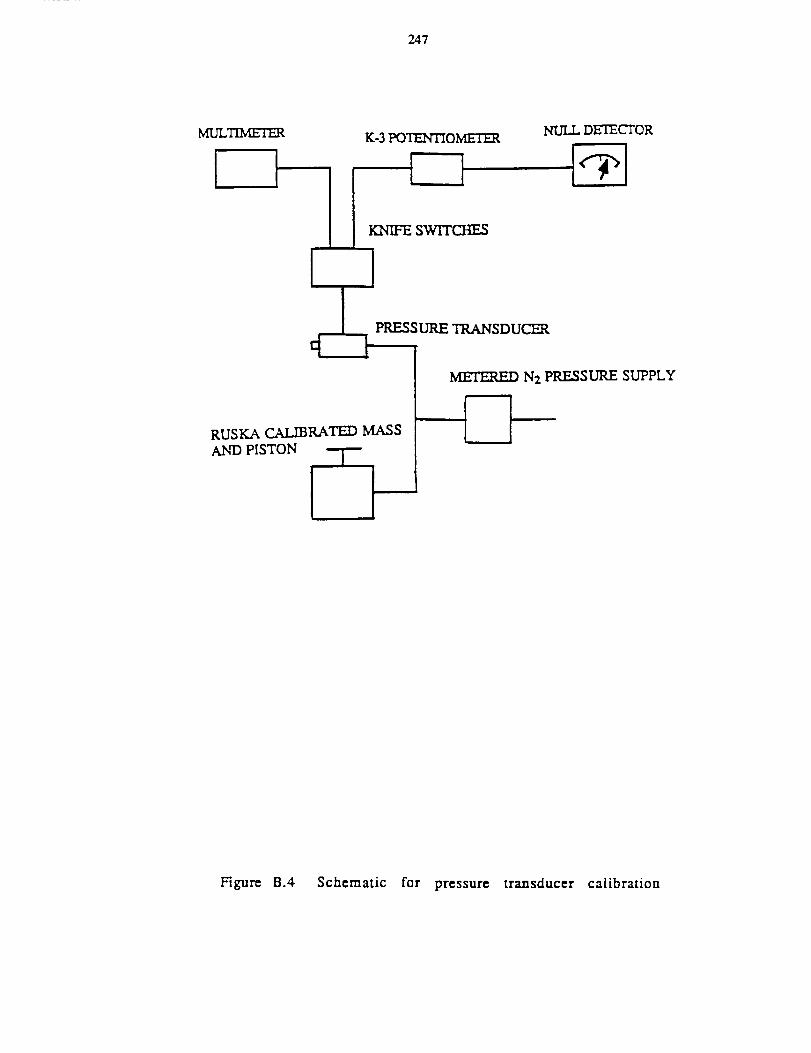
247
MIYLTIMETER
INULL DETECTOR
KNIFE SWITCHES
I ]
METERED N2 PRESSURE SUPPLY
RUSKA CALIBRATED MASSAND PISTON
Pigur_ B.4 Schematic for pressure transducer calibration
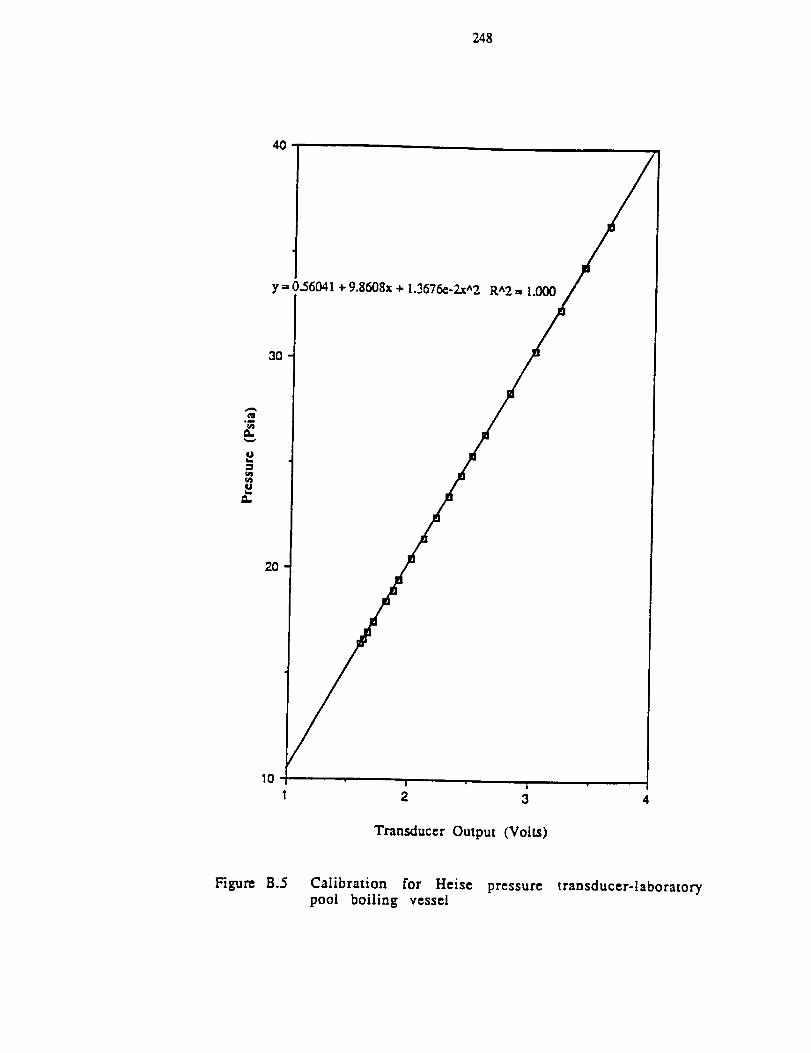
248
4O
y=0.56041+9.8608x÷ 1.3676e-2x^2R^2 --1.000
om
ot-
ut...
n..
Transducer Output (Volts)
Figure B.5 Calibration for Heise pressure transducer-laboratorypool boiling vessel
249
C. CR7X AND CODAS DATA ACQUISITION SYSTEMS
Four tests were performed to determine the performance of the CR7X under
various measuring conditions. The smallest voltages involved in this study were those
of the chromel-constantan thermocouples. The accuracy desired for temperature
measurement was 0.06 °C (0.1 °F) which corresponds to about 3 I.tV. It was found, in
the flu'st test, that an ice reference junction for thermocouples provided much more
satisfactory temperature measurements than with the internal reference junction
compensation of the CR7X. A set of negative and positive terminals were shorted
with a copper wire to establish a condition of zero voltage in a second test. Voltage
readings were taken employing both the fast and slow sampling rates of the instrument
every two seconds at eight different ranges, from the 1.5 mV range to the 5 V range.
It was found that two intermediate ranges, 15 mV and 50 mV, were the most desirable
in terms of accuracy in temperature measurement in the 20 to 60 °C ambient
temperature range.
In the third test, the accuracy of the CR7X with various input voltages for
different ranges and sampling rates was verified. The accuracy at each range and
speed was measured using a K-3 potentiometer (Leeds and Northrup Model 7553-5),
which had a maximum sensitivity of 0.5 _tV, and a null detector (Leeds and Northrup
Model 9834-1), which had a maximum sensitivity of 0.1 microvolts per division, as
the voltage standard. The desired maximum deviation of 3 p.V was not met for all of
the ranges. The ranges of 500 mV to 5000 mV in the slow sampling rate mode did not
meet the 3 laV criterion for any voltage level. The 1.5 mV and the 5 mV range in the
slow sampling rate mode were unable to measure voltages exceeding 5 mV. Hence,
their effectiveness was diminished. For thermocouple measurements, the 15 mV and
the 50 mV ranges were used at the slow sampling rate which had an uncertainty of _+
0.3 _V. The maximum uncertainty on the fast sampling rate mode was + 0.6 gV for
250
the 15, 50, and 150mV rangesat the 49 °C level, which correspondsto a maximum
uncertaintyin temperatureof about+ 0.01°C.
Thedynamicsof theCR7X wereevaluatedin a fourthtestagainsta 7700series
eight channelSanbornrecorder. The Sanborn(with a Model 8803 high gain d.c.
amplifier) and the CR7X were used individually and sequentiallyto measurethe
transientshunt voltage near the voltage level expectedin the transientpool boiling
measurements.For this test, the high gain amplifier of the Sanbornrecorderhad a
sensitivityrangeof I000 _tVperdivision to 1_V perdivision. The Sanbornpre-amp
followed from 10 to 90% of a stepchangein 5 ms. The CR7X and Sanbornvoltage
measurementswerein excellentagreement,asshownin FigureC.1.
Testswere performed with both the CR7X and the Codasdata acquisition
systemin the 50 to 150mV range,therangeof the divided voltagedifferenceacross
the heatersurface,in order to estimatethe uncertaintyin the Codassystemvoltage
measurement.In this voltagerange,therewere differencesof aboutone millivolt in
thevoltagereadingsbetweenthe Codasandthe CR7X with the samed.c. source.As
aresult, theuncertaintyin theCodasvoltagemeasurementsin this voltagerangewere
estimatedto be+ 1 mV.
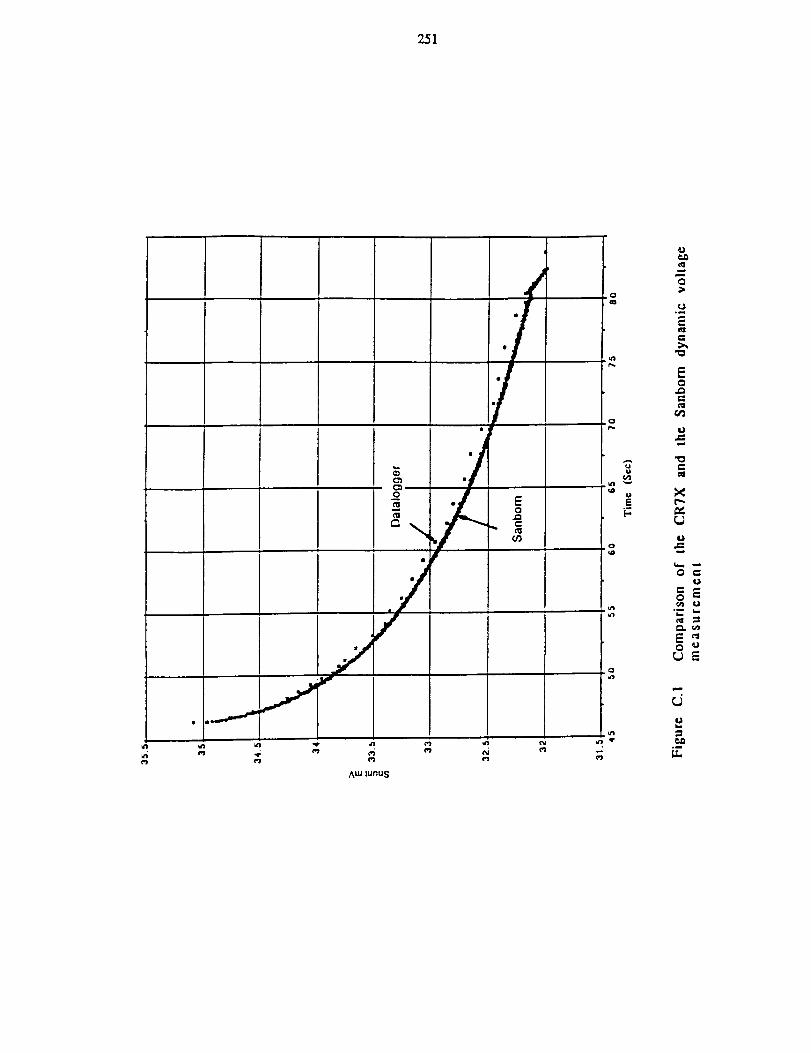
/
c.$
A_ lunus
o
unl
0
c_
0
U°_
E0
r_
w
X
r_
U
0U
0
_._
E_
M
o_
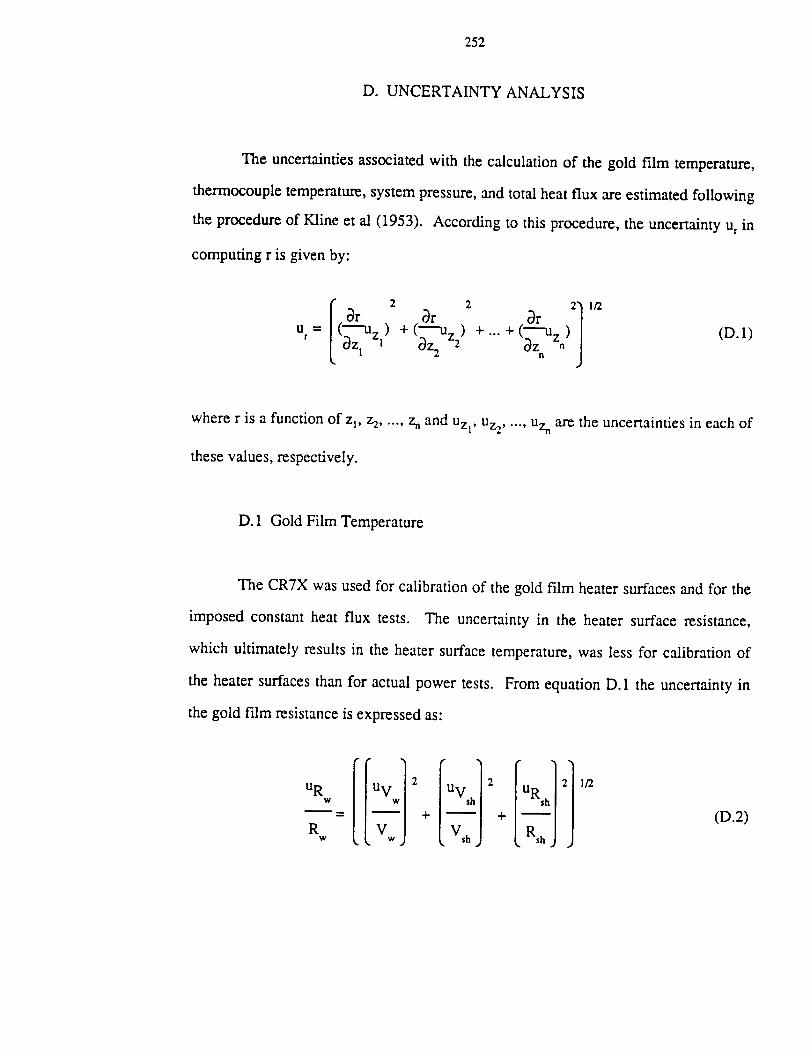
252
D. UNCERTAINTY ANALYSIS
The uncertainties associated with the calculation of the gold film temperature,
thermocouple temperature, system pressure, and total heat flux are estimated following
the procedure of Kline et al (1953). According to this procedure, the uncertainty ur in
computing r is given by:
Or Or 3r 21 la
u = (---"Uz) +( z2) +'"+( z) (D.I)r 0Z 1 1
where r is a function of z 1, z2..... zn and Uzl, u_ ..... Uz, are the uncertainties in each of
these values, respectively.
D. 1 Gold Film Temperature
The CR7X was used for calibration of the gold film heater surfaces and for the
imposed constant heat flux tests. The uncertainty in the heater surface resistance,
which ultimately results in the heater surface temperature, was less for calibration of
the heater surfaces than for actual power tests. From equation D. 1 the uncertainty in
the gold film resistance is expressed as:
u RW
Rw
(D.2)
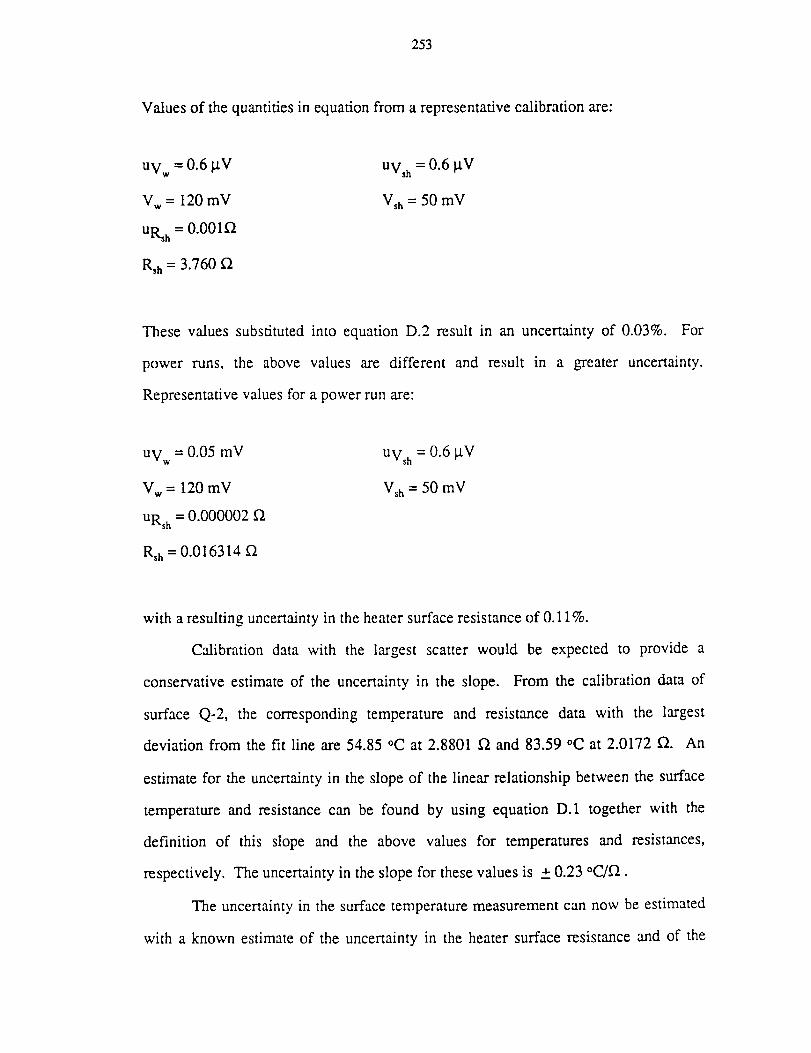
253
Valuesof thequantitiesin equationfrom arepresentativecalibrationare:
uvw = 0.6 I.tV
Vw= 120mV
URsh= 0.001 f_
Rsh = 3.760 f_
uvs h = 0.6 I.tV
Vsh = 50 mV
These values substituted into equation D.2 result in an uncertainty of 0.03%. For
power runs, the above values are different and result in a greater uncertainty.
Representative values for a power run are:
uvw = 0.05 mV
Vw = 120 mV
URs h = 0.000002
Rsh = 0.016314 f2
uvs h = 0.6 t.tV
Vsh = 50 mV
with a resulting uncertainty in the heater surface resistance of 0.11%.
Calibration data with the largest scatter would be expected to provide a
conservative estimate of the uncertainty in the slope. From the calibration data of
surface Q-2, the corresponding temperature and resistance data with the largest
deviation from the fit line are 54.85 °C at 2.8801 f_ and 83.59 °C at 2.0172 fL An
estimate for the uncertainty in the slope of the linear relationship between the surface
temperature and resistance can be found by using equation D.1 together with the
definition of this slope and the above values for temperatures and resistances,
respectively. The uncertainty in the slope for these values is + 0.23 °C/f_.
The uncertainty in the surface temperature measurement can now be estimated
with a known estimate of the uncertainty in the heater surface resistance and of the
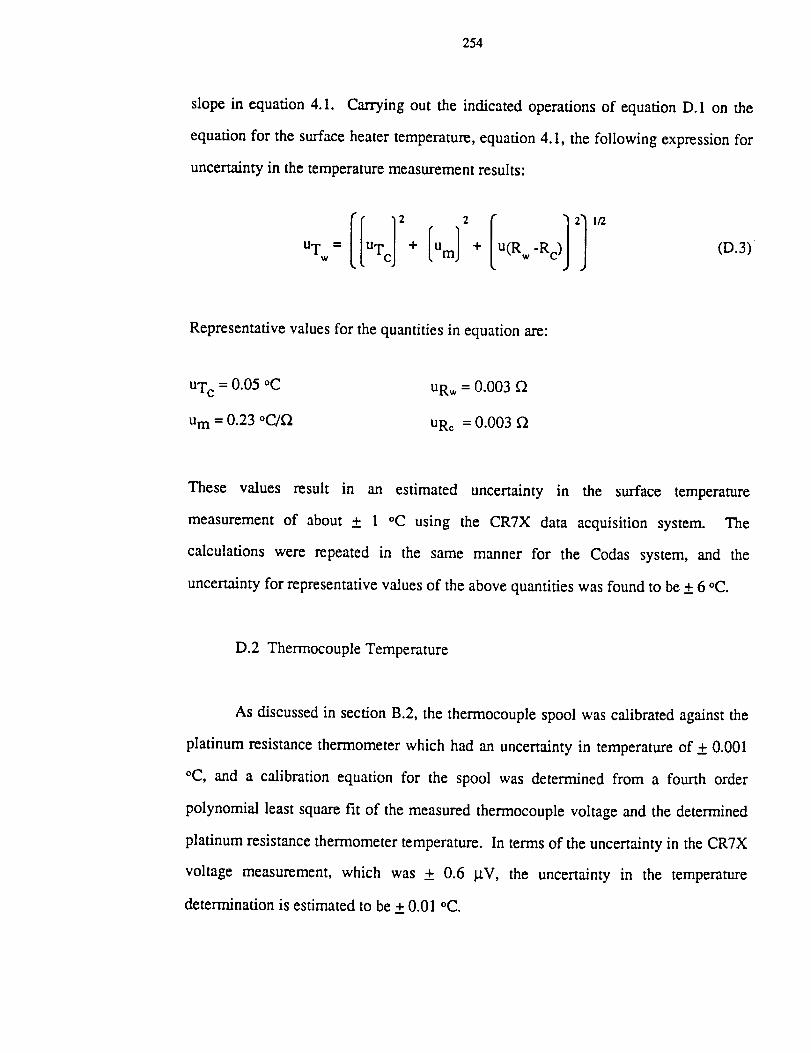
254
slope in equation 4.1. Carrying out the indicated operations of equation D.1 on the
equation for the surface heater temperature, equation 4.1, the following expression for
uncertainty in the temperature measurement results:
uTw
II2= UTc I 121+ u m + u(Rw-Rc) (D.3)
Representative values for the quantities in equation are:
UTc = 0.05 °C
u m = 0.23 °C/f_
URw = 0.003 f2
URc = 0.003 f2
These values result in an estimated uncertainty in the surface temperature
measurement of about + 1 °C using the CR7X data acquisition system. The
calculations were repeated in the same manner for the Codas system, and the
uncertainty for representative values of the above quantities was found to be + 6 °C.
D.2 Thermocouple Temperature
As discussed in section B.2, the thermocouple spool was calibrated against the
platinum resistance thermometer which had an uncertainty in temperature of + 0.001
°C, and a calibration equation for the spool was determined from a fourth order
polynomial least square fit of the measured thermocouple voltage and the determined
platinum resistance thermometer temperature. In terms of the uncertainty in the CR7X
voltage measurement, which was _.+ 0.6 I.tV, the uncertainty in the temperature
determination is estimated to be + 0.01 °C.
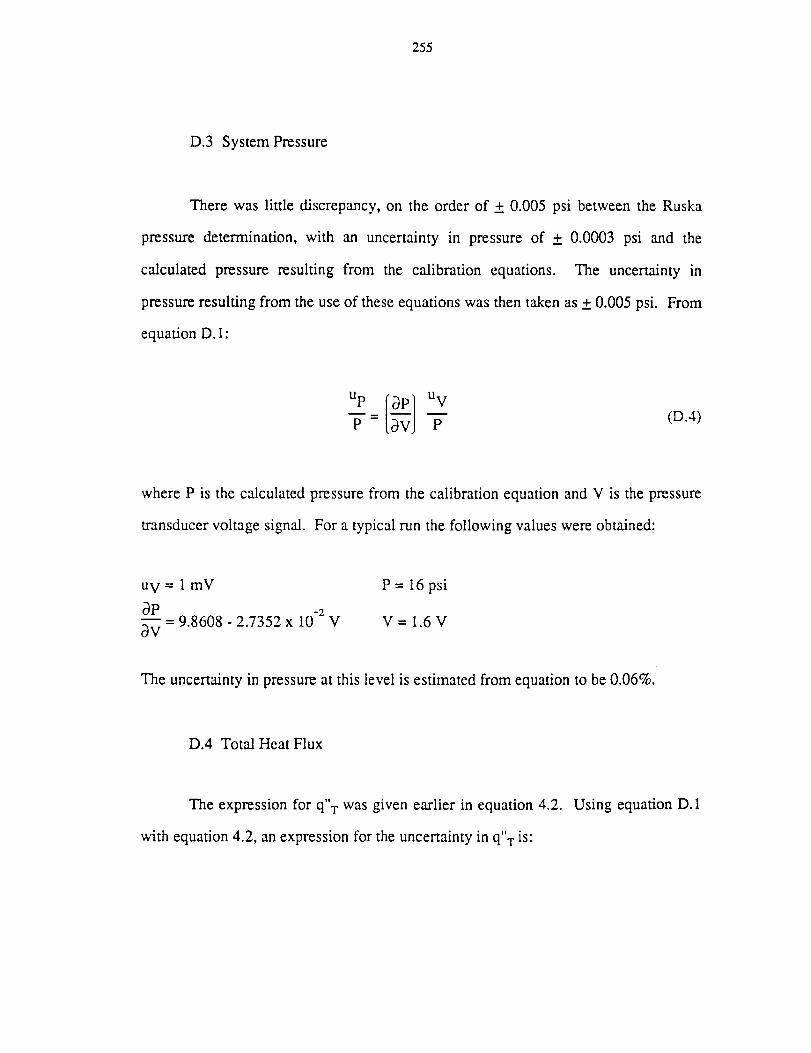
255
D.3 System Pressure
There was little discrepancy, on the order of + 0.005 psi between the Ruska
pressure determination, with an uncertainty in pressure of + 0.0003 psi and the
calculated pressure resulting from the calibration equations. The uncertainty in
pressure resulting from the use of these equations was then taken as + 0.005 psi. From
equation D. 1:
(D.4)
where P is the calculated pressure from the calibration equation and V is the pressure
transducer voltage signal. For a typical run the following values were obtained:
u V= lmV P=16psi
apm = 9.8608 - 2.7352 x 10 -z V V -- 1.6 Vav
The uncertainty in pressure at this level is estimated from equation to be 0.06%.
D.4 Total Heat Flux
The expression for q"T was given earlier in equation 4.2. Using equation D.I
with equation 4.2, an expression for the uncertainty in q"T is:
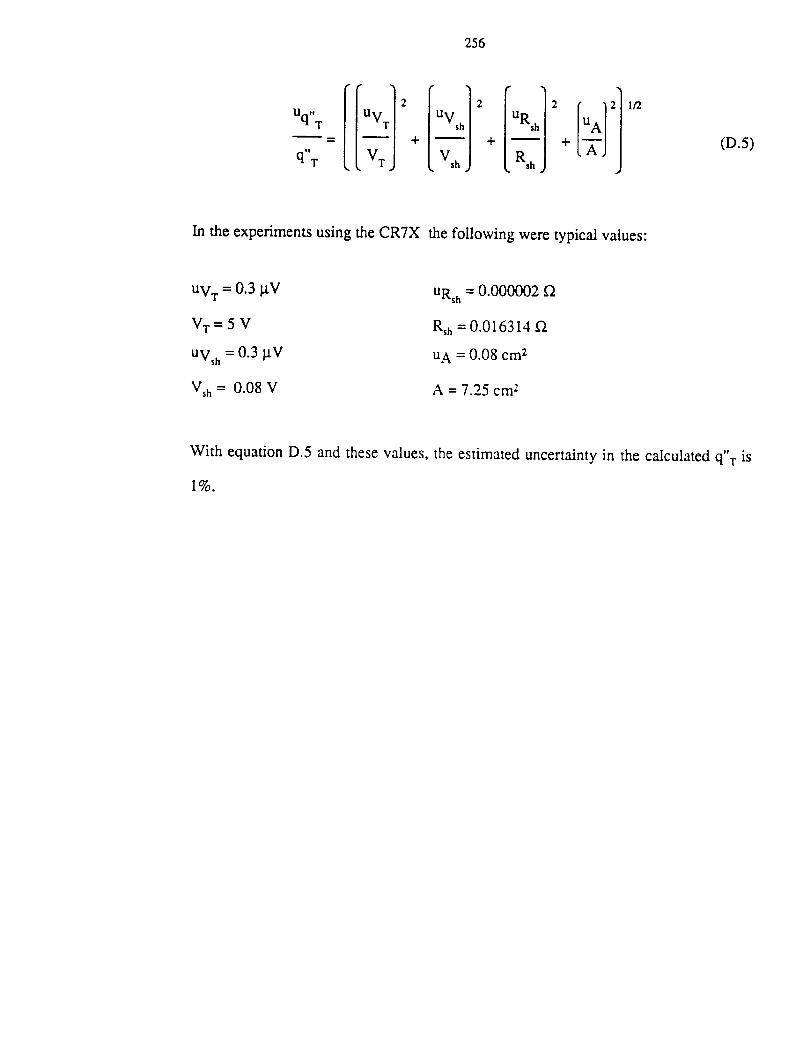
256
[iuvliu lrURJI l]_= + + +
q"T LV,J LV,_J LR,_J(D.5)
In the experiments using the CR7X the following were typical values:
UVT = 0.3 I.tV URs. = 0.000002 if2
V T = 5 V Rsh = 0.016314 f_
uvs h = 0.3 t.tV u A = 0.08 cm 2
V_h = 0.08 V A = 7.25 cm z
With equation D.5 and these values, the estimated uncertainty in the calculated q"T is
1%.
257
E. ELECTRONIC CIRCUITRY
E.1 Power Supply for Step in Heat Flux and Quasi-Steady Heating
As shown in Figure E.1, the power controller receives the set point voltage
from either the CR7X or a manual input command, and amplifies the signal by two.
The feedback signal (FBK1) from heater card number 1, presented in Figure E.2, is
then subtracted from the amplified set point voltage and extraneous noise is filtered.
For a positive difference, a proportional amount of current is sent into the base of
transistor number 1. For a negative or zero difference, a diode prevents current from
entering the base of transistor number 1. The base current then draws an amplified
amount of current from the collector which is connected to bases (B1, B2, B3, and B4)
of the four transistors on heater card number 1. Thus, as the base currents to the heater
card transistors are increased, more power is sent to the heater.
E.2 Power Supply for Step in Heater Surface Temperature
This power supply produces a rapidly varying, programmed schedule of power
to the test heater to result in a constant temperature of the test heater. The schedule
begins with the maximum power to the heater, and the power is progressively
decreased.
Discrete changes in the heating power permit the use of switches. N-channel
MOSFET switches are used. The heater is on a common bus which connects the
sources of all of the MOSFETS. The power supply voltage is connected to a separate
loading resistor for each switch, the other side of the load resistor is connected to the
drain of the MOSFET. The series combination of the heater and load resistances
258
determinesthe power to the heaterwhen the appropriateswitch is on. Eachgateis
optically coupledto its particularswitchingsignal.
The voltage-timescheduleis divided into 24 different time intervals; asshort
as20micro-secondsfor earlyintervalsandaslong as1.3secondsfor thefinal interval.
A micro-processorprogrammedin assemblytimesthesignalsto theswitches.
Sincethe power supply starting transient requiresabout 50 milliseconds,an
output resistorwith a MOSFET permitsthe power supply to operatenearmaximum
powerbeforetheactualpowerswitching transientis imposed.Detailsof theelectronic
circuitry arepresentedin FigureE.3.
E.3 PressureController
For largedeviationsfrom the setpoint pressurelevel, the pressurecontroller
operatesasanon/off controller by openingand closing the solenoidactuatedfill/vent
valves in responseto large pressuredeviations. More precisecontrol is achieved
throughregulationof the proportional valve while a needlevalve admitsa constant
flow rate of air into the bellows and the fill/vent valves remain closed. The
proportionalvalveis operatedwithin its linear rangeof operationsothat asvoltageto
theproportionalvalveis increasedor decreased,theflow rateof air exiting thebellows
in directproportionto thevoltage. Theelectroniccircuits arepresentedin FiguresE.4
throughE.6.
E.4 Drop VesselTemperatureController
Beforea drop test, the drop vesselwas brought to a uniform temperatureby
meansof heating films attachedto the external surfacesof the drop vessel. The
heatingfilms werepoweredby meansof thedrop vesseltemperaturecontroller. The

259
electronic circuits for the drop vessel temperature controller are presented in Figures
E.7 through E. 10.
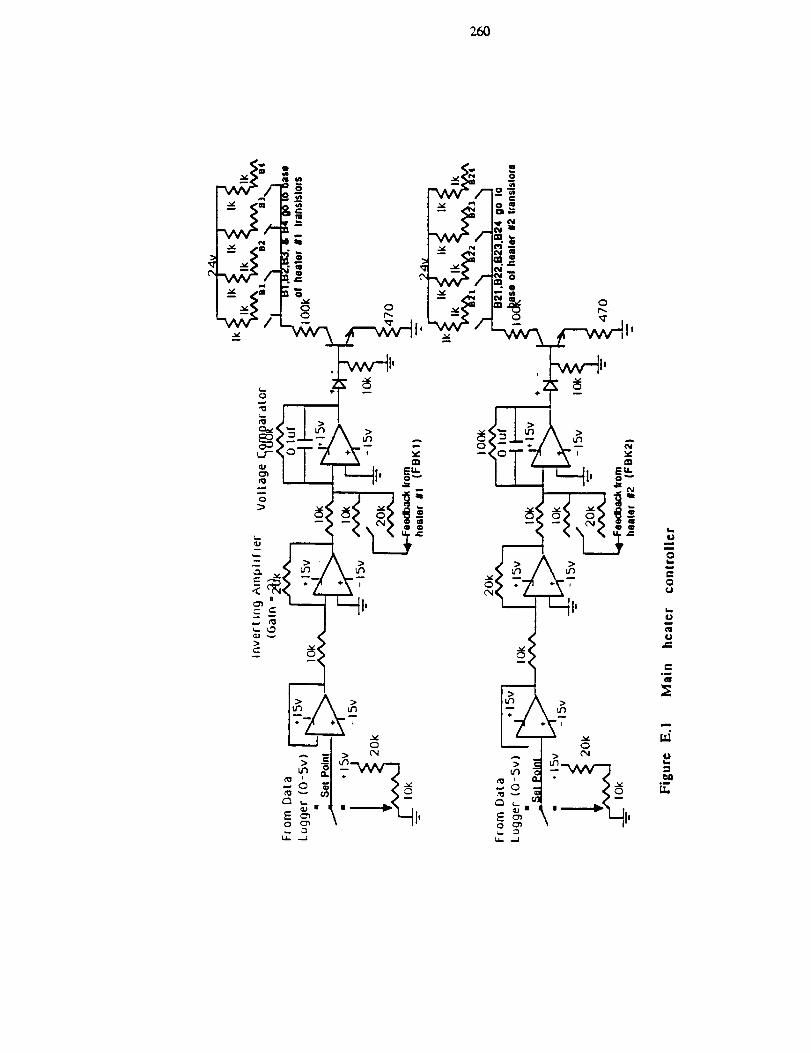
26O
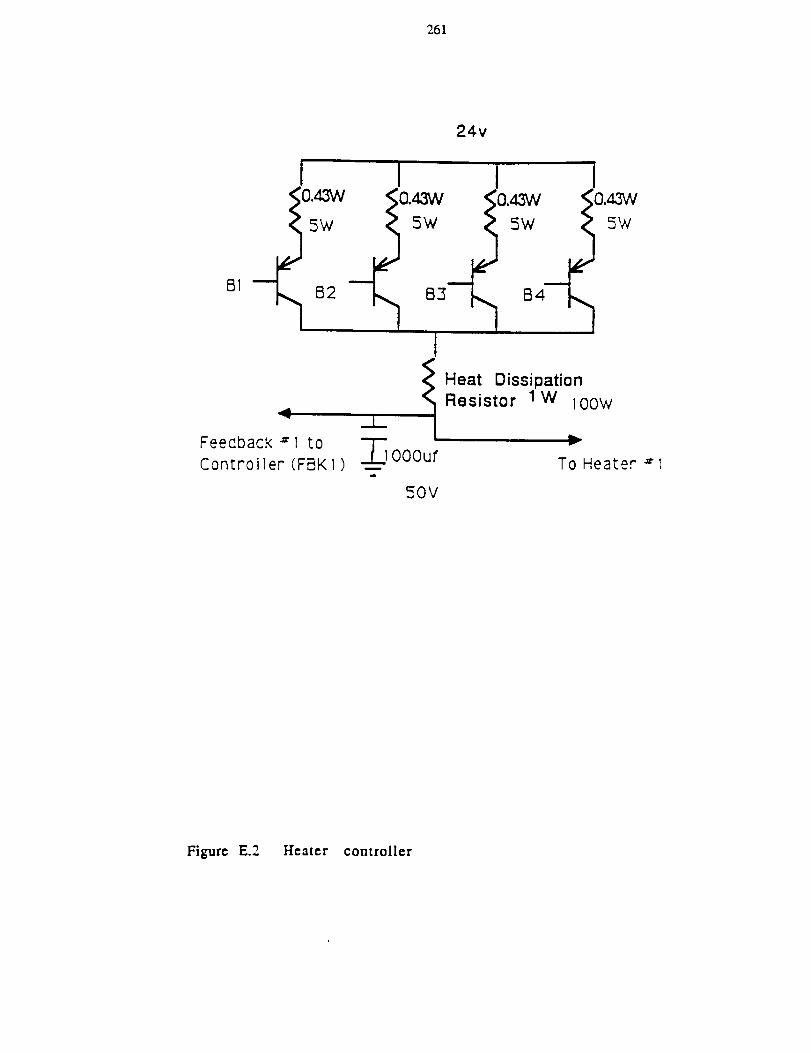
261
24v
B1
I I I I
5W 5W 5W "5W
I
I Heat DissipationResistor lW l OOW
_" ._L_
Feec!bact< = 1 to
Controller(FBK1) _ O00ur To Heater =1I
50V
Figure E.2 Heater controller
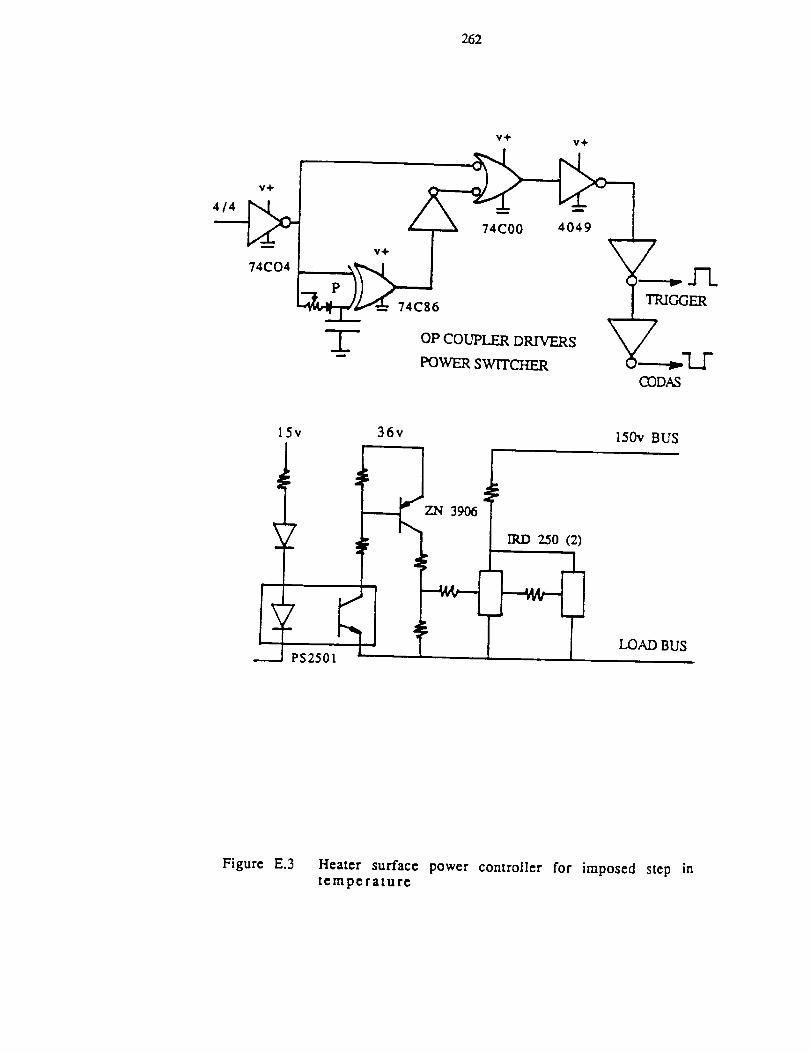
262
v÷
74CO4
V'4" V+
v÷
OP COUPLER DRIVERS
POWER SWITCHER
\TRIGGER
7_-----_'L/
GODAS
5v
\zi
_P52501 _.I
36v
ZN 3906
IRD 25O (2)
150v BUS
LOAD BUS
Figure E.3 Heater surface power controller for imposed step intemperature
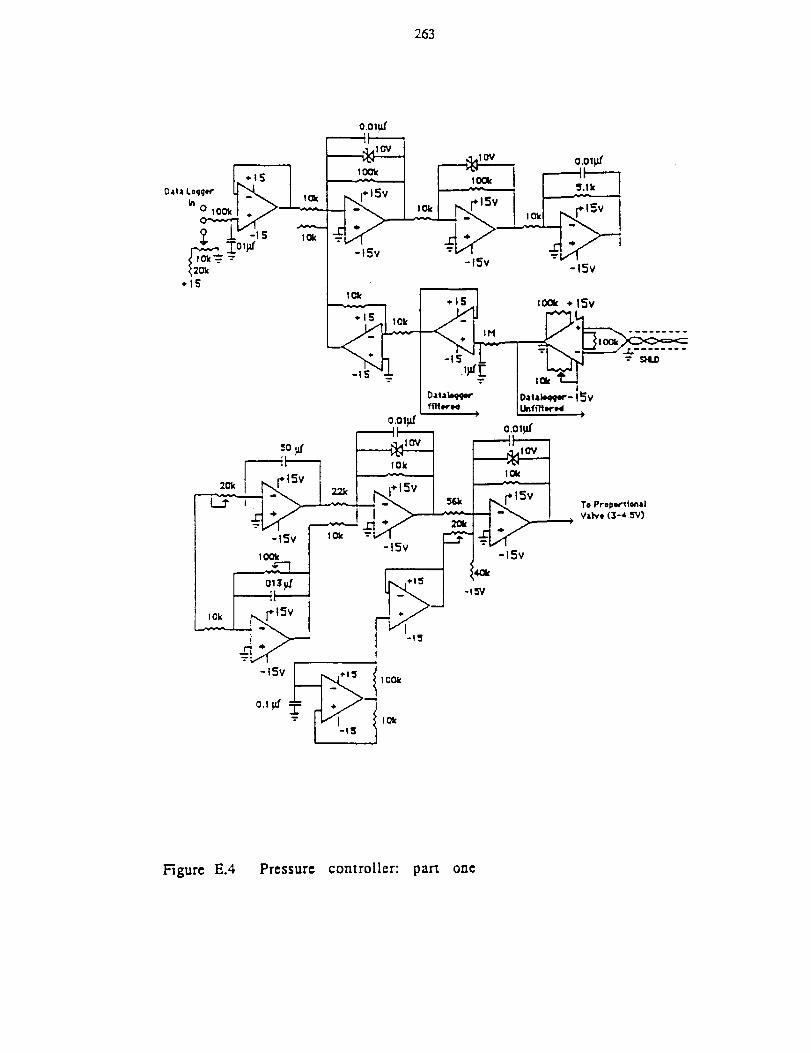
263
'= . I ._s.I ,o_ -Isv
Unfftt_-N )
o.oi¢ o.oI_"'toy II
lOV
ICk
r,,.I ÷tSv I
_ - -t5v
-15v 1ok
lOOk
-15v L_..,_[,,_is _
L I-"--.-J
o.I_ _ I
Te prop_enalValve (:3-4._,')
Figure E.4 Pressure controller: part one
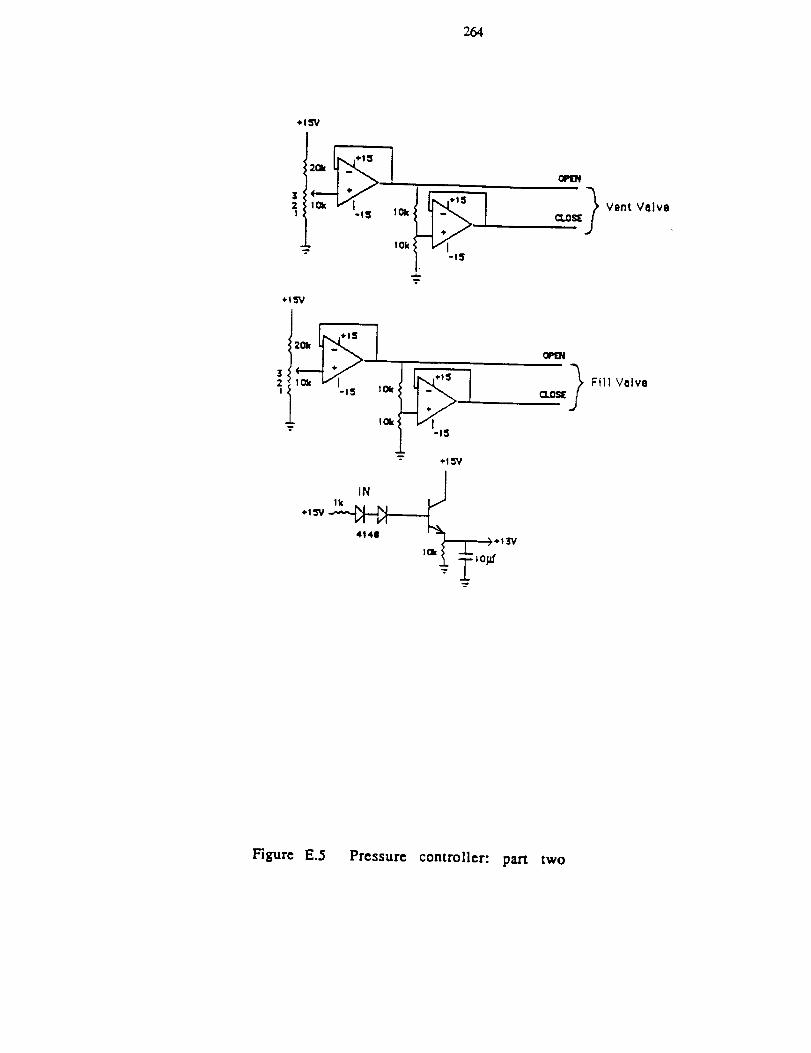
264
_l_rv
I
+t_V
i_: u,- I- -15
I
lk+lSV
÷13V
Vent Vnlve
Fill Valve
Figure E.5 Pressure controller: part two
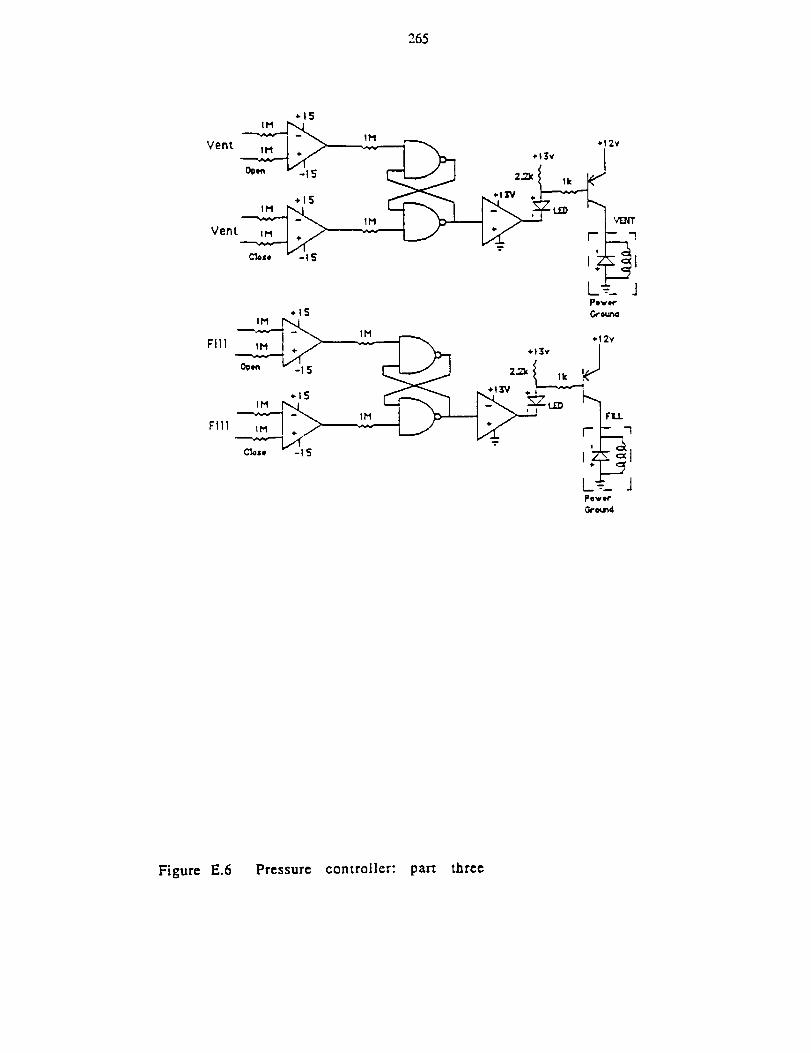
265
Vent
Figure E.6 Pressure controller: part three
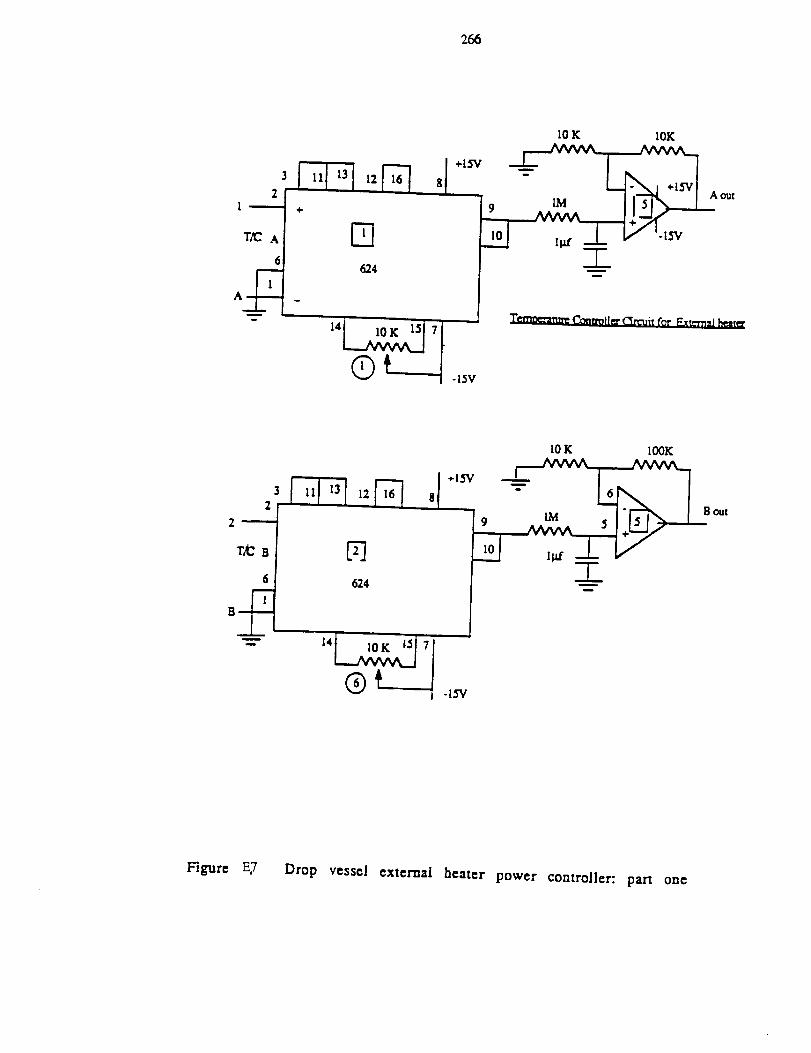
266
62,4
10K 10K
IMA out
2
2
T/CB
6 624
10 K 100K
IM B out
10K 71-153/
Figure E.7 Drop vessel external heater power controller: part one
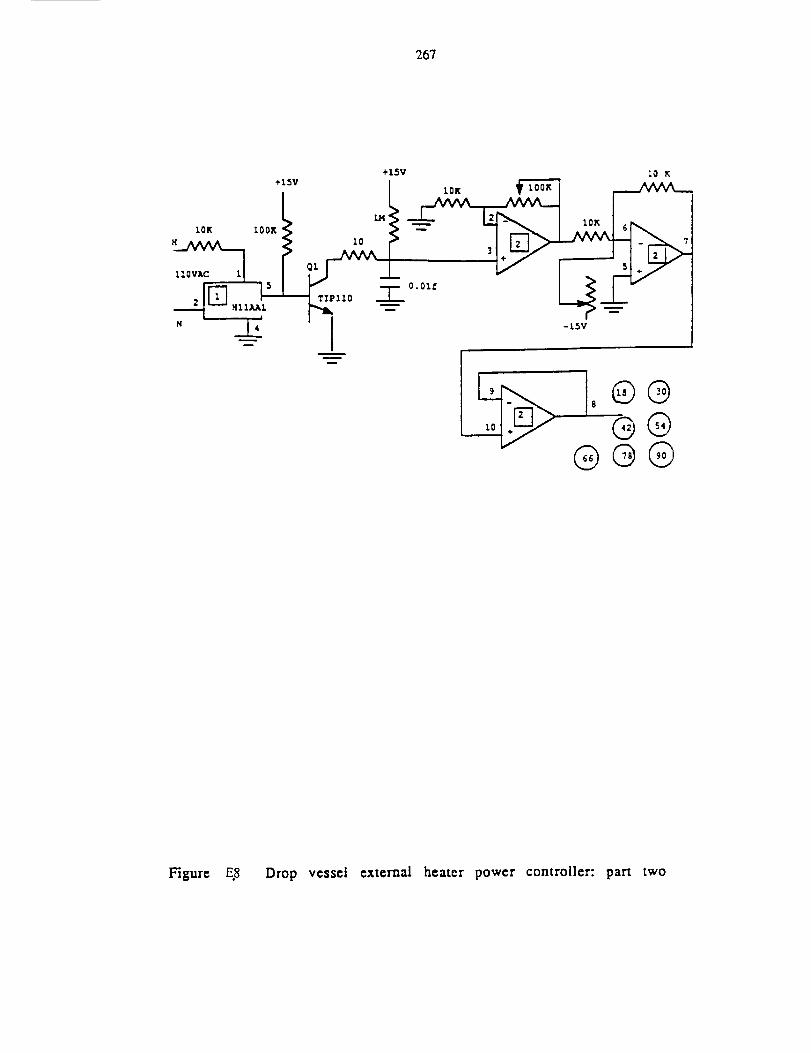
267
Figure E.8 Drop vessel external heater power controller: part two
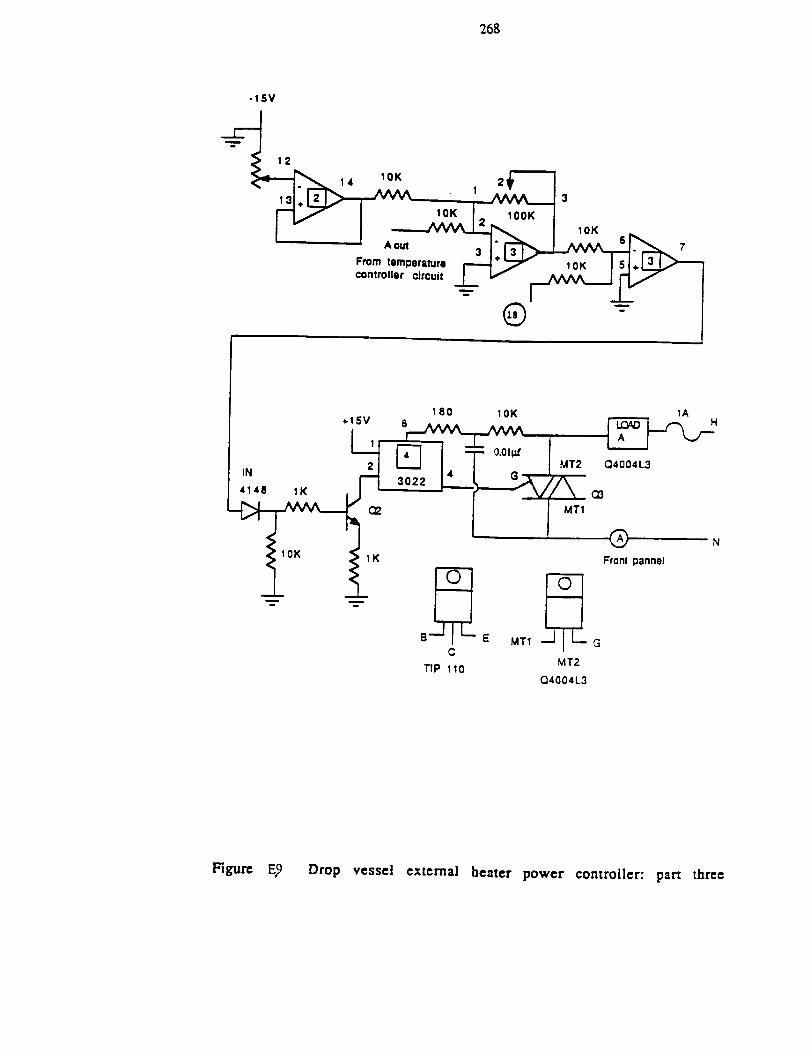
268
-15V
12 14 10K 2 i_--1
• | 3
It"" I _r,_-- I _oz<
From tem_ersturl _ 7 10K I_+_.._,_
corn roller circuit __._ _ l_J_.,.k[,,_
® -
+15V180 10K 1A
3022 _/__ C3
MTI
CMT2
TIP 110Q4004L3
-®Fronl pannel
F_p,._r¢ E_ Drop vcssc! external heater power controller:part three
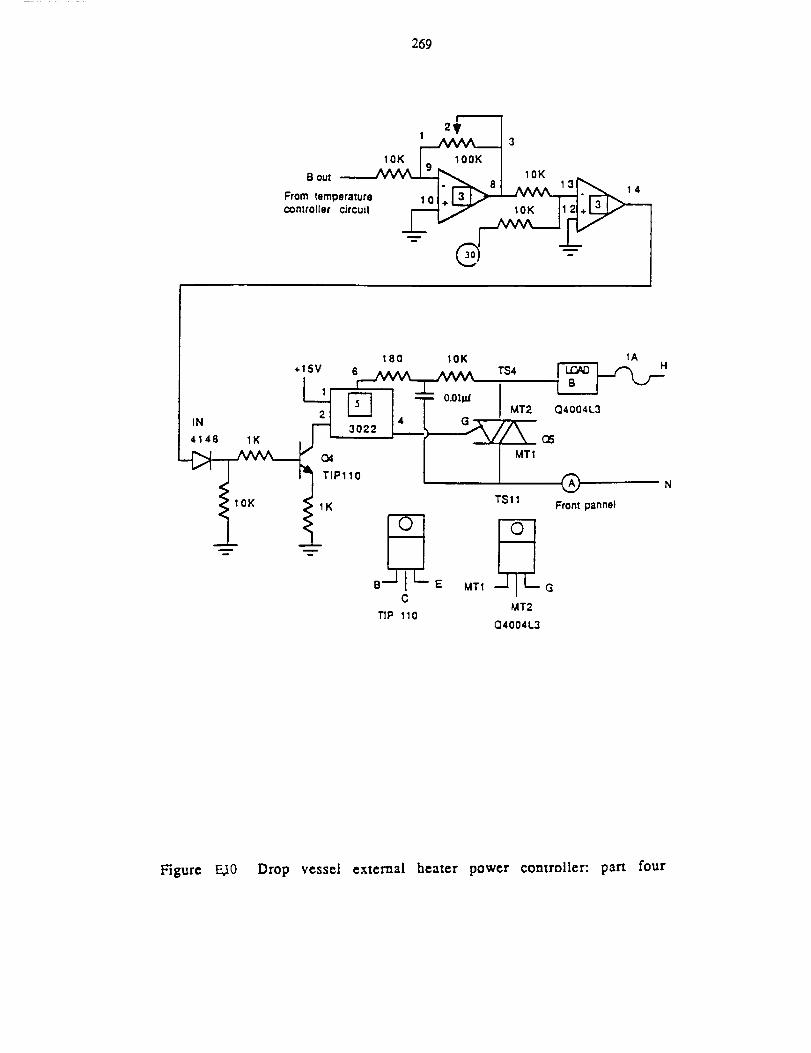
269
1 3
.,o.Bout _ IOK __
_ l'_SI ^^,,^131_ ,4,-tom,empe,ature I 0 {+ _" " " "-T"_I"
controller circuit i-----17 , 10K 11_+1_,..,,/ .... :
180 10K
{ ,N ,-:'{ 3022 14 • G_
MT2TIP 110
Q4004L3
IA
TS4 __. /.. H
MT2 Q4004L3
MTI
®TS11
Front pannel
N
Figure E,IO Drop vessel external heater power controller: part four
270
F. ANALYSIS OF IMPOSED STEP IN TEMPERATURE
One dimensional conduction to two semi-infinite media, in this case Rl13 and
quartz, from the common plane heat source, which produces a step in the interface
temperature at the boundary, are described analytically. The problem is considered in
two domains as shown in Figure F.1. The following governing equation, initial
condition, and boundary conditions are for the R113:
ao a2o
where 0 = T - T_,
0(x,0) =T,-T w (F.2)
0(0,t) = 0 (F.3)
0(o*,t) = T.-Tw (F.4)
The solution to F.1 and the heat flux necessary at the boundary to maintain the
constant temperature are by the Laplace transform method as described in Arpaci
(1966):
(F.5)
(F.6)
271
The temperaturedistribution in the quartzis also given by equationF.5, but with the
propertiesfor quartzsubstitutedfor the R113propertiesand the origin for the quartz
domainasindicatedin FigureF.1. Theheatflux to thequartzis given by equationF.6
with theappropriatequartzproperties.The sumof the heatflux to thequartzand the
heatflux to theR113resultsin equation3.1,thetotal power input to theheatersurface
divided by thesurfaceareato imposea stepincreasein surfacetemperature:
T-TW o,o
(3.1)
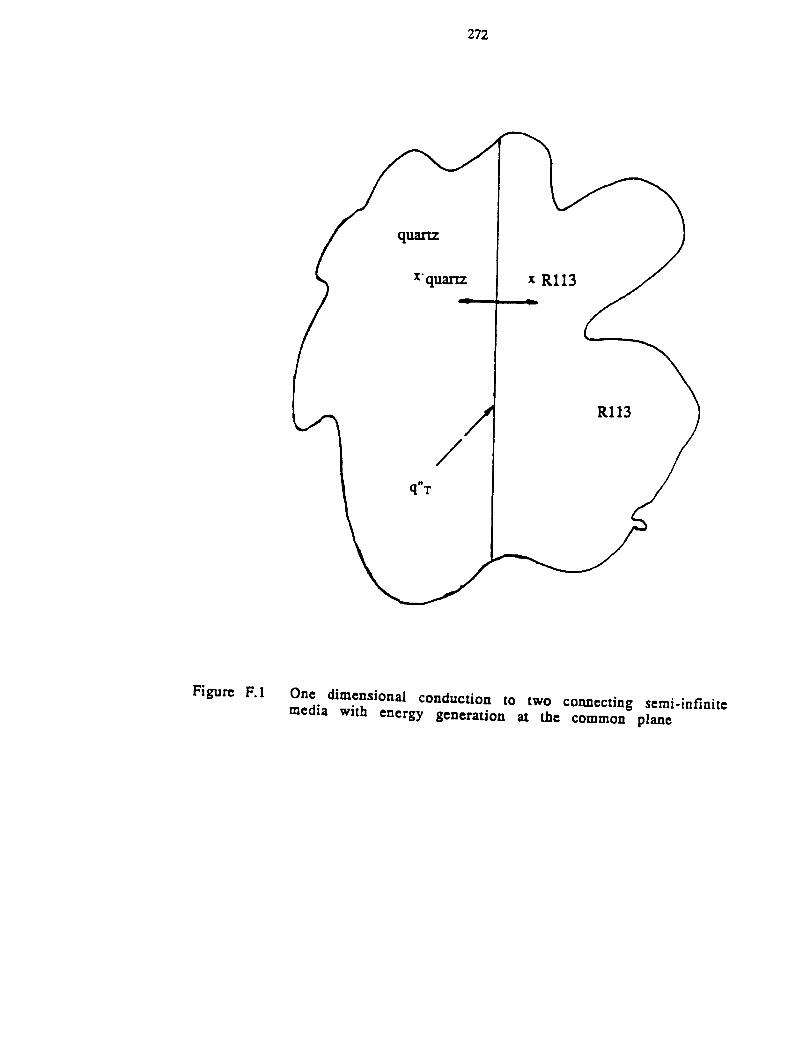
272
Xquartz x Rl13
/q_T
Rl13
Figure F.1One dimensional conduction to two connecting semi-infinitemedia with energy generation at the common plane
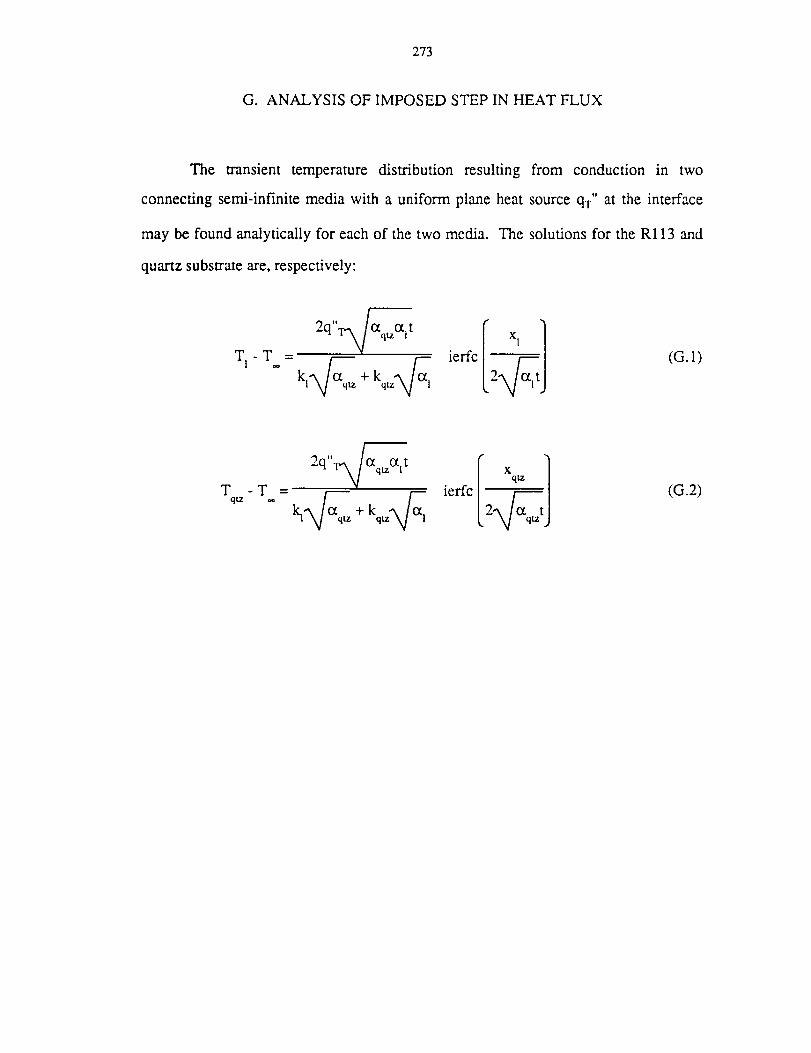
273
G. ANALYSIS OF IMPOSED STEP IN HEAT FLUX
The transient temperature distribution resulting from conduction in two
connecting semi-infinite media with a uniform plane heat source qv" at the interface
may be found analytically for each of the two media. The solutions for the R113 and
quartz substrate are, respectively:
(G.1)
2q"_qt_c_t ierfc I xq.....__= (G.2)
274
H. THREEDIMENSIONAL CONDUCTION NUMERICAL ANALYSIS
A three dimensional numerical solution for the transient temperature
distribution in the quartz and the Rl13 was obtained by solving the conduction
equationwith temperaturedependentpropertiesandpowergenerationin thecommon
plane. TheCrank-Nicholsonfinite differencemethod,which is unconditionallystable,
wasusedto solvetheequations.Thenumericalgrid hadequivalentnodespacingin all
threecoordinatedirections,and the spacingwas adjustable. Since the problemwas
symmetric, the temperaturein one fourth of the quartz and Rl13 solutiondomain
provided the threedimensionaltemperaturedistribution. Temperaturesolutions in
severalvertical planesof the quartz and Rl13, including the heater surface,were
printed at the desiredtime. Boundaryconditionson the bottomof thequartzsurface
included thoseof convectionand an insulatedboundary. The edgesof the heater
surfaceandtheR113abovewereassumedto beinsulated.

275
BIBLIOGRAPHY

276
BIBLIOGRAPHY
Abraham, F. F., "Homogeneous Nucleation Theory", Adv. Theor. Chem., Suppl. 1,Academic Press, New York, NY., 1974.
Arpaci, V. S., Conduction Heat Transfer, Addison-Wesley, Reading, Mass., 1966.
Bankoff, S., "Entrapment of Gas in The Spreading of a Liquid Over a Rough Surface",AIChE J., Vol. 4, pp. 24-26, 1958.
Becker, R., and Doting, W., "The Kinetic Treatment of Nuclear Formation in
Supersaturated Vapors", Ann. Phys., Vol. 24, p. 719, 1935.
Bergles, A. E., and Rohsenow, W. M., "The Determination of Forced-Convection
Surface-Boiling Heat Transfer", J. Heat Transfer, Paper No. 63-HT-22, pp. 1-8, 1963.
Blander, M., and Katz, Joseph L., "Bubble Nucleation in Liquids", AIChE. J., Vol. 21,pp. 833-848, 1975.
Boucher, E. A., "Nucleation in The Atmosphere", in Nucleation, Zetflemoyer, L. C.,and Marcel D., Ed., p. 527, Dekker, New York, 1969.
Chowdhury, S. K. R., and Winterton, R. H. S., "Surface Effects in Pool Boiling", Int.J. Heat Mass Transfer, Vol. 28, pp. 1881-1889, 1985.
Clark, H. B., Strenge, P. S., and Westwater, J. W., "Active Sites for NucleateBoiling", Chem. Engr. Prog. Symposium Series, Vol. 51, pp. 103-, 1959.
Cooling, IC J., and Merte, H. Jr., "Incipient and Nucleate Boiling of Liquid Hydrogen",ASME. Paper No. 68-WA/PID-4, 1968.
Cole, R., "Boiling Nucleation", Advances in Heat Transfer, Vol. 10, Harmett, J. P., and
Irvine, T. F. Jr.,Ed., New York, London, Academic Press, pp. 85-166, 1974.
Cooper, M.G., and Chandratilleke, "Growth of Diffusion-Controlled Vapour Bubbles ata Wall in a Known Temperature Gradient", Int. J. Heat Mass Transfer, Vol. 24, pp.1475-1492, 1981.
ComweU, K., "On Boiling Incipience Due to Contact Angle Hysteresis", Int. J. HeatMass Transfer, Vol. 25, pp. 205-211, 1982.
Corty, C., and Foust, A. S., "Surface Variables in Nucleate Boiling",Chem. Engr.Prog. Symposium Series, Vol. 51, pp. 1-12a, 1959.
Derewnicki, K. P., "Experimental Studies of Heat Transfer and Vapour Formation in
Fast Transient Boiling", Int. J. Heat Mass Transfer, Vol. 28, pp. 2085-2092, 1985.
E. I. DuPont de Nemours and Co., Inc., "Freon Product Information", Cat. No. B-2, E.
I. DuPont de Nemours and Co., Inc.,Wilmington, De., 1969.
E.I. Dupont de Nemours and Co., Inc., Personal Communication, March 1990.
Fabic, S., "Vapor Nucleation on Surfaces Subjected to Transient Heating", Ph.D.Dissertation, U. of California, Berkeley, No.65-2978, 1964.
277
Faw, R.E., VanVleet, R.J., and Schmidt, D.L., "Pre-pressurization Effects on Initiationof Subcooled Pool Boiling During Pressure and Power Transients", Int. J. Heat MassTransfer, Vol. 29, pp. 1427-1437, 1986.
Fisher, J. C., "The Fracture of Liquids", J. Applied Physics, Vol. 19, pp. 1062-1067,1948.
Forest, T.W., ''l'he Stability Of Gaseous Nuclei At Liquid-Solid Interfaces", J. Appl.
Phys., Vol. 53, pp. 6191-6201, 1982.
Frenkel, J., Kinetic Theory of Liquids, Dover Publ. Inc., New York, NY, 1955.
Gerum, E., Straub, J., and Grigull, U., "Superheating in Nucleate Boiling Calculated bythe Heterogeneous Nucleation Theory", Int. J. Heat Mass Transfer, Vol. 22, pp. 517-524, 1979.
Gibbs, J. W., The Collected Works of J. W. Gibbs, Vol. 1, Longmans, Green, NewYork, NY, 1928.
Griffith, P., and Wallis, J. D., "The Role of Surface Conditions in Nucleate Boiling",
Chem. Engr. Prog. Symposium Series, Vol. 56, pp. 49-63, 1960.
Hall, W. B., and Harrison, W. C., "Transient Boiling of Water at AtmosphericPressure", Int. Heat Transfer Conf., Institute of Mech. Eng., pp. 186-192, 1966.
Han, C. Y., and Griffith, P., "The Mechanism of Heat Transfer in Nucleate Pool
Boiling-Part I.", Int. J. Heat Mass Transfer, Vol. 8, pp. 887-904, 1965.
Hino, R., and Ueda, T., "Studies on Heat Transfer and Flow Characteristics in
Subcooled Flow Boiling-Part I. Boiling Characteristics", Int. J. Multiphase Flow, Vol.
I 1, pp. 269-281, 1985.
Hirth, J. P., and Pound, G. M., "Condensation and Evaporation, Nucleation andGrowth Kinetics", Prog. Materials Sci., Vol. 11, 1963.
Howell, LR., and Siegel, R.," Incipience Growth and Detachment of Boiling Bubbles inSaturated Water from Artificial Nucleation Sites of Known Geometry and Size", lnt.
Heat Transfer Conf. Chicago, pp. 512-513, 1966.
Hsu, Y. Y., "On the Size Range of Active Nucleation Cavities on a Heating Surface", J.
Heat Transfer, Vol. 84, pp. 207-216, 1962.
Ibrahim, E. A., and Judd, R. L., "An Experimental Investigation of the Effect of
Subcooling on Bubble Growth and Waiting Time in Nucleate Boiling", J. Heat Transfer,Vol. 107, pp. 168-174, 1985.
Incropera, F. P., and DeWitt, D. P., Fundamentals of Heat Transfer, 2nd Ed., John
Wiley and Sons, Inc., New York, NY., 1984.
Jarvis, T. J., Donohue, M. D., and Katz, J. L., "Bubble Nucleation Mechanisms of
Liquid Droplets Superheated in Other Liquids", J. Colloid Interf. Sci., Vol. 50, p. 359,1975.
278
Kline, S.J., and McC1intock, F.A., "The Description of Uncertainties in Single Sample
Experiments", Mechanical Engineering, VoL 75, 1953.
Kotake, S., and Glass, I. I., "Flows With Nucleation and Condensation", Prog.Aerospace Sc., Vol. 19, pp. 129-196, 1981.
Kottowski, H. M., "The Mechanism of Nucleation, Superheating and Reducing Effectson the Activation Energy of Nucleation", Prog. in Heat and Mass Transfer, D. E.Dweyer, Ed., Vol. 7, pp. 299-324, Permagon Press, Oxford, 1973.
Landau, L., "On the Theory of Slow Combustion", Acta Physiochimica U.R.S.S., Vol.
19, pp. 77-85, 1944.
Lee, C. H., Chang, C. J., Yin, S. T., and Huang, Y. D., "Prediction of IncipientBoiling with Forced Convective How at 0.1 to 20.7 MPa", ASME I988 Heat TransferConf, HTD-96, Vol. 2, pp. 469-474.
Lorenz, J., Mikic, B., and Rohsenow, W.M., "The Effect of Surface Conditions on
Boiling Characteristics", I974 Japanese Int. Heat Transfer Conf., Paper No. B2.1, pp.35-39, 1974.
Lothe, L, and Pound, G. M., "Reconsiderations of Nucleation Theory", J. Chem.Phys., Vol. 36, pp. 2080-2085, 1962.
Lothe, J., and Pound, G. M., "On The Statistical Mechanics of Nucleation Theory", J.
Chem. Phys., Vol. 45, pp. 630-634, 1966.
Lothe, L, and Pound, G. M., "Concentration of Clusters in Nucleation and the Classica.
Phase Integral", J. Chem.Phys., Vol. 48, pp. 1849-1852, 1968.
Lurie, H., and Johnson, H. A., "Transient Pool Boiling of Water on a Vertical Surface
with a Step in Heat Generation", J. Heat Transfer, Vol. 84, pp. 217-224, 1962.
Mayer, J.E., and Harrison, S. F., "Statisical Mechanics of Condensing Systems", J.Chem. Phys., Vol. 6, pp. 87-104, 1938.
McCann, H., Clarke, LJ., Masters, A.P., "An Experimental Study of Vapor Growth at
the Superheat Limit Temperature", Int. J. Heat Mass Transfer, Vol. 32, pp. 1077-1093,1989.
Merte, H. Jr., and Clark, J. A., "Pool Boiling in an Accelerating System", I. HeatTransfer, Vol. 83, pp. 234-242, 1961.
Merte, H. Jr., and Litfles, L, "Zero Gravity Incipient Boiling Heat Transfer", Proc.Space Transportation System Propulsion Technology Conference, Vol. 4, pp. 1312-1348, NASA, Huntsville, Alabama, April 6 and 7, 1971.
Montgomery, D. C., Design and Analysis of Experiments, 2rid Ed., John Wiley andSons, Inc., New York, NY., 1983.
Ngheim, L. X., "Holographische Untersuchung Des Instationaren Siedens", PhDThesis, Munich, 1980.
279
Nghiem, L. X., Merte,H. Jr., Winter, E. R. F., and Beer, H., "Prediction of Transient
Inception of Boiling in Terms of a Heterogeneous Nucleation Theory", I. Heat Transfer,Vol. 103, pp. 69-73, 1981.
Oker, E., and Merte, H. Jr., "Transient Boiling Heat Transfer in Saturated LiquidNitrogen and F113 at Standard and Zero Gravity", U. Michigan, Rept. No. 074610-52-F for NASA, 1973.
Oker, E., and Metre, FL Jr., "A Study of Transient Effects Leading up to Inception ofNucleate Boiling", Proceedings of the 6th Int. Heat Transfer Conference, Toronto,August 1978, pp. 139-144, 1978.
Oker, E., and Merte, H. Jr., "Semi-Transparent Gold Film as Simultaneous SurfaceHeater and Resistance Thermometer for Nucleate Boiling Studies", J. Heat Transfer,Vol. 103, pp. 65-68, 1981.
Okuyama, K., Kozawa, Y., Inoue, A., and Aoki, S., "Transient Boiling Heat TransferCharacteristics of R113 at Large Stepwise Power Generation", Int. I. Heat MassTransfer, Vol. 31, pp. 2161-2174, 1988.
Panton, R.L., Incompressible Flow, Wiley, New York, pp. 316-318, 1984.
Prospererti, A. and Plesset, M.S., "Vapor Bubble Growth in a Superheated Liquid", J.Fluid Mech., Vol. 85, pp. 349, 1978.
Reiss, H., "Theory of the Liquid Drop Model, Industrial and EngineeringChemistrmdies", Vol. 44, pp. 1284-1288, 1952.
Reiss, H., '"l'he Statistical Mechanical Theory of Irreversible Condensation-Part I.", J.Chem. Phys., Vol. 20, pp. 1216-1227, 1952.
Reiss, H., "Treatment of Droplike Clusters by Means of the Classical Phase Integral inNucleation Theory", J. Star. Phys., Vol. 2, pp. 83-104, 1970.
Reiss, H., and Katz, J. L., "Resolution of the Rotational Translational Paradox in the
Theory of Irreversible Condensation", J. Chem. Phys., Vol. 46, pp. 2496-2499, 1967.
Rohsenow, W. M., "Nucleation in Boiling Heat Transfer", ASME Paper 70-HT-18,ASME Symposium, Detroit, Mi., May, 1970., 1970
Sakurai, A., and Shiotsu, M., "Transient Pool Boiling Heat Transfer, Part 1: IncipientBoiling Superheat", J. Heat Transfer, Vol. 99, pp. 547-553, 1977.
Shoukri, M., and Judd, R. L., "Nucleation Site Activation in Sattu-ated Boiling", J. HeatTransfer, Vol. 97, pp. 93-98, 1975.
Sigsbee, R. A., "Vapour to Condensed-Phase Heterogeneous Nucleation", in
Nucleation, Zetflemoyer, L. C., and Marcel D., Ed., p. 151, Dekker, New York, 1969.
Simpson, H. C., and Walls, A. S., "A Study of Nucleation Phenomena in TransientPool Boiling", Proc. lnstn. Mech. Engrs., Vol. 180, Pt. 3C, Vol. 135-149, 1965-66.
Sinha, D.N., "Studies Of Homogeneous Nucleation And Transient Heat Transfer In
Cryogenic Liquids", Phi3 Dissertation, Portland State University, 1980.
28O
Skripov, V. P., Metastable Liquids, Trans. by R. Kondor, Isr_l Program for ScientificTranslations, D. Slutzkin, Ed., Wiley, 1974.
Sparrow, E.M., Goldstein, R.L, Jonsson, V.K., 'Thermal Instability in a HorizontalFluid Layer", J. Fluid Mech., Vol. 18, 1964.
Springer, G. S., "Homogeneous Nucleation"_ Adv. Heat Transfer, Vol. 14, pp. 281-346, 1978.
Straub, J., ZclI, M., and Vogel, B., "Pool Boiling in a Reduced Gravity Field",Presented at the Int. Heat Transfer Conf., Jerusalem, Israel, 1990.
Sturtevant, B., and Shepherd, J.E., "Evaporative Instability at the Superheat Limit",Appl. Sci. Res., Vol. 38, pp. 85-97, 1982.
Tong, W., Bar-Cohen, A., Simon, T. W., and You, S. M., "Contact Angle Effects on
Boiling Incipience of Higher Wetting Liquids", Int. J. Heat Mass Transfer, Vol. 33, pp.91-103, 1990.
Tsukamato, O. and Uyemura, T., "Observation of Bubble Formation Mechanism of
Liquid Nitrogen Subjected to Transient Heating", J. Adv. Cryogen. Eng., Vol. 25, pp.476-482, 1980.
Ulucakli, M., "Nucleate Pool Boiling With Increased Acceleration and Subcooling", Phi)Thesis, University of Michigan, Ann Arbor, 1987.
Volmer, M., Kinetik Der Phasenbildung, Edwards Brother, Inc., Ann Arbor, 1945.
Webb, R. L., "The Evolution of Enhanced Surface Geometries for Nucleate Boiling",Heat Tramfer Engr., Vol. 2, pp. 46-69, 1981.
Weinzicrl, A., and Straub, J., "Nucleate Pool Boiling In Microgravity Environment",Proceedings Of The Seventh International Heat Transfer Conference, Munich, Vol. 4,
pp. 21-27, 1982.
Wiebe, LR., and Judd, R.L., "Superheat Layer Tldckness Measurements In SaturatedAnd Subcooled Nucleate Boiling", I. Heat Transfer, Vol. 93, pp. 455-461, 1971.
Winterton, R. H. S., "Nucleation of Boiling and Cavitation", J. Phys. D: Appl. Phys.,VoL 10, pp. 2041-2056, 1977.
Winterton,R. H. S., and Blake, T. D., "Dynamic Effects in Contact Angle Hysteresis,Applied to Boiling Incipience", Int.. Comm.. Heat Mass Transfer, Vol. 10, pp. 525-531, 1983.
Yin, S. T.,
UniformlySymposium
and Abdelmessih, A. H., "Prediction of Incipient Flow Boiling from aHeated Surface", Nuclear, Solar and Process Heat Transfer AIChE
Series, Vol. 73, pp. 236-243, 1977.
You, S.M., Simon, T.W., Bar-Cohen, A., Tong, W., "Experimental Investigation ofNucleate Boiling Incipience with a Highly-Wetting Dielectric Fluid (R-113)", Int. L HeatMass Transfer, Vol. 33, pp. 105-117, 1990.
281
Zeldovich, J., "Theory of Nucleation and Condensation",Sov. Phys.-JETP,(Eng.Trans.),Vol. 12, 1942.
ZcI1, M., and Straub,I., "Experimental Investigation of Boiling Phenomena Under
Microgravity Conditions", Presented at the ASMEI JSME Thermal Eng. Conf.,Honolulu, Hawaii, March 1987.
Zell, M., and Straub, J., "Microgravity Pool Boiling-TEXUS and Parabolic FlightExperiments", Personal Communication, 1987.
Zimmels, Y., "On The Application of Thermodynamic Potentials to The Theory ofHeterogeneous Nucleation", J. Colloid hu. Sci., Vol. 57, p. 446, 1976.
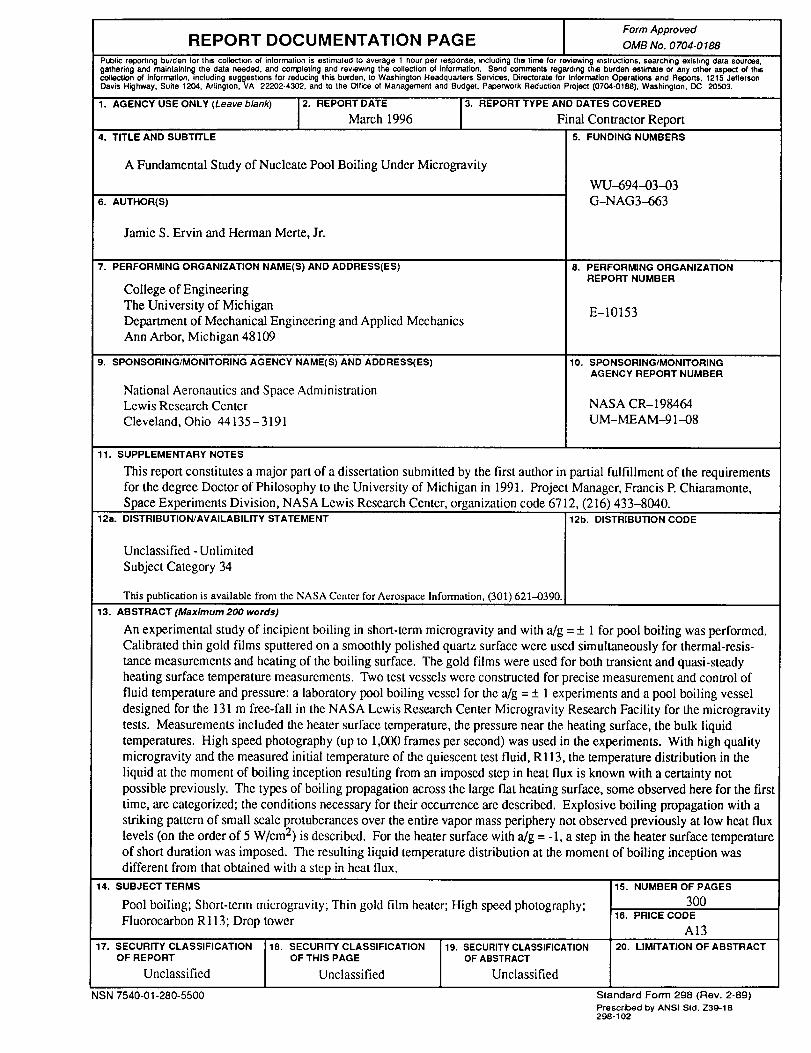
Form ApprovedREPORT DOCUMENTATION PAGE OMBNo. 0704-0188
Public reporting burden |or this collection of information is estimated to average 1 hour per response, including the time for reviewing instruclions, searching existing d_a sour(_s,gathering and maintainin_ the data needed, and completing and reviewing the collection of information. Send comments regarding this burden estimate or any other aspect of thiscollection of information, including suggestions for reducing this burden, to Washington Headquarters Services, Directorate for Information Operations and Reports, 1215 JeffersonDavis Highway, Suite 1204, Arlington, VA 22202-4302, and to lhe Office of Management and Budget, Paperwork Reduction Project (0704-0188), Washington, DC 20503.
1. AGENCY USE ONLY (Leave b/ank) 2. REPORT DATE 3. REPORT TYPE AND DATES COVERED
March 1996 Final Contractor Report4. TITLE AND SUBTITLE 5. FUNDING NUMBERS
A Fundamental Study of Nucleate Pool Boiling Under Microgravity
6. AUTHOR(S)
Jamie S. Ervin and Herman Merte, Jr.
7. PERFORMING ORGANIZATION NAME(S) AND ADDRESS(ES)
College of EngineeringThe University of MichiganDepartment of Mechanical Engineering and Applied MechanicsAnn Arbor, Michigan 48109
9. SPONSORING/MONITORING AGENCY NAME(S) AND ADDRESS(ES)
National Aeronautics and Space AdministrationLewis Research CenterCleveland, Ohio 44135- 3191
WU--694--03-03G-NAG3-663
8. PERFORMING ORGANIZATION
REPORT NUMBER
E-10153
10. SPONSORING/MONITORING
AGENCY REPORT NUMBER
NASA CR-198464UM-MEAM-91-08
11. SUPPLEMENTARY NOTES
This report constitutes a major part of a dissertation submitted by the first author in partial fulfillment of the requirements
for the degree Doctor of Philosophy to the University of Michigan in 1991. Project Manager, Francis P. Chiaramonte,
Space Experiments Division, NASA Lewis Research Center, organization code 6712, (216) 433-8040.
12a. DISTRIBUTION/AVAILABILITY STATEMENT
Unclassified - Unlimited
Subject Category 34
This publication is available from the NASA Center for Aerospace Information, (301) 621-0390.
12b. DISTRIBUTION CODE
13. ABSTRACT (Maximum 2OO words)
An experimental study of incipient boiling in short-term microgravity and with a/g = + 1 for pool boiling was performed.Calibrated thin gold films sputtered on a smoothly polished quartz surface were used simultaneously for thermal-resis-tance measurements and heating of the boiling surface. The gold films were used for both transient and quasi-steadyheating surface temperature measurements. Two test vessels were constructed for precise measurement and control offluid temperature and pressure: a laboratory pool boiling vessel for the a/g = + 1 experiments and a pool boiling vesseldesigned for the 131 m free-fall in the NASA Lewis Research Center Microgravity Research Facility for the microgravitytests. Measurements included the heater surface temperature, the pressure near the heating surface, the bulk liquidtemperatures. High speed photography (up to 1,000 frames per second) was used in the experiments. With high qualitymicrogravity and the measured initial temperature of the quiescent test fluid, R113, the temperature distribution in theliquid at the moment of boiling inception resulting from an imposed step in heat flux is known with a certainty notpossible previously. The types of boiling propagation across the large flat heating surface, some observed here for the firsttime, are categorized; the conditions necessary for their occurrence are described. Explosive boiling propagation with astriking pattern of small scale protuberances over the entire vapor mass periphery not observed previously at low heat fluxlevels (on the order of 5 W/cm 2) is described. For the heater surface with a/g = -1, a step in the heater surface temperature
of short duration was imposed. The resulting liquid temperature distribution at the moment of boiling inception wasdifferent from that obtained with a step in heat flux.
14. SUBJECT TERMS
Pool boiling; Short-term microgravity; Thin gold fihn heater; High speed photography;Fluorocarbon R 113; Drop tower
17. SECURITY CLASSIFICATIONOF REPORT
Unclassified
NSN 7540-01-280-5500
18. SECURITY CLASSIFICATION
OF THIS PAGE
Unclassified
19. SECURITY CLASSIFICATION
OF ABSTRACT
Unclassified
15. NUMBER OF PAGES
3OO16. PRICE CODE
A1320. LIMITATION OF ABSTRACT
Standard Form 298 (Rev. 2-89)
Prescribed by ANSI Sit. Z39-18298-102

_ _o_ 3
_ (.11 • _
c3 _ ,=! Q.0
z (D0 _
_J
3


