Embed Size (px)
Citation preview
Diving Into the Shared Pool – An In Depth Look at Tuning the Shared Pool
Michael Ault
Introduction
Perhaps one of the least understood areas of Oracle Shared Global Area tuning is tuning the shared pool. The generally accepted tuning methodology involves throwing memory into the pool until either the problem goes under or the problem is masked. In this article we will examine the shared pool and define a method for tuning the shared pool that uses measurement, not guesswork to drive the tuning methodologies.
What is the shared pool?
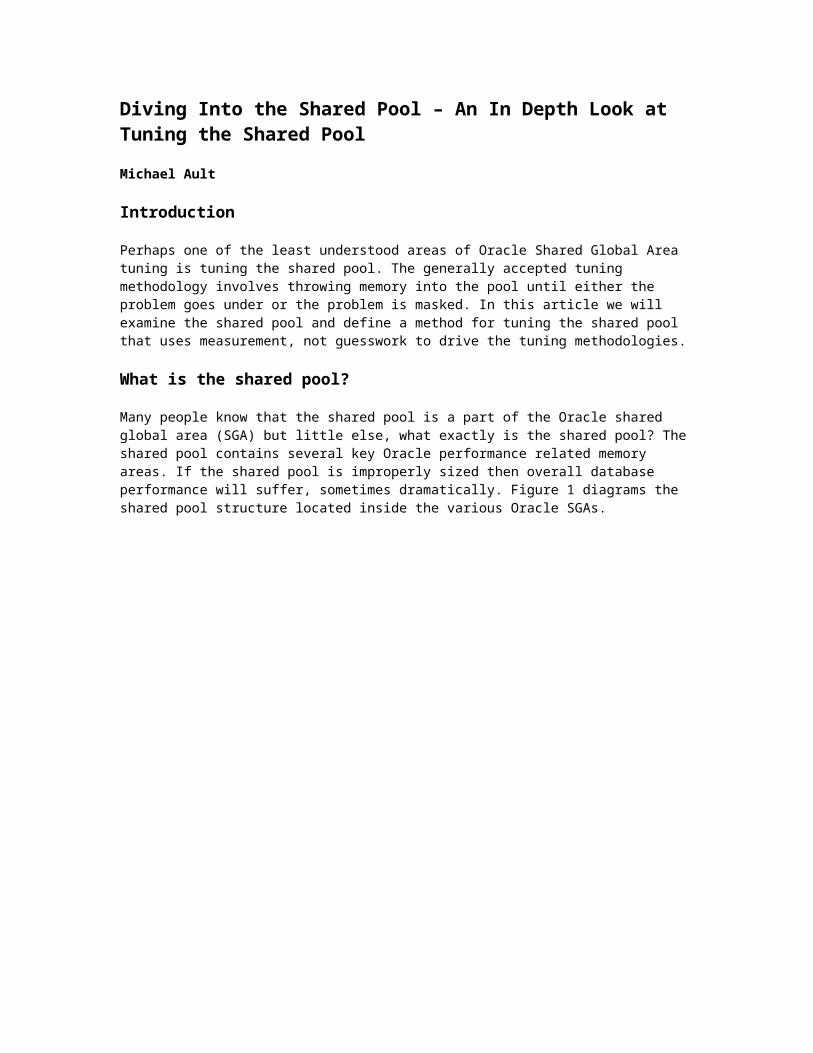
Many people know that the shared pool is a part of the Oracle shared global area (SGA) but little else, what exactly is the shared pool? The shared pool contains several key Oracle performance related memory areas. If the shared pool is improperly sized then overall database performance will suffer, sometimes dramatically. Figure 1 diagrams the shared pool structure located inside the various Oracle SGAs.
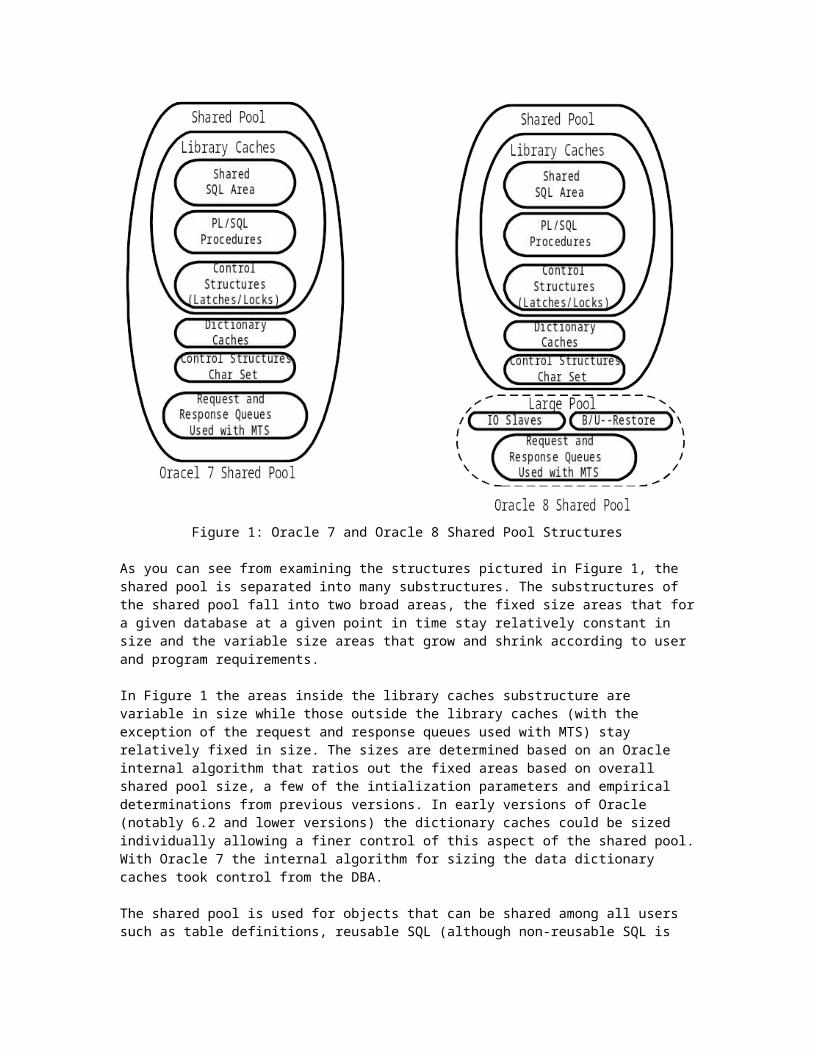
Figure 1: Oracle 7 and Oracle 8 Shared Pool Structures
As you can see from examining the structures pictured in Figure 1, the shared pool is separated into many substructures. The substructures of the shared pool fall into two broad areas, the fixed size areas that fora given database at a given point in time stay relatively constant in size and the variable size areas that grow and shrink according to user and program requirements.
In Figure 1 the areas inside the library caches substructure are variable in size while those outside the library caches (with the exception of the request and response queues used with MTS) stay relatively fixed in size. The sizes are determined based on an Oracle internal algorithm that ratios out the fixed areas based on overall shared pool size, a few of the intialization parameters and empirical determinations from previous versions. In early versions of Oracle (notably 6.2 and lower versions) the dictionary caches could be sized individually allowing a finer control of this aspect of the shared pool.With Oracle 7 the internal algorithm for sizing the data dictionary caches took control from the DBA.
The shared pool is used for objects that can be shared among all users such as table definitions, reusable SQL (although non-reusable SQL is
also stored there), PL/SQL packages, procedures and functions. Cursor information is also stored in the shared pool. At a minimum the shared pool must be sized to accommodate the needs of the fixed areas plus a small amount of memory reserved for use in parsing SQL and PL/SQL statements or ORA-07445 errors will result.
Monitoring and Tuning the Shared Pool
Let me begin this section by stating that the default values for the shared pool size initialization parameters are almost always too small by at least a factor of four. Unless your database is limited to the basic scott/tiger type schema and your overall physical data size is less than a couple of hundred megabytes, even the "large" parameters arefar too small. What parameters control the size of the shared pool? Essentially only one, SHARED_POOL_SIZE. The other shared pool parameterscontrol how the variable space areas in the shared pool are parsed out, but not overall shared pool size. In Oracle8 a new area, the large pool,controlled by the LARGE_POOL_SIZE parameter is also present. Generally speaking I suggest you start at a shared pool size of 40 megabytes and move up from there. The large pool size will depend on the number of concurrent users, number of multi-threaded server servers and dispatchers and the sort requirements for the application.
What should be monitored to determine if the shared pool is too small? For this you need to wade into the data dictionary tables, specifically the V$SGASTAT and V$SQLAREA views. Figure 2 shows a report that shows how much of the shared pool is in use at any given time the script is run.
REM Script to report on shared pool usageREMcolumn shared_pool_used format 9,999.99column shared_pool_size format 9,999.99column shared_pool_avail format 9,999.99column shared_pool_pct format 999.99@title80 'Shared Pool Summary'spool rep_out\&db\shared_poolselect sum(a.bytes)/(1024*1024) shared_pool_used, max(b.value)/(1024*1024) shared_pool_size, (max(b.value)/(1024*1024))-(sum(a.bytes)/(1024*1024)) shared_pool_avail, (sum(a.bytes)/max(b.value))*100 shared_pool_pct from v$sgastat a, v$parameter b where a.name in ( 'reserved stopper', 'table definiti',
'dictionary cache', 'library cache', 'sql area','PL/SQL DIANA','SEQ S.O.') andb.name='shared_pool_size';spool offttitle off
Figure 2: Example Script to Show SGA Usage
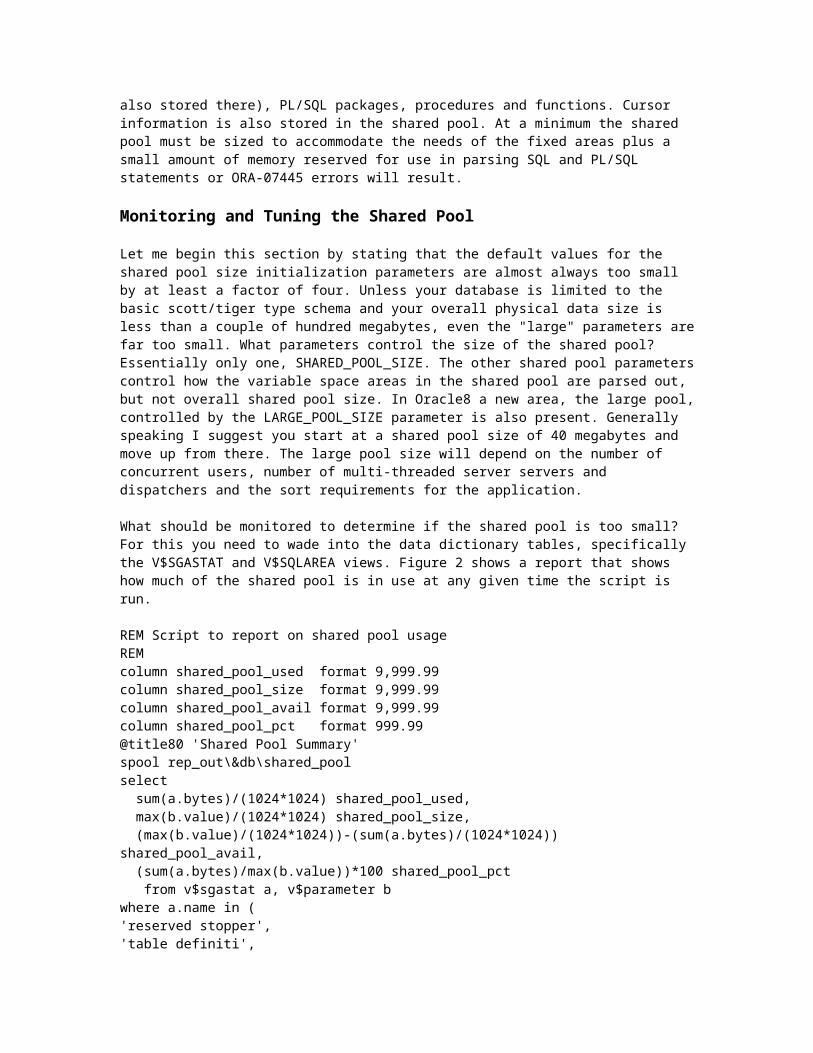
The script in Figure 2 should be run periodically during times of normaland high usage of your database. The results will be similar to Figure 3. If your shared_pool_pct figures stay in the high nineties then you may need to increase the size of your shared pool, however, this isn't always the case.
Date: 11/18/98 Page: 1 Time: 04:16 PM Shared Pool Summary SYSTEM ORTEST1 database SHARED_POOL_USED SHARED_POOL_SIZE SHARED_POOL_AVAIL SHARED_POOL_PCT ---------------- ---------------- ----------------- --------------- 3.66 38.15 34.49 9.60
Figure 3: Example Output From Script In Figure 2.
To often all that is monitored is how much of the shared pool is filled,no one looks how is it filled; with good reusable SQL or bad throw away SQL. You must examine how the space is being used before you can decide whether the shared pool should be increased in size, decreased in size or perhaps a periodic flush schedule set up with the size remaining the same. So how can we determine what is in the shared pool and whether itis being properly reused or not? Let's look at a few more reports.
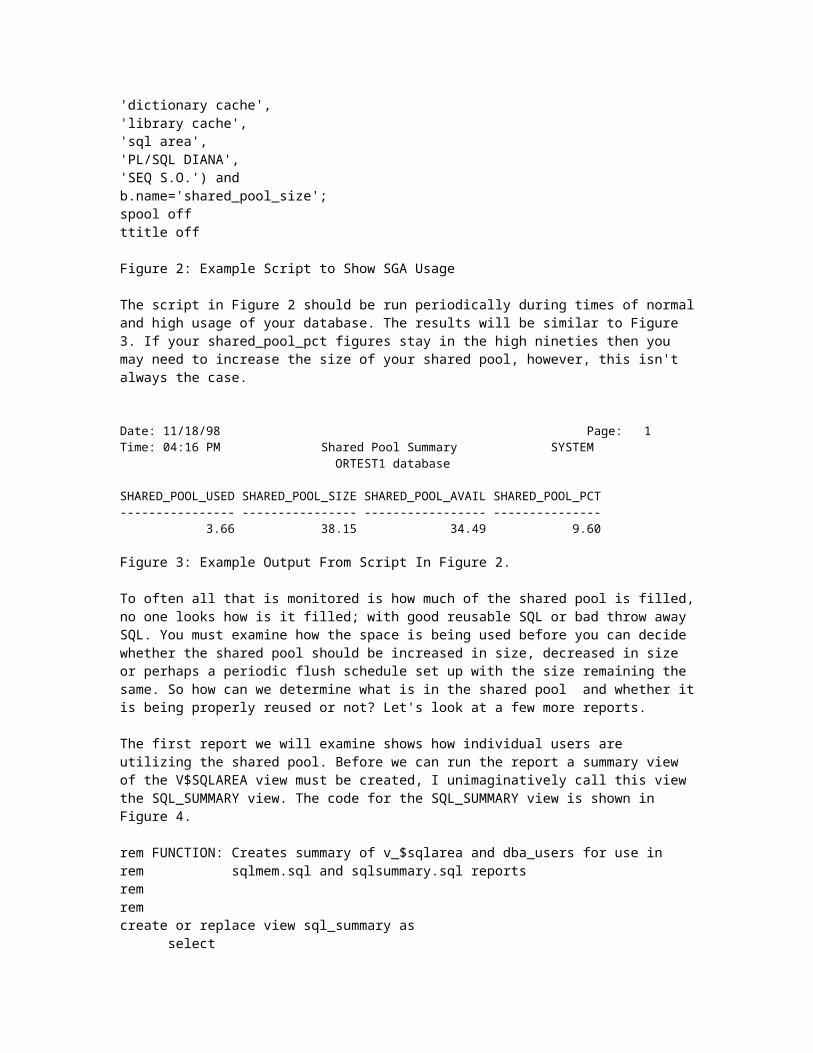
The first report we will examine shows how individual users are utilizing the shared pool. Before we can run the report a summary view of the V$SQLAREA view must be created, I unimaginatively call this view the SQL_SUMMARY view. The code for the SQL_SUMMARY view is shown in Figure 4.
rem FUNCTION: Creates summary of v_$sqlarea and dba_users for use inrem sqlmem.sql and sqlsummary.sql reportsremremcreate or replace view sql_summary as
select
username, sharable_mem, persistent_mem, runtime_memfrom
sys.v_$sqlarea a, dba_users bwhere
a.parsing_user_id = b.user_id;rem
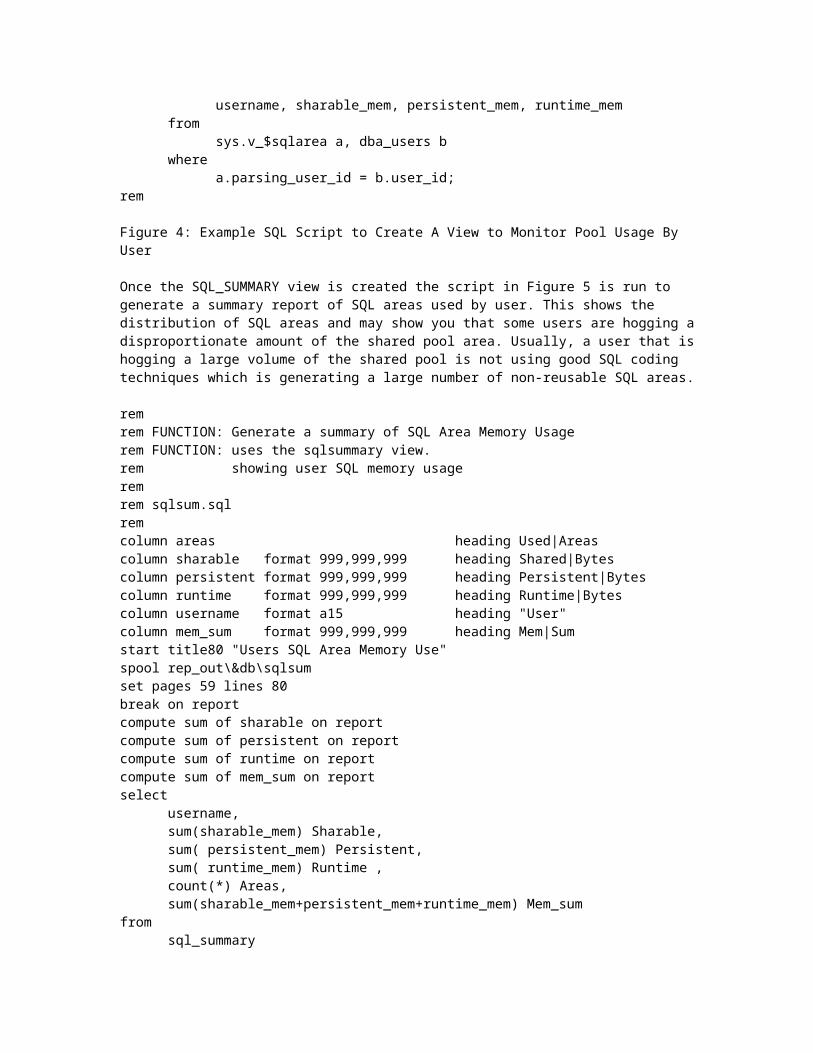
Figure 4: Example SQL Script to Create A View to Monitor Pool Usage By User
Once the SQL_SUMMARY view is created the script in Figure 5 is run to generate a summary report of SQL areas used by user. This shows the distribution of SQL areas and may show you that some users are hogging adisproportionate amount of the shared pool area. Usually, a user that ishogging a large volume of the shared pool is not using good SQL coding techniques which is generating a large number of non-reusable SQL areas.
remrem FUNCTION: Generate a summary of SQL Area Memory Usagerem FUNCTION: uses the sqlsummary view.rem showing user SQL memory usage remrem sqlsum.sql remcolumn areas heading Used|Areascolumn sharable format 999,999,999 heading Shared|Bytescolumn persistent format 999,999,999 heading Persistent|Bytescolumn runtime format 999,999,999 heading Runtime|Bytescolumn username format a15 heading "User" column mem_sum format 999,999,999 heading Mem|Sumstart title80 "Users SQL Area Memory Use"spool rep_out\&db\sqlsumset pages 59 lines 80 break on report compute sum of sharable on reportcompute sum of persistent on reportcompute sum of runtime on reportcompute sum of mem_sum on reportselect
username, sum(sharable_mem) Sharable, sum( persistent_mem) Persistent, sum( runtime_mem) Runtime , count(*) Areas,sum(sharable_mem+persistent_mem+runtime_mem) Mem_sum
from sql_summary
group by usernameorder by 2;spool offpause Press enter to continueclear columnsclear breaksset pages 22 lines 80ttitle off
Figure 5: Example SQL Script To Report On SQL Area Usage By User
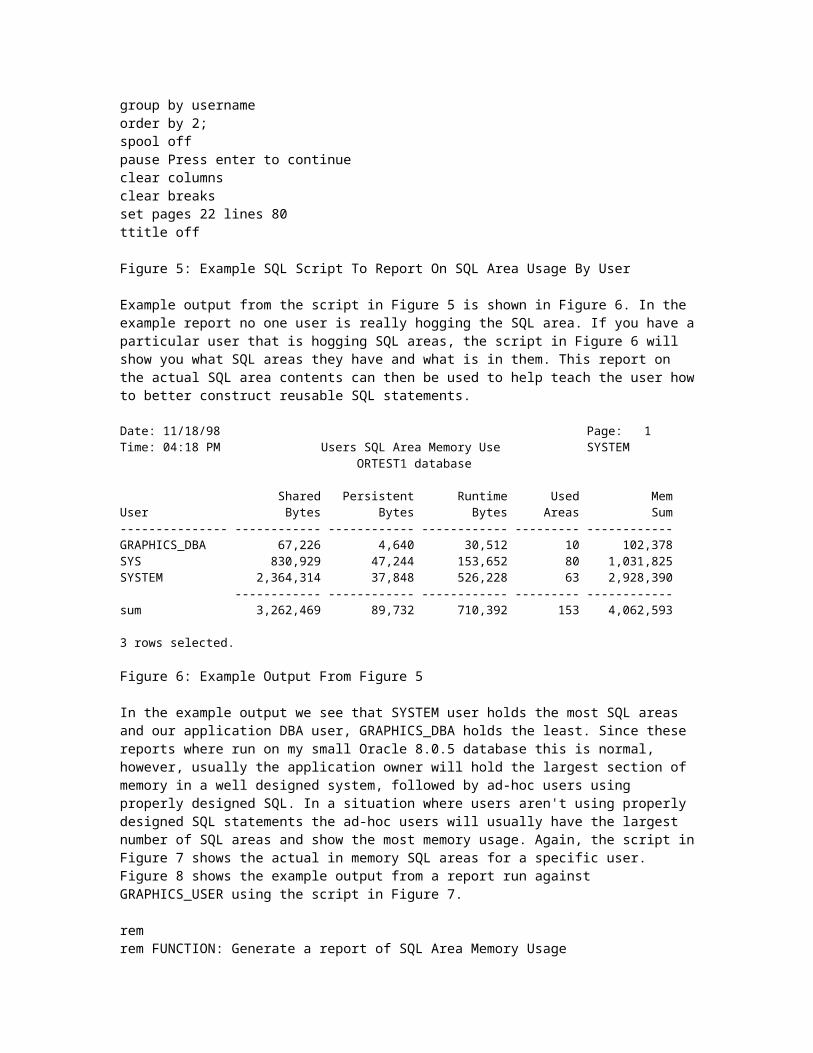
Example output from the script in Figure 5 is shown in Figure 6. In the example report no one user is really hogging the SQL area. If you have aparticular user that is hogging SQL areas, the script in Figure 6 will show you what SQL areas they have and what is in them. This report on the actual SQL area contents can then be used to help teach the user howto better construct reusable SQL statements.
Date: 11/18/98 Page: 1 Time: 04:18 PM Users SQL Area Memory Use SYSTEM ORTEST1 database Shared Persistent Runtime Used Mem User Bytes Bytes Bytes Areas Sum --------------- ------------ ------------ ------------ --------- ------------ GRAPHICS_DBA 67,226 4,640 30,512 10 102,378 SYS 830,929 47,244 153,652 80 1,031,825 SYSTEM 2,364,314 37,848 526,228 63 2,928,390 ------------ ------------ ------------ --------- ------------ sum 3,262,469 89,732 710,392 153 4,062,593
3 rows selected.
Figure 6: Example Output From Figure 5
In the example output we see that SYSTEM user holds the most SQL areas and our application DBA user, GRAPHICS_DBA holds the least. Since these reports where run on my small Oracle 8.0.5 database this is normal, however, usually the application owner will hold the largest section of memory in a well designed system, followed by ad-hoc users using properly designed SQL. In a situation where users aren't using properly designed SQL statements the ad-hoc users will usually have the largest number of SQL areas and show the most memory usage. Again, the script inFigure 7 shows the actual in memory SQL areas for a specific user. Figure 8 shows the example output from a report run against GRAPHICS_USER using the script in Figure 7.
remrem FUNCTION: Generate a report of SQL Area Memory Usage
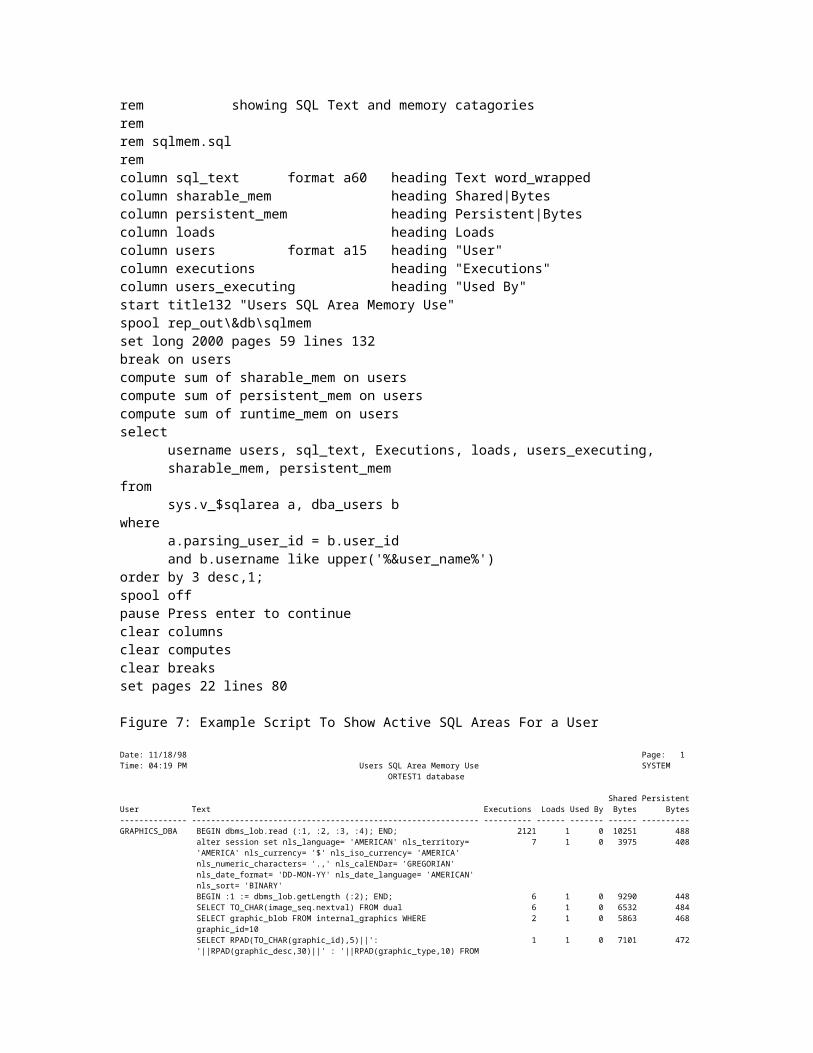
rem showing SQL Text and memory catagoriesremrem sqlmem.sql remcolumn sql_text format a60 heading Text word_wrappedcolumn sharable_mem heading Shared|Bytescolumn persistent_mem heading Persistent|Bytescolumn loads heading Loadscolumn users format a15 heading "User"column executions heading "Executions"column users_executing heading "Used By"start title132 "Users SQL Area Memory Use"spool rep_out\&db\sqlmemset long 2000 pages 59 lines 132break on userscompute sum of sharable_mem on userscompute sum of persistent_mem on userscompute sum of runtime_mem on usersselect
username users, sql_text, Executions, loads, users_executing, sharable_mem, persistent_mem
from sys.v_$sqlarea a, dba_users b
where a.parsing_user_id = b.user_idand b.username like upper('%&user_name%')
order by 3 desc,1;spool offpause Press enter to continueclear columnsclear computesclear breaksset pages 22 lines 80
Figure 7: Example Script To Show Active SQL Areas For a User
Date: 11/18/98 Page: 1 Time: 04:19 PM Users SQL Area Memory Use SYSTEM ORTEST1 database Shared Persistent User Text Executions Loads Used By Bytes Bytes -------------- ------------------------------------------------------------ ---------- ------ ------- ------ ---------- GRAPHICS_DBA BEGIN dbms_lob.read (:1, :2, :3, :4); END; 2121 1 0 10251 488 alter session set nls_language= 'AMERICAN' nls_territory= 7 1 0 3975 408 'AMERICA' nls_currency= '$' nls_iso_currency= 'AMERICA' nls_numeric_characters= '.,' nls_calENDar= 'GREGORIAN' nls_date_format= 'DD-MON-YY' nls_date_language= 'AMERICAN' nls_sort= 'BINARY' BEGIN :1 := dbms_lob.getLength (:2); END; 6 1 0 9290 448 SELECT TO_CHAR(image_seq.nextval) FROM dual 6 1 0 6532 484 SELECT graphic_blob FROM internal_graphics WHERE 2 1 0 5863 468 graphic_id=10 SELECT RPAD(TO_CHAR(graphic_id),5)||': 1 1 0 7101 472 '||RPAD(graphic_desc,30)||' : '||RPAD(graphic_type,10) FROM

internal_graphics ORDER BY graphic_id SELECT graphic_blob FROM internal_graphics WHERE 1 1 0 6099 468 graphic_id=12 SELECT graphic_blob FROM internal_graphics WHERE 1 1 0 6079 468 graphic_id=32 SELECT graphic_blob FROM internal_graphics WHERE 1 1 0 6074 468 graphic_id=4 SELECT graphic_blob FROM internal_graphics WHERE 1 1 0 5962 468 graphic_id=8 *************** ------ --------- sum 67226 4640
Figure 8: Report Output Example For a Users SQL Area
One warning about the script in figure 7, the report it generates can run to several hundred pages for a user with a large number of SQL areas. What things should you watch for in a user's SQL areas? First, watch for the non-use of bind variables, bind variable usage is shown bythe inclusion of variables such as ":1" or ":B" in the SQL text. Notice that in the example report in Figure 8 the first four statements use bind variables, and, consequently are reusable. Non-bind usage means hard coded values such as 'Missing' or '10' are used. Notice that for most of the rest of the statements in the report no bind variables are used even though many of the SQL statements are nearly identical. This is one of the leading causes of shared pool misuse and results in usefulSQL being drown in tons of non-reusable garbage SQL.
The problem with non-reusable SQL is that it must still be looked at by any new SQL inserted into the pool (actually it's hash value is scanned). While a hash value scan may seem a small cost item, if your shared pool contains tens of thousands of SQL areas this can be a performance bottleneck. How can we determine, without running the reportin Figure 7 for each of possibly hundreds of users, if we have garbage SQL in the shared pool?
The script in Figure 9 shows a view that provides details on individual users SQL area reuse. The view can be tailored to your environment if the limit on reuse (currently set at 1) is too restrictive. For example, in a recent tuning assignment resetting the value to 12 resulting in nearly 70 percent of the SQL being rejected as garbage SQL,in DSS or data warehouse systems where rollups are performed by the month, bi-monthly or weekly values of 12, 24 or 52 might be advisable. Figure 10 shows a report script that uses the view created in Figure 9.
REMREM View to sort SQL into GOOD and GARBAGEREMCREATE OR REPLACE VIEW sql_garbage ASSELECT b.username users, SUM(a.sharable_mem+a.persistent_mem) Garbage, TO_NUMBER(null) good
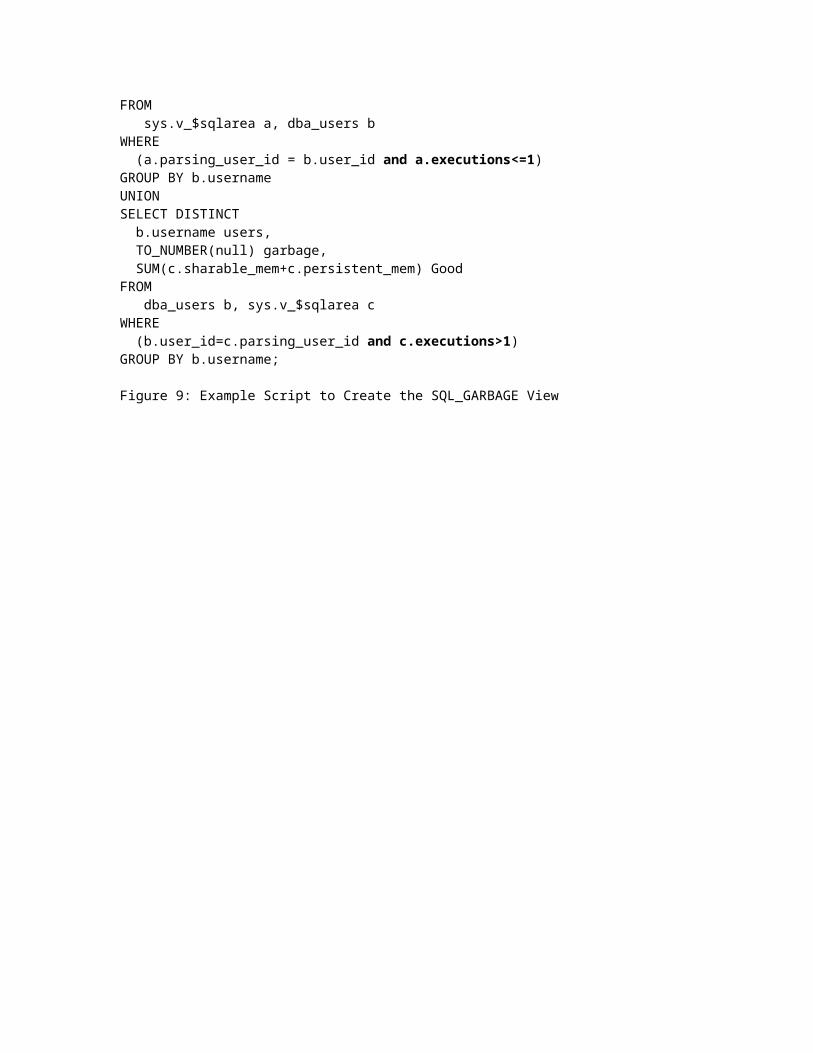
FROM sys.v_$sqlarea a, dba_users bWHERE (a.parsing_user_id = b.user_id and a.executions<=1)GROUP BY b.usernameUNIONSELECT DISTINCT b.username users, TO_NUMBER(null) garbage, SUM(c.sharable_mem+c.persistent_mem) GoodFROM dba_users b, sys.v_$sqlarea cWHERE (b.user_id=c.parsing_user_id and c.executions>1)GROUP BY b.username;
Figure 9: Example Script to Create the SQL_GARBAGE View
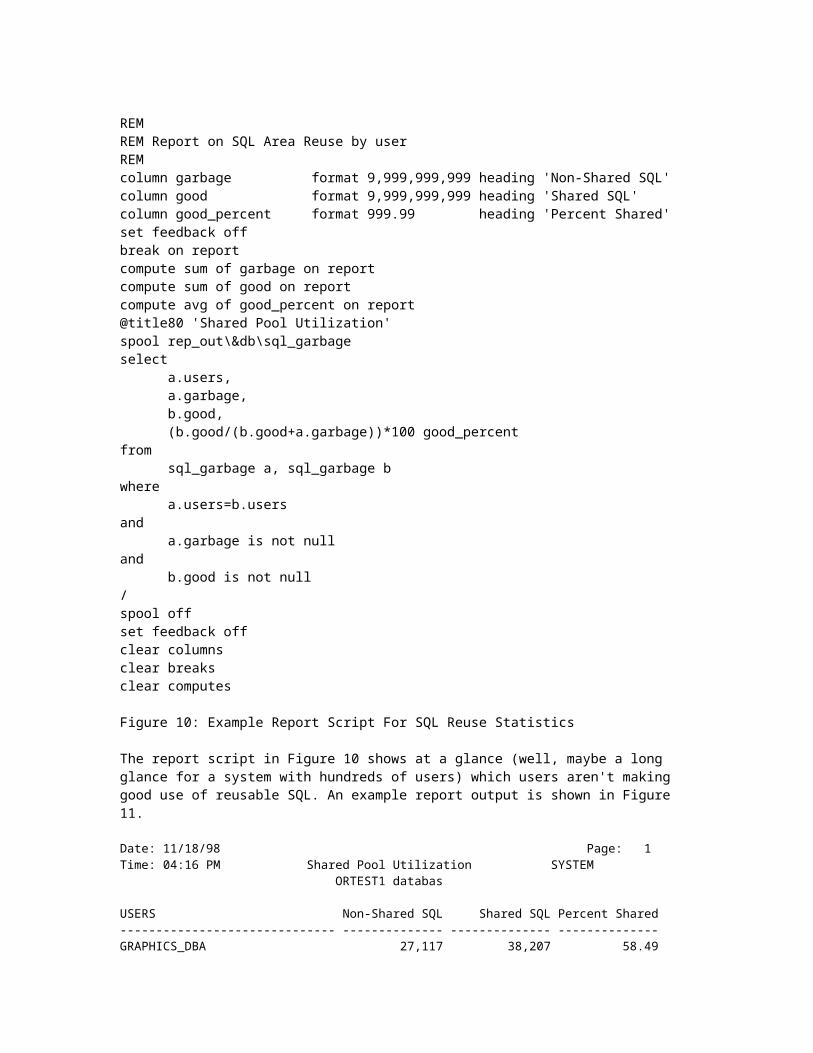
REMREM Report on SQL Area Reuse by userREMcolumn garbage format 9,999,999,999 heading 'Non-Shared SQL'column good format 9,999,999,999 heading 'Shared SQL'column good_percent format 999.99 heading 'Percent Shared'set feedback off break on reportcompute sum of garbage on reportcompute sum of good on reportcompute avg of good_percent on report@title80 'Shared Pool Utilization'spool rep_out\&db\sql_garbageselect
a.users, a.garbage,b.good,(b.good/(b.good+a.garbage))*100 good_percent
from sql_garbage a, sql_garbage b
where a.users=b.users
and a.garbage is not null
and b.good is not null
/spool offset feedback offclear columnsclear breaksclear computes
Figure 10: Example Report Script For SQL Reuse Statistics
The report script in Figure 10 shows at a glance (well, maybe a long glance for a system with hundreds of users) which users aren't making good use of reusable SQL. An example report output is shown in Figure 11.
Date: 11/18/98 Page: 1 Time: 04:16 PM Shared Pool Utilization SYSTEM ORTEST1 databas USERS Non-Shared SQL Shared SQL Percent Shared------------------------------ -------------- -------------- --------------GRAPHICS_DBA 27,117 38,207 58.49

SYS 302,997 575,176 65.50SYSTEM 1,504,740 635,861 29.70 -------------- -------------- --------------avg 51.23sum 1,834,854 1,249,244
Figure 11: Example Report From Showing SQL Reuse Statistics
Notice in Figure 11 that the GRAPHICS_DBA user only shows 58.49% shared SQL use based on memory footprints. From the report in Figure 8 we wouldexpect a low reuse value for GRAPHICS_DBA. The low reuse value for the SYSTEM user is due to its use as a monitoring user, the monitoring SQL is designed to be used once per day or so and was not built with reuse in mind.
Putting it All In Perspective
So what have we seen so far? We have examined reports that show both gross and detailed shared pool usage and whether or not shared areas arebeing reused. What can we do with this data? Ideally we will use the results to size our shared pool properly. Let's set out a few general guidelines for shared pool sizing:
Guideline 1: If gross usage of the shared pool in a non-ad-hoc environment exceeds 95% (rises to 95% or greater and stays there) establish a shared pool size large enough to hold the fixed size portions, pin reusable packages and procedures and then increase shared pool by 20% increments until usage drops below 90% on the average.
Guideline 2: If the shared pool shows a mixed ad-hoc and reuse environment establish a shared pool size large enough to hold the fixed size portions, pin reusable packages and establish a comfort level abovethis required level of pool fill, then establish a routine flush cycle to filter non-reusable code from the pool.
Guideline 3: If the shared pool shows that no reusable SQL is being usedestablish a shared pool large enough to hold the fixed size portions plus a few megabytes (usually not more than 40) and allow the shared pool modified least recently used (LRU) algorithm to manage the pool.
In guidelines 1, 2 and 3, start at around 40 megabytes for a standard size system. Notice in guideline 2 it is stated that a routine flush cycle should be instituted. This flies in the face of what Oracle Support pushes in their shared pool white papers, however, they work from the assumption that proper SQL is being generated and you want to reuse the SQL present in the shared pool. In a mixed environment where there is a mixture of reusable and non-reusable SQL the non-reusable SQL

will act as a drag against the other SQL (I call this shared pool thrashing) unless it is periodically removed by flushing. Figure 12 shows a PL/SQL package which can be used by the DBMS_JOB job queues to periodically flush the shared pool only when it exceeds a specified percent full.
PROCEDURE flush_it(p_free IN NUMBER) IS--CURSOR get_share ISSELECT
SUM(a.bytes)FROM
v$sgastat a WHERE
a.name in ( 'reserved stopper', 'table definiti', 'dictionary cache', 'library cache', 'sql area','PL/SQL DIANA','SEQ S.O.');
--CURSOR get_var IS SELECT value FROM v$parameter WHERE name = 'shared_pool_size';--CURSOR get_time IS SELECT sysdate FROM dual;-- todays_date DATE; mem_ratio NUMBER; share_mem NUMBER; variable_mem NUMBER; cur INTEGER; sql_com VARCHAR2(60); row_proc NUMBER;--BEGIN OPEN get_share;

OPEN get_var; FETCH get_share INTO share_mem; DBMS_OUTPUT.PUT_LINE('share_mem: '||to_char(share_mem)); FETCH get_var INTO variable_mem; DBMS_OUTPUT.PUT_LINE('variable_mem: '||to_char(variable_mem)); mem_ratio:=share_mem/variable_mem; DBMS_OUTPUT.PUT_LINE(TO_CHAR(mem_ratio,'99.999')||' '||TO_CHAR(p_free/100,'99.999')); IF mem_ratio>p_free/100 THEN cur:=DBMS_SQL.OPEN_CURSOR; sql_com:='ALTER SYSTEM FLUSH SHARED_POOL'; DBMS_SQL.PARSE(cur,sql_com,dbms_sql.v7); row_proc:=DBMS_SQL.EXECUTE(cur); DBMS_SQL.CLOSE_CURSOR(cur); OPEN get_time; FETCH get_time INTO todays_date; INSERT INTO dba_running_stats VALUES ('Flush of Shared Pool',mem_ratio,35,todays_date,0); COMMIT; END IF;END flush_it;
Figure 12: Example Script to Run a Shared Pool Flush Routine
The command set to perform a flush on a once every 30 minute cycle when the pool reaches 95% full would be:
VARIABLE x NUMBER;BEGINdbms_job.submit(:X,'BEGIN dbms_revealnet.flush_it(95); END;',SYSDATE,'SYSDATE+(30/1440)’);END;/COMMIT;(Always commit after assigning a job or the job will not be run and queued)
There is always a discussion as to whether this really does help performance so I set up a test on a production instance where on day 1 Idid no automated flushing and on day 2 I instituted the automated flushing. Figure 13 shows the graphs of performance indicators, flush cycles and users.
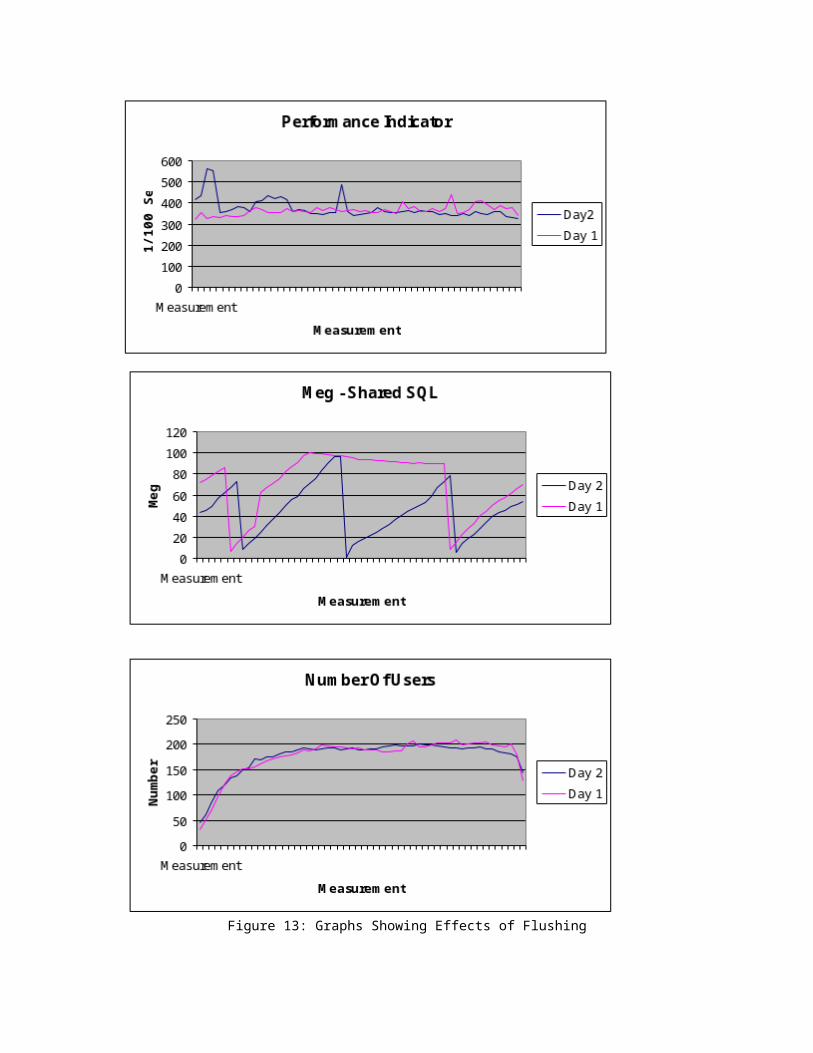
Figure 13: Graphs Showing Effects of Flushing

The thing to notice about the graphs in Figure 13 is the overall trend of the performance indicator between day 1 and day 2. On day 1 (the day with an initial flush as indicated by the steep plunge on the pool utilization graph followed by the buildup to maximum and the flattening of the graph) the performance indicator shows an upward trend. The performance indicator is a measure of how long the database takes to do a specific set of tasks (from the Q Diagnostic tool from Savant Corporation). Therefore an increase in the performance indicator indicates a net decrease in performance. On day 2 the overall trend is downward with the average value less than the average value from day 1. Overall the flushing improved the performance as indicated by the performance indicator by 10 to 20 percent. Depending on the environment I have seen improvements of up to 40-50 percent.
One thing that made the analysis difficult was that on day 2 there were several large batch jobs run which weren’t run on day 1. The results still show that flushing has a positive effect on performance when the database is a mixed SQL environment with a large percentage of non-reusable SQL areas.
Guideline 3 also brings up an interesting point, you may already have over allocated the shared pool, in this case guideline 3 may result in you decreasing the size of the shared pool. In this situation the sharedpool has become a cesspool filled with nothing but garbage SQL. After allocating enough memory for dictionary objects and other fixed areas and ensuring that the standard packages and such are pinned, you should only maintain a few megabytes above and beyond this level of memory for SQL statements. Since none of the code is being reused you want to reduce the hash search overhead as mush as possible, you do this by reducing the size of the available SQL area memory so as few a number ofstatements are kept as possible.
What to Pin
In all of the rules stated so far I mention that the memory is usually allocated above and beyond that needed for fixed size areas and pinned objects. How do you determine what to pin? Generally speaking any package, procedure, function or cursor that is frequently used by your application should be pinned into the shared pool when the database is started. I suggest adding a “null” startup function to every in house generated package it essentially looks like figure 14.
FUNCTION start_up RETURN number ISRet NUMBER:=1;BEGINRet:=0

RETURN ret;END start_up;
Figure 14: Example Null Startup Function
The purpose of the null startup function is to provide a touch point to pull the entire package into the shared pool. This allows you to create a startup SQL procedure that pulls all of the application packages into the pool and pins them using the DBMS_SHARED_POOL package. The DBMS_SHARED_POOL package may have to be built in earlier releases of Oracle. The DBMS_SHARED_POOL package is built using the DBMSPOOL.SQL andPRVTPOOL.PLB scripts located in (UNIX) $ORACLE_HOME/rdbms/admin or (NT) x:\orant\rdbms\admin (where x: is the home drive for your install).
How do you determine what packages, procedures of functions to pin? Actually, Oracle has made this easy by providing the V$DB_OBJECT_CACHE view that shows all objects in the pool, and, more importantly, how theyare being utilized. The script in Figure 15 provides a list of objects that have been loaded more than once and have executions greater than one. Some example output from this script is shown in figure 16. A rule of thumb is that if an object is being frequently executed and frequently reloaded it should be pinned into the shared pool.

remrem FUNCTION: Report Stored Object Statisticsremcolumn owner format a11 heading Schemacolumn name format a30 heading Object|Namecolumn namespace heading Name|Spacecolumn type heading Object|Typecolumn kept format a4 heading Keptcolumn sharable_mem format 999,999 heading Shared|Memorycolumn executions format 999,999 heading Executesset lines 132 pages 47 feedback off@title132 'Oracle Objects Report'break on owner on namespace on typespool rep_out/&db/o_statselect
OWNER, NAMESPACE,TYPE,NAME,SHARABLE_MEM,LOADS, EXECUTIONS, LOCKS, PINS,KEPT
from v$db_object_cache
where type not in (
'NOT LOADED','NON-EXISTENT','VIEW','TABLE','SEQUENCE')and executions>0 and loads>1 and kept='NO'
order by owner,namespace,type,executions desc;spool offset lines 80 pages 22 feedback onclear columnsclear breaksttitle offFigure 15: Script to Show Objects Which Should Be Kept
The output from the script in figure 15 is shown in Figure 16. Notice the objects with high executions.
Date: 11/20/98 Page: 1Time: 09:59 AM Oracle Objects Report AULTM AGCD database
Name Object Object SharedSchema Space Type Name Memory LOADS Executes LOCKS PINS Kept------ --------------- -------------- ---------------------------- -------- --------- -------- --------- --------- ----

SYS BODY PACKAGE BODY DBMS_EXPORT_EXTENSION 6,957 1 1,338 1 0 NO DBMS_SQL 11,016 1 50 1 0 NO DBMS_SYS_SQL 21,428 1 50 1 0 NO DBMS_DEFER_IMPORT_INTERNAL 4,070 1 50 1 0 NO STANDARD 26,796 1 50 1 0 NO DBMS_APPLICATION_INFO 4,585 1 8 1 0 NO DBMS_OUTPUT 8,799 1 1 1 0 NO TABLE/PROCEDURE PACKAGE DBMS_EXPORT_EXTENSION 12,269 1 1,355 1 0 NO DBMS_DEFER_IMPORT_INTERNAL 10,662 1 51 1 0 NO DBMS_SQL 6,960 1 50 1 0 NO STANDARD 118,556 1 50 1 0 NO DBMS_SYS_SQL 7,472 1 50 1 0 NO DBMS_APPLICATION_INFO 11,569 1 9 1 0 NO DBMS_OUTPUT 13,391 1 1 1 0 NO
Figure 17: Example Output From the Script In Figure 16.
Unfortunately in my active instance I already have the objects pinned that are required, but the example report in Figure 17 taken from one ofmy less active instances still shows the concept. Note that you only have to pin the package, not the package and package body.
Guideline 4: Always determine usage patterns of packages, procedures, functions and cursors and pin those that are frequently used.
The Shared Pool and MTS
The use of the multi-threaded server option (MTS) in Oracle requires a sometimes dramatic increase in the size of the shared pool. This increase in the size of the shared pool caused by MTS is due to the addition of the user global areas required for sorting and message queues. If you are using MTS you should monitor the V$SGASTAT values forMTS related memory areas and adjust the shared pool memory allocations accordingly.
Note that in Oracle 8 you should make use of the large pool feature to pull the user global areas (UGA) and multi-threaded server queues out ofthe shared pool area if MTS is being used. This prevents the fragmentation problems which have been reported in shared pools when MTSis used without allocating the large pool.
Guideline 5: In Oracle7when using MTS increase the shared pool size to accommodate MTS messaging and queuing as well as UGA requirements, in Oracle8 use the Large Pool to prevent MTS from effecting the shared poolareas.
A Matter Of Hashing
We have discussed hashing in prior sections, essentially each SQL statement is hashed and this hash value is then used to compare to already stored SQL areas, if a matching hash is found the statements arecompared. The hash is only calculated based on the first 200 or so characters in the SQL statement, so extremely long SQL statements can

result in multiple hashes being the same even though the stored SQL is different (if the first 200 or so characters in each statement are identical). This is another argument for using stored procedures and functions to perform operations and for the use of bind variables.
If the number of large, nearly identical statements is high, then the number of times the parser has to compare a new SQL statement to existing SQL statements with the same hash value increases. This resultsin a higher statement overhead and poorer performance. You should identify these large statements and encourage users to re-write them using bind variables or to proceduralize them using PL/SQL. The report in Figure 18 will show if you have a problem with multiple statements being hashed to the same value.
Rem:rem: FUNCTION: Shows by user who has possiblerem: SQL reuse problemsrem:column total_hash heading 'Total Hash|Values'column same_hash heading 'SQL With|Same Hash'column u_hash_ratio format 999.999 heading 'SQL Sharing|Hash'start title80 'Shared Hash Value Report'spool rep_out\&&db\shared_hash.lstbreak on reportcompute sum of total_hash on report compute sum of same_hash on reportselect
a.username,count(b.hash_value) total_hash, count(b.hash_value)-count(unique(b.hash_value)) same_hash,
(count(unique(b.hash_value))/count(b.hash_value))*100 u_hash_ratiofrom
dba_users a, v$sqlarea b
where a.user_id=b.parsing_user_id
group by a.username;
clear computes
Figure 18: Example Script to Report on Hashing Problems
The script in figure 18 produces a report similar to that shown in Figure 19. The report in Figure 19 shows which users are generating SQL that hashes to the same values. Once you have a user isolated you can then run the script in figure 7 to find the bad SQL statements.

Date: 11/20/98 Page: 1Time: 11:40 AM Shared Hash Value Report AULTM DCARS database
Total Hash SQL With SQL SharingUSERNAME Values Same Hash Hash------------------------------ ---------- --------- -----------AULTM 129 0 100.000DCARS 6484 58 99.105MCNAIRT 20 0 100.000PASSMAP 2 0 100.000QDBA 109 0 100.000RCAPS 270 0 100.000RCOM 342 7 97.953REPORTS1 28 0 100.000SECURITY_ADMIN 46 0 100.000SYS 134 0 100.000 ---------- ---------sum 7564 65
Figure 18: Hash Report
A quick glance at the report in Figure 18 shows that I need to look at the DCARS user to correct hashing problems they might be having and improve the reuse of SQL in the shared pool. However, look at the numberof hash areas this user has accumulated, 6,484, if I run the report fromfigure 7 it will out weigh the paper version of the Oracle documentationset. A faster way to find the hash values would be to do a self join andfilter out the hash values that are duplicate. Sounds easy enough, but remember, the V$ tables have no rowids so you can’t use the classic methods, you have to find another column that will be different when theHASH_VALUE column in V$SQLAREA is the same. Look at the select which follows:
select a.hash_value from v$sqlarea a, v$sqlarea bwhere a.hash_value=b.hash_value anda.FIRST_LOAD_TIME != b.FIRST_LOAD_TIME
This select should give the problem hash values then it is a simple matter to go back to the V$SQLAREA table and isolate the actual text. Long statements require special care to see that bind variables are usedto prevent this problem with hashing. Another help for long statements is to use views to store values at an intermediate state thus reducing the size of the variable portion of the SQL.

Guideline 6: Use bind variables, PL/SQL (procedures or functions) and views to reduce the size of large SQL statements to prevent hashing problems.
Monitoring Library and Data Dictionary Caches
I've spent most of this article looking at the shared SQL area of the shared pool. Let's wrap up with a high level look at the library and data dictionary caches. The library cache area is monitored via the V$LIBRARYCACHE view and contains the SQL area, PL/SQL area, table, indexand cluster cache areas. The data dictionary caches contain cache area for all data dictionary related definitions.
The script in Figure 21 creates a report on the library caches. The items of particular interest in the report generated by the script in Figure 21 (shown in Figure 22) are the various ratios.
remrem Title: libcache.sqlremrem FUNCTION: Generate a library cache report remcolumn namespace heading "Library Object"column gets format 9,999,999 heading "Gets"column gethitratio format 999.99 heading "Get Hit%"column pins format 9,999,999 heading "Pins"column pinhitratio format 999.99 heading "Pin Hit%"column reloads format 99,999 heading "Reloads"column invalidations format 99,999 heading "Invalid"column db format a10set pages 58 lines 80 start title80 "Library Caches Report"define output = rep_out\&db\lib_cachespool &outputselect
namespace,gets,gethitratio*100 gethitratio,pins,pinhitratio*100 pinhitratio,RELOADS,INVALIDATIONS
from v$librarycache
/spool offpause Press enter to continue
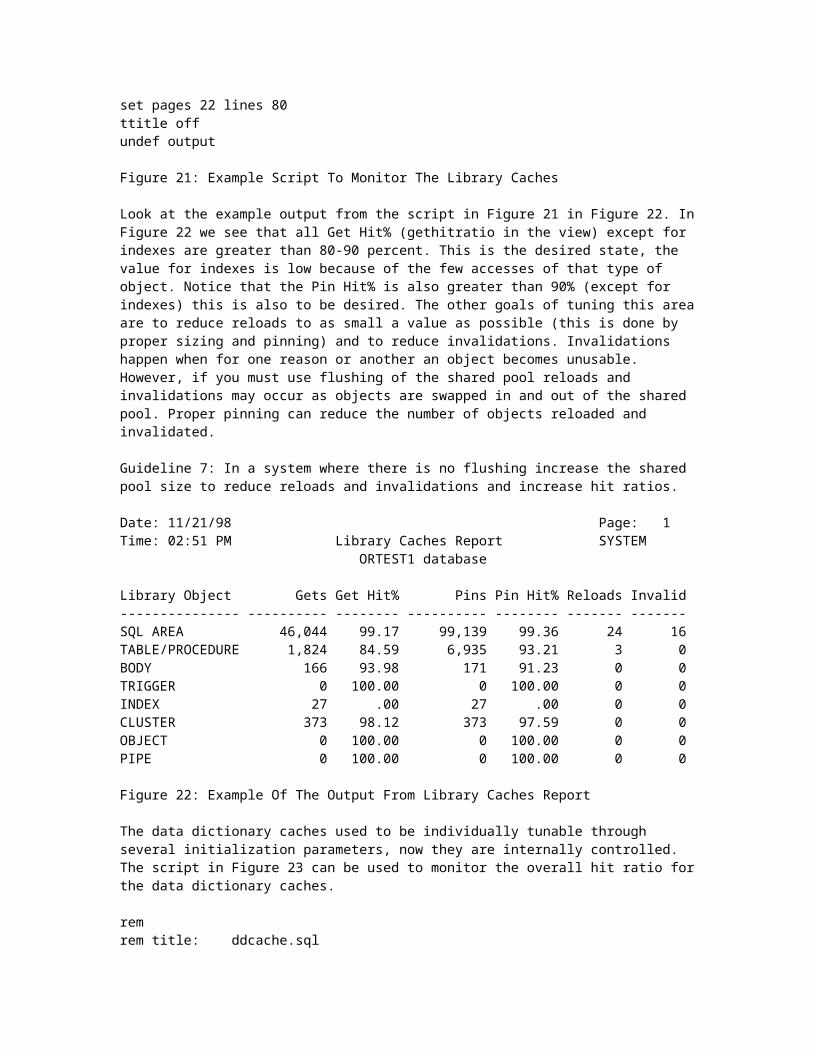
set pages 22 lines 80ttitle offundef output Figure 21: Example Script To Monitor The Library Caches
Look at the example output from the script in Figure 21 in Figure 22. InFigure 22 we see that all Get Hit% (gethitratio in the view) except for indexes are greater than 80-90 percent. This is the desired state, the value for indexes is low because of the few accesses of that type of object. Notice that the Pin Hit% is also greater than 90% (except for indexes) this is also to be desired. The other goals of tuning this areaare to reduce reloads to as small a value as possible (this is done by proper sizing and pinning) and to reduce invalidations. Invalidations happen when for one reason or another an object becomes unusable. However, if you must use flushing of the shared pool reloads and invalidations may occur as objects are swapped in and out of the shared pool. Proper pinning can reduce the number of objects reloaded and invalidated.
Guideline 7: In a system where there is no flushing increase the shared pool size to reduce reloads and invalidations and increase hit ratios.
Date: 11/21/98 Page: 1Time: 02:51 PM Library Caches Report SYSTEM ORTEST1 database
Library Object Gets Get Hit% Pins Pin Hit% Reloads Invalid--------------- ---------- -------- ---------- -------- ------- -------SQL AREA 46,044 99.17 99,139 99.36 24 16TABLE/PROCEDURE 1,824 84.59 6,935 93.21 3 0BODY 166 93.98 171 91.23 0 0TRIGGER 0 100.00 0 100.00 0 0INDEX 27 .00 27 .00 0 0CLUSTER 373 98.12 373 97.59 0 0OBJECT 0 100.00 0 100.00 0 0PIPE 0 100.00 0 100.00 0 0
Figure 22: Example Of The Output From Library Caches Report
The data dictionary caches used to be individually tunable through several initialization parameters, now they are internally controlled. The script in Figure 23 can be used to monitor the overall hit ratio forthe data dictionary caches.
remrem title: ddcache.sql
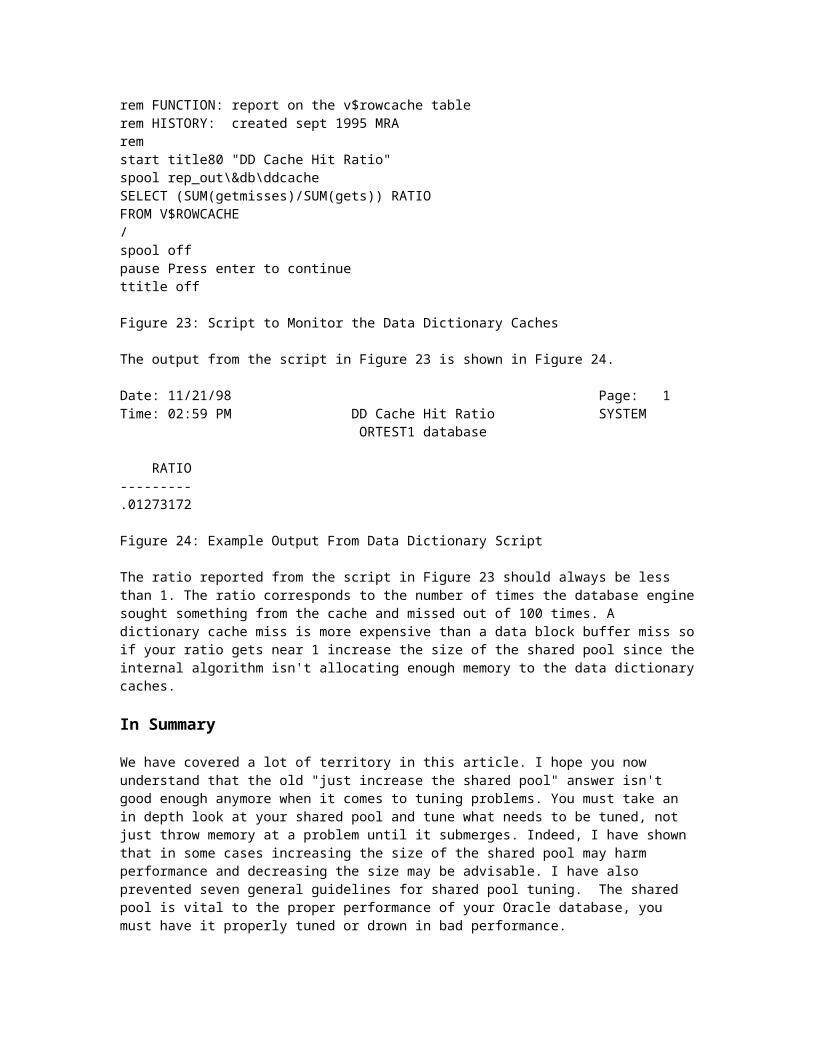
rem FUNCTION: report on the v$rowcache tablerem HISTORY: created sept 1995 MRAremstart title80 "DD Cache Hit Ratio"spool rep_out\&db\ddcacheSELECT (SUM(getmisses)/SUM(gets)) RATIOFROM V$ROWCACHE/spool offpause Press enter to continuettitle off
Figure 23: Script to Monitor the Data Dictionary Caches
The output from the script in Figure 23 is shown in Figure 24.
Date: 11/21/98 Page: 1Time: 02:59 PM DD Cache Hit Ratio SYSTEM ORTEST1 database
RATIO---------.01273172
Figure 24: Example Output From Data Dictionary Script
The ratio reported from the script in Figure 23 should always be less than 1. The ratio corresponds to the number of times the database enginesought something from the cache and missed out of 100 times. A dictionary cache miss is more expensive than a data block buffer miss soif your ratio gets near 1 increase the size of the shared pool since theinternal algorithm isn't allocating enough memory to the data dictionarycaches.
In Summary
We have covered a lot of territory in this article. I hope you now understand that the old "just increase the shared pool" answer isn't good enough anymore when it comes to tuning problems. You must take an in depth look at your shared pool and tune what needs to be tuned, not just throw memory at a problem until it submerges. Indeed, I have shown that in some cases increasing the size of the shared pool may harm performance and decreasing the size may be advisable. I have also prevented seven general guidelines for shared pool tuning. The shared pool is vital to the proper performance of your Oracle database, you must have it properly tuned or drown in bad performance.

Possible Side Bar:
Initialization Parameters That Effect The Shared PoolNAME DESCRIPTION------------------------------ ----------------------------------------shared_pool_size size in bytes of shared pool (7 and 8)shared_pool_reserved_size size in bytes of reserved area of shared pool (7 and 8)
shared_pool_reserved_min_alloc minimum allocation size in bytes for reserved area of shared pool (7 and 8)
large_pool_size size in bytes of the large allocation pool (8 only)
large_pool_min_alloc minimum allocation size in bytes for the large allocation pool (8 only)
parallel_min_message_pool minimum size of shared pool memory to reserve for pq servers (8 only)backup_io_slaves Number of backup IO slaves to configure (8 only)temporary_table_locks Number of temporary table locks to configure (7 and 8)dml_locks Number of DML locks to configure (7 and 8)sequence_cache_entries Number of sequence numbers to cache (7 and 8)row_cache_cursors Number of row caches to set up (7 and 8)max_enabled_roles Number of role caches to set up (7 and 8)mts_dispatchers Number of MTS dispatcher processes to start with (7 and 8)mts_max_dispatchers Maximum number of dispatcher processes to allow (7 and 8)mts_servers Number of MTS servers to start with (7 and 8)mts_max_servers Maximum number of MTS servers to allow (7 and 8)open_cursors Maximum number of open cursors per session (7 and 8)cursor_space_for_time Hold open cursors until process exits (7 and 8)
Views Mentioned in Article:

View Name Purpose----------------- -------------------------------------------V$PARAMETER Contains current settings for all documented initialization parametersV$SGASTAT Contains sizing information for all SGA areasV$SQLAREA Contains information and statistics on the SQL area of the shared poolV$DB_OBJECT_CACHE Contains information on all cached objects in the database shared pool areaV$LIBRARYCACHE Contains statistics on the library cachesV$ROWCACHE Contains statistics on the data dictionary cachesDBA_USERS Contains database user information
Software mentioned in article:
Software Manufacturer Purpose-------------------- -------------------- -----------------------------Oracle Administrator RevealNet, Inc. Administration Knowledge baseQ Diagnostic Savant, Corp. Provide Oracle DB diagnostics